2014 facts at a glance - homepage - ici
TRANSCRIPT

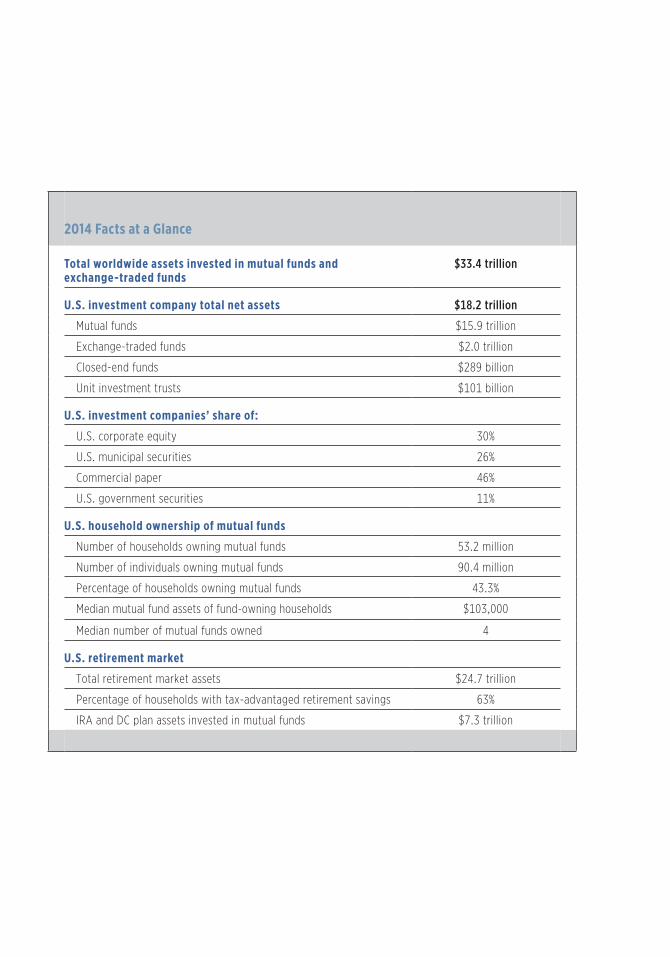
2014 Facts at a Glance
Total worldwide assets invested in mutual funds and exchange-traded funds
$33.4 trillion
U.S. investment company total net assets $18.2 trillion
Mutual funds $15.9 trillion
Exchange-traded funds $2.0 trillion
Closed-end funds $289 billion
Unit investment trusts $101 billion
U.S. investment companies’ share of:
U.S. corporate equity 30%
U.S. municipal securities 26%
Commercial paper 46%
U.S. government securities 11%
U.S. household ownership of mutual funds
Number of households owning mutual funds 53.2 million
Number of individuals owning mutual funds 90.4 million
Percentage of households owning mutual funds 43.3%
Median mutual fund assets of fund-owning households $103,000
Median number of mutual funds owned 4
U.S. retirement market
Total retirement market assets $24.7 trillion
Percentage of households with tax-advantaged retirement savings 63%
IRA and DC plan assets invested in mutual funds $7.3 trillion

2015 Investment Company Fact Book


2015 Investment Company Fact BookA Review of Trends and Activities in the U.S. Investment Company Industry
55th edition
WWW.ICIFACTBOOK.ORG

The Investment Company Institute (ICI) is the national association of U.S. investment companies. ICI seeks to encourage adherence to high ethical standards, promote public understanding, and otherwise advance the interests of funds, their shareholders, directors, and advisers.
Although information or data provided by independent sources is believed to be reliable, ICI is not responsible for its accuracy, completeness, or timeliness. Opinions expressed by independent sources are not necessarily those of the Institute. If you have questions or comments about this material, please contact the source directly.
Fifty-fifth edition
ISBN 1-878731-57-2
Copyright © 2015 by the Investment Company Institute. All rights reserved.

Contents
Letter from the Chief Economist vii
ICI Research Staff and Publications x
Part 1: Analysis and Statistics
List of Figures 3
Chapter 1: U.S.-Registered Investment Companies 6
Chapter 2: Recent Mutual Fund Trends 26
Chapter 3: Exchange-Traded Funds 56
Chapter 4: Closed-End Funds 78
Chapter 5: Mutual Fund Expenses and Fees 90
Chapter 6: Characteristics of Mutual Fund Owners 112
Chapter 7: Retirement and Education Savings 130
Part 2: Data Tables
List of Data Tables 171
Section 1: Mutual Fund Totals 173
Section 2: Closed-End Funds, Exchange-Traded Funds, and Unit Investment Trusts 181
Section 3: Long-Term Mutual Funds 187
Section 4: Money Market Funds 207
Section 5: Additional Categories of Mutual Funds 214
Section 6: Institutional Investors in the Mutual Fund Industry 234
Section 7: Worldwide Mutual Fund Totals 237
Appendix A: How U.S.-Registered Investment Companies Operate and the Core Principles Underlying Their Regulation 240
Appendix B: Significant Events in Fund History 266
Glossary 269
Index 283

LETTER FROM THE CHIEF ECONOMIST
Brian ReidChief Economist of the Investment Company Institute

viii
This year marks the 75th anniversary of the Investment Company Act and the Investment
Advisers Act—the key statutes under which mutual funds, exchange-traded funds (ETFs),
closed-end funds, and unit investment trusts are regulated and governed In the same year
that Congress enacted these laws, 1940, the fund industry formed the National Committee of
Investment Companies, the trade group that became the Investment Company Institute (ICI)
Shortly after its formation, ICI began to collect mutual fund asset and flow data, launching a
statistical and research program that remains one of the Institute’s core activities and central
strengths This data collection program has expanded greatly over time, with ICI currently
managing 18 different fund surveys Our historical data, some extending back nearly three-
quarters of a century, provide perspective about funds and their investors across changing
market cycles and an evolving investor base
One of the first projects I worked on when I joined ICI in 1996—a study showing how bond
fund investors react during bond market downturns—introduced me to this historical record
At the time, there was an ongoing debate about how fund investors would react to market
declines, because fund assets had risen from about $1 billion in 1940 to $3 5 trillion in 1996
Commentators and researchers were concerned that fund investors would leave the markets en
masse during a downturn, destabilizing a financial system in which funds were playing a larger
role
If this reminds you of today’s debates about financial stability and the fund industry, you are
right But as ICI economists Sean Collins and Chris Plantier recently wrote, this debate did not
first appear in the 1990s About once every decade since the 1920s, fears resurface that fund
investors will redeem heavily from stock and bond funds and cause markets to crash These
concerns typically appear after a period of rapid fund growth And so now, after nearly a
decade of strong inflows to bond funds, some regulators, researchers, and commentators are
once again raising concerns about how fund investors will react when interest rates begin to
rise and bond funds report losses Almost daily, a story shows up in the media highlighting
fears of large, destabilizing outflows from bond mutual funds and ETFs that will ignite or
accelerate a financial crisis
Yet every time I explore this topic I return to the same conclusion: stock and bond funds are
a remarkably stable source of capital to the U S and global economies As we discuss in
chapter 2, outflows from bond funds, even at the height of a market downturn, amount to only
1 or 2 percent of bond fund assets in a month And even when bond funds have net outflows,
investors do not all move for the exits As some investors sell shares in bond funds, others
continue to buy; a substantial portion of individual funds have net inflows; and fund managers
are both buyers and sellers of securities All of this means that funds continue to operate
on both sides of the markets, rather than engaging in the one-sided trading that is often
predicted (See Figure 2 7 on page 39 )
LETTER FROM THE CHIEF ECONOMIST

ix
Despite this historical evidence of stability, these concerns regularly resurface—and so ICI
Research continues to explore and explain this issue During the past year, we have written
and contributed to white papers, comment letters, and blog posts, explaining how fund
investors behave during periods of stress Chris Plantier has examined this for funds investing
in emerging markets, while ICI economist Shelly Antoniewicz and our ICI legal colleague Jane
Heinrichs have studied investor behavior in ETFs
The natural question is, why do we see such stable investor behavior? Certainly one aspect
is that most fund investors typically invest for the long term As we discuss in chapter 6,
91 percent of mutual fund investors indicate that saving for retirement is one of their savings
goals These investors have embraced the guidance of financial planners, academics, fund
companies, and journalists—that timing the market is most likely to leave them worse off than
remaining invested and continuing to make regular contributions to their funds
Of course, shareholder stability also depends crucially on the strength of regulations that
protect investors The core features of regulated funds—such as limitations on fund leverage,
mark-to-market pricing of fund portfolios, portfolio diversity, and liquidity management—have
provided important shareholder protections and helped maintain investor confidence during
periods of market stress over the past 75 years These protections help ensure that investors
who stay in a fund are shielded from harm caused by investors leaving the fund Industry
leaders, the Securities and Exchange Commission, and members of Congress who worked to
craft the statutes that serve as the foundation for regulated funds all understood how investor
protections are interwoven with investor confidence and capital formation
Gathering and analyzing data about funds, their investors, and the markets—and using those
data to inform and educate regulators, policymakers, and other stakeholders—are critical
to ICI’s service to funds and their investors The months of effort that ICI staff dedicate to
publishing the Fact Book contribute significantly to that mission This volume is a continuation
of nearly 75 years of effort to facilitate sound, well-informed public policies affecting
investment companies, their investors, and financial markets
LETTER FROM THE CHIEF ECONOMIST

x
ICI Senior Research Staff
Chief EconomistBrian Reid leads the Institute’s Research Department The department serves as a source for statistical data on the investment company industry and conducts public policy research on fund industry trends, shareholder demographics, the industry’s role in U S and international financial markets, and the retirement market Prior to joining ICI in 1996, Reid served as an economist at the Federal Reserve Board of Governors He has a PhD in economics from the University of Michigan and a BS in economics from the University of Wisconsin–Madison
Senior Director of Industry and Financial AnalysisSean Collins heads ICI’s research on the structure of the mutual fund industry, industry trends, and the broader financial markets Collins, who joined ICI in 2000, is responsible for research on the flows, assets, and fees of mutual funds, as well as a research initiative to better understand the costs and benefits of laws and regulations governing mutual funds Prior to joining ICI, Collins was an economist at the Federal Reserve Board of Governors and at the Reserve Bank of New Zealand He has a PhD in economics from the University of California, Santa Barbara, and a BA in economics from Claremont McKenna College
Senior Director of Retirement and Investor ResearchSarah Holden leads the Institute’s research efforts on investor demographics and behavior and retirement and tax policy Holden, who joined ICI in 1999, heads efforts to track trends in household retirement saving activity and ownership of funds as well as other investments inside and outside retirement accounts Prior to joining ICI, Holden served as an economist at the Federal Reserve Board of Governors She has a PhD in economics from the University of Michigan and a BA in mathematics and economics from Smith College
Senior Director of Statistical ResearchJudy Steenstra oversees the collection and publication of weekly, monthly, quarterly, and annual data on open-end mutual funds, as well as data on closed-end funds, exchange-traded funds, unit investment trusts, and the worldwide mutual fund industry Steenstra joined ICI in 1987 and was appointed director of statistical research in 2000 She has a BS in marketing from The Pennsylvania State University
ICI Research Staff and Publications
ICI RESEARCH STAFF AND PUBLICATIONS

xi
ICI Research Staff
The ICI Research Department consists of 42 members, including economists and research
analysts This staff collects and disseminates data for all types of registered investment
companies, offering detailed analyses of fund shareholders, the economics of investment
companies, and the retirement and education savings markets
2014 ICI Research and Statistical Publications
ICI is the primary source of analysis and statistical information on the investment company
industry In 2014, the Institute’s Research Department released more than 180 statistical
reports examining the broader investment company industry as well as specific segments
of the industry: money market funds, closed-end funds, exchange-traded funds, and unit
investment trusts In addition to the annual Investment Company Fact Book, ICI released 21
research and policy publications in 2014, examining the industry and its shareholders
Industry and Financial Analysis Research Publications
» “Globalisation and the Global Growth of Long-Term Mutual Funds,” ICI Global Research
Perspective, March 2014
» “The Closed-End Fund Market, 2013,” ICI Research Perspective, March 2014
» “Trends in the Expenses and Fees of Mutual Funds, 2013,” ICI Research Perspective, May 2014
» “Understanding Exchange-Traded Funds: How ETFs Work,” ICI Research Perspective,
September 2014
Investor Research Publications
» “Americans’ Views on Defined Contribution Plan Saving,” ICI Research Report, January 2014
» “Profile of Mutual Fund Shareholders, 2013,” ICI Research Report, February 2014
» “The IRA Investor Profile: Traditional IRA Investors’ Activity, 2007–2012,” ICI Research
Report, March 2014
» “The IRA Investor Profile: Roth IRA Investors’ Activity, 2007–2012,” ICI Research Report,
June 2014
» “Characteristics of Mutual Fund Investors, 2014,” ICI Research Perspective, November 2014
» “Ownership of Mutual Funds, Shareholder Sentiment, and Use of the Internet, 2014,”
ICI Research Perspective, November 2014
ICI RESEARCH STAFF AND PUBLICATIONS

xii
Retirement Research Publications
» “Defined Contribution Plan Participants’ Activities, First Three Quarters of 2013,”
ICI Research Report, February 2014
» “Defined Contribution Plan Participants’ Activities, 2013,” ICI Research Report, April 2014
» “The Economics of Providing 401(k) Plans: Services, Fees, and Expenses, 2013,” ICI Research
Perspective, July 2014
» “What Does Consistent Participation in 401(k) Plans Generate? Changes in 401(k) Account
Balances, 2007–2012,” ICI Research Perspective, July 2014
» “Defined Contribution Plan Participants’ Activities, First Quarter 2014,” ICI Research Report,
August 2014
» Inside the Structure of Defined Contribution/401(k) Plan Fees, 2013, August 2014
» “Who Gets Retirement Plans and Why, 2013,” ICI Research Perspective, October 2014
» “A Look at Private-Sector Retirement Plan Income After ERISA, 2013,” ICI Research
Perspective, October 2014
» “Defined Contribution Plan Participants’ Activities, First Half 2014,” ICI Research Report,
November 2014
» The BrightScope/ICI Defined Contribution Plan Profile: A Close Look at 401(k) Plans,
December 2014
» “401(k) Plan Asset Allocation, Account Balances, and Loan Activity in 2013,” ICI Research
Perspective, December 2014
ICI’s research is available at www.ici.org/research. Find further analysis and commentary by
ICI economists at ICI Viewpoints (www.ici.org/viewpoints).
Statistical Releases
Trends in Mutual Fund Investing
» A monthly report that includes mutual fund sales, redemptions, assets, cash positions,
exchange activity, and portfolio transactions for the period
Estimated Long-Term Mutual Fund Flows
» A weekly report that provides aggregate estimates of net new cash flows to equity, hybrid,
and bond mutual funds
Money Market Fund Assets
» A weekly report on money market fund assets by type of fund
ICI RESEARCH STAFF AND PUBLICATIONS

xiiiICI RESEARCH STAFF AND PUBLICATIONS
Monthly Taxable Money Market Fund Portfolio Data
» A monthly report based on data contained in SEC Form N-MFP that provides insights into
the aggregated holdings of prime and government money market funds and the nature and
maturity of security holdings and repurchase agreements
Retirement Market Data
» A quarterly report that includes individual retirement account and defined contribution plan
assets and mutual fund assets held in those accounts by type of fund
Closed-End Fund Data
» A quarterly report on closed-end fund assets, number of funds, issuance, and number of
shareholders
Exchange-Traded Fund Data
» A monthly report that includes assets, number of funds, issuance, and redemptions of ETFs
Unit Investment Trust Data
» A monthly report that includes the value and number of new trust deposits by type and
maturity
Worldwide Mutual Fund Market Data
» A quarterly report that includes assets, number of funds, and net sales of mutual funds in
countries worldwide
These and other ICI statistics are available at www.ici.org/research/stats. To subscribe to ICI’s
statistical releases, visit www.ici.org/pdf/stats_subs_order.pdf.
Acknowledgments
Publication of the 2015 Investment Company Fact Book was directed by Chris Plantier, senior
economist, and Judy Steenstra, senior director of statistical research, working with Miriam
Bridges, editorial director, Candice Gullett, senior copyeditor, and Stephanie Lacasse, designer

PART ONE
Analysis andStatistics


FIGURES 3
Chapter 1U.S.-Registered Investment CompaniesFigure 1.1: Investment Company Total Net Assets by Type 9
1.2: The United States Has the World’s Largest Mutual Fund and ETF Markets 10
1.3: Share of Household Financial Assets Held in Investment Companies 11
1.4: Household Net Investments in Funds, Bonds, and Equities 12
1.5: Mutual Funds in Household Retirement Accounts 13
1.6: Investment Companies Channel Investment to Stock, Bond, and Money Markets 14
1.7: 80 Percent of Fund Complexes Were Independent Fund Advisers 15
1.8: Number of Fund Sponsors 16
1.9: Fund Complexes with Positive Net New Cash Flow to Long-Term Mutual Funds 17
1.10: Share of Mutual Fund and ETF Assets at the Largest Complexes 17
1.11: Number of Mutual Funds Entering and Leaving the Industry 19
1.12: Total Net Assets and Number of UITs 21
1.13: Number of Investment Companies by Type 22
1.14: Investment Company Industry Employment 23
1.15: Investment Company Industry Employment by Job Function 24
1.16: Investment Company Industry Employment by State 25
Chapter 2Recent Mutual Fund TrendsFigure 2.1: Equity Funds Held More Than Half of Total Mutual Fund Assets 29
2.2: Institutional and Household Ownership of Mutual Funds 30
2.3: Net New Cash Flow to Mutual Funds 31
2.4: Net New Cash Flow to Equity Funds Is Related to World Equity Returns 34
2.5: Net New Cash Flow to Long-Term Mutual Funds 35
2.6: Turnover Rate Experienced by Equity Fund Investors 37
2.7: Net New Cash Flow to Bond Funds Is Related to Bond Returns 39
2.8: Bond Funds Have Experienced Net Inflows Through Most of the Past Decade 39
2.9: Willingness to Take Above-Average or Substantial Investment Risk by Age Group 40
2.10: Mutual Fund Assets by Age Group 41
2.11: Investors Are Gravitating Toward Hybrid Funds 42
2.12: Alternative Strategies Mutual Funds Have Grown Rapidly Since the 2008 Financial Crisis 44
2.13: Net New Cash Flow to Index Mutual Funds 45
2.14: Funds Indexed to the S&P 500 Held 33 Percent of Index Mutual Fund Assets 46
2.15: Index Equity Mutual Funds’ Share Continued to Rise 46
2.16: Some of the Outflows from Domestic Equity Mutual Funds Have Gone to ETFs 47
2.17: Net New Cash Flow to Money Market Funds 48
2.18: Net New Cash Flow to Retail and Institutional Money Market Funds 49
2.19: Money Market Funds Managed 23 Percent of U.S. Businesses’ Short-Term Assets in 2014 50
2.20: Net New Cash Flow to Taxable Retail Money Market Funds Is Related to Interest Rate Spread 51
2.21: Prime Money Market Fund Holdings of Treasury and Agency Securities and Repurchase Agreements 53
Figures

4 2015 INVESTMENT COMPANY FACT BOOK
Chapter 3Exchange-Traded FundsFigure 3.1: The United States Has the Largest ETF Market 59
3.2: Total Net Assets and Number of ETFs 60
3.3: Creation of ETF Shares 63
3.4: Most ETF Activity Occurs on the Secondary Market 67
3.5: Net Issuance of ETF Shares 69
3.6: Net Issuance of ETF Shares by Investment Classification 70
3.7: Total Net Assets of ETFs Were Concentrated in Large-Cap Domestic Stocks 71
3.8: Number of ETFs 72
3.9: Types of Commodity and Domestic Sector Equity ETFs 74
3.10: ETF-Owning Households Held a Broad Range of Investments 75
3.11: Characteristics of ETF-Owning Households 76
3.12: ETF-Owning Households Are Willing to Take More Investment Risk 77
Chapter 4Closed-End FundsFigure 4.1: Total Assets of Closed-End Funds Increased to $289 Billion at Year-End 2014 81
4.2: Equity Funds’ Growing Share of the Closed-End Fund Market 82
4.3: Closed-End Fund Net Share Issuance 83
4.4: Closed-End Fund Distributions 84
4.5: Closed-End Funds Employing Structural and Certain Types of Portfolio Leverage 85
4.6: Preferred Shares Comprised the Majority of Closed-End Fund Structural Leverage 86
4.7: Use of Portfolio Leverage 87
4.8: Closed-End Fund Investors Owned a Broad Range of Investments 88
4.9: Closed-End Fund Investors Had Above-Average Household Incomes and Financial Assets 89
Chapter 5Mutual Fund Expenses and FeesFigure 5.1: Expenses Incurred by Mutual Fund Investors Have Declined Substantially Since 2000 93
5.2: Mutual Fund Expense Ratios Tend to Fall as Fund Assets Rise 94
5.3: Fund Shareholders Paid Below-Average Expenses for Equity Funds 95
5.4: Assets Are Concentrated in Lower-Cost Funds 96
5.5: Total Net Assets and Number of Index Mutual Funds Have Increased in Recent Years 97
5.6: Expense Ratios of Actively Managed and Index Funds 99
5.7: Expense Ratios for Selected Investment Objectives 101
5.8: Front-End Sales Loads That Investors Pay Are Well Below the Maximum Front-End Sales Loads That Funds Charge 105
5.9: Nearly All Net New Cash Flow Was in No-Load Institutional Share Classes 106
5.10: Total Net Assets of Long-Term Mutual Funds Are Concentrated in No-Load Share Classes 107
5.11: A Variety of Arrangements May Be Used to Compensate 401(k) Service Providers 109
5.12: 401(k) Equity Mutual Fund Assets Are Concentrated in Lower-Cost Funds 111

FIGURES 5
Chapter 6Characteristics of Mutual Fund OwnersFigure 6.1: 43 Percent of U.S. Households Owned Mutual Funds in 2014 114
6.2: Characteristics of Mutual Fund Investors 115
6.3: Incidence of Mutual Fund Ownership Is Greatest Among 35- to 64-Year-Olds 116
6.4: The Baby Boom Generation Is the Largest Shareholder Group and Holds the Most Mutual Fund Assets 117
6.5: Ownership of Mutual Funds Increases with Household Income 118
6.6: Most Households That Own Mutual Funds Have Moderate Incomes 119
6.7: Employer-Sponsored Retirement Plans Are Increasingly the Source of First Mutual Fund Purchase 121
6.8: 82 Percent of Mutual Fund–Owning Households Held Shares Inside Employer-Sponsored Retirement Plans 122
6.9: Nearly Half of Mutual Fund–Owning Households Held Shares Through Multiple Sources 123
6.10: Households’ Mutual Fund Assets by Type of Account 124
6.11: Most Shareholders View the Mutual Fund Industry Favorably 125
6.12: Households’ Willingness to Take Investment Risk Tends to Move with the Stock Market 126
6.13: Households’ Willingness to Take Investment Risk 127
6.14: More Than Eight in 10 Mutual Fund–Owning Households Have Confidence in Mutual Funds 128
6.15: Internet Access Is Nearly Universal Among Mutual Fund–Owning Households 129
Chapter 7Retirement and Education SavingsFigure 7.1: Retirement Resource Pyramid 133
7.2: Primary Reason for Household Saving Changes with Age 134
7.3: Social Security Benefit Formula Is Highly Progressive 135
7.4: Near-Retiree Households Across All Income Groups Have Retirement Assets, DB Plan Benefits, or Both 136
7.5: U.S. Retirement Assets Rose in 2014 137
7.6: Total U.S. Retirement Assets and Unfunded Pension Liabilities 138
7.7: Many U.S. Households Have Tax-Advantaged Retirement Savings 139
7.8: Rates of IRA or Defined Contribution Plan Ownership 140
7.9: Defined Contribution Plan Assets by Type of Plan 141
7.10: Design of 401(k) Employer Contributions 142
7.11: Employers with Simple Matches Use a Variety of Formulas 143
7.12: Incidence of Investment Options Offered in 401(k) Plans by Type of Investment 144
7.13: 401(k) Asset Allocation Varied with Participant Age 146
7.14: Asset Allocation to Equities Varied Widely Among 401(k) Plan Participants 147
7.15: Target Date Funds’ 401(k) Market Share 148
7.16: 401(k) Balances Tend to Increase with Participant Age and Job Tenure 149
7.17: IRA Assets 151
7.18: Nearly 42 Million U.S. Households Owned IRAs 152
7.19: New Roth IRAs Often Are Opened with Contributions; New Traditional IRAs Often Are Opened with Rollovers 153
7.20: Multiple Sources of Information Are Consulted for the Rollover Decision 155
7.21: IRA Asset Allocation Varied with Investor Age 157
7.22: Roth IRA Investors Rarely Take Withdrawals; Traditional IRA Investors Are Heavily Affected by RMDs 158
7.23: Traditional IRA Withdrawals Among Retirees Often Are Used to Pay for Living Expenses 159
7.24: Substantial Amount of Retirement Assets Are Invested in Mutual Funds 161
7.25: Majority of Mutual Fund Retirement Account Assets Were Invested in Equities 162
7.26: Target Date and Lifestyle Mutual Fund Assets by Account Type 164
7.27: Section 529 Savings Plan Assets 166
7.28: Characteristics of Households Saving for College 167
The largest segment of the asset management business in the
United States is made up of registered investment companies.
U.S.-registered investment companies play a major role in the
U.S. economy and financial markets, and a growing role in global
financial markets. These funds managed $18.2 trillion in assets at
year-end 2014, largely on behalf of more than 90 million U.S. retail
investors. The industry has experienced strong growth over the
past quarter century from asset appreciation and strong demand
from households due to rising household wealth, the aging U.S.
population, and the evolution of employer-based retirement systems.
Funds supplied investment capital in securities markets around the
world and were among the largest groups of investors in the U.S.
stock, commercial paper, and municipal securities markets.
CHAPTER ONE
U.S.-Registered Investment Companies

The assets of U.S.-registered investmentcompanies exceeded $18 trillion for thefirst time in 2014
More than
$18 trillionat year-end 2014

2015 INVESTMENT COMPANY FACT BOOK8
This chapter provides a broad overview of U.S.-registered investment companies—mutual funds, closed-end funds, exchange-traded funds, and unit investment trusts—and their sponsors.
Investment Company Assets in 2014 8
Americans’ Continued Reliance on Investment Companies 11
Role of Investment Companies in Financial Markets 14
Types of Intermediaries and Number of Investment Companies 15
Investment Company Employment 23
Investment Company Assets in 2014
U S -registered investment companies* managed $18 2 trillion in assets
at year-end 2014 (Figure 1 1), $1 1 trillion more than at year-end 2013 U S
stocks returned more than 10 percent in 2014, contributing to the increase in
total net assets of funds invested in domestic equity markets International
stock markets, by contrast, fell on average, putting downward pressure on
the assets of funds invested in international equities The strengthening
of the U S dollar against the euro also lowered the dollar value of euro-
denominated securities, and thus the value of equity and bond funds holding
euro-denominated assets
The U S mutual fund and exchange-traded fund (ETF) markets—with
$17 8 trillion in assets under management at year-end 2014—remained the
largest in the world, accounting for 53 percent of the $33 4 trillion in mutual
fund and ETF assets worldwide (Figure 1 2)
The majority of U S mutual fund and ETF assets at year-end 2014 were in
long-term funds, with equity funds comprising 56 percent (Figure 1 2) Within
equity funds, domestic funds (those that invest primarily in shares of U S
corporations) held 42 percent of total assets and world funds (those that
invest primarily in shares of non-U S corporations) accounted for 14 percent
Bond funds held 21 percent of U S mutual fund and ETF assets Money market
funds, hybrid funds, and other funds—such as those that invest primarily in
commodities—held the remainder (23 percent)
* The term investment companies or U.S. investment companies will be used at times throughout this book in place of U.S.-registered investment companies. U.S.-registered investment companies are open-end mutual funds, closed-end funds, exchange-traded funds, and unit investment trusts.

U.S.-REGISTERED INVESTMENT COMPANIES 9
FIGURE 1 1
Investment Company Total Net Assets by TypeBillions of dollars; year-end, 1997–2014
Mutual funds1Closed-end
funds2 ETFs3 UITs Total4
1997 $4,468 $152 $7 $85 $4,711
1998 5,525 156 16 94 5,790
1999 6,846 147 34 92 7,119
2000 6,965 143 66 74 7,247
2001 6,975 141 83 49 7,248
2002 6,383 159 102 36 6,680
2003 7,402 214 151 36 7,803
2004 8,096 253 228 37 8,614
2005 8,891 276 301 41 9,509
2006 10,398 297 423 50 11,168
2007 12,000 312 608 53 12,974
2008 9,603 184 531 29 10,347
2009 11,113 223 777 38 12,151
2010 11,833 238 992 51 13,113
2011 11,632 242 1,048 60 12,982
2012 13,052 264 1,337 72 14,725
2013 15,035 279 1,675 87 17,075
2014 15,852 289 1,974 101 18,217
1 Mutual fund data include only mutual funds that report statistical information to the Investment Company Institute, and do not include mutual funds that invest primarily in other mutual funds.
2 Closed-end fund data include preferred share classes. 3 ETF data prior to 2001 were provided by Strategic Insight Simfund. ETF data include investment companies not
registered under the Investment Company Act of 1940 and exclude ETFs that primarily invest in other ETFs. 4 Total investment company assets include mutual fund holdings of closed-end funds and ETFs.
Note: Data are for investment companies that report statistical information to the Investment Company Institute. Assets of these companies are 98 percent of investor assets. Components may not add to the total because of rounding.
Sources: Investment Company Institute and Strategic Insight Simfund

2015 INVESTMENT COMPANY FACT BOOK10
FIGURE 1 2
The United States Has the World’s Largest Mutual Fund and ETF MarketsPercentage of total net assets, year-end 2014
0
20
40
60
80
100
6%Other Americas
53%United States
11%Africa andAsia-Pacific
29%Europe
Total U.S. mutual fund and ETF assets:$17.8 trillion
Domestic equity funds
World equity funds
Bond funds
Money market funds
42
14
21
15
Hybrid and other funds*8
Total worldwide mutual fund and ETF assets:$33.4 trillion
* Includes ETFs—both registered and not registered under the Investment Company Act of 1940—that invest primarily in commodities, currencies, and futures.
Note: Components may not add to 100 percent because of rounding.
Sources: Investment Company Institute and International Investment Funds Association
Mutual funds reported $102 billion in net inflows in 2014, while other
registered investment companies also recorded positive net inflows On net,
investors added $96 billion to long-term mutual funds Money market funds
accounted for the other $6 billion Mutual fund shareholders reinvested
$216 billion in income dividends and $381 billion in capital gains distributions
that mutual funds paid out during the year Investor demand for ETFs
continued to thrive with net share issuance (including reinvested dividends)
totaling $241 billion in 2014 Unit investment trusts (UITs) had new deposits of
$66 billion, up 18 percent from 2013, and closed-end funds issued $5 billion in
new shares, on net

U.S.-REGISTERED INVESTMENT COMPANIES 11
Americans’ Continued Reliance on Investment Companies
Households make up the largest group of investors in funds, and registered
investment companies managed 24 percent of household financial assets at
year-end 2014 (Figure 1 3) As households have come to rely more on funds
over the past decade, their demand for directly held equities and bonds has
fallen (Figure 1 4) Household demand for directly held bonds (which had
outflows of $455 billion in 2014) has been weak since the financial crisis Bond
funds recorded moderate inflows in 2014, with investors injecting $44 billion
Overall, households invested an additional $416 billion in long-term registered
investment companies in 2014 From 2005 to 2014, households invested an
annual average of $379 billion, on net, in long-term registered investment
companies, with net investments each year except 2008 In contrast, directly
held equities and bonds had average annual net sales of $433 billion
FIGURE 1 3
Share of Household Financial Assets Held in Investment CompaniesPercentage of household financial assets; year-end, 1980–2014
2014
24
20052000199519901980
2
1985 2010
Note: Household financial assets held in registered investment companies include household holdings of ETFs, closed-end funds, UITs, and mutual funds. Mutual funds held in employer-sponsored DC plans, IRAs, and variable annuities are included.
Sources: Investment Company Institute and Federal Reserve Board

2015 INVESTMENT COMPANY FACT BOOK12
The growth of individual retirement accounts (IRAs) and defined contribution
(DC) plans, particularly 401(k) plans, explains some of the increased
household reliance on investment companies during the past two decades At
year-end 2014, households had 9 9 percent of their financial assets in 401(k)
and other DC retirement plans, up from 7 0 percent in 1994 Mutual funds
managed 55 percent of the assets in these plans in 2014, more than double
the 22 percent in 1994 (Figure 1 5) IRAs made up 10 9 percent of household
financial assets at year-end 2014, with mutual funds managing 48 percent
of IRA assets that year Mutual funds also managed $1 2 trillion in variable
annuities outside retirement accounts, as well as $5 7 trillion of assets in
taxable household accounts
FIGURE 1 4
Household Net Investments in Funds, Bonds, and EquitiesBillions of dollars, 2005–2014
Long-term registered investment companies*Directly held bondsDirectly held equities
-46
687
-348 -107
-654
392
-230
-335
481
2005 2006 2007 2008 2009 2010 2011 2012 2013 2014
-533
-144
431 497
-1,159
470
455
-281 -82 -364
257 -210
335
-461
33
-455
416
-156
60 595
-84
* Data for long-term registered investment companies include mutual funds, variable annuities, ETFs, and closed-end funds.
Note: Household net investments include net new cash flow and reinvested dividends.
Sources: Investment Company Institute and Federal Reserve Board

U.S.-REGISTERED INVESTMENT COMPANIES 13
FIGURE 1 5
Mutual Funds in Household Retirement AccountsPercentage of retirement assets in mutual funds by type of retirement vehicle, 1994–2014
DC plans*
IRAs
55545248
5248
43
37
43
2922
47 4849465149
434847
42
34
20142012201020082006200420022000199819961994
20142012201020082006200420022000199819961994
* DC plans include 401(k) plans, 403(b) plans, 457 plans, Keoghs, and other DC plans without 401(k) features.
Sources: Investment Company Institute, Federal Reserve Board, Department of Labor, National Association of Government Defined Contribution Administrators, American Council of Life Insurers, and Internal Revenue Service Statistics of Income Division .
Businesses and other institutional investors also rely on funds Many
institutions use money market funds to manage some of their cash and short-
term assets Nonfinancial businesses held 23 percent of their cash in money
market funds at year-end 2014 Institutional investors also have contributed
to growing demand for ETFs Investment managers, including mutual funds
and pension funds, use ETFs to manage liquidity—helping them manage their
investor flows and remain fully invested in the market Asset managers also
use ETFs as part of their investment strategies, including as a hedge against
their exposure to equity markets

2015 INVESTMENT COMPANY FACT BOOK14
FIGURE 1 6
Investment Companies Channel Investment to Stock, Bond, and Money MarketsPercentage of total market securities held by investment companies, year-end 2014
Mutual fundsOther registered investment companies
26
<0.5
19
11 23
310
17
3 0
46
46
Commercialpaper
U.S. municipal securities
U.S. Treasuryand governmentagency securities
U.S. andinternational
corporate bonds
U.S. corporateequity
30
24
5
Note: Components may not add to the total because of rounding.
Sources: Investment Company Institute, Federal Reserve Board, and World Federation of Exchanges
Role of Investment Companies in Financial Markets
Investment companies have been among the largest investors in the domestic
financial markets for much of the past 20 years They held a large portion of
the outstanding shares of U S -issued equities and money market securities
at year-end 2014 Investment companies as a whole were one of the largest
groups of investors in U S companies that year, holding 30 percent of their
outstanding stock at year-end 2014 (Figure 1 6)
Mutual funds remained the largest investors in the U S commercial paper
market—an important source of short-term funding for major corporations
around the world From year-end 2013 to year-end 2014, mutual funds’ share
of outstanding commercial paper remained steady at 46 percent Money
market funds accounted for most of mutual fund commercial paper holdings,
and mutual fund holdings of commercial paper tend to fluctuate with investor
demand for prime money market funds and the supply of commercial paper

U.S.-REGISTERED INVESTMENT COMPANIES 15
At year-end 2014, investment companies held 26 percent of tax-exempt debt
issued by U S municipalities (Figure 1 6), a fairly stable share despite the
increased supply of tax-exempt debt since 2007 Funds held 11 percent of U S
Treasury and government agency securities at year-end 2014 In the corporate
bond market at year-end 2014, funds’ share of outstanding corporate debt
securities remained at the same level (19 percent) as at year-end 2013
Types of Intermediaries and Number of Investment Companies
A variety of financial services companies offer registered funds in the United
States At year-end 2014, 80 percent of fund complexes were independent
fund advisers (Figure 1 7), and these firms managed 66 percent of investment
company assets Other types of fund complexes in the U S market include
non-U S fund advisers, insurance companies, banks, thrifts, and brokerage
firms
FIGURE 1 7
80 Percent of Fund Complexes Were Independent Fund AdvisersPercentage of investment company complexes by type of intermediary, year-end 2014
80%Independent fund advisers
8%Non-U.S. fund advisers 5%
Insurance companies5%
Banks or thrifts2%
Brokerage firms

2015 INVESTMENT COMPANY FACT BOOK16
In 2014, 867 financial firms from around the world competed in the U S
market to provide investment management services to fund investors
(Figure 1 8) In the 1980s and 1990s, low barriers to entry attracted many new
fund sponsors But in the early 2000s, increased competition among these
sponsors and pressure from other financial products reversed those gains
From year-end 2004 to year-end 2009, 248 fund sponsors left the business
but just 238 entered, for a net loss of 10 sponsors Larger fund sponsors
acquiring smaller ones, fund sponsors liquidating funds and leaving the
business, and several large sponsors selling their fund advisory businesses
played a major role in the decline The number of fund companies retaining
assets and attracting new investments generally has been lower since 2000
than in the 1990s (Figure 1 9)
FIGURE 1 8
Number of Fund Sponsors2004–2014
39
2011
88
Total fund sponsors at year-endFund sponsors leavingFund sponsors entering
867
692 693 691 709 698 682 706755 790
823
44
29
2004
47 48
2005
46 44
2006
40
58
2007
62
51
2008
53
37
2009
53
77
2010
43
78
2012
49
82
2013
25
69
2014

U.S.-REGISTERED INVESTMENT COMPANIES 17
FIGURE 1 9
Fund Complexes with Positive Net New Cash Flow to Long-Term Mutual FundsPercentage of fund complexes, selected years
2013 201420122011201020092008200620042002200019981996199419921990
4954
484852
38
5856565553
646455
72
57
This steady turnover and merger activity has contributed to somewhat
greater concentration of regulated fund assets managed by the largest fund
complexes The share of assets managed by the five largest firms rose from
32 percent in 2000 to 43 percent in 2014, and the share managed by the
10 largest firms increased from 44 to 55 percent (Figure 1 10) Most of the
increase in market share occurred at the expense of the middle tier of firms—
those ranked from 11 to 25 whose market share fell from 25 percent in 2000 to
19 percent in 2014
FIGURE 1 10
Share of Mutual Fund and ETF Assets at the Largest ComplexesPercentage of total net assets of mutual funds and ETFs; year-end, selected years
2000 2005 2010 2014
Largest 5 complexes 32 36 42 43
Largest 10 complexes 44 47 55 55
Largest 25 complexes 69 69 74 74
Note: Data include only mutual funds and ETFs registered under the Investment Company Act of 1940. ETFs registered as UITs are excluded.

2015 INVESTMENT COMPANY FACT BOOK18
Two other factors also contributed to rising industry concentration First, the
growing popularity of index funds increased concentration, because the 10
largest fund complexes manage most of the assets in index mutual funds
Actively managed domestic equity mutual funds incurred outflows for nine
consecutive years, thus reducing market share for middle-tier firms, while
index domestic equity funds had inflows in each of these years Second,
strong inflows over the past decade to bond funds, which are fewer in
number and have fewer fund sponsors than equity mutual funds, helped
boost the share of assets managed by large fund complexes that offer bond
funds
Nevertheless, in recent years, the number of sponsors has risen once again
as the economy and financial markets have recovered, with a net increase
of 185 from year-end 2009 to year-end 2014 (394 entering and 209 leaving)
(Figure 1 8) Many of the entering firms took advantage of the series trust—
a cost-effective management solution in which the fund’s sponsor arranges
for a third party to provide certain services (e g , audit, trustee, some legal)
through a turnkey setup The series trust allows the sponsor to focus more on
managing portfolios and gathering assets, and its operating costs are spread
across the funds in the trust

U.S.-REGISTERED INVESTMENT COMPANIES 19
Macroeconomic conditions and competitive dynamics also affect the number
of funds offered in any given year Fund sponsors create new funds to meet
investor demand, and they merge or liquidate those that do not attract
sufficient investor interest A total of 654 funds opened in 2014, a slight fall
from the year before and below the 2007 peak of 726, but near the 2004–
2014 average (Figure 1 11) The rate of fund mergers and liquidations declined
significantly from 428 in 2013 to 362 in 2014, which led to the largest annual
net increase in the number of mutual funds in more than 10 years
FIGURE 1 11
Number of Mutual Funds Entering and Leaving the Industry2004–2014
2012 2013 201420112010200920082007200620052004
Opened mutual fundsMerged mutual fundsLiquidated mutual funds
306 257 232216241
509
333223207251286
196171
130300261
362
257315
230337248
674 696
502428
654
362
516502
871
590538
437
588534
656 571
501
710726680709
535
Note: Data include mutual funds that do not report statistical information to the Investment Company Institute and mutual funds that invest primarily in other mutual funds.

2015 INVESTMENT COMPANY FACT BOOK20
Unit Investment Trusts
Unit investment trusts (UITs) are registered investment companies with characteristics of both
mutual funds and closed-end funds Like mutual funds, UITs issue redeemable shares (called
units), and like closed-end funds, they typically issue a specific, fixed number of shares But
unlike either mutual funds or closed-end funds, UITs have a preset termination date based
on the portfolio’s investments and the UIT’s investment goals UITs investing in long-term
bonds might remain outstanding for 20 to 30 years UITs investing in stocks might seek to
capture capital appreciation in a few years or less When a UIT is dissolved, proceeds from the
securities are paid to unit holders or, at a unit holder’s election, reinvested in another trust
UITs fall into two main categories: bond trusts and equity trusts Bond trusts are either taxable
or tax-free; equity trusts are either domestic or international/global The first UIT, introduced
in 1961, held tax-free bonds, and historically, most UIT assets were invested in bonds However,
equity UITs have grown in popularity over the past two decades Since 1998, the assets in
equity UITs have exceeded the assets in taxable and tax-free bond UITs combined each year
except 2002, and constituted 85 percent of the assets in UITs in 2014, the highest share ever
recorded (Figure 1 12) The number of trusts outstanding fell in the late 1990s through the
mid-2000s, as sponsors created fewer trusts and existing trusts reached their preset
termination dates
Federal law requires that UITs have a largely fixed portfolio—that is, not actively managed
or traded Once the trust’s portfolio has been selected, its composition may change only in
very limited circumstances Most UITs hold a diversified portfolio, described in detail in the
prospectus, with securities professionally selected to meet a stated investment goal, such as
growth, income, or capital appreciation
Investors can obtain UIT price quotes from brokerage or investment firms and investment
company websites, and some but not all UITs list their prices on NASDAQ’s Mutual Fund
Quotation Service Some broker-dealers offer their own trusts or sell trusts offered by
nationally recognized independent sponsors Units of these trusts can be bought through
their registered representatives Units can also be bought from the representatives of smaller
investment firms that sell trusts sponsored by third-party bond and brokerage firms

U.S.-REGISTERED INVESTMENT COMPANIES 21
While only some units of a UIT are sold in a public offering, a trust sponsor is likely to maintain
a secondary market, in which investors can sell their units back to the sponsor and other
investors can buy those units Even absent a secondary market, UITs are required by law to
redeem outstanding units at their net asset value (NAV), which is based on the underlying
securities’ current market value
FIGURE 1 12
Total Net Assets and Number of UITsYear-end, 1999–2014
72
87
101
6051
3829
50 53 41 37 36
74
49 36
92
71 86
52 41 34 25 20
43 39 29 23 19 15 26
48 62
4 3
4 4
4 4 3 3 4
19 4
4
Total trusts (right scale)Tax-free debt trust assets (left scale)Taxable debt trust assets (left scale)Equity trust assets (left scale)
Billions of dollars Number of trusts
5,381 10,414
0
3,000
6,000
9,000
12,000
15,000
0
20
40
60
80
100
120
140
160
2013 201420122011201020092008200720062005200420032002200120001999
12 12
16 16
13 10
6
8 9 10 11 13 17 4
23
26
2
2 2 2
Note: Components may not add to the total because of rounding.

2015 INVESTMENT COMPANY FACT BOOK22
The total number of investment companies has increased since 2005
(the recent low point), but it remains well below the year-end 2000 peak
(Figure 1 13) Many attribute this decline to UIT sponsors creating far
fewer new trusts between 2000 and 2005, and UITs reaching their preset
termination dates The number of UITs continued to decline, falling to 5,381 at
year-end 2014 from 5,552 at year-end 2013 The total number of closed-end
funds fell to 568 at year-end 2014, the lowest level since 2002 The number
of ETFs grew by 9 percent in 2014, with 119 new ones on net There were 1,451
ETFs at year-end 2014, nearly double the total number of ETFs at year-end
2008
FIGURE 1 13
Number of Investment Companies by TypeYear-end, 1997–2014
Mutual funds*Closed-end
funds ETFs UITs Total
1997 6,778 485 19 11,593 18,875
1998 7,489 491 29 10,966 18,975
1999 8,003 510 30 10,414 18,957
2000 8,370 481 80 10,072 19,003
2001 8,518 489 102 9,295 18,404
2002 8,511 543 113 8,303 17,470
2003 8,426 581 119 7,233 16,359
2004 8,417 618 152 6,499 15,686
2005 8,449 634 204 6,019 15,306
2006 8,721 645 359 5,907 15,632
2007 8,745 662 629 6,030 16,066
2008 8,879 642 743 5,984 16,248
2009 8,611 627 820 6,049 16,107
2010 8,535 624 950 5,971 16,080
2011 8,673 632 1,166 6,043 16,514
2012 8,744 602 1,239 5,787 16,372
2013 8,974 599 1,332 5,552 16,457
2014 9,260 568 1,451 5,381 16,660
* Data include mutual funds that invest primarily in other mutual funds.
Note: Data are for investment companies that report statistical information to the Investment Company Institute. Assets of these companies are 98 percent of investor assets. ETF data prior to 2001 were provided by Strategic Insight Simfund. ETF data include investment companies not registered under the Investment Company Act of 1940 and ETFs that invest primarily in other ETFs.
Sources: Investment Company Institute and Strategic Insight Simfund

U.S.-REGISTERED INVESTMENT COMPANIES 23
Investment Company Employment
Registered investment companies typically do not have employees—
instead, they contract with other businesses to provide services to the
fund Except for UITs, funds in the United States have fund boards that
oversee the management of the fund and represent the interests of the fund
shareholders The fund boards must approve all major contracts between the
fund and its service providers including the advisory contract with a fund’s
investment adviser
Fund sponsors and third-party service providers offer advisory,
recordkeeping, administrative, custody, and other services to a growing
number of funds and their investors Fund industry employment in the United
States has grown 46 percent since 1997, from 114,000 workers to 166,000 in
2013 (Figure 1 14)
FIGURE 1 14
Investment Company Industry Employment Estimated number of employees of fund sponsors and their service providers, selected years*
1997
114,000
1999
149,000
2000
154,000
2005
146,000
2007
168,000
2009
157,000
2011
159,000
2013
166,000
* Years are those in which ICI conducted its employment survey.
One of the prominent providers of services to funds are fund investment
advisers This group of service providers is responsible for directing funds’
investments by undertaking investment research and determining which
securities to buy and sell The adviser will often undertake trading and
security settlement for the fund In March 2013, 34 percent of the industry
worked in support of fund management functions such as investment
research, trading and security settlement, information systems and
technology, and other corporate management functions (Figure 1 15)

2015 INVESTMENT COMPANY FACT BOOK24
FIGURE 1 15
Investment Company Industry Employment by Job Function Percentage of employees of fund sponsors and their service providers, March 2013
34%Fund management
10%Fund administration
30%Investor servicing
26%Sales and distribution
Total employment: 166,000 employees
The second-largest group of workers (30 percent) provides services to fund
investors and their accounts Shareholder account servicing encompasses a
wide range of activities to help investors monitor and update their accounts
These employees work in call centers and help shareholders and their
financial advisers with questions about investor accounts They also process
applications for account openings and closings Other services include
retirement plan transaction processing, retirement plan participant education,
participant enrollment, and plan compliance
Fund administration, which includes financial and portfolio accounting
and regulatory compliance duties, accounted for 10 percent of industry
employment Employees performing those services are often affiliated with a
fund’s investment adviser
Fund administration encompasses the middle- and back-office functions
necessary to operate the fund and includes clerical and fund accounting
services, data processing, recordkeeping, internal audits, and compliance
and risk management functions Typically, employees with administration
duties are responsible for regulatory and compliance requirements, such as
preparing and filing regulatory reports, overseeing fund service providers,
preparing and submitting reports to regulators and tax authorities, and
producing shareholder reports such as prospectuses and financial statements
of the funds Administration services also help to maintain compliance
procedures and internal controls, subject to approval by a fund’s board and
chief compliance officer

U.S.-REGISTERED INVESTMENT COMPANIES 25
Distribution and sales force personnel together accounted for 26 percent of
the workforce Employees in these areas may work in marketing, product
development and design, or investor communications, and can include sales
support staff, registered representatives, and supermarket representatives
For many industries, employment tends to be concentrated in locations
where the industry began The same is true for investment companies: those
located in Massachusetts and New York, early hubs of investment company
operations (Figure 1 16), employ 27 percent of fund industry workers As the
industry has grown, other states—including California, Pennsylvania, and
Texas—have become major centers of fund employment Fund companies in
these three states employed one-quarter of U S fund industry employees as
of March 2013
FIGURE 1 16
Investment Company Industry Employment by State Estimated number of employees of fund sponsors and their service providers by state, March 2013
4,000 or more1,500 to 3,999500 to 1,499100 to 4990 to 99

With nearly $16 trillion in assets, the U.S. mutual fund industry
remained the largest in the world at year-end 2014. Total net assets
increased by $818 billion from the level at year-end 2013, boosted
primarily by appreciation in stock and bond prices. Net new cash
flow into all types of mutual funds totaled $102 billion in 2014.
Investor demand appeared to be driven, in large part, by improving
economic conditions in the United States, lower long-term interest
rates, and the demographics of the U.S. population. Equity, bond,
and hybrid funds each recorded modest net inflows in 2014, while
index funds received substantial inflows.
CHAPTER TWO
Recent Mutual Fund Trends

One-quarter of equity mutual fund assetswere in world equity funds
25 percentat year-end 2014

2015 INVESTMENT COMPANY FACT BOOK28
Investor Demand for U.S. Mutual Funds
Investor demand for mutual funds is influenced by a variety of factors,
not least of which is funds’ ability to assist investors in achieving their
investment objectives For example, U S households rely on equity, bond,
and hybrid mutual funds to meet long-term personal financial objectives
such as preparing for retirement U S households, as well as businesses and
other institutional investors, use money market funds as cash management
tools because they provide a high degree of liquidity and competitive
short-term yields Changing demographics and investors’ reactions to U S
and worldwide economic and financial conditions play important roles in
determining how demand for specific types of mutual funds—and for mutual
funds in general—evolves
U.S. Mutual Fund Assets
The majority of U S mutual fund assets at year-end 2014 were in long-term
funds, with equity funds alone comprising 52 percent of total U S mutual
fund assets (Figure 2 1) Bond funds are the second-largest category, with
22 percent of assets Money market funds (17 percent) and hybrid funds
(9 percent) held the remainder
This chapter describes recent U.S. mutual fund developments and examines the market factors that affect the demand for equity, bond, hybrid, and money market funds.
Investor Demand for U.S. Mutual Funds 28
U.S. Mutual Fund Assets 28
Investors in U.S. Mutual Funds 29
Developments in Mutual Fund Flows 30
The Global Economy and Financial Markets in 2014 31
Long-Term Mutual Fund Flows 33
The Development of Alternative Strategies Funds 43
The Growing Popularity of Index Funds 45
Demand for Money Market Funds 48

RECENT MUTUAL FUND TRENDS 29
FIGURE 2 1
Equity Funds Held More Than Half of Total Mutual Fund AssetsPercentage of total net assets, year-end 2014
17%Money market
52%Equity22%
Bond
9%Hybrid
Total U.S. mutual fund assets: $15.9 trillion
Investors in U.S. Mutual Funds
Demand for mutual funds is, in part, related to the types of investors
who hold mutual fund shares Retail investors (i e , households) held the
vast majority (89 percent) of the nearly $16 trillion in mutual fund assets
(Figure 2 2) The proportion of assets held by retail investors is even higher
(95 percent) among mutual fund assets in long-term funds (i e , equity, bond,
or hybrid funds) Retail investors also held substantial assets ($1 7 trillion) in
money market funds, but that amounts to a relatively small share (12 percent)
of their total mutual fund assets
In contrast, institutional investors such as nonfinancial businesses, financial
institutions, and nonprofit organizations held a relatively small portion of
mutual fund assets (Figure 2 2) At year-end 2014, institutions held about
11 percent of mutual fund assets One of the primary reasons institutions use
mutual funds is to help manage cash balances Sixty-two percent of the $1 7
trillion that institutions held in mutual funds was in money market funds

2015 INVESTMENT COMPANY FACT BOOK30
FIGURE 2 2
Institutional and Household Ownership of Mutual FundsBillions of dollars, year-end 2014
Households held the majority (89 percent)of mutual fund assets
Total mutual fund assets: $15,852 billionTotal long-term2 mutual fund assets: $13,127 billion
Total money market fund assets: $2,725 billion
$1,677 Households’1 money
market funds
$12,496 Households’1 long-term
mutual funds2
$1,048Institutional investors’money market funds
$631Institutional investors’long-term mutual funds2
1 Mutual funds held as investments in variable annuities and 529 plans are counted as household holdings of mutual funds.
2 Long-term mutual funds include stock, hybrid, and bond mutual funds.
Developments in Mutual Fund Flows
Overall demand for mutual funds as measured by net new cash flow—new
fund sales less redemptions plus net exchanges—slowed in 2014 Lower
demand for equity, hybrid, and money market mutual funds was only partly
offset by greater demand for bond funds Overall, mutual funds had a net
cash inflow of $102 billion in 2014, down from $175 billion in 2013 (Figure 2 3)
In 2014, investors added $96 billion, on net, to long-term funds, and $6
billion, on net, to money market funds Movements in long-term interest
rates, global economic conditions, evolving investment preferences, and
ongoing demographic trends appeared to influence mutual fund flows in
2014

RECENT MUTUAL FUND TRENDS 31
The Global Economy and Financial Markets in 2014
Despite a slow start, the U S economy turned in a moderately good
performance in 2014 Gross domestic product (GDP) contracted by 2 1 percent
in the first quarter as a “polar vortex” of cold weather chilled the economy
in the East and Midwest Growth bounced back dramatically in the next two
quarters, with GDP expanding at a 5 percent annual rate in the third quarter,
the strongest pace since the third quarter of 2003 For the full year, GDP
advanced 2 4 percent, the fastest pace since 2010
Consumer spending, which comprises roughly 70 percent of GDP, increased
by 2 5 percent in 2014 Consumer confidence was buoyed by continued
improvement in the housing market, lower unemployment, and declining
energy prices Home prices rose 5 percent in 2014, building on an 11 percent
jump in 2013 * Steady improvement in the job market shaved a percentage
point from the unemployment rate, which finished the year at 5 6 percent,
down from its recession peak of 10 0 percent in 2009 Despite this progress,
the labor market continued to face paltry wage gains and difficulty absorbing
workers who dropped out of the labor force during the recession
FIGURE 2 3
Net New Cash Flow to Mutual Funds Billions of dollars, 2000–2014
Money market fundsEquity, bond, and hybrid funds
2012* 2013 2014201120102009200820072006200520042003200220012000
388
229
159 198
198
-124-96
75121
175
160
1510296
6
-281
243
-525
-150
389
-539
412
-225
637
879
224
654472
227
245254
1926253
210
-157-46
216
-263
-48
504
129
375
28
* In 2012, investors withdrew less than $500 million from money market funds.
Note: Components may not add to the total because of rounding.
* Measured by the S&P/Case-Shiller US National Home Price Index.

2015 INVESTMENT COMPANY FACT BOOK32
Meanwhile, sharply falling oil and gasoline prices helped put more money in
consumers’ pockets Inflation worries remained subdued as the Consumer
Price Index finished the year up a mere 0 7 percent, with the core rate up only
1 6 percent
With the economy on firmer footing, the Federal Reserve decided to begin
reducing its most recent round of large scale purchases of long-term Treasury
and mortgage-backed bonds While this might have been expected to put
upward pressure on long-term interest rates, they fell steadily over the
course of 2014 Yields on 10-year Treasury bonds fell from 2 9 percent at the
beginning of 2014 to 2 2 percent by year-end Market participants cited a
variety of domestic and global factors as possibly contributing to this trend,
including lower expectations for long-term economic growth, the federal
funds rate, and inflation
The recovering U S economy spurred a 3 percent increase in after-tax
corporate profits in 2014, building on growth of 6 percent in 2013 That, along
with few growth opportunities elsewhere in the world, helped drive the
total return on the S&P 500 to 14 percent for the year Stock prices faltered
briefly in October amid concerns about a possible “triple dip” recession in
Europe, lower oil prices, and the 2014 Ebola epidemic A second, smaller
dip in worldwide stock prices occurred in mid-December over concerns that
plunging oil prices might damage oil producing economies, push Europe into
deflation, and threaten the U S energy renaissance
U S stock and bond markets performed well in 2014, in part, because
overseas growth remained disappointing—buttressing demand for U S
securities Economic growth in China slowed to 7 percent and the eurozone
economy approached a near stall as possible deflation again became a
concern European stock prices* were down 10 percent for the year In
December 2014, the European Central Bank announced its intention to start
its own quantitative easing in 2015 As a result of these factors, plus similar
easing in Japan, the value of the dollar rose 14 percent relative to both the
euro and the yen in 2014 Finally, at the end of 2014, European markets faced
renewed concern about Greece, and speculation that it might be forced out of
the eurozone, with unknown consequences for the European financial system
* Measured by the MSCI Europe Index.
RECENT MUTUAL FUND TRENDS 33
Long-Term Mutual Fund Flows
Given continued improvement in the U S economy and positive market
returns, investors added a modest $96 billion in net new cash flow to equity,
bond, and hybrid funds in 2014 (Figure 2 3)
While flows into long-term mutual funds are correlated with market returns,
flows tend to be moderate as a percentage of assets even during episodes
of market turmoil Several factors may contribute to this phenomenon One
factor is that households own the vast majority of U S long-term mutual fund
assets (Figure 2 2) and individual investors generally respond less strongly to
market events than do institutional investors Most notably, households often
use mutual funds to save for the long term, such as for college or retirement
Many of these investors make stable contributions through periodic payroll
deductions, even during periods of market stress In addition, many long-
term fund shareholders seek the advice of financial advisers, who may
provide a steadying influence during market downturns These factors are
amplified by the fact that there are more than 90 million investors in mutual
funds Thus, fund investors are bound to have a wide range of views on
market conditions and how best to respond to those conditions to meet their
individual goals As a result, even during months when funds see significant
net outflows, some investors continue to make purchases of fund shares
For analysis of long-term fund flows, see www ici org/viewpoints/view_15_ fund_flow_04
LEARN MORE

2015 INVESTMENT COMPANY FACT BOOK34
Equity Mutual Funds
Net inflows to equity funds tend to rise with stock prices and net outflows
tend to occur when stock prices fall (Figure 2 4) The return on the MSCI All
Country World Total Return Index, a measure of returns (including dividend
payments) on global stock markets, was 5 percent in 2014 and 23 percent
in 2013 At the same time, equity mutual funds received net inflows totaling
$25 billion in 2014, down substantially from $160 billion in 2013 Flows to
equity funds varied substantially throughout 2014 (Figure 2 5) Equity funds
received net inflows of $59 billion in the first four months of the year As the
year progressed, flows waned and turned negative For example, equity funds
experienced net outflows of $24 billion in December
FIGURE 2 4
Net New Cash Flow to Equity Funds Is Related to World Equity ReturnsMonthly, 2000–2014
Net new cash flow1
Total return2
Percentage of total net assets Percent
-60
-40
-20
0
20
40
60
-1.00
-0.75
-0.50
-0.25
0.00
0.25
0.50
0.75
1.00
20142012201020082006200420022000
1 Net new cash flow is the percentage of previous month-end equity fund assets, plotted as a six-month moving average.2 The total return on equities is measured as the year-over-year percent change in the MSCI All Country World Daily Total
Return Index.
Sources: Investment Company Institute and Morgan Stanley Capital International

RECENT MUTUAL FUND TRENDS 35
Outflows from equity funds late in the year were likely related, in part, to
market volatility The Chicago Board Options Exchange Volatility Index (VIX),
which tracks the volatility of the S&P 500 index, is a widely used measure of
market risk Values greater than 30 typically reflect a high degree of investor
fear and values less than 20 are associated with a period of market calm In
2014, the daily VIX averaged just 14, but peaked at 26 in October and 24 in
December By comparison, during 2013, when equity funds had strong inflows
throughout the year, the VIX never closed above 21 Lower stock market
volatility during the early part of 2014 likely helped sustain demand for equity
mutual funds
FIGURE 2 5
Net New Cash Flow to Long-Term Mutual FundsBillions of dollars, September 2013–December 2014
Sept Oct Nov DecAugJul Jun May* Apr Mar Feb Jan Dec* Nov
2013 2014
Oct Sept
5
-114
21
-15
6
22
-14
2-0.2
-20
0.2
24
3
19
9
6
10
14
4 6
95
12
4
-2
12
4
-6
104
-5
-19
-3
15
-6
52
-19
-4
-24-2
11 10
-20
2933
28
2015 14 8
8
-23
-3
13
-47
Equity fundsHybrid fundsBond funds
5
1 2
-0.2
2
-2
1
* In December 2013, investors added $224 million to hybrid funds and withdrew $207 million from equity funds; in May 2014, investors withdrew $229 million from equity funds.
Note: Components may not add to the total because of rounding.

2015 INVESTMENT COMPANY FACT BOOK36
Investors in the United States increasingly have diversified their portfolios
toward equity mutual funds that invest significantly or primarily in foreign
markets (world equity funds) Over the past 10 years, world equity funds
received net inflows of $639 billion, while domestic equity mutual funds
experienced net outflows totaling $647 billion over the same period In 2013,
this pattern subsided temporarily and domestic equity funds had their first
positive net flow since 2005 In 2014, despite a stronger U S dollar, outflows
from domestic equity funds resumed: world equity funds received $85 billion
of net new cash while domestic equity funds experienced net redemptions of
$60 billion
The strong demand for world equity funds over the past decade also likely
reflects the high returns that have been realized in overseas markets
Between 2003 and 2010, international stocks* performed better than
domestic stocks, returning an average of 13 percent per year compared
with 8 percent for domestic stocks In 2013 and 2014, however, U S stocks
significantly outperformed international stocks In 2014 alone, the total return
on the Wilshire 5000 index (float-adjusted), an index of U S stock market
performance, was 13 percent, while the total return on international stocks
was -3 percent This sharp rise in the market values of U S stocks has driven
up price-to-earnings ratios on major domestic indexes For example, at the
start of 2013, the price-to-earnings ratio† for the S&P 500 was 22 By the
end of 2014, this value had risen steadily to 27—roughly equal to the 20-year
average When price-to-earnings ratios are low compared with historical
averages, investors may view stocks as undervalued and shift assets into
equity funds This may help explain why the demand for domestic equity
funds declined in 2014
* Measured by the MSCI All Country World ex-U.S. Total Return Index.† Measured by Shiller’s cyclically adjusted price-to-earnings ratio (CAPE).

RECENT MUTUAL FUND TRENDS 37
Asset-Weighted Turnover Rate
The turnover rate—the percentage of a fund’s holdings that have changed over a year—is a
measure of a fund’s trading activity The rate is calculated by dividing the lesser of purchases
or sales (excluding those of short-term assets) in a fund’s portfolio by average net assets
To analyze the turnover rate that shareholders actually experience in their funds, it is
important to identify those funds in which shareholders are most heavily invested Neither a
simple average nor a median takes into account where fund assets are concentrated An asset-
weighted average gives more weight to funds with large amounts of assets, and accordingly,
indicates the average portfolio turnover actually experienced by fund shareholders In 2014,
the asset-weighted annual turnover rate experienced by equity fund investors was 43 percent,
well below the average of the past 35 years
Investors tend to own equity funds with relatively low turnover rates In 2014, about half of
equity fund assets were in funds with portfolio turnover rates of less than 30 percent This
reflects the propensity for funds with below-average turnover to attract shareholder dollars
FIGURE 2 6
Turnover Rate Experienced by Equity Fund Investors1980–2014
Average over 1980−2014: 61%
0
20
40
60
80
100
’12 ’14’10’08’06’04’02’00’98’96’94’92’90’88’86’84’82’80
Note: The turnover rate is an asset-weighted average. Data exclude mutual funds available as investment choices in variable annuities.
Sources: Investment Company Institute, Center for Research in Security Prices, and Strategic Insight Simfund

2015 INVESTMENT COMPANY FACT BOOK38
Bond Mutual Funds
Bond fund flows are typically correlated with the performance of bonds
(Figure 2 7), which, in turn, is primarily driven by the U S interest rate
environment In 2014, as long-term interest rates declined, bond prices, which
are inversely related to interest rates, rose This boosted returns on bonds
and bond funds Bond funds experienced net inflows of $44 billion in 2014,
compared with net outflows of $71 billion the prior year
As 2014 progressed, investors interpreted low inflation, economic headwinds
from overseas, and continued slack in labor markets as signals that rates
would stay at low levels for the near future Consequently, compared with
the prior year, bond fund investors became less concerned with mitigating
capital losses associated with rising long-term interest rates, which resulted
in lower demand for bond funds with shorter durations In particular, short-
and ultrashort-term bond funds experienced $21 billion in net inflows in 2014,
down from $32 billion in 2013 Meanwhile, long-duration bond funds—such
as those whose investment mandates focus on mid- to long-term Treasury
bonds, corporate bonds, or mortgage-backed securities—experienced inflows
in 2014 Investors put $94 billion, on net, into these fund types in 2014, after
redeeming $50 billion on net in 2013 Investors redeemed $44 billion, on net,
from high-yield bond funds in 2014 Nearly all of these outflows occurred
after June, when the Fed raised concerns about overheating in the high-yield
bond market
Despite several periods of market turmoil, bond funds have experienced
inflows through most of the past decade Bond funds received $1 9 trillion in
net inflows and reinvested dividends since 2005 (Figure 2 8) A number of
factors have helped sustain this long-term demand for bond funds
Understanding the Risks of Bond Mutual Funds: Are They Right for Me? Available at www ici org/faqs
LEARN MORE

RECENT MUTUAL FUND TRENDS 39
FIGURE 2 7
Net New Cash Flow to Bond Funds Is Related to Bond ReturnsMonthly, 2000–2014
Net new cash flow1
Total return2
Percentage of total net assets Percent
-15
-20
-10
-5
0
20
25
30
5
10
15
-1.5
-2.0
-1.0
-0.5
0.0
1.5
1.0
0.5
2.0
2.5
3.0
20142012201020082006200420022000
1 Net new cash flow is the percentage of previous month-end bond fund assets, plotted as a three-month moving average. Data exclude flows to high-yield bond funds.
2 The total return on bonds is measured as the year-over-year percent change in the Citigroup Broad Investment Grade Bond Index.
Sources: Investment Company Institute and Citigroup
FIGURE 2 8
Bond Funds Have Experienced Net Inflows Through Most of the Past Decade Cumulative flows to bond mutual funds, billions of dollars; monthly, 2005–2014
0
500
1,000
1,500
2,000
2,500
Mar 13
Oct 13
May 14
Dec 14
Aug 12
Jan 12
Jun 11
Nov 10
Apr 10
Sep 09
Feb 09
Jul 08
Dec 07
May 07
Oct 06
Mar 06
Aug 05
Jan 05
Note: Bond mutual fund flows include net new cash flow and reinvested dividends. Data exclude mutual funds that invest primarily in other mutual funds.

2015 INVESTMENT COMPANY FACT BOOK40
The aging of the U S population has played an important role in boosting
inflows to bond funds Surveys indicate that willingness to take investment
risk declines as investors age In a 2014 survey of households, 25 percent of
those aged 35 to 49 indicated that they were willing to take above-average
or substantial investment risk (Figure 2 9) In comparison, only 12 percent of
those aged 65 and older were willing to take such risks
FIGURE 2 9
Willingness to Take Above-Average or Substantial Investment Risk by Age GroupPercentage of U.S. households by age of head of household, mid-2014
Age of head of household
65 or older
12
50 to 64
23
35 to 49
25
Younger than 35
24
Note: Age is based on the age of the sole or co-decisionmaker for household saving and investing. This figure measures willingness to take investment risk for equivalent gain—for example, willingness to take above-average or substantial risk for above-average or substantial gain.
Older investors also tend to have higher account balances because they have
had more time to accumulate savings and take advantage of compounding
For example, in 2014, households in which the head was younger than 35
held just 6 percent of households’ mutual fund assets, whereas households
headed by 55- to 64-year-olds held 25 percent of households’ mutual fund
assets (Figure 2 10) Larger mutual fund holdings of older age groups,
combined with the tendency of investors to shift toward fixed-income
products as they approach retirement, implies an underlying demand for
bond funds by older investors

RECENT MUTUAL FUND TRENDS 41
The continued popularity of target date mutual funds also has helped
maintain demand for bond funds Target date mutual funds invest in
a changing mix of equities and fixed-income investments As the fund
approaches and passes its target date (which is usually specified in the fund’s
name), the fund gradually reallocates assets away from equities toward
bonds Target date mutual funds usually invest through a fund-of-funds
approach, meaning they primarily hold and invest in shares of other equity
and bond mutual funds Over the past 10 years, target date mutual funds
have garnered inflows of $433 billion In 2014, target date mutual funds had
net inflows of $45 billion and ended the year with assets of $703 billion
The growing investor interest in these funds likely reflects their automatic
rebalancing features as well as their inclusion as an investment option in
many defined contribution plans Also, following the adoption of the Pension
Protection Act of 2006, many defined contribution plans have selected target
date funds as a default option for the investments of newly enrolled plan
participants (see chapter 7)
FIGURE 2 10
Mutual Fund Assets by Age GroupPercentage of households’ mutual fund assets, selected years
65 or older55 to 6445 to 5435 to 44Younger than 35
21
32
28
42013
23
25
30
16
62014
15
19
31
31
154
2010
20
27
33
146
2005
10
26
31
21
12
20001995
15
27
27
18
13
Age of head of household
Note: Age is based on the age of the sole or co-decisionmaker for household saving and investing.
“Trends in the Expenses and Fees of Mutual Funds, 2014 ” Available at www ici org/ perspective
LEARN MORE

2015 INVESTMENT COMPANY FACT BOOK42
Hybrid Mutual Funds
With the exception of 2008, hybrid funds have seen inflows every year in
the past decade Hybrid funds, also called asset allocation funds or balanced
funds, invest in a mix of stocks and bonds The fund’s prospectus may
specify the asset allocation that the fund seeks to maintain, such as investing
approximately 60 percent of the fund’s assets in equities and 40 percent
in bonds This approach offers a way to balance the potential capital
appreciation of stocks with the income and relative stability of bonds over the
long term The fund’s portfolio may be periodically rebalanced to bring the
fund’s asset allocation more in line with prospectus objectives, which could
be necessary following capital gains or losses in the stock or bond markets
Hybrid funds have become an increasingly popular way to help investors
achieve a managed, balanced portfolio of stocks and bonds Over the past
eight years, investors have added $436 billion in net new cash and reinvested
dividends to these funds (Figure 2 11) In 2014, investors added $27 billion in
net new cash flow to hybrid funds
FIGURE 2 11
Investors Are Gravitating Toward Hybrid FundsCumulative flows to hybrid mutual funds, billions of dollars; monthly, 2007–2014
0
50
100
150
200
250
300
350
400
450
500
Jan 14
July 14
Dec 14
July 13
Jan 13
July 12
Jan 12
July 11
Jan 11
July 10
Jan 10
July 09
Jan 09
July 08
Jan 08
July 07
Jan 07
Note: Hybrid mutual fund flows include net new cash flow and reinvested dividends. Data exclude mutual funds that invest primarily in other mutual funds.

RECENT MUTUAL FUND TRENDS 43
The Development of Alternative Strategies Funds
Equity, hybrid, and bond funds offering “alternative strategies” have
attracted considerable inflows in recent years In many ways, the 2008 crisis
evoked a desire among investors to broaden their portfolios and lower the
correlation of their investments with the market In response, fund sponsors
created funds that provide an alternative to the long-only strategies of most
regulated funds By creating limited amounts of leverage and investing in a
variety of financial securities and instruments, including derivatives, these
funds permit investors to gain exposure to strategies and sectors that might
be difficult for them to obtain otherwise Many of these funds also provide
investors a means of hedging against declines in various market sectors
Alternative strategies often involve hedging long positions using options and
holding short positions in securities and sectors that appear overvalued For
example, “long/short” strategies seek to provide investors with above-market
returns by buying certain securities long (with the expectation that they will
increase in value) and selling other securities short (with the expectation
that they will decrease in value) Selling short is often employed as part of
a “market neutral” strategy, in which the fund attempts to provide positive
returns that are independent of market fluctuations Another strategy, often
referred to as a “relative-value” strategy, seeks to take advantage of price
differentials between related financial instruments For example, a fund may
track a pair of related securities with historically high correlations and, when
the prices of the two securities diverge, buy the lower-valued security and
short the other until prices converge again “Event-driven” strategies also
seek lower correlations with equity markets through arbitrage opportunities,
specifically those triggered by corporate events (such as mergers,
restructurings, liquidations, and new product offerings) Finally, a “macro”
strategy seeks to profit from anticipated changes in economic policies that
may affect relative currency values, interest rates, and stock index levels

2015 INVESTMENT COMPANY FACT BOOK44
These strategies have resonated with investors Assets in alternative
strategies mutual funds reached $170 billion at year-end 2014, nearly triple
that from five years earlier ($58 billion in 2009) Ninety-nine percent of
these assets are invested in funds with equity exposure (i e , in either hybrid
or equity alternative strategies mutual funds) Since the start of 2007,
alternative strategies mutual funds garnered $124 billion in net new cash and
reinvested dividends (Figure 2 12)
FIGURE 2 12
Alternative Strategies Mutual Funds Have Grown Rapidly Since the 2008 Financial CrisisCumulative flows to alternative strategies mutual funds, billions of dollars; monthly, 2007–2014
-20
0
20
40
60
80
100
120
140
Bond alternative strategies
Hybrid alternative strategies
Equity alternative strategies
Jan 14
July 14
Dec 14
July 13
Jan 13
July 12
Jan 12
July 11
Jan 11
July 10
Jan 10
July 09
Jan 09
July 08
Jan 08
July 07
Jan 07
Note: Alternative strategies mutual fund flows include net new cash flow and reinvested dividends. Data exclude mutual funds that invest primarily in other mutual funds.

RECENT MUTUAL FUND TRENDS 45
The Growing Popularity of Index Funds
Index funds also remained popular with investors Of households that owned
mutual funds, 31 percent owned at least one equity index mutual fund in
2014 As of year-end 2014, 382 index funds managed total net assets of
$2 1 trillion Demand for index mutual funds remained strong in 2014, with
investors adding $148 billion in net new cash flow to these funds (Figure 2 13)
Of the new money that flowed to index mutual funds, 41 percent was invested
in funds tied to domestic stock indexes, 26 percent went to funds tied to
world stock indexes, and another 33 percent was invested in funds tied to
bond or hybrid indexes, such as those commonly used to benchmark target
date mutual fund performance Net new cash flow into index domestic equity
mutual funds grew from $52 billion in 2013 to $61 billion in 2014, a 17 percent
increase
FIGURE 2 13
Net New Cash Flow to Index Mutual FundsBillions of dollars, 2000–2014
Bond and hybridWorld equityDomestic equity
2000
21
26
2001
8
18
27
2002
7
17
25
2003
31
35
2005
8811
28
2006
811
14
33
2007
16
17
28
61
2008
10
-6
31
35
2009
27
4
25
56
2010
24
19
14
58
2011
20
17
18
55
2012
29
16
15
59
2013
34
28
52
114
2014
49
38
61
148
2004
7
28
40
61
22 2
22
Note: Components may not add to the total because of rounding.

2015 INVESTMENT COMPANY FACT BOOK46
Index equity mutual funds accounted for the bulk of index mutual fund assets
at year-end 2014 Eighty-two percent of index mutual fund assets were
invested in funds that track the S&P 500 or other domestic or international
stock indexes (Figure 2 14) Mutual funds indexed to the S&P 500 managed
33 percent of all assets invested in index mutual funds The share of assets
invested in index equity mutual funds relative to all equity mutual funds’
assets moved up to 20 percent in 2014 (Figure 2 15)
FIGURE 2 14
Funds Indexed to the S&P 500 Held 33 Percent of Index Mutual Fund Assets Percent, year-end 2014
18%Bond and hybrid
12%World equity
33%S&P 500
37%Other domestic equity
Total: $2.1 trillion
FIGURE 2 15
Index Equity Mutual Funds’ Share Continued to Rise Percentage of equity mutual funds’ total net assets, 2000–2014
18.4
2013
20.2
2014
17.3
2012
16.4
2011
14.9
2010
14.0
2009
13.4
2008
11.8
2007
11.6
2006
11.4
2005
11.6
2004
11.4
2003
10.9
2002
10.2
2001
9.4
2000

RECENT MUTUAL FUND TRENDS 47
Index domestic equity mutual funds and index-based exchange-traded funds
(ETFs), which are discussed in detail in chapter 3, have benefited from this
trend toward more index-oriented investment products From 2007 through
2014, index domestic equity mutual funds and ETFs received $1 trillion in
net new cash and reinvested dividends (Figure 2 16) Index-based domestic
equity ETFs have grown particularly quickly—attracting almost twice the
flows of index domestic equity mutual funds since 2007 In contrast, actively
managed domestic equity mutual funds experienced a net outflow of $659
billion, including reinvested dividends, from 2007 to 2014
FIGURE 2 16
Some of the Outflows from Domestic Equity Mutual Funds Have Gone to ETFs Cumulative flows to and net share issuance of domestic equity mutual funds and index ETFs, billions of dollars; monthly, 2007–2014
Jan 14
July 14
Dec 14
July 13
Jan 13
July 12
Jan 12
July 11
Jan 11
July 10
Jan 10
July 09
Jan 09
July 08
Jan 08
July 07
Jan 07
0
200
400
600
800
1,000
-600
-800
-400
-200
Index domestic equity mutual funds
Index domestic equity ETFs
Actively managed domestic equity mutual funds
Note: Equity mutual fund flows include net new cash flow and reinvested dividends. Data exclude mutual funds that invest primarily in other mutual funds.

2015 INVESTMENT COMPANY FACT BOOK48
Demand for Money Market Funds
In 2014, money market funds received a modest $6 billion in net inflows
However, similar to the demand for long-term funds, demand for money
market funds was not uniform throughout 2014 In particular, outflows from
money market funds were concentrated in the first four months of 2014,
during which investors redeemed $143 billion, on net (Figure 2 17) Tax
payments by corporations in mid-March and individuals in mid-April were
likely key drivers behind these redemptions Outflows abated and money
market funds received net inflows of $164 billion over the second half of the
year Most of these flows went to institutional share classes of money
market funds
FIGURE 2 17
Net New Cash Flow to Money Market Funds Billions of dollars, September 2013–December 2014
Tax-exemptPrimeGovernment
Sept Oct Nov DecAug*Jul Jun May Apr Mar Feb Jan Dec Nov*
2013 2014
Oct Sept
46
36
12
-2
-12
-27
164
-1
-92
44
-9
530
69
-47
-30
-16
-58
3
-13
-16
10
-29
-6
-29
-17
-13
-17 -16
3
-18
-3
2
-20
223
36
13
-12
22
36
30
41
809
-2
-33
19
198
22
13
-2
-1
1
-1
1
* In November 2013, investors withdrew $414 million from tax-exempt money market funds; in August 2014, investors added $225 million to tax-exempt money market funds.
Note: Components may not add to the total because of rounding.
“Pricing of U S Money Market Funds ” Available at www ici org/pubs/research/reports
LEARN MORE

RECENT MUTUAL FUND TRENDS 49
Institutional money market funds—used by businesses, pension funds, state
and local governments, and other large-account investors—had a net inflow
of $37 billion in 2014, following a net inflow of $27 billion in 2013 (Figure 2 18)
Some of the cash generated by rising corporate profits was likely held in
money market funds and bank deposits
FIGURE 2 18
Net New Cash Flow to Retail and Institutional Money Market Funds Billions of dollars, 2000–2014
-12
27
2013
-31
37
2014
1
2012*
2
2005
60
36
2001
339
2006
96
149
2007
173
482
2008
114
523
-1
2011
-123
2009
-231
-308
2010
-401
-124
34
2002
-80
2003
-151
-112
2004
-68-89
RetailInstitutional
44
2000
116-1
159
375
-46
-263-157
62
245
654 637
-539 -525
-124
15 6
* In 2012, investors added $1 billion to institutional money market funds and withdrew $1 billion from retail money market funds. On net, investors withdrew less than $500 million from money market funds. Components may not add to the total because of rounding.

2015 INVESTMENT COMPANY FACT BOOK50
Institutions rely more heavily on money market mutual funds to manage
their cash today than they did in the early 1990s For example, in 2008,
U S nonfinancial businesses held 37 percent of their cash balances in
money market funds, up from just 6 percent in 1990 (Figure 2 19) While
this portion has declined since the 2007–2008 financial crisis, it remains
substantial, measuring 23 percent in 2014 Part of this increased demand
reflects the outsourcing of institutions’ cash management activities, which
were commonly done in-house, to asset managers Depending on the size
of the cash position, the asset manager may create a separate account for
an institutional client with direct ownership of money market instruments or
they may invest some of the cash in money market funds
FIGURE 2 19
Money Market Funds Managed 23 Percent of U.S. Businesses’ Short-Term Assets in 2014 Percent; year-end, 2000–2014
23
2013
23
2014
23
2012
23
2011
24
2010
31
2009
37
2008
28
2007
23
2006
21
2005
21
2004
23
2003
28
2002
28
20012000
21
Note: U.S. nonfinancial businesses’ short-term assets consist of foreign deposits, checkable deposits, time and savings deposits, money market funds, repurchase agreements, and commercial paper.
Sources: Investment Company Institute and Federal Reserve Board

RECENT MUTUAL FUND TRENDS 51
Individual investors tend to withdraw cash from money market funds when
the difference between yields on money market funds and interest rates on
bank deposits narrows or becomes negative Because of Federal Reserve
monetary policy, short-term interest rates remained near zero in 2014 Yields
on money market funds, which track short-term open market instruments
such as Treasury bills, also hovered near zero and remained below yields on
money market deposit accounts offered by banks (Figure 2 20) Retail money
market funds, which principally are sold to individual investors, saw a net
outflow of $31 billion in 2014, following a net outflow of $12 billion in 2013
(Figure 2 18)
FIGURE 2 20
Net New Cash Flow to Taxable Retail Money Market Funds Is Related to Interest Rate Spread Monthly, 2000–2014
Net new cash flow1
Interest rate spread2
Percentage of total net assets Percentage points
-3
-2
-1
0
2
1
3
4
5
-3
-2
-1
0
2
1
3
4
5
20142012201020082006200420022000
1 Net new cash flow is the percentage of previous month-end taxable retail money market fund assets, plotted as a six-month moving average.
2 The interest rate spread is the difference between the taxable retail money market fund yield and the average interest rate on money market deposit accounts.
Sources: Investment Company Institute, iMoneyNet, and Bank Rate Monitor
Money Market Fund Resource Center Available at www ici org/mmfs
LEARN MORE

2015 INVESTMENT COMPANY FACT BOOK52
Recent Reforms to Money Market Funds
The U S Securities and Exchange Commission (SEC) has amended Rule 2a-7,
a regulation governing money market funds, several times since 1983, placing
greater limits on the maturity and credit quality of the securities that the
funds hold, adding diversification requirements, requiring minimum levels of
liquidity for the funds, and increasing their disclosure requirements
In response to the financial crisis, the SEC significantly reformed Rule 2a-7
in 2010 Among other things, these reforms required money market funds
to hold a certain amount of liquidity and imposed stricter maturity limits
One outcome of these provisions is that prime funds have become more
like government money market funds To a significant degree, prime funds
adjusted to the SEC’s 2010 amendments to Rule 2a-7 by adding to their
holdings of Treasury and agency securities They also boosted their assets
in repurchase agreements (repos) A repo can be thought of as a short-
term collateralized loan, such as to a bank or other financial intermediary
Repos are collateralized—typically by Treasury and agency securities—to
ensure that the loan is repaid Prime fund holdings of Treasury and agency
securities and repos have risen substantially as a share of the fund portfolios,
from 12 percent in May 2007 to a peak of 36 percent in November 2012
(Figure 2 21) In December 2014, this share was 31 percent of prime fund
assets, still more than double the value prior to the financial crisis and
subsequent reforms
“Money Market Funds, Risk, and Financial Stability in the Wake of the 2010 Reforms ” Available at www ici org/perspective
LEARN MORE

RECENT MUTUAL FUND TRENDS 53
In July 2014, the SEC adopted additional rules for money market funds,
further limiting the use of amortized cost for institutional funds that invest in
nongovernment securities, and requiring that such funds price their shares to
the nearest one-hundredth of a cent Additionally, under the July 2014 rules,
nongovernment money market fund boards can impose liquidity fees and
gates (a temporary suspension of redemptions) when a fund’s weekly liquid
assets fall below 30 percent of its total assets (the regulatory minimum) The
final rules also include additional diversification, disclosure, and stress testing
requirements, as well as updated reporting by money market funds Because
the new rules will not be fully implemented until late 2016, it is not yet clear
how the SEC’s 2014 rules will affect investor demand for money market funds
FIGURE 2 21
Prime Money Market Fund Holdings of Treasury and Agency Securities and Repurchase Agreements Percentage of prime funds’ total net assets; month-end, 2000–2014
0
5
10
15
20
25
30
35
40
2012 2013 2014201120102009200820072006200520042003200220012000
12
36
31

2015 INVESTMENT COMPANY FACT BOOK54
The Federal Reserve’s Overnight Reverse-Repo Facility
In 2013, in an effort to gradually absorb excess liquidity from the financial
system, the Federal Reserve began engaging in a new program of fixed-rate,
full-allotment, overnight, and term reverse repurchase agreements The
introduction and expansion of the Fed’s reverse-repo facilities over the past
two years has greatly increased the central bank’s role as a repo counterparty
Through these facilities, money market funds (and other market participants)
lend money to the Fed overnight or for a specified term At the end of 2014,
the Federal Reserve was the repo counterparty for 52 percent of the $654
billion in repurchase agreements entered into by taxable money market
funds This share has risen from 29 percent at the end of 2013, the year the
program began
The rise, however, reflects a strong seasonal pattern Money market fund
lending to the Fed tends to spike sharply at quarter-ends, in large part
because of changes in bank regulations, especially in Europe Historically,
European banks have been a major repo counterparty to money market funds
However, European banks have generally become less willing to borrow from
U S money market funds due to regulatory pressures, especially at the end
of the quarter Therefore, money market fund lending to the Fed via reverse-
repo has offset a quarter-end decline in the share of fund investments in
European banks For example, in December 2013, 31 percent of the repurchase
agreements held by taxable money market funds were issued by European
banks By December 2014, that value had fallen to 20 percent

RECENT MUTUAL FUND TRENDS 55
2014 Fund Reclassification
To reflect changes in the marketplace, ICI has modernized its investment objective (IOB)
classifications for open-end mutual funds
ICI reports data on open-end mutual funds at several levels At the macro level, the ICI data
categories—domestic equity, world equity, taxable bond, municipal bond, hybrid, taxable
money market, and tax-exempt money market funds—have remained the same
The update reclassified the categories at a more detailed level This means that there is a break
in the time series for some of the data in Fact Book
For more information
» See the 2014 Fund Reclassification page in the data table section on page 170
» 2014 Open-End Mutual Fund Reclassification FAQs, available at www.ici.org/research/stats/iob_update/iob_faqs
» Open-End Investment Objective Definitions, available at www.ici.org/research/stats/iob_update/iob_definitions

Investors seeking to gain or shed exposure to broad market indexes,
particular sectors or geographical regions, or specific rules-based
investment strategies find that ETFs are a convenient, cost-effective
tool to achieve these objectives. Over the past decade, demand for
ETFs has grown markedly as investors—both institutional and retail—
increasingly turn to them as investment options. In the past 10 years,
more than $1.4 trillion of net new ETF shares have been issued. With
the increase in demand, sponsors have offered more ETFs with a
greater variety of investment objectives. With nearly $2.0 trillion
in assets, the U.S. ETF industry remained the largest in the world
at year-end 2014. While ETFs share some basic characteristics with
mutual funds, there are key operational and structural differences
between the two types of investment products.
CHAPTER THREE
Exchange-Traded Funds

Total net assets of ETFs reached nearly $2.0 trillion at year-end 2014
Nearly
$2.0 trillionat year-end 2014

58 2015 INVESTMENT COMPANY FACT BOOK
This chapter provides an overview of exchange-traded funds (ETFs)—how they are created, how they trade, how they differ from mutual funds, the demand by investors for ETFs, and the characteristics of ETF-owning households.
What Is an ETF? 58
U.S. ETF Assets 59
Origination of an ETF 61
Creation and Redemption of ETF Shares 62
How ETFs Trade 64
Primary Market Activity and Secondary Market Trading in ETF Shares 66
ETFs and Mutual Funds 67
Key Differences 68
Demand for ETFs 69
Characteristics of ETF-Owning Households 75
What Is an ETF?
An ETF is a pooled investment vehicle with shares that can be bought and
sold throughout the day on a stock exchange at a market-determined price
Investors may buy or sell ETF shares through a broker or in a brokerage
account just as they would the shares of any publicly traded company In the
United States, most ETFs are structured as open-end investment companies
(open-end funds) or unit investment trusts, but some ETFs—primarily those
investing in commodities, currencies, and futures—have different structures
ETFs have been available as an investment product for more than 20 years
in the United States The first ETF—a broad-based domestic equity fund
tracking the S&P 500 index—was introduced in 1993 after a fund sponsor
received U S Securities and Exchange Commission (SEC) exemptive relief
from various provisions of the Investment Company Act of 1940 that would
not otherwise allow the ETF structure Until 2008, SEC exemptive relief was
granted only to ETFs that tracked designated indexes These ETFs, commonly
referred to as index-based ETFs, are designed to track the performance of
their specified indexes or, in some cases, a multiple of or an inverse (or a
multiple of an inverse) of their indexes
Frequently Asked Questions About ETF Basics and Structure Available at www ici org/pubs/faqs
LEARN MORE

EXCHANGE-TRADED FUNDS 59
FIGURE 3 1
The United States Has the Largest ETF MarketPercentage of total net assets, year-end 2014
3%Other
Americas
73%United States
16%Europe
8%Africa and Asia-Pacific
Total worldwide ETF assets: $2.7 trillion
Sources: Investment Company Institute and ETFGI
In early 2008, the SEC first granted exemptive relief to several fund
sponsors to offer fully transparent, actively managed ETFs meeting certain
requirements Each business day, these actively managed ETFs must disclose
on their publicly available websites the identities and weightings of the
component securities and other assets held by the ETF Actively managed
ETFs do not seek to track the return of a particular index Instead, an actively
managed ETF’s investment adviser, like that of an actively managed mutual
fund, creates a unique mix of investments to meet a particular investment
objective and policy
U.S. ETF Assets
The U S ETF market—with 1,411 funds and nearly $2 0 trillion in assets under
management at year-end 2014—remained the largest in the world, accounting
for 73 percent of the $2 7 trillion in ETF assets worldwide (Figure 3 1 and
Figure 3 2)

60 2015 INVESTMENT COMPANY FACT BOOK
FIGURE 3 2
Total Net Assets and Number of ETFsBillions of dollars; year-end, 2003–2014
Number of ETFs
Total net assets of non–1940 Act ETFs1
Total net assets of 1940 Act ETFs2
1,194 1,294 1,4111,134923797728629359204152119
2012
1,337120
1,217
2011
1,048109
939
2010
992101
891
2009
77775
703
2008
531 36
496
2007
608 29
580
2006
423 15
408
2005
301 5
296
2004
228 1
226
2003
151151
2013
1,675
1,611
64
1,97457
1,918
2014
1 The funds in this category are not registered under the Investment Company Act of 1940 and invest primarily in commodities, currencies, and futures.
2 The funds in this category are registered under the Investment Company Act of 1940.
Note: Data for ETFs that invest primarily in other ETFs are excluded from the totals. Components may not add to the total because of rounding.
The vast majority of assets in U S ETFs are in funds registered with and
regulated by the SEC under the Investment Company Act of 1940 (Figure 3 2)
At year-end 2014, about 3 percent of assets were held in ETFs that are not
registered with or regulated by the SEC under the Investment Company
Act of 1940; these ETFs invest primarily in commodities, currencies, and
futures Non–1940 Act ETFs that invest in commodity or currency futures are
regulated by the Commodity Futures Trading Commission (CFTC) under the
Commodity Exchange Act and by the SEC under the Securities Act of 1933
Those that invest solely in physical commodities or currencies are regulated
by the SEC under the Securities Act of 1933
FAQs About the U S ETF Market Available at www ici org/pubs/faqs
LEARN MORE

EXCHANGE-TRADED FUNDS 61
Origination of an ETF
An ETF originates with a sponsor—a company or financial institution—that
chooses the investment objective of the ETF In the case of an index-based
ETF, the sponsor chooses both an index and a method of tracking its target
index Index-based ETFs track their target index in various ways Many
early ETFs tracked traditional indexes, mostly those weighted by market
capitalization More-recently launched index-based ETFs follow benchmarks
that use an array of index construction methodologies, with weightings
based on market capitalization, as well as other fundamental factors, such as
sales or book value Others follow factor-based metrics—indexes that first
screen potential securities for a variety of attributes, including value, growth,
or dividend payments—and then weight the selected securities equally
or by market capitalization Other customized index approaches include
screening, selecting, and weighting securities to minimize volatility, maximize
diversification, or achieve a high or low degree of correlation with the market
An index-based ETF may replicate its index (that is, it may invest 100 percent
of its assets proportionately in all the securities in the target index) or it may
sample its index by investing in a representative sample of securities in the
target index Representative sampling is a practical solution for ETFs that
track indexes containing thousands of securities (such as broad-based or total
stock market indexes), that have restrictions on ownership or transferability
(certain foreign securities), or that are difficult to obtain (some fixed-income
securities)
The sponsor of an actively managed ETF also determines the investment
objective of the fund and may trade securities at its discretion, much like an
actively managed mutual fund For instance, the sponsor may try to achieve
an investment objective such as outperforming a segment of the market or
investing in a particular sector through a portfolio of stocks, bonds, or other
assets

62 2015 INVESTMENT COMPANY FACT BOOK
Creation and Redemption of ETF Shares
Each business day, ETFs are required to provide the makeup of the creation
and redemption baskets for the next trading day The creation/redemption
baskets are specific lists of names and quantities of securities, cash, and/or
other assets Often baskets will track the ETF’s portfolio through either a pro
rata slice or a representative sample, but, at times, baskets may be limited to
a subset of the ETF’s portfolio and contain a cash component For example,
the composition of baskets for bond ETFs may vary day to day with the mix
of cash and the selection of bonds in the baskets based on liquidity in the
underlying bond market Typically, the composition of an ETF’s daily creation
and redemption baskets mirror one another
Creation
The creation/redemption mechanism in the ETF structure allows the number
of shares outstanding in an ETF to expand or contract based on demand
(Figure 3 3) When ETF shares are created or redeemed, this is categorized
as primary market activity ETF shares are created when an “authorized
participant”—typically a large institutional investor, such as a market maker
or broker-dealer that has entered into a legal contract with an ETF—submits
an order for one or more creation units A creation unit consists of a specified
number of ETF shares, generally ranging from 25,000 to 250,000 shares
The ETF shares are delivered to the authorized participant when the specified
creation basket is transferred to the ETF The ETF may permit or require an
authorized participant to substitute cash for some or all of the securities or
assets in the creation basket, particularly when an instrument in the creation
basket is difficult to obtain or may not be held by certain types of investors
(such as certain foreign securities) An authorized participant also may be
charged a cash adjustment and/or transaction fee to offset any transaction
expenses the fund undertakes The value of the creation basket and any cash
adjustment equals the value of the creation unit based on the ETF’s net asset
value (NAV) at the end of the day on which the transaction was initiated
The Creation and Redemption Process and Why It Matters Available at www ici org/viewpoints/view_12_etfbasics_creation
LEARN MORE

EXCHANGE-TRADED FUNDS 63
The authorized participant can either keep the ETF shares that make up the
creation unit or sell all or part of them to its clients or to other investors
on a stock exchange These sales by the authorized participant, along with
any subsequent purchases and sales of these existing ETF shares among
investors, are referred to as secondary market activity
FIGURE 3 3
Creation of ETF Shares
Fund or trust
Creation basket
One creation unit(e.g., 150,000 shares of an ETF)
Hold shares
Sell shares on an exchange
Authorizedparticipant
Sell shares to client
Otherinvestors
Primary market
Secondary market
Note: The creation basket represents a specific list of securities, cash, and/or other assets.

64 2015 INVESTMENT COMPANY FACT BOOK
Redemption
The redemption process in the primary market is simply the reverse A
creation unit is redeemed when an authorized participant acquires the
number of ETF shares specified in the ETF’s creation unit and returns the
creation unit to the ETF In return, the authorized participant receives the daily
redemption basket of securities, cash, and/or other assets The total value of
the redemption basket is equivalent to the value of the creation unit based on
the ETF’s NAV at the end of the day on which the transaction was initiated
How ETFs Trade
The price of an ETF share on a stock exchange is influenced by the forces of
supply and demand Though imbalances in supply and demand can cause
the price of an ETF share to deviate from its underlying value, substantial
deviations tend to be short-lived for many ETFs Two primary features
of an ETF’s structure promote trading of an ETF’s shares at a price that
approximates the ETF’s underlying value: portfolio transparency and the
ability for authorized participants to create or redeem ETF shares at the NAV
at the end of each trading day
Transparency of an ETF’s holdings—either through full disclosure of the
portfolio or through established relationships of the components of the ETF’s
portfolio with published indexes, financial or macroeconomic variables,
or other indicators—enables investors to observe and attempt to profit
from discrepancies between the ETF’s share price and its underlying value
during the trading day ETFs contract with third parties (typically market
data vendors) to calculate an estimate of an ETF’s underlying value This
calculation, often called the intraday indicative value (IIV), is based on the
prior day’s portfolio holdings and is disseminated at regular intervals during
the trading day (typically every 15 seconds) Some market participants also
can make this assessment in real time using their own computer programs
and proprietary data feeds
Exchange-Traded Funds Resource Center Available at www ici org/etf_resources
LEARN MORE

EXCHANGE-TRADED FUNDS 65
When there are discrepancies between an ETF’s share price and the value of
its underlying securities, trading can more closely align the ETF’s price and
its underlying value For example, if an ETF is trading at a discount to its
underlying value, investors may buy ETF shares and/or sell the underlying
securities The increased demand for the ETF should raise its share price
and the sales of the underlying securities should lower their share prices,
narrowing the gap between the ETF and its underlying value If the ETF is
trading at a premium to its underlying value, investors may choose to sell the
ETF and/or buy the underlying securities These actions should reduce the
ETF share price and/or raise the price of the underlying securities, bringing
the price of the ETF and the market value of its underlying securities closer
together
The ability of authorized participants to create or redeem ETF shares at
the end of each trading day also helps an ETF trade at market prices that
approximate the underlying market value of the portfolio When a deviation
between an ETF’s market price and its underlying value occurs, authorized
participants may create or redeem creation units in the primary market in an
effort to capture a profit For example, when an ETF is trading at a discount,
authorized participants may find it profitable to buy the ETF shares and sell
short the underlying securities At the end of the day, authorized participants
return ETF shares to the fund in exchange for the ETF’s redemption basket,
which they use to cover their short positions When an ETF is trading at a
premium, authorized participants may find it profitable to sell short the ETF
during the day while simultaneously buying the underlying securities At the
end of the day, the authorized participant will deliver the creation basket to
the ETF in exchange for ETF shares that they use to cover their short sales
These actions by authorized participants, commonly described as arbitrage
opportunities, help keep the market-determined price of an ETF’s shares close
to its underlying value
“Understanding Exchange-Traded Funds: How ETFs Work ” Available at www ici org/perspective
LEARN MORE

66 2015 INVESTMENT COMPANY FACT BOOK
Primary Market Activity and Secondary Market Trading in ETF Shares
Investors can trade ETFs in the primary market and the secondary market
In the primary market, authorized participants create or redeem ETF shares,
whereas in the secondary market, investors purchase or sell securities on
stock exchanges, in “dark pools” (private exchanges), and in other trading
venues Many large institutional investors can access ETFs in both the
primary and secondary markets, while most retail investors access ETFs in
the secondary market Investors involved in many of these ETF secondary
market trades generally are not motivated by arbitrage (i e , the desire to
make a profit from the difference between the market price of the ETF and its
underlying value) These investors do not interact with the ETF directly and
do not create transactions in the underlying securities, because only the ETF
shares are trading hands
Across all ETFs, investors use the secondary market more than the primary
market when trading ETFs (Figure 3 4) On average, 90 percent of the total
daily activity in ETFs occurs on the secondary market Even for ETFs with
narrower investment objectives—such as emerging markets equity, domestic
high-yield bond, and emerging markets bond—the bulk of the trading
occurs on the secondary market (94 percent, 83 percent, and 78 percent,
respectively) On average, secondary market trading is a smaller proportion
(81 percent) of total trading for bond ETFs than for equity ETFs (91 percent)
Because bond ETFs are a growing segment of the industry, many small bond
ETFs tend to have less-established secondary markets As they increase their
assets under management, the secondary market for bond ETFs is likely to
deepen naturally
FAQs About ETFs and Retail Investors Available at www ici org/pubs/faqs
LEARN MORE

EXCHANGE-TRADED FUNDS 67
ETFs and Mutual Funds
A 1940 Act ETF is similar to a mutual fund in that it offers investors a
proportionate share in a pool of stocks, bonds, and other assets It is most
commonly structured as an open-end investment company and is governed
by the Investment Company Act of 1940 Like a mutual fund, an ETF is
required to post the mark-to-market NAV of its portfolio at the end of each
trading day and must conform to the main investor protection mechanisms
of the Investment Company Act, including limitations on leverage, daily
valuation and liquidity requirements, prohibitions on transactions with
affiliates, and rigorous disclosure obligations Also like mutual funds,
creations and redemptions of ETF shares are aggregated and executed just
once per day at NAV Despite these similarities, key features differentiate ETFs
from mutual funds
FIGURE 3 4
Most ETF Activity Occurs on the Secondary MarketPercentage of secondary market activity1 relative to total activity;2 daily, January 3, 2013–June 30, 2014
Emerging markets bond
Domestic high-yield
bond
Bond Emerging markets equity
Internationalequity
Domesticequity
EquityAll3
Equity Memo
90 91 91 92 94
788381
1 Measured as average daily dollar volume of ETF shares traded in each category over the 375 daily observations in the sample.
2 Measured as the sum of primary market and secondary market activity. Primary market activity is computed as daily creations or redemptions for each ETF, which are estimated by multiplying the daily change in shares outstanding by the daily NAV from Bloomberg. Aggregate daily creations and redemptions are computed by adding creations and the absolute value of redemptions across all ETFs in each investment objective each day. Average daily creations and redemptions are the average of the aggregate daily creations and redemptions over the 375 daily observations in the sample.
3 All is the weighted average of equity, bond, hybrid, and commodity ETF market activity. Sources: Investment Company Institute and Bloomberg

68 2015 INVESTMENT COMPANY FACT BOOK
Key Differences
One major difference is that retail investors buy and sell ETF shares on the
secondary market (stock exchange) through a broker-dealer, much like they
would any other type of stock In contrast, mutual fund shares are not listed
on stock exchanges, but are purchased and sold by the fund company Retail
investors buy and sell mutual fund shares through a variety of distribution
channels, including through investment professionals—full-service brokers,
independent financial planners, bank or savings institution representatives, or
insurance agents—or directly from a fund company or discount broker
Pricing also differs between mutual funds and ETFs Mutual funds are
“forward priced,” which means that although investors can place orders to
buy or sell shares throughout the day, all orders placed during the day will
receive the same price—the NAV—the next time it is computed Most mutual
funds calculate their NAV as of 4:00 p m eastern time because that is the
time U S stock exchanges typically close In contrast, the price of an ETF
share is continuously determined on a stock exchange Consequently, the
price at which investors buy and sell ETF shares on the secondary market may
not necessarily equal the NAV of the portfolio of securities in the ETF Two
investors selling the same ETF shares at different times on the same day may
receive different prices for their shares, both of which may differ from the
ETF’s NAV
FAQs About How ETFs Compare with Other Investments Available at www ici org/pubs/faqs
LEARN MORE

EXCHANGE-TRADED FUNDS 69
Demand for ETFs
In the past decade, demand for ETFs has increased as institutional investors
have found ETFs to be a convenient vehicle for participating in, or hedging
against, broad movements in the stock market Increased awareness of these
investment vehicles by retail investors and their financial advisers also has
influenced demand for ETFs Assets in ETFs accounted for about 11 percent
of total net assets managed by investment companies at year-end 2014 Net
issuance of ETF shares reached a record $241 billion (Figure 3 5)
FIGURE 3 5
Net Issuance of ETF SharesBillions of dollars, 2003–2014
Non–1940 Act ETFs1
1940 Act ETFs2
2012 2013 2014201120102009200820072006200520042003
167
11177
142
9151
66
874
54
357
55
156
1616
210
180
-30
242
241
-1
176
1859
115
118
110
118
28
116
88
8 3
1 The funds in this category are not registered under the Investment Company Act of 1940 and invest primarily in commodities, currencies, and futures.
2 The funds in this category are registered under the Investment Company Act of 1940.
Note: Data for ETFs that invest primarily in other ETFs are excluded from the totals. Components may not add to the total because of rounding.

70 2015 INVESTMENT COMPANY FACT BOOK
In 2014, changes in investor demand for specific types of ETFs were likely
related to relative performance across the stock, bond, and commodity
markets Continued gains in major U S stock indexes and declining long-
term interest rates in the United States spurred demand for domestic equity
and bond ETFs (Figure 3 6) Net issuance of broad-based domestic equity
ETFs increased to $102 billion in 2014 from $99 billion in 2013 and domestic
sector equity ETFs experienced net issuance of $41 billion in 2014, up from
$34 billion in 2013 In contrast, demand for global and international equity
ETFs slowed in 2014 with $47 billion in net issuance, down from $63 billion in
2013 Bond and hybrid ETFs saw net issuance of $53 billion in 2014, up from
$13 billion in 2013, and commodity ETFs had net redemptions of $1 billion in
2014, compared with net redemptions of $30 billion in 2013
FIGURE 3 6
Net Issuance of ETF Shares by Investment ClassificationBillions of dollars, 2012–2014
201220132014
Commodities2Bond andhybrid1
Global/Internationalequity
Domesticsector equity
Broad-baseddomestic equity
-1
5352
34
99
9
-30
13
63
41
102
5347
14
58
1 Bond ETFs represented 97 percent of flows in the bond and hybrid category in 2014. 2 This category includes funds—both registered and not registered under the Investment Company Act of 1940—that
invest primarily in commodities, currencies, and futures.
Note: Data for ETFs that invest primarily in other ETFs are excluded from the totals.

EXCHANGE-TRADED FUNDS 71
ETFs have been available for the past 20 years, and in that time, large-cap
domestic equity ETFs have accounted for the largest proportion of all ETF
assets—28 percent, or $556 billion, at year-end 2014 (Figure 3 7) Solid
performance in international stock markets and strong investor demand over
the past six years has made global/international equity ETFs the second-
largest category with 21 percent ($415 billion) of all ETF assets Bond and
hybrid ETFs accounted for 15 percent ($299 billion) of all ETF assets
FIGURE 3 7
Total Net Assets of ETFs Were Concentrated in Large-Cap Domestic Stocks Billions of dollars, year-end 2014
Broad-based domestic equity Global/Internationalequity
Bondand
hybrid2
299
Emergingmarkets
141
International1
229
Global
45
Domesticsectorequity
268
Other
184
Small-cap
94
Mid-cap
101
Large-cap
556
57
Commodities3
57
1 This category includes international, regional, and single country ETFs. 2 Bond ETFs represented 99 percent of the assets in the bond and hybrid category in 2014.3 This category includes funds—both registered and not registered under the Investment Company Act of 1940—that
invest primarily in commodities, currencies, and futures.
Note: Data for ETFs that invest primarily in other ETFs are excluded from the totals.

72 2015 INVESTMENT COMPANY FACT BOOK
Increased investor demand for ETFs led to a rapid increase in the number of
ETFs created by fund sponsors in the past decade (Figure 3 8) From year-
end 2003 to year-end 2014, 1,645 ETFs were created—the peak years came
in 2007, with 270 new funds, and 2011, with 226 new funds In 2014, 176
ETFs were created Few ETFs had been liquidated until 2008 when market
pressures appeared to come into play and sponsors began liquidating ETFs
that had failed to gather sufficient assets Liquidations occurred primarily
among ETFs tracking virtually identical indexes, those focusing on specialty
or niche indexes, or those using alternative weighting methodologies In 2012,
the number of liquidations jumped to 81 as two sponsors exited the index-
based ETF market In 2014, 59 ETFs were liquidated On net, there were 117
more ETFs at year-end 2014 than at year-end 2013, bringing the total number
of ETFs to 1,411
FIGURE 3 8
Number of ETFs2003–2014
Created Liquidated/Merged Total at year-end
2003 10 4 119
2004 35 2 152
2005 52 0 204
2006 156 1 359
2007 270 0 629
2008 149 50 728
2009 120 49 797*
2010 177 51 923
2011 226 15 1,134
2012 141 81 1,194
2013 143 46 1,294*
2014 176 59 1,411
* The difference between the number of ETFs created and liquidated may not equal the difference between the total number of ETFs at year-end because of conversions. In 2009, two ETFs converted from holding securities directly to investing primarily in other ETFs. In 2013, three ETFs converted from investing primarily in other ETFs to holding securities directly.
Note: ETF data include ETFs not registered under the Investment Company Act of 1940 but exclude ETFs that invest primarily in other ETFs.
Nine Questions Every ETF Investor Should Ask Before Investing Available at www understand ETFs org
LEARN MORE
EXCHANGE-TRADED FUNDS 73
As demand for ETFs has grown, ETF sponsors have offered not only a greater
number of funds, but a greater variety, including ETFs investing in particular
market sectors, industries, or commodities (either directly or through the
futures market) At year-end 2014, there were 318 commodity and domestic
sector equity ETFs, with commodity ETFs representing the largest category
at 26 percent (Figure 3 9) The second-largest category, natural resource
ETFs, which hold securities of publicly traded companies involved in mining or
production of natural resources, accounted for 17 percent of the total number
of sector and commodity ETFs Commodity and domestic sector equity ETFs
altogether held $324 billion in assets Although commodity ETFs remained
the largest category in this group with 18 percent of net assets at year-end
2014, their share was down from 24 percent at year-end 2013 Tepid demand
for commodity ETFs and weakness in gold and silver prices were the primary
drivers behind the drop in commodity ETF assets in 2014
ETF sponsors continued building on recent innovations by launching
additional actively managed ETFs During 2014, 53 actively managed ETFs
were launched, bringing the total number of actively managed ETFs to 111,
with nearly $17 billion in assets at year-end

74 2015 INVESTMENT COMPANY FACT BOOK
FIGURE 3 9
Types of Commodity and Domestic Sector Equity ETFsPercent, year-end 2014
18%Commodities*
10%Consumer
12%Financial13%
Natural resources
4%Utilities
Total net assets: $324 billion
12%Health
13%Real estate
11%Technology
6%Other
26%Commodities*
8%Consumer
12%Financial
17%Natural resources
4%Utilities
Total number: 318
9%Health
6%Real estate
12%Technology
6%Other
* This category includes funds—both registered and not registered under the Investment Company Act of 1940—that invest primarily in commodities, currencies, and futures.
Note: Data for ETFs that invest primarily in other ETFs are excluded from the totals. Components may not add to 100 percent because of rounding.
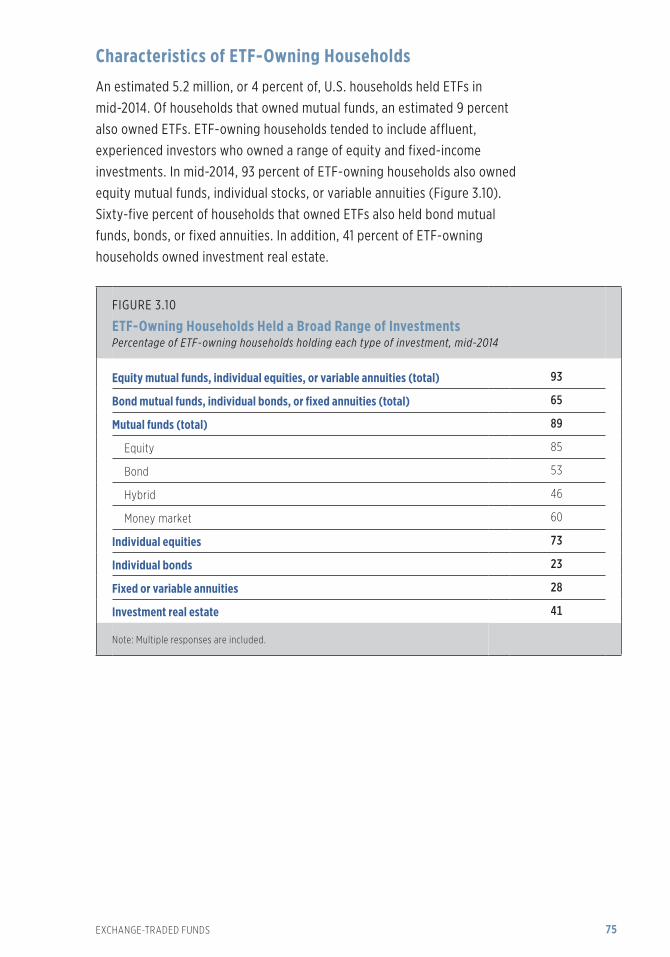
EXCHANGE-TRADED FUNDS 75
Characteristics of ETF-Owning Households
An estimated 5 2 million, or 4 percent of, U S households held ETFs in
mid-2014 Of households that owned mutual funds, an estimated 9 percent
also owned ETFs ETF-owning households tended to include affluent,
experienced investors who owned a range of equity and fixed-income
investments In mid-2014, 93 percent of ETF-owning households also owned
equity mutual funds, individual stocks, or variable annuities (Figure 3 10)
Sixty-five percent of households that owned ETFs also held bond mutual
funds, bonds, or fixed annuities In addition, 41 percent of ETF-owning
households owned investment real estate
FIGURE 3 10
ETF-Owning Households Held a Broad Range of InvestmentsPercentage of ETF-owning households holding each type of investment, mid-2014
Equity mutual funds, individual equities, or variable annuities (total) 93
Bond mutual funds, individual bonds, or fixed annuities (total) 65
Mutual funds (total) 89
Equity 85
Bond 53
Hybrid 46
Money market 60
Individual equities 73
Individual bonds 23
Fixed or variable annuities 28
Investment real estate 41
Note: Multiple responses are included.
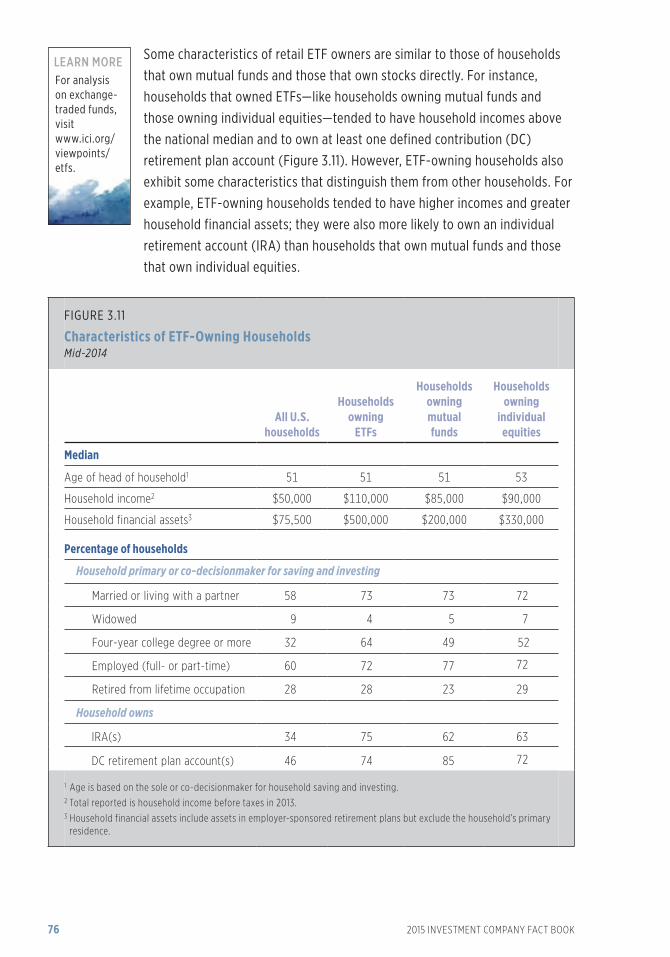
76 2015 INVESTMENT COMPANY FACT BOOK
Some characteristics of retail ETF owners are similar to those of households
that own mutual funds and those that own stocks directly For instance,
households that owned ETFs—like households owning mutual funds and
those owning individual equities—tended to have household incomes above
the national median and to own at least one defined contribution (DC)
retirement plan account (Figure 3 11) However, ETF-owning households also
exhibit some characteristics that distinguish them from other households For
example, ETF-owning households tended to have higher incomes and greater
household financial assets; they were also more likely to own an individual
retirement account (IRA) than households that own mutual funds and those
that own individual equities
For analysis on exchange-traded funds, visit www ici org/viewpoints/etfs
LEARN MORE
FIGURE 3 11
Characteristics of ETF-Owning HouseholdsMid-2014
All U.S.households
Householdsowning
ETFs
Householdsowningmutualfunds
Householdsowning
individualequities
Median
Age of head of household1 51 51 51 53
Household income2 $50,000 $110,000 $85,000 $90,000
Household financial assets3 $75,500 $500,000 $200,000 $330,000
Percentage of households
Household primary or co-decisionmaker for saving and investing
Married or living with a partner 58 73 73 72
Widowed 9 4 5 7
Four-year college degree or more 32 64 49 52
Employed (full- or part-time) 60 72 77 72
Retired from lifetime occupation 28 28 23 29
Household owns
IRA(s) 34 75 62 63
DC retirement plan account(s) 46 74 85 72
1 Age is based on the sole or co-decisionmaker for household saving and investing. 2 Total reported is household income before taxes in 2013.3 Household financial assets include assets in employer-sponsored retirement plans but exclude the household’s primary
residence.

EXCHANGE-TRADED FUNDS 77
FIGURE 3 12
ETF-Owning Households Are Willing to Take More Investment RiskPercentage of all U.S. households, mutual fund–owning households, and ETF-owning households, mid-2014
Substantial risk for substantial gainAbove-average risk for above-average gainAverage risk for average gainBelow-average risk for below-average gainUnwilling to take any risk
ETF-owning households
Mutual fund–owning households
All U.S. households
Level of risk willing to take with financial investments
126
3725
35
15
6
41
6
49
35 10
10
9
4
21% 31%49%
ETF-owning households also exhibit more willingness to take investment risk
(Figure 3 12) Forty-nine percent of ETF-owning households were willing to
take substantial or above-average investment risk for substantial or above-
average gain in 2014, compared with 21 percent of all U S households and
31 percent of mutual fund-owning households This result may be explained
by the predominance of equity ETFs, which make up 82 percent of ETF total
net assets Investors who are more willing to take investment risk may be
more likely to invest in equities

Closed-end funds are one of four types of investment companies,
along with mutual (or open-end) funds, exchange-traded funds
(ETFs), and unit investment trusts. Closed-end funds generally
issue a fixed number of shares that are listed on a stock exchange
or traded in the over-the-counter market. The assets of a closed-
end fund are professionally managed in accordance with the fund’s
investment objectives and policies, and may be invested in stocks,
bonds, and other securities.
CHAPTER FOUR
Closed-End Funds

Nearly 60 percent of closed-end fund totalassets were in bond funds at year-end 2014
59 percentin bond closed-end funds
2015 INVESTMENT COMPANY FACT BOOK80
This chapter describes recent closed-end fund developments and provides a profile of the U.S. households that own them.
What Is a Closed-End Fund? 80
Total Assets of Closed-End Funds 81
Net Issuance of Closed-End Funds 83
Closed-End Fund Distributions 84
Closed-End Fund Leverage 85
Characteristics of Households Owning Closed-End Funds 88
What Is a Closed-End Fund?
A closed-end fund is a type of investment company whose shares are listed
on a stock exchange or traded in the over-the-counter market The assets of
a closed-end fund are professionally managed in accordance with the fund’s
investment objectives and policies, and may be invested in equities, bonds,
and other securities The market price of closed-end fund shares fluctuates
like that of other publicly traded securities and is determined by supply and
demand in the marketplace
A closed-end fund is created by issuing a fixed number of common shares to
investors during an initial public offering Subsequent issuance of common
shares can occur through secondary or follow-on offerings, at-the-market
offerings, rights offerings, or dividend reinvestment Closed-end funds also
are permitted to issue one class of preferred shares in addition to common
shares Preferred shares differ from common shares in that preferred
shareholders are paid dividends but do not share in the gains and losses of
the fund Issuing preferred shares allows a closed-end fund to raise additional
capital, which it can use to purchase more securities for its portfolio
Once issued, shares of a closed-end fund generally are bought and sold by
investors in the open market and are not purchased or redeemed directly
by the fund, although some closed-end funds may adopt stock repurchase
programs or periodically tender for shares Because a closed-end fund does
not need to maintain cash reserves or sell securities to meet redemptions,
the fund has the flexibility to invest in less-liquid portfolio securities For
example, a closed-end fund may invest in securities of very small companies,
municipal bonds that are not widely traded, or securities traded in countries
that do not have fully developed securities markets
Closed-End Fund Resource Center Available at www ici org/cef
LEARN MORE

CLOSED-END FUNDS 81
FIGURE 4 1
Total Assets of Closed-End Funds Increased to $289 Billion at Year-End 2014Billions of dollars; year-end, 2004–2014
2010
238
624
2009
223
627
2008
184
642
2013
279
599
2014
289
568
2012
264
602
2011
242
632
2007
312
662
2006
297
645
2005
276
634
2004
253
618Number of closed-end funds
Total Assets of Closed-End Funds
At year-end 2014, 568 closed-end funds had total assets of $289 billion
(Figure 4 1) The number of closed-end funds available to investors remains
below its peak of 662 at the end of 2007 due to the effects of mergers,
liquidations, and conversions Although total assets at year-end 2014 were
up nearly 4 percent ($10 billion) from year-end 2013, they have not fully
recovered to the 2007 peak of $312 billion Three factors have limited the
growth in both the assets and the number of closed-end funds in recent
years First, several closed-end funds have repurchased shares through
tender offers over the past few years, reducing the number of outstanding
shares and the size of assets under management Second, a few closed-end
funds have liquidated each year and others have converted into open-end
mutual funds or ETFs Third, closed-end fund preferred share assets have
declined since the financial crisis of 2008
“The Closed-End Fund Market, 2014 ” Available at www ici org/perspective
LEARN MORE
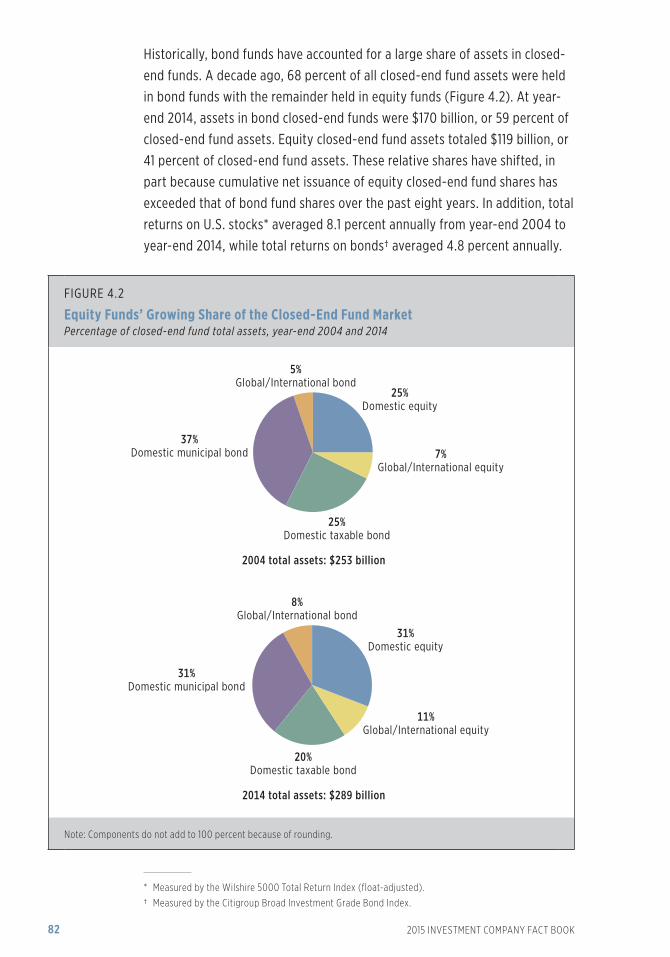
2015 INVESTMENT COMPANY FACT BOOK82
FIGURE 4 2
Equity Funds’ Growing Share of the Closed-End Fund MarketPercentage of closed-end fund total assets, year-end 2004 and 2014
25%Domestic equity
7%Global/International equity
25%Domestic taxable bond
2004 total assets: $253 billion
37%Domestic municipal bond
5%Global/International bond
31%Domestic equity
11%Global/International equity
20%Domestic taxable bond
2014 total assets: $289 billion
31%Domestic municipal bond
8%Global/International bond
Note: Components do not add to 100 percent because of rounding.
Historically, bond funds have accounted for a large share of assets in closed-
end funds A decade ago, 68 percent of all closed-end fund assets were held
in bond funds with the remainder held in equity funds (Figure 4 2) At year-
end 2014, assets in bond closed-end funds were $170 billion, or 59 percent of
closed-end fund assets Equity closed-end fund assets totaled $119 billion, or
41 percent of closed-end fund assets These relative shares have shifted, in
part because cumulative net issuance of equity closed-end fund shares has
exceeded that of bond fund shares over the past eight years In addition, total
returns on U S stocks* averaged 8 1 percent annually from year-end 2004 to
year-end 2014, while total returns on bonds† averaged 4 8 percent annually
* Measured by the Wilshire 5000 Total Return Index (float-adjusted).
† Measured by the Citigroup Broad Investment Grade Bond Index.

CLOSED-END FUNDS 83
Net Issuance of Closed-End Funds
Net issuance of closed-end fund shares slowed substantially to $4 8 billion
in 2014 from $13 7 billion in 2013, as investor demand for bond closed-end
funds waned (Figure 4 3) Net issuance of bond closed-end funds fell to
$427 million in 2014 from $10 2 billion in 2013 In contrast, demand for equity
closed-end funds strengthened further in 2014 with net issuance amounting
to $4 3 billion, up from $3 6 billion in 2013 and $3 0 billion in 2012 As in
the previous six years, net issuance of domestic equity closed-end funds
accounted for the bulk of the equity fund net issuance
FIGURE 4 3
Closed-End Fund Net Share Issuance1
Millions of dollars, 2007–20142
Equity Bond
Total Total DomesticGlobal/
International Total Domestic taxable
Domestic municipal
Global/International
2007 $28,369 $24,608 $4,949 $19,659 $3,761 $1,966 -$880 $2,675
2008 -22,298 -8,739 -7,052 -1,687 -13,560 -6,770 -6,089 -700
2009 -3,259 -2,520 -2,366 -154 -739 -788 -238 287
2010 5,430 2,054 1,995 59 3,376 1,900 1,119 357
2011 6,018 4,466 3,206 1,260 1,551 724 825 2
2012 11,315 2,953 2,840 113 8,362 3,249 3,032 2,081
2013 13,742 3,554 4,097 -543 10,188 3,921 -155 6,423
2014 4,766 4,339 3,844 494 427 105 533 -212
1 Dollar value of gross issuance (proceeds from initial and additional public offerings of shares) minus gross redemptions of shares (share repurchases and fund liquidations). A positive number indicates that gross issuance exceeded gross redemptions. A negative number indicates that gross redemptions exceeded gross issuance.
2 Data are not available for years prior to 2007.
Note: Components may not add to the total because of rounding.

2015 INVESTMENT COMPANY FACT BOOK84
Closed-End Fund Distributions
In 2014, closed-end funds distributed $17 1 billion to shareholders (Figure 4 4)
Closed-end funds may make distributions to shareholders from three possible
sources: income from interest and dividends, realized capital gains, and return
of capital Income from interest and dividends made up 75 percent of closed-
end fund distributions, with the majority of income distributions paid by bond
closed-end funds Return of capital comprised 13 percent of closed-end fund
distributions, and capital gains distributions accounted for 11 percent
FIGURE 4 4
Closed-End Fund DistributionsPercentage of closed-end fund distributions, 2014
Total closed-end fund distributions: $17.1 billion
13%Return of capital
11%Capital gains distributions
75%Income distributions*
* Income distributions include payments from interest and dividends.
Note: Components do not add to 100 percent because of rounding.

CLOSED-END FUNDS 85
Closed-End Fund Leverage
Closed-end funds have the ability, subject to strict regulatory limits, to use
leverage as part of their investment strategy The use of leverage by a closed-
end fund can allow it to achieve higher long-term returns, but also increases
risk and the likelihood of share price volatility Closed-end fund leverage can
be classified as either structural leverage or portfolio leverage At year-end
2014, at least 372 funds, accounting for 65 percent of closed-end funds,
were using structural leverage, certain types of portfolio leverage (tender
option bonds or reverse repurchase agreements), or both as a part of their
investment strategy (Figure 4 5)
FIGURE 4 5
Closed-End Funds Employing Structural and Certain Types of Portfolio LeverageNumber of funds; quarterly, selected quarters
TotalStructural 1
Portfolio 2
372377384398398401
2014:Q4
319
195
2014:Q3
323
198
2014:Q2
329
204
2014:Q1
344
213
2013:Q4
343
215
2012:Q4
359
219
1 Structural leverage affects the closed-end fund’s capital structure by increasing the fund’s portfolio assets through borrowing and issuing debt and preferred stock.
2 Portfolio leverage results from particular types of portfolio investments, including certain types of derivatives, reverse repurchase agreements, tender option bonds, and other investments or types of transactions. Data are only available for reverse repurchase agreements and tender option bonds. Given data collection constraints, and the continuing development of types of investments/transactions with a leverage characteristic (and the use of different definitions of leverage), actual portfolio leverage may be materially different from what is reflected above.
Note: Components do not add to the total because funds may employ both structural and portfolio leverage.

2015 INVESTMENT COMPANY FACT BOOK86
Structural leverage, the most common type, affects the closed-end fund’s
capital structure by increasing the fund’s portfolio assets Types of closed-
end fund structural leverage include borrowing and issuing debt and
preferred shares At the end of 2014, 319 funds had a total of $50 7 billion in
structural leverage, with a little more than half (53 percent) of those assets
from preferred shares (Figure 4 6) Forty-seven percent of closed-end fund
structural leverage was other structural leverage The average leverage
ratio* across those closed-end funds employing structural leverage was
26 0 percent at year-end 2014 Among bond funds employing structural
leverage, the average leverage ratio was somewhat higher (28 2 percent)
than that of equity funds (19 4 percent) employing structural leverage
FIGURE 4 6
Preferred Shares Comprised the Majority of Closed-End Fund Structural Leverage Percentage of closed-end fund structural leverage, year-end 2014
47%Other structural
leverage2
Total closed-end fund structural leverage: $50.7 billion
53%Preferred shares1
1 A closed-end fund may issue preferred shares to raise additional capital, which can be used to purchase more securities for its portfolio. Preferred stock differs from common stock in that preferred shareholders are paid income and capital gains distributions, but do not share in the gains and losses in the value of the fund’s shares.
2 Other structural leverage includes bank borrowing and other forms of debt.
FAQs About Closed-End Funds and Their Use of Leverage Available at www ici org/pubs/faqs
LEARN MORE
* The leverage ratio is the ratio of the amount of preferred shares and other structural leverage to the sum of the amount of common assets, preferred shares, and other structural leverage.
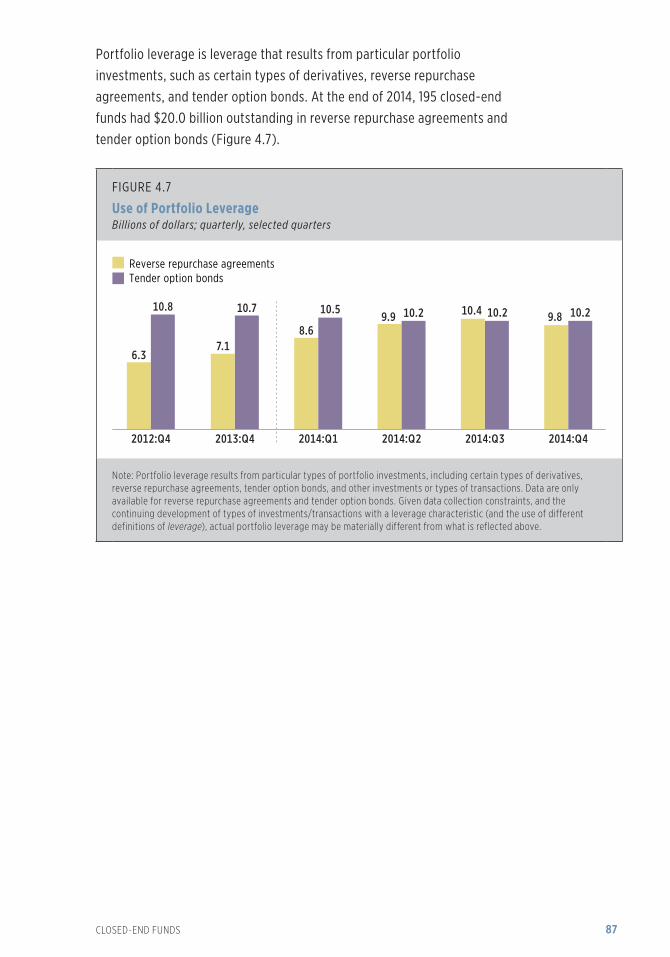
CLOSED-END FUNDS 87
Portfolio leverage is leverage that results from particular portfolio
investments, such as certain types of derivatives, reverse repurchase
agreements, and tender option bonds At the end of 2014, 195 closed-end
funds had $20 0 billion outstanding in reverse repurchase agreements and
tender option bonds (Figure 4 7)
FIGURE 4 7
Use of Portfolio LeverageBillions of dollars; quarterly, selected quarters
Reverse repurchase agreementsTender option bonds
2014:Q42014:Q32014:Q22014:Q12013:Q42012:Q4
9.810.49.98.6
7.16.3
10.210.210.210.510.710.8
Note: Portfolio leverage results from particular types of portfolio investments, including certain types of derivatives, reverse repurchase agreements, tender option bonds, and other investments or types of transactions. Data are only available for reverse repurchase agreements and tender option bonds. Given data collection constraints, and the continuing development of types of investments/transactions with a leverage characteristic (and the use of different definitions of leverage), actual portfolio leverage may be materially different from what is reflected above.

2015 INVESTMENT COMPANY FACT BOOK88
Because a large number of households that owned closed-end funds also
owned individual equities and mutual funds, the characteristics of closed-end
fund owners were similar in many respects to those of individual equity and
mutual fund owners For instance, households that owned closed-end funds
(like individual equity- and mutual fund–owning households) were more
likely than all households to be headed by college-educated individuals and
had household incomes above the national median (Figure 4 9)
Characteristics of Households Owning Closed-End Funds
An estimated 3 4 million U S households owned closed-end funds in
mid-2014 These households tended to include affluent, experienced investors
who owned a range of equity and fixed-income investments In mid-2014,
92 percent of households owning closed-end funds also owned equity mutual
funds, individual stocks, or variable annuities (Figure 4 8) Sixty-eight percent
of households that owned closed-end funds also held bonds, bond mutual
funds, or fixed annuities In addition, 43 percent of these households owned
investment real estate
FIGURE 4 8
Closed-End Fund Investors Owned a Broad Range of InvestmentsPercentage of closed-end fund–owning households holding each type of investment, mid-2014
Equity mutual funds, individual equities, or variable annuities (total) 92
Bond mutual funds, individual bonds, or fixed annuities (total) 68
Mutual funds (total) 89
Equity 85
Bond 51
Hybrid 44
Money market 66
Individual equities 72
Individual bonds 31
Fixed or variable annuities 36
Investment real estate 43
Note: Multiple responses are included.
A Guide to Closed-End Funds Available at www ici org/cef
LEARN MORE

CLOSED-END FUNDS 89
FIGURE 4 9
Closed-End Fund Investors Had Above-Average Household Incomes and Financial AssetsMid-2014
All U.S.households
Householdsowning
closed-endfunds
Householdsowningmutualfunds
Householdsowning
individualequities
Median
Age of head of household1 51 51 51 53
Household income2 $50,000 $100,000 $85,000 $90,000
Household financial assets3 $75,500 $350,000 $200,000 $330,000
Percentage of households
Household primary or co-decisionmaker for saving and investing
Married or living with a partner 58 69 73 72
Widowed 9 10 5 7
Four-year college degree or more 32 53 49 52
Employed (full- or part-time) 60 69 77 72
Retired from lifetime occupation 28 33 23 29
Household owns
IRA(s) 34 72 62 63
DC retirement plan account(s) 46 68 85 72
1 Age is based on the sole or co-decisionmaker for household saving and investing. 2 Total reported is household income before taxes in 2013.3 Household financial assets include assets in employer-sponsored retirement plans but exclude the household’s primary
residence.
Nonetheless, households that owned closed-end funds exhibited certain
characteristics distinguishing them from mutual fund–owning households
For example, households with closed-end funds tended to have significantly
greater household financial assets (Figure 4 9) Thirty-three percent of
closed-end fund–owning households were retired from their lifetime
occupations, compared with 23 percent of households owning mutual funds
Mutual funds provide investors with many investment-related
services, and for those services investors incur two primary types
of expenses and fees: ongoing expenses and sales loads. Average
expenses paid by mutual fund investors have fallen substantially
over time. For example, on an asset-weighted basis, average
expense ratios for equity funds fell from 99 basis points in 2000 to
70 basis points in 2014, a 29 percent decline.
CHAPTER FIVE
Mutual Fund Expenses and Fees

Expenses paid by equity fund investorshave fallen for five consecutive years
70 basis pointsin average expenses paid on equity funds in 2014

92 2015 INVESTMENT COMPANY FACT BOOK
Mutual fund investors, like investors in all financial products, pay for the services they receive. This chapter provides an overview of mutual fund expenses and fees.
Trends in Mutual Fund Expenses 92
Understanding the Decline in Fund Expense Ratios 94
Understanding Differences in the Expense Ratios of Mutual Funds 100
Mutual Fund Load Fees 104
Services and Expenses in 401(k) Plans 108
Trends in Mutual Fund Expenses
Mutual fund investors incur two primary types of expenses and fees: ongoing
expenses and sales loads Ongoing expenses cover portfolio management,
fund administration, daily fund accounting and pricing, shareholder services
(such as call centers and websites), distribution charges (known as 12b-1 fees),
and other operating costs These expenses are included in a fund’s expense
ratio—the fund’s annual expenses expressed as a percentage of its assets
Since expenses are paid from fund assets, investors pay these expenses
indirectly Sales loads are paid at the time of share purchase (front-end
loads), when shares are redeemed (back-end loads), or over time
(level loads)
On an asset-weighted basis, average expense ratios* incurred by mutual fund
investors have fallen substantially (Figure 5 1) In 2000, equity fund investors
incurred expense ratios of 99 basis points, on average, or 99 cents for every
$100 invested † By 2014, that average had fallen to 70 basis points, a decline
of 29 percent Hybrid and bond fund ratios also have declined The average
hybrid fund expense ratio fell from 89 basis points in 2000 to 78 basis points
in 2014, a reduction of 12 percent In addition, the average bond fund expense
ratio fell from 76 basis points in 2000 to 57 basis points in 2014, a decline of
25 percent
“Trends in the Expenses and Fees of Mutual Funds, 2014 ” Available at www ici org/perspective
LEARN MORE
* In this chapter, unless otherwise noted, average expenses are calculated on an asset-weighted basis. An asset-weighted average gives more weight to funds with large amounts of assets. It reflects where investors are actually putting their assets, and thus better reflects the actual expenses, fees, or performance experienced by investors than does a simple average (weighting each fund or share class equally). ICI’s fee research uses asset-weighted averages to summarize the expenses and fees that shareholders pay through mutual funds. In this context, asset-weighted averages are preferable to simple averages, which would overstate the expenses and fees of funds in which investors hold few dollars. ICI weights each fund’s expense ratio by its year-end assets.
† Basis points simplify percentages written in decimal form. A basis point equals one-hundredth of 1 percent (0.01 percent), so 100 basis points equals 1 percentage point. When applied to $1.00, 1 basis point equals $0.0001; 100 basis points equals one cent ($0.01).

MUTUAL FUND EXPENSES AND FEES 93
FIGURE 5 1
Expenses Incurred by Mutual Fund Investors Have Declined Substantially Since 2000Basis points, 2000–2014
Hybrid funds
Equity funds
Bond funds
74
2013
77
2012
79
2011
83
2010
87
2009
83
2008
86
2007
88
2006
91
2005
95
2004
100
2003
100
2002
99
2001
99
2000
80
2013
78
2014
79
2012
80
2011
82
2010
84
2009
77
2008
77
2007
78
2006
81
2005
85
2004
90
2003
89
2002
89
2001
89
2000
61
2013
57
2014
61
2012
62
2011
63
2010
64
2009
61
2008
64
2007
67
2006
68
2005
72
2004
75
2003
74
2002
75
2001
76
2000
2014
70
Note: Expense ratios are measured as asset-weighted averages. Data exclude mutual funds available as investment choices in variable annuities and mutual funds that invest primarily in other mutual funds.
Sources: Investment Company Institute and Lipper

94 2015 INVESTMENT COMPANY FACT BOOK
FIGURE 5 2
Mutual Fund Expense Ratios Tend to Fall as Fund Assets RiseShare classes of domestic equity mutual funds continuously in existence since 20001
Total net assets
Basis points Billions of dollars
1,8651,644
1,272
1,718
1,9722,082
2,297 2,340
1,298
1,738
1,5821,674
2,127 2,208
70
75
80
85
90
95
100
0
500
1,000
1,500
2,000
2,500
2013 20142012201120102009200820072006200520042003200220012000
Average expenseratio2
1,629
1 Calculations are based on a fixed sample of share classes. Data exclude mutual funds available as investment choices in variable annuities and mutual funds that invest primarily in other mutual funds.
2 Expense ratios are measured as asset-weighted averages.
Sources: Investment Company Institute and Lipper
Understanding the Decline in Fund Expense Ratios
Several factors help account for the steep drop in expense ratios First,
expense ratios often vary inversely with fund assets Some fund costs
included in expense ratios—such as transfer agency fees, accounting and
audit fees, and directors’ fees—are more or less fixed in dollar terms That
means that when a fund’s assets rise, these costs contribute less to a fund’s
expense ratio Thus, if the assets of a fixed sample of funds rise over time, the
sample’s average expense ratio tends to fall (Figure 5 2)
Another factor in the decline of the average expenses of long-term funds
is the shift toward no-load share classes,* particularly institutional no-load
share classes, which tend to have below-average expense ratios In part, this
shift reflects a change in how investors pay for services from brokers and
other financial professionals (see Mutual Fund Load Fees on page 104)
* See page 103 for a description of no-load share classes.

MUTUAL FUND EXPENSES AND FEES 95
Mutual fund expenses also have fallen because of economies of scale and
competition Investor demand for mutual fund services has increased
dramatically in recent years From 1990 to 2014, the number of households
owning mutual funds more than doubled—from 23 4 million to 53 2 million
All else equal, this sharp increase in demand would tend to boost fund
expense ratios Any such tendency, however, was mitigated by downward
pressure on expense ratios—from competition among existing fund sponsors,
new fund sponsors entering the industry, competition from products such
as exchange-traded funds (ETFs) (see chapter 3), and economies of scale
resulting from the growth in fund assets
Finally, shareholders tend to invest in funds with below-average expense
ratios (Figure 5 3) The simple average expense ratio of equity funds (the
average for all equity funds offered for sale) was 133 basis points in 2014
The asset-weighted average expense ratio for equity funds (the average
shareholders actually paid) was far lower—just 70 basis points
FIGURE 5 3
Fund Shareholders Paid Below-Average Expenses for Equity FundsBasis points, 2000–2014
Simple average expense ratio Asset-weighted average expense ratio
136
74
2013
133
70
2014
140
77
2012
142
79
2011
146
83
2010
150
87
2009
146
83
2008
146
86
2007
151
88
2006
154
91
2005
159
95
2004
168
100
2003
166
100
2002
165
99
2001
160
99
2000
Note: Data exclude mutual funds available as investment choices in variable annuities and mutual funds that invest primarily in other mutual funds.
Sources: Investment Company Institute and Lipper

96 2015 INVESTMENT COMPANY FACT BOOK
Another way to illustrate this tendency is to examine how investors allocate
their assets across funds At year-end 2014, equity funds with expense ratios
in the lowest quartile held 74 percent of equity funds’ total net assets, while
those with expense ratios in the upper three quartiles held only 26 percent
(Figure 5 4) This pattern holds for actively managed equity funds, index
equity funds, and target date funds (funds that adjust their portfolios,
typically more toward fixed income, as the fund approaches and passes its
target date) Index equity funds with expense ratios in the lowest quartile
held 85 percent of index equity fund assets at year-end 2014
FIGURE 5 4
Assets Are Concentrated in Lower-Cost FundsPercentage of total net assets, 2014
Funds with expense ratios in the upper three quartilesFunds with expense ratios in the lowest quartile
Target date funds2Index equity funds1Actively managedequity funds1
All equity funds1
26
74
30
70
15
85
36
64
1 Data exclude mutual funds available as investment choices in variable annuities and mutual funds that invest primarily in other mutual funds.
2 Data include mutual funds that invest primarily in other mutual funds, but exclude mutual funds available as investment choices in variable annuities. Ninety-seven percent of these funds invest primarily in other mutual funds.
Sources: Investment Company Institute and Lipper

MUTUAL FUND EXPENSES AND FEES 97
Index Mutual Fund Expenses
Growth in index mutual funds has contributed to the decline in equity and bond fund expense
ratios * Index fund assets have grown substantially in recent years, from $384 billion in 2000
to $2 1 trillion in 2014 (Figure 5 5) Investor demand for index bond funds and index hybrid
funds has grown in the past few years, but as of December 2014, 82 percent of index fund
assets were invested in index equity funds
Index funds tend to have lower-than-average expense ratios for several reasons The first is
their approach to portfolio management An index fund generally seeks to mimic the returns
on a given index Under this approach, often referred to as passive management, portfolio
managers buy and hold all, or a representative sample of, the securities in their target indexes
* Unless otherwise noted, the discussion and figures in this section exclude exchange-traded funds (ETFs), which are examined separately in chapter 3.
FIGURE 5 5
Total Net Assets and Number of Index Mutual Funds Have Increased in Recent YearsBillions of dollars, 2000–2014
Total net assets of index bond funds and index hybrid fundsTotal net assets of index equity funds
Number of index funds371 382372382365357359354343322328321313286271
1,429
305
1,734
2013
1,680
373
2,053
2014
1,031
281
1,311
2012
856
238
1,094
2011
824
1931,017
2010
678
158835
2009
481
121602
2008
748
107855
2007
665
83747
2006
548
71619
2005
494
60554
2004
404
51455
2003
28146327
2002
334
36371
2001
357
27384
2000
Note: Data exclude mutual funds that invest primarily in other mutual funds. Components may not add to the total because of rounding.

98 2015 INVESTMENT COMPANY FACT BOOK
By contrast, under an active management approach, managers have discretion to increase or
reduce their exposure to the sectors or securities in their investment mandates This approach
offers investors the chance to enjoy superior returns However, it also entails more-intensive
analysis of securities or sectors, which can be costly
A second reason index funds tend to have below-average expense ratios is their investment
focus Historically, the assets of index equity funds have been concentrated most heavily in
“large-cap blend” funds that target U S large-cap indexes, notably the S&P 500 Assets of
actively managed funds, on the other hand, have been divided among stocks of varying levels
of market capitalization, international regions, or specialized business sectors Managing
portfolios of mid- or small-cap, international, or sector stocks is generally acknowledged to be
more expensive than managing portfolios of U S large-cap stocks
Third, index funds are larger on average than actively managed funds, which helps reduce fund
expense ratios through economies of scale In 2014, the average index equity fund had $5 0
billion in assets, more than triple the $1 5 billion for the average actively managed equity fund
Finally, index fund investors who hire financial professionals might pay for that service out-of-
pocket, rather than through the fund’s expense ratio Actively managed funds more commonly
bundle those costs in the fund’s expense ratio, through a 12b-1 fee
These reasons, among others, help explain why index funds generally have lower expense
ratios than actively managed funds Note, however, that both index and actively managed
funds have contributed to the decline in mutual funds’ overall average expense ratios shown
in Figure 5 1 The average expense ratios incurred by investors in both index and actively
managed funds have fallen—and by roughly the same amount From 2000 to 2014, the average
expense ratio of index equity funds fell 16 basis points, similar to the decline of 20 basis
points in the expenses of actively managed equity funds (Figure 5 6) Over the same period,
the average expense ratio of index bond funds and actively managed bond funds fell 10 basis
points and 15 basis points, respectively

MUTUAL FUND EXPENSES AND FEES 99
In part, the downward trend in the average expense ratios of both index and actively managed
funds reflects investors’ tendency to buy lower-cost funds Investor demand for index funds is
disproportionately concentrated in the very lowest-cost funds In 2014, for example, 69 percent
of index equity fund assets were held in funds with expense ratios that were among the lowest
10 percent of all index equity funds This phenomenon is not unique to index funds, however;
the proportion of assets in the lowest-cost actively managed funds is also high
FIGURE 5 6
Expense Ratios of Actively Managed and Index FundsBasis points, 2000–2014
Actively managed equity funds
Actively managed bond funds
Index equity funds
Index bond funds0
20
40
60
80
100
120
1121
27
78
106
11
63
86
2013 20142012201120102009200820072006200520042003200220012000
Note: Expense ratios are measured as asset-weighted averages. Data exclude mutual funds available as investment choices in variable annuities and mutual funds that invest primarily in other mutual funds.
Sources: Investment Company Institute and Lipper

100 2015 INVESTMENT COMPANY FACT BOOK
Understanding Differences in the Expense Ratios of Mutual Funds
Like the prices of most goods and services, the expenses of individual mutual
funds differ considerably across the array of available products The expense
ratios of individual funds depend on many factors, including investment
objective, fund assets, and payments to intermediaries
Fund Investment Objective
Fund expenses vary by investment objective (Figure 5 7) For example, bond
and money market funds tend to have lower expense ratios than equity
funds Among equity funds, expense ratios tend to be higher for funds that
specialize in a given sector—such as healthcare or real estate—or those that
invest in equities around the world, because such funds tend to cost more to
manage Even within a particular investment objective, fund expense ratios
can vary considerably For example, 10 percent of equity funds that focus on
growth stocks have expense ratios of 74 basis points or less, while another
10 percent have expense ratios of 200 basis points or more This variation
reflects, among other things, the fact that some growth funds focus more on
small- or mid-cap stocks and others focus more on large-cap stocks This is
important because portfolios of small- and mid-cap stocks tend to cost more
to manage
“The Economics of Providing 401(k) Plans: Services, Fees, and Expenses, 2013 ” Available at www ici org/perspective
LEARN MORE

MUTUAL FUND EXPENSES AND FEES 101
FIGURE 5 7
Expense Ratios for Selected Investment ObjectivesBasis points, 2014
Investment objective10th
percentile Median90th
percentile
Asset-weighted average
Simple average
Equity funds1 72 125 208 70 133
Growth 74 120 200 82 128
Sector 79 135 216 81 141
Value 73 118 196 80 125
Blend 45 108 189 46 112
World 88 139 220 86 146
Hybrid funds1 70 124 205 78 133
Bond funds1 48 86 165 57 98
Taxable 47 90 172 57 99
Municipal 50 80 157 56 93
Money market funds1 6 10 21 13 12
Memo:
Target date funds2 49 94 161 57 99
Index equity funds1 8 44 156 11 70
1 Data exclude mutual funds available as investment choices in variable annuities and mutual funds that invest primarily in other mutual funds.
2 Data include mutual funds that invest primarily in other mutual funds, but exclude mutual funds available as investment choices in variable annuities. Ninety-seven percent of these funds invest primarily in other mutual funds.
Sources: Investment Company Institute and Lipper

102 2015 INVESTMENT COMPANY FACT BOOK
Mutual Fund Fee Structures
Mutual funds often are categorized by the class of shares that fund sponsors offer, primarily
load or no-load classes Load classes generally serve investors who buy shares through
financial professionals; no-load classes usually serve investors who buy shares without the
assistance of a financial professional or who choose to compensate their financial professional
separately Funds sold through financial professionals typically offer more than one share class
in order to provide investors with alternative ways to pay for financial services
12b-1 Fees
Since 1980, when the U S Securities and Exchange Commission adopted Rule 12b-1 under
the Investment Company Act of 1940, funds and their shareholders have had the flexibility to
compensate financial professionals and other financial intermediaries through asset-based
fees These distribution fees, known as 12b-1 fees, enable investors to pay indirectly for some
or all of the services they receive from financial professionals (such as their broker) and other
financial intermediaries (such as retirement plan recordkeepers and discount brokerage firms)
Funds also use 12b-1 fees to a very limited extent to help defray advertising and marketing
costs
Load Share Classes
Load share classes include a sales load, a 12b-1 fee, or both Sales loads and 12b-1 fees are used
to compensate brokers and other financial professionals for their services
Front-end load shares, which are predominantly Class A shares, were the traditional way
investors compensated financial professionals for assistance These shares generally charge a
sales load—a percentage of the sales price or offering price—at the time of purchase They also
generally have a 12b-1 fee, often 0 25 percent (25 basis points) Front-end load shares are used
in employer-sponsored retirement plans sometimes, but fund sponsors typically waive the
sales load for purchases made through such retirement plans Additionally, front-end load fees
often decline as the size of an investor’s initial purchase rises (called breakpoint discounts), and
many fund providers offer discounted load fees when an investor has total balances exceeding
a given amount in that provider’s funds

MUTUAL FUND EXPENSES AND FEES 103
Back-end load shares, often called Class B shares, typically do not have a front-end load
Investors using back-end load shares pay for services provided by financial professionals
through a combination of an annual 12b-1 fee and a contingent deferred sales load (CDSL)
The CDSL is paid if fund shares are redeemed before a given number of years of ownership
Back-end load shares usually convert after a specified number of years to a share class with a
lower 12b-1 fee (for example, Class A shares) The assets in back-end load shares have declined
substantially in recent years
Level-load shares, which include Class C shares, generally do not have front-end loads
Investors in this share class compensate financial advisers with an annual 12b-1 fee (typically
1 percent) and a CDSL (also typically 1 percent) that shareholders pay if they sell their shares
within a year of purchase
No-Load Share Classes
No-load share classes have no front-end load or CDSL, and have a 12b-1 fee of 0 25 percent
(25 basis points) or less Originally, no-load share classes were sold directly by mutual
fund sponsors to investors Now, investors can purchase no-load funds through employer-
sponsored retirement plans, mutual fund supermarkets, discount brokerage firms, and bank
trust departments, as well as directly from mutual fund sponsors Some financial professionals
who charge investors separately for their services, rather than through a load or 12b-1 fee, help
investors select a portfolio of no-load funds

104 2015 INVESTMENT COMPANY FACT BOOK
Mutual Fund Load Fees
Many mutual fund investors engage an investment professional, such as a
broker, an investment adviser, or a financial planner Among households
owning mutual fund shares outside employer-sponsored retirement plans,
80 percent own fund shares through investment professionals These
professionals can provide many benefits to investors, such as helping them
identify financial goals, analyzing an existing financial portfolio, determining
an appropriate asset allocation, and (depending on the type of financial
professional) providing investment advice or recommendations to help
investors achieve their financial goals The investment professional also
may provide ongoing services, such as responding to investors’ inquiries or
periodically reviewing and rebalancing their portfolios
Thirty years ago, fund shareholders usually compensated financial advisers
through a front-end load—a one-time, up-front payment for current and
future services That structure has since changed significantly
One important outcome of the changing distribution structure has been a
marked decline in load fees paid by mutual fund investors The maximum
front-end load fee that shareholders might pay for investing in mutual funds
has changed little since 1990 (Figure 5 8) But front-end load fees that
investors actually paid have declined markedly, from nearly 4 percent in
1990 to less than 1 percent in 2014 This in part reflects the increasing role of
mutual funds in helping investors save for retirement Funds that normally
charge front-end load fees often waive load fees on purchases made through
defined contribution (DC) plans, such as 401(k) plans Also, front-end load
funds offer volume discounts, that is, waiving or reducing load fees for large
initial or cumulative purchases (see Mutual Fund Fee Structures on page 102)

MUTUAL FUND EXPENSES AND FEES 105
Another important element in the changing distribution structure of mutual
funds has been a shift toward asset-based fees, which are assessed as
a percentage of the assets that the financial professional helps an investor
manage Brokers and other financial professionals who sell mutual funds
increasingly have been compensated through these fees An investor may
pay an asset-based fee indirectly through a fund’s 12b-1 fee, which is included
in the fund’s expense ratio, or directly (out-of-pocket) to the financial
professional, in which case it is not included in the fund’s expense ratio
FIGURE 5 8
Front-End Sales Loads That Investors Pay Are Well Below the Maximum Front-End Sales Loads That Funds ChargePercentage of purchase amount, selected years
Maximum front-end sales load1Average front-end sales load that investors
actually paid2
Equity Hybrid Bond Equity Hybrid Bond
1990 5.0 5.0 4.6 3.9 3.8 3.5
1995 4.8 4.7 4.1 2.5 2.4 2.1
2000 5.2 5.1 4.2 1.4 1.4 1.1
2005 5.3 5.3 4.0 1.3 1.3 1.0
2010 5.4 5.2 3.9 1.0 1.0 0.8
2014 5.4 5.2 3.8 0.9 0.9 0.7
1 The maximum front-end sales load is a simple average of the highest front-end load that funds may charge as set forth in their prospectuses.
2 The simple average front-end sales load that investors actually paid is the total front-end sales loads that funds collected divided by the total maximum loads that the funds could have collected based on their new sales that year. This ratio is then multiplied by each fund’s maximum sales load. The resulting value is then averaged across all funds.
Note: Data exclude mutual funds available as investment choices in variable annuities and mutual funds that invest primarily in other mutual funds.
Sources: Investment Company Institute, Lipper, and Strategic Insight Simfund

106 2015 INVESTMENT COMPANY FACT BOOK
In part because of the shift toward asset-based fees (either through the fund
or out-of-pocket), the market shares of front-end and back-end load share
classes have declined in recent years, while those in no-load share classes
have increased substantially For example, from year-end 2005 to year-end
2014, front-end and back-end load share classes had net outflows totaling
$717 billion (Figure 5 9); in addition, their share of long-term mutual fund
assets fell from 29 percent to 16 percent (Figure 5 10)
FIGURE 5 9
Nearly All Net New Cash Flow Was in No-Load Institutional Share ClassesBillions of dollars, 2005–2014
2005 2006 2007 2008 2009 2010 2011 2012 2013 2014
All long-term mutual funds $192 $227 $224 -$225 $389 $243 $28 $198 $160 $96
Load 12 18 -2 -156 9 -62 -129 -77 -63 -175
Front-end1 41 44 18 -105 2 -56 -100 -67 -56 -159
Back-end2 -47 -47 -42 -39 -24 -27 -23 -16 -11 -9
Level3 18 22 25 -13 31 21 -6 6 -2 -4
Other4 (*) (*) (*) (*) (*) (*) (*) -1 (*) -3
Unclassified -1 -1 -2 (*) (*) (*) (*) (*) 6 (*)
No-load5 139 156 165 -73 324 265 170 300 265 341
Retail 65 71 59 -103 139 55 -46 21 33 113
Institutional 73 84 106 30 185 210 215 279 232 228
Variable annuities 18 24 25 -26 29 7 -21 -28 -54 -66
“R” share classes6 24 29 37 30 27 33 9 3 11 -4
1 Front-end load > 1 percent. Primarily includes Class A shares; includes sales where front-end loads are waived.2 Front-end load = 0 percent and contingent deferred sales load (CDSL) > 2 percent. Primarily includes Class B shares.3 Front-end load ≤ 1 percent, CDSL ≤ 2 percent, and 12b-1 fee > 0.25 percent. Primarily includes Class C shares; excludes
institutional share classes. 4 All other load share classes not classified as front-end load, back-end load, or level load. 5 Front-end load = 0 percent, CDSL = 0 percent, and 12b-1 fee ≤ 0.25 percent. 6 “R” shares include assets in any share class that ICI designates as a “retirement share class.” These share classes
are sold predominantly to employer-sponsored retirement plans. However, other share classes—including retail and institutional share classes—also contain investments made through 401(k) plans or IRAs.
(*) = inflow or outflow of less than $0.5 billion
Note: Components may not add to the totals because of rounding. Data exclude mutual funds that invest primarily in other mutual funds.
Sources: Investment Company Institute and Lipper

MUTUAL FUND EXPENSES AND FEES 107
By contrast, no-load share classes have seen net inflows and rising assets
over the past 10 years No-load share classes have accumulated the bulk
of the inflows to long-term funds in the past decade In 2014, no-load
share classes accounted for 64 percent of long-term fund assets, up from
50 percent in 2005
FIGURE 5 10
Total Net Assets of Long-Term Mutual Funds Are Concentrated in No-Load Share ClassesBillions of dollars, 2005–2014
2005 2006 2007 2008 2009 2010 2011 2012 2013 2014
All long-term mutual funds $6,865 $8,060 $8,914 $5,771 $7,797 $9,029 $8,940 $10,359 $12,316 $13,127
Load 2,313 2,630 2,795 1,722 2,185 2,352 2,176 2,362 2,658 2,634
Front-end1 1,728 2,027 2,190 1,374 1,750 1,882 1,751 1,893 2,148 2,116
Back-end2 271 241 204 102 98 78 50 39 32 24
Level3 287 340 379 237 328 381 367 417 459 480
Other4 17 15 10 7 8 8 7 11 10 11
Unclassified 9 8 13 2 2 4 2 2 8 3
No-load5 3,427 4,073 4,587 3,055 4,255 5,091 5,224 6,262 7,594 8,366
Retail 2,404 2,799 3,091 1,940 2,666 3,069 2,991 3,469 4,144 4,625
Institutional 1,023 1,274 1,496 1,116 1,589 2,022 2,233 2,793 3,450 3,741
Variable annuities 1,039 1,225 1,346 854 1,130 1,291 1,250 1,396 1,614 1,649
“R” share classes6 85 132 186 140 226 296 290 339 451 478
1 Front-end load > 1 percent. Primarily includes Class A shares; includes sales where front-end loads are waived.2 Front-end load = 0 percent and contingent deferred sales load (CDSL) > 2 percent. Primarily includes Class B shares.3 Front-end load ≤ 1 percent, CDSL ≤ 2 percent, and 12b-1 fee > 0.25 percent. Primarily includes Class C shares; excludes
institutional share classes. 4 All other load share classes not classified as front-end load, back-end load, or level load. 5 Front-end load = 0 percent, CDSL = 0 percent, and 12b-1 fee ≤ 0.25 percent. 6 “R” shares include assets in any share class that ICI designates as a “retirement share class.” These share classes
are sold predominantly to employer-sponsored retirement plans. However, other share classes—including retail and institutional share classes—also contain investments made through 401(k) plans or IRAs.
Note: Components may not add to the totals because of rounding. Data exclude mutual funds that invest primarily in other mutual funds.
Sources: Investment Company Institute and Lipper

108 2015 INVESTMENT COMPANY FACT BOOK
Some of the shift toward no-load share classes can be attributed to do-it-
yourself investors However, a larger factor is the growth of sales through
DC plans as well as sales of no-load share classes through sales channels
that compensate financial professionals with asset-based fees outside of
funds (for example, mutual fund supermarkets, discount brokers, fee-based
advisers, full-service brokerage platforms)
Services and Expenses in 401(k) Plans
Employers are confronted with two competing economic pressures: the need
to attract and retain quality workers with competitive compensation packages
and the need to keep their products and services competitively priced In
deciding whether to offer 401(k) plans to their workers, employers must
decide if the benefits of offering a plan (in attracting and retaining quality
workers) outweigh the costs of providing the plan and plan services These
costs are both the contributions the employer makes to an employee’s 401(k)
account and the costs associated with setting up and administering the 401(k)
plan on an ongoing basis
To provide and maintain 401(k) plans, employers are required to obtain a
variety of administrative, participant-focused, regulatory, and compliance
services Employers offering 401(k) plans typically hire service providers to
operate these plans, and these providers charge fees for their services
The BrightScope/ICI Defined Contribution Plan Profile: A Close Look at 401(k) Plans. Available at www ici org/pubs/research/reports
LEARN MORE

MUTUAL FUND EXPENSES AND FEES 109
FIGURE 5 11
A Variety of Arrangements May Be Used to Compensate 401(k) Service Providers
Employer/PlanRecordkeeper/
Retirement service provider
Participants Investment provider(s)
Direct fees: dollar per participant; percentage based on assets; transactional fees
Recordkeeping and administration; plan service and consulting;
legal, compliance, and regulatory
Participant service, education, advice, and communication
Asset management; investment products
Expense ratio (percentage of assets)
Recordkeeping; distribution
Recordkeeping/ Administrative
payment (percentage of
assets)
Direct fees: dollar per participant;percentage based on assets; transactional fees
Services providedFee payment/Form of fee payment
Note: In selecting the service provider(s) and deciding the cost-sharing for the 401(k) plan, the employer/plan sponsor will determine which combinations of these fee arrangements will be used in the plan.
Source: ICI Research Perspective, “The Economics of Providing 401(k) Plans: Services, Fees, and Expenses, 2013”
As with any employee benefit, the employer generally determines how the
costs of providing the benefit will be shared between the employer and
employee 401(k) plan fees can be paid directly by the plan sponsor (the
employer), directly by the plan participant (the employee), indirectly by the
participant through fees or other reductions in returns paid to the investment
provider, or by some combination of these methods (Figure 5 11)

110 2015 INVESTMENT COMPANY FACT BOOK
One key driver of 401(k) plan fees is plan size A Deloitte/ICI study of 361 DC
plans in 2013 created and analyzed a comprehensive plan fee measure, the
“all-in fee ” The study found that plans with more participants and larger
average account balances tended to have lower all-in fees than plans with
fewer participants and smaller average account balances This observed
effect likely results in part from fixed costs required to start up and run
the plan, much of which are driven by legal and regulatory requirements It
appears that economies of scale are gained as a plan grows because these
fixed costs can be spread across more participants, a larger asset base, or
both Plans with a higher percentage of their assets in equity investments
tended to have higher all-in fees, reflecting the higher expense ratios
associated with equity investing compared with fixed-income investing The
study also examined types of service providers, automatic enrollment, the
number of investment options, and variables relating to plans’ relationships
with their service providers—but found little impact on fees
More than 60 percent of 401(k) assets at year-end 2014 were invested in
mutual funds Participants in 401(k) plans holding mutual funds tend to
invest in lower-cost funds and funds with below-average portfolio turnover
Both characteristics help to keep down the costs of investing in mutual funds
through 401(k) plans For example, at year-end 2013, 38 percent of 401(k)
equity mutual fund assets were in funds that had total annual expense
ratios of less than 50 basis points, and another 47 percent had expense
ratios between 50 basis points and 100 basis points (Figure 5 12) On an
asset-weighted basis, the average total expense ratio incurred on 401(k)
participants’ holdings of equity mutual funds through their 401(k) plans was
58 basis points in 2013, less than the asset-weighted average total expense
ratio of 74 basis points for equity mutual funds industrywide Similarly, equity
mutual funds held in 401(k) accounts tend to have lower turnover in their
portfolios The asset-weighted average turnover rate of equity funds held
in 401(k) accounts was 35 percent in 2013, less than the industrywide asset-
weighted average of 41 percent
Inside the Structure of Defined Contribution/ 401(k) Plan Fees, 2013. Available at www ici org/pubs/research/reports
LEARN MORE

MUTUAL FUND EXPENSES AND FEES 111
FIGURE 5 12
401(k) Equity Mutual Fund Assets Are Concentrated in Lower-Cost FundsPercentage of 401(k) equity mutual fund assets, 2013
100 to <150 ≥15050 to <100<50
Total expense ratio*
38
47
13
1
* The total expense ratio, expressed in basis points, includes fund operating expenses and any 12b-1 fees.
Note: Data exclude mutual funds available as investment choices in variable annuities. Components do not add to 100 percent because of rounding.
Sources: Investment Company Institute and Lipper. See ICI Research Perspective, “The Economics of Providing 401(k) Plans: Services, Fees, and Expenses, 2013.”

The percentage of U.S. households owning mutual funds grew
eightfold in the 1980s and 1990s, and has held steady for the
past 15 years, averaging about 45 percent since 2000. In mid-
2014, 43 percent of all U.S. households owned mutual funds. The
estimated 90 million people who owned mutual funds in mid-2014
belong to all age and income groups, have a variety of financial
goals, and buy and sell mutual funds through four principal sources:
investment professionals, employer-sponsored retirement plans,
fund companies directly, and fund supermarkets.
CHAPTER SIX
Characteristics of Mutual Fund Owners

Nearly three-quarters of mutual fund–owninghouseholds said that retirement saving was the household’s primary financial goal in 2014
74 percentsaving primarilyfor retirement

114 2015 INVESTMENT COMPANY FACT BOOK
This chapter takes an in-depth look at the characteristics of U.S. mutual fund owners and examines how they buy fund shares.
Individual and Household Ownership of Mutual Funds 114
Mutual Fund Ownership by Age and Income 116
Savings Goals of Mutual Fund Investors 119
Where Investors Own Mutual Funds 120
Sources of Mutual Fund Purchases 122
Shareholder Sentiment, Willingness to Take Investment Risk, and Confidence 125
Shareholders’ Use of the Internet 129
FIGURE 6 1
43 Percent of U.S. Households Owned Mutual Funds in 2014Millions of U.S. households owning mutual funds, selected years
Percentage of U.S. households owning mutual funds
2012
53.8
2011
52.9
2010
53.2
2005
50.3
2000
48.6
1995
28.4
1990
23.4
1985
12.8
1980
4.6
44.4 46.3 43.344.145.344.445.728.725.114.75.7
2013
56.7
2014
53.2
Sources: Investment Company Institute and U.S. Census Bureau. See ICI Research Perspective, “Ownership of Mutual Funds, Shareholder Sentiment, and Use of the Internet, 2014.”
Individual and Household Ownership of Mutual Funds
In mid-2014, an estimated 90 million individual investors owned mutual
funds—and at year-end, these investors held 89 percent of total mutual
fund assets, directly or through retirement plans Household ownership of
mutual funds has remained steady since 2000 Altogether, 43 percent of U S
households—or about 53 2 million—owned mutual funds in mid-2014, slightly
below the 2000–2014 average of about 45 percent (Figure 6 1) Mutual
funds were a major component of many U S households’ financial holdings
in mid-2014 Among households owning mutual funds, the median amount
invested in mutual funds was $103,000 (Figure 6 2) Nearly three-quarters
of individuals heading households that owned mutual funds were married
or living with a partner, nearly half were college graduates, and more than
three-quarters worked full- or part-time

CHARACTERISTICS OF MUTUAL FUND OWNERS 115
FIGURE 6 2
Characteristics of Mutual Fund InvestorsMid-2014
How many people own mutual funds?
90.4 million individuals
53.2 million U.S. households
Who are they?
51 is the median age of the head of household
73 percent are married or living with a partner
49 percent are college graduates
77 percent are employed (full- or part-time)
12 percent are Silent or GI Generation (born 1904 to 1945)
42 percent are Baby Boomers (born 1946 to 1964)
31 percent are Generation X (born 1965 to 1980)
15 percent are Millennial Generation (born 1981 to 2004)
$85,000 is the median household income
What do they own?
$200,000 is the median household financial assets
$103,000 is the median mutual fund assets
68 percent hold more than half of their financial assets in mutual funds
62 percent own IRAs
85 percent own DC retirement plan accounts
4 mutual funds is the median number owned
86 percent own equity funds
When and how did they make their first mutual fund purchase?
47 percent bought their first mutual fund before 1995
64 percent purchased their first mutual fund through an employer-sponsored retirement plan
Why do they invest?
91 percent are saving for retirement
49 percent are saving for emergencies
49 percent hold mutual funds to reduce taxable income
23 percent are saving for education
Sources: Investment Company Institute and U.S. Census Bureau. See ICI Research Perspective, “Ownership of Mutual Funds, Shareholder Sentiment, and Use of the Internet, 2014”; ICI Research Perspective, “Characteristics of Mutual Fund Investors, 2014”; and ICI Research Report, “Profile of Mutual Fund Shareholders, 2014.”

116 2015 INVESTMENT COMPANY FACT BOOK
FIGURE 6 3
Incidence of Mutual Fund Ownership Is Greatest Among 35- to 64-Year-OldsPercentage of U.S. households within each age group, mid-2014
Age of head of household
65 or older55 to 6445 to 5435 to 44Younger than 35
34
505349
34
Note: Age is based on the age of the sole or co-decisionmaker for household saving and investing.
Sources: Investment Company Institute and U.S. Census Bureau. See ICI Research Perspective, “Ownership of Mutual Funds, Shareholder Sentiment, and Use of the Internet, 2014.”
Mutual Fund Ownership by Age and Income
Mutual fund ownership in mid-2014 was greatest among households in their
peak earning and saving years—between the ages of 35 and 64—at about
50 percent (Figure 6 3) Thirty-four percent of households younger than 35
owned mutual funds, the same as for households aged 65 or older
Among mutual fund–owning households in mid-2014, 42 percent were
headed by members of the Baby Boom Generation (head of household born
between 1946 and 1964), 31 percent were headed by members of Generation
X (born between 1965 and 1980), 15 percent were headed by members of the
Millennial Generation (born between 1981 and 2004), and 12 percent were
headed by members of the Silent and GI Generations (born between 1904 and
1945) (Figure 6 4) Heads of mutual fund–owning households had a median
age of 51 years (Figure 6 2)
“Ownership of Mutual Funds, Shareholder Sentiment, and Use of the Internet, 2014 ” Available at www ici org/perspective
LEARN MORE

CHARACTERISTICS OF MUTUAL FUND OWNERS 117
FIGURE 6 4
The Baby Boom Generation Is the Largest Shareholder Group and Holds the Most Mutual Fund AssetsPercentage of mutual fund–owning households and mutual fund assets by generation, mid-2014
Millennial Generation (head of household born between 1981 and 2004)Generation X (head of household born between 1965 and 1980)Baby Boom Generation (head of household born between 1946 and 1964)Silent and GI Generations (head of household born between 1904 and 1945)
Age of head of household
Households owning mutual funds
15
31
42
12
Households’ mutual fund assets
5
31
51
13
Note: Generation is based on the age of the sole or co-decisionmaker for household saving and investing.
Source: ICI Research Perspective, “Characteristics of Mutual Fund Investors, 2014”
Not only were Baby Boomers the largest shareholder group in mid-2014, they
also held the largest percentage of households’ mutual fund assets, at 51 percent
(Figure 6 4) Households headed by members of Generation X (31 percent), the
Silent and GI Generations (13 percent), and the Millennial Generation (5 percent)
held the rest

118 2015 INVESTMENT COMPANY FACT BOOK
FIGURE 6 5
Ownership of Mutual Funds Increases with Household IncomePercentage of U.S. households within each income group, mid-2014
67%$50,000 or more
18%Less than $50,000
Household income
Less than $25,000
$25,000 to $34,999
$35,000 to $49,999
$50,000 to $74,999
$75,000 to $99,999
$100,000 or more
7
21
36
52
67
77
Note: Total reported is household income before taxes in 2013.
Sources: Investment Company Institute and U.S. Census Bureau. See ICI Research Perspective, “Ownership of Mutual Funds, Shareholder Sentiment, and Use of the Internet, 2014.”
Households with higher annual incomes are more likely to own mutual
funds than those with lower annual incomes In mid-2014, 67 percent of U S
households with annual income of $50,000 or more owned mutual funds,
compared with 18 percent of households with annual income of less than
$50,000 (Figure 6 5) In fact, lower-income households tend to have less
savings than higher-income households The typical household with less than
$50,000 in annual income had only $12,000 in savings and investments,
while the typical household with annual income of $50,000 or more held
$190,000 in savings and investments

CHARACTERISTICS OF MUTUAL FUND OWNERS 119
FIGURE 6 6
Most Households That Own Mutual Funds Have Moderate IncomesPercent distribution of all U.S. households and households owning mutual funds by household income, mid-2014
Households owningmutual funds
All U.S. households
244 5
10
Household income
$200,000 or more$100,000 to $199,999$75,000 to $99,999$50,000 to $74,999$35,000 to $49,999$25,000 to $34,999Less than $25,000
11
14
21
1819
1231
1795
Note: Total reported is household income before taxes in 2013.
Sources: Investment Company Institute and U.S. Census Bureau. See ICI Research Perspective, “Ownership of Mutual Funds, Shareholder Sentiment, and Use of the Internet, 2014.”
U S households owning mutual funds had a range of annual incomes in
mid-2014: 20 percent had annual income of less than $50,000; 21 percent
had between $50,000 and $74,999; 19 percent had between $75,000 and
$99,999; and the remaining 40 percent had $100,000 or more (Figure 6 6)
The median income of mutual fund–owning households in mid-2014 was
$85,000 (Figure 6 2)
Savings Goals of Mutual Fund Investors
Mutual funds play a key role in the savings goals of U S households—both
long- and short-term In mid-2014, 91 percent of mutual fund–owning
households indicated that saving for retirement was one of their financial
goals (Figure 6 2), and 74 percent said it was their primary financial goal
However, retirement is not the only financial goal for mutual fund–owning
households—49 percent reported saving for emergencies as a goal;
49 percent reported reducing taxable income as a goal; and 23 percent
reported saving for education as a goal (Figure 6 2)
120 2015 INVESTMENT COMPANY FACT BOOK
Where Investors Own Mutual Funds
The importance that mutual fund–owning households place on retirement
saving is reflected in where they own their funds—94 percent of these
households held mutual fund shares inside employer-sponsored retirement
plans, individual retirement accounts (IRAs), and other tax-deferred
accounts in mid-2014 It also is reflected in the type of funds they choose,
with households more likely to invest their retirement assets in long-term
mutual funds than in money market funds Indeed, defined contribution
(DC) retirement plan and IRA assets held in equity, bond, and hybrid mutual
funds totaled $6 9 trillion at year-end 2014, or 53 percent of those funds’
assets industrywide By contrast, DC retirement plan and IRA assets in money
market funds totaled just $364 billion, or 13 percent of those funds’ assets
industrywide
As 401(k) and other employer-sponsored DC retirement plans have grown
more popular, the percentage of households that make their first foray
into mutual fund investing inside these plans has increased Among the
households that bought their first mutual fund shares in 2005 or later,
68 percent did so inside an employer-sponsored retirement plan (Figure 6 7)
Among those that bought their first mutual fund shares before 1990, only
57 percent did so inside an employer-sponsored retirement plan
“Characteristics of Mutual Fund Investors, 2014 ” Available at www ici org/ perspective
LEARN MORE

CHARACTERISTICS OF MUTUAL FUND OWNERS 121
In mid-2014, 82 percent of mutual fund–owning households held funds inside
employer-sponsored retirement plans, with 43 percent owning funds only
inside such plans (Figure 6 8) Fifty-seven percent of mutual fund–owning
households held funds outside employer-sponsored retirement accounts,
with 18 percent owning funds only outside such plans For mutual fund–
owning households without funds in employer-sponsored retirement plans,
59 percent held funds in traditional or Roth IRAs In many cases, these IRAs
held assets rolled over from 401(k) plans or other employer-sponsored
retirement plans (either defined benefit or DC plans)
FIGURE 6 7
Employer-Sponsored Retirement Plans Are Increasingly the Source of First Mutual Fund PurchasePercentage of U.S. households owning mutual funds, mid-2014
Year of household’s first mutual fund purchase Memo:all mutual
fund–owning households
Before1990
1990 to1994
1995 to1999
2000 to 2004
2005 or later
Source of first mutual fund purchase
Inside employer-sponsored retirement plan
57 62 69 74 68 64
Outside employer-sponsored retirement plan
43 38 31 26 32 36
Note: Employer-sponsored retirement plans include DC plans (such as 401(k), 403(b), or 457 plans) and employer-sponsored IRAs (SEP IRAs, SAR-SEP IRAs, and SIMPLE IRAs).
Source: ICI Research Perspective, “Characteristics of Mutual Fund Investors, 2014”

122 2015 INVESTMENT COMPANY FACT BOOK
FIGURE 6 8
82 Percent of Mutual Fund–Owning Households Held Shares Inside Employer-Sponsored Retirement PlansMid-2014
Outside employer-sponsored retirement
plans only1
Inside and outsideemployer-sponsored
retirement plans1
Inside employer-sponsored retirement
plans only1
40%Investment professionals2and fund companies, fund
supermarkets, ordiscount brokers
13%Fund companies, fund
supermarkets, or discountbrokers only7%
Source unknown
40%Investmentprofessionals
only2
Sources of mutual fund ownershipPercentage of U.S. households owning mutual funds
Sources for households owning mutual fundsoutside employer-sponsored retirement plansPercentage of U.S. households owning mutual funds outside employer-sponsored retirement plans1
18
39
43
1 Employer-sponsored retirement plans include DC plans (such as 401(k), 403(b), or 457 plans) and employer-sponsored IRAs (SEP IRAs, SAR-SEP IRAs, and SIMPLE IRAs).
2 Investment professionals include registered investment advisers, full-service brokers, independent financial planners, bank and savings institution representatives, insurance agents, and accountants.
Source: ICI Research Perspective, “Characteristics of Mutual Fund Investors, 2014”
Sources of Mutual Fund Purchases
Households owning mutual funds outside employer-sponsored retirement
plans buy their fund shares through a variety of sources In mid-2014,
80 percent of these households owned funds purchased with the help
of an investment professional, including registered investment advisers,
full-service brokers, independent financial planners, bank and savings
institution representatives, insurance agents, and accountants (Figure 6 8)
Forty percent of these households owned funds purchased solely with the
help of an investment professional, while another 40 percent owned funds
purchased from investment professionals and directly from fund companies,
fund supermarkets, or discount brokers Thirteen percent solely owned funds
purchased directly from fund companies, fund supermarkets, or discount
brokers

CHARACTERISTICS OF MUTUAL FUND OWNERS 123
In mid-2014, about 46 percent of mutual fund–owning households held
mutual funds through multiple sources: 15 percent held mutual funds both
inside employer-sponsored retirement plans and through investment
professionals; 5 percent held mutual funds both inside employer-sponsored
retirement plans and directly from fund companies, fund supermarkets,
or discount brokers; and 7 percent held mutual funds through investment
professionals and directly from fund companies, fund supermarkets, or
discount brokers (Figure 6 9) Sixteen percent owned mutual funds through
all three source categories Another 3 percent owned funds inside and outside
employer-sponsored retirement plans, without specifying their outside
purchase source When owning funds through only one source category,
the most common source was employer-sponsored retirement plans, at
43 percent
FIGURE 6 9
Nearly Half of Mutual Fund–Owning Households Held Shares Through Multiple SourcesPercentage of U.S. households owning mutual funds, mid-2014
Inside employer-sponsored retirement plans1
Investment professionals2
Fund companies, fund supermarkets, or discount brokers
43%
16%
8%
7%
2%5%
15%
1 Employer-sponsored retirement plans include DC plans (such as 401(k), 403(b), or 457 plans) and employer-sponsored IRAs (SEP IRAs, SAR-SEP IRAs, and SIMPLE IRAs).
2 Investment professionals include registered investment advisers, full-service brokers, independent financial planners, bank and savings institution representatives, insurance agents, and accountants.
Note: Figure does not add to 100 percent because 4 percent of households owning mutual funds indicated that they owned funds outside of employer-sponsored retirement plans, but did not indicate which source was used to purchase funds. Of this 4 percent, 3 percent owned funds both inside and outside employer-sponsored retirement plans and 1 percent owned funds only outside of employer-sponsored retirement plans.
Source: ICI Research Perspective, “Characteristics of Mutual Fund Investors, 2014”

124 2015 INVESTMENT COMPANY FACT BOOK
At year-end 2014, mutual funds held in DC plans and IRAs accounted for
$7 3 trillion, or 29 percent of, the $24 7 trillion U S retirement market The
$7 3 trillion made up 46 percent of total mutual fund assets at year-end 2014
DC plans and IRAs held 53 percent of total assets in long-term mutual funds,
but a much smaller share of total assets in money market funds (13 percent)
Similarly, mutual funds held in DC plans and IRAs accounted for 55 percent of
household long-term mutual funds but only 22 percent of household money
market funds (Figure 6 10)
FIGURE 6 10
Households’ Mutual Fund Assets by Type of Account Billions of dollars, year-end 2014
Households’ money market fund assets
Households’ long-term mutual fund assets
1,677
12,496
1,291 221
Other household accounts1
Variable annuities outside retirement plansIRAs2
DC plans3
3,580
3,325
1,168
4,423
22 143
55%
22%
1 Mutual funds held as investments in 529 plans and Coverdell ESAs are counted in this category. 2 IRAs include traditional IRAs, Roth IRAs, and employer-sponsored IRAs (SEP IRAs, SAR-SEP IRAs, and SIMPLE IRAs). 3 DC plans include 401(k) plans, 403(b) plans, 457 plans, Keoghs, and other DC plans without 401(k) features.

CHARACTERISTICS OF MUTUAL FUND OWNERS 125
Shareholder Sentiment, Willingness to Take Investment Risk, and Confidence
Each year, ICI surveys U S households about a variety of topics, including
shareholder sentiment In mid-2014, 68 percent of mutual fund–owning
households familiar with mutual fund companies had “very” or “somewhat”
favorable impressions of fund companies, the same as in 2013 (Figure 6 11)
The share of mutual fund–owning households with “very” favorable
impressions of fund companies, meanwhile, increased from 13 percent to
17 percent
FIGURE 6 11
Most Shareholders View the Mutual Fund Industry FavorablyPercentage of mutual fund shareholders familiar with mutual fund companies, selected years
Very favorableSomewhat favorableSomewhat unfavorableVery unfavorableNo opinion
2001
161 4
57
22
79
2003
181
10
55
16
71
2005
172 7
59
15
74
2007
1 8
57
20
77
2008
15142
10
57
16
73
2009
164
16
54
10
64
2010
172
14
55
12
67
2013
212
9
55
13
68
2014
222 8
51
17
68
Source: ICI Research Perspective, “Ownership of Mutual Funds, Shareholder Sentiment, and Use of the Internet, 2014”
“Profile of Mutual Fund Shareholders, 2014 ” Available at www ici org/pubs/research/reports
LEARN MORE

126 2015 INVESTMENT COMPANY FACT BOOK
Among all U S households, the percentage willing to take above-average or
substantial investment risk tends to move with stock market performance
U S households tend to become less tolerant of investment risk following
periods of poor stock market performance For example, willingness to take
above-average or substantial investment risk fell from 23 percent in mid-
2008, just before the 2007–2008 financial crisis hit, to 19 percent in mid-2009
(Figure 6 12) Not until mid-2013, more than four years after the stock market
bottomed out, did willingness to take investment risk rebound
FIGURE 6 12
Households’ Willingness to Take Investment Risk Tends to Move with the Stock MarketPercentage of U.S. households willing to take above-average or substantial investment risk and S&P 500, 1988–2014
0
250
500
750
1,000
1,250
1,500
1,750
2,000
2,250
2,500
’12
’13
’14
’11
’10
’09
’08
’07
’06
’05
’04
’03
’02
’01
’00
’99
’98
’97
’96
’95
’94
’93
’92
’91
’90
’89
’88
Index level Percent
10
12
14
16
18
20
22
24
ICI measure of willingness to take risk (right scale)SCF measure of willingness to take risk (right scale)
S&P 500 (left scale)
Note: The S&P 500 is an index of 500 stocks chosen for market size, liquidity, and industry group representation.
Sources: ICI Annual Mutual Fund Shareholder Tracking Survey, Federal Reserve Board Survey of Consumer Finances (SCF), and Standard & Poor’s
Households owning mutual funds are far more willing to take investment
risk than other households In mid-2014, 31 percent of households owning
mutual funds were willing to take above-average or substantial investment
risk, more than twice the 13 percent of households not owning mutual funds
(Figure 6 13)

CHARACTERISTICS OF MUTUAL FUND OWNERS 127
FIGURE 6 13
Households’ Willingness to Take Investment Risk Percentage of U.S. households by mutual fund ownership status, 2008–2014
All U.S. households
Households owning mutual funds
Households not owning mutual funds
Substantial risk for substantial gainAbove-average risk for above-average gainAverage risk for average gainBelow-average risk for below-average gainUnwilling to take any risk
Level of risk willing to take with financial investments
20122011201020092008
2012 2013 20142011201020092008
2012 2013 20142011201020092008
1011
3537
14155 544
33
10
38
154
121310117
111011107
4948494950
2325252530
6 5455
19 19 19 19
44 43 46 46
21
43
36
14
30 30
21 21
29
23
28
231012
48
26
430
221010
49
25
631
20
11 11
5655535155
9109118
2325272726
66
67774444 11
63 62 62
10
65
12
65 54
9
26
65 11
63 55
8
24
76 13
63
36 33363332
10108
363537
161518 23
40
5 621
4435
9
35
15
2013 2014
Source: ICI Research Perspective, “Ownership of Mutual Funds, Shareholder Sentiment, and Use of the Internet, 2014”

128 2015 INVESTMENT COMPANY FACT BOOK
As with their impressions of fund companies, shareholders’ confidence that
mutual funds are helping them reach their financial goals declined in the wake
of the financial crisis In mid-2009, 72 percent of mutual fund shareholders
said they were confident in mutual funds’ ability to help them achieve
their financial goals, down from 85 percent the year before (Figure 6 14)
From mid-2010 through mid-2014, about eight in 10 mutual fund–owning
households said they were confident in mutual funds’ ability to help them
achieve their financial goals, with more than 20 percent saying they were
“very” confident
FIGURE 6 14
More Than Eight in 10 Mutual Fund–Owning Households Have Confidence in Mutual FundsPercentage of all mutual fund shareholders by level of confidence that mutual funds can help them meet their investment goals, 2005–2014
Very confidentSomewhat confident
2012 2013 20142011201020092008200720062005
84
5961555559535457
21
58
26
56
2421241726313229
80 8082797285848686
Note: This question was not included in the survey prior to 2005. The question has four choices; the other two possible responses are “not very confident” and “not at all confident.”
Source: ICI Research Perspective, “Ownership of Mutual Funds, Shareholder Sentiment, and Use of the Internet, 2014”

CHARACTERISTICS OF MUTUAL FUND OWNERS 129
FIGURE 6 15
Internet Access Is Nearly Universal Among Mutual Fund–Owning HouseholdsPercentage of households with Internet access, mid-2014
All U.S. householdsMutual fund–owning
householdsHouseholds with
DC plans1
Age of head of household2
Younger than 35 86 96 96
35 to 49 88 95 95
50 to 64 81 95 93
65 or older 60 86 84
Education level
High school diploma or less 63 84 84
Some college or associate’s degree 85 95 94
College or postgraduate degree 92 97 97
Household income3
Less than $50,000 65 84 82
$50,000 to $99,999 90 94 95
$100,000 to $149,999 95 98 98
$150,000 or more 94 98 98
Total 79 94 93
1 DC plans include 401(k), 403(b), 457, and other DC plans. 2 Age is based on the sole or co-decisionmaker for household saving and investing. 3 Total reported is household income before taxes in 2013.
Note: Internet access includes access to the Internet at home, work, or some other location.
Source: ICI Annual Mutual Fund Shareholder Tracking Survey. See ICI Research Perspective, “Ownership of Mutual Funds, Shareholder Sentiment, and Use of the Internet, 2014.”
Shareholders’ Use of the Internet
Nearly all mutual fund–owning households have Internet access In mid-
2014, 94 percent of U S households owning mutual funds had Internet
access (Figure 6 15), up from 68 percent in 2000 (the first year for which
ICI collected data on shareholder access to the Internet) Internet access
traditionally has been greatest among younger people—in both mutual fund–
owning households and the general population Increasing access among
older shareholders, however, has narrowed the gap considerably

National policies that have created or enhanced tax-advantaged
savings accounts have proven integral to helping Americans prepare
for retirement and other long-term savings goals. Because many
Americans use mutual funds in tax-advantaged accounts to reach
these goals, ICI studies the U.S. retirement market; the investors who
use IRAs, 401(k) plans, 529 plans, and other tax-advantaged savings
vehicles; and the role of funds in the retirement and education
savings markets.
CHAPTER SEVEN
Retirement and Education Savings
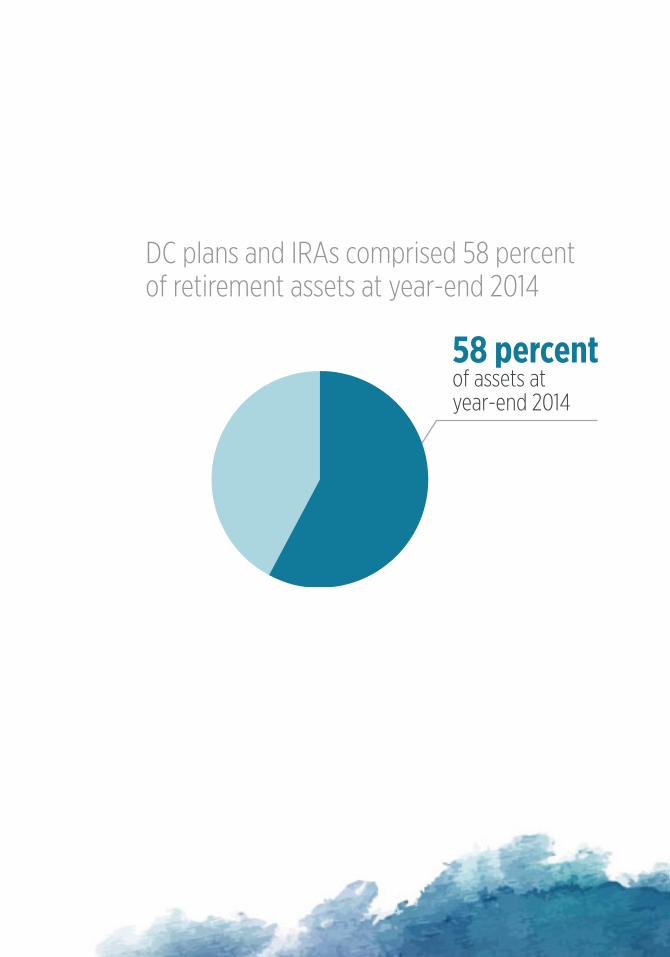
DC plans and IRAs comprised 58 percentof retirement assets at year-end 2014
58 percent of assets atyear-end 2014
132 2015 INVESTMENT COMPANY FACT BOOK
This chapter analyzes the U.S. retirement market; describes the investors who use IRAs, 401(k) plans, 529 plans, and other tax-advantaged savings vehicles; and explores the role of mutual funds in U.S. households’ efforts to save for retirement and education.
The U.S. Retirement System 132
Retirement Resource Pyramid 132
Snapshot of U.S. Retirement Market Assets 137
Defined Contribution Retirement Plans 141
401(k) Plan Design: Employer Contributions and Investment Lineup 142
401(k) Participants: Asset Allocations, Account Balances, and Loan Activity 145
Individual Retirement Accounts 150
IRA Investors 152
IRA Portfolios 156
Distributions from IRAs 158
The Role of Mutual Funds in Retirement Savings 160
Types of Mutual Funds Used by Retirement Plan Investors 162
The Role of Mutual Funds in Education Savings 165
The U.S. Retirement System
American households rely on a combination of resources in retirement,
and the role each type of resource plays has changed over time and varies
across households The traditional analogy compares retirement resources
to a three-legged stool, with resources divided equally among the legs—
Social Security, employer-sponsored pension plans, and private savings But
Americans’ retirement resources are best thought of as a five-layer pyramid
Retirement Resource Pyramid
The retirement resource pyramid has five layers, which draw from
government programs, compensation deferred until retirement, and other
savings and assets (Figure 7 1):
» Social Security
» homeownership
» employer-sponsored retirement plans (private-sector and government
employer plans, including both defined benefit [DB] and defined
contribution [DC] plans)
» individual retirement accounts (IRAs), including rollovers
» other assets
For analysis on key 401(k) issues, visit www ici org/ viewpoints/ 401k
LEARN MORE

RETIREMENT AND EDUCATION SAVINGS 133
FIGURE 7 1
Retirement Resource Pyramid
Other assets
IRAs(including rollovers)
Employer-sponsored retirement plans
Homeownership
Social Security
Source: Investment Company Institute , The Success of the U.S. Retirement System
While the importance of each layer differs by household, together they have
enabled recent generations of retirees, on average, to maintain their standard
of living in retirement
The construction of each household’s pyramid varies with age and income
Younger households are more likely to save primarily for reasons other than
retirement, such as a home purchase, family needs, or education (Figure 7 2)
By contrast, older households are more likely to save primarily for retirement,
as many already have reached their other savings goals The tendency of
younger workers to focus less on saving for retirement is consistent with
economic models of life-cycle consumption predicting that most workers
delay saving for retirement until later in their careers Lower-income
households also focus less on saving for retirement, reflecting the fact that
Social Security benefits replace a higher share of pre-retirement earnings for
workers with lower lifetime earnings
The Success of the U.S. Retirement System Available at www ici org/pubs/white_papers
LEARN MORE

134 2015 INVESTMENT COMPANY FACT BOOK
Social Security, the base of the U S retirement resource pyramid, is the
largest component of retiree income and the primary source of income
for lower-income retirees Social Security benefits are funded through a
payroll tax equal to 12 4 percent of earnings of covered workers (6 2 percent
paid by employees and 6 2 percent paid by employers) up to a maximum
taxable earnings amount ($117,000 in 2014) The benefit formula is highly
progressive, with benefits representing a much higher percentage of earnings
for workers with lower lifetime earnings By design, Social Security is the
primary means of support for retirees with low lifetime earnings and a
substantial source of income for all retired workers For individuals born in the
1950s, the Congressional Budget Office (CBO) projects that mean first-year
Social Security benefits will replace 85 percent of average inflation-indexed
lifetime earnings for the bottom 20 percent of retired workers ranked by
lifetime household earnings (Figure 7 3) The mean replacement rate drops
to 64 percent for the second quintile of households, and then declines more
slowly as lifetime household earnings increase For even the top 20 percent
of lifetime earners, Social Security benefits are projected to replace a
considerable portion (34 percent) of earnings
FIGURE 7 2
Primary Reason for Household Saving Changes with AgePercentage of households by age of household head, 2013
91315
2322
3330
3832
43
RetirementHome purchase, for the family, or education
Primary reason for saving
Age of household head
21 to 2930 to 3940 to 4445 to 5455 to 64
Source: Investment Company Institute tabulations of the 2013 Federal Reserve Board Survey of Consumer Finances. See ICI Research Perspective, “Supplemental Tables: Who Gets Retirement Plans and Why, 2013.”

RETIREMENT AND EDUCATION SAVINGS 135
FIGURE 7 3
Social Security Benefit Formula Is Highly Progressive2014 CBO estimates of mean first-year benefits relative to average inflation-indexed earnings by lifetime household earnings, 1950s birth cohort, percent
Quintiles of lifetime household earnings
HighestFourthMiddleSecondLowest
3447
5564
85
Source: Congressional Budget Office, The 2014 Long-Term Projections for Social Security: Additional Information
For many near-retiree households, homeownership is the second most
important retirement resource after Social Security Older households are
more likely to own their homes; more likely to own their homes without
mortgage debt; and, if they still have mortgages, more likely to have small
mortgages relative to the value of their homes Retired households typically
access this resource simply by living in their homes rent-free
Employer-sponsored retirement plans and IRAs, which complement Social
Security benefits and are important resources for households regardless of
income or wealth, increase in importance for households for whom Social
Security replaces a smaller share of earnings In 2013, about eight out of
10 near-retiree households had accrued benefits in employer-sponsored
retirement plans—DB and DC plans sponsored by private-sector and
government employers—or IRAs (Figure 7 4)
“A Look at Private-Sector Retirement Plan Income After ERISA, 2013 ” Available at www ici org/perspective
LEARN MORE

136 2015 INVESTMENT COMPANY FACT BOOK
FIGURE 7 4
Near-Retiree Households Across All Income Groups Have Retirement Assets, DB Plan Benefits, or BothPercentage of near-retiree households1 by income quintile,2 2013
Retirement assets only3
Both DB plan benefits and retirement assets3, 4
DB plan benefits only4
AllHighest
$140,005 or more
Fourth
$86,235 to $140,005
Middle
$54,785 to $86,235
Second
$33,480 to $54,785
Lowest
Less than$33,480
10
30
42
81
1
44
53
98
8
45
42
96
10
34
46
90
14
20
42
76
155
26
46
Household income quintile2
1 Near-retiree households are those with a working head of household aged 55 to 64, excluding the top and bottom 1 percent of the income distribution.
2 Income is household income before taxes in 2012. 3 Retirement assets include DC plan assets (401(k), 403(b), 457, thrift, and other DC plans) and IRAs (traditional, Roth, SEP,
SAR-SEP, and SIMPLE), whether from private-sector or government employers. 4 Households currently receiving DB plan benefits and households with the promise of future DB plan benefits, whether
from private-sector or government employers, are counted in this category.
Note: Components may not add to the total because of rounding.
Source: Investment Company Institute tabulations of the 2013 Federal Reserve Board Survey of Consumer Finances
Although less important on average, retirees also rely on other assets in
retirement These assets can be financial—including bank deposits, stocks,
bonds, and mutual funds owned outside employer-sponsored retirement
plans and IRAs They also can be nonfinancial—including business equity,
investment real estate, second homes, vehicles, and consumer durables
(long-lived goods such as household appliances and furniture) Higher-
income households are more likely to have large holdings of assets in this
category
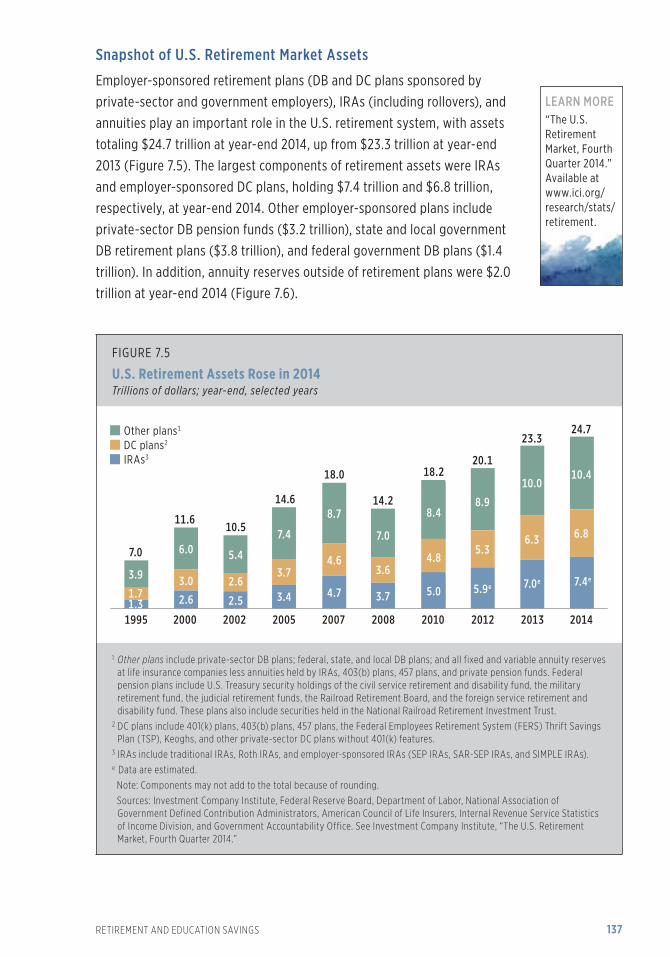
RETIREMENT AND EDUCATION SAVINGS 137
FIGURE 7 5
U.S. Retirement Assets Rose in 2014 Trillions of dollars; year-end, selected years
Other plans1
DC plans2
IRAs3 20.1
8.9
5.9e
5.3
2012
23.3
10.0
7.0e
6.3
2013
24.7
10.4
7.4e
6.8
2014
18.2
8.4
5.0
4.8
2010
14.2
7.0
3.7
3.6
2008
18.0
8.7
4.7
4.6
2007
14.6
7.4
3.4
3.7
2005
10.5
5.4
2.5
2.6
2002
11.6
6.0
2.6
3.0
2000
7.0
3.9
1.7
19951.3
1 Other plans include private-sector DB plans; federal, state, and local DB plans; and all fixed and variable annuity reserves at life insurance companies less annuities held by IRAs, 403(b) plans, 457 plans, and private pension funds. Federal pension plans include U.S. Treasury security holdings of the civil service retirement and disability fund, the military retirement fund, the judicial retirement funds, the Railroad Retirement Board, and the foreign service retirement and disability fund. These plans also include securities held in the National Railroad Retirement Investment Trust.
2 DC plans include 401(k) plans, 403(b) plans, 457 plans, the Federal Employees Retirement System (FERS) Thrift Savings Plan (TSP), Keoghs, and other private-sector DC plans without 401(k) features.
3 IRAs include traditional IRAs, Roth IRAs, and employer-sponsored IRAs (SEP IRAs, SAR-SEP IRAs, and SIMPLE IRAs). e Data are estimated.
Note: Components may not add to the total because of rounding.
Sources: Investment Company Institute, Federal Reserve Board, Department of Labor, National Association of Government Defined Contribution Administrators, American Council of Life Insurers, Internal Revenue Service Statistics of Income Division, and Government Accountability Office. See Investment Company Institute, “The U.S. Retirement Market, Fourth Quarter 2014.”
Snapshot of U.S. Retirement Market Assets
Employer-sponsored retirement plans (DB and DC plans sponsored by
private-sector and government employers), IRAs (including rollovers), and
annuities play an important role in the U S retirement system, with assets
totaling $24 7 trillion at year-end 2014, up from $23 3 trillion at year-end
2013 (Figure 7 5) The largest components of retirement assets were IRAs
and employer-sponsored DC plans, holding $7 4 trillion and $6 8 trillion,
respectively, at year-end 2014 Other employer-sponsored plans include
private-sector DB pension funds ($3 2 trillion), state and local government
DB retirement plans ($3 8 trillion), and federal government DB plans ($1 4
trillion) In addition, annuity reserves outside of retirement plans were $2 0
trillion at year-end 2014 (Figure 7 6)
“The U S Retirement Market, Fourth Quarter 2014 ” Available at www ici org/research/stats/retirement
LEARN MORE

138 2015 INVESTMENT COMPANY FACT BOOK
FIGURE 7 6
Total U.S. Retirement Assets and Unfunded Pension LiabilitiesTrillions of dollars, year-end 2014
1.4
3.2
0.02
1.8
7.4e
3.8
1.32.0
Private-sectorDB plans
Federal DBplans
State and localgovernmentDB plans
AnnuitiesIRAs
6.8
DC plans
Retirement assetsUnfunded pension liabilities
e Data are estimated.
Sources: Investment Company Institute, Federal Reserve Board, National Association of Government Defined Contribution Administrators, American Council of Life Insurers, Internal Revenue Service Statistics of Income Division, and Government Accountability Office. See Investment Company Institute, “The U.S. Retirement Market, Fourth Quarter 2014.”
Retirement assets include individual account–based savings (e g , IRAs and
DC plans) and assets held in DB plans Traditional DB plans promise to pay
benefits in retirement typically based on salary and years of service, and
assets held in those plans represent funding for those promised benefits
Some DB plans do not have sufficient funding to cover promised benefits that
households have a legal right to expect; the total unfunded liabilities of DB
plans were $3 1 trillion at year-end 2014 (Figure 7 6) Underfunding is more
pronounced in the government-sector pension plans As of year-end 2014,
private-sector DB plans had $3 2 trillion in assets and only $0 02 trillion in
unfunded liabilities On the other hand, state and local government DB plans
had $3 8 trillion in assets and $1 3 trillion in unfunded liabilities, and federal
DB plans had $1 4 trillion in assets and $1 8 trillion in unfunded liabilities

RETIREMENT AND EDUCATION SAVINGS 139
FIGURE 7 7
Many U.S. Households Have Tax-Advantaged Retirement Savings Percentage of U.S. households, mid-2014
6%Had IRA only1
37%Did not have IRA oremployer-sponsoredretirement plan
Total number of U.S. households: 123.0 million
28%Had IRA and
employer-sponsoredretirement plan1, 2
29%Had employer-sponsoredretirement plan only2
1 IRAs include traditional IRAs, Roth IRAs, and employer-sponsored IRAs (SEP IRAs, SAR-SEP IRAs, and SIMPLE IRAs).2 Employer-sponsored retirement plans include DC and DB retirement plans.
Sources: Investment Company Institute and U.S. Census Bureau. See ICI Research Perspective, “The Role of IRAs in U.S. Households’ Saving for Retirement, 2014.”
Ownership of retirement accumulations is widespread; 63 percent of U S
households (or 77 million) reported that they had employer-sponsored
retirement plans, IRAs, or both in mid-2014 (Figure 7 7) Fifty-seven percent
of U S households reported that they had employer-sponsored retirement
plans—that is, they had assets in DC plan accounts, were receiving or
expecting to receive benefits from DB plans, or both Thirty-four percent
reported having assets in IRAs, and 28 percent had both IRAs and employer-
sponsored retirement plans The households in this snapshot represent a wide
range of ages—from younger than 35 to age 65 or older—and so, they are at
different points in the life cycle of saving Focus on retirement savings tends
to increase with age and about eight out of 10 near-retiree households have
retirement accumulations (Figure 7 4)

140 2015 INVESTMENT COMPANY FACT BOOK
FIGURE 7 8
Rates of IRA or Defined Contribution Plan OwnershipPercentage of U.S. households owning IRAs or DC plans by decade in which household heads were born, 1983–2013
Age at time of survey
19891983 1992 1995 1998 2001 2004 2007 2010 2013
0
10
20
30
40
50
60
70
80
90
100
25 30 35 40 45 50 55 60 65 70 75 80
Born 1920 to 1929
Born 1980 to 1989
Born 1970 to 1979
Born 1960 to 1969 Born 1950 to 1959
Born 1940 to 1949
Born 1930 to 1939
Note: Age is the average age of the 10-year birth cohort at the time of the survey. The 10-year birth cohorts are defined using the age of the head of household.
Source: Investment Company Institute tabulations of the Federal Reserve Board Survey of Consumer Finances
Ownership of IRA and DC plan assets has tended to increase with each
successive generation of workers, although recent data suggest that
ownership rates may have stabilized For example, in 1983, when they were
44 to 53 years of age, 44 percent of households born in the 1930s owned
IRAs or DC plan accounts (Figure 7 8) By comparison, households born a
decade later had a 56 percent ownership rate when they were 44 to 53 years
old in 1993; and, among households born in the 1950s, 62 percent had IRAs
or DC plan accounts when they were 44 to 53 years old, in 2003 Earlier in
their careers, the 1960s birth cohort appeared to be continuing the trend of
increased ownership However, in 2013, when they were 44 to 53 years old,
57 percent of households born in the 1960s owned IRAs or DC plan accounts
Recent experience could indicate that long-term growth in ownership has
stabilized, or it could reflect a temporary pause in the long-term trend caused
by the weak economy

RETIREMENT AND EDUCATION SAVINGS 141
Defined Contribution Retirement Plans
DC plans provide employees with a retirement account funded with
employer contributions, employee contributions, or both, plus investment
earnings or losses on those contributions, less withdrawals Assets in
employer-sponsored DC plans have grown faster than assets in other types
of employer-sponsored retirement plans over the past quarter century,
increasing from 26 percent of employer plan assets in 1985 to 45 percent at
year-end 2014 At the end of 2014, employer-sponsored DC plans—which
include 401(k) plans, 403(b) plans, 457 plans, the federal Thrift Savings
Plan (TSP), Keoghs, and other private-sector DC plans—held an estimated
$6 8 trillion in assets (Figure 7 9) With $4 6 trillion in assets at year-end
2014, 401(k) plans held the largest share of employer-sponsored DC plan
assets Similar to 401(k) plans, 403(b) plans, which allow employees of
educational institutions and certain nonprofit organizations to receive
deferred compensation, held another $1 0 trillion in assets In addition, 457
plans—which allow employees of state and local governments and certain
tax-exempt organizations to receive deferred compensation—and the Federal
Employees Retirement System (FERS) Thrift Savings Plan (TSP) held a total
of $0 7 trillion Other private-sector DC plans without 401(k) features held the
remaining $0 6 trillion
FIGURE 7 9
Defined Contribution Plan Assets by Type of Plan Trillions of dollars; year-end, selected years
Other private-sector DC plans*457 plans and federal Thrift Savings Plan (TSP)403(b) plans401(k) plans
2012
5.30.4
3.5
0.50.8
2013
6.30.5
4.2
0.90.6
2014
1.0
6.80.6
4.6
0.7
2010
4.80.4
0.8
3.1
0.5
2008
3.6
0.30.6
2.2
0.4
2007
4.60.5
0.7
3.0
0.4
2005
3.70.4
0.6
2.4
0.3
2002
2.60.40.41.6
0.2
2000
3.00.5
0.5
1.7
0.2
1995
1.70.5
0.9
0.30.1
* Other private-sector DC plans include Keoghs and other private-sector DC plans (profit-sharing, stock bonus, and money purchase) without 401(k) features.
Note: Components may not add to the total because of rounding.
Sources: Investment Company Institute, Federal Reserve Board, Department of Labor, National Association of Government Defined Contribution Administrators, and American Council of Life Insurers. See Investment Company Institute, “The U.S. Retirement Market, Fourth Quarter 2014.”

142 2015 INVESTMENT COMPANY FACT BOOK
401(k) Plan Design: Employer Contributions and Investment Lineup
Employer Contributions
In 401(k) plans, employers can make contributions without regard
to employee contributions or by using a matching structure that
gives employees an incentive to contribute to the plan If the employer
chooses to match employee contributions, the employer can choose a simple
match formula, a tiered match formula, or a maximum dollar match formula
According to research conducted by ICI and BrightScope, in 2012, 40 percent
of 401(k) plans had a simple match formula (for example, matching
50 percent of employee contributions up to 6 percent of the employee’s
salary), 4 percent had a tiered match formula (for example, matching
100 percent of the first 4 percent of salary contributed and 50 percent of
the next 2 percent), and 3 percent matched employee contributions up to a
maximum amount (for example, matching 50 percent of the first $2,000 of an
employee’s contributions) (Figure 7 10)
FIGURE 7 10
Design of 401(k) Employer ContributionsPercentage of plans among plans with audited 401(k) filings in the BrightScope database, 2012
37%Other employer contribution4
4%Tiered match formula2
40%Simple match formula1
3%Maximum dollar
match3
17%No employer contribution
1 Simple match formulas are employer contributions of a specified percentage of employee contributions up to a fixed percentage of employee salary.
2 Tiered match formulas match employee contributions at different rates for different levels of employee contributions. 3 Maximum dollar match formulas are employer contributions of some percentage of employee contributions up to a fixed
dollar amount. 4 Other employer contributions include nonelective contributions and lump-sum contributions without an additional
matching formula. Plans with employer matches but missing descriptions of the employer match data may be included in this category.
Note: The sample is 35,472 plans with $2.9 trillion in assets. Audited DC/401(k) filings generally include plans with 100 or more participants. Plans with fewer than four investment options or more than 100 investment options are excluded from this analysis. Components do not add to 100 percent because of rounding.
Source: BrightScope Defined Contribution Plan Database. See BrightScope and Investment Company Institute, The BrightScope/ICI Defined Contribution Plan Profile: A Close Look at 401(k) Plans.
The BrightScope/ICI Defined Contribution Plan Profile: A Close Look at 401(k) Plans Available at www ici org/pubs/research/reports
LEARN MORE

RETIREMENT AND EDUCATION SAVINGS 143
Employers use a variety of simple match formulas in their 401(k) plans,
choosing a combination of the percentage of employee contributions to match
(the match rate), as well as the maximum contribution percentage to match
(the match level) Among 401(k) plans using simple match formulas, the most
common combination was matching 50 cents on the dollar up to 6 percent
of pay, used by 17 percent of plans with simple matches (Figure 7 11) The
second most common match formula was matching dollar for dollar up to
6 percent of pay, used by 15 percent of plans with simple matches Matching
up to 6 percent of pay was the most common match level (used by 41 percent
of 401(k) plans with simple matches), and the most common match rate
was 100 percent, or dollar for dollar, used in 46 percent of plans with simple
matches
FIGURE 7 11
Employers with Simple Matches Use a Variety of FormulasPercentage of plans with simple match formulas from audited 401(k) filings in the BrightScope database, 2012
Dollar for dollar50¢ on the dollar25¢ on the dollar
Employer matches
4% 5% 6% 7% or more3% or less
22
9
11 15
4
912
3
81
41
64 2
15
17
Employer matches up to this percentage
111 2
Note: Plans with no employer contribution, maximum dollar contributions, tiered match formulas, or only a nonmatching contribution were excluded. The sample is the 40 percent of plans with simple match formulas. Audited DC/401(k) filings generally include plans with 100 or more participants. Plans with fewer than four investment options or more than 100 investment options are excluded from this analysis. Components may not add to the totals and do not add to 100 percent overall because minor categories have been omitted.
Source: BrightScope Defined Contribution Plan Database. See BrightScope and Investment Company Institute, The BrightScope/ICI Defined Contribution Plan Profile: A Close Look at 401(k) Plans.

144 2015 INVESTMENT COMPANY FACT BOOK
Investment Lineup
In addition to choosing how contributions to the 401(k) plan will be structured,
employers also select the number and types of investment options in the plan
In 2012, domestic equity funds, international equity funds, and domestic bond
funds were widely available, offered in 99 percent, 98 percent, and 98 percent
of plans, respectively (Figure 7 12) A little more than half of 401(k) plans
offered money funds on average and almost two-thirds of 401(k) plans offered
guaranteed investment contracts (GICs)
FIGURE 7 12
Incidence of Investment Options Offered in 401(k) Plans by Type of InvestmentPercentage of 401(k) plans offering specified investment option, 2012
22
70
66
98
99
98
54
64
60
Targetdate funds1
Non–targetdate balanced
funds
Domestic
International
Moneyfunds
GICs
Domestic
International
Other2
Equity funds
Balanced funds
Bond funds
Other funds
Type of investment option
1 A target date fund typically rebalances its portfolio to become less focused on growth and more focused on income as it approaches and passes the target date of the fund, which is usually included in the fund’s name.
2 Other includes commodity funds, real estate funds, and individual stocks (including company stock) and bonds.
Note: The sample is 35,472 plans with $2.9 trillion in assets. Audited DC/401(k) filings generally include plans with 100 or more participants. Funds include mutual funds, collective investment trusts, separate accounts, and other pooled investment products. Plans with fewer than four investment options or more than 100 investment options are excluded from this analysis.
Source: BrightScope Defined Contribution Plan Database. See BrightScope and Investment Company Institute, The BrightScope/ICI Defined Contribution Plan Profile: A Close Look at 401(k) Plans.

RETIREMENT AND EDUCATION SAVINGS 145
401(k) Participants: Asset Allocations, Account Balances, and Loan Activity
Asset Allocation
For many American workers, 401(k) plan accounts have become an important
part of retirement planning The income these accounts provide in retirement
depends, in part, on the asset allocation decisions of plan participants
On average, younger participants allocate more of their portfolios to equities
(which include equity mutual funds and other pooled equity investments; the
equity portion of balanced funds, including target date funds; and company
stock of their employers) According to research conducted by ICI and the
Employee Benefit Research Institute (EBRI), at year-end 2013, individuals
in their twenties had 37 percent of their 401(k) assets in equity funds and
company stock; 47 percent in target date funds and non–target date balanced
funds; and only 9 percent in GICs, stable value funds, money funds, and bond
funds (Figure 7 13) All told, participants in their twenties had 76 percent of
their 401(k) assets in equities By comparison, at year-end 2013, participants
in their sixties had 55 percent of their 401(k) assets in equities At year-end
2013, individuals in their sixties had 30 percent of their 401(k) account assets
in GICs, stable value funds, money funds, and bond funds; only 20 percent
in target date funds and non–target date balanced funds; and 44 percent in
equity funds and company stock
“401(k) Plan Asset Allocation, Account Balances, and Loan Activity in 2013 ” Available at www ici org/perspective
LEARN MORE

146 2015 INVESTMENT COMPANY FACT BOOK
FIGURE 7 13
401(k) Asset Allocation Varied with Participant Age Average asset allocation of 401(k) account balances, percentage of account balances, year-end 2013
35.0
5.47.1
1.911.7
6.4
5.7
7.112.4
13.0
31.937.3
5.111.6
6.21.8
Non–target datebalanced funds
Bond funds
Money funds
Other
GICs and otherstable value funds
Equity funds
Target date funds*
Company stock
Participants in their twentiesParticipants in their sixties
* A target date fund typically rebalances its portfolio to become less focused on growth and more focused on income as it approaches and passes the target date of the fund, which is usually included in the fund’s name.
Note: Funds include mutual funds, bank collective trusts, life insurance separate accounts, and any pooled investment product primarily invested in the security indicated. Percentages are dollar-weighted averages. Components do not add to 100 percent because of rounding.
Source: Tabulations from EBRI/ICI Participant-Directed Retirement Plan Data Collection Project. See ICI Research Perspective, “401(k) Plan Asset Allocation, Account Balances, and Loan Activity in 2013.”

RETIREMENT AND EDUCATION SAVINGS 147
Portfolio allocation also varies widely within age groups At year-end
2013, 65 percent of 401(k) participants in their twenties held more than
80 percent of their account in equities, and 11 percent of these participants
held 20 percent or less (Figure 7 14) Of 401(k) participants in their sixties,
22 percent held more than 80 percent of their account in equities, and two
out of 10 held 20 percent or less
FIGURE 7 14
Asset Allocation to Equities Varied Widely Among 401(k) Plan ParticipantsAsset allocation distribution of 401(k) participant account balance to equities, percentage of participants, year-end 2013
>80 percent>60 to 80 percent>40 to 60 percent>20 to 40 percent>0 to 20 percentZero
Percentage of 401(k) account balance invested in equities
Participants intheir sixties
Participants intheir twenties
22
65 18
19
26
13410
2 1 615
Note: Equities include equity funds, company stock, and the equity portion of balanced funds. Funds include mutual funds, bank collective trusts, life insurance separate accounts, and any pooled investment product invested primarily in the security indicated. Components do not add to 100 percent because of rounding.
Source: Tabulations from EBRI/ICI Participant-Directed Retirement Plan Data Collection Project. See ICI Research Perspective, “401(k) Plan Asset Allocation, Account Balances, and Loan Activity in 2013.”

148 2015 INVESTMENT COMPANY FACT BOOK
Target Date Funds
Target date funds, introduced in the mid-1990s, have grown rapidly in recent
years A target date fund (including both target date mutual funds and other
pooled target date investments) follows a predetermined reallocation of
assets over time based on a specified target retirement date Typically the
fund rebalances its portfolio to become less focused on growth and more
focused on income as it approaches and passes the target date, which is
usually indicated in the fund’s name Since 2006, the share of 401(k) plans
that offer target date funds, the share of 401(k) plan participants offered
target date funds, and the share of 401(k) participants holding target date
funds all have increased (Figure 7 15) At year-end 2013, target date funds
accounted for 15 percent of 401(k) assets, up from 5 percent at year-end
2006
In 2013, 71 percent of 401(k) plans offered target date funds, and 66 percent
of 401(k) plan participants were offered target date funds (Figure 7 15)
Because not all plan participants choose to allocate assets to these funds,
the percentage of 401(k) participants with target date fund assets was lower
than the percentage of participants who were offered the option At year-end
FIGURE 7 15
Target Date Funds’ 401(k) Market SharePercentage of total 401(k) market; year-end, 2006 and 2013
20062013
Target date fund assetsParticipants holdingtarget date funds
Participants o�eredtarget date funds
Plans o�eringtarget date funds
57
7162
66
19
41
5
15
Note: Funds include mutual funds, bank collective trusts, life insurance separate accounts, and any pooled investment product.
Source: Tabulations from EBRI/ICI Participant-Directed Retirement Plan Data Collection Project. See ICI Research Perspective, “401(k) Plan Asset Allocation, Account Balances, and Loan Activity in 2013.”

RETIREMENT AND EDUCATION SAVINGS 149
2013, 41 percent of 401(k) participants held at least some plan assets in target
date funds In addition, because not all participants with assets in target date
funds allocated 100 percent of their holdings to these funds, and because
participants with assets in these funds were more likely to be younger or
recently hired and have lower account balances, the share of 401(k) assets
invested in target date funds was lower than the share of participants
invested in these funds
Account Balances
Account balances tended to be higher the longer 401(k) plan participants
had been working for their current employers and the older the participant
Participants in their sixties with more than 30 years of tenure at their current
employer had an average 401(k) account balance of $248,397 at year-end
2013 (Figure 7 16) Participants in their forties with five to 10 years of tenure
at their current employer had an average 401(k) balance of $62,087 The
median 401(k) plan participant was 46 years old at year-end 2013, and the
median job tenure was eight years
FIGURE 7 16
401(k) Balances Tend to Increase with Participant Age and Job TenureAverage 401(k) account balance by participant age and tenure, 2013
20s
30s
40s
50s60s
Participant job tenure (years)
$0
$50,000
$100,000
$150,000
$200,000
$250,000
$300,000
>30>20 to 30>10 to 20>5 to 10>2 to 50 to 2
Source: Tabulations from EBRI/ICI Participant-Directed Retirement Plan Data Collection Project. See ICI Research Perspective, “401(k) Plan Asset Allocation, Account Balances, and Loan Activity in 2013.”

150 2015 INVESTMENT COMPANY FACT BOOK
Plan Loans
Most 401(k) participants do not borrow from their plans, although the
majority have access to loans At year-end 2013, 21 percent of participants
eligible for loans had loans outstanding, the same rate as over the previous
four years However, not all participants have access to 401(k) plan loans—
factoring in all 401(k) participants with and without loan access in the EBRI/
ICI 401(k) database, only 18 percent had loans outstanding at year-end
2013 The average unpaid loan balances among participants with loans
represented about 12 percent of their 401(k) account balances (net of the
unpaid loan balances) In aggregate, U S Department of Labor data indicate
that outstanding loan amounts were less than 2 percent of 401(k) plan assets
in 2012
Individual Retirement Accounts
Traditional IRAs, the first type of IRA, were created in 1974 under the
Employee Retirement Income Security Act (ERISA) IRAs provide all workers
with a contributory retirement savings vehicle and, through rollovers, give
workers leaving jobs a means to preserve the tax benefits and growth
opportunities that employer-sponsored retirement plans provide Roth IRAs,
first available in 1998, were created to provide a contributory retirement
savings vehicle on an after-tax basis with qualified withdrawals distributed
tax-free In addition, policymakers have added employer-sponsored IRAs
(SEP IRAs, SAR-SEP IRAs, and SIMPLE IRAs) to encourage small employers to
provide retirement plans by simplifying the rules applicable to tax-qualified
plans
Ten Important Facts About IRAs Available at www ici org/pdf/ten_facts_iras pdf
LEARN MORE

RETIREMENT AND EDUCATION SAVINGS 151
FIGURE 7 17
IRA AssetsTrillions of dollars; year-end, selected years
Other assets1
Life insurance companies2
Bank and thrift deposits3
Mutual funds
0.1
2014
0.4 0.5
3.0e
7.4e
1995
1.3 0.5 0.3 0.5
2000
2.6
0.2
1.3
0.3
0.9
2002
0.3
1.1
0.3
0.9
2.5
2005
3.4
0.3
1.8
0.3
1.1
2007
4.7
0.3
2.5
0.3
1.6
2008
3.7
1.3
1.7
0.3 0.4
2012
0.3
2.8
0.5
2.3e
5.9e
3.5
2013
0.3
3.3
0.5
2.8e
7.0e
2010
0.3
2.4
0.5
1.8
5.0
1 Other assets include individual stocks, individual bonds, closed-end funds, ETFs, and other assets held through brokerage or trust accounts.
2 Life insurance company IRA assets are annuities held by IRAs, excluding variable annuity mutual fund IRA assets, which are included in mutual funds.
3 Bank and thrift deposits include Keogh deposits.e Data are estimated.
Note: Components may not add to the total because of rounding.
Sources: Investment Company Institute, Federal Reserve Board, American Council of Life Insurers, Internal Revenue Service Statistics of Income Division, and Government Accountability Office. See Investment Company Institute, “The U.S. Retirement Market, Fourth Quarter 2014.”
Total IRA assets, $7 4 trillion at year-end 2014, accounted for 30 percent
of U S retirement assets Mutual funds accounted for $3 5 trillion of IRA
assets at year-end 2014, up from $3 3 trillion at year-end 2013 (Figure 7 17)
Assets managed by mutual funds were the largest component of IRA assets,
followed by other assets, which include ETFs, individual stocks and bonds,
and other securities held through brokerage accounts ($3 0 trillion at
year-end 2014) The mutual fund industry’s share of the IRA market was
48 percent at year-end 2014, the same as at year-end 2013

152 2015 INVESTMENT COMPANY FACT BOOK
IRA Investors
More than three out of 10 U S households, or nearly 42 million, owned at
least one type of IRA as of mid-2014 (Figure 7 18) Traditional IRAs—those
introduced under ERISA—were the most common type, owned by 31 million
U S households Roth IRAs, first available in 1998 under the Taxpayer Relief
Act of 1997, were owned by 19 million U S households Seven million U S
households owned employer-sponsored IRAs (SEP IRAs, SAR-SEP IRAs, or
SIMPLE IRAs)
Although most U S households are eligible to make contributions to IRAs, few
do so Indeed, only 12 percent of U S households contributed to any type of
IRA in tax year 2013 In addition, very few eligible households made “catch-up”
contributions to traditional or Roth IRAs
FIGURE 7 18
Nearly 42 Million U.S. Households Owned IRAs
Year created
Number of U.S. households with
type of IRA (mid-2014)
Percentage of U.S. households with
type of IRA(mid-2014)
Assets in IRAs (billions of
dollars, year-end 2014)
Traditional IRA
1974(Employee Retirement Income Security Act)
31.1 million 25.3% $6,421e
SEP IRA 1978(Revenue Act)
SAR-SEP IRA 1986(Tax Reform Act)
7.4 million 6.0% $472e
SIMPLE IRA1996
(Small Business Job Protection Act)
Roth IRA 1997(Taxpayer Relief Act)
19.2 million 15.6% $550e
Any IRA 41.5 million 33.7% $7,443e
e Data are estimated.
Note: Households may own more than one type of IRA. SEP IRAs, SAR-SEP IRAs, and SIMPLE IRAs are employer-sponsored IRAs.
Sources: Investment Company Institute and U.S. Census Bureau. See ICI Research Perspective, “The Role of IRAs in U.S. Households’ Saving for Retirement, 2014” and “The U.S. Retirement Market, Fourth Quarter 2014.”

RETIREMENT AND EDUCATION SAVINGS 153
FIGURE 7 19
New Roth IRAs Often Are Opened with Contributions; New Traditional IRAs Often Are Opened with Rollovers Percentage of new IRAs opened in 2012 by type of IRA
Combination of activitiesContribution onlyConversion onlyRollover only
Traditional IRAsRoth IRAs
71
12
11
53
10
87
Note: New IRAs are accounts that did not exist in The IRA Investor Database in 2011 and were opened by one of the paths indicated in 2012. The calculation excludes IRAs that changed financial services firms. The samples are 0.2 million new Roth IRA investors aged 18 or older at year-end 2012 and 0.7 million new traditional IRA investors aged 25 to 74 at year-end 2012. Components may not add to 100 percent because of rounding.
Source: The IRA Investor Database™. See ICI Research Report, “The IRA Investor Profile: Roth IRA Investors’ Activity, 2007–2012.”
Instead, investment returns and rollovers from employer-sponsored retirement
plans have fueled the growth of IRAs In any given year, a small portion of
traditional IRA investors make rollovers, but analysis of The IRA Investor
Database—which contains information on more than 15 million IRA investors—
finds that, for the most part, the groups that make rollovers differ from year
to year Rollovers play an important role in opening traditional IRAs With the
availability of retirement accumulations that can be rolled over, whether from
DC accounts or as lump-sum distributions from DB plans, most (87 percent)
new traditional IRAs in 2012 were opened only with rollovers (Figure 7 19)
By contrast, in 2012, 11 percent of Roth IRAs were opened only with rollovers;
instead, the majority (71 percent) of Roth IRAs were opened only with
contributions
The IRA Investor Profile: Traditional IRA Investors’ Activity, 2007–2012 Available at www ici org/ira
LEARN MORE

154 2015 INVESTMENT COMPANY FACT BOOK
Traditional IRA–owning households generally researched the decision to roll
over money from their former employer’s retirement plan into a traditional
IRA The most common source of information was professional financial
advisers Advisers were consulted by 61 percent of traditional IRA–owning
households with rollovers, with half indicating they primarily relied on
financial professionals (Figure 7 20) Older households were more likely to
consult professional financial advisers than younger households Ten percent
of traditional IRA–owning households with rollovers indicated their primary
source of information was online materials from financial services firms,
with younger households more likely to rely on online resources than older
households
Households owning IRAs generally are headed by middle-aged individuals
(median age of 52 years) with moderate household incomes (median income
of $80,500) These households held a median of $50,000 in IRAs In addition,
many households held multiple types of IRAs For example, 36 percent of
households with traditional IRAs also owned Roth IRAs, and 13 percent also
owned employer-sponsored IRAs
“The Role of IRAs in U S Households’ Saving for Retirement, 2014 ” Available at www ici org/perspective
LEARN MORE

RETIREMENT AND EDUCATION SAVINGS 155
FIGURE 7 20
Multiple Sources of Information Are Consulted for the Rollover DecisionPercentage of traditional IRA–owning households with rollovers, mid-2014
20
6Coworker, friend, or family member
5
35Spouse or par tner
10
28Online materials from
financial services firms
61
50A financial professional
26
3IRS rules or publications
11
Employer (printed or online materials, seminars,
workshops)
38
Printed materials provided by financial
services firms 4
38
Seminars, workshops, or phone representatives
from financial services firms 6
35
Other2 9
5
Source1
Primary source
1 Multiple responses are included. 2 Other responses given included: myself, other online information, bank, and books and magazines.
Source: Investment Company Institute IRA Owners Survey. See ICI Research Perspective, “The Role of IRAs in U.S. Households’ Saving for Retirement, 2014.”

156 2015 INVESTMENT COMPANY FACT BOOK
IRA Portfolios
At year-end 2012, younger IRA investors tended to have more invested
in equities, equity funds, and target date funds, on average, than older
investors, according to The IRA Investor Database Older investors
were invested more heavily in non–target date balanced funds and
fixed-income investments For example, traditional IRA investors in their
thirties had, on average, 50 percent of their assets in equities and equity
funds and another 17 percent in target date funds (Figure 7 21) Traditional
IRA investors in their sixties held 46 percent and 5 percent of their
traditional IRA assets, respectively, in these two asset categories By
contrast, traditional IRA investors in their sixties had nearly half of
their assets in money market funds (13 percent), bonds and bond funds
(23 percent), and non–target date balanced funds (11 percent) Traditional IRA
investors in their thirties held about 29 percent of their assets in these three
asset categories
Roth IRA investors display a similar pattern of investing by age, although
Roth IRA investors of all ages tended to have higher allocations to equities
and equity funds compared with traditional IRA investors Roth IRA
investors in their thirties had, on average, 62 percent of their assets in
equities and equity funds and another 16 percent in target date funds,
while Roth IRA investors in their sixties held 59 percent and 4 percent of their
Roth IRA assets, respectively, in these two asset categories (Figure 7 21)
By contrast, Roth IRA investors in their sixties had more than a third of
their assets in money market funds (10 percent), bonds and bond funds
(13 percent), and non–target date balanced funds (13 percent) Roth IRA
investors in their thirties held about 21 percent of their assets in these three
asset categories
“The IRA Investor Profile: Roth IRA Investors’ Activity, 2007–2012 ” Available at www ici org/ ira
LEARN MORE

RETIREMENT AND EDUCATION SAVINGS 157
FIGURE 7 21
IRA Asset Allocation Varied with Investor AgeAverage asset allocation of IRA balances, percentage of assets, year-end 2012
Other investments1Money market fundsBonds and bond funds2Non–target date balanced funds3Target date funds4Equities and equity funds5
Traditional IRA investors
Roth IRA investors
Investors in their sixtiesInvestors in their thirties
4.013.8
6.97.9
17.0
50.4
2.5
13.0
22.7
11.34.9
45.6
1.810.2
13.3
12.63.7
58.5
1.07.04.49.2
16.2
62.2
Investors in their sixtiesInvestors in their thirties
1 Other investments include certificates of deposit and unidentifiable assets . 2 Bond funds include bond mutual funds, bond closed-end funds, and bond ETFs. 3 Balanced funds invest in a mix of equities and fixed-income securities. 4 A target date fund typically rebalances its portfolio to become less focused on growth and more focused on income as it
approaches and passes the target date of the fund, which is usually included in the fund’s name.5 Equity funds include equity mutual funds, equity closed-end funds, and equity ETFs.
Note: Percentages are dollar-weighted averages. Components may not add to 100 percent because of rounding.
Source: The IRA Investor Database™. See ICI Research Report, “The IRA Investor Profile: Traditional IRA Investors’ Activity, 2007–2012,” and ICI Research Report, “The IRA Investor Profile: Roth IRA Investors’ Activity, 2007–2012.”

158 2015 INVESTMENT COMPANY FACT BOOK
Distributions from IRAs
Withdrawals from IRAs tend to occur later in life, often to fulfill required
minimum distributions (RMDs) An RMD is equal to a percentage of the IRA
balance, based on remaining life expectancy Traditional IRA owners aged
70½ or older generally must withdraw at least the minimum amount each
year or pay a penalty In tax year 2013, 65 percent of individuals who took
traditional IRA withdrawals stated they calculated the withdrawal amount
based on RMD rules
In contrast to traditional IRAs, Roth IRAs have no RMDs (unless they are
inherited Roth IRAs) As a result, withdrawal activity is much lower among
Roth IRA investors In 2012, only 4 percent of Roth IRA investors aged 25
or older made withdrawals, compared with 22 percent of traditional IRA
investors (Figure 7 22) Early withdrawal penalties can apply to both Roth and
traditional IRA investors younger than 59½, and withdrawal activity is lower
among investors younger than 60 compared with investors aged 60 or older
FIGURE 7 22
Roth IRA Investors Rarely Take Withdrawals; Traditional IRA Investors Are Heavily Affected by RMDsPercentage of IRA investors with withdrawals by type of IRA and investor age, 2012
Roth IRA investorsTraditional IRA investors
All (25 or older)70 or older
Age of IRA investor
60 to 6925 to 59
39 5
20
5
80
4
22
Note: The samples are 4.9 million Roth IRA investors aged 25 or older at year-end 2012 and 10.4 million traditional IRA investors aged 25 or older at year-end 2012.
Source: The IRA Investor Database™. See ICI Research Report, “The IRA Investor Profile: Roth IRA Investors’ Activity, 2007–2012.”

RETIREMENT AND EDUCATION SAVINGS 159
FIGURE 7 23
Traditional IRA Withdrawals Among Retirees Often Are Used to Pay for Living ExpensesPercentage of traditional IRA–owning households with withdrawals by retirement status,1 mid-2014
Retired1, 2 Not retired3
Purpose of traditional IRA withdrawal
Took withdrawals to pay for living expenses 41 36
Spent it on a car, boat, or big-ticket item other than a home 9 8
Spent it on a healthcare expense 22 17
Used it for an emergency 12 20
Used it for home purchase, repair, or remodeling 22 28
Reinvested or saved it in another account 38 28
Paid for education 6 7
Some other purpose 13 10
1 The household was considered retired if either the head of household or spouse responded affirmatively to the question: “Are you retired from your lifetime occupation?”
2 The base of respondents includes the 15 percent of traditional IRA–owning households that were retired in mid-2014 and took withdrawals in tax year 2013.
3 The base of respondents includes the 5 percent of traditional IRA–owning households that were not retired in mid-2014 and took withdrawals in tax year 2013.
Note: Multiple responses are included.
Source: ICI IRA Owners Survey. See ICI Research Perspective, “The Role of IRAs in U.S. Households’ Saving for Retirement, 2014.”
Withdrawals from IRAs tend to be retirement related Of the 20 percent
of traditional IRA–owning households who reported taking withdrawals
in tax year 2013, 75 percent reported that the head of household, the
spouse, or both were retired Of retired households that took traditional
IRA withdrawals in tax year 2013, 41 percent reported using some or all of
the withdrawal amount to pay for living expenses (Figure 7 23) Other uses
included reinvesting or saving in another account (38 percent), paying for
a healthcare expense (22 percent), and buying, repairing, or remodeling a
home (22 percent)
Traditional IRA–owning households that reported taking withdrawals in tax
year 2013 and were not retired indicated a slightly different pattern for the
withdrawals The nonretired households with withdrawals were less likely to
indicate using some or all of the money for living expenses (36 percent) or
a healthcare expense (17 percent) than the retired households (Figure 7 23)
Nonretired households were more likely than retired households to indicate
that they needed to use some or all of the withdrawal for an emergency
(20 percent) or for home purchase, repair, or remodeling (28 percent)
Individual Retirement Account Resource Center Available at www ici org/iraresource
LEARN MORE

160 2015 INVESTMENT COMPANY FACT BOOK
Because current withdrawal activity might not be a good indicator of future
withdrawal activity, ICI also asked about plans for future traditional IRA
withdrawals Among traditional IRA–owning households in 2014 that did not
take a withdrawal in tax year 2013, 69 percent said that they were not likely
to take a withdrawal before age 70½ Traditional IRA–owning households
that were either (1) retired and did not take withdrawals in tax year 2013 or
(2) not retired reported a pattern for the expected role of their future IRA
withdrawals in retirement that is consistent with those that withdrew in tax
year 2013 Sixty percent of these households reported they plan to use IRA
withdrawals to pay for living expenses in retirement, and 42 percent reported
they plan to reinvest or save their IRA withdrawals in another account
The Role of Mutual Funds in Retirement Savings
At year-end 2014, mutual funds held in DC plans and IRAs accounted for
$7 3 trillion, or 29 percent, of the $24 7 trillion U S retirement market The
$7 3 trillion in mutual fund retirement assets made up 46 percent of all
mutual fund assets at year-end 2014 Mutual funds accounted for 55 percent
of DC plan assets and 48 percent of IRA assets (Figure 7 24) Additionally,
retirement investors tend to hold long-term mutual funds At year-end 2014,
DC plans and IRAs held 53 percent of equity, balanced, and bond mutual
funds, but only 13 percent of money market funds

RETIREMENT AND EDUCATION SAVINGS 161
FIGURE 7 24
Substantial Amount of Retirement Assets Are Invested in Mutual Funds Assets, billions of dollars, year-end 2014
Other investmentsMutual funds
Equity, balanced,and bond mutual funds
Money market funds
53%
DC plans IRAs
13,127
6,905 2,725
364
6,765
3,723
7,443e
3,546
6,222
3,042 3,897
2,361
Other investorsDC plans and IRAs
48%55%
13%
e Data are estimated.
Sources: Investment Company Institute, Federal Reserve Board, American Council of Life Insurers, and Internal Revenue Service Statistics of Income Division. See Investment Company Institute, “The U.S. Retirement Market, Fourth Quarter 2014.”
Across the entire U S retirement market, mutual funds play a major role
in IRAs and employer-sponsored DC plans, such as 401(k) plans At year-
end 2014, investors held slightly more mutual fund assets in DC plans
($3 7 trillion, or 55 percent of total DC plan assets) than in IRAs ($3 5 trillion,
or 48 percent of total IRA assets) (Figure 7 25) Among DC plans, 401(k) plans
held the most assets in mutual funds, with $2 9 trillion, followed by 403(b)
plans ($456 billion), other private-sector DC plans ($287 billion), and 457
plans ($112 billion)

162 2015 INVESTMENT COMPANY FACT BOOK
Types of Mutual Funds Used by Retirement Plan Investors
Retirement investors tend to hold equity investments At year-end 2014,
58 percent of the $7 3 trillion in mutual fund retirement assets held in DC
plans and IRAs were invested in domestic or world equity funds (Figure 7 25)
By comparison, about 52 percent of overall fund industry assets—retirement
and nonretirement accounts—were invested in domestic or world equity
funds Domestic equity funds alone constituted about $3 2 trillion, or
45 percent, of mutual fund assets held in DC plans and IRAs
Retirement investors also gain exposure to equities and fixed-income
securities through balanced funds At year-end 2014, 23 percent of mutual
fund assets held in DC plans and IRAs were held in balanced funds, which
invest in a mix of equity, bond, and money market securities (Figure 7 25)
At year-end 2014, the remaining 19 percent of mutual fund assets held in DC
plans and IRAs were invested in bond funds and money market funds Bond
funds held $1 0 trillion, or 14 percent, of mutual fund assets held in DC plans
and IRAs, and money market funds accounted for $364 billion, or 5 percent
FIGURE 7 25
Majority of Mutual Fund Retirement Account Assets Were Invested in EquitiesBillions of dollars, year-end 2014
Equity
Balanced1 BondMoney market TotalDomestic World
IRAs2 $1,484 $465 $783 $593 $221 $3,546
DC plans 1,763 500 873 444 143 3,723
401(k) plans 1,312 406 730 321 99 2,868
403(b) plans 284 37 79 37 20 456
457 plans 62 16 19 14 2 112
Other private-sector DC plans3 105 41 46 72 23 287
Total 3,248 965 1,656 1,037 364 7,269
1 Balanced funds invest in a mix of equities and fixed-income securities. Most target date and lifestyle funds are counted in this category.
2 IRAs include traditional IRAs, Roth IRAs, and employer-sponsored IRAs (SEP IRAs, SAR-SEP IRAs, and SIMPLE IRAs). 3 Other private-sector DC plans include Keoghs and other private-sector DC plans without 401(k) features.
Note: Components may not add to the total because of rounding.
Source: Investment Company Institute, “The U.S. Retirement Market, Fourth Quarter 2014”
For ICI resources on 401(k) plans, visit www ici org/ 401k
LEARN MORE

RETIREMENT AND EDUCATION SAVINGS 163
For ICI resources on target date funds, visit www ici org/trdf
LEARN MORE
Target Date and Lifestyle Mutual Funds
Target date and lifestyle mutual funds, generally included in the balanced
fund category, have grown more popular among investors and retirement
plan sponsors over the past decade A target date fund follows a
predetermined reallocation of assets over time based on a specified target
retirement date Typically the fund rebalances its portfolio to become less
focused on growth and more focused on income as it approaches and passes
the target date, which is usually indicated in the fund’s name A lifestyle
fund maintains a predetermined risk level and generally uses words such as
“conservative,” “moderate,” or “aggressive” in its name to indicate the fund’s
risk level
Assets in target date and lifestyle mutual funds totaled $1 1 trillion at year-
end 2014, up from $977 billion at year-end 2013 (Figure 7 26) Target date
mutual funds’ assets were up 14 percent in 2014, increasing from $618 billion
to $703 billion Assets in lifestyle mutual funds grew 10 percent in 2014, rising
from $359 billion to $394 billion The bulk (89 percent) of target date mutual
fund assets was held in retirement accounts, compared with 43 percent of
lifestyle mutual fund assets

164 2015 INVESTMENT COMPANY FACT BOOK
FIGURE 7 26
Target Date and Lifestyle Mutual Fund Assets by Account TypeBillions of dollars; year-end, 2004–2014
Other investorsIRAs1
DC plans2
Target date mutual funds3
Lifestyle mutual funds4
2012 2013 20142011201020092008200720062005
2014
149
77
477
703
2013
128
63
427
618
2004
145
50
70
264
145
50
67
262
127
43
62
231
93
33
49
176120
46
72
238
94
34
61
189
63
2147
131
1646
24
85
161
58
73
292
206
71
81
359
224
93
78
394
2010
3366
241
340
2011
36
74
266
376
2012
96
45
340
481
2009
49
186
256
11
2008
32
116
16015
2007
40
128
183
9
2006
2680
115
7
2005
16 49
715 9
20042944
21
1 IRAs include traditional IRAs, Roth IRAs, and employer-sponsored IRAs (SEP IRAs, SAR-SEP IRAs, and SIMPLE IRAs). 2 DC plans include 401(k) plans, 403(b) plans, 457 plans, Keoghs, and other DC plans without 401(k) features. 3 A target date mutual fund typically rebalances its portfolio to become less focused on growth and more focused on
income as it approaches and passes the target date of the fund, which is usually included in the fund’s name.4 A lifestyle mutual fund maintains a predetermined risk level and generally contains “conservative,” “moderate,” or
“aggressive,” in the fund’s name.
Note: Components may not add to the total because of rounding.
Source: Investment Company Institute, “The U.S. Retirement Market, Fourth Quarter 2014”

RETIREMENT AND EDUCATION SAVINGS 165
The Role of Mutual Funds in Education Savings
Twenty-three percent of households that owned mutual funds in 2014 cited
education as a financial goal for their fund investments Nevertheless, the
demand for education savings vehicles has been historically modest since
their introduction in the 1990s, partly because of their limited availability and
investors’ lack of familiarity with them The Economic Growth and Tax Relief
Reconciliation Act (EGTRRA), enacted in 2001, enhanced the attractiveness
of Section 529 plans and Coverdell Education Savings Accounts (ESAs)—two
education savings vehicles—by allowing greater contributions to them and
making them more flexible The Pension Protection Act (PPA), enacted in
2006, made the EGTRRA enhancements to Section 529 plans permanent
The Tax Relief, Unemployment Insurance Reauthorization, and Job Creation
Act of 2010 extended the EGTRRA enhancements to Coverdell ESAs for two
years; the American Taxpayer Relief Act of 2012 made these enhancements
permanent
529 Plan Program Statistics Available at www ici org/research/stats/529s
LEARN MORE

166 2015 INVESTMENT COMPANY FACT BOOK
Assets in Section 529 savings plans increased 9 6 percent in 2014, with
$224 7 billion at year-end 2014, up from $205 1 billion at year-end 2013
(Figure 7 27) As of year-end 2014, there were 11 0 million 529 savings plan
accounts, with an average account size of approximately $20,500
FIGURE 7 27
Section 529 Savings Plan AssetsBillions of dollars; year-end, selected years
2013
205.1
2014
224.7
2011
144.9
2009
116.9
2008
89.4
2007
112.5
2005
68.7
2003
35.1
2001
8.5
Note: Data were estimated for a few individual state observations in order to construct a continuous time series. Sources: Investment Company Institute and College Savings Plans Network. See Investment Company Institute, “529 Plan Program Statistics, December 2014.”
In mid-2014, as a group, households saving for college through 529 plans,
Coverdell ESAs, or mutual funds held outside these accounts tended to be
headed by younger individuals, with half younger than 45 (Figure 7 28)
Heads of households saving for college had a range of education attainment:
47 percent had less than four years of college and 53 percent had four years
or more These households also had a range of incomes: 39 percent earned
less than $75,000; 16 percent earned between $75,000 and $99,999; and
45 percent earned $100,000 or more About two-thirds of these households
had children (younger than 18) in the home, and 39 percent had more than
one child in the home

RETIREMENT AND EDUCATION SAVINGS 167
FIGURE 7 28
Characteristics of Households Saving for CollegePercentage of U.S. households saving for college,1 mid-2014
Age of head of household2
Younger than 35 23
35 to 44 27
45 to 54 28
55 to 64 13
65 or older 9
Education level
High school diploma or less 20
Associate’s degree or some college 27
Completed college 22
Some graduate school or completed graduate school 31
Household income3
Less than $25,000 5
$25,000 to $34,999 4
$35,000 to $49,999 11
$50,000 to $74,999 19
$75,000 to $99,999 16
$100,000 or more 45
Number of children in home4
None 35
One 26
Two 25
Three or more 14
1 Households saving for college are households that own education savings plans (Coverdell ESAs or 529 plans) or that said paying for education was one of their financial goals for their mutual funds.
2 Age is based on the sole or co-decisionmaker for saving and investing. 3 Total reported is household income before taxes in 2013. 4 The number of children reported is children younger than 18 living in the home.


PART TWO
Data Tables

2014 Fund Reclassification
To help members, analysts, the media, and the public understand trends in mutual
fund investing, ICI reports data on open-end mutual funds at several levels From the
broadest to the most detailed, those are:
» Level 1: Long-term and money market
» Level 2: Equity, hybrid, bond, and money market
» Level 3: Domestic equity, world equity, hybrid, taxable bond, municipal bond, taxable
money market, and tax-exempt money market
» Level 4: Thirteen composite investment objectives (for example, capital appreciation,
world equity, hybrid, and investment grade bond)
» Level 5: Forty-two investment objectives (for example, growth, alternative strategies,
global equity, flexible portfolio, and investment grade–short term)
Thus, investment objectives (IOBs) offer the greatest level of detail on trends in net
assets, flows, and liquidity in mutual funds
To reflect changes in the marketplace, ICI modernized its IOB classifications for open-
end mutual funds While the macro-level classifications—levels 1 through 3—are
unchanged, the data at a detailed level are affected The new IOBs and composite
IOBs have changed significantly and data reported at these detailed levels are now
only available beginning in January 2000 Although some of these category names
are unchanged, the new categories are not comparable to previous categories, since
the definitions of these categories were changed In addition, as a result of the fund
reclassification, many funds were moved from one category to another
For more information
» 2014 Open-End Mutual Fund Reclassification FAQs, available at www.ici.org/research/stats/iob_update/iob_faqs
» Open-End Investment Objective Definitions, available at www.ici.org/research/stats/iob_update/iob_definitions
Data
Sec
tion
1
170 2015 INVESTMENT COMPANY FACT BOOK

Data Tables
Section 1Mutual Fund TotalsTable 1: Total Net Assets, Number of Funds, and Number of Share Classes of the Mutual Fund Industry 173
2: Total Sales, New Sales, Exchange Sales, Redemptions, and Exchange Redemptions of the Mutual Fund Industry . 174
3: Total Net Assets of the Mutual Fund Industry 175
4: Total Net Assets of the Mutual Fund Industry by Composite Investment Objective 176
5: Number of Funds of the Mutual Fund Industry 177
6: Number of Funds of the Mutual Fund Industry by Composite Investment Objective 178
7: Number of Share Classes of the Mutual Fund Industry 179
8: Number of Share Classes of the Mutual Fund Industry by Composite Investment Objective 180
Section 2Closed-End Funds, Exchange-Traded Funds, and Unit Investment TrustsTable 9: Closed-End Funds: Total Assets and Number of Funds by Type of Fund 181
10: Closed-End Funds: Gross Issuance, Gross Redemptions, and Net Issuance by Type of Fund 182
11: Exchange-Traded Funds: Total Net Assets by Type of Fund 183
12: Exchange-Traded Funds: Number of Funds by Type of Fund 184
13: Exchange-Traded Funds: Net Issuance by Type of Fund 185
14: Unit Investment Trusts: Total Net Assets, Number of Trusts, and New Deposits by Type of Trust 186
Section 3Long-Term Mutual FundsTable 15: Liquid Assets and Liquidity Ratio of Long-Term Mutual Funds 187
16: Liquidity Ratio of Long-Term Mutual Funds by Composite Investment Objective 188
17: Net New Cash Flow of Long-Term Mutual Funds 189
18: Net New Cash Flow and Components of Net New Cash Flow of Equity Mutual Funds 190
19: Net New Cash Flow and Components of Net New Cash Flow of Hybrid Mutual Funds 191
20: Net New Cash Flow and Components of Net New Cash Flow of Bond Mutual Funds 192
21: Net New Cash Flow of Long-Term Mutual Funds by Composite Investment Objective 193
22: New Sales of Long-Term Mutual Funds by Composite Investment Objective 194
23: Exchange Sales of Long-Term Mutual Funds by Composite Investment Objective 195
24: Redemptions of Long-Term Mutual Funds by Composite Investment Objective 196
25: Exchange Redemptions of Long-Term Mutual Funds by Composite Investment Objective 197
26: Annual Redemption Rates of Long-Term Mutual Funds 198
27: Portfolio Holdings of Long-Term Mutual Funds and Percentage of Total Net Assets 199
28: Portfolio Holdings of Long-Term Mutual Funds as a Percentage of Total Net Assets by Type of Fund 200
29: Paid and Reinvested Dividends of Long-Term Mutual Funds by Type of Fund 201
30: Paid and Reinvested Capital Gains of Long-Term Mutual Funds by Type of Fund 202
31: Total Portfolio, Common Stock, and Other Securities: Purchases, Sales, and Net Purchases by Long-Term Mutual Funds 203
32: Total Portfolio, Common Stock, and Other Securities: Purchases, Sales, and Net Purchases by Equity Mutual Funds 204
33: Total Portfolio, Common Stock, and Other Securities: Purchases, Sales, and Net Purchases by Hybrid Mutual Funds 205
34: Total Portfolio, Common Stock, and Other Securities: Purchases, Sales, and Net Purchases by Bond Mutual Funds 206
Data Section 1
DATA TABLES 171

Section 4Money Market FundsTable 35: Money Market Funds: Total Net Assets, Number of Funds, and
Number of Share Classes by Type of Fund 207
36: Total Net Assets of Money Market Funds by Type of Fund 208
37: Net New Cash Flow of Money Market Funds by Type of Fund 209
38: Net New Cash Flow and Components of Net New Cash Flow of Money Market Funds 210
39: Paid and Reinvested Dividends of Money Market Funds by Type of Fund 211
40: Asset Composition of Taxable Government Money Market Funds as a Percentage of Total Net Assets 212
41: Asset Composition of Taxable Prime Money Market Funds as a Percentage of Total Net Assets 213
Section 5Additional Categories of Mutual FundsTable 42: Alternative Strategies Mutual Funds: Total Net Assets, Net New Cash Flow, Number of Funds, and
Number of Share Classes 214
43: Emerging Markets Debt Mutual Funds: Total Net Assets, Net New Cash Flow, Number of Funds, and Number of Share Classes 215
44: Floating-Rate High-Yield Bond Mutual Funds: Total Net Assets, Net New Cash Flow, Number of Funds, and Number of Share Classes 216
45: Funds of Funds: Total Net Assets, Net New Cash Flow, Number of Funds, and Number of Share Classes 217
46: Funds of Funds: Components of Net New Cash Flow 218
47: Index Mutual Funds: Total Net Assets and Net New Cash Flow 219
48: Index Mutual Funds: Number of Funds and Number of Share Classes 220
49: Index Mutual Funds: New Sales and Exchange Sales 221
50: Index Mutual Funds: Redemptions and Exchange Redemptions 222
51: Inflation-Protected and Treasury Inflation-Protected Mutual Funds: Total Net Assets, Net New Cash Flow, Number of Funds, and Number of Share Classes 223
52: Mutual Funds by Market Capitalization: Total Net Assets and Net New Cash Flow by Type of Fund 224
53: Mutual Funds by Market Capitalization: Number of Funds and Number of Share Classes by Type of Fund 225
54: Retirement Mutual Funds: Total Net Assets, Net New Cash Flow, Number of Funds, and Number of Share Classes 226
55: Retirement Mutual Funds: Components of Net New Cash Flow 227
56: Sector Mutual Funds: Total Net Assets and Net New Cash Flow by Type of Fund 228
57: Sector Mutual Funds: Number of Funds and Number of Share Classes by Type of Fund 229
58: Target Date and Lifestyle Mutual Funds: Total Net Assets, Net New Cash Flow, Number of Funds, and Number of Share Classes 230
59: Target Date and Lifestyle Mutual Funds: Components of Net New Cash Flow 231
60: Variable Annuity Mutual Funds: Total Net Assets, Net New Cash Flow, and Number of Funds 232
61: Variable Annuity Mutual Funds: Components of Net New Cash Flow 233
Section 6Institutional Investors in the Mutual Fund Industry
Table 62: Total Net Assets of Mutual Funds Held in Individual and Institutional Accounts 234
63: Total Net Assets of Institutional Investors in Mutual Funds by Type of Institution and Type of Fund 235
64: Total Net Assets of Institutional Investors in Taxable Money Market Funds by Type of Institution and Type of Fund 236
Section 7Worldwide Mutual Fund TotalsTable 65: Worldwide Total Net Assets of Mutual Funds 237
66: Worldwide Number of Mutual Funds 238
67: Worldwide Net Sales of Mutual Funds 239
Data
Sec
tion
1
172 2015 INVESTMENT COMPANY FACT BOOK
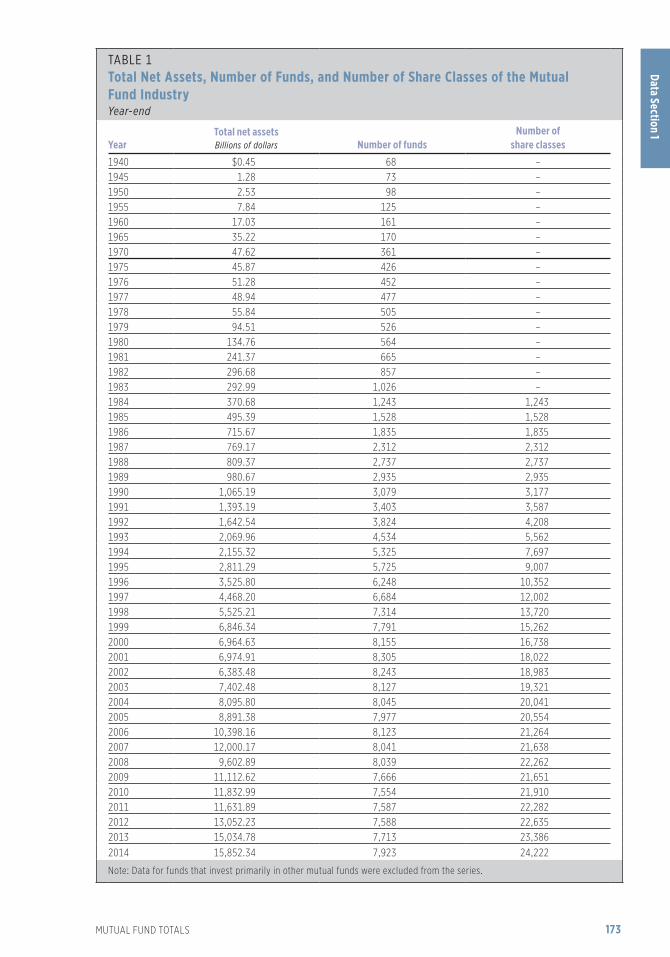
Section 4Money Market FundsTable 35: Money Market Funds: Total Net Assets, Number of Funds, and
Number of Share Classes by Type of Fund 207
36: Total Net Assets of Money Market Funds by Type of Fund 208
37: Net New Cash Flow of Money Market Funds by Type of Fund 209
38: Net New Cash Flow and Components of Net New Cash Flow of Money Market Funds 210
39: Paid and Reinvested Dividends of Money Market Funds by Type of Fund 211
40: Asset Composition of Taxable Government Money Market Funds as a Percentage of Total Net Assets 212
41: Asset Composition of Taxable Prime Money Market Funds as a Percentage of Total Net Assets 213
Section 5Additional Categories of Mutual FundsTable 42: Alternative Strategies Mutual Funds: Total Net Assets, Net New Cash Flow, Number of Funds, and
Number of Share Classes 214
43: Emerging Markets Debt Mutual Funds: Total Net Assets, Net New Cash Flow, Number of Funds, and Number of Share Classes 215
44: Floating-Rate High-Yield Bond Mutual Funds: Total Net Assets, Net New Cash Flow, Number of Funds, and Number of Share Classes 216
45: Funds of Funds: Total Net Assets, Net New Cash Flow, Number of Funds, and Number of Share Classes 217
46: Funds of Funds: Components of Net New Cash Flow 218
47: Index Mutual Funds: Total Net Assets and Net New Cash Flow 219
48: Index Mutual Funds: Number of Funds and Number of Share Classes 220
49: Index Mutual Funds: New Sales and Exchange Sales 221
50: Index Mutual Funds: Redemptions and Exchange Redemptions 222
51: Inflation-Protected and Treasury Inflation-Protected Mutual Funds: Total Net Assets, Net New Cash Flow, Number of Funds, and Number of Share Classes 223
52: Mutual Funds by Market Capitalization: Total Net Assets and Net New Cash Flow by Type of Fund 224
53: Mutual Funds by Market Capitalization: Number of Funds and Number of Share Classes by Type of Fund 225
54: Retirement Mutual Funds: Total Net Assets, Net New Cash Flow, Number of Funds, and Number of Share Classes 226
55: Retirement Mutual Funds: Components of Net New Cash Flow 227
56: Sector Mutual Funds: Total Net Assets and Net New Cash Flow by Type of Fund 228
57: Sector Mutual Funds: Number of Funds and Number of Share Classes by Type of Fund 229
58: Target Date and Lifestyle Mutual Funds: Total Net Assets, Net New Cash Flow, Number of Funds, and Number of Share Classes 230
59: Target Date and Lifestyle Mutual Funds: Components of Net New Cash Flow 231
60: Variable Annuity Mutual Funds: Total Net Assets, Net New Cash Flow, and Number of Funds 232
61: Variable Annuity Mutual Funds: Components of Net New Cash Flow 233
Section 6Institutional Investors in the Mutual Fund Industry
Table 62: Total Net Assets of Mutual Funds Held in Individual and Institutional Accounts 234
63: Total Net Assets of Institutional Investors in Mutual Funds by Type of Institution and Type of Fund 235
64: Total Net Assets of Institutional Investors in Taxable Money Market Funds by Type of Institution and Type of Fund 236
Section 7Worldwide Mutual Fund TotalsTable 65: Worldwide Total Net Assets of Mutual Funds 237
66: Worldwide Number of Mutual Funds 238
67: Worldwide Net Sales of Mutual Funds 239
Data Section 1
MUTUAL FUND TOTALS 173
TABLE 1Total Net Assets, Number of Funds, and Number of Share Classes of the Mutual Fund Industry Year-end
YearTotal net assets Billions of dollars Number of funds
Number of share classes
1940 $0.45 68 – 1945 1.28 73 – 1950 2.53 98 – 1955 7.84 125 – 1960 17.03 161 – 1965 35.22 170 – 1970 47.62 361 – 1975 45.87 426 – 1976 51.28 452 – 1977 48.94 477 – 1978 55.84 505 – 1979 94.51 526 – 1980 134.76 564 – 1981 241.37 665 – 1982 296.68 857 – 1983 292.99 1,026 – 1984 370.68 1,243 1,2431985 495.39 1,528 1,5281986 715.67 1,835 1,8351987 769.17 2,312 2,3121988 809.37 2,737 2,7371989 980.67 2,935 2,9351990 1,065.19 3,079 3,1771991 1,393.19 3,403 3,5871992 1,642.54 3,824 4,2081993 2,069.96 4,534 5,5621994 2,155.32 5,325 7,6971995 2,811.29 5,725 9,0071996 3,525.80 6,248 10,3521997 4,468.20 6,684 12,0021998 5,525.21 7,314 13,7201999 6,846.34 7,791 15,2622000 6,964.63 8,155 16,7382001 6,974.91 8,305 18,0222002 6,383.48 8,243 18,9832003 7,402.48 8,127 19,3212004 8,095.80 8,045 20,0412005 8,891.38 7,977 20,5542006 10,398.16 8,123 21,2642007 12,000.17 8,041 21,6382008 9,602.89 8,039 22,2622009 11,112.62 7,666 21,6512010 11,832.99 7,554 21,9102011 11,631.89 7,587 22,2822012 13,052.23 7,588 22,6352013 15,034.78 7,713 23,3862014 15,852.34 7,923 24,222
Note: Data for funds that invest primarily in other mutual funds were excluded from the series.

Data
Sec
tion
1
174 2015 INVESTMENT COMPANY FACT BOOK
TABLE 2 Total Sales, New Sales, Exchange Sales, Redemptions, and Exchange Redemptions of the Mutual Fund Industry Billions of dollars, annual
Year Total sales1 New sales Exchange sales2 Redemptions Exchange redemptions3
1945 $0.29 – – $0.11 – 1950 0.52 – – 0.28 – 1955 1.21 – – 0.44 – 1960 2.10 – – 0.84 – 1965 4.36 $3.93 – 1.96 – 1970 4.63 3.84 – 2.99 – 1975 10.06 8.94 – 9.57 – 1976 13.72 11.92 $1.52 16.41 $1.441977 17.07 14.75 2.24 16.69 2.311978 37.16 35.40 3.97 31.53 3.941979 119.32 115.66 5.83 86.74 5.891980 247.42 238.96 10.10 216.08 9.941981 472.13 452.42 14.44 362.44 14.591982 626.94 604.09 28.25 588.35 27.861983 547.77 532.04 35.67 565.83 36.031984 680.12 661.74 36.66 607.02 37.111985 953.85 933.37 46.55 864.88 46.841986 1,204.90 1,179.40 107.75 1,015.64 107.961987 1,251.19 1,220.27 205.68 1,178.75 207.351988 1,176.81 1,143.62 134.28 1,166.67 134.241989 1,444.84 1,401.21 130.66 1,327.05 131.951990 1,564.81 1,517.41 138.79 1,470.83 140.981991 2,037.64 1,990.53 155.75 1,879.69 154.311992 2,749.68 2,704.69 197.43 2,548.28 198.151993 3,187.49 3,137.76 248.79 2,904.44 253.951994 3,075.63 3,019.76 317.55 2,928.62 325.001995 3,600.62 3,526.00 351.53 3,314.86 351.081996 4,671.44 4,586.71 504.73 4,266.20 503.941997 5,801.23 5,704.83 613.44 5,324.29 618.491998 7,230.40 7,126.92 742.97 6,649.27 743.371999 9,043.58 8,922.96 949.96 8,562.10 947.362000 11,109.54 10,970.50 1,149.75 10,586.59 1,145.422001 12,866.21 12,747.53 797.34 12,242.32 798.082002 13,168.76 13,084.32 747.34 13,011.36 745.652003 12,393.59 12,315.40 572.50 12,361.66 573.762004 12,191.21 12,101.07 409.00 12,038.96 417.952005 13,939.33 13,812.50 420.84 13,546.81 432.432006 17,409.26 17,228.70 487.72 16,751.98 492.202007 23,470.65 23,236.42 606.47 22,352.20 611.962008 26,346.73 26,132.96 733.84 25,725.70 728.842009 20,679.71 20,528.31 529.97 20,680.23 528.132010 18,209.76 18,052.99 420.18 18,319.72 434.882011 17,836.92 17,660.78 448.06 17,738.34 466.522012 17,022.02 16,830.75 422.03 16,620.55 434.122013 18,157.31 17,967.72 517.69 17,779.44 531.092014 18,715.54 18,499.61 425.48 18,389.31 433.361 Total sales are the dollar value of new sales plus sales made through reinvestment of income dividends from existing
accounts, but exclude reinvestment of capital gains distributions. 2 Exchange sales are the dollar value of mutual fund shares switched into funds within the same fund group. 3 Exchange redemptions are the dollar value of mutual fund shares switched out of funds and into other funds within the same
fund group. Note: Data for funds that invest primarily in other mutual funds were excluded from the series.

Data Section 1
MUTUAL FUND TOTALS 175
TABLE 3 Total Net Assets of the Mutual Fund Industry Billions of dollars, year-end
Year Total
Long-term funds Money market fundsEquity Bond and income
1960 $17.03 $16.00 $1.02 – 1965 35.22 32.76 2.46 – 1970 47.62 45.13 2.49 – 1975 45.87 37.49 4.68 $3.701976 51.28 39.19 8.39 3.691977 48.94 34.07 10.98 3.891978 55.84 32.67 12.31 10.861979 94.51 35.88 13.10 45.531980 134.76 44.42 13.98 76.361981 241.37 41.19 14.01 186.161982 296.68 53.63 23.21 219.841983 292.99 76.97 36.63 179.39
Year Total
Long-term funds
Money market fundsEquity
Hybrid
Bond
Domestic World Taxable Municipal Taxable Tax-exempt
1984 $370.68 $74.55 $5.19 $11.15 $25.45 $20.79 $209.75 $23.801985 495.39 103.39 7.94 17.61 83.20 39.44 207.55 36.251986 715.67 138.98 15.47 25.76 167.63 75.67 228.35 63.811987 769.17 158.02 17.43 29.25 171.40 76.97 254.68 61.421988 809.37 171.40 17.98 26.35 168.96 86.73 272.20 65.761989 980.67 221.45 23.59 35.64 166.25 105.66 358.62 69.471990 1,065.19 211.18 28.30 35.98 171.14 120.25 414.56 83.781991 1,393.19 365.21 39.52 52.04 239.77 154.20 452.46 89.981992 1,642.54 468.41 45.68 77.63 308.37 196.26 451.35 94.841993 2,069.96 626.54 114.13 142.33 367.05 254.60 461.88 103.441994 2,155.32 691.57 161.19 161.40 302.84 227.31 501.11 109.891995 2,811.29 1,052.57 196.51 206.70 349.21 253.29 631.32 121.691996 3,525.80 1,440.81 285.20 248.36 396.56 253.07 763.94 137.871997 4,468.20 2,021.66 346.37 311.90 457.50 271.89 901.23 157.661998 5,525.21 2,586.31 391.64 360.04 536.96 298.59 1,166.97 184.711999 6,846.34 3,456.64 585.25 374.64 545.18 271.48 1,413.25 199.902000 6,964.63 3,369.73 564.75 360.92 545.58 278.41 1,611.38 233.872001 6,974.91 2,947.93 444.47 358.03 642.96 296.22 2,026.23 259.082002 6,383.48 2,273.05 369.37 335.28 810.58 330.13 1,988.78 276.302003 7,402.48 3,118.32 535.05 447.57 925.21 336.31 1,749.73 290.292004 8,095.80 3,626.37 716.20 552.25 971.03 328.24 1,589.70 312.002005 8,891.38 3,929.72 955.73 621.48 1,018.68 338.95 1,690.45 336.372006 10,398.16 4,472.13 1,360.45 731.50 1,130.52 365.09 1,969.42 369.032007 12,000.17 4,694.65 1,718.57 821.52 1,305.51 374.15 2,617.67 468.092008 9,602.89 2,738.82 898.60 562.26 1,233.18 337.79 3,338.56 493.682009 11,112.62 3,564.56 1,307.98 717.58 1,748.11 458.50 2,916.96 398.942010 11,832.99 4,055.64 1,540.98 841.41 2,117.07 473.95 2,473.92 330.012011 11,631.89 3,856.91 1,356.08 883.06 2,346.90 497.53 2,399.72 291.702012 13,052.23 4,326.34 1,612.41 1,029.26 2,810.53 580.17 2,406.10 287.432013 15,034.78 5,728.52 2,034.20 1,267.33 2,787.10 499.29 2,447.72 270.612014 15,852.34 6,234.99 2,079.33 1,351.84 2,894.45 566.48 2,464.47 260.79
Note: Data for funds that invest primarily in other mutual funds were excluded from the series. The data contain a series break beginning in 1984. All funds were reclassified in 1984, and a separate category was created for hybrid funds. Components may not add to the total because of rounding.
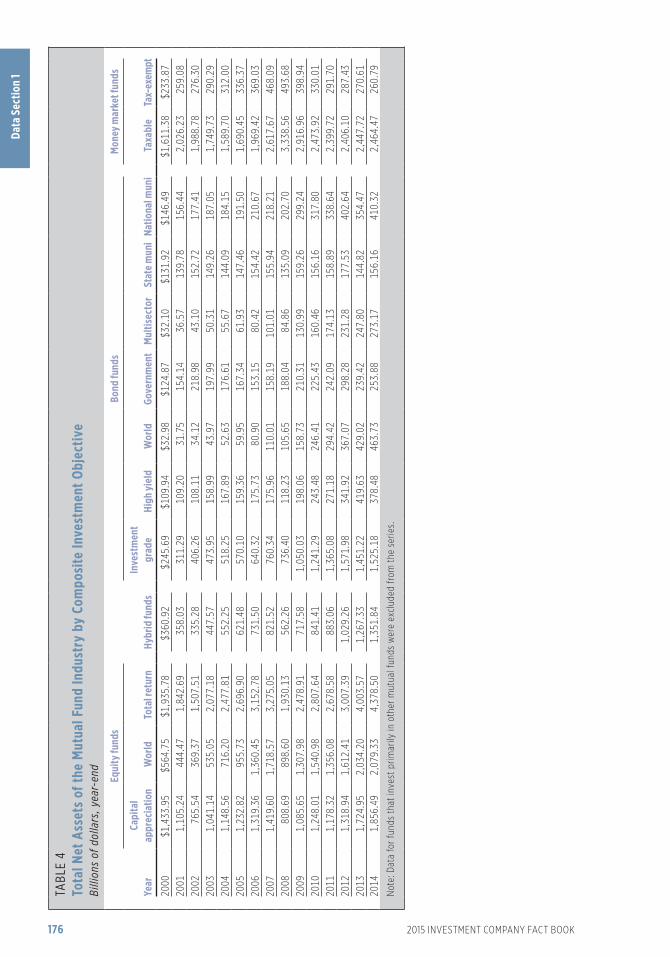
Data
Sec
tion
1
176 2015 INVESTMENT COMPANY FACT BOOK
TABL
E 4
Tota
l Net
Ass
ets
of th
e M
utua
l Fun
d In
dust
ry b
y Co
mpo
site
Inve
stm
ent O
bjec
tive
Billi
ons
of d
olla
rs, y
ear-
end
Year
Equi
ty fu
nds
Hybr
id fu
nds
Bond
fund
sM
oney
mar
ket f
unds
Capi
tal
appr
ecia
tion
Wor
ld
Tota
l ret
urn
Inve
stm
ent
grad
eHi
gh y
ield
W
orld
Go
vern
men
t M
ultis
ecto
rSt
ate
mun
i Na
tiona
l mun
i Ta
xabl
eTa
x-ex
empt
2000
$1,4
33.9
5$5
64.7
5$1
,935
.78
$360
.92
$245
.69
$109
.94
$32.
98$1
24.8
7$3
2.10
$131
.92
$146
.49
$1,6
11.3
8$2
33.8
720
011,
105.
2444
4.47
1,84
2.69
358.
0331
1.29
109.
2031
.75
154.
1436
.57
139.
7815
6.44
2,02
6.23
259.
0820
0276
5.54
369.
371,
507.
5133
5.28
406.
2610
8.11
34.1
221
8.98
43.1
015
2.72
177.
411,
988.
7827
6.30
2003
1,04
1.14
535.
052,
077.
1844
7.57
473.
9515
8.99
43.9
719
7.99
50.3
114
9.26
187.
051,
749.
7329
0.29
2004
1,14
8.56
716.
202,
477.
8155
2.25
518.
2516
7.89
52.6
317
6.61
55.6
714
4.09
184.
151,
589.
7031
2.00
2005
1,23
2.82
955.
732,
696.
9062
1.48
570.
1015
9.36
59.9
516
7.34
61.9
314
7.46
191.
501,
690.
4533
6.37
2006
1,31
9.36
1,36
0.45
3,15
2.78
731.
5064
0.32
175.
7380
.90
153.
1580
.42
154.
4221
0.67
1,96
9.42
369.
0320
071,
419.
601,
718.
573,
275.
0582
1.52
760.
3417
5.96
110.
0115
8.19
101.
0115
5.94
218.
212,
617.
6746
8.09
2008
808.
6989
8.60
1,93
0.13
562.
2673
6.40
118.
2310
5.65
188.
0484
.86
135.
0920
2.70
3,33
8.56
493.
6820
091,
085.
651,
307.
982,
478.
9171
7.58
1,05
0.03
198.
0615
8.73
210.
3113
0.99
159.
2629
9.24
2,91
6.96
398.
9420
101,
248.
011,
540.
982,
807.
6484
1.41
1,24
1.29
243.
4824
6.41
225.
4316
0.46
156.
1631
7.80
2,47
3.92
330.
0120
111,
178.
321,
356.
082,
678.
5888
3.06
1,36
5.08
271.
1829
4.42
242.
0917
4.13
158.
8933
8.64
2,39
9.72
291.
7020
121,
318.
941,
612.
413,
007.
391,
029.
261,
571.
9834
1.92
367.
0729
8.28
231.
2817
7.53
402.
642,
406.
1028
7.43
2013
1,72
4.95
2,03
4.20
4,00
3.57
1,26
7.33
1,45
1.22
419.
6342
9.02
239.
4224
7.80
144.
8235
4.47
2,44
7.72
270.
6120
141,
856.
492,
079.
334,
378.
501,
351.
841,
525.
1837
8.48
463.
7325
3.88
273.
1715
6.16
410.
322,
464.
4726
0.79
Not
e: D
ata
for f
unds
that
inve
st p
rimar
ily in
oth
er m
utua
l fun
ds w
ere
excl
uded
from
the
serie
s.

Data Section 1
MUTUAL FUND TOTALS 177
TABLE 5 Number of Funds of the Mutual Fund Industry Year-end
Year Total
Long-term funds Money market fundsEquity Bond and income
1970 361 323 38 – 1971 392 350 42 – 1972 410 364 46 – 1973 421 366 55 – 1974 431 343 73 151975 426 314 76 361976 452 302 102 481977 477 296 131 501978 505 294 150 611979 526 289 159 781980 564 288 170 1061981 665 306 180 1791982 857 340 199 3181983 1,026 396 257 373
Year Total
Long-term funds
Money market fundsEquity
Hybrid
Bond
Domestic World Taxable Municipal Taxable Tax-exempt
1984 1,243 430 29 89 159 111 331 941985 1,528 519 43 103 229 174 350 1101986 1,835 621 57 121 302 247 360 1271987 2,312 743 81 164 415 366 389 1541988 2,737 897 109 179 522 420 433 1771989 2,935 941 128 189 561 443 470 2031990 3,079 944 155 192 584 463 505 2361991 3,403 985 206 211 658 523 552 2681992 3,824 1,086 239 234 773 628 585 2791993 4,534 1,280 306 281 951 796 627 2931994 5,325 1,463 423 360 1,104 1,012 649 3141995 5,725 1,611 528 411 1,167 1,011 676 3211996 6,248 1,902 668 465 1,244 981 669 3191997 6,684 2,183 768 500 1,287 933 685 3281998 7,314 2,622 890 525 1,351 900 687 3391999 7,791 3,004 949 531 1,375 887 704 3412000 8,155 3,315 1,055 508 1,367 871 704 3352001 8,305 3,610 1,085 473 1,308 814 690 3252002 8,243 3,714 1,018 458 1,295 770 677 3112003 8,127 3,659 929 474 1,313 779 660 3132004 8,045 3,651 887 472 1,324 767 639 3052005 7,977 3,659 912 481 1,315 740 593 2772006 8,123 3,748 995 500 1,320 713 573 2742007 8,041 3,678 1,060 496 1,326 676 545 2602008 8,039 3,655 1,139 511 1,311 640 534 2492009 7,666 3,419 1,172 481 1,291 599 476 2282010 7,554 3,322 1,193 494 1,310 583 442 2102011 7,587 3,260 1,265 519 1,348 563 431 2012012 7,588 3,218 1,278 562 1,393 557 400 1802013 7,713 3,194 1,345 602 1,457 560 382 1732014 7,923 3,239 1,407 661 1,531 557 365 163
Note: Data for funds that invest primarily in other mutual funds were excluded from the series. The data contain a series break beginning in 1984. All funds were reclassified in 1984, and a separate category was created for hybrid funds.

Data
Sec
tion
1
178 2015 INVESTMENT COMPANY FACT BOOK
TABL
E 6
Num
ber o
f Fun
ds o
f the
Mut
ual F
und
Indu
stry
by
Com
posi
te In
vest
men
t Obj
ectiv
e
Ye
ar-e
nd
Year
Equi
ty fu
nds
Hybr
id fu
nds
Bond
fund
sM
oney
mar
ket f
unds
Capi
tal
appr
ecia
tion
Wor
ld
Tota
l ret
urn
Inve
stm
ent
grad
eHi
gh y
ield
W
orld
Go
vern
men
t M
ultis
ecto
rSt
ate
mun
i Na
tiona
l mun
i Ta
xabl
eTa
x-ex
empt
2000
1,55
51,
055
1,76
050
857
521
915
532
395
589
282
704
335
2001
1,72
31,
085
1,88
747
355
722
414
029
691
550
264
690
325
2002
1,72
91,
018
1,98
545
857
521
212
628
498
515
255
677
311
2003
1,68
092
91,
979
474
601
212
121
281
9852
325
666
031
320
041,
650
887
2,00
147
261
421
712
227
596
513
254
639
305
2005
1,63
191
22,
028
481
609
228
123
262
9349
824
259
327
720
061,
669
995
2,07
950
059
422
113
925
611
047
823
557
327
420
071,
577
1,06
02,
101
496
605
223
151
243
104
448
228
545
260
2008
1,55
61,
139
2,09
951
159
521
616
123
610
341
522
553
424
920
091,
442
1,17
21,
977
481
571
207
170
237
106
377
222
476
228
2010
1,39
31,
193
1,92
949
458
321
018
322
910
536
122
244
221
020
111,
358
1,26
51,
902
519
579
211
217
223
118
346
217
431
201
2012
1,34
31,
278
1,87
556
258
121
825
421
612
433
622
140
018
020
131,
327
1,34
51,
867
602
594
231
289
214
129
331
229
382
173
2014
1,33
01,
407
1,90
966
160
524
134
719
913
932
223
536
516
3
Not
e: D
ata
for f
unds
that
inve
st p
rimar
ily in
oth
er m
utua
l fun
ds w
ere
excl
uded
from
the
serie
s.

Data Section 1
MUTUAL FUND TOTALS 179
Year Total
Long-term funds
Money market fundsEquity
Hybrid
Bond
Domestic World Taxable Municipal Taxable Tax-exempt
1984 1,243 430 29 89 159 111 331 941985 1,528 519 43 103 229 174 350 1101986 1,835 621 57 121 302 247 360 1271987 2,312 743 81 164 415 366 389 1541988 2,737 897 109 179 522 420 433 1771989 2,935 941 128 189 561 443 470 2031990 3,177 962 166 199 598 490 522 2401991 3,587 1,021 227 223 687 558 591 2801992 4,208 1,189 263 257 877 708 616 2981993 5,562 1,560 385 347 1,207 1,054 672 3371994 7,697 2,026 630 515 1,605 1,660 858 4031995 9,007 2,442 845 634 1,844 1,862 953 4271996 10,352 3,056 1,155 749 2,050 1,889 1,005 4481997 12,002 3,860 1,449 873 2,293 1,978 1,075 4741998 13,720 4,872 1,770 964 2,532 1,955 1,137 4901999 15,262 5,818 1,968 1,026 2,722 1,998 1,230 5002000 16,738 6,725 2,299 1,007 2,821 2,031 1,331 5242001 18,022 7,738 2,511 994 2,874 1,957 1,405 5432002 18,983 8,427 2,515 1,030 3,066 1,939 1,463 5432003 19,321 8,546 2,369 1,112 3,223 2,040 1,462 5692004 20,041 9,002 2,357 1,202 3,377 2,050 1,477 5762005 20,554 9,259 2,501 1,344 3,427 1,992 1,464 5672006 21,264 9,641 2,775 1,355 3,542 1,938 1,454 5592007 21,638 9,706 3,030 1,354 3,640 1,893 1,447 5682008 22,262 9,881 3,385 1,424 3,753 1,829 1,443 5472009 21,651 9,342 3,550 1,374 3,782 1,757 1,330 5162010 21,910 9,206 3,710 1,449 3,990 1,774 1,281 5002011 22,282 9,178 3,944 1,561 4,150 1,719 1,255 4752012 22,635 9,148 4,037 1,691 4,438 1,698 1,174 4492013 23,386 9,224 4,258 1,864 4,721 1,748 1,141 4302014 24,222 9,423 4,525 2,027 4,997 1,743 1,101 406
Note: Data for funds that invest primarily in other mutual funds were excluded from the series.
TABLE 7 Number of Share Classes of the Mutual Fund Industry Year-end

Data
Sec
tion
1
180 2015 INVESTMENT COMPANY FACT BOOK
TABL
E 8
Nu
mbe
r of S
hare
Cla
sses
of t
he M
utua
l Fun
d In
dust
ry b
y Co
mpo
site
Inve
stm
ent O
bjec
tive
Year
-end
Year
Equi
ty fu
nds
Hybr
id fu
nds
Bond
fund
sM
oney
mar
ket f
unds
Capi
tal
appr
ecia
tion
Wor
ld
Tota
l ret
urn
Inve
stm
ent
grad
eHi
gh y
ield
W
orld
Go
vern
men
t M
ultis
ecto
rSt
ate
mun
i Na
tiona
l mun
i Ta
xabl
eTa
x-ex
empt
2000
3,23
22,
299
3,49
31,
007
1,14
149
031
167
920
01,
393
638
1,33
152
420
013,
770
2,51
13,
968
994
1,19
052
429
266
120
71,
325
632
1,40
554
320
023,
974
2,51
54,
453
1,03
01,
341
528
291
676
230
1,28
665
31,
463
543
2003
3,95
02,
369
4,59
61,
112
1,46
253
829
170
322
91,
333
707
1,46
256
920
044,
068
2,35
74,
934
1,20
21,
551
571
302
716
237
1,33
371
71,
477
576
2005
4,09
22,
501
5,16
71,
344
1,57
461
231
568
723
91,
306
686
1,46
456
720
064,
245
2,77
55,
396
1,35
51,
604
623
367
666
282
1,25
868
01,
454
559
2007
4,15
83,
030
5,54
81,
354
1,65
566
141
363
028
11,
220
673
1,44
756
820
084,
179
3,38
55,
702
1,42
41,
660
680
491
624
298
1,15
167
81,
443
547
2009
3,92
83,
550
5,41
41,
374
1,62
966
054
463
431
51,
069
688
1,33
051
620
103,
840
3,71
05,
366
1,44
91,
707
690
615
652
326
1,06
570
91,
281
500
2011
3,78
53,
944
5,39
31,
561
1,72
170
474
462
036
11,
029
690
1,25
547
520
123,
770
4,03
75,
378
1,69
11,
797
744
891
626
380
1,00
269
61,
174
449
2013
3,77
04,
258
5,45
41,
864
1,84
579
71,
043
631
405
1,01
073
81,
141
430
2014
3,79
54,
525
5,62
82,
027
1,87
583
41,
251
601
436
990
753
1,10
140
6
Not
e: D
ata
for f
unds
that
inve
st p
rimar
ily in
oth
er m
utua
l fun
ds w
ere
excl
uded
from
the
serie
s.

Data Section 1
181
Data Section 2
CLOSED-END FUNDS, EXCHANGE-TRADED FUNDS, AND UNIT INVESTMENT TRUSTS
TABL
E 9
Clos
ed-E
nd F
unds
: Tot
al A
sset
s an
d Nu
mbe
r of F
unds
by
Type
of F
und
Tota
l ass
ets
Mill
ions
of d
olla
rs, y
ear-
end
Num
ber o
f fun
dsYe
ar-e
nd
Equi
tyBo
nd
Tota
l
Equi
tyBo
nd
Year
Tota
lDo
mes
ticGl
obal
/ In
tern
atio
nal
Dom
estic
ta
xabl
eDo
mes
tic
mun
icip
alGl
obal
/ In
tern
atio
nal
Dom
estic
Glob
al/
Inte
rnat
iona
lDo
mes
tic
taxa
ble
Dom
estic
m
unic
ipal
Glob
al/
Inte
rnat
iona
l
1990
$59,
014
$10,
791
$5,7
51$1
6,82
0$1
6,48
2$9
,170
245
4051
8452
1819
9176
,092
13,1
096,
115
19,4
0329
,519
7,94
727
739
5286
8515
1992
100,
581
14,5
817,
100
24,6
3245
,593
8,67
437
042
6199
148
2019
9313
1,43
815
,462
12,4
6630
,909
60,1
0012
,501
491
4770
120
225
2919
9413
0,58
616
,018
21,5
0526
,604
56,0
3510
,425
509
4986
123
219
3219
9514
2,54
018
,078
23,7
6928
,678
60,3
1811
,698
498
4891
119
207
3319
9614
6,90
819
,830
27,0
7428
,418
59,5
4012
,046
495
4991
118
205
3219
9715
1,76
720
,536
29,0
1128
,315
61,9
9211
,912
485
4589
115
204
3219
9815
5,74
922
,529
25,0
1134
,127
63,6
2810
,454
491
4483
123
211
3019
9914
6,94
024
,696
16,4
9430
,888
64,5
1310
,348
510
4973
117
241
3020
0014
3,06
624
,557
11,9
8628
,581
68,2
669,
676
481
5369
109
220
3020
0114
1,18
522
,261
8,74
826
,606
74,4
679,
102
489
5164
109
238
2720
0215
8,66
426
,596
6,98
825
,643
90,0
249,
414
543
6359
105
291
2520
0321
3,75
642
,987
9,74
355
,428
94,0
6011
,539
581
7555
127
297
2720
0425
3,38
263
,732
18,0
7263
,890
94,8
4112
,847
618
9561
137
295
3020
0527
5,93
277
,090
27,7
8463
,935
94,5
6312
,559
634
120
7113
228
031
2006
297,
236
88,0
1333
,657
67,9
6294
,526
13,0
7964
512
874
134
276
3320
0731
2,37
187
,869
57,3
2962
,571
88,9
2015
,682
662
136
9213
126
934
2008
184,
175
45,7
5326
,525
33,6
7367
,334
10,8
9164
212
893
128
260
3320
0922
2,89
452
,940
34,4
8944
,126
77,6
7713
,660
627
117
9112
726
032
2010
237,
790
60,4
6136
,239
48,9
8577
,140
14,9
6562
411
787
130
258
3220
1124
2,38
762
,414
33,4
4148
,009
84,1
0014
,422
632
125
8713
225
632
2012
263,
548
68,4
6132
,179
53,6
3890
,524
18,7
4660
212
586
131
223
3720
1327
9,28
281
,757
32,4
2958
,489
82,8
7123
,737
599
131
8513
221
041
2014
289,
137
88,9
7930
,383
56,7
3290
,169
22,8
7456
812
684
124
194
40
Not
e: C
ompo
nent
s m
ay n
ot a
dd to
the
tota
l bec
ause
of r
ound
ing.
Tot
als
are
incl
usiv
e of
pre
ferr
ed s
hare
cla
sses
.

Data
Sec
tion
2
182 2015 INVESTMENT COMPANY FACT BOOK
TABLE 10Closed-End Funds: Gross Issuance, Gross Redemptions, and Net Issuance by Type of FundMillions of dollars, annual
Year Total
Equity funds Bond funds
DomesticGlobal/
InternationalDomestic taxable
Domestic municipal
Global/ International
Gross issuance1
2002 $24,895 $9,191 $3 $2,309 $13,392 $02003 40,810 11,187 50 25,587 2,954 1,0322004 27,991 15,424 5,714 5,820 5 1,0282005 21,388 12,559 6,628 2,046 31 1242006 12,745 7,992 2,505 1,718 196 3342007 31,086 5,973 19,764 2,221 433 2,6952008 275 8 145 121 0 02009 3,615 549 485 876 1,389 3172010 14,017 3,719 114 2,374 7,454 3582011 14,990 3,850 1,469 1,000 8,669 22012 16,774 3,815 533 4,088 6,258 2,0812013 17,012 4,311 106 4,525 1,643 6,4282014 7,699 3,996 619 516 2,567 1
Gross redemptions2
2007 $2,717 $1,024 $105 $254 $1,313 $202008 22,573 7,060 1,832 6,891 6,089 7012009 6,875 2,916 639 1,664 1,627 302010 8,587 1,724 55 474 6,335 02011 8,972 644 209 276 7,843 02012 5,459 974 420 838 3,226 02013 3,270 214 649 604 1,799 52014 2,933 152 124 411 2,034 213
Net issuance3
2007 $28,369 $4,949 $19,659 $1,966 $-880 $2,6752008 -22,298 -7,052 -1,687 -6,770 -6,089 -7002009 -3,259 -2,366 -154 -788 -238 2872010 5,430 1,995 59 1,900 1,119 3572011 6,018 3,206 1,260 724 825 22012 11,315 2,840 113 3,249 3,032 2,0812013 13,742 4,097 -543 3,921 -155 6,4232014 4,766 3,844 494 105 533 -212
1 Gross issuance of shares is the value of net proceeds from underwritings, additional offerings, and other issuance. Data are not available prior to 2002.
2 Gross redemptions of shares is the value of share repurchases and fund liquidations. Data are not available prior to 2007. 3 Net issuance of shares is the dollar value of gross issuance minus gross redemptions. A positive number indicates that gross
issuance exceeded gross redemptions. A negative number indicates that gross redemptions exceeded gross issuance. Data are not available prior to 2007.
Note: Components may not add to the total because of rounding. Totals are inclusive of preferred share classes.

Data Section 2
CLOSED-END FUNDS, EXCHANGE-TRADED FUNDS, AND UNIT INVESTMENT TRUSTS 183
TABL
E 11
Exch
ange
-Tra
ded
Fund
s: T
otal
Net
Ass
ets
by T
ype
of F
und
Mill
ions
of d
olla
rs, y
ear-
end
Year
Tota
l
Inve
stm
ent o
bjec
tive
Lega
l sta
tus
Mem
oEq
uity
Com
mod
ities
2Hy
brid
Bond
1940
Act
ETF
s
Non–
1940
Act
ETFs
3
Dom
estic
equ
ityGl
obal
/ In
tern
atio
nal
Inde
xAc
tivel
y m
anag
edFu
nds o
f fu
nds4
Broa
d-ba
sed
Sect
or1
1993
$464
$464
-
-
-
-
- $4
64
-
-
-
1994
424
424
-
-
-
-
-
424
-
-
-
1995
1,05
21,
052
-
-
-
-
-
1,05
2 -
-
-
19
962,
411
2,15
9 -
$2
52
-
-
-
2,41
1
-
-
-
1997
6,70
76,
200
-
506
-
-
-
6,70
7 -
-
-
19
9815
,568
14,0
58$4
841,
026
-
-
-
15,5
68 -
-
-
19
9933
,873
29,3
742,
507
1,99
2
-
-
-
33,8
73
-
-
-
2000
65,5
8560
,529
3,01
52,
041
-
-
-
65,5
85 -
-
-
20
0182
,993
74,7
525,
224
3,01
6
-
-
-
82,9
93 -
-
-
2002
102,
143
86,9
855,
919
5,32
4 -
-
$3,9
1510
2,14
3
-
-
- 20
0315
0,98
312
0,43
011
,901
13,9
84 -
-
4,
667
150,
983
-
-
-
2004
227,
540
163,
730
20,3
1533
,644
$1,3
35
-
8,51
622
6,20
5 -
$1
,335
-
2005
300,
820
186,
832
28,9
7565
,210
4,79
8 -
15
,004
296,
022
- 4,
798
- 20
0642
2,55
023
2,48
743
,655
111,
194
14,6
99 -
20
,514
407,
850
-
14,6
99 -
20
0760
8,42
230
0,93
064
,117
179,
702
28,9
06$1
1934
,648
579,
517
-
28,9
06 -
20
0853
1,28
826
6,16
158
,374
113,
684
35,7
2813
257
,209
495,
314
$245
35,7
28$9
720
0977
7,12
830
4,04
482
,053
209,
315
74,5
2816
910
7,01
870
1,58
61,
014
74,5
2882
420
1099
1,98
937
2,37
710
3,80
727
6,62
210
1,08
132
213
7,78
188
8,19
82,
736
101,
055
1,29
420
111,
048,
134
400,
696
108,
548
245,
114
109,
176
377
184,
222
934,
216
5,04
910
8,86
81,
580
2012
1,33
7,11
250
9,33
813
5,37
832
8,52
112
0,01
665
624
3,20
31,
206,
974
10,2
5711
9,88
12,
227
2013
1,67
4,61
676
1,70
120
2,70
639
8,83
464
,042
1,46
924
5,86
21,
596,
691
14,0
5563
,869
2,65
920
141,
974,
377
935,
652
267,
523
414,
805
56,9
743,
047
296,
376
1,90
1,33
116
,508
56,5
385,
204
1 Th
is c
ateg
ory
incl
udes
fund
s bo
th re
gist
ered
and
not
regi
ster
ed u
nder
the
Inve
stm
ent C
ompa
ny A
ct o
f 194
0.
2
This
cat
egor
y in
clud
es fu
nds—
both
regi
ster
ed a
nd n
ot re
gist
ered
und
er th
e In
vest
men
t Com
pany
Act
of 1
940—
that
inve
st p
rimar
ily in
com
mod
ities
, cur
renc
ies,
and
futu
res.
3
The
fund
s in
this
cat
egor
y ar
e no
t reg
iste
red
unde
r the
Inve
stm
ent C
ompa
ny A
ct o
f 194
0.
4
Dat
a fo
r ETF
s th
at in
vest
prim
arily
in o
ther
ETF
s ar
e ex
clud
ed fr
om th
e to
tals
.
N
ote:
Com
pone
nts
may
not
add
to th
e to
tal b
ecau
se o
f rou
ndin
g.
Sou
rces
: Inv
estm
ent C
ompa
ny In
stitu
te a
nd S
trat
egic
Insi
ght S
imfu
nd

Data
Sec
tion
2
184 2015 INVESTMENT COMPANY FACT BOOK
TABL
E 12
Exch
ange
-Tra
ded
Fund
s: N
umbe
r of F
unds
by
Type
of F
und
Year
-end
Year
Tota
l
Inve
stm
ent o
bjec
tive
Lega
l sta
tus
Mem
oEq
uity
Com
mod
ities
2Hy
brid
Bond
1940
Act
ETF
s
Non–
1940
Act
ETFs
3
Dom
estic
equ
ityGl
obal
/ In
tern
atio
nal
Inde
xAc
tivel
y m
anag
edFu
nds o
f fu
nds4
Broa
d-ba
sed
Sect
or1
1993
11
-
-
-
-
-
1 -
-
-
19
941
1 -
-
-
-
-
1
-
-
-
1995
22
-
-
-
-
-
2 -
-
-
19
9619
2 -
17
-
-
-
19 -
-
-
19
9719
2 -
17
-
-
-
19 -
-
-
19
9829
39
17 -
-
-
29
-
-
-
1999
304
917
-
-
-
30 -
-
-
20
0080
2926
25 -
-
-
80
-
-
-
2001
102
3434
34 -
-
-
10
2 -
-
-
20
0211
334
3239
-
-
811
3 -
-
-
20
0311
939
3341
-
-
611
9 -
-
-
20
0415
260
4243
1 -
6
151
-
1 -
20
0520
481
6549
3 -
6
201
-
3 -
20
0635
913
311
985
16 -
6
343
-
16 -
20
0762
919
719
115
928
549
601
-
28 -
20
0872
820
418
622
545
662
670
1345
1520
0979
722
217
924
449
598
727
2149
2320
1092
324
319
329
855
612
884
425
5427
2011
1,13
428
722
936
875
716
81,
028
3373
3220
121,
194
274
222
404
7913
202
1,07
044
8045
2013
1,29
429
223
543
876
1523
81,
158
6175
3820
141,
411
316
236
494
8219
264
1,22
811
172
401
This
cat
egor
y in
clud
es fu
nds
both
regi
ster
ed a
nd n
ot re
gist
ered
und
er th
e In
vest
men
t Com
pany
Act
of 1
940.
2
This
cat
egor
y in
clud
es fu
nds—
both
regi
ster
ed a
nd n
ot re
gist
ered
und
er th
e In
vest
men
t Com
pany
Act
of 1
940—
that
inve
st p
rimar
ily in
com
mod
ities
, cur
renc
ies,
and
futu
res.
3 Th
e fu
nds
in th
is c
ateg
ory
are
not r
egis
tere
d un
der t
he In
vest
men
t Com
pany
Act
of 1
940.
4
Dat
a fo
r ETF
s th
at in
vest
prim
arily
in o
ther
ETF
s ar
e ex
clud
ed fr
om th
e to
tals
. S
ourc
es: I
nves
tmen
t Com
pany
Inst
itute
and
Str
ateg
ic In
sigh
t Sim
fund

Data Section 2
CLOSED-END FUNDS, EXCHANGE-TRADED FUNDS, AND UNIT INVESTMENT TRUSTS 185
TABL
E 13
Exch
ange
-Tra
ded
Fund
s: N
et Is
suan
ce b
y Ty
pe o
f Fun
d M
illio
ns o
f dol
lars
, ann
ual
Year
Tota
l
Inve
stm
ent o
bjec
tive
Lega
l sta
tus
Mem
oEq
uity
Com
mod
ities
2Hy
brid
Bond
1940
Act
ETF
s
Non–
1940
Act
ETFs
3
Dom
estic
equ
ityGl
obal
/ In
tern
atio
nal
Inde
xAc
tivel
y m
anag
edFu
nds o
f fu
nds4
Broa
d-ba
sed
Sect
or1
1993
$442
$442
- -
- -
- $4
42-
- -
1994
-28
-28
- -
- -
- -2
8-
- -
1995
443
443
- -
- -
- 44
3-
- -
1996
1,10
884
2-
$266
- -
- 1,
108
- -
- 19
973,
466
3,16
0-
306
- -
- 3,
466
- -
- 19
986,
195
5,15
8$4
8455
3-
- -
6,19
5-
- -
1999
11,9
2910
,221
1,59
611
2-
- -
11,9
29-
- -
2000
42,5
0840
,591
1,03
388
4-
- -
42,5
08-
- -
2001
31,0
1226
,911
2,73
51,
366
- -
- 31
,012
- -
- 20
0245
,302
35,4
772,
304
3,79
2-
- $3
,729
45,3
02-
- -
2003
15,8
105,
737
3,58
75,
764
- -
721
15,8
10-
- -
2004
56,3
7529
,084
6,51
415
,645
$1,3
53-
3,77
855
,021
- $1
,353
- 20
0556
,729
16,9
416,
719
23,4
552,
859
- 6,
756
53,8
71-
2,85
9-
2006
73,9
9521
,589
9,78
028
,423
8,47
5-
5,72
965
,520
- 8,
475
- 20
0715
0,61
761
,152
18,1
2248
,842
9,06
2$1
2213
,318
141,
555
- 9,
062
- 20
0817
7,22
088
,105
30,2
9625
,243
10,5
6758
22,9
5216
6,37
2$2
8110
,567
$107
2009
116,
469
-11,
842
14,3
2939
,599
28,4
1015
45,9
5887
,336
724
28,4
1023
720
1011
7,98
228
,317
10,1
8741
,527
8,15
514
429
,652
108,
141
1,71
18,
129
433
2011
117,
642
34,6
539,
682
24,2
502,
940
7246
,045
112,
437
2,56
72,
639
389
2012
185,
394
57,7
3914
,307
51,8
968,
889
246
52,3
1817
1,32
95,
025
9,04
151
020
1317
9,88
599
,470
34,4
3462
,807
-29,
870
849
12,1
9520
5,32
34,
468
-29,
906
1,18
020
1424
0,78
510
2,33
540
,593
46,6
42-1
,420
1,62
951
,007
240,
011
2,53
8-1
,764
2,42
31 T
his
cate
gory
incl
udes
fund
s bo
th re
gist
ered
and
not
regi
ster
ed u
nder
the
Inve
stm
ent C
ompa
ny A
ct o
f 194
0.
2 Thi
s ca
tego
ry in
clud
es fu
nds—
both
regi
ster
ed a
nd n
ot re
gist
ered
und
er th
e In
vest
men
t Com
pany
Act
of 1
940—
that
inve
st p
rimar
ily in
com
mod
ities
, cur
renc
ies,
and
futu
res.
3 The
fund
s in
this
cat
egor
y ar
e no
t reg
iste
red
unde
r the
Inve
stm
ent C
ompa
ny A
ct o
f 194
0.
4 D
ata
for E
TFs
that
inve
st p
rimar
ily in
oth
er E
TFs
are
excl
uded
from
the
tota
ls.
N
ote:
Com
pone
nts
may
not
add
to th
e to
tal b
ecau
se o
f rou
ndin
g.
Sou
rces
: Inv
estm
ent C
ompa
ny In
stitu
te a
nd S
trat
egic
Insi
ght S
imfu
nd

Data
Sec
tion
2
186 2015 INVESTMENT COMPANY FACT BOOK
TABL
E 14
Unit
Inve
stm
ent T
rust
s: T
otal
Net
Ass
ets,
Num
ber o
f Tru
sts,
and
New
Dep
osits
by
Type
of T
rust
Year
Tota
l net
ass
ets
Mill
ions
of d
olla
rs, y
ear-
end
Num
ber o
f tru
sts
Year
-end
New
dep
osits
Mill
ions
of d
olla
rs, a
nnua
l
Tota
l tru
sts
Equi
tyTa
xabl
e de
btTa
x-fr
ee
debt
Tota
l tru
sts
Equi
tyTa
xabl
e de
btTa
x-fr
ee
debt
Tota
l tru
sts
Equi
tyTa
xabl
e de
btTa
x-fr
ee
debt
1990
$105
,390
$4,1
92$9
,456
$91,
742
12,1
3117
172
211
,238
$7,4
89$4
95$1
,349
$5,6
4419
9110
2,82
84,
940
9,72
188
,167
12,3
8816
867
811
,542
8,19
590
01,
687
5,60
919
9297
,925
6,48
49,
976
81,4
6513
,598
230
745
12,6
238,
909
1,77
12,
385
4,75
219
9387
,574
8,49
48,
567
70,5
1313
,740
258
679
12,8
039,
359
3,20
61,
598
4,55
519
9473
,682
9,28
57,
252
57,1
4413
,310
306
568
12,4
368,
915
3,26
51,
709
3,94
119
9573
,125
14,0
198,
094
51,0
1312
,979
301
578
12,1
0011
,264
6,74
31,
154
3,36
719
9672
,204
22,9
228,
485
40,7
9611
,764
378
591
10,7
9521
,662
18,3
1680
02,
546
1997
84,7
6140
,747
6,48
037
,533
11,5
9356
351
310
,517
38,5
4635
,855
771
1,91
919
9893
,943
56,4
135,
380
32,1
5110
,966
872
414
9,68
047
,675
45,9
4756
21,
166
1999
91,9
7062
,128
4,28
325
,559
10,4
141,
081
409
8,92
452
,046
50,6
2934
31,
074
2000
74,1
6148
,060
3,50
222
,599
10,0
721,
554
369
8,14
943
,649
42,5
7019
688
320
0149
,249
26,4
673,
784
18,9
999,
295
1,50
032
47,
471
19,0
4916
,927
572
1,55
020
0236
,016
14,6
514,
020
17,3
458,
303
1,24
736
66,
690
11,6
009,
131
862
1,60
720
0335
,826
19,0
243,
311
13,4
917,
233
1,20
632
05,
707
12,7
3110
,071
931
1,72
920
0437
,267
23,2
012,
635
11,4
326,
499
1,16
629
55,
038
17,1
2514
,559
981
1,58
520
0540
,894
28,6
342,
280
9,98
06,
019
1,25
130
44,
464
22,5
9821
,526
289
782
2006
49,6
6238
,809
2,14
28,
711
5,90
71,
566
319
4,02
229
,057
28,1
8529
457
820
0753
,040
43,2
952,
066
7,68
06,
030
1,96
432
73,
739
35,8
3635
,101
298
438
2008
28,5
4320
,080
2,00
76,
456
5,98
42,
175
343
3,46
623
,590
22,3
3555
769
820
0938
,336
24,7
743,
668
9,89
46,
049
2,14
543
83,
466
22,2
9316
,159
2,20
13,
933
2010
50,5
6734
,112
3,78
012
,675
5,97
12,
212
491
3,26
830
,936
25,0
0392
85,
006
2011
59,9
3140
,638
3,60
215
,691
6,04
32,
395
512
3,13
636
,026
31,9
0076
53,
361
2012
71,7
2551
,905
4,06
315
,757
5,78
72,
426
553
2,80
843
,404
40,0
121,
236
2,15
720
1386
,504
70,8
503,
560
12,0
945,
552
2,42
858
02,
544
55,6
2853
,719
916
993
2014
101,
136
85,9
573,
065
12,1
145,
381
2,50
359
12,
287
65,5
3063
,991
624
915
Not
e: C
ompo
nent
s m
ay n
ot a
dd to
the
tota
l bec
ause
of r
ound
ing.

187LONG-TERM MUTUAL FUNDS
Data Section 3
TABLE 15Liquid Assets and Liquidity Ratio of Long-Term Mutual FundsYear-end
Year
Liquid assetsMillions of dollars
Liquidity ratio*Percent
TotalEquityfunds
Hybridfunds
Bondfunds Total
Equityfunds
Hybridfunds
Bondfunds
1984 $12,181 $7,295 $878 $4,007 8.9% 9.1% 7.9% 8.7%1985 20,593 10,452 1,413 8,728 8.2 9.4 8.0 7.11986 30,611 14,612 2,514 13,485 7.2 9.5 9.8 5.51987 37,930 16,319 2,730 18,881 8.4 9.3 9.3 7.61988 44,980 17,742 2,986 24,252 9.5 9.4 11.3 9.51989 44,603 25,602 5,747 13,253 8.1 10.4 16.1 4.91990 48,440 27,344 4,198 16,899 8.5 11.4 11.7 5.81991 60,385 30,657 3,309 26,419 7.1 7.6 6.4 6.71992 73,984 42,417 6,560 25,007 6.7 8.3 8.5 5.01993 99,436 57,539 16,613 25,284 6.6 7.8 11.7 4.11994 120,430 70,885 19,929 29,616 7.8 8.3 12.3 5.61995 141,755 97,743 19,271 24,741 6.9 7.8 9.3 4.11996 151,988 107,667 17,954 26,367 5.8 6.2 7.2 4.11997 198,826 145,565 24,645 28,616 5.8 6.1 7.9 3.91998 191,393 143,516 25,289 22,588 4.6 4.8 7.0 2.71999 219,098 174,692 20,979 23,427 4.2 4.3 5.6 2.92000 277,164 225,023 26,798 25,343 5.4 5.7 7.4 3.12001 222,475 170,361 26,911 25,203 4.7 5.0 7.5 2.72002 208,939 120,500 25,423 63,016 5.1 4.6 7.6 5.52003 259,641 154,877 30,654 74,110 4.8 4.2 6.8 5.92004 307,111 184,140 36,419 86,552 5.0 4.2 6.6 6.72005 303,189 190,906 43,133 69,150 4.4 3.9 6.9 5.12006 346,768 218,670 57,461 70,637 4.3 3.7 7.9 4.72007 381,679 266,285 56,813 58,581 4.3 4.2 6.9 3.52008 296,540 185,536 52,712 58,291 5.1 5.1 9.4 3.72009 365,787 169,799 52,845 143,143 4.7 3.5 7.4 6.52010 330,295 192,757 61,013 76,525 3.7 3.4 7.3 3.02011 461,767 182,548 70,660 208,559 5.2 3.5 8.0 7.32012 515,396 200,436 99,570 215,390 5.0 3.4 9.7 6.42013 651,842 272,507 142,258 237,077 5.3 3.5 11.2 7.22014 725,615 291,691 148,623 285,301 5.5 3.5 11.0 8.2
* Liquidity ratio is the ratio of liquid assets divided by total net assets at year-end. Note: Data for funds that invest primarily in other mutual funds were excluded from the series. Components may not add to
the total because of rounding.

Data
Sec
tion
3
188 2015 INVESTMENT COMPANY FACT BOOK
TABL
E 16
Liqu
idity
Rat
io o
f Lon
g-Te
rm M
utua
l Fun
ds b
y Co
mpo
site
Inve
stm
ent O
bjec
tive
Perc
ent,
yea
r-en
d
Year
Equi
ty fu
nds
Hybr
id fu
nds
Bond
fund
s
Capi
tal
appr
ecia
tion
Wor
ld
Tota
l ret
urn
Inve
stm
ent
grad
eHi
gh y
ield
W
orld
Go
vern
men
t M
ultis
ecto
rSt
ate
mun
i Na
tiona
l mun
i
2000
6.1%
7.7%
4.9%
7.4%
4.5%
9.1%
-2.2
%-2
.8%
-2.2
%3.
1%3.
5%20
014.
96.
24.
87.
53.
37.
7-3
.7-0
.50.
62.
33.
220
024.
95.
74.
17.
610
.77.
9-2
.50.
5-1
.02.
64.
220
033.
75.
84.
16.
89.
76.
13.
31.
77.
12.
23.
720
043.
65.
54.
26.
68.
96.
16.
13.
87.
52.
96.
520
053.
35.
23.
76.
96.
55.
26.
11.
26.
22.
55.
720
063.
44.
33.
77.
96.
94.
912
.5-4
.12.
22.
04.
520
074.
35.
23.
66.
92.
34.
617
.0-0
.82.
81.
84.
620
086.
16.
14.
29.
41.
110
.713
.04.
43.
71.
74.
920
094.
53.
92.
87.
46.
85.
413
.64.
06.
62.
86.
020
103.
54.
42.
97.
30.
35.
816
.5-2
.52.
72.
15.
220
113.
84.
52.
88.
07.
27.
217
.50.
95.
23.
16.
620
123.
64.
02.
99.
75.
45.
615
.22.
86.
93.
46.
220
133.
64.
53.
011
.26.
84.
317
.31.
07.
02.
06.
520
143.
34.
92.
911
.07.
44.
419
.42.
58.
03.
67.
6
Not
e: L
iqui
dity
rat
io is
the
ratio
of l
iqui
d as
sets
div
ided
by
tota
l net
ass
ets
at y
ear-
end.
Dat
a fo
r fun
ds th
at in
vest
prim
arily
in o
ther
mut
ual f
unds
wer
e ex
clud
ed fr
om th
e se
ries.

LONG-TERM MUTUAL FUNDS
Data Section 3
189
TABLE 17Net New Cash Flow* of Long-Term Mutual FundsMillions of dollars, annual
Year Total Equity funds Hybrid funds Bond funds
1984 $19,194 $4,336 $1,801 $13,0581985 73,490 6,643 3,720 63,1271986 129,991 20,386 6,988 102,6181987 29,776 19,231 3,748 6,7971988 -23,119 -14,948 -3,684 -4,4881989 8,731 6,774 3,183 -1,2261990 21,211 12,915 1,463 6,8331991 106,213 39,888 7,067 59,2581992 171,696 78,983 21,725 70,9891993 242,049 127,260 42,619 72,1691994 75,160 114,525 21,998 -61,3621995 122,208 124,392 3,738 -5,9221996 231,874 216,937 11,795 3,1411997 272,030 227,106 15,757 29,1661998 241,796 156,875 10,265 74,6561999 169,780 187,565 -13,018 -4,7672000 228,874 315,711 -36,722 -50,1152001 129,188 33,439 7,285 88,4632002 120,583 -29,326 8,043 141,8652003 215,884 144,055 39,079 32,7502004 209,890 171,937 53,055 -15,1022005 192,016 123,967 42,754 25,2952006 227,078 147,773 19,857 59,4482007 224,321 73,328 40,384 110,6092008 -224,900 -229,407 -25,525 30,0322009 389,078 -1,952 19,792 371,2382010 243,222 -24,414 35,295 232,3422011 27,953 -129,263 39,549 117,6672012 198,441 -152,680 44,895 306,2262013 159,674 159,553 71,293 -71,1722014 96,090 25,216 27,346 43,528
* Net new cash flow is the dollar value of new sales minus redemptions combined with net exchanges. Note: Data for funds that invest primarily in other mutual funds were excluded from the series. Components many not add to the total because of rounding.
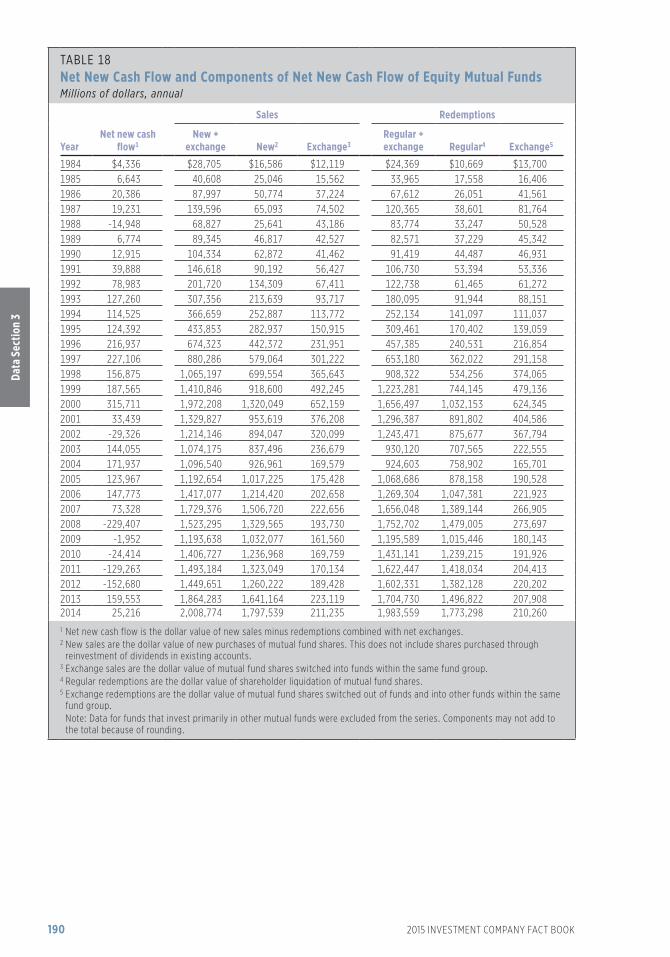
Data
Sec
tion
3
190 2015 INVESTMENT COMPANY FACT BOOK
TABLE 18Net New Cash Flow and Components of Net New Cash Flow of Equity Mutual Funds Millions of dollars, annual
YearNet new cash
flow1
Sales Redemptions
New + exchange New2 Exchange3
Regular + exchange Regular4 Exchange5
1984 $4,336 $28,705 $16,586 $12,119 $24,369 $10,669 $13,7001985 6,643 40,608 25,046 15,562 33,965 17,558 16,4061986 20,386 87,997 50,774 37,224 67,612 26,051 41,5611987 19,231 139,596 65,093 74,502 120,365 38,601 81,7641988 -14,948 68,827 25,641 43,186 83,774 33,247 50,5281989 6,774 89,345 46,817 42,527 82,571 37,229 45,3421990 12,915 104,334 62,872 41,462 91,419 44,487 46,9311991 39,888 146,618 90,192 56,427 106,730 53,394 53,3361992 78,983 201,720 134,309 67,411 122,738 61,465 61,2721993 127,260 307,356 213,639 93,717 180,095 91,944 88,1511994 114,525 366,659 252,887 113,772 252,134 141,097 111,0371995 124,392 433,853 282,937 150,915 309,461 170,402 139,0591996 216,937 674,323 442,372 231,951 457,385 240,531 216,8541997 227,106 880,286 579,064 301,222 653,180 362,022 291,1581998 156,875 1,065,197 699,554 365,643 908,322 534,256 374,0651999 187,565 1,410,846 918,600 492,245 1,223,281 744,145 479,1362000 315,711 1,972,208 1,320,049 652,159 1,656,497 1,032,153 624,3452001 33,439 1,329,827 953,619 376,208 1,296,387 891,802 404,5862002 -29,326 1,214,146 894,047 320,099 1,243,471 875,677 367,7942003 144,055 1,074,175 837,496 236,679 930,120 707,565 222,5552004 171,937 1,096,540 926,961 169,579 924,603 758,902 165,7012005 123,967 1,192,654 1,017,225 175,428 1,068,686 878,158 190,5282006 147,773 1,417,077 1,214,420 202,658 1,269,304 1,047,381 221,9232007 73,328 1,729,376 1,506,720 222,656 1,656,048 1,389,144 266,9052008 -229,407 1,523,295 1,329,565 193,730 1,752,702 1,479,005 273,6972009 -1,952 1,193,638 1,032,077 161,560 1,195,589 1,015,446 180,1432010 -24,414 1,406,727 1,236,968 169,759 1,431,141 1,239,215 191,9262011 -129,263 1,493,184 1,323,049 170,134 1,622,447 1,418,034 204,4132012 -152,680 1,449,651 1,260,222 189,428 1,602,331 1,382,128 220,2022013 159,553 1,864,283 1,641,164 223,119 1,704,730 1,496,822 207,9082014 25,216 2,008,774 1,797,539 211,235 1,983,559 1,773,298 210,2601 Net new cash flow is the dollar value of new sales minus redemptions combined with net exchanges. 2 New sales are the dollar value of new purchases of mutual fund shares. This does not include shares purchased through
reinvestment of dividends in existing accounts. 3 Exchange sales are the dollar value of mutual fund shares switched into funds within the same fund group. 4 Regular redemptions are the dollar value of shareholder liquidation of mutual fund shares. 5 Exchange redemptions are the dollar value of mutual fund shares switched out of funds and into other funds within the same
fund group. Note: Data for funds that invest primarily in other mutual funds were excluded from the series. Components may not add to
the total because of rounding.

LONG-TERM MUTUAL FUNDS
Data Section 3
191
TABLE 19Net New Cash Flow and Components of Net New Cash Flow of Hybrid Mutual Funds Millions of dollars, annual
YearNet new cash
flow1
Sales Redemptions
New + exchange New2 Exchange3
Regular + exchange Regular4 Exchange5
1984 $1,801 $4,118 $3,842 $276 $2,318 $2,017 $3011985 3,720 7,502 6,976 526 3,782 3,161 6211986 6,988 13,535 12,342 1,194 6,548 5,162 1,3861987 3,748 14,948 12,419 2,528 11,200 7,848 3,3531988 -3,684 6,259 4,601 1,658 9,943 7,521 2,4221989 3,183 11,139 9,334 1,805 7,956 5,780 2,1761990 1,463 9,671 7,989 1,682 8,208 5,600 2,6081991 7,067 16,860 13,754 3,106 9,793 7,011 2,7821992 21,725 32,772 26,463 6,309 11,047 7,209 3,8381993 42,619 60,610 49,526 11,083 17,990 11,735 6,2561994 21,998 58,541 49,043 9,498 36,544 25,298 11,2451995 3,738 43,024 35,385 7,640 39,286 27,807 11,4791996 11,795 56,783 47,436 9,347 44,988 31,413 13,5751997 15,757 68,347 55,264 13,084 52,590 38,265 14,3251998 10,265 82,691 67,294 15,397 72,426 53,353 19,0731999 -13,018 81,917 67,617 14,300 94,934 69,790 25,1452000 -36,722 70,445 56,973 13,473 107,167 77,219 29,9482001 7,285 83,546 65,634 17,912 76,260 58,850 17,4102002 8,043 93,685 75,664 18,021 85,642 67,407 18,2342003 39,079 115,929 96,811 19,117 76,849 63,329 13,5202004 53,055 143,463 125,438 18,025 90,407 77,520 12,8872005 42,754 144,267 126,616 17,651 101,513 86,199 15,3142006 19,857 146,088 127,532 18,555 126,231 106,066 20,1652007 40,384 206,415 183,482 22,933 166,031 144,066 21,9652008 -25,525 181,437 155,076 26,361 206,962 165,396 41,5662009 19,792 174,217 150,048 24,169 154,425 127,179 27,2462010 35,295 205,353 181,394 23,959 170,058 146,387 23,6722011 39,549 263,052 233,463 29,589 223,502 190,403 33,0992012 44,895 264,402 237,734 26,669 219,507 194,900 24,6072013 71,293 335,250 298,445 36,805 263,956 232,905 31,0522014 27,346 319,132 287,626 31,505 291,785 264,572 27,2131 Net new cash flow is the dollar value of new sales minus redemptions combined with net exchanges. 2 New sales are the dollar value of new purchases of mutual fund shares. This does not include shares purchased through
reinvestment of dividends in existing accounts. 3 Exchange sales are the dollar value of mutual fund shares switched into funds within the same fund group. 4 Regular redemptions are the dollar value of shareholder liquidation of mutual fund shares. 5 Exchange redemptions are the dollar value of mutual fund shares switched out of funds and into other funds within the same
fund group. Note: Data for funds that invest primarily in other mutual funds were excluded from the series. Components may not add to
the total because of rounding.

Data
Sec
tion
3
192 2015 INVESTMENT COMPANY FACT BOOK
TABLE 20 Net New Cash Flow and Components of Net New Cash Flow of Bond Mutual Funds Millions of dollars, annual
YearNet new cash
flow1
Sales Redemptions
New + exchange New2 Exchange3
Regular + exchange Regular4 Exchange5
1984 $13,058 $25,554 $20,774 $4,780 $12,497 $7,344 $5,1521985 63,127 83,359 74,485 8,874 20,232 13,094 7,1371986 102,618 158,874 138,240 20,634 56,256 35,776 20,4801987 6,797 123,528 93,725 29,803 116,731 69,627 47,1041988 -4,488 72,174 47,378 24,796 76,662 51,558 25,1031989 -1,226 71,770 48,602 23,168 72,996 48,517 24,4801990 6,833 80,659 57,106 23,552 73,826 47,978 25,8481991 59,258 141,674 108,095 33,580 82,416 56,177 26,2391992 70,989 217,863 171,991 45,872 146,874 96,628 50,2461993 72,169 262,300 208,605 53,696 190,131 127,294 62,8381994 -61,362 186,908 131,351 55,556 248,270 162,823 85,4481995 -5,922 166,437 110,451 55,986 172,359 114,686 57,6731996 3,141 203,343 137,886 65,457 200,201 125,486 74,7151997 29,166 242,309 176,275 66,034 213,143 140,906 72,2371998 74,656 314,429 230,934 83,495 239,773 160,071 79,7021999 -4,767 299,198 217,431 81,767 303,965 207,254 96,7112000 -50,115 250,918 187,188 63,730 301,033 220,868 80,1652001 88,463 394,211 301,477 92,733 305,748 226,197 79,5512002 141,865 515,028 402,020 113,009 373,163 285,070 88,0932003 32,750 520,683 428,553 92,130 487,934 376,840 111,0942004 -15,102 395,451 340,549 54,902 410,554 341,466 69,0882005 25,295 402,784 351,167 51,617 377,489 321,681 55,8082006 59,448 446,377 391,126 55,251 386,929 329,462 57,4672007 110,609 592,760 506,964 85,796 482,151 410,366 71,7852008 30,032 709,634 580,948 128,686 679,602 582,683 96,9192009 371,238 1,006,675 856,834 149,841 635,437 525,213 110,2242010 232,342 1,089,699 964,459 125,240 857,357 742,628 114,7292011 117,667 1,103,665 976,073 127,592 985,999 870,097 115,9012012 306,226 1,246,704 1,121,190 125,514 940,478 838,189 102,2892013 -71,172 1,307,940 1,158,804 149,136 1,379,112 1,190,747 188,3662014 43,528 1,278,294 1,174,227 104,068 1,234,766 1,137,937 96,829
1 Net new cash flow is the dollar value of new sales minus redemptions combined with net exchanges. 2 New sales are the dollar value of new purchases of mutual fund shares. This does not include shares purchased through
reinvestment of dividends in existing accounts. 3 Exchange sales are the dollar value of mutual fund shares switched into funds within the same fund group. 4 Regular redemptions are the dollar value of shareholder liquidation of mutual fund shares. 5 Exchange redemptions are the dollar value of mutual fund shares switched out of funds and into other funds within the same
fund group. Note: Data for funds that invest primarily in other mutual funds were excluded from the series. Components may not add to
the total because of rounding.
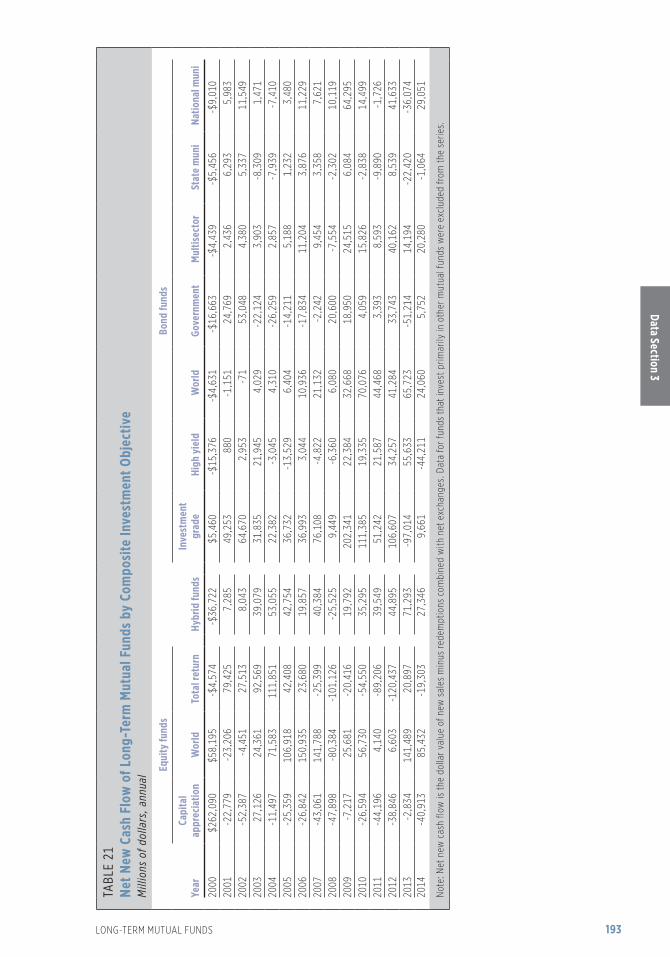
LONG-TERM MUTUAL FUNDS
Data Section 3
193
TABL
E 21
Net N
ew C
ash
Flow
of L
ong-
Term
Mut
ual F
unds
by
Com
posi
te In
vest
men
t Obj
ectiv
e
M
illio
ns o
f dol
lars
, ann
ual
Year
Equi
ty fu
nds
Hybr
id fu
nds
Bond
fund
s
Capi
tal
appr
ecia
tion
Wor
ld
Tota
l ret
urn
Inve
stm
ent
grad
e Hi
gh y
ield
W
orld
Go
vern
men
t M
ultis
ecto
rSt
ate
mun
i Na
tiona
l mun
i
2000
$262
,090
$58,
195
-$4,
574
-$36
,722
$5,4
60-$
15,3
76-$
4,63
1-$
16,6
63-$
4,43
9-$
5,45
6-$
9,01
020
01-2
2,77
9-2
3,20
679
,425
7,28
549
,253
880
-1,1
5124
,769
2,43
66,
293
5,98
320
02-5
2,38
7-4
,451
27,5
138,
043
64,6
702,
953
-71
53,0
484,
380
5,33
711
,549
2003
27,1
2624
,361
92,5
6939
,079
31,8
3521
,945
4,02
9-2
2,12
43,
903
-8,3
091,
471
2004
-11,
497
71,5
8311
1,85
153
,055
22,3
82-3
,045
4,31
0-2
6,25
92,
857
-7,9
39-7
,410
2005
-25,
359
106,
918
42,4
0842
,754
36,7
32-1
3,52
96,
404
-14,
211
5,18
81,
232
3,48
020
06-2
6,84
215
0,93
523
,680
19,8
5736
,993
3,04
410
,936
-17,
834
11,2
043,
876
11,2
2920
07-4
3,06
114
1,78
8-2
5,39
940
,384
76,1
08-4
,822
21,1
32-2
,242
9,45
43,
358
7,62
120
08-4
7,89
8-8
0,38
4-1
01,1
26-2
5,52
59,
449
-6,3
606,
080
20,6
00-7
,554
-2,3
0210
,119
2009
-7,2
1725
,681
-20,
416
19,7
9220
2,34
122
,384
32,6
6818
,950
24,5
156,
084
64,2
9520
10-2
6,59
456
,730
-54,
550
35,2
9511
1,38
519
,335
70,0
764,
059
15,8
26-2
,838
14,4
9920
11-4
4,19
64,
140
-89,
206
39,5
4951
,242
21,5
8744
,468
3,39
38,
593
-9,8
90-1
,726
2012
-38,
846
6,60
3-1
20,4
3744
,895
106,
607
34,2
5741
,284
33,7
4340
,162
8,53
941
,633
2013
-2,8
3414
1,48
920
,897
71,2
93-9
7,01
455
,633
65,7
23-5
1,21
414
,194
-22,
420
-36,
074
2014
-40,
913
85,4
32-1
9,30
327
,346
9,66
1-4
4,21
124
,060
5,75
220
,280
-1,0
6429
,051
Not
e: N
et n
ew c
ash
flow
is th
e do
llar v
alue
of n
ew s
ales
min
us re
dem
ptio
ns c
ombi
ned
with
net
exc
hang
es. D
ata
for f
unds
that
inve
st p
rimar
ily in
oth
er m
utua
l fun
ds w
ere
excl
uded
from
the
serie
s.

Data
Sec
tion
3
194 2015 INVESTMENT COMPANY FACT BOOK
TABL
E 22
New
Sal
es o
f Lon
g-Te
rm M
utua
l Fun
ds b
y Co
mpo
site
Inve
stm
ent O
bjec
tive
Mill
ions
of d
olla
rs, a
nnua
l
Year
Equi
ty fu
nds
Hybr
id fu
nds
Bond
fund
s
Capi
tal
appr
ecia
tion
Wor
ld
Tota
l ret
urn
Inve
stm
ent
grad
e Hi
gh y
ield
W
orld
Go
vern
men
t M
ultis
ecto
rSt
ate
mun
i Na
tiona
l mun
i
2000
$574
,322
$342
,511
$403
,217
$56,
973
$79,
200
$27,
405
$8,2
67$2
4,35
9$6
,787
$16,
989
$24,
180
2001
306,
550
251,
663
395,
407
65,6
3412
7,71
136
,277
8,94
858
,987
12,2
4525
,028
32,2
8220
0225
0,05
624
5,15
239
8,83
975
,664
172,
587
39,6
6510
,920
93,8
7415
,446
26,3
6043
,168
2003
250,
597
205,
236
381,
662
96,8
1118
6,66
165
,577
18,9
4671
,167
20,9
6820
,546
44,6
8820
0426
8,02
718
4,37
147
4,56
312
5,43
816
5,64
448
,346
18,1
3238
,512
18,5
4816
,820
34,5
4820
0526
3,54
223
9,62
051
4,06
312
6,61
617
1,63
042
,226
23,7
8632
,063
21,1
7221
,959
38,3
3120
0630
1,99
435
4,87
855
7,54
812
7,53
218
3,99
045
,724
29,0
2529
,690
30,1
4725
,566
46,9
8520
0736
8,27
347
9,18
065
9,26
718
3,48
224
7,21
455
,721
45,5
4634
,593
39,7
1829
,590
54,5
8220
0834
0,07
637
2,41
461
7,07
615
5,07
627
7,17
747
,425
53,5
6164
,527
37,7
1130
,562
69,9
8320
0927
3,32
428
4,15
447
4,60
015
0,04
842
6,74
370
,370
69,3
4090
,702
58,0
2928
,386
113,
264
2010
309,
473
379,
399
548,
096
181,
394
450,
179
96,1
6312
9,60
279
,464
71,2
7128
,530
109,
250
2011
340,
702
397,
965
584,
382
233,
463
448,
943
128,
890
138,
829
72,2
4076
,873
19,7
9790
,501
2012
335,
970
362,
512
561,
740
237,
734
490,
135
124,
107
131,
719
109,
826
106,
435
30,9
1212
8,05
820
1339
6,09
051
0,78
873
4,28
629
8,44
546
7,42
917
2,53
719
2,00
474
,507
116,
833
23,8
3311
1,66
120
1442
5,77
654
2,61
382
9,15
028
7,62
649
3,47
314
7,59
519
4,17
270
,546
128,
592
22,4
2311
7,42
5
Not
e: N
ew s
ales
are
the
dolla
r val
ue o
f new
pur
chas
es o
f mut
ual f
und
shar
es. T
his
does
not
incl
ude
shar
es p
urch
ased
thro
ugh
rein
vest
men
t of d
ivid
ends
in e
xist
ing
acco
unts
. Dat
a fo
r fun
ds th
at in
vest
prim
arily
in
oth
er m
utua
l fun
ds w
ere
excl
uded
from
the
serie
s.

LONG-TERM MUTUAL FUNDS
Data Section 3
195
TABL
E 23
Exch
ange
Sal
es o
f Lon
g-Te
rm M
utua
l Fun
ds b
y Co
mpo
site
Inve
stm
ent O
bjec
tive
Mill
ions
of d
olla
rs, a
nnua
l
Year
Equi
ty fu
nds
Hybr
id fu
nds
Bond
fund
s
Capi
tal
appr
ecia
tion
Wor
ld
Tota
l ret
urn
Inve
stm
ent
grad
e Hi
gh y
ield
W
orld
Go
vern
men
t M
ultis
ecto
rSt
ate
mun
i Na
tiona
l mun
i
2000
$343
,618
$169
,388
$139
,153
$13,
473
$16,
756
$10,
298
$3,0
11$1
5,82
9$1
,662
$5,3
04$1
0,87
020
0117
6,02
085
,824
114,
364
17,9
1232
,627
11,3
782,
057
24,7
792,
860
5,34
813
,686
2002
144,
274
71,0
8410
4,74
118
,021
39,4
5411
,201
2,37
337
,280
3,47
45,
625
13,6
0220
0394
,572
41,7
7710
0,33
019
,117
33,9
1717
,110
3,52
818
,355
4,71
34,
288
10,2
1820
0457
,575
27,6
3084
,373
18,0
2523
,666
8,94
42,
056
7,02
34,
330
2,75
06,
135
2005
55,7
8638
,396
81,2
4617
,651
20,8
337,
270
2,78
06,
575
4,74
22,
983
6,43
520
0664
,336
56,9
2681
,396
18,5
5521
,896
7,29
52,
740
5,97
27,
027
3,45
06,
869
2007
60,8
8468
,791
92,9
8122
,933
41,5
877,
931
4,63
010
,226
5,03
65,
706
10,6
8020
0858
,645
48,0
7987
,005
26,3
6150
,417
7,41
48,
506
27,4
9510
,048
7,03
917
,767
2009
44,8
9347
,195
69,4
7224
,169
76,5
0713
,182
7,97
618
,336
8,64
15,
161
20,0
3720
1041
,942
55,9
1671
,901
23,9
5958
,253
13,0
689,
482
14,5
1310
,792
3,85
215
,280
2011
48,3
9940
,005
81,7
3029
,589
59,2
1814
,814
10,8
0114
,323
10,7
563,
736
13,9
4420
1245
,112
47,4
7096
,846
26,6
6955
,238
13,4
079,
145
14,9
1212
,957
3,68
516
,171
2013
68,2
2644
,073
110,
820
36,8
0552
,690
18,9
6726
,824
13,3
2010
,305
4,90
022
,131
2014
61,4
0848
,129
101,
698
31,5
0546
,085
12,1
6710
,140
7,23
19,
738
3,60
015
,107
Not
e: E
xcha
nge
sale
s ar
e th
e do
llar v
alue
of m
utua
l fun
d sh
ares
sw
itche
d in
to fu
nds
with
in th
e sa
me
fund
gro
up. D
ata
for f
unds
that
inve
st p
rimar
ily in
oth
er m
utua
l fun
ds w
ere
excl
uded
from
the
serie
s.

Data
Sec
tion
3
196 2015 INVESTMENT COMPANY FACT BOOK
TABL
E 24
Rede
mpt
ions
of L
ong-
Term
Mut
ual F
unds
by
Com
posi
te In
vest
men
t Obj
ectiv
e
M
illio
ns o
f dol
lars
, ann
ual
Year
Equi
ty fu
nds
Hybr
id fu
nds
Bond
fund
s
Capi
tal
appr
ecia
tion
Wor
ld
Tota
l ret
urn
Inve
stm
ent
grad
e Hi
gh y
ield
W
orld
Go
vern
men
t M
ultis
ecto
rSt
ate
mun
i Na
tiona
l mun
i
2000
$367
,939
$288
,253
$375
,961
$77,
219
$71,
781
$37,
560
$11,
447
$35,
865
$10,
431
$21,
877
$31,
908
2001
307,
031
264,
414
320,
356
58,8
5087
,986
34,3
819,
538
37,9
3910
,367
18,5
8427
,401
2002
276,
869
243,
479
355,
328
67,4
0711
7,19
736
,207
11,3
8353
,918
12,0
4320
,889
33,4
3420
0322
2,87
718
3,74
330
0,94
563
,329
150,
032
47,3
5515
,501
79,4
3717
,372
25,7
0041
,443
2004
269,
656
122,
228
367,
018
77,5
2014
1,77
749
,051
13,8
1958
,824
15,5
5222
,817
39,6
2520
0527
4,03
614
8,06
545
6,05
786
,199
136,
146
52,2
5918
,358
43,9
1316
,059
20,4
5734
,488
2006
313,
742
223,
271
510,
369
106,
066
146,
821
42,4
6218
,602
43,9
7519
,707
21,6
9236
,205
2007
393,
843
347,
697
647,
604
144,
066
186,
051
57,1
6326
,374
38,8
5029
,139
25,8
3846
,949
2008
375,
619
424,
738
678,
648
165,
396
281,
433
51,0
1249
,556
59,7
8145
,632
32,2
0063
,070
2009
273,
761
258,
011
483,
675
127,
179
248,
411
51,3
3840
,278
69,9
2036
,083
22,7
6256
,421
2010
329,
476
317,
314
592,
425
146,
387
347,
313
79,9
0662
,812
74,2
3955
,858
29,1
0193
,398
2011
377,
196
382,
528
658,
310
190,
403
406,
914
108,
257
95,4
8069
,572
69,3
3328
,412
92,1
2820
1236
7,66
935
4,06
966
0,39
019
4,90
039
3,67
592
,111
91,9
8577
,394
70,4
1222
,815
89,7
9820
1340
1,61
437
3,69
572
1,51
423
2,90
552
9,94
012
1,68
314
0,87
811
7,15
810
1,52
440
,542
139,
022
2014
465,
178
458,
723
849,
397
264,
572
490,
685
186,
585
169,
917
63,7
9911
0,86
523
,917
92,1
68
Not
e: R
edem
ptio
ns a
re th
e do
llar v
alue
of s
hare
hold
er li
quid
atio
n of
mut
ual f
und
shar
es. D
ata
for f
unds
that
inve
st p
rimar
ily in
oth
er m
utua
l fun
ds w
ere
excl
uded
from
the
serie
s.

LONG-TERM MUTUAL FUNDS
Data Section 3
197
TABL
E 25
Exch
ange
Red
empt
ions
of L
ong-
Term
Mut
ual F
unds
by
Com
posi
te In
vest
men
t Obj
ectiv
e
M
illio
ns o
f dol
lars
, ann
ual
Year
Equi
ty fu
nds
Hybr
id fu
nds
Bond
fund
s
Capi
tal
appr
ecia
tion
Wor
ld
Tota
l ret
urn
Inve
stm
ent
grad
e Hi
gh y
ield
W
orld
Go
vern
men
t M
ultis
ecto
rSt
ate
mun
i Na
tiona
l mun
i
2000
$287
,910
$165
,451
$170
,983
$29,
948
$18,
715
$15,
519
$4,4
63$2
0,98
6$2
,457
$5,8
72$1
2,15
320
0119
8,31
796
,279
109,
990
17,4
1023
,098
12,3
932,
618
21,0
582,
301
5,49
912
,583
2002
169,
848
77,2
0812
0,73
818
,234
30,1
7411
,706
1,98
124
,188
2,49
85,
758
11,7
8720
0395
,166
38,9
1088
,479
13,5
2038
,711
13,3
872,
945
32,2
094,
407
7,44
311
,992
2004
67,4
4318
,190
80,0
6712
,887
25,1
5011
,284
2,05
912
,969
4,46
84,
692
8,46
720
0570
,651
23,0
3396
,844
15,3
1419
,585
10,7
661,
804
8,93
64,
666
3,25
36,
798
2006
79,4
3137
,597
104,
895
20,1
6522
,073
7,51
32,
227
9,52
16,
264
3,44
96,
420
2007
78,3
7658
,486
130,
043
21,9
6526
,641
11,3
112,
670
8,21
06,
161
6,09
910
,692
2008
71,0
0076
,138
126,
558
41,5
6636
,712
10,1
876,
432
11,6
429,
682
7,70
314
,562
2009
51,6
7447
,657
80,8
1227
,246
52,4
999,
830
4,37
120
,168
6,07
14,
702
12,5
8420
1048
,533
61,2
7182
,122
23,6
7249
,734
9,99
06,
195
15,6
7910
,379
6,11
916
,632
2011
56,1
0051
,303
97,0
0933
,099
50,0
0513
,860
9,68
113
,597
9,70
35,
011
14,0
4320
1252
,258
49,3
1011
8,63
424
,607
45,0
9011
,146
7,59
413
,601
8,81
73,
243
12,7
9720
1365
,536
39,6
7710
2,69
531
,052
87,1
9314
,188
12,2
2821
,882
11,4
2010
,611
30,8
4420
1462
,918
46,5
8810
0,75
427
,213
39,2
1217
,388
10,3
358,
225
7,18
63,
170
11,3
13
Not
e: E
xcha
nge
rede
mpt
ions
are
the
dolla
r val
ue o
f mut
ual f
und
shar
es s
witc
hed
out o
f fun
ds a
nd in
to o
ther
fund
s w
ithin
the
sam
e fu
nd g
roup
. Dat
a fo
r fun
ds th
at in
vest
prim
arily
in o
ther
mut
ual f
unds
wer
e ex
clud
ed fr
om th
e se
ries.

Data
Sec
tion
3
198 2015 INVESTMENT COMPANY FACT BOOK
TABLE 26Annual Redemption Rates of Long-Term Mutual FundsPercent
Year
Narrow redemption rate1 Broad redemption rate2
TotalEquityfunds
Hybridfunds
Bondfunds Total
Equityfunds
Hybridfunds
Bondfunds
1985 17.4% 18.4% 22.0% 15.5% 29.8% 35.6% 26.3% 24.0%1986 19.8 19.6 23.8 19.6 38.6 50.9 30.2 30.71987 26.5 23.4 28.5 28.3 56.7 73.0 40.7 47.51988 20.0 18.2 27.1 20.5 36.9 45.9 35.8 30.41989 17.9 17.1 18.7 18.4 31.9 38.0 25.7 27.71990 17.5 18.4 15.6 17.0 31.0 37.7 22.9 26.21991 16.4 16.6 15.9 16.4 28.1 33.1 22.2 24.11992 17.0 13.4 11.1 21.5 28.8 26.7 17.0 32.71993 17.8 14.7 10.7 22.6 29.9 28.7 16.4 33.81994 21.6 17.7 16.7 28.3 35.2 31.6 24.1 43.11995 17.4 16.2 15.1 20.3 28.9 29.4 21.3 30.41996 17.0 16.2 13.8 20.0 30.0 30.7 19.8 32.01997 17.9 17.7 13.7 20.4 30.5 31.9 18.8 30.91998 19.7 20.0 15.9 20.5 32.2 34.0 21.6 30.61999 21.7 21.2 19.0 25.1 34.5 34.9 25.8 36.82000 25.7 25.9 21.0 26.9 39.9 41.5 29.1 36.72001 24.0 24.3 16.4 25.7 34.2 35.4 21.2 34.72002 27.9 29.0 19.4 27.4 38.7 41.2 24.7 35.92003 24.2 22.5 16.2 31.4 31.5 29.5 19.6 40.62004 20.4 19.0 15.5 26.7 24.7 23.1 18.1 32.12005 19.7 19.0 14.7 24.2 23.7 23.2 17.3 28.42006 19.9 19.5 15.7 23.1 23.9 23.7 18.7 27.12007 22.9 22.7 18.6 25.8 27.1 27.0 21.4 30.42008 30.3 29.4 23.9 35.9 35.9 34.9 29.9 41.82009 24.6 23.9 19.9 27.8 29.3 28.1 24.1 33.62010 25.3 23.7 18.8 31.0 29.2 27.3 21.8 35.72011 27.6 26.2 22.1 32.0 31.5 30.0 25.9 36.32012 25.0 24.8 20.4 26.9 28.6 28.7 23.0 30.22013 25.8 21.8 20.3 35.7 29.5 24.9 23.0 41.32014 25.0 22.1 20.2 33.7 27.6 24.7 22.3 36.61 Narrow redemption rate is calculated by taking the sum of regular redemptions for the year as a percentage of average net
assets at the beginning and end of the period. 2 Broad redemption rate is calculated by taking the sum of regular redemptions and exchange redemptions for the year as a
percentage of average net assets at the beginning and end of the period. Note: Data for funds that invest primarily in other mutual funds were excluded from the series.

LONG-TERM MUTUAL FUNDS
Data Section 3
199
TABLE 27 Portfolio Holdings of Long-Term Mutual Funds and Percentage of Total Net AssetsYear-end
Year Total net assets
Common and preferred
stocksLong-term U.S.
government bondsCorporate
bondsMunicipal
bondsLiquid assets Other
Millions of dollars
1995 $2,058,275 $1,215,218 $259,107 $190,837 $245,331 $141,755 $6,0261996 2,623,994 1,718,203 264,972 238,003 245,183 151,988 5,6451997 3,409,315 2,358,258 282,272 292,770 266,324 198,826 10,8661998 4,173,531 3,004,185 286,592 389,213 292,395 191,393 9,7531999 5,233,193 4,059,429 293,565 388,472 267,426 219,098 5,2042000 5,119,386 3,910,200 309,752 348,928 269,334 277,164 4,0082001 4,689,603 3,424,533 379,740 371,436 289,651 222,475 1,7682002 4,118,402 2,687,962 481,639 417,475 320,477 208,939 1,9102003 5,362,460 3,761,038 504,757 502,000 331,986 259,641 3,0382004 6,194,101 4,489,609 537,297 533,250 318,354 307,111 8,4802005 6,864,553 5,055,105 612,795 549,982 330,945 303,189 12,5362006 8,059,704 6,024,800 644,734 668,282 359,163 346,768 15,9562007 8,914,408 6,609,155 749,427 784,015 369,055 381,679 21,0772008 5,770,655 3,733,992 705,030 676,685 336,878 296,540 21,5312009 7,796,729 5,090,646 849,809 1,021,925 451,151 365,787 17,4112010 9,029,066 5,869,016 1,084,703 1,258,351 479,665 330,295 7,0362011 8,940,472 5,506,875 1,185,969 1,318,712 506,841 461,767 -39,6922012 10,358,707 6,292,589 1,380,129 1,603,814 592,868 515,396 -26,0892013 12,316,444 8,217,587 1,208,087 1,730,118 512,483 651,842 -3,6732014 13,127,081 8,788,714 1,223,860 1,831,200 567,778 725,615 -10,086
Percent1995 100.0% 59.0% 12.6% 9.3% 11.9% 6.9% 0.3%1996 100.0 65.5 10.1 9.1 9.3 5.8 0.21997 100.0 69.2 8.3 8.6 7.8 5.8 0.31998 100.0 72.0 6.9 9.3 7.0 4.6 0.21999 100.0 77.6 5.6 7.4 5.1 4.2 0.12000 100.0 76.4 6.1 6.8 5.3 5.4 0.12001 100.0 73.0 8.1 7.9 6.2 4.7 0.02002 100.0 65.3 11.7 10.1 7.8 5.1 0.02003 100.0 70.1 9.4 9.4 6.2 4.8 0.12004 100.0 72.5 8.7 8.6 5.1 5.0 0.12005 100.0 73.6 8.9 8.0 4.8 4.4 0.22006 100.0 74.8 8.0 8.3 4.5 4.3 0.22007 100.0 74.1 8.4 8.8 4.1 4.3 0.22008 100.0 64.7 12.2 11.7 5.8 5.1 0.42009 100.0 65.3 10.9 13.1 5.8 4.7 0.22010 100.0 65.0 12.0 13.9 5.3 3.7 0.12011 100.0 61.6 13.3 14.7 5.7 5.2 -0.42012 100.0 60.7 13.3 15.5 5.7 5.0 -0.32013 100.0 66.7 9.8 14.0 4.2 5.3 0.02014 100.0 67.0 9.3 13.9 4.3 5.5 -0.1
Note: Data for funds that invest primarily in other mutual funds were excluded from the series. Components may not add to the total because of rounding.

Data
Sec
tion
3
200 2015 INVESTMENT COMPANY FACT BOOK
TABLE 28 Portfolio Holdings of Long-Term Mutual Funds as a Percentage of Total Net Assets by Type of Fund Year-end
YearTotal net
assets
Common and preferred
stocksLong-term U.S.
government bondsCorporate
bondsMunicipal
bondsLiquid assets Other
Total net assets
Millions of dollars
Equity funds2000 100.0% 93.7% 0.1% 0.4% 0.0% 5.7% 0.0% $3,934,4802001 100.0 94.3 0.1 0.5 0.0 5.0 0.0 3,392,3992002 100.0 94.2 0.4 0.8 0.0 4.6 0.0 2,642,4202003 100.0 95.0 0.2 0.5 0.0 4.2 0.0 3,653,3702004 100.0 95.2 0.1 0.4 0.0 4.2 0.1 4,342,5772005 100.0 95.5 0.1 0.4 0.0 3.9 0.1 4,885,4442006 100.0 95.6 0.1 0.4 0.0 3.8 0.1 5,832,5822007 100.0 95.2 0.1 0.4 0.0 4.2 0.2 6,413,2222008 100.0 93.9 0.2 0.5 0.0 5.1 0.3 3,637,4162009 100.0 95.8 0.1 0.5 0.0 3.5 0.1 4,872,5412010 100.0 95.7 0.2 0.5 0.0 3.4 0.1 5,596,6292011 100.0 95.6 0.3 0.6 0.0 3.5 0.0 5,212,9892012 100.0 95.6 0.3 0.6 0.0 3.4 0.0 5,938,7472013 100.0 95.6 0.2 0.6 0.0 3.5 0.0 7,762,7272014 100.0 95.6 0.2 0.6 0.0 3.5 0.1 8,314,314
Hybrid funds2000 100.0% 59.1% 13.4% 19.7% 0.3% 7.4% 0.1% $360,9162001 100.0 59.9 11.9 20.4 0.2 7.5 0.2 358,0272002 100.0 57.4 12.4 22.3 0.2 7.5 0.1 335,2762003 100.0 62.5 10.6 19.7 0.3 6.9 0.0 447,5702004 100.0 63.5 11.0 18.4 0.4 6.6 0.1 552,2502005 100.0 62.6 10.5 19.5 0.4 6.9 0.0 621,4792006 100.0 61.2 10.0 19.5 0.3 8.9 0.1 731,5032007 100.0 60.5 10.3 20.8 0.3 8.0 0.1 821,5222008 100.0 55.4 9.8 24.3 0.4 9.6 0.4 562,2622009 100.0 58.3 9.8 23.4 0.4 7.7 0.5 717,5802010 100.0 60.6 8.8 22.3 0.5 7.3 0.4 841,4152011 100.0 59.3 9.4 22.1 0.5 7.9 0.8 883,0562012 100.0 59.4 8.9 21.1 0.5 9.3 0.8 1,029,2572013 100.0 61.6 7.9 18.8 0.4 10.7 0.6 1,267,3292014 100.0 60.1 9.0 19.2 0.5 10.7 0.5 1,351,839
Bond funds2000 100.0% 1.4% 31.1% 31.5% 32.6% 3.1% 0.3% $823,9902001 100.0 1.1 35.5 29.9 30.8 2.7 0.0 939,1772002 100.0 0.6 37.6 28.1 28.0 5.5 0.0 1,140,7072003 100.0 0.8 35.8 31.3 26.2 5.8 0.1 1,261,5202004 100.0 0.8 36.2 31.7 24.2 6.6 0.4 1,299,2742005 100.0 0.8 39.6 30.0 23.9 5.1 0.6 1,357,6302006 100.0 0.8 37.4 33.5 23.6 4.3 0.5 1,495,6192007 100.0 1.0 38.9 35.0 21.6 3.0 0.6 1,679,6642008 100.0 0.6 40.8 33.2 21.2 3.6 0.5 1,570,9782009 100.0 0.8 34.8 37.4 20.1 6.5 0.4 2,206,6092010 100.0 0.9 38.2 40.0 18.1 3.0 -0.1 2,591,0222011 100.0 0.8 37.8 38.2 17.4 7.4 -1.7 2,844,4282012 100.0 0.9 37.0 39.5 17.1 6.5 -1.0 3,390,7042013 100.0 1.1 32.9 43.7 15.2 7.4 -0.4 3,286,3882014 100.0 1.2 31.3 43.8 16.1 8.4 -0.7 3,460,928
Note: Data for funds that invest primarily in other mutual funds were excluded from the series. Components may not add to the total because of rounding.

LONG-TERM MUTUAL FUNDS
Data Section 3
201
TABLE 29 Paid and Reinvested Dividends of Long-Term Mutual Funds by Type of Fund Millions of dollars, annual
Year
Paid dividends Reinvested dividends
TotalEquityfunds
Hybridfunds
Bondfunds Total
Equityfunds
Hybridfunds
Bondfunds
1984e $7,238 $2,613 $583 $4,042 $4,655 $1,881 $432 $2,3421985 12,719 3,229 1,098 8,392 7,731 2,321 768 4,6421986 22,689 6,328 1,499 14,862 13,991 3,706 1,087 9,1971987 31,708 7,246 1,934 22,528 18,976 4,841 1,476 12,6591988 31,966 6,554 1,873 23,539 17,494 4,476 1,217 11,8011989 34,102 10,235 2,165 21,702 20,584 7,119 1,383 12,0821990 33,156 8,787 2,350 22,018 21,124 6,721 1,717 12,6861991 35,145 9,007 2,337 23,801 24,300 7,255 1,898 15,1471992 58,608 17,023 4,483 37,102 30,393 8,845 2,923 18,6251993 73,178 20,230 6,810 46,137 38,116 12,174 4,239 21,7031994 61,261 17,279 6,662 37,320 39,136 12,971 4,907 21,2581995 67,229 22,567 8,856 35,806 46,635 18,286 6,792 21,5581996 73,282 25,061 9,580 38,642 53,213 21,345 8,031 23,8371997 79,522 27,597 11,319 40,606 58,423 23,100 9,413 25,9101998 81,011 25,495 11,104 44,413 60,041 22,377 9,328 28,3361999 95,443 32,543 12,441 50,458 69,973 27,332 10,544 32,0962000 88,215 27,042 10,848 50,325 66,277 23,786 9,537 32,9542001 82,967 21,390 10,361 51,216 62,306 19,251 9,270 33,7862002 82,065 20,472 9,740 51,853 62,413 18,560 8,778 35,0762003 85,926 24,359 9,920 51,648 66,870 22,127 8,840 35,9032004 98,131 34,708 12,186 51,237 78,253 31,427 10,668 36,1582005 115,502 42,413 16,691 56,397 94,024 38,435 14,579 41,0112006 143,500 60,112 19,134 64,254 119,074 54,210 16,989 47,8752007 181,014 77,563 25,058 78,393 151,777 69,596 22,092 60,0902008 181,608 70,086 26,032 85,490 152,632 63,166 23,045 66,4212009 168,019 58,877 22,213 86,930 140,359 53,098 19,388 67,8732010 180,988 62,196 23,276 95,516 152,329 56,385 20,670 75,2752011 202,444 68,706 29,024 104,714 172,873 62,460 25,691 84,7222012 215,277 83,226 24,919 107,131 187,063 76,208 22,663 88,1922013 209,357 84,509 24,066 100,782 184,380 78,082 22,007 84,2912014 235,474 99,578 29,768 106,128 210,925 92,461 27,526 90,938
e Portions of the paid dividend totals for equity, hybrid, and bond funds are estimated; the total is not estimated. Note: Data for funds that invest primarily in other mutual funds were excluded from the series. Components may not add to
the total because of rounding.

Data
Sec
tion
3
202 2015 INVESTMENT COMPANY FACT BOOK
TABLE 30 Paid and Reinvested Capital Gains of Long-Term Mutual Funds by Type of Fund Millions of dollars, annual
Year
Paid capital gains Reinvested capital gains
TotalEquityfunds
Hybridfunds
Bondfunds Total
Equityfunds
Hybridfunds
Bondfunds
1984e $6,019 $5,247 $553 $219 $5,122 $4,655 $338 $1291985 4,895 3,699 739 457 3,751 3,091 398 2611986 17,661 13,942 1,240 2,478 14,275 11,851 778 1,6461987 22,926 18,603 1,605 2,718 17,816 15,449 1,056 1,3121988 6,354 4,785 620 948 4,769 3,883 364 5221989 14,766 12,665 540 1,562 9,710 8,744 348 6171990 8,017 6,833 443 742 5,515 4,975 255 2851991 13,917 11,961 861 1,095 9,303 8,242 484 5771992 22,089 17,294 1,488 3,306 14,906 12,233 1,130 1,5421993 35,905 27,705 3,496 4,704 25,514 19,954 2,687 2,8721994 29,744 26,351 2,399 993 24,864 22,038 2,086 7401995 54,271 50,204 3,322 745 46,866 43,550 2,832 4841996 100,489 88,212 10,826 1,451 87,416 76,638 9,769 1,0091997 182,764 160,744 19,080 2,941 164,916 145,358 17,360 2,1981998 164,989 138,681 21,572 4,737 151,105 127,473 19,698 3,9351999 237,624 219,484 16,841 1,299 206,508 190,300 15,229 9792000 325,841 305,994 18,645 1,202 298,429 279,891 17,506 1,0322001 68,626 60,088 6,105 2,433 64,820 56,965 5,790 2,0652002 16,097 10,538 907 4,651 14,749 9,838 887 4,0242003 14,397 7,782 758 5,857 12,956 7,188 703 5,0652004 54,741 41,581 6,600 6,560 49,896 38,074 6,167 5,6552005 129,058 113,167 11,895 3,995 117,566 103,208 10,955 3,4032006 256,915 235,853 18,720 2,342 236,465 217,010 17,509 1,9462007 413,641 377,682 32,163 3,795 380,921 347,633 30,011 3,2772008 132,404 110,883 9,786 11,735 123,272 103,801 9,064 10,4072009 15,300 5,740 771 8,789 13,994 5,418 702 7,8742010 42,950 15,739 1,290 25,921 38,961 14,785 1,199 22,9772011 73,247 51,455 5,466 16,326 68,223 48,128 5,239 14,8552012 100,174 66,771 5,552 27,851 93,812 62,879 5,322 25,6112013 239,003 201,806 22,646 14,552 227,685 191,985 21,954 13,7462014 397,942 344,483 40,139 13,320 380,556 328,738 39,181 12,637
e Portions of the paid capital gains totals for equity, hybrid, and bond funds are estimated; the total is not estimated. Note: Data for funds that invest primarily in other mutual funds were excluded from the series. Components may not add to
the total because of rounding.

LONG-TERM MUTUAL FUNDS
Data Section 3
203
TABL
E 31
To
tal P
ortf
olio
, Com
mon
Sto
ck, a
nd O
ther
Sec
uriti
es: P
urch
ases
, Sal
es, a
nd N
et P
urch
ases
by
Long
-Ter
m M
utua
l Fun
ds
Mill
ions
of d
olla
rs, a
nnua
l
Year
Tota
l por
tfol
ioCo
mm
on st
ock
Othe
r sec
uriti
es
Purc
hase
sSa
les
Net p
urch
ases
Purc
hase
sSa
les
Net p
urch
ases
Purc
hase
sSa
les
Net p
urch
ases
1984
$119
,273
$98,
934
$20,
338
$56,
588
$50,
900
$5,6
88$6
2,68
5$4
8,03
5$1
4,65
019
8525
9,49
618
6,98
572
,511
80,7
1972
,577
8,14
217
8,77
711
4,40
864
,369
1986
500,
597
365,
087
135,
509
134,
446
118,
026
16,4
2136
6,15
024
7,06
211
9,08
919
8753
0,60
148
5,27
145
,330
198,
859
176,
004
22,8
5533
1,74
130
9,26
722
,474
1988
410,
509
421,
223
-10,
713
112,
742
128,
815
-16,
073
297,
767
292,
407
5,35
9
1989
471,
744
445,
453
26,2
9114
2,77
114
1,69
41,
077
328,
973
303,
759
25,2
1419
9055
4,72
050
5,78
048
,940
166,
398
146,
580
19,8
1738
8,32
235
9,19
929
,123
1991
735,
698
608,
129
127,
569
250,
289
209,
276
41,0
1348
5,40
939
8,85
386
,556
1992
949,
404
758,
476
190,
928
327,
518
261,
857
65,6
6162
1,88
649
6,61
912
5,26
819
931,
335,
514
1,06
0,35
927
5,15
550
6,71
338
0,85
512
5,85
882
8,80
167
9,50
414
9,29
819
941,
433,
739
1,32
9,32
910
4,40
962
8,66
851
2,34
611
6,32
180
5,07
181
6,98
3-1
1,91
219
951,
550,
510
1,40
0,70
214
9,80
979
0,01
768
6,75
610
3,26
076
0,49
471
3,94
646
,548
1996
2,01
8,25
31,
736,
884
281,
370
1,15
1,26
292
7,26
622
3,99
686
6,99
180
9,61
857
,373
1997
2,38
4,63
92,
108,
981
275,
659
1,45
7,38
41,
268,
983
188,
401
927,
255
839,
997
87,2
5819
982,
861,
562
2,56
0,07
430
1,48
71,
762,
565
1,59
7,31
116
5,25
51,
098,
997
962,
764
136,
233
1999
3,43
7,18
03,
224,
301
212,
878
2,26
2,50
52,
088,
544
173,
962
1,17
4,67
41,
135,
757
38,9
1720
004,
922,
927
4,69
8,19
222
4,73
43,
560,
671
3,33
0,41
723
0,25
41,
362,
255
1,36
7,77
5-5
,519
2001
4,68
8,53
04,
393,
114
295,
416
2,73
6,93
32,
609,
657
127,
275
1,95
1,59
71,
783,
456
168,
141
2002
4,01
8,96
93,
807,
392
211,
578
2,17
6,36
32,
141,
754
34,6
091,
842,
606
1,66
5,63
817
6,96
820
034,
281,
605
3,99
8,76
628
2,84
02,
054,
379
1,88
4,71
116
9,66
72,
227,
227
2,11
4,05
411
3,17
320
044,
310,
180
4,01
9,27
329
0,90
72,
390,
924
2,19
8,57
819
2,34
61,
919,
256
1,82
0,69
598
,561
2005
4,83
4,37
44,
532,
166
302,
208
2,76
5,10
02,
610,
805
154,
296
2,06
9,27
41,
921,
362
147,
912
2006
5,73
7,36
35,
398,
108
339,
255
3,33
0,05
73,
172,
222
157,
835
2,40
7,30
62,
225,
886
181,
420
2007
7,09
8,61
16,
721,
251
377,
360
3,83
5,57
43,
733,
130
102,
444
3,26
3,03
72,
988,
121
274,
916
2008
7,35
3,05
07,
294,
533
58,5
183,
655,
854
3,71
5,55
7-5
9,70
33,
697,
197
3,57
8,97
611
8,22
120
096,
933,
548
6,45
3,77
947
9,76
92,
644,
973
2,54
3,51
110
1,46
24,
288,
575
3,91
0,26
837
8,30
620
107,
334,
591
6,86
5,62
246
8,96
92,
810,
540
2,75
1,73
758
,804
4,52
4,05
14,
113,
885
410,
166
2011
8,53
0,90
18,
125,
258
405,
643
3,03
2,24
73,
032,
854
-607
5,49
8,65
35,
092,
403
406,
250
2012
8,18
8,57
77,
602,
772
585,
805
2,77
0,63
12,
825,
999
-55,
368
5,41
7,94
64,
776,
773
641,
173
2013
9,22
5,64
68,
707,
219
518,
427
3,40
3,95
03,
221,
274
182,
675
5,82
1,69
75,
485,
945
335,
752
2014
8,49
7,67
57,
941,
490
556,
185
3,51
5,10
03,
440,
319
74,7
814,
982,
575
4,50
1,17
048
1,40
4
Not
e: D
ata
for f
unds
that
inve
st p
rimar
ily in
oth
er m
utua
l fun
ds w
ere
excl
uded
from
the
serie
s. C
ompo
nent
s m
ay n
ot a
dd to
the
tota
l bec
ause
of r
ound
ing.

Data
Sec
tion
3
204 2015 INVESTMENT COMPANY FACT BOOK
TABL
E 32
Tota
l Por
tfol
io, C
omm
on S
tock
, and
Oth
er S
ecur
ities
: Pur
chas
es, S
ales
, and
Net
Pur
chas
es b
y Eq
uity
Mut
ual F
unds
M
illio
ns o
f dol
lars
, ann
ual
Year
Tota
l por
tfol
ioCo
mm
on st
ock
Othe
r sec
uriti
es
Purc
hase
sSa
les
Net p
urch
ases
Purc
hase
sSa
les
Net p
urch
ases
Purc
hase
sSa
les
Net p
urch
ases
1984
$54,
933
$49,
853
$5,0
80$4
9,09
8$4
4,21
3$4
,885
$5,8
35$5
,640
$195
1985
77,3
2770
,685
6,64
266
,762
61,5
995,
163
10,5
659,
086
1,47
919
8612
9,72
311
1,23
318
,491
110,
016
96,5
1213
,504
19,7
0814
,721
4,98
719
8719
6,90
217
5,29
221
,611
170,
715
150,
705
20,0
0926
,188
24,5
861,
601
1988
119,
861
130,
821
-10,
959
100,
888
113,
635
-12,
747
18,9
7317
,186
1,78
8
1989
148,
346
144,
753
3,59
312
8,99
812
7,02
61,
973
19,3
4817
,728
1,62
119
9018
7,59
216
9,37
318
,219
151,
907
133,
630
18,2
7735
,685
35,7
43-5
919
9125
1,77
320
7,94
743
,827
224,
117
186,
785
37,3
3327
,656
21,1
626,
494
1992
339,
003
268,
868
70,1
3530
0,71
224
2,31
958
,393
38,2
9126
,549
11,7
4219
9350
0,20
638
2,43
311
7,77
345
1,48
534
5,35
710
6,12
848
,720
37,0
7611
,644
1994
618,
004
508,
394
109,
610
564,
380
456,
708
107,
672
53,6
2351
,686
1,93
719
9578
5,86
767
8,06
010
7,80
771
8,29
862
1,69
996
,599
67,5
6956
,361
11,2
0819
961,
116,
906
896,
644
220,
262
1,05
0,88
483
2,48
621
8,39
766
,022
64,1
571,
865
1997
1,42
1,21
11,
223,
463
197,
748
1,35
2,08
51,
166,
649
185,
436
69,1
2656
,814
12,3
1219
981,
723,
752
1,55
7,21
216
6,54
01,
635,
842
1,47
5,38
416
0,45
887
,909
81,8
276,
082
1999
2,23
2,82
82,
049,
540
183,
288
2,12
6,86
01,
941,
505
185,
355
105,
968
108,
035
-2,0
6720
003,
515,
572
3,25
8,63
525
6,93
73,
393,
017
3,14
4,11
624
8,90
212
2,55
411
4,51
98,
035
2001
2,70
7,35
92,
593,
454
113,
905
2,57
1,18
22,
464,
587
106,
595
136,
177
128,
867
7,31
020
022,
140,
797
2,11
2,75
928
,039
2,01
7,84
71,
999,
827
18,0
2012
2,95
011
2,93
110
,019
2003
1,96
5,41
91,
822,
753
142,
666
1,90
2,71
81,
758,
142
144,
576
62,7
0164
,611
-1,9
1020
042,
278,
755
2,11
0,60
516
8,15
02,
216,
948
2,05
3,65
216
3,29
661
,807
56,9
534,
854
2005
2,67
1,17
02,
524,
339
146,
831
2,59
2,05
92,
452,
257
139,
803
79,1
1072
,083
7,02
820
063,
231,
135
3,06
3,82
216
7,31
33,
129,
822
2,96
6,14
316
3,67
910
1,31
397
,679
3,63
420
073,
760,
234
3,65
8,39
510
1,83
83,
582,
758
3,49
0,17
492
,584
177,
476
168,
221
9,25
520
083,
628,
276
3,69
8,25
5-6
9,97
93,
361,
901
3,42
6,44
2-6
4,54
026
6,37
527
1,81
3-5
,439
2009
2,74
9,91
32,
676,
641
73,2
732,
433,
267
2,33
9,18
194
,086
316,
646
337,
459
-20,
813
2010
2,82
8,78
12,
828,
824
-44
2,56
8,44
32,
532,
634
35,8
0926
0,33
829
6,19
1-3
5,85
320
112,
914,
926
2,94
3,14
4-2
8,21
82,
756,
061
2,78
5,48
2-2
9,42
115
8,86
515
7,66
21,
203
2012
2,63
9,80
62,
696,
126
-56,
321
2,49
9,40
12,
571,
677
-72,
276
140,
405
124,
449
15,9
5520
133,
178,
949
2,99
3,41
718
5,53
13,
043,
749
2,87
7,08
216
6,66
713
5,20
011
6,33
518
,864
2014
3,30
1,05
23,
191,
092
109,
960
3,12
0,61
93,
033,
152
87,4
6718
0,43
315
7,93
922
,493
Not
e: D
ata
for f
unds
that
inve
st p
rimar
ily in
oth
er m
utua
l fun
ds w
ere
excl
uded
from
the
serie
s. C
ompo
nent
s m
ay n
ot a
dd to
the
tota
l bec
ause
of r
ound
ing.

LONG-TERM MUTUAL FUNDS
Data Section 3
205
TABL
E 33
To
tal P
ortf
olio
, Com
mon
Sto
ck, a
nd O
ther
Sec
uriti
es: P
urch
ases
, Sal
es, a
nd N
et P
urch
ases
by
Hybr
id M
utua
l Fun
ds
Mill
ions
of d
olla
rs, a
nnua
l
Year
Tota
l por
tfol
ioCo
mm
on st
ock
Othe
r sec
uriti
es
Purc
hase
sSa
les
Net p
urch
ases
Purc
hase
sSa
les
Net p
urch
ases
Purc
hase
sSa
les
Net p
urch
ases
1984
$11,
589
$9,2
58$2
,331
$7,1
29$5
,822
$1,3
08$4
,459
$3,4
36$1
,023
1985
19,6
4714
,915
4,73
213
,378
10,5
132,
865
6,26
94,
402
1,86
719
8634
,746
28,0
076,
739
21,8
9419
,451
2,44
312
,853
8,55
64,
297
1987
48,3
3544
,168
4,16
826
,282
23,9
892,
293
22,0
5320
,179
1,87
419
8828
,070
31,4
55-3
,384
10,6
2813
,833
-3,2
0517
,442
17,6
22-1
79
1989
26,7
4724
,864
1,88
312
,459
13,5
98-1
,139
14,2
8811
,266
3,02
219
9030
,606
26,6
713,
935
13,3
2711
,832
1,49
417
,279
14,8
392,
440
1991
41,9
9933
,747
8,25
218
,657
15,4
353,
222
23,3
4218
,313
5,02
919
9263
,564
43,1
3120
,433
23,9
6517
,200
6,76
539
,599
25,9
3113
,667
1993
113,
314
72,1
5041
,164
49,6
8630
,485
19,2
0163
,628
41,6
6521
,963
1994
134,
972
110,
305
24,6
6754
,808
46,4
298,
380
80,1
6363
,876
16,2
8719
9518
0,63
817
0,86
49,
774
67,6
1660
,602
7,01
511
3,02
111
0,26
22,
759
1996
223,
905
201,
872
22,0
3392
,485
88,4
644,
021
131,
420
113,
408
18,0
1119
9725
5,20
723
4,82
020
,387
98,1
0994
,976
3,13
215
7,09
913
9,84
417
,255
1998
282,
651
257,
096
25,5
5511
5,70
311
1,40
14,
301
166,
948
145,
694
21,2
5419
9929
6,23
529
6,85
0-6
1512
8,30
313
8,92
3-1
0,62
016
7,93
215
7,92
710
,005
2000
308,
821
335,
531
-26,
711
158,
039
174,
998
-16,
960
150,
782
160,
533
-9,7
5120
0135
7,55
733
4,16
123
,396
155,
235
134,
368
20,8
6820
2,32
219
9,79
42,
528
2002
340,
650
320,
591
20,0
5914
5,37
012
9,20
416
,166
195,
280
191,
387
3,89
320
0336
0,65
331
2,11
148
,542
137,
490
113,
785
23,7
0622
3,16
319
8,32
624
,837
2004
404,
955
337,
219
67,7
3616
3,79
513
2,96
630
,829
241,
160
204,
253
36,9
0720
0539
7,69
534
6,26
051
,435
165,
487
150,
166
15,3
2123
2,20
819
6,09
436
,114
2006
408,
861
381,
376
27,4
8519
1,74
019
7,12
0-5
,380
217,
122
184,
256
32,8
6520
0752
9,06
146
5,04
964
,011
241,
633
230,
855
10,7
7828
7,42
823
4,19
453
,233
2008
594,
156
577,
635
16,5
2128
1,81
427
3,65
58,
159
312,
342
303,
980
8,36
320
0947
7,00
644
3,13
133
,876
200,
907
194,
826
6,08
127
6,09
924
8,30
527
,794
2010
510,
872
462,
374
48,4
9822
4,17
320
3,83
220
,341
286,
699
258,
542
28,1
5720
1165
7,75
659
4,46
763
,288
253,
328
228,
267
25,0
6140
4,42
836
6,20
138
,227
2012
716,
429
655,
957
60,4
7125
0,87
623
5,39
315
,483
465,
552
420,
564
44,9
8820
1388
2,47
380
3,24
079
,233
339,
260
322,
777
16,4
8354
3,21
248
0,46
362
,749
2014
902,
977
838,
052
64,9
2636
4,00
737
9,40
0-1
5,39
453
8,97
145
8,65
180
,320
Not
e: D
ata
for f
unds
that
inve
st p
rimar
ily in
oth
er m
utua
l fun
ds w
ere
excl
uded
from
the
serie
s. C
ompo
nent
s m
ay n
ot a
dd to
the
tota
l bec
ause
of r
ound
ing.
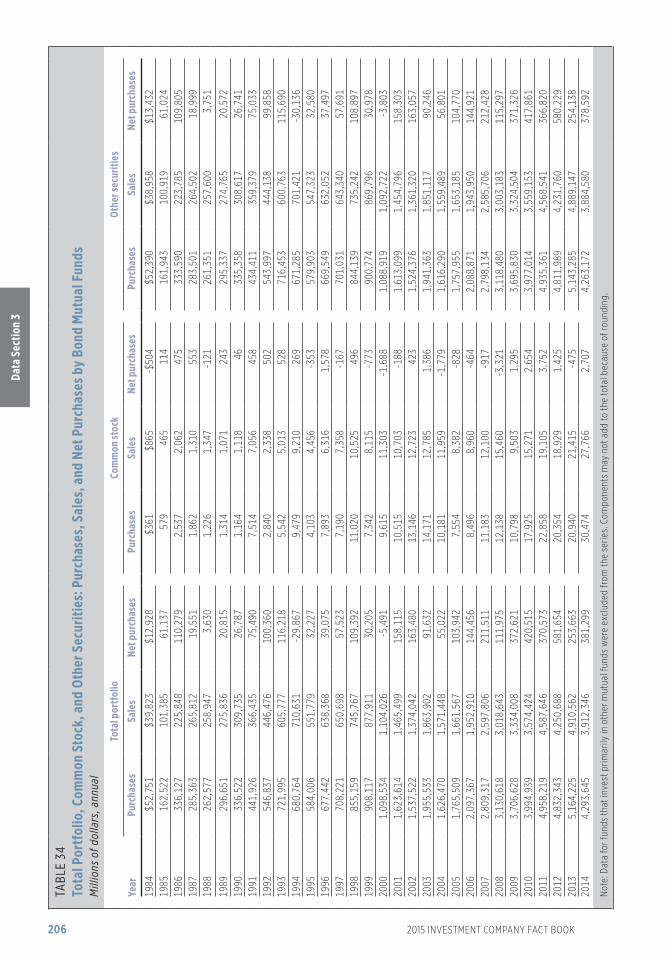
Data
Sec
tion
3
206 2015 INVESTMENT COMPANY FACT BOOK
TABL
E 34
To
tal P
ortf
olio
, Com
mon
Sto
ck, a
nd O
ther
Sec
uriti
es: P
urch
ases
, Sal
es, a
nd N
et P
urch
ases
by
Bond
Mut
ual F
unds
M
illio
ns o
f dol
lars
, ann
ual
Year
Tota
l por
tfol
ioCo
mm
on st
ock
Othe
r sec
uriti
es
Purc
hase
sSa
les
Net p
urch
ases
Purc
hase
sSa
les
Net p
urch
ases
Purc
hase
sSa
les
Net p
urch
ases
1984
$52,
751
$39,
823
$12,
928
$361
$865
-$50
4$5
2,39
0$3
8,95
8$1
3,43
219
8516
2,52
210
1,38
561
,137
579
465
114
161,
943
100,
919
61,0
2419
8633
6,12
722
5,84
811
0,27
92,
537
2,06
247
533
3,59
022
3,78
510
9,80
519
8728
5,36
326
5,81
219
,551
1,86
21,
310
553
283,
501
264,
502
18,9
9919
8826
2,57
725
8,94
73,
630
1,22
61,
347
-121
261,
351
257,
600
3,75
1
1989
296,
651
275,
836
20,8
151,
314
1,07
124
329
5,33
727
4,76
520
,572
1990
336,
522
309,
735
26,7
871,
164
1,11
846
335,
358
308,
617
26,7
4119
9144
1,92
636
6,43
575
,490
7,51
47,
056
458
434,
411
359,
379
75,0
3319
9254
6,83
744
6,47
610
0,36
02,
840
2,33
850
254
3,99
744
4,13
899
,858
1993
721,
995
605,
777
116,
218
5,54
25,
013
528
716,
453
600,
763
115,
690
1994
680,
764
710,
631
-29,
867
9,47
99,
210
269
671,
285
701,
421
-30,
136
1995
584,
006
551,
779
32,2
274,
103
4,45
6-3
5357
9,90
354
7,32
332
,580
1996
677,
442
638,
368
39,0
757,
893
6,31
61,
578
669,
549
632,
052
37,4
9719
9770
8,22
165
0,69
857
,523
7,19
07,
358
-167
701,
031
643,
340
57,6
9119
9885
5,15
974
5,76
710
9,39
211
,020
10,5
2549
684
4,13
973
5,24
210
8,89
719
9990
8,11
787
7,91
130
,205
7,34
28,
115
-773
900,
774
869,
796
30,9
7820
001,
098,
534
1,10
4,02
6-5
,491
9,61
511
,303
-1,6
881,
088,
919
1,09
2,72
2-3
,803
2001
1,62
3,61
41,
465,
499
158,
115
10,5
1510
,703
-188
1,61
3,09
91,
454,
796
158,
303
2002
1,53
7,52
21,
374,
042
163,
480
13,1
4612
,723
423
1,52
4,37
61,
361,
320
163,
057
2003
1,95
5,53
31,
863,
902
91,6
3214
,171
12,7
851,
386
1,94
1,36
31,
851,
117
90,2
4620
041,
626,
470
1,57
1,44
855
,022
10,1
8111
,959
-1,7
791,
616,
290
1,55
9,48
956
,801
2005
1,76
5,50
91,
661,
567
103,
942
7,55
48,
382
-828
1,75
7,95
51,
653,
185
104,
770
2006
2,09
7,36
71,
952,
910
144,
456
8,49
68,
960
-464
2,08
8,87
11,
943,
950
144,
921
2007
2,80
9,31
72,
597,
806
211,
511
11,1
8312
,100
-917
2,79
8,13
42,
585,
706
212,
428
2008
3,13
0,61
83,
018,
643
111,
975
12,1
3815
,460
-3,3
213,
118,
480
3,00
3,18
311
5,29
720
093,
706,
628
3,33
4,00
837
2,62
110
,798
9,50
31,
295
3,69
5,83
03,
324,
504
371,
326
2010
3,99
4,93
93,
574,
424
420,
515
17,9
2515
,271
2,65
43,
977,
014
3,55
9,15
341
7,86
120
114,
958,
219
4,58
7,64
637
0,57
322
,858
19,1
053,
752
4,93
5,36
14,
568,
541
366,
820
2012
4,83
2,34
34,
250,
688
581,
654
20,3
5418
,929
1,42
54,
811,
989
4,23
1,76
058
0,22
920
135,
164,
225
4,91
0,56
225
3,66
320
,940
21,4
15-4
755,
143,
285
4,88
9,14
725
4,13
820
144,
293,
645
3,91
2,34
638
1,29
930
,474
27,7
662,
707
4,26
3,17
23,
884,
580
378,
592
Not
e: D
ata
for f
unds
that
inve
st p
rimar
ily in
oth
er m
utua
l fun
ds w
ere
excl
uded
from
the
serie
s. C
ompo
nent
s m
ay n
ot a
dd to
the
tota
l bec
ause
of r
ound
ing.

207
Data Section 4
MONEY MARKET FUNDS
TABL
E 35
M
oney
Mar
ket F
unds
: Tot
al N
et A
sset
s, N
umbe
r of F
unds
, and
Num
ber o
f Sha
re C
lass
es b
y Ty
pe o
f Fun
d
Ye
ar-e
nd
Year
Tota
l net
ass
ets
Mill
ions
of d
olla
rsNu
mbe
r of f
unds
Num
ber o
f sha
re cl
asse
s
Tota
lTa
xabl
eTa
x-
exem
ptTo
tal
Taxa
ble
Tax-
ex
empt
Tota
lTa
xabl
eTa
x-
exem
ptGo
vern
men
tPr
ime
Gove
rnm
ent
Prim
eGo
vern
men
tPr
ime
1984
$233
,554
$51,
800
$157
,951
$23,
802
425
158
173
9442
515
817
394
1985
243,
802
55,7
0515
1,84
936
,249
460
151
199
110
460
151
199
110
1986
292,
152
63,7
3616
4,61
063
,806
487
147
213
127
487
147
213
127
1987
316,
096
67,5
8918
7,08
761
,420
543
154
235
154
543
154
235
154
1988
337,
954
61,2
9821
0,89
765
,758
610
159
274
177
610
159
274
177
1989
428,
093
74,6
8528
3,93
969
,470
673
160
310
203
673
160
310
203
1990
498,
341
109,
376
305,
189
83,7
7774
117
632
923
676
218
333
924
019
9154
2,44
213
8,11
131
4,34
689
,984
820
211
341
268
871
228
363
280
1992
546,
194
151,
043
300,
310
94,8
4186
423
535
027
991
424
836
829
819
9356
5,31
914
9,18
031
2,70
110
3,43
992
026
536
229
31,
009
286
386
337
1994
611,
005
148,
139
352,
972
109,
894
963
276
373
314
1,26
136
849
040
319
9575
3,01
818
1,49
444
9,82
912
1,69
599
728
439
232
11,
380
404
549
427
1996
901,
807
223,
790
540,
146
137,
871
988
277
392
319
1,45
341
359
244
819
971,
058,
886
254,
223
647,
005
157,
658
1,01
327
940
632
81,
549
442
633
474
1998
1,35
1,67
831
2,90
785
4,06
118
4,71
11,
026
277
410
339
1,62
746
267
549
019
991,
613,
146
333,
726
1,07
9,52
319
9,89
71,
045
281
423
341
1,73
048
874
250
020
001,
845,
248
367,
780
1,24
3,59
823
3,86
91,
039
275
429
335
1,85
553
479
752
420
012,
285,
310
461,
631
1,56
4,59
825
9,08
11,
015
269
421
325
1,94
857
383
254
320
022,
265,
075
453,
157
1,53
5,62
127
6,29
798
825
941
831
12,
006
581
882
543
2003
2,04
0,02
241
0,04
11,
339,
689
290,
291
973
251
409
313
2,03
157
289
056
920
041,
901,
700
379,
706
1,20
9,99
531
1,99
994
424
039
930
52,
053
577
900
576
2005
2,02
6,82
239
9,33
01,
291,
119
336,
373
870
221
372
277
2,03
157
089
456
720
062,
338,
451
426,
838
1,54
2,58
436
9,02
984
721
535
827
42,
013
579
875
559
2007
3,08
5,76
076
0,38
91,
857,
280
468,
092
805
203
342
260
2,01
557
487
356
820
083,
832,
236
1,49
0,20
81,
848,
349
493,
680
783
200
334
249
1,99
058
485
954
720
093,
315,
893
1,10
7,03
51,
809,
923
398,
935
704
180
296
228
1,84
656
176
951
620
102,
803,
922
855,
021
1,61
8,89
633
0,00
665
216
527
721
01,
781
544
737
500
2011
2,69
1,42
297
0,07
51,
429,
650
291,
697
632
166
265
201
1,73
054
471
147
520
122,
693,
523
928,
749
1,47
7,34
728
7,42
658
015
824
218
01,
623
519
655
449
2013
2,71
8,33
296
2,00
91,
485,
711
270,
612
555
152
230
173
1,57
150
863
343
020
142,
725,
260
1,01
0,78
31,
453,
690
260,
787
528
148
217
163
1,50
751
258
940
6
Not
e: D
ata
for f
unds
that
inve
st p
rimar
ily in
oth
er m
utua
l fun
ds w
ere
excl
uded
from
the
serie
s. C
ompo
nent
s m
ay n
ot a
dd to
the
tota
l bec
ause
of r
ound
ing.

Data
Sec
tion
4
208 2015 INVESTMENT COMPANY FACT BOOK
TABL
E 36
To
tal N
et A
sset
s of
Mon
ey M
arke
t Fun
ds b
y Ty
pe o
f Fun
dM
illio
ns o
f dol
lars
, yea
r-en
d
Year
All m
oney
mar
ket f
unds
Reta
il m
oney
mar
ket f
unds
Inst
itutio
nal m
oney
mar
ket f
unds
Tota
lTa
xabl
eTa
x-
exem
ptTo
tal
Taxa
ble
Tax-
ex
empt
Tota
lTa
xabl
eTa
x-
exem
ptGo
vern
men
tPr
ime
Gove
rnm
ent
Prim
eGo
vern
men
tPr
ime
1996
$901
,807
$223
,790
$540
,146
$137
,871
$592
,604
$94,
786
$387
,705
$110
,113
$309
,203
$129
,003
$152
,441
$27,
758
1997
1,05
8,88
625
4,22
364
7,00
515
7,65
866
3,40
810
0,99
143
9,67
012
2,74
739
5,47
815
3,23
220
7,33
434
,911
1998
1,35
1,67
831
2,90
785
4,06
118
4,71
183
5,25
512
1,66
457
1,46
514
2,12
651
6,42
319
1,24
328
2,59
642
,585
1999
1,61
3,14
633
3,72
61,
079,
523
199,
897
964,
686
132,
915
675,
986
155,
785
648,
460
200,
812
403,
537
44,1
1120
001,
845,
248
367,
780
1,24
3,59
823
3,86
91,
061,
605
151,
837
731,
051
178,
716
783,
644
215,
943
512,
547
55,1
5420
012,
285,
310
461,
631
1,56
4,59
825
9,08
11,
134,
703
169,
883
775,
335
189,
484
1,15
0,60
729
1,74
878
9,26
369
,597
2002
2,26
5,07
545
3,15
71,
535,
621
276,
297
1,06
4,41
815
7,01
171
5,38
319
2,02
51,
200,
657
296,
146
820,
238
84,2
7220
032,
040,
022
410,
041
1,33
9,68
929
0,29
193
8,41
314
1,24
860
6,55
319
0,61
21,
101,
608
268,
793
733,
136
99,6
7920
041,
901,
700
379,
706
1,20
9,99
531
1,99
985
2,50
212
6,47
353
4,23
419
1,79
41,
049,
199
253,
233
675,
761
120,
205
2005
2,02
6,82
239
9,33
01,
291,
119
336,
373
875,
933
126,
244
546,
283
203,
406
1,15
0,88
827
3,08
574
4,83
613
2,96
820
062,
338,
451
426,
838
1,54
2,58
436
9,02
91,
007,
853
140,
483
643,
327
224,
043
1,33
0,59
828
6,35
489
9,25
814
4,98
620
073,
085,
760
760,
389
1,85
7,28
046
8,09
21,
225,
493
185,
526
754,
378
285,
590
1,86
0,26
757
4,86
31,
102,
902
182,
503
2008
3,83
2,23
61,
490,
208
1,84
8,34
949
3,68
01,
369,
819
289,
731
776,
876
303,
212
2,46
2,41
71,
200,
476
1,07
1,47
419
0,46
720
093,
315,
893
1,10
7,03
51,
809,
923
398,
935
1,07
9,95
921
4,47
863
0,09
823
5,38
32,
235,
935
892,
556
1,17
9,82
516
3,55
320
102,
803,
922
855,
021
1,61
8,89
633
0,00
695
7,87
118
9,69
456
2,20
320
5,97
51,
846,
051
665,
327
1,05
6,69
312
4,03
120
112,
691,
422
970,
075
1,42
9,65
029
1,69
794
9,89
220
3,67
754
9,76
419
6,45
11,
741,
530
766,
398
879,
885
95,2
4720
122,
693,
523
928,
749
1,47
7,34
728
7,42
694
8,57
520
5,51
354
0,08
620
2,97
51,
744,
948
723,
236
937,
261
84,4
5120
132,
718,
332
962,
009
1,48
5,71
127
0,61
293
6,13
620
5,05
653
4,81
819
6,26
21,
782,
197
756,
954
950,
893
74,3
5020
142,
725,
260
1,01
0,78
31,
453,
690
260,
787
905,
123
199,
533
515,
587
190,
003
1,82
0,13
781
1,25
093
8,10
370
,784
Not
e: D
ata
for f
unds
that
inve
st p
rimar
ily in
oth
er m
utua
l fun
ds w
ere
excl
uded
from
the
serie
s. C
ompo
nent
s m
ay n
ot a
dd to
the
tota
l bec
ause
of r
ound
ing.

Data Section 4
MONEY MARKET FUNDS 209
TABL
E 37
Ne
t New
Cas
h Fl
ow*
of M
oney
Mar
ket F
unds
by
Type
of F
und
M
illio
ns o
f dol
lars
, ann
ual
Year
All m
oney
mar
ket f
unds
Reta
il m
oney
mar
ket f
unds
Inst
itutio
nal m
oney
mar
ket f
unds
Tota
lTa
xabl
eTa
x-
exem
ptTo
tal
Taxa
ble
Tax-
ex
empt
Tota
lTa
xabl
eTa
x-
exem
ptGo
vern
men
tPr
ime
Gove
rnm
ent
Prim
eGo
vern
men
tPr
ime
1996
$89,
422
$20,
572
$58,
935
$9,9
15$5
2,88
6$6
,181
$39,
505
$7,2
00$3
6,53
6$1
4,39
1$1
9,43
0$2
,715
1997
103,
466
20,1
2969
,107
14,2
3146
,620
4,78
132
,081
9,75
856
,846
15,3
4737
,026
4,47
319
9823
5,45
745
,178
167,
909
22,3
7013
0,99
215
,835
100,
428
14,7
2810
4,46
529
,343
67,4
817,
642
1999
193,
681
8,48
617
4,95
710
,238
82,0
06-7
5772
,935
9,82
711
1,67
59,
243
102,
021
411
2000
159,
365
14,4
1211
8,35
426
,599
43,5
7250
424
,413
18,6
5511
5,79
313
,908
93,9
417,
944
2001
375,
291
86,6
2126
7,32
921
,340
36,3
2813
,579
12,7
0610
,043
338,
963
73,0
4325
4,62
311
,297
2002
-45,
937
-11,
131
-51,
060
16,2
54-8
0,17
5-1
0,17
4-7
1,32
91,
328
34,2
38-9
5720
,269
14,9
2520
03-2
63,4
03-5
0,99
8-2
22,1
799,
774
-151
,113
-20,
609
-125
,596
-4,9
08-1
12,2
90-3
0,38
9-9
6,58
314
,682
2004
-156
,744
-36,
125
-139
,213
18,5
93-8
8,67
9-1
5,87
1-7
5,24
12,
433
-68,
065
-20,
254
-63,
971
16,1
6020
0562
,085
13,1
8228
,009
20,8
952,
494
-3,6
52-4
,645
10,7
9159
,591
16,8
3432
,654
10,1
0320
0624
5,16
219
,615
200,
115
25,4
3296
,345
9,31
770
,870
16,1
5714
8,81
810
,297
129,
245
9,27
620
0765
4,41
231
9,24
025
1,21
983
,953
172,
550
38,7
6983
,156
50,6
2448
1,86
228
0,47
116
8,06
233
,329
2008
637,
155
697,
443
-73,
523
13,2
3511
4,11
298
,267
2,08
213
,763
523,
043
599,
176
-75,
605
-528
2009
-539
,150
-414
,948
-28,
571
-95,
631
-308
,374
-104
,057
-136
,412
-67,
906
-230
,776
-310
,892
107,
841
-27,
725
2010
-524
,658
-253
,927
-201
,359
-69,
372
-124
,114
-25,
964
-69,
745
-28,
404
-400
,544
-227
,962
-131
,613
-40,
968
2011
-123
,961
107,
294
-192
,601
-38,
654
-1,3
0420
,461
-12,
500
-9,2
65-1
22,6
5786
,833
-180
,101
-29,
389
2012
-336
-43,
343
46,9
37-3
,930
-1,1
45-7
81-7
,552
7,18
780
9-4
2,56
354
,489
-11,
117
2013
15,2
0729
,348
2,64
3-1
6,78
4-1
2,19
2-1
,143
-4,2
57-6
,792
27,3
9930
,491
6,90
0-9
,993
2014
6,33
848
,232
-31,
787
-10,
107
-30,
511
-5,8
43-1
8,18
2-6
,486
36,8
4954
,075
-13,
604
-3,6
21
* Net
new
cas
h flo
w is
the
dolla
r val
ue o
f new
sal
es m
inus
rede
mpt
ions
com
bine
d w
ith n
et e
xcha
nges
.
Not
e: D
ata
for f
unds
that
inve
st p
rimar
ily in
oth
er m
utua
l fun
ds w
ere
excl
uded
from
the
serie
s. C
ompo
nent
s m
ay n
ot a
dd to
the
tota
l bec
ause
of r
ound
ing.

Data
Sec
tion
4
210 2015 INVESTMENT COMPANY FACT BOOK
TABLE 38 Net New Cash Flow and Components of Net New Cash Flow of Money Market Funds Millions of dollars, annual
YearNet new
cash flow1
Sales Redemptions
New + exchange New2 Exchange3
Regular + exchange Regular4 Exchange5
1984 $35,077 $640,021 $620,536 $19,485 $604,944 $586,990 $17,9531985 -5,293 848,451 826,858 21,592 853,743 831,067 22,6761986 33,552 1,026,745 978,041 48,704 993,193 948,656 44,5371987 10,072 1,147,877 1,049,034 98,843 1,137,805 1,062,671 75,1331988 106 1,130,639 1,066,003 64,636 1,130,534 1,074,346 56,1881989 64,132 1,359,616 1,296,458 63,158 1,295,484 1,235,527 59,9571990 23,179 1,461,537 1,389,439 72,098 1,438,358 1,372,764 65,5941991 6,068 1,841,131 1,778,491 62,640 1,835,063 1,763,106 71,9571992 -16,006 2,449,766 2,371,925 77,841 2,465,772 2,382,976 82,7961993 -13,890 2,756,282 2,665,987 90,295 2,770,172 2,673,464 96,7071994 8,525 2,725,201 2,586,478 138,722 2,716,675 2,599,400 117,2751995 89,381 3,234,216 3,097,225 136,990 3,144,834 3,001,968 142,8661996 89,422 4,156,985 3,959,014 197,971 4,067,563 3,868,772 198,7911997 103,466 5,127,328 4,894,226 233,102 5,023,863 4,783,096 240,7671998 235,457 6,407,574 6,129,140 278,434 6,172,116 5,901,590 270,5261999 193,681 8,080,959 7,719,310 361,649 7,887,278 7,540,912 346,3672000 159,365 9,826,677 9,406,287 420,391 9,667,312 9,256,350 410,9622001 375,291 11,737,291 11,426,804 310,487 11,362,000 11,065,468 296,5332002 -45,937 12,008,801 11,712,587 296,215 12,054,738 11,783,209 271,5302003 -263,403 11,177,118 10,952,544 224,574 11,440,521 11,213,929 226,5922004 -156,744 10,874,608 10,708,117 166,492 11,031,353 10,861,076 170,2772005 62,085 12,493,636 12,317,491 176,145 12,431,551 12,260,771 170,7792006 245,162 15,706,879 15,495,624 211,255 15,461,717 15,269,074 192,6432007 654,412 21,314,339 21,039,253 275,086 20,659,927 20,408,620 251,3072008 637,155 24,452,430 24,067,371 385,059 23,815,275 23,498,612 316,6632009 -539,150 18,683,752 18,489,354 194,399 19,222,902 19,012,387 210,5162010 -524,658 15,771,387 15,670,167 101,220 16,296,045 16,191,487 104,5582011 -123,961 15,248,942 15,128,198 120,744 15,372,904 15,259,802 113,1022012 -336 14,292,019 14,211,602 80,417 14,292,356 14,205,334 87,0212013 15,207 14,977,938 14,869,310 108,629 14,962,732 14,858,963 103,7692014 6,338 15,318,896 15,240,222 78,674 15,312,557 15,213,502 99,0551 Net new cash flow is the dollar value of new sales minus redemptions combined with net exchanges. 2 New sales are the dollar value of new purchases of mutual fund shares. This does not include shares purchased through
reinvestment of dividends in existing accounts. 3 Exchange sales are the dollar value of mutual fund shares switched into funds within the same fund group. 4 Regular redemptions are the dollar value of shareholder liquidation of mutual fund shares. 5 Exchange redemptions are the dollar value of mutual fund shares switched out of funds and into other funds within the same
fund group. Note: Data for funds that invest primarily in other mutual funds were excluded from the series. Components may not add to the
total because of rounding.

Data Section 4
MONEY MARKET FUNDS 211
TABLE 39 Paid and Reinvested Dividends of Money Market Funds by Type of Fund Millions of dollars, annual
Year
Paid dividends Reinvested dividends
Total
Taxable money market
funds
Tax-exempt money market
funds Total
Taxable money market
funds
Tax-exempt money market
funds
1984 $16,435 $15,435 $1,000 $13,730 $13,061 $6691985 15,708 14,108 1,600 12,758 11,760 9981986 14,832 12,432 2,400 11,514 9,981 1,5331987 15,654 12,833 2,821 11,946 10,136 1,8101988 21,618 17,976 3,642 15,692 13,355 2,3371989 28,619 24,683 3,936 23,050 20,294 2,7561990 30,258 26,448 3,810 26,282 23,226 3,0561991 28,604 25,121 3,483 22,809 19,998 2,8111992 20,280 17,197 3,083 14,596 12,567 2,0291993 18,991 15,690 3,302 11,615 10,007 1,6071994 23,737 20,504 3,233 16,739 14,626 2,1131995 37,038 32,855 4,183 27,985 24,873 3,1111996 42,555 38,446 4,108 31,516 28,448 3,0681997 48,843 44,185 4,658 37,979 34,425 3,5541998 57,375 52,164 5,211 43,443 39,580 3,8631999 69,004 63,229 5,775 50,648 46,602 4,0462000 98,219 90,158 8,061 72,771 66,890 5,8812001 79,307 73,361 5,946 56,367 51,949 4,4182002 32,251 29,397 2,854 22,033 19,940 2,0932003 17,041 15,124 1,917 11,314 9,916 1,3982004 18,390 15,899 2,491 11,889 10,080 1,8092005 50,186 43,547 6,638 32,803 27,951 4,8522006 96,423 85,018 11,405 61,488 53,268 8,2202007 127,907 113,177 14,730 82,457 71,938 10,5192008 93,857 82,727 11,130 61,134 53,455 7,6802009 18,619 16,590 2,030 11,035 9,999 1,0372010 7,161 6,708 453 4,447 4,196 2522011 5,237 4,888 349 3,261 3,074 1872012 6,618 6,345 273 4,212 4,068 1442013 8,020 7,794 226 5,206 5,089 1172014 7,565 7,323 242 5,000 4,876 124
Note: Data for funds that invest primarily in other mutual funds were excluded from the series. Components may not add to the total because of rounding.

Data
Sec
tion
4
212 2015 INVESTMENT COMPANY FACT BOOK
TABL
E 40
Asse
t Com
posi
tion
of T
axab
le G
over
nmen
t Mon
ey M
arke
t Fun
ds a
s a
Perc
enta
ge o
f Tot
al N
et A
sset
s
Year
-end
Year
Tota
l net
ass
ets
Mill
ions
of d
olla
rs
U.S.
Tr
easu
ry
bills
Othe
r Tr
easu
ry
secu
ritie
s
U.S.
gov
ernm
ent
agen
cy is
sues
Repu
rcha
se
agre
emen
tsCe
rtifi
cate
s of
depo
sit
Euro
dolla
r CDs
Com
mer
cial
pa
per
Bank
no
tes1
Corp
orat
e no
tes2
Othe
r as
sets
3
Aver
age
mat
urity
D
ays
1984
$51,
800
21.0
%7.
5%20
.4%
33.9
%4.
3%4.
3%7.
3%–
–
1.
3%46
1985
55,7
0523
.94.
915
.938
.22.
96.
36.
21.
644
1986
63,7
3622
.87.
914
.439
.14.
14.
94.
3–
–
2.
551
1987
67,5
894.
611
.222
.044
.94.
87.
44.
0–
–
1.
135
1988
61,2
985.
09.
720
.558
.41.
20.
13.
2–
–
2.
028
1989
74,6
855.
06.
920
.662
.70.
20.
13.
0–
–
1.
531
1990
109,
376
11.1
12.2
20.6
45.7
0.0
0.0
0.3
–
–
9.9
4619
9113
8,11
121
.516
.520
.340
.90.
00.
00.
4–
–
0.
358
1992
151,
043
26.0
16.5
21.6
34.7
0.0
0.0
0.5
–
–
0.6
5519
9314
9,18
030
.314
.120
.732
.80.
00.
00.
3–
–
1.
861
1994
148,
139
24.4
12.6
26.3
34.0
0.0
0.0
0.4
0.0%
–
2.2
3719
9518
1,49
419
.813
.928
.534
.10.
00.
00.
50.
0–
3.
148
1996
223,
790
17.7
18.5
25.4
35.2
0.0
0.1
0.7
0.0
–
2.4
4919
9725
4,22
315
.217
.625
.137
.80.
10.
01.
20.
1–
2.
950
1998
312,
907
14.3
17.7
30.4
33.4
0.3
0.0
1.7
0.1
0.2%
2.0
5219
9933
3,72
617
.113
.037
.128
.20.
10.
01.
40.
11.
11.
948
2000
367,
780
14.2
10.1
32.0
37.9
0.0
0.0
1.6
0.1
1.2
2.9
4520
0146
1,63
119
.29.
234
.531
.70.
20.
00.
50.
01.
53.
355
2002
453,
157
20.5
6.4
33.2
35.5
0.1
0.0
0.5
0.0
1.7
2.1
5220
0341
0,04
120
.07.
233
.836
.30.
30.
00.
90.
01.
8-0
.352
2004
379,
706
21.4
4.9
34.5
35.9
0.2
0.0
0.9
0.1
0.8
1.2
3620
0539
9,33
015
.84.
428
.150
.00.
00.
00.
20.
10.
80.
527
2006
426,
838
14.9
4.1
21.5
58.6
0.1
0.0
0.5
0.0
0.1
0.3
3220
0776
0,38
916
.35.
124
.153
.70.
30.
00.
20.
00.
00.
231
2008
1,49
0,20
830
.56.
236
.226
.80.
00.
00.
10.
10.
2-0
.148
2009
1,10
7,03
525
.66.
035
.430
.60.
00.
01.
00.
20.
30.
747
2010
855,
021
22.9
8.5
33.3
33.0
0.0
0.0
0.9
0.1
0.4
0.9
4720
1197
0,07
523
.213
.228
.931
.60.
00.
01.
00.
10.
41.
545
2012
928,
749
25.6
12.6
26.7
33.0
0.0
0.0
0.7
0.0
0.1
1.4
4620
1396
2,00
927
.114
.329
.427
.90.
00.
00.
30.
00.
10.
848
2014
1,01
0,78
321
.213
.531
.334
.70.
10.
00.
50.
00.
1-1
.244
1 Prio
r to
1994
, ban
k no
tes
are
incl
uded
in o
ther
ass
ets.
2 Prio
r to
1998
, cor
pora
te n
otes
are
incl
uded
in o
ther
ass
ets.
3 O
ther
ass
ets
incl
ude
bank
er’s
acce
ptan
ces,
mun
icip
al s
ecur
ities
, and
cas
h re
serv
es.
Not
e: D
ata
for f
unds
that
inve
st p
rimar
ily in
oth
er m
utua
l fun
ds w
ere
excl
uded
from
the
serie
s. C
ompo
nent
s m
ay n
ot a
dd to
100
per
cent
bec
ause
of r
ound
ing.
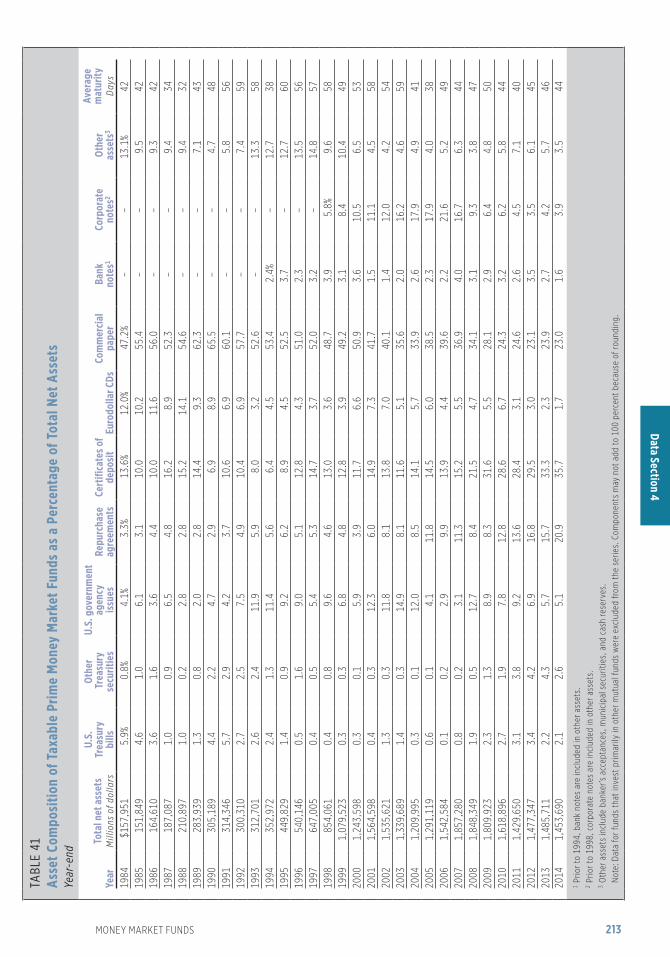
Data Section 4
MONEY MARKET FUNDS 213
TABL
E 41
As
set C
ompo
sitio
n of
Tax
able
Prim
e M
oney
Mar
ket F
unds
as
a Pe
rcen
tage
of T
otal
Net
Ass
ets
Year
-end
Year
Tota
l net
ass
ets
Mill
ions
of d
olla
rs
U.S.
Tr
easu
ry
bills
Othe
r T
reas
ury
secu
ritie
s
U.S.
gov
ernm
ent
agen
cy
issu
esRe
purc
hase
ag
reem
ents
Cert
ifica
tes o
f de
posi
tEu
rodo
llar C
DsCo
mm
erci
al
pape
rBa
nk
note
s1Co
rpor
ate
note
s2Ot
her
asse
ts3
Aver
age
mat
urity
D
ays
1984
$157
,951
5.9%
0.8%
4.1%
3.3%
13.6
%12
.0%
47.2
%–
–
13
.1%
4219
8515
1,84
94.
61.
06.
13.
110
.010
.255
.4–
–
9.
542
1986
164,
610
3.6
1.6
3.6
4.4
10.0
11.6
56.0
–
–
9.3
4219
8718
7,08
71.
00.
96.
54.
816
.28.
952
.3–
–
9.
434
1988
210,
897
1.0
0.2
2.8
2.8
15.2
14.1
54.6
–
–
9.4
3219
8928
3,93
91.
30.
82.
02.
814
.49.
362
.3–
–
7.
143
1990
305,
189
4.4
2.2
4.7
2.9
6.9
8.9
65.5
–
–
4.7
4819
9131
4,34
65.
72.
94.
23.
710
.66.
960
.1–
–
5.
856
1992
300,
310
2.7
2.5
7.5
4.9
10.4
6.9
57.7
–
–
7.4
5919
9331
2,70
12.
62.
411
.95.
98.
03.
252
.6–
–
13
.358
1994
352,
972
2.4
1.3
11.4
5.6
6.4
4.5
53.4
2.4%
–
12.7
3819
9544
9,82
91.
40.
99.
26.
28.
94.
552
.53.
7–
12
.760
1996
540,
146
0.5
1.6
9.0
5.1
12.8
4.3
51.0
2.3
–
13.5
5619
9764
7,00
50.
40.
55.
45.
314
.73.
752
.03.
2–
14
.857
1998
854,
061
0.4
0.8
9.6
4.6
13.0
3.6
48.7
3.9
5.8%
9.6
5819
991,
079,
523
0.3
0.3
6.8
4.8
12.8
3.9
49.2
3.1
8.4
10.4
4920
001,
243,
598
0.3
0.1
5.9
3.9
11.7
6.6
50.9
3.6
10.5
6.5
5320
011,
564,
598
0.4
0.3
12.3
6.0
14.9
7.3
41.7
1.5
11.1
4.5
5820
021,
535,
621
1.3
0.3
11.8
8.1
13.8
7.0
40.1
1.4
12.0
4.2
5420
031,
339,
689
1.4
0.3
14.9
8.1
11.6
5.1
35.6
2.0
16.2
4.6
5920
041,
209,
995
0.3
0.1
12.0
8.5
14.1
5.7
33.9
2.6
17.9
4.9
4120
051,
291,
119
0.6
0.1
4.1
11.8
14.5
6.0
38.5
2.3
17.9
4.0
3820
061,
542,
584
0.1
0.2
2.9
9.9
13.9
4.4
39.6
2.2
21.6
5.2
4920
071,
857,
280
0.8
0.2
3.1
11.3
15.2
5.5
36.9
4.0
16.7
6.3
4420
081,
848,
349
1.9
0.5
12.7
8.4
21.5
4.7
34.1
3.1
9.3
3.8
4720
091,
809,
923
2.3
1.3
8.9
8.3
31.6
5.5
28.1
2.9
6.4
4.8
5020
101,
618,
896
2.7
1.9
7.8
12.8
28.6
6.7
24.3
3.2
6.2
5.8
4420
111,
429,
650
3.1
3.8
9.2
13.6
28.4
3.1
24.6
2.6
4.5
7.1
4020
121,
477,
347
3.4
4.2
6.9
16.8
29.5
3.0
23.1
3.5
3.5
6.1
4520
131,
485,
711
2.2
4.3
5.7
15.7
33.3
2.3
23.9
2.7
4.2
5.7
4620
141,
453,
690
2.1
2.6
5.1
20.9
35.7
1.7
23.0
1.6
3.9
3.5
441 P
rior t
o 19
94, b
ank
note
s ar
e in
clud
ed in
oth
er a
sset
s.
2 P
rior t
o 19
98, c
orpo
rate
not
es a
re in
clud
ed in
oth
er a
sset
s.
3
Oth
er a
sset
s in
clud
e ba
nker
’s ac
cept
ance
s, m
unic
ipal
sec
uriti
es, a
nd c
ash
rese
rves
.
N
ote:
Dat
a fo
r fun
ds th
at in
vest
prim
arily
in o
ther
mut
ual f
unds
wer
e ex
clud
ed fr
om th
e se
ries.
Com
pone
nts
may
not
add
to 1
00 p
erce
nt b
ecau
se o
f rou
ndin
g.

Data
Sec
tion
4
214
TABLE 42 Alternative Strategies Mutual Funds: Total Net Assets, Net New Cash Flow, Number of Funds, and Number of Share Classes
Equity funds Equity funds
Year
Total Domestic WorldHybrid funds
Multisector bond funds Total Domestic World
Hybrid funds
Multisector bond funds
Total net assetsMillions of dollars , year-end
Net new cash flowMillions of dollars , annual
2007 $41,504 $20,343 $1,149 $18,619 $1,392 -$780 $445 -$47 -$632 -$5462008 31,276 17,097 431 12,574 1,174 -1,239 -1,013 -446 208 122009 58,317 24,432 3,355 28,892 1,638 21,025 7,241 2,572 10,789 4242010 91,271 32,620 1,776 55,078 1,796 23,192 7,295 726 14,930 2412011 104,023 33,729 3,987 64,171 2,136 12,423 -3,747 954 14,795 4202012 127,507 41,045 3,897 80,421 2,145 11,223 6,088 822 4,358 -462013 168,474 50,193 6,666 109,753 1,862 35,358 9,804 2,054 23,384 1162014 170,297 58,766 7,920 101,323 2,288 6,785 6,959 1,298 -1,595 123
Number of fundsYear-end
Number of share classesYear-end
2007 181 126 16 21 18 426 296 35 54 412008 204 138 22 27 17 499 320 58 80 412009 208 132 24 34 18 507 300 65 98 442010 235 139 24 52 20 611 330 72 157 522011 290 149 39 79 23 743 350 103 238 522012 323 154 35 111 23 838 361 85 340 522013 346 153 42 128 23 925 366 104 407 482014 402 167 52 157 26 1,114 408 145 497 64
Note: Data for funds that invest primarily in other mutual funds were excluded from the series. Components may not add to the total because of rounding.
Data
Sec
tion
5
2015 INVESTMENT COMPANY FACT BOOK

Data Section 5
ADDITIONAL CATEGORIES OF MUTUAL FUNDS 215
TABLE 43 Emerging Markets Debt Mutual Funds: Total Net Assets, Net New Cash Flow, Number of Funds, and Number of Share Classes
Year
Total net assets
Millions of dollars , year-end
Net new cash flow
Millions of dollars , annual
Number of funds
Year-end
Number of share classes
Year-end
2000 $2,442 -$288 23 482001 2,129 -412 24 502002 2,585 311 22 462003 4,297 691 19 432004 5,543 635 19 432005 7,408 1,197 17 392006 12,747 2,180 22 572007 16,751 2,278 27 762008 13,459 264 30 932009 19,496 1,947 32 992010 37,553 14,838 35 1212011 44,702 12,598 47 1602012 74,940 19,868 65 2122013 64,389 -4,627 87 2862014 58,649 -5,589 102 346
Note: Data for funds that invest primarily in other mutual funds were excluded from the series.

Data
Sec
tion
5
216 2015 INVESTMENT COMPANY FACT BOOK
TABLE 44 Floating-Rate High-Yield Bond Mutual Funds: Total Net Assets, Net New Cash Flow, Number of Funds, and Number of Share Classes
Year
Total net assets
Millions of dollars , year-end
Net new cash flow
Millions of dollars , annual
Number of funds
Year-end
Number of share classes
Year-end
2000 $23,791 -$2,626 16 302001 19,718 -5,114 23 562002 13,392 -5,792 22 522003 14,968 -310 20 492004 24,032 7,449 23 622005 27,485 2,195 25 732006 33,619 5,445 23 842007 33,667 -2,448 29 1032008 17,128 -8,169 31 1262009 28,330 4,362 31 1222010 47,109 15,041 32 1272011 59,877 10,158 38 1562012 76,619 10,625 41 1692013 140,898 59,580 51 1992014 118,254 -22,232 52 203
Note: Data for funds that invest primarily in other mutual funds were excluded from the series.

Data Section 5
ADDITIONAL CATEGORIES OF MUTUAL FUNDS 217
TABL
E 45
Fund
s of
Fun
ds:1 T
otal
Net
Ass
ets,
Net
New
Cas
h Fl
ow, N
umbe
r of F
unds
, and
Num
ber o
f Sha
re C
lass
es
Year
Tota
l net
ass
ets
Mill
ions
of d
olla
rs, y
ear-
end
Net n
ew c
ash
flow
2
Mill
ions
of d
olla
rs, a
nnua
lNu
mbe
r of f
unds
Year
-end
Num
ber o
f sha
re c
lass
esYe
ar-e
nd
Tota
lEq
uity
Hybr
id a
nd
bond
Tota
lEq
uity
Hybr
id a
nd
bond
Tota
lEq
uity
Hybr
id a
nd
bond
Tota
lEq
uity
Hybr
id a
nd
bond
1990
$1,4
26$2
11$1
,215
$131
-$21
$152
2011
920
119
1991
2,31
340
31,
910
475
9737
820
1010
2010
1019
923,
722
651
3,07
21,
134
205
929
2110
1121
1011
1993
5,40
390
04,
503
1,16
015
41,
006
2412
1224
1212
1994
6,17
01,
367
4,80
356
734
222
532
1517
3215
1719
959,
063
2,28
86,
774
1,13
563
350
236
1917
3719
1819
9613
,404
4,59
68,
808
2,45
71,
572
885
4524
2156
2828
1997
21,4
807,
580
13,9
003,
380
1,61
71,
763
9441
5314
858
9019
9835
,368
12,2
1223
,156
6,37
62,
006
4,37
017
575
100
305
112
193
1999
48,3
1018
,676
29,6
346,
572
3,39
23,
180
212
8312
939
413
725
720
0056
,911
11,9
1944
,992
10,4
013,
146
7,25
521
558
157
414
9531
920
0163
,385
11,1
5952
,226
8,92
91,
313
7,61
721
358
155
450
9435
620
0268
,960
10,3
1158
,649
11,5
931,
532
10,0
6126
868
200
625
118
507
2003
123,
029
19,3
6710
3,66
229
,859
3,00
626
,853
299
7022
971
611
859
820
0419
9,19
727
,729
171,
468
50,4
815,
260
45,2
2237
269
303
957
126
831
2005
305,
749
41,2
7926
4,47
079
,550
5,88
573
,665
472
9038
21,
292
185
1,10
720
0646
9,37
770
,897
398,
480
101,
347
13,7
8287
,565
598
119
479
1,84
925
81,
591
2007
638,
073
96,6
6054
1,41
312
6,40
717
,276
109,
131
704
124
580
2,33
129
52,
036
2008
487,
081
60,6
0642
6,47
561
,333
6,56
554
,768
840
124
716
2,78
431
32,
471
2009
680,
121
55,2
6662
4,85
670
,430
4,40
766
,022
945
131
814
3,05
132
52,
726
2010
915,
527
80,5
8083
4,94
711
8,69
24,
964
113,
727
981
147
834
3,14
134
82,
793
2011
1,03
6,77
680
,699
956,
076
119,
783
3,01
111
6,77
21,
086
158
928
3,40
836
23,
046
2012
1,27
4,17
993
,075
1,18
1,10
495
,138
-2,6
5197
,789
1,15
616
499
23,
739
410
3,32
920
131,
576,
174
128,
782
1,44
7,39
211
2,16
612
,621
99,5
451,
261
174
1,08
74,
007
417
3,59
020
141,
718,
109
128,
178
1,58
9,93
170
,242
11,7
1258
,530
1,33
717
61,
161
4,24
142
13,
820
1 Fu
nds
of fu
nds
are
mut
ual f
unds
that
inve
st p
rimar
ily in
oth
er m
utua
l fun
ds.
2 N
et n
ew c
ash
flow
is th
e do
llar v
alue
of n
ew s
ales
min
us re
dem
ptio
ns c
ombi
ned
with
net
exc
hang
es.
Not
e: C
ompo
nent
s m
ay n
ot a
dd to
the
tota
l bec
ause
of r
ound
ing.

Data
Sec
tion
5
218 2015 INVESTMENT COMPANY FACT BOOK
TABL
E 46
Fund
s of
Fun
ds:1 C
ompo
nent
s of
Net
New
Cas
h Fl
ow2
Mill
ions
of d
olla
rs, a
nnua
l
Year
Sale
sRe
dem
ptio
ns
New
+ e
xcha
nge
New
3Ex
chan
ge4
Regu
lar +
exc
hang
eRe
gula
r5Ex
chan
ge6
Tota
lEq
uity
Hybr
id
and
bond
Tota
lEq
uity
Hybr
id
and
bond
Tota
lEq
uity
Hybr
id
and
bond
Tota
lEq
uity
Hybr
id
and
bond
Tota
lEq
uity
Hybr
id
and
bond
Tota
lEq
uity
Hybr
id
and
bond
1990
$416
$68
$348
$351
$58
$293
$65
$10
$55
$285
$89
$196
$186
$87
$99
$100
$3$9
719
9177
219
258
057
914
243
719
450
143
298
9520
318
579
105
113
1697
1992
1,61
737
11,
246
1,25
529
496
136
276
286
483
166
318
303
130
174
180
3614
419
931,
953
358
1,59
41,
533
293
1,24
041
965
354
793
205
588
453
156
297
340
4929
119
941,
781
583
1,19
71,
341
389
952
439
194
245
1,21
324
197
268
216
651
753
175
456
1995
2,36
298
71,
376
1,75
069
21,
059
612
295
317
1,22
735
487
376
823
353
545
912
133
819
964,
522
2,32
12,
201
3,62
11,
847
1,77
490
147
442
82,
066
749
1,31
71,
290
519
771
776
230
546
1997
6,31
72,
858
3,45
94,
753
2,01
72,
736
1,56
584
272
32,
937
1,24
11,
696
1,74
977
497
51,
189
468
721
1998
12,9
314,
398
8,53
29,
938
3,57
86,
360
2,99
382
12,
172
6,55
42,
392
4,16
23,
766
1,54
12,
225
2,78
885
01,
938
1999
16,7
496,
861
9,88
812
,759
5,57
57,
184
3,99
01,
287
2,70
310
,177
3,46
96,
708
6,63
82,
553
4,08
43,
540
916
2,62
420
0024
,092
5,49
318
,599
18,6
074,
493
14,1
145,
485
1,00
04,
485
13,6
902,
347
11,3
449,
250
1,92
57,
325
4,44
042
14,
019
2001
22,5
773,
914
18,6
6317
,606
3,25
514
,350
4,97
165
94,
312
13,6
472,
601
11,0
469,
546
2,01
87,
528
4,10
158
33,
518
2002
28,1
934,
937
23,2
5623
,063
4,14
918
,914
5,13
178
94,
342
16,6
003,
405
13,1
9512
,209
2,87
59,
335
4,39
153
03,
861
2003
46,9
205,
914
41,0
0638
,405
4,82
433
,582
8,51
51,
090
7,42
517
,062
2,90
914
,153
12,7
852,
452
10,3
334,
277
456
3,82
020
0476
,677
9,28
567
,392
63,0
047,
409
55,5
9513
,674
1,87
611
,798
26,1
964,
026
22,1
7119
,742
3,45
916
,283
6,45
556
75,
888
2005
122,
744
11,3
9511
1,34
910
5,97
39,
035
96,9
3816
,771
2,36
014
,411
43,1
945,
510
37,6
8435
,168
4,74
730
,420
8,02
776
37,
264
2006
163,
033
22,3
5414
0,67
913
8,80
817
,618
121,
190
24,2
254,
736
19,4
8961
,686
8,57
253
,114
48,9
727,
182
41,7
9012
,714
1,39
011
,324
2007
226,
977
33,4
1019
3,56
719
3,64
026
,126
167,
515
33,3
367,
284
26,0
5210
0,56
916
,134
84,4
3581
,898
13,0
7368
,825
18,6
713,
061
15,6
1020
0821
4,27
628
,503
185,
773
183,
379
22,9
4216
0,43
630
,898
5,56
125
,337
152,
943
21,9
3813
1,00
612
1,20
217
,386
103,
816
31,7
414,
552
27,1
8920
0919
1,30
320
,580
170,
723
171,
942
18,8
1915
3,12
319
,361
1,76
117
,600
120,
873
16,1
7310
4,70
110
2,40
514
,549
87,8
5518
,469
1,62
316
,845
2010
290,
912
21,5
3126
9,38
126
5,67
520
,330
245,
345
25,2
371,
201
24,0
3617
2,22
016
,567
155,
654
150,
225
15,1
6713
5,05
821
,995
1,40
020
,596
2011
351,
447
20,7
3033
0,71
732
3,70
819
,619
304,
089
27,7
391,
112
26,6
2823
1,66
417
,720
213,
944
203,
556
16,2
3718
7,31
928
,108
1,48
226
,625
2012
332,
877
18,4
6531
4,41
230
6,87
717
,100
289,
777
26,0
011,
366
24,6
3523
7,74
021
,116
216,
623
212,
535
19,6
1519
2,92
025
,205
1,50
123
,704
2013
405,
472
33,3
1937
2,15
336
5,40
730
,718
334,
690
40,0
642,
601
37,4
6329
3,30
620
,698
272,
608
260,
259
19,2
0224
1,05
733
,046
1,49
631
,551
2014
411,
451
34,7
7837
6,67
337
0,85
932
,838
338,
021
40,5
921,
940
38,6
5234
1,20
923
,066
318,
143
290,
083
21,6
8626
8,39
751
,126
1,38
049
,746
1 Fu
nds
of fu
nds
are
mut
ual f
unds
that
inve
st p
rimar
ily in
oth
er m
utua
l fun
ds.
2 Net
new
cas
h flo
w is
the
dolla
r val
ue o
f new
sal
es m
inus
rede
mpt
ions
com
bine
d w
ith n
et e
xcha
nges
.
3 New
sal
es a
re th
e do
llar v
alue
of n
ew p
urch
ases
of m
utua
l fun
d sh
ares
. Thi
s do
es n
ot in
clud
e sh
ares
pur
chas
ed th
roug
h re
inve
stm
ent o
f div
iden
ds in
exi
stin
g ac
coun
ts.
4 E
xcha
nge
sale
s ar
e th
e do
llar v
alue
of m
utua
l fun
d sh
ares
sw
itche
d in
to fu
nds
with
in th
e sa
me
fund
gro
up.
5 R
egul
ar re
dem
ptio
ns a
re th
e do
llar v
alue
of s
hare
hold
er li
quid
atio
n of
mut
ual f
und
shar
es.
6 Exc
hang
e re
dem
ptio
ns a
re th
e do
llar v
alue
of m
utua
l fun
d sh
ares
sw
itche
d ou
t of f
unds
and
into
oth
er fu
nds
with
in th
e sa
me
fund
gro
up.
N
ote:
Com
pone
nts
may
not
add
to th
e to
tal b
ecau
se o
f rou
ndin
g.

Data Section 5
ADDITIONAL CATEGORIES OF MUTUAL FUNDS 219
TABL
E 46
Fund
s of
Fun
ds:1 C
ompo
nent
s of
Net
New
Cas
h Fl
ow2
Mill
ions
of d
olla
rs, a
nnua
l
Year
Sale
sRe
dem
ptio
ns
New
+ e
xcha
nge
New
3Ex
chan
ge4
Regu
lar +
exc
hang
eRe
gula
r5Ex
chan
ge6
Tota
lEq
uity
Hybr
id
and
bond
Tota
lEq
uity
Hybr
id
and
bond
Tota
lEq
uity
Hybr
id
and
bond
Tota
lEq
uity
Hybr
id
and
bond
Tota
lEq
uity
Hybr
id
and
bond
Tota
lEq
uity
Hybr
id
and
bond
1990
$416
$68
$348
$351
$58
$293
$65
$10
$55
$285
$89
$196
$186
$87
$99
$100
$3$9
719
9177
219
258
057
914
243
719
450
143
298
9520
318
579
105
113
1697
1992
1,61
737
11,
246
1,25
529
496
136
276
286
483
166
318
303
130
174
180
3614
419
931,
953
358
1,59
41,
533
293
1,24
041
965
354
793
205
588
453
156
297
340
4929
119
941,
781
583
1,19
71,
341
389
952
439
194
245
1,21
324
197
268
216
651
753
175
456
1995
2,36
298
71,
376
1,75
069
21,
059
612
295
317
1,22
735
487
376
823
353
545
912
133
819
964,
522
2,32
12,
201
3,62
11,
847
1,77
490
147
442
82,
066
749
1,31
71,
290
519
771
776
230
546
1997
6,31
72,
858
3,45
94,
753
2,01
72,
736
1,56
584
272
32,
937
1,24
11,
696
1,74
977
497
51,
189
468
721
1998
12,9
314,
398
8,53
29,
938
3,57
86,
360
2,99
382
12,
172
6,55
42,
392
4,16
23,
766
1,54
12,
225
2,78
885
01,
938
1999
16,7
496,
861
9,88
812
,759
5,57
57,
184
3,99
01,
287
2,70
310
,177
3,46
96,
708
6,63
82,
553
4,08
43,
540
916
2,62
420
0024
,092
5,49
318
,599
18,6
074,
493
14,1
145,
485
1,00
04,
485
13,6
902,
347
11,3
449,
250
1,92
57,
325
4,44
042
14,
019
2001
22,5
773,
914
18,6
6317
,606
3,25
514
,350
4,97
165
94,
312
13,6
472,
601
11,0
469,
546
2,01
87,
528
4,10
158
33,
518
2002
28,1
934,
937
23,2
5623
,063
4,14
918
,914
5,13
178
94,
342
16,6
003,
405
13,1
9512
,209
2,87
59,
335
4,39
153
03,
861
2003
46,9
205,
914
41,0
0638
,405
4,82
433
,582
8,51
51,
090
7,42
517
,062
2,90
914
,153
12,7
852,
452
10,3
334,
277
456
3,82
020
0476
,677
9,28
567
,392
63,0
047,
409
55,5
9513
,674
1,87
611
,798
26,1
964,
026
22,1
7119
,742
3,45
916
,283
6,45
556
75,
888
2005
122,
744
11,3
9511
1,34
910
5,97
39,
035
96,9
3816
,771
2,36
014
,411
43,1
945,
510
37,6
8435
,168
4,74
730
,420
8,02
776
37,
264
2006
163,
033
22,3
5414
0,67
913
8,80
817
,618
121,
190
24,2
254,
736
19,4
8961
,686
8,57
253
,114
48,9
727,
182
41,7
9012
,714
1,39
011
,324
2007
226,
977
33,4
1019
3,56
719
3,64
026
,126
167,
515
33,3
367,
284
26,0
5210
0,56
916
,134
84,4
3581
,898
13,0
7368
,825
18,6
713,
061
15,6
1020
0821
4,27
628
,503
185,
773
183,
379
22,9
4216
0,43
630
,898
5,56
125
,337
152,
943
21,9
3813
1,00
612
1,20
217
,386
103,
816
31,7
414,
552
27,1
8920
0919
1,30
320
,580
170,
723
171,
942
18,8
1915
3,12
319
,361
1,76
117
,600
120,
873
16,1
7310
4,70
110
2,40
514
,549
87,8
5518
,469
1,62
316
,845
2010
290,
912
21,5
3126
9,38
126
5,67
520
,330
245,
345
25,2
371,
201
24,0
3617
2,22
016
,567
155,
654
150,
225
15,1
6713
5,05
821
,995
1,40
020
,596
2011
351,
447
20,7
3033
0,71
732
3,70
819
,619
304,
089
27,7
391,
112
26,6
2823
1,66
417
,720
213,
944
203,
556
16,2
3718
7,31
928
,108
1,48
226
,625
2012
332,
877
18,4
6531
4,41
230
6,87
717
,100
289,
777
26,0
011,
366
24,6
3523
7,74
021
,116
216,
623
212,
535
19,6
1519
2,92
025
,205
1,50
123
,704
2013
405,
472
33,3
1937
2,15
336
5,40
730
,718
334,
690
40,0
642,
601
37,4
6329
3,30
620
,698
272,
608
260,
259
19,2
0224
1,05
733
,046
1,49
631
,551
2014
411,
451
34,7
7837
6,67
337
0,85
932
,838
338,
021
40,5
921,
940
38,6
5234
1,20
923
,066
318,
143
290,
083
21,6
8626
8,39
751
,126
1,38
049
,746
1 Fu
nds
of fu
nds
are
mut
ual f
unds
that
inve
st p
rimar
ily in
oth
er m
utua
l fun
ds.
2 Net
new
cas
h flo
w is
the
dolla
r val
ue o
f new
sal
es m
inus
rede
mpt
ions
com
bine
d w
ith n
et e
xcha
nges
.
3 New
sal
es a
re th
e do
llar v
alue
of n
ew p
urch
ases
of m
utua
l fun
d sh
ares
. Thi
s do
es n
ot in
clud
e sh
ares
pur
chas
ed th
roug
h re
inve
stm
ent o
f div
iden
ds in
exi
stin
g ac
coun
ts.
4 E
xcha
nge
sale
s ar
e th
e do
llar v
alue
of m
utua
l fun
d sh
ares
sw
itche
d in
to fu
nds
with
in th
e sa
me
fund
gro
up.
5 R
egul
ar re
dem
ptio
ns a
re th
e do
llar v
alue
of s
hare
hold
er li
quid
atio
n of
mut
ual f
und
shar
es.
6 Exc
hang
e re
dem
ptio
ns a
re th
e do
llar v
alue
of m
utua
l fun
d sh
ares
sw
itche
d ou
t of f
unds
and
into
oth
er fu
nds
with
in th
e sa
me
fund
gro
up.
N
ote:
Com
pone
nts
may
not
add
to th
e to
tal b
ecau
se o
f rou
ndin
g.
TABL
E 47
Inde
x M
utua
l Fun
ds: T
otal
Net
Ass
ets
and
Net N
ew C
ash
Flow
Mill
ions
of d
olla
rs
Year
Tota
l net
ass
ets
Year
-end
Net n
ew c
ash
flow
*A
nnua
l
Tota
l
Equi
ty
Hybr
id
and
bond
Tota
l
Equi
ty
Hybr
id
and
bond
S&P
500
Othe
r do
mes
ticW
orld
S&P
500
Othe
r do
mes
ticW
orld
1993
$27,
805
$19,
790
$3,3
38$1
,281
$3,3
96$6
,428
$3,9
94$9
53$5
01$9
8019
9432
,573
22,7
523,
863
2,09
53,
863
3,34
81,
871
515
436
525
1995
57,0
4241
,744
6,44
22,
846
6,00
911
,815
8,82
01,
038
512
1,44
619
9697
,759
73,8
5611
,241
4,12
48,
538
24,7
8018
,447
3,19
21,
033
2,10
819
9717
0,30
212
9,85
721
,221
5,32
913
,894
34,8
4725
,208
5,23
081
83,
591
1998
264,
998
201,
791
35,0
517,
962
20,1
9346
,143
30,9
778,
499
1,56
85,
099
1999
387,
411
284,
588
63,3
8613
,130
26,3
0761
,603
38,0
6316
,102
2,24
15,
197
2000
384,
039
272,
462
72,0
0912
,644
26,9
2325
,592
10,7
8310
,668
1,66
42,
477
2001
370,
560
249,
452
73,5
9811
,128
36,3
8126
,735
9,11
38,
859
1,18
17,
582
2002
327,
417
200,
989
69,4
2611
,050
45,9
5225
,255
4,81
812
,152
1,66
96,
616
2003
455,
293
273,
691
112,
480
18,2
1850
,903
35,2
3414
,231
16,5
382,
199
2,26
620
0455
4,04
431
7,82
614
7,81
928
,236
60,1
6340
,130
11,7
3916
,078
5,66
16,
651
2005
618,
699
334,
012
171,
377
42,7
9270
,518
27,8
77-3
1711
,731
8,45
68,
007
2006
747,
491
379,
765
218,
166
66,6
4782
,913
32,9
74-5
,908
20,1
3410
,674
8,07
420
0785
4,71
539
4,59
325
7,85
095
,695
106,
577
61,1
45-1
,440
29,1
9216
,915
16,4
7820
0860
1,72
825
2,95
617
7,97
550
,125
120,
672
34,9
277,
666
23,3
37-6
,000
9,92
420
0983
5,42
232
8,64
725
6,36
592
,507
157,
903
55,9
768,
195
16,6
464,
000
27,1
3520
101,
016,
713
375,
949
325,
276
122,
751
192,
736
57,5
60-8
0815
,024
19,0
7624
,268
2011
1,09
3,74
937
6,58
235
7,62
412
1,44
523
8,09
854
,828
-6,8
6824
,600
17,2
0219
,895
2012
1,31
1,07
742
9,69
843
9,63
316
1,21
228
0,53
459
,043
-7,1
3922
,134
15,5
2328
,525
2013
1,73
3,62
957
4,38
063
8,86
921
5,54
530
4,83
511
4,37
65,
541
46,5
4128
,309
33,9
8420
142,
052,
963
669,
483
767,
596
242,
924
372,
959
148,
386
12,5
6748
,325
38,4
0349
,091
* Net
new
cas
h flo
w is
the
dolla
r val
ue o
f new
sal
es m
inus
rede
mpt
ions
com
bine
d w
ith n
et e
xcha
nges
.
Not
e: D
ata
for f
unds
that
inve
st p
rimar
ily in
oth
er m
utua
l fun
ds w
ere
excl
uded
from
the
serie
s. C
ompo
nent
s m
ay n
ot a
dd to
the
tota
l bec
ause
of r
ound
ing.

Data
Sec
tion
5
220 2015 INVESTMENT COMPANY FACT BOOK
TABL
E 48
Inde
x M
utua
l Fun
ds: N
umbe
r of F
unds
and
Num
ber o
f Sha
re C
lass
es
Year
-end
Year
Num
ber o
f fun
dsNu
mbe
r of s
hare
cla
sses
Tota
l
Equi
ty
Hybr
id
and
bond
Tota
l
Equi
ty
Hybr
id
and
bond
S&P
500
Othe
r do
mes
ticW
orld
S&P
500
Othe
r do
mes
ticW
orld
1993
7039
156
1074
4315
610
1994
8243
177
1596
5417
1015
1995
8748
187
1411
063
1911
1719
9610
560
227
1614
386
2511
2119
9713
272
2712
2120
511
538
2131
1998
156
8637
1518
252
148
5225
2719
9919
797
5920
2132
316
695
3131
2000
271
120
9926
2646
522
116
343
3820
0128
612
611
024
2651
823
819
743
4020
0231
313
212
428
2957
825
522
153
4920
0332
112
813
430
2960
125
324
356
4920
0432
812
714
628
2763
326
226
955
4720
0532
211
914
729
2764
725
827
962
4820
0634
312
515
733
2869
927
230
370
5420
0735
412
515
937
3373
527
631
283
6420
0835
912
216
341
3375
427
831
695
6520
0935
711
315
149
4475
725
929
110
710
020
1036
511
116
150
4377
625
330
112
110
120
1138
211
116
957
4585
626
033
714
411
520
1237
210
316
658
4587
124
734
915
312
220
1337
196
171
5846
880
234
363
156
127
2014
382
9518
258
4790
623
240
014
812
6
Not
e: D
ata
for f
unds
that
inve
st p
rimar
ily in
oth
er m
utua
l fun
ds w
ere
excl
uded
from
the
serie
s.

Data Section 5
ADDITIONAL CATEGORIES OF MUTUAL FUNDS 221
TABL
E 49
Inde
x M
utua
l Fun
ds: N
ew S
ales
and
Exc
hang
e Sa
les
Mill
ions
of d
olla
rs, a
nnua
l
Year
New
+ e
xcha
nge
New
1Ex
chan
ge2
Tota
l
Equi
ty
Hybr
id a
nd
bond
Tota
l
Equi
ty
Hybr
id a
nd
bond
Tota
l
Equi
ty
Hybr
id a
nd
bond
S&P
500
Othe
r do
mes
ticW
orld
S&P
500
Othe
r do
mes
ticW
orld
S&P
500
Othe
r do
mes
ticW
orld
1993
$13,
399
$9,0
29$1
,560
$746
$2,0
64$1
1,30
8$7
,926
$1,2
83$4
55$1
,644
$2,0
91$1
,104
$277
$291
$420
1994
11,9
808,
106
1,28
382
41,
767
10,2
577,
187
1,13
057
91,
361
1,72
391
915
324
540
519
9521
,853
15,9
162,
107
1,01
92,
811
17,6
6913
,095
1,88
380
01,
891
4,18
42,
821
224
219
920
1996
42,6
8031
,828
4,89
31,
855
4,10
334
,903
26,1
654,
182
1,46
33,
093
7,77
65,
663
711
392
1,01
019
9773
,274
54,4
9410
,219
2,17
36,
388
54,0
9341
,160
6,56
21,
816
4,55
519
,181
13,3
343,
657
357
1,83
419
9810
2,84
375
,186
15,5
153,
014
9,12
879
,382
59,4
5711
,405
2,15
76,
362
23,4
6115
,728
4,10
985
72,
767
1999
145,
582
101,
675
26,7
554,
544
12,6
0811
2,68
681
,540
18,9
943,
232
8,92
032
,896
20,1
357,
761
1,31
23,
688
2000
136,
385
92,0
1929
,049
6,09
19,
225
107,
344
75,9
9020
,141
4,86
36,
351
29,0
4116
,029
8,90
81,
228
2,87
520
0112
2,24
772
,936
28,0
554,
643
16,6
1294
,018
58,6
5420
,960
3,94
610
,458
28,2
2914
,282
7,09
669
76,
154
2002
127,
752
68,0
8534
,211
5,16
120
,295
99,6
4057
,060
24,9
224,
505
13,1
5428
,112
11,0
269,
289
656
7,14
120
0313
6,83
067
,688
44,5
935,
998
18,5
5010
4,70
354
,472
31,6
805,
178
13,3
7232
,127
13,2
1612
,913
820
5,17
820
0415
9,31
074
,967
53,9
479,
403
20,9
9212
8,16
263
,371
40,6
227,
915
16,2
5331
,148
11,5
9713
,325
1,48
84,
739
2005
163,
344
70,7
6356
,374
13,5
2322
,684
131,
335
58,8
1843
,402
11,2
7517
,840
32,0
0911
,945
12,9
712,
248
4,84
420
0618
9,91
569
,619
73,3
3319
,890
27,0
7415
2,43
759
,125
57,3
8016
,061
19,8
7137
,478
10,4
9415
,953
3,82
87,
203
2007
259,
454
93,6
9192
,086
30,5
3943
,138
200,
076
76,3
0071
,958
23,6
5028
,169
59,3
7817
,391
20,1
296,
889
14,9
6920
0824
9,58
187
,082
82,1
4126
,258
54,0
9920
1,21
174
,131
64,7
2522
,355
40,0
0048
,369
12,9
5117
,416
3,90
314
,099
2009
243,
411
69,3
9866
,308
24,9
6082
,744
181,
737
60,0
2452
,130
19,4
0650
,177
61,6
749,
374
14,1
785,
554
32,5
6720
1027
9,01
670
,013
84,0
1050
,914
74,0
7921
2,86
559
,437
64,6
4832
,063
56,7
1666
,151
10,5
7719
,361
18,8
5117
,362
2011
330,
845
93,6
7910
7,16
544
,919
85,0
8126
8,31
980
,167
83,0
5536
,824
68,2
7462
,526
13,5
1224
,110
8,09
616
,807
2012
338,
948
93,4
2911
0,99
444
,029
90,4
9627
7,65
179
,206
89,3
6935
,357
73,7
2061
,296
14,2
2321
,625
8,67
216
,776
2013
432,
830
111,
144
146,
421
59,6
4711
5,61
934
5,80
295
,555
119,
032
50,0
8681
,129
87,0
2815
,588
27,3
899,
561
34,4
9020
1451
1,58
414
2,88
017
8,37
572
,752
117,
577
436,
358
121,
824
152,
698
62,3
6499
,473
75,2
2521
,056
25,6
7710
,388
18,1
041
New
sal
es a
re th
e do
llar v
alue
of n
ew p
urch
ases
of m
utua
l fun
d sh
ares
. Thi
s do
es n
ot in
clud
e sh
ares
pur
chas
ed th
roug
h re
inve
stm
ent o
f div
iden
ds in
exi
stin
g ac
coun
ts.
2 Ex
chan
ge s
ales
are
the
dolla
r val
ue o
f mut
ual f
und
shar
es s
witc
hed
into
fund
s w
ithin
the
sam
e fu
nd g
roup
. N
ote:
Dat
a fo
r fun
ds th
at in
vest
prim
arily
in o
ther
mut
ual f
unds
wer
e ex
clud
ed fr
om th
e se
ries.
Com
pone
nts
may
not
add
to th
e to
tal b
ecau
se o
f rou
ndin
g.

Data
Sec
tion
5
222 2015 INVESTMENT COMPANY FACT BOOK
TABL
E 50
Inde
x M
utua
l Fun
ds: R
edem
ptio
ns a
nd E
xcha
nge
Rede
mpt
ions
Mill
ions
of d
olla
rs, a
nnua
l
Year
Regu
lar +
exc
hang
eRe
gula
r1Ex
chan
ge2
Tota
l
Equi
ty
Hybr
id a
nd
bond
Tota
l
Equi
ty
Hybr
id a
nd
bond
Tota
l
Equi
ty
Hybr
id a
nd
bond
S&P
500
Othe
r do
mes
ticW
orld
S&P
500
Othe
r do
mes
ticW
orld
S&P
500
Othe
r do
mes
ticW
orld
1993
$6,9
71$5
,036
$607
$245
$1,0
84$5
,304
$4,0
22$4
49$1
18$7
15$1
,667
$1,0
14$1
58$1
27$3
6919
948,
632
6,23
676
838
71,
241
7,17
75,
426
645
243
863
1,45
581
012
314
437
919
9510
,038
7,09
61,
069
507
1,36
57,
721
5,73
893
533
771
12,
316
1,35
813
517
065
419
9617
,900
13,3
821,
700
822
1,99
513
,578
10,3
301,
429
566
1,25
34,
321
3,05
227
125
674
219
9738
,427
29,2
864,
988
1,35
52,
797
24,7
5319
,824
2,46
877
91,
681
13,6
749,
462
2,52
057
61,
116
1998
56,7
0044
,208
7,01
61,
446
4,02
940
,024
32,5
634,
256
973
2,23
216
,676
11,6
462,
760
473
1,79
719
9983
,979
63,6
1210
,653
2,30
37,
411
60,8
0948
,336
7,05
01,
276
4,14
623
,170
15,2
763,
603
1,02
73,
265
2000
110,
793
81,2
3718
,381
4,42
76,
749
80,7
8861
,735
11,9
592,
816
4,27
830
,005
19,5
016,
422
1,61
12,
471
2001
95,5
1263
,823
19,1
963,
462
9,03
068
,474
47,7
9212
,731
2,59
75,
353
27,0
3816
,030
6,46
586
53,
677
2002
102,
497
63,2
6722
,059
3,49
213
,679
74,9
6348
,625
15,2
232,
819
8,29
627
,534
14,6
426,
835
673
5,38
320
0310
1,59
653
,457
28,0
563,
800
16,2
8476
,804
42,8
1420
,548
3,40
710
,035
24,7
9210
,643
7,50
839
36,
249
2004
119,
180
63,2
2837
,869
3,74
214
,341
90,0
4450
,340
26,8
863,
061
9,75
629
,136
12,8
8810
,982
681
4,58
520
0513
5,46
771
,080
44,6
435,
067
14,6
7710
2,05
354
,621
32,2
874,
108
11,0
3633
,414
16,4
5912
,356
959
3,64
120
0615
6,94
175
,527
53,2
009,
215
18,9
9911
8,53
159
,556
39,1
116,
775
13,0
8938
,410
15,9
7114
,088
2,44
15,
910
2007
198,
309
95,1
3162
,894
13,6
2526
,659
141,
088
71,4
0542
,808
10,0
8116
,794
57,2
2123
,726
20,0
863,
544
9,86
520
0821
4,65
479
,416
58,8
0432
,258
44,1
7516
7,81
762
,324
43,1
4428
,061
34,2
8846
,837
17,0
9215
,660
4,19
79,
887
2009
187,
435
61,2
0349
,662
20,9
6055
,609
133,
211
49,7
9438
,167
17,7
2527
,525
54,2
2311
,409
11,4
953,
236
28,0
8420
1022
1,45
670
,821
68,9
8531
,839
49,8
1116
2,50
356
,993
54,7
8214
,737
35,9
9158
,953
13,8
2814
,203
17,1
0213
,820
2011
276,
017
100,
548
82,5
6527
,717
65,1
8621
9,55
381
,877
64,6
5420
,333
52,6
8956
,464
18,6
7117
,911
7,38
412
,497
2012
279,
905
100,
568
88,8
5928
,506
61,9
7121
2,63
379
,623
62,2
7821
,662
49,0
7167
,273
20,9
4526
,582
6,84
412
,901
2013
318,
454
105,
603
99,8
8031
,338
81,6
3424
8,68
389
,331
81,1
1225
,139
53,1
0069
,772
16,2
7118
,768
6,19
828
,534
2014
363,
198
130,
313
130,
050
34,3
4968
,486
308,
639
112,
519
109,
906
28,1
4158
,073
54,5
5917
,795
20,1
446,
207
10,4
131
Regu
lar r
edem
ptio
ns a
re th
e do
llar v
alue
of s
hare
hold
er li
quid
atio
n of
mut
ual f
und
shar
es.
2 Ex
chan
ge re
dem
ptio
ns a
re th
e do
llar v
alue
of m
utua
l fun
d sh
ares
sw
itche
d ou
t of f
unds
and
into
oth
er fu
nds
with
in th
e sa
me
fund
gro
up.
N
ote:
Dat
a fo
r fun
ds th
at in
vest
prim
arily
in o
ther
mut
ual f
unds
wer
e ex
clud
ed fr
om th
e se
ries.
Com
pone
nts
may
not
add
to th
e to
tal b
ecau
se o
f rou
ndin
g.

Data Section 5
ADDITIONAL CATEGORIES OF MUTUAL FUNDS 223
TABLE 51Inflation-Protected and Treasury Inflation-Protected Mutual Funds: Total Net Assets, Net New Cash Flow, Number of Funds, and Number of Share Classes
Year
TotalInflation- protected
Treasury inflation-protected Total
Inflation- protected
Treasury inflation-protected
Total net assetsMillions of dollars , year-end
Net new cash flowMillions of dollars , annual
2010 $108,438 $98,326 $10,112 $9,181 $7,346 $1,8352011 133,330 120,065 13,266 11,425 9,900 1,5252012 150,342 137,116 13,226 7,338 8,289 -9512013 108,160 95,942 12,218 -31,504 -31,383 -1202014 107,328 92,360 14,968 -3,089 -5,869 2,780
Number of fundsYear-end
Number of share classesYear-end
2010 59 50 9 200 170 302011 63 52 11 217 183 342012 68 56 12 234 197 372013 69 57 12 242 205 372014 65 56 9 232 205 27
Note: Data for funds that invest primarily in other mutual funds were excluded from the series. Components may not add to the total because of rounding.

Data
Sec
tion
5
224 2015 INVESTMENT COMPANY FACT BOOK
TABL
E 52
Mut
ual F
unds
by
Mar
ket C
apita
lizat
ion:
Tot
al N
et A
sset
s an
d Ne
t New
Cas
h Fl
ow b
y Ty
pe o
f Fun
dM
illio
ns o
f dol
lars
Year
Tota
l net
ass
ets
Year
-end
Grow
th fu
nds
Valu
e fu
nds
Blen
d fu
nds
Smal
l cap
Mid
cap
Larg
e ca
pM
ulti
cap
Smal
l cap
Mid
cap
Larg
e ca
pM
ulti
cap
Smal
l cap
Mid
cap
Larg
e ca
pM
ulti
cap
2004
$101
,728
$144
,182
$365
,645
$348
,495
$97,
716
$111
,824
$418
,598
$156
,404
$97,
094
$146
,278
$804
,228
$645
,668
2005
106,
921
153,
494
377,
231
381,
045
108,
707
135,
441
464,
347
169,
401
108,
504
164,
955
843,
752
701,
795
2006
114,
522
156,
733
379,
207
414,
190
130,
100
155,
866
570,
240
197,
391
123,
102
193,
651
974,
531
807,
898
2007
119,
593
177,
801
393,
968
480,
751
122,
045
158,
450
577,
987
203,
448
119,
792
202,
391
1,01
7,00
487
3,93
220
0867
,787
91,8
4122
4,91
127
6,50
478
,536
88,5
6333
9,75
411
1,19
871
,867
109,
537
637,
320
493,
352
2009
94,8
3012
7,60
329
4,64
036
5,99
410
4,21
412
1,01
541
6,94
214
0,76
996
,987
149,
165
817,
289
632,
531
2010
116,
796
159,
163
327,
217
399,
028
130,
444
146,
281
457,
150
159,
489
120,
735
182,
499
923,
238
687,
801
2011
107,
188
145,
985
326,
621
355,
760
120,
523
135,
407
435,
889
155,
979
116,
868
172,
318
911,
556
630,
045
2012
115,
903
161,
065
385,
120
377,
791
133,
256
152,
781
472,
021
175,
072
144,
854
192,
146
1,03
7,95
569
9,30
820
1316
5,83
621
3,25
050
6,89
049
1,70
717
5,81
020
9,20
759
1,82
524
2,90
620
7,50
726
5,99
01,
402,
025
908,
305
2014
158,
996
212,
407
553,
506
508,
039
170,
379
221,
202
630,
876
272,
937
208,
209
287,
573
1,62
1,87
296
5,44
7
Net n
ew c
ash
flow
Ann
ual
Grow
th fu
nds
Valu
e fu
nds
Blen
d fu
nds
Year
Smal
l cap
Mid
cap
Larg
e ca
pM
ulti
cap
Smal
l cap
Mid
cap
Larg
e ca
pM
ulti
cap
Smal
l cap
Mid
cap
Larg
e ca
pM
ulti
cap
2004
$-1,
510
$-6,
726
$-10
,973
$3,4
42$7
,451
$21,
072
$28,
751
$5,6
32$8
,729
$9,1
17$1
2,46
0$1
8,63
920
05-2
,380
-6,1
91-1
6,58
3-3
,324
2,97
013
,677
19,8
633,
018
3,31
23,
159
-12,
397
8,80
720
06-3
,781
-8,4
71-1
8,89
64,
041
3,65
3-1
,544
21,3
446,
181
885
1,15
2-1
4,43
56,
444
2007
-4,4
34-7
04-2
7,20
49,
005
-4,6
19-1
,511
-4,6
105,
730
-5,8
86-4
,612
-4,9
73-4
,918
2008
-3,9
70-9
,602
-13,
884
-11,
332
-1,9
36-8
,764
-18,
880
-15,
198
-7,6
09-1
4,11
8-3
,444
-31,
176
2009
1,86
0-9
82-9
,420
-9,2
931,
124
2,47
5-7
,542
-3,4
801,
383
-1,0
193,
485
-16,
841
2010
-1,7
83-1
,083
-12,
832
-19,
261
1,31
334
2-1
3,49
5-2
,303
150
-650
-10,
097
-29,
809
2011
-5,4
65-6
,628
6,58
0-3
3,63
5-4
,981
-4,9
24-1
8,54
6-1
74-4
74-5
,656
-12,
239
-42,
212
2012
-6,3
98-5
,353
2,00
8-3
8,86
2-8
,707
-7,3
37-2
9,50
4-1
0,64
6-6
,255
-5,7
74-1
0,90
9-4
1,30
420
133,
182
-2,7
89-1
2,23
5-1
6,79
8-3
,971
2,71
1-2
5,88
614
,473
7,72
17,
980
29,3
67-1
1,49
920
14-1
0,06
1-1
4,88
7-1
6,61
2-2
8,55
1-1
0,21
7-4
,238
-20,
600
9,03
0-7
,594
-2,0
9940
,290
-23,
876
Not
e: D
ata
for f
unds
that
inve
st p
rimar
ily in
oth
er m
utua
l fun
ds w
ere
excl
uded
from
the
serie
s. C
ompo
nent
s m
ay n
ot a
dd to
the
tota
l bec
ause
of r
ound
ing.

Data Section 5
ADDITIONAL CATEGORIES OF MUTUAL FUNDS 225
TABL
E 53
Mut
ual F
unds
by
Mar
ket C
apita
lizat
ion:
Num
ber o
f Fun
ds a
nd N
umbe
r of S
hare
Cla
sses
by
Type
of F
und
Year
-end
Year
Num
ber o
f fun
ds
Grow
th fu
nds
Valu
e fu
nds
Blen
d fu
nds
Smal
l cap
Mid
cap
Larg
e ca
pM
ulti
cap
Smal
l cap
Mid
cap
Larg
e ca
pM
ulti
cap
Smal
l cap
Mid
cap
Larg
e ca
pM
ulti
cap
2004
258
255
412
247
193
156
384
195
176
137
504
256
2005
266
255
406
243
208
166
397
199
182
139
482
255
2006
267
256
390
232
214
185
398
199
187
142
497
257
2007
246
245
351
209
219
196
400
200
196
146
490
254
2008
237
245
346
210
221
201
396
202
186
149
491
253
2009
213
220
329
192
202
190
370
189
177
140
464
245
2010
207
207
316
182
197
185
359
192
171
134
458
233
2011
205
198
309
169
203
181
341
201
172
140
439
225
2012
199
189
299
164
208
178
332
211
166
136
419
225
2013
192
180
287
165
204
175
325
213
178
131
413
228
2014
189
179
288
160
212
185
328
218
187
129
417
233
Num
ber o
f sha
re c
lass
es
Grow
th fu
nds
Valu
e fu
nds
Blen
d fu
nds
Year
Smal
l cap
Mid
cap
Larg
e ca
pM
ulti
cap
Smal
l cap
Mid
cap
Larg
e ca
pM
ulti
cap
Smal
l cap
Mid
cap
Larg
e ca
pM
ulti
cap
2004
657
671
1,03
359
247
440
997
249
641
432
51,
224
620
2005
675
686
1,04
259
352
444
71,
048
507
439
343
1,20
565
420
0668
869
81,
023
592
558
502
1,07
551
245
135
31,
266
679
2007
653
699
960
544
582
533
1,10
653
248
037
41,
257
684
2008
652
695
997
555
595
560
1,11
154
947
140
51,
303
708
2009
606
634
950
537
560
527
1,02
650
145
038
31,
249
718
2010
580
610
915
522
561
537
1,02
751
543
136
01,
236
699
2011
592
592
903
493
582
540
999
544
435
382
1,22
169
020
1258
256
889
047
459
754
496
256
943
737
81,
181
710
2013
561
556
873
485
592
548
954
598
477
366
1,18
373
620
1456
155
788
546
560
958
698
562
052
035
51,
213
740
Not
e: D
ata
for f
unds
that
inve
st p
rimar
ily in
oth
er m
utua
l fun
ds w
ere
excl
uded
from
the
serie
s.
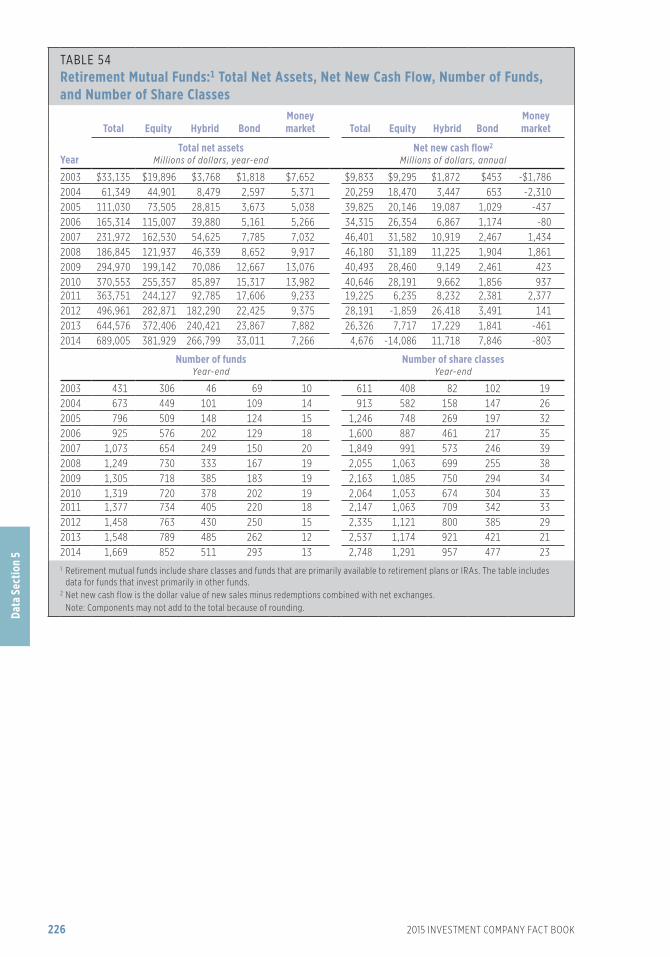
Data
Sec
tion
5
226 2015 INVESTMENT COMPANY FACT BOOK
TABLE 54 Retirement Mutual Funds:1 Total Net Assets, Net New Cash Flow, Number of Funds, and Number of Share Classes
Year
Total Equity Hybrid BondMoney market Total Equity Hybrid Bond
Money market
Total net assetsMillions of dollars , year-end
Net new cash flow2
Millions of dollars , annual
2003 $33,135 $19,896 $3,768 $1,818 $7,652 $9,833 $9,295 $1,872 $453 -$1,7862004 61,349 44,901 8,479 2,597 5,371 20,259 18,470 3,447 653 -2,3102005 111,030 73,505 28,815 3,673 5,038 39,825 20,146 19,087 1,029 -4372006 165,314 115,007 39,880 5,161 5,266 34,315 26,354 6,867 1,174 -802007 231,972 162,530 54,625 7,785 7,032 46,401 31,582 10,919 2,467 1,4342008 186,845 121,937 46,339 8,652 9,917 46,180 31,189 11,225 1,904 1,8612009 294,970 199,142 70,086 12,667 13,076 40,493 28,460 9,149 2,461 4232010 370,553 255,357 85,897 15,317 13,982 40,646 28,191 9,662 1,856 9372011 363,751 244,127 92,785 17,606 9,233 19,225 6,235 8,232 2,381 2,3772012 496,961 282,871 182,290 22,425 9,375 28,191 -1,859 26,418 3,491 1412013 644,576 372,406 240,421 23,867 7,882 26,326 7,717 17,229 1,841 -4612014 689,005 381,929 266,799 33,011 7,266 4,676 -14,086 11,718 7,846 -803
Number of fundsYear-end
Number of share classesYear-end
2003 431 306 46 69 10 611 408 82 102 192004 673 449 101 109 14 913 582 158 147 262005 796 509 148 124 15 1,246 748 269 197 322006 925 576 202 129 18 1,600 887 461 217 352007 1,073 654 249 150 20 1,849 991 573 246 392008 1,249 730 333 167 19 2,055 1,063 699 255 382009 1,305 718 385 183 19 2,163 1,085 750 294 342010 1,319 720 378 202 19 2,064 1,053 674 304 332011 1,377 734 405 220 18 2,147 1,063 709 342 332012 1,458 763 430 250 15 2,335 1,121 800 385 292013 1,548 789 485 262 12 2,537 1,174 921 421 212014 1,669 852 511 293 13 2,748 1,291 957 477 231 Retirement mutual funds include share classes and funds that are primarily available to retirement plans or IRAs. The table includes
data for funds that invest primarily in other funds. 2 Net new cash flow is the dollar value of new sales minus redemptions combined with net exchanges. Note: Components may not add to the total because of rounding.

Data Section 5
ADDITIONAL CATEGORIES OF MUTUAL FUNDS 227
TABL
E 55
Retir
emen
t Mut
ual F
unds
:1 Com
pone
nts
of N
et N
ew C
ash
Flow
2
Mill
ions
of d
olla
rs, a
nnua
l
Year
Sale
sRe
dem
ptio
ns
New
3Ex
chan
ge4
Regu
lar5
Exch
ange
6
Equi
tyHy
brid
Bond
Mon
ey
mar
ket
Equi
tyHy
brid
Bond
Mon
ey
mar
ket
Equi
tyHy
brid
Bond
Mon
ey
mar
ket
Equi
tyHy
brid
Bond
Mon
ey
mar
ket
2003
$9,9
49$2
,404
$1,1
56$4
0,89
8$2
,303
$180
$125
$154
$2,7
45$6
63$7
19$4
2,58
8$2
12$4
8$1
10$2
5020
0423
,800
4,54
71,
468
30,8
261,
221
161
9016
96,
246
1,17
779
232
,980
306
8411
332
620
0532
,244
21,0
692,
108
33,8
281,
501
215
122
167
13,0
062,
028
1,05
334
,053
593
170
147
379
2006
46,8
5910
,686
2,27
737
,776
3,51
151
722
930
322
,957
4,00
11,
162
37,7
281,
060
336
171
430
2007
70,7
5817
,981
4,34
124
,488
3,94
964
145
271
241
,247
7,24
32,
080
22,9
651,
878
460
246
801
2008
70,9
7320
,171
5,02
631
,069
5,14
21,
576
653
1,19
239
,887
9,15
43,
360
29,6
685,
039
1,36
841
573
220
0965
,162
17,7
346,
522
33,2
3817
,779
3,06
21,
278
858
36,2
928,
068
3,64
132
,757
18,1
903,
579
1,69
991
620
1080
,204
21,2
496,
639
69,2
8814
,849
1,58
070
760
952
,432
11,6
604,
921
68,3
6414
,430
1,50
856
859
620
1182
,825
24,6
787,
012
92,2
5310
,389
2,05
81,
507
866
74,3
6916
,333
5,51
890
,162
12,6
102,
171
621
579
2012
78,1
7156
,405
8,81
736
,308
10,0
905,
193
781
606
77,7
2728
,190
5,66
436
,285
12,3
936,
990
442
488
2013
82,3
1657
,588
9,43
336
,170
15,0
3411
,814
560
569
77,1
0239
,497
7,52
236
,636
12,5
3112
,676
629
564
2014
86,4
3862
,463
14,2
5532
,118
19,8
5315
,843
542
427
105,
668
46,4
646,
404
32,8
9114
,708
20,1
2454
745
71
Retir
emen
t mut
ual f
unds
incl
ude
shar
e cl
asse
s an
d fu
nds
that
are
prim
arily
ava
ilabl
e to
retir
emen
t pla
ns o
r IRA
s. T
he ta
ble
incl
udes
dat
a fo
r fun
ds th
at in
vest
prim
arily
in o
ther
fund
s.2
Net
new
cas
h flo
w is
the
dolla
r val
ue o
f new
sal
es m
inus
rede
mpt
ions
com
bine
d w
ith n
et e
xcha
nges
.
3 New
sal
es a
re th
e do
llar v
alue
of n
ew p
urch
ases
of m
utua
l fun
d sh
ares
. Thi
s do
es n
ot in
clud
e sh
ares
pur
chas
ed th
roug
h re
inve
stm
ent o
f div
iden
ds in
exi
stin
g ac
coun
ts.
4 Exc
hang
e sa
les
are
the
dolla
r val
ue o
f mut
ual f
und
shar
es s
witc
hed
into
fund
s w
ithin
the
sam
e fu
nd fa
mily
.
5 Reg
ular
rede
mpt
ions
are
the
dolla
r val
ue o
f sha
reho
lder
liqu
idat
ion
of m
utua
l fun
d sh
ares
.
6 Exc
hang
e re
dem
ptio
ns a
re th
e do
llar v
alue
of m
utua
l fun
d sh
ares
sw
itche
d ou
t of f
unds
and
into
oth
er fu
nds
with
in th
e sa
me
fund
gro
up.
Not
e: C
ompo
nent
s m
ay n
ot a
dd to
the
tota
l bec
ause
of r
ound
ing.

Data
Sec
tion
5
228 2015 INVESTMENT COMPANY FACT BOOK
TABLE 56Sector Mutual Funds: Total Net Assets and Net New Cash Flow by Type of FundMillions of dollars
Year
Total net assetsYear-end
Consumer Financial HealthNatural
resourcesPrecious metals Real estate
Technology/Telcom Utilities
Other sectors
2000 $1,042 $16,087 $45,921 $2,955 $1,108 $11,675 $103,853 $22,908 $3,9172001 1,290 13,901 40,545 2,429 1,276 13,509 62,339 17,744 2,9402002 1,096 10,885 30,087 2,230 2,431 17,745 31,308 11,275 2,0822003 1,436 13,138 36,803 3,307 4,158 31,653 46,929 13,481 2,4122004 1,631 12,917 40,147 5,844 4,215 49,927 42,403 19,201 2,9742005 1,405 11,837 45,398 12,048 6,928 59,158 34,366 28,390 3,1892006 1,928 12,269 44,744 14,723 9,741 81,329 32,891 34,589 3,9502007 2,147 8,518 43,967 22,312 11,804 53,738 34,169 45,669 4,8262008 1,776 4,857 31,337 9,967 7,776 33,503 16,331 23,240 1,7662009 2,439 5,941 32,440 17,496 14,785 44,126 27,610 30,327 2,9862010 3,113 6,286 32,507 22,853 22,926 56,830 30,738 33,332 4,5972011 3,546 4,548 35,884 20,998 17,029 61,665 26,680 34,785 3,9062012 4,675 5,901 44,105 22,041 15,293 77,033 28,570 35,400 5,0012013 6,431 9,285 74,767 30,960 6,790 79,034 41,486 40,149 8,1732014 7,017 9,415 103,447 36,904 6,005 106,106 45,358 41,556 8,969
Net new cash flowAnnual
Year Consumer Financial HealthNatural
resourcesPrecious metals Real estate
Technology/Telcom Utilities
Other sectors
2000 -$122 -$534 $9,256 $236 -$203 $339 $43,837 $1,015 -$1872001 254 -962 236 -182 -28 430 -4,458 -953 -1982002 11 -1,603 -2,895 -70 480 3,612 -6,211 -2,076 -2882003 9 -940 -767 327 456 5,177 73 -292 -1452004 3 -1,535 -387 1,414 419 7,050 -6,165 1,571 1482005 -209 -1,586 836 3,483 1,016 3,000 -8,541 3,311 1212006 29 -1,017 -4,137 789 717 4,395 -4,456 556 -492007 94 -2,617 -3,378 1,724 -214 -15,282 -2,745 1,992 2572008 209 96 -3,025 -268 832 1,791 -3,847 -3,397 -4882009 82 -457 -3,163 1,767 2,249 492 1,768 254 3862010 101 -626 -2,407 1,470 2,353 1,695 -1,391 -848 7242011 262 -885 478 1,193 -1,336 916 -2,346 701 -2862012 544 56 1,385 564 152 4,307 -1,515 -1,994 1732013 794 859 8,582 5,411 -1,425 241 1,972 -1,409 9772014 47 -256 7,645 5,823 -165 5,186 85 3,783 91
Note: Data for funds that invest primarily in other mutual funds were excluded from the series. Components may not add to the total because of rounding.

Data Section 5
ADDITIONAL CATEGORIES OF MUTUAL FUNDS 229
TABLE 57Sector Mutual Funds: Number of Funds and Number of Share Classes by Type of Fund Year-end
Year
Number of funds
Consumer Financial HealthNatural
resourcesPrecious metals Real estate
Technology/Telcom Utilities
Other sectors
2000 7 34 38 19 11 74 132 34 162001 9 41 57 18 10 75 155 40 172002 12 42 63 15 11 79 145 35 192003 11 38 58 16 11 91 124 33 192004 14 40 59 17 11 94 115 34 202005 14 41 53 18 11 93 103 32 192006 18 40 57 20 12 97 108 38 232007 19 40 52 20 11 96 98 39 252008 19 38 48 21 11 92 88 41 222009 19 36 41 20 11 90 79 37 232010 19 35 38 21 11 88 74 35 212011 19 32 34 26 10 84 69 33 212012 20 33 35 28 11 85 66 36 242013 19 32 35 32 11 88 68 41 242014 19 31 34 36 11 88 67 37 24
Number of share classes
Year Consumer Financial HealthNatural
resourcesPrecious metals Real estate
Technology/Telcom Utilities
Other sectors
2000 12 73 91 33 19 151 283 75 232001 17 88 145 32 21 156 350 89 252002 22 92 171 26 24 172 348 91 282003 19 85 155 33 26 214 290 88 282004 27 92 159 34 27 238 279 91 292005 26 95 137 38 27 240 260 94 272006 33 93 147 41 30 246 267 107 372007 41 95 133 47 34 252 249 113 422008 42 91 124 52 37 246 218 117 332009 42 80 101 50 37 246 199 105 412010 42 79 97 54 38 251 190 96 362011 43 72 80 75 33 243 184 89 362012 47 73 83 85 36 246 182 100 432013 41 72 83 97 34 261 188 109 442014 41 70 80 106 34 271 181 96 40
Note: Data for funds that invest primarily in other mutual funds were excluded from the series.

Data
Sec
tion
5
230 2015 INVESTMENT COMPANY FACT BOOK
TABL
E 58
Targ
et D
ate
and
Life
styl
e M
utua
l Fun
ds:1 T
otal
Net
Ass
ets,
Net
New
Cas
h Fl
ow, N
umbe
r of F
unds
, and
Num
ber o
f Sha
re C
lass
es
Year
Tota
l net
ass
ets
Mill
ions
of d
olla
rs, y
ear-
end
Net n
ew c
ash
flow
2
Mill
ions
of
dolla
rs, a
nnua
lNu
mbe
r of f
unds
Year
-end
Num
ber o
f sha
re c
lass
esYe
ar-e
nd
Tota
lTa
rget
dat
eLi
fest
yle
Tota
lTa
rget
dat
eLi
fest
yle
Tota
lTa
rget
dat
eLi
fest
yle
Tota
lTa
rget
dat
eLi
fest
yle
1995
$2,7
46$4
87$2
,259
$1,1
94$1
85$1
,009
266
2050
1040
1996
6,49
780
55,
693
2,58
321
62,
367
449
3570
961
1997
14,3
141,
408
12,9
064,
138
193
3,94
577
1265
141
1712
419
9825
,413
4,50
820
,905
6,01
51,
153
4,86
211
017
9319
923
176
1999
34,8
497,
014
27,8
354,
928
1,31
13,
618
130
1911
124
030
210
2000
39,7
168,
788
30,9
287,
581
3,59
83,
983
146
2412
227
942
237
2001
45,4
6712
,372
33,0
957,
696
3,79
53,
902
147
2512
235
182
269
2002
49,4
2514
,902
34,5
238,
095
3,70
84,
386
171
2514
643
282
350
2003
81,7
3325
,901
55,8
3219
,040
7,22
111
,819
192
4514
749
912
037
920
0412
9,17
043
,756
85,4
1428
,336
12,9
0315
,432
241
8415
774
026
347
720
0520
2,01
771
,223
130,
794
57,1
6622
,256
34,9
1032
412
719
71,
128
465
663
2006
303,
594
114,
560
189,
034
66,7
9233
,023
33,7
6942
218
423
81,
559
783
776
2007
420,
863
182,
905
237,
958
91,9
2056
,200
35,7
2049
424
524
91,
837
1,03
580
220
0833
5,42
115
9,83
017
5,59
154
,424
41,8
9712
,527
613
338
275
2,21
51,
367
848
2009
486,
540
255,
590
230,
950
52,1
1643
,442
8,67
464
337
926
42,
350
1,51
383
720
1060
3,92
633
9,77
226
4,15
548
,615
44,4
314,
184
638
377
261
2,32
71,
491
836
2011
637,
742
375,
810
261,
932
40,3
6741
,557
-1,1
8967
441
226
22,
484
1,62
086
420
1277
3,13
048
0,74
329
2,38
750
,218
52,9
48-2
,730
682
430
252
2,59
81,
754
844
2013
976,
546
618,
016
358,
530
55,2
5052
,968
2,28
276
049
126
92,
927
2,03
189
620
141,
097,
080
702,
632
394,
448
41,6
4844
,583
-2,9
3579
752
826
93,
036
2,14
289
41 C
ateg
orie
s in
clud
e da
ta fo
r fun
ds th
at in
vest
prim
arily
in o
ther
fund
s.
2 Net
new
cas
h flo
w is
the
dolla
r val
ue o
f new
sal
es m
inus
rede
mpt
ions
com
bine
d w
ith n
et e
xcha
nges
.
N
ote:
Com
pone
nts
may
not
add
to th
e to
tal b
ecau
se o
f rou
ndin
g.

Data Section 5
ADDITIONAL CATEGORIES OF MUTUAL FUNDS 231
TABL
E 59
Targ
et D
ate
and
Life
styl
e M
utua
l Fun
ds:1 C
ompo
nent
s of
Net
New
Cas
h Fl
ow2
M
illio
ns o
f dol
lars
, ann
ual
Sale
sRe
dem
ptio
ns
Year
New
3Ex
chan
ge4
Regu
lar5
Exch
ange
6
Tota
lTa
rget
dat
eLi
fest
yle
Tota
lTa
rget
dat
eLi
fest
yle
Tota
lTa
rget
dat
eLi
fest
yle
Tota
lTa
rget
dat
eLi
fest
yle
1995
$1,2
89$2
82$1
,008
$364
$9$3
55$3
04$1
00$2
03$1
55$5
$151
1996
3,39
362
22,
771
564
1255
298
940
658
338
511
373
1997
5,58
051
35,
067
1,06
633
1,03
31,
763
331
1,43
274
622
723
1998
8,85
61,
306
7,54
92,
782
1,35
41,
428
3,55
764
12,
916
2,06
686
71,
199
1999
10,6
631,
831
8,83
23,
144
1,70
71,
436
6,10
21,
000
5,10
22,
776
1,22
71,
549
2000
15,0
344,
267
10,7
674,
621
2,84
51,
776
8,30
21,
654
6,64
83,
772
1,86
11,
912
2001
15,4
084,
787
10,6
214,
179
2,57
61,
602
8,51
01,
844
6,66
53,
381
1,72
41,
656
2002
18,2
355,
282
12,9
533,
691
2,30
71,
384
10,9
012,
340
8,56
12,
930
1,54
11,
389
2003
27,5
818,
083
19,4
985,
321
3,39
01,
931
11,0
382,
521
8,51
82,
824
1,73
11,
093
2004
41,6
7016
,442
25,2
288,
713
5,47
43,
239
17,5
716,
274
11,2
964,
477
2,73
91,
738
2005
77,1
1126
,754
50,3
5811
,647
7,69
23,
955
25,9
198,
633
17,2
875,
673
3,55
82,
116
2006
89,4
9739
,913
49,5
8417
,113
11,1
575,
956
31,2
3212
,662
18,5
718,
586
5,38
53,
201
2007
137,
672
76,1
5561
,517
23,4
5617
,041
6,41
556
,637
28,5
0728
,131
12,5
708,
490
4,08
020
0812
7,51
778
,539
48,9
7822
,099
16,1
205,
979
73,8
7838
,386
35,4
9221
,314
14,3
756,
938
2009
118,
467
80,3
2838
,138
15,1
7211
,554
3,61
868
,193
39,3
8828
,805
13,3
299,
053
4,27
720
1014
9,97
410
7,61
842
,356
20,6
0616
,623
3,98
310
4,94
067
,373
37,5
6717
,025
12,4
374,
588
2011
172,
417
131,
659
40,7
5922
,271
17,9
144,
356
131,
977
90,8
0241
,176
22,3
4317
,215
5,12
920
1218
2,70
714
3,65
639
,052
19,6
6815
,988
3,68
013
3,05
092
,069
40,9
8119
,107
14,6
264,
481
2013
217,
731
171,
407
46,3
2430
,991
25,3
035,
687
166,
957
121,
592
45,3
6526
,514
22,1
504,
364
2014
240,
198
186,
196
54,0
0233
,593
28,0
935,
500
187,
264
129,
048
58,2
1644
,878
40,6
584,
221
1 Cat
egor
ies
incl
ude
data
for f
unds
that
inve
st p
rimar
ily in
oth
er fu
nds.
2 N
et n
ew c
ash
flow
is th
e do
llar v
alue
of n
ew s
ales
min
us re
dem
ptio
ns c
ombi
ned
with
net
exc
hang
es.
3 N
ew s
ales
are
the
dolla
r val
ue o
f new
pur
chas
es o
f mut
ual f
und
shar
es. T
his
does
not
incl
ude
shar
es p
urch
ased
thro
ugh
rein
vest
men
t of d
ivid
ends
in e
xist
ing
acco
unts
. 4 E
xcha
nge
sale
s ar
e th
e do
llar v
alue
of m
utua
l fun
d sh
ares
sw
itche
d in
to fu
nds
with
in th
e sa
me
fund
gro
up.
5 Reg
ular
rede
mpt
ions
are
the
dolla
r val
ue o
f sha
reho
lder
liqu
idat
ion
of m
utua
l fun
d sh
ares
.
6 E
xcha
nge
rede
mpt
ions
are
the
dolla
r val
ue o
f mut
ual f
und
shar
es s
witc
hed
out o
f fun
ds a
nd in
to o
ther
fund
s w
ithin
the
sam
e fu
nd g
roup
.
Not
e: C
ompo
nent
s m
ay n
ot a
dd to
the
tota
l bec
ause
of r
ound
ing.

Data
Sec
tion
5
232 2015 INVESTMENT COMPANY FACT BOOK
TABL
E 60
Varia
ble
Annu
ity M
utua
l Fun
ds: T
otal
Net
Ass
ets,
Net
New
Cas
h Fl
ow, a
nd N
umbe
r of F
unds
Tota
l net
ass
ets
Mill
ions
of
dolla
rs, y
ear-
end
Net n
ew c
ash
flow
*M
illio
ns o
f do
llars
, ann
ual
Num
ber o
f fun
dsYe
ar-e
nd
Tota
lEq
uity
Hybr
id a
nd
bond
Mon
ey
mar
ket
Tota
lEq
uity
Hybr
id a
nd
bond
Mon
ey m
arke
tTo
tal
Equi
tyHy
brid
and
bo
ndM
oney
mar
ket
1990
$28,
749
$14,
974
$8,3
55$5
,420
$3,0
83$1
,866
$323
$895
331
145
134
5219
9191
,056
69,1
3813
,734
8,18
46,
174
5,09
71,
498
-420
354
150
147
5719
9210
9,86
880
,934
21,0
467,
888
12,8
848,
708
4,36
3-1
8836
615
715
158
1993
152,
403
104,
823
39,7
407,
841
26,0
8816
,423
9,83
4-1
6942
819
217
660
1994
176,
370
121,
153
44,3
3910
,878
22,0
6615
,998
3,76
32,
305
507
245
202
6019
9525
9,81
318
7,70
260
,042
12,0
6920
,824
18,6
042,
214
566
534
425
071
1996
349,
341
260,
959
73,1
8915
,193
40,1
3332
,699
5,06
32,
371
800
435
290
7519
9747
3,33
136
4,28
692
,571
16,4
7440
,470
33,7
436,
316
411
937
535
323
7919
9861
5,15
247
4,96
111
6,33
723
,853
44,2
5927
,857
10,3
626,
040
1,16
270
337
782
1999
818,
958
656,
877
128,
349
33,7
3238
,543
30,7
36-4
608,
267
1,35
386
840
481
2000
816,
800
652,
421
131,
342
33,0
3748
,461
58,3
14-7
,790
-2,0
631,
562
1,05
143
180
2001
742,
258
558,
654
138,
848
44,7
5621
,583
4,86
18,
035
8,68
71,
750
1,24
841
389
2002
638,
949
438,
603
152,
276
48,0
70-1
,286
-12,
763
11,1
5132
71,
903
1,38
942
292
2003
837,
443
619,
018
182,
773
35,6
5229
,827
34,9
696,
929
-12,
071
1,88
91,
364
437
8820
0497
3,91
073
8,44
420
2,10
633
,361
33,5
0533
,592
2,59
5-2
,683
1,88
11,
351
443
8720
051,
072,
894
822,
105
217,
090
33,6
9916
,404
13,2
544,
449
-1,2
991,
882
1,35
644
383
2006
1,26
6,93
497
5,53
224
9,21
042
,192
29,7
1217
,018
7,19
25,
501
1,92
61,
391
454
8120
071,
398,
318
1,05
2,86
829
2,72
752
,723
31,7
801,
581
22,9
487,
251
1,90
01,
367
455
7820
0892
8,69
359
8,52
425
5,19
974
,971
-6,0
59-3
0,61
55,
018
19,5
381,
897
1,36
944
979
2009
1,18
7,61
079
2,08
333
8,23
157
,296
10,0
33-3
,644
32,4
83-1
8,80
61,
830
1,30
745
073
2010
1,33
9,17
688
6,35
740
4,26
548
,554
-2,3
13-2
5,37
532
,773
-9,7
111,
772
1,25
644
670
2011
1,29
8,46
080
0,12
944
9,45
848
,873
-21,
340
-48,
213
26,7
3713
61,
737
1,22
245
164
2012
1,43
9,57
887
5,00
452
0,64
243
,932
-32,
827
-55,
367
27,6
72-5
,132
1,72
41,
195
469
6020
131,
654,
071
1,05
0,47
056
3,80
939
,792
-56,
170
-61,
392
7,86
0-2
,638
1,73
11,
180
494
5720
141,
686,
125
1,06
5,11
958
3,88
237
,124
-69,
003
-58,
542
-7,7
96-2
,665
1,72
31,
149
518
56
* Net
new
cas
h flo
w is
the
dolla
r val
ue o
f new
sal
es m
inus
rede
mpt
ions
com
bine
d w
ith n
et e
xcha
nges
.
N
ote:
Dat
a fo
r fun
ds th
at in
vest
prim
arily
in o
ther
mut
ual f
unds
wer
e ex
clud
ed fr
om th
e se
ries.
Com
pone
nts
may
not
add
to th
e to
tal b
ecau
se o
f rou
ndin
g.

Data Section 5
ADDITIONAL CATEGORIES OF MUTUAL FUNDS 233
TABL
E 61
Varia
ble
Annu
ity M
utua
l Fun
ds: C
ompo
nent
s of
Net
New
Cas
h Fl
ow1
M
illio
ns o
f dol
lars
, ann
ual
Sale
sRe
dem
ptio
ns
Year
New
2Ex
chan
ge3
Regu
lar4
Exch
ange
5
Tota
lEq
uity
Hybr
id a
nd
bond
Mon
ey
mar
ket
Tota
lEq
uity
Hybr
id a
nd
bond
Mon
ey
mar
ket
Tota
lEq
uity
Hybr
id a
nd
bond
Mon
ey
mar
ket
Tota
lEq
uity
Hybr
id a
nd
bond
Mon
ey
mar
ket
1990
$9,9
94$4
,714
$1,8
08$3
,473
$1,0
82$4
50$1
83$4
49$6
,993
$2,9
41$1
,465
$2,5
87$1
,000
$357
$203
$440
1991
16,4
089,
034
3,36
84,
006
838
331
174
333
10,2
943,
967
1,92
04,
407
778
301
124
352
1992
24,7
7913
,294
6,63
44,
851
1,56
874
035
047
812
,014
4,74
52,
348
4,92
11,
450
581
273
596
1993
42,3
9222
,738
13,1
466,
508
1,13
157
632
523
016
,352
6,42
53,
410
6,51
71,
084
467
227
390
1994
48,0
1025
,661
10,9
0711
,443
7,01
74,
064
429
2,52
525
,933
9,94
16,
830
9,16
17,
029
3,78
674
22,
501
1995
53,1
0131
,661
9,32
612
,114
8,67
44,
984
727
2,96
332
,283
13,2
017,
234
11,8
498,
668
4,84
060
63,
223
1996
84,9
3353
,188
13,0
5618
,689
12,6
567,
190
864
4,60
244
,729
20,4
978,
041
16,1
9112
,726
7,18
281
54,
729
1997
105,
222
67,0
0515
,290
22,9
2624
,210
13,0
172,
348
8,84
665
,377
33,4
089,
905
22,0
6323
,586
12,8
711,
417
9,29
819
9814
1,46
483
,457
23,2
2734
,780
37,1
3618
,967
5,50
212
,668
99,1
4154
,024
14,9
6430
,153
35,1
9920
,542
3,40
311
,254
1999
212,
025
130,
900
22,0
0459
,120
40,8
1822
,080
2,98
515
,753
174,
418
100,
392
22,2
7551
,750
39,8
8321
,853
3,17
414
,856
2000
334,
936
222,
945
20,1
2891
,863
36,3
2622
,822
1,85
211
,652
287,
230
166,
186
27,4
8393
,561
35,5
7121
,267
2,28
812
,017
2001
346,
166
197,
831
33,7
0711
4,62
831
,716
15,9
285,
185
10,6
0432
5,67
619
0,97
727
,510
107,
189
30,6
2317
,921
3,34
69,
356
2002
342,
193
183,
758
48,1
7911
0,25
634
,170
16,4
287,
160
10,5
8334
4,22
419
4,37
438
,908
110,
942
33,4
2518
,574
5,28
19,
570
2003
283,
007
169,
043
54,3
9259
,572
28,7
9115
,307
5,94
47,
540
253,
526
136,
061
46,6
3270
,832
28,4
4513
,319
6,77
48,
351
2004
261,
715
170,
082
46,5
9245
,042
26,4
0714
,396
5,71
16,
300
228,
278
136,
344
44,3
8247
,552
26,3
4014
,543
5,32
56,
472
2005
246,
396
162,
387
48,2
2035
,789
19,5
9810
,599
3,40
35,
595
230,
118
148,
067
44,4
7237
,578
19,4
7211
,666
2,70
25,
104
2006
280,
246
191,
872
51,5
2936
,846
22,3
1810
,823
3,42
58,
070
250,
509
173,
300
44,3
5032
,859
22,3
4412
,376
3,41
26,
555
2007
343,
465
218,
138
73,9
9151
,336
37,0
4519
,701
8,24
79,
097
317,
180
215,
814
55,8
7745
,488
31,5
5020
,444
3,41
37,
693
2008
380,
350
198,
130
94,0
5188
,169
25,4
4511
,112
5,11
49,
220
390,
038
227,
293
90,6
0172
,144
21,8
1612
,564
3,54
65,
706
2009
312,
904
150,
971
100,
405
61,5
2822
,650
14,5
893,
767
4,29
430
2,74
215
4,82
169
,691
78,2
3122
,778
14,3
821,
999
6,39
720
1033
7,44
816
4,88
213
9,60
232
,964
17,3
256,
755
6,74
23,
828
339,
508
188,
495
108,
612
42,4
0117
,578
8,51
74,
959
4,10
220
1133
0,90
714
4,67
914
9,97
736
,252
16,2
696,
816
6,86
52,
589
352,
265
189,
868
125,
488
36,9
1016
,251
9,84
04,
616
1,79
520
1230
8,49
112
8,10
815
1,80
728
,575
14,2
4810
,720
2,11
81,
410
340,
384
181,
579
124,
982
33,8
2415
,181
12,6
161,
271
1,29
320
1329
5,31
214
2,68
512
1,87
930
,748
23,2
0514
,353
5,99
32,
859
349,
726
201,
508
113,
350
34,8
6724
,960
16,9
226,
661
1,37
720
1425
6,02
313
2,89
394
,929
28,2
019,
591
4,66
91,
607
3,31
632
4,38
618
9,76
810
3,57
531
,043
10,2
326,
335
758
3,13
91
Net
new
cas
h flo
w is
the
dolla
r val
ue o
f new
sal
es m
inus
rede
mpt
ions
com
bine
d w
ith n
et e
xcha
nges
.
2 New
sal
es a
re th
e do
llar v
alue
of n
ew p
urch
ases
of m
utua
l fun
d sh
ares
. Thi
s do
es n
ot in
clud
e sh
ares
pur
chas
ed th
roug
h re
inve
stm
ent o
f div
iden
ds in
exi
stin
g ac
coun
ts.
3 E
xcha
nge
sale
s ar
e th
e do
llar v
alue
of m
utua
l fun
d sh
ares
sw
itche
d in
to fu
nds
with
in th
e sa
me
fund
gro
up.
4 Re
gula
r red
empt
ions
are
the
dolla
r val
ue o
f sha
reho
lder
liqu
idat
ion
of m
utua
l fun
d sh
ares
.
5 E
xcha
nge
rede
mpt
ions
are
the
dolla
r val
ue o
f mut
ual f
und
shar
es s
witc
hed
out o
f fun
ds a
nd in
to o
ther
fund
s w
ithin
the
sam
e fu
nd g
roup
.
Not
e: D
ata
for f
unds
that
inve
st p
rimar
ily in
oth
er m
utua
l fun
ds w
ere
excl
uded
from
the
serie
s. C
ompo
nent
s m
ay n
ot a
dd to
the
tota
l bec
ause
of r
ound
ing.

Data
Sec
tion
6
234 2015 INVESTMENT COMPANY FACT BOOK
TABLE 62 Total Net Assets of Mutual Funds Held in Individual and Institutional Accounts Millions of dollars, year-end
Year Total Equity Hybrid Bond Money market
Total
2000 $6,964,634 $3,934,480 $360,916 $823,990 $1,845,2482001 6,974,913 3,392,399 358,027 939,177 2,285,3102002 6,383,477 2,642,420 335,276 1,140,707 2,265,0752003 7,402,482 3,653,370 447,570 1,261,520 2,040,0222004 8,095,801 4,342,577 552,250 1,299,274 1,901,7002005 8,891,373 4,885,444 621,479 1,357,630 2,026,8222006 10,398,137 5,832,582 731,503 1,495,619 2,338,4512007 12,000,168 6,413,222 821,522 1,679,664 3,085,7602008 9,602,891 3,637,416 562,262 1,570,978 3,832,2362009 11,112,623 4,872,541 717,580 2,206,609 3,315,8932010 11,832,988 5,596,629 841,415 2,591,022 2,803,9222011 11,631,894 5,212,989 883,056 2,844,428 2,691,4222012 13,052,230 5,938,747 1,029,257 3,390,704 2,693,5232013 15,034,776 7,762,727 1,267,329 3,286,388 2,718,3322014 15,852,341 8,314,314 1,351,839 3,460,928 2,725,260
Individual accounts
2000 $6,242,568 $3,726,670 $350,537 $753,419 $1,411,9422001 6,102,362 3,215,167 347,782 855,593 1,683,8202002 5,521,045 2,491,013 325,811 1,047,210 1,657,0122003 6,554,596 3,463,587 435,131 1,168,540 1,487,3382004 7,204,277 4,093,544 536,248 1,205,962 1,368,5222005 7,803,133 4,576,622 600,437 1,235,488 1,390,5862006 9,098,602 5,437,561 704,116 1,358,138 1,598,7872007 10,389,611 5,986,591 792,386 1,521,986 2,088,6482008 7,838,372 3,388,810 544,230 1,425,757 2,479,5752009 9,288,981 4,503,074 693,742 2,009,477 2,082,6892010 10,052,131 5,130,806 807,872 2,338,145 1,775,3082011 9,923,455 4,778,381 844,223 2,578,389 1,722,4622012 11,225,411 5,447,329 987,061 3,066,238 1,724,7832013 13,028,356 7,157,267 1,209,698 2,954,172 1,707,2192014 13,728,839 7,663,417 1,291,976 3,104,217 1,669,228
Institutional accounts*
2000 $722,066 $207,810 $10,379 $70,571 $433,3062001 872,551 177,232 10,245 83,584 601,4902002 862,432 151,407 9,465 93,497 608,0642003 847,885 189,783 12,439 92,980 552,6842004 891,524 249,033 16,002 93,312 533,1782005 1,088,239 308,822 21,042 122,143 636,2352006 1,299,535 395,021 27,386 137,481 739,6642007 1,610,557 426,630 29,136 157,678 997,1122008 1,764,519 248,606 18,031 145,220 1,352,6612009 1,823,642 369,467 23,839 197,132 1,233,2042010 1,780,857 465,823 33,542 252,877 1,028,6152011 1,708,438 434,607 38,832 266,039 968,9602012 1,826,819 491,418 42,195 324,465 968,7402013 2,006,421 605,460 57,631 332,216 1,011,1142014 2,123,502 650,897 59,863 356,710 1,056,032
* Institutional accounts include accounts purchased by an institution, such as a business, financial, or nonprofit organization. Institutional accounts do not include primary accounts of individuals issued by a broker-dealer. Note: Data for funds that invest primarily in other mutual funds were excluded from the series. Components may not add to the total because of rounding.

Data Section 6
INSTITUTIONAL INVESTORS IN THE MUTUAL FUND INDUSTRY 235
TABLE 63 Total Net Assets of Institutional Investors in Mutual Funds by Type of Institution and Type of FundMillions of dollars, year-end
Year Total Business
corporationsFinancial
institutions1Nonprofit
organizations Other2
2006 Total $1,299,535 $605,919 $392,457 $125,403 $175,755Equity 395,003 135,407 117,135 55,242 87,219Hybrid 27,386 7,856 8,295 4,848 6,388Bond 137,481 34,654 26,783 25,411 50,633Money market 739,664 428,003 240,243 39,902 31,515
2007 Total 1,610,557 752,596 474,827 150,177 232,957Equity 426,630 136,905 119,384 60,760 109,580Hybrid 29,136 8,306 10,216 4,500 6,114Bond 157,678 38,276 30,836 24,435 64,131Money market 997,112 569,109 314,390 60,482 53,132
2008 Total 1,764,519 916,758 496,069 135,287 216,404Equity 248,606 70,419 64,968 32,882 80,338Hybrid 18,031 5,702 5,708 2,717 3,904Bond 145,220 29,355 28,624 22,868 64,373Money market 1,352,661 811,283 396,769 76,820 67,789
2009 Total 1,823,642 896,961 505,916 147,414 273,352Equity 369,467 106,237 89,282 44,777 129,171Hybrid 23,839 7,989 7,126 3,665 5,060Bond 197,132 47,265 41,527 29,010 79,331Money market 1,233,204 735,470 367,982 69,963 59,790
2010 Total 1,780,857 752,449 513,067 153,520 361,821Equity 465,823 121,499 108,061 49,360 186,903Hybrid 33,542 10,952 10,187 4,261 8,142Bond 252,877 54,091 54,861 33,325 110,599Money market 1,028,615 565,907 339,957 66,574 56,177
2011 Total 1,708,438 695,581 484,560 146,589 381,709Equity 434,607 102,346 94,629 45,695 191,937Hybrid 38,832 12,042 11,390 4,794 10,606Bond 266,039 51,684 57,819 36,041 120,495Money market 968,960 529,509 320,721 60,058 58,671
2012 Total 1,826,819 699,023 510,828 153,066 463,902Equity 491,418 109,141 96,889 52,675 232,712Hybrid 42,195 11,217 13,941 5,186 11,851Bond 324,465 59,217 68,607 40,130 156,511Money market 968,740 519,448 331,391 55,074 62,828
2013 Total 2,006,421 770,167 539,879 169,662 526,713Equity 605,460 136,640 118,295 64,180 286,344Hybrid 57,631 15,299 17,246 7,419 17,667Bond 332,216 59,084 70,180 36,469 166,483Money market 1,011,114 559,144 334,158 61,593 56,218
2014 Total 2,123,502 815,013 566,443 185,283 556,762Equity 650,897 150,438 121,086 65,465 313,908Hybrid 59,863 15,660 18,062 7,682 18,459Bond 356,710 68,765 78,664 40,014 169,267Money market 1,056,032 580,150 348,631 72,122 55,129
1 Financial institutions include credit unions, investment clubs, accounts of banks not held as fiduciaries, insurance companies, and other financial organizations.
2 Other institutional investors include state and local governments, funds holding mutual fund shares, and other institutional accounts not classified.
Note: Data for funds that invest primarily in other mutual funds were excluded from the series. Components may not add to the total because of rounding.

Data
Sec
tion
6
236 2015 INVESTMENT COMPANY FACT BOOK
TABLE 64 Total Net Assets of Institutional Investors in Taxable Money Market Funds by Type of Institution and Type of Fund1 Millions of dollars, year-end
Year Total Business corporations
Financial institutions2
Nonprofit organizations Other3
2000 Total $409,466 $201,985 $158,334 $22,987 $26,160Institutional funds 305,180 137,226 134,543 14,951 18,460Retail funds 104,286 64,759 23,791 8,037 7,699
2001 Total 575,181 300,471 219,136 27,975 27,599Institutional funds 469,167 235,624 195,663 18,193 19,687Retail funds 106,014 64,847 23,473 9,783 7,912
2002 Total 578,112 303,148 226,645 27,673 20,646Institutional funds 485,551 247,671 202,475 20,186 15,219Retail funds 92,561 55,477 24,170 7,487 5,427
2003 Total 515,153 270,469 194,259 32,223 18,202Institutional funds 429,149 221,267 173,539 22,473 11,870Retail funds 86,005 49,202 20,720 9,751 6,333
2004 Total 486,612 277,235 161,810 28,909 18,659Institutional funds 406,837 228,681 146,630 18,941 12,586Retail funds 79,775 48,554 15,180 9,968 6,073
2005 Total 578,538 322,944 197,002 32,896 25,696Institutional funds 485,208 270,964 172,306 23,672 18,266Retail funds 93,330 51,980 24,697 9,224 7,430
2006 Total 677,610 388,596 221,779 37,856 29,379Institutional funds 582,316 324,826 208,179 26,698 22,613Retail funds 95,294 63,770 13,600 11,158 6,766
2007 Total 919,892 517,835 294,356 57,470 50,232Institutional funds 807,813 447,602 273,550 43,408 43,254Retail funds 112,079 70,233 20,806 14,062 6,977
2008 Total 1,265,490 748,320 377,468 74,803 64,900Institutional funds 1,141,552 672,189 350,450 60,632 58,282Retail funds 123,937 76,130 27,018 14,171 6,618
2009 Total 1,157,743 678,917 353,677 68,124 57,025Institutional funds 1,059,673 617,034 332,846 57,764 52,029Retail funds 98,070 61,883 20,831 10,360 4,996
2010 Total 971,055 523,805 328,133 65,252 53,865Institutional funds 882,599 470,349 306,445 56,440 49,365Retail funds 88,456 53,456 21,688 8,812 4,500
2011 Total 923,001 494,801 312,442 58,686 57,072Institutional funds 835,898 442,179 290,467 50,996 52,256Retail funds 87,102 52,622 21,975 7,689 4,815
2012 Total 921,982 483,275 322,483 53,961 62,262Institutional funds 846,066 437,390 303,243 47,365 58,067Retail funds 75,916 45,885 19,241 6,596 4,194
2013 Total 967,143 523,505 327,287 60,631 55,721Institutional funds 895,654 475,961 312,847 55,146 51,701Retail funds 71,489 47,544 14,440 5,485 4,020
2014 Total 1,013,032 545,170 342,748 70,608 54,506Institutional funds 943,830 499,074 329,067 64,887 50,802Retail funds 69,202 46,097 13,681 5,722 3,703
1 Institutional funds are sold primarily to institutional investors or institutional accounts. This includes accounts that are purchased by an institution, such as a business, financial, or nonprofit organization. Retail funds are sold primarily to individual investors and include variable annuity mutual funds.
2 Financial institutions include credit unions, investment clubs, accounts of banks not held as fiduciaries, insurance companies, and other financial organizations.
3 Other institutional investors include state and local governments, funds holding mutual fund shares, and other institutional accounts not classified.
Note: Data for funds that invest primarily in other mutual funds were excluded from the series. Components may not add to the total because of rounding.

237
Data Section 7
WORLDWIDE MUTUAL FUND TOTALS
TABLE 65 Worldwide Total Net Assets of Mutual FundsMillions of U.S. dollars, year-end
2007 2008 2009 2010 2011 2012 2013 2014World $26,130,201 $18,919,299 $22,945,270 $24,711,508 $23,801,209 $26,844,414 $30,047,406 $31,381,425Americas 13,421,794 10,581,230 12,578,245 13,599,181 13,534,659 15,147,007 17,173,504 18,012,199
Argentina 6,789 3,867 4,470 5,179 6,808 9,185 11,179 15,630Brazil 615,365 479,321 783,970 980,448 1,008,928 1,070,998 1,018,641 989,542Canada 698,397 416,031 565,156 636,947 753,606 856,504 940,580 981,804Chile 24,444 17,587 34,227 38,243 33,425 37,900 39,291 44,166Costa Rica 1,203 1,098 1,309 1,470 1,266 1,484 1,933 2,092Mexico 75,428 60,435 70,659 98,094 92,743 112,201 120,518 119,504Trinidad and Tobago N/A N/A 5,832 5,812 5,989 6,505 6,586 7,121United States 12,000,168 9,602,891 11,112,623 11,832,988 11,631,894 13,052,230 15,034,776 15,852,341
Europe 8,934,861 6,231,116 7,545,531 7,903,389 7,220,298 8,230,059 9,374,830 9,576,475Austria 138,709 93,269 99,628 94,670 81,038 89,125 90,633 83,522Belgium 149,842 105,057 106,721 96,288 81,505 81,651 91,528 90,211Bulgaria N/A 226 256 302 291 324 504 496Croatia N/A N/A N/A N/A N/A N/A N/A 2,058Czech Republic 7,595 5,260 5,436 5,508 4,445 5,001 5,131 5,563Denmark 104,083 65,182 83,024 89,800 84,891 103,506 118,702 121,092Finland 81,136 48,750 66,131 71,210 62,193 73,985 88,462 86,621France 1,989,690 1,591,082 1,805,641 1,617,176 1,382,068 1,473,085 1,531,500 1,391,271Germany 372,072 237,986 317,543 333,713 293,011 327,640 382,976 359,867Greece 29,807 12,189 12,434 8,627 5,213 6,011 6,742 5,256Hungary 12,573 9,188 11,052 11,532 7,193 8,570 12,158 11,375Ireland 951,371 720,486 860,515 1,014,104 1,061,051 1,276,601 1,439,867 1,547,343Italy 419,687 263,588 279,474 234,313 180,754 181,720 215,553 238,327Liechtenstein 25,103 20,489 30,329 35,387 32,606 31,951 36,235 28,875Luxembourg 2,685,065 1,860,763 2,293,973 2,512,874 2,277,465 2,641,964 3,030,665 3,208,264Malta N/A N/A N/A N/A 2,132 3,033 3,160 3,522Netherlands 113,759 77,379 95,512 85,924 69,156 76,145 85,304 75,751Norway 74,709 41,157 71,170 84,505 79,999 98,723 109,325 112,223Poland 45,542 17,782 23,025 25,595 18,463 25,883 27,858 26,098Portugal 29,732 13,572 15,808 11,004 7,321 7,509 9,625 8,564Romania 390 326 1,134 1,713 2,388 2,613 4,000 4,932Russia 7,175 2,026 3,182 3,917 3,072 N/A N/A N/ASlovakia 4,762 3,841 4,222 4,349 3,191 2,951 3,292 4,183Slovenia 4,219 2,067 2,610 2,663 2,279 2,370 2,506 2,553Spain 396,534 270,983 269,611 216,915 195,220 191,284 248,234 274,049Sweden 194,955 113,331 170,277 205,449 179,707 205,733 252,878 279,094Switzerland 176,282 135,052 168,260 261,893 273,061 310,686 397,080 407,890Turkey 22,609 15,404 19,426 19,545 14,048 16,478 14,078 15,292United Kingdom 897,460 504,681 729,141 854,413 816,537 985,517 1,166,834 1,182,184
Asia and Pacific 3,678,325 2,037,536 2,715,233 3,067,323 2,921,276 3,322,198 3,356,204 3,646,276Australia 1,192,988 841,133 1,198,838 1,455,850 1,440,128 1,667,128 1,624,081 1,601,132China 434,063 276,303 381,207 364,985 339,037 437,449 460,332 708,884Hong Kong 818,421 N/A N/A N/A N/A N/A N/A N/AIndia 108,582 62,805 130,284 111,421 87,519 114,489 107,895 134,630Japan 713,998 575,327 660,666 785,504 745,383 738,488 774,126 780,636Korea, Rep. of 329,979 221,992 264,573 266,495 226,716 267,582 285,173 312,150New Zealand 14,925 10,612 17,657 19,562 23,709 31,145 34,185 41,560Pakistan 4,956 1,985 2,224 2,290 2,984 3,159 3,464 4,156Philippines 2,090 1,263 1,488 2,184 2,363 3,566 4,662 5,078Taiwan 58,323 46,116 58,297 59,032 53,437 59,192 62,286 58,049
Africa 95,221 69,417 106,261 141,615 124,976 145,150 142,868 146,474South Africa 95,221 69,417 106,261 141,615 124,976 145,150 142,868 146,474
N/A = not availableNote: Funds of funds are not included except for France, Italy, and Luxembourg. Data include home-domiciled funds, except for Hong Kong, the Republic of Korea, and New Zealand, which include home- and foreign-domiciled funds. Components may not add to the total because of rounding. Source: International Investment Funds Association

Data
Sec
tion
7
238 2015 INVESTMENT COMPANY FACT BOOK
TABLE 66 Worldwide Number of Mutual FundsYear-end
2007 2008 2009 2010 2011 2012 2013 2014World 66,362 69,049 67,533 69,492 72,607 73,235 76,206 79,669 Americas 15,474 16,476 16,935 17,992 19,749 21,095 22,026 22,962
Argentina 241 253 252 254 281 291 297 302 Brazil 3,381 4,169 4,744 5,618 6,513 7,468 8,072 8,560 Canada 2,038 2,015 2,075 2,117 2,655 2,866 2,963 3,164 Chile 1,260 1,484 1,691 1,912 2,150 2,286 2,385 2,418 Costa Rica 93 85 64 68 63 66 66 66 Mexico 420 431 407 434 464 488 487 486 Trinidad and Tobago N/A N/A 36 35 36 42 43 43 United States 8,041 8,039 7,666 7,554 7,587 7,588 7,713 7,923
Europe 35,210 36,780 34,899 35,292 35,713 34,470 34,743 35,163 Austria 1,070 1,065 1,016 1,016 1,003 995 981 938 Belgium 1,655 1,828 1,845 1,797 1,723 1,529 1,432 1,209 Bulgaria N/A 81 85 90 92 95 98 103 Croatia N/A N/A N/A N/A N/A N/A N/A 82 Czech Republic 66 76 78 80 80 80 85 106 Denmark 500 489 483 490 500 495 510 530 Finland 379 389 377 366 368 375 369 352 France 8,243 8,301 7,982 7,791 7,744 7,392 7,154 7,082 Germany 1,462 1,675 2,067 2,106 2,051 2,059 2,012 2,039 Greece 230 239 210 213 196 177 166 143 Hungary 212 270 264 276 152 167 182 189 Ireland 2,898 3,097 2,721 2,899 3,085 3,167 3,345 3,462 Italy 924 742 675 650 659 600 661 719 Liechtenstein 391 335 348 409 437 535 657 587 Luxembourg 8,782 9,351 9,017 9,353 9,462 9,435 9,500 9,839 Malta N/A N/A N/A N/A 59 54 69 63 Netherlands 450 458a N/A N/A 495 497 501 561 Norway 511 530 487 507 507 406 573 616 Poland 188 210 208 214 226 259 264 278 Portugal 180 184 171 171 173 157 153 137 Romania 41 52 51 56 105 62 64 72 Russia 533 528 480 462 472 N/A N/A N/ASlovakia 54 56 54 58 63 58 54 67 Slovenia 106 125 125 130 137 131 114 111 Spain 2,940 2,944 2,588 2,486 2,474 2,349 2,267 2,238 Sweden 477 508 506 504 508 456 484 510 Switzerland 567 572 509 653 664 667 765 815 Turkey 294 304 286 311 337 351 373 395 United Kingdom 2,057 2,371 2,266 2,204 1,941 1,922 1,910 1,920
Asia and Pacific 14,847 14,909 14,795 15,265 16,198 16,703 18,375 20,373 Australia N/A N/A N/A N/A N/A N/A N/A N/AChina 341 429 547 660 831 1,065 1,415 1,763 Hong Kong 1,162 N/A N/A N/A N/A N/A N/A N/AIndia 555 551 590 658 680 692 699 723Japan 2,997 3,333 3,656 3,905 4,196 4,384 4,922 5,404 Korea, Rep. of 8,609 9,384 8,703 8,687 9,064 9,121 9,876 11,063 New Zealand 623 643 702 700 709 700 694 632 Pakistan 64 83 96 125 137 139 152 159 Philippines 40 43 41 43 47 48 47 52 Taiwan 456 443 460 487 534 554 570 577
Africa 831 884 904 943 947 967 1,062 1,171 South Africa 831 884 904 943 947 967 1,062 1,171
a Year-end data are not available. Data are as of September. N/A = not available Note: Funds of funds are not included except for France, Italy, and Luxembourg. Data include home-domiciled funds, except for Hong Kong, the
Republic of Korea, and New Zealand, which include home- and foreign-domiciled funds. Source: International Investment Funds Association

Data Section 7
WORLDWIDE MUTUAL FUND TOTALS 239
TABLE 67 Worldwide Net Sales of Mutual Funds Millions of U.S. dollars, annual
2007 2008 2009 2010 2011 2012 2013 2014World $1,533,877 $275,791 $271,121 $206,612 $104,907 $910,369 $896,139 $1,333,658Americas 1,204,570 606,278 79,056 -23,621 171,273 503,929 476,926 433,302
Argentina N/A N/A N/A N/A N/A N/A N/A 4,511b
Brazil 16,880 -32,653 47,317 58,316 49,995 56,099 34,713 777Canada 61,286 17,495 12,074 23,797 37,032 50,697 64,965 90,035Chile 3,282 -1,167 9,921 416 -423 813 5,394 8,550Costa Rica N/A N/A N/A 171 432 -221 -305 341Mexico 10,154 -3,418 8,572 18,382 4,005 6,869 7,705 10,442Trinidad and Tobago N/A N/A -150 -45 107 292 -13 292United States 1,112,968 626,021 1,322 -124,658 80,125 389,380 364,467 318,354
Europe 101,766 -443,035 166,653 218,363 -122,470 255,867 299,064 617,973Austria -4,864 -18,147 -4,746 -2,301 -6,675 236 -2,257 -1,380Belgium N/A N/A N/A N/A N/A N/A N/A N/ABulgaria N/A -151 8 51 8 16 129 36Croatia N/A N/A N/A N/A N/A N/A N/A -51Czech Republic 198 -1,561 -263 55 -536 161 256 676Denmark 1,893 -4,000 2,419 5,204 2,537 8,038 7,439 8,175Finland 3,535 -11,387 5,475 936 -1,709 3,223 5,617 7,584France -49,354 -68,351 6,164 -110,856 -125,565 -30,528 -99,007 -26,976Germany -18,531 -32,746 11,935 13,835 -5,018 -464 7,608 3,374Greece -2,643 -11,382 -1,124 -1,424 -1,489 -330 -741 -301Hungary 2,436 -1,755 776 936 -1,136 37 2,856 1,164Ireland N/A N/A N/A 133,942 85,666 117,666 74,644 149,568Italy -81,538 -107,691 -10,925 -29,921 -41,900 -14,020 16,704 43,109Liechtenstein 3,636 2,317 5,087 261 353 2,685 -726 -1,812Luxembourg 255,689 -102,257 95,059 152,608 -31,962 125,591 203,107 310,061Malta -5,732 N/A N/A N/A -53 599 -295 506Netherlands 6,870 -6,117a N/A 225 -9,532 -1,017 875 -5,553Norway N/A 40 6,689 4,807 4,380 7,048 4,727 17,184Poland N/A -1,423 859 1,278 -1,764 3,931 2,610 1,927Portugal -5,707 -11,169 1,120 -3,684 -2,858 -538 1,354 -3Romania 93 125 760 561 351 432 1,075 1,288Russia N/A N/A N/A N/A N/A N/A N/A N/ASlovakia 689 -897 80 308 -1,040 -451 148 896Slovenia 637 -433 27 21 -103 -140 -54 52Spain -23,273 -84,149 -15,858 -30,938 -11,803 -13,580 30,744 47,685Sweden 2,228 3,754 10,203 7,371 5,843 652 8,708 15,488Switzerland 15,074 17,851 7,343 4,063 9,067 15,887 5,780 20,819Turkey N/A N/A 2,324 2,608 -1,228 166 969 -644United Kingdom 430 -3,506 43,241 68,417 13,696 30,567 26,794 25,102
Asia and Pacific 217,849 105,561 13,908 -3,092 49,475 136,777 100,080 272,360Australia N/A N/A N/A N/A N/A N/A N/A N/AChina N/A 35,721b -35,612 -15,115 27,179 90,505 -3,842 167,834Hong Kong 6,834 N/A N/A N/A N/A N/A N/A N/AIndia 27,357 2,754 43,029 -35,950 532 15,832 2,724 7,651Japan 120,308 5,430 32,571 68,847 33,028 21,526 102,980 64,505Korea, Rep. of 61,081 58,818 -27,836 -19,604 -15,605 6,822 -4,876 32,631New Zealand 254 226 1,363 1,281 1,784 2,468 231 3,551Pakistan 2,922 -612 -3 -208 769 10 -89 28Philippines -15 -453 11 318 536 629 1,480 -4Taiwan -892 3,677 385 -2,661 1,252 -1,015 1,472 -3,835
Africa 9,692 6,987 11,504 14,962 6,629 13,796 20,069 10,022South Africa 9,692 6,987 11,504 14,962 6,629 13,796 20,069 10,022
a Year-end data are not available. Data are for January through September. b Data are only for October through December. N/A = not available Note: Net sales is a calculation of total sales minus total redemptions plus net exchanges. Funds of funds are not included except for France, Italy,
and Luxembourg. Data include home-domiciled funds, except for Hong Kong, the Republic of Korea, and New Zealand, which include home- and foreign-domiciled funds. Components may not add to the total because of rounding.
Source: International Investment Funds Association

APPENDIX A240
This appendix provides an overview of how investment company operations and features serve investors, examines the tax treatment of funds, and describes the core principles underlying investment company regulation.
The Origins of Pooled Investing 240
The Different Types of U.S. Investment Companies 242
The Organization of a Mutual Fund 243
Tax Features of Mutual Funds 249
Core Principles Underlying the Regulation of U.S. Investment Companies 255
Appendix A
How U S -Registered Investment Companies Operate and the Core Principles Underlying Their Regulation
The Origins of Pooled Investing
The investment company concept dates to the late 1700s in Europe, according
to K Geert Rouwenhorst in The Origins of Mutual Funds, when “a Dutch
merchant and broker…invited subscriptions from investors to form a trust to
provide an opportunity to diversify for small investors with limited means ”
The emergence of “investment pooling” in England in the 1800s brought the
concept closer to U S shores In 1868, the Foreign and Colonial Government
Trust formed in London This trust resembled the U S fund model in basic
structure, providing “the investor of moderate means the same advantages as
the large capitalists by spreading the investment over a number of different
stocks ”
Perhaps more importantly, the British fund model established a direct link
with U S securities markets, helping to finance the development of the post–
Civil War U S economy The Scottish American Investment Trust, formed on
February 1, 1873, by fund pioneer Robert Fleming, invested in the economic
potential of the United States, chiefly through American railroad bonds Many
other trusts followed that not only targeted investment in America, but also
led to the introduction of the fund investing concept on U S shores in the late
1800s and early 1900s

HOW U.S.-REGISTERED INVESTMENT COMPANIES OPERATE AND THE CORE PRINCIPLES UNDERLYING THEIR REGULATION 241
The first mutual, or open-end, fund was introduced in Boston in March 1924
The Massachusetts Investors Trust introduced important innovations to the
investment company concept by establishing a simplified capital structure,
continuous offering of shares, the ability to redeem shares rather than hold
them until dissolution of the fund, and a set of clear investment restrictions
and policies
The stock market crash of 1929 and the Great Depression that followed
hampered the growth of pooled investments until a succession of landmark
securities laws, beginning with the Securities Act of 1933 and concluding
with the Investment Company Act of 1940, reinvigorated investor confidence
Renewed investor confidence and many innovations led to relatively steady
growth in industry assets and number of accounts
Four Principal Securities Laws Govern Investment Companies
The Investment Company Act of 1940 Regulates the structure and operations of investment companies through a combination of registration and disclosure requirements and restrictions on day-to-day operations. The Investment Company Act requires the registration of all investment companies with more than 100 investors. Among other things, the Act addresses investment company capital structures, custody of assets, investment activities (particularly with respect to transactions with affiliates and other transactions involving potential conflicts of interest), and the duties of fund boards.
The Investment Advisers Act of 1940 Regulates investment advisers. Requires all advisers to registered investment companies and other large advisers to register with the SEC. The Advisers Act contains provisions requiring fund advisers to meet recordkeeping, custodial, reporting, and other regulatory responsibilities.
The Securities Exchange Act of 1934 Regulates the trading, purchase, and sale of securities, including investment company shares. The 1934 Act also regulates broker-dealers, including investment company principal underwriters and others that sell investment company shares, and requires them to register with the SEC. In 1938, the Securities Exchange Act of 1934 was revised to add Section 15A, which authorized the SEC to create self-regulatory organizations. Pursuant to this authority, in 1939 a self-regulatory organization for broker-dealers—which is now known as the Financial Industry Regulatory Authority (FINRA)—was created. Through its rules, inspections, and enforcement activities, FINRA, with oversight by the SEC, continues to regulate the conduct of broker-dealers, thereby adding another layer of protection for investors.
The Securities Act of 1933 Requires the registration of public offerings of securities, including investment company shares, and regulates such offerings. The 1933 Act also requires that all investors receive a current prospectus describing the fund.

APPENDIX A242
The Different Types of U.S. Investment Companies
Fund sponsors in the United States offer four types of registered investment
companies: open-end investment companies (commonly called mutual
funds), closed-end investment companies, exchange-traded funds (ETFs), and
unit investment trusts (UITs)
The vast majority of investment companies are mutual funds, both in
terms of number of funds and assets under management Mutual funds
can have actively managed portfolios, in which a professional investment
adviser creates a unique mix of investments to meet a particular investment
objective, or passively managed portfolios, in which the adviser seeks to track
the performance of a selected benchmark or index One hallmark of mutual
funds is that they issue redeemable securities, meaning that the fund stands
ready to buy back its shares at their current net asset value (NAV) The NAV
is calculated by dividing the total market value of the fund’s assets, minus its
liabilities, by the number of mutual fund shares outstanding
Money market funds are one type of mutual fund; a defining feature of money
market funds is that they seek to maintain a stable NAV Money market funds
offer investors a variety of features, including liquidity, a market-based
rate of return, and the goal of returning principal, all at a reasonable cost
These funds, which are typically publicly offered to all types of investors, are
registered investment companies that are regulated by the Securities and
Exchange Commission (SEC) under U S federal securities laws, including
Rule 2a-7 under the Investment Company Act That rule contains numerous
risk-limiting conditions concerning portfolio maturity, quality, diversification,
and liquidity intended to help a fund achieve its objectives In 2014, the SEC
adopted amendments to Rule 2a-7 that will require institutional prime (funds
that primarily invest in corporate debt securities) and institutional municipal
money market funds to maintain a floating NAV for transactions based on the
current market value of the securities in their portfolios; funds must comply
with this requirement by October 2016 Government money market funds and
retail money market funds (funds designed to limit all beneficial owners of
the funds to natural persons) will be allowed to continue using the amortized
cost or penny rounding method of pricing or both to seek to maintain a stable
share price The 2014 amendments also give money market fund boards
of directors the ability to impose liquidity fees or to suspend redemptions
temporarily if a fund’s level of weekly liquid assets falls below a certain
threshold

HOW U.S.-REGISTERED INVESTMENT COMPANIES OPERATE AND THE CORE PRINCIPLES UNDERLYING THEIR REGULATION 243
Unlike mutual funds, closed-end funds do not issue redeemable shares
Instead, they issue a fixed number of shares that trade intraday on stock
exchanges at market-determined prices Investors in a closed-end fund buy
or sell shares through a broker, just as they would trade the shares of any
publicly traded company For more information on closed-end funds, see
chapter 4 on page 78
ETFs are described as a hybrid of other types of investment companies
They are structured and legally classified as mutual funds or UITs (discussed
below), but trade intraday on stock exchanges like closed-end funds ETFs
only buy and sell fund shares directly to authorized participants in large
blocks, often 50,000 shares or more For more information on ETFs, see
chapter 3 on page 56
UITs are also a hybrid, with some characteristics of mutual funds and some
of closed-end funds Like closed-end funds, UITs typically issue only a
specific, fixed number of shares, called units Like mutual funds, the units are
redeemable, but unlike mutual funds, generally the UIT sponsor will maintain
a secondary market in the units so that redemptions do not deplete the UIT’s
assets A UIT does not actively trade its investment portfolio—instead it buys
and holds a set of particular investments until a set termination date, at which
time the trust is dissolved and proceeds are paid to shareholders For more
information on UITs, see page 20
The Organization of a Mutual Fund
A mutual fund typically is organized under state law either as a corporation
or a business trust (sometimes called a statutory trust) The three most
popular forms of organization are Massachusetts business trusts, Maryland
corporations, and Delaware statutory trusts (Figure A 1) 1
Historically, Massachusetts business trusts have been the most popular—in
part because the very first mutual fund was formed as a Massachusetts
business trust This was a common form of organization at the time for
pools that invested in real estate or public utilities and it provided a model
for others to follow Over the last few decades, the percentage of funds
organized as Massachusetts business trusts has declined as more and more
funds have formed as Maryland corporations, as well as Delaware statutory
1 More than 1,000 funds, or about 10 percent, have chosen other forms of organization, such as limited liability partnerships, or other domiciles, such as Ohio or Minnesota.

APPENDIX A244
trusts, the most fashionable form of mutual fund organization Developments
in the late 1980s gave asset management companies other attractive choices
For example, in 1987, Maryland revised its law to align it with interpretations
of the Investment Company Act of 1940 concerning when funds are required
to hold annual meetings As a result, Maryland corporations became more
competitive with the Massachusetts business trust as a form of organization
for mutual funds In 1988, Delaware—already a popular domicile for U S
corporations—adopted new statutory provisions devoted specifically to
business trusts (since renamed statutory trusts) One such provision is the
ability to file a 1031 exchange under IRC §1031, allowing for the deferment
of capital gains This and other benefits, such as management of the trust
and limited liability afforded to the trust’s beneficial owners, have led to its
current dominance over other forms of mutual fund organization
Mutual funds have officers and directors (if the fund is a corporation) or
trustees (if the fund is a business trust) 2 The fund’s board plays an important
role, described in more detail on page 259, in overseeing fund operations
FIGURE A 1
The Most Popular Forms of Mutual Fund Organization Percentage of funds, year-end 2014
15%Maryland
corporations
39%Delaware
statutory trusts
36%Massachusetts business trusts
10%Other
Number of funds: 10,409
Note: Data include mutual funds that do not report statistical information to the Investment Company Institute and mutual funds that invest primarily in other mutual funds.
2 For ease of reference, this appendix refers to all directors and trustees as directors and all boards as boards of directors.

HOW U.S.-REGISTERED INVESTMENT COMPANIES OPERATE AND THE CORE PRINCIPLES UNDERLYING THEIR REGULATION 245
Unlike other companies, a mutual fund is typically externally managed; it is
not an operating company and it has no employees in the traditional sense
Instead, a fund relies upon third parties or service providers—either affiliated
organizations or independent contractors—to invest fund assets and carry
out other business activities Figure A 2 shows the primary types of service
providers usually relied upon by a fund
Although it typically has no employees, a fund is required by law to have
written compliance policies and procedures that govern the operations of the
fund and the fund’s administrator, investment adviser, transfer agent, and
principal underwriter and that are reasonably designed to ensure the fund’s
compliance with the federal securities laws All funds must also have a chief
compliance officer (CCO), whose appointment must be approved by the fund’s
board and who must annually produce a report for the board regarding the
adequacy of the fund’s compliance policies and procedures, the effectiveness
of their implementation, and any material compliance matters that have
arisen
FIGURE A 2
Organization of a Mutual Fund
Shareholders
Board of directorsFund
Sponsor/Investment
adviser
Independentpublic
accountant
Custodian Transfer agent
Principalunderwriter
Administrator
APPENDIX A246
Shareholders
Like shareholders of other companies, mutual fund shareholders have specific
voting rights These include the right to elect directors at meetings called
for that purpose and the right to approve material changes in the terms of a
fund’s contract with its investment adviser, the entity that manages the fund’s
assets For example, a fund’s management fee cannot be increased and a
fund’s investment objectives or fundamental policies cannot be changed
unless a majority of shareholders vote to approve the increase or change
Sponsors
Setting up a mutual fund is a complicated process performed by the fund’s
sponsor, which is typically the fund’s investment adviser The fund sponsor
has a variety of responsibilities For example, it must assemble the group
of third parties needed to launch the fund, including the persons or entities
charged with managing and operating the fund The sponsor provides officers
and affiliated directors to oversee the fund and recruits unaffiliated persons
to serve as independent directors
Some of the major steps in the process of starting a mutual fund include
organizing the fund under state law, registering the fund with the SEC as an
investment company pursuant to the Investment Company Act of 1940, and
registering the fund shares for sale to the public pursuant to the Securities
Act of 1933 3 Unless otherwise exempt from doing so, the fund also must
make filings and pay fees to each state (except Florida) in which the fund’s
shares will be offered to the public The Investment Company Act also
requires that each new fund have at least $100,000 of seed capital before
distributing its shares to the public; this capital is usually contributed by the
sponsor or adviser in the form of an initial investment
3 For more information on the requirements for the initial registration of a mutual fund, see the SEC’s Investment Company Registration and Regulation Package, available at www.sec.gov/divisions/investment/invcoreg121504.htm.

HOW U.S.-REGISTERED INVESTMENT COMPANIES OPERATE AND THE CORE PRINCIPLES UNDERLYING THEIR REGULATION 247
Advisers
Investment advisers have overall responsibility for directing the fund’s
investments and handling its business affairs The investment advisers have
their own employees, including investment professionals who work on behalf
of the fund’s shareholders and determine which securities to buy and sell in
the fund’s portfolio, consistent with the fund’s investment objectives and
policies In addition to managing the fund’s portfolio, the adviser often serves
as administrator to the fund, providing various “back-office” services As
noted earlier, a fund’s investment adviser is often the fund’s initial sponsor
and its initial shareholder through the seed money invested to create
the fund
To protect investors, a fund’s investment adviser and the adviser’s employees
are subject to numerous standards and legal restrictions, including
restrictions on transactions that may pose conflicts of interest Like the
mutual fund, investment advisers are required to have their own written
compliance programs that are overseen by CCOs and to establish detailed
procedures and internal controls designed to ensure compliance with all
relevant laws and regulations
Administrators
A fund’s administrator handles the many back-office functions for a fund
For example, administrators often provide office space, clerical and fund
accounting services, data processing, and bookkeeping and internal auditing;
they also may prepare and file SEC, tax, shareholder, and other reports
Fund administrators also help maintain compliance procedures and internal
controls, subject to oversight by the fund’s board and CCO

APPENDIX A248
Principal Underwriters
Investors buy and redeem fund shares either directly through a fund’s
transfer agent or indirectly through a broker-dealer that is authorized to
sell fund shares In order to offer a particular fund’s shares, however, a
broker-dealer must have a sales agreement with the fund The role of a
fund’s principal underwriter is to act as the agent for the fund in executing
sales agreements that authorize broker-dealers to offer for sale and sell
fund shares While principal underwriters must register under the Securities
Exchange Act of 1934 as broker-dealers, they (1) do not operate as full-service
broker-dealers, (2) typically are not involved in offering or selling fund shares
to retail investors, and (3) do not establish or maintain accounts for retail
investors
Transfer Agents
Mutual funds and their shareholders rely on the services of transfer agents to
maintain records of shareholder accounts, calculate and distribute dividends
and capital gains, and prepare and mail shareholder account statements,
federal income tax information, and other shareholder notices Some transfer
agents also prepare and mail statements confirming shareholder transactions
and account balances Additionally, they may maintain customer service
departments, including call centers, to respond to shareholder inquiries
Auditors
Auditors certify the fund’s financial statements The auditors’ oversight role is
described more fully on page 260

HOW U.S.-REGISTERED INVESTMENT COMPANIES OPERATE AND THE CORE PRINCIPLES UNDERLYING THEIR REGULATION 249
Tax Features of Mutual Funds
Mutual funds are subject to special tax rules set forth in subchapter M of
the Internal Revenue Code Unlike most corporations, mutual funds are
not subject to taxation on their income or capital gains at the entity level,
provided that they meet certain gross income, asset, and distribution
requirements
To qualify as a regulated investment company (RIC) under subchapter
M, at least 90 percent of a mutual fund’s gross income must be derived
from certain sources, including dividends, interest, payments with respect
to securities loans, and gains from the sale or other disposition of stock,
securities, or foreign currencies In addition, at the close of each quarter of
the fund’s taxable year, at least 50 percent of the value of the fund’s total net
assets must consist of cash, cash items, government securities, securities of
other funds, and investments in other securities which, with respect to any
one issuer, represent neither more than 5 percent of the assets of the fund
nor more than 10 percent of the voting securities of the issuer Further, no
more than 25 percent of the fund’s assets may be invested in the securities
of any one issuer (other than government securities or the securities of other
funds), the securities (other than the securities of other funds) of two or more
issuers that the fund controls and are engaged in similar trades or businesses,
or the securities of one or more qualified publicly traded partnerships
If a mutual fund satisfies the gross income and asset tests and thus qualifies
as a RIC, the fund is eligible for the tax treatment provided by subchapter M,
including the ability to deduct from its taxable income the dividends it pays
to shareholders, provided that the RIC distributes at least 90 percent of its
income (other than net capital gains) each year A RIC may retain up to 10
percent of its income and all capital gains, but the retained income is taxed at
regular corporate tax rates Therefore, mutual funds generally distribute all,
or nearly all, of their income and capital gains each year
The Internal Revenue Code also imposes an excise tax on RICs, unless a RIC
distributes by December 31 at least 98 percent of its ordinary income earned
during the calendar year, 98 2 percent of its net capital gains earned during
the 12-month period ending on October 31 of the calendar year, and 100
percent of any previously undistributed amounts Mutual funds typically seek
to avoid this charge—imposed at a 4 percent rate on the “underdistributed”
amount—by making the required “minimum distribution” each year

APPENDIX A250
Mutual Fund Assets by Tax Status
Fund investors are responsible for paying tax on the amount of a fund’s earnings and
gains distributed to them, whether they receive the distributions in cash or reinvest them
in additional fund shares Investors often attempt to lessen the impact of taxes on their
investments by investing in tax-exempt funds and tax-deferred retirement accounts and
variable annuities As of year-end 2014, 5 percent of all mutual fund assets were held in tax-
exempt funds, and 53 percent were invested in tax-deferred accounts held by households
FIGURE A 3
58 Percent of Mutual Fund Assets Were Held in Tax-Deferred Accounts and Tax-Exempt Funds Percentage of assets, year-end 2014
10%Taxable nonhousehold
31%Taxable household
53%Tax-deferred household
5%Tax-exempt funds
Total mutual fund assets: $15.9 trillion
Note: Components do not add to 100 percent because of rounding.

HOW U.S.-REGISTERED INVESTMENT COMPANIES OPERATE AND THE CORE PRINCIPLES UNDERLYING THEIR REGULATION 251
Types of Distributions
Mutual funds make two types of taxable distributions to shareholders:
ordinary dividends and capital gains
Ordinary dividend distributions come primarily from the interest and
dividends earned by the securities in a fund’s portfolio and net short-term
gains, if any, after expenses are paid by the fund These distributions must
be reported as dividends on an investor’s tax return and are taxed at the
investor’s ordinary income tax rate A top tax rate of 15 percent is provided for
“qualified dividend” income received by most taxpayers; the top rate for this
income is 20 percent for certain “high-income individuals ” Some dividends
paid by mutual funds may qualify for these lower top tax rates
Long-term capital gains distributions represent a fund’s net gains, if any,
from the sale of securities held in its portfolio for more than one year A top
tax rate of 15 percent is provided for most investors’ long-term capital gains
(however, a 20 percent top tax rate applies to certain high-income individuals
and a lower rate applies to some taxpayers)
Certain high-income individuals also are subject to a 3 8 percent tax on “net
investment income” (NII) The tax on NII applies to interest, dividends, and
net capital gains, including those received from a mutual fund
To help mutual fund shareholders understand the impact of taxes on the
returns generated by their investments, the SEC requires mutual funds to
disclose standardized after-tax returns for one-, five-, and 10-year periods
After-tax returns, which accompany before-tax returns in fund prospectuses,
are presented in two ways:
» After taxes on fund distributions only (preliquidation)
» After taxes on fund distributions and an assumed redemption of fund
shares (postliquidation)

APPENDIX A252
Types of Taxable Shareholder Transactions
An investor who sells mutual fund shares usually incurs a capital gain or loss
in the year the shares are sold; an exchange of shares between funds in the
same fund family also results in either a capital gain or loss
Investors are liable for tax on any capital gain arising from the sale of fund
shares, just as they would be if they sold a stock, bond, or other security
Capital losses from mutual fund share sales and exchanges, like capital
losses from other investments, may be used to offset other capital gains in
the current year and thereafter In addition, up to $3,000 of capital losses
in excess of capital gains ($1,500 for a married individual filing a separate
return) may be used to offset ordinary income
The amount of a shareholder’s gain or loss on fund shares is determined by
the difference between the cost basis of the shares (generally, the purchase
price—including sales loads—of the shares, whether acquired with cash or
reinvested dividends) and the sale price Many funds voluntarily have been
providing cost basis information to shareholders or computing gains and
losses for shares sold New tax rules enacted in 2012 require all brokers and
funds to provide cost basis information to shareholders, as well as to indicate
whether any gains or losses are long-term or short-term, for fund shares
acquired on or after January 2, 2012
Tax-Exempt Funds
Tax-exempt bond funds distribute amounts attributable to municipal bond
interest These “exempt-interest dividends” are exempt from federal income
tax and, in some cases, state and local taxes Tax-exempt money market
funds invest in short-term municipal securities or equivalent instruments and
also pay exempt-interest dividends Even though income from these funds
generally is tax-exempt, investors must report it on their income tax returns
Tax-exempt funds provide investors with this information and typically
explain how to handle exempt-interest dividends on a state-by-state basis
For some taxpayers, portions of income earned by tax-exempt funds also may
be subject to the federal alternative minimum tax

HOW U.S.-REGISTERED INVESTMENT COMPANIES OPERATE AND THE CORE PRINCIPLES UNDERLYING THEIR REGULATION 253
Mutual Fund Ordinary Dividend Distributions
Ordinary dividend distributions represent income—primarily from interest and dividends
earned by securities in a fund’s portfolio—after expenses are paid by the fund Mutual funds
distributed $243 billion in dividends to fund shareholders in 2014 Bond and money market
funds accounted for 47 percent of all dividend distributions in 2014 Fifty-six percent of all
dividend distributions were paid to tax-exempt fund shareholders and tax-deferred household
accounts Another 38 percent were paid to taxable household accounts
FIGURE A 4
Dividend Distributions Billions of dollars, 2000–2014
Year
Tax-deferred household and tax-
exempt fundsTaxable
householdTaxable
nonhousehold Total
2000 $75 $87 $24 $186
2001 69 71 22 162
2002 59 43 12 114
2003 58 37 8 103
2004 66 41 10 117
2005 85 60 20 166
2006 116 89 36 240
2007 145 117 47 309
2008 139 98 38 275
2009 110 62 15 187
2010 112 64 12 188
2011 122 73 12 208
2012 129 80 13 222
2013 124 80 14 217
2014 136 92 16 243
Note: Components may not add to the total because of rounding.

APPENDIX A254
Mutual Fund Capital Gains Distributions
Capital gains distributions represent a fund’s net gains, if any, from the sale of securities
held in its portfolio When gains from these sales exceed losses, they are distributed to fund
shareholders Mutual funds distributed $398 billion in capital gains to shareholders in 2014
Sixty-three percent of these distributions were paid to tax-deferred household accounts,
and another 33 percent were paid to taxable household accounts Equity, bond, and hybrid
funds can distribute capital gains, but equity funds typically account for the bulk of these
distributions In 2014, 63 percent of stock fund share classes made a capital gains distribution,
and 83 percent of these share classes distributed more than 2 0 percent of their assets as
capital gains
FIGURE A 5
Capital Gains Distributions* Billions of dollars, 2000–2014
YearTax-deferred
householdTaxable
householdTaxable
nonhousehold Total
2000 $195 $117 $13 $326
2001 51 16 2 69
2002 10 6 1 16
2003 8 6 1 14
2004 31 21 3 55
2005 79 43 8 129
2006 165 78 14 257
2007 262 130 22 414
2008 98 28 7 132
2009 11 4 1 15
2010 23 17 3 43
2011 39 30 4 73
2012 59 37 5 100
2013 145 83 11 239
2014 249 132 17 398
* Capital gains distributions include long-term and short-term capital gains.
Note: Components may not add to the total because of rounding.

HOW U.S.-REGISTERED INVESTMENT COMPANIES OPERATE AND THE CORE PRINCIPLES UNDERLYING THEIR REGULATION 255
Core Principles Underlying the Regulation of U.S. Investment Companies
Embedded in the structure and regulation of mutual funds and other
registered investment companies are several core principles that provide
important protections for shareholders
Transparency
Funds are subject to more extensive disclosure requirements than any
other comparable financial product, such as separately managed accounts,
collective investment trusts, and private pools The cornerstone of the
disclosure regime for mutual funds and ETFs is the prospectus 4 Mutual
funds and ETFs are required to maintain a current prospectus, which
provides investors with information about the fund, including its investment
objectives, investment strategies, risks, fees and expenses, and performance,
as well as how to purchase, redeem, and exchange fund shares Importantly,
the key parts of this disclosure with respect to performance information and
fees and expenses are standardized to facilitate comparisons by investors
Mutual funds and ETFs may provide investors with a summary prospectus
containing key information about the fund, while making more information
available on the Internet and on paper upon request
Mutual funds and ETFs also are required to make statements of additional
information (SAIs) available to investors upon request and without charge
The SAI conveys information about the fund that, while useful to some
investors, is not necessarily needed to make an informed investment decision
For example, the SAI generally includes information about the history of
the fund, offers detailed disclosure on certain investment policies (such as
borrowing and concentration policies), and lists officers, directors, and other
persons who control the fund
4 Closed-end funds and UITs also provide investors with extensive disclosure, but under a slightly different regime that reflects the way shares of these funds trade. Both closed-end funds and UITs file an initial registration statement with the SEC containing a prospectus and other information related to the initial offering of their shares to the public.

APPENDIX A256
The prospectus, SAI, and certain other required information are contained in
the fund’s registration statement, which is filed electronically with the SEC
and is publicly available via the SEC’s Electronic Data Gathering, Analysis,
and Retrieval (EDGAR) system Mutual fund and ETF registration statements
are amended at least once each year to ensure that financial statements and
other information do not become stale 5 These funds also amend registration
statements throughout the year as necessary to reflect material changes to
their disclosure
In addition to registration statement disclosure, funds provide shareholders
with several other disclosure documents Shareholders receive audited annual
and unaudited semiannual reports within 60 days after the end and the
midpoint of the fund’s fiscal year These reports contain updated financial
statements, a list of the fund’s portfolio securities,6 management’s discussion
of financial performance, and other information current as of the date of the
report
Following their first and third quarter, funds file an additional form with the
SEC, Form N-Q, disclosing the complete schedule of their portfolio holdings
Finally, funds annually disclose how they voted on specific proxy issues at
portfolio companies on Form N-PX Funds are the only shareholders required
to publicly disclose each and every proxy vote they cast Funds are not
required to mail Form N-Q and Form N-PX to shareholders, but the forms are
publicly available via the SEC’s EDGAR database
The combination of prospectuses, SAIs, annual and semiannual shareholder
reports, Form N-Qs, and Form N-PXs provide the investing public, regulators,
media, and other interested parties with far more information on funds
than is available for other types of investments This information is easily
and readily available from most funds and the SEC It is also available from
private-sector vendors, such as Morningstar, that are in the business of
compiling publicly available information on funds in ways that might benefit
investors
5 Section 10(a)(3) of the Securities Act of 1933 prohibits investment companies that make a continuous offering of shares from using a registration statement with financial information that is more than 16 months old. This gives mutual funds and ETFs four months after the end of their fiscal year to amend their registration statements.
6 A fund is permitted to include a summary portfolio schedule in its shareholder reports in lieu of the complete schedule, provided that the complete portfolio schedule is filed with the SEC and is provided to shareholders upon request, free of charge. The summary portfolio schedule includes each of the fund’s 50 largest holdings in unaffiliated issuers and each investment that exceeds 1 percent of the fund’s NAV.

HOW U.S.-REGISTERED INVESTMENT COMPANIES OPERATE AND THE CORE PRINCIPLES UNDERLYING THEIR REGULATION 257
Daily Valuation and Liquidity
Nearly all funds offer shareholders liquidity and objective, market-based
valuation of their investments at least daily ETF and closed-end fund
shares are traded intraday on stock exchanges at market-determined prices,
giving shareholders real-time liquidity and pricing Mutual fund shares are
redeemable on a daily basis at a price that reflects the current market value of
the fund’s portfolio securities, calculated according to pricing methodologies
established by each fund’s board of directors The value of each security in
the fund’s portfolio is determined either by a market quotation, if a market
quotation is readily available, or at fair value as determined in good faith
The daily pricing process is a critically important core compliance function
that involves numerous staff, the fund board, and pricing vendors The fair
valuation process, a part of the overall pricing process, receives particular
scrutiny from funds, their boards of directors, regulators, and independent
auditors Under SEC rules, all funds must adopt written policies and
procedures that address the circumstances under which securities may be fair
valued, and must establish criteria for determining how to assign fair values
in particular instances 7
This daily valuation process results in a NAV for the fund The NAV is the
price used for all mutual fund share transactions occuring that day—new
purchases, sales (redemptions), and exchanges from one fund to another
within the same fund family 8 It represents the current mark-to-market value
of all the fund’s assets, minus liabilities (e g , fund expenses), divided by the
total number of outstanding shares Mutual funds release their daily NAVs
to investors and others after they complete the pricing process, generally
around 6:00 p m eastern time Daily fund prices are available through fund
toll-free telephone services, websites, and other means
7 ICI has published several papers on the mutual fund valuation process. For more information, see ICI’s two white papers titled Valuation and Liquidity Issues for Mutual Funds (February 1997 and March 2002) and two installments of ICI’s Fair Value Series, “An Introduction to Fair Valuation” (2005) and “The Role of the Board” (2007). ICI also has a two-volume compendium of SEC releases, staff letters, and enforcement actions related to the mutual fund valuation process, which is available at www.ici.org/pdf/pub_11_valuation_volume1.pdf and www.ici.org/pdf/pub_11_valuation_volume2.pdf.
8 The pricing process is also critical for ETFs, although for slightly different reasons. ETFs operate like mutual funds with respect to transactions with authorized participants that trade with the ETF in large blocks, often of 50,000 shares or more. The NAV is the price used for these large transactions. Closed-end funds are not required to strike a daily NAV, but most do so in order to provide the market with the ability to calculate the difference between the fund’s market price and its NAV. That difference is called the fund’s premium or discount.

APPENDIX A258
The Investment Company Act of 1940 requires mutual funds to process
transactions based upon “forward pricing,” meaning that shareholders
receive the next computed NAV following the fund’s receipt of their
transaction order For example, for a fund that prices its shares at 4:00 p m ,9
orders received prior to 4:00 p m receive the NAV determined that same
day at 4:00 p m Orders received after 4:00 p m receive the NAV determined
at 4:00 p m on the next business day Forward pricing is an important
protection for mutual fund shareholders It is designed to minimize the ability
of shareholders to take advantage of fluctuations in the price of the securities
in the fund’s portfolio that occur after the fund calculates its NAV
When a shareholder redeems shares in a mutual fund, he or she can expect
to be paid promptly Mutual funds may not suspend redemptions of their
shares (subject to certain extremely limited exceptions)10 or delay payments
of redemption proceeds for more than seven days
At least 85 percent of a mutual fund’s portfolio must be invested in liquid
securities 11 In part to ensure that redemptions can be made, a security is
generally deemed to be liquid if it can be sold or disposed of in the ordinary
course of business within seven days at approximately the price at which the
mutual fund has valued it Many funds adopt a specific policy with respect
to investments in illiquid securities; these policies are sometimes more
restrictive than the SEC requirements
Oversight and Accountability
All funds are subject to a strong system of oversight from both internal and
external sources Internal oversight mechanisms include boards of directors,
which include independent directors, and written compliance programs
overseen by CCOs, both at the fund and adviser levels External oversight is
provided by the SEC, the Financial Industry Regulatory Association (FINRA),
and external service providers, such as certified public accounting firms
9 Funds must price their shares at least once every business day at a time determined by the fund’s board. Many funds price at 4:00 p.m. eastern time or when the New York Stock Exchange closes.
10 From time to time, natural disasters and other emergencies occur that disrupt fund pricing, but Section 22(e) of the Investment Company Act prohibits funds from suspending redemptions unless the SEC declares an emergency or the New York Stock Exchange closes or restricts trading. The SEC has not declared an emergency in more than 20 years. During that period, the NYSE has closed and funds have suspended redemptions on several occasions, such as during Hurricane Sandy in 2012.
11 Money market funds are held to a stricter standard, and must limit illiquid investments to 5 percent of the portfolio.

HOW U.S.-REGISTERED INVESTMENT COMPANIES OPERATE AND THE CORE PRINCIPLES UNDERLYING THEIR REGULATION 259
Fund Boards
Mutual funds, closed-end funds, and most ETFs have boards The role of a
fund’s board of directors is primarily one of oversight The board of directors
typically is not involved in the day-to-day management of the fund company
Instead, day-to-day management is handled by the fund’s investment adviser
or administrator pursuant to a contract with the fund
Investment company directors review and approve major contracts with
service providers (including, notably, the fund’s investment adviser), approve
policies and procedures to ensure the fund’s compliance with federal
securities laws, and undertake oversight and review of the performance of
the fund’s operations Directors devote substantial time and consider large
amounts of information in fulfilling these duties, in part because they must
perform all their duties in “an informed and deliberate manner ”
Fund boards must maintain a particular level of independence The
Investment Company Act of 1940 requires at least 40 percent of the members
of a fund board to be independent from fund management An independent
director is a fund director who does not have any significant business
relationship with a mutual fund’s adviser or underwriter In practice, most
fund boards have far higher percentages of independent directors As of
year-end 2012, independent directors made up three-quarters of boards in
approximately 85 percent of fund complexes 12
Independent fund directors play a critical role in overseeing fund operations
and are entrusted with the primary responsibility for looking after the
interests of the fund’s shareholders They serve as watchdogs, furnishing an
independent check on the management of funds Like directors of operating
companies, they owe shareholders the duties of loyalty and care under
state law But independent fund directors also have specific statutory and
regulatory responsibilities under the Investment Company Act beyond the
duties required of other types of directors Among other things, they oversee
the performance of the fund, approve the fees paid to the investment adviser
for its services, and oversee the fund’s compliance program
12 See Overview of Fund Governance Practices, 1994–2012 for a description of the study that collects data on this and other governance practices. Available at www.idc.org/pdf/pub_13_fund_governance.pdf.

APPENDIX A260
Compliance Programs
The internal oversight function played by the board has been greatly
enhanced in recent years by the development of written compliance programs
and a formal requirement that all funds have CCOs Rules adopted in 2003
require every fund and adviser to have a CCO who administers a written
compliance program reasonably designed to prevent, detect, and correct
violations of the federal securities laws Compliance programs must be
reviewed at least annually for their adequacy and effectiveness, and fund
CCOs are required to report directly to the independent directors
Regulatory Oversight
Internal oversight is accompanied by a number of forms of external oversight
and accountability Funds are subject to inspections, examinations, and
enforcement by their primary regulator, the SEC Fund underwriters and
distributors also are overseen by FINRA, a self-regulatory organization Funds
affiliated with a bank may additionally be overseen by banking regulators All
funds are subject to the antifraud jurisdiction of each state in which the fund’s
shares are offered for sale or sold
Auditors
A fund’s financial statement disclosure is also subject to several internal
and external checks For example, annual reports include audited financial
statements certified by a certified public accounting firm subject to oversight
by the Public Company Accounting Oversight Board (PCAOB) This ensures
that the financial statements are prepared in conformity with generally
accepted accounting principles (GAAP) and fairly present the fund’s financial
position and results of operations
Sarbanes-Oxley Act
Like officers of public companies, fund officers are required to make
certifications and disclosures required by the Sarbanes-Oxley Act For
example, they must certify the accuracy of the financial statements

HOW U.S.-REGISTERED INVESTMENT COMPANIES OPERATE AND THE CORE PRINCIPLES UNDERLYING THEIR REGULATION 261
Additional Regulation of Advisers
In addition to the system of oversight applicable directly to funds, investors
enjoy protections through SEC regulation of the investment advisers that
manage fund portfolios All advisers to registered funds are required to
register with the SEC, and are subject to SEC oversight and disclosure
requirements Advisers also owe a fiduciary duty to each fund they advise,
meaning that they have a fundamental legal obligation to act in the best
interests of the fund pursuant to a duty of undivided loyalty and utmost good
faith
Limits on Leverage
The inherent nature of a fund—a professionally managed pool of securities
owned pro rata by its investors—is straightforward and easily understood
by investors The Investment Company Act of 1940 fosters simplicity by
prohibiting complex capital structures and limiting funds’ use of leverage
The Investment Company Act imposes various requirements on the capital
structure of mutual funds, closed-end funds, and ETFs, including limitations
on the issuance of “senior securities” and borrowing These limitations greatly
minimize the possibility that a fund’s liabilities will exceed the value of its
assets
Generally speaking, a senior security is any debt that takes priority over
the fund’s shares, such as a loan or preferred stock The SEC historically has
interpreted the definition of senior security broadly, taking the view that
selling securities short, purchasing securities on margin, and investing in
many types of derivative instruments, among other practices, may create
senior securities

APPENDIX A262
The SEC also takes the view that the Investment Company Act prohibits a
fund from creating a future obligation to pay unless it “covers” the obligation
A fund generally can cover an obligation by owning the instrument underlying
that obligation For example, a fund that wants to take a short position in a
certain stock can comply with the Investment Company Act by owning an
equivalent long position in that stock The fund also can cover by earmarking
or segregating liquid securities equal in value to the fund’s potential exposure
from the leveraged transaction The assets set aside to cover the potential
future obligation must be liquid, unencumbered, and marked-to-market daily
They may not be used to cover other obligations and, if disposed of, must be
replaced
The Investment Company Act also limits borrowing With the exception of
certain privately arranged loans and temporary loans, any promissory note
or other indebtedness would generally be considered a prohibited senior
security 13 Mutual funds and ETFs are permitted to borrow from a bank if,
immediately after the bank borrowing, the fund’s total net assets are at least
three times total aggregate borrowings In other words, the fund must have
at least 300 percent asset coverage
Closed-end funds have a slightly different set of limitations They are
permitted to issue debt and preferred stock, subject to certain conditions,
including asset coverage requirements of 300 percent for debt and 200
percent for preferred stock
Many funds voluntarily go beyond the prohibitions in the Investment
Company Act, adopting policies that further restrict their ability to issue
senior securities or borrow Funds often, for example, adopt a policy stating
that they will borrow only as a temporary measure for extraordinary or
emergency purposes and not to finance investment in securities In addition,
they may disclose that, in any event, borrowings will be limited to a small
percentage of fund assets (such as 5 percent) These are meaningful
voluntary measures, because under the Investment Company Act, a fund’s
policies on borrowing money and issuing senior securities cannot be changed
without the approval of fund shareholders
13 Temporary loans cannot exceed 5 percent of the fund’s total net assets and must be repaid within 60 days.

HOW U.S.-REGISTERED INVESTMENT COMPANIES OPERATE AND THE CORE PRINCIPLES UNDERLYING THEIR REGULATION 263
Custody
To protect fund assets, the Investment Company Act requires all funds
to maintain strict custody of fund assets, separate from the assets of the
adviser Although the Act permits other arrangements,14 nearly all funds use a
bank custodian for domestic securities International securities are required to
be held in the custody of an international bank or securities depository
A fund’s custody agreement with a bank is typically far more elaborate
than the arrangements used for other bank clients The custodian’s services
generally include safekeeping and accounting for the fund’s assets, settling
securities transactions, receiving dividends and interest, providing foreign
exchange services, paying fund expenses, reporting failed trades, reporting
cash transactions, monitoring corporate actions at portfolio companies, and
tracing loaned securities
The strict rules on the custody and reconciliation of fund assets are designed
to prevent theft and other fraud-based losses Shareholders are further
insulated from these types of losses by a provision in the Investment
Company Act that requires all mutual funds to have fidelity bonds
designed to protect them against possible instances of employee larceny or
embezzlement
14 The Investment Company Act contains six separate custody rules for the possible types of custody arrangements for mutual funds, closed-end funds, and ETFs. UITs are subject to a separate rule that requires the use of a bank to maintain custody. See section 17(f) of the Investment Company Act of 1940 and SEC Rules 17f-1 through 17f-7 thereunder.

APPENDIX A264
Prohibitions on Transactions with Affiliates
The Investment Company Act of 1940 contains a number of strong and
detailed prohibitions on transactions between the fund and fund insiders or
affiliated organizations (such as the corporate parent of the fund’s adviser)
Many of these prohibitions were part of the original statutory text of the Act,
enacted in response to instances of overreaching and self-dealing by fund
insiders during the 1920s in the purchase and sale of portfolio securities,
loans by funds, and investments in related funds The SEC’s Division of
Investment Management has said that “for more than 50 years, [the affiliated
transaction prohibitions] have played a vital role in protecting the interests
of shareholders and in preserving the industry’s reputation for integrity; they
continue to be among the most important of the Act’s many protections ”15
Although there are a number of prohibitions in the Investment Company Act
relating to affiliated transactions relating to affiliated transactions, three are
particularly noteworthy:
» Generally prohibiting direct transactions between a fund and an affiliate
» Generally prohibiting joint transactions, where the fund and affiliate are
acting together vis-à-vis a third party
» Preventing investment banks from placing or “dumping” unmarketable
securities with an affiliated fund by generally prohibiting the fund from
buying securities in an offering syndicated by an affiliated investment
bank
Diversification
Both tax and securities law provide diversification standards for funds
registered under the Investment Company Act As discussed in detail above,
under the tax laws, all mutual funds, closed-end funds, and ETFs, as well
as most UITs, qualify as RICs and, as such, must meet a tax diversification
test every quarter The effect of this test is that a fund with a modest cash
position and no government securities would hold securities from at least 12
different issuers Another tax diversification restriction limits the amount of
an issuer’s outstanding voting securities that a fund may own
15 See Protecting Investors: A Half Century of Investment Company Regulation, Report of the Division of Investment Management, Securities and Exchange Commission (May 1992), available at www.sec.gov/divisions/investment/guidance/icreg50-92.pdf. The Division of Investment Management is the division within the SEC responsible for the regulation of funds.

HOW U.S.-REGISTERED INVESTMENT COMPANIES OPERATE AND THE CORE PRINCIPLES UNDERLYING THEIR REGULATION 265
The securities laws set higher standards for funds that elect to be diversified
If a fund elects to be diversified, the Investment Company Act requires that,
with respect to at least 75 percent of the portfolio, no more than 5 percent
may be invested in the securities of any one issuer and no investment may
represent more than 10 percent of the outstanding voting securities of any
issuer Diversification is not mandatory, but all mutual funds, closed-end
funds, and ETFs must disclose whether or not they are diversified under the
Act’s standards
In practice, most funds that elect to be diversified are much more highly
diversified than they need to be to meet these two tests As of December
2014, for example, the median number of stocks held by U S equity funds
was 98 16
16 This number is the median among U.S. actively managed and index equity funds, excluding sector funds.

APPENDIX B266
Appendix B
Significant Events in Fund History
1774 Dutch merchant and broker Adriaan van Ketwich invites subscriptions from
investors to form a trust, the Eendragt Maakt Magt, with the aim of providing
investment diversification opportunities to investors of limited means
1868 The Foreign and Colonial Government Trust, the precursor to the U S investment
fund model, is formed in London This trust provides “the investor of moderate
means the same advantages as large capitalists ”
1924 The first mutual funds are established in Boston
1933 The Securities Act of 1933 regulates the registration and offering of new securities,
including mutual fund and closed-end fund shares, to the public
1934 The Securities Exchange Act of 1934 authorizes the Securities and Exchange
Commission (SEC) to provide for fair and equitable securities markets
1936 The Revenue Act of 1936 establishes the tax treatment of mutual funds and their
shareholders Closed-end funds were covered by the Act in 1942
1940 The Investment Company Act of 1940 is signed into law, setting the structure and
regulatory framework for registered investment companies
The forerunner to the National Association of Investment Companies (NAIC) is
formed The NAIC will become the Investment Company Institute
1944 The NAIC begins collecting investment company industry statistics
1951 The total number of mutual funds surpasses 100, and the number of shareholder
accounts exceeds one million for the first time
1954 Households’ net purchases of fund shares exceed those of corporate stock NAIC
initiates a nationwide public information program emphasizing the role of investors
in the U S economy and explaining the concept of investment companies
1955 The first U S -based international mutual fund is introduced
1961 The first tax-free unit investment trust is offered The NAIC changes its name to the
Investment Company Institute (ICI) and welcomes fund advisers and underwriters
as members

SIGNIFICANT EVENTS IN FUND HISTORY 267
1962 The Self-Employed Individuals Tax Retirement Act creates savings opportunities
(Keogh plans) for self-employed individuals
1971 Money market funds are introduced
1974 The Employee Retirement Income Security Act (ERISA) creates the individual
retirement account (IRA) for workers not covered by employer-sponsored
retirement plans
1976 The Tax Reform Act of 1976 permits the creation of municipal bond funds The first
retail index fund is offered
1978 The Revenue Act of 1978 creates new Section 401(k) retirement plans and simplified
employee pensions (SEPs)
1981 The Economic Recovery Tax Act establishes “universal” IRAs for all workers IRS
proposes regulations for Section 401(k)
1986 The Tax Reform Act of 1986 reduces IRA deductibility
1987 ICI welcomes closed-end funds as members
1990 Mutual fund assets top $1 trillion
1993 The first exchange-traded fund (ETF) shares are issued
1996 Enactment of the National Securities Markets Improvement Act of 1996 (NSMIA)
provides a more rational system of state and federal regulation, giving the SEC
exclusive jurisdiction for registering and regulating mutual funds, exchange-
listed securities, and larger advisers States retain their antifraud authority and
responsibility for regulating non-exchange-listed offerings and smaller advisers
The Small Business Job Protection Act creates SIMPLE plans for employees of small
businesses
1997 The Taxpayer Relief Act of 1997 creates the Roth IRA and eliminates restrictions on
portfolio management that disadvantage fund shareholders
1998 The SEC approves the most significant disclosure reforms in the history of U S
mutual funds, encompassing “plain English,” fund profiles, and improved risk
disclosure
1999 The Gramm-Leach-Bliley Act modernizes financial services regulation and enhances
financial privacy

APPENDIX B268
2001 Enactment of the Economic Growth and Tax Relief Reconciliation Act (EGTRRA) of
2001 significantly expands retirement savings opportunities for millions of working
Americans
2003 The Jobs and Growth Tax Relief Reconciliation Act (JGTRRA) provides mutual fund
shareholders with the full benefits of lower tax rates on dividends and capital gains
2006 Enactment of the Pension Protection Act (PPA) and the Tax Increase Prevention and
Reconciliation Act provides incentives for investors of all ages to save more in tax-
deferred and taxable investment accounts
2008 The SEC votes to adopt the Summary Prospectus rule
Reserve Primary Fund fails to maintain $1 00 NAV, becoming the second money
market fund in 25 years to “break a dollar ”
2009 Money market fund assets hit $3 9 trillion, their highest level to date
The Money Market Working Group, a task force of senior industry executives,
submits its report to the ICI Board The Board endorses the Working Group’s call for
immediate implementation of new regulatory and oversight standards for money
market funds
2010 The SEC adopts new rules and amendments to regulations governing money market
funds
In Jones v. Harris, the U S Supreme Court unanimously upholds the Gartenberg
standard under which courts have long considered claims of excessive fund
advisory fees
Enactment of the RIC Modernization Act streamlines and updates technical tax
rules, benefiting shareholders by making funds more efficient
2011 In Business Roundtable et al. v. SEC, the United States Court of Appeals for the
District of Columbia Circuit vacated the SEC’s proxy access rule for failing to
adequately evaluate the rule’s costs and benefits
ICI Global—the first industry body exclusively advancing the perspective of global
investment funds—is formed
2014 The SEC adopted sweeping changes to the rules that govern money market funds,
building upon the changes to money market fund regulation adopted by the SEC in
2010

GLOSSARYGLOSSARY 269
Glossary
adviser. An organization employed by a mutual fund to give professional advice on the fund’s investments and asset management practices Also known as investment adviser.
after-tax return. The total return of a fund after the effects of taxes on distributions and/or redemptions have been assessed Funds are required by federal securities law to calculate after-tax returns using standardized formulas based upon the highest tax rates (Consequently, they are not representative of the after-tax returns of most mutual fund shareholders ) These standardized after-tax returns are not relevant for shareholders in tax-deferred retirement accounts
aggressive. An investment approach that accepts above-average risk of loss in return for potentially above-average investment returns Contrast conservative.
annual report. A report that a fund sends to its shareholders that discusses the fund’s performance over the past fiscal year and identifies the securities in the fund’s portfolio on the last business day of the fund’s fiscal year The annual report includes audited financial statements See also semiannual report.
appreciation. An increase in an investment’s value Contrast depreciation.
asset allocation. The proportion of different investment classes—such as stocks, bonds, and cash equivalents—that investors hold in their portfolios
asset class. A group of securities or investments that have similar characteristics and behave similarly in the marketplace Three common asset classes are equities (e g , stocks), fixed income (e g , bonds), and cash equivalents (e g , money market funds)
assets. Securities, cash, and receivables owned by a fund
authorized participant. An entity, usually an institutional investor, that submits orders to the exchange-traded fund (ETF) for the creation and redemption of ETF “creation units ”
automatic reinvestment. A fund service giving shareholders the option to purchase additional shares using dividend and capital gains distributions
average portfolio maturity. The average maturity of all the securities in a bond or money market fund’s portfolio
back-end load. See contingent deferred sales load (CDSL).
balanced fund. A fund with an investment objective of both long-term growth and income, to be achieved through investment in stocks and bonds
basis point. One one-hundredth of 1 percent (0 01 percent); thus, 100 basis points equals 1 percentage point When applied to $1 00, 1 basis point is $0 0001; 100 basis points equals one cent ($0 01) Basis points are often used to simplify percentages written in decimal form

GLOSSARY270
bear market. A period during which the majority of securities prices in a particular market (such as the stock market) drop substantially One generally accepted measure is a price decline of 20 percent or more over at least a two-month period Contrast bull market.
benchmark. A standard against which the performance of a security or a mutual fund can be measured For example, Barclays Capital Aggregate Bond Index is a benchmark index for many bond mutual funds Many equity mutual funds are benchmarked to the S&P 500 index See also index.
bond. A debt security issued by a company, municipality, or government agency A bond investor lends money to the issuer and, in exchange, the issuer promises to repay the loan amount on a specified maturity date; the issuer usually pays the bondholder periodic interest payments over the life of the loan
bond fund. A fund that invests primarily in bonds and other debt instruments
breakpoints. The dollar amounts at which many mutual funds offer reduced fees to investors There are two kinds of breakpoints One kind is a reduction in sales charges (load fees) to investors when they initially purchase fund shares The amount of the discount varies, depending upon the amount of the investment: the more invested, the greater the likelihood of surpassing a breakpoint and thus receiving a discount The other kind of breakpoint is a reduction in management fees that fund advisers may charge their associated funds as fund assets surpass a given level
break the dollar. A phrase used to describe when the net asset value (NAV) of a money market fund is repriced from its stable $1 00 NAV, an event that could be triggered by a deviation greater than one-half of 1 percent (one-half cent, or $0 0050) between the fund’s mark-to-market value (shadow price) and its stable $1 00 NAV Also known as break the buck
broker. See broker-dealer.
broker-dealer. A broker is a person or company engaged in the business of effecting transactions in securities for the account of others, and is often paid by commission A dealer is any person or company engaged in the business of buying and selling securities for their own account A broker-dealer is a firm that acts as both a broker and a dealer
bull market. A period during which a majority of securities prices in a particular market (such as the stock market) rise substantially Contrast bear market.
capital gain. An increase in the value of an investment, calculated by the difference between the net purchase price and the net sale price Contrast capital loss.
capital gains distributions. Profits distributed to shareholders resulting from the sale of securities held in the fund’s portfolio
capital loss. A decline in the value of an investment, calculated by the difference between the net purchase price and the net sale price Contrast capital gain.

271GLOSSARY
catch-up contribution. Individuals aged 50 or older are permitted to make contributions to an individual retirement account (IRA) or employer-sponsored retirement savings plan in excess of the annual contribution limit In 2014, the catch-up limit was $1,000 for IRAs, $2,500 for SIMPLE plans, and $5,500 for 401(k) plans
certificate of deposit (CD). A savings certificate entitling the bearer to receive interest A CD bears a fixed maturity date, has a specified fixed interest rate, and can be issued in any denomination CDs generally are issued by commercial banks and currently are insured by the Federal Deposit Insurance Corporation (FDIC) up to a maximum of $250,000 CDs generally are offered at terms ranging from one month to five years
closed-end fund. A type of investment company that issues a fixed number of shares that trade intraday on stock exchanges at market-determined prices Investors in a closed-end fund buy or sell shares through a broker, just as they would trade the shares of any publicly traded company
commercial paper. Short-term, unsecured notes issued by a corporation to meet immediate short-term needs for cash, such as the financing of accounts payable, inventories, and short-term liabilities Maturities typically range from overnight to 270 days Commercial paper is usually issued by corporations with high credit ratings and sold at a discount from face value
commission. A fee paid to a broker or other sales agent for services related to transactions in securities
common stock. An investment that represents a share of ownership in a corporation
compounding. The cumulative effect that reinvesting an investment’s earnings can have by generating additional earnings of its own Over time, compounding can produce significant growth in the value of an investment
conservative. An investment approach that aims to grow capital over the long term, focusing on minimizing risk Contrast aggressive.
contingent deferred sales load (CDSL). A fee imposed by some funds when shares are redeemed (sold back to the fund) during the first few years of ownership Also known as back-end load.
corporate bond. A bond issued by a corporation, rather than by a government The credit risk for a corporate bond is based on the ability of the issuing company to repay the bond
Coverdell Education Savings Account (ESA). This type of account, formerly known as an education IRA, is a tax-advantaged trust or custodial account set up to pay the qualified education expenses of a designated beneficiary
creation unit. A specified number of shares issued by an exchange-traded fund (ETF) in large blocks, generally between 25,000 and 200,000 shares Authorized participants that buy creation units either keep the ETF shares that make up the creation unit or sell all or part of them on a stock exchange

GLOSSARY272
credit quality. A term used in portfolio management to describe the creditworthiness of an issuer of fixed-income securities and to indicate the likelihood that the issuer will be able to repay its debt
credit risk. The possibility that a bond issuer may not be able to pay interest or repay its debt Also known as default risk See also default.
credit spread. The additional yield required of a debt security beyond that of a risk-free alternative (such as a U S Treasury instrument of the same maturity)
custodian. An organization, usually a bank, that safeguards the securities and other assets of a mutual fund
default. A failure by an issuer to: (1) pay principal or interest when due, (2) meet nonpayment obligations, such as reporting requirements, or (3) comply with certain covenants in the document authorizing the issuance of a bond (an indenture)
defined benefit (DB) plan. An employer-sponsored pension plan in which the amount of future benefits an employee will receive from the plan is defined, typically by a formula based on salary history and years of service The amount of contributions the employer is required to make will depend on the investment returns experienced by the plan and the benefits promised Contrast defined contribution plan.
defined contribution (DC) plan. An employer-sponsored retirement plan, such as a 401(k) plan or a 403(b) plan, in which contributions are made to individual participant accounts Depending on the type of DC plan, contributions may be made by the employee, the employer, or both The employee’s benefits at retirement or termination of employment are based on the employee and employer contributions and earnings and losses on those contributions See also 401(k) plan and 403(b) plan. Contrast defined benefit plan.
depreciation. A decline in an investment’s value Contrast appreciation.
director. Mutual fund directors oversee the management and operations of a fund organized as a corporation and have a fiduciary duty to represent the interests of shareholders Because a fund has no employees, it relies on the adviser and other service providers to run the fund’s day-to-day operations Directors focus on the performance and fees of these entities under their respective contracts, and monitor potential conflicts of interest Fund directors have the same responsibilities as fund trustees See also independent director and trustee.
distribution. (1) The payment of dividends and capital gains, (2) a term used to describe a method of selling fund shares to the public, or (3) a term used to describe a withdrawal of funds from a retirement plan
diversification. The practice of investing broadly across a number of different securities, industries, or asset classes to reduce risk Diversification is a key benefit of investing in mutual funds and other investment companies that have diversified portfolios
dividend. Money that an investment fund or company pays to its shareholders, typically from its investment income, after expenses The amount is usually expressed on a per-share basis

273GLOSSARY
dollar-cost averaging. The practice of investing a fixed amount of money at regular intervals, regardless of whether the securities markets are declining or rising, in the hopes of reducing average share cost by acquiring more shares when prices are low and fewer shares when prices are high
education IRA. See Coverdell Education Savings Account (ESA).
emerging market. Generally, economies that are in the process of growth and industrialization, such as those in Africa, Asia, Eastern Europe, Latin America, and the Middle East While relatively undeveloped, these economies may hold significant growth potential in the future May also be called developing markets
equity. A security or investment representing ownership in a company—unlike a bond, which represents a loan to a borrower Often used interchangeably with stock.
equity fund. A fund that concentrates its investments in equities Also known as a stock fund
exchange privilege. A fund option enabling shareholders to transfer their investments from one fund to another within the same fund family as their needs or objectives change Typically, fund companies allow exchanges several times a year for a low fee or no fee
exchange-traded fund (ETF). An investment company, typically a mutual fund or unit investment trust, whose shares are traded intraday on stock exchanges at market-determined prices Investors may buy or sell ETF shares through a broker just as they would the shares of any publicly traded company
ex-dividend date. With regard to mutual funds, this is the day on which declared distributions (dividends or capital gains) are deducted from the fund’s assets before it calculates its net asset value (NAV) The NAV per share will drop by the amount of the distribution per share
expense ratio. A measure of what it costs to operate a fund—disclosed in the prospectus and shareholder reports—expressed as a percentage of its assets
face value. The stated principal or redemption value of a bond; the amount that a bond’s issuer must repay at the bond’s maturity date
fair value. The price for a security that the fund might reasonably expect to receive upon its current sale
federal funds. Non-interest-bearing deposits held by member banks at the Federal Reserve
Financial Industry Regulatory Authority (FINRA). A self-regulatory organization with authority over U S broker-dealer firms that distribute mutual fund shares as well as other securities FINRA operates under the supervision of the SEC
financial statements. The written record of the financial status of a fund or company, usually published in the annual report The record generally includes a balance sheet, income statement, and other financial statements and disclosures

GLOSSARY274
529 plan. An investment program, offered by state governments, designed to help pay future qualified higher education expenses States offer two types of 529 plans: prepaid tuition programs allow contributors to establish an account in the name of a student to cover the cost of a specified number of academic periods or course units in the future at current prices; and college savings plans allow individuals to contribute to an investment account to pay for a student’s qualified higher education expenses
fixed-income securities. Securities that pay a fixed rate of return in the form of interest or dividend income
forward pricing. The concept describing the price at which mutual fund shareholders buy or redeem fund shares Shareholders must receive the next computed share price following the fund’s receipt of a shareholder transaction order
457 plan. An employer-sponsored retirement plan that enables employees of state and local governments and other tax-exempt employers to make tax-deferred contributions from their salaries to the plan
401(k) plan. An employer-sponsored retirement plan that enables employees to make tax-deferred contributions from their salaries to the plan See also defined contribution plan.
403(b) plan. An employer-sponsored retirement plan that enables employees of universities, public schools, and nonprofit organizations to make tax-deferred contributions from their salaries to the plan See also defined contribution plan.
front-end load. A fee imposed by some funds at the point of purchase to cover selling costs
fund family. A group or complex of mutual funds, each typically with its own investment objective, that is managed and distributed by the same company
funds of funds. Mutual funds that primarily hold and invest in shares of other mutual funds rather than investing directly in individual securities
fund supermarket. A brokerage platform that provides access to funds from a wide range of fund families
government securities. Any debt obligation issued by a government or its agencies (e g , Treasury bills issued by the United States) See also U.S. Treasury securities.
growth and income fund. A fund that has a dual strategy of capital appreciation (growth) and current income generation through dividends or interest payments
growth fund. A fund that invests primarily in the stocks of companies with above-average risk in return for potentially above-average gains These companies often pay small or no dividends and their stock prices tend to be more volatile from day to day
hedge fund. A private investment pool for qualified (typically wealthy) investors that, unlike a mutual fund, is exempt from SEC registration
hybrid fund. A mutual fund that invests in a mix of equity and fixed-income securities

275GLOSSARY
income distributions. Dividends, interest, and/or short-term capital gains paid to a mutual fund’s shareholders Operating expenses are deducted from income before it is distributed to shareholders
income fund. A fund that primarily seeks current income generation rather than capital appreciation
independent director. A fund director or trustee who does not have any significant business relationship with a mutual fund’s adviser or underwriter An independent director better enables the fund board to provide an independent check on the fund’s management See also director and trustee.
index. A portfolio of securities that tracks the performance of a particular financial market or subset of it (e g , stock, bond, or commodity markets) and serves as a benchmark against which to evaluate a fund’s performance The most common index for equity funds is the S&P 500 See also benchmark.
index mutual fund. A fund designed to track the performance of a market index The fund’s portfolio of securities is either a replicate or a representative sample of the designated market index Often referred to as passively managed portfolios.
individual retirement account (IRA). A tax-deferred account set up by or for an individual to hold and invest funds for retirement
inflation. The overall general upward price movement of goods and services in an economy, generally as a result of increased spending that exceeds the supply of goods on the market Inflation is one of the major risks to investors over the long term because it erodes the purchasing power of their savings
inflation risk. The risk that the purchasing power of the future value of assets or income will be lower due to inflation
initial public offering (IPO). A corporation’s or closed-end fund’s first offering of stock or fund shares to the public
institutional investor. The businesses, nonprofit organizations, and other similar investors who own funds and other securities on behalf of their organizations This classification of investors differs from individual or household investors who own the majority of investment company assets
interest/interest rate. The fee charged by a lender to a borrower, usually expressed as an annual percentage of the principal
interest rate risk. Risk of gain or loss on a security due to possible changes in interest-rate levels When interest rates rise, the market value of a debt security will fall, and vice versa
intraday indicative value (IIV). A real-time estimate of an exchange-traded fund’s (ETF) intraday value Third-party providers calculate and disseminate this measure every 15 to 60 seconds during securities market trading hours

GLOSSARY276
investment adviser. See adviser.
investment company. A corporation, trust, or partnership that invests pooled shareholder dollars in securities appropriate to the organization’s objective Mutual funds, closed-end funds, unit investment trusts, and exchange-traded funds are the main types of SEC-registered investment companies
investment objective. The goal (e g , current income, long-term capital growth) that a mutual fund pursues on behalf of its investors
investment return. The gain or loss on an investment over a certain period, expressed as a percentage Income and capital gains or losses are included in calculating the investment return
investment risk. The possibility of losing some or all of the amounts invested or not gaining value in an investment
issuer. The company, municipality, or government agency that issues securities, such as stocks, bonds, or money market instruments
Keogh. A tax-favored investment vehicle covering self-employed individuals, partners, and owners of unincorporated businesses; also called an H R 10 plan These were first made available by Congress in 1962, but today operate under rules very similar to those for retirement plans for a corporation’s employees
level load. A combination of an annual 12b-1 fee (typically 1 percent) and a contingent deferred sales load fee (also often 1 percent) imposed by funds when shares are sold within the first year after purchase See also contingent deferred sales load and 12b-1 fee.
lifecycle fund. See target date fund.
lifestyle fund. Mutual funds that maintain a predetermined risk level and generally use words such as “conservative,” “moderate,” or “aggressive” in their names to indicate the fund’s risk level Also known as target risk fund
liquidity. The ability to gain ready access to invested money Mutual funds are liquid because their shares can be redeemed for the next computed net asset value (NAV) on any business day In the securities market, a security is said to be liquid if the spread between bid and ask prices is narrow and reasonably sized trades can take place at those quotes
load. See sales charge.
load fund. A mutual fund that imposes a sales charge—either when fund shares are purchased (front-end load) or redeemed (contingent deferred sales load)—or a fund that charges a 12b-1 fee greater than 0 25 percent
long-term funds. A mutual fund industry designation for all funds other than money market funds Long-term funds are broadly divided into equity (stock), bond, and hybrid funds
management fee. The amount paid by a mutual fund to the investment adviser for its services

277GLOSSARY
market value. The price at which a security was last traded or a price based on its current ask or bid prices
maturity. The date by which an issuer promises to repay a bond’s face value
money market. The global financial market for short-term borrowing and lending where short-term instruments such as Treasury bills (T-bills), commercial paper, and repurchase agreements are bought and sold
money market fund. A mutual fund that invests in short-term, high-grade, fixed-income securities, and seeks the highest level of income consistent with preservation of capital (i e , maintaining a stable share price)
MuniFund Term Preferred (MTP) shares. Exchange-listed closed-end fund preferred shares that have a fixed dividend rate set at the time of issuance MTP shares have a mandatory redemption period (usually five years) unless they are redeemed or repurchased earlier by the fund Unlike fixed-rate preferred stock previously issued, MTP shares were created for issuance by closed-end funds investing in municipal bonds
mutual fund. An investment company registered with the SEC that buys a portfolio of securities selected by a professional investment adviser to meet a specified financial goal (investment objective) Mutual funds can have actively managed portfolios, in which a professional investment adviser creates a unique mix of investments to meet a particular investment objective, or passively managed portfolios, in which the adviser seeks to track the performance of a selected benchmark or index One hallmark of mutual funds is that they issue redeemable securities, meaning that the fund stands ready to buy back its shares at their current net asset value (NAV) See also open-end investment company.
net asset value (NAV). The per-share value of an investment company, calculated by subtracting the fund’s liabilities from the current market value of its assets and dividing by the number of shares outstanding Mutual funds calculate their NAVs at least once daily
net new cash flow. The dollar value of new sales minus redemptions, plus net exchanges A positive number indicates new sales plus exchanges into funds exceeded redemptions plus exchanges out of funds A negative number indicates redemptions plus exchanges out of funds exceeded new sales plus exchanges into funds
no-load fund. A mutual fund whose shares are sold without a sales commission and without a 12b-1 fee of more than 0 25 percent per year
open-end investment company. The legal name for a mutual fund, indicating that it stands ready to redeem (buy back) its shares from investors
operating expenses. Business costs paid from a fund’s assets These include management fees, 12b-1 fees, and other expenses
payroll deduction plan. An arrangement that some employers offer where employees can authorize their employer to deduct a specified amount from their salaries at stated times to buy mutual fund shares

GLOSSARY278
pooled investing. The basic concept behind mutual funds in which a fund aggregates the assets of investors who share common financial goals A fund uses the pooled assets to buy a diversified portfolio of investments, and each mutual fund share purchased represents ownership in all the fund’s underlying securities
portfolio. A collection of securities owned by an individual or an institution (such as a mutual fund) that may include stocks, bonds, money market instruments, and other securities
portfolio manager. A specialist employed by a mutual fund’s adviser to invest the fund’s assets in accordance with predetermined investment objectives
portfolio turnover rate. A measure of how frequently securities are bought and sold within a fund during a year The portfolio turnover rate usually is expressed as a percentage of the total value of a fund
prepayment risk. The possibility that a bond owner will receive his or her principal investment back from the issuer prior to the bond’s maturity date
principal. See face value
prospectus. The official document that describes an investment company to prospective investors The prospectus contains information required by the SEC, such as investment objectives and policies, risks, services, and fees
puttable preferred stock. See Variable Rate Demand Preferred (VRDP) shares.
redeem. To sell mutual fund shares back to the fund Mutual fund shares may be redeemed on any business day An investor receives the next computed share price, called net asset value (NAV), minus any deferred sales charge or redemption fee
redemption price. The amount per share that mutual fund shareholders receive when they redeem
registered investment company. A company that is required to register as an investment company with the SEC under the Investment Company Act of 1940 and is also required to register the public offering of its shares under the Securities Act of 1933 The definition of investment company in the Investment Company Act of 1940 generally includes any company that is engaged primarily in the business of investing, reinvesting, or trading in securities
regulated investment company (RIC). An investment company or trust eligible under subchapter M of the Internal Revenue Code to eliminate tax at the fund level by distributing all of its taxable income to its shareholders The fund’s income thus is taxed only once, at the investor level To qualify as a RIC, a corporation must be registered at all times during the taxable year under the Investment Company Act of 1940 and must derive at least 90 percent of its income from certain sources, including dividends, interest, and capital gains It also must distribute at least 90 percent of the dividends and interest received Mutual funds and closed-end funds are both regulated investment companies
reinvestment privilege. An option whereby shareholders may elect to use dividend and capital gains distributions to automatically buy additional fund shares

279GLOSSARY
repurchase agreements. A form of short-term funding for dealers The dealer sells the securities to investors, usually on an overnight basis, and buys them back at a higher price reflecting the cost of funding Also known as a repo
required minimum distribution (RMD). Minimum distribution rules require that beginning at age 70½, the entire amount of a traditional IRA or 401(k) account be distributed over the expected life of the individual (or the joint lives of the individual and designated beneficiary) Distributing less than the required amount will result in a tax penalty Roth IRAs are not subject to required minimum distributions during the account holder’s lifetime
return. The gain or loss of a security in a particular period It is usually quoted as a percentage
RIC. See regulated investment company.
risk. The degree of uncertainty associated with the return on an asset
risk/return tradeoff. The principle that an investment must offer a higher expected return as compensation for the likelihood of higher volatility in returns
risk tolerance. An investor’s willingness to lose some or all of an investment in exchange for greater potential returns
rollover. The transfer of an investor’s assets from one qualified retirement plan (including an IRA) to another—due to changing jobs, for instance—without a tax penalty
Roth 401(k) plan account. A type of account within a 401(k) plan to which after-tax contributions are made, and from which qualified distributions of contributions and earnings are tax free
Roth IRA. An individual retirement plan, first available in 1998, that permits only after-tax contributions; earnings are not taxed, and qualified distributions of earnings and principal are generally tax-free
sales charge. An amount charged for the sale of some fund shares, usually those sold by brokers or other sales professionals By regulation, mutual fund sales charges are capped The charge may vary depending on the amount invested and the fund chosen Also known as the load
SAR-SEP IRA (salary reduction simplified employee pension). A SEP IRA with a salary reduction feature (see SEP IRA) The Small Business Job Protection Act of 1996, which created SIMPLE IRAs, prohibited the formation of new SAR-SEP IRAs, which were created in 1986
secondary market. Market in which an investor purchases or sells certain investment company shares (closed-end, UIT, and ETF) from another investor through an intermediary such as a broker-dealer
sector fund. A fund that invests in a particular or specialized segment of the marketplace, such as stocks of companies in the software, healthcare, or real estate industries
Securities and Exchange Commission (SEC). The primary U S government agency responsible for the regulation of the day-to-day operations and disclosure obligations of registered investment companies

GLOSSARY280
securitization. The process of aggregating similar instruments, such as loans or mortgages, into a negotiable security, such as the creation of mortgage-backed securities
security. A general term for stocks, bonds, mutual funds, and other investments
semiannual report. A report a fund sends to its shareholders that discusses the fund’s performance over the first six months of the fiscal year and identifies the securities in the fund’s portfolio on the last business day of the first six months of the fiscal year See also annual report
separate account. An insurance company account that is segregated or separate from the insurance company’s general assets Also refers to a fund managed by an investment adviser for a single plan
SEP IRA (simplified employee pension plan). A retirement program created in 1978 that consists of individual retirement accounts for all eligible employees, to which the employer can contribute according to certain rules A fairly simple, inexpensive plan to establish and administer, a SEP IRA can be attractive to small businesses and self-employed individuals
series fund. A group of different mutual funds, each with its own investment objective and policies, that is structured as a single corporation or business trust
share. A representation of ownership in a company or investment fund Also a synonym for stock
share classes. Some mutual funds offer investors different types of shares known as classes (e g , Class A, institutional shares) Each class will invest in the same portfolio of securities and will have the same investment objectives and policies, but each class will have different shareholder services and/or distribution arrangements with different fees and expenses and, therefore, different performance results A multiclass structure offers investors the ability to select a fee and expense structure that is most appropriate for their investment goals (including the time that they expect to remain invested in the fund)
shareholder. An investor who owns shares of a mutual fund or other company
short-term fund. See money market fund
SIMPLE IRA (savings incentive match plan for employees). A simplified tax-favored retirement plan created in 1996 that small employers can set up for the benefit of their employees
stable value fund. An investment fund that seeks to preserve principal and to provide consistent returns and liquidity Stable value funds include collective investment funds sponsored by banks or trust companies or contracts issued by insurance companies
S&P 500 index. A daily measure of stock market performance based on 500 U S stocks chosen for market size, liquidity, and industry group representation
statement of additional information (SAI). The supplementary document to a prospectus that contains more detailed information about a fund; also known as “Part B” of the prospectus

281GLOSSARY
stock. A share of ownership or equity in a corporation
stock fund. See equity fund
summary prospectus. Pursuant to an SEC rule adopted in 2009, all funds must provide their investors with a brief summary (generally three to four pages) in plain English of the key information in the fund’s full (lengthy) statutory prospectus The summary prospectus must contain the following items in standardized order and cannot include additional information, nor omit required information: investment objectives/goals; fee and expense tables; principal investment strategies, principal risks and performance table; and management information See also prospectus.
target date fund. A hybrid fund that follows a predetermined reallocation of risk over a working career and into retirement for a person expecting to retire at the target date of the fund (which is usually included in the fund’s name) These funds invest in a mix of asset classes and typically rebalance their portfolios over time to become more conservative and income producing Also known as lifecycle fund.
target risk fund. See lifestyle fund
tender offer. In a closed-end fund tender offer, shareholders are given a limited opportunity to sell a portion of their shares back to the fund at a price—the tender price Generally, the tender price is close to the fund’s NAV and is higher than the market price
total net assets. The total amount of assets, less any liabilities, a fund holds as of a certain date
total return. A measure of a fund’s performance that encompasses all elements of return: dividends, capital gains distributions, and changes in net asset value (NAV) Total return is the change in value of an investment over a given period, assuming reinvestment of any dividends and capital gains distributions, expressed as a percentage of the initial investment
traditional IRA. The first type of individual retirement account, created in 1974 Individuals may make tax-deductible or nondeductible (depending on income and other requirements) contributions to these accounts See also individual retirement account (IRA)
transfer agent. The internal or external organization that a mutual fund uses to prepare and maintain records relating to shareholder accounts
Treasury bill (T-bill). A short-term debt obligation of the U S government with a maturity of less than one year T-bills are sold in denominations of $1,000 up to a maximum purchase of $5 million and commonly have maturities of one month (four weeks), three months (13 weeks), or six months (26 weeks)
trustee. A member of the board of trustees of a fund organized as a business or statutory trust Mutual fund trustees oversee the management and operations of the fund and have a fiduciary duty to represent the interests of shareholders Fund trustees have the same responsibilities as fund directors See also director

GLOSSARY282
12b-1 fee. A mutual fund fee, named for the SEC rule that permits it, used to pay distribution costs such as compensation to financial advisers for initial and ongoing assistance If a fund has a 12b-1 fee, it will be disclosed in the fee table of a fund’s prospectus
underwriter. A mutual fund underwriter enters into sales agreements with retail distributors (e g , broker-dealers) of the mutual fund To sell fund shares, a retail distributor must have executed a contract with a fund or its principal underwriter, which authorizes the distributor to offer and sell fund shares to the public Generally speaking, a fund’s underwriter is not involved in the offer or sale of fund shares to investors
unit investment trust (UIT). A type of fund with some characteristics of mutual funds and some of closed-end funds Like mutual funds, UITs issue redeemable shares Like closed-end funds, however, UITs typically issue only a specific, fixed number of shares A UIT does not actively trade its investment portfolio, instead buying and holding a set of particular investments until a set termination date, at which time the trust is dissolved and proceeds are paid to shareholders
U.S. Treasury securities. Debt securities issued by the U S government and secured by its full faith and credit Treasury securities are the debt financing instruments of the U S federal government, and they are often referred to simply as Treasuries There are four types of Treasury securities: Treasury bills, Treasury bonds, Treasury notes, and Treasury inflation protected securities (TIPS) See also Treasury bill.
variable annuity. An investment contract sold by an insurance company Capital is accumulated, often through mutual fund investments, with the option to convert to an income stream in retirement
Variable Rate Demand Preferred (VRDP) shares. A type of puttable preferred stock that is similar to auction market preferred stock (AMPS) in that they pay dividends at variable rates, and sell orders are filled to the extent there are bids Rates are set through remarketings, and if there are more sell orders than bids, a third party (commonly referred to as a liquidity provider) purchases the VRDP shares
withdrawal plan. A fund service allowing shareholders to receive income or principal payments from their fund account at regular intervals
yield. A measure of income (dividends and interest) earned by the securities in a fund’s portfolio less the fund’s expenses during a specified period A fund’s yield is expressed as a percentage of the maximum offering price per share on a specified date
yield curve. The graphical depiction of the relationship between the yield on bonds of the same credit quality but different maturities The most frequently reported yield curve compares the yields on three-month, two-year, five-year, and 30-year U S Treasury securities This yield curve is used as a benchmark for other debt in the market, such as mortgage rates or bank lending rates

283INDEX
A page number with an f indicates a figure; an n indicates a note; a t indicates a table. Page numbers in bold indicate a definition.
12b-1 fees, 92, 98, 102, 103, 105, 282
401(k) plans, 274
account balances, 149, 149f
asset allocation, 145–47, 146f, 147f
assets, 124f, 137f, 141, 141f
employer contributions to, 142–43, 142f, 143f
equity funds, 110, 111f
household financial assets in, 12, 13f, 136f
investment options, 144, 144f
investor demographics, 129f, 145–47, 146f, 147f, 149,149f
lifestyle funds in, 164f
loan activity, 150
mutual fund assets in, 120–21, 121f, 122f, 123f, 161,162f
mutual fund fees, 104, 106f, 108–11, 109f, 111f
purchase sources, 120–21, 121f, 122f, 123f, 124f
services and expenses, 104, 106f, 108–11, 109f, 111f
target date funds in, 144f, 145, 146f, 148–49, 148f, 164f
403(b) plans, 274
assets, 124f, 137f, 141, 141f
household financial assets in, 13f, 136f
investor demographics, 129f
lifestyle funds in, 164f
mutual fund assets in, 121f, 122f, 123f, 161, 162f
purchase sources, 120–21, 121f, 122f, 123f, 124f
target date funds in, 164f
457 plans, 274
assets, 124f, 137f, 141, 141f
household financial assets in, 13f, 136f
investor demographics, 129f
lifestyle funds in, 164f
mutual fund assets in, 121f, 122f, 123f, 162f
purchase sources, 120–21, 121f, 122f, 123f, 124f
target date funds in, 164f
529 plans, 30f, 124f, 165–66, 166f, 167f, 274
Aaccountants, 122, 122f, 123f, 245f
actively managed domestic equity funds, 18, 47
actively managed ETFs, 59, 61, 73, 183t, 184t, 185t
actively managed mutual funds, 96, 96f, 98–99, 99f, 242
administrators, 245f, 247
advisers, 269
compensation of, 104, 105
as intermediaries, 15, 15f, 33
IRA rollovers and, 154, 155f
advisers (continued)
mutual fund, 245f, 246, 247, 258, 259
as purchase sources, 104, 122, 122f, 123f
regulation of, 241, 261
affiliated transaction prohibitions, 264
Africa region, 10f, 59f, 237t, 238t, 239t
after-tax return, 269
age demographics
401(k) owners, 149, 149f
bond fund owners, 40–41, 41f
generational mutual fund ownership, 117, 117f
Internet use and, 129, 129f
IRA owners, 139–40, 139f, 140f, 154, 156, 157f
mutual fund owners, 40, 41f, 115f, 116–19, 116f
retirement account owners, 139–40
risk tolerance and, 40, 40f
agency securities, 14f, 15, 52–53, 53f, 212t, 213t
aggressive, 269
alternative minimum tax, 252
alternative strategies funds, 43–44, 44f, 214t
American Taxpayer Relief Act of 2012, 165
Americas region, 10f, 59f, 237t, 238t, 239t
annual reports, 256, 260, 269
annuities, 75, 75f, 88, 88f, 137, 137f, 151f. See also variable
annuities
appreciation, 269
Asia and Pacific region, 10f, 59f, 237t, 238t, 239t
asset allocation, 41–42, 145–47, 146f, 147f, 156, 157f, 269
asset allocation funds, 42. See also hybrid funds
asset-based fees, 105–6, 108
asset class, 269
assets, 269
asset-weighted turnover rate, 37, 37f
auditors, 248, 260
authorized participants, 62–66, 63f, 269
automatic reinvestment, 269
average portfolio maturity, 269
BBaby Boom Generation, 117, 117f
back-end load, 92, 269
back-end load share classes, 103, 106, 107f
balanced funds, 269. See also hybrid funds; lifestyle funds;target date funds
401(k) investment options, 144f, 145, 146f, 147
characteristics, 42, 163
non–target date, 144f, 145, 146f, 156
Index

284 INDEX
balanced funds (continued)
retirement assets in, 156, 157f, 160, 161, 162, 162f
bank notes, 212t, 213t
banks
as custodians, 263
as intermediaries, 15, 15f
money market fund trends and, 51, 51f
as mutual fund purchase sources, 122, 122f, 123f
retirement assets held by, 151f
basis points, 92n, 269
bear market, 270
benchmark, 270
blend funds, 224t, 225t
boards of directors, 244, 245f, 246, 258–59
bond and income funds, 175t, 177t
bond closed-end funds, 79f, 82–83, 82f, 83f, 86, 181t, 182t
bond ETFs, 67f, 70, 70f, 71, 71f, 183t, 184t, 185t
bond funds, 270. See also government bond funds;high-yield bond funds; investment grade bond funds;multisector bond funds; municipal bond funds; worldbond funds
401(k) investment options, 144f, 145, 146f
alternative strategies, 214t
assets, 8, 10, 26, 28, 29f
asset share at largest complexes, 18
capital gains distributions, 254
capital gains paid and reinvested, 202t
closed-end, 79f, 82–83, 82f, 83f, 86, 181t, 182t
corporate, 38
demand for, 28, 30, 38
demographic effects on, 40–41, 41f
dividends paid and reinvested, 201t, 252, 253
exchange redemptions, 192t, 197t
exchange sales, 192t, 195t
expenses, 92, 93f, 99f, 100, 101f, 105f
household investments in, 29, 30f, 88, 88f
individual accounts, 234t
institutional accounts, 234t, 235t
IRA investments in, 156, 157f
liquidity, 187t, 188t
mortgage-backed securities, 38
net new cash flow, 18, 30, 31f, 33, 35f, 38–41, 39f, 189t,192t, 193t, 226t, 227t
new sales, 192t, 194t
number of funds, 177t, 178t, 226t
number of share classes, 179t, 180t, 226t
portfolio holdings and percentage of total net assets,200t
redemptions, 192t, 196t, 198t
retirement assets in, 120, 160, 161f, 162, 162f, 226t,227t
returns on, 38, 39f
short-term, 38
target date funds’ effect on, 41
bond funds (continued)
taxable, 101f, 175t, 177t, 179t
taxable closed-end, 82f, 181t, 182t
tax-exempt, 252
total net assets, 175t, 176t, 226t, 234t
total portfolio, common stock, and other securities:purchases, sales, and net purchases, 206t
trends, 26, 38–41, 39f, 40f, 41f
variable annuity, 232t, 233t
bond funds of funds, 217t, 218t
bond index funds, 45, 45f, 46f, 97f, 99f, 219t, 220t, 221t,
222t
bond market, 32
bonds, 270. See also bond funds; municipal bonds
directly held, 11, 12f, 88, 88f
IRA investments in, 151, 151f, 152, 156, 157f
net new cash flow, 33
returns on, 32, 38, 39f
tender option, 85, 87, 87f
breakpoints, 102, 270
break the dollar, 270
BrightScope, 142
broad-based domestic equity ETFs, 58, 70, 70f, 71f, 183t,
184t, 185t
broker, 270
brokerage firms, 15, 15f, 150, 151f, 241
broker-dealer, 68, 270
bull market, 270
business corporation assets, 13, 28, 49, 235t, 236t
Ccapital appreciation equity funds
exchange redemptions, 197t
exchange sales, 195t
liquidity, 188t
net new cash flow, 193t
new sales, 194t
number of funds, 178t
number of share classes, 180t
redemptions, 196t
total net assets, 176t
capital gain, 270
capital gains distributions, 10, 251, 252, 254, 254f, 270
capital gains paid and reinvested, 202t
capital loss, 252, 270
catch-up contributions, 152, 271
CDSL (contingent deferred sales load), 103, 271
certificates of deposit (CDs), 212t, 213t, 271
CFTC (Commodity Futures Trading Commission), 60
Chicago Board Options Exchange Volatility Index (VIX), 35
Class A, B, or C shares. See share classes
closed-end funds, 271
assets, 9f, 81–82, 81f, 181t
bond, 79f, 82–83, 82f, 83f, 86, 181t, 182t

285INDEX
closed-end funds (continued)
characteristics, 78, 80, 243
common shares, 80
creation of, 80
custody rules, 263n
disclosure requirements, 255n
distributions, 84, 84f
diversification standards, 264–65
domestic bond, 82f, 83f, 181t, 182t
domestic equity, 82f, 83, 83f, 181t, 182t
equity, 82–83, 82f, 83f, 86, 181t, 182t
global/international, 82f, 83f, 181t, 182t
household investments in, 11f, 12f, 88–89, 88f, 89f
IRA investments in, 151f
leverage ability, 85–87, 85f, 86f, 87f, 261–62
liquidations or closures, 81
liquidity and valuation, 257
municipal bond, 82f, 83, 83f, 181t, 182t
net issuance, 10, 83, 83f, 182t
number of funds, 22, 22f, 81, 81f, 181t
preferred shares, 80, 81, 83, 86, 86f, 262
pricing, 257, 257n8
redemptions, 182t
shareholder characteristics, 88–89, 88f, 89f
taxable bond, 82f, 83f, 181t, 182t
trading, 80
commercial paper, 14, 14f, 212t, 213t, 271
commission, 271
commodities funds, 8
commodity ETFs, 58, 60, 70, 70f, 71f, 73, 74f, 183t, 184t,
185t
Commodity Exchange Act, 60
Commodity Futures Trading Commission (CFTC), 60
commodity markets, 70
common stock, 199t, 200t, 271
common stock purchases, sales, and net purchases, 203t,
204t, 205t, 206t
company stock holdings, 145, 146f
compliance programs, 245, 247, 257, 258, 260
compounding, 40, 271
confidence of consumers, 31–32, 128f, 128, 241
Congressional Budget Office (CBO), 134
conservative, 271
consumer sector funds, 228t, 229t
consumer spending, 31–32
contingent deferred sales load (CDSL), 103, 271
corporate bond funds, 38. See also investment grade
bond funds
corporate bonds, 14f, 15, 199t, 200t, 271
corporate notes, 212t, 213t
cost basis, 252
Coverdell Education Savings Accounts (ESAs), 124f, 165–66,
167f, 271
creation units, 62–63, 63f, 271
credit quality, 272
credit risk, 272
credit spread, 272
currency ETFs, 58, 60
custodians, 245f, 263, 272
Ddefault, 272
defined benefit (DB) plans, 132, 135, 136f, 137–39, 137f,
138f, 139f, 153, 272. See also pension funds
defined contribution (DC) plans, 272. See also 401(k) plans;403(b) plans; 457 plans; Keoghs; Thrift Savings Plan
asset location, 122f
assets, 141, 141f
characteristics, 141
household investments in, 11f, 12, 13f, 136f, 137–40,139f, 140f
IRA rollovers from, 153
lifestyle funds in, 164f
mutual fund assets in, 12, 120–21, 121f, 124, 124f,160–62, 161f, 162f
mutual fund fees, 104, 108
owner demographics, 129, 129f, 136f, 139–40, 140f
percentage of retirement assets in, 131f
purchase sources, 122f, 123f
retirement resource pyramid and, 132, 135, 136f
target date funds in, 41, 164f
U.S. assets, 137–40, 137f, 138f, 140f
Delaware statutory trusts, 243–44, 244f
demographics. See also age demographics
401(k) plan participants, 129f, 145–47, 146f, 147f, 149,149f
bond fund investors, 40–41, 41f
closed-end fund investors, 88–89, 88f, 89f
DC plan investors, 136f, 139–40, 140f
education level, 129f
education savings investors, 166, 167f
ETF investors, 75–77, 75f, 76f, 77f
income level, 116–19, 118f, 119f, 129f, 133, 136f
Internet use by shareholders, 129, 129f
investment goals and, 133, 134f
IRA investors, 139–40, 139f, 140f, 154, 156, 157f
mutual fund investors, 115f, 116–19, 116f, 118f, 119f
mutual fund trends and, 26, 28, 30
retirement plan investors, 134f, 139–40, 139f
depreciation, 272
derivative instruments, 261
directors, 244, 245f, 246, 258–59, 272
disclosure, 255–56
discount brokers, 122–23, 122f, 123f
distributions, 272
capital gains, 10, 202t, 251, 252, 254, 254f
dividend, 10, 201t, 211t, 251, 252, 253, 253f
286 INDEX
distributions (continued)
from IRAs, 158–60, 158f, 159f
diversification, 36, 264–65, 272
dividend, 272
dividend distributions, 10, 201t, 211t, 251, 252, 253, 253f
dollar-cost averaging, 273
domestic bond closed-end funds, 82f, 83f, 181t, 182t
domestic bond funds, 144, 144f
domestic equity closed-end funds, 82f, 83, 83f, 181t, 182t
domestic equity ETFs, 47, 47f, 67f, 70–71, 70f, 71f, 183t,
184t, 185t
domestic equity funds
401(k) investment options, 144
actively managed, 18, 47
alternative strategies, 214t
assets, 8, 10
expense ratios, 94f
net cash flow, 36
number of funds, 177t
number of share classes, 179t
retirement accounts, 162
retirement assets in, 162f
total net assets, 8, 175t
trends in, 18
domestic equity index funds, 18, 45–47, 45f, 46f, 47f, 219t,
220t, 221t, 222t
domestic high-yield bond ETFs, 67f
domestic municipal bond closed-end funds, 82f, 83f, 181t,
182t
domestic sector equity ETFs, 70, 70f, 71f, 73, 74f, 183t,
184t, 185t
domestic taxable bond closed-end funds, 82f, 83f, 181t,
182t
Eeconomic climate, 18–19, 26, 28, 30, 31–32, 43, 126f, 140
Economic Growth and Tax Relief Reconciliation Act
(EGTRRA), 165
EDGAR (Electronic Data Gathering, Analysis, and
Retrieval) system, 256
education IRA. See Coverdell Education Savings Accounts
emerging market, 273
emerging markets bond ETFs, 67f
emerging markets debt mutual funds, 215t
emerging markets equity ETFs, 67f
emerging markets ETFs, 71f
Employee Benefit Research Institute (EBRI), 145
Employee Retirement Income Security Act (ERISA), 150, 152
employer-sponsored retirement plans. See also 401(k)plans; 403(b) plans; 457 plans; defined contributionplans; Keoghs; Roth 401(k); SAR-SEP IRAs; SEP IRAs; SIMPLE IRAs
asset location, 120–21
employer-sponsored retirement plans (continued)
fee structures for, 102
household accounts, 120–24, 121f, 122f, 123f, 124f,139–40, 139f, 140f, 154
purchase sources, 120, 121f, 122f, 123f
retirement resource pyramid and, 132–36, 133f
target date and lifestyle fund assets, 164f
U.S. assets, 137–40, 137f
employment, investment industry, 23–25, 23f, 24f, 25f
equities. See also stock
401(k) investment options, 145, 147, 147f
directly held, 11, 12f, 88, 88f
investment company assets, 14, 14f
IRA assets in, 156, 157f
equity, 273
equity closed-end funds, 82–83, 82f, 83f, 86, 181t, 182t
equity ETFs, 67f, 183t, 184t, 185t
equity funds, 273. See also capital appreciation equityfunds; domestic equity funds; equity index funds;total return equity funds; world equity funds
401(k) investment options, 110, 111f, 144f, 145, 146f
alternative strategies, 214t
capital gains distributions, 254
capital gains paid and reinvested, 202t
closed-end, 82–83, 82f, 83f, 86, 181t, 182t
demand for, 28
diversification of, 265
dividends paid and reinvested, 201t
exchange redemptions, 190t, 197t
exchange sales, 190t, 195t
expenses, 90, 91f, 93f, 95f, 96, 96f, 100, 101f, 105f,108–11, 109f, 111f
household investments in, 29, 30f, 88, 88f
individual accounts, 234t
institutional accounts, 234t, 235t
in IRAs, 156, 157f
liquidity, 187t, 188t
net new cash flow, 30, 31f, 33, 34, 34f, 35f, 189t, 190t,193t, 226t, 227t
new sales, 190t, 194t
number of funds, 177t, 178t, 226t
number of share classes, 179t, 180t, 226t
portfolio holdings and percentage of total net assets,200t
redemptions, 190t, 196t, 198t
retirement assets in, 120, 149, 160, 161f, 162, 162f,226t, 227t
total net assets, 8, 26–28, 29f, 175t, 176t, 226t, 234t
total portfolio, common stock, and other securities:purchases, sales, and net purchases, 204t
trends, 26, 28, 29f, 34–36, 34f, 35f
turnover rate, 37, 37f
variable annuity, 232t, 233t
equity funds of funds, 217t, 218t

287INDEX
equity index funds
assets, 45, 45f, 46f
domestic, 18, 45–47, 45f, 46f, 47f, 219t, 220t, 221t,222t
exchange sales, 221t
expenses, 96–99, 96f, 97f, 99f, 101f
net new cash flow, 45, 45f, 219t
new sales, 221t
number of funds and share classes, 220t
redemptions and exchange redemptions, 222t
S&P 500, 219t, 220t, 221t, 222t
total net assets, 219t
world, 45, 45f, 46f, 219t, 220t, 221t, 222t
ERISA (Employee Retirement Income Security Act), 150, 152
ESAs (Coverdell Education Savings Accounts), 124f, 165–66,167f, 271
ETFs. See exchange-traded funds
euro-denominated securities, 8
eurodollar CDs, 212t, 213t
European mutual fund market, 10f, 59f, 237t, 238t, 239t
eurozone economic climate, 32
exchange privilege, 253, 273
exchanges of shares, 252
exchange-traded funds (ETFs), 273
actively managed, 59, 61, 73, 183t, 184t, 185t
arbitrage opportunities, 65
assets, 8, 56, 57, 59, 59f, 71f, 183t
assets at largest complexes, 17–18, 17f
assets worldwide, 10f, 59, 59f
authorized participants, 62–64, 62–66, 63f
bond, 67f, 70, 70f, 71, 71f, 183t, 184t, 185t
broad-based domestic equity, 58, 70, 70f, 71f, 183t,184t, 185t
characteristics, 58–59, 243
commodity-based, 58, 60, 70, 70f, 71f, 73, 74f, 183t,184t, 185t
creation of, 62–63, 63f, 65, 72, 72f
currency-based, 58, 60
demand for, 10, 56, 69–74, 69f, 70f, 71f, 72f, 74f
diversification with, 264–65
domestic equity, 47, 47f, 67f, 70–71, 70f, 71f, 183t,184t, 185t
domestic sector equity, 70, 70f, 71f, 73, 74f, 183t, 184t,185t
emerging markets, 71f
funds of funds structure, 183t, 184t, 185t
futures-based, 58, 60, 73
global/international equity, 67f, 70, 70f, 71, 71f, 183t,184t, 185t
history, 58–59
household investments in, 11f, 12f, 75–77, 75f, 76f, 77f
hybrid, 70, 70f, 71f, 183t, 184t, 185t
index-based, 47, 47f, 58, 61, 183t, 184t, 185t
exchange-traded funds (ETFs) (continued)
institutional investors in, 13, 62–63
IRA investments in, 151, 151f
large-, mid-, and small-cap equity, 71, 71f
leverage limits, 261–62
liquidations, 72, 72f
liquidity, 257
mutual funds compared with, 67–68
natural resources, 73, 74f
net asset value, 62, 64, 67
net issuance, 10, 69–70, 69f, 70f, 185t
nonregistered, 60, 60f, 69f, 183t, 184t, 185t
number of funds, 22, 22f, 60f, 72, 72f, 184t
origination of, 61–64
pricing, 64–65, 68, 257, 257n8
primary markets, 66, 67f
redemptions, 64, 65
registered, 60, 60f, 69f, 183t, 184t, 185t
regulation of, 60, 255–56, 263n
secondary markets, 66, 67f
sector, 73
sector equity, 183t, 184t, 185t
shareholders, 75–77, 75f, 76f, 77f
sponsors, 56, 61
total net assets, 9f, 59, 59f, 60f, 71f, 183t
trading, 62, 64–67, 67f, 68
transparency, 59, 64
ex-dividend date, 273
exempt-interest dividends, 252
expense ratio, 94–96, 94f, 273. See also mutual fund
expenses and fees
Fface value, 273
fair value, 257, 273
Federal Employees Retirement System (FERS), 137f, 141
federal funds, 273
federal government employee retirement assets, 135, 136f,
137, 137f, 138, 138f, 141
Federal Reserve, 32, 38, 51, 54
financial advisers. See advisers
Financial Industry Regulatory Authority (FINRA), 241, 258,
260, 273
financial institution assets, 29, 235t, 236t
financial sector funds, 228t, 229t
financial statements, 273
fixed annuities, 75, 75f, 88, 88f, 137f
fixed-income securities, 40–41, 61, 75, 156, 157f, 162, 162f,
274
floating-rate high-yield bond mutual funds, 216t
foreign securities, 61, 62. See also global/international
entries; world entries
forward pricing, 68, 258, 274

288 INDEX
front-end load, 92, 104, 105f, 107f, 274
front-end load share classes, 102, 106, 107f
full-service brokers, 122, 122f, 123f
fund family, 274
funds of funds, 41, 183t, 184t, 185t, 217t, 218t, 274
fund supermarkets, 103, 108, 112, 122–23, 122f, 123f, 274
futures ETFs, 58, 60, 73
GGeneration X, 117, 117f
GICs (guaranteed investment contracts), 144, 144f, 145,
146f
GI Generation, 117, 117f
global economic climate, 28, 30, 32, 34, 34f
global equity funds, 34, 34f
global/international closed-end funds, 82f, 83f, 181t, 182t
global/international equity ETFs, 70, 70f, 71, 71f, 183t,
184t, 185t
government agency securities, 14f, 15, 52–53, 53f, 212t,
213t
government bond funds
exchange redemptions, 197t
exchange sales, 195t
liquidity, 188t
net new cash flow, 193t
new sales, 194t
number of funds, 178t
number of share classes, 180t
redemptions, 196t
total net assets, 176t
government bond holdings, 199t, 200t
government employee retirement assets, 135, 136f, 137,
137f, 138, 138f, 141
government money market funds, 48f, 49, 207t, 208t, 209t,
212t
government securities, 274
Greece, 32
gross domestic product, 31
growth and income funds, 274
growth funds, 100, 101f, 224t, 225t, 274
guaranteed investment contracts (GICs), 144, 144f, 145,
146f
Hhealth sector funds, 228t, 229t
hedge funds, 274
high-yield bond funds
ETF, 66, 67f
exchange redemptions, 197t
exchange sales, 195t
floating-rate, 216t
liquidity, 188t
net new cash flow, 193t
new sales, 194t
number of funds, 178t
high-yield bond funds (continued)
number of share classes, 180t
redemptions, 38, 196t
total net assets, 176t
homeownership as retirement resource, 132, 133f, 135
household financial assets. See also demographics; mutual fund shareholders; individual investors;specific classification, such as bond funds
401(k) plans, 12, 13f, 136f
403(b) plans, 13f, 136f
457 plans, 13f, 136f
asset location of, 120–21, 121f, 122f, 123f
capital gains distributions, 254, 254f
defined contribution plans, 11f, 12, 13f, 136f, 137–40,139f, 140f
directly held stocks and bonds, 11, 12f
dividend distributions, 253, 253f
education savings plans, 165–66, 166f, 167f
employer-sponsored retirement plans, 120–24, 121f,122f, 123f, 124f, 139–40, 139f, 140f, 154
ETFs, 11f, 12f, 75–77, 75f, 76f, 77f
investment company holdings, 11, 11f
investment goals and, 28, 33, 113, 115f, 119, 133, 134f,165
investor sentiment and, 31–32, 125, 125f
IRAs, 11f, 12, 13f, 120–21, 121f, 124, 124f, 136f,137–40, 139f, 140f, 152–55, 152f, 156, 157f
mutual funds, 11–12, 11f, 12f, 13f, 28–29, 30f, 33, 88f,89f, 95, 114–19, 114f, 115f, 124, 124f
mutual funds by tax status, 250, 250f
purchase sources, 104, 120, 121f, 122–23, 122f, 123f
retirement accounts, 12, 13f, 120–24, 121f, 122f, 123f,124f, 134f, 136f, 137–40, 139f, 140f
retirement resource pyramid and, 132–36, 133f
risk tolerance and, 35, 40, 40f
taxable accounts, 12, 250, 250f, 253, 253f, 254, 254f
tax-deferred accounts, 250, 250f, 253, 253f, 254, 254f
tax-exempt accounts, 250, 250f, 253, 253f
variable annuities, 12f, 75, 75f, 88, 88f
housing market, 31
hybrid ETFs, 70, 70f, 71f, 183t, 184t, 185t
hybrid funds, 274. See also target date (lifecycle) funds
alternative strategies, 214t
assets, 8, 28, 29f
capital gains distributions, 254
capital gains paid and reinvested, 202t
closed-end fund owner holdings of, 88f
demand for, 28, 42, 42f
dividends paid and reinvested, 201t
exchange redemptions, 191t, 197t
exchange sales, 191t, 195t
expenses, 92, 93f, 100, 101f, 105f
household investments in, 29, 30f
individual accounts, 234t

289INDEX
hybrid funds (continued)
institutional accounts, 234t, 235t
lifestyle, 163, 230t, 231t
liquidity, 187t, 188t
net new cash flow, 26, 30, 31f, 33, 35f, 42, 42f,189t, 191t, 193t, 226t, 227t
new sales, 191t
number of funds, 177t, 178t, 226t
number of share classes, 179t, 180t, 226t
portfolio holdings and percentage of total net assets,200t
redemptions, 191t, 196t, 198t
retirement assets in, 120, 226t, 227t
total net assets, 175t, 176t, 226t, 234t
total portfolio, common stock and other securities:purchases, sales, and net purchases, 205t
trends, 26, 28, 29f, 42, 42f
variable annuity, 232t, 233t
hybrid funds of funds, 217t, 218t
hybrid index funds, 45, 45f, 46f, 97f, 219t, 220t, 221t, 222t
IIIV (intraday indicative value), 64, 275
income distributions, 275. See also distributions, dividend
income funds, 275
income of mutual fund investors. See demographics
independent directors, 258–59, 275
independent financial planners, 122, 122f, 123f
independent fund advisers, 15, 15f
index, 275
index bond funds. See bond index funds
index equity funds. See equity index funds
index ETFs, 47, 47f, 58, 61, 72, 183t, 184t, 185t
index mutual funds, 275. See also bond index funds;equity index funds
assets, 26, 45, 45f
asset share at largest complexes, 18
domestic equity, 18, 45–47, 45f, 46f, 47f, 219t, 220t,221t, 222t
exchange sales, 221t
expenses and fees, 97–99, 97f, 99f
hybrid, 45, 45f, 97f
hybrid and bond, 219t, 220t, 221t, 222t
net cash flows, 18
net new cash flow, 45, 45f, 219t
new sales, 221t
number of funds, 97f, 220t
number of share classes, 220t
redemptions and exchange redemptions, 222t
S&P 500, 219t, 220t, 221t, 222t
total net assets, 45, 46f, 97f, 219t
trends, 26, 45–47, 45f, 46f, 47f, 97–99, 97f, 99f
world equity, 45, 45f, 46f, 219t, 220t, 221t, 222t
individual investors. See also demographics; household financial assets; mutual fund shareholders; shareholder sentiment
bond funds held by, 234t
equity funds held by, 234t
ETFs held by, 69, 75–77, 75f, 76f, 77f
fees and share classes, 107f
hybrid funds held by, 234t
market conditions’ effect on, 33
mutual fund investments, 114–19, 114f, 115f, 116f
total net assets held by, 234t
individual retirement accounts (IRAs), 275. See also RothIRAs; SEP IRAs; SAR-SEP IRAs; SIMPLE IRAs
asset location, 120–21
assets, 137–40, 137f, 138f, 139f, 151, 151f
bond funds, 157f
bonds held in, 151f, 157
catch-up contributions, 152
characteristics, 150
contributions to, 152, 153, 153f
distributions from, 158–60, 158f, 159f
equities held in, 151f, 156, 157f
equity funds, 156, 157f
ETFs, 151f
household investments in, 11f, 12, 13f, 120–21, 121f,124, 124f, 136f, 137–40, 139f, 140f, 152–55, 152f,156, 157f
investor demographics, 139–40, 139f, 140f, 154, 156,157f
investor portfolios, 156, 157f
lifestyle funds in, 164f
money market funds in, 156, 157f
mutual fund fees, 106f
mutual funds held in, 12, 120–21, 124, 124f, 151, 151f,160–61, 162f
percentage of retirement assets in, 131f
purchase sources, 121f, 122f
required minimum distribution (RMD), 158, 279
retirement resource pyramid and, 132, 133f, 135, 136f
rollovers, 153–54, 153f, 155f
target date funds in, 156, 157f, 164f
inflation, 275
inflation-protected mutual funds, 223t
inflation risk, 275
initial public offering (IPO), 275
institutional investors, 275
bond funds held by, 234t, 235t
equity funds held by, 234t, 235t
ETFs held by, 13, 62–63, 69
hybrid funds held by, 234t, 235t
market events effect on, 33
money market funds held by, 13, 29, 30f
mutual funds held by, 29, 30f

290 INDEX
institutional investors (continued)
total net assets held by, 234t, 235t, 236t
types, 235t, 236t
institutional money market funds
demand for, 13, 28, 29, 30f, 48–50
government, 208t, 209t
net new cash flow, 48–49, 49f, 50f, 209t
nonfinancial business assets, 50, 50f
prime, 208t, 209t
taxable, 208t, 209t, 236t
tax-exempt, 208t, 209t
total net assets, 208t, 234t, 235t, 236t
trends, 28, 29f, 48–54, 48f, 49f, 50f, 51f, 53f
institutional no-load share classes, 94, 107f
insurance companies, 15, 15f, 122, 122f, 123f
interest, 275
interest rate risk, 275
interest rates, 26, 30, 32, 38, 51, 70, 275
interest rate spread, 51, 51f
intermediaries, 15, 15f, 22, 22f
international bond funds, 144f
international equity ETFs, 67f
international equity funds, 144
international stock market performance, 8, 34, 34f, 36, 71
Internet use by shareholders, 129, 129f
intraday indicative value (IIV), 64, 275
investment advisers. See advisers
Investment Advisers Act of 1940, 241
investment companies, 276. See also closed-end funds;exchange-traded funds; money market funds; mutual fund entries; regulation of investment companies; unit investment trusts
assets, 8, 9f
corporate equity held by, 14f
definition, 8n
directly held stocks and bonds vs., 11, 12f
employment data, 23–25, 23f, 24f, 25f
entering and leaving business, 16–19, 16f, 17f, 19f
history, 240–41, 266–68
household investments in, 11–12, 12f
net new cash flow, 10, 12f, 17f
number of, 16–19, 16f, 17f, 22, 22f
pooled investing origins, 240–41
role of, 14–15
securities held by, 14, 14f, 15
types, 15, 15f, 22, 22f, 242
Investment Company Act of 1940, 67. See also regulation ofinvestment companies
12b-1 fees, 102
ETF authorization and, 58, 60
regulatory requirements, 241, 242, 244, 246, 258, 259,261–62, 263, 264, 265
investment grade bond funds
exchange redemptions, 197t
exchange sales, 195t
liquidity, 188t
net new cash flow, 193t
new sales, 194t
number of funds, 178t
number of share classes, 180t
redemptions, 196t
total net assets, 176t
investment objectives, 55, 100, 101f, 170, 246, 276
investment professionals. See advisers
investment return, 276
investment risk, 276. See also risk tolerance
investor sentiment, 35, 125, 125f, 126f, 127f
IPO (initial public offering), 275
IRA Investor Database, 153, 156
IRAs. See individual retirement accounts
issuers, 276
KKeoghs, 13f, 124f, 137f, 141, 141f, 151f, 162f, 164f, 276
Llarge-cap domestic equity ETFs, 71, 71f
large-cap equity portfolios, 98, 100
large-cap mutual funds, 224t, 225t
level load, 92, 276
level-load share classes, 103, 106f, 107f
leverage, 85–87, 85f, 86f, 87f, 261–62
lifecycle funds. See target date funds
life insurance companies, 137f, 146f, 147f, 148f, 151f
lifestyle (target risk) funds, 162f, 163, 230t, 231t, 276
liquid assets, 187t, 199t, 200t
liquidity, 187t, 188t, 257–58, 276
load (sales charge), 92, 104–8, 279
load funds, 276
load share classes, 102–3
local government employee retirement plans, 137, 137f,
138, 138f
long-term bond yields, 32
long-term capital gains, 251, 252, 254f
long-term interest rates, 32, 38, 70
long-term mutual funds, 276. See also bond funds; equityfunds; hybrid funds; mutual fund entries
annual redemption rates, 198t
assets, 8, 30f
capital gains paid and reinvested, 202t
demand for, 28, 29f
dividends paid and reinvested, 201t
exchange redemptions, 197t
exchange sales, 195t
expense ratios, 94–96, 94f
household asset location, 120

291INDEX
long-term mutual funds (continued)
household investments in, 12f, 29, 30f
institutional investments in, 29, 30f
liquid assets and liquidity ratio, 187t, 188t
market share, 106f, 107f
net new cash flow, 10, 16, 17f, 30, 31f, 33, 34, 35f, 106f,107f, 189t, 193t
new sales, 194t
portfolio holdings and percentage of total net assets,199t, 200t
redemptions, 196t, 198t
retirement assets in, 124f, 160, 162f
total net assets, 107f, 199t
total portfolio, common stock, and other securities:purchases, sales, net purchases, 203t
long-term U.S. government bonds, 199t, 200t
Mmanagement fees, 246, 276
market capitalization, 224t, 225t
market value, 277
Maryland corporations, 243–44, 244f
Massachusetts business trusts, 243–44, 244f
maturity, 277
mid-cap equity ETFs, 71f
mid-cap equity portfolios, 98, 100
mid-cap mutual funds, 224t, 225t
Millennial Generation, 117, 117f
money market, 277
money market deposit accounts, 51, 51f
money market funds, 144, 144f, 145, 146f, 277. See alsoinstitutional money market funds; retail money market funds; taxable money market funds; tax-exempt money market funds
asset composition of, 212t, 213t
assets, 8, 28, 29f, 30f, 226t, 234t
characteristics, 242
closed-end fund owner holdings of, 88f
commercial paper holdings, 14, 14f
demand for, 48
dividend distributions, 253
dividends paid and reinvested, 211t
exchange redemptions, 210t
exchange sales, 210t
expenses, 100, 101f
Federal Reserve lending facilities, 54
government, 207t, 208t, 209t, 212t
household investments in, 29, 30f, 124, 124f
individual accounts, 234t
institutional, 49f, 208t, 209t, 236t
investment company assets, 14
investor goals, 28
in IRAs, 156
liquidity requirements, 258n11
money market funds (continued)
net new cash flow, 10, 30, 31f, 48, 48f, 49f, 51f, 209t,210t, 226t, 227t
new sales, 210t
number of funds, 177t, 178t, 207t, 226t
number of share classes, 179t, 180t, 207t, 226t
prime, 14, 52–53, 53f, 207t, 208t, 209t, 213t
redemptions, 210t
reforms to, 52–53, 53f
regulation of, 52–53, 53f, 242
retail, 49f, 51, 51f, 208t, 209t, 236t
retirement assets in, 120, 124, 124f, 160, 161f, 162,162f, 226t, 227t
total net assets, 175t, 176t, 207t, 208t, 226t, 234t
trends, 28, 29f, 48–54, 48f, 49f, 50f, 51f, 53f
variable annuity, 232t, 233t
yields, 51
money purchase plans, 141f
Morningstar, 256
mortgage-backed securities, 38
MSCI All Country World Daily Total Return Index, 34, 34f
MTP (MuniFund Term Preferred) shares, 277
multi-cap mutual funds, 224t, 225t
multisector bond funds
alternative strategies, 214t
exchange redemptions, 197t
exchange sales, 195t
liquidity, 188t
net new cash flow, 193t
new sales, 194t
number of funds, 178t
number of share classes, 180t
redemptions, 196t
total net assets, 176t
municipal bond closed-end funds, 82f, 83f, 181t, 182t
municipal bond mutual funds. See also national municipalbond funds; state municipal bond funds
expense ratios, 101f
number of funds, 177t
number of share classes, 179t
total net assets, 175t
municipal bonds, 14f, 15, 199t, 200t, 252
MuniFund Term Preferred (MTP) shares, 277
mutual fund characteristics
compliance programs, 245, 247, 257, 258, 260
custody rules, 263
definition and overview, 242
disclosure and transparency, 255–56
distribution types, 251, 253f, 254f
diversification standards, 264–65
ETFs compared with, 67–68
history, 266–68
leverage limits, 261–62

292 INDEX
mutual fund characteristics (continued)
liquidity requirements, 257–58
net asset value, 62, 64, 242, 257–58
organizational structure, 243–48, 244f, 245f
oversight and accountability, 258–61
pricing, 68, 257–58
prohibited transactions, 261–62, 264
redeemable securities, 242, 257–58
tax features, 249–54, 250f, 253f, 254f
turnover rate, 37, 37f
valuation, 257–58
mutual fund companies, 16–19, 16f, 17f, 19f. See alsoinvestment companies
investor views of, 125, 125f
as purchase sources, 122–23, 122f, 123f
mutual fund expenses and fees. See also specific classification, such as equity funds
12b-1 fees, 92, 98, 102, 103, 105
401(k) plans, 104, 106f, 108–11, 109f, 111f
actively managed funds, 96, 96f
all-in fees, 110
asset-based, 105–6, 108
back-end load, 92, 103, 106, 107f
DC plans, 104, 108
economies of scale and, 95, 98, 111
expense ratios, 92, 94–96, 100, 101f
front-end load, 92, 102, 104, 105f, 106, 107f
fund size and, 94, 94f
index funds, 97–99, 97f, 99f
institutional no-load shares, 94, 107f
investment objectives and, 100, 101f
level-load, 92, 103, 106f, 107f
load fees, 104–8
management fees, 246
no-load shares, 94, 103, 106–8, 106f, 107f
ongoing expenses, 92
share class and, 104–8, 105f, 107f
shareholder views about, 95–96, 95f, 96f, 99
structures of, 102–3, 105f, 107f
target date funds, 96, 96f, 101f
trends, 90–99, 93f, 94f, 95f, 96f, 99f
mutual fund industry data. See also bond funds; equityfunds; hybrid funds; long-term mutual funds; moneymarket funds; mutual fund trends
assets, U.S., 6, 7f, 26, 28, 29f, 30f
asset share at largest complexes, 17–18, 17f
assets worldwide, 10f, 237t, 238t, 239t
capital gains paid and reinvested, 10, 202t
dividends paid and reinvested, 10, 201t
equity funds, 162
exchange redemptions, 174t
exchange sales, 174t
investment objective classifications, 170
IRA assets, 151, 151f
mutual fund industry data (continued)
net new cash flow, 10, 26, 30, 31f, 189–93t
new sales, 174t
number of funds, 22, 22f, 173t, 177t, 178t
number of share classes, 173t, 179t, 180t
redemptions, 174t
research publications, xi
total net assets, 9f, 26, 173t, 175t, 176t, 234t
total net assets by tax status, 250, 250f
total sales, 174t
mutual funds, 277. See also investment companies; long-term mutual funds; money market funds; mutual fund characteristics; mutual fund industrydata; regulation of investment companies
asset location, 120–21
commercial paper holdings by, 14, 14f
creation of, 246
demand for, 26, 28–30, 29f, 30f, 31f
entering and leaving business, 16–19, 19f
equity investments percentage, 162
ETF investments by, 13
history, 240–41
household investments in, 11–12, 11f, 12f, 13f, 28–29,30f, 88f, 89f, 95, 114–19, 114f, 115f, 124, 124f
IRA assets, 12, 120–21, 151, 151f
market cap equity, 224t, 225t
by market capitalization, 224t, 225t
net new cash flow, 30
openings, mergers, and liquidations, 19, 19f
prime money market fund holdings, 14
regulation of, 255–65
sponsors, 16–19, 16f, 17f, 19f, 245f, 246
trading, 68
variable annuities in, 11f, 12, 12f, 30f, 75, 75f, 88, 88f
mutual fund shareholders. See also demographics
asset location, 120–21, 122f, 123f
characteristics, 112, 115f
confidence of, 128, 128f, 241
investment goals of, 28, 113, 115f, 119, 133, 134f, 165
investor sentiment, 125, 125f
lower expense desires of, 95–96, 95f, 96f, 99
purchase sources, 68, 120, 121f, 122–23, 122f, 123f
risk tolerance of, 35, 40, 40f, 77, 77f, 126, 126f, 127f
taxable transactions by, 252
voting rights, 245f, 246
mutual fund trends
alternative strategies funds, 43–44, 44f
assets, U.S., 26–28, 29f, 30, 30f
assets worldwide, 34, 34f, 36
bond funds, 28, 29f, 38–41, 39f, 40f, 41f
equity funds, 26, 28, 29f, 34–36, 34f, 35f
hybrid funds, 26, 28, 29f, 42, 42f
index funds, 45–47, 45f, 46f, 47f, 97–99, 97f, 99f
investor demand and, 26, 28–30, 29f, 30f, 31f

293INDEX
mutual fund trends (continued)
money market funds, 28, 29f, 48–54, 48f, 49f, 50f, 51f,53f
net new cash flow, 26, 30, 31f, 33
Nnational municipal bond funds
exchange redemptions, 197t
exchange sales, 195t
liquidity, 188t
net new cash flow, 193t
new sales, 194t
number of funds, 178t
number of share classes, 180t
redemptions, 196t
total net assets, 176t
natural resources ETFs, 73, 74f
natural resources mutual funds, 228t, 229t
net asset value (NAV), 62, 64, 242, 257–58, 277
net investment income (NII), 251
net new cash flow, 30, 277
New York Stock Exchange closures, 258n10
no-load share classes, 94, 103, 106–8, 106f, 107f, 277
nonfinancial business assets, 13, 29, 50, 50f, 136
nonprofit organization assets, 29, 235t, 236t
non–target date balanced funds, 144f, 145, 146f, 156
non-U.S. fund advisers, 15, 15f
Ooil and gas prices, 32
open-end investment companies, 242, 277. See also mutual
fund entries
operating expenses, 277
organizational structure of mutual funds, 243–48, 244f, 245f
Ppassively managed portfolios, 97, 242. See also index
mutual funds
payroll deduction plans, 277
PCAOB (Public Company Accounting Oversight Board), 260
pension funds, 13, 49, 132, 137, 137f, 138, 138f. See also
defined benefit plans
Pension Protection Act (PPA), 41, 165
pooled investing, 240–41, 278
pooled investment products, 145, 146f, 147f, 148, 148f
portfolio, 278
portfolio leverage, 85, 85f, 86f, 87, 87f
portfolio managers, 278
portfolio turnover rate, 37, 37f, 278
PPA (Pension Protection Act), 41, 165
precious metals sector funds, 228t, 229t
preferred stock, 199t, 200t
prepayment risk, 278
pricing process, 257–58
prime money market funds, 14, 48f, 52–53, 53f, 207t, 208t,
209t, 213t
principal. See face value
principal underwriters, 245f, 248
private-sector retirement plans. See defined benefit plans;
defined contribution plans
profit-sharing plans, 141f
prohibited transactions, 261–62, 264
prospectuses, 255–56, 278
Public Company Accounting Oversight Board (PCAOB), 260
puttable preferred stock. See Variable Rate Demand
Preferred shares
Rreal estate sector funds, 228t, 229t
redeem, 278
redeemable securities, 242, 257–58
redemption price, 278
registered investment advisers. See advisers
registered investment companies, 278
registration statements, 256
regulated investment companies (RICs), 249, 264, 278
regulation of investment companies
core principles, 255–65
custody rules, 263
diversification standards, 264
ETFs, 60, 255–56
legislation, 241
leverage limits, 261–62
liquidity, 257–58
money market funds, 52–53, 242
mutual funds, 255–65
organizational structure, 243–48, 244f, 245f
oversight and accountability, 258–61
prohibited transactions, 261–62, 264
taxation and, 249–54, 250f, 253, 253f, 254, 254f
transparency and disclosure, 255–56
valuation, 257–58
reinvestment privilege, 278
repurchase agreements, 52–53, 53f, 212t, 213t, 279
required minimum distribution (RMD), 158, 279
retail investors. See individual investors
retail money market funds, 49f, 51, 51f, 208t, 209t, 236t
retirement mutual funds, 226t, 227t
exchange redemptions, 227t
exchange sales, 227t
net new cash flow, 226t, 227t
new sales, 227t
no-load share classes, 107f, 108
number of funds, 226t
number of share classes, 226t
redemptions, 227t
total net assets, 226t

294 INDEX
retirement plans. See also defined benefit plans; definedcontribution plans; employer-sponsored retirementplans; individual retirement accounts
as first purchase sources, 120–23, 121f, 122f, 123f
research publications, xii
resource pyramid and, 132–36, 133f, 135f, 136f
unfunded pension liabilities, 138, 138f
U.S. assets, 124, 124f, 137–40, 138f, 139f, 140f
retirement savings. See also 401(k) plans; defined contribution (DC) plans; employer-sponsored retirement plans; individual retirement accounts;specific classification, such as bond funds
asset location, 120–21
assets, 124f, 160–62, 162f
fees, 104
as first purchase sources, 120–23, 121f, 122f, 123f
household accounts, 12, 13f, 120–24, 121f, 122f, 123f,124f, 134f, 136f, 137–40, 139f, 140f
investment goals and, 113, 115f, 119, 133, 134f
return, 279
reverse repurchase agreements, 85, 87, 87f
RICs (regulated investment companies), 249, 264, 278
risk, 279
risk/return tradeoff, 279
risk tolerance, 35, 40, 40f, 77, 77f, 126, 126f, 127f, 279
RMD (required minimum distribution), 158, 279
rollover, 153–54, 153f, 155f, 279
Roth 401(k) plan account, 279
Roth IRAs, 279
asset allocation, 156, 157f
catch-up contributions, 152
characteristics, 150
contributions or rollovers into, 153
distributions from, 158, 158f
household accounts, 121, 124f, 139f, 152, 152f
investor demographics, 154, 156, 157f
near-retiree retirement accounts, 136f
target date and lifestyle fund assets, 164f
U.S. retirement assets and, 137f
“R” share classes, 106f
SSAI (statement of additional information), 255–56, 280
sales charge (load), 92, 104–8, 279
Sarbanes-Oxley Act, 260
SAR-SEP IRAs (salary reduction simplified employeepensions), 279
characteristics, 150
household accounts, 122f, 124f, 139f, 152, 152f
mutual fund assets in, 162f
near-retiree retirement accounts, 136f
purchase sources, 121f, 122f, 123f
target date and lifestyle fund assets, 164f
U.S. retirement assets and, 137f
savings goals of investors, 113, 115f, 119, 133, 134f,
165–66, 166f, 167f
savings incentive match plans for employees. See SIMPLE
IRAs
savings institutions, 122, 122f, 123f
secondary market, 279
Section 529 plans, 30f, 124f, 165–66, 166f, 167f, 274
sector equity ETFs, 73, 74f, 183t, 184t, 185t
sector funds, 98, 100, 101f, 228t, 229t, 279
Securities Act of 1933, 60, 241, 246, 256n5
Securities and Exchange Commission (SEC), 279. See alsoregulation of investment companies
12b-1 fees, 92, 98, 102, 103, 105
affiliated transaction prohibitions, 264
custody rules, 263n
disclosure requirements of, 251, 256
ETF regulation by, 58, 59
money market fund regulation by, 52–53, 53f, 242
registration with, 246, 255n
regulatory authority of, 241, 258, 260
valuation and liquidity requirements, 257
Securities Exchange Act of 1934, 241, 248
securitization, 280
security, 280
selling short, 43, 261–62
semiannual reports, 256, 280
senior securities, 261–62
separate account, 280
SEP IRAs (simplified employee pension plans), 280
characteristics, 150
household accounts, 122f, 124f, 139f, 152, 152f
mutual fund assets in, 162f
near-retiree retirement accounts, 136f
purchase sources, 121f, 122f, 123f
target date and lifestyle fund assets, 164f
U.S. retirement assets and, 137f
series funds, 280
series trusts, 18
share, 280
share classes, 94, 94f, 102–3, 106-8, 106f, 107f, 173t, 179t,
180t, 207t, 280
shareholders, 280. See also mutual fund shareholders
shareholder sentiment, 35, 125, 125f
short positions, 43, 261–62
short-term bond funds, 38
short-term capital gains, 251, 254f
short-term funds. See money market funds
short-term interest rates, 51
Silent Generation, 117, 117f
SIMPLE IRAs (savings incentive match plans for employees),280
characteristics, 150
household accounts, 122f, 124f, 139f, 152, 152f
mutual fund assets in, 162f

295INDEX
SIMPLE IRAs (continued)
near-retiree retirement accounts, 136f
purchase sources, 121f, 123f
target date and lifestyle fund assets, 164f
U.S. retirement assets and, 137f
simplified employee pension plans. See SEP IRAs
small-cap equity ETFs, 71f
small-cap equity portfolios, 98, 100
small-cap mutual funds, 224t, 225t
Social Security, 132–35, 133f, 135f
S&P 500 index, 32, 35, 36, 46, 46f, 58, 126, 126f, 280
S&P 500 index funds, 219t, 220t, 221t, 222t
sponsors, 16–19, 16f, 17f, 19f, 245f, 246
stable value funds, 145, 280
state government employee retirement plans, 137, 137f,
138, 138f
statement of additional information (SAI), 255–56, 280
state municipal bond funds
exchange redemptions, 197t
exchange sales, 195t
liquidity, 188t
net new cash flow, 193t
new sales, 194t
number of funds, 178t
number of share classes, 180t
redemptions, 196t
total net assets, 176t
stock, 281
common, 199t, 200t, 203t, 204t, 205t, 206t
company, 145, 146f
directly held, 11, 12f
investment company assets, 14, 14f
in IRAs, 151, 151f
margin purchases of, 261
as portfolio holdings, 199t, 200t
preferred, 199t, 200t
short positions, 261–62
stock bonus plans, 141f
stock funds. See equity funds
stock market performance
equity fund flows and, 34–36, 34f
ETF demand and, 70
global indexes, 32
international, 8, 34, 34f, 36
investment company assets and, 8
market risk and volatility, 35
mutual fund trends and, 26, 32, 34–36, 34f
shareholder risk tolerance and, 35, 126, 126f, 127f
U.S. stock indexes, 8, 32, 35, 36
structural leverage, 85–86, 85f, 86f
summary portfolio schedule, 256n6
summary prospectus, 281
Ttarget date (lifecycle) funds, 230t, 231t, 281
in 401(k) plans, 144f, 145, 146f, 148–49, 148f, 164f
by account type, 164f
bond fund flows and, 41
characteristics, 41, 148–49, 163
exchange sales, 231t
expenses and fees, 96, 96f, 101f
in IRAs, 156
retirement assets in, 41, 156, 157f, 162f, 163, 164f
target risk (lifestyle) funds. See lifestyle (target risk) funds
taxable bond closed-end funds, 82f, 83f, 181t, 182t
taxable bond funds, 101f, 175t, 177t, 179t
taxable government money market funds, 207t, 208t, 209t,
212t
taxable money market funds
asset composition, 212t, 213t
dividends paid and reinvested, 211t
institutional, 208t, 209t, 236t
net new cash flow, 51f, 209t
number of funds, 178t, 207t
number of share classes, 179t, 180t, 207t
retail, 51f, 208t, 209t
total net assets, 175t, 176t, 177t, 207t, 208t, 236t
taxable prime money market funds, 207t, 208t, 209t, 213t
tax-deferred accounts, 250, 250f, 253, 253f
tax-exempt bond funds, 252
tax-exempt money market funds
dividend distributions, 252
dividends paid and reinvested, 211t
institutional, 208t, 209t
net new cash flow, 48f, 209t
number of funds, 178t, 207t
number of share classes, 179t, 180t, 207t
retail, 208t, 209t
total net assets, 175t, 176t, 177t, 207t, 208t
tax-exempt mutual funds, 250, 250f, 252, 253, 253f
tax features of mutual funds
assets by tax status, 250, 250f
cost basis, 252
distribution types, 251, 253, 253f, 254, 254f
diversification standards, 264
exchanges of shares, 252
net investment income tax, 251
RIC qualification, 249
taxable transactions, 252
tax-exempt funds, 252
Taxpayer Relief Act of 1997, 152
Taxpayer Relief Act of 2012, 165
Tax Relief, Unemployment Insurance Reauthorization, and
Job Creation Act of 2010, 165
T-bills (Treasury bills), 51, 212t, 213t, 281
technology/telecom sector funds, 228t, 229t
tender offer, 81, 281

296 INDEX
tender option bonds, 85, 87, 87f
thrift deposits, 151f
thrifts, 15, 15f
Thrift Savings Plan (TSP), 137f, 141
total net assets, 281. See also mutual fund industry data;
specific classification, such as closed-end funds
total return, 281
total return equity funds
exchange redemptions, 197t
exchange sales, 195t
liquidity, 188t
net new cash flow, 193t
new sales, 194t
number of funds, 178t
number of share classes, 180t
redemptions, 196t
total net assets, 176t
traditional IRAs, 281. See also individual retirement
accounts
transfer agents, 245f, 248, 281
transparency, 255–56
Treasury bills (T-bills), 51, 212t, 213t, 281
Treasury bonds, 32, 38
Treasury inflation-protected mutual funds, 223t
Treasury securities, 14f, 15, 52–53, 53f, 212t, 213t
trends. See mutual fund trends
trustees, 244, 281
turnover rate, 37, 37f
Uunderwriters, 245f, 248, 282
unit investment trusts (UITs), 282
characteristics, 20–21, 243
custody rules, 263n
diversification standards, 264
household investments in, 11f
new deposits, 10, 186t
number of, 21f, 22, 22f, 186t
regulation of, 255n, 263n
total net assets, 9f, 21f, 186t
U.S. corporate equity, 14f
U.S. dollar performance, 8, 32, 36
U.S. economic climate, 18–19, 26, 28, 31–32, 43, 126f, 140
U.S. government agency issues, 14f, 15, 52–53, 53f, 212t,
213t
U.S. government bonds, 199t, 200t
U.S. government bond funds. See government bond funds
U.S. government employee retirement assets, 135, 136f,
137–38, 137f, 138f, 141
U.S. Labor Department, 150
U.S. mutual fund assets, 6, 7f, 26, 28, 29f, 30f. See also
mutual fund industry data
U.S. retirement system, 124, 132–40, 133f, 135f, 136f, 137f,
139f, 140f
U.S. Treasury securities, 14f, 15, 52–53, 53f, 212t, 213t, 282
utilities sector funds, 228t, 229t
Vvaluation process of funds, 257–58
value funds, 101f, 224t, 225t
variable annuities, 282
closed-end fund owner holdings of, 88, 88f
in ETF-owning households, 75, 75f
holdings by tax status, 250
household investments in, 11f, 12, 12f, 30f, 75, 75f, 88,88f
as IRA assets, 151f
no-load share classes, 107f
retirement assets in, 124f, 137f
total net assets, 107f
variable annuity mutual funds, 232t, 233t
Variable Rate Demand Preferred (VRDP) shares, 282
VIX (Chicago Board Options Exchange Volatility Index),
35
WWilshire 5000 index, 36
withdrawal plans, 282
world bond funds
exchange redemptions, 197t
exchange sales, 195t
liquidity, 188t
net new cash flow, 193t
new sales, 194t
number of funds, 178t
number of share classes, 180t
redemptions, 196t
total net assets, 176t
world equity funds
alternative strategies, 214t
exchange redemptions, 197t
exchange sales, 195t
expense ratios, 100, 101f
liquidity, 188t
net new cash flow, 34, 34f, 36, 193t
new sales, 194t
number of funds, 177t, 178t
number of share classes, 179t, 180t
redemptions, 196t
retirement assets in, 162, 162f
total net assets, 8, 27, 175t, 176t
world equity index funds, 45, 45f, 46f, 219t, 220t, 221t,
222t
worldwide mutual fund assets, 10f, 237t, 238t, 239t
Yyield, 282
yield curve, 282