2014 facilities inventory system report - ofm.wa.gov. facilities inventory system report . rcw...
TRANSCRIPT

2014 Facilities Inventory System Report
RCW 43.82.150
Office of Financial Management Budget Division, Facilities Oversight September 2014

To accommodate persons with disabilities, this document is available in alternate formats by calling the Office of Financial Management at 360-902-0555. TTY/TDD users should contact OFM via
the Washington Relay Service at 711 or 1-800-833-6388.
Visit our website at www.ofm.wa.gov

TABLE OF CONTENTS
Overview ............................................................................................................................................. 1
Requirement and Purpose ................................................................................................................... 1
2014 Facilities Inventory Results ......................................................................................................... 1
Statewide Facilities Summary ........................................................................................................... 2
Total Facility Inventory Summary ......................................................................................................... 2
Square Feet by Functional Area .......................................................................................................... 2
Square Feet by Property Class ............................................................................................................ 3
Building Condition Summary ................................................................................................................ 4
Owned Square Feet Change by County .............................................................................................. 5
Leased Square Feet Change by County .............................................................................................. 6
Summary of Owned Facilities in Inventory ...................................................................................... 7
Owned Facilities Inventory Change between 2013 and 2014 .............................................................. 7
Density of Owned Facilities (by County) .............................................................................................. 7
Owned Facilities by Functional Area .................................................................................................... 8
Top Agencies for Owned Square Footage ........................................................................................... 8
Owned Space by Property Classification ............................................................................................. 9
Age of Owned Facilities ....................................................................................................................... 9
Condition of Owned Facilities ............................................................................................................ 10
Summary of Leased Inventory ........................................................................................................ 11
Leased Facilities Inventory Change between 2013 and 2014 ............................................................ 11
Density of Leased Facilities (by County) ............................................................................................ 11
Leased Facilities by Functional Area ................................................................................................. 11 Top Agencies for Leased Square Footage ........................................................................................ 12
Leased Facilities Space by Property Classification ............................................................................ 13
Occupancy Period of Leased Facilities .............................................................................................. 13
Condition of Leased Facilities ............................................................................................................ 14
Real Estate Authority ......................................................................................................................... 14
Real Estate Authority Cost Breakdown .............................................................................................. 15
Lease Options .................................................................................................................................... 15

Lease Services .................................................................................................................................. 16
2010–15 Facilities Inventory Trend ................................................................................................. 17
Total State Facilities by Year ............................................................................................................. 17
Total Square Footage by Year ........................................................................................................... 23
Questions/Comments…………………………………………………………………………….…………………19
Appendix: Facilities Demographics by Agency……………………………………………………………..20 Appendix: Facilities Demographics by County……………………………………………………………...23

1
OVERVIEW Requirement and Purpose The state of Washington owns and leases thousands of facilities that house state agencies. This represents a significant financial investment by the citizens of Washington. To monitor this investment, the Office of Financial Management (OFM) has responsibility for the completion of the Facilities Inventory System (FIS), as prescribed in RCW 43.82.150. This document is a summary of the data reported by agencies in the 2014 FIS. The 2014 Facilities Inventory is used to inform the state’s Six-Year Facilities Plan, capital budget decisions, comprehensive emergency management planning and other analyses related to state facilities, as necessary. Data concerning all owned and leased facilities obligated to state agencies and higher education institutions were reported to OFM by Sept. 1, 2014. A facility is defined as a building or other structure with at least one wall, a roof and a permanent foundation, regardless of occupancy. Facilities in the inventory range from office buildings to warehouses to grain elevators to node sites, among others. 2014 Facilities Inventory Results As of 2014, 73 state agencies1 reported more than 10,500 facilities totaling close to 112 million square feet. Approximately 87.9 percent of these facilities are owned by Washington state agencies. The remaining 12.1 percent consist of leased facilities. State facilities are located in every county, with Garfield County having the fewest (20) and King County having the most (1,360). Thirty-nine facilities are located outside of Washington in countries such as Ethiopia, China and Spain. Since the 2013 FIS Report, the state’s facilities inventory has increased by 468 facilities and more than 1.7 million square feet. In 2014, notable changes in the state’s inventory are:
The Department of Fish and Wildlife located an additional 200 existing owned facilities statewide that should have been previously reported in FIS.
Central Washington University broke out clustered facilities, thereby increasing the number of facilities with little change to the reported square footage.
The University of Washington and Washington State University reported nearly 1.4 million square feet of new facilities.
The 2014 Facility Inventory continues to demonstrate the state’s commitment to creating a more complete inventory of state facilities. While these attempts have greatly increased accuracy, FIS is likely to have some missing facility records and data. OFM will continue to work with agencies on increasing the accuracy and timeliness of FIS. The 2014 Facilities Inventory, including the facility owner, location, type, condition, size of each facility and other pertinent facility data, is available at http://www.ofm.wa.gov/budget/facilities/fis.asp.
1All state agencies and higher education institutions were contacted to report their 2014 Facilities Inventory. All agricultural commissions are exempt from reporting per RCW 15.04.200. Most legislative and judicial agencies did not report back to confirm data for their agencies for the FIS 2014.

2
STATEWIDE FACILITIES SUMMARY
The state of Washington owns, maintains, leases or occupies more than 10,500 facilities statewide. These facilities represent the state’s physical presence in the communities it serves. State employees, volunteers, contractors and community partners perform a large variety of functions in these facilities such as educating citizens, providing social services, licensing businesses and auditing government operations. Many of the state’s facilities also serve as residences, prison facilities and in support functions. Total Facility Inventory Summary In fall 2014, 73 state agencies reported approximately 10,546 facilities, totaling 111,878,106 square feet. Thirty-two agencies reported 9,237 owned facilities, totaling 98,363,905 square feet. Sixty-eight agencies reported 1,309 leased facilities, totaling 13,514,201 square feet. Based on square footage, 87.9 percent of the state’s full facilities inventory is owned and 12.1 percent is leased from the private sector. Square Feet by Functional Area The chart below depicts the percentage of owned versus leased square footage by functional area. The owned square footage that higher education occupies clearly dwarfs all other functional areas. It is important to note that OFM has no statutory authority over the use of higher education space use.
0 20,000,000 40,000,000 60,000,000 80,000,000
HIGHER EDUCATION
HUMAN SERVICES
GENERAL GOVERNMENT
NATURAL RESOURCES
TRANSPORTATION
EDUCATION -OTHER
Square Feet
Func
tiona
l Are
a
Square Feet by Functional Area
Leased Sq. Ft. Owned Sq. Ft.

3
Square Feet by Property Class The chart below breaks down total square footage by property class for the full inventory. Property class is defined as the category the specified primary space type of the facility falls under. As with previous reports, the facilities inventory continues to indicate that facility assets are primarily used for educational, general office and health care activities. Most notably, the inventory indicates leased facilities overwhelmingly are used for office space with over 66 percent of the total leased space.
0
5
10
15
20
25
Office Educational Special Use Support Residential Laboratory Study Health Care Unclassified General
Millio
ns
Total Square Feet by Property Class
Leased Owned

4
Building Condition Summary Agencies are asked to rank the general condition of each facility in their respective inventory on a scale of 1-Superior to 5-Emergent Use Only. Condition is assessed based on factors such as exterior, interior, lighting, maintenance levels and overall satisfaction. The table below depicts the condition of all state facilities based on this scale. Agencies generally ranked facility conditions as either adequate (2) or fair (3). Leased facilities tend to be viewed in better condition than owned facilities. Less than 3.7 percent of the current inventory is rated as being used for Emergent Use Only.
0
500
1,000
1,500
2,000
2,500
3,000
3,500
4,000
1 - Superior 2 - Adequate 3 - Fair 4 - Limited 5 - Emergent UseOnly
N/A
Facilities Count by Condition Rating
Leased Owned

5
Owned Square Feet Change by County The map below shows the owned square footage change from the past year. Total owned square footage increased as whole, specifically in King, Spokane and Whitman counties. This is mainly a result of growth in higher education. The University of Washington added nearly 478,000 square feet of newly reported residential, garage and laboratory facilities in King County. In Whitman County, WSU added 108,000 square feet for a football facility.
6
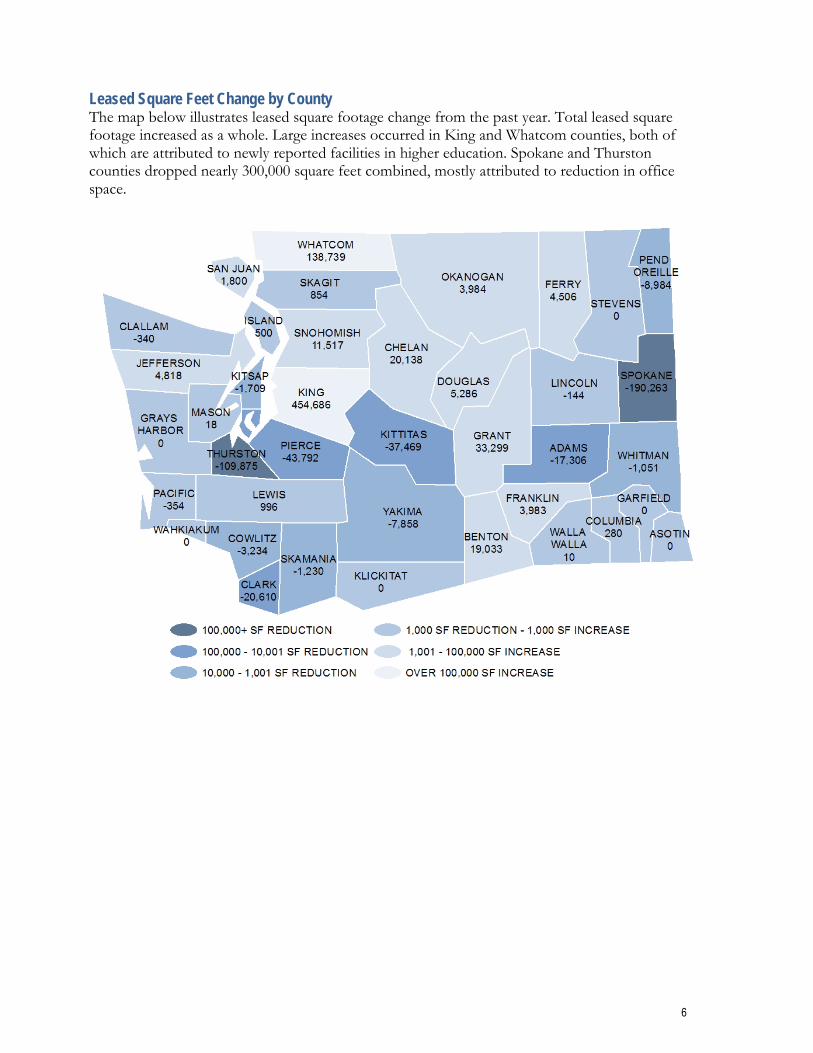
Leased Square Feet Change by County The map below illustrates leased square footage change from the past year. Total leased square footage increased as a whole. Large increases occurred in King and Whatcom counties, both of which are attributed to newly reported facilities in higher education. Spokane and Thurston counties dropped nearly 300,000 square feet combined, mostly attributed to reduction in office space.

7
SUMMARY OF OWNED FACILITIES IN INVENTORY
Thirty-three agencies reported 9,237 owned facilities that totaled 98,363,905 square feet. Based on square footage, the owned inventory represents 87.9 percent of the state’s total facilities inventory. Owned Facilities Inventory Change Between 2013 and 2014 The 2014 Owned Inventory represents an increase of 435 facilities and an increase of 1,498,313 square feet from the 2013 FIS Annual Report. Notable changes to the owned inventory are:
The Department of Fish and Wildlife added 200 additional facilities, for an increase of approximately 228,000 square feet.
The Liquor Control Board disposed of the Liquor Distribution Center in Seattle, for a decrease of about 220,000 square feet.
Tacoma Community College added a newly reported 70,000 square foot Health Center. Higher education, combined, accounted for 1.2 million square feet in newly reported space.
Density of Owned Facilities (by County) All 39 counties have state-owned facilities, ranging from 18 in Pend Oreille County to 1,109 in King County. King, Pierce and Thurston counties have a combined 2,385 facilities, 25 percent of the owned inventory. In eastern Washington, Spokane and Whitman counties have a total of 1,031 facilities, 11 percent of the owned inventory. The map below depicts the distribution of owned facilities by county.

8
Owned Facilities by Functional Area The table below shows the total owned square feet by functional area. Higher education represented the largest single functional area, with 2,803 owned facilities that totaled 66,022,518 square feet, or 67.1 percent of all state-owned facilities.
Owned Functional Area Breakdown
Functional Area Owned Square Feet Percentage of Inventory Owned Facilities Percentage of
Inventory
Higher Education 66,022,518 67.1 2,803 30.4 Human Services 15,381,133 15.6 1,389 15.0 General Government 7,057,383 7.2 281 3.0 Natural Resources 5,674,600 5.8 3,733 40.4 Transportation 3,487,261 3.5 993 10.8 Education - Other 741,002 0.7 38 0.4
Top Agencies for Owned Square Footage The top 10 agencies for owned square footage in the inventory represent roughly three-fourths of the owned inventory. The University of Washington, community and technical college system and Washington State University combine for 55.7 percent of the total owned inventory.
Top Agencies for Owned Square Feet Agency Square Feet Facilities
1. University of Washington 21,672,009 565 2. Community and Technical Colleges 19,647,259 914 3. Washington State University 13,486,632 861 4. Department of Corrections 8,643,832 808 5. Department of Social and Health Services 5,427,735 509 6. Department of Enterprise Services 5,402,242 92 7. Western Washington University 3,396,891 117 8. Central Washington University 3,262,908 189 9. State Parks and Recreation 3,059,455 2,623 10. Eastern Washington University 2,928,850 85

9
Educational 21.5%
Special Use 15.9%
Office 14.2%
Support 13.6%
Residential 12.6%
Laboratory 11.0%
Study 3.8%
Health Care 3.1%
Unclassified 2.3%
General 2.0%
Percent of Owned Square Feet by Property Class
Owned Space by Property Classification Property classification is organized into 10 categories, which are then further defined into nearly 40 specific space types. FIS defines the property classification as more than 60 percent of the facility space dedicated to one category. The chart below depicts the percentage of facilities by property classification. Close to 50 percent of owned facilities are used primarily for such things as higher education classrooms, general offices and correctional facilities.
Age of Owned Facilities Today, the state owns 83 facilities constructed before 1900 and more than 300 facilities older than 100 years. The Jackson House in Chehalis, owned by the State Parks and Recreation Commission, is the oldest facility, with a construction date of 1845. Older facilities are typically used for historic, education and residential purposes. At the other end of the spectrum, 234 facilities have been constructed since 2010. Newer facilities tended to be used for residential and storage needs. No construction date was reported by 1,138 facilities. The majority of these facilities are owned by the Department of Fish and Wildlife.
83 178 128
212
489 493 675
1,121 1,095 945
1,161 1,285
234
0
200
400
600
800
1,000
1,200
1,400
Pre-1900 1900-09 1910-19 1920-29 1930-39 1940-49 1950-59 1960-69 1970-79 1980-89 1990-99 2000-09 2010-14
Facil
ities
Year Constructed
Owned Facilties Constructed by Decade
10
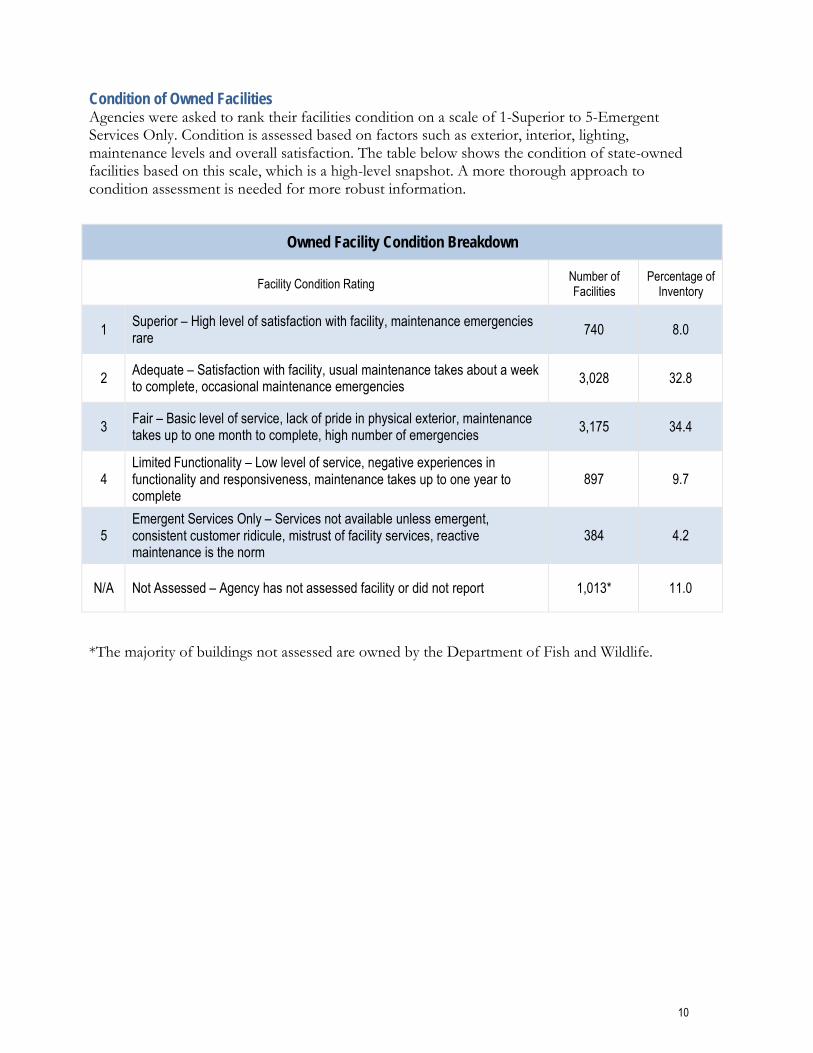
Condition of Owned Facilities Agencies were asked to rank their facilities condition on a scale of 1-Superior to 5-Emergent Services Only. Condition is assessed based on factors such as exterior, interior, lighting, maintenance levels and overall satisfaction. The table below shows the condition of state-owned facilities based on this scale, which is a high-level snapshot. A more thorough approach to condition assessment is needed for more robust information.
Owned Facility Condition Breakdown
Facility Condition Rating Number of Facilities
Percentage of Inventory
1 Superior – High level of satisfaction with facility, maintenance emergencies rare 740 8.0
2 Adequate – Satisfaction with facility, usual maintenance takes about a week to complete, occasional maintenance emergencies 3,028 32.8
3 Fair – Basic level of service, lack of pride in physical exterior, maintenance takes up to one month to complete, high number of emergencies 3,175 34.4
4 Limited Functionality – Low level of service, negative experiences in functionality and responsiveness, maintenance takes up to one year to complete
897 9.7
5 Emergent Services Only – Services not available unless emergent, consistent customer ridicule, mistrust of facility services, reactive maintenance is the norm
384 4.2
N/A Not Assessed – Agency has not assessed facility or did not report 1,013* 11.0
*The majority of buildings not assessed are owned by the Department of Fish and Wildlife.

11
SUMMARY OF LEASED INVENTORY
Sixty-eight agencies reported 1,309 leased facilities that totaled 13,514,201 square feet. Based on square footage, the leased inventory represents 12.1 percent of the state’s total facilities inventory. Leased Facilities Inventory Change Between 2013 and 2014 The 2014 leased inventory represents an increase of 33 facilities and an increase in 251,834 square feet from the 2013 FIS Annual Report. Notable changes to the leased inventory are:
Innovate Washington was eliminated and the facility it leased moved to Washington State University.
The University of Washington added a 183,000 square foot facility that will be used for laboratory purposes in Seattle.
The Department of Commerce added the Pacific Tower in Seattle, which comprises 205,000 square feet.
The Department of Social and Health Services closed 11 facilities totaling 100,000 square feet.
Density of Leased Facilities (by County) Thirty-five counties have state-leased facilities. Three counties have more than 100 leased facilities: King has 251, Thurston has 168 and Spokane has 109. Wahkiakum, Lincoln and Garfield counties have no state-leased facilities. The map below depicts the distribution of leased facilities by county.

12
Leased Facilities by Functional Area The table below depicts the total leased square feet by functional area. Human services represented the largest single functional area, with 308 leases that totaled 4,866,998 square feet, or 36.0 percent of all state-leased facility space.
Leased Square Feet by Functional Area
Functional Area Leased Square Feet Percentage of Inventory Leases Percentage of
Inventory
Human Services 4,866,998 36 308 23.5
General Government 3,958,001 29.3 262 20.0
Higher Education 2,951,575 21.8 282 21.5
Natural Resources 839,584 6.2 326 24.9
Transportation 795,451 5.9 111 8.5
Education 102,591 0.8 20 1.5
Top Agencies for Leased Square Footage The table below shows the top 10 agencies with the most leased square footage. The Department of Social and Health Services accounts for 20 percent of the total leased inventory.
Top Agencies for Leased Square Feet Agency Square Feet Leases
1. Department of Social and Health Services 2,694,646 130
2. University of Washington 1,793,124 176
3. Military Department 1,385,710 135
4. Community and Technical Colleges 871,557 69
5. Employment Security 587,732 52
6. Department of Corrections 464,465 68
7. Attorney General 463,627 17
8. Department of Health 456,057 10
9. Consolidated Technology Services 400,615 8
10. Department of Commerce 339,106 9

13
Leased Facilities Space by Property Classification Property classification is organized into 10 categories, which are then further defined into nearly 40 specific space types. FIS defines the property classification as more than 60 percent of the facility space dedicated to one category. The chart below depicts the percentage of facilities by property classification. FIS shows that leased facilities are used primarily for office space.
Occupancy Period of Leased Facilities Agencies were asked to provide the known date when they first started leasing from the current location. Approximately 133 facilities have a known occupancy of more than 40 years. Most of these facilities are used by State Parks and Recreation and the Military Department. No first year of occupancy was noted for 189 facilities.
General 0.1%
Study 0.4%
Health Care 0.6%
Unclassified 0.6% Residential
2.0%
Educational 6.2%
Special Use 6.9%
Laboratory 7.1%
Support 10.1%
Office 66.1%
Percent of Leased Square Feet by Space Type
315
443
152 77 69 64
0-10 Years 11-20 Years 21-30 Years 31-40 Years 41-50 Years 50+ Years
Facil
ities
Years Since First Date of Occupation
Occupancy Period of Leased Facilties

14
Condition of Leased Facilities Agencies were asked to rank their facilities condition on a scale of 1-Superior to 5-Emergent Services Only. Condition is assessed on factors such as exterior, interior, lighting, maintenance levels and overall satisfaction. The table below shows the condition of state-owned facilities based on this scale. A more thorough approach to condition assessment is needed for more robust information.
Facility Condition Breakdown
Facility Condition Rating Number of Facilities
Percentage of Inventory
1 Superior – High level of satisfaction with facility, maintenance emergencies rare 134 10.2
2 Adequate – Satisfaction with facility, usual maintenance takes about a week to complete, occasional maintenance emergencies 578 44.2
3 Fair – Basic level of service, lack of pride in physical exterior, maintenance takes up to one month to complete, high number of emergencies 226 17.3
4 Limited Functionality – Low level of service, negative experiences in functionality and responsiveness, maintenance takes up to one year to complete
56 4.3
5 Emergent Services Only – Services not available unless emergent, consistent customer ridicule, mistrust of facility services, reactive maintenance is the norm
4 0.3
Not assessed – Agency failed to fill in requested data 311 23.8 Real Estate Authority Washington State currently has a decentralized model for authority over state real estate. Three primary real estate authorities are defined in FIS, based on state laws2: 1) the Department of Enterprise Services; 2) state agencies leasing through statutory exemption or delegation from the Department of Enterprise Services; and 3) higher education. The table below demonstrates the proportion of each real estate authority.
Real Estate Authority Breakdown Real Estate Authority Total Square Footage Percentage of Inventory Total Facilities Percentage of Inventory
Enterprise Services 8,752,273.00 64.8 588 44.9
State Agency 2,891,544.00 19.2 490 37.4
Higher Education 2,170,383.98 16.1 231 17.6
2 See RCW 43.82.010(13) and RCW 28B.10.020 for more information
15
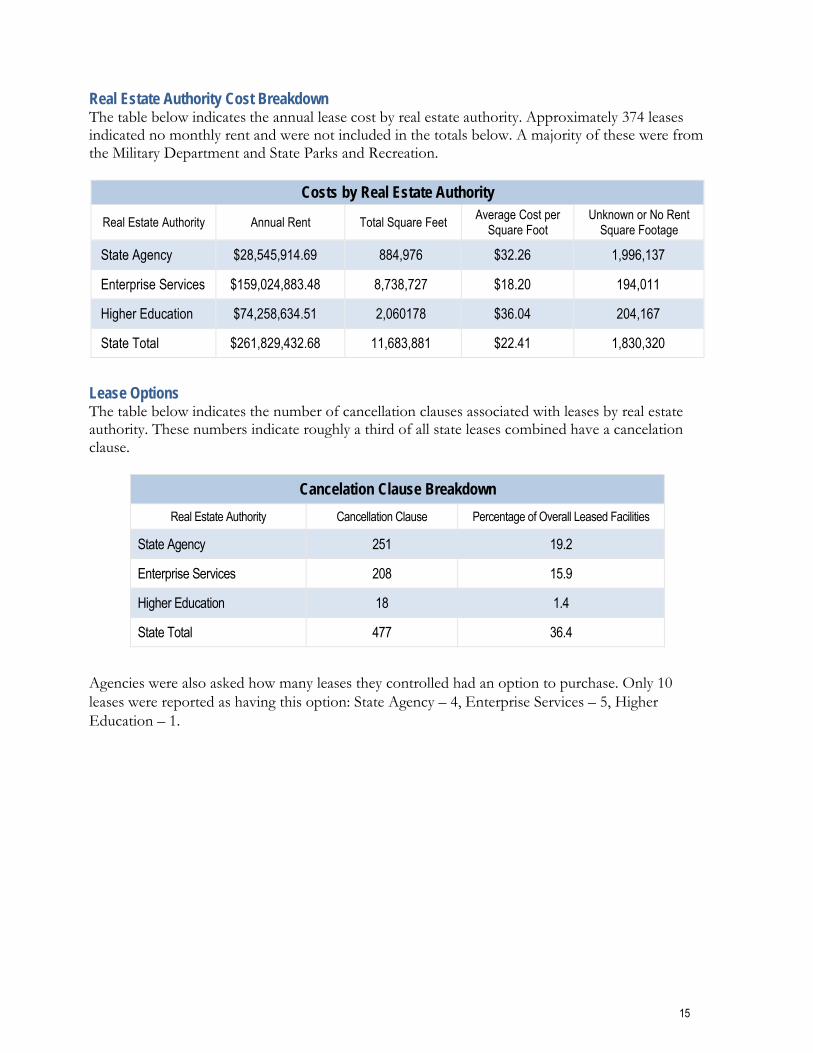
Real Estate Authority Cost Breakdown The table below indicates the annual lease cost by real estate authority. Approximately 374 leases indicated no monthly rent and were not included in the totals below. A majority of these were from the Military Department and State Parks and Recreation.
Costs by Real Estate Authority Real Estate Authority Annual Rent Total Square Feet Average Cost per
Square Foot Unknown or No Rent
Square Footage
State Agency $28,545,914.69 884,976 $32.26 1,996,137
Enterprise Services $159,024,883.48 8,738,727 $18.20 194,011
Higher Education $74,258,634.51 2,060178 $36.04 204,167
State Total $261,829,432.68 11,683,881 $22.41 1,830,320
Lease Options The table below indicates the number of cancellation clauses associated with leases by real estate authority. These numbers indicate roughly a third of all state leases combined have a cancelation clause.
Cancelation Clause Breakdown Real Estate Authority Cancellation Clause Percentage of Overall Leased Facilities
State Agency 251 19.2
Enterprise Services 208 15.9
Higher Education 18 1.4
State Total 477 36.4
Agencies were also asked how many leases they controlled had an option to purchase. Only 10 leases were reported as having this option: State Agency – 4, Enterprise Services – 5, Higher Education – 1.

16
Lease Services The 2014 leased inventory indicates that the state typically pays for natural gas, electric, garbage, restroom supplies and janitorial services. Owners are more likely to pay for assessments, insurance, stormwater and property taxes. Recycling was one area most agencies indicated was not an option. The table below depicts the percentage of each service paid by the state and by the owner. More complete information is expected to be gathered in future reports to further break down facility costs.
0%
20%
40%
60%
80%
100%
Lease Services Breakdown
Lessee Paid Lessor Paid Lesse Paid Via Reimbursement N/A

17
2010–15 FACILITIES INVENTORY TREND
Since 2009, OFM has prepared a summary report of the owned and leased facilities inventory. This information equips the state of Washington to better strategize for efficiency and cost savings related to facilities. Below, OFM has prepared a trend report to demonstrate how the state has reported owned and leased facilities over the past five years. Total State Facilities by Year The five-year trend shows the total number of state facilities has increased since 2010. In 2014, agencies reported a large number of facilities that had not been identified earlier. Since 2010, the state total has grown by approximately 216 reported facilities, more than 2 percent.
9,033 9,054 8,933 8,802 9,237
1,297 1,295 1,254 1,276
1,309
7,000
8,000
9,000
10,000
11,000
2010 2011 2012 2013 2014
Total Reported Facilities
Owned Leased

18
Total Square Footage by Year The five-year trend demonstrates that the total square footage has decreased on the leased side by nearly 568,000 square feet. However, these decreases were more than offset by the 4.5 million square feet of new square footage reported for owned facilities. Much of this increase can be attributed to higher education. Since 2010, total state-occupied square footage increased by 4 million, more than 3.6 percent.
93,783 93,947 95,202 96,866 98,364
14,082 14,297 13,359 13,262
13,514
80,000
90,000
100,000
110,000
120,000
2010 2011 2012 2013 2014
Thou
sand
s
Total Reported Square Feet
Owned Leased

19
QUESTIONS/COMMENTS For questions about the FIS process, instructions or results, or to provide feedback, please contact these OFM staff members: Josh Calvert Facilities Analyst [email protected] 360-902-0548
Amy McMahan Senior Facilities Oversight Manager [email protected] 360-902-9824

20
APPENDIX: FACILITIES DEMOGRAPHICS BY AGENCY The following chart is a summary by agency of the total facilities and total square footage (by leased and owned facilities) for all types of facilities. The chart is sorted by the percentage of total inventory which is provided, based on the total square footage.
Agency Name Number of
Owned Facilities
Number of Leased
Facilities
Total Number of Facilities
Total Owned Square Footage
Total Leased Square Footage
Total Square Footage
Percentage of Total
Inventory
Sq. Ft Change from
2013
University of Washington 565 176 741 21,672,009 1,793,124 23,465,133 20.97%
Community and Technical College System 914 69 983 19,647,259 871,557 20,518,816 18.34%
Washington State University 861 15 876 13,486,632 79,799 13,566,431 12.13%
Department of Corrections 808 68 876 8,643,832 464,465 9,108,297 8.14%
Department of Social and Health Services 509 130 639 5,427,735 2,694,646 8,122,381 7.26%
Department of Enterprise Services 92 5 97 5,402,242 327,860 5,730,102 5.12%
Western Washington University 117 6 123 3,396,891 51,904 3,448,795 3.08%
State Parks and Recreation 2,623 204 2,827 3,059,455 224,276 3,283,731 2.94%
Central Washington University 189 6 195 3,262,908 14,583 3,277,491 2.93%
Department of Transportation 834 24 858 2,877,755 284,058 3,161,813 2.83%
Eastern Washington University 85 7 92 2,928,850 75,609 3,004,459 2.69%
Military Department 184 135 319 1,478,119 1,385,710 2,863,829 2.56%
The Evergreen State College 71 2 73 1,583,969 37,359 1,621,328 1.45%
Department of Fish and Wildlife 840 36 876 1,462,787 132,866 1,595,653 1.43%
Department of Natural Resources 249 17 266 729,447 50,401 779,848 0.70%
Department of Labor and Industries 4 21 25 415,454 323,250 738,704 0.66%
Washington State Patrol 155 26 181 580,339 156,904 737,243 0.66%
Employment Security Department 2 52 54 93,550 587,732 681,282 0.61%
Department of Veterans Affairs 54 2 56 538,047 26,363 564,410 0.50% -
Department of Ecology 9 14 23 394,867 164,279 559,146 0.50%
Department of Health 2 10 12 81,753 456,057 537,810 0.48%

21
Agency Name Number of
Owned Facilities
Number of Leased
Facilities
Total Number of Facilities
Total Owned Square Footage
Total Leased Square Footage
Total Square Footage
Percentage of Total
Inventory
Sq. Ft Change from
2013
Office of the Attorney General 0 17 17 0 463,627 463,627 0.41%
Consolidated Technology Services 0 8 8 0 400,615 400,615 0.36%
Department of Licensing 4 57 61 29,167 332,456 361,623 0.32%
Department of Commerce 0 9 9 0 339,106 339,106 0.30%
Department of Revenue 0 17 17 0 320,466 320,466 0.29%
Department of Agriculture 11 52 63 12,944 250,709 263,653 0.24%
Office of the Secretary of State 5 3 8 177,022 81,526 258,548 0.23%
Washington State Center for Childhood Deafness and Hearing Loss 17 0 17 249,453 0 249,453 0.22%
Health Care Authority 0 4 4 0 201,571 201,571 0.18% -
Washington State Criminal Training Commission 9 1 10 180,162 2,900 183,062 0.16% -
Washington Historical Society 3 0 3 181,862 0 181,862 0.16% -
State School for the Blind 13 0 13 165,600 0 165,600 0.15% -
Eastern Washington Historical Society 5 0 5 144,087 0 144,087 0.13% -
Board of Industrial Insurance Appeals 0 9 9 0 78,083 78,083 0.07% -
Liquor Control Board 0 8 8 0 75,000 75,000 0.07%
State Board for Community and Technical Colleges 1 1 2 44,000 27,641 71,641 0.06% -
State Auditor’s Office 0 13 13 0 64,873 64,873 0.06%
Department of Retirement Systems 0 2 2 0 62,691 62,691 0.06%
Office of the Insurance Commissioner 0 4 4 0 60,661 60,661 0.05% -
Washington State Gambling Commission 0 8 8 0 58,567 58,567 0.05% -
State Lottery Commission 0 7 7 0 57,716 57,716 0.05% -
Utilities and Transportation Commission 0 2 2 0 53,234 53,234 0.05% -
Department of Financial Institutions 0 2 2 0 49,245 49,245 0.04% -
Office of Administrative Hearings 0 5 5 0 47,862 47,862 0.04%
Department of Early Learning 0 8 8 0 47,379 47,379 0.04%
State Investment Board 0 3 3 0 32,415 32,415 0.03% -

22
Agency Name Number of
Owned Facilities
Number of Leased
Facilities
Total Number of Facilities
Total Owned Square Footage
Total Leased Square Footage
Total Square Footage
Percentage of Total
Inventory
Sq. Ft Change from
2013
Student Achievement Council 0 2 2 0 27,676 27,676 0.02% -
Housing Finance Commission 0 1 1 0 26,014 26,014 0.02% -
Department of Services for the Blind 1 7 8 600 15,135 15,735 0.01% -
Apple Commission 1 0 1 15,108 0 15,108 0.01%
Office of Financial Management 0 2 2 0 14,890 14,890 0.01%
Superintendent of Public Instruction 0 7 7 0 12,965 12,965 0.01%
Public Employment Relations Commission 0 2 2 0 11,730 11,730 0.01%
Human Rights Commission 0 2 2 0 9,036 9,036 0.01% -
Puget Sound Partnership 0 1 1 0 8,500 8,500 0.01% -
Workforce Training and Education Coordinating Board 0 1 1 0 8,168 8,168 0.01% -
Washington Traffic Safety Commission 0 1 1 0 8,113 8,113 0.01% -
Public Disclosure Commission 0 1 1 0 7,682 7,682 0.01% -
County Road Administration Board 0 1 1 0 7,349 7,349 0.01% -
Washington State Arts Commission 0 2 2 0 6,403 6,403 0.01%
Environmental and Land Use Hearings Office 0 1 1 0 5,653 5,653 0.01% -
Transportation Improvement Board 0 1 1 0 4,632 4,632 0.00% -
Board of Tax Appeals 0 1 1 0 4,427 4,427 0.00% -
Office of the Governor 0 3 3 0 4,257 4,257 0.00%
State Board of Accountancy 0 1 1 0 4,129 4,129 0.00% -
Life Science Discovery Fund Authority 0 1 1 0 3,185 3,185 0.00% -
Columbia River Gorge Commission 0 1 1 0 2,900 2,900 0.00% -
Washington Health Care Facilities Authority 0 1 1 0 2,780 2,780 0.00% -
Horse Racing Commission 0 1 1 0 2,093 2,093 0.00% -
Law Enforcement Officers and Fire Fighters Plan 2 Retirement Board 0 1 1 0 1,998 1,998 0.00% -
Transportation Commission 0 1 1 0 1,939 1,939 0.00% -
Board for Volunteer Firefighters and Reserve Officers 0 1 1 0 1,402 1,402 0.00% -

23
APPENDIX: FACILITIES DEMOGRAPHICS BY COUNTY The following chart is a summary by county of the total facilities and total square footage (by leased and owned facilities) for all types of facilities. The chart is sorted by county name.
County Owned Facilities
Leased Facilities
Total Facilities
Owned Square Feet
Leased Square Feet
Total Square Feet Largest Agency by Square Feet
Adams 62 2 64 90,662.94 1,862 92,524.94 Department of Transportation Asotin 90 4 94 160,544.55 25,551 186,095.55 Department of Transportation Benton 157 26 183 715,334.30 184,294 899,628.30 Washington State University Chelan 194 43 237 794,546.20 122,092 916,638.20 Community and Technical College System Clallam 181 14 195 916,396.43 66,179 982,575.43 Department of Corrections Clark 219 26 245 2,216,319.91 300,239 2,516,558.91 Community and Technical College System Columbia 76 2 78 60,012.02 2,080 62,092.02 Department of Transportation Cowlitz 133 11 144 696,787.95 46,228 743,015.95 Community and Technical College System Douglas 42 41 83 52,818.10 66,369 119,187.10 State Parks and Recreation Ferry 32 4 36 48,429.58 13,183 61,612.58 Department of Transportation Franklin 156 24 180 1,505,102.50 53,272 1,558,374.50 Department of Corrections Garfield 20 0 20 26,905.74 0 26,905.74 Washington State University Grant 245 47 292 728,853.88 91,430 820,283.88 Community and Technical College System Grays Harbor 203 14 217 1,212,643.83 65,528 1,278,171.83 Department of Corrections Island 267 7 274 410,683.87 27,544 438,227.87 State Parks and Recreation Jefferson 381 6 387 1,365,802.02 21,777 1,387,579.02 State Parks and Recreation King 1109 251 1360 29,117,309.68 3,697,078 32,814,387.68 University of Washington Kitsap 252 29 281 1,300,958.69 85,265 1,386,223.69 Community and Technical College System Kittitas 353 9 362 3,534,266.12 36,932 3,571,198.12 Central Washington University Klickitat 112 26 138 153,782.63 35,467 189,249.63 State Parks and Recreation Lewis 155 34 189 875,580 82,593 958,173 Community and Technical College System Lincoln 58 0 58 89,444.21 0 89,444.21 Department of Transportation Mason 235 7 242 1,054,679.96 36,357 1,091,036.96 Department of Corrections

24
County Owned Facilities
Leased Facilities
Total Facilities
Owned Square Feet
Leased Square Feet
Total Square Feet Largest Agency by Square Feet
Okanogan 208 46 254 295,498.59 67,241 362,739.59 Department of Fish and Wildlife Out of State 1 38 39 4,977 102,603 107,580 University of Washington Pacific 233 6 239 441,853.97 25,656 467,509.97 State Parks and Recreation Pend Oreille 18 4 22 31,265.69 11,397 42,662.69 Department of Transportation Pierce 848 61 909 9,137,098.89 989,339 10,126,437.89 Community and Technical College System San Juan 280 5 285 216,467 5,221 221,688 University of Washington Skagit 282 12 294 1,303,726.63 114,809 1,418,535.63 Department of Enterprise Services Skamania 65 2 67 66,666.60 6,732 73,398.60 Department of Fish and Wildlife Snohomish 260 71 331 3,065,756.55 811,491.98 3,877,248.53 Community and Technical College System Spokane 570 109 679 8,736,809.80 1,220,061 9,956,870.80 Eastern Washington University Stevens 68 7 75 166,646.47 37,218 203,864.47 Community and Technical College System Thurston 428 168 596 8,482,795.54 4,021,285 12,504,080.54 Department of Enterprise Services Wahkiakum 22 0 22 39,089.65 0 39,089.65 Department of Fish and Wildlife Walla Walla 153 14 167 2,183,984.93 95,730 2,279,714.93 Department of Corrections Whatcom 280 38 318 4,220,336.35 359,835 4,580,171.35 Western Washington University Whitman 561 11 572 11,249,849.38 51,160 11,301,009.38 Washington State University Yakima 228 90 318 1,593,217.01 533,102 2,126,319.01 Community and Technical College System


Washington State Office of Financial Management Insurance Building ♦ PO Box 43113
Olympia, WA 98504-3113 ♦ 360-902-0555 ♦ Fax 360-664-2832