2014 clean rivers clean lake conference: morning plenary -- how research leads to regional action
TRANSCRIPT

How Water Quality Research Leads
to Regional Action
10th Annual
Clean Rivers, Clean Lake
Conference
May 1, 2014

Cooperative Research Collaborations

E=mc2
Research Creates the Ripple Effect of
Knowledge, Decisions and Action!

Onionology
Research is like Peeling an Onion

What does good research require?
Yet, sometimes the answer is right in
front of you and you don’t see it!
Patience
Perseverance
Commitment
Diligence
Determination
Objectivity
and the Keen Power of Observation
An intense focus like that of hunting

Designed to improve the understanding of the emerging issues
facing the various water resources within the region.
Protect and promote the public's health and environment.
Assists scientists, water resource managers and policy makers by
providing sound technical and scientific information necessary
for beneficial programs, projects and objective policy decisions.
Identifies operational improvements and performance.
Takes advantage of collaborations and partnerships with others
to leverage limited research dollars in order to maximize results.
Fosters economic opportunities and growth.
Commonality of Design

Like speed dating on steroids

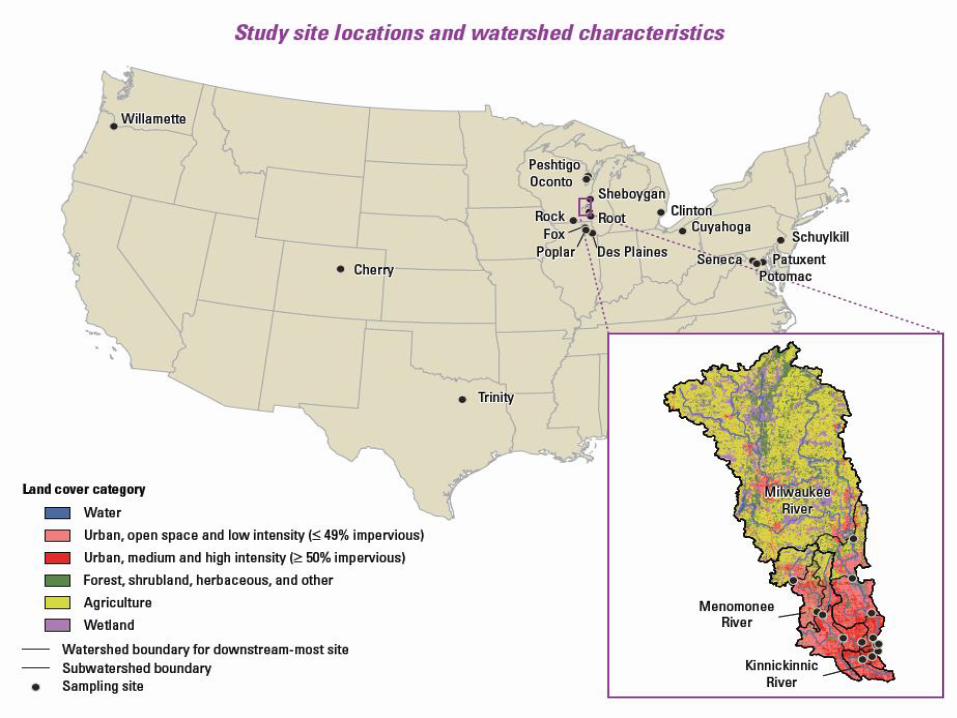
Does urban stream restorations scale up?
An analysis of
ecosystem
response to
restorations
throughout
river
networks in
the Great
Lakes basin.

Research overview
Phase 1: Process-based field work, Summer 2014
Assess the economic
and social costs and
benefits associated with
restoration actions.
Develop a management
tool to prioritize sites in
urban watersheds for
future restorations.
Quantify ecosystem
services related to
restorations in locations
within a river network.
.
Phase 2: Work towards management tool, Winter 2014/15
Phase 3: Scale results to urban areas
throughout the Great Lakes basin,
Summer 2015

Economic cost ($) = Social gain (reduced flood risk)
Return on investment = - Social + ecological gain
Economic cost
(A) Main Channel (A)
Storage (As)
k1 k2 + NH4
+
PO4
3-
+
Action: Scale results to urban areas throughout the
Great Lakes Basin
Applying data to decisions – return on
investment

Determine long-term trends in
chlorides due to road salt influence
Examine long-term chloride trends (~20+ years) in Milwaukee area streams
Compare seasonal differences in chloride trends
Compare chloride concentrations to established aquatic life criteria
Compare trends in Milwaukee area streams to urban rivers in other U.S. cities

The 800 Pound Gorilla in the Room
Road Salt

1
10
100
1,000
10,000
Estimated…
Estimated Chloride Concentrations Menomonee River Real-Time Monitoring
70th St. and State St. January 1 - April 8 , 2014
Ch
lori
de
s m
g/L
Acute 757 mg/L
Chronic 395 mg/L

Average number of days EPA
chronic water-quality criteria (230
mg/L) was exceeded in 1991-95
compared to 2006-10
The average exceedance
frequency has increased to as
much as 294 and 261 days per
year on the Kinnickinic and
Menomonee Rivers in the 2006-10
time period, respectively.
Action: Modeled Daily Results
Aquatic toxicity from road salt

Pyrolysis of Biosolids
Pyrolysis is the heating of organic material in a low or no-
oxygen environment at very high temperatures.
Organics are destroyed, producing a gaseous product
called “pygas” that contains combustible products that
can be use for energy.
A liquid fraction is also produced in the pyrolysis process
called “pyoil.
The pyrolysis process also produces “biochar”, the
remaining solid product after pyrolysis”.

Pyrolysis Process

The Pyrolysis Options
Pyrolysis - Lack of O2
- ~500oC ~50% Gas (CH4, CO, H2)
~2% Bio-oil
~48 % Biochar
Waste
Biosolids Anaerobic
Digestion
Drying &
Pelletizing
Fertilizer Pellets Land Application
Adsorption of Nutrients
From wastewater
Heat
Nutrient Rich
Wastewater
Recycle
Nutrient Deficient
Wastewater
Nutr
ien
t R
ich
Bio
ch
ar

Actions: Pyrolysis of Biosolids
Explores energy positive sustainable disposal
methods for biosolids
Serves as a means for sequestering carbon
Successful process will reduce the carbon
footprint for wastewater treatment
Possibly provide a valuable agricultural soil
amendment, “Milorganite® PLUS”
Removal of micro-contaminates
Transfer of technology

Detection of wastewater using optical
properties
Define relative magnitude of
wastewater influence in surface
waters due to sanitary sewer
contamination
Develop relations of human-
specific bacteria with optical
properties of water (lab-based
measurements)
Use lab results and develop field
sensors to detect wastewater
presence in surface water in real-
time

Menominee
Manitowoc
Milwaukee
River Raisin
Maumee Portage
Clinton
River Rouge
Urban sites Agricultural sites Mixed site Reference sites
Great Lakes Tributary Locations

E
mis
sio
n w
ave
len
gth
(n
m)
Excitation wavelength (nm)
Excitation wavelength (nm)
Storm Sewer Summer
Storm Sewer Fall
Sewage
Storm sewers and Sewage
E
mis
sio
n w
ave
len
gth
(n
m)

Actions: Wastewater Optical Properties
Define the relative magnitude of wastewater influence in surface waters
Developed methods to trace wastewater leakage to the source
Improve efficiency in locating wastewater leakage for repair/correction
Development of affordable and portable field sensors to detect wastewater presence in surface water in real-time
Transferability of these technologies

Organic Waste Compounds In Streams
USGS and MMSD Report

Sediment Results

PAH’s potential for toxicity in sediments

Coal-tar-based sealcoat products contain
about 1,000 times more PAHs than sealcoat
products with an asphalt base

“Chemical Fingerprinting” of PAH’s
Coal Tar Sealants Largest Source of PAH’s to Urban Lakes

Action: Sources and Toxicity of PAHs in Milwaukee Area Streams
Collect 50 sediment samples from streambeds and source areas
Identify source(s) of PAHs to streams
• Contributions from multiple sources, identify greatest sources
such as coal-tar based sealants.
Relate sediment PAH concentrations to toxicity to aquatic organisms.
Possible regional ban on coal-tar sealants depending on results.

Nearshore Carbon and Phosphorus Dynamics

net plankton flux
dissolved nutrient flux
0 m
5
10
15
20
25
30
thermocline
Cladophora growth zone
plankton
dissolved
nutrients
NEARSHORE ZONE OFFSHORE
plankton
DP
mussels
Cladophora
ejecta
River P
Load
How mussels effect nutrient cycle and flux -
movement
Develop conceptual model

Average Water Temperature 8oC
•
•
•
•
•
•
•
•
• •
• • •
• • • • •
• •
• • •
• • • •
• • • • •
•
•
• • • • • • •
• •
•
• • • •
• • • • • •
• •
•
•
•
•
•
• • •
• •
•
•
•
•
•
•
•
•
•
•
•
•
1990’s
Cladophora
Abundance
5 m
Internal Lake Pool of
Phosphorus
River Inputs of
Phosphorus
Extent of Cladophora Growth
Phosphorus
Deposition
Indigenous
Mussel Species

• • • •
•
•
• •
• • • • • • • • •
• • • • • • • • •
•
• • • • •
•
• • •
•
•
•
•
• • • •
• •
• • •
• •
•
•
•
• •
•
• •
•
•
• •
•
2002-2012
Cladophora
Abundance
Increased River
Inputs of
Phosphorus
Recycling of Internal Lake Pool of
Phosphorus Shoreward by
Invasive Mussels Filtering
Warmer Average Water
Temperature 12o C
Increased Water Clarity and
Greater Depth of Light Penetration
due to Invasive Mussels Filtering
Extent of Cladophora Growth 10 -15 M
Loss of Indigenous
Mussel Species
Phosphorus
Deposition
Phosphorus
Invasive Mussels
Species •
• •

Action: Conceptual Model to predict Cladophora
biomass and management
1. Cladophora biomass varies significantly from
year to year.
2. The proximal causes of this variation are both
water clarity and dissolved P concentration.
3. Inter-annual variation does not appear to be
linked to river nutrient loads.
4. Mid-summer biomass is greater when May is
colder and darker.

Industry/University Cooperative
Research Center (I/UCRC)
Water, Equipment and Policy center focus:
1. Advanced Sensor and Control System Technology
2. Novel Materials
3. Autonomous Inspection and Repair
4. Environmental System Design
5. Regulation, Legislation, and Water Policy

University Scientists
Industry Engineers
WEP I/UCRC COLLABORATION
Your Company
Other Companies
Additional Universities
Additional Universities
I/UCRC - WEP Center

Handheld Real-time WQ Meter
• Disposable test strip for bacteria, virus, heavy metal ions
• Potential applications: well water quality test, point-of-use test, etc.
• Wireless connection to iphones/central station

Consumer
Industrial
Municipal
Market Segments Strategic Thrusts
Research Thrusts
Materials
Sensors & Devices
Systems
Policy
Point-of-Use Technologies
Emerging Contaminants
Sustainability
Reduced Energy Consumption
Action: WEP I/UCRC Mission
• Develop pre-competitive water technologies.
• Train engineers and students in water technologies.
• Encourage entrepreneurship.
• Highly leveraged water research platform.

Pharmaceuticals and Personal Care Products in
Wastewater

Research performed at the South Shore WRF

Action: Medicine and Household Hazardous Waste
Collection

Action: Sharing knowledge and technology

Plume Following Autonomous Drifting Vehicle – UWM
Flue Gas Desulfurization (FGD) Gypsum for Phosphorus Control – WeEnergies and EPRI Effort
Genomic Center – UWM –SFS
South Shore Beach Relocation Study – Milwaukee County
Green Infrastructure Monitoring – Veolia
Assessment of Stormwater Outfalls for Sanitary Sewage Contamination – UWM
Corridor Study Agreement and Monitoring Program – USGS
Real-Time Water Quality Monitoring – USGS
Additional Ongoing Research

Research Reports found on MMSD New Website
www.mmsd.com
Scroll down page

Research Reports found on MMSD New Website
Scroll down
to Water Quality

The End