2014 article iv consultation—staff report; … · bank excess cash holdings ... limited and...
TRANSCRIPT

©2014 International Monetary Fund
IMF Country Report No. 14/107
MAURITIUS 2014 ARTICLE IV CONSULTATION—STAFF REPORT; PRESS RELEASE; AND STATEMENT BY THE EXECUTIVE DIRECTOR FOR MAURITIUS
Under Article IV of the IMF’s Articles of Agreement, the IMF holds bilateral discussions with members, usually every year. In the context of the 2014 Article IV consultation with Mauritius, the following documents have been released and are included in this package: The Staff Report prepared by a staff team of the IMF for the Executive Board’s
consideration on April 21, 2014, following discussions that ended on February 5, 2014, with the officials of Mauritius on economic developments and policies. Based on information available at the time of these discussions, the staff report was completed on April 7, 2014.
An Informational Annex prepared by the IMF.
A Press Release summarizing the views of the Executive Board as expressed during its April 21, 2014 consideration of the staff report that concluded the Article IV consultation with Mauritius.
A Statement by the Executive Director for Mauritius.
The publication policy for staff reports and other documents allows for the deletion of market-sensitive information.
Copies of this report are available to the public from
International Monetary Fund Publication Services PO Box 92780 Washington, D.C. 20090
Telephone: (202) 623-7430 Fax: (202) 623-7201 E-mail: [email protected] Web: http://www.imf.org
International Monetary Fund Washington, D.C.
May 2014

z
MAURITIUS STAFF REPORT FOR THE 2014 ARTICLE IV CONSULTATION
KEY ISSUES Context: The Mauritian economy has grown steadily despite weak activity in Europe, its main trading partner. Growth was supported by fiscal stimulus and accommodative monetary policy. The economy is operating slightly below potential, domestic investment has fallen, and the planned medium-term fiscal consolidation has been delayed.
Outlook and risks: The economic outlook for 2014 is broadly positive with growth projected at 3¾ percent and inflation at 4½ percent. The main short-term risk would be renewed Euro area financial stress; medium-term risks relate to weak future reform efforts.
Fiscal policy: The 2014 fiscal stance is neutral. Staff recommended initiating fiscal adjustment already in 2014 to smooth the planned medium-term adjustment. Staff projects debt to be sustainable, but recommended additional medium-term fiscal adjustment efforts to safely reach the legally-mandated 2018 debt target.
Monetary policy: The moderately accommodative monetary policy is appropriate but should be forward looking to anticipate inflationary pressures. Excess liquidity has to be removed to improve the monetary transmission mechanism despite likely, but justified, losses for the Bank of Mauritius. Staff suggested sharing the cost of monetary policy.
External sustainability: Standard quantitative measures together with a persistently high current account deficit, weak export performance, and wage growth in excess of productivity suggest a moderate overvaluation. International reserves appear adequate.
Long-term growth: Staff suggested fiscal adjustment and structural reforms to reduce external vulnerabilities and improve long-term growth. Reforms to public enterprises, social safety nets, pensions, local governments, and the general business environment could lift longer-term growth rates to reach high income status faster than projected.
Financial sector: The financial sector remains well-capitalized and profitable. Stress tests show a broad resilience of the system. BOM started using macro-prudential tools and is improving coordination with the nonbank supervisor.
April 7, 2014

MAURITIUS
2 INTERNATIONAL MONETARY FUND
Approved By David Robinson and Vivek Arora
Discussions took place in Port Louis from January 22–February 5, 2014. The staff team comprised Mr. Petri (head), Mr. Inui, Thakoor, Touna Mama and Xiao (all AFR). Mr. Ismael (OED) participated in the policy discussions. The mission met with Prime Minister Dr. Navin Ramgoolam, Vice-Prime-Minister and Minister of Finance and Economic Development Xavier-Luc Duval, the Governor of Bank of Mauritius, Rundheersing Bheenick, and other government officials. Mr. Campbell provided research and Ms. Thiam (all AFR) editorial support.
CONTENTS
INTRODUCTION __________________________________________________________________________________ 4
RECENT ECONOMIC DEVELOPMENTS __________________________________________________________ 4
OUTLOOK AND RISKS ___________________________________________________________________________ 7
MACROECONOMIC POLICIES FOR 2014 ________________________________________________________ 8
A. Fiscal Policy ____________________________________________________________________________________8
B. Monetary Policy ______________________________________________________________________________ 10
C. External Sector Assessment __________________________________________________________________ 12
MEDIUM-TERM MACROECONOMIC AND STRUCTURAL POLICIES __________________________ 13
A. Fiscal Consolidation and Public Sector Reforms _____________________________________________ 14
B. Financial Sector Issues _______________________________________________________________________ 16
C. Raising Potential Growth _____________________________________________________________________ 18
D. Statistical Issues ______________________________________________________________________________ 18
STAFF APPRAISAL ______________________________________________________________________________ 19
BOX
1. Further Pension Reforms _____________________________________________________________________ 16
FIGURES
1. Macroeconomic Developments, 2006-13 ______________________________________________________6
2. Macroeconomic Projections, 2006-19 __________________________________________________________9
3. Interest Rate Disconnect _____________________________________________________________________ 11
4. Bank Excess Cash Holdings __________________________________________________________________ 11

MAURITIUS
INTERNATIONAL MONETARY FUND 3
TABLES
1. Selected Economic and Financial Indicators, 2011–19 _______________________________________ 21
2. Summary of Central Government Finances, 2011–15 ________________________________________ 22
3. Central Government Integrated Balance Sheet, 2009−12 ____________________________________ 23
4. Balance of Payments, 2011−19 ______________________________________________________________ 24
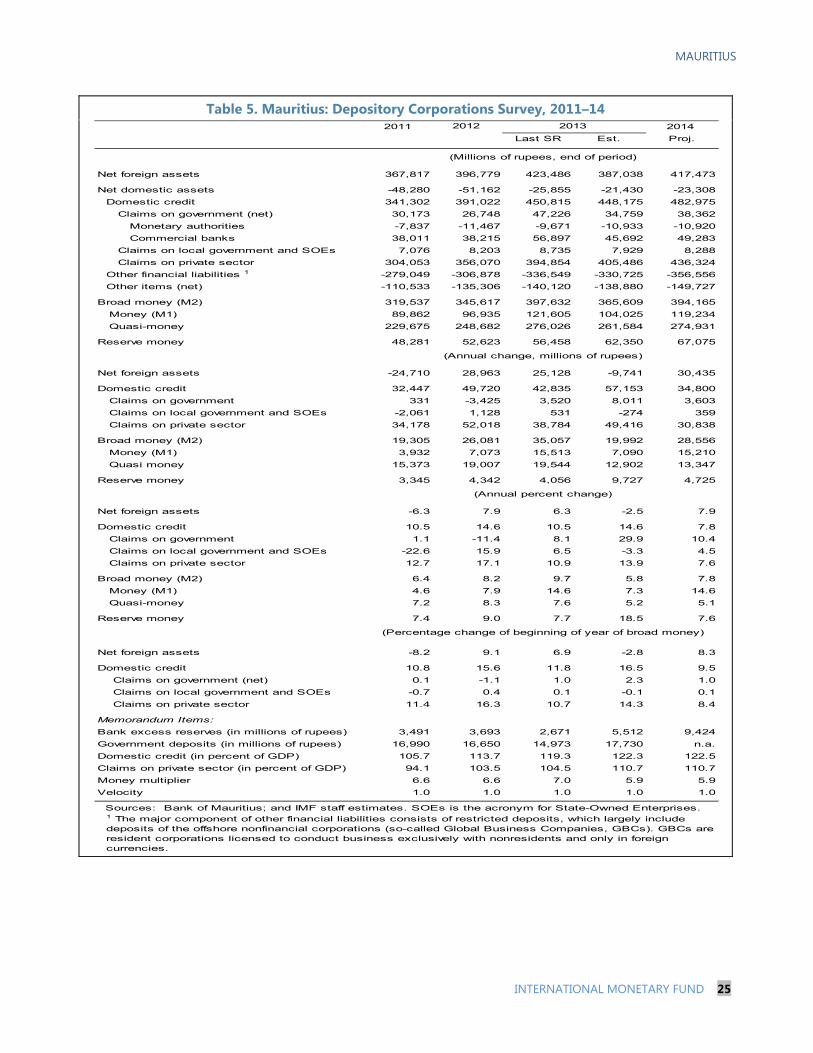
5. Depository Corporations Survey, 2011–14 ___________________________________________________ 25
6. Financial Soundness Indicators for the Banking Sector, December 2009-June 2013 _________ 26
7. Risk Assessment Matrix ______________________________________________________________________ 27
APPENDIXES
I. Debt Sustainability Analysis __________________________________________________________________ 29
II. External Competitiveness Assessment _______________________________________________________ 42
III. Banking Sector and Spillover Analysis ________________________________________________________ 46
IV. Offshore Financial Sector Assessment _______________________________________________________ 52
V. Revenue and Expenditure Assignments of Local Governments ______________________________ 56
VI. Considerations for Introducing an Earned-Income Tax Credit in Mauritius __________________ 60

MAURITIUS
4 INTERNATIONAL MONETARY FUND
INTRODUCTION 1. The Mauritian economy has been growing steadily despite weak activity in Europe—its main trading partner. This resilience has been supported by successive fiscal stimuli together with increased diversification of export destinations. However, the economy still operates slightly below potential and domestic investment has been falling. Going forward renewed reform efforts are needed to accelerate the country’s objective of attaining high-income status. Addressing infrastructure gaps and enhancing the efficiency of the public sector (particularly state-owned enterprises, SOEs) would support further productivity gains.
2. Mauritius’ institutions are among the strongest in Sub-Saharan Africa, and have been continuously ranked number one by the Mo Ibrahim Foundation. Doing Business indicators suggest that the country provides an environment that facilitates business and economic development. The country ranks 12 out of 189 economics in terms of protecting investors, and has recently improved the ease of getting credit. Its corruption perception score and transparency are also favorable. Mauritius also ranks high in terms of infrastructure, at 37 for ground transport and 69 for ICT infrastructure, both out of 140 countries.
3. Previous recommendations regarding gradual fiscal consolidation were delayed, but monetary policy was broadly in line with recommendations. Difficult external conditions, urgent investment needs, and one-off events have delayed medium-term fiscal adjustment in 2013. Monetary policy was moderately accommodative in the context of declining inflation pressures as recommended, but little progress was made in removing excess liquidity and sharing the cost of monetary policy. There has been some progress in better targeting social protection, and improving efficiency of SOEs, but more could be done particularly regarding phasing-out subsidies and incorporating extra-budgetary (special) funds into the budget.
RECENT ECONOMIC DEVELOPMENTS 4. Economic activity expanded at a moderate pace in 2013 and inflation stayed subdued, but unemployment remained a concern. Real GDP growth was lower than expected at 3.1 percent in 2013, mainly due to weak demand for construction, sugar and tourism. With subdued international prices and despite large public sector wage increases, inflation fell to 3.5 percent. The unemployment rate is estimated to have increased marginally to 8.2 percent. Moody’s maintained the country’s credit rating at Baa1.
5. The fiscal policy stance was more expansionary than planned because of one-off and cyclical factors but also slippages. The structural primary balance excluding grants (SPBEG)—a measure of the fiscal impulse—deteriorated by over 2 percent of GDP relative to 2012 rather than the planned neutral stance. While revenues in 2013 were broadly unchanged relative to GDP, expenditures increased by 2 percent of GDP, of which ¾ percent of GDP were related to the flash floods in Port Louis. There also were unplanned transfers to local governments and
MAURITIUS
INTERNATIONAL MONETARY FUND 5
public enterprises. Wages increased as expected by 1 percent of GDP reflecting the recommendations of the Pay Research Bureau’s (PRB) report, which adjusts wages beyond the annual inflation adjustment every five years. Also, capital spending including the special funds was 1 percent of GDP higher, partially due to cost overruns. Gross public sector debt reached almost 60 percent of GDP at end-2013 (55 percent of GDP for public debt law purposes).
6. Monetary policy was somewhat accommodative during 2013, but inflation declined nevertheless. Pass-through of the public sector wage increases into private sector wages was limited and inflation expectations remain well anchored; helped by sluggish domestic demand and low international price pressures. The Bank of Mauritius (BOM) maintained the policy rate at 4.65 percent, following a 25 basis point reduction in June 2013. The nominal effective exchange rate has been relatively stable (see Figure 1); the rupee depreciated by 0.4 percent in real effective terms last year.
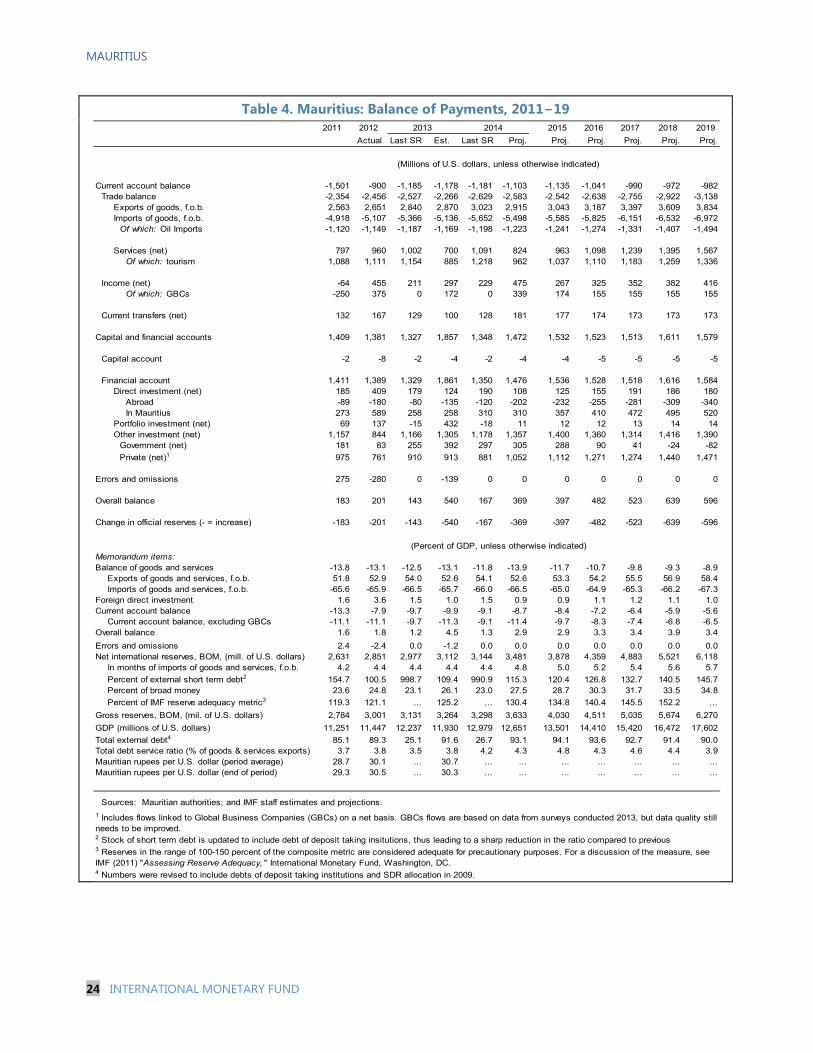
7. The trade balance improved slightly, but the current account deficit increased mainly on account of a decline in service exports. Exports of goods and services increased by only some 3 percent in dollar terms (tourism receipts dropped by 9 percent related to a slow European recovery). Imports of goods and services increased marginally by 2 percent. The decline of net income, particularly from the GBC sector (possibly related to low global interest rates), contributed to widen the current account deficit from 8 percent of GDP in 2012 to 10 percent in 2013. The BOM accumulated additional net international reserves and the reserve cover of imports of goods and services remained at 4.4 months at end-2013.
8. The banking system remained profitable and BOM strengthened macro-prudential measures. Banks capital—at 14.6 percent of Regulatory Tier I capital to risk-weighted assets in June 2013—remains, well above Basel II and proposed Basel III requirements. Banks have remained profitable with 15 percent return on equity, despite low leverage ratios. BOM is consulting with banks on implementation of Basel III regulations. BOM continued to publish its bi-annual CAMEL ratings for all domestic banks. Non-performing loans (NPLs) increased slightly to 3.7 percent by June 2013. The BOM implemented macroprudential measures aimed at addressing emerging NPLs in the construction and real estate sectors as well as rising indebtedness.

MAURITIUS
6 INTERNATIONAL MONETARY FUND
Figure 1. Mauritius: Macroeconomic Developments, 2006–13
Growth is lately driven by mainly by consumption. Inflationary pressures have declined in 2013, despite public sector wage increases, which were well anticipated.
Credit to the private sector continued to expand at a robust pace reflecting increased intermediation.
Reserves remain at comfortable levels; and the current account deficit widened in 2013 mainly because of GBC transactions.
The REER edged up in 2013 reversing a small depreciation in mid-2012.
Fiscal consolidation was delayed in 2013 due to one-off factorsand slippages; and total debt increased marginally as a result.
Sources: Mauritian authorities; and IMF staff estimates and projections.
‐10
-5
0
5
10
2006 2007 2008 2009 2010 2011 2012 2013
Co
ntr
ibu
tio
n t
o r
eal G
DP
gro
wth
, %
Net exports Consumpt.Investment InventoriesGDP non-OECD GDP
0
4
8
12
16
2006 2007 2008 2009 2010 2011 2012 2013
Infl
atio
n r
ate
CPI, eop
CPI, eop, excluding volatile items
0
3
6
9
12
15
0
10
20
30
2006 2007 2008 2009 2010 2011 2012 2013
%
Yoy
gro
wth
Broad moneyPrivate creditPolicy rate (right)
2
3
4
5
6
7
8
9
10
-16
-14
-12
-10
-8
-6
-4
2006 2007 2008 2009 2010 2011 2012 2013
Mo
nth
s o
f im
po
rts
of
goo
ds
and
ser
vice
s
% o
f G
DP Current Account
Trade BalanceReserve assets (right)
80
90
100
110
120
130
22
27
32
37
42
47
2006 2007 2008 2009 2010 2011 2012 2013
Ind
ex, 2
00
0 =
10
0
MRS/USD MRS/EUR
NEER (right axis) REER (right axis)
50
55
60
65
70
-5
-4
-3
-2
-1
0
1
2
3
2006 2007 2008 2009 2010 2011 2012 2013
% o
f G
DP
% o
f G
DP
, exc
lud
ing
net
len
din
g
Overall balanceStruct. prim. w/o grantsPrimary balance including grantsStructural primary balance including grantsPublic debt (Right)

MAURITIUS
INTERNATIONAL MONETARY FUND 7
OUTLOOK AND RISKS 9. Growth is projected to accelerate modestly in 2014 consistent with an improving external environment. Staff projects that real GDP growth in 2014 will increase to 3.7 percent, remaining slightly below potential reflecting still subdued demand from Mauritius’ main markets and low investment. Growth could turn out stronger if the implementation of the public investment program is stronger than currently projected or private investment picks up. In subsequent years, real GDP growth is expected to converge to its medium-term growth potential of about 4 percent. CPI inflation is projected to accelerate to 4.5 percent in 2014, still below the traditional implicit inflation target of 5 percent. The current account deficit is projected to narrow gradually, falling to about 6½ percent of GDP by 2019, reflecting reforms to improve external competitiveness.
10. While fiscal consolidation has been delayed, debt related risks appear manageable. After expenditure increases in 2013, the 2014 budget keeps spending at historically high levels, above the levels consistent with achieving the 2018 debt limit. However, the medium-term budget includes fiscal adjustment starting in 2014. While the public debt stock, at around 60 percent of GDP in gross, undiscounted terms, is somewhat high for an emerging economy, exposure to risks are limited by the debt profile—low external debt, generally from multi- and bilateral sources (financed at long maturities and favorable interest rates) and a relatively well developed domestic financial market. Key risks relate to the ability to achieve the targeted medium-term fiscal adjustment and the need to resist spending pressures ahead of elections scheduled for 2015.
11. A protracted period of slower growth in Europe could reduce growth (see Risk Assessment Matrix, Table 7). The main linkages to Mauritius would be through reduced tourism, trade, and FDI inflows. In addition, the persistently large current account deficit is a vulnerability. In both cases, relying on the flexible exchange rate regime should be helpful. Capital and financial flows into Mauritius have been stable compared with larger emerging markets that were affected by the emerging market volatility in 2013 and early 2014. Other international financial flows are an additional source of vulnerability, as large capital flows linked in large part to the GBCs could prove to be more volatile than historically although the impact on the real economy appears small. A revision of the Double Taxation Avoidance Agreement (DTAA) with India should have a moderate impact on growth and capital flows in part because there already has been some reorientation of GBC flows towards Africa.
12. The authorities broadly agreed with the staff’s assessment of the outlook and associated risks and policy options. They believe a higher growth rate is possible over the medium term, but they are cognizant of the need to advance structural reforms and initiate fiscal consolidation to improve growth prospects and reduce external imbalances.

MAURITIUS
8 INTERNATIONAL MONETARY FUND
MACROECONOMIC POLICIES FOR 2014 Discussions centered on the appropriate stance of fiscal policy from a cyclical and medium-term perspective; risks to the inflation outlook and the related monetary policy stance; and improvements to the monetary policy framework in preparation for a move to more formal inflation targeting.
A. Fiscal Policy
13. The 2014 fiscal policy stance is projected to be broadly neutral, with historically high spending. While the fiscal stance presented in the budget document is expansionary, staff projects that with the public investment program and contingency reserve implemented at historical levels the overall deficit and structural primary balance excluding grants would be largely unchanged (Figure 2). The budget aims to support employment and economic growth, expand social safety nets, advance the public infrastructure program, and foster the activities of emerging sectors of the economy. Domestic revenue will increase marginally, supported by new revenue measures on excises on cars and tobacco and expected dividend payments from SOEs. Current spending would remain at broadly the same level, with lower transfers offsetting a small wage increase related to the PRB. Total investment spending would increase somewhat, due to a ½ percent of GDP increase in net spending from the special funds. Fiscal adjustment is now postponed into 2015—an election year.
14. Staff suggested advancing some fiscal consolidation into 2014. Delaying fiscal adjustment into 2015 as currently planned will make it harder to achieve the primary fiscal balances needed to address external imbalances, and reduce debt vulnerabilities. In fact, staff currently projects debt to be on a declining path, but that the 2018 debt law target of 50 percent of GDP would be missed. Moreover, fiscal adjustment has been postponed in previous years already. Thus, staff recommended reducing the fiscal deficit already in 2014 through reducing transfers to SOEs, further restricting recourse to the contingency reserve, and limiting spending from the special funds. Given the low fiscal multipliers in a small open economy, the output cost should be marginal and this would help to smooth and achieve the needed adjustment over time.
15. Should the external environment deteriorate significantly it would be appropriate to let automatic stabilizers work. The experience from the global financial crisis showed that this could be quite effective and growth did not decline as much as in other countries. Also, staff recommended including all extra-budgetary funds in the budget to increase fiscal transparency and better measure the fiscal stance. In addition, passing the new Public Financial Management (PFM) Act, which has been developed with Fund technical assistance, should alleviate some of the budget execution difficulties that have led the authorities to create the special funds.

MAURITIUS
INTERNATIONAL MONETARY FUND 9
Figure 2. Mauritius: Macroeconomic Projections, 2006–19 The output gap will start to narrow after 2014 and growth should reach its medium-term potential around 4 percent.
The current account should improve over the medium-term through the trade balance; international reserves should increase.
Taxes should remain stable with small declines in nontax and grants; hence consolidation will take place through …
… reduced spending with a focus on rationalizing transfers and subsidies; though also less capital spending.
Fiscal policy attempts to create buffers by targeting primary balance starting in 2015 …
… leading to a decline in debt over time; but still above the legally-mandated debt target in 2018.
Sources: Mauritian authorities; and IMF staff estimates and projections.
MAURITIUS
10 INTERNATIONAL MONETARY FUND
16. The authorities agreed with the staff’s analysis, but explained that it would be difficult to limit spending in 2014. They pointed out that a substantial part of the deficit is related to urgent capital spending. They also reasoned that a large part of spending was relatively rigid and would be difficult to reduce, particularly given the electoral calendar. They also explained that the wage bill would decline gradually until the next PRB decision in every three years, which should moderate wage spending. They also reaffirmed their commitment to reach the 2018 debt targets. In the meantime the authorities are working to identify efficiency savings in the area of social protection (together with the World Bank) and SOEs (with AFRITAC South).
B. Monetary Policy
17. The current somewhat accommodative monetary policy stance is appropriate, but inflationary expectations and external developments should be monitored in a forward looking framework. While inflation expectations appear to be well-anchored according to inflation surveys, pressures may arise from: higher imported prices (fuel or food); via exchange rate pass-through; or adjustments of administrated prices. Staff currently forecasts headline inflation to remain below the traditional implicit inflation target of 5 percent in 2014. However, the authorities should stand ready to tighten monetary conditions if inflation accelerates, initially through the removal of excess liquidity, which should be done irrespectively (see below). The first round effect of any administrated price increases could be accommodated, but a tighter monetary policy stance would likely be needed to help contain inflationary expectations and limit second-round price effects, which will also depend on the estimated output gap and fiscal policy stance.
18. A persistent disconnect between the policy rate and the interbank rate hinders the monetary transmission mechanism. The interbank rate has been persistently below the policy rate for several years (165 basis points at end-2013) and there is little short-term relationship to the policy rate (Figure 3), because of fluctuating excess liquidity or excess cash holdings of banks (Figure 4). While reserve requirements were increased in two increments from 6 to 8 percent to remove excess liquidity, most recently in October 2013, staff considers this to be a second best policy response because of the increased cost of credit intermediation. Excess liquidity is not overly worrisome from an inflation perspective now because international prices appear stable and the output gap is slightly negative. However, the persistent gap makes monetary policy less effective. While the repo rate influences bank deposit and lending rates (partly through moral suasion), the low interbank rate contributes to financial disintermediation since banks have little incentive to raise deposits which cost more at the margin than they can earn. Moreover, the excess liquidity might be inducing banks to engage in riskier lending.
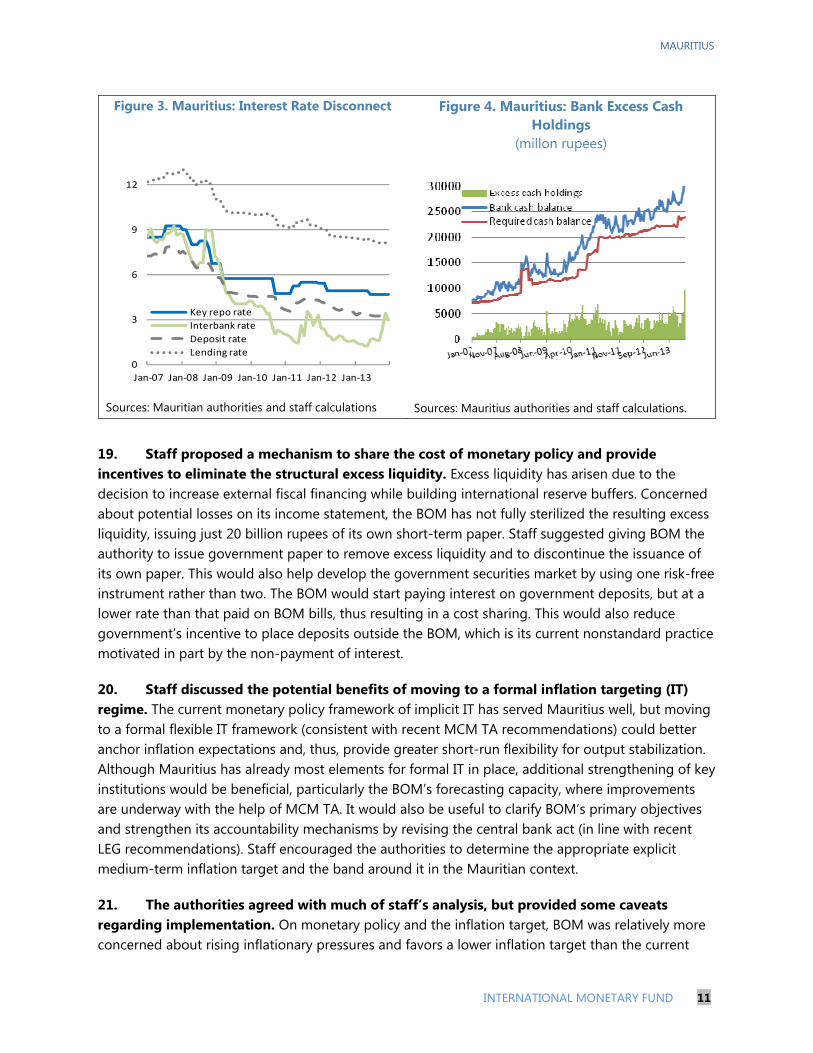
MAURITIUS
INTERNATIONAL MONETARY FUND 11
Figure 3. Mauritius: Interest Rate Disconnect Figure 4. Mauritius: Bank Excess Cash Holdings
(millon rupees)
Sources: Mauritian authorities and staff calculations Sources: Mauritius authorities and staff calculations.
19. Staff proposed a mechanism to share the cost of monetary policy and provide incentives to eliminate the structural excess liquidity. Excess liquidity has arisen due to the decision to increase external fiscal financing while building international reserve buffers. Concerned about potential losses on its income statement, the BOM has not fully sterilized the resulting excess liquidity, issuing just 20 billion rupees of its own short-term paper. Staff suggested giving BOM the authority to issue government paper to remove excess liquidity and to discontinue the issuance of its own paper. This would also help develop the government securities market by using one risk-free instrument rather than two. The BOM would start paying interest on government deposits, but at a lower rate than that paid on BOM bills, thus resulting in a cost sharing. This would also reduce government’s incentive to place deposits outside the BOM, which is its current nonstandard practice motivated in part by the non-payment of interest.
20. Staff discussed the potential benefits of moving to a formal inflation targeting (IT) regime. The current monetary policy framework of implicit IT has served Mauritius well, but moving to a formal flexible IT framework (consistent with recent MCM TA recommendations) could better anchor inflation expectations and, thus, provide greater short-run flexibility for output stabilization. Although Mauritius has already most elements for formal IT in place, additional strengthening of key institutions would be beneficial, particularly the BOM’s forecasting capacity, where improvements are underway with the help of MCM TA. It would also be useful to clarify BOM’s primary objectives and strengthen its accountability mechanisms by revising the central bank act (in line with recent LEG recommendations). Staff encouraged the authorities to determine the appropriate explicit medium-term inflation target and the band around it in the Mauritian context.
21. The authorities agreed with much of staff’s analysis, but provided some caveats regarding implementation. On monetary policy and the inflation target, BOM was relatively more concerned about rising inflationary pressures and favors a lower inflation target than the current
0
3
6
9
12
Jan-07 Jan-08 Jan-09 Jan-10 Jan-11 Jan-12 Jan-13
Key repo rate
Interbank rate
Deposit rate
Lending rate

MAURITIUS
12 INTERNATIONAL MONETARY FUND
implicit 5 percent target. MOFED in contrast would like to see further analysis regarding the optimal inflation target. There was widespread agreement regarding the need to withdraw excess liquidity and the cost-sharing mechanism, but the details (including the interest rate paid on government deposits) remain to be worked out. The authorities saw benefit in modernizing the central bank act, although there remains a difference of views regarding some details, particularly regarding central bank independence and accountability.
C. External Sector Assessment
22. Staff analysis suggests that the real effective exchange rate (REER) is moderately overvalued (Appendix II). CGER-type models indicate an overvaluation of 7 percent on average for 2014, declining to 4 percent by 2018 (Text Table 1). The estimates are subject to considerable uncertainty—all ranges of estimates include zero overvaluation—but all estimates point in the same direction. Other competiveness indicators also point to some overvaluation: the persistently large historical current account deficit,1 loss of market share in export sectors like tourism, weak long-term export growth, and wage growth in excess of labor productivity. Capital flows to finance the current account deficit have been relatively stable. GBC transactions have a large impact on the BOP financing and fluctuate significantly from year to year; partly because of timing issues (see Appendix IV). FDI and other private investment flows have been the most important for BOP financing historically and are projected to continue.
Text Table 1. Mauritius: Exchange Rate Estimates
1 Most tourism-dependent economies tend to have large inward FDI flows, leading to weak current account balances. Also, there is some evidence that financial services earnings related to the Global Business Companies (GBCs) might be underestimated.
2012 2013 2014 2018
Method
MB 6.2 8.5 7.3 4.0
ERER 7.2 6.8 6.7 5.1
ES 10.6 13.8 11.0 7.1
PPP 2.2 1.9 1.9 1.9
FEER 12.6 10.6 7.6 3.3
Average 7.8 8.3 6.9 4.3
Trimmed Average 2 8.0 8.7 7.2 4.11 Mauritius specific elasticities: exports = -1.6; imports = 12 Average excluding highest and lowest results
Exchange Rate Misalignments (Mauritius specific elasticities)1

MAURITIUS
INTERNATIONAL MONETARY FUND 13
23. External imbalances need to be addressed by increasing national savings and structural reforms to foster competitiveness. Over the 2000s Mauritius experienced a significant fall in national savings from over 25 percent of GDP in the early 2000s to 13 percent in 2011 with a corresponding increase in the current account deficit since investment was relatively stable. Fiscal consolidation, as envisioned by the authorities, can contribute to the needed adjustment in saving-investment balances, but private sector savings also need to rise, for example through pension reform (see below) and reforms that encourage savings. Efforts to improve competitiveness are also crucial, such as investments in infrastructure to remove bottlenecks, and in human capital to reduce skills mismatches, and wage policies that align real wage increases with productivity improvements.
24. Reserves levels appear comfortable when measured against the traditional thresholds and adequate relative to the IMF composite indicator (Appendix II). Reserves are above the traditional benchmarks (3 months of imports, 20 percent of M2, and 100 percent of short-term external debt). Reserves are 125 percent of the IMF composite indicator at end-2013, which is in the middle of the recommended range (100 to 150 percent). However, if the external liabilities of the GBC sector were taken into consideration, the IMF metric would drop well below the comfortable range. While the extent to which GBC liabilities should be taken into account for reserve adequacy purposes is difficult to assess, the BOM’s reserve reconstitution program targets a further accumulation of reserves to about 150 percent of the IMF metric by 2019. Staff agreed that a further gradual accumulation of reserves would be prudent, with intervention focused on reducing the volatility of the rupee. The Mauritian economy has so far not been very affected by the increased volatility in international capital flows since last summer.2
25. The authorities agreed with staff’s assessment and intend to address the economy’s falling competitiveness. They believe that fiscal adjustment can help reduce external imbalances, but more importantly that their medium-term reform program can improve export competitiveness, and that education and labor market reforms help boost productivity.
MEDIUM-TERM MACROECONOMIC AND STRUCTURAL POLICIES
Discussions centered on debt sustainability and the specifics of medium-term fiscal consolidation; local government finances, the pension and social protection system, the role of the global business sector; and policies to increase longer-term growth.
2 Mauritius continues to maintain an exchange system free of multiple currency practices and of restrictions on the making of payments and transfers for current international transactions.

MAURITIUS
14 INTERNATIONAL MONETARY FUND
A. Fiscal Consolidation and Public Sector Reforms
Fiscal consolidation
26. Fiscal consolidation is needed to address external imbalances, lower vulnerabilities, and meet the debt law. The updated debt sustainability analysis (DSA) shows a reasonably positive debt outlook for Mauritius, similar to the previous DSA, although slightly weaker (Appendix I). Both total public debt and external debt are on sustainable trajectories and the results of stress tests indicate that debt dynamics are resilient to several shocks. However, based on current policies, staff projects that total public debt would not fall to below 50 percent of GDP by 2018 as required by law. Staff noted that a debt ratio of 50 percent of GDP is close to the sustainability risk threshold for a typical emerging market, but, as a financial center, Mauritius might need larger policy buffers. Staff therefore recommended advancing some fiscal consolidation into 2014 and accelerating the adjustment over 2015-18 to safely reach the debt target. The authorities recently received TA on their medium-term debt strategy from MCM, which suggested to update and publish the authorities’ debt strategy to provide market participants with more guidance regarding the government’s financing strategy.
27. Given the large investment needs, medium-term fiscal consolidation should focus on current expenditure rationalization and include revenue raising measures. There appears to be room for reducing expenditures through better targeting of social assistance and reduction in subsidies, and from improving efficiency in SOEs and local governments. However, the consolidation should not come from spending alone—priority spending, such as health and education, and maintenance spending may need to increase, and new infrastructure investment is needed. Thus, some focus on revenue raising measures would seem a better adjustment mix than concentrating on spending only in the authorities’ plans. Increases in the revenue-to-GDP ratio could be achieved through better tax administration and growth-friendly and environmentally-sustainable taxes.3
Local government finances
28. Reforms to increase local governments’ own resources and improve spending efficiency should contain fiscal risks and improve efficiency (Appendix V). Local governments rely heavily on Grant-In-Aid (GIA) central government transfers, which do not reflect expenditure needs or revenue raising capacity. The authorities are considering changing the GIA formula with assistance from AFRITAC South to reduce local government imbalances and provide greater revenue mobilization incentives. The existing own-revenue instruments are used inadequately. Staff advised to increase reliance on real estate taxes over the medium term since they tend to increase local government accountability as local payers tend to monitor local service delivery more closely. Staff also suggested reviewing spending assignments, since local authorities spend most of their outlays
3 Taxation of fuel products could be raised and combined with a carbon tax, both serving environmental and external balance objectives. VAT and import tariff exemptions should be phased out. Over the medium term, GPS-based tolls could replace road taxes and car import duties. Real estate taxes could be introduced for local governments.

MAURITIUS
INTERNATIONAL MONETARY FUND 15
on wages, which leaves little fiscal space for service delivery. Staff advised to phase in reforms slowly with proper planning and consultation.
Pension reforms
29. The authorities have implemented important pension reforms, but there are still significant challenges (Box 1). Major recent steps were the increase in retirement age and the creation of a new system for civil servants. Further reforms could help reduce the fiscal cost of the system, increase savings, and contribute to a better social protection system. Creating the capacity for pension modeling with the World Bank’s PROST model is welcome.
Potential for an earned income tax credit
30. An earned income tax credit (EITC) is theoretically appealing, but unlikely to be feasible at this time (Appendix VI). With an EITC, low-income workers receive a refundable tax credit instead of paying taxes. This can help alleviate poverty, especially for families with children, and provide greater incentives for unemployed youth and women to work without placing an additional burden on employers. On the other hand, an EITC would be relatively expensive and would not fit into the current fiscal framework without offsetting cost savings or revenue measures. In addition, implementing EITC would incur significant administrative costs on the Mauritius Revenue Authority (MRA) because only ¼ of personal income taxpayers are required to file tax returns. Moving to an EITC would force MRA to divert its limited resources away from high-risk, high-income taxpayers and could lead to serious revenue losses. Staff and authorities agreed that an EITC would not be advisable at this time, but could be kept under consideration as a longer-term option as part of an overall review of the social safety net.
31. The authorities supported much of staff suggestions but pointed to implementation difficulties. Regarding fiscal adjustment they preferred to base as much as possible on expenditure measures in order to preserve their relatively efficient tax system, which they see as one of Mauritius’ attractions. They explained that in the current political situation major reforms would be difficult, but that technical work to prepare the ground for future reforms would continue. Regarding local governments they appreciated AFRITAC South’s assistance, but stressed that real estate taxation would have to be carefully prepared to be successfully implemented. On pensions, they were receptive to several ideas including the merging of the new civil service system, but stressed that reforms should be studied further using the World Bank’s PROST model.

MAURITIUS
16 INTERNATIONAL MONETARY FUND
Box 1. Mauritius: Further Pension Reforms
Rising pension expenditure in Mauritius reflects rising dependency ratios. Increasing longevity and declining fertility rates contribute to rising dependency ratios (Box Figure 1). The cost of the current system is projected to increase by 2 percent of GDP by 2040, mainly due to the public sector (civil servants) (Box Figure 2), despite optimistic assumptions for the basic retirement program (BRP).
Box Figure 1. Ageing increases the
dependency ratio Box Figure 2. Pension imbalances deteriorate
(percent of GDP)
Source: IMF staff estimates.
The authorities implemented two bold reforms; but challenges remain. The retirement age for both males and females was increased from 60 to 65 years. In 2013, a new defined-contribution (DC) system was introduced for all new public sector employees. However, tackling the transition cost (40 percent of GDP in NPV-terms) remains a challenge since the new system will only generate savings in about 35 years. Previous reforms aimed at means-testing the BRP were reversed.
Further reforms could render the system fully sustainable. Measures could include (i) indexing the retirement age to life expectancy; (ii) linking benefits to inflation instead of wages (iii) decreasing incentives for early retirement; (iv) linking accrual rates to the real investment returns; and (v) reducing job categories eligible for early retirement. In addition, the BRP could be converted into a true poverty pension. Regarding the National Pension Fund (NPF) for the private sector, increasing contribution rates could support higher replacement rates, which at 35 percent are only half that of the public sector. Additionally, pension fund returns could be improved by diversifying into low cost international passive strategies. These reforms could help increase national and fiscal savings while possibly allowing for an increase in pensions for lower income workers.
Merging the new public sector system with the NPF should be considered. The DC system unnecessarily shifts all risks to pensioners. A prefunded defined benefit system, as the NPF, might achieve higher investment returns through more professional management and higher risk-taking capacity. Risk sharing would eliminate longevity risk. Pensioners could receive higher and more secure pensions for the same fiscal cost, and mobility between private and public sectors would improve.
B. Financial Sector Issues
32. The Mauritian banking system is well-capitalized and resilient against a range of shocks according to stress tests (Appendix III). Banks’ profitability and comfortable capitalization provide valuable cushions against a range of shocks to their credit portfolios. Direct exchange rate and interest rate risks appear to be low. Risks on concentration of lending have eased, but need
0
5
10
15
20
25
30
35
40
2010 2015 2020 2025 2030 2035 2040 2045 2050
Old-age dependency ratio
-6.0
-5.0
-4.0
-3.0
-2.0
-1.0
0.0
1.0
2010 2015 2020 2025 2030 2035 2040 2045 2050
BRP
Public Sector
NPF

MAURITIUS
INTERNATIONAL MONETARY FUND 17
continuous monitoring. Liquidity ratios have improved somewhat, and the banking sector as a whole still has sufficient liquid assets to sustain a hypothetical bank-run. An analysis of possible cross border contagion suggests that severe shocks to some large European banks would have considerable negative effects on external funding for Mauritian banks, but the overall impact should be manageable.
33. The BOM should continue its supervisory efforts, including through FSC coordination. Rising non-performing loans, insufficient collateral values, and credit exposures to large borrowers might be of concern for banks, although it appears that most real estate lending was well-collateralized. Regular meetings between BOM and FSC have been held to address supervisory and statistics coordination issues. The BOM and the FSC should continue to strengthen their collaboration, particularly on assessing the inter-linkages between banks, non-bank financial institutions and GBC sector, and regulatory overlaps and gaps. Threats to financial stability posed by a Ponzi-like scheme in 2013 were contained successfully, and the regulatory framework was subsequently improved.4
34. Further work is required on a deposit insurance scheme (DIS), particularly regarding linkages with bank resolution. A draft DIS Bill was prepared by the BOM in consultation with stakeholders, but the draft could be strengthened to ensure its consistency with bank resolution procedures. Further technical assistance from the IMF and the World Bank is planned.
35. The GBC sector contributes increasingly to the economy, but there are risks associated with its activity (Appendix IV). The linkages of GBCs with the domestic economy are not easily quantified. GBCs employ highly qualified employees directly and indirectly and might contribute some 3 percent of total GDP. The authorities have strengthened the statistical coverage of the sector with help from STA and are channeling more supervisory resources to it. The likely revision of the double taxation avoidance agreement (DTAA) with India could reduce GBC earnings (see Risk Assessment Matrix). However, the sector is diversifying, including into providing financial services to Africa.
36. The authorities welcomed the results of the staff’s stress testing exercise, which complement the BOM’s own stress testing. They noted that they have introduced macro-prudential measures to address vulnerabilities in the banking sector. The authorities welcomed staff suggestions on the DIS and the global business sector, and they have requested further TA from the Fund in these areas.
4The scheme was uncovered in early 2013. The BOM acted swiftly to involve law enforcement, to gather information on the fraudulent (and unlicensed) entities and transactions, and to provide information to the public and register complaints. BOM set up a "hotline" to provide information and register complaints (by end-2013, some, 3.400 complaints totaling almost Rs 1 billion had been received). BOM and FSC launched education campaigns to encourage due diligence by investors. Experts from the Reserve Bank of India were enlisted to help close regulatory gaps and MCM TA provided information on international best practices in combating such schemes.

MAURITIUS
18 INTERNATIONAL MONETARY FUND
C. Raising Potential Growth
37. Over the last decade or so, Mauritius’s trend growth has softened while total factor productivity (TFP) has fallen. During 1960-2013, Mauritius grew by 5 percent on average each year. Growth accounting models suggest that human-capital-augmented labor contributed 2½ percentage points, physical capital 1½ percent, and total factor productivity 1 percentage points.5 Thus, Mauritius’ impressive past growth performance relied heavily on labor, which—given population dynamics—will be less important, although there is a role for human capital. Growth accounting suggests that growth over the next 20 years might be around 3 percent in the absence of further structural reforms. Nonetheless, with virtually no population growth, a 3 percent per-capita growth rate is very respectable and would allow Mauritius to reach high income status in about a decade.
38. Long-term growth prospects could be improved by addressing aspects of the cost of doing business— infrastructure bottlenecks, limited air access, and high communication costs. Carefully planned investments in physical and human capital should raise growth directly and indirectly through improved productivity, but should avoid fiscal contingencies. Comprehensive reforms including increased private involvement in the water, transport, and energy sectors should help remove infrastructure bottlenecks and improve productivity.
39. Labor market policies could increase potential growth by building human capital qualitatively and quantitatively. Unemployment is relatively high and predominantly affects the young, women, and the low-skilled. Policy measures should primarily target the employability of low-skilled Mauritian youth, for example through subsidized training (as already started with the Youth Employment Program). In addition, the wage setting mechanisms should be reviewed with the objective of aligning real wages with labor productivity. Finally, consideration should be given to attracting skilled foreign labor to fill skill gaps and to help transfer skills to the Mauritian work force.
40. The authorities appreciated staff’s analysis but thought that it was unduly pessimistic. While agreeing that trend growth in Mauritius had likely declined, they argued that the long-term potential was significantly higher than estimated by staff, as they considered that reform efforts would be continued vigorously, yielding higher TFP growth.
D. Statistical Issues
41. Mauritius’ macroeconomic statistics are adequate for surveillance. Statistical capacity continues to be strengthened and the authorities aim to subscribe to SDDS Plus. Staff supports the Statistics Mauritius’ initiatives to improve its website and communication to the public in general. There is a need to improve labor statistics, particularly regarding unemployment, and labor
5 Svirydzenka and Petri, 2014, “Mauritius - The Drivers of Growth—Can the Past Be Extended”, draft IMF WP.

MAURITIUS
INTERNATIONAL MONETARY FUND 19
productivity. Monetary statistics could benefit from expanding coverage to Other Financial Companies (OFCs), including pension funds and insurance companies.
42. Coverage of the GBC sector should be strengthened. Looking forward, BOP and international investment position (IIP) statistics should increasingly improve coverage, frequency, and timeliness of data sources, with particular focus on the coverage of GBCs.
STAFF APPRAISAL 43. The macroeconomic outlook for 2014 is broadly positive. Real activity is expected to strengthen to close to potential, while inflation is projected at about 4.5 percent with a stable outlook. Mauritius has been resilient to a variety of shocks in part because of prudent macroeconomic policies and strong institutions.
44. Delays in beginning the intended medium-term fiscal consolidation complicate the achievement of the debt target. With the output gap expected to close further, a tighter fiscal stance in 2014 would help smooth the planned consolidation. Debt is projected to decline, but staff recommended additional moderate fiscal adjustment over the medium term to lower debt vulnerabilities and ensure that the 2018 debt target would be met.
45. An overhaul of the SOE sector and improvements of the already efficient tax system should also contribute to medium-term fiscal consolidation. Considerable fiscal resources are devoted to relatively inefficient SOEs, which should be reformed to operate more on fully commercial principles, particularly through comprehensive policy reforms of the regulatory framework of the water and energy sectors. Improving tax administration and broadening the tax base by reducing the list of VAT and import exemptions, introducing a true carbon tax, and moving to GPS-based road taxes could create further fiscal space.
46. The current moderately accommodative monetary policy is appropriate. Inflation dynamics, mostly determined by imported goods prices and inflation expectations, appear stable, but the authorities should be forward looking in their response to potential inflationary pressures. While most elements of formal inflation targeting are in place, additional steps to strengthen institutional arrangements and forecasting would allow for a greater forward orientation in setting monetary policy and an eventual adoption of formal flexible IT.
47. Reducing excess liquidity in the banking sector is necessary to improve the monetary transmission mechanism despite likely but justifiable losses for the BOM. Aligning the key policy rate and the interbank rate would improve the transmission mechanism through tighter links between interest rates and better signaling. Moreover, banks would have more incentives to attract deposits and less to engage in unsound banking practices. Absorbing excess liquidity through issuance of government paper, rather than BOM paper, combined with paying interest on government deposits, would result in better sharing of the cost of monetary policy.

MAURITIUS
20 INTERNATIONAL MONETARY FUND
48. The banking system remains well-capitalized, profitable, and resilient against a range of shocks. Developments in the real estate sector and household indebtedness, as well as concentration of lending should continue to be monitored closely. Whenever necessary, macro-prudential measures could be used to address vulnerabilities in the banking sector. It would be desirable to introduce a deposit insurance scheme compatible with modern bank resolution tools. Further strengthening of the coordination with the nonbank financial supervisor would be useful to reduce regulatory overlaps and gaps.
49. Further reform efforts are needed to enhance external competitiveness and improve longer-term growth prospects. Empirical models and broader indicators point to a moderate overvaluation of the rupee that should be addressed through steps to strengthen national savings—both through medium-term fiscal consolidation and pension reform to raise private savings—as well as measures to enhance productivity through reducing the cost of doing business.
50. Pension reforms could promote national savings while better achieving social protection for the poor and the overall workforce. Pension contributions for the National Pension Fund (NPF) could be raised in order to increase retirement income. Staff also recommended merging the pre-funded pension system for new civil servants with the NPF to achieve better old age protection, economies of scale in pension administration, and better mobility between the public and private sector. The universal basic retirement program could be converted into a true poverty pension to improve social protection and generate fiscal savings.
51. Local government finances should be reformed to increase own resources and improve local service delivery. In the short-term, the focus should be on improving the Grant-In-Aid transfer formula to reduce fiscal imbalance between localities and provide greater incentives for raising own revenues. Longer-term reforms should include appropriate expenditure assignments, possibly reducing wage outlays, and turning real estate taxes into a reliable long-term source of funding.
52. Macroeconomic statistics are adequate for surveillance. The authorities’ commitment to adopt SDDS plus is a clear sign of the importance placed on accurate timely data. Priority areas to strengthen are the coverage of the GBC and labor statistics.
53. Staff recommends that the next Article IV consultation be held on the standard 12-month cycle.

MAURITIUS
INTERNATIONAL MONETARY FUND 21
Table 1. Mauritius: Selected Economic and Financial Indicators, 2011–19
2011 2016 2017 2018 2019Actual Actual Last SR Est. Last SR Proj.
National income, prices and employmentReal GDP 3.8 3.3 3.7 3.1 4.4 3.7 4.0 4.2 4.1 4.0 4.0Real GDP per capita 3.4 2.7 3.2 2.6 3.8 3.2 3.5 3.7 3.6 3.5 3.6GDP per capita (in U.S. dollars) 8,730 8,835 9,395 9,160 9,912 9,661 10,256 10,903 11,620 12,364 13,159GDP deflator 4.1 3.1 5.7 3.3 4.6 3.7 4.2 5.1 5.1 5.1 5.1Consumer prices (period average) 6.5 3.9 5.7 3.5 4.6 3.9 4.4 5.0 5.0 5.0 5.0Consumer prices (end of period) 4.9 3.2 6.0 3.5 5.1 4.5 5.0 5.0 5.0 5.0 5.0Unemployment rate (percent) 7.9 8.0 … n.a. … … … … … … …
External sector Exports of goods and services, f.o.b. 17.9 3.8 6.7 3.7 6.3 6.0 8.2 8.6 9.5 9.5 9.7
Of which : tourism receipts 16.1 -0.8 4.3 -10.6 5.5 8.2 6.5 6.8 6.9 7.0 7.0Imports of goods and services, f.o.b. 20.6 2.2 5.9 3.9 5.3 7.2 4.3 6.6 7.7 8.2 8.7Nominal effective exchange rate (annual averages) 3.3 0.5 … -1.3 ... ... ... ... ... ... ...Real effective exchange rate (annual averages) 6.2 1.4 … -0.4 ... ... ... ... ... ... ...Terms of trade -5.7 0.3 … 0.6 ... ... ... ... ... ... ...
Money and creditNet foreign assets -8.2 9.1 6.9 -2.8 ... 8.3 ... ... ... ... ...Domestic credit 10.8 15.6 11.8 16.5 ... 9.5 ... ... ... ... ...
Net claims on government 0.1 -1.1 1.0 2.3 ... 1.0 ... ... ... ... ...Credit to non-government sector 1 10.8 16.1 10.7 14.3 ... 11.1 ... ... ... ... ...
Broad money (end of period, annual percentage change) 6.4 8.2 9.7 5.8 ... 7.8 ... ... ... ... ...Income velocity of broad money 1.0 1.0 1.0 1.0 ... 1.0 ... ... ... ... ...Interest rate (weighted average TBs, primary auctions) 4.6 3.3 ... ... ... ... ... ... ... ... ...
Central government financesOverall consolidated balance (including grants) 2 -2.5 -2.1 -2.6 -4.5 -1.9 -4.5 -3.0 -2.9 -2.7 -3.0 -2.8Primary balance (including grants) 0.5 0.9 0.1 -1.9 0.7 -1.7 -0.3 -0.2 0.0 -0.2 0.0Structural primary balance (including grants) 0.4 0.9 0.2 -1.8 0.8 -1.6 -0.2 -0.2 0.0 -0.2 0.0Structural primary balance (excluding grants) -0.3 0.2 -0.4 -2.2 0.3 -2.2 -0.6 -0.5 -0.2 -0.3 0.0Revenues and grants 21.4 21.4 21.9 21.4 21.3 21.8 20.8 20.6 20.5 20.4 20.3Expenditure, excl. net lending 23.9 23.6 24.5 25.9 23.2 26.2 23.7 23.6 23.2 23.5 23.1Domestic debt of central government 42.6 41.0 39.7 41.0 37.6 39.4 37.9 37.1 37.0 37.2 37.5External debt of central government 9.5 10.4 10.3 12.8 12.4 14.0 15.1 14.7 13.7 12.8 11.5
Investment and savingGross domestic investment 26.0 24.8 25.1 23.2 25.3 23.2 23.4 23.6 23.7 24.0 24.2
Public 5.5 5.5 7.6 5.0 7.1 4.1 4.2 3.9 3.8 3.7 3.7Private 20.4 19.2 17.5 18.2 18.2 19.1 19.2 19.7 20.0 20.2 20.4
Gross national savings 12.7 17.1 15.4 14.0 16.2 13.0 13.9 15.1 16.2 16.7 17.2Public -0.5 1.0 1.3 -0.5 1.1 0.0 -0.2 -0.2 0.0 -0.3 -0.1Private 13.3 16.1 14.1 14.5 15.2 13.0 14.1 15.4 16.1 17.0 17.3
External sectorBalance of goods and services -13.8 -13.1 -12.5 -13.1 -11.8 -13.9 -11.7 -10.7 -9.8 -9.3 -8.9
Exports of goods and services, f.o.b. 51.8 52.9 54.0 52.6 54.1 52.6 53.3 54.2 55.5 56.9 58.4Imports of goods and services, f.o.b. -65.6 -65.9 -66.5 -65.7 -66.0 -66.5 -65.0 -64.9 -65.3 -66.2 -67.3
Current account balance -13.3 -7.9 -9.7 -9.9 -9.1 -8.7 -8.4 -7.2 -6.4 -5.9 -5.6Overall balance 1.6 1.8 1.2 4.5 1.3 2.9 2.9 3.3 3.4 3.9 3.4Total external debt 3 85.1 89.3 25.1 91.6 26.7 93.1 94.1 93.6 92.7 91.4 90.0Net international reserves (millions of U.S. dollars) 2,631 2,851 2,977 3,112 3,144 3,481 3,878 4,359 4,883 5,521 6,118
Months of imports of goods and services, f.o.b. 4.2 4.4 4.4 4.4 4.4 4.8 5.0 5.2 5.4 5.6 5.7
Memorandum items:GDP at current market prices (billions of Mauritian rupees) 323.0 344.0 377.9 366.4 412.5 394.2 427.5 467.9 511.6 558.8 610.9GDP at current market prices (millions of U.S. dollars) 11,251 11,447 ... 11,930 ... 12,651 13,501 14,410 15,420 16,472 17,602Public sector debt (percent of GDP) 58.6 57.9 55.8 60.0 55.0 59.1 58.2 56.7 55.1 54.0 52.7
Public sector debt (for debt ceiling purpose) 4 54.3 53.1 … 55.1 … 54.6 54.1 52.9 51.6 50.8 49.8Foreign and local currency long-term debt rating (Moody's) Baa2 Baa1 … Baa1 … … … … … … …
Sources: Mauritian authorities; and IMF staff estimates and projections.
1 Includes credit to parastatals.2 GFSM 2001 concept of net lending/net borrowing, includes special and other extrabudgetary funds.3 Numbers were revised to include debts of deposit taking institutions and SDR allocation in 2009.4 For the purposes of calculating the public debt ceiling, the 2008 Public Debt Management Act requires discounting certain types of State-owned enterprises' debt.
(Percent of GDP, unless otherwise indicated)
(Annual change in percent of beginning of period M2)
(Annual percent change, unless otherwise indicated)
2012 2013 2014 2015
(Annual percent change, in US Dollars)
Proj.

MAURITIUS
22 INTERNATIONAL MONETARY FUND
Table 2. Mauritius: Summary of Central Government Finances, 2011–151 (Percent of GDP; unless otherwise indicated)
2011 2015
Actual Actual Last SR Est. Last SR Proj. Proj.
Total revenue and grants (1) 21.4 21.4 21.9 21.4 21.3 21.8 20.8
Domestic revenue 20.7 20.8 21.3 21.0 20.8 21.2 20.4
Tax revenue 18.3 18.9 18.7 18.6 18.4 18.7 18.6
Income tax - Individuals 1.5 1.5 1.6 1.7 1.6 1.7 1.7
Income tax - Corporations 2.7 2.7 2.5 2.7 2.5 2.4 2.5
Value added tax (VAT) 7.0 7.3 7.2 7.1 7.2 7.1 7.1
Excise duties, incl. "Maurice Ile Durable" levy 3.6 3.8 3.8 3.7 3.6 3.7 3.6
Customs 0.5 0.4 0.4 0.4 0.4 0.4 0.4
Other taxes 3.0 3.1 3.2 3.0 3.2 3.4 3.4
Social contributions 0.3 0.3 0.3 0.3 0.3 0.3 0.3
Nontax revenue 2.1 1.6 2.3 2.1 2.1 2.2 1.4
Grants 0.7 0.7 0.6 0.4 0.5 0.6 0.4
Total expense (current spending) (2) 22.0 20.5 20.7 21.8 20.3 21.8 21.0
Expenditures on goods and services 8.2 8.0 8.9 9.0 9.0 9.1 9.0
Compensation of employees 5.6 5.4 6.0 6.2 6.0 6.4 6.3
Use of goods and services 2.6 2.6 2.9 2.8 2.9 2.8 2.7
Interest payments 3.0 3.0 2.7 2.6 2.6 2.8 2.7
Domestic interest 2.8 2.7 2.4 2.5 2.4 2.5 2.4
External interest 0.1 0.3 0.2 0.1 0.3 0.3 0.3
Transfers and subsidies 6.3 5.0 4.4 5.4 4.0 5.1 4.7
Subsidies 0.4 0.3 0.4 0.4 0.3 0.4 0.4
Grants and transfers 6.0 4.7 4.0 5.0 3.8 4.7 4.3
Social benefits 4.4 4.5 4.6 4.8 4.6 4.8 4.6
Contingencies 0.0 0.0 0.0 0.0 0.0 0.0 0.0
Gross operating balance ((3)=(1)-(2)) -0.5 1.0 1.3 -0.5 1.1 0.0 -0.2
Net acquisition of non-financial assets (capital spending) 2.7 2.8 3.1 3.0 2.5 3.0 2.8
Net lending / borrowing (central governm. budget balance) 2 -3.2 -1.8 -1.9 -3.5 -1.4 -3.0 -3.0
Net lending / borrowing (special funds) 3 0.7 -0.3 -0.7 -1.0 -0.5 -1.5 0.0
Inflows to special funds 2.0 0.6 0.0 0.6 0.0 0.4 0.3
Outflows from special funds -1.3 -0.9 -0.7 -1.7 -0.5 -1.8 -0.3
Net lending / borrowing (consolidated balance) -2.5 -2.1 -2.6 -4.5 -1.9 -4.5 -3.0
Transactions in financial assets/liabilities 0.9 0.3 1.6 1.3 2.3 0.4 0.8
Net acquisition of financial assets 0.9 0.4 1.8 1.4 2.5 0.4 0.8
Of which: net lending 0.7 0.0 1.7 1.4 2.5 0.4 0.7Adjustment for difference in cash and accrual -0.1 -0.1 -0.2 -0.1 -0.2 -0.1 0.0
Borrowing requirements (financing) 3.3 2.4 4.1 5.9 4.2 4.8 3.7
Domestic 1.6 1.5 1.9 3.0 1.2 2.7 1.5
Banks 0.1 -1.0 0.9 2.2 0.6 0.9 0.8
Nonbanks 1.5 2.5 0.9 0.8 0.6 1.8 0.8
Foreign 1.7 0.9 2.3 2.9 3.0 2.1 2.2
Disbursements 2.0 1.2 2.6 3.2 3.6 2.6 2.9
Amortization -0.2 -0.3 -0.3 -0.3 -0.6 -0.5 -0.7
Memorandum items:
Government debt 52.1 51.5 50.0 53.8 50.0 53.4 53.0
Public sector debt 58.6 57.9 55.8 60.0 55.0 59.1 58.2
Public sector debt (for debt ceiling purpose) 4 54.3 53.1 … 55.1 … 54.6 54.1
GDP at current market prices (in billions of rupees) 323.0 344.0 377.9 366.4 412.5 394.2 427.5
Expenditure, excluding net lending 23.9 23.6 24.5 25.9 23.2 26.2 23.8
Primary balance (incl. grants; excl. net lending) 0.5 0.9 0.1 -1.9 0.7 -1.7 -0.3
Structural primary balance (incl. grants; excl. net lending) 0.4 0.9 0.2 -1.8 0.8 -1.6 -0.2
Primary balance (excl. grants; excl. net lending) -0.2 0.2 -0.5 -2.3 0.2 -2.3 -0.7
Structural primary balance (excl. grants; excl. net lending) -0.3 0.2 -0.4 -2.2 0.3 -2.2 -0.6
Sources: Ministry of Finance and Development; Bank of Mauritius; and IMF staff estimates and projections.
3 Includes the following special and other extra-budgetary funds: Maurice Ile Durable Fund; Human Resource, Knowledge and Arts Development Fund; Food Security Fund; Local Infrastructure Fund; and Social Housing Development Fund; National Resillience Fund (named Business Growth Fund prior to 2012); Road Decongestion Program Fund; and Build Mauritius Fund.
4 For the purposes of calculating the public debt ceiling, the 2008 Public Debt Management Act requires discounting certain types of State-owned enterprises' debt.
2 Corresponds to the authorities' budget presentation.
1 GFSM 2001 presentation.
2012 2013 2014

MAURITIUS
INTERNATIONAL MONETARY FUND 23
Table 3. Mauritius: Central Government Integrated Balance Sheet, 2009−12 (Percent of GDP)
Closing/opening balance
Transactions Other economic
flows
Closing balance
Transactions Other economic
flows
Closing balance
Transactions Other economic
flows
Closing balance
Net worth 104.1 -1.0 -12.2 90.9 3.1 -9.3 84.7 0.7 -5.4 80.0
Nonfinancial assets 161.5 2.7 -10.4 153.8 2.7 -9.8 146.6 2.8 -6.8 142.6
Of which: fixed assets 42.5 2.6 -3.9 41.2 2.5 -1.4 42.3 2.4 -0.1 44.6
Of which: land 118.7 0.0 -6.5 112.2 0.0 -8.3 103.9 0 -6.2 97.7
Net financial worth -57.4 -3.7 -1.8 -62.9 0.4 0.5 -61.9 -2.1 1.4 -62.6
Financial assets 13.0 -0.8 -1.0 11.2 1.7 -0.8 12.1 0.3 -0.3 12.1
Currency and deposits 1.7 -0.6 0.0 1.0 0.2 0.0 1.2 -0.1 0.0 1.1
Equity and investment fund shares 6.7 0.0 -0.9 5.8 0.9 -0.5 6.2 0.4 -0.2 6.4
Loans (includes loans to parastatals) 2.3 0.0 -0.1 2.2 0.7 -0.2 2.6 0.0 -0.1 2.6
Other accounts receivable (arrears of revenue) 2.4 -0.2 0.0 2.2 -0.1 0.0 2.0 0.0 0.0 2.0
Liabilities 70.4 2.9 0.7 74.1 1.3 -1.3 74.1 2.4 -1.7 74.8
Domestic
Currency and deposits 1 3.1 -0.6 0.0 2.4 -2.1 0.0 0.4 0.0 0.0 0.4
Securities and loans 2 45.9 1.7 -3.1 44.4 1.6 -3.8 42.2 1.5 -2.7 41.0
Insurance, pensions, and standardized guarantee schemes 15.4 0.0 4.3 19.7 0.0 3.4 23.1 0.0 0.9 23.9
Foreign
Securities and loans 2 6.2 1.9 -0.4 7.6 1.7 -0.9 8.4 0.9 0.1 9.4
Memorandum items:
GDP at current market prices (billions of rupees) 282.4 298.8 323.0 344.0
Liabilities/assets ratio 0.4 0.4 0.5 0.5
Liabilities/financial assets ratio 5.4 6.6 6.1 6.2
Sources: Ministry of Finance and Development; and IMF staff estimates.1 Includes special funds.2 Includes interests payables on debt.
2011 20122009 2010
MAURITIUS
24 INTERNATIONAL MONETARY FUND
Table 4. Mauritius: Balance of Payments, 2011−19 2011 2015 2016 2017 2018 2019
Actual Last SR Est. Last SR Proj. Proj. Proj. Proj. Proj. Proj.
Current account balance -1,501 -900 -1,185 -1,178 -1,181 -1,103 -1,135 -1,041 -990 -972 -982Trade balance -2,354 -2,456 -2,527 -2,266 -2,629 -2,583 -2,542 -2,638 -2,755 -2,922 -3,138
Exports of goods, f.o.b. 2,563 2,651 2,840 2,870 3,023 2,915 3,043 3,187 3,397 3,609 3,834Imports of goods, f.o.b. -4,918 -5,107 -5,366 -5,136 -5,652 -5,498 -5,585 -5,825 -6,151 -6,532 -6,972
Of which: Oil Imports -1,120 -1,149 -1,187 -1,169 -1,198 -1,223 -1,241 -1,274 -1,331 -1,407 -1,494
Services (net) 797 960 1,002 700 1,091 824 963 1,098 1,239 1,395 1,567Of which: tourism 1,088 1,111 1,154 885 1,218 962 1,037 1,110 1,183 1,259 1,336
Income (net) -64 455 211 297 229 475 267 325 352 382 416Of which: GBCs -250 375 0 172 0 339 174 155 155 155 155
Current transfers (net) 132 167 129 100 128 181 177 174 173 173 173
Capital and financial accounts 1,409 1,381 1,327 1,857 1,348 1,472 1,532 1,523 1,513 1,611 1,579
Capital account -2 -8 -2 -4 -2 -4 -4 -5 -5 -5 -5
Financial account 1,411 1,389 1,329 1,861 1,350 1,476 1,536 1,528 1,518 1,616 1,584Direct investment (net) 185 409 179 124 190 108 125 155 191 186 180
Abroad -89 -180 -80 -135 -120 -202 -232 -255 -281 -309 -340In Mauritius 273 589 258 258 310 310 357 410 472 495 520
Portfolio investment (net) 69 137 -15 432 -18 11 12 12 13 14 14Other investment (net) 1,157 844 1,166 1,305 1,178 1,357 1,400 1,360 1,314 1,416 1,390
Government (net) 181 83 255 392 297 305 288 90 41 -24 -82
Private (net)1 975 761 910 913 881 1,052 1,112 1,271 1,274 1,440 1,471
Errors and omissions 275 -280 0 -139 0 0 0 0 0 0 0
Overall balance 183 201 143 540 167 369 397 482 523 639 596
Change in official reserves (- = increase) -183 -201 -143 -540 -167 -369 -397 -482 -523 -639 -596
Memorandum items:Balance of goods and services -13.8 -13.1 -12.5 -13.1 -11.8 -13.9 -11.7 -10.7 -9.8 -9.3 -8.9
Exports of goods and services, f.o.b. 51.8 52.9 54.0 52.6 54.1 52.6 53.3 54.2 55.5 56.9 58.4Imports of goods and services, f.o.b. -65.6 -65.9 -66.5 -65.7 -66.0 -66.5 -65.0 -64.9 -65.3 -66.2 -67.3
Foreign direct investment 1.6 3.6 1.5 1.0 1.5 0.9 0.9 1.1 1.2 1.1 1.0Current account balance -13.3 -7.9 -9.7 -9.9 -9.1 -8.7 -8.4 -7.2 -6.4 -5.9 -5.6
Current account balance, excluding GBCs -11.1 -11.1 -9.7 -11.3 -9.1 -11.4 -9.7 -8.3 -7.4 -6.8 -6.5Overall balance 1.6 1.8 1.2 4.5 1.3 2.9 2.9 3.3 3.4 3.9 3.4
Errors and omissions 2.4 -2.4 0.0 -1.2 0.0 0.0 0.0 0.0 0.0 0.0 0.0Net international reserves, BOM, (mill. of U.S. dollars) 2,631 2,851 2,977 3,112 3,144 3,481 3,878 4,359 4,883 5,521 6,118
In months of imports of goods and services, f.o.b. 4.2 4.4 4.4 4.4 4.4 4.8 5.0 5.2 5.4 5.6 5.7
Percent of external short term debt2 154.7 100.5 998.7 109.4 990.9 115.3 120.4 126.8 132.7 140.5 145.7Percent of broad money 23.6 24.8 23.1 26.1 23.0 27.5 28.7 30.3 31.7 33.5 34.8
Percent of IMF reserve adequacy metric3 119.3 121.1 ... 125.2 ... 130.4 134.8 140.4 145.5 152.2 …
Gross reserves, BOM, (mil. of U.S. dollars) 2,784 3,001 3,131 3,264 3,298 3,633 4,030 4,511 5,035 5,674 6,270
GDP (millions of U.S. dollars) 11,251 11,447 12,237 11,930 12,979 12,651 13,501 14,410 15,420 16,472 17,602
Total external debt4 85.1 89.3 25.1 91.6 26.7 93.1 94.1 93.6 92.7 91.4 90.0Total debt service ratio (% of goods & services exports) 3.7 3.8 3.5 3.8 4.2 4.3 4.8 4.3 4.6 4.4 3.9Mauritian rupees per U.S. dollar (period average) 28.7 30.1 ... 30.7 ... ... ... ... ... ... ...Mauritian rupees per U.S. dollar (end of period) 29.3 30.5 ... 30.3 ... ... ... ... ... ... ...
Sources: Mauritian authorities; and IMF staff estimates and projections.
4 Numbers were revised to include debts of deposit taking institutions and SDR allocation in 2009.
3 Reserves in the range of 100-150 percent of the composite metric are considered adequate for precautionary purposes. For a discussion of the measure, see IMF (2011) "Assessing Reserve Adequacy, " International Monetary Fund, Washington, DC.
2 Stock of short term debt is updated to include debt of deposit taking insitutions, thus leading to a sharp reduction in the ratio compared to previous
1 Includes flows linked to Global Business Companies (GBCs) on a net basis. GBCs flows are based on data from surveys conducted 2013, but data quality still needs to be improved.
20132012
(Millions of U.S. dollars, unless otherwise indicated)
(Percent of GDP, unless otherwise indicated)
2014
MAURITIUS
INTERNATIONAL MONETARY FUND 25
Table 5. Mauritius: Depository Corporations Survey, 2011–14
2011 2014
Last SR Est. Proj.
Net foreign assets 367,817 396,779 423,486 387,038 417,473
Net domestic assets -48,280 -51,162 -25,855 -21,430 -23,308
Domestic credit 341,302 391,022 450,815 448,175 482,975
Claims on government (net) 30,173 26,748 47,226 34,759 38,362
Monetary authorities -7,837 -11,467 -9,671 -10,933 -10,920
Commercial banks 38,011 38,215 56,897 45,692 49,283
Claims on local government and SOEs 7,076 8,203 8,735 7,929 8,288
Claims on private sector 304,053 356,070 394,854 405,486 436,324
Other financial liabilities 1 -279,049 -306,878 -336,549 -330,725 -356,556
Other items (net) -110,533 -135,306 -140,120 -138,880 -149,727
Broad money (M2) 319,537 345,617 397,632 365,609 394,165
Money (M1) 89,862 96,935 121,605 104,025 119,234
Quasi-money 229,675 248,682 276,026 261,584 274,931
Reserve money 48,281 52,623 56,458 62,350 67,075
Net foreign assets -24,710 28,963 25,128 -9,741 30,435
Domestic credit 32,447 49,720 42,835 57,153 34,800
Claims on government 331 -3,425 3,520 8,011 3,603
Claims on local government and SOEs -2,061 1,128 531 -274 359
Claims on private sector 34,178 52,018 38,784 49,416 30,838
Broad money (M2) 19,305 26,081 35,057 19,992 28,556
Money (M1) 3,932 7,073 15,513 7,090 15,210
Quasi money 15,373 19,007 19,544 12,902 13,347
Reserve money 3,345 4,342 4,056 9,727 4,725
Net foreign assets -6.3 7.9 6.3 -2.5 7.9
Domestic credit 10.5 14.6 10.5 14.6 7.8
Claims on government 1.1 -11.4 8.1 29.9 10.4
Claims on local government and SOEs -22.6 15.9 6.5 -3.3 4.5
Claims on private sector 12.7 17.1 10.9 13.9 7.6
Broad money (M2) 6.4 8.2 9.7 5.8 7.8
Money (M1) 4.6 7.9 14.6 7.3 14.6
Quasi-money 7.2 8.3 7.6 5.2 5.1
Reserve money 7.4 9.0 7.7 18.5 7.6
Net foreign assets -8.2 9.1 6.9 -2.8 8.3
Domestic credit 10.8 15.6 11.8 16.5 9.5
Claims on government (net) 0.1 -1.1 1.0 2.3 1.0
Claims on local government and SOEs -0.7 0.4 0.1 -0.1 0.1
Claims on private sector 11.4 16.3 10.7 14.3 8.4
Memorandum Items:
Bank excess reserves (in millions of rupees) 3,491 3,693 2,671 5,512 9,424
Government deposits (in millions of rupees) 16,990 16,650 14,973 17,730 n.a.
Domestic credit (in percent of GDP) 105.7 113.7 119.3 122.3 122.5
Claims on private sector (in percent of GDP) 94.1 103.5 104.5 110.7 110.7
Money multiplier 6.6 6.6 7.0 5.9 5.9
Velocity 1.0 1.0 1.0 1.0 1.0
Sources: Bank of Mauritius; and IMF staff estimates. SOEs is the acronym for State-Owned Enterprises.1 The major component of other financial liabilities consists of restricted deposits, which largely include deposits of the offshore nonfinancial corporations (so-called Global Business Companies, GBCs). GBCs are resident corporations licensed to conduct business exclusively with nonresidents and only in foreign currencies.
2012 2013
(Millions of rupees, end of period)
(Annual change, millions of rupees)
(Annual percent change)
(Percentage change of beginning of year of broad money)

MAURITIUS
26 INTERNATIONAL MONETARY FUND
Table 6. Mauritius: Financial Soundness Indicators for the Banking Sector, December 2009–June 20131
(End of period, in percent, unless otherwise indicated) 2009 2010 2011 2011 2012 2012 2013
Jun. Jun. Jun
Capital adequacyRegulatory capital to risk-weighted assets 2 15.4 15.8 16.3 15.6 16.3 16.7 16.0Regulatory Tier I capital to risk-weighted assets 13.3 13.6 14.1 13.9 14.9 15.1 14.6Total (regulatory) capital to total assets 7.7 7.3 7.3 7.2 7.9 8.1 8.3
Asset composition and qualityShare of loans (exposures) per risk-weight (RW) category
RW = 0% 20.6 21.6 17.2 16.0 18.3 18.1 16.3RW = 20% 24.9 19.5 21.7 22.2 18.5 12.1 14.9RW = 35% 3.2 3.0 3.2 3.7 4 4.0 3.6RW = 50% 8.4 8.8 10.7 12.3 11.4 10.4 13.8RW = 75% 3.7 3.6 3.7 3.8 3.9 4.1 3.9RW = 100% 38.3 42.5 42.3 40.6 41.9 49.6 46.0RW = 150% 0.9 1.0 1.2 1.4 1.9 1.7 1.6
Total exposures/total assets 40.0 46.7 49.1 52.6 58.6 55.4 54.4
Sectoral distribution of loans to total loans Agriculture 6.3 6.3 5.8 6.5 6.2 6.4 6.0
of which: sugar 5.2 5.5 4.9 5.7 5.5 5.7 5.3Manufacturing 8.7 7.8 7.6 7.3 6.6 6.7 6.5
of which: EPZ 3.2 2.6 2.4 2.2 2 2.0 1.9Traders 10.1 10.5 10.6 11.5 10.9 11.1 9.7Personal and professional 9.0 8.8 8.9 8.8 9 8.9 10.1Construction 19.7 20.2 20.9 22.0 24.1 24.1 25.3
of which: housing 11.6 14.3 14.5 15.4 16.4 16.3 17.1Tourism/hotels 16.2 17.6 17.7 17.3 16.3 16.0 16.2Other 30.0 28.8 28.5 26.6 26.9 26.8 26.2
Foreign currency loans to total loans 59.1 61.5 61.6 61.6 63.7 63.4 64.1
NPLs to gross loans - excluding accrued/unpaid interest 3.3 2.8 2.6 2.8 3.7 3.5 3.9NPLs net of provisions to capital 13.4 9.1 9.6 10.9 15.6 12.1 12.8
Large exposure to capital 3 216.9 222.5 228.2 247.0 215.9 200.3 185.9
Earnings and ProfitabilityROA (Pre-tax net income/average assets) 1.6 1.4 1.6 1.3 1.5 1.3 1.1ROE (Pre-tax net income/average equity) 21.0 20.0 21.5 17.9 19.6 17.8 14.8Interest margin to gross income 68.9 67.1 65.4 65.4 62.9 65.5 71.8Noninterest expenses to gross income 39.2 38.9 36.7 41.2 39.1 38.4 43.1Expenses/revenues … … … … …Earnings/employee - in 000 of rupees … … … … …
Liquidity
Liquid assets to total assets 4 27.9 23.4 21.2 17.7 14.8 19.2 19.6
Liquid assets to total short-term liabilities 4 34.4 31.9 29.9 26.0 22.6 27.8 28.5Funding volatility ratio … … … … …Demand deposits/total liabilities 23.9 25.6 25.3 24.8 22.4FX deposits to total deposits 64.1 64.0 65.1 60.6 59.6
Sensitivity to market risk
Net open positions in FX to capital 4 5.3 7.0 2.0 2.2 3.8 2.3 2.3
Source: Mauritian authorities.1 Banking sector refers to former Category 1 banks up to December 2004 and to all banks thereafter.
2 Total of Tier I and Tier 2 less investments in subsidiaries and associates.
3 Prior to June 2006, data refer to Category 1 banks only.
4 Ratio has been revised according to manual as from 2008.

Table 7. Mauritius: Risk Assessment Matrix1
Source of Risks
Relative Likelihood
(Low, Medium, or
High)
Impact (Low,
Medium, or High)
Policy response
Side-effects from global financial conditions:
Surges in global financial market volatility (related to UMP exit), leading to economic and fiscal stress, and constraints on country policy settings.
Distortions from protracted period of low interest rates: excess leverage, especially for corporates; delays in fiscal and structural reforms.
High
Medium
Medium
Medium
Exchange rate flexibility. Macroprudential measures. FX interventions to reduce exchange rate volatility and excessive misalignments.
Protracted period of slower growth in advanced and emerging economies:
Advanced economies: larger than expected deleveraging or negative surprises on potential growth.
Emerging markets: earlier maturing of the cycle and incomplete structural reforms leading to prolonged slower growth.
High
(Europe) Medium
(elsewhere)
Medium
Low
Exchange rate flexibility. Structural reforms to boost competitiveness, export diversification.
Financial stress in the Euro area re-emerges triggered by stalled or incomplete delivery of national and euro area policy commitments.
Medium Low Exchange rate flexibility. Macroprudential measures. FX interventions to reduce excessive misalignments.
1 The Risk Assessment Matrix (RAM) shows events that could materially alter the baseline path (the scenario most likely to materialize in the view of IMF staff). The relative likelihood of risks listed is the staff’s subjective assessment of the risks surrounding the baseline (“low” is meant to indicate a probability below 10 percent, “medium” a probability between 10 and 30 percent, and “high” a probability of 30 percent or more). The RAM reflects staff views on the source of risks and overall level of concern as of the time of discussions with the authorities. Non-mutually exclusive risks may interact and materialize jointly.
MAU
RITIUS
IN
TERNATIO
NAL
MO
NETARY
FUN
D27

Table 7. Mauritius: Risk Assessment Matrix (concluded)
Source of Risks
Relative Likelihood
(Low, Medium, or
High)
Impact (Low,
Medium, or High)
Policy response
Bond market stress from a reassessment in sovereign risk
Japan: Abenomics falters, depressed domestic demand and deflation (short-term), leading to bond market stress (medium-term).
United States: protracted failure to agree on a credible plan to ensure fiscal sustainability (medium-term).
Medium
Low
Low
Low
Let automatic stabilizers work, limited targeted spending initiatives. Monetary and exchange rate policies should support the fiscal policy response.
Double Taxation Agreement with India
Termination (short-term).
Revision (short-term).
Low
High
High
Medium
Exchange rate flexibility. Active labor market policies to absorb unemployed. Diversification of financial services. Exchange rate flexibility. Diversification of financial services. Active labor market policies to absorb unemployed.
Insufficient fiscal adjustment efforts over the medium-term in Mauritius due to political constraints.
Medium
Medium Exchange rate flexibility. Proper phasing of the adjustment effort. Public policy dialogue to increase public acceptability of reforms.
MAU
RITIUS
28 INTERN
ATION
AL MO
NETARY FU
ND

MAURITIUS
INTERNATIONAL MONETARY FUND 29
APPENDIX I. DEBT SUSTAINABILITY ANALYSIS 1
The debt sustainability analysis (DSA) shows that Mauritius’ exposure to risks from its debt profile
should be manageable. Under the baseline scenario, public debt indicators remain below their relevant
indicative thresholds over the medium term. The public debt dynamics is most vulnerable to contingent
liability, real GDP growth, and real interest rate shocks. External debt stays low and is financed by
multi- and bilateral sources at long maturities and favorable interest rates. The main risk to the debt
outlook would be insufficient medium-term fiscal adjustment to reduce the size of the debt, which at
almost 60 percent of GDP is somewhat high for an emerging market economy.
Background
The last debt sustainability analysis (DSA) for Mauritius was prepared in January 2013 and
concluded that the debt outlook was broadly positive. This exercise updates the analysis using
the new template for the DSA for market-access countries (MAC-DSA),2 which was released in 2013.
Public debt increased in 2013 for the first time since 2009, raising further the fiscal adjustment
needed to reach healthier debt levels. The ratio of public debt-to-GDP reached 59.9 percent in
2013 and is projected at 59 percent for end-2014. While moderate economic growth and one-off
spending pressures unexpectedly raised the primary deficit in 2013, the 2014 fiscal stance will likely
maintain an elevated deficit, which is planned to be reduced in 2015. With only five years left to
reach the end-2018 debt law target of 50 percent of GDP, further consolidation will have to be
implemented over these years. The authorities are cognizant of this tradeoff, although they are
somewhat more constrained in 2014, a pre-election year.
Despite somewhat elevated borrowing needs, Mauritius has not experienced financing
difficulties and funding public sector debt has remained accessible though somewhat
expensive. The 10-year bond yield spread over U.S. Treasury bonds was around 420 basis points at
the January 2014 auction, which was below the 600 basis points threshold for vulnerability.
Additional factors that contain vulnerabilities are (i) no history of debt difficulties; (ii) external debt
represents only around 20 percent of public sector debt and has very advantageous terms;3 and
(iii) less than one percent of domestic debt is held by non-residents. Moreover, the country’s
1 Prepared by Albert Touna Mama (AFR).
2 See www.imf.org/external/pubs/ft/dsa/mac.htm. 3 About two thirds of external debt is composed of multilateral loans (World Bank and the African Development Bank make up the majority of multilateral debt outstanding) and the remaining third are bilateral loans (France, India, and China are the main lenders).
MAURITIUS
30 INTERNATIONAL MONETARY FUND
domestic debt portfolio has tilted towards long- and medium-term maturities, which reduces
rollover risks and possibly borrowing costs.
The authorities continue to refine their debt management strategy. An MCM mission recently
visited Mauritius to help with revising the Medium-Term Debt Strategy (MTDS).4 Beyond
strengthening debt management and extending the maturity of domestic debt, further work remains
to develop the primary and the secondary market markets for government securities. The authorities
have set to lengthen the maturity structure and increase the attractiveness of domestic debt by
introducing benchmark securities. More could be done, including by increasing the number of
auctions held every year, by eliminating the issuance of non-benchmark securities or by considering
new debt instruments.5
Public DSA risk assessment
The most vulnerable areas are with respect to the debt profile, although none of the upper early
warning thresholds are reached (Figure 1). In fact, Mauritius is below the lower threshold for the
annual change in short-term debt and right at the lower threshold for public debt held for non-
residents. The evolution of predictive densities of gross nominal public debt remains within relative
narrow paths.
Realism of baseline scenario
The baseline macroeconomic assumptions for the present DSA are consistent with the
macroeconomic framework underlying the 2014 Article IV report (see main text). The realism of
this scenario for DSA purposes is assessed in Figure 2. Generally, the forecast errors for Mauritius for
real GDP growth, the primary balance, and inflation (deflator) have been low or at least below the
median, which provides confidence in the forecasts.
Growth. Economic activity is projected to accelerate gradually over the medium term,
reaching 4 percent in 2018, which is in line with the historical record.
Deflator. Inflation and the deflator should converge to the traditional inflation target of
5 percent, from 4½ percent in 2014.
4 The debt strategy is being developed by the MoFED in cooperation with the BOM. It covers both domestic and external financing with the view of achieving low overall financing costs and minimizing financing risks, while at the same time developing the domestic debt markets. 5 Government securities are comprised of Treasury Bills, Treasury Notes and Treasury Bonds. T-bills are sold with maturities of 91, 182, 273 and 364 days. T-notes have maturities of 3 and 5 years, while T-bonds come at 10 years and 15 years. T-bills are all sold at a discount. T-notes and bonds are coupon securities. There is one annual auction for a 15-year inflation indexed bond.
MAURITIUS
INTERNATIONAL MONETARY FUND 31
Fiscal adjustment. Fiscal consolidation is expected to resume in 2015, with a reduction in
the primary deficit from 3 percent of GDP in 2013 to around ½ percent over 2015–19.6
Adjustment is projected to focus on current expenditure rationalization, including through
better targeting of social assistance and reduction in subsidies, and from improving efficiency
in SOEs and local governments. Against cross-country historical experience, the consolidation
of the cyclically-adjusted primary balance over the last three years of some 1½ percentage
points of GDP falls into the 4th lowest decile, which seems reasonable.
Boom-bust analysis. Mauritius has had a cumulative increase of 17 percent of GDP in
private sector credit over 2010–13, which in some countries has been an indicator of an
elevated risk of a future downturn. However, risk appear low in Mauritius: there is a negative
output gap and growth is projected to increase only slightly over the projection period in line
with estimated growth potential; and stress tests on the banking system (Appendix III)
suggest that the Mauritian banking system appears to be resilient against most shocks.
Moreover, lending has been well collateralized and banking supervision is relatively sound so
that growth shocks emanating from a collapse in lending or property values should be small
and manageable.
Current account deficit. The current account deficit is expected to gradually narrow from an
estimate of 9 percent of GDP in 2013 to about 6 percent by 2018. The trade balance should
improve over the projection period as the services surplus recovers from the 2008 crisis.
Baseline Scenario
The projection is based on the borrowing requirements identified in the budget. In line with the
authorities’ financing assumptions, external financing is mostly based on previously committed
disbursements. Domestic financing has the objective of tilting the issuance towards longer-term
instruments. The amount of domestic financing is in effect the residual of total financing need minus
available external financing, which is assumed to be mostly on favorable terms.
Under the baseline scenario, Mauritius’ debt outlook has deteriorated slightly but remains
broadly positive (Figures 1 and 2). The debt-to-GDP ratio is projected to decline from 59.9 percent
in 2013 to about 53 percent by 2019. A high primary balance in 2014 and somewhat elevated real
interest rates are the principal debt-creating flows in the forecasting period, but the overall debt
trajectory is sustainable. The need for short-term domestic financing stays broadly stable implying
some rollover risk but government’s access to funding has not been a problem historically.
6 The primary balance concept used in the DSA is the primary balance (including grants and excluding net lending) shown in the fiscal table plus transactions in financial assets/liabilities (mainly net lending to SOEs).

MAURITIUS
32 INTERNATIONAL MONETARY FUND
Debt levels (Figures 3 and 4). Mauritius’ increase in gross debt by 2 percentage points of
GDP relative in 2013 is mainly explained by the deterioration in the primary balance and by
slower growth. Despite a projected improvement of growth in 2014, the primary deficit
remains broadly at the elevated level of 2013. Over the projection period, the fiscal
consolidation planned for 2015 underpins the decreasing debt-to-GDP ratio.
Maturity and rollover (Figures 1 and 4). The need for short-term domestic financing stays
broadly stable implying some rollover risk, but government’s access to funding has not been
a problem historically. In fact, the banking system currently has excess liquidity and
government securities auctions have been oversubscribed.
The 2018 debt target mandated by the Public Debt Management Act of 2008 might be missed
given current projections. The target is a 50 percent debt-to-GDP ratio, although some debt to
state-owned enterprise (SOEs) is allowed to be discounted for the purposes of the debt law ceiling if
the SOEs are run mainly on commercial principles. Staff currently projects public debt for debt ceiling
purposes of 51 percent of GDP in 2018. To safely reach the mandated target, the primary deficit each
year would need to be about ¼ percent of GDP lower than currently projected, which should be
feasible.
Alternative scenarios highlight the need to increase the primary balance to avoid adverse debt
dynamics (Figure 4). Assuming a constant primary balance from 2014 onward would lead to public
gross financing needs at around 12 percent of GDP by 2019, and a gross nominal debt of 59 percent
of GDP. Hence, an insufficient medium-term fiscal adjustment is an important risk to the debt
outlook. Under the historical scenario, the debt outlook is more favorable than the baseline.7 This
reflects better real GDP growth and primary balances in the historical period than under the baseline,
although the effective interest rate would be slightly higher.
Stress tests
Most stress test would leave end-of-projection results at lower or close-to-initial values (Figure 5).
The most severe stress tests relate to the contingent liability shock, and the real GDP and real
interest rate shocks.
Contingent liability shock. This shock is significant reflecting Mauritius’ role as a financial
center. In a scenario, that simulates the risk of a banking crisis due to implicit or explicit
guaranties to banks, public debt would jump from about 60 percent of GDP in 2014 to some
7 Real GDP growth, the primary balance, and real interest rates are set at their historical average; while other variables are the same as in the baseline.

MAURITIUS
INTERNATIONAL MONETARY FUND 33
90 percent in 2015, but decline gradually thereafter. However, the banking system is well
capitalized and resilient to most shocks (Appendix III), so the risk of this shock materializing
should be small.
Growth shock. A lower real output growth by 1 standard deviation for 2 years starting in
2015 would have significant impact on the level of debt, which would reach 59.5 percent of
GDP in 2016 compared to 56.8 percent under the baseline.
Real interest rate shock. An increase in the sovereign risk premia by somewhat more than
200 basis points (bps) starting in 2015 would raise the effective interest rate paid on public
debt by about 80 basis points in 2016 and by about 230 basis points in 2019, reflecting a
maturity structure that is tilted toward the medium term.
Primary balance shock. A scenario involving a deterioration of the primary balance of about
1 percent of GDP over the next two years leaves the gross debt-to-GDP ratio broadly stable;
with a higher impact on the debt-to-revenue ratio. All ratios gradually return towards their
baseline values.
Real exchange rate shock. A real exchange rate depreciation starting 2015 and
corresponding to the estimated overvaluation in 2014 of 7 percent, would have little effect
on debt or gross financing needs.
Combined shock. In a scenario with all the above shocks combined into a single scenario,
the debt-to-GDP ratio would rise to about 63 percent in 2015 and would only decline
marginally by 2019 to about 62 percent. Similarly, debt-to-revenue ratios and gross financing
needs would remain at elevated levels over the projection period. Most of the deviation from
the baseline would be driven by the growth and real interest rate shock.
External Debt Sustainability8
External debt dynamics remain sustainable under the baseline scenario (Figure 6 and Table 1).
External debt is estimated at 25 percent of GDP at end-2013. Gross bank external liabilities are not
included in the external debt figures as they are matched by external assets almost twice as large. As
standard practice in many international financial centers, it would be misleading to include bank
external liabilities in the country’s external debt measure for DSA purposes. External debt is projected
to increase slightly initially and then decline to 24 percent of GDP by 2018, as authorities continue to
take advantage of concessional long-term financing from multilateral and bilateral sources.
8 The first year of the projection period is 2013 as final external data are only available for 2012.

MAURITIUS
34 INTERNATIONAL MONETARY FUND
The external debt outlook is vulnerable to shocks on non-interest current account and large
exchange rate depreciations. Sensitivity analysis suggests that Mauritius’ external debt remains
resilient to interest rate and growth shocks, but a 30 percent real depreciation would push the
external debt-to-GDP ratio to 35 percent in 2018. A current account deficit that is 3 percentage
points larger than projected in the baseline would also cause the debt-to-GDP ratio to increase to
close to 34 percent by 2018. Hence, moderating the non-interest part of the external current account
balance would be important to maintain external debt sustainability.
Conclusion
The public debt outlook remains broadly positive, although it has weakened somewhat
compared to the last DSA. Further improvements to this outlook could derive from the planned
medium-term fiscal consolidation and further structural reforms to improve growth prospects and
competitiveness.
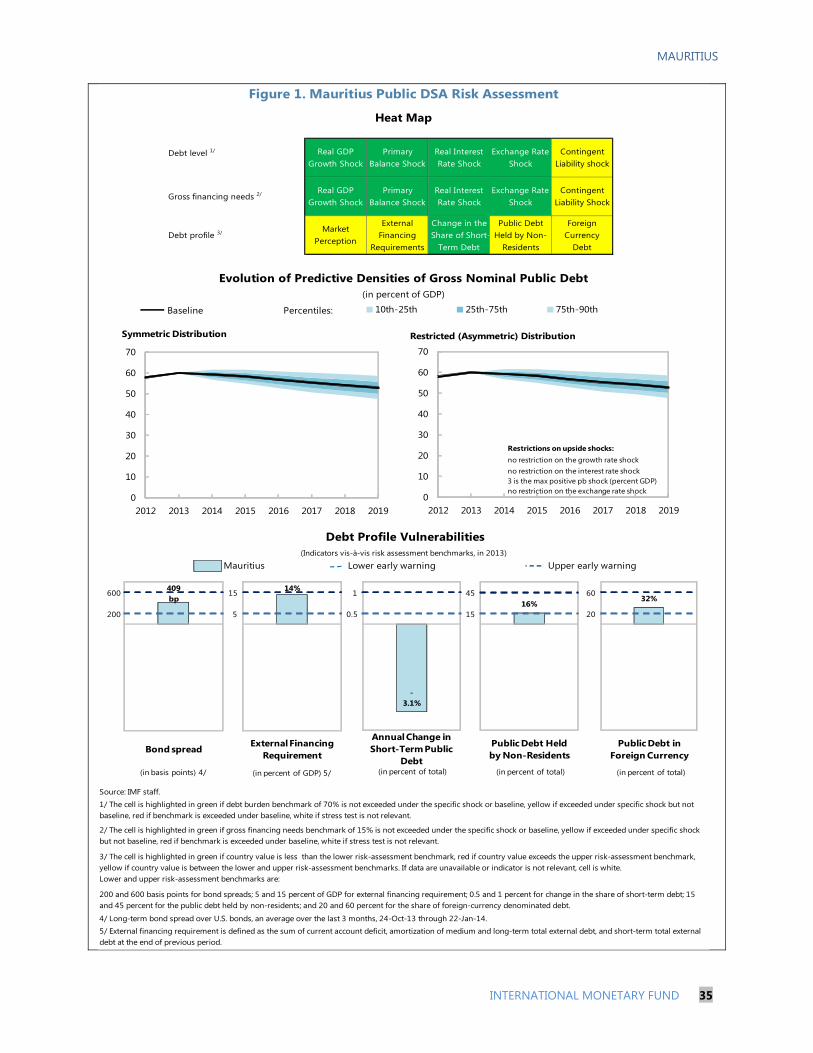
MAURITIUS
INTERNATIONAL MONETARY FUND 35
Mauritius
Source: IMF staff.
Figure 1. Mauritius Public DSA Risk Assessment
1/ The cell is highlighted in green if debt burden benchmark of 70% is not exceeded under the specific shock or baseline, yellow if exceeded under specific shock but not baseline, red if benchmark is exceeded under baseline, white if stress test is not relevant.
Real Interest Rate Shock
External Financing
Requirements
Real GDP Growth Shock
Heat Map
Upper early warning
Evolution of Predictive Densities of Gross Nominal Public Debt(in percent of GDP)
Debt profile 3/
Lower early warning(Indicators vis-à-vis risk assessment benchmarks, in 2013)
Debt Profile Vulnerabilities
Gross financing needs 2/
Debt level 1/ Real GDP Growth Shock
Primary Balance Shock
3/ The cell is highlighted in green if country value is less than the lower risk-assessment benchmark, red if country value exceeds the upper risk-assessment benchmark, yellow if country value is between the lower and upper risk-assessment benchmarks. If data are unavailable or indicator is not relevant, cell is white. Lower and upper risk-assessment benchmarks are:
Change in the Share of Short-
Term Debt
Foreign Currency
Debt
Public Debt Held by Non-
Residents
Primary Balance Shock
Real Interest Rate Shock
Exchange Rate Shock
Contingent Liability Shock
Exchange Rate Shock
Contingent Liability shock
5/ External financing requirement is defined as the sum of current account deficit, amortization of medium and long-term total external debt, and short-term total external debt at the end of previous period.
4/ Long-term bond spread over U.S. bonds, an average over the last 3 months, 24-Oct-13 through 22-Jan-14.
2/ The cell is highlighted in green if gross financing needs benchmark of 15% is not exceeded under the specific shock or baseline, yellow if exceeded under specific shock but not baseline, red if benchmark is exceeded under baseline, white if stress test is not relevant.
200 and 600 basis points for bond spreads; 5 and 15 percent of GDP for external financing requirement; 0.5 and 1 percent for change in the share of short-term debt; 15 and 45 percent for the public debt held by non-residents; and 20 and 60 percent for the share of foreign-currency denominated debt.
Market Perception
20
6032%
1 2
200
600 409 bp
1 2
5
15 14%
1 2
0.5
1
-3.1%
1 2
Bond spread External Financing Requirement
Annual Change in Short-Term Public
Debt
Public Debt in Foreign Currency
(in basis points) 4/ (in percent of GDP) 5/ (in percent of total) (in percent of total)
0
10
20
30
40
50
60
70
2012 2013 2014 2015 2016 2017 2018 2019
10th-25th 25th-75th 75th-90thPercentiles:Baseline
Symmetric Distribution
0
10
20
30
40
50
60
70
2012 2013 2014 2015 2016 2017 2018 2019
Restricted (Asymmetric) Distribution
no restriction on the growth rate shockno restriction on the interest rate shock3 is the max positive pb shock (percent GDP)no restriction on the exchange rate shock
Restrictions on upside shocks:
15
4516%
1 2
Public Debt Held by Non-Residents
(in percent of total)

Source : IMF Staff.1/ Plotted distribution includes surveillance countries, percentile rank refers to all countries.2/ Projections made in the spring WEO vintage of the preceding year.
4/ Data cover annual obervations from 1990 to 2011 for advanced and emerging economies with debt greater than 60 percent of GDP. Percent of sample on vertical axis.
Figure 2. Mauritius Public DSA - Realism of Baseline Assumptions
Forecast Track Record, versus surveillance countries
Boom-Bust Analysis 3/Assessing the Realism of Projected Fiscal Adjustment
3/ Mauritius has had a cumulative increase in private sector credit of 17 percent of GDP, 2010-2013. For Mauritius, t corresponds to 2014; for the distribution, t corresponds to the first year of the crisis.
-10
-8
-6
-4
-2
0
2
4
6
2005 2006 2007 2008 2009 2010 2011 2012 2013Year 2/
Real GDP Growth
Interquartile range (25-75)MedianMauritius forecast error
-0.5936%Has a percentile rank of:
Mauritius median forecast error, 2005-2013:
Distribution of forecast errors: 1/
(in percent, actual-projection)
-10
-8
-6
-4
-2
0
2
4
2005 2006 2007 2008 2009 2010 2011 2012 2013Year 2/
Primary Balance
Interquartile range (25-75)MedianMauritius forecast error
0.6378%Has a percentile rank of:
Mauritius median forecast error, 2005-2013:
Distribution of forecast errors: 1/
(in percent of GDP, actual-projection)
-10-8-6-4-202468
1012
2005 2006 2007 2008 2009 2010 2011 2012 2013Year 2/
Inflation (Deflator)
Interquartile range (25-75)MedianMauritius forecast error
-0.0522%Has a percentile rank of:
Mauritius median forecast error, 2005-2013:
Distribution of forecast errors: 1/
(in percent, actual-projection)
pess
imis
ticop
timis
tic
-6
-4
-2
0
2
4
6
8
t-5 t-4 t-3 t-2 t-1 t t+1 t+2 t+3 t+4 t+5
Real GDP growth
Mauritius
Boom-bust inter-quartile range around crisis events (t)
(in percent)
0
2
4
6
8
10
12
14
Less -4 -3 -2 -1 0 1 2 3 4 5 6 7 8
Distribution 4/Mauritius
3-Year Adjustment in Cyclically-Adjusted Primary Balance (CAPB)(Percent of GDP)
Mor
e
3-year CAPB adjustment greater than 3 percent of
GDP in approx. top quartilehas a percentile rank of 33%
0
2
4
6
8
10
12Le
ss -4 -3 -2 -1 0 1 2 3 4 5 6 7 8
Distribution 4/Mauritius
3-Year Average Level of Cyclically-Adjusted Primary Balance (CAPB)(Percent of GDP)
Mor
e
3-year average CAPB level greater than 3.5 percent of GDP in approx. top quartilehas a percentile
rank of 70%
MAU
RITIUS
36 INTERN
ATION
AL MO
NETARY FU
ND

MAURITIUS
INTERNATIONAL MONETARY FUND 37
As of January 22, 20142/ 2012 2013 2014 2015 2016 2017 2018 2019 Sovereign Spreads
Nominal gross public debt 61.6 57.9 59.9 59.1 58.2 56.8 55.2 54.1 52.7 EMBIG (bp) 3/ 420Public gross financing needs 25.6 12.1 13.9 11.8 10.7 10.0 9.4 10.1 9.7 5Y CDS (bp) n.a.
Real GDP growth (in percent) 4.3 3.3 3.1 3.7 4.0 4.2 4.1 4.0 4.0 Ratings Foreign LocalInflation (GDP deflator, in percent) 4.8 3.1 3.3 3.7 4.2 5.1 5.1 5.1 5.1 Moody's Baa1 Baa1Nominal GDP growth (in percent) 9.4 6.5 6.5 7.6 8.5 9.4 9.3 9.2 9.3 S&Ps n.a. n.a.Effective interest rate (in percent) 4/ 6.5 5.4 4.8 5.2 5.6 6.0 6.3 6.8 6.9 Fitch n.a. n.a.
2012 2013 2014 2015 2016 2017 2018 2019 cumulativeChange in gross public sector debt -1.3 -0.7 2.0 -0.7 -0.9 -1.5 -1.6 -1.1 -1.3 -7.1
Identified debt-creating flows -1.6 -0.6 2.2 -1.0 -1.2 -1.8 -1.9 -1.4 -1.7 -9.0Primary deficit (incl. changes in financial assets) 0.1 -0.6 3.2 2.1 1.0 0.7 0.5 0.7 0.5 5.5
Primary (noninterest) revenue and grants 20.5 21.4 21.4 21.8 20.8 20.6 20.5 20.4 20.3 124.5Primary (noninterest) expenditure 20.6 20.8 24.6 23.8 21.9 21.3 21.0 21.1 20.8 129.9
Automatic debt dynamics 5/ -1.6 0.0 -1.0 -1.3 -1.6 -1.8 -1.6 -1.2 -1.2 -8.7Interest rate/growth differential 6/ -1.7 -0.6 -0.9 -1.3 -1.6 -1.8 -1.6 -1.2 -1.2 -8.7
Of which: real interest rate 0.8 1.2 0.8 0.7 0.6 0.4 0.5 0.8 0.8 3.9Of which: real GDP growth -2.5 -1.8 -1.7 -2.1 -2.2 -2.2 -2.1 -2.0 -2.0 -12.6
Exchange rate depreciation 7/ 0.1 0.6 -0.1 … … … … … … …Drawdown of government deposits 8/ 0.0 0.0 0.0 -1.7 -0.7 -0.7 -0.8 -0.9 -0.9 -5.7
Residual, including asset changes 9/ 0.2 -0.1 -0.2 0.3 0.3 0.4 0.3 0.3 0.3 1.8
Source: IMF staff.1/ Public sector is defined as non-financial public sector.2/ Based on available data.3/ Long-term bond spread over U.S. bonds.4/ Defined as interest payments divided by debt stock (excluding guarantees) at the end of previous year.5/ Derived as [(r - π(1+g) - g + ae(1+r)]/(1+g+π+gπ)) times previous period debt ratio, with r = interest rate; π = growth rate of GDP deflator; g = real GDP growth rate;
a = share of foreign-currency denominated debt; and e = nominal exchange rate depreciation (measured by increase in local currency value of U.S. dollar).
6/ The real interest rate contribution is derived from the numerator in footnote 5 as r - π (1+g) and the real growth contribution as -g.7/ The exchange rate contribution is derived from the numerator in footnote 5 as ae(1+r). 8/ Mauritius has accumulated substantial amount of deposits. 9/ Includes asset changes and interest revenues (if any). For projections, includes exchange rate changes during the projection period.10/ Assumes that key variables (real GDP growth, real interest rate, and other identified debt-creating flows) remain at the level of the last projection year.
Figure 3. Mauritius Public DSA - Baseline Scenario
-2.1balance 10/
primary
(in percent of GDP unless otherwise indicated)
Debt, Economic and Market Indicators 1/
2003-2011Actual
Projections
Contribution to Changes in Public DebtProjections
2003-2011Actual
debt-stabilizing
-15
-10
-5
0
5
10
15
2003 2004 2005 2006 2007 2008 2009 2010 2011 2012 2013 2014 2015 2016 2017 2018 2019
Debt-Creating Flows
Primary deficit Real GDP growth Real interest rate Exchange rate depreciation Other debt-creating flows ResidualChange in gross public sector debt
projection
(in percent of GDP)
-20
-15
-10
-5
0
5
10
15
cumulative

MAURITIUS
38 INTERNATIONAL MONETARY FUND
Baseline Scenario 2014 2015 2016 2017 2018 2019 Historical Scenario 2014 2015 2016 2017 2018 2019Real GDP growth 3.7 4.0 4.2 4.1 4.0 4.0 Real GDP growth 3.7 3.9 3.9 3.9 3.9 3.9Inflation 3.7 4.2 5.1 5.1 5.1 5.1 Inflation 3.7 4.2 5.1 5.1 5.1 5.1Primary Balance -2.1 -1.0 -0.7 -0.5 -0.7 -0.5 Primary Balance -2.1 -0.2 -0.2 -0.2 -0.2 -0.2Effective interest rate 5.2 5.6 6.0 6.3 6.8 6.9 Effective interest rate 5.2 5.6 6.1 6.5 7.1 7.2
Constant Primary Balance ScenarioReal GDP growth 3.7 4.0 4.2 4.1 4.0 4.0Inflation 3.7 4.2 5.1 5.1 5.1 5.1Primary Balance -2.1 -2.1 -2.1 -2.1 -2.1 -2.1Effective interest rate 5.2 5.6 5.9 6.2 6.6 6.5
Source: IMF staff.
Underlying Assumptions(in percent)
Figure 4. Mauritius Public DSA - Composition of Public Debt and Alternative Scenarios
Alternative Scenarios
Composition of Public Debt
Baseline Historical Constant Primary Balance
46
48
50
52
54
56
58
60
62
2012 2013 2014 2015 2016 2017 2018 2019
Gross Nominal Public Debt(in percent of GDP)
projection0
2
4
6
8
10
12
14
16
2012 2013 2014 2015 2016 2017 2018 2019
Public Gross Financing Needs(in percent of GDP)
projection
0
10
20
30
40
50
60
70
80
2003 2005 2007 2009 2011 2013 2015 2017 2019
By Maturity
Medium and long-termShort-term
projection
(in percent of GDP)
0
10
20
30
40
50
60
70
80
2003 2005 2007 2009 2011 2013 2015 2017 2019
By Currency
Local currency-denominatedForeign currency-denominated
projection
(in percent of GDP)
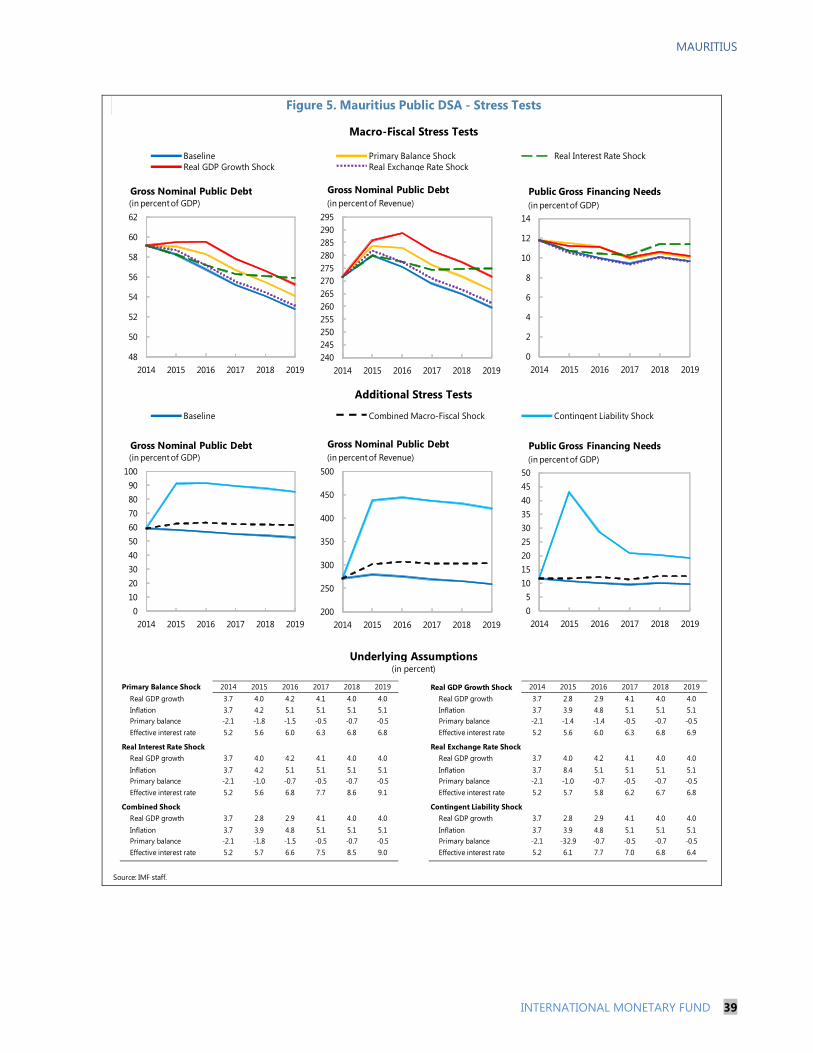
MAURITIUS
INTERNATIONAL MONETARY FUND 39
Primary Balance Shock 2014 2015 2016 2017 2018 2019 Real GDP Growth Shock 2014 2015 2016 2017 2018 2019Real GDP growth 3.7 4.0 4.2 4.1 4.0 4.0 Real GDP growth 3.7 2.8 2.9 4.1 4.0 4.0Inflation 3.7 4.2 5.1 5.1 5.1 5.1 Inflation 3.7 3.9 4.8 5.1 5.1 5.1Primary balance -2.1 -1.8 -1.5 -0.5 -0.7 -0.5 Primary balance -2.1 -1.4 -1.4 -0.5 -0.7 -0.5Effective interest rate 5.2 5.6 6.0 6.3 6.8 6.8 Effective interest rate 5.2 5.6 6.0 6.3 6.8 6.9
Real Interest Rate Shock Real Exchange Rate ShockReal GDP growth 3.7 4.0 4.2 4.1 4.0 4.0 Real GDP growth 3.7 4.0 4.2 4.1 4.0 4.0Inflation 3.7 4.2 5.1 5.1 5.1 5.1 Inflation 3.7 8.4 5.1 5.1 5.1 5.1Primary balance -2.1 -1.0 -0.7 -0.5 -0.7 -0.5 Primary balance -2.1 -1.0 -0.7 -0.5 -0.7 -0.5Effective interest rate 5.2 5.6 6.8 7.7 8.6 9.1 Effective interest rate 5.2 5.7 5.8 6.2 6.7 6.8
Combined Shock Contingent Liability ShockReal GDP growth 3.7 2.8 2.9 4.1 4.0 4.0 Real GDP growth 3.7 2.8 2.9 4.1 4.0 4.0Inflation 3.7 3.9 4.8 5.1 5.1 5.1 Inflation 3.7 3.9 4.8 5.1 5.1 5.1Primary balance -2.1 -1.8 -1.5 -0.5 -0.7 -0.5 Primary balance -2.1 -32.9 -0.7 -0.5 -0.7 -0.5Effective interest rate 5.2 5.7 6.6 7.5 8.5 9.0 Effective interest rate 5.2 6.1 7.7 7.0 6.8 6.4
Source: IMF staff.
Figure 5. Mauritius Public DSA - Stress Tests
Macro-Fiscal Stress Tests
Baseline Primary Balance ShockReal GDP Growth Shock
Real Interest Rate Shock
(in percent)
Real Exchange Rate Shock
Combined Macro-Fiscal Shock
Additional Stress Tests
Baseline
Underlying Assumptions
Contingent Liability Shock
48
50
52
54
56
58
60
62
2014 2015 2016 2017 2018 2019
Gross Nominal Public Debt(in percent of GDP)
240245250255260265270275280285290295
2014 2015 2016 2017 2018 2019
Gross Nominal Public Debt(in percent of Revenue)
0
2
4
6
8
10
12
14
2014 2015 2016 2017 2018 2019
Public Gross Financing Needs(in percent of GDP)
0102030405060708090
100
2014 2015 2016 2017 2018 2019
Gross Nominal Public Debt(in percent of GDP)
200
250
300
350
400
450
500
2014 2015 2016 2017 2018 2019
Gross Nominal Public Debt(in percent of Revenue)
05
101520253035404550
2014 2015 2016 2017 2018 2019
Public Gross Financing Needs(in percent of GDP)
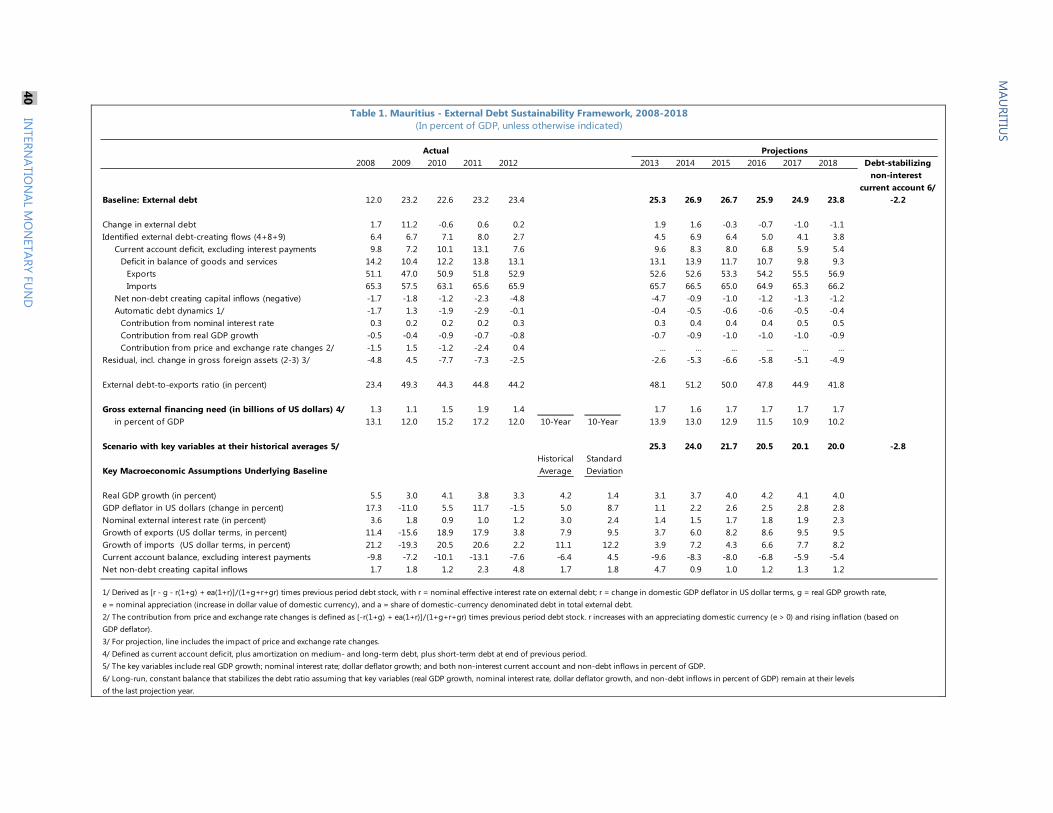
Projections2008 2009 2010 2011 2012 2013 2014 2015 2016 2017 2018 Debt-stabilizing
non-interest current account 6/
Baseline: External debt 12.0 23.2 22.6 23.2 23.4 25.3 26.9 26.7 25.9 24.9 23.8 -2.2
Change in external debt 1.7 11.2 -0.6 0.6 0.2 1.9 1.6 -0.3 -0.7 -1.0 -1.1Identified external debt-creating flows (4+8+9) 6.4 6.7 7.1 8.0 2.7 4.5 6.9 6.4 5.0 4.1 3.8
Current account deficit, excluding interest payments 9.8 7.2 10.1 13.1 7.6 9.6 8.3 8.0 6.8 5.9 5.4Deficit in balance of goods and services 14.2 10.4 12.2 13.8 13.1 13.1 13.9 11.7 10.7 9.8 9.3
Exports 51.1 47.0 50.9 51.8 52.9 52.6 52.6 53.3 54.2 55.5 56.9Imports 65.3 57.5 63.1 65.6 65.9 65.7 66.5 65.0 64.9 65.3 66.2
Net non-debt creating capital inflows (negative) -1.7 -1.8 -1.2 -2.3 -4.8 -4.7 -0.9 -1.0 -1.2 -1.3 -1.2Automatic debt dynamics 1/ -1.7 1.3 -1.9 -2.9 -0.1 -0.4 -0.5 -0.6 -0.6 -0.5 -0.4
Contribution from nominal interest rate 0.3 0.2 0.2 0.2 0.3 0.3 0.4 0.4 0.4 0.5 0.5Contribution from real GDP growth -0.5 -0.4 -0.9 -0.7 -0.8 -0.7 -0.9 -1.0 -1.0 -1.0 -0.9Contribution from price and exchange rate changes 2/ -1.5 1.5 -1.2 -2.4 0.4 ... ... ... ... ... ...
Residual, incl. change in gross foreign assets (2-3) 3/ -4.8 4.5 -7.7 -7.3 -2.5 -2.6 -5.3 -6.6 -5.8 -5.1 -4.9
External debt-to-exports ratio (in percent) 23.4 49.3 44.3 44.8 44.2 48.1 51.2 50.0 47.8 44.9 41.8
Gross external financing need (in billions of US dollars) 4/ 1.3 1.1 1.5 1.9 1.4 1.7 1.6 1.7 1.7 1.7 1.7in percent of GDP 13.1 12.0 15.2 17.2 12.0 10-Year 10-Year 13.9 13.0 12.9 11.5 10.9 10.2
Scenario with key variables at their historical averages 5/ 25.3 24.0 21.7 20.5 20.1 20.0 -2.8Historical Standard
Key Macroeconomic Assumptions Underlying Baseline Average Deviation
Real GDP growth (in percent) 5.5 3.0 4.1 3.8 3.3 4.2 1.4 3.1 3.7 4.0 4.2 4.1 4.0GDP deflator in US dollars (change in percent) 17.3 -11.0 5.5 11.7 -1.5 5.0 8.7 1.1 2.2 2.6 2.5 2.8 2.8Nominal external interest rate (in percent) 3.6 1.8 0.9 1.0 1.2 3.0 2.4 1.4 1.5 1.7 1.8 1.9 2.3Growth of exports (US dollar terms, in percent) 11.4 -15.6 18.9 17.9 3.8 7.9 9.5 3.7 6.0 8.2 8.6 9.5 9.5Growth of imports (US dollar terms, in percent) 21.2 -19.3 20.5 20.6 2.2 11.1 12.2 3.9 7.2 4.3 6.6 7.7 8.2Current account balance, excluding interest payments -9.8 -7.2 -10.1 -13.1 -7.6 -6.4 4.5 -9.6 -8.3 -8.0 -6.8 -5.9 -5.4Net non-debt creating capital inflows 1.7 1.8 1.2 2.3 4.8 1.7 1.8 4.7 0.9 1.0 1.2 1.3 1.2
1/ Derived as [r - g - r(1+g) + ea(1+r)]/(1+g+r+gr) times previous period debt stock, with r = nominal effective interest rate on external debt; r = change in domestic GDP deflator in US dollar terms, g = real GDP growth rate, e = nominal appreciation (increase in dollar value of domestic currency), and a = share of domestic-currency denominated debt in total external debt.2/ The contribution from price and exchange rate changes is defined as [-r(1+g) + ea(1+r)]/(1+g+r+gr) times previous period debt stock. r increases with an appreciating domestic currency (e > 0) and rising inflation (based on GDP deflator).3/ For projection, line includes the impact of price and exchange rate changes.4/ Defined as current account deficit, plus amortization on medium- and long-term debt, plus short-term debt at end of previous period. 5/ The key variables include real GDP growth; nominal interest rate; dollar deflator growth; and both non-interest current account and non-debt inflows in percent of GDP.6/ Long-run, constant balance that stabilizes the debt ratio assuming that key variables (real GDP growth, nominal interest rate, dollar deflator growth, and non-debt inflows in percent of GDP) remain at their levels of the last projection year.
Actual
Table 1. Mauritius - External Debt Sustainability Framework, 2008-2018(In percent of GDP, unless otherwise indicated)
MAU
RITIUS
40 INTERN
ATION
AL MO
NETARY FU
ND

MAURITIUS
INTERNATIONAL MONETARY FUND 41
i-rate shock 25
Baseline24
10
15
20
25
30
35
2008 2010 2012 2014 2016 2018
Interest rate shock (in percent)
Figure 6. Mauritius - External Debt Sustainability: Bound Tests 1/ 2/(External debt in percent of GDP)
Sources: International Monetary Fund, Country desk data, and staff estimates.1/ Shaded areas represent actual data. Individual shocks are permanent one-half standard deviation shocks. Figures in the boxes represent average projections for the respective variables in the baseline and scenario being presented. Ten-year historical average for the variable is also shown. 2/ For historical scenarios, the historical averages are calculated over the ten-year period, and the information is used to project debt dynamics five years ahead.3/ Permanent 1/4 standard deviation shocks applied to real interest rate, growth rate, and current account balance.4/ One-time real depreciation of 30 percent occurs in 2010.
Historical
20
Baseline
24
0
5
10
15
20
10
15
20
25
30
35
2008 2010 2012 2014 2016 2018
Baseline and historical scenarios
CA shock
34
Baseline24
10
15
20
25
30
35
2008 2010 2012 2014 2016 2018
Combined shock
30
Baseline24
10
15
20
25
30
35
2008 2010 2012 2014 2016 2018
Combined shock 3/
30 % depreciation
35
Baseline24
10
15
20
25
30
35
40
2008 2010 2012 2014 2016 2018
Real depreciation shock 4/
Gross financing need under baseline
(right scale)
Non-interest current account shock (in percent of GDP)
Growth shock
24Baseline24
10
15
20
25
30
35
2008 2010 2012 2014 2016 2018
Baseline:
Scenario:
Historical:
1.83.0
3.0
Baseline:
Scenario:
Historical:
4.03.3
4.2
Baseline:
Scenario:
Historical:
-6.9-9.1
-6.4
Growth shock (in percent per year)

MAURITIUS
42 INTERNATIONAL MONETARY FUND
APPENDIX II. EXTERNAL COMPETITIVENESS ASSESSMENT 1
Exchange rate assessment The Mauritian rupee depreciated by an average of 0.4 percent in real effective terms during 2013, but continues to be at historically high levels (Figure II.1). After the continuous real appreciation of the rupee from 2007 to 2012, the BOM started intervening occasionally in the foreign exchange market after June 2012 to smooth the fluctuation of the rupee and build reserves. The BOM continued to intervene in 2013, smoothing the volatility in the nominal effective exchange, although the nominal and real effective exchange rates edged up marginally over the course of the year.
Figure II.1. Mauritius: Bilateral and Effective Exchange Rates, 2001-13
Source: Mauritius authorities and IMF staff estimates.
The rupee is estimated to be moderately overvalued based on analytical methods. Staff applied the three Consultative Group on Exchange Rate (CGER) Issues methodologies: (i) macroeconomic balance (MB); equilibrium real exchange rate (ERER); and external sustainability (ES). All three approaches consistently give point estimates of a moderate overvaluation, which ranges from about 3 percent on average for the medium-term (Table II.1) to 7 percent for 2014. The level of confidence in the individual estimates is not very high since all methodologies include zero-overvaluation in the bands (Figures II.2 and II.3). The results from CGER methodologies are also consistent with two additional approaches, the purchasing power parity (PPP) approach and the fundamental equilibrium exchange rate (FEER) approach, which point to mild or zero overvaluation in 2014. The numerical estimates are not very large, but they all point in the same direction, which gives a little bit more confidence in the results. Table II.1 summarizes the current and medium-term exchange rate misalignment computed under the five different methodologies. Some results are sensitive to the estimates of the elasticity of the current account with respect to the real exchange rate. The estimates used are Mauritius-specific because as a small open economy, Mauritius is estimated to have higher import and export elasticities (Text Table II.1.) If standard CGER elasticities (exports = -0.71; imports = 0.92) were used instead of Mauritius-specific elasticities, implied exchange rate misalignments would be larger for the MB and the ES approaches. However, the error bands for the MB approach would also be larger and zero misalignment of the current account would still be within the error band.
1 Prepared by Keiichiro Inui (AFR).

MAURITIUS
INTERNATIONAL MONETARY FUND 43
The MB approach shows that the gap between underlying current account deficit and its norm was stable in 2013 (Figure II.2). Estimation results show that the underlying current account deficit was outside the band around the norm in 2011 and thus the REER might have been somewhat overvalued at that point. After 2011, however, the actual CA deficit narrowed, resulting in a lower measured overvaluation. The equilibrium CA deficit is estimated at 3 percent of GDP over the medium term, mainly because of a higher growth rate than trading partners (which contributed 2 percentage points of GDP to the equilibrium CA deficit).
The ERER approach does not suggest a significant misalignment. The ERER approach signaled a mild overvaluation of the rupee by about 7 percent in 2013-14, but the average real exchange rate is within the 90 percent confidence interval estimated by this methodology. The rupee is projected to stay constant in real effective terms over the medium term, which would narrow the level of misalignment over the medium term due to a moderate improvement in fundamentals (Figure II.3).
The ES approach estimates the level of the CA balance that stabilizes the level of net foreign assets (NFA). It shows that the rupee is projected to be overvalued by about 11 percent in 2014 and 7 percent over the medium term due to a projected decline in the CA deficit (Figure II.4). The estimated overvaluation under the ES approach is slightly larger than that of the MB approach because of the difference in the CA norms.
The results from CGER methodologies are in line with the results from the two other approaches. The PPP approach shows that the current level of the real exchange rate is close to its historical average.
Figure II.2. Mauritius: MB Approach: Norm vs. Underlying CA
-20
-10
0
10
2001
2002
2003
2004
2005
2006
2007
2008
2009
2010
2011
2012
2013
2014
2015
2016
2017
2018
% of
GDP
CA Norm Underlying CA
Figure II.3. Mauritius: ERER Approach: Actual and Equilibrium REER
Source: IMF staff estimates and projections.
80
100
120
140
2001
2002
2003
2004
2005
2006
2007
2008
2009
2010
2011
2012
2013
2014
2015
2016
2017
2018
Actual REER Equilibrium REER
Text Table II.1. Mauritius: Exchange Rate Assessment Results
Source: IMF staff estimates and projections.
2012 2013 2014 2018
Method
MB 6.2 8.5 7.3 4.0
ERER 7.2 6.8 6.7 5.1
ES 10.6 13.8 11.0 7.1
PPP 2.2 1.9 1.9 1.9
FEER 12.6 10.6 7.6 3.3
Average 7.8 8.3 6.9 4.3
Trimmed Average 2 8.0 8.7 7.2 4.11 Mauritius specific elasticities: exports = -1.6; imports = 12 Average excluding highest and lowest results
Exchange Rate Misalignments (Mauritius specific elasticities)1

MAURITIUS
44 INTERNATIONAL MONETARY FUND
The fundamental equilibrium exchange rate (FEER) approach is conceptually similar to the ERER approach; it also seeks the long-term relationship between exchange rates and a set of economic fundamentals, including terms of trade, government consumption, and openness. Instead of running panel regressions (as in the ERER), the FEER uses a longer time series of Mauritian data to identify potential misalignments. The FEER results suggest that the exchange rate overvaluation declined between 2012 and 2014 to 8 percent, but stayed within the statistical error bands during recent years (Figure II.5).
Figure II.4. Mauritius: ES Approach: Norm vs. Underlying CA Figure Figure II.5. Mauritius: FEER Approach
Source: IMF staff estimates and projections. Source: IMF staff estimates and projections.
Competitiveness assessment
Mauritius’s share in world tourism has been generally stable but fell after the global financial crisis (Figure II.6). A possible explanation for losing share over the recent few years could be that the impact of the financial crisis was largest in Europe, the largest source of tourists going to Mauritius. A competitiveness scorecard suggests that Mauritius has lost competitiveness against peer tourism-dependent countries. The scorecard shows various indicators representing competitiveness of Mauritius and compares them with all other countries and a group of tourism-dependent economies (Text Table II.2). Higher rankings (lower numbers in deciles) in each indicator imply greater competitiveness of Mauritius compared with the other countries (or other peer tourism-dependent countries). The scorecard shows that Mauritius is in the 8th lowest decile in the group of tourism-dependent country, which can be interpreted as having relatively low competitiveness against its peer group or median competitiveness from a global perspective.
-20
-10
0
10
20
01
20
02
20
03
20
04
20
05
20
06
20
07
20
08
20
09
20
10
20
11
20
12
20
13
20
14
20
15
20
16
20
17
20
18
% o
f G
DP
CA Norm Actual CA
75
85
95
105
115
125
135
145
155
165
1980
1981
1982
1983
1984
1985
1986
1987
1988
1989
1990
1991
1992
1993
1994
1995
1996
1997
1998
1999
2000
2001
2002
2003
2004
2005
2006
2007
2008
2009
2010
2011
2012
2013
2014
Mauritius: Actual vs. Equilibrium REER, FEER Approach
Actual REER
Long run equilibrium REER
90% confidence interval
Source: IMF staff estimates. Equilibrium REER is determined by fundamentals, include terms of trade, government consumption, and trade openness.
Figure II.6. Development of Mauritius’ Tourism Sector (International Tourists Arrival)
Source: World Bank and the Government of Mauritius.
500
600
700
800
900
1000
1100
0.080%
0.085%
0.090%
0.095%
0.100%
0.105%
20
00
20
01
20
02
20
03
20
04
20
05
20
06
20
07
20
08
20
09
20
10
20
11
20
12
20
13
Tourist arrivals in mauritius (in thousands, right axis)
Mauritius' share in world tourism (left axis)

MAURITIUS
INTERNATIONAL MONETARY FUND 45
A comprehensive competitiveness assessment suggests that the rupee is moderately overvalued from a structural point of view. Although Mauritius had a current account surplus from 2001 through 2003, the current account deteriorated gradually to an elevated level. The competitiveness scorecard also points to a loss of competitiveness, because of (i) loss of export volume and market share; (ii) higher costs of production factors; and (iii) appreciation of the currency, Mauritius’ competitiveness scores on the low side among peer tourism-dependent countries. Furthermore, over the past few years, wages have risen faster than labor productivity, resulting in higher unit labor costs, and exports have fallen as a share of GDP. These measures of competitiveness suggest that the rupee is moderately overvalued from a structural point of view. This vulnerability will need to be addressed through structural measures to restore competitiveness.
Text Table II.2. Mauritius: Competitiveness Scorecard
OverallInternal
Terms of
Trade
CPI-REER Tourist
Arrival Share
Non-Oil
Export
Volume
Non-Oil
Export
Market Share
Internet
Users (per
100 people)
Price for
Gasoline
(US$ per
liter)
Price for
Diesel Fuel
(US$ per
liter)
Doing
Business
Indicator
(ranking)
Corruption
Perception Index
Values -21.1 19.4 0.1% 5.3 -0.6% 41 1.7 1.4 20 5.2
Deciles 1 8 5 7 8 5 7 7 1 3 5
Group (1) (10) (2) (6) (10) (7) (8) (9) (1) (8) (8)
Relative Price External Sector Costs Institution

MAURITIUS
46 INTERNATIONAL MONETARY FUND
APPENDIX III. BANKING SECTOR AND SPILLOVER ANALYSIS 1 Financial Soundness Indicators (FSI) and bank health heat map
FSIs show that the Mauritian banking system is healthy at the aggregate level. The capital adequacy ratio (CAR) has increased following the global financial crisis and stands well above the regulatory minimum of 10 percent (Figure III.1). Also, the overall liquidity ratio rose from 17 percent at end-2012 to 20 percent in June 2013, but it has not fully recovered to the level of 2008 and 2009. In recent years, it was mainly the offshore (Segment B) sector that contributed to the decrease of liquidity, while the onshore (Segment A) sector broadly maintained its liquidity ratio.
Profitability and NPLs of banking have suffered somewhat in recent years. Several indicators including ROE show a decline of bank earnings and profitability, although from relatively comfortable levels. The non-performing loan (NPL) ratio is at a low level by international comparison, but it has increased slightly to 3.9 percent in June 2013, mainly because of difficulties in the construction, tourism and GBC sectors (although GBC NPLs are still at very low levels).
Bank health heat map indicators show that large banks tend to be healthier. The heat map shows the bank health index of banks based on the BankScope database (Text Table III.1). The bank health index is defined as the average of five normalized financial ratios (i) capital adequacy; (ii) NPLs; (iii) return on assets; (iv) liquidity; and (v) tangible common equity to tangible assets (inverse of leverage ratio).2 Larger banks in Mauritius do better mainly because of higher CARs and profitability. The larger Mauritian banks continue to have a comparable or slightly better level of soundness than major global banks. Stress-testing the banking system
Stress tests suggest that bank capital remains sufficient to withstand a wide range of shocks. Staff updated the stress tests for 18 of the 21 Mauritian banks based on June 2013 data. Banks were divided into four analytical groups: (1) three large banks serving both domestic and non-residents; (2) three large banks serving primarily non-residents; (3) six medium-to-small banks serving both domestic and non-residents; and (4) six medium-to-small banks serving mostly residents. Three smaller banks were
1 Prepared by Keiichiro Inui (AFR). 2 The value of each ratio is normalized by the three-year mean and standard deviation among all banks to obtain a z-score. The sample consists of 12 Mauritian banks and 5 largest international banks as a reference group.
Figure III.1. Mauritius: Financial Soundness Indicators
0
5
10
15
20
25
30
0
1
2
3
4
5
6
2006 2007 2008 2009 2010 2011 2012 2013NPLs to gross loans (left scale)Regulatory capital/RWA (right scale)ROE (right scale)Liquid assets to total assets (right scale)
Source:Bank of Mauritius.
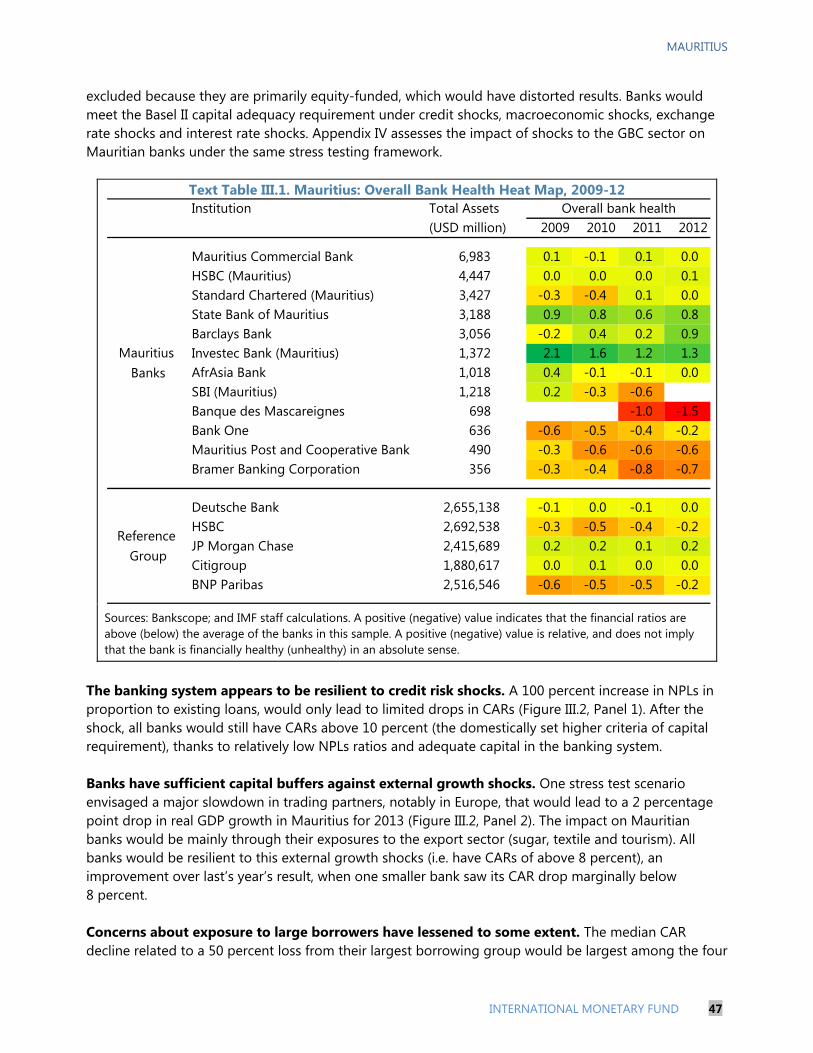
MAURITIUS
INTERNATIONAL MONETARY FUND 47
excluded because they are primarily equity-funded, which would have distorted results. Banks would meet the Basel II capital adequacy requirement under credit shocks, macroeconomic shocks, exchange rate shocks and interest rate shocks. Appendix IV assesses the impact of shocks to the GBC sector on Mauritian banks under the same stress testing framework.
Text Table III.1. Mauritius: Overall Bank Health Heat Map, 2009-12
Sources: Bankscope; and IMF staff calculations. A positive (negative) value indicates that the financial ratios are above (below) the average of the banks in this sample. A positive (negative) value is relative, and does not imply that the bank is financially healthy (unhealthy) in an absolute sense.
The banking system appears to be resilient to credit risk shocks. A 100 percent increase in NPLs in proportion to existing loans, would only lead to limited drops in CARs (Figure III.2, Panel 1). After the shock, all banks would still have CARs above 10 percent (the domestically set higher criteria of capital requirement), thanks to relatively low NPLs ratios and adequate capital in the banking system. Banks have sufficient capital buffers against external growth shocks. One stress test scenario envisaged a major slowdown in trading partners, notably in Europe, that would lead to a 2 percentage point drop in real GDP growth in Mauritius for 2013 (Figure III.2, Panel 2). The impact on Mauritian banks would be mainly through their exposures to the export sector (sugar, textile and tourism). All banks would be resilient to this external growth shocks (i.e. have CARs of above 8 percent), an improvement over last’s year’s result, when one smaller bank saw its CAR drop marginally below 8 percent. Concerns about exposure to large borrowers have lessened to some extent. The median CAR decline related to a 50 percent loss from their largest borrowing group would be largest among the four
Institution Total Assets(USD million) 2009 2010 2011 2012
Mauritius Commercial Bank 6,983 0.1 -0.1 0.1 0.0HSBC (Mauritius) 4,447 0.0 0.0 0.0 0.1Standard Chartered (Mauritius) 3,427 -0.3 -0.4 0.1 0.0State Bank of Mauritius 3,188 0.9 0.8 0.6 0.8Barclays Bank 3,056 -0.2 0.4 0.2 0.9Investec Bank (Mauritius) 1,372 2.1 1.6 1.2 1.3AfrAsia Bank 1,018 0.4 -0.1 -0.1 0.0SBI (Mauritius) 1,218 0.2 -0.3 -0.6Banque des Mascareignes 698 -1.0 -1.5Bank One 636 -0.6 -0.5 -0.4 -0.2Mauritius Post and Cooperative Bank 490 -0.3 -0.6 -0.6 -0.6Bramer Banking Corporation 356 -0.3 -0.4 -0.8 -0.7
Deutsche Bank 2,655,138 -0.1 0.0 -0.1 0.0HSBC 2,692,538 -0.3 -0.5 -0.4 -0.2JP Morgan Chase 2,415,689 0.2 0.2 0.1 0.2Citigroup 1,880,617 0.0 0.1 0.0 0.0BNP Paribas 2,516,546 -0.6 -0.5 -0.5 -0.2
Overall bank health
Mauritius Banks
Reference Group
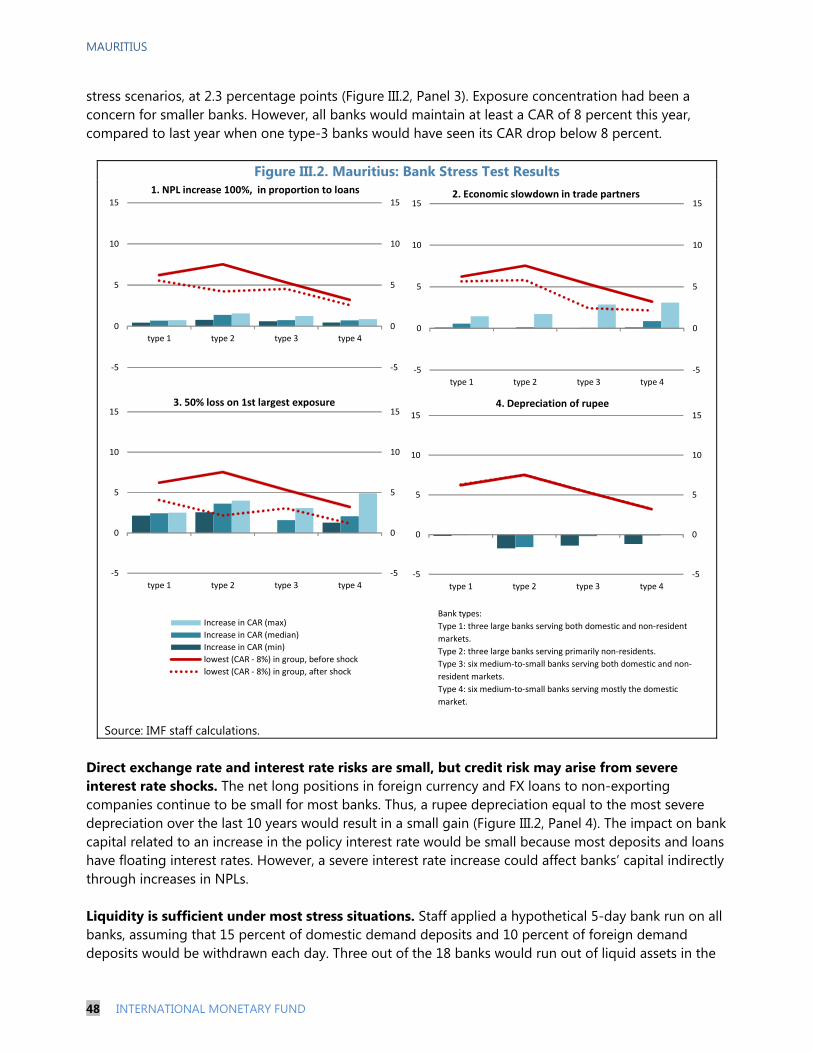
MAURITIUS
48 INTERNATIONAL MONETARY FUND
stress scenarios, at 2.3 percentage points (Figure III.2, Panel 3). Exposure concentration had been a concern for smaller banks. However, all banks would maintain at least a CAR of 8 percent this year, compared to last year when one type-3 banks would have seen its CAR drop below 8 percent.
Figure III.2. Mauritius: Bank Stress Test Results
Source: IMF staff calculations. Direct exchange rate and interest rate risks are small, but credit risk may arise from severe interest rate shocks. The net long positions in foreign currency and FX loans to non-exporting companies continue to be small for most banks. Thus, a rupee depreciation equal to the most severe depreciation over the last 10 years would result in a small gain (Figure III.2, Panel 4). The impact on bank capital related to an increase in the policy interest rate would be small because most deposits and loans have floating interest rates. However, a severe interest rate increase could affect banks’ capital indirectly through increases in NPLs. Liquidity is sufficient under most stress situations. Staff applied a hypothetical 5-day bank run on all banks, assuming that 15 percent of domestic demand deposits and 10 percent of foreign demand deposits would be withdrawn each day. Three out of the 18 banks would run out of liquid assets in the
Bank types:
Type 1: three large banks serving both domestic and non-resident
markets.
Type 2: three large banks serving primarily non-residents.
Type 3: six medium-to-small banks serving both domestic and non-
resident markets.
Type 4: six medium-to-small banks serving mostly the domestic
market.
051015
-5051015
type 1 type 2 type 3 type 4
Increase in CAR (max)
Increase in CAR (median)
Increase in CAR (min)
lowest (CAR - 8%) in group, before shock
lowest (CAR - 8%) in group, after shock
-5
0
5
10
15
-5
0
5
10
15
type 1 type 2 type 3 type 4
1. NPL increase 100%, in proportion to loans
-5
0
5
10
15
-5
0
5
10
15
type 1 type 2 type 3 type 4
2. Economic slowdown in trade partners
-5
0
5
10
15
-5
0
5
10
15
type 1 type 2 type 3 type 4
3. 50% loss on 1st largest exposure
-5
0
5
10
15
-5
0
5
10
15
type 1 type 2 type 3 type 4
4. Depreciation of rupee

MAURITIUS
INTERNATIONAL MONETARY FUND 49
absence of any interbank borrowing or external support, but the banking system as a whole would still be liquid, with the liquid assets-to-total assets ratio at 13 percent by the end of day five. Banking and sovereign stress spillover analysis
The direct spillovers to Mauritius from stress in international banks were assessed using the Bank Contagion Module developed by the IMF’s Research Department. The module estimates the vulnerability of Mauritian banks stemming from international banks that operate in Mauritius or are involved in direct cross-border lending, based on the BIS banking statistics. Based on the default rates specified in the tables below, the module estimates the reduction in the availability of credit for Mauritian banks, since international banks that do not hold enough capital to cover such losses, would have to deleverage (reduce their foreign and domestic assets) to restore their required CARs, thus squeezing credit lines to Mauritius and other countries.3
A default on the sovereign debt of selected European countries would only moderately affect foreign credit availability to Mauritius. The banking systems of Greece, Ireland, Italy, Portugal, and Spain have already experienced market pressures. Although the assumed default rates are very high (Text Table III.2), the impact of the simulated losses of international banks actively lending to Mauritian banks would be limited except the case of Italy where the impact on credit availability is moderate at some 1.5 percent of GDP.
Text Table III.2. Mauritius: Spillovers From International Banks’ Sovereign Exposure (end-2012)
Foreign credit availability for Mauritian borrowers would be affected considerably by large losses of international banks in European countries. The simulations assume a default on 10–30 percent of international bank assets, which would be a very severe shock. The largest direct impact of the various scenarios would stem from a combined loss in selected European countries and would reduce foreign bank credit to Mauritian banks by about 50 percent of GDP (Text Table III.3). Among these countries, the impact from the UK would be the largest (about 28 percent of GDP), because UK banks constitute about 39 percent of banking assets in Mauritius, followed by Germany and France (about 9 percent of GDP
3 The model assumes no bank recapitalization or other support at the host and/or home country level.
Shock Originating From Magnitude 1/
Impact on Credit Availability (percent of
GDP) 2/Greece 50 0.0Greece, Ireland, and Portugal 50 -0.1Spain 25 -0.2Italy 25 -1.5
Source: RES/MFU Bank Contagion Module based on BIS, ECB, and IFS data.
1/ Magnitude denotes the percent of sovereign on-balance sheet claims that default.
2/ Reduction in foreign banks credit on Mauritius due to the impact of their shock in their balance sheet, assuming a uniform deleveraging across domestic and external claims.

MAURITIUS
50 INTERNATIONAL MONETARY FUND
each). This suggests that an emergence of a severe crisis in large European countries could impact Mauritian banks beyond their direct asset exposure to the region.
Text Table III.3. Mauritius: Spillovers From International Banks’ Exposure (end-2012)
Development of macro-financial risks and conditions of Mauritius
The Mauritian financial sector has become less risky over the past two years. The Country Financial Stability Map developed by the IMF’s MCM department describes the development of macro-financial risks and conditions in a particular country, with four risk indices (macroeconomic risks; inward spillover risks; credit risks; and market and liquidity risks) and two macro-financial condition indices (risk appetite; and monetary and financial conditions). Each index is calculated by taking into consideration various macroeconomic and financial indicators that affects risks of financial sector in each country. Figure III.3 shows that the macro-financial conditions have improved as both the risk appetite index and monetary and financial conditions index indicate lower risks in the second quarter of 2013 compared with two years earlier. This improvement is likely mainly due to the improvement of economic and financial conditions in Europe, Mauritius’ main trade partner. In addition, market and liquidity risks appear to have declined, while macroeconomic risks edged up, with credit and inward spillover risks basically stable. The largest risk exposure was related to market and liquidity risks.
Shock Originating From Magnitude 1/
Impact on Credit Availability (percent of
GDP) 2/Greece 30 0.0Greece, Ireland, and Portugal 30 -0.2Italy 10 -2.4Spain 10 -0.4France 10 -8.6Germany 10 -8.6Belgium 10 -0.1Switzerland 10 -0.1UK 10 -27.5Selected European Countries 3/ 10 -50.8US 10 -4.1Canada 10 -0.1Canada and US 10 -5.4Australia 10 -1.3
Source: RES/MFU Bank Contagion Module based on BIS, ECB, and IFS data.
3/ Greece, Ireland, Portugal, Italy, Spain, France, Germany, Belgium, Switzerland, and UK
2/ Reduction in foreign banks credit to Mauritius due to the impact of the analyzed shock in their balance sheet, assuming a uniform deleveraging across domestic and external claims.
1/ Magnitude denotes the percent of on-balance sheet claims (all borrowing sectors) that default.

MAURITIUS
INTERNATIONAL MONETARY FUND 51
Figure III.3. Mauritius: Country Financial Stability Map for Mauritius
0
2
4
6
8
10Inward spillover risks
Credit risks
Market and liquidity risks
Risk appetite
Monetary and financial conditions
Macroeconomic risks
2011Q2
2013Q2
Note: Away from the center signifies higher risks.
0123456789
10
2011Q2 2011Q3 2011Q4 2012Q1 2012Q2 2012Q3 2012Q4 2013Q1 2013Q2
Ran
king
Inward spillover risks Credit risksMarket and liquidity risks Macroeconomic risks
0123456789
10
2011Q2 2011Q3 2011Q4 2012Q1 2012Q2 2012Q3 2012Q4 2013Q1 2013Q2
Rank
ing
Monetary and financial conditions Risk appetite
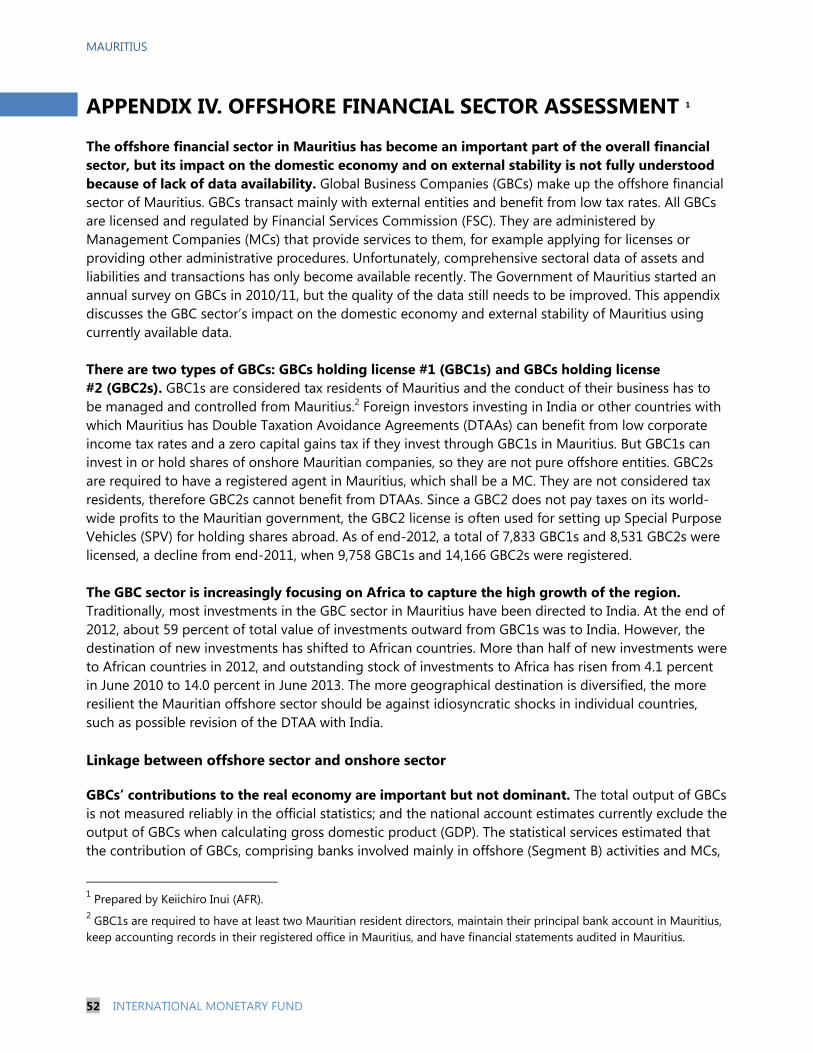
MAURITIUS
52 INTERNATIONAL MONETARY FUND
APPENDIX IV. OFFSHORE FINANCIAL SECTOR ASSESSMENT 1 The offshore financial sector in Mauritius has become an important part of the overall financial sector, but its impact on the domestic economy and on external stability is not fully understood because of lack of data availability. Global Business Companies (GBCs) make up the offshore financial sector of Mauritius. GBCs transact mainly with external entities and benefit from low tax rates. All GBCs are licensed and regulated by Financial Services Commission (FSC). They are administered by Management Companies (MCs) that provide services to them, for example applying for licenses or providing other administrative procedures. Unfortunately, comprehensive sectoral data of assets and liabilities and transactions has only become available recently. The Government of Mauritius started an annual survey on GBCs in 2010/11, but the quality of the data still needs to be improved. This appendix discusses the GBC sector’s impact on the domestic economy and external stability of Mauritius using currently available data. There are two types of GBCs: GBCs holding license #1 (GBC1s) and GBCs holding license #2 (GBC2s). GBC1s are considered tax residents of Mauritius and the conduct of their business has to be managed and controlled from Mauritius.2 Foreign investors investing in India or other countries with which Mauritius has Double Taxation Avoidance Agreements (DTAAs) can benefit from low corporate income tax rates and a zero capital gains tax if they invest through GBC1s in Mauritius. But GBC1s can invest in or hold shares of onshore Mauritian companies, so they are not pure offshore entities. GBC2s are required to have a registered agent in Mauritius, which shall be a MC. They are not considered tax residents, therefore GBC2s cannot benefit from DTAAs. Since a GBC2 does not pay taxes on its world-wide profits to the Mauritian government, the GBC2 license is often used for setting up Special Purpose Vehicles (SPV) for holding shares abroad. As of end-2012, a total of 7,833 GBC1s and 8,531 GBC2s were licensed, a decline from end-2011, when 9,758 GBC1s and 14,166 GBC2s were registered. The GBC sector is increasingly focusing on Africa to capture the high growth of the region. Traditionally, most investments in the GBC sector in Mauritius have been directed to India. At the end of 2012, about 59 percent of total value of investments outward from GBC1s was to India. However, the destination of new investments has shifted to African countries. More than half of new investments were to African countries in 2012, and outstanding stock of investments to Africa has risen from 4.1 percent in June 2010 to 14.0 percent in June 2013. The more geographical destination is diversified, the more resilient the Mauritian offshore sector should be against idiosyncratic shocks in individual countries, such as possible revision of the DTAA with India. Linkage between offshore sector and onshore sector
GBCs’ contributions to the real economy are important but not dominant. The total output of GBCs is not measured reliably in the official statistics; and the national account estimates currently exclude the output of GBCs when calculating gross domestic product (GDP). The statistical services estimated that the contribution of GBCs, comprising banks involved mainly in offshore (Segment B) activities and MCs,
1 Prepared by Keiichiro Inui (AFR). 2 GBC1s are required to have at least two Mauritian resident directors, maintain their principal bank account in Mauritius, keep accounting records in their registered office in Mauritius, and have financial statements audited in Mauritius.
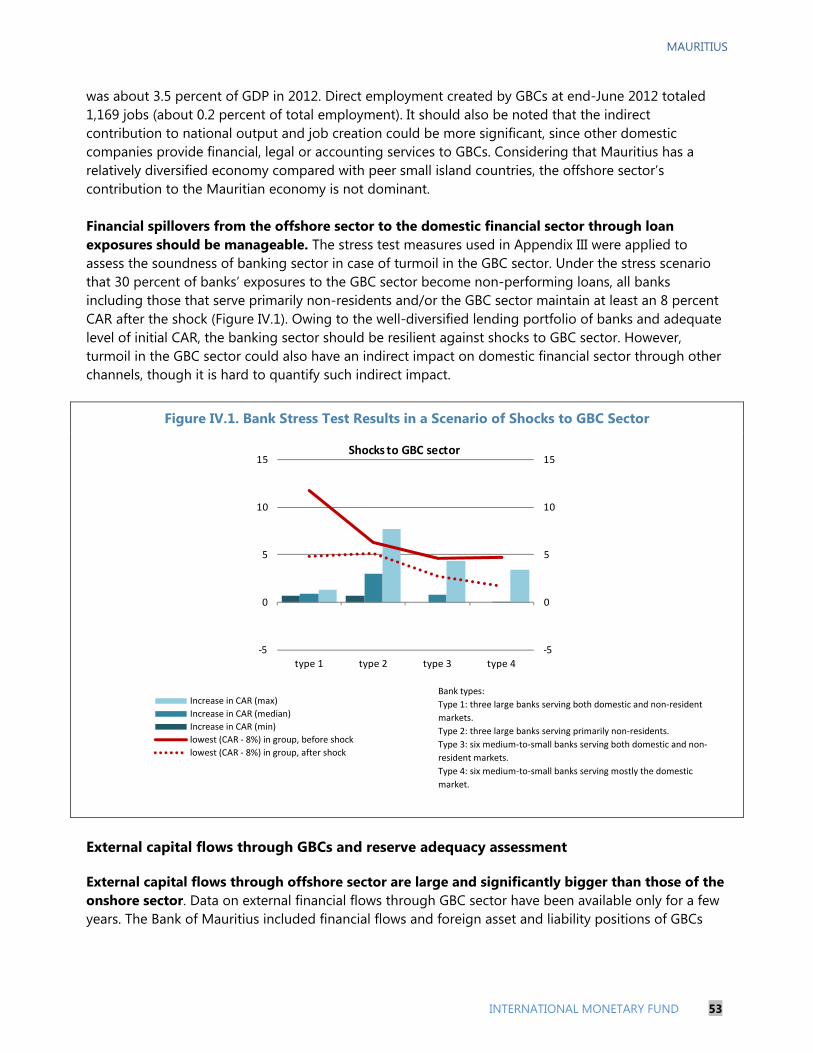
MAURITIUS
INTERNATIONAL MONETARY FUND 53
was about 3.5 percent of GDP in 2012. Direct employment created by GBCs at end-June 2012 totaled 1,169 jobs (about 0.2 percent of total employment). It should also be noted that the indirect contribution to national output and job creation could be more significant, since other domestic companies provide financial, legal or accounting services to GBCs. Considering that Mauritius has a relatively diversified economy compared with peer small island countries, the offshore sector’s contribution to the Mauritian economy is not dominant. Financial spillovers from the offshore sector to the domestic financial sector through loan exposures should be manageable. The stress test measures used in Appendix III were applied to assess the soundness of banking sector in case of turmoil in the GBC sector. Under the stress scenario that 30 percent of banks’ exposures to the GBC sector become non-performing loans, all banks including those that serve primarily non-residents and/or the GBC sector maintain at least an 8 percent CAR after the shock (Figure IV.1). Owing to the well-diversified lending portfolio of banks and adequate level of initial CAR, the banking sector should be resilient against shocks to GBC sector. However, turmoil in the GBC sector could also have an indirect impact on domestic financial sector through other channels, though it is hard to quantify such indirect impact.
Figure IV.1. Bank Stress Test Results in a Scenario of Shocks to GBC Sector
External capital flows through GBCs and reserve adequacy assessment
External capital flows through offshore sector are large and significantly bigger than those of the onshore sector. Data on external financial flows through GBC sector have been available only for a few years. The Bank of Mauritius included financial flows and foreign asset and liability positions of GBCs
-5
0
5
10
15
-5
0
5
10
15
type 1 type 2 type 3 type 4
Shocks to GBC sector
Bank types:
Type 1: three large banks serving both domestic and non-resident
markets.
Type 2: three large banks serving primarily non-residents.
Type 3: six medium-to-small banks serving both domestic and non-
resident markets.
Type 4: six medium-to-small banks serving mostly the domestic
market.
051015
-5051015
type 1 type 2 type 3 type 4
Increase in CAR (max)
Increase in CAR (median)
Increase in CAR (min)
lowest (CAR - 8%) in group, before shock
lowest (CAR - 8%) in group, after shock
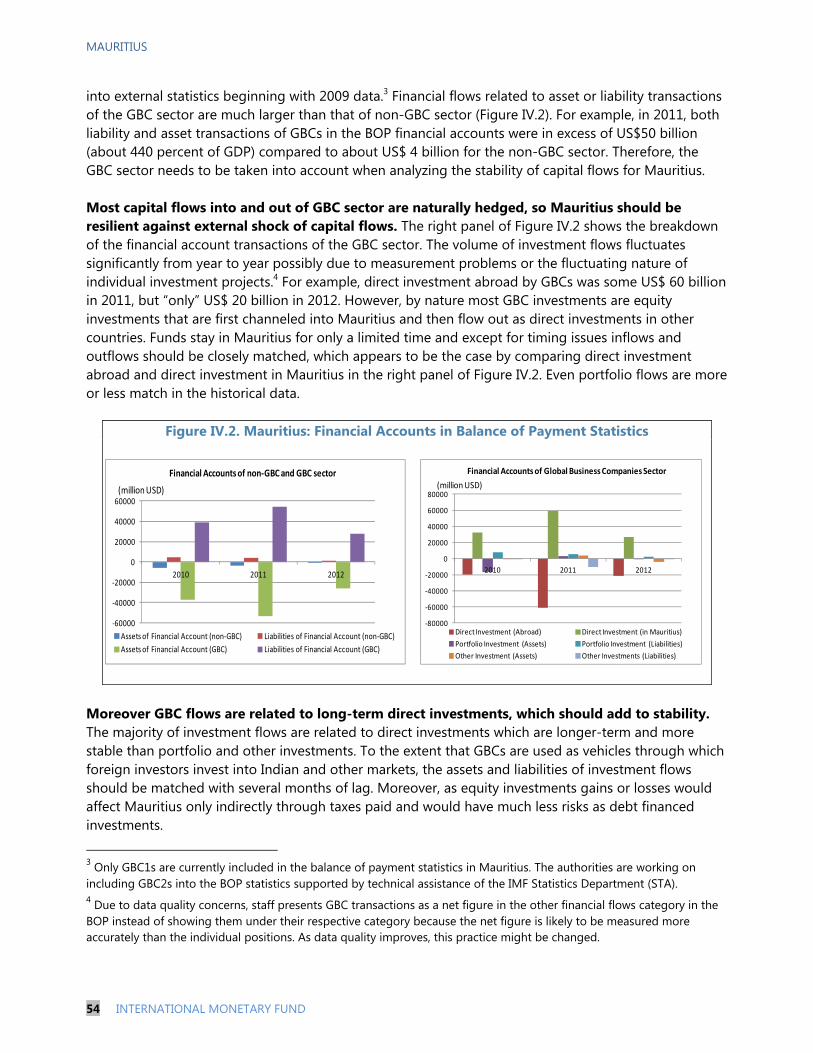
MAURITIUS
54 INTERNATIONAL MONETARY FUND
-60000
-40000
-20000
0
20000
40000
60000
2010 2011 2012
Assets of Financial Account (non-GBC) Liabilities of Financial Account (non-GBC)
Assets of Financial Account (GBC) Liabilities of Financial Account (GBC)
(million USD)
Financial Accounts of non-GBC and GBC sector
into external statistics beginning with 2009 data.3 Financial flows related to asset or liability transactions of the GBC sector are much larger than that of non-GBC sector (Figure IV.2). For example, in 2011, both liability and asset transactions of GBCs in the BOP financial accounts were in excess of US$50 billion (about 440 percent of GDP) compared to about US$ 4 billion for the non-GBC sector. Therefore, the GBC sector needs to be taken into account when analyzing the stability of capital flows for Mauritius. Most capital flows into and out of GBC sector are naturally hedged, so Mauritius should be resilient against external shock of capital flows. The right panel of Figure IV.2 shows the breakdown of the financial account transactions of the GBC sector. The volume of investment flows fluctuates significantly from year to year possibly due to measurement problems or the fluctuating nature of individual investment projects.4 For example, direct investment abroad by GBCs was some US$ 60 billion in 2011, but “only” US$ 20 billion in 2012. However, by nature most GBC investments are equity investments that are first channeled into Mauritius and then flow out as direct investments in other countries. Funds stay in Mauritius for only a limited time and except for timing issues inflows and outflows should be closely matched, which appears to be the case by comparing direct investment abroad and direct investment in Mauritius in the right panel of Figure IV.2. Even portfolio flows are more or less match in the historical data.
Figure IV.2. Mauritius: Financial Accounts in Balance of Payment Statistics
Moreover GBC flows are related to long-term direct investments, which should add to stability. The majority of investment flows are related to direct investments which are longer-term and more stable than portfolio and other investments. To the extent that GBCs are used as vehicles through which foreign investors invest into Indian and other markets, the assets and liabilities of investment flows should be matched with several months of lag. Moreover, as equity investments gains or losses would affect Mauritius only indirectly through taxes paid and would have much less risks as debt financed investments.
3 Only GBC1s are currently included in the balance of payment statistics in Mauritius. The authorities are working on including GBC2s into the BOP statistics supported by technical assistance of the IMF Statistics Department (STA). 4 Due to data quality concerns, staff presents GBC transactions as a net figure in the other financial flows category in the BOP instead of showing them under their respective category because the net figure is likely to be measured more accurately than the individual positions. As data quality improves, this practice might be changed.
-80000
-60000
-40000
-20000
0
20000
40000
60000
80000
2010 2011 2012
Direct Investment (Abroad) Direct Investment (in Mauritius)
Portfolio Investment (Assets) Portfolio Investment (Liabilities)
Other Investment (Assets) Other Investments (Liabilities)
(million USD)
Financial Accounts of Global Business Companies Sector
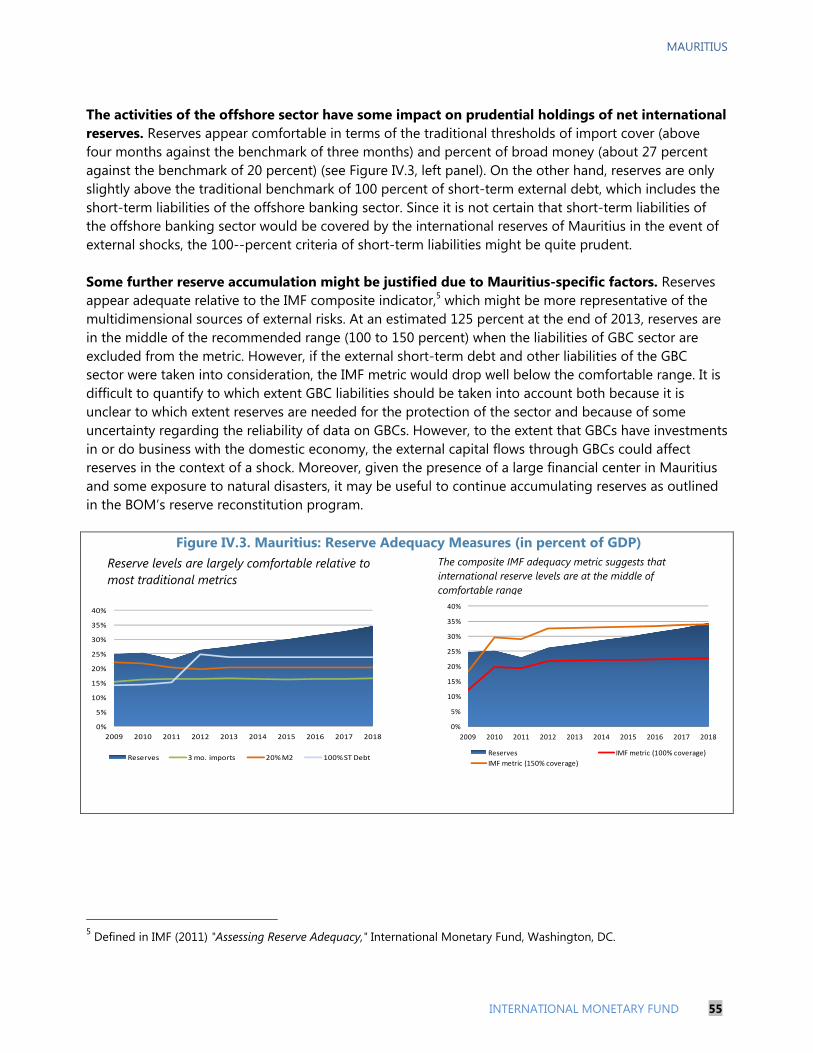
MAURITIUS
INTERNATIONAL MONETARY FUND 55
The activities of the offshore sector have some impact on prudential holdings of net international reserves. Reserves appear comfortable in terms of the traditional thresholds of import cover (above four months against the benchmark of three months) and percent of broad money (about 27 percent against the benchmark of 20 percent) (see Figure IV.3, left panel). On the other hand, reserves are only slightly above the traditional benchmark of 100 percent of short-term external debt, which includes the short-term liabilities of the offshore banking sector. Since it is not certain that short-term liabilities of the offshore banking sector would be covered by the international reserves of Mauritius in the event of external shocks, the 100--percent criteria of short-term liabilities might be quite prudent. Some further reserve accumulation might be justified due to Mauritius-specific factors. Reserves appear adequate relative to the IMF composite indicator,5 which might be more representative of the multidimensional sources of external risks. At an estimated 125 percent at the end of 2013, reserves are in the middle of the recommended range (100 to 150 percent) when the liabilities of GBC sector are excluded from the metric. However, if the external short-term debt and other liabilities of the GBC sector were taken into consideration, the IMF metric would drop well below the comfortable range. It is difficult to quantify to which extent GBC liabilities should be taken into account both because it is unclear to which extent reserves are needed for the protection of the sector and because of some uncertainty regarding the reliability of data on GBCs. However, to the extent that GBCs have investments in or do business with the domestic economy, the external capital flows through GBCs could affect reserves in the context of a shock. Moreover, given the presence of a large financial center in Mauritius and some exposure to natural disasters, it may be useful to continue accumulating reserves as outlined in the BOM’s reserve reconstitution program.
Figure IV.3. Mauritius: Reserve Adequacy Measures (in percent of GDP)
5 Defined in IMF (2011) "Assessing Reserve Adequacy," International Monetary Fund, Washington, DC.
0%
5%
10%
15%
20%
25%
30%
35%
40%
2009 2010 2011 2012 2013 2014 2015 2016 2017 2018
Reserves 3 mo. imports 20% M2 100% ST Debt
0%
5%
10%
15%
20%
25%
30%
35%
40%
2009 2010 2011 2012 2013 2014 2015 2016 2017 2018
Reserves IMF metric (100% coverage)
IMF metric (150% coverage)
Reserve levels are largely comfortable relative to most traditional metrics
The composite IMF adequacy metric suggests that international reserve levels are at the middle of comfortable range

MAURITIUS
56 INTERNATIONAL MONETARY FUND
APPENDIX V. REVENUE AND EXPENDITURE ASSIGNMENTS OF LOCAL GOVERNMENTS 1
Local governments in Mauritius are heavily reliant on the central government and the current arrangements pose significant fiscal risks. To contain such risks and avoid spillovers on the central government, fundamental reforms are necessary. Reforms should encompass revenue generation, a more transparent and objective transfer system, coupled with clear spending responsibilities for local governments. Improved budgeting would also foster greater transparency and accountability. These reforms should be properly designed, prioritized, and phased in over time.
Current intergovernmental fiscal arrangements
Mauritius has a two-tier government system, comprising the central government and municipal councils (urban) and district councils (rural). Councils are governed by elected councilors and their main functions are the provision of local public goods.
The current process gives councils some autonomy for their recurrent budget. The councils in principle have to submit a balanced recurrent budget to the parent ministry for approval. However, councils often send their budget to the ministry with significant deficits and the final approved budget is then an iterative process. Capital budgets are dealt with separately on a case by case basis.
There is a significant divergence between the revenue raising powers of councils. Municipal councils have more revenue raising instruments than district councils and their tax base is broader as well. At the same time, some of the revenues that could accrue to the district councils are claimed by other government institutions or the central government. It also appears that councils are not fully aware as regard their own revenue raising powers.
The current revenue raising instruments are inadequate. For municipalities, the main source of own revenue is the property tax, but the tax yield is meager (about 10 percent of total revenues). Low tax yields reflect mainly administrative inadequacies tied to an outdated cadastre and valuations of property, and low collection efforts. Fees and permits raise little revenue, while generating considerable administrative and political costs. Additionally, several councils have revenue arrears, in part reflecting weak administrative and enforcement capacity.
Councils are heavily reliant on the central government, but the current Grant-In-Aid (GIA) formula is flawed. Almost 70 percent of council revenues come from GIA (Figure V.1). The current formula, however, suffers from three major flaws. First, it is linked to historical spending and thus benefits municipal councils that traditionally have had higher spending. Second, it ignores the revenue raising ability of councils. Municipal councils receive a larger share despite having greater revenue raising abilities. Third, the GIA does not provide incentives to mobilize own revenue.
Expenditure responsibilities are not clearly defined. There is significant overlap in the provision of services between councils and various ministries. Several welfare services for the youth and elderly are provided by both the councils and the related ministries. Similarly, there is an overlap as regard the maintenance of coastal areas.
1 Prepared by Vimal Thakoor (AFR).

MAURITIUS
INTERNATIONAL MONETARY FUND 57
Rising risks
The decision to split district councils and the government’s wage policy has exacerbated structural spending pressures. The administrative split has burdened councils with new overhead costs in a context of a relatively fixed resource envelope. Moreover, the recent wage increase at the central level was adopted by local governments, with the result that wage and pensions now account for 70 percent of spending (Figure V.2). This has crowded out other priority expenses, like capital investment and street maintenance. These spending pressures could be further exacerbated by longer-term spending needs associated with increasing pension obligations.
Rising expenditure and sticky revenues have contributed to a deterioration of the financial situation of local councils (Figures V.3 and V.4). All the councils had deficits in 2013, and most of them ran out of funds in the fourth quarter. Since councils have very limited borrowing capacities, some councils partly financed the overrun by dipping into previous savings, but all councils had recourse to the central government.
Figure V.1. Revenue Composition of Councils* Figure V.2. Expenditure Composition*
Figure V.3. Consolidated position of councils* Figure V.4. Financial situation by council*
Sources: Mauritian authorities; and Fund staff calculations. * Based on preliminary 2013 data.
Absent a coherent revenue mobilization strategy, councils have relied on ad-hoc low-yield measures. Councils have recently turned to permits and licenses to generate revenue. However, given the narrow base this represents, the revenue mobilized remains marginal and comes at a significant political and administrative cost. Other options being considered by councils—such as charging for services—have not received the approval of the parent ministry.
Balanced budget constraints have also increased the incentives for window dressing. For instance, some councils inflate spending in the budget proposed to the ministry to get an amount closer to their
68
10
7
75 2
1 0
GIA
General Rates
Fees
Rentals
Investment Income
Other Income
Permits
Taxes
618
2
2
8
1
17
Staff wages
Pensions
Other Admin
Transport
Contribution to Funds
Social and Cultural
Supplies & Services

MAURITIUS
58 INTERNATIONAL MONETARY FUND
needs. Some councils have used such a strategy in the past to run a surplus, which has been kept outside of the normal budget process. Secondly, some councils have re-prioritized their spending toward more immediate items at the expense of their pension contributions.
The current financial situation of local councils also pose health and safety risks. Taken in the context of a relatively rigid resource envelope, the rising spending pressures can impact on the ability of councils to deliver the basic services (road maintenance and refuse collection). With 70 percent of the budget directed towards personnel, the risk of crowding out priority service delivery is real. There are already large differences in the frequency with which some areas are serviced. Also, the maintenance of infrastructure is often postponed when the budget constraint becomes binding.
Reform options
Fundamental reforms are required for both revenues and spending, but a comprehensive strategy should be phased in gradually. Reforms need to be broad based to be effective and fair and should be phased in gradually to increase political acceptability. Some big-ticket items can deliver significant gains at low cost. To ensure these reforms gain political traction, a proper communication strategy focusing on the overall risks and the gains to be achieved needs to be articulated. Improving service delivery will also be a critical component in sustaining the success of a reform strategy.
The reforms also require improved coordination between the parent ministry and the councils. While the legal framework allows for councils to raise their own revenue, this is somewhat constrained by both the existing instruments and arrangements. Currently, councils are required to seek the approval of the minister before implementing any measure. To ensure a level playing field across councils, and increase the autonomy of councils, it would be useful to clarify which revenue raising instruments councils can use. Additionally, to limit tax competition, the ministry should consider setting the rates within bands. Councils operating within the defined bands should then not have to seek the approval of the ministry when using such instruments. This would also go a long way towards harmonizing the tax instruments across councils.
Revenue reforms
Reforming the GIA formula is an immediate priority, but the new formula should be phased in gradually. Ongoing efforts to revise the formula (with AFRITAC South support) should be accelerated with a view to fostering increased transparency and equalization. The first formula element aimed at program-based budgeting items should reflect actual service needs and increasing quality incentives. The other elements could be based on equalization criteria such as population, inverse of income per capita, spending needs or fiscal capacities. It will also be important to ensure that the change to the GIA does not adversely impact on the running of councils, particularly those that stand to lose from the implementation of the new formula.2
License and other fees should be revised on a yearly basis. Recent efforts to increase the trade fees have highlighted the risks of leaving rates unadjusted for an extended time period. In particular, notwithstanding the real decline in revenue over time, the rare increases seem steeper. To avoid such
2 To foster political buy-in, some countries have adopted a “hold-harmless clause,” by transforming the existing amount of the transfer into a lump-sum transfer fixed in nominal terms, based on data in the year preceding the reforms, but applying the new formula for future increases. This ensures that no entity would be made worse off.
MAURITIUS
INTERNATIONAL MONETARY FUND 59
situations, yearly revisions to the fees, for instance by linking them to inflation, would likely be more acceptable and efficient.
Local administrative and enforcement capacities should be strengthened. Low revenue mobilization is also a reflection of inadequate capacity for monitoring the tax base and revenue collections. Low tax compliance and increasing revenue arrears also reflect the limited enforcement.
Real estate taxes have significant potential for the medium term. Properly designed, real estate taxes can offer a stable and significant tax base. It is also fairer since it is generally based on the value of properties and can be designed so as minimize the impact on the poor. The forthcoming update of the local authorities’ valuation and information management system (LAVIMS) offers a good opportunity to reconsider real estate taxes. The design of such a tax should place particular emphasis on its structure, the tax base and objective exemptions criteria, while also scaling up administrative and enforcement capacities. Transition arrangements to the new taxes and collection arrangements could also be considered.
Expenditure reforms
The expenditure assignments of councils should be clarified to eliminate overlaps and improve program-based budgeting (PBB). As things stand, despite the PBB in place, the mandates of local councils is unclear due to the overlaps with other ministries. At the same time, this would also facilitate the allocation of funds through the GIA.
A benchmarking exercise across councils would be useful. Such an exercise should be undertaken at the earliest opportunity to create benchmarks and identify improvement needs for potentially inefficient councils. A staffing-need analysis should also be undertaken in view of the high share of spending devoted toward personnel. Most councils spend about 70 percent of their budget on personnel, compared to international benchmarks of 40-50 percent.
In the medium term, it is important to ensure that the pension obligations of councils are funded. It is imperative to address the nonpayment of pension obligations by local councils to contain contingent liabilities for the central government.
The above reforms need to be complemented with public financial management reforms and an overall strengthening of the budget process. To facilitate budget preparation, it would be useful if the overall envelope available to each council could be made available in advance. The budget classification across councils should be harmonized to facilitate monitoring and consolidation with the fiscal accounts. A standard template could be generated in this regard and legal provisions could be enacted to ensure reporting on a quarterly, half-yearly and yearly basis.

MAURITIUS
60 INTERNATIONAL MONETARY FUND
APPENDIX VI. CONSIDERATIONS FOR INTRODUCING AND EARNED INCOME TAX CREDIT IN MAURITIUS 1 Earned income tax credits (EITC) have been used to encourage labor participation and provide social assistance. EITC is a refundable personal income tax credit which provides a subsidy to earnings up to an income threshold. Variations of the system are used in the U.S., U.K., Australia, Finland, Ireland, Canada, New Zealand, Lithuania, Korea, etc. The EITC is the largest cash antipoverty program in the U.S. providing benefits of up to $6,000 per year to families with children in 2013. Low youth and female labor participation rates remain a challenge in Mauritius and there are gaps in the poorly targeted social safety net. It would appear that an EITC might play a role in addressing these problems. However, the costs and benefits of an EITC need to be assessed carefully and evaluated in the context of available fiscal space and overall social welfare reforms. Staff currently believes that it would be premature to introduce an EITC in Mauritius, but it could be considered as a longer-term option. Motivation for introducing an EITC in Mauritius
An EITC has two main objectives. It augments the income of the working poor and encourages labor force participation and employment, as only the working individuals are eligible. These two benefits could potentially help to address two persistent problems in Mauritius, namely the poorly targeted social safety net system, and low youth and female labor participation. The diagram below illustrates the typical design of the EITC, where the tax benefits vary with the income level.
Figure VI.1. A Typical EITC as a Function of Income
Mauritius’s poverty rate is low but income inequality has increased recently. The 2012 Household Budget Survey suggests that 9.4 percent of households were below the relative poverty line in 2012 (set at half the median monthly household income, Figure VI.2) up from 7.9 percent in 2006/07. Also, income inequality measured by the Gini coefficient increased from 0.388 in 2006/07 to 0.413 in 2012. Mauritius has a large but relatively inefficient social safety net system, and there is a scope for more targeted programs. The numerous programs are managed by different agencies, which results in high administrative overhead. The universal basic pension is the largest program (Figure VI.3) but is not
1 Prepared by Yuan Xiao (AFR).

MAURITIUS
INTERNATIONAL MONETARY FUND 61
targeted at all. The Social Aid Program is also poorly targeted with only one-third of the benefits going to households in the poorest decile, while the wealthier half of households also receive one-third.2
Figure VI.2. Income Distribution of Households Figure VI.3. Social Safety Spending
Low participation and high unemployment among the young and women are a salient character of Mauritius’s labor market. This is especially striking compared to OECD countries (see Figures IV.4 and IV.5). While policy measures targeting the employability of this population are important, a mechanism like EITC could also help encourage labor participation. Studies from other countries suggest that the size of the stimulating effect varies, so a careful assessment of the potential impact in the Mauritian context would be very important before implementing an EITC.
Figure VI.4. Mauritius: Unemployment Rates by Age and Gender
2 Based on the 2001/02 Household Budget Survey. See World Bank (2010), Mauritius: Social Protection Review and Strategy and David and Petri (2013), Inclusive Growth and the Incidence of Fiscal Policy in Mauritius, IMF WP.
0
2
4
6
8
10
12
14
16
Distribution (%) of households by income class, 2012 Household Budget Survey
Poverty lineMedian income
0.0
0.5
1.0
1.5
2.0
2.5
3.0
3.5
2010 2011 2012 2013
Social aid Income support
Other Basic Pension
Social Safty Net Spending (% of GDP)
0
2
4
6
8
10
12
14
16
18
19
92
19
93
19
94
19
95
19
96
19
97
19
98
19
99
20
00
20
01
20
02
20
03
20
04
20
05
20
06
20
07
20
08
20
09
20
10
20
11
Female, MUS Female, OECD
Male, MUS Male, OECD
Unemployment rate (age 15+)
0
5
10
15
20
25
30
35
40
2004 2005 2006 2007 2008 2009 2010 2011
Female, MUS Female, OECD
Male, MUS Male, OECD
Unemployment rate (age 15-24)

MAURITIUS
62 INTERNATIONAL MONETARY FUND
Costs of implementing EITC
Introducing an EITC would impose a significant administrative burden on the Mauritius Revenue Authority (MRA). The Mauritian tax system has been simplified over the years and the personal income tax has a low 15 percent flat rate. With high exemption thresholds above 275,000 Rs (US$9,000) per year, normally only some 150,000 persons (¼ of the formal work force) file annual tax returns. Introducing an EITC would require processing 400,000 new returns. While this could be mitigated by electronic filing (90 percent of individual taxpayers already file electronically), it would require significant training for the new taxpayers. The potential for noncompliance and fraud would also increase. Moreover, distributing welfare payments is not MRA’s strength and the resulting distractions might lead to revenue losses and less taxpayer satisfaction and compliance, which would be problematic. An EITC would have a high fiscal cost. The cost depends on the parameters and the objectives of the EITC. Four scenarios are simulated using data from the 2012 Household Budget Survey (Figures VI.6 and VI.7). For different cost envelopes, the Scenarios I and III favor employment participation by providing higher benefits as incomes rise (and therefore more hours worked), up to a threshold. Scenarios II and IV favor income augmentation by providing high initial subsidies to the working poor. With a cost of 0.3 percent of GDP, Scenario I could provide a maximum monthly support of about 1,000 Rs (US$33) per household, while a cost envelope of 0.5 percent of GDP would raise the maximum monthly credit to about 1,500 Rs (US$50) per household in Scenario II. These credits are not very large compared to the poverty threshold of about 9,000 Rs per month, so in practice the cost of EITC could be higher. The fiscal space for an EITC could be created in the context of broader social safety net reforms. Given the government’s fiscal consolidation plans to achieve its medium term public debt target, fiscal space for the EITC could be created by replacing other small and poorly targeted social welfare programs. Such a comprehensive reform of social safety nets would allow the government to achieve cost savings and improve poverty alleviation. For example, some estimates suggest that introducing income means-testing for the basic pension and targeting the 40 percent of poorest elders could save 1 percent of GDP. Broaden the tax base over the medium term could also provide the necessary fiscal space for a program like EITC.
Figure VI.5. EITC Scenarios I & II (0.3% GDP)
Figure VI.6. EITC Scenarios III & IV (0.5% GDP)
0.0
500.0
1000.0
1500.0
2000.0
2500.0
0
2
4
6
8
10
12
14
16
Scenarios I & II (cost = 0.3 percent of GDP)
Poverty line
Monthly credit, Scenario II(rhs)
Monthly credit, Scenario I (rhs)
0.0
500.0
1000.0
1500.0
2000.0
2500.0
0
2
4
6
8
10
12
14
16
Scenarios III & IV (cost = 0.5 percent of GDP)
Poverty line
Monthly credit, Scenario III (rhs)
Monthly credit, Scenario IV (rhs)

MAURITIUS
INTERNATIONAL MONETARY FUND 63
Key Design Considerations There are a number of factors to consider in designing an EITC, and in practice countries design their EITC systems to serve different objectives. There is no single rule for the parameters; the system can be more or less generous, and the design is dependent on the available fiscal space and the interaction with other policies. The parameters usually also evolve over time. What is the main objective of the EITC? If the main objective is to augment the income of the
working poor, the design would give more generous subsidies to the lower end of the income distribution. However, if the main objective is to stimulate labor participation, the design would target those workers above the minimum working hours so as to avoid disincentives to work.
Should EITC be provided to the self-employed? In principle, self-employed workers should be covered by the EITC on the ground of fairness. However, this could disproportionally increase the administrative costs and in some cases be difficult to implement and monitor.
Should there be an hour (or earnings) threshold? The U.S. EITC applies from the first dollar of earnings, while the U.K.’s Working Tax Credit (WTC) imposes a threshold of hours. The rationale for the hours threshold reflects the desired objective of stimulating labor market participation. However, an hour threshold incurs potentially significant additional administrative costs as hours information, which is normally not required for filing income tax, needs to be collected.
Are the overall social welfare, tax and labor market policies conducive to a successful EITC program? The U.S. EITC’s success is often attributed to (1) relatively low minimum wages, which results in lower cost for the same benefit coverage, (2) low social benefits (if other social welfare benefits are dependent on income, then incentives to work created by an EITC may be offset by reductions in other benefits caused by an increase in income), and (3) low tax rates (the higher are existing marginal tax rates, the more costly it is to impose high phase-out rates). On these aspects, Mauritius seems to have similar characteristics as the U.S.
Are there alternative or complimentary programs to EITC? For example, the government could pay the social security contribution of the low-income workers, thus augmenting their take-home income and provide an incentive to work. This could be a more cost-effective alternative because it utilizes the existing social security system. Introducing an economy-wide minimum wage, which has not existed in Mauritius previously, could provide similar income benefits to poor workers, but the impact on employment tends to be negative if the threshold is set too high.
Concluding remarks
On balance, while EITC is theoretically appealing it is likely not suitable for Mauritius at this stage. An EITC system could help alleviate poverty, especially for families with children, and provide greater incentives for unemployed youth and women to work without placing additional burden on employers. However, the current fiscal framework does not provide sufficient fiscal space for EITC. In addition, implementing EITC would incur significant administrative costs on the Mauritius Revenue Authority as only ¼ of personal income taxpayers are currently required to file tax returns through the streamlined personal income tax. EITC should only be considered as a longer-term option and only in the context of an overall review of the social safety net. Longer-term social safety net options and the potential role for EITC should be considered. Alternatives such as using the social security system to achieve some of the objectives associated with EITC should also be explored. Among other things, the government needs to
MAURITIUS
64 INTERNATIONAL MONETARY FUND
determine the main objectives of the EITC, and assess the sizes of the potential benefits, the administrative costs, and whether the medium term fiscal framework would allow sufficient fiscal space for it. Given the large cost of social spending in Mauritius and its relatively poor targeting, a reform of the social safety net is desirable, independent of the question of whether EITC would have a role in the new system.

MAURITIUS STAFF REPORT FOR THE 2014 ARTICLE IV CONSULTATION—INFORMATIONAL ANNEX Approved by David Robinson and Vivek Arora
Prepared by - The African Department
RELATIONS WITH THE FUND ____________________________________________________________ 2
THE JMAP BANK-FUND MATRIX (2014) ________________________________________________ 6
RELATIONS WITH THE AFRICAN DEVELOPMENT BANK GROUP ______________________ 9
STATISTICAL ISSUES ____________________________________________________________________ 10
CONTENTS
April 7, 2014
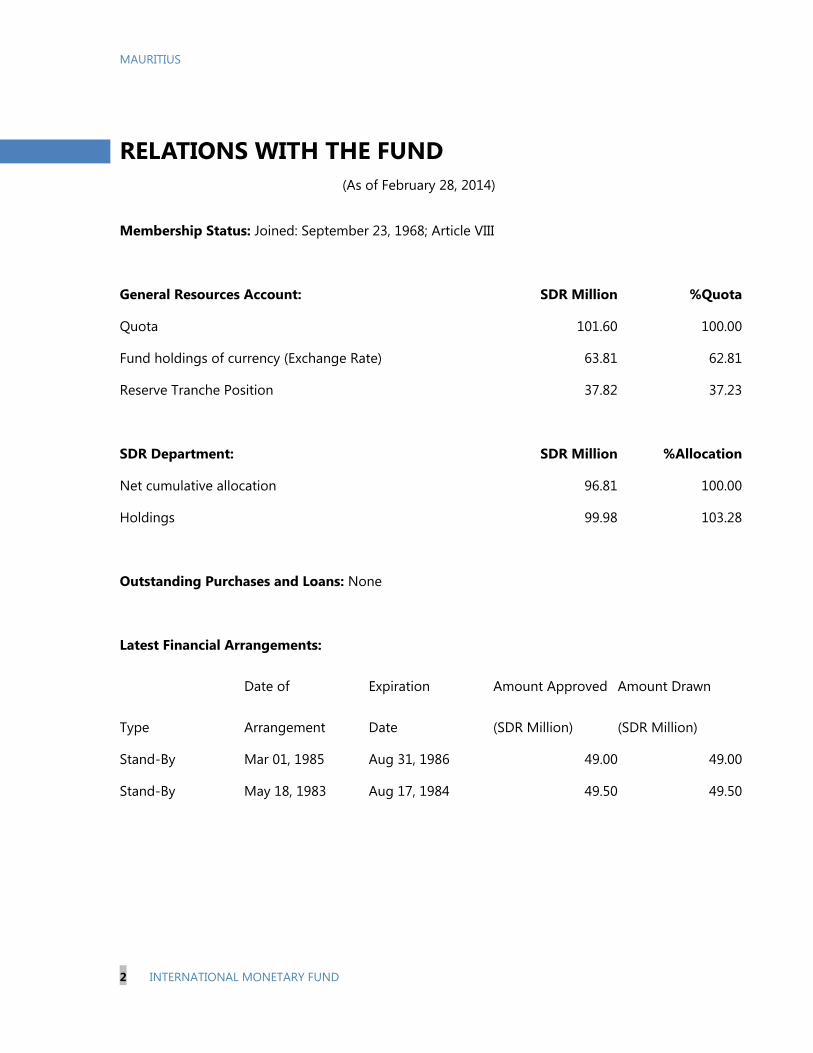
MAURITIUS
2 INTERNATIONAL MONETARY FUND
RELATIONS WITH THE FUND (As of February 28, 2014)
Membership Status: Joined: September 23, 1968; Article VIII
General Resources Account: SDR Million %Quota
Quota 101.60 100.00
Fund holdings of currency (Exchange Rate) 63.81 62.81
Reserve Tranche Position 37.82 37.23
SDR Department: SDR Million %Allocation
Net cumulative allocation 96.81 100.00
Holdings 99.98 103.28
Outstanding Purchases and Loans: None
Latest Financial Arrangements:
Date of Expiration Amount Approved Amount Drawn
Type Arrangement Date (SDR Million) (SDR Million)
Stand-By Mar 01, 1985 Aug 31, 1986 49.00 49.00
Stand-By May 18, 1983 Aug 17, 1984 49.50 49.50

MAURITIUS
INTERNATIONAL MONETARY FUND 3
Projected Payments to Fund 1/
(SDR Million; based on existing use of resources and present holdings of SDRs):
Forthcoming
2014 2015 2016 2017 2018
Principal
Charges/Interest
0.00 0.00 0.00 0.00 0.00
Total
0.00 0.00 0.00 0.00 0.00
1/ When a member has overdue financial obligations outstanding for more than three months, the amount of such arrears will be shown in this section.
Implementation of HIPC Initiative: Not Applicable
Implementation of Multilateral Debt Relief Initiative (MDRI): Not Applicable
Implementation of Post-Catastrophe Debt Relief (PCDR): Not Applicable
Exchange Rate Arrangement Starting in July 1, 2010, Mauritius intervened occasionally in the foreign exchange market to smooth excess volatility and the de facto exchange rate arrangement was reclassified from free floating to floating. Mauritius has accepted the obligations of Article VIII, Section 2, 3, and 4. It maintains an exchange system free of multiple currency practices and of restrictions on the making of payments and transfers for current international transactions. Mauritius also maintains a liberal capital account. On March 19, 2014, US$1 was equivalent to MUR 30.10. Article IV Consultation Mauritius is on the standard 12-month cycle. The last Article IV consultation staff report (Country Report No. 13/97, March, 2013) was completed by the Executive Board on April 3, 2013. A Financial System Stability Assessment update was completed by a joint IMF–World Bank team on April 20, 2007.

MAURITIUS
4 INTERNATIONAL MONETARY FUND
Technical Assistance (2005–2014) MFD mission on banking supervision during 2005: the first mission in January 2005, and the
second in March-April 2005. FAD mission on revenue administration and tax policy, January 2005. MFD mission on financial sector policy and strategy, January 2006. FAD mission on fiscal adjustment strategy and Poverty and Social Impact Analysis (PSIA),
February-March 2006. MFD mission on financial sector policy and strategy, July 2006. MFD mission on banking supervision/monetary operations/monetary policy, October 2006. STA mission on multisector statistics, November 2006. MCM mission on financial sector policy and strategy, January 2007. MCM primary mission on Financial Sector Assessment Program (FSAP), February 2007. FAD mission on Public Financial Management (PFM) and Medium-Term Expenditure Framework
(MTEF), March 2007. MCM mission on financial sector policy and strategy, March-April 2007. STA mission on balance of payments statistics, March 2007. MCM mission on foreign exchange markets, August 2007. STA balance of payments module mission, October 2007. STA mission on Phase II SDSS balance of payments statistics, October-November 2007. STA Report on the Observance of Standards and Codes (ROSC) mission, November-December
2007. FAD mission on Public Financial Management (PFM): Implementing Program-Based Budgeting:
Next Steps, February 2008. STA mission on national accounts statistics, February 2008. STA mission on Phase II SDSS Government Finance Statistics, March 2008. MCM mission on Central Bank-FSAP follow-up, March 2008 (2 missions). STA mission on Phase II SDSS Multisector Statistics, March-April 2008. STA mission on monetary and financial statistics, April 2008. STA mission on balance of payments statistics, May 2009. FAD mission on refining program budgeting and performance management, September 2009 STA mission on national accounts statistics, November 2009 STA mission on national accounts statistics, April 2010 STA mission on balance of payments statistics, July 2010 MCM mission on anti-money laundering (AML), August 2010 MCM mission on macroeconomic modeling, August/September 2010 FAD mission on refining program budgeting and performance management, September 2010 STA mission on international investment position, October 2010 FAD mission on PEFA, November 2010 STA mission on government finance statistics, January 2011 FAD mission on revenue administration, June 2011 LEG mission on AML/CFT, July 2011 STA mission on balance of payment statistics, September 2011 STA/DFID mission on external sector statistics, October 2011

MAURITIUS
INTERNATIONAL MONETARY FUND 5
MCM mission on macroeconomic modeling and forecasting, October 2011 MCM mission on technical assistance needs assessment, October 2011 LEG mission on AML/CFT, February 2012 LEG mission on central banking legislation, February 2012 AFRITAC South mission on updating the Finance & Audit Act (2008) and drafting revised
underlying financial regulations, February 2012. MCM multi-topic mission on financial sector reform, April/May 2012 AFRITAC South multi-topic mission on PFM Legal framework and developing a new PFM Act,
May/June 2012 AFRITAC South mission on Implementation of Basel III, September 2012 AFRITAC South mission on Fiscal Legal Framework, September 2012 STA mission on Balance of Payments Statistics and International Investment Position, November
2012 MCM mission on Liquidity and Debt management and Secondary Market Development,
December 2012 STA multi-sector statistics mission, January/February 2013 AFRITAC South multi-topic mission on revenue mobilization and on the finalization of the Tax
Administration Act, February/March 2013 MCM mission on Monetary Policy Implementation, May/June 2013 LEG mission on Monetary Policy Framework and Central Bank Act, June 2013 AFRITAC South mission for the Development of Public Finance Management Act, August 2013 AFRITAC South mission on Fiscal Law VAT/Tax Law Reform, August/September 2013 AFRITAC South mission on Fiscal Risks Related to Operation of SOEs, September 2013 STA External Statistics mission, September 2013 AFRITAC South mission on Grant in Aid Formula for Local Authorities, September/October 2013 MCM mission on Public Debt Management, December 2013 MCM mission on Inflation Forecasting and Modeling, January 2014 AFRITAC South mission on Customs Law, January/February 2014 MCM mission on Review of the Functioning of Supervisory College, February 2014 STA External Statistics mission, March 2014 MCM mission on Compliance with Basel II Capital Adequacy Framework, March 2014 STA Monetary and Financial Statistics mission, March/April 2014 Resident Representative: None.

MAURITIUS
6 INTERNATIONAL MONETARY FUND
THE JMAP BANK-FUND MATRIX (2014) (As of March 20, 2014)
The IMF and World Bank Mauritius teams met on January 22 to discuss a Joint Managerial Action Plan (JMAP). The team from the World Bank comprised of Mr. Muñoz (Country Representative), and Mr. Revilla (lead Economist and sector leader), and from the IMF of Messrs. Petri, Inui, Thakoor, Touna Mama and Xiao (all AFR). The IMF’s work program entails continued engagement through the Article IV consultation process as well as technical assistance in: public financial management, tax administration, and economic forecasting provided through AFRITAC South (AFS); financial sector stability, monetary policy frameworks, and central bank legislation through the Monetary and Capital Markets Department (MCM) and Legal (LEG) Departments, and enhancements to macroeconomic statistics with the support of the Statistics Department (STA). The World Bank Group’s work program entails continuing work on infrastructure, competitiveness, public sector reform and social sectors. The World Bank Country Partnership Strategy for Mauritius up to 2015 aims at helping the Government to deal with (i) short-term trade shocks and (ii) the transition to a more competitive and diversified economy, while minimizing negative social impacts along the transition. On-going and planned Bank assistance to Mauritius is: Infrastructure. The Mauritius Infrastructure Project signed in December 2009 seeks to
support the government investment program in transport, water and electricity.
Preparation of a Grid Code, Feed-in-Tariffs & Model Energy Supply Purchase Agreements for Renewable Energy Systems Greater than 50kW through a SIDS DOCK Grant will seek to promote investment in renewable energy infrastructure, contribute to energy security, reduce GHG emissions, and encourage household-private sector investment in renewable energy technologies.
Policy Reforms. The Bank is expected to approve in 2014 a new DPL series. Building on the reforms supported by the previous programmatic DPL series, the proposed operation advances the competitiveness agenda through reforms to (i) improve the efficiency and impact of public services aimed at private sector business development, (ii) underpin the access, stability, and integrity of the financial system, and (iii) support transition to a knowledge-based, entrepreneurial economy.
Analytical support. The Bank is preparing a report on poverty and income disparity to analyze the impact that recent economic growth has had in income distribution in the country. Technical assistance provided as part of the preparation of the DPL series will

MAURITIUS
INTERNATIONAL MONETARY FUND 7
aim to improve competitiveness and economic diversification in areas of higher value added such as ICT and financial services.
Strengthening Public Sector Performance. The Strengthening Governance and Anti-Corruption in Mauritius technical assistance will aim at strengthening governance and anti-corruption in Mauritius through support to performance management, M&E and institutional strengthening across the public sector, with a focus on strengthening M&E at the MoFED.
Preparation of a Systematic Country Diagnostic (SCD). As part of the preparation of the upcoming strategy of the Bank with Mauritius, the new Country Partnership Framework foresees the preparation of a SCD. This diagnosis exercise will be prepared by WBG staff in close consultation with national authorities and other stakeholders.
International Finance Corporation (IFC). The IFC has focused its intervention in Mauritius in the financial services sector along three axes: (i) supporting the banking sector with access to long term funding to offset local banks’ difficulty in accessing long term foreign exchange to support trade finance, cross-border south–south initiatives and long term investments in key infrastructure; (2) investing in regional private equity funds to increase regional integration with investments mainly along the Madagascar-Mauritius axis; and, (3) supporting IFC clients to improve internal capacity by providing specialist training to bank’s SME loan officers and SME-Owner managers to improve financial and managerial literacy.
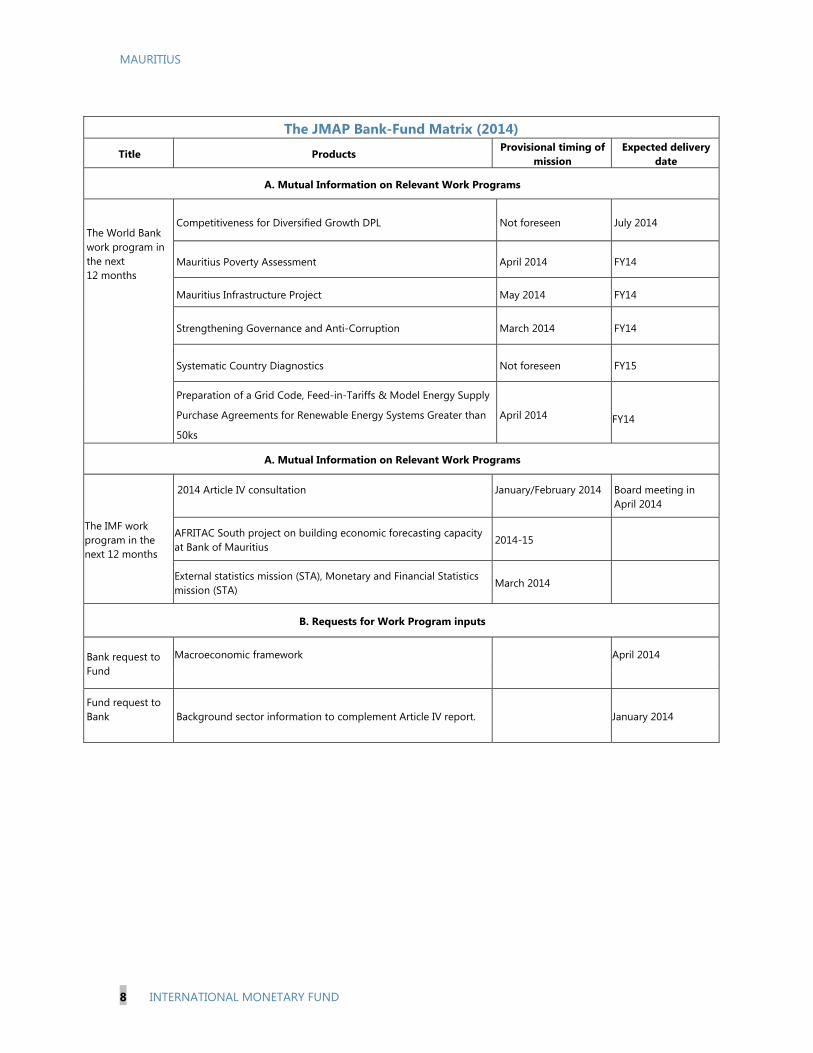
MAURITIUS
8 INTERNATIONAL MONETARY FUND
The JMAP Bank-Fund Matrix (2014)
Title Products Provisional timing of
mission Expected delivery
date
A. Mutual Information on Relevant Work Programs
The World Bank work program in the next 12 months
Competitiveness for Diversified Growth DPL Not foreseen July 2014
Mauritius Poverty Assessment April 2014 FY14
Mauritius Infrastructure Project May 2014 FY14
Strengthening Governance and Anti-Corruption March 2014 FY14
Systematic Country Diagnostics Not foreseen FY15
Preparation of a Grid Code, Feed-in-Tariffs & Model Energy Supply
Purchase Agreements for Renewable Energy Systems Greater than
50ks
April 2014 FY14
A. Mutual Information on Relevant Work Programs
The IMF work program in the next 12 months
2014 Article IV consultation
January/February 2014
Board meeting in April 2014
AFRITAC South project on building economic forecasting capacity at Bank of Mauritius
2014-15
External statistics mission (STA), Monetary and Financial Statistics mission (STA)
March 2014
B. Requests for Work Program inputs
Bank request to Fund
Macroeconomic framework
April 2014
Fund request to Bank
Background sector information to complement Article IV report. January 2014

MAURITIUS
INTERNATIONAL MONETARY FUND 9
RELATIONS WITH THE AFRICAN DEVELOPMENT BANK GROUP
(As of March 24, 2014)
The African Development Bank (AfDB)’s 2014–2018 Country Strategy Paper (CSP) for Mauritius will provide the framework for its partnership with the country in the given period. The objective of this CSP is to help Mauritius build its competitiveness and resilience to exogenous shocks so as to enhance the quality of growth and accelerate the country’s transition to a High Income Country. In line with the Bank Group’s Strategy for 2013-22, this CSP focuses on interventions that promote ‘green’ and ‘inclusive’ growth. It is designed to explore new ways of doing business in Mauritius by focusing Bank support on deepening technical and knowledge advisory services and catalyzing private investments to drive growth and create jobs. The CSP seeks to support interventions in Mauritius under two complementary pillars - Pillar I: Building Infrastructure and Public Private Partnerships (PPPs) and Pillar II: Deepening Skills and Technology Development. Within the first pillar, the lending program focuses on infrastructure development particularly energy, transport, and water and sanitation. Within the framework of a customized presence, the Bank’s Infrastructure Investment Specialist will be resident in Mauritius to provide technical advisory services and strengthen the Government of Mauritius’ capacity to structure PPPs. The interventions are designed to inform policy dialogue and provide green and inclusive infrastructure investment options to the government. The lending program within the second pillar will support actions and policy reforms that will contribute to improving the quality and relevance of education particularly higher education and Technical, Vocational, Education and Training (TVET) and strengthen human capital. The Bank will also use this pillar as a platform to facilitate skills and technology transfer to mainland Africa in areas where the country enjoys competitive advantage such as financial services and governance. To further support policy reforms, capacity building and studies in specific areas within the framework of the two strategic pillars, the Bank will be providing grants from its Middle Income Countries Technical Assistance Fund (MIC TAF). The grants will be used to fund the following activities: (i) study to inform multi-modal climate resilient transport solutions; (ii) study on land-use planning and environmental threats; and (iii) baseline study on e-education and adaptive learning. The Bank will continue to collaborate very closely with other development partners including the World Bank, EU, AFD and UNDP in supporting structural reforms through its policy based lending. The Government of Mauritius acknowledges the important role the Bank is playing in Mauritius. In particular the Bank’s approval to extend the Competitiveness and Public Sector Efficiency loan and providing the Infrastructure Investment Specialist to play an advisory role on PPPs is a timely support to the Government’s US$10 billion infrastructure program. A mid-term review of the CSP is programmed for 2016 to review progress and assess continued relevance of the Bank’s strategic orientation.

MAURITIUS
10 INTERNATIONAL MONETARY FUND
STATISTICAL ISSUES
Statistical Issues Appendix As of March 12, 2014
I. Assessment of Data Adequacy for Surveillance
General: Data provision is adequate for surveillance. However, balance of payments (BOP) and international investment position (IIP) statistics could be further improved. The authorities are aware of this situation and are continuing work in this regard.
Balance of Payments and International Investment Position Statistics: The authorities are in the process of reinforcing the statistical framework. Already, there were significant improvements in reducing the errors and omissions category in the BOP statistics.
II. Data Standards and Quality
Participant in the GDDS since September 2000, Mauritius subscribed to Special Data Dissemination Standard (SDDS) on February 28, 2012. Mauritius is the second Sub-Saharan African country to subscribe to the SDDS.
A data ROSC report was published in August 2008.

MAURITIUS 2012 ARTICLE IV REPORT—INFORMATIONAL ANNEX
IN
TERNATIO
NAL M
ON
ETARY FUN
D 11
MAU
RITIUS
Mauritius: Table of Common Indicators Required for Surveillance March 12, 2014
Date of latest observation
Date received
Frequency of data7
Frequency of reporting7
Frequency of publication7
Memo Items: Data Quality-Methodological soundness 8
Data Quality-Accuracy and
reliability9
Exchange Rates March 2014 03/2014 D D D
International Reserve Assets and Reserve Liabilities of the Monetary Authorities1
January 2014 03/2014 M M M
Reserve/Base Money January 2014 03/2014 M M M
O, LO, LO, LO O, O, O, O, LO Broad Money January 2014 03/2014 M M M
Central Bank Balance Sheet January 2014 03/2014 M M M
Consolidated Balance Sheet of the Banking System
January 2014 03/2014 M M M
Interest Rates2 January 2014 03/2014 M M M
Consumer Price Index January 2014 02/2014 M M M O, LO, O, O O, O, O, O, O
Revenue, Expenditure, Balance and Composition of Financing3 – General Government4
Q4/2013 02/2014 Q Q Q
LO, O, O, O LO, O, O, O, NO
Revenue, Expenditure, Balance and Composition of Financing3– Central Government
Q4/2013 02/2014 Q Q Q
Stocks of Central Government and Central Government-Guaranteed Debt5
Q4/2013 02/2014 Q Q Q

12 IN
TERNATIO
NAL M
ON
ETARY FUN
D
MAU
RITIUS
Mauritius: Table of Common Indicators Required for Surveillance March 12, 2014 (concluded)
Date of latest observation
Date received
Frequency of data7
Frequency of reporting7
Frequency of publication7
Memo Items: Data Quality-Methodological soundness 8
Data Quality-Accuracy and reliability9
Exports and Imports of Goods and Services
Q3/2013 01/2014 Q Q Q
External Current Account Balance
Q3/2013 01/2014 Q Q Q O, LO, LO, LO LNO, LNO, LO, LO, NO
GDP/GNP Q3/2013 02/2014 Q Q Q O, LO, O, LO LO, O, LNO, LO, O
Gross External Debt Q4/2013 02/2014 Q Q Q
International Investment Position6
Q3/2013 02/2014 Q Q Q
1 Any reserve assets that are pledged of otherwise encumbered should be specified separately. Also, data should comprise short-term liabilities linked to a foreign currency but settled
by other means as well as the notional values of financial derivatives to pay and to receive foreign currency, including those linked to a foreign currency but settled by other means.
2 Both market-based and officially determined, including discount rates, money market rates, rates on treasury bills, notes, and bonds.
3 Foreign, domestic bank, and domestic nonbank financing.
4 The general government consists of the central government (budgetary funds, extra budgetary funds, and social security funds) and state and local governments.
5 Including currency and maturity composition.
6 Includes external gross financial asset and liability positions vis-à-vis nonresidents.
7 Daily (D); Weekly (W); Monthly (M); Quarterly (Q); Annually (A); Irregular (I); Not Available (NA).
8 Reflects the assessment provided in the data ROSC published in August, 2008, and based on the findings of the mission that took place during November 29–December 7, 2007 for
the dataset corresponding to the variables in each row. The assessment indicates whether international standards concerning concepts and definitions, scope,
classification/sectorization, and basis for recording are fully observed (O), largely observed (LO), largely not observed (LNO), or not observed (NO).
9 Same as footnote 8, except referring to international standards concerning source data, assessment and validation of source data, statistical techniques, assessment and validation of
intermediate data and statistical outputs, and revision studies.

Press Release No. 14/176 FOR IMMEDIATE RELEASE April 23, 2014
IMF Executive Board Concludes 2014 Article IV Consultation with Mauritius On April, 21, 2014, the Executive Board of the International Monetary Fund (IMF) concluded the Article IV consultation1 with Mauritius. A stable macroeconomic environment was maintained in 2013, despite difficult external developments. Real GDP growth was lower than expected at 3.2 percent in 2013, mainly on account of construction, sugar and tourism. With subdued international prices, inflationary pressures declined in 2013, despite the public sector wage increases, and year-on-year inflation fell to 3.5 percent. The unemployment rate was unchanged compared to 2012 at 8.0 percent. Credit to private sector growth remained robust. On the external front, the current account deficit widened to almost 10 percent of GDP in 2013. The reserve cover of imports of goods and services stayed constant at 4½ months with the Bank of Mauritius (BOM) accumulating additional net international reserves. The fiscal policy stance was more expansionary than planned because of cyclical and one-off factors but also slippages. The structural primary deficit was broadly unchanged relative to 2011. The overall deficit including extra-budgetary funds is estimated at 4½ percent of GDP. While revenues remained broadly unchanged in proportion of GDP, expenditures increased by over 2 percent of GDP. As expected wages increased following the Pay Research Bureau’s (PRB) report, which increases civil servant salaries beyond annual inflation adjustments periodically with the next adjustment expected in 2016. Additional spending was also related to the flash floods in Port Louis as well as unplanned transfers to local governments and public enterprises. Finally, capital spending including by the special funds was 1 percent of GDP higher, though partially due to cost overruns. Monetary policy was somewhat accommodative. Throughout the year, while a sluggish domestic demand and low international inflationary pressures helped anchor inflation
1 Under Article IV of the IMF's Articles of Agreement, the IMF holds bilateral discussions with members, usually every year. A staff team visits the country, collects economic and financial information, and discusses with officials the country's economic developments and policies. On return to headquarters, the staff prepares a report, which forms the basis for discussion by the Executive Board.
International Monetary Fund 700 19th Street, NW Washington, D. C. 20431 USA

2
expectations. The public sector wage increase related to the PRB report did not lead to strong private sector wage pressures. In this context, the BOM maintained the policy rate at 4.65 percent in September 2013 and February 2014, following a 25 basis point reduction in June 2013. In October 2013, reserve requirements were raised from 7 to 8 percent to curb excess liquidity in the banking system. The authorities continued building international reserves and used limited interventions to moderate excessive fluctuations of the rupee. The banking system remained well-capitalized and resilient in a strong regulatory context. Regulatory Tier I capital to risk-weighted assets are well above Basel II and the proposed Basel III requirements. Non-performing loans (NPL) increased slightly in 2013, but banks remained profitable with a 20 percent return on equity, despite low leverage ratios. However, liquidity ratios have worsened in recent years and are on the low side in international comparisons. BOM is consulting with banks on implementation of Basel III regulations and continued to publish its bi-annual CAMEL ratings for all domestic banks. It implemented macroprudential measures aimed at addressing emerging NPLs in the construction and real estate sectors as well as rising indebtedness. Threats to financial stability posed by a Ponzi-like scheme in 2013 were contained successfully, and the regulatory framework was subsequently improved. Mauritius has established a track record as a reformer with strong institutions and a dynamic private sector. The Africa Training Institute (ATI) is set to open in June 2014 in Ebene. The country statistical capacity continues to be strengthened, including ongoing work on Monetary and Financial Statistics (MFS) as well as balance of payments (BOP) and international investment position (IIP) statistics. Mauritius subscribed to the IMF’s Special Data Dissemination Standard (SDDS) in February 2012, being the second Sub-Saharan African country to do so and is working on subscribing to SDDS Plus. Executive Board Assessment2 Executive Directors agreed with the thrust of the staff appraisal. They noted that Mauritius’ prudent policies and strong institutions have delivered steady growth, well-anchored inflation expectations, and continued financial stability. The near-term growth outlook is generally favorable, but an uncertain external environment carries risks. Against this background, Directors encouraged the authorities to consolidate recent macroeconomic gains, strengthen policy buffers, and pursue greater economic diversification through structural reforms to enhance the resilience of the economy.
Directors generally considered it appropriate to start tightening fiscal policy this year to smooth adjustment and increase the likelihood that the 50 percent target for the debt-to-GDP
2 At the conclusion of the discussion, the Managing Director, as Chairman of the Board, summarizes the views of Executive Directors, and this summary is transmitted to the country's authorities. An explanation of any qualifiers used in summings up can be found here: http://www.imf.org/external/np/sec/misc/qualifiers.htm.

3
ratio is achieved by 2018, as mandated by law. They encouraged the authorities to articulate an ambitious consolidation strategy centered on better prioritizing public expenditure, strengthening tax administration, and broadening the tax base. Subsidy reforms and an overhaul of public enterprises, as well as an improved framework for fiscal devolution, including a better use of real estate taxes, could also underpin the budgetary adjustment over the medium term.
Directors agreed that the current monetary stance is broadly appropriate, but cautioned that a withdrawal of accommodation might be necessary if inflationary pressures intensify. They also suggested strengthening the institutional and operational arrangements that would support the eventual adoption of a formal inflation targeting framework.
Directors noted that the banking system remains well-capitalized, profitable, and resilient to shocks. They observed, however, that persistent excess liquidity in the banking system has hindered the monetary transmission mechanism, while also encouraging disintermediation and riskier lending. To address this issue, Directors encouraged the authorities to consider an approach to liquidity management involving additional issuance of government paper for monetary policy purposes and—more broadly—closer collaboration between the government and the central bank. Similarly, coordination between the central bank and the nonbank supervisor should continue to be strengthened to ensure the soundness of the overall financial system.
Directors took note of the staff’s assessment that the rupee appears to be modestly overvalued in real effective terms. To bolster Mauritius’s international competitiveness and durably reduce the large structural current account deficit, they recommended greater exchange rate flexibility, well-prioritized infrastructure investment, and stepped-up reforms to address labor and product markets rigidities. Directors also agreed that the external adjustment could benefit from further pension reforms that would boost national savings while strengthening social protection.
Directors welcomed the authorities’ intention to adopt the Fund’s SDDS Plus, and supported ongoing efforts to improve the collection of financial and labor market statistics.

4
Mauritius: Selected Economic and Financial Indicators, 2011–14
2011 2012 2013 2014
Est. Proj. National income, prices and employment Real GDP 3.8 3.3 3.2 3.7 Real GDP per capita 3.4 2.7 2.6 3.2 GDP per capita (in U.S. dollars) 8,730 8,835 9,160 9,661 GDP deflator 4.1 3.1 3.3 3.7 Consumer prices (period average) 6.5 3.9 3.5 3.9 Consumer prices (end of period) 4.9 3.2 3.5 4.5 Unemployment rate (percent) 7.9 8.0 8.0 …
(Annual percent change, in US Dollars) External sector Exports of goods and services, f.o.b. 17.9 3.8 3.7 6.0
Of which: tourism receipts 16.1 -0.8 -10.6 8.2 Imports of goods and services, f.o.b. 20.6 2.2 3.9 7.2 Nominal effective exchange rate (annual averages) 3.3 0.5 -1.3 ... Real effective exchange rate (annual averages) 6.2 1.4 -0.4 ... Terms of trade -5.7 0.3 0.6 ...
(Annual change in percent of beginning of period M2) Money and credit Net foreign assets -8.2 9.1 -2.8 8.3 Domestic credit 10.8 15.6 16.5 9.5
Net claims on government 0.1 -1.1 2.3 1.0 Credit to non-government sector 1 10.8 16.1 14.3 11.1
Broad money (end of period, annual percentage change) 6.4 8.2 5.8 7.8
Income velocity of broad money 1.0 1.0 1.0 1.0
Interest rate (weighted average T-Bills, primary auctions) 4.6 3.3 ... ... (Percent of GDP, unless otherwise indicated)
Central government finances Overall consolidated balance (including grants) 2 -2.5 -2.1 -4.5 -4.5 Primary balance (including grants) 0.5 0.9 -1.9 -1.7 Structural primary balance (including grants) 0.4 0.9 -1.8 -1.6 Structural primary balance (excluding grants) -0.3 0.2 -2.2 -2.2 Revenues and grants 21.4 21.4 21.4 21.8 Expenditure, excluding net lending 23.9 23.6 25.9 26.2 Domestic debt of central government 42.6 41.0 41.0 39.4
External debt of central government 9.5 10.4 12.8 14.0
Investment and saving
Gross domestic investment 26.0 24.8 23.2 23.2 Public 5.5 5.5 5.0 4.1 Private 20.4 19.2 18.2 19.1
Gross national savings 12.7 17.1 14.0 13.0 Public -0.5 1.0 -0.5 0.0 Private 13.3 16.1 14.5 13.0
External sector Balance of goods and services -13.8 -13.1 -13.1 -13.9
Exports of goods and services, f.o.b. 51.8 52.9 52.6 52.6 Imports of goods and services, f.o.b. -65.6 -65.9 -65.7 -66.5
Current account balance -13.3 -7.9 -9.9 -8.7 Overall balance 1.6 1.8 4.5 2.9 Total external debt 3 85.1 89.3 91.6 93.1 Net international reserves (millions of U.S. dollars) 2,631 2,851 3,112 3,481
Months of imports of goods and services, f.o.b. 4.2 4.4 4.4 4.8 Memorandum items: GDP at current market prices (billions of Mauritian rupees) 323.0 344.0 366.4 394.2 GDP at current market prices (millions of U.S. dollars) 11,251 11,447 11,930 12,651 Public sector debt (percent of GDP) 58.6 57.9 60.0 59.1
Public sector debt (for debt law ceiling purpose) 4 54.3 53.1 55.1 54.6
Foreign and local currency long-term debt rating (Moody's) Baa2 Baa1 Baa1 …
Sources: Mauritian authorities; and IMF staff estimates and projections. 1 Includes credit to parastatals. 2 GFSM 2001 concept of net lending/net borrowing; includes special and other extra budgetary funds. 3 Numbers were revised to include debts of deposit taking institutions and SDR allocation in 2009. 4 For the purposes of calculating the public debt ceiling, the 2008 Public Debt Management Act allows for the discounting of certain types of state-owned enterprise debt.

Statement by Mr. Kossi Assimaidou, Executive Director for Mauritius
April 21, 2014 On behalf of my Mauritian authorities, I would like to express their appreciation to the staff for the constructive and engaging dialogue during the conduct of the 2014 Article IV Consultation. The staff report provides an insightful analysis of the economy and helpful advice, focused on policies to preserve macroeconomic stability and keep advancing towards higher and sustainable growth. My authorities would also like to express their gratitude to Management and staff for the high quality of technical assistance provided. This has been crucial in the development of the appropriate economic and financial policies and their implementation. The technical assistance provided, over the years, has been instrumental in the economic progress achieved.
The Mauritian economy continued to perform moderately well in 2013, with a broadly appropriate policy mix. Real GDP grew at 3.1 percent, as growth slowed down in the construction, tourism, and information technology sectors. Inflation remained low at about 3.5 percent, in spite of the public sector wage increases. The trade account improved but the current account deficit increased due to decline in service exports, mainly income from the Global Business Companies (GBC) transactions. The nominal exchange rate of the Mauritian rupee remained broadly stable and the central bank continued to build international reserves buffers.
Fiscal policy was slightly more expansionary than planned, due mainly to lower tax revenue and unexpected outlays related to the early 2013 floods. Capital expenditure was also higher than budgeted due to cost overruns. As a result the fiscal deficit and the public debt ratio increased.
Monetary policy was appropriately accommodative. Inflation declined compared to the previous year. However, an important concern of the authorities was the excess liquidity in the economy. The Bank of Mauritius increased reserve requirements twice last year in its efforts to remove excess liquidity. Presently, this excess liquidity is not putting pressure on prices as the output gap is negative and there is little demand for domestic credit. However, the situation does raise concerns as it is contributing to financial disintermediation and banks are not encouraging new deposits as they become more costly for them. The low interest rates and the excess liquidity are causing an increase in riskier lending, particularly in some segments of real estate. In this regard, the Bank of Mauritius issued guidelines to contain the expansion of loans toward the real estate sector and the increase in household debt. Notwithstanding these developments, the banking system remains strong and profitable. Banks are well capitalized, well above the Regulatory Tier I capital to risk-weighted assets of Basel II and Basel III, and non-performing loans remain low.
Structural reforms were pursued. Measures that were budgeted have been implemented. They are mostly in the transportation and water sectors with the aim to remove infrastructure bottlenecks and improve productivity.

2
Economic Outlook for 2014 and the Medium-Term
Policies going forward will continue to focus on raising economic growth with the objective of reaching high income status within a decade. Efforts will focus on reducing external imbalances through, among others, fiscal consolidation and reforms to remove infrastructure bottlenecks and improve productivity. Prudent investments in physical and human capital should help raise total factor productivity, in spite of a zero population growth. The authorities are of the view that their policies of encouraging economic diversification, supporting domestic demand, and attracting foreign investors will result in a higher growth rate than projected by staff. In this regard, they would note their successful efforts at diversifying their tourist markets towards Africa and Asia, and also diversifying the financial service sectors, especially the GBCs towards Africa. Together with the further development of the maritime sector (seafood, transshipment, ships registration, etc), and the expected recovery in their traditional export markets, the authorities expect real GDP growth to strengthen over the medium term.
Fiscal Sector
The 2014 fiscal deficit is projected to be about the same as the previous year. New measures like excise on cars and tobacco should help raise revenue. Current expenditure is not expected to increase. However, total spending will increase as the authorities expand capital spending, mainly investment spending in public infrastructure, strengthen social safety nets, and foster the activities of the emerging sectors of the economy. More broadly, given the weak economic activity in the country’s main trading partners, the authorities are of the view that their policies, without being too expansionary, will help support economic growth and employment.
Over the medium term, the authorities intend to pursue policies aimed at fiscal consolidation in order to reduce external imbalances, and meet the debt target. However, in trying to reduce the fiscal deficit, the authorities prefer to focus their adjustment efforts on expenditure containment rather than revenue-increasing measures. They view the present tax system that has been put in place over a number of years as being simple and broadly efficient and one that attracts investors. However, they agree that the revenue system can be improved, and in that context are planning to harmonize the customs and excise taxes with Fund TA. They are also requesting Fund TA to develop and implement a system of real estate tax. They have taken good note of the recommendations of staff regarding better targeting of social assistance, and subsidies, and improving the financial performance of state-owned-enterprises (SOEs) and local governments. As regards the latter the authorities have greatly appreciated the presentation of staff during the Article IV Consultation. At the same time, the authorities view with appreciation the work done by staff on pension. Many of the recommendations of staff are under consideration and the technical work to prepare the ground work for future reforms has started.
The debt outlook remains positive. The results of the debt sustainability analysis indicate that public debt is sustainable over the medium term. The debt ratio has been on a declining trend since 2003, but the stimulus implemented to counter the adverse effects of the global financial crisis and the slowdown in economic growth have caused the debt ratio to
3
increase slightly. The authorities remain fully committed to the objective of bringing the debt ratio down to 50 percent of GDP, and are confident that they will be able to reach this objective with further fiscal consolidation over the medium term. Moreover, a strengthening of real GDP going forward, based on both domestic measures, including public sector investment, and better growth in trade partners will also contribute to a lowering of the debt ratio.
The authorities are committed to reducing its involvement in State Owned Enterprises (SOEs). The Mauritian authorities share the view of staff that a strengthening of the financing of SOEs can both reduce government expenditure and ensure that the debt target is met. In this regard, they have already started work on strengthening the financial framework of the SOEs. A public sector governance office has been set up. It is responsible, among others, to review the performance of the SOEs and to propose restructuring plans, including privatization. In this regard, it is to be noted that the Development Bank of Mauritius (DBM) is already being privatized. A system of Key Performance Indicators (KPI) has been set up and is being monitored by the EU, under its budgetary support. The aim eventually is for the private sector to become majority share owners of these enterprises and for the government to use the proceeds from the sale to further reduce the public debt.
Monetary and Financial Sectors
The Bank of Mauritius will pursue its prudent monetary policy aimed at maintaining price stability and orderly and balanced economic development. It will continue to monitor external and domestic price developments closely and will tighten monetary conditions, if the situation warrants it. The current “hybrid inflation targeting” framework is serving Mauritius well and has helped to bring inflation down. It remains the intention of the authorities to move to a full inflation targeting framework in the future.
The authorities are giving their full attention to the excess liquidity issue in the economy. Over the past few weeks, representatives of the Bank of Mauritius and the Ministry of Finance have met regularly to discuss the best ways to address the issue and the modalities of a cost-sharing mechanism, as suggested by staff. In the meantime, both parties have come to an agreement as to what level of excess liquidity could adversely affect the economy. The Bank of Mauritius increased the reserve ratio for banks in March. The Ministry of Finance has for its part decided to frontload its borrowing requirement for this year, and to sell Treasury notes directly to the public and bear the associated costs. Moreover, it has cancelled a substantial contingency loan from the African Development Bank. The central bank is monitoring the situation carefully and future actions will be taken promptly, as necessary.
The banking system remains strong. It is well capitalized and, as staff note, it is resilient against a number of shocks according to stress tests. Nevertheless, additional macro-prudential measures have been introduced to address possible vulnerabilities in the banking sector. The central bank is continuing its work on a deposit insurance scheme (DIS). A draft DIS Bill has been prepared after consultation with stakeholders, but will be strengthened with further technical assistance from the Fund and World Bank before its presentation to parliament. Moreover, in view of recent weaknesses that have appeared in the regulatory

4
framework of the non-bank financial sector, the Bank of Mauritius is strengthening its coordination with the non bank financial supervisory institution, the Financial Services Commission (FSC), to address those issues. Although there are important links between the global business and onshore sectors, through notably job creation and provisions of services, the contribution of the global business sector to the Mauritian economy is rather small and is not a risk to the economy. Nevertheless, as the sector expands, the risks associated with their activity could increase, and the authorities are taking steps to strengthen the statistical coverage of the Global Business Companies (GBCs) and the regulatory framework.
In conclusion, while the economy is performing rather well, the authorities are well aware of the challenges and risks to the outlook. They are in broad agreement with the staff’s assessment and with the policy recommendations. They will continue to monitor closely developments, both external and domestic, and will continue to implement reform measures aimed at achieving a higher level of inclusive growth in an environment of macroeconomic stability. In this regard, the authorities are working closely with the private sector to develop a “blueprint” for the next six years to accelerate economic growth and enable the country to reach high income status.