2014 annual report. our national impact our 2015 local impact 2,864 total youth served 560 119,544...
TRANSCRIPT

2014 Annual Report


OUR NATIONAL IMPACT

OUR 2015 LOCAL IMPACT
2,864 Total Youth Served
560
119,54415

Chartered Units
Stand-Alone Sites• Oakwood• Westview Terrace• Southside Gardens• Lowell Community Center• Elyria Community Center• Wilkes Villa Teen Center• Oberlin
School Sites• Lorain High School• Annex Middle School• General Johnnie Wilson• Longfellow Middle School• Admiral King Elementary• Frank Jacinto Elementary• Larkmoor Elementary
We Are Programming at 2 Additional Lorain Elementary Schools
• Garfield Elementary
• Washington Elementary

Membership: By Gender
2013 Total Members:1787
Girls: 876
Boys: 911
2014Total Members: 2247
Girls: 1077
Boys: 1170

2014 Member Demographics

Ethnicity # of Youth % of Total
American Indian/Alaska Native 3 0.13%
Asian 8 0.36%
Black or African American 942 41.92%
Hispanic or Latino 555 24.70%
Native Hawaiian or Pacific Islander 0 0.00%
White 369 16.42%
Other 24 1.07%
Multi-Racial 260 11.57%
Don't Know 26 1.16%
Member Ethnicity Breakdown

Member Breakdown: Age
• 5 Years and Under: 39• 6 Year Olds: 133• 7 Year Olds: 136• 8 Year Olds: 197• 9 Year Olds: 210• 10 Year Olds: 192• 11 Year Olds: 196• 12 Year Olds: 179
• 13 Year Olds: 119• 14 Year Olds: 233• 15 Year Olds: 193• 16 Year Olds: 135• 17 Year Olds: 68• 18 Year Olds: 45• 19 Year Olds: 23• 20 Year Olds: 3

NYOI Review
• National Survey of BGC Members
• Administered Yearly in March
• Ages 9-18
• Confidential
• Sample Survey Available to Parents, Parental Permission Must Be Granted
• Web Based
• English and Spanish

NYOI 2014 Results: Club ExperienceHow We Compare to Rest of BGC Nation
Overall Club Experience:
Total Responses% Total
Responses National %Room to Grow 68 24% 32%
Doing Fine 112 39% 33%
Doing Great 105 37% 35%

Sense of Belonging:
Total Responses % Total
Responses National %Room to Grow 33 12% 15%
Doing Fine 116 42% 45%
Doing Great 129 46% 41%
NYOI 2014 Results: Club ExperienceHow We Compare to Rest of BGC Nation

Emotional Safety:
Total Responses% Total
Responses National %Room to Grow 39 14% 17%
Doing Fine 108 40% 43%
Doing Great 122 45% 40%
NYOI 2014 Results: Club ExperienceHow We Compare to Rest of BGC Nation

Total Responses% Total
Responses National %Room to Grow 92 33% 35%
Doing Fine 15 5% 11%
Doing Great 176 62% 54%
Physical Safety:
NYOI 2014 Results: Club ExperienceHow We Compare to Rest of BGC Nation

Fun:
Total Responses% Total
Responses National %Room to Grow 41 15% 18%
Doing Fine 88 31% 33%
Doing Great 153 54% 49%
NYOI 2014 Results: Club ExperienceHow We Compare to Rest of BGC Nation

Staff Expectations:
Total
Responses% Total
Responses National %Room to Grow 13 5% 7%
Doing Fine 48 17% 25%
Doing Great 214 78% 68%
NYOI 2014 Results: Club ExperienceHow We Compare to Rest of BGC Nation

Recognition:
Total Responses% Total
Responses National %Room to Grow 54 19% 25%
Doing Fine 54 19% 25%
Doing Great 172 61% 50%
NYOI 2014 Results: Club ExperienceHow We Compare to Rest of BGC Nation

On Grade Level for Age:
Total Responses% Total
Responses National % State %On Grade Level 267 96% 93% 90%
Not On Grade Level
12 4% 7% 10%
NYOI 2014 Results: AcademicsHow We Compare to Rest of BGC Nation

Highest Level of Expected Schooling: YOUTH
Total Responses% Total
Responses National % State %Grade 8 5 2% 4% 5%
Some high school 5 2% 2% 2%
High school 12 6% 7% 8%
College 193 90% 87% 86%
NYOI 2014 Results: AcademicsHow We Compare to Rest of BGC Nation

Highest Level of Expected Schooling: TEEN
Total
Responses% Total
ResponsesNational
% State %Some high school 3 5% 3% 3%
High school graduation 5 8% 10% 10%
Finished vocational or trade school 1 2% 2% 3%
1 or 2 years of college 10 15% 14% 15%
4-year college degree 23 35% 34% 30%
Masters degree, Ph.D, M.D., or equivalent 23 35% 37% 38%
NYOI 2014 Results: AcademicsHow We Compare to Rest of BGC Nation

Grades (Self Reported):
Total Responses% Total
Responses National % State %Mostly A's 125 44% 42% 40%
Mostly B's 98 35% 39% 36%
Mostly C's 37 13% 15% 18%
Mostly D's 12 4% 3% 3%
Mostly F's 9 3% 2% 3%
NYOI 2014 Results: AcademicsHow We Compare to Rest of BGC Nation
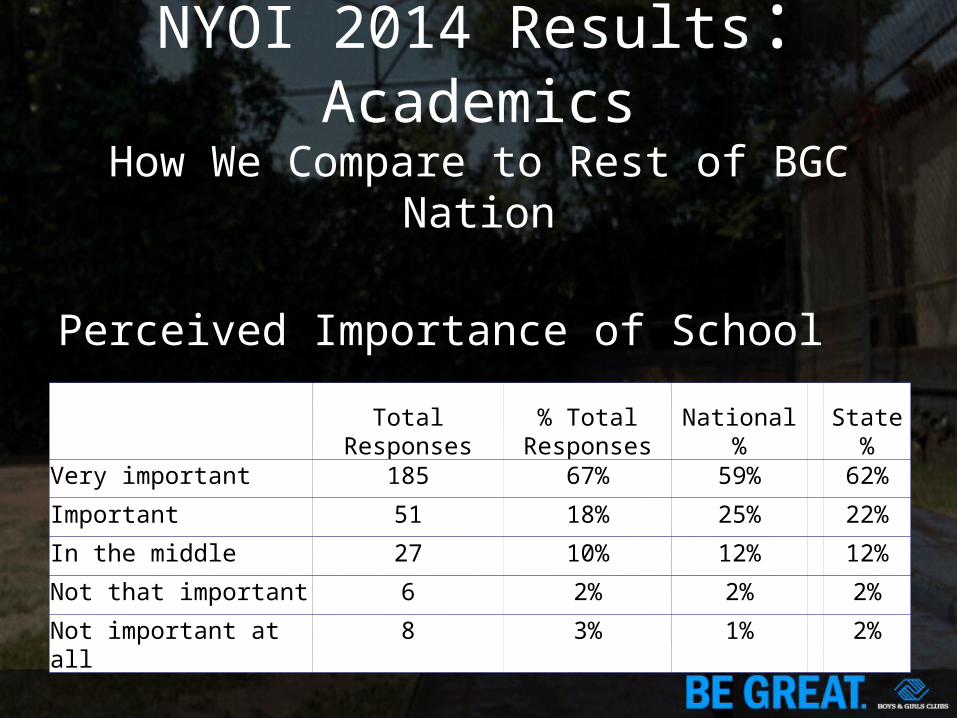
Perceived Importance of School
Total Responses% Total
Responses National % State %Very important 185 67% 59% 62%
Important 51 18% 25% 22%
In the middle 27 10% 12% 12%
Not that important 6 2% 2% 2%
Not important at all 8 3% 1% 2%
NYOI 2014 Results: AcademicsHow We Compare to Rest of BGC Nation

NYOI 2014 Results: AcademicsHow We Compare to Rest of BGC Nation
School Days Skipped (Self Reported):
Total
Responses% Total
Responses National % State %None 215 78% 73% 69%1 day 20 7% 9% 9%2 days 13 5% 6% 7%3 days 9 3% 5% 6%4-5 days 8 3% 4% 5%6-10 days 3 1% 2% 2%11 or more days 8 3% 2% 3%

NYOI 2014 Results: CharacterHow We Compare to Rest of BGC Nation
Teen Volunteering:
Total Responses% Total
Responses National % State %Never 19 29% 31% 32%
About once a year 16 25% 23% 24%
About once a month 12 18% 20% 19%
About once every two weeks 9 14% 10% 9%
About once a week or more 9 14% 16% 16%

Participation in Club-Based ServiceServe Food, Clean Club, Lead an Activity, Help Another Student with Homework, Volunteering to Work Events, etc.
NYOI 2014 Results: CharacterHow We Compare to Rest of BGC Nation
Total
Responses% Total
ResponsesNational
% State %Never 53 19% 28% 26%
About once a year 36 13% 15% 16%
About once a month 31 11% 17% 16%
About once every two weeks 52 19% 13% 14%
About once a week or more 100 37% 27% 29%

Civic Responsibility: Concern For Others
NYOI 2014 Results: CharacterHow We Compare to Rest of BGC Nation
Total
Responses% Total
Responses National % State %Room to Grow 38 18% 21% 24%
Doing Fine 76 37% 39% 38%
Doing Great 92 45% 40% 38%

Civic Responsibility: Concern For Community
NYOI 2014 Results: CharacterHow We Compare to Rest of BGC Nation
Total
Responses% Total
Responses National % State %
Room to Grow 21 10% 12% 11%
Doing Fine 109 54% 54% 54%
Doing Great 71 35% 34% 35%

Fighting:
NYOI 2014 Results: CharacterHow We Compare to Rest of BGC Nation
Total Responses% Total
Responses National % State %Fights 21 31% 33% 41%
No Fights 46 69% 67% 59%

Arrest History in Past 12 Months:
Total Responses% Total
Responses National % State %Never 55 87% 91% 82%
Once 4 6% 7% 12%
Two or more times 4 6% 3% 6%
NYOI 2014 Results: CharacterHow We Compare to Rest of BGC Nation

Conflict Resolution Skills:
NYOI 2014 Results: CharacterHow We Compare to Rest of BGC Nation
Total Responses% Total
Responses National % State %Room to Grow 118 43% 44% 56%
Doing Fine 86 31% 33% 28%
Doing Great 70 26% 22% 16%
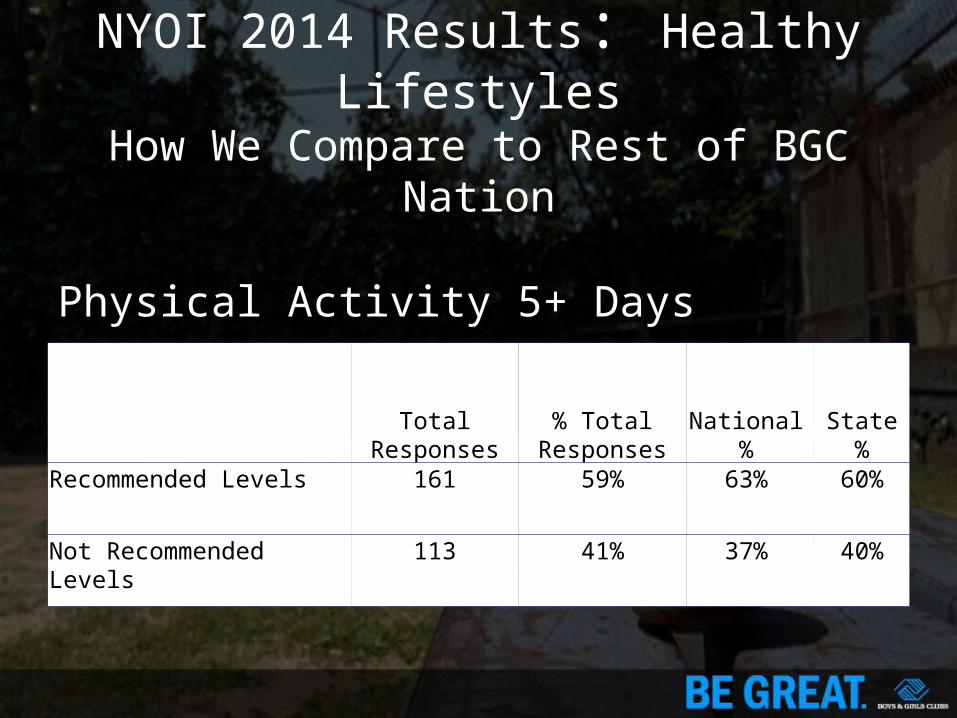
Physical Activity 5+ Days
NYOI 2014 Results: Healthy LifestylesHow We Compare to Rest of BGC Nation
Total
Responses% Total
Responses National % State %Recommended Levels 161 59% 63% 60%
Not Recommended Levels 113 41% 37% 40%

Drinking:
NYOI 2014 Results: Healthy LifestylesHow We Compare to Rest of BGC Nation
Total
Responses% Total
Responses National % State %Abstained 50 91% 89% 89%
Did Not Abstain 5 9% 11% 11%

Cigarette Smoking:
NYOI 2014 Results: Healthy LifestylesHow We Compare to Rest of BGC Nation
Total Responses% Total
Responses National % State %Abstained 61 98% 95% 96%
Did Not Abstain 1 2% 5% 4%

Marijuana Use:
NYOI 2014 Results: Healthy LifestylesHow We Compare to Rest of BGC Nation
Total Responses% Total
Responses National % State %Abstained 52 88% 91% 88%
Did Not Abstain 7 12% 9% 12%

Number of Fruits Per Day
Number of Vegetables Per Day
Number of Soda Pops Per Day
NYOI 2014 Results: Healthy LifestylesHow We Compare to Rest of BGC Nation
Total Responses % Total Responses National % State %Less than 3 160 61% 61% 59%3 or more 101 39% 39% 41%
Total Responses % Total Responses National % State %Less than 2 85 32% 33% 32%
2 or more 180 68% 67% 68%
Total Responses % Total Responses National % State %0 times 93 35% 40% 31%1 time 68 26% 24% 23%2 times 35 13% 13% 15%3 times 24 9% 7% 9%4 times 8 3% 4% 5%5 or more times 35 13% 12% 16%

BOYS & GIRLS CLUBS OF LORAIN COUNTYORGANIZATIONAL CHART
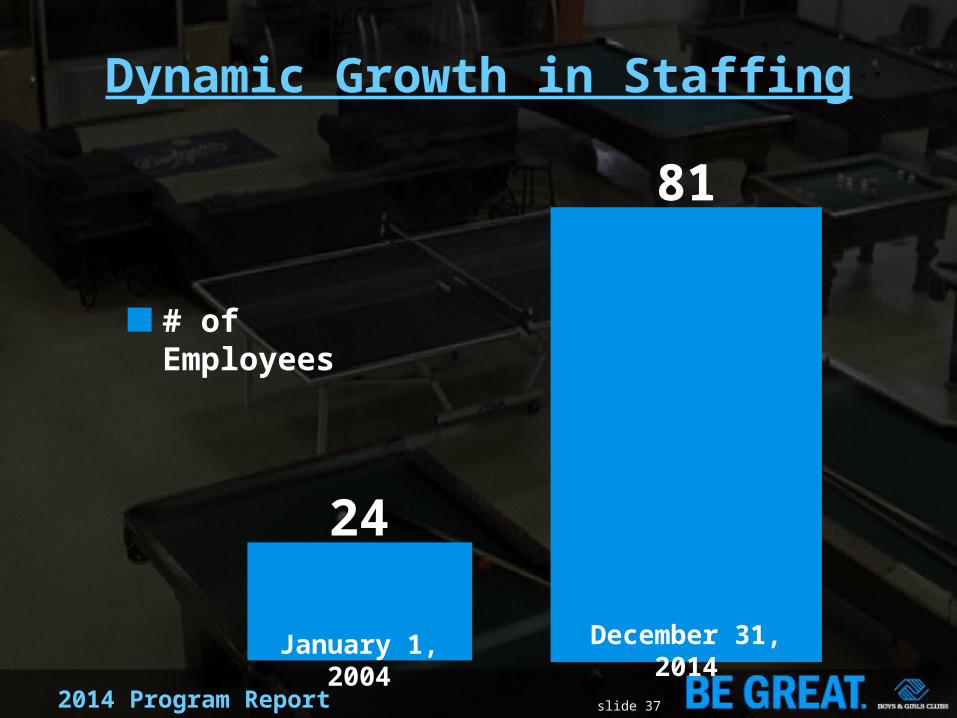
2014 Program Report slide 37
Dynamic Growth in Staffing
24
81
# of Employees
January 1, 2004 December 31, 2014

Staffing Demographics

Staffing & Volunteer Breakdown
• Total Full-Time Staff: 31
• Total Part-Time Staff: 50
• Program Volunteers: 45
• Other Adult Volunteers: 50

BGCLC Financials
Total Assets: $3,229,984.68
Total Income: $2,821,327.22
Total Expenses: $2,587,807.45

2013 Program Report
What They Think
What parents think…
“With the Boys & Girls Club, I have always felt that my daughter has been in caring hands that both support her and help her grow in positive ways.”
“The Club has helped my kids experience things that I would not have been able to provide”
“I think my kids have matured and learned to handle themselves in diverse situations.”
slide 41

2013 Program Report
What They Think
What kids think…“My life has been changed by the Club because I am more
respectful now to others” – Age 10, boy
“I have gotten a lot smarter and learned what’s not okay and what’s okay.” – Age 8, boy
“The Club means everything to me… The staff and helpers are the nicest people in the world. If they weren’t here, this Club would not be as great as it is now” – Age 12, girl
slide 42
