2014 10 29 - coface sa 9m 2014 results - analysts incl ...sa_9... · illustration: 2013/2014...
TRANSCRIPT

9M-2014 results
Financial analysts presentation
October 29th, 2014

//
IMPORTANT NOTICE:
This presentation has been prepared exclusively for the purpose of the conference call held on October 29th, 2014, for the publication of Coface Group’s 9M results 2014, to financial analysts.
This presentation includes only summary information and does not purport to be comprehensive. The Coface Group takes no responsibility for the use of these materials by any person.
The information contained in this presentation has not been subject to independent verification. No representation, warranty or undertaking, express or implied, is made as to, and no reliance should be
placed on, the fairness, accuracy, completeness or correctness of the information or opinions contained herein. None of the Coface Group, its affiliates or its advisors, nor any representatives of such
persons, shall have any liability whatsoever for any loss arising from any use of this document or its contents or otherwise arising in connection with this document or any other information or material
discussed.
Participants should read the respectively 9M 2014 Financial Statements and complete this information with the Prospectus relating to the initial public offering (“IPO”) of the Company. The Prospectus
was approved by the Autorité des marchés financiers (“AMF”) on June 13th, 2014 under the No. 14-293, and it consists of: (i) a Base Document registered under the No. I.14-029 dated of May 6th,2014
(only this document exists in English); (ii) a Securities Note registered under the No. 14-293 dated of June 13th, 2014; and, (iii) a summary of the prospectus (included in the Securities Note). The
Prospectus presents a detailed description of the Coface Group, its business, strategy, financial condition, results of operations and risk factors.
This presentation contains certain forward-looking statements. Such forward looking statements in this presentation are for illustrative purposes only. Forward-looking statements relate to expectations,
beliefs, projections, future plans and strategies, anticipated events or trends and similar expressions concerning matters that are not historical facts. The forward-looking statements are based on Coface
Group’s current beliefs, assumptions and expectations of its future performance, taking into account all information currently available. The Coface Group is under no obligation and does not undertake to
provide updates of these forward-looking statements and information to reflect events that occur or circumstances that arise after the date of this document.
Forward-looking information and statements are not guarantees of future performance and are subject to various risks and uncertainties, many of which are difficult to predict and generally beyond the
control of the Coface Group. Actual results could differ materially from those expressed in, or implied or projected by, forward-looking information and statements. These risks and uncertainties include
those discussed or identified under “Facteurs de Risques” in the Document de Base filed by the Coface Group with the AMF.
This presentation contains certain information that has not been prepared in accordance with International Financial Reporting Standards (“IFRS”). This information has important limitations as an
analytical tool and should not be considered in isolation or as a substitute for analysis of our results as reported under IFRS.
More comprehensive information about the Coface Group may be obtained on its Internet website (http://www.coface.com/Investors).
This document does not constitute an offer to sell, or a solicitation of an offer to buy COFACE SA securities in any jurisdiction.
Important legal information
2Financial analysts presentation - 2014, October 29th
/
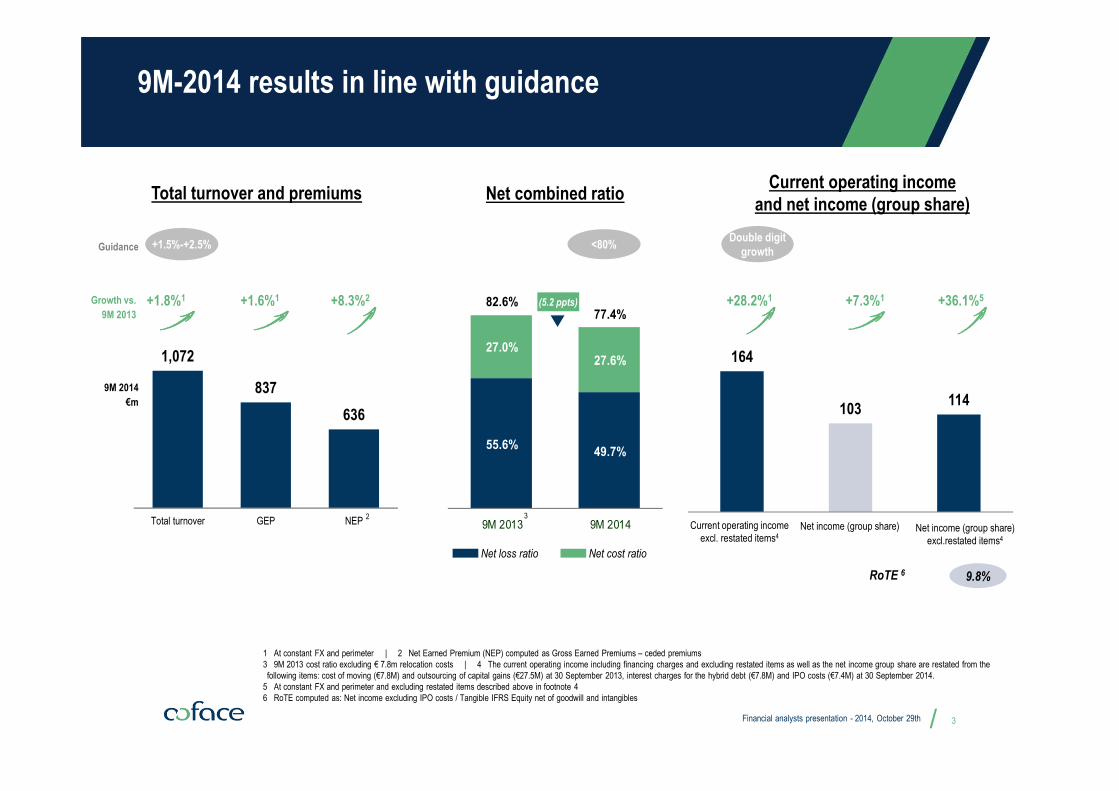
9M-2014 results in line with guidance
9M 2014
€m
RoTE 6
Growth vs.
9M 2013
9.8%
3
Net combined ratioCurrent operating income
and net income (group share)Total turnover and premiums
1,072
837
636
Total turnover GEP NEP
Net loss ratio Net cost ratio
(5.2 ppts)
+1.5%-+2.5%Guidance <80%
+1.8%1
3
+1.6%1 +8.3%2 +7.3%1 +36.1%5
2
Financial analysts presentation - 2014, October 29th
Double digit
growth
55.6%49.7%
27.0%27.6%
82.6%77.4%
9M 2013 9M 2014
164
103114
Current operatingincome
Net income (group share) Net income (group share)excl. exceptional items
+28.2%1
1 At constant FX and perimeter | 2 Net Earned Premium (NEP) computed as Gross Earned Premiums – ceded premiums
3 9M 2013 cost ratio excluding € 7.8m relocation costs | 4 The current operating income including financing charges and excluding restated items as well as the net income group share are restated from the
following items: cost of moving (€7.8M) and outsourcing of capital gains (€27.5M) at 30 September 2013, interest charges for the hybrid debt (€7.8M) and IPO costs (€7.4M) at 30 September 2014.
5 At constant FX and perimeter and excluding restated items described above in footnote 4
6 RoTE computed as: Net income excluding IPO costs / Tangible IFRS Equity net of goodwill and intangibles
Current operating income
excl. restated items4Net income (group share) Net income (group share)
excl.restated items4

// 4
0%
1%
2%
3%
4%
5%
6%
7%
2014e 2015e 2016e
G7
G7 - previous outlook
Latin america
Latin america - previous outlook
North africa - Middle east
North africa - Middle east -previous outlook
Source: Coface for 2013, 2014, 2015 ; IMF for 2016 (as of October 2014)
Previous outlook: as of June 2014
GDP Growth
0%
1%
2%
3%
4%
5%
6%
7%
2014e 2015e 2016e
G7
G7 - previous outlook
Euro area
Euro area - previous outlook
Emerging and developping economies
Emerging and developping economies - previous outlook
Source: IMF (as of October 2014)
Previous outlook: as of June 2014
Exports of goods & services
Though painful, macroeconomic indicators
point to recovery
Financial analysts presentation - 2014, October 29th
The economic recovery forecast is confirmed, even if it is slower than initially expected by the markets
// 5
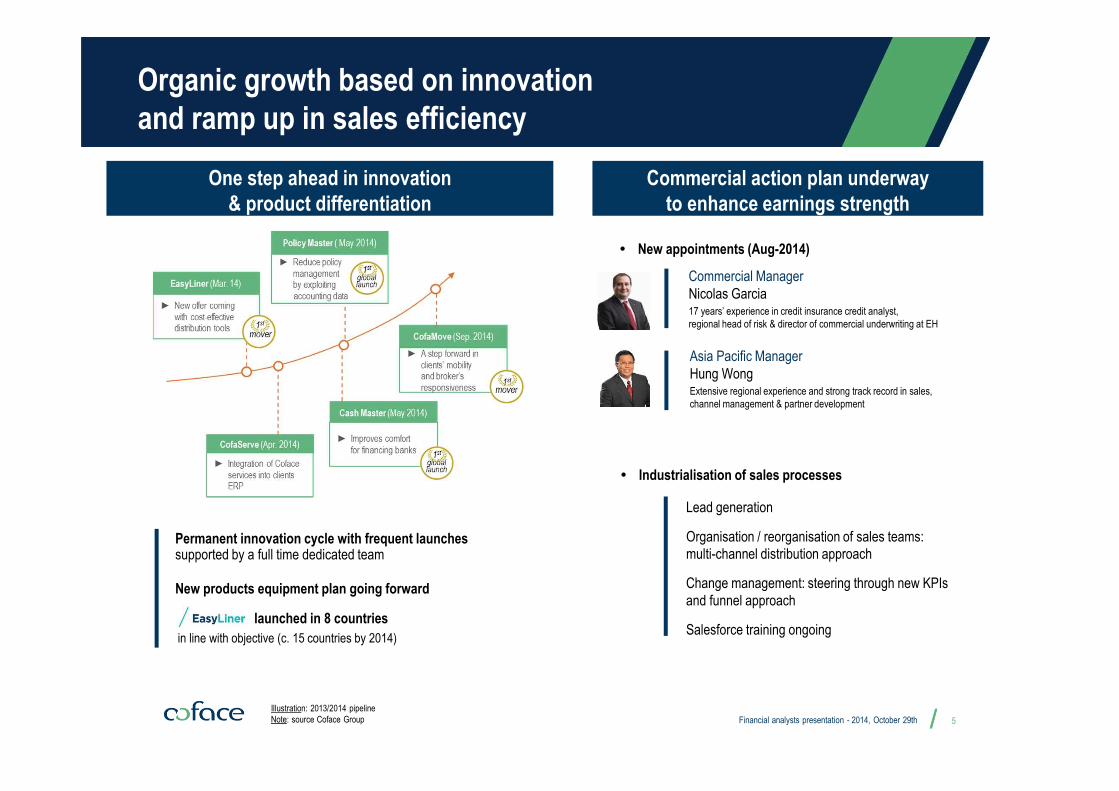
Illustration: 2013/2014 pipeline
Note: source Coface Group
One step ahead in innovation
& product differentiation
Commercial action plan underway
to enhance earnings strength
Organic growth based on innovation
and ramp up in sales efficiency
Financial analysts presentation - 2014, October 29th
� Industrialisation of sales processes
Lead generation
Organisation / reorganisation of sales teams:
multi-channel distribution approach
Change management: steering through new KPIs
and funnel approach
Salesforce training ongoing
Commercial Manager
Nicolas Garcia17 years’ experience in credit insurance credit analyst,
regional head of risk & director of commercial underwriting at EH
� New appointments (Aug-2014)
Asia Pacific Manager
Hung WongExtensive regional experience and strong track record in sales,
channel management & partner development
launched in 8 countries
in line with objective (c. 15 countries by 2014)
Permanent innovation cycle with frequent launchessupported by a full time dedicated team
New products equipment plan going forward

/
Commercial performance
1 Portfolio as of 9M 2014
2 Not annualized
New
pr
oduc
tion
1R
eten
tion
rate
1P
rice
effe
ct
1V
olum
e ef
fect
1• New production steadily developing
• Strong client loyalty
• Pricing reduction resulting from loss ratio
decrease under control
• Progressive improvement in client activity
mirrors gradual macro recovery
€m93
111120
9M 2012 9M 2013 9M 2014
+8%
89.1% 86.9% 87.4% 91.9%
2011 2012 9M 2013 9M 2014
(4.9)%
(2.2)%
0.0%
(0.9)%
2011 2012 9M 2013 9M 2014
11.1%
3.6%1.2% 2.4%
2011 2012 9M 2013 9M 2014
6Growth Financial analysts presentation - 2014, October 29th
2 2
�
�
�
�
/
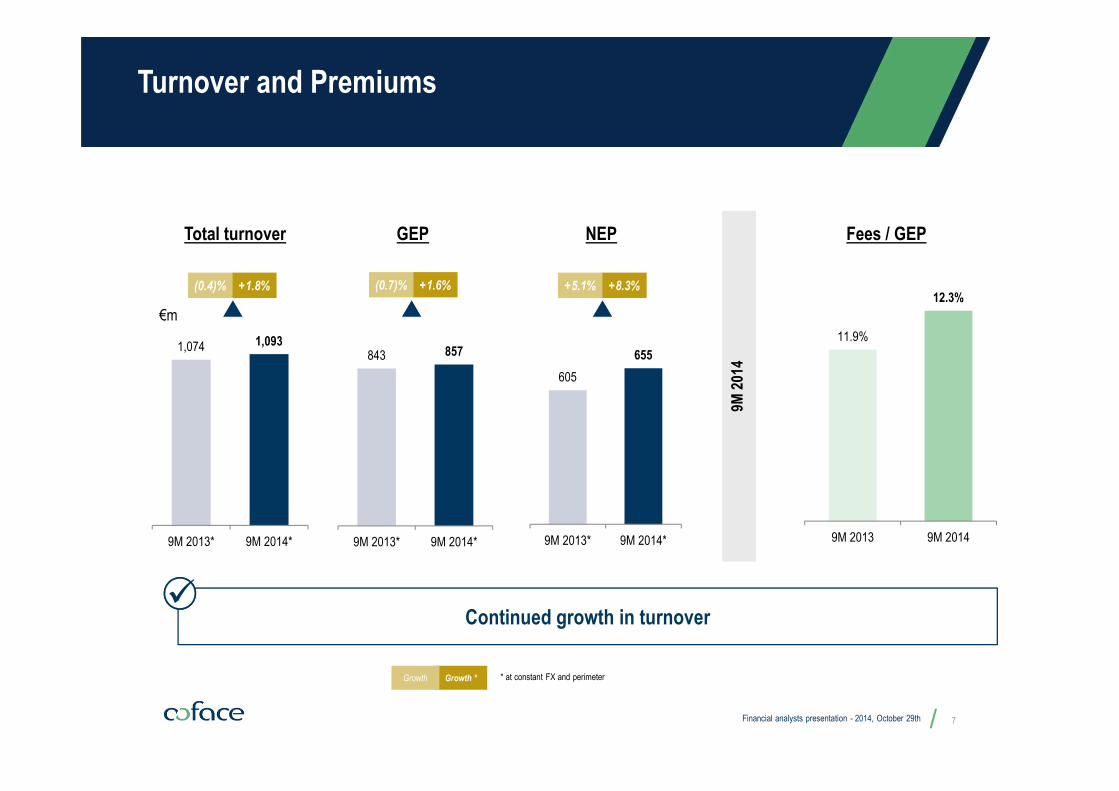
Total turnover GEP NEP
€m
+1.8%
Continued growth in turnover
Fees / GEP
9M 2
014
Growth *Growth * at constant FX and perimeter
(0.4)% +1.6%(0.7)% +8.3%+5.1%
�
Turnover and Premiums
Financial analysts presentation - 2014, October 29th
1,074 1,093
9M 2013* 9M 2014*
843 857
9M 2013* 9M 2014*
11.9%
12.3%
9M 2013 9M 2014
605
655
9M 2013* 9M 2014*
7

/
Overview of turnover by region
Financial analysts presentation - 2014, October 29th
Turnover
€m
Growth*Growth
(1.4)%(1.9)% (2.5)%(2.0%) +4.6%+4.3% +4.8%+2.0%
Northern Europe Western Europe Central Europe Mediterranean and Africa
8* at constant FX and perimeter
North America Latin AmericaAsia Pacific
+1.6%(2.9%) +12.6%+7.9% +15.5%(4.1%)
Turnover
€mTurnover
€mTurnover
€m
Turnover
€mTurnover
€m
Turnover
€m
273 268
9M 2013 9M 2014
354 347
9M 2013 9M 2014
81 84
9M 2013 9M 2014
159 162
9M 2013 9M 2014
77 84
9M 2013 9M 2014
60 57
9M 2013 9M 2014
72 70
9M 2013 9M 2014
Net production growing in all regions
Good growth in emerging countries
Commercial reengineering still underway in Northern Europe and Western Europe
�

/
73.8% 77.4% 75.0% 72.5% 73.9% 72.6% 73.0% 72.7% 71.8%
(24.4)% (28.2)% (25.2)% (21.2)% (23.5)% (24.1)% (28.1)% (27.0)% (26.8)%
49.4% 49.2% 49.8% 51.4% 50.4%48.4%
44.9% 45.7% 45.0%
12M 2011 12M 2012 3M 2013 6M 2013 9M 2013 12M 2013 3M 2014 6M 2014 9M 2014
Loss ratio evolution illustrates
strong focus on technical profitability
Current year and all year gross loss ratio2 evolution
Gross loss ratio current year Gross loss ratio prior years All year gross loss ratio
1 All year gross loss ratio, including claims handling expenses
2 Loss ratio gross of reinsurance and excluding claims handling expenses9
51.7% 51.5% 51.1%47.4% 48.0% 47,1%
2011 2012 2013 Q1 2014 H1 2014 9M 2014
Gross loss ratio evolution1
Financial analysts presentation - 2014, October 29th
• First 9 months results show
improvement in current year and all
year loss ratios
�

/
Costs under control
Growing slower than premiumsExpenses under control
Costs evolving at slower pace than premiums, in line with guidance�
€m
1.6%
1.1%
GEP Internal costs
1 Internal costs growth excluding €7.8m non-recurring costs linked to the relocation of the Coface Group's head office in 9M 2013
1
Internal costs External acquisition costs
(1.4%)
Ytd 2014 vs. Ytd 2013 growth at constant FX and perimeter
Financial analysts presentation - 2014, October 29th
418 407
99 102
9M2013 9M2014
517 509
(2.6%)
10

/
Reinsurance result
Retention Reinsurance commissions / Premiums ceded
1 Net Earned Premiums (NEP) computed as: Gross Earned Premiums (GEP) – Ceded premiums
2 Adjusted for 2012 positive run-offs on reinsurance commissions relating to previous underwriting years
NEP 1
€m
69.4% 71.6% 72.0% 76.0%
31.5% 34.2% 34.2% 35.7%
2011 2012 2013 9M 2014
Reinsurance result
€m
(43)(52)
9M 2013 9M 2014
Financial analysts presentation - 2014, October 29th
NEP 1
GEP
2
790 831 813
636
2011 2012 2013 9M 2014
11

/
Net combined ratio improving
Evolution in net combined ratio
Net combined ratio in line with guidance�
55.6%49.7%
27.0%1
27.6%
82.6%77.4%
9M 2013 9M 2014
53.3% 53.8%
26.9% 28.7%1
80.2% 82.5%
2012 2013
12Financial analysts presentation - 2014, October 29th
(5.2 ppts)
Net loss ratioNet cost ratio
1 Excluding relocation costs : €8.3m FY 2013, €7.8m 9M 2013

/
Investment income
1 Excludes investments in non-consolidated subsidiaries
2 Excludes stakes in unconsolidated subsidiaries, FX and investment management charges
3 Excludes €27.5m realised gains due to reorganisation of asset management in 2013 and sale of part of bonds portfolio
4 9M investment income, not annualized
€m 2012 2013 9M 2013 9M 2014
Income from investment portfolio2 47.6 68.6 58,7 31.3
Investment management costs (7.7) (7.0) (5.8) (4.2)
Other (2.9) 5.9 6.2 4.5
Net investment income 37.0 67.5 59.1 31.6
Net investment income without exceptional income 31.6 31.6
Accounting yield on average investment portfolio 2.3% 1.9%3 2.7% 1.8%
Economic yield on average investment portfolio (not audited) 3.8% 1.4% 0.6%4 2.7%4
13Financial analysts presentation - 2014, October 29th
Investment portfolio 1
Improved economic yield�
Bonds
71%
Equities
7%Loans, Deposits
& Other financials
22%
Total
€ 2.57bn1

/
Increase in RoATE
Changes in equity Return on Average Tangible Equity (RoATE)
1 Excluding IPO costs
Note: Return on Average Tangible Equity (RoATE) computed as: Net income (N) / Average Tangible IFRS Equity net of goodwill and
intangibles (N,N-1); net income is annualised for 9M-2014 in the RoATE calculation
RoATE
1,526
Average
Tangible
Equity
€m
1,4411,211
5.3%
8.6% 8.4%
9.6%
2011 2012 2013 9M 2014
14Financial analysts presentation - 2014, October 29th
1,503
1
1,793 (227) 104 27 18 (6) 1,710
Total IFRSEquity
Dec 31, 2013
Share prem.Distrib.
Net income impact
Revaluationreserve
(financialinstruments AFS)
Currencytranslation
differences
Other variations Total IFRSEquity
Sept 30, 2014
€m

Annexes

/
9M 2014 - Key Figures
Income statement items - in €m 9M 2013 9M 2014 %%
like-for-like 1
Consolidated revenues 1,075.9 1,072.0 (0.4)% +1.8%
of which earned premiums 842.7 836.7 (0.7)% +1.6%
Underwriting income after reinsurance 93.0 134.0 +44.0%
Investment income net of expenses and excluding restated items2 31.6 31.6 (0.1)%
Current operating income 152.1 165.5 +8.8%
Current operating income3 excluding restated items4 129.7 164.0 +26.4% +28.2%
Net result (group share) 98,0 103.1 +5.2% +7.3%
Net result (group share) excluding restated items4 85,0 113.6 +33.7% +36.1%
Key ratios - in % 9M 20135 9M 2014 Var.
Loss ratio net of reinsurance 55.6 49.7 (5.9) pts
Cost ratio net of reinsurance 27.0 27.6 +0.6 pts
Combined ratio net of reinsurance 82.6 77.4 (5.2) pts
Balance sheet items - in €m 31/12/2013 30/09/2014
Total equity 1,793 1,710
16Financial analysts presentation - 2014, October 29th
1 The like-for-like change is calculated at constant FX and scope. The scope effect on the consolidated turnover is less than 0.1% and primarily associated with the cessation of public
procedures management by SBCE in Brazil in september 2013
2 Capital gains resulting from the reallocation of assets in 2013 linked to the centralization of the assets’ portfolio management (€27.5 million)
3 Current operating income including finance costs and excluding restated items
4 Current operating income including finance costs and excluding restated items together with the net result are restated from the following items: cost of relocation (€7.8 million)
and capital gains (€27.5 million) in the first nine months of 2013, interest charges on the hybrid debt (€7.8 million) and IPO costs (€7.4 million) in the first nine months of 2014
5 Excluding relocating costs (€7.8 million) in the fist nine months of 2013

/
Q3 2014 - Key Figures
Income statement items - in €m Q3 2013 Q3 2014 %%
like-for-like 1
Consolidated revenues 349.7 348.4 (0.4)% +1.7%
of which earned premiums 273.6 271.9 (0.6)% +1.4%
Underwriting income after reinsurance 33.2 46.1 +39.0%
Investment income net of expenses 8.4 9.2 9.9%
Current operating income 41.6 55.4 +33.2%
Net result (group share) 30.1 33.7 +11.7% +12.3%
Net result (group share) excluding restated items2 29.8 38.0 +27.3% +26.3%
Key ratios - in % Q3 2013 Q3 2014 Var.
Loss ratio net of reinsurance 54.3% 47.4% (6.9)pts
Cost ratio net of reinsurance 28.1% 29.1% +0.9pts
Combined ratio net of reinsurance 82.4% 76.4% (6.0)pts
17Financial analysts presentation - 2014, October 29th
1 The like-for-like change is calculated at constant FX and scope. The scope effect on the consolidated turnover is associated with the cessation of public procedures management by
SBCE in Brazil in september 2013
2 Current operating income including finance costs and excluding restated items together with the net result are restated from the following items: capital gains (€0.3 million) in the third
quarter 2013, interest charges on the hybrid debt (€3.8 million) and IPO costs (€0.5 million) in the third quarter 2014.

/
Overview of net combined ratio calculations
Adjusted Net Earned Premiums
€m 9M-2013 9M-2014
Gross Earned Premiums 843 837
Ceded premiums (238) (201)
Net Earned Premiums 605 636
Adjusted net claims
€m 9M-2013 9M-2014
Gross claims 446 394
Ceded claims (110) (78)
Net claims 336 316
Adjusted net operating expenses
€m 9M-2013 9M-2014
Total operating expenses excl. relocation costs1 509 509
Factoring revenues (52) (53)
Fees + Services revenues (132) (135)
Public guarantees revenues (49) (48)
Employee profit-sharing and incentive plans (4) (7)
Internal investment management charges (2) (2)
Insurance claims handling costs (20) (18)
Adjusted gross operating expenses 249 247
Received reinsurance commissions (86) (72)
Adjusted net operating expenses 164 176
D
E
F
Gross combined ratio = Gross loss ratioB
A+ Gross cost ratio
C
A
Net combined ratio = Net loss ratioE
D+ Net cost ratio
F
D
A
B
C
�
�
1 Excluding € 7.8m relocation costs in 9M-2013 and cost of risk from factoringFinancial analysts presentation - 2014, October 29th 18

/
Cyrille Charbonnel
24 years of experience
in credit insurance
Working for Coface since 2011
Western Europe Manager
Teva Perreau
15 years of experience
in financial services
Working for Coface since 2010
Northern Europe Manager
Michael Ferrante
35 years of experience
in insurance industry
Working for Coface since 2003
North America Manager
Hung Wong
14 years of experience in channel
sales growth & partner engagement
Working for Coface since 2014
Asia Pacific Manager
Katarzyna Kompowska
22 years of experience in credit
insurance & related services
Working for Coface since 1990
Central Europe Manager
Antonio Marchitelli
18 years of experience
in insurance industry
Working for Coface since 2013
Mediterranean & Africa Manager
Bart Pattyn
30 years of experience
in insurance & financial services
Working for Coface since 2000
Latin America Manager
Patrice Luscan
15 years of experience
in credit insurance
Working for Coface since 2012
Marketing & Strategy Manager
Carole Lytton
31 years of experience
in credit insurance
Working for Coface since 1983
Legal, Compliance & Facility Manager
Cécile Fourmann
20 years of experience in HR
Working for Coface since 2012
Human Resources Manager
Carine Pichon
13 years of experience
in credit insurance
Working for Coface since 2001
CFO
Nicolas de Buttet
14 years of experience
in credit insurance
Working for Coface since 2012
Risk Underwriting, Info & Claims
Manager
Pierre Hamille
34 years of experience
in financial services
Working for Coface since 2007
Risks, Organisation & IT Manager
Jean-Marc Pillu
14 years of experience in insurance industry
& former General Manager of Euler Hermes
Working for Coface since 2010
CEO
Gro
up c
entr
al funct
ions
Reg
ional
funct
ions
A strengthened and experienced management team
19
Nicolas Garcia
17 years of experience
in credit insurance
Working for Coface since 2013
Commercial Manager
Financial analysts presentation - 2014, October 29th

//
Investor Relations
1 As of the date of September 30th, 2014.
2 Including own shares
3 Excluding own shares
Numbers of Shares & Voting Rights1
Next Event Date
2014 FY Results February 17th, 2015
Calendar
IR Contacts
Nicolas ANDRIOPOULOS Head of Reinsurance & Financial Communication
Cécile COMBEAUInvestor Relations Officer
+33 (0)1 49 02 22 94
Issuer
• COFACE SA is a société anonyme (joint-stock corporation),
with a Board of Directors (Conseil d’Administration)
incorporated under the laws of France.
Registered
Number &
Office
• Registered No. 432 413 599 with the Nanterre Trade and
Companies Register & Registered office at 1 Place Costes
et Bellonte, 92270 Bois Colombes, France.
Ticker / ISIN • “COFA” / FR0010667147
Listing• Euronext Paris (regulated market) – Compartiment A
• Ordinary shares / No other listing contemplated
Market cap.1 • 1,637,954,095 €
Shares Capital
in €
Number of Shares
Capital
Theoretical Number
of Voting Rights2Number of Real
Voting Rights3
786,241,160 157,248,232 157,248,232 157,020,425
Financial analysts presentation - 2014, October 29th 20