2014 10 28 q3 report%20gea%20group en tcm30 25666
DESCRIPTION
http://www.gea.com/global/de/binaries/2014-10-28_Q3-report%20GEA%20Group_en_tcm30-25666.pdfTRANSCRIPT
engineering for a better world
Quarterly Financial Report
January 1 – September 30, 2014
Q3
2
GEA Group Q3/2014
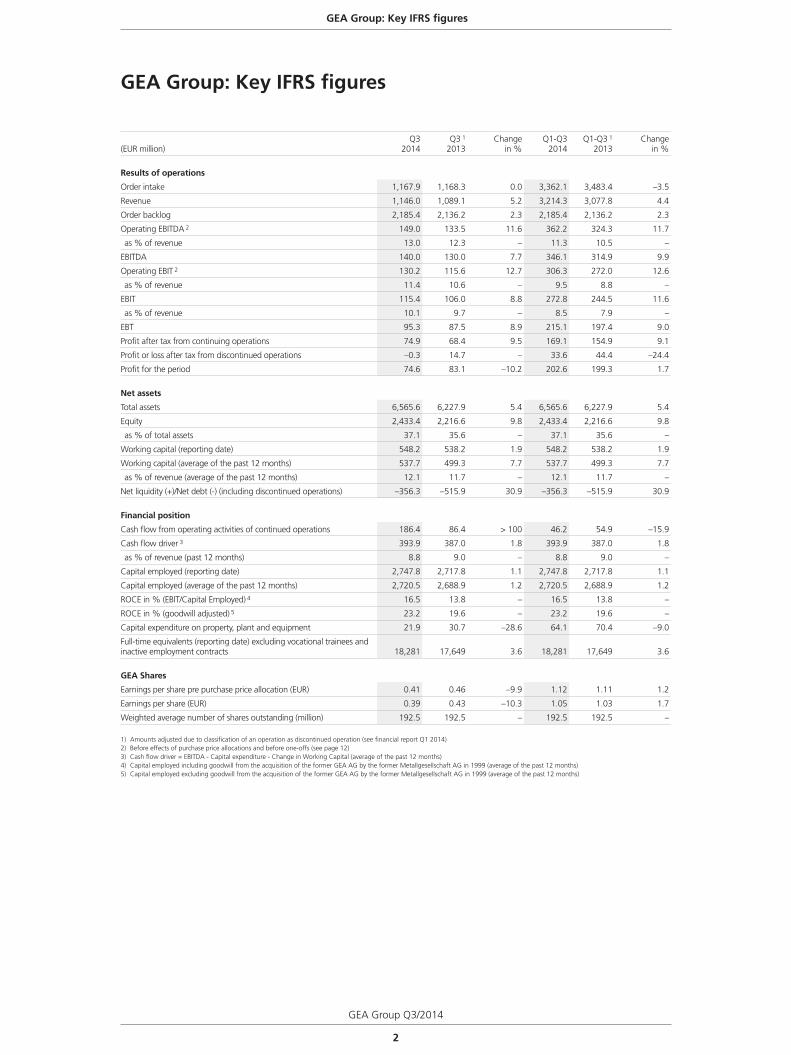
GEA Group: Key IFRS figures
(EUR million)Q3
2014Q3 1
2013Change
in %Q1-Q3
2014Q1-Q3 1
2013Change
in %
Results of operations
Order intake 1,167.9 1,168.3 0.0 3,362.1 3,483.4 –3.5
Revenue 1,146.0 1,089.1 5.2 3,214.3 3,077.8 4.4
Order backlog 2,185.4 2,136.2 2.3 2,185.4 2,136.2 2.3
Operating EBITDA 2 149.0 133.5 11.6 362.2 324.3 11.7
as % of revenue 13.0 12.3 – 11.3 10.5 –
EBITDA 140.0 130.0 7.7 346.1 314.9 9.9
Operating EBIT 2 130.2 115.6 12.7 306.3 272.0 12.6
as % of revenue 11.4 10.6 – 9.5 8.8 –
EBIT 115.4 106.0 8.8 272.8 244.5 11.6
as % of revenue 10.1 9.7 – 8.5 7.9 –
EBT 95.3 87.5 8.9 215.1 197.4 9.0
Profit after tax from continuing operations 74.9 68.4 9.5 169.1 154.9 9.1
Profit or loss after tax from discontinued operations –0.3 14.7 – 33.6 44.4 –24.4
Profit for the period 74.6 83.1 –10.2 202.6 199.3 1.7
Net assets
Total assets 6,565.6 6,227.9 5.4 6,565.6 6,227.9 5.4
Equity 2,433.4 2,216.6 9.8 2,433.4 2,216.6 9.8
as % of total assets 37.1 35.6 – 37.1 35.6 –
Working capital (reporting date) 548.2 538.2 1.9 548.2 538.2 1.9
Working capital (average of the past 12 months) 537.7 499.3 7.7 537.7 499.3 7.7
as % of revenue (average of the past 12 months) 12.1 11.7 – 12.1 11.7 –
Net liquidity (+)/Net debt (-) (including discontinued operations) –356.3 –515.9 30.9 –356.3 –515.9 30.9
Financial position
Cash flow from operating activities of continued operations 186.4 86.4 > 100 46.2 54.9 –15.9
Cash flow driver 3 393.9 387.0 1.8 393.9 387.0 1.8
as % of revenue (past 12 months) 8.8 9.0 – 8.8 9.0 –
Capital employed (reporting date) 2,747.8 2,717.8 1.1 2,747.8 2,717.8 1.1
Capital employed (average of the past 12 months) 2,720.5 2,688.9 1.2 2,720.5 2,688.9 1.2
ROCE in % (EBIT/Capital Employed) 4 16.5 13.8 – 16.5 13.8 –
ROCE in % (goodwill adjusted) 5 23.2 19.6 – 23.2 19.6 –
Capital expenditure on property, plant and equipment 21.9 30.7 –28.6 64.1 70.4 –9.0
Full-time equivalents (reporting date) excluding vocational trainees and inactive employment contracts 18,281 17,649 3.6 18,281 17,649 3.6
GEA Shares
Earnings per share pre purchase price allocation (EUR) 0.41 0.46 –9.9 1.12 1.11 1.2
Earnings per share (EUR) 0.39 0.43 –10.3 1.05 1.03 1.7
Weighted average number of shares outstanding (million) 192.5 192.5 – 192.5 192.5 –
1) Amounts adjusted due to classification of an operation as discontinued operation (see financial report Q1 2014)2) Before effects of purchase price allocations and before one-offs (see page 12)3) Cash flow driver = EBITDA - Capital expenditure - Change in Working Capital (average of the past 12 months)4) Capital employed including goodwill from the acquisition of the former GEA AG by the former Metallgesellschaft AG in 1999 (average of the past 12 months)5) Capital employed excluding goodwill from the acquisition of the former GEA AG by the former Metallgesellschaft AG in 1999 (average of the past 12 months)
GEA Group: Key IFRS figures
3
GEA Group Q3/2014
2 GEA Group Key IFRS figures
Management Report 4 Report on Economic Position
20 Performance of Discontinued Operations 21 Report on Post-Balance Sheet Date Events
21 Report on Risks and Opportunities
22 New Group Structure
23 Report on Expected Developments
GEA Shares 25
Consolidated 28 Consolidated Balance Sheet Financial Statements 30 Consolidated Income Statement/ Statement of Comprehensive Income
34 Consolidated Cash Flow Statement
35 Consolidated Statement of Changes in Equity
36 Notes to the Consolidated Financial Statements
Financial Calendar/ 53 Publication Details
Contents
Contents
4
GEA Group Q3/2014
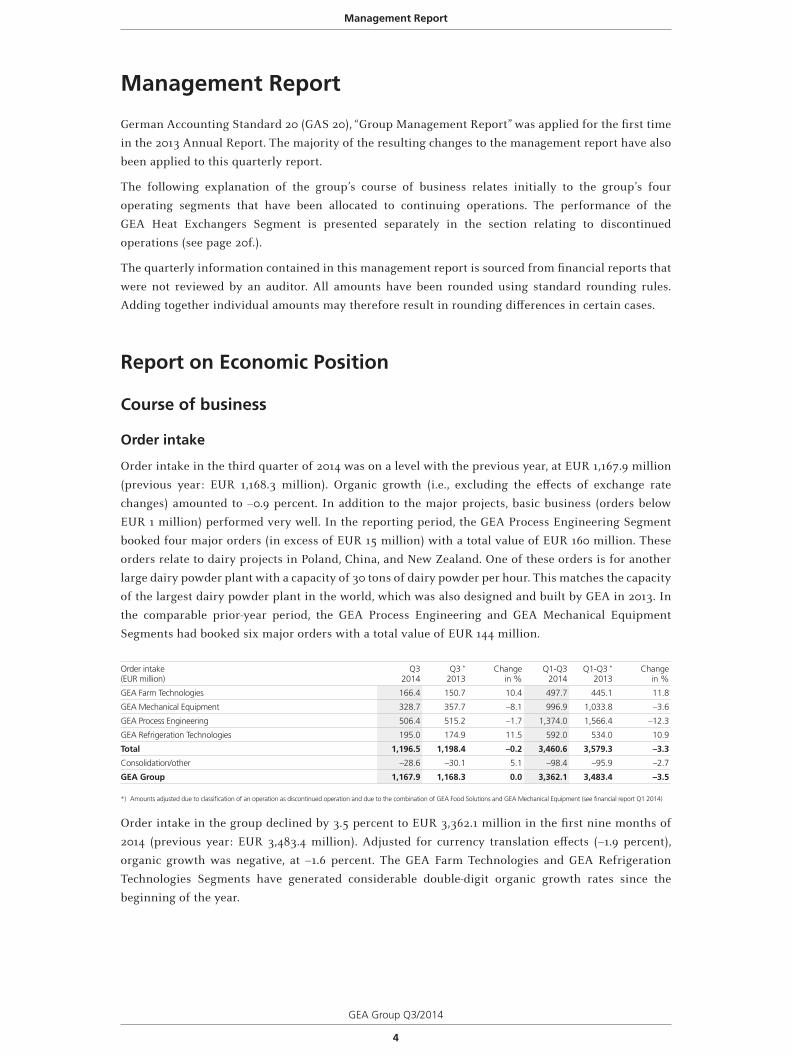
Management Report
Management Report
German Accounting Standard 20 (GAS 20), “Group Management Report” was applied for the first time
in the 2013 Annual Report. The majority of the resulting changes to the management report have also
been applied to this quarterly report.
The following explanation of the group’s course of business relates initially to the group’s four
operating segments that have been allocated to continuing operations. The performance of the
GEA Heat Exchangers Segment is presented separately in the section relating to discontinued
operations (see page 20f.).
The quarterly information contained in this management report is sourced from financial reports that
were not reviewed by an auditor. All amounts have been rounded using standard rounding rules.
Adding together individual amounts may therefore result in rounding differences in certain cases.
Report on Economic Position
Course of business
Order intake
Order intake in the third quarter of 2014 was on a level with the previous year, at EUR 1,167.9 million
(previous year: EUR 1,168.3 million). Organic growth (i.e., excluding the effects of exchange rate
changes) amounted to –0.9 percent. In addition to the major projects, basic business (orders below
EUR 1 million) performed very well. In the reporting period, the GEA Process Engineering Segment
booked four major orders (in excess of EUR 15 million) with a total value of EUR 160 million. These
orders relate to dairy projects in Poland, China, and New Zealand. One of these orders is for another
large dairy powder plant with a capacity of 30 tons of dairy powder per hour. This matches the capacity
of the largest dairy powder plant in the world, which was also designed and built by GEA in 2013. In
the comparable prior-year period, the GEA Process Engineering and GEA Mechanical Equipment
Segments had booked six major orders with a total value of EUR 144 million.
Order intake(EUR million)
Q32014
Q3 *
2013Change
in %Q1-Q3
2014Q1-Q3 *
2013Change
in %
GEA Farm Technologies 166.4 150.7 10.4 497.7 445.1 11.8
GEA Mechanical Equipment 328.7 357.7 –8.1 996.9 1,033.8 –3.6
GEA Process Engineering 506.4 515.2 –1.7 1,374.0 1,566.4 –12.3
GEA Refrigeration Technologies 195.0 174.9 11.5 592.0 534.0 10.9
Total 1,196.5 1,198.4 –0.2 3,460.6 3,579.3 –3.3
Consolidation/other –28.6 –30.1 5.1 –98.4 –95.9 –2.7
GEA Group 1,167.9 1,168.3 0.0 3,362.1 3,483.4 –3.5
*) Amounts adjusted due to classification of an operation as discontinued operation and due to the combination of GEA Food Solutions and GEA Mechanical Equipment (see financial report Q1 2014)
Order intake in the group declined by 3.5 percent to EUR 3,362.1 million in the first nine months of
2014 (previous year: EUR 3,483.4 million). Adjusted for currency translation effects (–1.9 percent),
organic growth was negative, at –1.6 percent. The GEA Farm Technologies and GEA Refrigeration
Technologies Segments have generated considerable double-digit organic growth rates since the
beginning of the year.
GEA Group Q3/2014
5
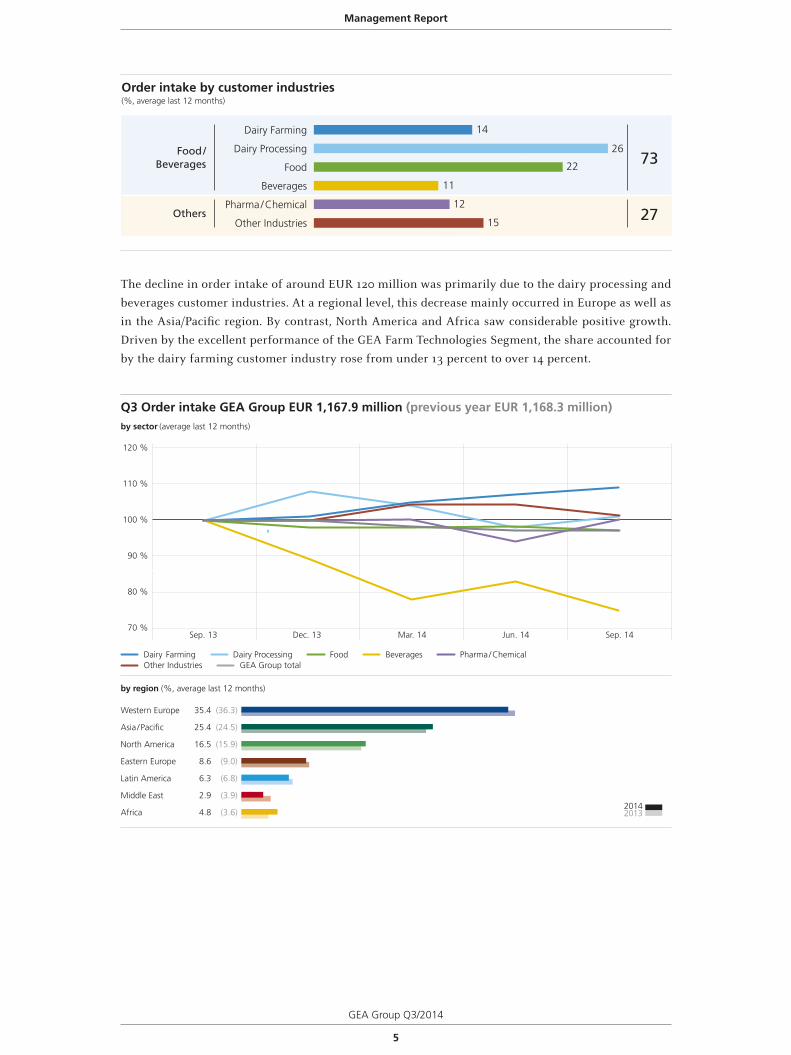
Order intake by customer industries(%, average last 12 months)
Dairy Farming
Dairy Processing
Food
Beverages
Pharma / Chemical
Other Industries
Food /Beverages
Others
73
27
14
26
22
11
12
15
The decline in order intake of around EUR 120 million was primarily due to the dairy processing and
beverages customer industries. At a regional level, this decrease mainly occurred in Europe as well as
in the Asia/Pacific region. By contrast, North America and Africa saw considerable positive growth.
Driven by the excellent performance of the GEA Farm Technologies Segment, the share accounted for
by the dairy farming customer industry rose from under 13 percent to over 14 percent.
Q3 Order intake GEA Group EUR 1,167.9 million (previous year EUR 1,168.3 million) by sector (average last 12 months)
20132014
Dairy Farming Dairy Processing Food Beverages Pharma / Chemical Other Industries GEA Group total
by region (%, average last 12 months)
Western Europe 35.4 (36.3)
Asia / Pacific 25.4 (24.5)
North America 16.5 (15.9)
Eastern Europe 8.6 (9.0)
Latin America 6.3 (6.8)
Middle East 2.9 (3.9)
Africa 4.8 (3.6)
100 %
70 %
90 %
80 %
120 %
110 %
Sep. 13 Dec. 13 Mar. 14 Jun. 14 Sep. 14
Management Report
6
GEA Group Q3/2014
Order backlog
The order backlog rose further to EUR 2,185.4 million, up by EUR 170.0 million or 8.4 percent compared
with December 31, 2013 (EUR 2,015.5 million). Around EUR 900 million of the order backlog as of
September 30, 2014, is billable in the current fiscal year.
Order backlog(EUR million) 09/30/2014 09/30/2013 *
Changein %
GEA Farm Technologies 120.8 112.2 7.6
GEA Mechanical Equipment 421.7 456.8 –7.7
GEA Process Engineering 1,370.5 1,334.9 2.7
GEA Refrigeration Technologies 293.9 253.1 16.1
Total 2,206.9 2,157.0 2.3
Consolidation/other –21.5 –20.8 –3.2
GEA Group 2,185.4 2,136.2 2.3
*) Amounts adjusted due to classification of an operation as discontinued operation and due to the combination of GEA Food Solutions and GEA Mechanical Equipment (see financial report Q1 2014)
Revenue
In general, the same regional and sector-specific trends apply to revenue as to order intake, although
with different time lags. However, revenue is less volatile than order intake.
In the third quarter of 2014, group revenue increased by 5.2 percent to EUR 1,146.0 million (previous
year: EUR 1,089.1 million). The effects of exchange rate movements had no material impact. All
segments recorded their highest ever third-quarter revenue.
The book-to-bill ratio, the ratio of order intake to revenue, remained at slightly over 1.0 in the third
quarter of 2014.
Revenue(EUR million)
Q32014
Q3 *
2013Change
in %Q1-Q3
2014Q1-Q3 *
2013Change
in %
GEA Farm Technologies 176.4 156.9 12.4 457.2 401.5 13.9
GEA Mechanical Equipment 349.2 336.3 3.8 999.7 968.4 3.2
GEA Process Engineering 453.8 441.3 2.8 1,313.6 1,271.3 3.3
GEA Refrigeration Technologies 196.4 184.8 6.3 540.3 526.0 2.7
Total 1,175.9 1,119.3 5.1 3,310.9 3,167.2 4.5
Consolidation/other –29.9 –30.2 1.0 –96.5 –89.4 –8.0
GEA Group 1,146.0 1,089.1 5.2 3,214.3 3,077.8 4.4
*) Amounts adjusted due to classification of an operation as discontinued operation and due to the combination of GEA Food Solutions and GEA Mechanical Equipment (see financial report Q1 2014)
In the first three quarters of 2014, revenue in the group increased by 4.4 percent to EUR 3,214.3 million
(previous year: EUR 3,077.8 million). Exchange rate movements reduced revenue by 1.9 percent.
Organic revenue growth was 6.4 percent.
The service business recorded growth of 5.2 percent (7.7 percent adjusted for exchange rate effects).
At 27.3 percent, its share of total revenue remained stable year-on-year.
Management Report
GEA Group Q3/2014
7
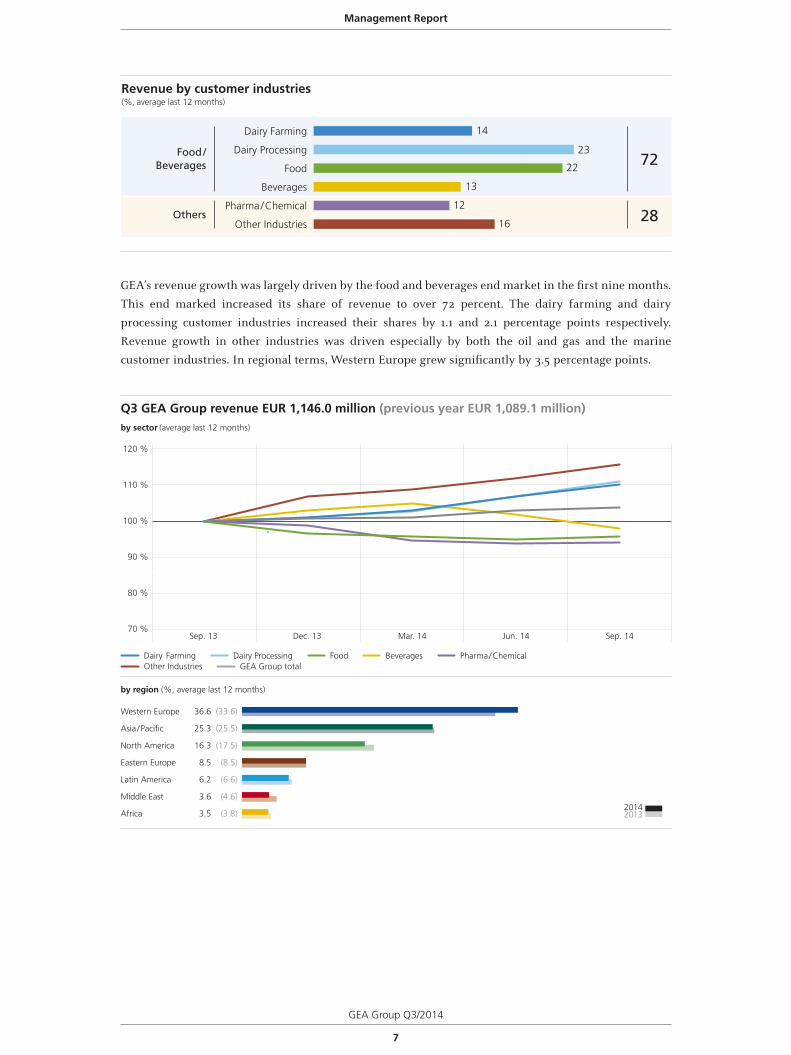
Revenue by customer industries(%, average last 12 months)
Dairy Farming
Dairy Processing
Food
Beverages
Pharma / Chemical
Other Industries
Food /Beverages
Others
72
28
14
23
22
13
12
16
GEA’s revenue growth was largely driven by the food and beverages end market in the first nine months.
This end marked increased its share of revenue to over 72 percent. The dairy farming and dairy
processing customer industries increased their shares by 1.1 and 2.1 percentage points respectively.
Revenue growth in other industries was driven especially by both the oil and gas and the marine
customer industries. In regional terms, Western Europe grew significantly by 3.5 percentage points.
20132014
by region (%, average last 12 months)
Western Europe 36.6 (33.6)
Asia / Pacific 25.3 (25.5)
North America 16.3 (17.5)
Eastern Europe 8.5 (8.5)
Latin America 6.2 (6.6)
Middle East 3.6 (4.6)
Africa 3.5 (3.8)
Q3 GEA Group revenue EUR 1,146.0 million (previous year EUR 1,089.1 million) by sector (average last 12 months)
Dairy Farming Dairy Processing Food Beverages Pharma / Chemical Other Industries GEA Group total
100 %
70 %
90 %
80 %
120 %
110 %
Sep. 13 Dec. 13 Mar. 14 Jun. 14 Sep. 14
Management Report
8
GEA Group Q3/2014
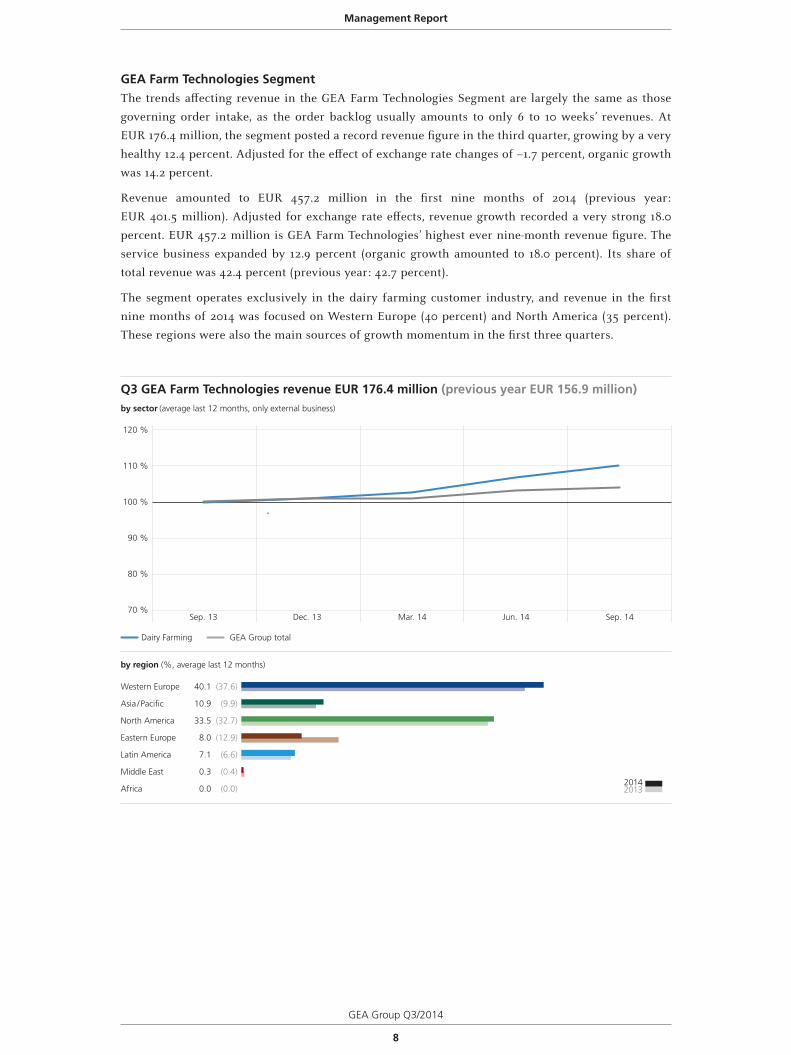
GEA Farm Technologies SegmentThe trends affecting revenue in the GEA Farm Technologies Segment are largely the same as those
governing order intake, as the order backlog usually amounts to only 6 to 10 weeks’ revenues. At
EUR 176.4 million, the segment posted a record revenue figure in the third quarter, growing by a very
healthy 12.4 percent. Adjusted for the effect of exchange rate changes of –1.7 percent, organic growth
was 14.2 percent.
Revenue amounted to EUR 457.2 million in the first nine months of 2014 (previous year:
EUR 401.5 million). Adjusted for exchange rate effects, revenue growth recorded a very strong 18.0
percent. EUR 457.2 million is GEA Farm Technologies’ highest ever nine-month revenue figure. The
service business expanded by 12.9 percent (organic growth amounted to 18.0 percent). Its share of
total revenue was 42.4 percent (previous year: 42.7 percent).
The segment operates exclusively in the dairy farming customer industry, and revenue in the first
nine months of 2014 was focused on Western Europe (40 percent) and North America (35 percent).
These regions were also the main sources of growth momentum in the first three quarters.
20132014
by region (%, average last 12 months)
Western Europe 40.1 (37.6)
Asia / Pacific 10.9 (9.9)
North America 33.5 (32.7)
Eastern Europe 8.0 (12.9)
Latin America 7.1 (6.6)
Middle East 0.3 (0.4)
Africa 0.0 (0.0)
Q3 GEA Farm Technologies revenue EUR 176.4 million (previous year EUR 156.9 million) by sector (average last 12 months, only external business)
Dairy Farming GEA Group total
100 %
70 %
90 %
80 %
120 %
110 %
Sep. 13 Dec. 13 Mar. 14 Jun. 14 Sep. 14
Management Report
GEA Group Q3/2014
9
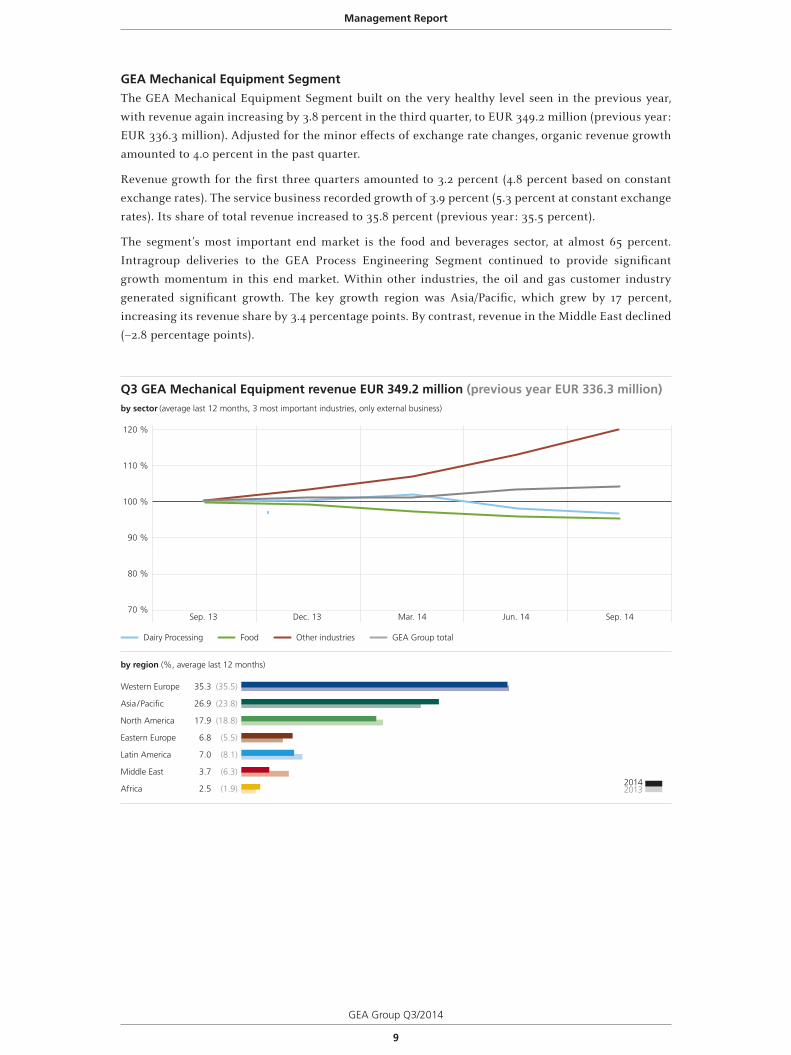
GEA Mechanical Equipment Segment The GEA Mechanical Equipment Segment built on the very healthy level seen in the previous year,
with revenue again increasing by 3.8 percent in the third quarter, to EUR 349.2 million (previous year:
EUR 336.3 million). Adjusted for the minor effects of exchange rate changes, organic revenue growth
amounted to 4.0 percent in the past quarter.
Revenue growth for the first three quarters amounted to 3.2 percent (4.8 percent based on constant
exchange rates). The service business recorded growth of 3.9 percent (5.3 percent at constant exchange
rates). Its share of total revenue increased to 35.8 percent (previous year: 35.5 percent).
The segment’s most important end market is the food and beverages sector, at almost 65 percent.
Intragroup deliveries to the GEA Process Engineering Segment continued to provide significant
growth momentum in this end market. Within other industries, the oil and gas customer industry
generated significant growth. The key growth region was Asia/Pacific, which grew by 17 percent,
increasing its revenue share by 3.4 percentage points. By contrast, revenue in the Middle East declined
(–2.8 percentage points).
20132014
by region (%, average last 12 months)
Western Europe 35.3 (35.5)
Asia / Pacific 26.9 (23.8)
North America 17.9 (18.8)
Eastern Europe 6.8 (5.5)
Latin America 7.0 (8.1)
Middle East 3.7 (6.3)
Africa 2.5 (1.9)
Dairy Processing Food Other industries GEA Group total
Q3 GEA Mechanical Equipment revenue EUR 349.2 million (previous year EUR 336.3 million) by sector (average last 12 months, 3 most important industries, only external business)
100 %
70 %
90 %
80 %
120 %
110 %
Sep. 13 Dec. 13 Mar. 14 Jun. 14 Sep. 14
Management Report
10
GEA Group Q3/2014
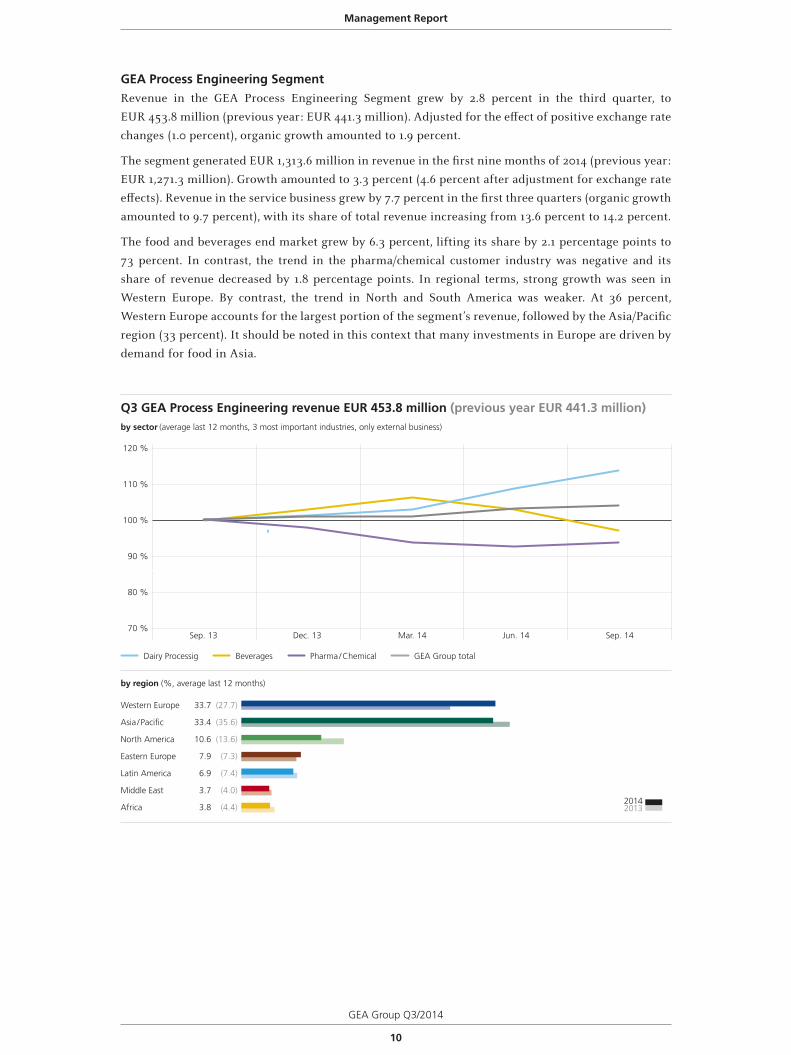
GEA Process Engineering SegmentRevenue in the GEA Process Engineering Segment grew by 2.8 percent in the third quarter, to
EUR 453.8 million (previous year: EUR 441.3 million). Adjusted for the effect of positive exchange rate
changes (1.0 percent), organic growth amounted to 1.9 percent.
The segment generated EUR 1,313.6 million in revenue in the first nine months of 2014 (previous year:
EUR 1,271.3 million). Growth amounted to 3.3 percent (4.6 percent after adjustment for exchange rate
effects). Revenue in the service business grew by 7.7 percent in the first three quarters (organic growth
amounted to 9.7 percent), with its share of total revenue increasing from 13.6 percent to 14.2 percent.
The food and beverages end market grew by 6.3 percent, lifting its share by 2.1 percentage points to
73 percent. In contrast, the trend in the pharma/chemical customer industry was negative and its
share of revenue decreased by 1.8 percentage points. In regional terms, strong growth was seen in
Western Europe. By contrast, the trend in North and South America was weaker. At 36 percent,
Western Europe accounts for the largest portion of the segment’s revenue, followed by the Asia/Pacific
region (33 percent). It should be noted in this context that many investments in Europe are driven by
demand for food in Asia.
20132014
by region (%, average last 12 months)
Western Europe 33.7 (27.7)
Asia / Pacific 33.4 (35.6)
North America 10.6 (13.6)
Eastern Europe 7.9 (7.3)
Latin America 6.9 (7.4)
Middle East 3.7 (4.0)
Africa 3.8 (4.4)
Dairy Processig Beverages Pharma / Chemical GEA Group total
Q3 GEA Process Engineering revenue EUR 453.8 million (previous year EUR 441.3 million) by sector (average last 12 months, 3 most important industries, only external business)
100 %
70 %
90 %
80 %
120 %
110 %
Sep. 13 Dec. 13 Mar. 14 Jun. 14 Sep. 14
Management Report
GEA Group Q3/2014
11
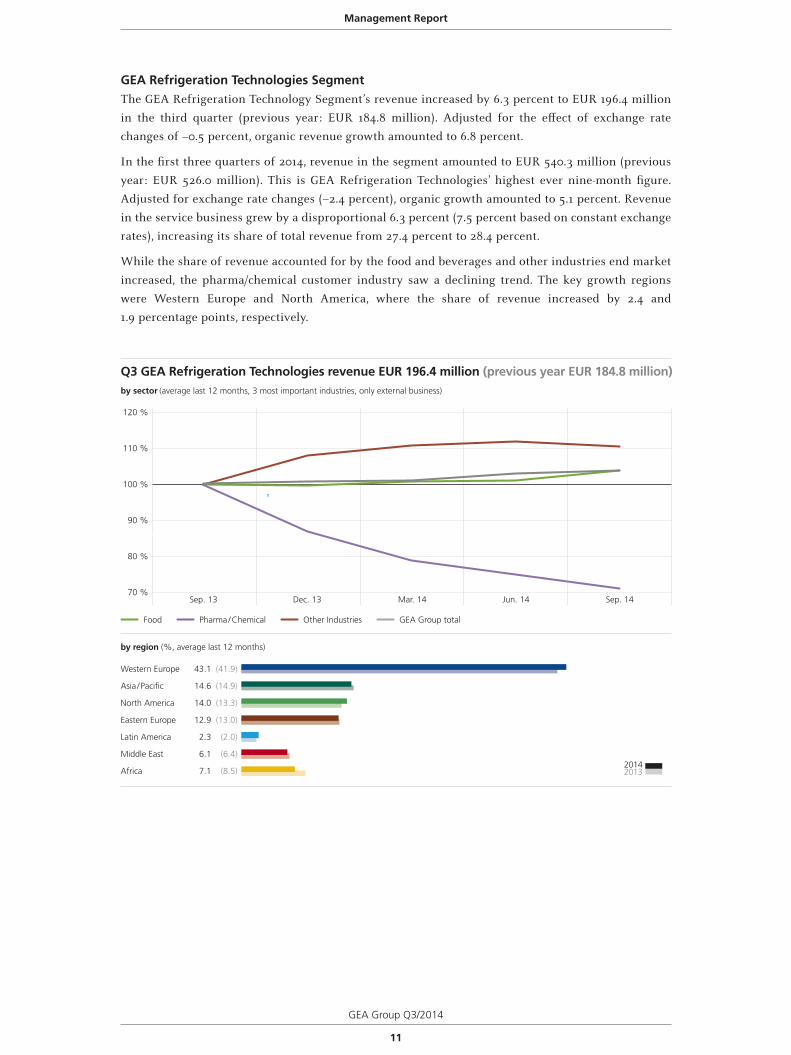
GEA Refrigeration Technologies SegmentThe GEA Refrigeration Technology Segment’s revenue increased by 6.3 percent to EUR 196.4 million
in the third quarter (previous year: EUR 184.8 million). Adjusted for the effect of exchange rate
changes of –0.5 percent, organic revenue growth amounted to 6.8 percent.
In the first three quarters of 2014, revenue in the segment amounted to EUR 540.3 million (previous
year: EUR 526.0 million). This is GEA Refrigeration Technologies’ highest ever nine-month figure.
Adjusted for exchange rate changes (–2.4 percent), organic growth amounted to 5.1 percent. Revenue
in the service business grew by a disproportional 6.3 percent (7.5 percent based on constant exchange
rates), increasing its share of total revenue from 27.4 percent to 28.4 percent.
While the share of revenue accounted for by the food and beverages and other industries end market
increased, the pharma/chemical customer industry saw a declining trend. The key growth regions
were Western Europe and North America, where the share of revenue increased by 2.4 and
1.9 percentage points, respectively.
Q3 GEA Refrigeration Technologies revenue EUR 196.4 million (previous year EUR 184.8 million) by sector (average last 12 months, 3 most important industries, only external business)
20132014
by region (%, average last 12 months)
Western Europe 43.1 (41.9)
Asia / Pacific 14.6 (14.9)
North America 14.0 (13.3)
Eastern Europe 12.9 (13.0)
Latin America 2.3 (2.0)
Middle East 6.1 (6.4)
Africa 7.1 (8.5)
Food Pharma / Chemical Other Industries GEA Group total
100 %
70 %
90 %
80 %
120 %
110 %
Sep. 13 Dec. 13 Mar. 14 Jun. 14 Sep. 14
Management Report
12
GEA Group Q3/2014
Results of operations, financial position and net assets
Results of operations
GEA remains committed to its policy of consciously selecting orders on the basis of their price quality
and contract terms. This is reflected in the multi-stage approval process for major customer projects.
Whenever operating profit is referred to in the following, this relates on the one hand to the adjustment
of the purchase price allocation effects that were determined for all material past acquisitions, and on
the other hand to the adjustment of expenses for strategic projects, income from the remeasurement
of noncurrent provisions relating to former mining activities, and the contingent allocation of
management fees and trademark fees required in accordance with IFRSs.
The key earnings figures for the first nine months of fiscal year 2014 were adjusted overall for
nonrecurring expenses of EUR 16.1 million (previous year: EUR 9.2 million). These expenses are
attributable to strategic projects (EUR 17.2 million, against the prior-year figure of EUR 3.7 million),
income from the remeasurement of noncurrent provisions (EUR 4.5 million, against the prior-year
figure of EUR 0.0 million), as well as to the fact that management and trademark fees previously
allocated to GEA Heat Exchangers must now be allocated to continuing operations, including the
holding company, in accordance with IFRSs. These fees amounted to EUR 3.4 million in the first nine
months of the year (previous year: EUR 5.5 million; see page 50f.).
EBITDA in the third quarter of 2014 amounted to EUR 140.0 million, up precisely EUR 10.0 million on
the figure for the previous year of EUR 130.0 million. This corresponds to an EBITDA margin of 12.2
percent – a year-on-year rise of 28 basis points. Adjusted for nonrecurring items of EUR 9.1 million
(previous year: EUR 3.6 million), operating EBITDA amounted to EUR 149.0 million (previous year:
EUR 133.5 million). The figure for operating EBITDA already contains EUR –0.8 million in adjustments
for exchange rate effects. At 13.0 percent, the operating EBITDA margin was up 74 basis points year-
on-year.
At EUR 346.1 million, EBITDA for the first nine months was up EUR 31.2 million, or 9.9 percent, on
the figure for the previous year (EUR 314.9 million). The EBITDA margin rose by 54 basis points to
10.8 percent. Operating EBITDA, which already includes burden of EUR –6.3 million for exchange rate
effects, improved by EUR 37.9 million to EUR 362.2 million (previous year: EUR 324.3 million). At 11.3
percent, the operating EBITDA margin was up 73 basis points year-on-year.
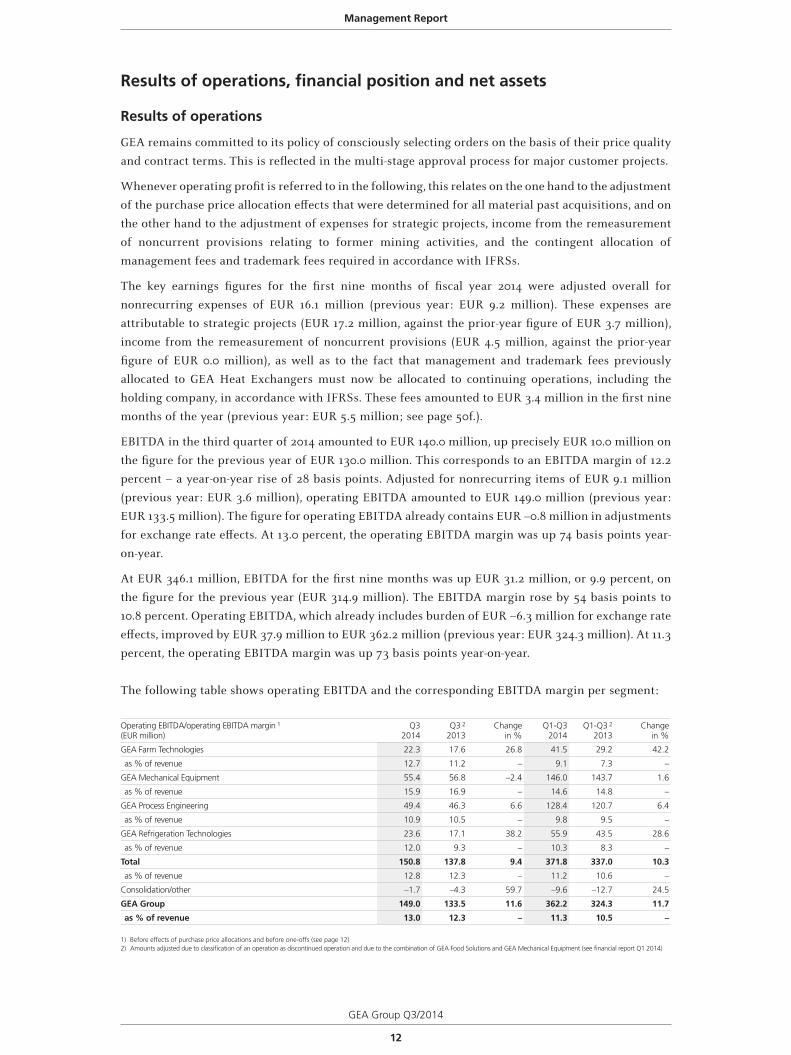
The following table shows operating EBITDA and the corresponding EBITDA margin per segment:
Operating EBITDA/operating EBITDA margin 1
(EUR million)Q3
2014Q3 2
2013Change
in %Q1-Q3
2014Q1-Q3 2
2013Change
in %
GEA Farm Technologies 22.3 17.6 26.8 41.5 29.2 42.2
as % of revenue 12.7 11.2 – 9.1 7.3 –
GEA Mechanical Equipment 55.4 56.8 –2.4 146.0 143.7 1.6
as % of revenue 15.9 16.9 – 14.6 14.8 –
GEA Process Engineering 49.4 46.3 6.6 128.4 120.7 6.4
as % of revenue 10.9 10.5 – 9.8 9.5 –
GEA Refrigeration Technologies 23.6 17.1 38.2 55.9 43.5 28.6
as % of revenue 12.0 9.3 – 10.3 8.3 –
Total 150.8 137.8 9.4 371.8 337.0 10.3
as % of revenue 12.8 12.3 – 11.2 10.6 –
Consolidation/other –1.7 –4.3 59.7 –9.6 –12.7 24.5
GEA Group 149.0 133.5 11.6 362.2 324.3 11.7
as % of revenue 13.0 12.3 – 11.3 10.5 –
1) Before effects of purchase price allocations and before one-offs (see page 12)2) Amounts adjusted due to classification of an operation as discontinued operation and due to the combination of GEA Food Solutions and GEA Mechanical Equipment (see financial report Q1 2014)
Management Report
GEA Group Q3/2014
13
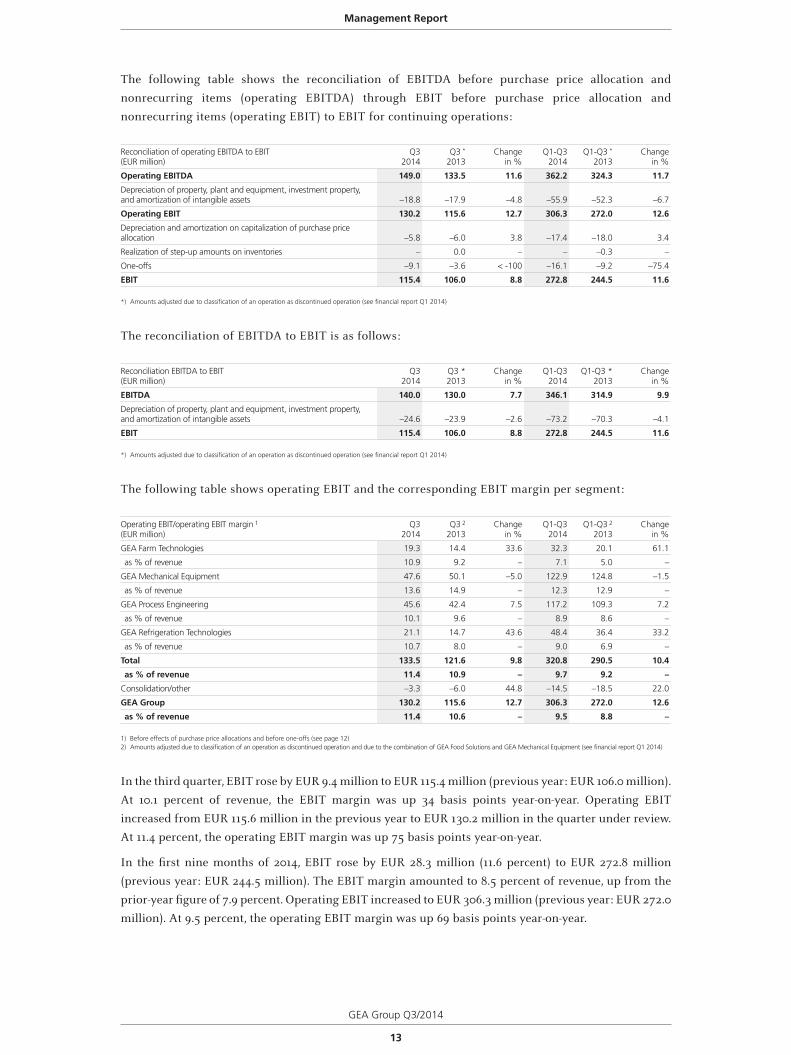
The following table shows the reconciliation of EBITDA before purchase price allocation and
nonrecurring items (operating EBITDA) through EBIT before purchase price allocation and
nonrecurring items (operating EBIT) to EBIT for continuing operations:
Reconciliation of operating EBITDA to EBIT(EUR million)
Q32014
Q3 *
2013Change
in %Q1-Q3
2014Q1-Q3 *
2013Change
in %
Operating EBITDA 149.0 133.5 11.6 362.2 324.3 11.7
Depreciation of property, plant and equipment, investment property, and amortization of intangible assets –18.8 –17.9 –4.8 –55.9 –52.3 –6.7
Operating EBIT 130.2 115.6 12.7 306.3 272.0 12.6
Depreciation and amortization on capitalization of purchase price allocation –5.8 –6.0 3.8 –17.4 –18.0 3.4
Realization of step-up amounts on inventories – 0.0 – – –0.3 –
One-offs –9.1 –3.6 < -100 –16.1 –9.2 –75.4
EBIT 115.4 106.0 8.8 272.8 244.5 11.6
*) Amounts adjusted due to classification of an operation as discontinued operation (see financial report Q1 2014)
The reconciliation of EBITDA to EBIT is as follows:
Reconciliation EBITDA to EBIT(EUR million)
Q32014
Q3 *2013
Changein %
Q1-Q32014
Q1-Q3 *2013
Changein %
EBITDA 140.0 130.0 7.7 346.1 314.9 9.9
Depreciation of property, plant and equipment, investment property, and amortization of intangible assets –24.6 –23.9 –2.6 –73.2 –70.3 –4.1
EBIT 115.4 106.0 8.8 272.8 244.5 11.6
*) Amounts adjusted due to classification of an operation as discontinued operation (see financial report Q1 2014)
The following table shows operating EBIT and the corresponding EBIT margin per segment:
Operating EBIT/operating EBIT margin 1
(EUR million)Q3
2014Q3 2
2013Change
in %Q1-Q3
2014Q1-Q3 2
2013Change
in %
GEA Farm Technologies 19.3 14.4 33.6 32.3 20.1 61.1
as % of revenue 10.9 9.2 – 7.1 5.0 –
GEA Mechanical Equipment 47.6 50.1 –5.0 122.9 124.8 –1.5
as % of revenue 13.6 14.9 – 12.3 12.9 –
GEA Process Engineering 45.6 42.4 7.5 117.2 109.3 7.2
as % of revenue 10.1 9.6 – 8.9 8.6 –
GEA Refrigeration Technologies 21.1 14.7 43.6 48.4 36.4 33.2
as % of revenue 10.7 8.0 – 9.0 6.9 –
Total 133.5 121.6 9.8 320.8 290.5 10.4
as % of revenue 11.4 10.9 – 9.7 9.2 –
Consolidation/other –3.3 –6.0 44.8 –14.5 –18.5 22.0
GEA Group 130.2 115.6 12.7 306.3 272.0 12.6
as % of revenue 11.4 10.6 – 9.5 8.8 –
1) Before effects of purchase price allocations and before one-offs (see page 12)2) Amounts adjusted due to classification of an operation as discontinued operation and due to the combination of GEA Food Solutions and GEA Mechanical Equipment (see financial report Q1 2014)
In the third quarter, EBIT rose by EUR 9.4 million to EUR 115.4 million (previous year: EUR 106.0 million).
At 10.1 percent of revenue, the EBIT margin was up 34 basis points year-on-year. Operating EBIT
increased from EUR 115.6 million in the previous year to EUR 130.2 million in the quarter under review.
At 11.4 percent, the operating EBIT margin was up 75 basis points year-on-year.
In the first nine months of 2014, EBIT rose by EUR 28.3 million (11.6 percent) to EUR 272.8 million
(previous year: EUR 244.5 million). The EBIT margin amounted to 8.5 percent of revenue, up from the
prior-year figure of 7.9 percent. Operating EBIT increased to EUR 306.3 million (previous year: EUR 272.0
million). At 9.5 percent, the operating EBIT margin was up 69 basis points year-on-year.
Management Report
14
GEA Group Q3/2014
Key figures: Results of operations(EUR million)
Q32014
Q3 1
2013Change
in %Q1-Q3
2014Q1-Q3 1
2013Change
in %
Revenue 1,146.0 1,089.1 5.2 3,214.3 3,077.8 4.4
Operating EBITDA 2 149.0 133.5 11.6 362.2 324.3 11.7
EBITDA 140.0 130.0 7.7 346.1 314.9 9.9
Operating EBIT 2 130.2 115.6 12.7 306.3 272.0 12.6
EBIT 115.4 106.0 8.8 272.8 244.5 11.6
Interest 20.1 18.5 8.7 57.7 47.1 22.4
EBT 95.3 87.5 8.9 215.1 197.4 9.0
Income taxes 20.4 19.1 6.6 46.0 42.5 8.4
Profit after tax from continuing operations 74.9 68.4 9.5 169.1 154.9 9.1
Profit/loss after tax from discontinued operations –0.3 14.7 – 33.6 44.4 –24.4
Profit for the period 74.6 83.1 –10.2 202.6 199.3 1.7
1) Amounts adjusted due to classification of an operation as discontinued operation (see financial report Q1 2014)2) Before effects of purchase price allocations and before one-offs (see page 12)
Net interest income amounted to EUR –57.7 million in the first nine months of the year, following
EUR –47.1 million in the previous year. The change of EUR –10.6 million is mainly attributable to the
changes in the discount rate used to measure noncurrent provisions, which amounted to EUR 19.1
million. All other components of net interest income resulted in a EUR 8.5 million reduction overall
in the negative impact on earnings.
EBT in the third quarter of 2014 amounted to EUR 95.3 million, EUR 7.8 million higher than the figure
for the previous year (EUR 87.5 million). At 8.3 percent, the EBT margin recorded an improvement on
the prior-year figure (8.0 percent).
In the first three quarters, EBT increased to EUR 215.1 million (previous year: EUR 197.4 million). The
corresponding EBT margin improved by 28 basis points to 6.7 percent.
An income tax rate of 21.4 percent is expected for fiscal year 2014; the tax expense for the first nine
months of 2014 was calculated using this figure. On this basis, the income tax expense was EUR 20.4
million in the third quarter (previous year: EUR 19.1 million) and EUR 46.0 million in the first nine
months of the year (previous year: EUR 42.5 million).
Due to the EUR 22.4 million impairment loss on the carrying amount of disposal group GEA Heat
Exchangers, discontinued operations generated a loss of EUR 0.3 million in the quarter under review,
compared with a profit of EUR 14.7 million in the prior-year period.
Profit from discontinued operations amounted to EUR 33.6 million in the first nine months of 2014
(previous year: EUR 44.4 million). The GEA Heat Exchangers Segment accounted for EUR 33.7 million
of this amount (previous year: EUR 50.4 million). Further disclosures on the business performance of
the GEA Heat Exchangers Segment and the other companies can be found in the chapter entitled
“Performance of Discontinued Operations” (see page 20f.).
Consolidated profit, which is almost completely attributable to GEA Group Aktiengesellschaft
shareholders, amounted to EUR 74.6 million in the third quarter of 2014 (previous year: EUR 83.1 million).
Taking into account the unchanged average number of shares compared with the previous year
(192,495,476), this corresponds to earnings per share of EUR 0.39 (previous year: EUR 0.43).
Consolidated profit for the first three quarters amounted to EUR 202.6 million (previous year:
EUR 199.3 million). EUR 202.5 million of this amount (previous year: EUR 199.2 million) is attributable
to GEA Group Aktiengesellschaft shareholders. This corresponds to earnings per share of EUR 1.05
(previous year: EUR 1.03).
Management Report
GEA Group Q3/2014
15
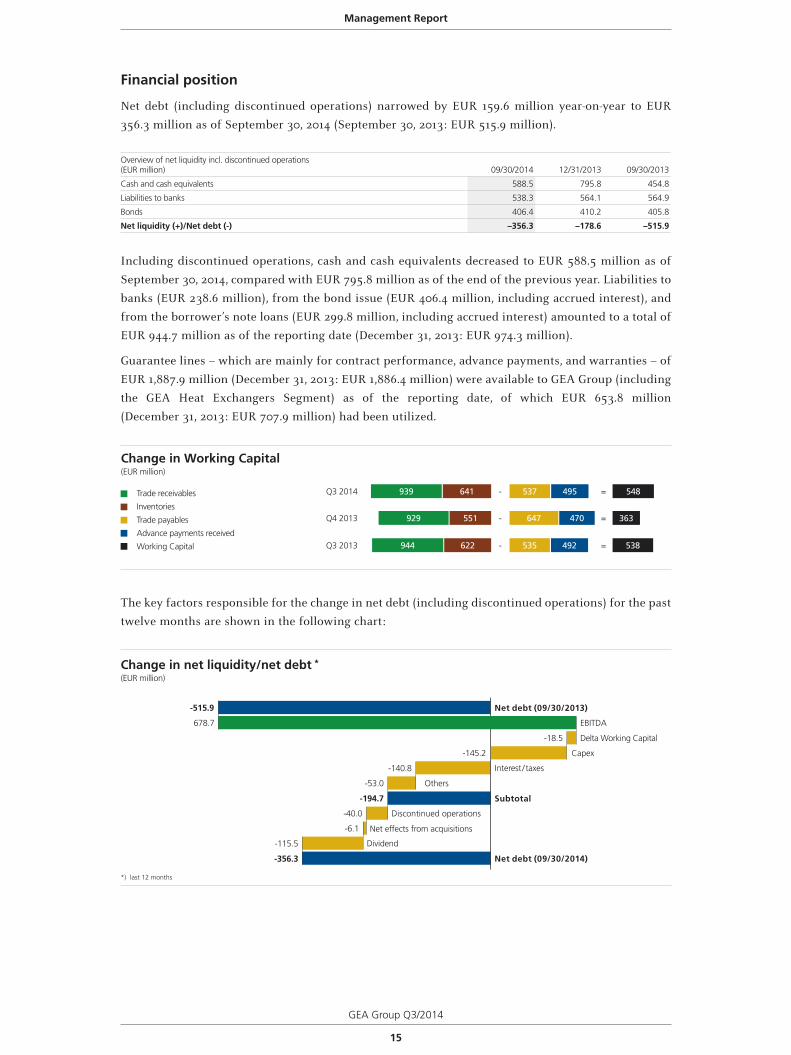
Financial position
Net debt (including discontinued operations) narrowed by EUR 159.6 million year-on-year to EUR
356.3 million as of September 30, 2014 (September 30, 2013: EUR 515.9 million).
Overview of net liquidity incl. discontinued operations(EUR million) 09/30/2014 12/31/2013 09/30/2013
Cash and cash equivalents 588.5 795.8 454.8
Liabilities to banks 538.3 564.1 564.9
Bonds 406.4 410.2 405.8
Net liquidity (+)/Net debt (-) –356.3 –178.6 –515.9
Including discontinued operations, cash and cash equivalents decreased to EUR 588.5 million as of
September 30, 2014, compared with EUR 795.8 million as of the end of the previous year. Liabilities to
banks (EUR 238.6 million), from the bond issue (EUR 406.4 million, including accrued interest), and
from the borrower’s note loans (EUR 299.8 million, including accrued interest) amounted to a total of
EUR 944.7 million as of the reporting date (December 31, 2013: EUR 974.3 million).
Guarantee lines – which are mainly for contract performance, advance payments, and warranties – of
EUR 1,887.9 million (December 31, 2013: EUR 1,886.4 million) were available to GEA Group (including
the GEA Heat Exchangers Segment) as of the reporting date, of which EUR 653.8 million
(December 31, 2013: EUR 707.9 million) had been utilized.
Change in Working Capital(EUR million)
Trade receivables
Inventories
Trade payables
Advance payments received
Working Capital
Q4 2013
Q3 2014
Q3 2013
363- =470647929 551
548- =495537939 641
538- =492535944 622
The key factors responsible for the change in net debt (including discontinued operations) for the past
twelve months are shown in the following chart:
Change in net liquidity/net debt *
(EUR million)
Net debt (09/30/2014)
Net debt (09/30/2013)
Subtotal
-53.0
-40.0
-6.1
-115.5
-356.3
-515.9
-194.7
678.7
-145.2 Capex
Delta Working Capital
EBITDA
Others
Net effects from acquisitions
Dividend
-140.8 Interest / taxes
Discontinued operations
*) last 12 months
-18.5
Management Report
16
GEA Group Q3/2014
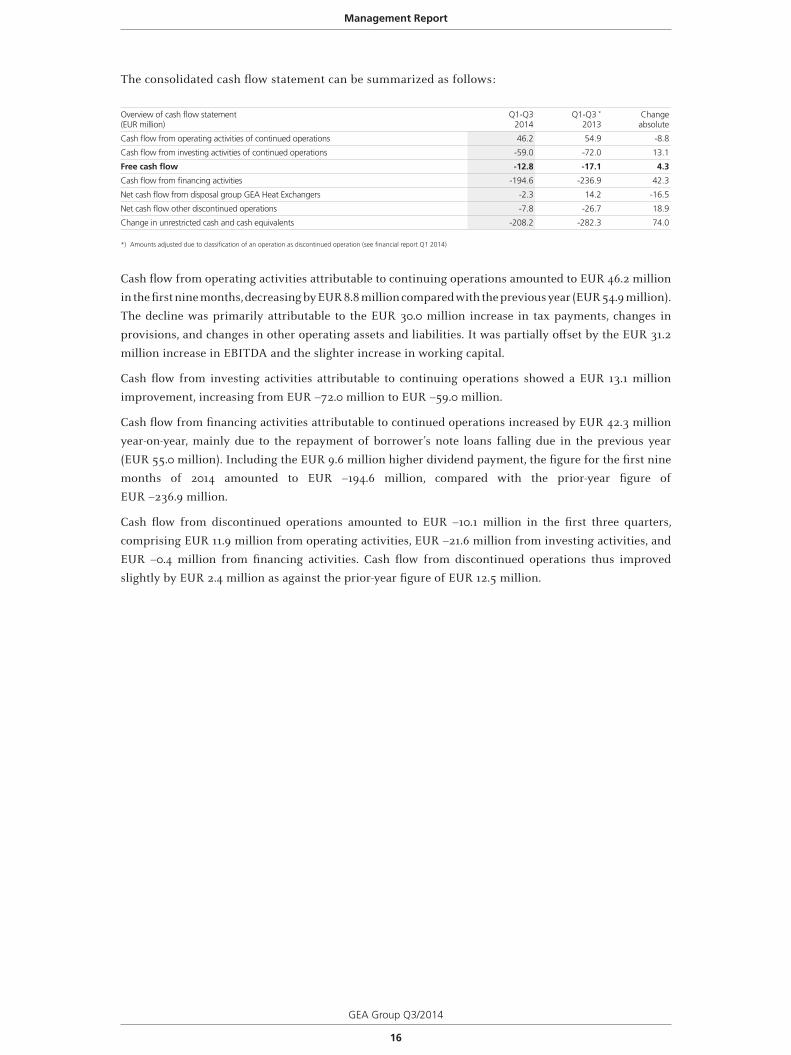
The consolidated cash flow statement can be summarized as follows:
Overview of cash flow statement(EUR million)
Q1-Q32014
Q1-Q3 *
2013Changeabsolute
Cash flow from operating activities of continued operations 46.2 54.9 -8.8
Cash flow from investing activities of continued operations -59.0 -72.0 13.1
Free cash flow -12.8 -17.1 4.3
Cash flow from financing activities -194.6 -236.9 42.3
Net cash flow from disposal group GEA Heat Exchangers -2.3 14.2 -16.5
Net cash flow other discontinued operations -7.8 -26.7 18.9
Change in unrestricted cash and cash equivalents -208.2 -282.3 74.0
*) Amounts adjusted due to classification of an operation as discontinued operation (see financial report Q1 2014)
Cash flow from operating activities attributable to continuing operations amounted to EUR 46.2 million
in the first nine months, decreasing by EUR 8.8 million compared with the previous year (EUR 54.9 million).
The decline was primarily attributable to the EUR 30.0 million increase in tax payments, changes in
provisions, and changes in other operating assets and liabilities. It was partially offset by the EUR 31.2
million increase in EBITDA and the slighter increase in working capital.
Cash flow from investing activities attributable to continuing operations showed a EUR 13.1 million
improvement, increasing from EUR –72.0 million to EUR –59.0 million.
Cash flow from financing activities attributable to continued operations increased by EUR 42.3 million
year-on-year, mainly due to the repayment of borrower’s note loans falling due in the previous year
(EUR 55.0 million). Including the EUR 9.6 million higher dividend payment, the figure for the first nine
months of 2014 amounted to EUR –194.6 million, compared with the prior-year figure of
EUR –236.9 million.
Cash flow from discontinued operations amounted to EUR –10.1 million in the first three quarters,
comprising EUR 11.9 million from operating activities, EUR –21.6 million from investing activities, and
EUR –0.4 million from financing activities. Cash flow from discontinued operations thus improved
slightly by EUR 2.4 million as against the prior-year figure of EUR 12.5 million.
Management Report
GEA Group Q3/2014
17
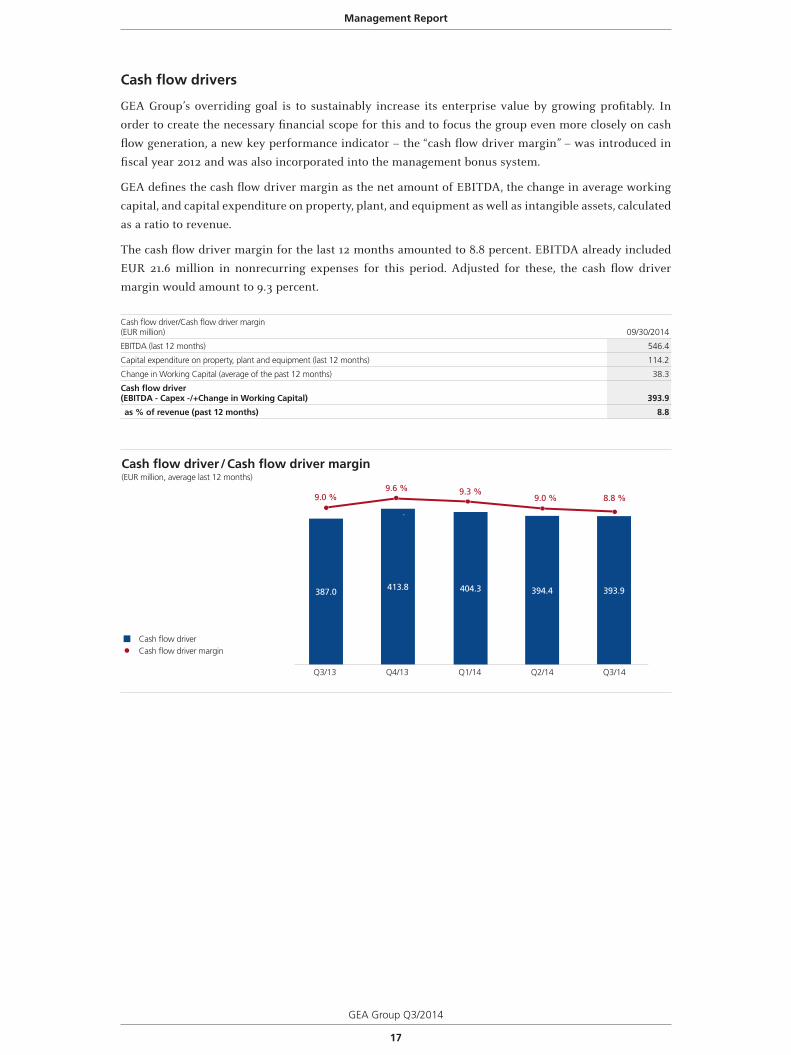
Cash flow drivers
GEA Group’s overriding goal is to sustainably increase its enterprise value by growing profitably. In
order to create the necessary financial scope for this and to focus the group even more closely on cash
flow generation, a new key performance indicator – the “cash flow driver margin” – was introduced in
fiscal year 2012 and was also incorporated into the management bonus system.
GEA defines the cash flow driver margin as the net amount of EBITDA, the change in average working
capital, and capital expenditure on property, plant, and equipment as well as intangible assets, calculated
as a ratio to revenue.
The cash flow driver margin for the last 12 months amounted to 8.8 percent. EBITDA already included
EUR 21.6 million in nonrecurring expenses for this period. Adjusted for these, the cash flow driver
margin would amount to 9.3 percent.
Cash flow driver/Cash flow driver margin(EUR million) 09/30/2014
EBITDA (last 12 months) 546.4
Capital expenditure on property, plant and equipment (last 12 months) 114.2
Change in Working Capital (average of the past 12 months) 38.3
Cash flow driver(EBITDA - Capex -/+Change in Working Capital) 393.9
as % of revenue (past 12 months) 8.8
Q1/14
387.0
Q4/13Q3/13 Q2/14
413.8
Cash flow driver / Cash flow driver margin(EUR million, average last 12 months)
Cash flow driverCash flow driver margin
9.0 %9.6 % 9.3 %
Q3/14
394.4 393.9404.3
9.0 % 8.8 %
Management Report
18
GEA Group Q3/2014
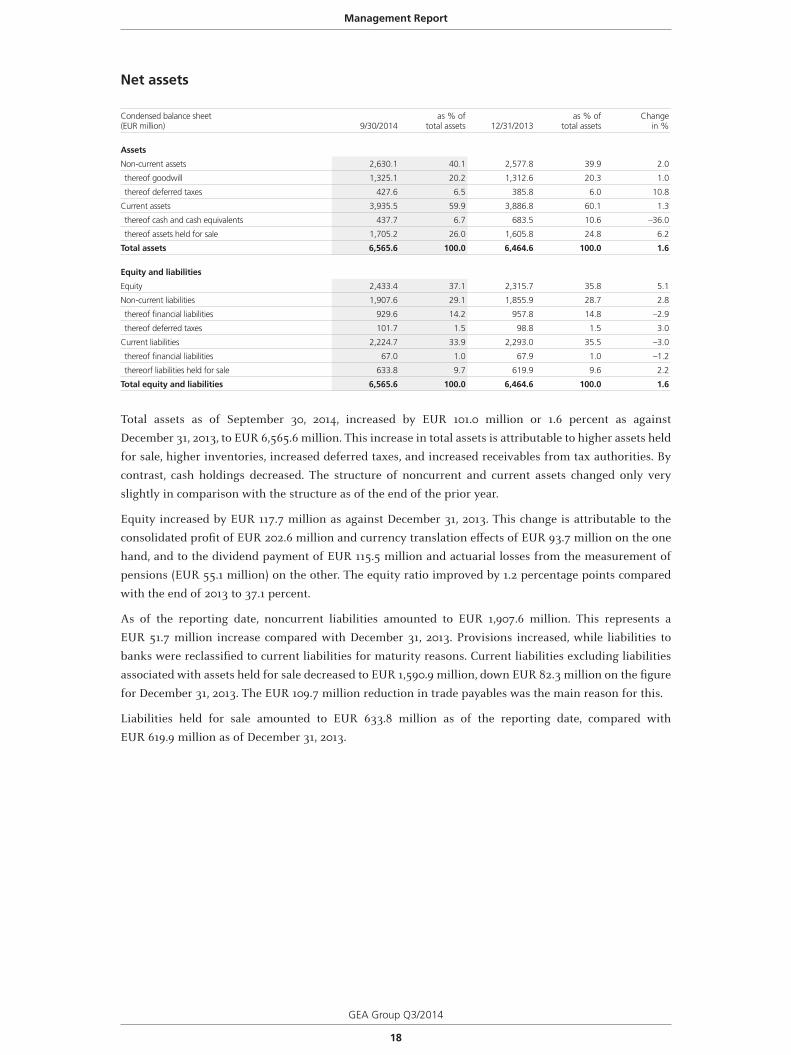
Net assets
Condensed balance sheet(EUR million) 9/30/2014
as % oftotal assets 12/31/2013
as % oftotal assets
Changein %
Assets
Non-current assets 2,630.1 40.1 2,577.8 39.9 2.0
thereof goodwill 1,325.1 20.2 1,312.6 20.3 1.0
thereof deferred taxes 427.6 6.5 385.8 6.0 10.8
Current assets 3,935.5 59.9 3,886.8 60.1 1.3
thereof cash and cash equivalents 437.7 6.7 683.5 10.6 –36.0
thereof assets held for sale 1,705.2 26.0 1,605.8 24.8 6.2
Total assets 6,565.6 100.0 6,464.6 100.0 1.6
Equity and liabilities
Equity 2,433.4 37.1 2,315.7 35.8 5.1
Non-current liabilities 1,907.6 29.1 1,855.9 28.7 2.8
thereof financial liabilities 929.6 14.2 957.8 14.8 –2.9
thereof deferred taxes 101.7 1.5 98.8 1.5 3.0
Current liabilities 2,224.7 33.9 2,293.0 35.5 –3.0
thereof financial liabilities 67.0 1.0 67.9 1.0 –1.2
thereorf liabilities held for sale 633.8 9.7 619.9 9.6 2.2
Total equity and liabilities 6,565.6 100.0 6,464.6 100.0 1.6
Total assets as of September 30, 2014, increased by EUR 101.0 million or 1.6 percent as against
December 31, 2013, to EUR 6,565.6 million. This increase in total assets is attributable to higher assets held
for sale, higher inventories, increased deferred taxes, and increased receivables from tax authorities. By
contrast, cash holdings decreased. The structure of noncurrent and current assets changed only very
slightly in comparison with the structure as of the end of the prior year.
Equity increased by EUR 117.7 million as against December 31, 2013. This change is attributable to the
consolidated profit of EUR 202.6 million and currency translation effects of EUR 93.7 million on the one
hand, and to the dividend payment of EUR 115.5 million and actuarial losses from the measurement of
pensions (EUR 55.1 million) on the other. The equity ratio improved by 1.2 percentage points compared
with the end of 2013 to 37.1 percent.
As of the reporting date, noncurrent liabilities amounted to EUR 1,907.6 million. This represents a
EUR 51.7 million increase compared with December 31, 2013. Provisions increased, while liabilities to
banks were reclassified to current liabilities for maturity reasons. Current liabilities excluding liabilities
associated with assets held for sale decreased to EUR 1,590.9 million, down EUR 82.3 million on the figure
for December 31, 2013. The EUR 109.7 million reduction in trade payables was the main reason for this.
Liabilities held for sale amounted to EUR 633.8 million as of the reporting date, compared with
EUR 619.9 million as of December 31, 2013.
Management Report
GEA Group Q3/2014
19
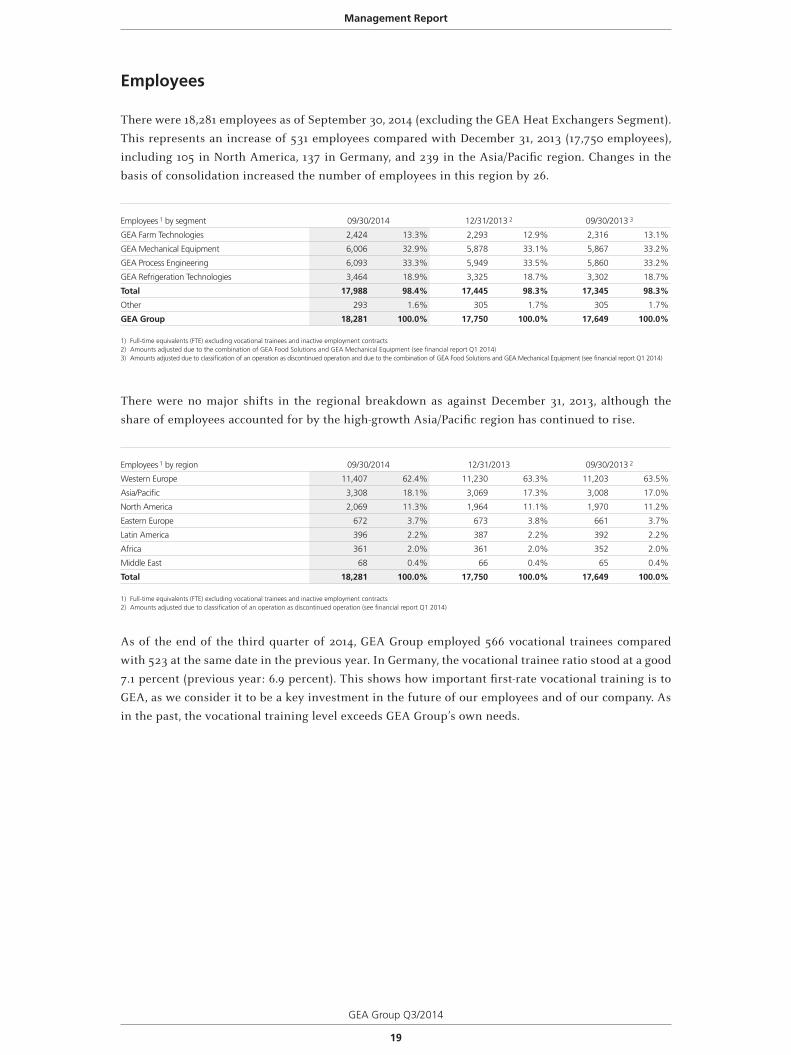
Employees
There were 18,281 employees as of September 30, 2014 (excluding the GEA Heat Exchangers Segment).
This represents an increase of 531 employees compared with December 31, 2013 (17,750 employees),
including 105 in North America, 137 in Germany, and 239 in the Asia/Pacific region. Changes in the
basis of consolidation increased the number of employees in this region by 26.
Employees 1 by segment 09/30/2014 12/31/2013 2 09/30/2013 3
GEA Farm Technologies 2,424 13.3% 2,293 12.9% 2,316 13.1%
GEA Mechanical Equipment 6,006 32.9% 5,878 33.1% 5,867 33.2%
GEA Process Engineering 6,093 33.3% 5,949 33.5% 5,860 33.2%
GEA Refrigeration Technologies 3,464 18.9% 3,325 18.7% 3,302 18.7%
Total 17,988 98.4% 17,445 98.3% 17,345 98.3%
Other 293 1.6% 305 1.7% 305 1.7%
GEA Group 18,281 100.0% 17,750 100.0% 17,649 100.0%
1) Full-time equivalents (FTE) excluding vocational trainees and inactive employment contracts2) Amounts adjusted due to the combination of GEA Food Solutions and GEA Mechanical Equipment (see financial report Q1 2014)3) Amounts adjusted due to classification of an operation as discontinued operation and due to the combination of GEA Food Solutions and GEA Mechanical Equipment (see financial report Q1 2014)
There were no major shifts in the regional breakdown as against December 31, 2013, although the
share of employees accounted for by the high-growth Asia/Pacific region has continued to rise.
Employees 1 by region 09/30/2014 12/31/2013 09/30/2013 2
Western Europe 11,407 62.4% 11,230 63.3% 11,203 63.5%
Asia/Pacific 3,308 18.1% 3,069 17.3% 3,008 17.0%
North America 2,069 11.3% 1,964 11.1% 1,970 11.2%
Eastern Europe 672 3.7% 673 3.8% 661 3.7%
Latin America 396 2.2% 387 2.2% 392 2.2%
Africa 361 2.0% 361 2.0% 352 2.0%
Middle East 68 0.4% 66 0.4% 65 0.4%
Total 18,281 100.0% 17,750 100.0% 17,649 100.0%
1) Full-time equivalents (FTE) excluding vocational trainees and inactive employment contracts2) Amounts adjusted due to classification of an operation as discontinued operation (see financial report Q1 2014)
As of the end of the third quarter of 2014, GEA Group employed 566 vocational trainees compared
with 523 at the same date in the previous year. In Germany, the vocational trainee ratio stood at a good
7.1 percent (previous year: 6.9 percent). This shows how important first-rate vocational training is to
GEA, as we consider it to be a key investment in the future of our employees and of our company. As
in the past, the vocational training level exceeds GEA Group’s own needs.
Management Report
20
GEA Group Q3/2014
Research and development
In the first three quarters of 2014, direct expenses for research and development (R&D) amounted to
EUR 60.7 million, compared with EUR 54.5 million in the prior-year period. These figures include
refunded expenses (contract costs), which are reported in the cost of sales and which totaled EUR 7.7
million (previous year: EUR 8.7 million). The R&D ratio amounted to 1.9 percent of revenue (previous
year: 1.8 percent).
Research and development (R&D) expenses(EUR million)
Q3 2014
Q3 *
2013Change
in %Q1-Q3
2014Q1-Q3 *
2013Change
in %
Refunded expenses (“contract costs”) 2.8 2.7 6.9 7.7 8.7 –11.2
Non-refunded R&D expenses 16.6 15.2 9.8 53.0 45.8 15.6
Total R&D expenses 19.5 17.8 9.4 60.7 54.5 11.3
R&D ratio (as % of revenue) 1.7 1.6 – 1.9 1.8 –
*) Amounts adjusted due to classification of an operation as discontinued operation (see financial report Q1 2014)
Performance of Discontinued Operations
GEA Heat Exchangers
(EUR million)Q3
2014Q3
2013Change
in %Q1-Q3
2014Q1-Q3
2013Change
in %
Order intake 290.2 348.1 –16.6 1,039.9 1,073.5 –3.1
Order backlog * 815.7 799.5 2.0 815.7 799.5 2.0
Sales 377.5 380.8 –0.9 1,044.7 1,084.8 –3.7
Operating EBITDA 43.7 38.6 13.1 102.2 102.3 –0.1
as % of revenue 11.6 10.1 – 9.8 9.4 –
Employees * 7,195 7,244 –0.7 7,195 7,244 –0.7
*) Reporting date
Order intakeIn the first nine months of 2014, order intake in the GEA Heat Exchangers Segment declined by
3.1 percent compared with the prior-year period, to EUR 1,039.9 million. Adjusted for the effect of
exchange rate changes of –2.1 percent, organic growth remained negative, at –1.0 percent.
Order backlogThe order backlog rose slightly by EUR 10.6 million or 1.3 percent compared with December 31, 2013
(EUR 805.1 million), to EUR 815.7 million.
RevenueThe GEA Heat Exchangers Segment’s revenue declined by 3.7 percent to EUR 1,044.7 million in the
first three quarters (previous year: EUR 1,084.8 million). Adjusted for the effect of exchange rate
changes of –2.0 percent, organic growth was negative, at –1.7 percent.
Management Report
GEA Group Q3/2014
21
Results of operationsThe GEA Heat Exchangers Segment’s operating EBITDA was on a level with the previous year in the first
nine months, at EUR 102.2 million, (previous year: EUR 102.3 million), despite the decline in revenue.
The operating EBITDA margin improved accordingly by 36 basis points to 9.8 percent of revenue.
In accordance with the agreement governing the sale of GEA Heat Exchangers, the purchaser is
economically entitled to the profit generated after December 31, 2013. The profit generated in 2014
increased the carrying amount of the GEA Heat Exchangers disposal group.
The carrying amount of the GEA Heat Exchangers disposal group was written down to its fair value
less costs to sell as of September 30, 2014. In addition to the expected transaction costs, costs to sell
include sufficient provisions for contractual warranties associated with the sale and for risk-sharing
obligations for large projects. This led to an impairment loss of EUR 22.4 million in the quarter under
review, which is not included in the figure for operating EBITDA.
EmployeesThe number of employees in the GEA Heat Exchangers Segment amounted to 7,195 as of September 30,
2014, and thus remained almost constant compared with December 31, 2013 (7,201 employees).
Other companies
Other companies classified as discontinued operations did not have a material impact overall on
consolidated profit in the first nine months of 2014. The prior-year figures include expenses of EUR 9.4
million relating to a decision by the French competition authority, as well as offsetting tax effects.
Report on Post-Balance Sheet Date Events
On October 6, 2014, GEA acquired all shares of Dutch company de Klokslag, which is one of the
leading European manufacturers of large-scale equipment for semi-hard cheese production. The
transaction is still subject to antitrust approval.
Report on Risks and Opportunities
There was no significant change in the overall assessment of risks and opportunities compared with
the position presented in the 2013 Annual Report.
All in all, from today’s perspective, there are no risks to the continued existence of GEA Group as a
going concern. Sufficient provisions have been recognized for known risks, in line with the relevant
requirements.
Management Report
22
GEA Group Q3/2014
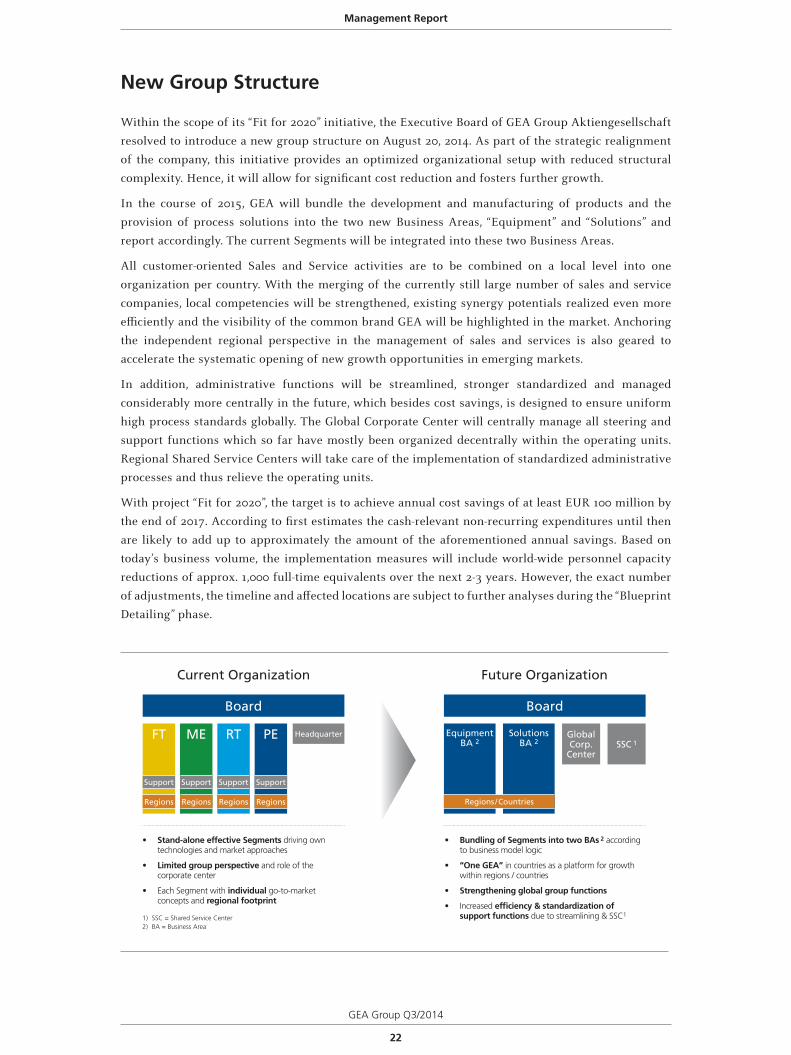
New Group Structure
Within the scope of its “Fit for 2020” initiative, the Executive Board of GEA Group Aktiengesellschaft
resolved to introduce a new group structure on August 20, 2014. As part of the strategic realignment
of the company, this initiative provides an optimized organizational setup with reduced structural
complexity. Hence, it will allow for significant cost reduction and fosters further growth.
In the course of 2015, GEA will bundle the development and manufacturing of products and the
provision of process solutions into the two new Business Areas, “Equipment” and “Solutions” and
report accordingly. The current Segments will be integrated into these two Business Areas.
All customer-oriented Sales and Service activities are to be combined on a local level into one
organization per country. With the merging of the currently still large number of sales and service
companies, local competencies will be strengthened, existing synergy potentials realized even more
efficiently and the visibility of the common brand GEA will be highlighted in the market. Anchoring
the independent regional perspective in the management of sales and services is also geared to
accelerate the systematic opening of new growth opportunities in emerging markets.
In addition, administrative functions will be streamlined, stronger standardized and managed
considerably more centrally in the future, which besides cost savings, is designed to ensure uniform
high process standards globally. The Global Corporate Center will centrally manage all steering and
support functions which so far have mostly been organized decentrally within the operating units.
Regional Shared Service Centers will take care of the implementation of standardized administrative
processes and thus relieve the operating units.
With project “Fit for 2020”, the target is to achieve annual cost savings of at least EUR 100 million by
the end of 2017. According to first estimates the cash-relevant non-recurring expenditures until then
are likely to add up to approximately the amount of the aforementioned annual savings. Based on
today’s business volume, the implementation measures will include world-wide personnel capacity
reductions of approx. 1,000 full-time equivalents over the next 2-3 years. However, the exact number
of adjustments, the timeline and affected locations are subject to further analyses during the “Blueprint
Detailing” phase.
Board
Current Organization Future Organization
Board
FT
Support
Regions
ME RT PE EquipmentBA 2
SolutionsBA 2
Headquarter
Support Support Support
Regions Regions Regions Regions / Countries
SSC 1GlobalCorp.
Center
• Stand-alone effective Segments driving own technologies and market approaches
• Limited group perspective and role of the corporate center
• Each Segment with individual go-to-market concepts and regional footprint
• Bundling of Segments into two BAs 2 according to business model logic
• “One GEA” in countries as a platform for growth within regions / countries
• Strengthening global group functions
• Increased efficiency & standardization of support functions due to streamlining & SSC1 1) SSC = Shared Service Center
2) BA = Business Area
Management Report
GEA Group Q3/2014
23
Management Report
Report on Expected Developments
Economic environment in 2014/2015
In its current World Economic Outlook (October 2014), the International Monetary Fund (IMF)
lowered its growth forecast for the global economy slightly. In comparison with its previous report
(World Economic Outlook Update, July 2014), the forecast for 2014 was reduced by 0.1 percentage
points to 3.3 percent. The forecast for 2015 was also lowered, dropping 0.2 percentage points to
3.8 percent. The primary reason for this more pessimistic outlook is the global economy’s performance
in the first half of 2014, which fell short of expectations. In addition, the risks to improved growth
have increased since the spring.
Aside from the geopolitical crises in Ukraine and the Middle East, which could have detrimental
economic effects extending well beyond the regions affected, for example through increased energy
prices, the IMF is deeply concerned about the stagnation in the eurozone. It also warns about the
possibility of the financial markets overheating. According to the IMF, the high share prices currently
observed fail to reflect the fragility of the economic recovery.
In contrast to the general assessment, growth in the U.S.A. for 2014 is now viewed in a significantly
more positive light. The growth forecast currently stands at 2.2 percent, 0.5 percentage points above
the previous figure. As before, growth of 3.1 percent is expected in 2015. The IMF reduced its 2014
growth forecast for the eurozone by 0.3 percentage points to 0.8 percent. The forecast for 2015 was
also lowered, falling by 0.2 percentage points against the figure published in July, to 1.3 percent. After
the forecast for Germany was increased in July, the IMF has now reduced this to 1.4 percent in 2014
and 1.5 percent in 2015, a drop of 0.5 and 0.2 percentage points respectively. The emerging economies
are also weaker than previously expected, with growth now forecast at only 4.4 percent and 5.0 percent
in 2015 (down 0.1 percentage points each). The growth forecast for China remains unchanged at 7.4
percent in 2014 and 7.1 percent in 2015.
24
GEA Group Q3/2014
Business outlook
Provided that there is no slowdown in global economic growth and that exchange rates remain the
same as in 2013, and excluding the effect of acquisitions and nonrecurring items, we are aiming for
our key performance indicators to develop as follows in the current fiscal year:
Revenue
We expect GEA Group’s segments to register moderate revenue growth overall in fiscal year 2014, with
the notable exception of GEA Process Engineering, which will grow more strongly than the other
segments due to its very healthy order intake in the previous year.
Earnings
We expect operating EBITDA to reach EUR 550 million to EUR 590 million during the period,
compared with EUR 530 million in fiscal year 2013. All of GEA Group’s segments will contribute to
this year-on-year increase. The term operating means that the earnings figures are adjusted for the
effects of the remeasurement of new assets resulting from acquisitions, as well as expenses that are
nonrecurring in terms of their type or amount.
Cash flow driver margin
With respect to our cash flow drivers, i.e., the net amount of EBITDA, the change in working capital,
and capital expenditure, we are aiming for a ratio to revenue of between 9.0 percent and 9.5 percent
in 2014, after 9.6 percent in 2013.
Provided that there is no slowdown in the global economy, we expect the group to achieve moderate
organic growth. The further increase in profitability together with the ongoing focus on liquidity
generation should help ensure we have the financial leeway to successfully implement our strategic
growth targets.
Düsseldorf, October 28, 2014
The Executive Board
Management Report
GEA Group Q3/2014
25
GEA Shares
GEA Shares
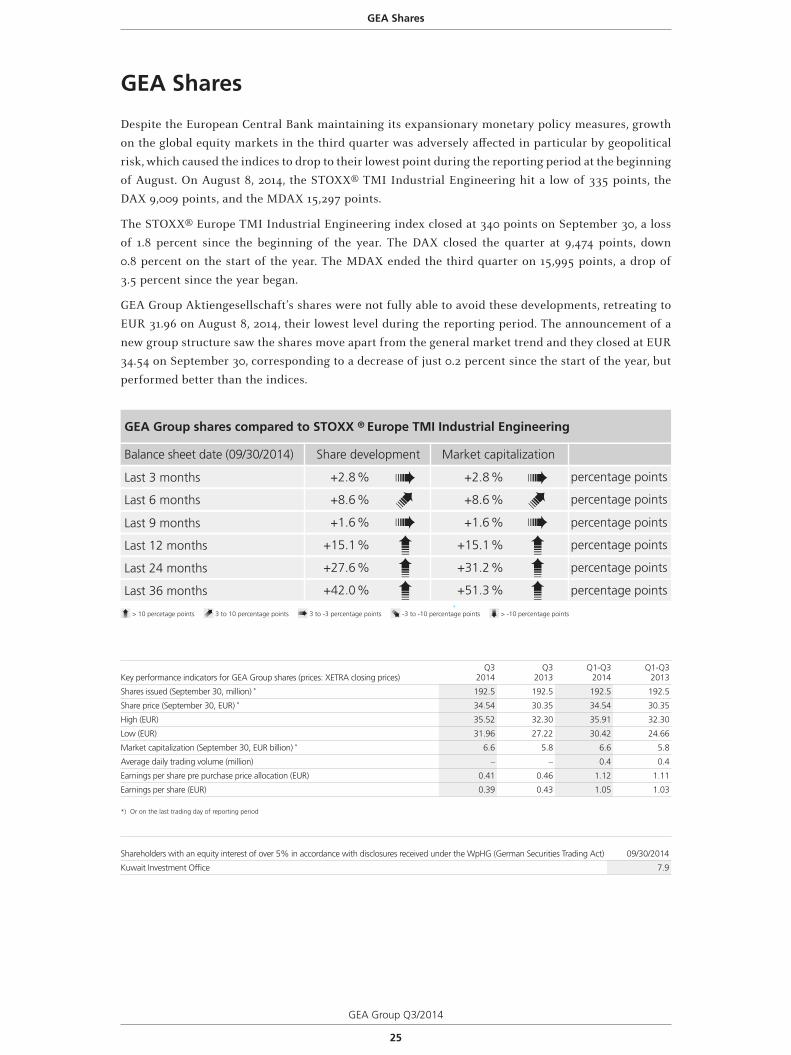
Despite the European Central Bank maintaining its expansionary monetary policy measures, growth
on the global equity markets in the third quarter was adversely affected in particular by geopolitical
risk, which caused the indices to drop to their lowest point during the reporting period at the beginning
of August. On August 8, 2014, the STOXX® TMI Industrial Engineering hit a low of 335 points, the
DAX 9,009 points, and the MDAX 15,297 points.
The STOXX® Europe TMI Industrial Engineering index closed at 340 points on September 30, a loss
of 1.8 percent since the beginning of the year. The DAX closed the quarter at 9,474 points, down
0.8 percent on the start of the year. The MDAX ended the third quarter on 15,995 points, a drop of
3.5 percent since the year began.
GEA Group Aktiengesellschaft’s shares were not fully able to avoid these developments, retreating to
EUR 31.96 on August 8, 2014, their lowest level during the reporting period. The announcement of a
new group structure saw the shares move apart from the general market trend and they closed at EUR
34.54 on September 30, corresponding to a decrease of just 0.2 percent since the start of the year, but
performed better than the indices.
GEA Group shares compared to STOXX ® Europe TMI Industrial Engineering
Last 3 months percentage points
percentage points
percentage points
percentage points
percentage points
percentage points
Last 6 months
Last 9 months
Last 12 months
Last 24 months
Last 36 months
> 10 percetage points 3 to 10 percentage points 3 to -3 percentage points -3 to -10 percentage points > -10 percentage points
+2.8 %
+8.6 %
+1.6 %
+15.1 %
+27.6 %
+42.0 %
Share developmentBalance sheet date (09/30/2014) Market capitalization
+2.8 %
+8.6 %
+1.6 %
+15.1 %
+31.2 %
+51.3 %
Key performance indicators for GEA Group shares (prices: XETRA closing prices)Q3
2014Q3
2013Q1-Q3
2014Q1-Q3
2013
Shares issued (September 30, million) * 192.5 192.5 192.5 192.5
Share price (September 30, EUR) * 34.54 30.35 34.54 30.35
High (EUR) 35.52 32.30 35.91 32.30
Low (EUR) 31.96 27.22 30.42 24.66
Market capitalization (September 30, EUR billion) * 6.6 5.8 6.6 5.8
Average daily trading volume (million) – – 0.4 0.4
Earnings per share pre purchase price allocation (EUR) 0.41 0.46 1.12 1.11
Earnings per share (EUR) 0.39 0.43 1.05 1.03
*) Or on the last trading day of reporting period
Shareholders with an equity interest of over 5% in accordance with disclosures received under the WpHG (German Securities Trading Act) 09/30/2014
Kuwait Investment Office 7.9

26
GEA Group Q3/2014
GEA Group Q3/2014
27
Consolidated Financial Statements
for the 3rd Quarter of 2014
Consolidated Financial Statements
28
GEA Group Q3/2014
Consolidated Balance Sheetas of September 30, 2014
Assets(EUR thousand) 9/30/2014 12/31/2013
Changein %
Property, plant and equipment 500,533 490,420 2.1
Investment property 11,266 13,448 –16.2
Goodwill 1,325,060 1,312,554 1.0
Other intangible assets 314,279 319,840 –1.7
Equity-accounted investments 14,207 13,690 3.8
Other non-current financial assets 37,206 42,068 –11.6
Deferred taxes 427,556 385,822 10.8
Non-current assets 2,630,107 2,577,842 2.0
Inventories 640,877 551,055 16.3
Trade receivables 939,006 929,156 1.1
Income tax receivables 18,622 8,332 > 100
Other current financial assets 194,089 108,939 78.2
Cash and cash equivalents 437,704 683,520 –36.0
Assets held for sale 1,705,224 1,605,786 6.2
Current assets 3,935,522 3,886,788 1.3
Total assets 6,565,629 6,464,630 1.6
Consolidated Financial Statements
GEA Group Q3/2014
29
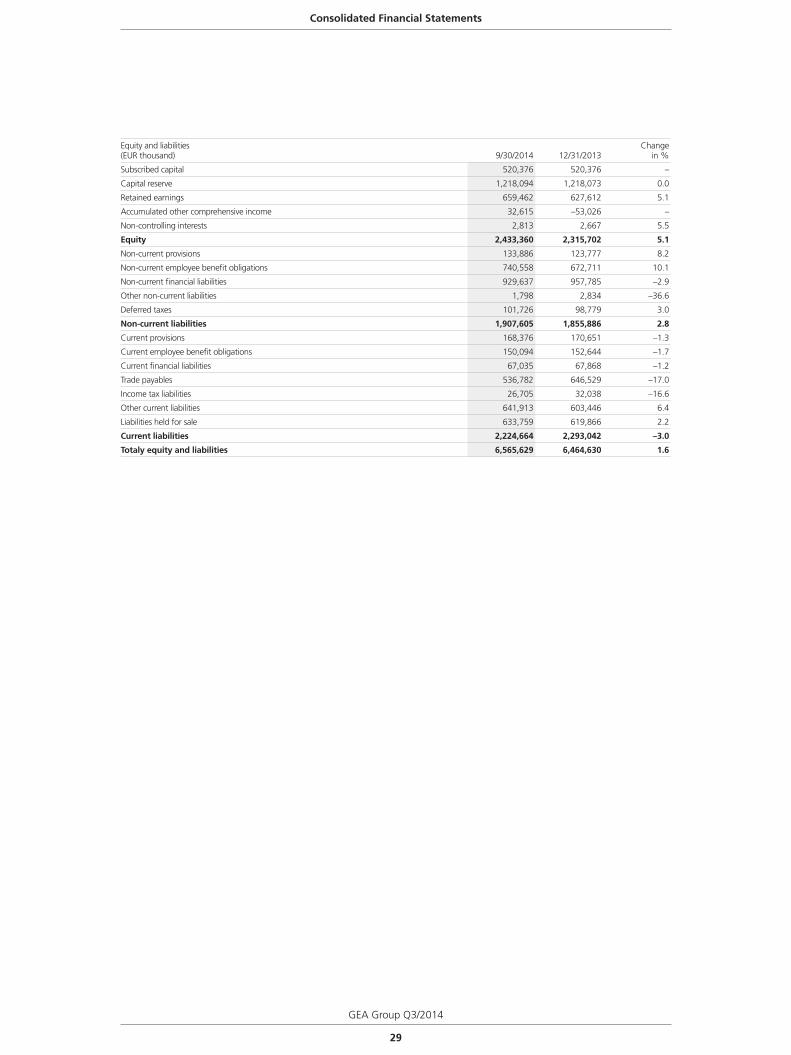
Equity and liabilities(EUR thousand) 9/30/2014 12/31/2013
Changein %
Subscribed capital 520,376 520,376 –
Capital reserve 1,218,094 1,218,073 0.0
Retained earnings 659,462 627,612 5.1
Accumulated other comprehensive income 32,615 –53,026 –
Non-controlling interests 2,813 2,667 5.5
Equity 2,433,360 2,315,702 5.1
Non-current provisions 133,886 123,777 8.2
Non-current employee benefit obligations 740,558 672,711 10.1
Non-current financial liabilities 929,637 957,785 –2.9
Other non-current liabilities 1,798 2,834 –36.6
Deferred taxes 101,726 98,779 3.0
Non-current liabilities 1,907,605 1,855,886 2.8
Current provisions 168,376 170,651 –1.3
Current employee benefit obligations 150,094 152,644 –1.7
Current financial liabilities 67,035 67,868 –1.2
Trade payables 536,782 646,529 –17.0
Income tax liabilities 26,705 32,038 –16.6
Other current liabilities 641,913 603,446 6.4
Liabilities held for sale 633,759 619,866 2.2
Current liabilities 2,224,664 2,293,042 –3.0
Totaly equity and liabilities 6,565,629 6,464,630 1.6
Consolidated Financial Statements
30
GEA Group Q3/2014
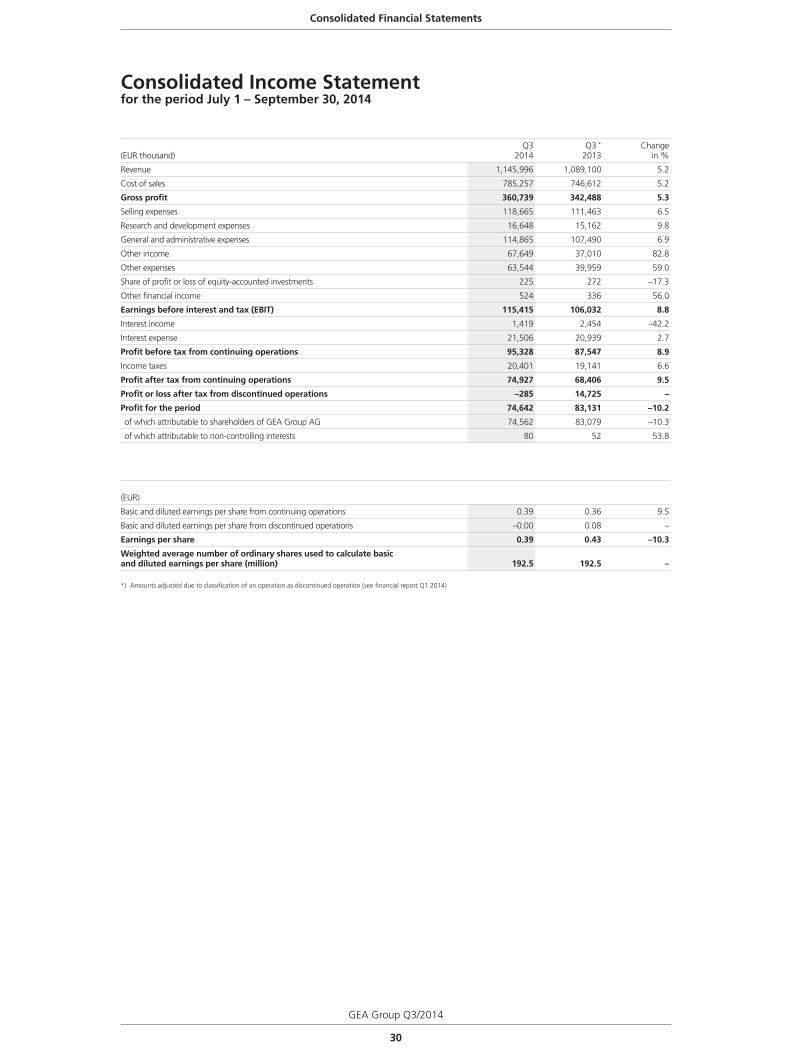
Consolidated Income Statementfor the period July 1 – September 30, 2014
(EUR thousand)Q3
2014Q3 *
2013Change
in %
Revenue 1,145,996 1,089,100 5.2
Cost of sales 785,257 746,612 5.2
Gross profit 360,739 342,488 5.3
Selling expenses 118,665 111,463 6.5
Research and development expenses 16,648 15,162 9.8
General and administrative expenses 114,865 107,490 6.9
Other income 67,649 37,010 82.8
Other expenses 63,544 39,959 59.0
Share of profit or loss of equity-accounted investments 225 272 –17.3
Other financial income 524 336 56.0
Earnings before interest and tax (EBIT) 115,415 106,032 8.8
Interest income 1,419 2,454 –42.2
Interest expense 21,506 20,939 2.7
Profit before tax from continuing operations 95,328 87,547 8.9
Income taxes 20,401 19,141 6.6
Profit after tax from continuing operations 74,927 68,406 9.5
Profit or loss after tax from discontinued operations –285 14,725 –
Profit for the period 74,642 83,131 –10.2
of which attributable to shareholders of GEA Group AG 74,562 83,079 –10.3
of which attributable to non-controlling interests 80 52 53.8
(EUR)
Basic and diluted earnings per share from continuing operations 0.39 0.36 9.5
Basic and diluted earnings per share from discontinued operations –0.00 0.08 –
Earnings per share 0.39 0.43 –10.3
Weighted average number of ordinary shares used to calculate basic and diluted earnings per share (million) 192.5 192.5 –
*) Amounts adjusted due to classification of an operation as discontinued operation (see financial report Q1 2014)
Consolidated Financial Statements
GEA Group Q3/2014
31
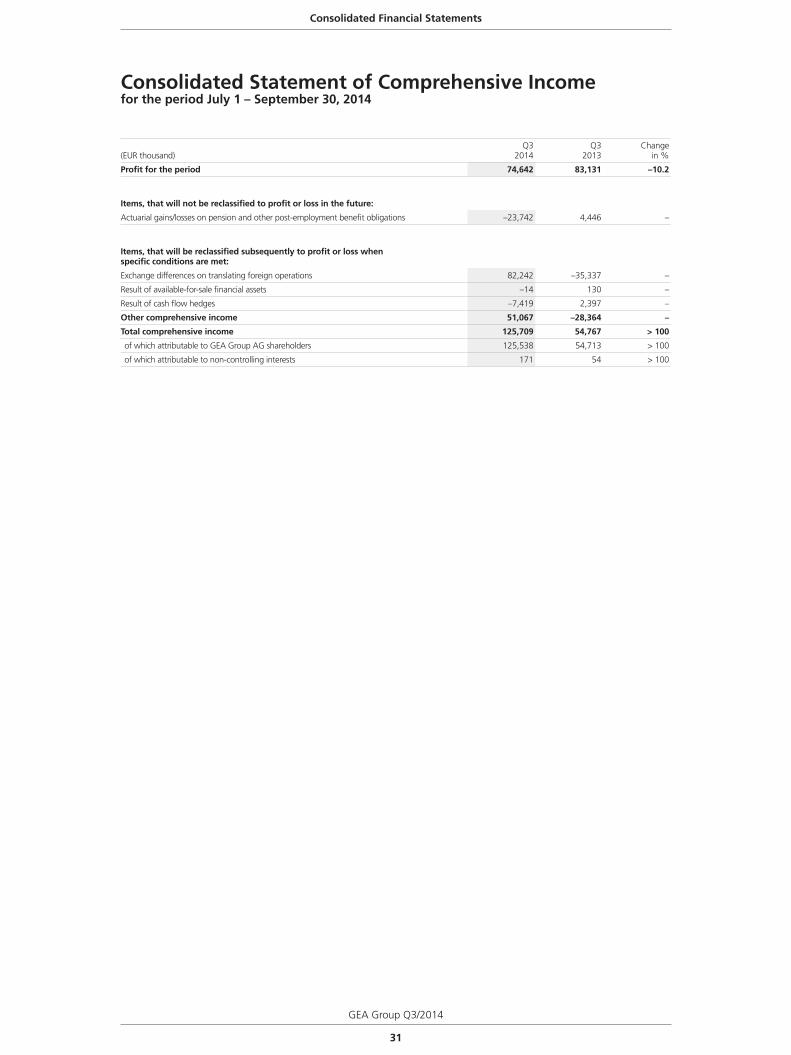
Consolidated Statement of Comprehensive Incomefor the period July 1 – September 30, 2014
(EUR thousand)Q3
2014Q3
2013Change
in %
Profit for the period 74,642 83,131 –10.2
Items, that will not be reclassified to profit or loss in the future:
Actuarial gains/losses on pension and other post-employment benefit obligations –23,742 4,446 –
Items, that will be reclassified subsequently to profit or loss when specific conditions are met:
Exchange differences on translating foreign operations 82,242 –35,337 –
Result of available-for-sale financial assets –14 130 –
Result of cash flow hedges –7,419 2,397 –
Other comprehensive income 51,067 –28,364 –
Total comprehensive income 125,709 54,767 > 100
of which attributable to GEA Group AG shareholders 125,538 54,713 > 100
of which attributable to non-controlling interests 171 54 > 100
Consolidated Financial Statements
32
GEA Group Q3/2014
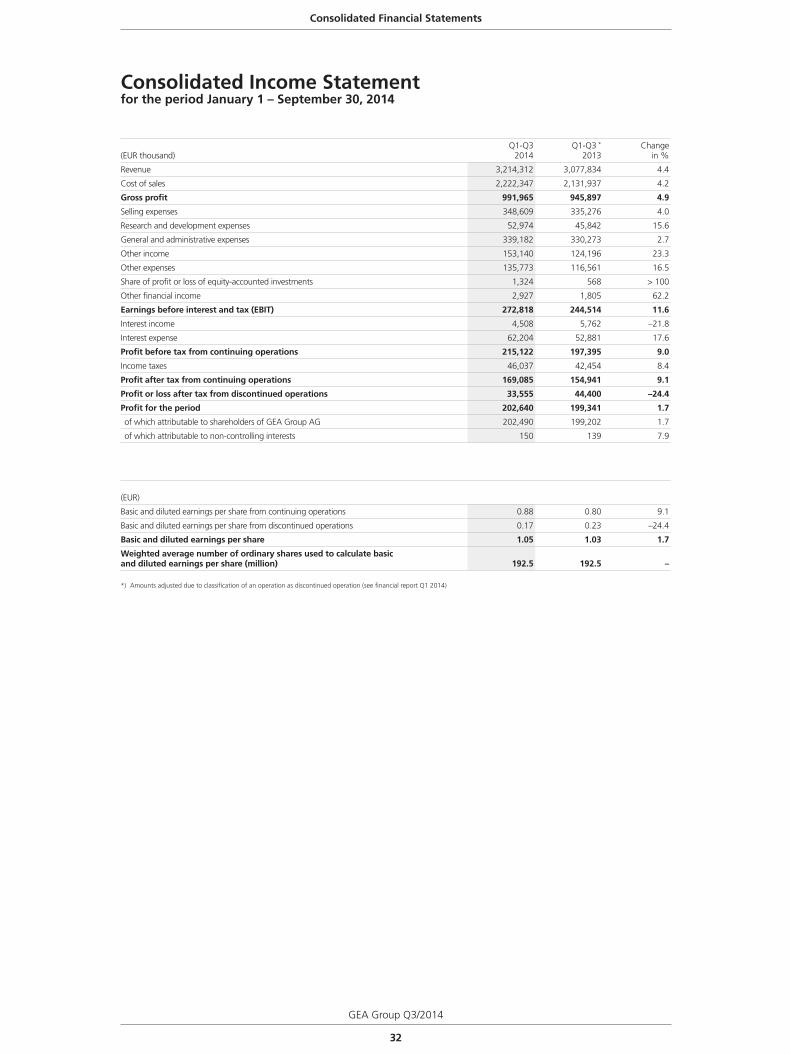
Consolidated Income Statementfor the period January 1 – September 30, 2014
(EUR thousand)Q1-Q3
2014Q1-Q3 *
2013Change
in %
Revenue 3,214,312 3,077,834 4.4
Cost of sales 2,222,347 2,131,937 4.2
Gross profit 991,965 945,897 4.9
Selling expenses 348,609 335,276 4.0
Research and development expenses 52,974 45,842 15.6
General and administrative expenses 339,182 330,273 2.7
Other income 153,140 124,196 23.3
Other expenses 135,773 116,561 16.5
Share of profit or loss of equity-accounted investments 1,324 568 > 100
Other financial income 2,927 1,805 62.2
Earnings before interest and tax (EBIT) 272,818 244,514 11.6
Interest income 4,508 5,762 –21.8
Interest expense 62,204 52,881 17.6
Profit before tax from continuing operations 215,122 197,395 9.0
Income taxes 46,037 42,454 8.4
Profit after tax from continuing operations 169,085 154,941 9.1
Profit or loss after tax from discontinued operations 33,555 44,400 –24.4
Profit for the period 202,640 199,341 1.7
of which attributable to shareholders of GEA Group AG 202,490 199,202 1.7
of which attributable to non-controlling interests 150 139 7.9
(EUR)
Basic and diluted earnings per share from continuing operations 0.88 0.80 9.1
Basic and diluted earnings per share from discontinued operations 0.17 0.23 –24.4
Basic and diluted earnings per share 1.05 1.03 1.7
Weighted average number of ordinary shares used to calculate basic and diluted earnings per share (million) 192.5 192.5 –
*) Amounts adjusted due to classification of an operation as discontinued operation (see financial report Q1 2014)
Consolidated Financial Statements
GEA Group Q3/2014
33
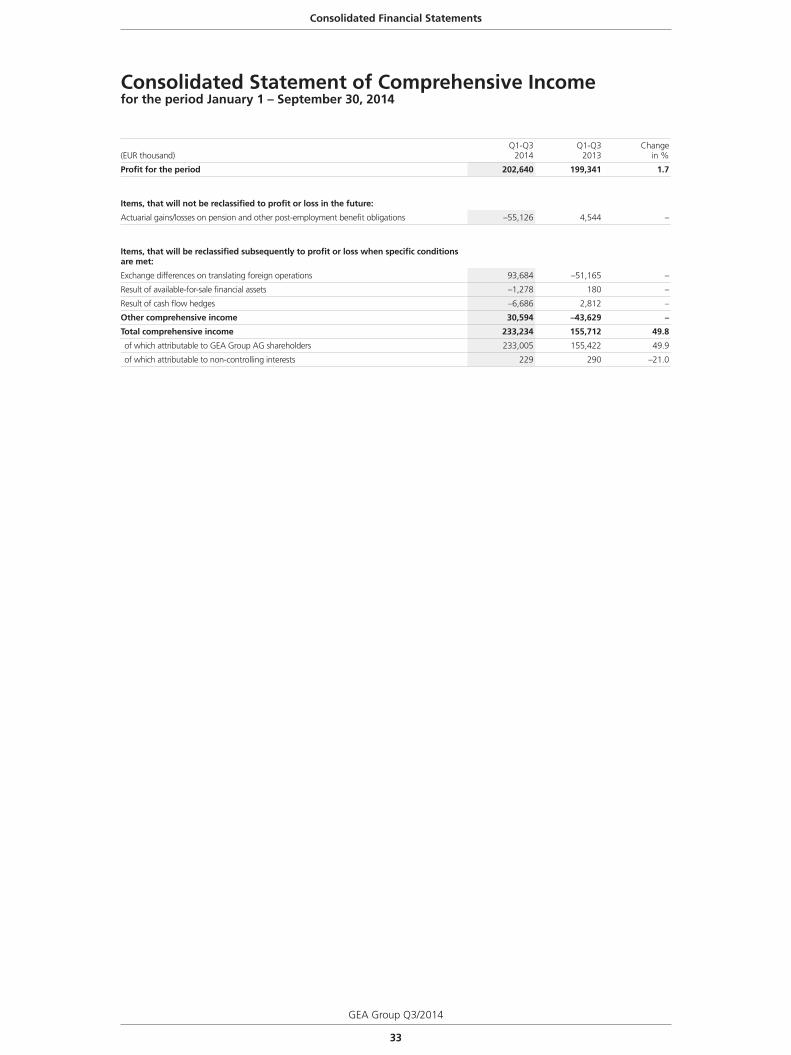
Consolidated Statement of Comprehensive Incomefor the period January 1 – September 30, 2014
(EUR thousand)Q1-Q3
2014Q1-Q3
2013Change
in %
Profit for the period 202,640 199,341 1.7
Items, that will not be reclassified to profit or loss in the future:
Actuarial gains/losses on pension and other post-employment benefit obligations –55,126 4,544 –
Items, that will be reclassified subsequently to profit or loss when specific conditions are met:
Exchange differences on translating foreign operations 93,684 –51,165 –
Result of available-for-sale financial assets –1,278 180 –
Result of cash flow hedges –6,686 2,812 –
Other comprehensive income 30,594 –43,629 –
Total comprehensive income 233,234 155,712 49.8
of which attributable to GEA Group AG shareholders 233,005 155,422 49.9
of which attributable to non-controlling interests 229 290 –21.0
Consolidated Financial Statements
34
GEA Group Q3/2014
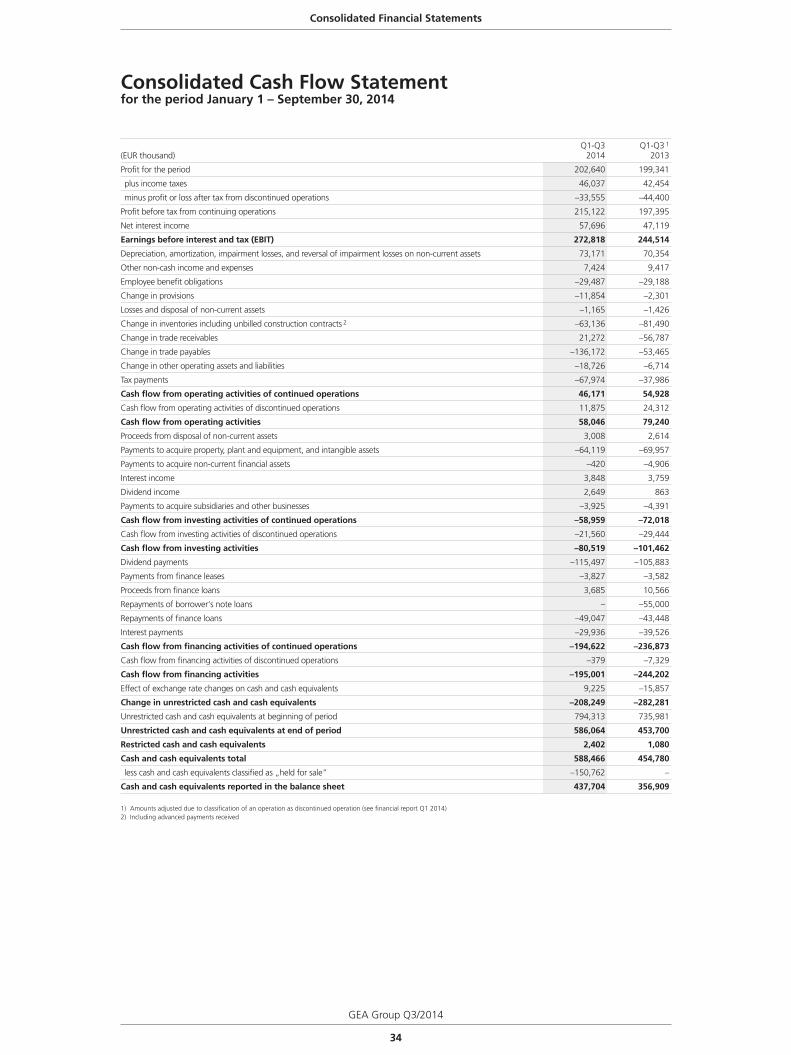
Consolidated Cash Flow Statementfor the period January 1 – September 30, 2014
(EUR thousand)Q1-Q3
2014Q1-Q3 1
2013
Profit for the period 202,640 199,341
plus income taxes 46,037 42,454
minus profit or loss after tax from discontinued operations –33,555 –44,400
Profit before tax from continuing operations 215,122 197,395
Net interest income 57,696 47,119
Earnings before interest and tax (EBIT) 272,818 244,514
Depreciation, amortization, impairment losses, and reversal of impairment losses on non-current assets 73,171 70,354
Other non-cash income and expenses 7,424 9,417
Employee benefit obligations –29,487 –29,188
Change in provisions –11,854 –2,301
Losses and disposal of non-current assets –1,165 –1,426
Change in inventories including unbilled construction contracts 2 –63,136 –81,490
Change in trade receivables 21,272 –56,787
Change in trade payables –136,172 –53,465
Change in other operating assets and liabilities –18,726 –6,714
Tax payments –67,974 –37,986
Cash flow from operating activities of continued operations 46,171 54,928
Cash flow from operating activities of discontinued operations 11,875 24,312
Cash flow from operating activities 58,046 79,240
Proceeds from disposal of non-current assets 3,008 2,614
Payments to acquire property, plant and equipment, and intangible assets –64,119 –69,957
Payments to acquire non-current financial assets –420 –4,906
Interest income 3,848 3,759
Dividend income 2,649 863
Payments to acquire subsidiaries and other businesses –3,925 –4,391
Cash flow from investing activities of continued operations –58,959 –72,018
Cash flow from investing activities of discontinued operations –21,560 –29,444
Cash flow from investing activities –80,519 –101,462
Dividend payments –115,497 –105,883
Payments from finance leases –3,827 –3,582
Proceeds from finance loans 3,685 10,566
Repayments of borrower‘s note loans – –55,000
Repayments of finance loans –49,047 –43,448
Interest payments –29,936 –39,526
Cash flow from financing activities of continued operations –194,622 –236,873
Cash flow from financing activities of discontinued operations –379 –7,329
Cash flow from financing activities –195,001 –244,202
Effect of exchange rate changes on cash and cash equivalents 9,225 –15,857
Change in unrestricted cash and cash equivalents –208,249 –282,281
Unrestricted cash and cash equivalents at beginning of period 794,313 735,981
Unrestricted cash and cash equivalents at end of period 586,064 453,700
Restricted cash and cash equivalents 2,402 1,080
Cash and cash equivalents total 588,466 454,780
less cash and cash equivalents classified as „held for sale“ –150,762 –
Cash and cash equivalents reported in the balance sheet 437,704 356,909
1) Amounts adjusted due to classification of an operation as discontinued operation (see financial report Q1 2014)2) Including advanced payments received
Consolidated Financial Statements
GEA Group Q3/2014
35
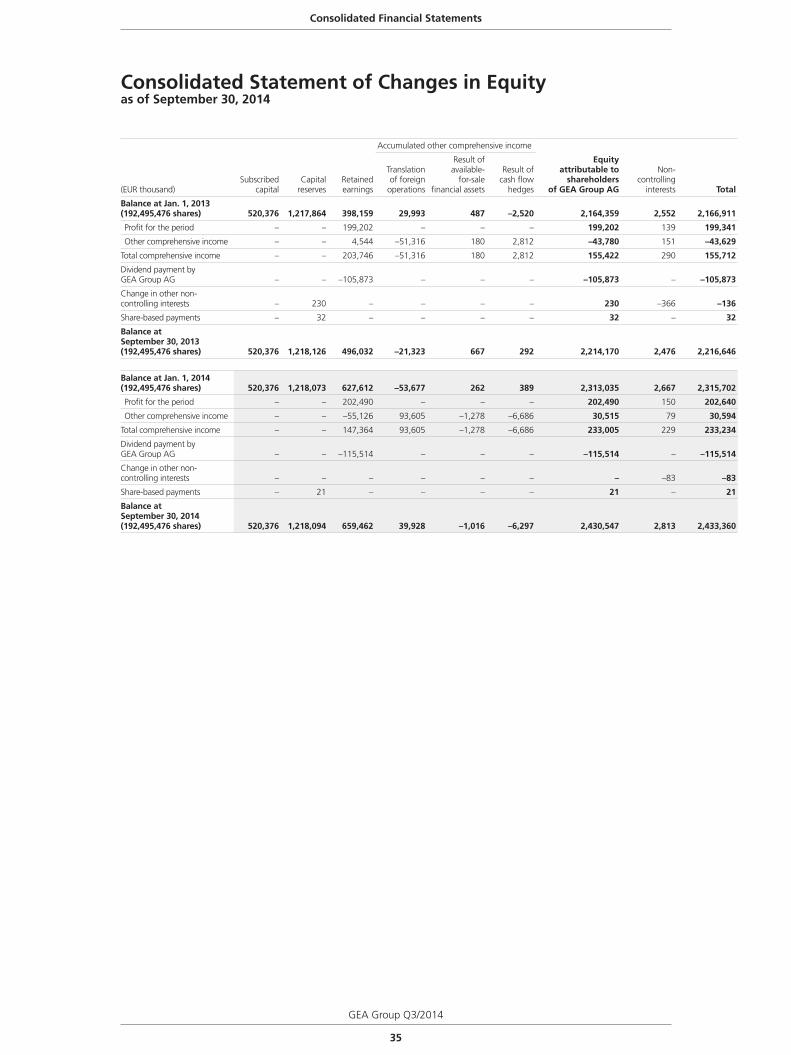
Consolidated Statement of Changes in Equityas of September 30, 2014
Accumulated other comprehensive income
(EUR thousand)Subscribed
capitalCapital
reservesRetained earnings
Translation of foreign
operations
Result of available-
for-sale financial assets
Result of cash flow
hedges
Equity attributable to
shareholders of GEA Group AG
Non-controlling
interests Total
Balance at Jan. 1, 2013(192,495,476 shares) 520,376 1,217,864 398,159 29,993 487 –2,520 2,164,359 2,552 2,166,911
Profit for the period – – 199,202 – – – 199,202 139 199,341
Other comprehensive income – – 4,544 –51,316 180 2,812 –43,780 151 –43,629
Total comprehensive income – – 203,746 –51,316 180 2,812 155,422 290 155,712
Dividend payment by GEA Group AG – – –105,873 – – – –105,873 – –105,873
Change in other non-controlling interests – 230 – – – – 230 –366 –136
Share-based payments – 32 – – – – 32 – 32
Balance at September 30, 2013(192,495,476 shares) 520,376 1,218,126 496,032 –21,323 667 292 2,214,170 2,476 2,216,646
Balance at Jan. 1, 2014(192,495,476 shares) 520,376 1,218,073 627,612 –53,677 262 389 2,313,035 2,667 2,315,702
Profit for the period – – 202,490 – – – 202,490 150 202,640
Other comprehensive income – – –55,126 93,605 –1,278 –6,686 30,515 79 30,594
Total comprehensive income – – 147,364 93,605 –1,278 –6,686 233,005 229 233,234
Dividend payment by GEA Group AG – – –115,514 – – – –115,514 – –115,514
Change in other non-controlling interests – – – – – – – –83 –83
Share-based payments – 21 – – – – 21 – 21
Balance at September 30, 2014(192,495,476 shares) 520,376 1,218,094 659,462 39,928 –1,016 –6,297 2,430,547 2,813 2,433,360
Consolidated Financial Statements
36
GEA Group Q3/2014
Notes to the Consolidated Financial Statements
1. Reporting principles
Basis of presentationThe interim financial statements of GEA Group Aktiengesellschaft and the interim financial statements
of the subsidiaries included in the consolidated financial statements were prepared in accordance
with the International Financial Reporting Standards (IFRSs) and related Interpretations issued by
the International Accounting Standards Board (IASB), as adopted by the EU for interim financial
reporting in accordance with Regulation (EC) No. 1606/2002 of the European Parliament and the
Council on the application of international accounting standards. In accordance with IAS 34, the
interim financial report does not contain all the information and disclosures required by IFRSs for
full-year consolidated financial statements.
The accompanying consolidated financial statements and Group management report on the third
quarter have not been audited in accordance with section 317 of the Handelsgesetzbuch (HGB –
German Commercial Code) or reviewed by an auditor.
These interim financial statements have been prepared in euros (EUR). All amounts, including the
comparative figures, are presented in thousands of euros (EUR thousand), except for the segment
information. All amounts have been rounded using standard rounding rules. Adding together individual
amounts may therefore result in a difference in the order of EUR 1 thousand in certain cases.
With the exception of the pronouncements effective as of January 1, 2014, the accounting policies
applied to the accompanying interim financial statements are the same as those applied as of
December 31, 2013, and are described in detail on pages 118 to 139 of the Annual Report containing
GEA Group’s IFRS consolidated financial statements.
The following accounting standards were applied for the first time in fiscal year 2014:
IFRS 10 “Consolidated Financial Statements”, IFRS 11 “Joint Arrangements”, IFRS 12 “Disclosure of Interests in Other Entities”, consequential amendments to IAS 27 “Separate Financial Statements” and IAS 28 “Investments in Associates and Joint Ventures” – issued by the IASB in May 2011In fiscal year 2014, GEA Group retrospectively applied IFRS 10 “Consolidated Financial Statements”,
IFRS 11 “Joint Arrangements”, IFRS 12 “Disclosure of Interests in Other Entities”, and the consequential
amendments to IAS 27 “Separate Financial Statements” and IAS 28 “Investments in Associates and
Joint Ventures.”
IFRS 10 replaces the consolidation requirements of IAS 27 “Consolidated and Separate Financial
Statements” and SIC-12 “Consolidation – Special Purpose Entities.” The new IFRS 10 affects the
definition of the basis of consolidation. As was previously required by IAS 27, consolidated financial
statements must include those entities that are controlled by the parent. The definition of control in
IFRS 10 differs from that used in IAS 27. Under IFRS 10, control exists when an investing entity is
exposed, or has rights, to variable returns from involvement with the investee on the one hand, and
has the ability to affect those returns through its power over the investee on the other.
IFRS 11 “Joint Arrangements” supersedes IAS 31 “Interests in Joint Ventures” and SIC-13 “Jointly
Controlled Entities – Nonmonetary Contributions by Venturers”. In contrast to IAS 31, accounting for
joint arrangements under IFRS 11 depends not on the legal form of the arrangement but on the nature
of the rights and duties arising under the arrangement. IFRS 11 makes a distinction between joint
operations and joint ventures. Under IFRSs, joint ventures now have to be accounted for using the
Notes to the Consolidated Financial Statements
GEA Group Q3/2014
37
equity method. The previous option to account for joint ventures using proportionate consolidation
has been removed.
IFRS 12 “Disclosure of Interests in Other Entities” revises the disclosure requirements for all types of
interests in other entities, including joint arrangements, associates, structured entities, and off-balance
sheet vehicles.
Initial application of the new requirements did not affect the interim financial statements. The
disclosures introduced by the new requirements are presented in the notes to the (full-year)
consolidated financial statements, or where there are items that are required to be disclosed.
Amendments to IAS 39 “Financial Instruments: Recognition and Measurement” – issued by the IASB in June 2013In fiscal year 2014, GEA Group applied the amended IAS 39 “Financial Instruments: Recognition and
Measurement.” Pursuant to the transition requirements, initial application was retrospective. As a
result of the amendments to IAS 39, derivatives continue to be designated as hedging instruments in
a hedging relationship when the hedging instrument is novated to a central counterparty. For this to
apply, the central counterparty must become involved as a result of legal or regulatory requirements.
The amendments to IAS 39 had no impact on the interim financial statements.
The IASB issued the following new accounting pronouncements in the reporting period:
IFRS 9 “Financial Instruments” – issued by the IASB in July 2014The fourth and final version of IFRS 9 “Financial Instruments” completes the project to replace IAS 39
“Financial Instruments: Recognition and Measurement.”
The new standard contains revised requirements governing the measurement and classification of
financial instruments and supplements the new hedge accounting requirements issued in 2013. In
particular, it introduces a new model for determining impairment losses, under which not only
incurred losses but also expected credit losses are recognized. In addition, “at fair value through other
comprehensive income” has been introduced as an additional measurement category for financial
assets. This is intended to be used when accounting for business models in which assets are held both
for sale and to collect contractual cash flows. These requirements therefore primarily affect banks and
insurers.
In addition, IFRS 9 introduces extensive new disclosure requirements.
Subject to endorsement by the EU, which is still outstanding, IFRS 9 must be applied for fiscal years
beginning on or after January 1, 2018. Initial application of the standard is retrospective, with certain
practical expedients permitted.
Improvements to IFRSs 2012–2014 Cycle – amendments under the IASB’s annual improvements project – published by the IASB in September 2014The improvements result from the IASB’s annual improvements process, which is designed to make
minor amendments to standards and interpretations (Annual Improvements Cycle). They comprise
minor amendments to a total of four standards. Subject to endorsement by the EU, which is still
outstanding, the amendments must be applied for fiscal years beginning on or after January 1, 2016.
Notes to the Consolidated Financial Statements
38
GEA Group Q3/2014
Amendments to IFRS 10 and IAS 28 – Sale or Contribution of Assets between an Investor and its Associate or Joint Venture – issued by the IASB in September 2014The amendments address a known inconsistency between the requirements of IFRS 10 and those of
IAS 28 (2011) in cases where assets are sold to or contributed by an associate or a joint venture. In the
future, the gain or loss resulting from such a transaction will only be recognized in full if the asset sold
or contributed is a business within the meaning of IFRS 3, regardless of whether the transaction is
structured as a share deal or an asset deal. However, if the assets do not constitute a business, any gain
or loss is recognized only in proportion to the investor’s interest in the associate or joint venture.
Subject to their endorsement by the EU, which is still outstanding, the amendments must be applied
for fiscal years beginning on or after January 1, 2016. Earlier adoption is permitted once they have
been endorsed by the EU.
GEA Group is currently assessing the impact of the amended pronouncements on its consolidated
financial statements, but does not believe at this point in time that application of the new or revised
pronouncements will have a material effect on its consolidated financial statements.
Interim financial reporting principlesThese interim financial statements present a true and fair view of the Company’s results of operations,
financial position, and net assets in the reporting period.
Preparation of interim financial statements requires management to make certain estimates and
assumptions that may affect the Company’s assets, liabilities, provisions, and deferred tax assets and
liabilities, as well as its income and expenses. Although management makes such estimates and
assumptions carefully and in good faith, actual amounts may differ from the estimates used in the
interim financial statements.
Factors that may cause amounts to fall below expectations include a deterioration in the global
economic situation, movements in exchange rates and interest rates, as well as material litigation and
changes in environmental or other legislation. Errors in internal operating processes, the loss of key
customers, and rising borrowing costs may also adversely affect the Group’s future performance.
Notes to the Consolidated Financial Statements
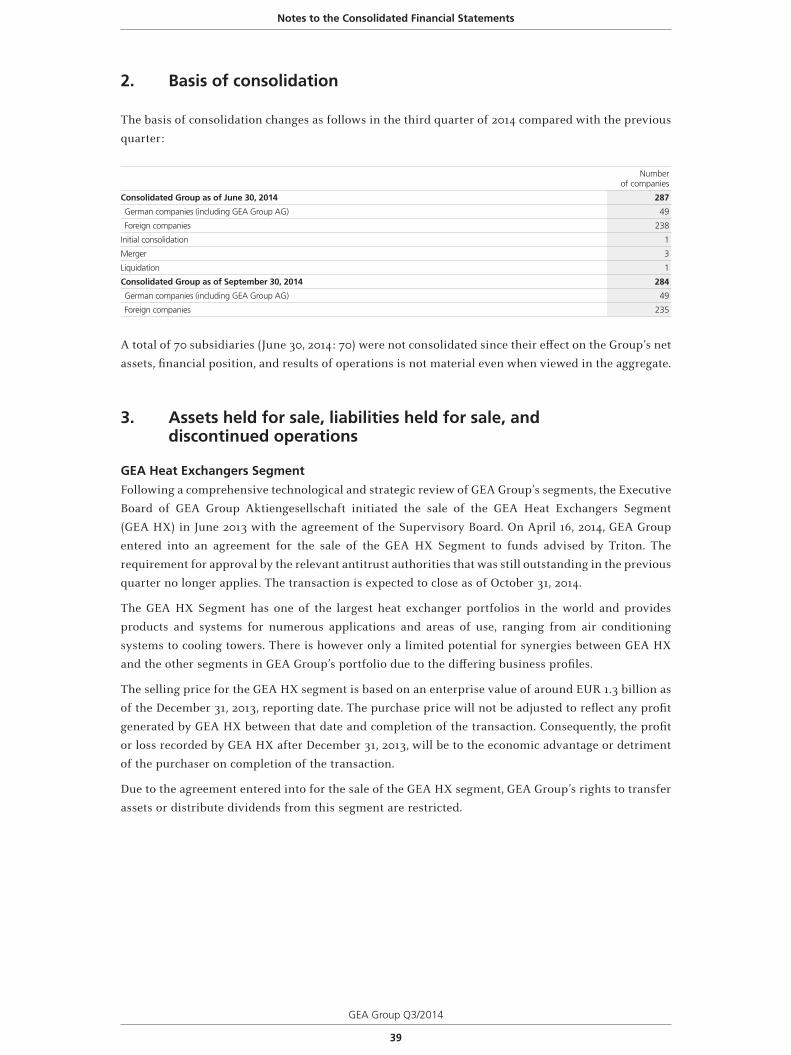
GEA Group Q3/2014
39
2. Basis of consolidation
The basis of consolidation changes as follows in the third quarter of 2014 compared with the previous
quarter:
Numberof companies
Consolidated Group as of June 30, 2014 287
German companies (including GEA Group AG) 49
Foreign companies 238
Initial consolidation 1
Merger 3
Liquidation 1
Consolidated Group as of September 30, 2014 284
German companies (including GEA Group AG) 49
Foreign companies 235
A total of 70 subsidiaries (June 30, 2014: 70) were not consolidated since their effect on the Group’s net
assets, financial position, and results of operations is not material even when viewed in the aggregate.
3. Assets held for sale, liabilities held for sale, and discontinued operations
GEA Heat Exchangers SegmentFollowing a comprehensive technological and strategic review of GEA Group’s segments, the Executive
Board of GEA Group Aktiengesellschaft initiated the sale of the GEA Heat Exchangers Segment
(GEA HX) in June 2013 with the agreement of the Supervisory Board. On April 16, 2014, GEA Group
entered into an agreement for the sale of the GEA HX Segment to funds advised by Triton. The
requirement for approval by the relevant antitrust authorities that was still outstanding in the previous
quarter no longer applies. The transaction is expected to close as of October 31, 2014.
The GEA HX Segment has one of the largest heat exchanger portfolios in the world and provides
products and systems for numerous applications and areas of use, ranging from air conditioning
systems to cooling towers. There is however only a limited potential for synergies between GEA HX
and the other segments in GEA Group’s portfolio due to the differing business profiles.
The selling price for the GEA HX segment is based on an enterprise value of around EUR 1.3 billion as
of the December 31, 2013, reporting date. The purchase price will not be adjusted to reflect any profit
generated by GEA HX between that date and completion of the transaction. Consequently, the profit
or loss recorded by GEA HX after December 31, 2013, will be to the economic advantage or detriment
of the purchaser on completion of the transaction.
Due to the agreement entered into for the sale of the GEA HX segment, GEA Group’s rights to transfer
assets or distribute dividends from this segment are restricted.
Notes to the Consolidated Financial Statements
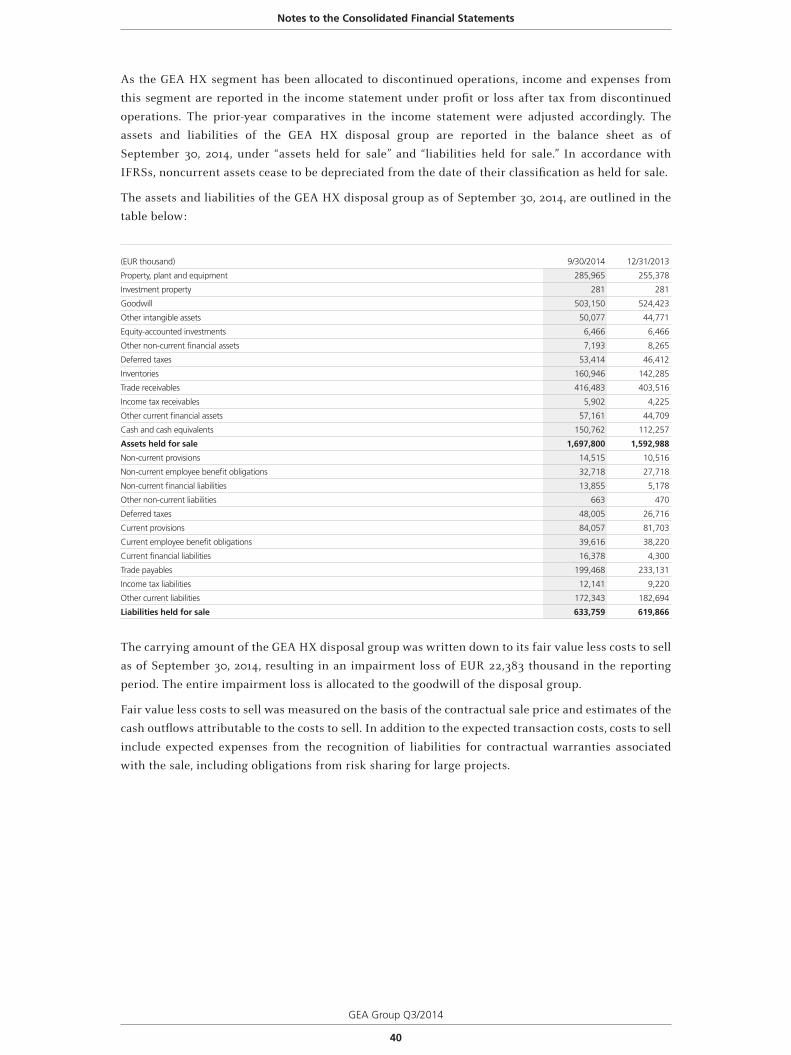
40
GEA Group Q3/2014
As the GEA HX segment has been allocated to discontinued operations, income and expenses from
this segment are reported in the income statement under profit or loss after tax from discontinued
operations. The prior-year comparatives in the income statement were adjusted accordingly. The
assets and liabilities of the GEA HX disposal group are reported in the balance sheet as of
September 30, 2014, under “assets held for sale” and “liabilities held for sale.” In accordance with
IFRSs, noncurrent assets cease to be depreciated from the date of their classification as held for sale.
The assets and liabilities of the GEA HX disposal group as of September 30, 2014, are outlined in the
table below:
(EUR thousand) 9/30/2014 12/31/2013
Property, plant and equipment 285,965 255,378
Investment property 281 281
Goodwill 503,150 524,423
Other intangible assets 50,077 44,771
Equity-accounted investments 6,466 6,466
Other non-current financial assets 7,193 8,265
Deferred taxes 53,414 46,412
Inventories 160,946 142,285
Trade receivables 416,483 403,516
Income tax receivables 5,902 4,225
Other current financial assets 57,161 44,709
Cash and cash equivalents 150,762 112,257
Assets held for sale 1,697,800 1,592,988
Non-current provisions 14,515 10,516
Non-current employee benefit obligations 32,718 27,718
Non-current financial liabilities 13,855 5,178
Other non-current liabilities 663 470
Deferred taxes 48,005 26,716
Current provisions 84,057 81,703
Current employee benefit obligations 39,616 38,220
Current financial liabilities 16,378 4,300
Trade payables 199,468 233,131
Income tax liabilities 12,141 9,220
Other current liabilities 172,343 182,694
Liabilities held for sale 633,759 619,866
The carrying amount of the GEA HX disposal group was written down to its fair value less costs to sell
as of September 30, 2014, resulting in an impairment loss of EUR 22,383 thousand in the reporting
period. The entire impairment loss is allocated to the goodwill of the disposal group.
Fair value less costs to sell was measured on the basis of the contractual sale price and estimates of the
cash outflows attributable to the costs to sell. In addition to the expected transaction costs, costs to sell
include expected expenses from the recognition of liabilities for contractual warranties associated
with the sale, including obligations from risk sharing for large projects.
Notes to the Consolidated Financial Statements
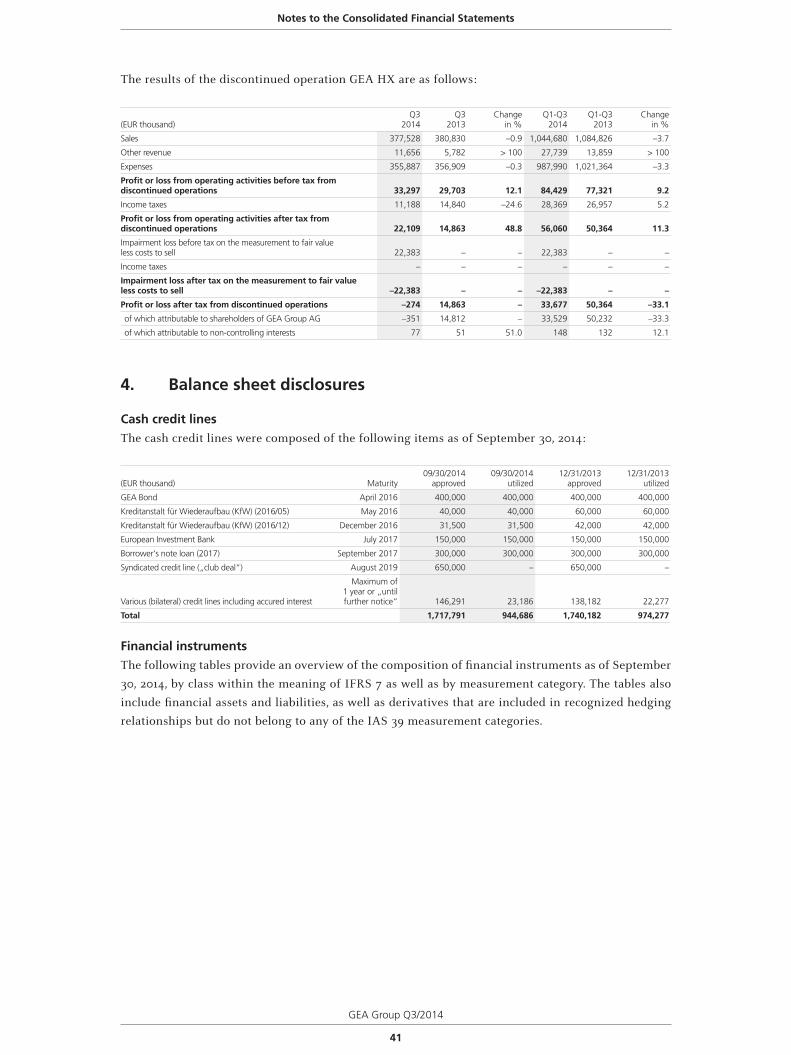
GEA Group Q3/2014
41
The results of the discontinued operation GEA HX are as follows:
(EUR thousand)Q3
2014Q3
2013Change
in %Q1-Q3
2014Q1-Q3
2013Change
in %
Sales 377,528 380,830 –0.9 1,044,680 1,084,826 –3.7
Other revenue 11,656 5,782 > 100 27,739 13,859 > 100
Expenses 355,887 356,909 –0.3 987,990 1,021,364 –3.3
Profit or loss from operating activities before tax from discontinued operations 33,297 29,703 12.1 84,429 77,321 9.2
Income taxes 11,188 14,840 –24.6 28,369 26,957 5.2
Profit or loss from operating activities after tax from discontinued operations 22,109 14,863 48.8 56,060 50,364 11.3
Impairment loss before tax on the measurement to fair value less costs to sell 22,383 – – 22,383 – –
Income taxes – – – – – –
Impairment loss after tax on the measurement to fair value less costs to sell –22,383 – – –22,383 – –
Profit or loss after tax from discontinued operations –274 14,863 – 33,677 50,364 –33.1
of which attributable to shareholders of GEA Group AG –351 14,812 – 33,529 50,232 –33.3
of which attributable to non-controlling interests 77 51 51.0 148 132 12.1
4. Balance sheet disclosures
Cash credit linesThe cash credit lines were composed of the following items as of September 30, 2014:
(EUR thousand) Maturity09/30/2014
approved09/30/2014
utilized12/31/2013
approved12/31/2013
utilized
GEA Bond April 2016 400,000 400,000 400,000 400,000
Kreditanstalt für Wiederaufbau (KfW) (2016/05) May 2016 40,000 40,000 60,000 60,000
Kreditanstalt für Wiederaufbau (KfW) (2016/12) December 2016 31,500 31,500 42,000 42,000
European Investment Bank July 2017 150,000 150,000 150,000 150,000
Borrower‘s note loan (2017) September 2017 300,000 300,000 300,000 300,000
Syndicated credit line („club deal“) August 2019 650,000 – 650,000 –
Various (bilateral) credit lines including accured interest
Maximum of 1 year or „until further notice“ 146,291 23,186 138,182 22,277
Total 1,717,791 944,686 1,740,182 974,277
Financial instrumentsThe following tables provide an overview of the composition of financial instruments as of September
30, 2014, by class within the meaning of IFRS 7 as well as by measurement category. The tables also
include financial assets and liabilities, as well as derivatives that are included in recognized hedging
relationships but do not belong to any of the IAS 39 measurement categories.
Notes to the Consolidated Financial Statements
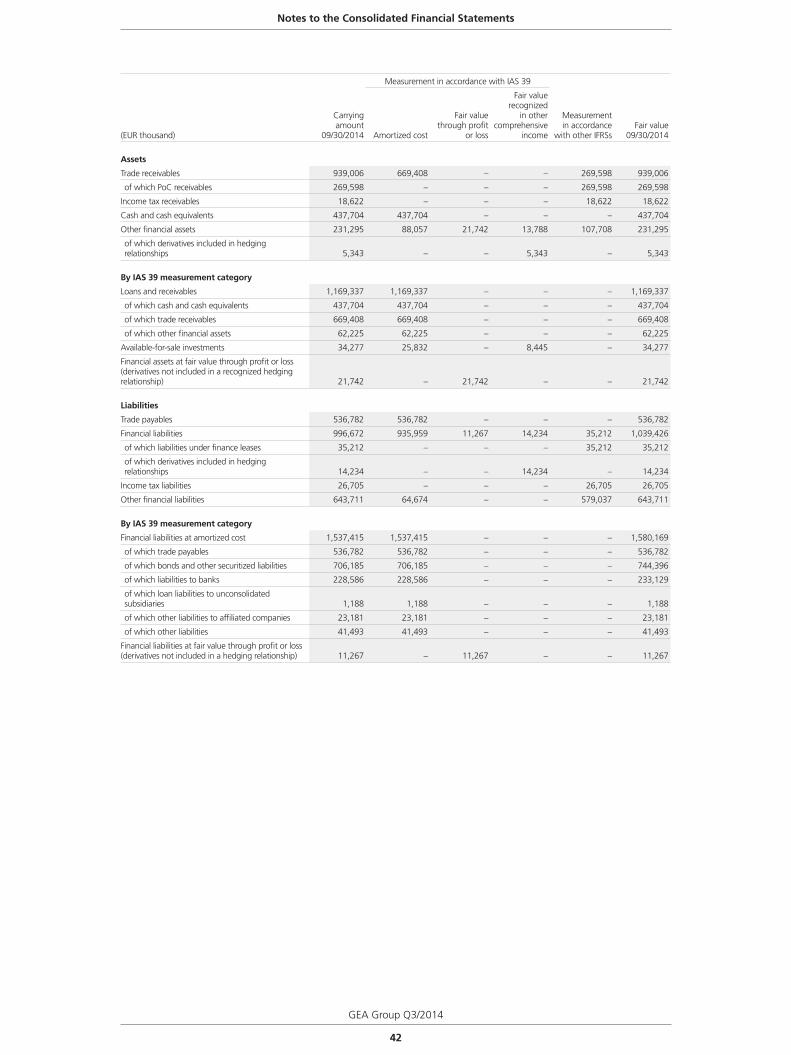
42
GEA Group Q3/2014
Measurement in accordance with IAS 39
(EUR thousand)
Carrying amount
09/30/2014 Amortized cost
Fair value through profit
or loss
Fair value recognized
in other comprehensive
income
Measurement in accordance
with other IFRSsFair value
09/30/2014
Assets
Trade receivables 939,006 669,408 – – 269,598 939,006
of which PoC receivables 269,598 – – – 269,598 269,598
Income tax receivables 18,622 – – – 18,622 18,622
Cash and cash equivalents 437,704 437,704 – – – 437,704
Other financial assets 231,295 88,057 21,742 13,788 107,708 231,295
of which derivatives included in hedging relationships 5,343 – – 5,343 – 5,343
By IAS 39 measurement category
Loans and receivables 1,169,337 1,169,337 – – – 1,169,337
of which cash and cash equivalents 437,704 437,704 – – – 437,704
of which trade receivables 669,408 669,408 – – – 669,408
of which other financial assets 62,225 62,225 – – – 62,225
Available-for-sale investments 34,277 25,832 – 8,445 – 34,277
Financial assets at fair value through profit or loss (derivatives not included in a recognized hedging relationship) 21,742 – 21,742 – – 21,742
Liabilities
Trade payables 536,782 536,782 – – – 536,782
Financial liabilities 996,672 935,959 11,267 14,234 35,212 1,039,426
of which liabilities under finance leases 35,212 – – – 35,212 35,212
of which derivatives included in hedging relationships 14,234 – – 14,234 – 14,234
Income tax liabilities 26,705 – – – 26,705 26,705
Other financial liabilities 643,711 64,674 – – 579,037 643,711
By IAS 39 measurement category
Financial liabilities at amortized cost 1,537,415 1,537,415 – – – 1,580,169
of which trade payables 536,782 536,782 – – – 536,782
of which bonds and other securitized liabilities 706,185 706,185 – – – 744,396
of which liabilities to banks 228,586 228,586 – – – 233,129
of which loan liabilities to unconsolidated subsidiaries 1,188 1,188 – – – 1,188
of which other liabilities to affiliated companies 23,181 23,181 – – – 23,181
of which other liabilities 41,493 41,493 – – – 41,493
Financial liabilities at fair value through profit or loss (derivatives not included in a hedging relationship) 11,267 – 11,267 – – 11,267
Notes to the Consolidated Financial Statements
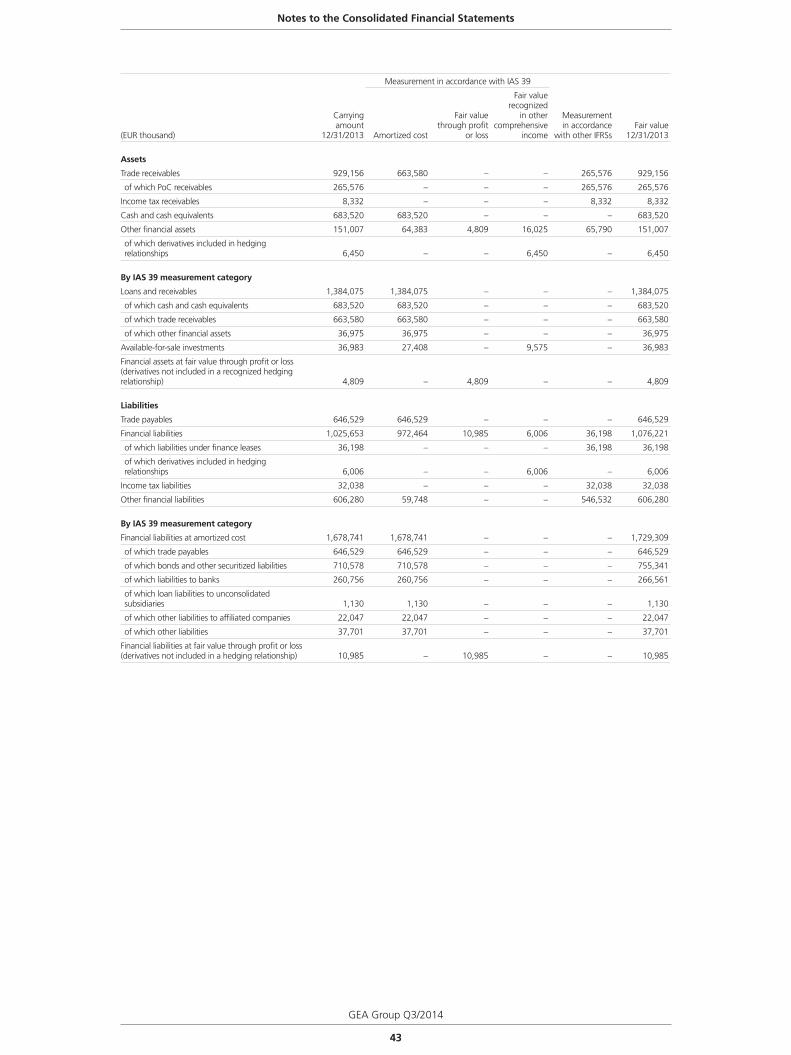
43
GEA Group Q3/2014
Measurement in accordance with IAS 39
(EUR thousand)
Carrying amount
12/31/2013 Amortized cost
Fair value through profit
or loss
Fair value recognized
in other comprehensive
income
Measurement in accordance
with other IFRSsFair value
12/31/2013
Assets
Trade receivables 929,156 663,580 – – 265,576 929,156
of which PoC receivables 265,576 – – – 265,576 265,576
Income tax receivables 8,332 – – – 8,332 8,332
Cash and cash equivalents 683,520 683,520 – – – 683,520
Other financial assets 151,007 64,383 4,809 16,025 65,790 151,007
of which derivatives included in hedging relationships 6,450 – – 6,450 – 6,450
By IAS 39 measurement category
Loans and receivables 1,384,075 1,384,075 – – – 1,384,075
of which cash and cash equivalents 683,520 683,520 – – – 683,520
of which trade receivables 663,580 663,580 – – – 663,580
of which other financial assets 36,975 36,975 – – – 36,975
Available-for-sale investments 36,983 27,408 – 9,575 – 36,983
Financial assets at fair value through profit or loss (derivatives not included in a recognized hedging relationship) 4,809 – 4,809 – – 4,809
Liabilities
Trade payables 646,529 646,529 – – – 646,529
Financial liabilities 1,025,653 972,464 10,985 6,006 36,198 1,076,221
of which liabilities under finance leases 36,198 – – – 36,198 36,198
of which derivatives included in hedging relationships 6,006 – – 6,006 – 6,006
Income tax liabilities 32,038 – – – 32,038 32,038
Other financial liabilities 606,280 59,748 – – 546,532 606,280
By IAS 39 measurement category
Financial liabilities at amortized cost 1,678,741 1,678,741 – – – 1,729,309
of which trade payables 646,529 646,529 – – – 646,529
of which bonds and other securitized liabilities 710,578 710,578 – – – 755,341
of which liabilities to banks 260,756 260,756 – – – 266,561
of which loan liabilities to unconsolidated subsidiaries 1,130 1,130 – – – 1,130
of which other liabilities to affiliated companies 22,047 22,047 – – – 22,047
of which other liabilities 37,701 37,701 – – – 37,701
Financial liabilities at fair value through profit or loss (derivatives not included in a hedging relationship) 10,985 – 10,985 – – 10,985
Notes to the Consolidated Financial Statements
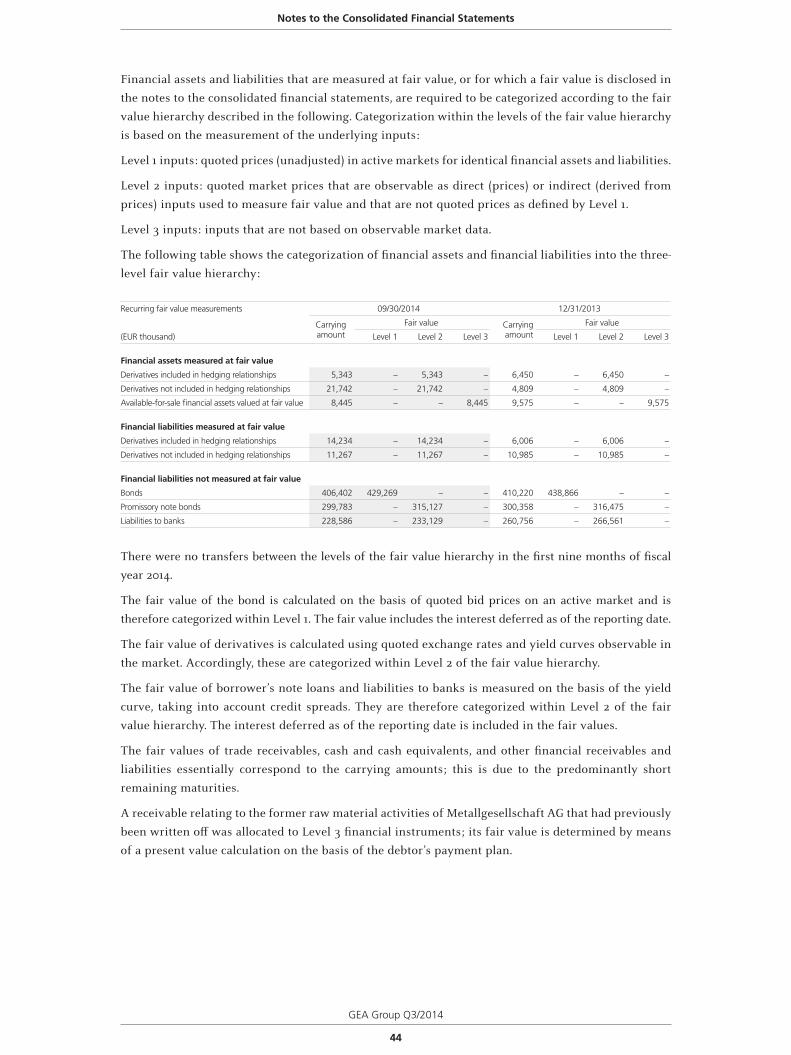
44
GEA Group Q3/2014
Financial assets and liabilities that are measured at fair value, or for which a fair value is disclosed in
the notes to the consolidated financial statements, are required to be categorized according to the fair
value hierarchy described in the following. Categorization within the levels of the fair value hierarchy
is based on the measurement of the underlying inputs:
Level 1 inputs: quoted prices (unadjusted) in active markets for identical financial assets and liabilities.
Level 2 inputs: quoted market prices that are observable as direct (prices) or indirect (derived from
prices) inputs used to measure fair value and that are not quoted prices as defined by Level 1.
Level 3 inputs: inputs that are not based on observable market data.
The following table shows the categorization of financial assets and financial liabilities into the three-
level fair value hierarchy:
Recurring fair value measurements 09/30/2014 12/31/2013
Carrying amount
Fair value Carrying amount
Fair value
(EUR thousand) Level 1 Level 2 Level 3 Level 1 Level 2 Level 3
Financial assets measured at fair value
Derivatives included in hedging relationships 5,343 – 5,343 – 6,450 – 6,450 –
Derivatives not included in hedging relationships 21,742 – 21,742 – 4,809 – 4,809 –
Available-for-sale financial assets valued at fair value 8,445 – – 8,445 9,575 – – 9,575
Financial liabilities measured at fair value
Derivatives included in hedging relationships 14,234 – 14,234 – 6,006 – 6,006 –
Derivatives not included in hedging relationships 11,267 – 11,267 – 10,985 – 10,985 –
Financial liabilities not measured at fair value
Bonds 406,402 429,269 – – 410,220 438,866 – –
Promissory note bonds 299,783 – 315,127 – 300,358 – 316,475 –
Liabilities to banks 228,586 – 233,129 – 260,756 – 266,561 –
There were no transfers between the levels of the fair value hierarchy in the first nine months of fiscal
year 2014.
The fair value of the bond is calculated on the basis of quoted bid prices on an active market and is
therefore categorized within Level 1. The fair value includes the interest deferred as of the reporting date.
The fair value of derivatives is calculated using quoted exchange rates and yield curves observable in
the market. Accordingly, these are categorized within Level 2 of the fair value hierarchy.
The fair value of borrower’s note loans and liabilities to banks is measured on the basis of the yield
curve, taking into account credit spreads. They are therefore categorized within Level 2 of the fair
value hierarchy. The interest deferred as of the reporting date is included in the fair values.
The fair values of trade receivables, cash and cash equivalents, and other financial receivables and
liabilities essentially correspond to the carrying amounts; this is due to the predominantly short
remaining maturities.
A receivable relating to the former raw material activities of Metallgesellschaft AG that had previously
been written off was allocated to Level 3 financial instruments; its fair value is determined by means
of a present value calculation on the basis of the debtor’s payment plan.
Notes to the Consolidated Financial Statements
45
GEA Group Q3/2014
5. Consolidated income statement disclosures
The taxes recognized during the interim reporting period were calculated for continuing operations
using an estimated tax rate of 21.4 percent (previous year: 21.5 percent).
6. Statement of comprehensive income and consolidated statement of changes in equity disclosures
Exchange differences on translating foreign operationsThe change in exchange differences on translating foreign operations amounted to EUR 82,242 thousand
in the reporting period (previous year: EUR –35,337 thousand) and resulted primarily from the rise in
the U.S. dollar against the euro. Exchange differences on translating foreign operations amounted to
EUR 93,684 thousand in the period from January to September, 2014 (previous year: EUR −51,165
thousand), and were also mainly attributable to the rise in the U.S. dollar against the euro.
Notes to the Consolidated Financial Statements
46
GEA Group Q3/2014
7. Segment reporting
7.1 Change in the structure of the operating segments
In January 2014, the Executive Board of GEA Group Aktiengesellschaft decided to combine its operating
segments GEA Food Solutions and GEA Mechanical Equipment effective as of the beginning of fiscal
year 2014. Production of machinery for preparing, marinating, processing, cutting, and packaging
meat, poultry, fish, cheese, and other foods, which formed part of the GEA Food Solutions Segment, is
now combined with the activities of GEA Mechanical Equipment in a single segment so as to better
exploit existing synergies.
The group’s operating segments were therefore reorganized: Since the beginning of 2014, GEA Food
Solutions has no longer been one of GEA Group’s operating segments. The activities of the former
GEA Food Solutions and GEA Mechanical Equipment Segments are now reported together under the
segment name GEA Mechanical Equipment. The prior-period information was adjusted to reflect the
amended reporting structure.
7.2 Operating segments
GEA Group’s business activities are divided into the following six operating segments:
GEA Farm Technologies Segment (GEA FT)GEA Farm Technologies is one of the world’s leading manufacturers of integrated product solutions
for profitable milk production and livestock farming. The segment’s combined expertise in the areas
of milking and milk-cooling technology, automatic feeding systems, manure management systems,
and barn equipment provides modern farming with a complete range of products and solutions.
Services and animal hygiene solutions round off its profile as a full-line systems provider for farms of
all sizes. The segment’s sales strategy is built upon a global network of specialist dealers and sales and
service partners.
GEA Heat Exchangers Segment (GEA HX)GEA Heat Exchangers provides products and systems for numerous areas of use, ranging from air
conditioning systems to cooling towers, boasting what is probably the largest portfolio of heat exchangers
worldwide. The segment supplies optimal single-source solutions for a large number of applications and
also offers customers professional support with project planning. The GEA Heat Exchangers Segment was
allocated to discontinued operations at the end of fiscal year 2013 (see section 3).
Notes to the Consolidated Financial Statements
47
GEA Group Q3/2014
GEA Mechanical Equipment Segment (GEA ME)GEA Mechanical Equipment specializes in high-quality process engineering components and process
technology solutions that ensure seamless processes and cost-effective production in almost all major
areas of industry worldwide. In addition to separators, decanters, valves, pumps, and homogenizers,
the segment’s product range includes machines used in food preparation, marination, processing,
slicing, and packaging. Such equipment helps reduce customer production costs and protect the
environment in a sustainable manner.
GEA Process Engineering Segment (GEA PE)GEA Process Engineering specializes in the design and development of process solutions for the dairy,
brewing, food, pharma, and chemical industries. The segment is an acknowledged market and
technology leader in its business areas: liquid processing, concentration, industrial drying, powder
processing and handling, and emission control.
GEA Refrigeration Technologies Segment (GEA RT)GEA Refrigeration Technologies is a market leader in the field of industrial refrigeration technology.
The segment develops, manufactures, and installs innovative key components and technical solutions
for its customers. To ensure complete customer satisfaction, GEA Refrigeration Technologies also
offers a broad range of maintenance and other services. Its product range comprises the following
core components: reciprocating and screw compressors, valves, chillers, ice generators, and freezing
systems.
OtherThe “Other” segment comprises the companies with business activities that do not form part of the
core business. In addition to the holding and service companies, it contains companies that report
investment property held for sale, pension obligations, and residual mining obligations.
Notes to the Consolidated Financial Statements
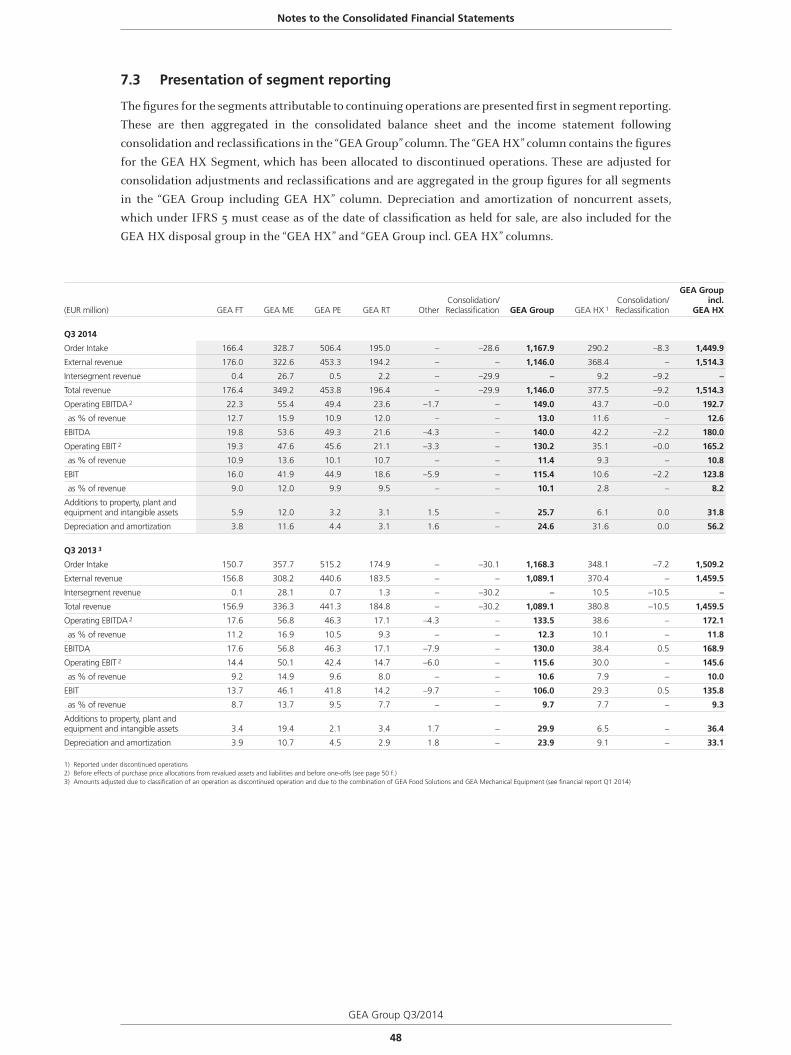
48
GEA Group Q3/2014
7.3 Presentation of segment reporting
The figures for the segments attributable to continuing operations are presented first in segment reporting.
These are then aggregated in the consolidated balance sheet and the income statement following
consolidation and reclassifications in the “GEA Group” column. The “GEA HX” column contains the figures
for the GEA HX Segment, which has been allocated to discontinued operations. These are adjusted for
consolidation adjustments and reclassifications and are aggregated in the group figures for all segments
in the “GEA Group including GEA HX” column. Depreciation and amortization of noncurrent assets,
which under IFRS 5 must cease as of the date of classification as held for sale, are also included for the
GEA HX disposal group in the “GEA HX” and “GEA Group incl. GEA HX” columns.
(EUR million) GEA FT GEA ME GEA PE GEA RT OtherConsolidation/Reclassification GEA Group GEA HX 1
Consolidation/Reclassification
GEA Group incl.
GEA HX
Q3 2014
Order Intake 166.4 328.7 506.4 195.0 – –28.6 1,167.9 290.2 –8.3 1,449.9
External revenue 176.0 322.6 453.3 194.2 – – 1,146.0 368.4 – 1,514.3
Intersegment revenue 0.4 26.7 0.5 2.2 – –29.9 – 9.2 –9.2 –
Total revenue 176.4 349.2 453.8 196.4 – –29.9 1,146.0 377.5 –9.2 1,514.3
Operating EBITDA 2 22.3 55.4 49.4 23.6 –1.7 – 149.0 43.7 –0.0 192.7
as % of revenue 12.7 15.9 10.9 12.0 – – 13.0 11.6 – 12.6
EBITDA 19.8 53.6 49.3 21.6 –4.3 – 140.0 42.2 –2.2 180.0
Operating EBIT 2 19.3 47.6 45.6 21.1 –3.3 – 130.2 35.1 –0.0 165.2
as % of revenue 10.9 13.6 10.1 10.7 – – 11.4 9.3 – 10.8
EBIT 16.0 41.9 44.9 18.6 –5.9 – 115.4 10.6 –2.2 123.8
as % of revenue 9.0 12.0 9.9 9.5 – – 10.1 2.8 – 8.2
Additions to property, plant and equipment and intangible assets 5.9 12.0 3.2 3.1 1.5 – 25.7 6.1 0.0 31.8
Depreciation and amortization 3.8 11.6 4.4 3.1 1.6 – 24.6 31.6 0.0 56.2
Q3 2013 3
Order Intake 150.7 357.7 515.2 174.9 – –30.1 1,168.3 348.1 –7.2 1,509.2
External revenue 156.8 308.2 440.6 183.5 – – 1,089.1 370.4 – 1,459.5
Intersegment revenue 0.1 28.1 0.7 1.3 – –30.2 – 10.5 –10.5 –
Total revenue 156.9 336.3 441.3 184.8 – –30.2 1,089.1 380.8 –10.5 1,459.5
Operating EBITDA 2 17.6 56.8 46.3 17.1 –4.3 – 133.5 38.6 – 172.1
as % of revenue 11.2 16.9 10.5 9.3 – – 12.3 10.1 – 11.8
EBITDA 17.6 56.8 46.3 17.1 –7.9 – 130.0 38.4 0.5 168.9
Operating EBIT 2 14.4 50.1 42.4 14.7 –6.0 – 115.6 30.0 – 145.6
as % of revenue 9.2 14.9 9.6 8.0 – – 10.6 7.9 – 10.0
EBIT 13.7 46.1 41.8 14.2 –9.7 – 106.0 29.3 0.5 135.8
as % of revenue 8.7 13.7 9.5 7.7 – – 9.7 7.7 – 9.3
Additions to property, plant and equipment and intangible assets 3.4 19.4 2.1 3.4 1.7 – 29.9 6.5 – 36.4
Depreciation and amortization 3.9 10.7 4.5 2.9 1.8 – 23.9 9.1 – 33.1
1) Reported under discontinued operations2) Before effects of purchase price allocations from revalued assets and liabilities and before one-offs (see page 50 f.)3) Amounts adjusted due to classification of an operation as discontinued operation and due to the combination of GEA Food Solutions and GEA Mechanical Equipment (see financial report Q1 2014)
Notes to the Consolidated Financial Statements
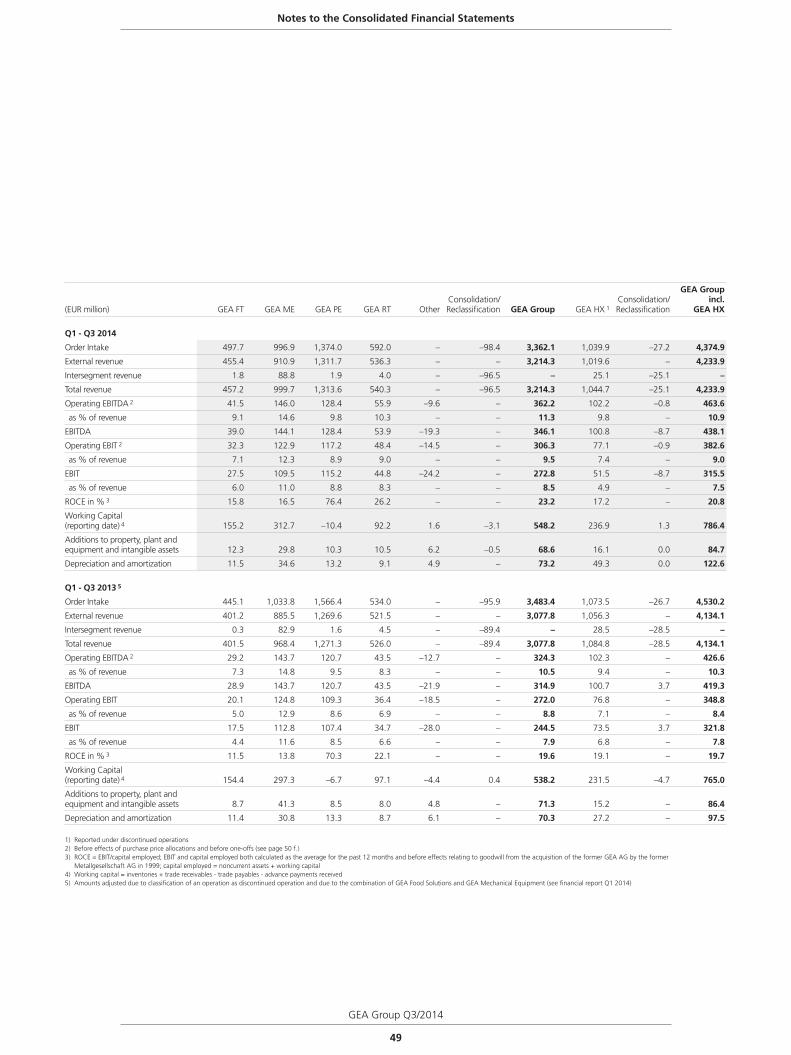
49
GEA Group Q3/2014
Notes to the Consolidated Financial Statements
(EUR million) GEA FT GEA ME GEA PE GEA RT OtherConsolidation/Reclassification GEA Group GEA HX 1
Consolidation/Reclassification
GEA Group incl.
GEA HX
Q1 - Q3 2014
Order Intake 497.7 996.9 1,374.0 592.0 – –98.4 3,362.1 1,039.9 –27.2 4,374.9
External revenue 455.4 910.9 1,311.7 536.3 – – 3,214.3 1,019.6 – 4,233.9
Intersegment revenue 1.8 88.8 1.9 4.0 – –96.5 – 25.1 –25.1 –
Total revenue 457.2 999.7 1,313.6 540.3 – –96.5 3,214.3 1,044.7 –25.1 4,233.9
Operating EBITDA 2 41.5 146.0 128.4 55.9 –9.6 – 362.2 102.2 –0.8 463.6
as % of revenue 9.1 14.6 9.8 10.3 – – 11.3 9.8 – 10.9
EBITDA 39.0 144.1 128.4 53.9 –19.3 – 346.1 100.8 –8.7 438.1
Operating EBIT 2 32.3 122.9 117.2 48.4 –14.5 – 306.3 77.1 –0.9 382.6
as % of revenue 7.1 12.3 8.9 9.0 – – 9.5 7.4 – 9.0
EBIT 27.5 109.5 115.2 44.8 –24.2 – 272.8 51.5 –8.7 315.5
as % of revenue 6.0 11.0 8.8 8.3 – – 8.5 4.9 – 7.5
ROCE in % 3 15.8 16.5 76.4 26.2 – – 23.2 17.2 – 20.8
Working Capital (reporting date) 4 155.2 312.7 –10.4 92.2 1.6 –3.1 548.2 236.9 1.3 786.4
Additions to property, plant and equipment and intangible assets 12.3 29.8 10.3 10.5 6.2 –0.5 68.6 16.1 0.0 84.7
Depreciation and amortization 11.5 34.6 13.2 9.1 4.9 – 73.2 49.3 0.0 122.6
Q1 - Q3 2013 5
Order Intake 445.1 1,033.8 1,566.4 534.0 – –95.9 3,483.4 1,073.5 –26.7 4,530.2
External revenue 401.2 885.5 1,269.6 521.5 – – 3,077.8 1,056.3 – 4,134.1
Intersegment revenue 0.3 82.9 1.6 4.5 – –89.4 – 28.5 –28.5 –
Total revenue 401.5 968.4 1,271.3 526.0 – –89.4 3,077.8 1,084.8 –28.5 4,134.1
Operating EBITDA 2 29.2 143.7 120.7 43.5 –12.7 – 324.3 102.3 – 426.6
as % of revenue 7.3 14.8 9.5 8.3 – – 10.5 9.4 – 10.3
EBITDA 28.9 143.7 120.7 43.5 –21.9 – 314.9 100.7 3.7 419.3
Operating EBIT 20.1 124.8 109.3 36.4 –18.5 – 272.0 76.8 – 348.8
as % of revenue 5.0 12.9 8.6 6.9 – – 8.8 7.1 – 8.4
EBIT 17.5 112.8 107.4 34.7 –28.0 – 244.5 73.5 3.7 321.8
as % of revenue 4.4 11.6 8.5 6.6 – – 7.9 6.8 – 7.8
ROCE in % 3 11.5 13.8 70.3 22.1 – – 19.6 19.1 – 19.7
Working Capital (reporting date) 4 154.4 297.3 –6.7 97.1 –4.4 0.4 538.2 231.5 –4.7 765.0
Additions to property, plant and equipment and intangible assets 8.7 41.3 8.5 8.0 4.8 – 71.3 15.2 – 86.4
Depreciation and amortization 11.4 30.8 13.3 8.7 6.1 – 70.3 27.2 – 97.5
1) Reported under discontinued operations2) Before effects of purchase price allocations and before one-offs (see page 50 f.)3) ROCE = EBIT/capital employed; EBIT and capital employed both calculated as the average for the past 12 months and before effects relating to goodwill from the acquisition of the former GEA AG by the former Metallgesellschaft AG in 1999; capital employed = noncurrent assets + working capital4) Working capital = inventories + trade receivables - trade payables - advance payments received5) Amounts adjusted due to classification of an operation as discontinued operation and due to the combination of GEA Food Solutions and GEA Mechanical Equipment (see financial report Q1 2014)
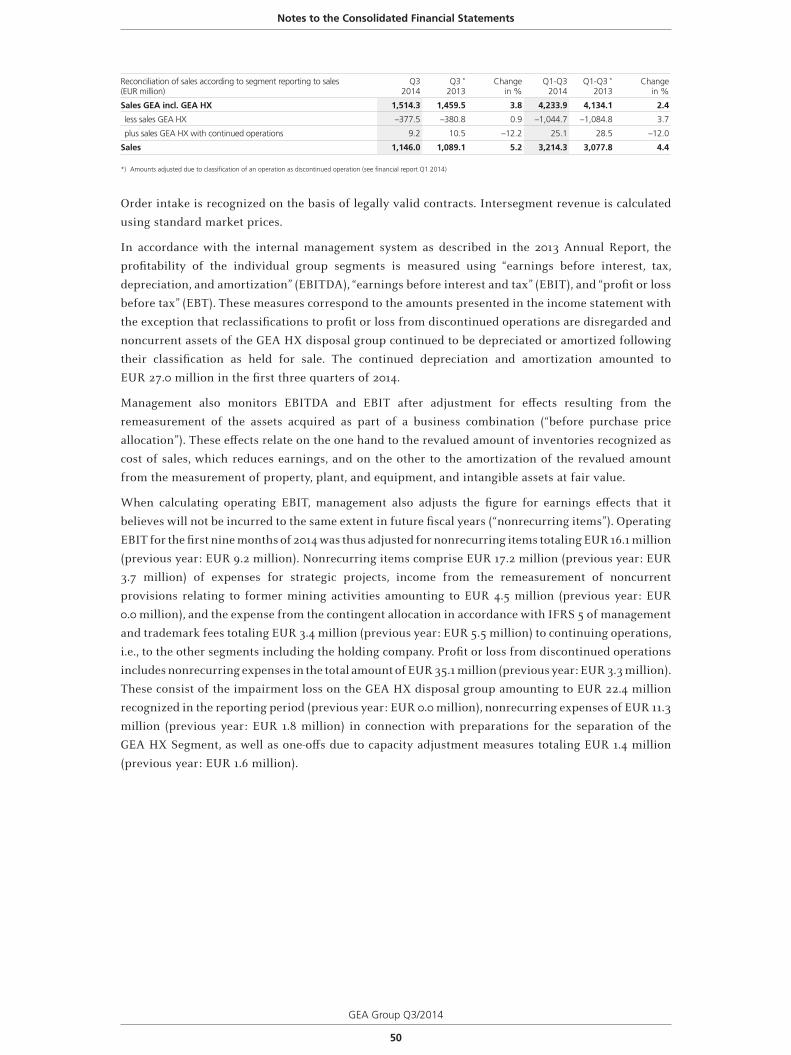
50
GEA Group Q3/2014
Notes to the Consolidated Financial Statements
Reconciliation of sales according to segment reporting to sales(EUR million)
Q32014
Q3 *
2013Change
in %Q1-Q3
2014Q1-Q3 *
2013Change
in %
Sales GEA incl. GEA HX 1,514.3 1,459.5 3.8 4,233.9 4,134.1 2.4
less sales GEA HX –377.5 –380.8 0.9 –1,044.7 –1,084.8 3.7
plus sales GEA HX with continued operations 9.2 10.5 –12.2 25.1 28.5 –12.0
Sales 1,146.0 1,089.1 5.2 3,214.3 3,077.8 4.4
*) Amounts adjusted due to classification of an operation as discontinued operation (see financial report Q1 2014)
Order intake is recognized on the basis of legally valid contracts. Intersegment revenue is calculated
using standard market prices.
In accordance with the internal management system as described in the 2013 Annual Report, the
profitability of the individual group segments is measured using “earnings before interest, tax,
depreciation, and amortization” (EBITDA), “earnings before interest and tax” (EBIT), and “profit or loss
before tax” (EBT). These measures correspond to the amounts presented in the income statement with
the exception that reclassifications to profit or loss from discontinued operations are disregarded and
noncurrent assets of the GEA HX disposal group continued to be depreciated or amortized following
their classification as held for sale. The continued depreciation and amortization amounted to
EUR 27.0 million in the first three quarters of 2014.
Management also monitors EBITDA and EBIT after adjustment for effects resulting from the
remeasurement of the assets acquired as part of a business combination (“before purchase price
allocation”). These effects relate on the one hand to the revalued amount of inventories recognized as
cost of sales, which reduces earnings, and on the other to the amortization of the revalued amount
from the measurement of property, plant, and equipment, and intangible assets at fair value.
When calculating operating EBIT, management also adjusts the figure for earnings effects that it
believes will not be incurred to the same extent in future fiscal years (“nonrecurring items”). Operating
EBIT for the first nine months of 2014 was thus adjusted for nonrecurring items totaling EUR 16.1 million
(previous year: EUR 9.2 million). Nonrecurring items comprise EUR 17.2 million (previous year: EUR
3.7 million) of expenses for strategic projects, income from the remeasurement of noncurrent
provisions relating to former mining activities amounting to EUR 4.5 million (previous year: EUR
0.0 million), and the expense from the contingent allocation in accordance with IFRS 5 of management
and trademark fees totaling EUR 3.4 million (previous year: EUR 5.5 million) to continuing operations,
i.e., to the other segments including the holding company. Profit or loss from discontinued operations
includes nonrecurring expenses in the total amount of EUR 35.1 million (previous year: EUR 3.3 million).
These consist of the impairment loss on the GEA HX disposal group amounting to EUR 22.4 million
recognized in the reporting period (previous year: EUR 0.0 million), nonrecurring expenses of EUR 11.3
million (previous year: EUR 1.8 million) in connection with preparations for the separation of the
GEA HX Segment, as well as one-offs due to capacity adjustment measures totaling EUR 1.4 million
(previous year: EUR 1.6 million).
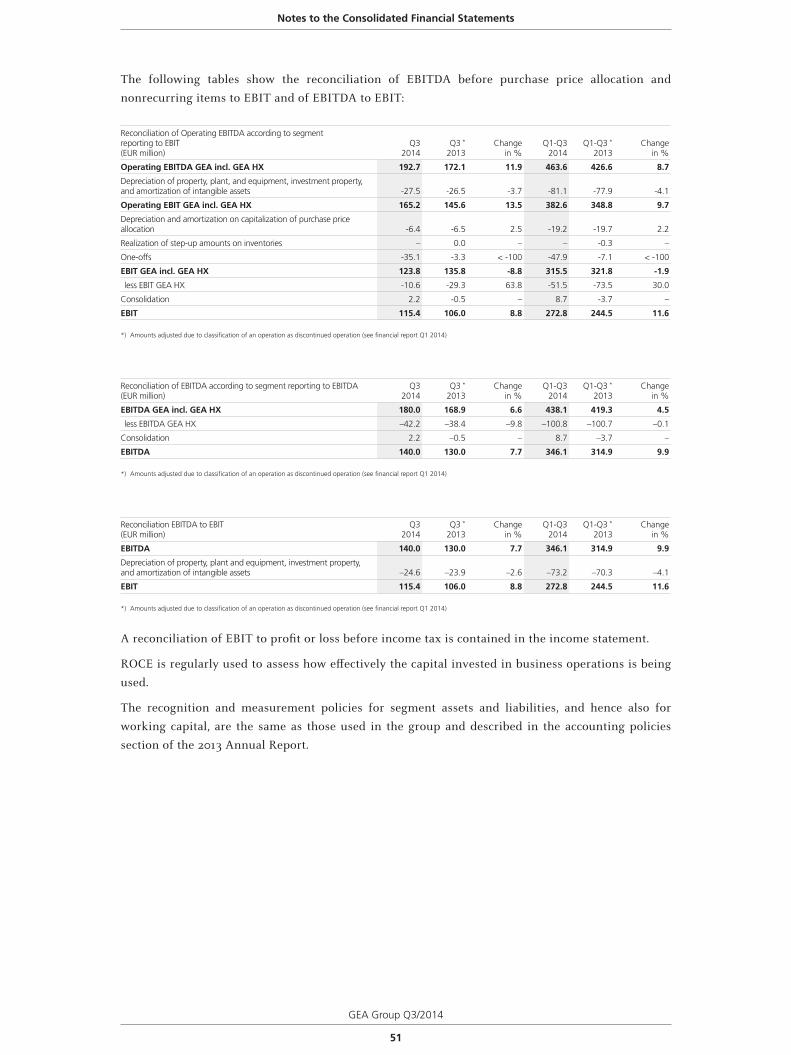
51
GEA Group Q3/2014
Notes to the Consolidated Financial Statements
The following tables show the reconciliation of EBITDA before purchase price allocation and
nonrecurring items to EBIT and of EBITDA to EBIT:
Reconciliation of Operating EBITDA according to segment reporting to EBIT(EUR million)
Q32014
Q3 *
2013Change
in %Q1-Q3
2014Q1-Q3 *
2013Change
in %
Operating EBITDA GEA incl. GEA HX 192.7 172.1 11.9 463.6 426.6 8.7
Depreciation of property, plant, and equipment, investment property, and amortization of intangible assets -27.5 -26.5 -3.7 -81.1 -77.9 -4.1
Operating EBIT GEA incl. GEA HX 165.2 145.6 13.5 382.6 348.8 9.7
Depreciation and amortization on capitalization of purchase price allocation -6.4 -6.5 2.5 -19.2 -19.7 2.2
Realization of step-up amounts on inventories – 0.0 – – -0.3 –
One-offs -35.1 -3.3 < -100 -47.9 -7.1 < -100
EBIT GEA incl. GEA HX 123.8 135.8 -8.8 315.5 321.8 -1.9
less EBIT GEA HX -10.6 -29.3 63.8 -51.5 -73.5 30.0
Consolidation 2.2 -0.5 – 8.7 -3.7 –
EBIT 115.4 106.0 8.8 272.8 244.5 11.6
*) Amounts adjusted due to classification of an operation as discontinued operation (see financial report Q1 2014)
Reconciliation of EBITDA according to segment reporting to EBITDA(EUR million)
Q32014
Q3 *
2013Change
in %Q1-Q3
2014Q1-Q3 *
2013Change
in %
EBITDA GEA incl. GEA HX 180.0 168.9 6.6 438.1 419.3 4.5
less EBITDA GEA HX –42.2 –38.4 –9.8 –100.8 –100.7 –0.1
Consolidation 2.2 –0.5 – 8.7 –3.7 –
EBITDA 140.0 130.0 7.7 346.1 314.9 9.9
*) Amounts adjusted due to classification of an operation as discontinued operation (see financial report Q1 2014)
Reconciliation EBITDA to EBIT(EUR million)
Q32014
Q3 *
2013Change
in %Q1-Q3
2014Q1-Q3 *
2013Change
in %
EBITDA 140.0 130.0 7.7 346.1 314.9 9.9
Depreciation of property, plant and equipment, investment property, and amortization of intangible assets –24.6 –23.9 –2.6 –73.2 –70.3 –4.1
EBIT 115.4 106.0 8.8 272.8 244.5 11.6
*) Amounts adjusted due to classification of an operation as discontinued operation (see financial report Q1 2014)
A reconciliation of EBIT to profit or loss before income tax is contained in the income statement.
ROCE is regularly used to assess how effectively the capital invested in business operations is being
used.
The recognition and measurement policies for segment assets and liabilities, and hence also for
working capital, are the same as those used in the group and described in the accounting policies
section of the 2013 Annual Report.
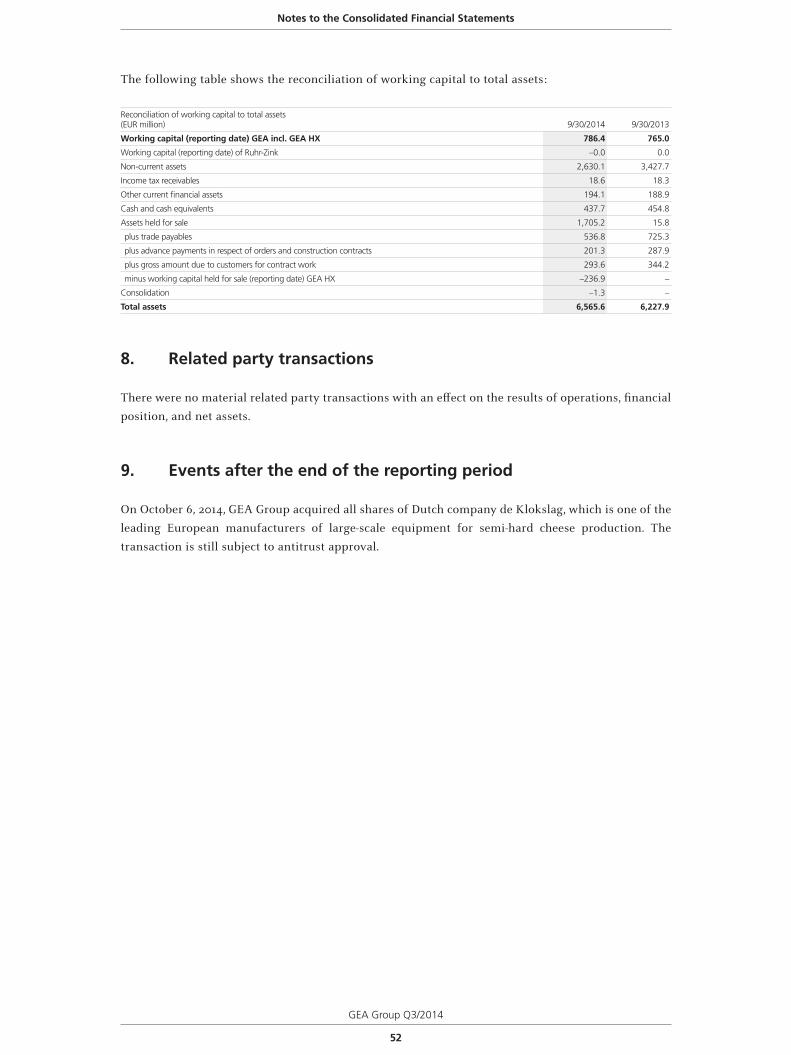
52
GEA Group Q3/2014
Notes to the Consolidated Financial Statements
The following table shows the reconciliation of working capital to total assets:
Reconciliation of working capital to total assets(EUR million) 9/30/2014 9/30/2013
Working capital (reporting date) GEA incl. GEA HX 786.4 765.0
Working capital (reporting date) of Ruhr-Zink –0.0 0.0
Non-current assets 2,630.1 3,427.7
Income tax receivables 18.6 18.3
Other current financial assets 194.1 188.9
Cash and cash equivalents 437.7 454.8
Assets held for sale 1,705.2 15.8
plus trade payables 536.8 725.3
plus advance payments in respect of orders and construction contracts 201.3 287.9
plus gross amount due to customers for contract work 293.6 344.2
minus working capital held for sale (reporting date) GEA HX –236.9 –
Consolidation –1.3 –
Total assets 6,565.6 6,227.9
8. Related party transactions
There were no material related party transactions with an effect on the results of operations, financial
position, and net assets.
9. Events after the end of the reporting period
On October 6, 2014, GEA Group acquired all shares of Dutch company de Klokslag, which is one of the
leading European manufacturers of large-scale equipment for semi-hard cheese production. The
transaction is still subject to antitrust approval.
53
GEA Group Q3/2014
Financial Calendar / Publication Details
Financial Calendar
February 4, 2015 Release of preliminary figures 2014
March 10, 2015 Annual Report 2014
April 16, 2015 Annual Shareholders‘ Meeting for 2014
Investor Relations
Tel. +49 (0)211 9136-1492
Fax +49 (0)211 9136-31492
Mail [email protected]
Public Relations
Tel. +49 (0)211 9136-1492
Fax +49 (0)211 9136-31492
Mail [email protected]
Publication Details
Published by GEA Group Aktiengesellschaft Peter-Müller-Straße 12 40468 Düsseldorf Germany www.gea.com
Design www.kpad.de
This report is a translation of the German original; in the event of variances, the German version shall take precedence over the Englisch translation.
The GEA Group Stock: Key data
WKN 660 200
ISIN DE0006602006
Reuters code G1AG.DE
Bloomberg code G1A.GR
Xetra G1A.DE
American Depository Receipts (ADR)
CUSIP 361592108
Symbol GEAGY
Sponsor Deutsche Bank Trust Company Americas
ADR-Level 1
Ratio 1:1
This report includes forward-looking statements on GEA Group Aktiengesellschaft, its subsidiaries and associates, and on the economic and political
conditions that may influence the business performance of the GEA Group. All these statements are based on assumptions made by the Executive
Board using information available to it at the time. Should these assumptions prove to be wholly or partly incorrect, or should further risks arise,
actual business performance may differ from that expected. The Executive Board therefore cannot assume any liability for the statements made.
GEA Group is a global engineering company with multi-billion euro sales and operations in more than 50 countries. Founded in 1881 the company is one of the largest providers of innovative equipment and process technology. GEA Group is listed in the STOXX® Europe 600 Index.
We live our values.Excellence • Passion • Integrity • Responsibility • GEA-versity
GEA Group Aktiengesellschaft
Peter-Müller-Straße 12, 40468 DüsseldorfGermanyPhone: +49 211 [email protected], www.gea.com