2013 ye hoi fs draft 02-13-2014 11am · section 3 ─ trusts and ... local health integration...
TRANSCRIPT

This publication is available in English and French. CD-ROM copies in either language may be obtained from:
ServiceOntario PublicationsTelephone: (416) 326-5300Toll-free: 1-800-668-9938
TTY Toll-free: 1-800-268-7095Website: www.serviceontario.ca/publications
For electronic access, visit the Ministry of Finance website at www.fin.gov.on.ca
Le présent document est publié en français et en anglais.On peut en obtenir une version sur CD-ROM dans l’une ou l’autre langue auprès de :
Publications ServiceOntarioTéléphone : 416 326-5300Sans frais : 1 800 668-9938
Téléimprimeur (ATS) sans frais : 1 800 268-7095Site Web : www.serviceontario.ca/publications
Pour en obtenir une version électronique, il suffit de consulter le site Web du ministère des Finances à www.fin.gov.on.ca
© Queen’s Printer for Ontario, 2014ISSN 0381-2375 (Print)
ISSN 1913-5556 (Online) Volume 2c
P U B L I CA C C O U N T S
of
O N T A R I O
2013–2014
Ministry of Finance
F INANCIAL S TATEMENTS OF
G OVERNMENT B USINESS E NTERPRISES ,
T RUSTS AND M ISCELLANEOUS
S TATEMENTS
20
13
–2
01
4O
NT
AR
IO
2 c
Pu
blic A
ccou
nts o
f


Volume 2c
P U B L I CA C C O U N T S
of
O N T A R I O
2013–2014
Ministry of Finance
F INANCIAL S TATEMENTS OF
G OVERNMENT B USINESS E NTERPRISES ,
T RUSTS AND M ISCELLANEOUS
S TATEMENTS


TABLE OF CONTENTS Volume 2c
Page
General
Responsible Ministry for Government Agencies .......................................................................................... ii A Guide to the Public Accounts ................................................................................................................... iv
FINANCIAL STATEMENTS
Section 2 ─ Government Business Enterprises
Hydro One Inc............................................................................................ December 31, 2013 ............... 2-1 Liquor Control Board of Ontario ................................................................. March 31, 2014 ...................... 2-49 Ontario Lottery and Gaming Corporation ................................................... March 31, 2014 ...................... 2-79 Ontario Power Generation Inc.................................................................... December 31, 2013 ............... 2-131
Section 3 ─ Trusts and Miscellaneous Statements
Deposit Insurance Corporation of Ontario.................................................. December 31, 2013 ............... 3-1 Motor Vehicle Accident Claims Fund ......................................................... March 31, 2014 ...................... 3-19 Ontario Pension Board............................................................................... December 31, 2013 ............... 3-31 Pension Benefits Guarantee Fund ............................................................. March 31, 2014 ...................... 3-59 Provincial Judges Pension Fund................................................................ March 31, 2014 ...................... 3-73 The Public Guardian and Trustee for the Province of Ontario ................... March 31, 2014 ...................... 3-79 Workplace Safety and Insurance Board..................................................... December 31, 2013 ............... 3-111 Losses Deleted from the Accounts ............................................................ March 31, 2014 ...................... 3-171 Revenue Remissions ................................................................................. March 31, 2014 ...................... 3-173
i
PUBLIC ACCOUNTS, 2013-2014
ii
RESPONSIBLE MINISTRY FOR GOVERNMENT BUSINESS ENTERPRISES, ORGANIZATIONS, TRUSTS & MISCELLANEOUS FINANCIAL STATEMENTS
Ministry of Agriculture and Food/Rural Affairs AgriCorp Agricultural Research Institute of Ontario Ontario Racing Commission
Ministry of the Attorney General Legal Aid Ontario The Public Guardian and Trustee for the Province of Ontario
Ministry of Economic Development, Trade and Employment/Research and Innovation Ontario Capital Growth Corporation Ontario Immigrant Investor Corporation
Ministry of Education Education Quality and Accountability Office Ontario Educational Communications Authority (TV Ontario) Ontario French-Language Educational Communications Authority
Ministry of Energy Hydro One Inc. Independent Electricity System Operator Ontario Energy Board Ontario Power Authority Ontario Power Generation Inc.
Ministry of the Environment Ontario Clean Water Agency
Ministry of Finance Deposit Insurance Corporation of Ontario Liquor Control Board of Ontario Losses Deleted from the Accounts Motor Vehicle Accident Claims Fund Ontario Electricity Financial Corporation Ontario Financing Authority Ontario Lottery and Gaming Corporation Ontario Securities Commission Pension Benefits Guarantee Fund Provincial Judges Pension Fund Revenue Remissions
Ministry of Government Services Ontario Pension Board
Ministry of Infrastructure General Real Estate Portfolio Ontario Infrastructure and Lands Corporation (Infrastructure Ontario) Toronto Waterfront Revitalization Corporation (Waterfront Toronto)

PUBLIC ACCOUNTS, 2013-2014
iii
RESPONSIBLE MINISTRY FOR GOVERNMENT BUSINESS ENTERPRISES, ORGANIZATIONS, TRUSTS & MISCELLANEOUS FINANCIAL STATEMENTS
Ministry of Health and Long-Term Care Cancer Care Ontario eHealth Ontario Local Health Integration Network – Central Local Health Integration Network – Central East Local Health Integration Network – Central West Local Health Integration Network – Champlain Local Health Integration Network – Erie St. Clair Local Health Integration Network – Hamilton Niagara Haldimand Brant Local Health Integration Network – Mississauga Halton Local Health Integration Network – North East Local Health Integration Network – North Simcoe Muskoka Local Health Integration Network – North West Local Health Integration Network – South East Local Health Integration Network – South West Local Health Integration Network – Toronto Central Local Health Integration Network – Waterloo Wellington Ontario Agency for Health Protection and Promotion (Public Health Ontario) Ornge
Ministry of Labour Workplace Safety and Insurance Board
Ministry of Municipal Affairs and Housing Ontario Mortgage and Housing Corporation
Ministry of Natural Resources Algonquin Forestry Authority Forest Renewal Trust
Ministry of Northern Development and Mines Northern Ontario Heritage Fund Corporation Ontario Northland Transportation Commission
Ministry of Tourism, Culture and Sport The Centennial Centre of Science and Technology (Ontario Science Centre) Metropolitan Toronto Convention Centre Corporation Niagara Parks Commission Ontario Place Corporation Ontario Tourism Marketing Partnership Corporation Ontario Trillium Foundation Ottawa Convention Centre Corporation Province of Ontario Council for the Arts (Ontario Arts Council) The Royal Ontario Museum Toronto Organizing Committee for the 2015 Pan American and Parapan American Games (Toronto 2015)
Ministry of Transportation Metrolinx

PUBLIC ACCOUNTS, 2013-2014
iv
A GUIDE TO THE PUBLIC ACCOUNTS
1. SCOPE OF THE PUBLIC ACCOUNTS
The 2013-2014 Public Accounts of the Province of Ontario comprise the Annual Report and Consolidated Financial Statements and three volumes:
Volume 1 contains ministry statements and detailed schedules of debt and other items. The ministry statements reflect the financial activities of the government’s ministries on the accrual basis of accounting, providing a comparison of appropriations with actual spending. Ministry expenses include all expenses that are subject to appropriation approved by the Legislative Assembly, but exclude adjustments arising from consolidation of government organizations whose expenses are not appropriated.
Volume 2 contains the financial statements of Government Organizations and Business Enterprises that are part of the government’s reporting entity and other miscellaneous financial statements.
Volume 3 contains the details of payments made by ministries to vendors (including sales tax) and transfer payment recipients that are not deemed to be prohibited by the Freedom of Information and Protection of Privacy Act.
2. A GUIDE TO VOLUME 2 OF THE PUBLIC ACCOUNTS
The financial statements of the selected crown corporations, boards and commissions are for fiscal periods ending within the Province’s own fiscal period April 1, 2013 to March 31, 2014. They are presented in the same detail as the approved, audited financial statements and as nearly as possible in the same form. The statements have been presented in the order shown in the Table of Contents. In addition, a listing is provided which groups the crown corporations, boards and commissions by ministerial responsibility.

GOVERNMENT BUSINESS ENTERPRISES

MANAGEM The Consolidahave been prepintegrity, consprepared in acThe MD&A h The preparatioassumptions bcannot be finaconditions andsignificant accThe preparatioimpact of futuresources, opeassessment ofFinancial Statinformation up Management Company. In comprehensiveconduct policauthorities; anreasonable assmanagement haccordance wSponsoring OCompany maiinternal controrequired. The ConsolidaShareholder. Statements areAuditors’ Rep The Hydro Onfulfills its respperiodically wdischarged its by the Board without the pre The President Hydro One’s athe design and On behalf of H
Carmin Preside
MENT’S REP
ated Financial pared by the msistency and reccordance withas been prepar
on of the Consbased on manalized with certd various othecounting policion of the Conure events anderating trends,f this informattements and Mp to February 1
is responsiblemeeting its ree system of in
cy; implementand sound and cosurance that ashas assessed th
with the criteriaOrganizations o
ntained effectiols and finding
ated Financial The external e fairly presentort outlines the
ne Board of Diponsibilities forwith manageme
respective resof Directors. Tesence of mana
and Chief Exannual Consol
d effectiveness
Hydro One Inc.
ne Marcello ent and Chief E
PORT
Statements, Mmanagement of eliability of alh United Statesred in accordan
solidated Finanagement’s judtainty until futuer assumptionies followed bnsolidated Finad transactions.
risks and untion because f
MD&A have b13, 2014.
e for establishesponsibility fonternal controlation of a risonservative acssets are safege design and opa set forth in of the Treadwive internal congs is reported
Statements havauditors’ resp
ted in accordane scope of their
irectors, througr financial repoent, the internaponsibility andThe external aagement, to dis
ecutive Officelidated Financiof related inter
.’s managemen
Executive Offic
Management’s Df Hydro One Inll such informas Generally Ac
nce with Nation
ncial Statemendgement, particure periods. Ess believed to y the Companancial StatemeThe MD&A a
ncertainties. Acfuture events been properly
ing and maintor the reliabilitl and internal sk managemencounting polic
guarded and thperating effectInternal Cont
way Commissntrol over finato the Audit
ve been examiponsibility is nce with Unitedr examination
gh its Audit anorting and inteal auditors andd to review the
auditors had discuss their aud
r and the Chieial Statements rnal controls ov
nt:
cer
Discussion andnc. (Hydro Oneation presenteccepted Accounal Instrument
nts and informacularly when stimates and asbe reasonable
ny as describedents and the Malso includes ictual results inand circumstaprepared wit
taining adequaty of financialaudit. The sys
nt framework;cies that are reghat reliable inftiveness of the trol – Integration. Based onncial reportingand Finance C
ined by KPMGto express thed States Generaand their opini
nd Finance Coernal controls. d the external ae Consolidatedrect and full a
dit findings.
ef Administratiand annual Mver financial re
Sandy StrutChief Adm
d Analysis (MDe or the Compad. The Consolunting Principl51-102, Part 5
ation in the Mtransactions assumptions aree in the circumd in Note 2 to MD&A includinformation regn the future m
ances may notthin reasonable
ate internal col information, stem of intern; effective seggularly revieweformation is avCompany’s in
ted Frameworkn this assessmg as of DecembCommittee of
G LLP, indepeneir opinion onally Accepted Aion.
mmittee, is resThe Audit andauditors to sat
d Financial Staaccess to the A
ion Officer andMD&A, related
eporting.
thers ministration Off
D&A) and relaany). Managemlidated Financles and applica5.
D&A involvesaffecting the ce based on hist
umstances, withthe Consolida
es informationgarding sourcemay differ mat occur as expe limits of m
ontrol over fimanagement m
nal control incgregation of ded. This structvailable on a
nternal control k (1992), issument, managember 31, 2013. Tthe Hydro On
ndent external n whether theAccounting Pr
sponsible for ed Finance Comtisfy itself thatatements beforeAudit and Fina
d Chief Financdisclosure con
ficer and Chief
ated financial ment is responscial Statementsable securities
s the use of escurrent accountorical experienh critical analated Financial n regarding thes of liquidity aterially from pected. The C
materiality and
nancial reportmaintains and
cludes a writteduties and deture is designedtimely basis. over financial
ued by the Coment concludeThe effectivenne Board of D
auditors appoie Consolidatedrinciples. The I
ensuring that mmmittee of Hydt each group he recommendin
ance Committe
cial Officer hantrols and proc
f Financial Offi
information sible for the s have been
legislation.
stimates and nting period nce, current lysis of the Statements.
he estimated and capital the present
Consolidated in light of
ting for the relies on a
en corporate elegation of d to provide In addition, reporting in
ommittee of ed that the
ness of these Directors, as
inted by the d Financial Independent
management dro One met had properly ng approval
ee, with and
ave certified cedures and
icer
HYDRO ONE INC.
PUBLIC ACCOUNTS, 2013-2014 2-1
HYDRO ONE INC. INDEPENDENT AUDITORS’ REPORT
2
To the Shareholder of Hydro One Inc. We have audited the accompanying Consolidated Financial Statements of Hydro One Inc., which comprise the consolidated balance sheets as at December 31, 2013 and December 31, 2012, the consolidated statements of operations and comprehensive income, changes in shareholder’s equity and cash flows for the years then ended, and notes, comprising a summary of significant accounting policies and other explanatory information. Management’s Responsibility for the Consolidated Financial Statements Management is responsible for the preparation and fair presentation of these Consolidated Financial Statements in accordance with United States Generally Accepted Accounting Principles, and for such internal control as management determines is necessary to enable the preparation of Consolidated Financial Statements that are free from material misstatement, whether due to fraud or error. Auditors’ Responsibility Our responsibility is to express an opinion on these Consolidated Financial Statements based on our audits. We conducted our audits in accordance with Canadian generally accepted auditing standards. Those standards require that we comply with ethical requirements and plan and perform the audit to obtain reasonable assurance about whether the Consolidated Financial Statements are free from material misstatement. An audit involves performing procedures to obtain audit evidence about the amounts and disclosures in the Consolidated Financial Statements. The procedures selected depend on our judgement, including the assessment of the risks of material misstatement of the Consolidated Financial Statements, whether due to fraud or error. In making those risk assessments, we consider internal control relevant to the entity’s preparation and fair presentation of the Consolidated Financial Statements in order to design audit procedures that are appropriate in the circumstances, but not for the purpose of expressing an opinion on the effectiveness of the entity’s internal control. An audit also includes evaluating the appropriateness of accounting policies used and the reasonableness of accounting estimates made by management, as well as evaluating the overall presentation of the Consolidated Financial Statements. We believe that the audit evidence we have obtained in our audits is sufficient and appropriate to provide a basis for our audit opinion. Opinion In our opinion, the Consolidated Financial Statements present fairly, in all material respects, the consolidated financial position of Hydro One Inc. as at December 31, 2013 and December 31, 2012, and its consolidated results of operations and its consolidated cash flows for the years then ended in accordance with United States Generally Accepted Accounting Principles. Chartered Professional Accountants, Licensed Public Accountants Toronto, Canada February 13, 2014
2-2 PUBLIC ACCOUNTS, 2013-2014
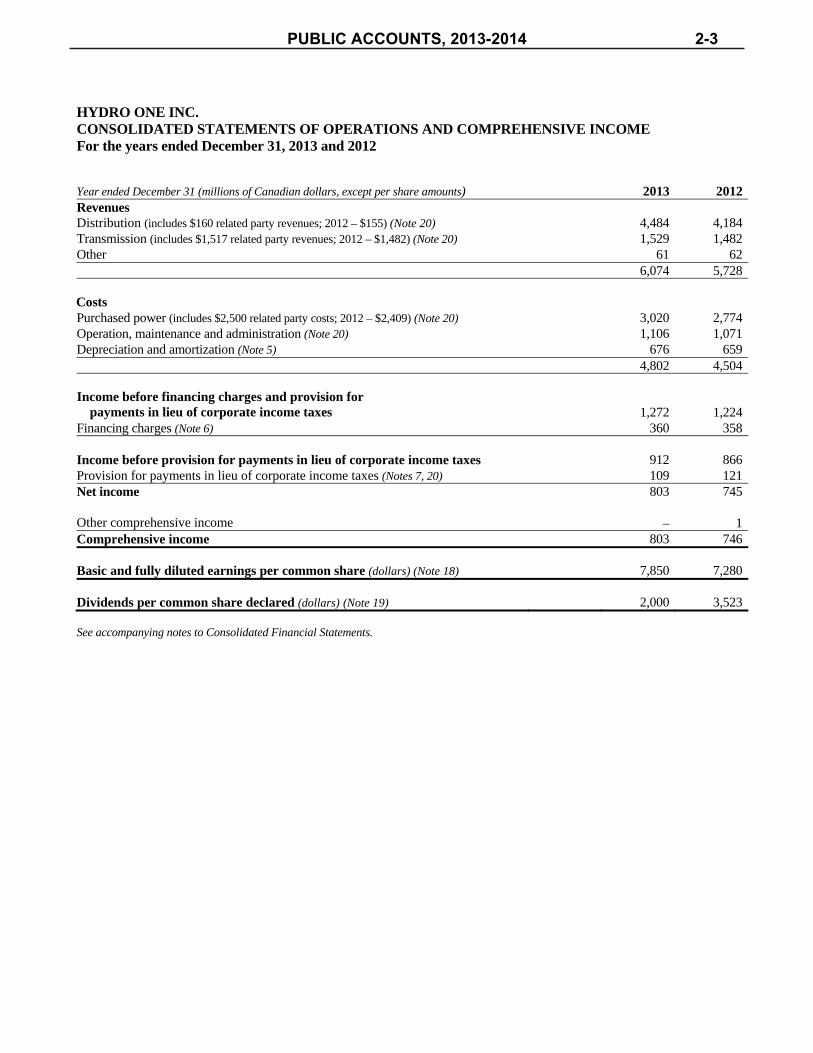
HYDRO ONE INC. CONSOLIDATED STATEMENTS OF OPERATIONS AND COMPREHENSIVE INCOME For the years ended December 31, 2013 and 2012
3
Year ended December 31 (millions of Canadian dollars, except per share amounts) 2013 2012Revenues Distribution (includes $160 related party revenues; 2012 – $155) (Note 20) 4,484 4,184Transmission (includes $1,517 related party revenues; 2012 – $1,482) (Note 20) 1,529 1,482Other 61 62 6,074 5,728 Costs Purchased power (includes $2,500 related party costs; 2012 – $2,409) (Note 20) 3,020 2,774Operation, maintenance and administration (Note 20) 1,106 1,071Depreciation and amortization (Note 5) 676 659
4,802 4,504
Income before financing charges and provision for payments in lieu of corporate income taxes 1,272 1,224
Financing charges (Note 6) 360 358
Income before provision for payments in lieu of corporate income taxes 912 866Provision for payments in lieu of corporate income taxes (Notes 7, 20) 109 121Net income 803 745 Other comprehensive income – 1Comprehensive income 803 746 Basic and fully diluted earnings per common share (dollars) (Note 18) 7,850 7,280 Dividends per common share declared (dollars) (Note 19) 2,000 3,523 See accompanying notes to Consolidated Financial Statements.
PUBLIC ACCOUNTS, 2013-2014 2-3

HYDRO ONE INC. CONSOLIDATED BALANCE SHEETS At December 31, 2013 and 2012
4
December 31 (millions of Canadian dollars) 2013 2012Assets Current assets: Cash and cash equivalents (Note 13) 565 195 Accounts receivable (net of allowance for doubtful accounts – $36; 2012 – $23) (Note 8) 923 845 Due from related parties (Note 20) 197 154 Regulatory assets (Note 11) 47 29 Materials and supplies 23 23 Deferred income tax assets (Note 7) 18 18 Derivative instruments (Note 13) 6 – Investment (Notes 13, 20) 251 – Other 28 22 2,058 1,286Property, plant and equipment (Note 9): Property, plant and equipment in service 23,820 22,650 Less: accumulated depreciation 8,615 8,145
15,205 14,505 Construction in progress 1,078 1,055 Future use land, components and spares 148 147 16,431 15,707Other long-term assets: Regulatory assets (Note 11) 2,636 3,098 Investment (Notes 13, 20) – 251 Intangible assets (net of accumulated amortization – $252; 2012 – $305) (Note 10) 313 267 Goodwill 133 133 Deferred debt costs 36 34 Derivative instruments (Note 13) 6 19 Deferred income tax assets (Note 7) 11 14 Other 1 2 3,136 3,818Total assets 21,625 20,811 See accompanying notes to Consolidated Financial Statements.
2-4 PUBLIC ACCOUNTS, 2013-2014

HYDRO ONE INC. CONSOLIDATED BALANCE SHEETS (continued) At December 31, 2013 and 2012
5
December 31 (millions of Canadian dollars, except number of shares) 2013 2012Liabilities Current liabilities: Bank indebtedness (Note 13) 31 42 Accounts payable 62 140 Accrued liabilities (Notes 7, 15, 16) 733 578 Due to related parties (Note 20) 230 261 Accrued interest 100 95 Regulatory liabilities (Note 11) 85 40 Long-term debt payable within one year (includes $506 measured at fair value; 2012 – $0) (Notes 12, 13) 756 600 1,997 1,756 Long-term debt (includes $256 measured at fair value; 2012 – $769) (Notes 12, 13) 8,301 7,879Other long-term liabilities: Post-retirement and post-employment benefit liability (Note 15) 1,488 1,416 Deferred income tax liabilities (Note 7) 1,129 944 Pension benefit liability (Note 15) 845 1,515 Environmental liabilities (Note 16) 239 227 Regulatory liabilities (Note 11) 163 181 Net unamortized debt premiums 20 23 Asset retirement obligations (Note 17) 14 15 Long-term accounts payable and other liabilities 14 25 3,912 4,346Total liabilities 14,210 13,981 Contingencies and commitments (Notes 22, 23) Preferred shares (authorized: unlimited; issued: 12,920,000) (Notes 18, 19) 323 323 Shareholder’s equity Common shares (authorized: unlimited; issued: 100,000) (Notes 18, 19) 3,314 3,314 Retained earnings 3,787 3,202 Accumulated other comprehensive loss (9) (9)Total shareholder’s equity 7,092 6,507Total liabilities, preferred shares and shareholder’s equity 21,625 20,811 See accompanying notes to Consolidated Financial Statements. On behalf of the Board of Directors: James Arnett Michael J. Mueller Chair Chair, Audit and Finance Committee
PUBLIC ACCOUNTS, 2013-2014 2-5

HYDRO ONE INC. CONSOLIDATED STATEMENTS OF CHANGES IN SHAREHOLDER’S EQUITY
For the years ended December 31, 2013 and 2012
6
Year ended December 31, 2013 (millions of Canadian dollars)
Common
Shares
Retained Earnings
Accumulated Other Comprehensive
Loss
Total Shareholder’s
Equity January 1, 2013 3,314 3,202 (9) 6,507Net income – 803 – 803Other comprehensive income – – – –Dividends on preferred shares – (18) – (18)Dividends on common shares – (200) – (200)December 31, 2013 3,314 3,787 (9) 7,092 Year ended December 31, 2012 (millions of Canadian dollars)
Common
Shares
Retained Earnings
Accumulated Other Comprehensive
Loss
Total Shareholder’s
Equity January 1, 2012 3,314 2,827 (10) 6,131Net income – 745 – 745Other comprehensive income – – 1 1Dividends on preferred shares – (18) – (18)Dividends on common shares – (352) – (352)December 31, 2012 3,314 3,202 (9) 6,507 See accompanying notes to Consolidated Financial Statements.
2-6 PUBLIC ACCOUNTS, 2013-2014

HYDRO ONE INC. CONSOLIDATED STATEMENTS OF CASH FLOWS
For the years ended December 31, 2013 and 2012
7
Year ended December 31 (millions of Canadian dollars) 2013 2012Operating activities Net income 803 745Environmental expenditures (16) (18)Adjustments for non-cash items:
Depreciation and amortization (excluding removal costs) 597 589Regulatory assets and liabilities 3 12Deferred income taxes (2) (9)Other 8 6
Changes in non-cash balances related to operations (Note 21) 11 (31)Net cash from operating activities 1,404 1,294 Financing activities Long-term debt issued 1,185 1,085Long-term debt retired (600) (600)Dividends paid (218) (370)Change in bank indebtedness (11) 3Other (5) (1)Net cash from financing activities 351 117 Investing activities Capital expenditures (Note 21)
Property, plant and equipment (1,333) (1,373)Intangible assets (79) (90)
Other 27 19Net cash used in investing activities (1,385) (1,444) Net change in cash and cash equivalents 370 (33)Cash and cash equivalents, beginning of year 195 228Cash and cash equivalents, end of year 565 195 See accompanying notes to Consolidated Financial Statements.
PUBLIC ACCOUNTS, 2013-2014 2-7

HYDRO ONE INC. NOTES TO CONSOLIDATED FINANCIAL STATEMENTS For the years ended December 31, 2013 and 2012
8
1. DESCRIPTION OF THE BUSINESS Hydro One Inc. (Hydro One or the Company) was incorporated on December 1, 1998, under the Business Corporations Act (Ontario) and is wholly owned by the Province of Ontario (Province). The principal businesses of Hydro One are the transmission and distribution of electricity to customers within Ontario. The electricity rates of these businesses are regulated by the Ontario Energy Board (OEB). 2. SIGNIFICANT ACCOUNTING POLICIES Basis of Consolidation These Consolidated Financial Statements include the accounts of the Company and its wholly owned subsidiaries: Hydro One Networks Inc. (Hydro One Networks), Hydro One Remote Communities Inc. (Hydro One Remote Communities), Hydro One Brampton Networks Inc. (Hydro One Brampton Networks), Hydro One Telecom Inc. (Hydro One Telecom), Hydro One Lake Erie Link Management Inc., and Hydro One Lake Erie Link Company Inc. Intercompany transactions and balances have been eliminated. Basis of Accounting These Consolidated Financial Statements are prepared and presented in accordance with United States (US) Generally Accepted Accounting Principles (GAAP) and in Canadian dollars. Certain comparative figures have been reclassified to conform to the presentation of these Consolidated Financial Statements (see Note 21 – Consolidated Statements of Cash Flows). In the opinion of management, these Consolidated Financial Statements include all adjustments that are necessary to fairly state the financial position and results of operations of Hydro One as at, and for the year ended December 31, 2013. Hydro One performed an evaluation of subsequent events through to February 13, 2014, the date these Consolidated Financial Statements were issued, to determine whether any events or transactions warranted recognition and disclosure in these Consolidated Financial Statements. See Note 25 – Subsequent Event. Use of Management Estimates The preparation of financial statements requires management to make estimates and assumptions that affect the reported amounts of assets and liabilities at the date of the financial statements and the reported amounts of revenues, expenses, gains and losses during the reporting periods. Management evaluates these estimates on an ongoing basis based upon: historical experience; current conditions; and assumptions believed to be reasonable at the time the assumptions are made with any adjustments being recognized in results of operations in the period they arise. Significant estimates relate to regulatory assets and regulatory liabilities, environmental liabilities, pension benefits, post-retirement and post-employment benefits, asset retirement obligations (AROs), goodwill and asset impairments, contingencies, unbilled revenues, allowance for doubtful accounts, derivative instruments, and deferred income tax assets and liabilities. Actual results may differ significantly from these estimates, which may be impacted by future decisions made by the OEB or the Province. Rate Setting The Company’s Transmission Business includes the separately regulated transmission business of Hydro One Networks. The Company’s consolidated Distribution Business includes Hydro One Brampton Networks, Hydro One Remote Communities, as well as the separately regulated distribution business of Hydro One Networks. The OEB has approved the use of US GAAP for rate setting and regulatory accounting and reporting by Hydro One Networks’ transmission and distribution businesses, as well as by Hydro One Remote Communities, beginning with the year 2012. Hydro One Brampton Networks currently uses Canadian GAAP for its distribution rate-setting purposes.
2-8 PUBLIC ACCOUNTS, 2013-2014

HYDRO ONE INC. NOTES TO CONSOLIDATED FINANCIAL STATEMENTS (continued) For the years ended December 31, 2013 and 2012
9
Transmission In May 2010, Hydro One Networks filed a cost-of-service application with the OEB for 2012 transmission rates. The OEB approved a revenue requirement of $1,418 million for 2012, along with new 2012 uniform transmission rates, with an effective date of January 1, 2012. In May 2012, Hydro One Networks filed a cost-of-service application with the OEB for 2013 transmission rates, seeking approval for a 2013 revenue requirement of $1,465 million. In December 2012, the OEB approved a revenue requirement of $1,438 million for 2013. The reduced approved revenue requirement included reductions to proposed operation, maintenance and administration costs, and capital expenditures. Distribution In 2010, the OEB approved a revised 2011 revenue requirement of $1,218 million and 2011 distribution rates. Hydro One Networks elected to retain the same distribution rates for 2012 as approved by the OEB for the 2011 rate year. In June 2012, Hydro One Networks filed an Incentive Regulation Mechanism (IRM) application with the OEB for 2013 distribution rates. In December 2012, the OEB approved an increase in average distribution rates of approximately 1.3%, with an effective date of January 1, 2013. In September 2011, Hydro One Brampton Networks filed an IRM application with the OEB for 2012 distribution rates. In January 2012, the OEB approved a reduction in distribution rates of approximately 13.2%, with an effective date of January 1, 2012. These rate reductions were primarily due to OEB-approved adjustments to depreciation rates. In August 2012, Hydro One Brampton Networks filed an IRM application with the OEB for 2013 distribution rates. In December 2012, the OEB approved an increase in average distribution rates of approximately 0.3%, with an effective date of January 1, 2013. In November 2011, Hydro One Remote Communities filed an IRM application with the OEB for 2012 rates. In March 2012, the OEB approved an increase of approximately 1.1% to basic rates for the distribution and generation of electricity, with an effective date of May 1, 2012. In September 2012, Hydro One Remote Communities filed a cost-of-service application with the OEB for 2013 rates, seeking approval for a 2013 revenue requirement of $53 million. In June 2013, the OEB approved a revenue requirement of $51 million for 2013. Regulatory Accounting The OEB has the general power to include or exclude revenues, costs, gains or losses in the rates of a specific period, resulting in a change in the timing of accounting recognition from that which would have been applied in an unregulated company. Such change in timing involves the application of rate-regulated accounting, giving rise to the recognition of regulatory assets and liabilities. The Company’s regulatory assets represent certain amounts receivable from future customers and costs that have been deferred for accounting purposes because it is probable that they will be recovered in future rates. In addition, the Company has recorded regulatory liabilities that generally represent amounts that are refundable to future customers. The Company continually assesses the likelihood of recovery of each of its regulatory assets and continues to believe that it is probable that the OEB will factor its regulatory assets and liabilities into the setting of future rates. If, at some future date, the Company judges that it is no longer probable that the OEB will include a regulatory asset or liability in setting future rates, the appropriate carrying amount will be reflected in results of operations in the period that the assessment is made. Cash and Cash Equivalents Cash and cash equivalents include cash and short-term investments with an original maturity of three months or less. Revenue Recognition Transmission revenues are collected through OEB-approved rates, which are based on an approved revenue requirement that includes a rate of return. Such revenue is recognized as electricity is transmitted and delivered to customers. Distribution revenues are recognized on an accrual basis and include billed and unbilled revenues. Distribution revenues attributable to the delivery of electricity are based on OEB-approved distribution rates and are recognized as electricity is delivered to customers. The Company estimates monthly revenue for a period based on wholesale electricity purchases
PUBLIC ACCOUNTS, 2013-2014 2-9

HYDRO ONE INC. NOTES TO CONSOLIDATED FINANCIAL STATEMENTS (continued) For the years ended December 31, 2013 and 2012
10
because customer meters are not generally read at the end of each month. At the end of each month, the electricity delivered to customers, but not billed, is estimated and revenue is recognized. The unbilled revenue estimate is affected by energy demand, weather, line losses and changes in the composition of customer classes. Distribution revenue also includes an amount relating to rate protection for rural, residential and remote customers, which is received from the Independent Electricity System Operator (IESO) based on a standardized customer rate that is approved by the OEB. Current legislation provides rate protection for prescribed classes of rural, residential and remote consumers by reducing the electricity rates that would otherwise apply. Revenues also include amounts related to sales of other services and equipment. Such revenue is recognized as services are rendered or as equipment is delivered. Revenues are recorded net of indirect taxes. Accounts Receivable and Allowance for Doubtful Accounts Billed accounts receivable are recorded at the invoiced amount, net of allowance for doubtful accounts. Unbilled accounts receivable are estimated and recorded based on wholesale electricity purchases. Overdue amounts related to regulated billings bear interest at OEB-approved rates. The allowance for doubtful accounts reflects the Company’s best estimate of losses on billed accounts receivable balances. The allowance is based on accounts receivable aging, historical experience and other currently available information. The Company estimates the allowance for doubtful accounts on customer receivables by applying internally developed loss rates to the outstanding receivable balances by risk segment. Risk segments represent groups of customers with similar credit quality indicators and are computed based on various attributes, including number of days receivables are past due, delinquency of balances and payment history. Loss rates applied to the accounts receivable balances are based on historical average write-offs as a percentage of accounts receivable in each risk segment. An account is considered delinquent if the amount billed is not received within 110 days of the invoiced date. Accounts receivable are written off against the allowance when they are deemed uncollectible. The existing allowance for uncollectible accounts will continue to be affected by changes in volume, prices and economic conditions. Corporate Income Taxes Under the Electricity Act, 1998, Hydro One is required to make payments in lieu of corporate income taxes (PILs) to the Ontario Electricity Financial Corporation (OEFC). These payments are calculated in accordance with the rules for computing income and other relevant amounts contained in the Income Tax Act (Canada) and the Taxation Act, 2007 (Ontario) as modified by the Electricity Act, 1998 and related regulations. Current and deferred income taxes are computed based on the tax rates and tax laws enacted at the balance sheet date. Tax benefits associated with income tax positions taken, or expected to be taken, in a tax return are recorded only when the “more-likely-than-not” recognition threshold is satisfied and are measured at the largest amount of benefit that has a greater than 50% likelihood of being realized upon settlement. Management evaluates each position based solely on the technical merits and facts and circumstances of the position, assuming the position will be examined by a taxing authority having full knowledge of all relevant information. Significant management judgement is required to determine recognition thresholds and the related amount of tax benefits to be recognized in the Consolidated Financial Statements. Management re-evaluates tax positions each period in which new information about recognition or measurement becomes available. Current Income Taxes The provision for current taxes and the assets and liabilities recognized for the current and prior periods are measured at the amounts receivable from, or payable to, the OEFC. Deferred Income Taxes Deferred income taxes are provided for using the liability method. Deferred income taxes are recognized based on the estimated future tax consequences attributable to temporary differences between the carrying amount of assets and liabilities in the Consolidated Financial Statements and their corresponding tax bases.
2-10 PUBLIC ACCOUNTS, 2013-2014
HYDRO ONE INC. NOTES TO CONSOLIDATED FINANCIAL STATEMENTS (continued) For the years ended December 31, 2013 and 2012
11
Deferred income tax liabilities are generally recognized on all taxable temporary differences. Deferred tax assets are recognized to the extent that it is more-likely-than-not that these assets will be realized from taxable income available against which deductible temporary differences can be utilized. Deferred income taxes are calculated at the tax rates that are expected to apply in the period when the liability is settled or the asset is realized, based on the tax rates and tax laws that have been enacted at the balance sheet date. Deferred income taxes that are not included in the rate-setting process are charged or credited to the Consolidated Statements of Operations and Comprehensive Income. If management determines that it is more-likely-than-not that some or all of a deferred income tax asset will not be realized, a valuation allowance is recorded against the tax asset to report the net balance at the amount expected to be realized. Previously unrecognized deferred income tax assets are reassessed at each balance sheet date and are recognized to the extent that it has become more-likely-than-not that the tax benefit will be realized. The Company records regulatory assets and liabilities associated with deferred income taxes that will be included in the rate-setting process. The Company uses the flow-through method to account for investment tax credits (ITCs) earned on eligible scientific research and experimental development expenditures, and apprenticeship job creation. Under this method, only non-refundable ITCs are recognized as a reduction to income tax expense. Materials and Supplies Materials and supplies represent consumables, small spare parts and construction materials held for internal construction and maintenance of property, plant and equipment. These assets are carried at average cost less any impairments recorded. Property, Plant and Equipment Property, plant and equipment is recorded at original cost, net of customer contributions received in aid of construction and any accumulated impairment losses. The cost of additions, including betterments and replacement asset components, is included on the Consolidated Balance Sheets as property, plant and equipment. The original cost of property, plant and equipment includes direct materials, direct labour (including employee benefits), contracted services, attributable capitalized financing costs, asset retirement costs, and direct and indirect overheads that are related to the capital project or program. Indirect overheads include a portion of corporate costs such as finance, treasury, human resources, information technology and executive costs. Overhead costs, including corporate functions and field services costs, are capitalized on a fully allocated basis, consistent with an OEB-approved methodology. Property, plant and equipment in service consists of transmission, distribution, communication, administration and service assets and land easements. Property, plant and equipment also includes future use assets, such as land, major components and spare parts, and capitalized project development costs associated with deferred capital projects. Transmission Transmission assets include assets used for the transmission of high-voltage electricity, such as transmission lines, support structures, foundations, insulators, connecting hardware and grounding systems, and assets used to step up the voltage of electricity from generating stations for transmission and to step down voltages for distribution, including transformers, circuit breakers and switches. Distribution Distribution assets include assets related to the distribution of low-voltage electricity, including lines, poles, switches, transformers, protective devices and metering systems.
PUBLIC ACCOUNTS, 2013-2014 2-11

HYDRO ONE INC. NOTES TO CONSOLIDATED FINANCIAL STATEMENTS (continued) For the years ended December 31, 2013 and 2012
12
Communication Communication assets include the fibre-optic and microwave radio system, optical ground wire, towers, telephone equipment and associated buildings. Administration and Service Administration and service assets include administrative buildings, personal computers, transport and work equipment, tools and other minor assets. Easements Easements include statutory rights of use for transmission corridors and abutting lands granted under the Reliable Energy and Consumer Protection Act, 2002, as well as other land access rights. Intangible Assets Intangible assets separately acquired or internally developed are measured on initial recognition at cost, which comprises purchased software, direct labour (including employee benefits), consulting, engineering, overheads and attributable capitalized financing charges. Following initial recognition, intangible assets are carried at cost, net of any accumulated amortization and accumulated impairment losses. The Company’s intangible assets primarily represent major administrative computer applications. Capitalized Financing Costs Capitalized financing costs represent interest costs attributable to the construction of property, plant and equipment or development of intangible assets. The financing cost of attributable borrowed funds is capitalized as part of the acquisition cost of such assets. The capitalized portion of financing costs is a reduction to financing charges recognized in the Consolidated Statements of Operations and Comprehensive Income. Capitalized financing costs are calculated using the Company’s weighted average effective cost of debt. Construction and Development in Progress Construction and development in progress consists of the capitalized cost of constructed assets that are not yet complete and which have not yet been placed in service. Depreciation and Amortization The cost of property, plant and equipment and intangible assets is depreciated or amortized on a straight-line basis based on the estimated remaining service life of each asset category, except for transport and work equipment, which is depreciated on a declining balance basis. The Company periodically initiates an external independent review of its property, plant and equipment and intangible asset depreciation and amortization rates, as required by the OEB. Any changes arising from OEB approval of such a review are implemented on a remaining service life basis, consistent with their inclusion in electricity rates. The last review resulted in changes to rates effective January 1, 2013. A summary of average service lives and depreciation and amortization rates for the various classes of assets is included below:
Average Rate (%) Service Life Range Average
Transmission 57 years 1% – 2% 2%Distribution 42 years 1% – 20% 2%Communication 19 years 1% – 15% 5%Administration and service 15 years 3% – 20% 6%
2-12 PUBLIC ACCOUNTS, 2013-2014

HYDRO ONE INC. NOTES TO CONSOLIDATED FINANCIAL STATEMENTS (continued) For the years ended December 31, 2013 and 2012
13
The cost of intangible assets is included primarily within the administration and service classification above. Amortization rates for computer applications software and other intangible assets range from 9% to 10%. In accordance with group depreciation practices, the original cost of property, plant and equipment, or major components thereof, and intangible assets that are normally retired, is charged to accumulated depreciation, with no gain or loss being reflected in results of operations. Where a disposition of property, plant and equipment occurs through sale, a gain or loss is calculated based on proceeds and such gain or loss is included in depreciation expense. Depreciation expense also includes the costs incurred to remove property, plant and equipment where no ARO has been recorded. Goodwill Goodwill represents the cost of acquired local distribution companies that is in excess of the fair value of the net identifiable assets acquired at the acquisition date. Goodwill is not included in rate base. Goodwill is evaluated for impairment on an annual basis, or more frequently if circumstances require. The Company performs a qualitative assessment to determine whether it is more-likely-than-not that the fair value of the applicable reporting unit is less than its carrying amount. If the Company determines, as a result of its qualitative assessment, that it is not more-likely-than-not that the fair value of the applicable reporting unit is less than its carrying amount, no further testing is required. If the Company determines, as a result of its qualitative assessment, that it is more-likely-than-not that the fair value of the applicable reporting unit is less than its carrying amount, a goodwill impairment assessment is performed using a two-step, fair value-based test. The first step compares the fair value of the applicable reporting unit to its carrying amount, including goodwill. If the carrying amount of the applicable reporting unit exceeds its fair value, a second step is performed. The second step requires an allocation of fair value to the individual assets and liabilities using purchase price allocation in order to determine the implied fair value of goodwill. If the implied fair value of goodwill is less than the carrying amount, an impairment loss is recorded as a reduction to goodwill and as a charge to results of operations. For the year ended December 31, 2013, based on the qualitative assessment performed as at September 30, 2013, the Company has determined that it is not more-likely-than-not that the fair value of each applicable reporting unit assessed is less than its carrying amount. As a result, no further testing was performed, and the Company has concluded that goodwill was not impaired at December 31, 2013. Long-Lived Asset Impairment When circumstances indicate the carrying value of long-lived assets may not be recoverable, the Company evaluates whether the carrying value of such assets, excluding goodwill, has been impaired. For such long-lived assets, impairment exists when the carrying value exceeds the sum of the future estimated undiscounted cash flows expected to result from the use and eventual disposition of the asset. When alternative courses of action to recover the carrying amount of a long-lived asset are under consideration, a probability-weighted approach is used to develop estimates of future undiscounted cash flows. If the carrying value of the long-lived asset is not recoverable based on the estimated future undiscounted cash flows, an impairment loss is recorded, measured as the excess of the carrying value of the asset over its fair value. As a result, the asset’s carrying value is adjusted to its estimated fair value. Within its regulated business, the carrying costs of most of Hydro One’s long-lived assets are included in rate base where they earn an OEB-approved rate of return. Asset carrying values and the related return are recovered through approved rates. As a result, such assets are only tested for impairment in the event that the OEB disallows recovery, in whole or in part, or if such a disallowance is judged to be probable. Hydro One regularly monitors the assets of its unregulated Hydro One Telecom subsidiary for indications of impairment. Management assesses the fair value of such long-lived assets using commonly accepted techniques, and may use more than one. Techniques used to determine fair value include, but are not limited to, the use of recent third party comparable sales for reference and internally developed discounted cash flow analysis. Significant changes in market conditions, changes to the condition of an asset, or a change in management’s intent to utilize the asset are generally viewed by management as triggering events to reassess the cash flows related to these long-lived assets. As at December 31, 2013, no asset impairment had been recorded for assets within either the Company’s regulated or unregulated businesses.
PUBLIC ACCOUNTS, 2013-2014 2-13

HYDRO ONE INC. NOTES TO CONSOLIDATED FINANCIAL STATEMENTS (continued) For the years ended December 31, 2013 and 2012
14
Costs of Arranging Debt Financing For financial liabilities classified as other than held-for-trading, the Company defers the external transaction costs related to obtaining debt financing and presents such amounts as deferred debt costs on the Consolidated Balance Sheets. Deferred debt costs are amortized over the contractual life of the related debt on an effective-interest basis and the amortization is included within financing charges in the Consolidated Statements of Operations and Comprehensive Income. Transaction costs for items classified as held-for-trading are expensed immediately. Comprehensive Income Comprehensive income is comprised of net income and other comprehensive income (OCI). OCI includes the amortization of net unamortized hedging losses on the Company’s discontinued cash flow hedges, and the change in fair value on the existing cash flow hedges to the extent that the hedge is effective. The Company amortizes its unamortized hedging losses on discontinued cash flow hedges to financing charges using the effective-interest method over the term of the allocated hedged debt. Hydro One presents net income and OCI in a single continuous Consolidated Statement of Operations and Comprehensive Income. Financial Assets and Liabilities All financial assets and liabilities are classified into one of the following five categories: held-to-maturity; loans and receivables; held-for-trading; other liabilities; or available-for-sale. Financial assets and liabilities classified as held-for-trading are measured at fair value. All other financial assets and liabilities are measured at amortized cost, except accounts receivable and amounts due from related parties, which are measured at the lower of cost or fair value. Accounts receivable and amounts due from related parties are classified as loans and receivables. The Company considers the carrying amounts of accounts receivable and amounts due from related parties to be reasonable estimates of fair value because of the short time to maturity of these instruments. Provisions for impaired accounts receivable are recognized as adjustments to the allowance for doubtful accounts and are recognized when there is objective evidence that the Company will not be able to collect amounts according to the original terms. Derivative instruments are measured at fair value. Gains and losses from fair valuation are included within financing charges in the period in which they arise. The Company determines the classification of its financial assets and liabilities at the date of initial recognition. The Company designates certain of its financial assets and liabilities to be held at fair value, when it is consistent with the Company’s risk management policy disclosed in Note 13 – Fair Value of Financial Instruments and Risk Management. The Company’s investment in Province of Ontario Floating-Rate Notes, which is held as an alternate form of liquidity to supplement the bank credit facilities, is classified as held-for-trading and is measured at fair value. All financial instrument transactions are recorded at trade date. Derivative Instruments and Hedge Accounting The Company closely monitors the risks associated with changes in interest rates on its operations and, where appropriate, uses various instruments to hedge these risks. Certain of these derivative instruments qualify for hedge accounting and are designated as accounting hedges, while others either do not qualify as hedges or have not been designated as hedges (hereinafter referred to as undesignated contracts) as they are part of economic hedging relationships. The accounting guidance for derivative instruments requires the recognition of all derivative instruments not identified as meeting the normal purchase and sale exemption as either assets or liabilities recorded at fair value on the Consolidated Balance Sheets. For derivative instruments that qualify for hedge accounting, the Company may elect to designate such derivative instruments as either cash flow hedges or fair value hedges. The Company offsets fair value amounts recognized in its Consolidated Balance Sheets related to derivative instruments executed with the same counterparty under the same master netting agreement.
2-14 PUBLIC ACCOUNTS, 2013-2014

HYDRO ONE INC. NOTES TO CONSOLIDATED FINANCIAL STATEMENTS (continued) For the years ended December 31, 2013 and 2012
15
For derivative instruments that qualify for hedge accounting and which are designated as cash flow hedges, the effective portion of any gain or loss, net of tax, is reported as a component of accumulated OCI (AOCI) and is reclassified to results of operations in the same period or periods during which the hedged transaction affects results of operations. Any gains or losses on the derivative instrument that represent either hedge ineffectiveness or hedge components excluded from the assessment of effectiveness are recognized in results of operations. For fair value hedges, changes in fair value of both the derivative instrument and the underlying hedged exposure are recognized in the Consolidated Statement of Operations and Comprehensive Income in the current period. The gain or loss on the derivative instrument is included in the same line item as the offsetting gain or loss on the hedged item in the Consolidated Statements of Operations and Comprehensive Income. Additionally, the Company enters into derivative agreements that are economic hedges that either do not qualify for hedge accounting or have not been designated as hedges. The changes in fair value of these undesignated derivative instruments are reflected in results of operations. Embedded derivative instruments are separated from their host contracts and carried at fair value on the Consolidated Balance Sheets when: (a) the economic characteristics and risks of the embedded derivative are not clearly and closely related to the economic characteristics and risks of the host contract; (b) the hybrid instrument is not measured at fair value, with changes in fair value recognized in results of operations each period; and (c) the embedded derivative itself meets the definition of a derivative. The Company does not engage in derivative trading or speculative activities and had no embedded derivatives at December 31, 2013 or 2012. Hydro One periodically develops hedging strategies taking into account risk management objectives. At the inception of a hedging relationship where the Company has elected to apply hedge accounting, Hydro One formally documents the relationship between the hedged item and the hedging instrument, the related risk management objective, the nature of the specific risk exposure being hedged, and the method for assessing the effectiveness of the hedging relationship. The Company also assesses, both at the inception of the hedge and on a quarterly basis, whether the hedging instruments are effective in offsetting changes in fair values or cash flows of the hedged items. Employee Future Benefits Employee future benefits provided by Hydro One include pension, post-retirement and post-employment benefits. The costs of the Company’s pension, post-retirement and post-employment benefit plans are recorded over the periods during which employees render service. The Company recognizes the funded status of its pension, post-retirement and post-employment plans on its Consolidated Balance Sheets and subsequently recognizes the changes in funded status at the end of each reporting year. Pension, post-retirement and post-employment plans are considered to be underfunded when the projected benefit obligation exceeds the fair value of the plan assets. Liabilities are recognized on the Consolidated Balance Sheets for any net underfunded projected benefit obligation. The net underfunded projected benefit obligation may be disclosed as a current liability, long-term liability, or both. The current portion is the amount by which the actuarial present value of benefits included in the benefit obligation payable in the next 12 months exceeds the fair value of plan assets. If the fair value of plan assets exceeds the projected benefit obligation of the plan, an asset is recognized equal to the net overfunded projected benefit obligation. The net asset for an overfunded plan is classified as a long-term asset on the Consolidated Balance Sheets. The post-retirement and post-employment benefit plans are unfunded because there are no related plan assets. Pension benefits In accordance with the OEB’s rate orders, pension costs are recorded on a cash basis as employer contributions are paid to the pension fund in accordance with the Pension Benefits Act (Ontario). Pension costs are recorded on an accrual basis for financial reporting purposes. Pension costs are actuarially determined using the projected benefit method prorated on service and are based on assumptions that reflect management’s best estimate of the effect of future events, including future compensation increases. Past service costs from plan amendments and all actuarial gains and losses are amortized on a straight-line basis over the expected average remaining service period of active employees in the plan, and over the estimated remaining life expectancy of inactive employees in the plan. Pension plan assets, consisting primarily of listed equity securities as well as corporate and government debt securities, are fair valued at the end of each year.
PUBLIC ACCOUNTS, 2013-2014 2-15

HYDRO ONE INC. NOTES TO CONSOLIDATED FINANCIAL STATEMENTS (continued) For the years ended December 31, 2013 and 2012
16
Hydro One records a regulatory asset equal to the net underfunded projected benefit obligation for its pension plan. The regulatory asset for the net underfunded projected benefit obligation for the pension plan, in the absence of regulatory accounting, would be recognized in AOCI. A regulatory asset is recognized because management considers it to be probable that pension benefit costs will be recovered in the future through the rate-setting process. The pension regulatory assets are remeasured at the end of each year based on the current status of the pension plan. All future pension benefit costs are attributed to labour and are either charged to results of operations or capitalized as part of the cost of property, plant and equipment and intangible assets. Post-retirement and post-employment benefits Post-retirement and post-employment benefits are recorded and included in rates on an accrual basis. Costs are determined by independent actuaries using the projected benefit method prorated on service and based on assumptions that reflect management’s best estimates. Past service costs from plan amendments are amortized to results of operations based on the expected average remaining service period. Hydro One records a regulatory asset equal to the incremental net unfunded projected benefit obligation for post-retirement and post-employment plans recorded at each year end based on annual actuarial reports. The regulatory asset for the incremental net unfunded projected benefit obligation for post-retirement and post-employment plans, in the absence of regulatory accounting, would be recognized in AOCI. A regulatory asset is recognized because management considers it to be probable that post-retirement and post-employment benefit costs will be recovered in the future through the rate-setting process. For post-retirement benefits, all actuarial gains or losses are deferred using the “corridor” approach. The amount calculated above the “corridor” is amortized to results of operations on a straight-line basis over the expected average remaining service life of active employees in the plan and over the remaining life expectancy of inactive employees in the plan. The post-retirement benefit obligation is remeasured to its fair value at each year end based on an annual actuarial report, with an offset to the associated regulatory asset, to the extent of the remeasurement adjustment. For post-employment obligations, the associated regulatory liabilities representing actuarial gains on transition to US GAAP are amortized to results of operations based on the “corridor” approach. Post transition, the actuarial gains and losses on post-employment obligations that are incurred during the year are recognized immediately to results of operations. The post-employment benefit obligation is remeasured to its fair value at each year end based on an annual actuarial report, with an offset to the associated regulatory asset, to the extent of the remeasurement adjustment. All post-retirement and post-employment future benefit costs are attributed to labour and are either charged to results of operations or capitalized as part of the cost of property, plant and equipment and intangible assets. Multiemployer Pension Plan Employees of Hydro One Brampton Networks participate in the Ontario Municipal Employees Retirement System Fund (OMERS), a multiemployer, contributory, defined benefit public sector pension fund. OMERS provides retirement pension payments based on members’ length of service and salary. Both participating employers and members are required to make plan contributions. The OMERS plan assets are pooled together to provide benefits to all plan participants and the plan assets are not segregated by member entity. OMERS is registered with the Financial Services Commission of Ontario under Registration #0345983. At December 31, 2012, OMERS had approximately 429,000 members, with approximately 283 members being current employees of Hydro One Brampton Networks. The OMERS plan is accounted for as a defined contribution plan by Hydro One because it is not practicable to determine the present value of the Company’s obligation, the fair value of plan assets or the related current service cost applicable to Hydro One Brampton Networks’ employees. Hydro One recognizes its contributions to the OMERS plan as pension expense, with a portion being capitalized. The expensed amount is included in operation, maintenance and administration costs in the Consolidated Statements of Operations and Comprehensive Income.
2-16 PUBLIC ACCOUNTS, 2013-2014

HYDRO ONE INC. NOTES TO CONSOLIDATED FINANCIAL STATEMENTS (continued) For the years ended December 31, 2013 and 2012
17
Loss Contingencies Hydro One is involved in certain legal and environmental matters that arise in the normal course of business. In the preparation of its Consolidated Financial Statements, management makes judgements regarding the future outcome of contingent events and records a loss for a contingency based on its best estimate when it is determined that such loss is probable and the amount of the loss can be reasonably estimated. Where the loss amount is recoverable in future rates, a regulatory asset is also recorded. When a range estimate for the probable loss exists and no amount within the range is a better estimate than any other amount, the Company records a loss at the minimum amount within the range. Management regularly reviews current information available to determine whether recorded provisions should be adjusted and whether new provisions are required. Estimating probable losses may require analysis of multiple forecasts and scenarios that often depend on judgements about potential actions by third parties, such as federal, provincial and local courts or regulators. Contingent liabilities are often resolved over long periods of time. Amounts recorded in the Consolidated Financial Statements may differ from the actual outcome once the contingency is resolved. Such differences could have a material impact on future results of operations, financial position and cash flows of the Company. Provisions are based upon current estimates and are subject to greater uncertainty where the projection period is lengthy. A significant upward or downward trend in the number of claims filed, the nature of the alleged injuries, and the average cost of resolving each claim could change the estimated provision, as could any substantial adverse or favourable verdict at trial. A federal or provincial legislative outcome or structured settlement could also change the estimated liability. Legal fees are expensed as incurred. Environmental Liabilities Environmental liabilities are recorded in respect of past contamination when it is determined that future environmental remediation expenditures are probable under existing statute or regulation and the amount of the future expenditures can be reasonably estimated. Hydro One records a liability for the estimated future expenditures associated with the contaminated land assessment and remediation (LAR) and for the phase-out and destruction of polychlorinated biphenyl (PCB)-contaminated mineral oil removed from electrical equipment, based on the present value of these estimated future expenditures. The Company determines the present value with a discount rate equal to its credit-adjusted risk-free interest rate on financial instruments with comparable maturities to the pattern of future environmental expenditures. As the Company anticipates that the future expenditures will continue to be recoverable in future rates, an offsetting regulatory asset has been recorded to reflect the future recovery of these environmental expenditures from customers. Hydro One reviews its estimates of future environmental expenditures annually, or more frequently if there are indications that circumstances have changed. Asset Retirement Obligations AROs are recorded for legal obligations associated with the future removal and disposal of long-lived assets. Such obligations may result from the acquisition, construction, development and/or normal use of the asset. Conditional AROs are recorded when there is a legal obligation to perform a future asset retirement activity but where the timing and/or method of settlement are conditional on a future event that may or may not be within the control of the Company. In such a case, the obligation to perform the asset retirement activity is unconditional even though uncertainty exists about the timing and/or method of settlement. When recording an ARO, the present value of the estimated future expenditures required to complete the asset retirement activity is recorded in the period in which the obligation is incurred, if a reasonable estimate can be made. In general, the present value of the estimated future expenditures is added to the carrying amount of the associated asset and the resulting asset retirement cost is depreciated over the estimated useful life of the asset. Where an asset is no longer in service when an ARO is recorded, the asset retirement cost is recorded in results of operations. Some of the Company’s transmission and distribution assets, particularly those located on unowned easements and rights-of-way, may have AROs, conditional or otherwise. The majority of the Company’s easements and rights-of-way are either of perpetual duration or are automatically renewed annually. Land rights with finite terms are generally subject to extension or renewal. As the Company expects to use the majority of its facilities in perpetuity, no ARO currently exists for these assets.
PUBLIC ACCOUNTS, 2013-2014 2-17

HYDRO ONE INC. NOTES TO CONSOLIDATED FINANCIAL STATEMENTS (continued) For the years ended December 31, 2013 and 2012
18
If, at some future date, a particular facility is shown not to meet the perpetuity assumption, it will be reviewed to determine whether an estimable ARO exists. In such a case, an ARO would be recorded at that time. The Company’s AROs recorded to date relate to estimated future expenditures associated with the removal and disposal of asbestos-containing materials installed in some of its facilities and with the decommissioning of specific switching stations located on unowned sites. 3. NEW ACCOUNTING PRONOUNCEMENTS Recently Adopted Accounting Pronouncements In December 2011, the Financial Accounting Standards Board (FASB) issued Accounting Standards Update (ASU) 2011-11, Balance Sheet (Topic 210): Disclosures about Offsetting Assets and Liabilities. This ASU requires an entity to disclose both gross and net information about financial instruments and transactions eligible for offset on the Consolidated Balance Sheets as well as financial instruments and transactions executed under a master netting or similar arrangement. The ASU was issued to enable users of financial statements to understand the effects or potential effects of those arrangements on an entity’s financial position. This ASU was required to be applied retrospectively and was effective for fiscal years, and interim periods within those years, beginning on or after January 1, 2013. The adoption of this ASU did not have an impact on the Company’s Consolidated Financial Statements. In February 2013, the FASB issued ASU 2013-02, Comprehensive Income (Topic 220): Reporting of Amounts Reclassified Out of Accumulated Other Comprehensive Income. This ASU requires an entity to provide information about the amounts reclassified out of accumulated other comprehensive income by component. In addition, an entity is required to present, either on the face of the statement where net income is presented or in the notes, significant amounts reclassified out of accumulated other comprehensive income by the respective line items of net income, but only if the amount reclassified is required under US GAAP to be reclassified to net income in its entirety in the same reporting period. For other amounts that are not required under US GAAP to be reclassified in their entirety to net income, an entity is required to cross-reference to other disclosures required under US GAAP that provide additional detail about those amounts. This ASU was required to be applied prospectively and was effective for fiscal years, and interim periods within those years, beginning after December 15, 2012. The adoption of this ASU did not have a significant impact on the Company’s Consolidated Financial Statements. Recent Accounting Guidance Not Yet Adopted In July 2013, the FASB issued ASU 2013-11, Income Taxes (Topic 740): Presentation of an Unrecognized Tax Benefit When a Net Operating Loss Carryforward, a Similar Tax Loss, or a Tax Credit Carryforward Exists. This ASU provides guidance on the presentation of unrecognized tax benefits. This ASU is effective for fiscal years, and interim periods within those years, beginning after December 15, 2013, and should be applied prospectively to all unrecognized tax benefits that exist at the effective date. Retrospective application is permitted. The adoption of this ASU is not anticipated to have a significant impact on the Company’s Consolidated Financial Statements. 4. BUSINESS ACQUISITION Norfolk Power Purchase Agreement On April 2, 2013, Hydro One reached an agreement with The Corporation of Norfolk County to acquire 100% of the common shares of Norfolk Power Inc. (Norfolk Power), an electricity distribution and telecom company located in southwestern Ontario. The acquisition is pending a regulatory decision from the OEB. The purchase price for Norfolk Power will be approximately $93 million, subject to final closing adjustments. The transaction is anticipated to be completed in 2014. In anticipation of the Norfolk Power acquisition, the Company made a refundable deposit totaling $5 million, which was recorded in other current assets on the interim Consolidated Balance Sheet.
2-18 PUBLIC ACCOUNTS, 2013-2014

HYDRO ONE INC. NOTES TO CONSOLIDATED FINANCIAL STATEMENTS (continued) For the years ended December 31, 2013 and 2012
19
5. DEPRECIATION AND AMORTIZATION
Year ended December 31 (millions of Canadian dollars) 2013 2012
Depreciation of property, plant and equipment 533 522Amortization of intangible assets 48 48Asset removal costs 79 70Amortization of regulatory assets 16 19 676 659 6. FINANCING CHARGES Year ended December 31 (millions of Canadian dollars) 2013 2012
Interest on long-term debt 416 421Other 9 12Less: Interest capitalized on construction and development in progress (51) (59) Gain on interest-rate swap agreements (11) (12) Interest earned on investments (3) (4) 360 358 7. PROVISION FOR PAYMENTS IN LIEU OF CORPORATE INCOME TAXES The provision for PILs differs from the amount that would have been recorded using the combined Canadian federal and Ontario statutory income tax rate. The reconciliation between the statutory and the effective tax rates is provided as follows: Year ended December 31 (millions of Canadian dollars) 2013 2012
Income before provision for PILs 912 866Canadian federal and Ontario statutory income tax rate 26.50% 26.50%Provision for PILs at statutory rate 242 230 Increase (decrease) resulting from: Net temporary differences included in amounts charged to customers: Capital cost allowance in excess of depreciation and amortization (72) (42) Pension contributions in excess of pension expense (23) (23) Interest capitalized for accounting but deducted for tax purposes (13) (15) Overheads capitalized for accounting but deducted for tax purposes (14) (14) Prior year’s adjustments (8) (2) Non-refundable investment tax credits (4) (8) Environmental expenditures (4) (5) Post-retirement and post-employment benefit expense in excess of cash payments 4 – Other (1) (1)Net temporary differences (135) (110)Net permanent differences 2 1Total provision for PILs 109 121
PUBLIC ACCOUNTS, 2013-2014 2-19

HYDRO ONE INC. NOTES TO CONSOLIDATED FINANCIAL STATEMENTS (continued) For the years ended December 31, 2013 and 2012
20
The major components of income tax expense are as follows: Year ended December 31 (millions of Canadian dollars) 2013 2012
Current provision for PILs 111 130Deferred recovery of PILs (2) (9)Total provision for PILs 109 121 Effective income tax rate 11.98% 13.96% The current provision for PILs is remitted to, or received from, the Ontario Electricity Financial Corporation (OEFC). At December 31, 2013, $29 million due from the OEFC was included in due from related parties on the Consolidated Balance Sheet (December 31, 2012 – $10 million included in due to related parties). The total provision for PILs includes deferred recovery of PILs of $2 million (2012 – $9 million) that is not included in the rate-setting process, using the liability method of accounting. Deferred PILs balances expected to be included in the rate-setting process are offset by regulatory assets and liabilities to reflect the anticipated recovery or disposition of these balances within future electricity rates. Deferred Income Tax Assets and Liabilities Deferred income tax assets and liabilities arise from differences between the carrying amounts and tax bases of the Company’s assets and liabilities. At December 31, 2013 and 2012, deferred income tax assets and liabilities consisted of the following: December 31 (millions of Canadian dollars) 2013 2012
Deferred income tax assets Post-retirement and post-employment benefits expense in excess of cash payments 7 7 Environmental expenditures 5 4 Depreciation and amortization in excess of capital cost allowance – 3 Other (1) –Total deferred income tax assets 11 14Less: current portion – – 11 14 December 31 (millions of Canadian dollars) 2013 2012
Deferred income tax liabilities Capital cost allowance in excess of depreciation and amortization (1,556) (1,344) Post-retirement and post-employment benefits expense in excess of cash payments 542 519 Environmental expenditures 66 62 Regulatory amounts that are not recognized for tax purposes (144) (147) Goodwill (20) (19) Other 1 3Total deferred income tax liabilities (1,111) (926)Less: current portion 18 18 (1,129) (944) During 2013, there was no change in the rate applicable to future taxes (2012 – a change in rate applicable to future rates generated a $60 million increase).
2-20 PUBLIC ACCOUNTS, 2013-2014

HYDRO ONE INC. NOTES TO CONSOLIDATED FINANCIAL STATEMENTS (continued) For the years ended December 31, 2013 and 2012
21
8. ACCOUNTS RECEIVABLE December 31 (millions of Canadian dollars) 2013 2012
Accounts receivable – billed 268 224Accounts receivable – unbilled 691 644Accounts receivable, gross 959 868Allowance for doubtful accounts (36) (23)Accounts receivable, net 923 845 The following table shows the movements in the allowance for doubtful accounts for the years ended December 31, 2013 and 2012: Year ended December 31 (millions of Canadian dollars) 2013 2012
Allowance for doubtful accounts – January 1 (23) (18)Write-offs 24 17Additions to allowance for doubtful accounts (37) (22)Allowance for doubtful accounts – December 31 (36) (23) 9. PROPERTY, PLANT AND EQUIPMENT December 31, 2013 (millions of Canadian dollars)
Property, Plant and Equipment
Accumulated Depreciation
Construction in Progress
Total
Transmission 12,413 4,215 671 8,869Distribution 8,498 3,046 316 5,768Communication 1,060 560 53 553Administration and Service 1,380 716 38 702Easements 617 78 – 539 23,968 8,615 1,078 16,431 December 31, 2012 (millions of Canadian dollars)
Property, Plant and Equipment
Accumulated Depreciation
Construction in Progress
Total
Transmission 11,840 3,990 641 8,491Distribution 8,005 2,879 234 5,360Communication 1,024 516 57 565Administration and Service 1,314 668 123 769Easements 614 92 – 522 22,797 8,145 1,055 15,707 Financing charges capitalized on property, plant and equipment under construction were $48 million in 2013 (2012 – $56 million). 10. INTANGIBLE ASSETS
December 31, 2013 (millions of Canadian dollars)
Intangible Assets
Accumulated Amortization
Development in Progress
Total
Computer applications software 557 249 3 311Other 5 3 – 2 562 252 3 313
PUBLIC ACCOUNTS, 2013-2014 2-21

HYDRO ONE INC. NOTES TO CONSOLIDATED FINANCIAL STATEMENTS (continued) For the years ended December 31, 2013 and 2012
22
December 31, 2012 (millions of Canadian dollars)
Intangible Assets
Accumulated Amortization
Development in Progress
Total
Computer applications software 451 301 116 266Other 5 4 – 1 456 305 116 267 Financing charges capitalized on intangible assets under development were $3 million in 2013 (2012 – $3 million). The estimated annual amortization expense for intangible assets is as follows: 2014 – $52 million; 2015 – $52 million; 2016 – $52 million; 2017 – $52 million; and 2018 – $44 million. 11. REGULATORY ASSETS AND LIABILITIES Regulatory assets and liabilities arise as a result of the rate-setting process. Hydro One has recorded the following regulatory assets and liabilities: December 31 (millions of Canadian dollars) 2013 2012
Regulatory assets: Deferred income tax regulatory asset 1,145 954 Pension benefit regulatory asset 845 1,515 Post-retirement and post-employment benefits 308 320 Environmental 266 249 Pension cost variance 80 61 OEB cost assessment differential 9 6 DSC exemption 7 2 Long-term project development costs 5 5 Rider 2 – 10 Other 18 5
Total regulatory assets 2,683 3,127Less: current portion 47 29
2,636 3,098 Regulatory liabilities: External revenue variance 81 61 Rider 8 55 45 Retail settlement variance accounts 35 54 Deferred income tax regulatory liability 19 16 Rider 9 19 – PST savings deferral 17 13 Hydro One Brampton Networks rider 8 – Rider 3 – 9 Rural and remote rate protection variance – 6 Other 14 17
Total regulatory liabilities 248 221Less: current portion 85 40
163 181 Deferred Income Tax Regulatory Asset and Liability Deferred income taxes are recognized on temporary differences between the carrying amount of assets and liabilities in the financial statements and the corresponding tax bases used in the computation of taxable profit. The Company has recognized regulatory assets and liabilities that correspond to deferred income taxes that flow through the rate-setting process. In the absence of rate-regulated accounting, the Company’s provision for PILs would have been recognized using the liability
2-22 PUBLIC ACCOUNTS, 2013-2014

HYDRO ONE INC. NOTES TO CONSOLIDATED FINANCIAL STATEMENTS (continued) For the years ended December 31, 2013 and 2012
23
method and there would be no regulatory accounts established for taxes to be recovered through future rates. As a result, the 2013 provision for PILs would have been higher by approximately $139 million (2012 – $136 million). Pension Benefit Regulatory Asset The Company recognizes the net unfunded status of pension obligations on the Consolidated Balance Sheets with an offset to the associated regulatory asset. A regulatory asset is recognized because management considers it to be probable that pension benefit costs will be recovered in the future through the rate-setting process. The pension benefit obligation is remeasured to its fair value at each year end based on an annual actuarial report, with an offset to the associated regulatory asset, to the extent of the remeasurement adjustment. In the absence of rate-regulated accounting, 2013 OCI would have been higher by $670 million (2012 – lower by $736 million). Post-Retirement and Post-Employment Benefits The Company recognizes the net unfunded status of post-retirement and post-employment obligations on the Consolidated Balance Sheets with an incremental offset to the associated regulatory assets. A regulatory asset is recognized because management considers it to be probable that post-retirement and post-employment benefit costs will be recovered in the future through the rate-setting process. The post-retirement and post-employment benefit obligation is remeasured to its fair value at each year end based on an annual actuarial report, with an offset to the associated regulatory asset, to the extent of the remeasurement adjustment. In the absence of rate-regulated accounting, 2013 OCI would have been higher by $12 million (2012 – lower by $197 million). Environmental Hydro One records a liability for the estimated future expenditures required to remediate environmental contamination. Because such expenditures are expected to be recoverable in future rates, the Company has recorded an equivalent amount as a regulatory asset. In 2013, the environmental regulatory asset decreased by $3 million (2012 – $3 million) to reflect related changes in the Company’s PCB liability, and increased by $26 million (2012 – $2 million) due to changes in the LAR liability. The environmental regulatory asset is amortized to results of operations based on the pattern of actual expenditures incurred and charged to environmental liabilities. The OEB has the discretion to examine and assess the prudency and the timing of recovery of all of Hydro One’s actual environmental expenditures. In the absence of rate-regulated accounting, 2013 operation, maintenance and administration expenses would have been higher by $23 million (2012 – lower by $1 million). In addition, 2013 amortization expense would have been lower by $16 million (2012 – $18 million), and 2013 financing charges would have been higher by $10 million (2012 – $11 million). Pension Cost Variance A pension cost variance account was established for Hydro One Networks’ transmission and distribution businesses to track the difference between the actual pension expense incurred and estimated pension costs approved by the OEB. The balance in this regulatory account reflects the excess of pension costs paid as compared to OEB-approved amounts. In the absence of rate-regulated accounting, 2013 revenue would have been lower by $19 million (2012 – $18 million). OEB Cost Assessment Differential In April 2010, the OEB announced its decision regarding the Company’s rate application in respect of Hydro One Networks’ distribution business for 2010 and 2011. As part of this decision, the OEB also approved the distribution-related OEB Cost Assessment Differential Account to record the difference between the amounts approved in rates and actual expenditures with respect to the OEB’s cost assessments. DSC Exemption In June 2010, Hydro One Networks filed an application with the OEB regarding the OEB’s new cost responsibility rules contained in the OEB’s October 2009 Notice of Amendment to the Distribution System Code (DSC), with respect to the connection of certain renewable generators that were already connected or that had received a connection impact assessment prior to October 21, 2009. The application sought approval to record and defer the unanticipated costs incurred by Hydro One
PUBLIC ACCOUNTS, 2013-2014 2-23

HYDRO ONE INC. NOTES TO CONSOLIDATED FINANCIAL STATEMENTS (continued) For the years ended December 31, 2013 and 2012
24
Networks that resulted from the connection of certain renewable generation facilities. The OEB ruled that expenditures for identified specific expenditures can be recorded in a deferral account, subject to the OEB’s review at a future date. Long-Term Project Development Costs In May 2009, the OEB approved the creation of a deferral account to record Hydro One Networks’ costs of preliminary work to advance certain transmission projects identified in the Company’s 2009 and 2010 transmission rate applications. In March 2010, the OEB issued a decision amending the scope of the account to include the 20 major transmission projects identified in the September 2009 request from the Ministry of Energy and Infrastructure. In December 2012, the OEB approved the recovery of the December 31, 2012 balance, including accrued interest, to be recovered over a one-year period from January 1, 2014 to December 31, 2014. Rider 2 In April 2006, the OEB approved Hydro One Networks’ distribution-related deferral account balances. The Rider 2 regulatory asset includes retail settlement and cost variance amounts and distribution low-voltage service amounts, plus accrued interest. In December 2012, as part of Hydro One Networks’ 2013 IRM distribution rate application, the OEB approved the balance of the Rider 2 regulatory account for disposition as part of Rider 9, including accrued interest, to be disposed over a 24-month period from January 1, 2013 to December 31, 2014. External Revenue Variance In May 2009, the OEB approved forecasted amounts related to export service revenue, external revenue from secondary land use, and external revenue from station maintenance and engineering and construction work. In November 2012, the OEB again approved forecasted amounts related to these revenue categories and extended the scope to encompass all other external revenues. The external revenue variance account balance reflects the excess of actual external revenues compared to the OEB-approved forecasted amounts. Rider 8 In April 2010, the OEB requested the establishment of deferral accounts which capture the difference between the revenue recorded on the basis of Green Energy Plan expenditures incurred and the actual recoveries received. Retail Settlement Variance Accounts (RSVAs) Hydro One has deferred certain retail settlement variance amounts under the provisions of Article 490 of the OEB’s Accounting Procedures Handbook. In December 2012, the OEB approved the disposition of the total RSVA balance accumulated from January 2010 to December 2011, including accrued interest, to be disposed over a 24-month period from January 1, 2013 to December 31, 2014. Hydro One has continued to accumulate a net liability in its RSVAs since December 31, 2011. Rider 9 In December 2012, as part of Hydro One Networks’ 2013 IRM distribution rate application, the OEB approved for disposition certain distribution-related deferral account balances, including RSVA amounts and balances of Rider 2 and Rider 3, accumulated up to December 2011, including accrued interest, to be disposed over a 24-month period from January 1, 2013 to December 31, 2014. PST Savings Deferral Account The provincial sales tax (PST) and goods and services tax (GST) were harmonized in July 2010. Unlike the GST, the PST was included in operation, maintenance and administrative expenses or capital expenditures for past revenue requirements approved during a full cost-of-service hearing. Under the harmonized sales tax (HST) regime, the HST included in operation, maintenance and administration expenses or capital expenditures is not a cost ultimately borne by the Company and as such, a refund of the prior PST element in the approved revenue requirement is applicable, and calculations for tracking and refund
2-24 PUBLIC ACCOUNTS, 2013-2014

HYDRO ONE INC. NOTES TO CONSOLIDATED FINANCIAL STATEMENTS (continued) For the years ended December 31, 2013 and 2012
25
were requested by the OEB. For Hydro One Networks’ transmission revenue requirement, PST was included between July 1, 2010 and December 31, 2010 and recorded in a deferral account, per direction from the OEB. For Hydro One Networks’ distribution revenue requirement, PST was included between July 1, 2010 and December 31, 2013 and recorded in a deferral account, per direction from the OEB. Hydro One Brampton Networks Rider In December 2013, the OEB issued a decision for Hydro One Brampton Networks’ 2014 distribution rates. Included in the OEB’s decision was the approval of certain deferral account balances, primarily RSVAs. The OEB ordered that the approved balances be aggregated into a single regulatory account and disposed of through a rate rider over a two-year period from January 1, 2014 to December 31, 2015. Rider 3 In December 2008, the OEB approved certain distribution-related deferral account balances, including RSVA amounts, deferred tax changes, OEB costs and smart meters. The OEB approved the disposition of the Rider 3 balance accumulated up to April 2008, including accrued interest, to be disposed over a 27-month period from February 1, 2009 to April 30, 2011. In December 2012, as part of Hydro One Networks’ 2013 IRM distribution rate application, the OEB approved the balance of Rider 2 for disposition as part of Rider 9. Rural and Remote Rate Protection Variance (RRRP) Hydro One receives rural rate protection amounts from the IESO. A portion of these amounts is provided to retail customers of Hydro One Networks who are eligible for rate protection. The OEB has approved a mechanism to collect the RRRP through the Wholesale Market Service Charge. Variances between the amounts remitted by the IESO to Hydro One and the fixed entitlements defined in the regulation, and subsequent OEB utility rate decisions, are tracked by the Company in the RRRP variance account. At December 31, 2013, the RRRP variance account had a $2 million debit balance, which is included in Other regulatory assets. 12. DEBT AND CREDIT AGREEMENTS Short-Term Notes Hydro One meets its short-term liquidity requirements in part through the issuance of commercial paper under its Commercial Paper Program which has a maximum authorized amount of $1,000 million. These short-term notes are denominated in Canadian dollars with varying maturities not exceeding 365 days. Hydro One had no commercial paper borrowings outstanding as at December 31, 2013 and 2012. Hydro One has a $1,500 million committed and unused revolving standby credit facility with a syndicate of banks, maturing in June 2018. If used, interest on the facility would apply based on Canadian benchmark rates. This credit facility is unsecured and supports the Company’s Commercial Paper Program. The Company may use the credit facility for general corporate purposes, including meeting short-term funding requirements. The obligation of each lender to make any credit extension to the Company under its credit facility is subject to various conditions including, among other things, that no event of default has occurred or would result from such credit extension. Long-Term Debt The Company issues notes for long-term financing under its Medium-Term Note (MTN) Program. The maximum authorized principal amount of notes issuable under this program is $3,000 million. At December 31, 2013, $1,815 million remained available for issuance until October 2015.
PUBLIC ACCOUNTS, 2013-2014 2-25

HYDRO ONE INC. NOTES TO CONSOLIDATED FINANCIAL STATEMENTS (continued) For the years ended December 31, 2013 and 2012
26
The following table presents the outstanding long-term debt at December 31, 2013 and 2012: December 31 (millions of Canadian dollars) 2013 2012
5.00% Series 15 notes due 2013 – 6003.13% Series 19 notes due 20141 750 7502.95% Series 21 notes due 20151 500 500Floating-rate Series 22 notes due 20152 50 504.64% Series 10 notes due 2016 450 450Floating-rate Series 27 notes due 20162 50 505.18% Series 13 notes due 2017 600 6002.78% Series 28 notes due 2018 750 –4.40% Series 20 notes due 2020 300 3003.20% Series 25 notes due 2022 600 6007.35% Debentures due 2030 400 4006.93% Series 2 notes due 2032 500 5006.35% Series 4 notes due 2034 385 3855.36% Series 9 notes due 2036 600 6004.89% Series 12 notes due 2037 400 4006.03% Series 17 notes due 2039 300 3005.49% Series 18 notes due 2040 500 5004.39% Series 23 notes due 2041 300 3006.59% Series 5 notes due 2043 315 3154.59% Series 29 notes due 2043 435 –5.00% Series 11 notes due 2046 325 3254.00% Series 24 notes due 2051 225 2253.79% Series 26 notes due 2062 310 310 9,045 8,460Add: Unrealized marked-to-market loss1 12 19Less: Long-term debt payable within one year (756) (600) Long-term debt 8,301 7,8791 The unrealized marked-to-market loss relates to $500 million of the Series 19 notes due 2014, and $250 million of the Series 21 notes due 2015. The
unrealized marked-to-market loss is offset by a $12 million (2012 – $19 million) unrealized marked-to-market gain on the related fixed-to-floating interest-rate swap agreements, which are accounted for as fair value hedges. See Note 13 – Fair Value of Financial Instruments and Risk Management for details of fair value hedges.
2 The interest rates of the floating-rate notes are referenced to the 3-month Canadian dollar bankers’ acceptance rate, plus a margin.
In 2013, Hydro One issued $1,185 million (2012 – $1,085 million) of long-term debt under the MTN Program, and repaid the $600 million MTN Series 15 notes (2012 – redeemed $600 million MTN Series 3 notes). The long-term debt is unsecured and denominated in Canadian dollars. The long-term debt is summarized by the number of years to maturity in Note 13 – Fair Value of Financial Instruments and Risk Management. 13. FAIR VALUE OF FINANCIAL INSTRUMENTS AND RISK MANAGEMENT Fair value is considered to be the exchange price in an orderly transaction between market participants to sell an asset or transfer a liability at the measurement date. The fair value definition focuses on an exit price, which is the price that would be received in the sale of an asset or the amount that would be paid to transfer a liability. Hydro One classifies its fair value measurements based on the following hierarchy, as prescribed by the accounting guidance for fair value, which prioritizes the inputs to valuation techniques used to measure fair value into three levels:
2-26 PUBLIC ACCOUNTS, 2013-2014
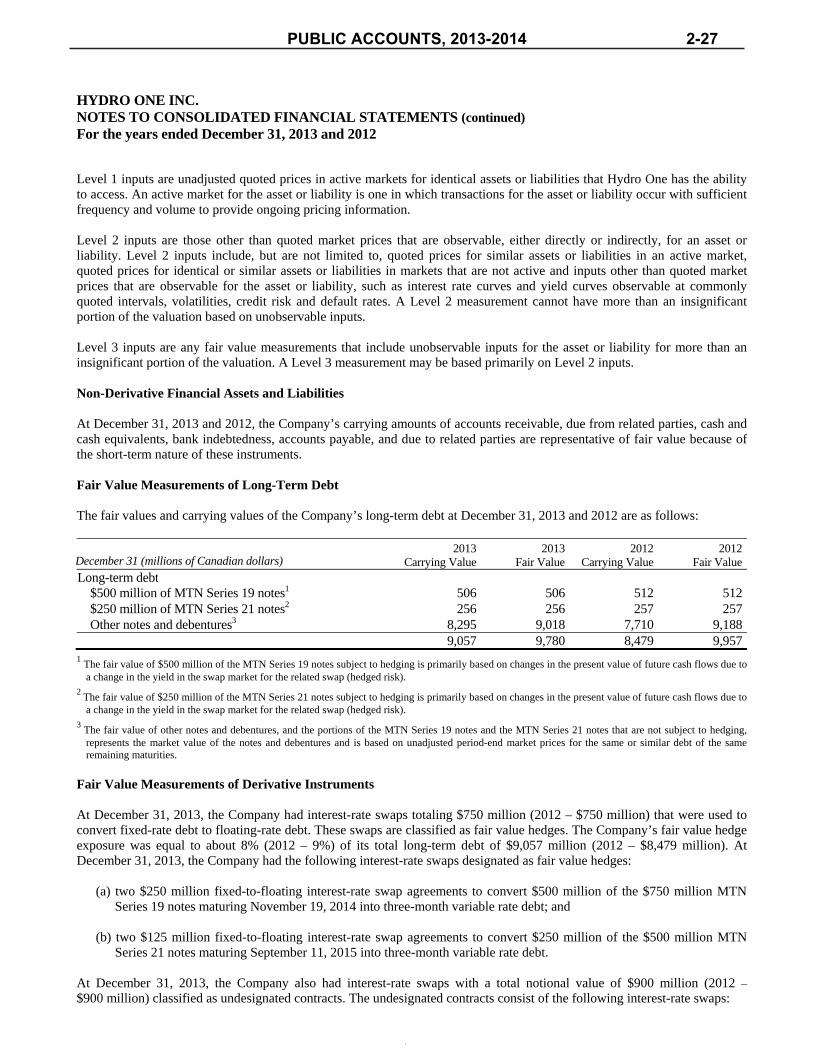
HYDRO ONE INC. NOTES TO CONSOLIDATED FINANCIAL STATEMENTS (continued) For the years ended December 31, 2013 and 2012
27
Level 1 inputs are unadjusted quoted prices in active markets for identical assets or liabilities that Hydro One has the ability to access. An active market for the asset or liability is one in which transactions for the asset or liability occur with sufficient frequency and volume to provide ongoing pricing information. Level 2 inputs are those other than quoted market prices that are observable, either directly or indirectly, for an asset or liability. Level 2 inputs include, but are not limited to, quoted prices for similar assets or liabilities in an active market, quoted prices for identical or similar assets or liabilities in markets that are not active and inputs other than quoted market prices that are observable for the asset or liability, such as interest rate curves and yield curves observable at commonly quoted intervals, volatilities, credit risk and default rates. A Level 2 measurement cannot have more than an insignificant portion of the valuation based on unobservable inputs. Level 3 inputs are any fair value measurements that include unobservable inputs for the asset or liability for more than an insignificant portion of the valuation. A Level 3 measurement may be based primarily on Level 2 inputs. Non-Derivative Financial Assets and Liabilities At December 31, 2013 and 2012, the Company’s carrying amounts of accounts receivable, due from related parties, cash and cash equivalents, bank indebtedness, accounts payable, and due to related parties are representative of fair value because of the short-term nature of these instruments. Fair Value Measurements of Long-Term Debt The fair values and carrying values of the Company’s long-term debt at December 31, 2013 and 2012 are as follows:
December 31 (millions of Canadian dollars) 2013
Carrying Value2013
Fair Value2012
Carrying Value 2012
Fair ValueLong-term debt
$500 million of MTN Series 19 notes1 506 506 512 512 $250 million of MTN Series 21 notes2 256 256 257 257 Other notes and debentures3 8,295 9,018 7,710 9,188 9,057 9,780 8,479 9,957
1 The fair value of $500 million of the MTN Series 19 notes subject to hedging is primarily based on changes in the present value of future cash flows due to a change in the yield in the swap market for the related swap (hedged risk).
2 The fair value of $250 million of the MTN Series 21 notes subject to hedging is primarily based on changes in the present value of future cash flows due to a change in the yield in the swap market for the related swap (hedged risk).
3 The fair value of other notes and debentures, and the portions of the MTN Series 19 notes and the MTN Series 21 notes that are not subject to hedging, represents the market value of the notes and debentures and is based on unadjusted period-end market prices for the same or similar debt of the same remaining maturities.
Fair Value Measurements of Derivative Instruments At December 31, 2013, the Company had interest-rate swaps totaling $750 million (2012 – $750 million) that were used to convert fixed-rate debt to floating-rate debt. These swaps are classified as fair value hedges. The Company’s fair value hedge exposure was equal to about 8% (2012 – 9%) of its total long-term debt of $9,057 million (2012 – $8,479 million). At December 31, 2013, the Company had the following interest-rate swaps designated as fair value hedges:
(a) two $250 million fixed-to-floating interest-rate swap agreements to convert $500 million of the $750 million MTN Series 19 notes maturing November 19, 2014 into three-month variable rate debt; and
(b) two $125 million fixed-to-floating interest-rate swap agreements to convert $250 million of the $500 million MTN
Series 21 notes maturing September 11, 2015 into three-month variable rate debt. At December 31, 2013, the Company also had interest-rate swaps with a total notional value of $900 million (2012 – $900 million) classified as undesignated contracts. The undesignated contracts consist of the following interest-rate swaps:
PUBLIC ACCOUNTS, 2013-2014 2-27
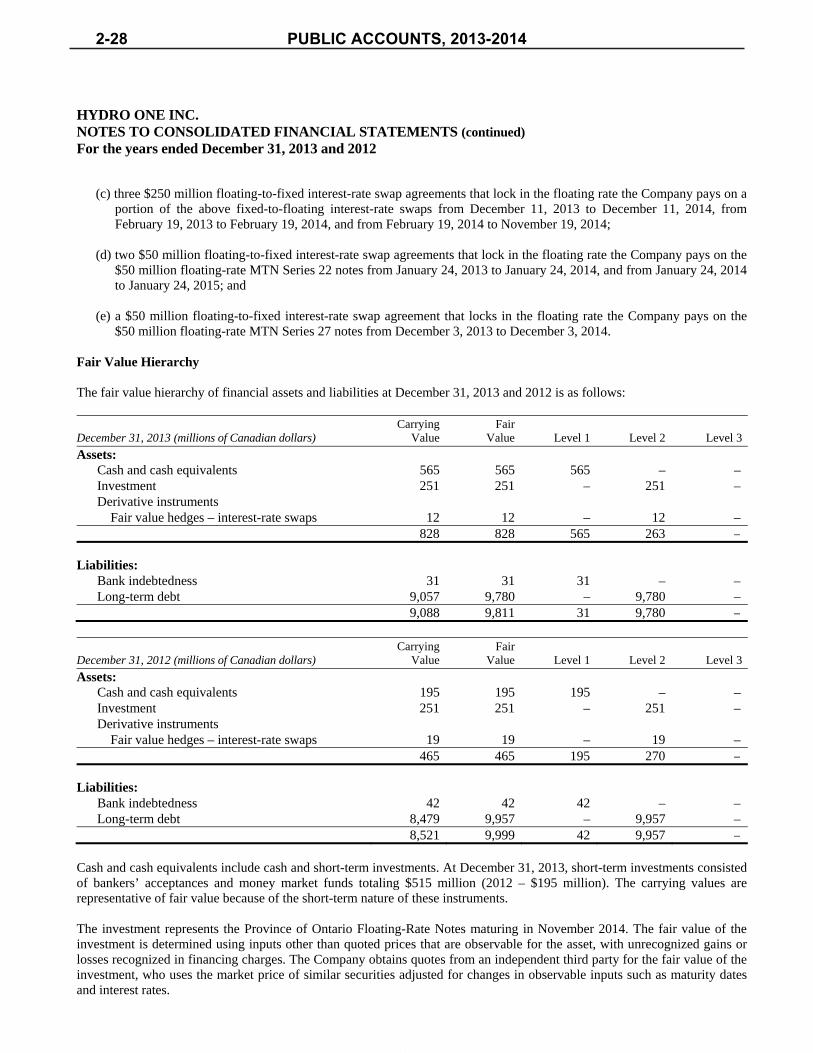
HYDRO ONE INC. NOTES TO CONSOLIDATED FINANCIAL STATEMENTS (continued) For the years ended December 31, 2013 and 2012
28
(c) three $250 million floating-to-fixed interest-rate swap agreements that lock in the floating rate the Company pays on a portion of the above fixed-to-floating interest-rate swaps from December 11, 2013 to December 11, 2014, from February 19, 2013 to February 19, 2014, and from February 19, 2014 to November 19, 2014;
(d) two $50 million floating-to-fixed interest-rate swap agreements that lock in the floating rate the Company pays on the
$50 million floating-rate MTN Series 22 notes from January 24, 2013 to January 24, 2014, and from January 24, 2014 to January 24, 2015; and
(e) a $50 million floating-to-fixed interest-rate swap agreement that locks in the floating rate the Company pays on the
$50 million floating-rate MTN Series 27 notes from December 3, 2013 to December 3, 2014. Fair Value Hierarchy The fair value hierarchy of financial assets and liabilities at December 31, 2013 and 2012 is as follows: December 31, 2013 (millions of Canadian dollars)
Carrying Value
Fair Value
Level 1
Level 2
Level 3
Assets: Cash and cash equivalents 565 565 565 – – Investment 251 251 – 251 – Derivative instruments Fair value hedges – interest-rate swaps 12 12 – 12 – 828 828 565 263 –
Liabilities: Bank indebtedness 31 31 31 – – Long-term debt 9,057 9,780 – 9,780 – 9,088 9,811 31 9,780 –
December 31, 2012 (millions of Canadian dollars)
Carrying Value
Fair Value
Level 1
Level 2
Level 3
Assets: Cash and cash equivalents 195 195 195 – – Investment 251 251 – 251 – Derivative instruments Fair value hedges – interest-rate swaps 19 19 – 19 – 465 465 195 270 –
Liabilities: Bank indebtedness 42 42 42 – – Long-term debt 8,479 9,957 – 9,957 – 8,521 9,999 42 9,957 –
Cash and cash equivalents include cash and short-term investments. At December 31, 2013, short-term investments consisted of bankers’ acceptances and money market funds totaling $515 million (2012 – $195 million). The carrying values are representative of fair value because of the short-term nature of these instruments. The investment represents the Province of Ontario Floating-Rate Notes maturing in November 2014. The fair value of the investment is determined using inputs other than quoted prices that are observable for the asset, with unrecognized gains or losses recognized in financing charges. The Company obtains quotes from an independent third party for the fair value of the investment, who uses the market price of similar securities adjusted for changes in observable inputs such as maturity dates and interest rates.
2-28 PUBLIC ACCOUNTS, 2013-2014

HYDRO ONE INC. NOTES TO CONSOLIDATED FINANCIAL STATEMENTS (continued) For the years ended December 31, 2013 and 2012
29
The fair value of the derivative instruments is determined using inputs other than quoted prices that are observable for these assets. The fair value is primarily based on the present value of future cash flows using a swap yield curve to determine the assumptions for interest rates. The fair value of the hedged portion of the long-term debt is primarily based on the present value of future cash flows using a swap yield curve to determine the assumption for interest rates. The fair value of the unhedged portion of the long-term debt is based on unadjusted period-end market prices for the same or similar debt of the same remaining maturities. There were no significant transfers between any of the fair value levels during the years ended December 31, 2013 and 2012. Risk Management Exposure to market risk, credit risk and liquidity risk arises in the normal course of the Company’s business. Market Risk Market risk refers primarily to the risk of loss that results from changes in commodity prices, foreign exchange rates and interest rates. The Company does not have commodity risk. The Company does have foreign exchange risk as it enters into agreements to purchase materials and equipment associated with capital programs and projects that are settled in foreign currencies. This foreign exchange risk is not material, although the Company could in the future decide to issue foreign currency-denominated debt which would be hedged back to Canadian dollars consistent with its risk management policy. Hydro One is exposed to fluctuations in interest rates as the regulated rate of return for the Company’s Transmission and Distribution Businesses is derived using a formulaic approach that is based on the forecast for long-term Government of Canada bond yields and the spread in 30-year “A”-rated Canadian utility bonds over the 30-year benchmark Government of Canada bond yield. The Company estimates that a 1% decrease in the forecasted long-term Government of Canada bond yield or the “A”-rated Canadian utility spread used in determining the Company’s rate of return would reduce the Transmission Business’ annual results of operations by approximately $19 million (2012 – $18 million) and Hydro One Networks’ distribution business’ annual results of operations by approximately $10 million (2012 – $10 million). The Company uses a combination of fixed and variable-rate debt to manage the mix of its debt portfolio. The Company also uses derivative financial instruments to manage interest-rate risk. The Company utilizes interest-rate swaps, which are typically designated as fair value hedges, as a means to manage its interest rate exposure to achieve a lower cost of debt. In addition, the Company may utilize interest-rate derivative instruments to lock in interest rate levels in anticipation of future financing. Hydro One may also enter into derivative agreements such as forward-starting pay fixed-interest-rate swap agreements to hedge against the effect of future interest rate movements on long-term fixed-rate borrowing requirements. Such arrangements are typically designated as cash flow hedges. No cash flow hedge agreements were in existence as at December 31, 2013 or 2012. A hypothetical 10% increase in the interest rates associated with variable-rate debt would not have resulted in a significant decrease in Hydro One’s results of operations for the years ended December 31, 2013 or 2012. Fair Value Hedges For derivative instruments that are designated and qualify as fair value hedges, the gain or loss on the derivative as well as the offsetting loss or gain on the hedged item attributable to the hedged risk are recognized in the Consolidated Statements of Operations and Comprehensive Income. The net unrealized loss (gain) on the hedged debt and the related interest-rate swaps for the years ended December 31, 2013 and 2012 are included in financing charges as follows: Year ended December 31 (millions of Canadian dollars) 2013 2012Unrealized loss (gain) on hedged debt (8) (14)Unrealized loss (gain) on fair value interest-rate swaps 8 14Net unrealized loss (gain) – –
PUBLIC ACCOUNTS, 2013-2014 2-29

HYDRO ONE INC. NOTES TO CONSOLIDATED FINANCIAL STATEMENTS (continued) For the years ended December 31, 2013 and 2012
30
ended December 31, 2013 and 2012, there was no significant impact on the results of operations as a result of any ineffectiveness attributable to fair value hedges. Credit Risk Financial assets create a risk that a counterparty will fail to discharge an obligation, causing a financial loss. At December 31, 2013 and 2012, there were no significant concentrations of credit risk with respect to any class of financial assets. The Company’s revenue is earned from a broad base of customers. As a result, Hydro One did not earn a significant amount of revenue from any single customer. At December 31, 2013 and 2012, there was no significant accounts receivable balance due from any single customer. At December 31, 2013, the Company’s provision for bad debts was $36 million (2012 – $23 million). Adjustments and write-offs were determined on the basis of a review of overdue accounts, taking into consideration historical experience. At December 31, 2013, approximately 4% of the Company’s net accounts receivable were aged more than 60 days (2012 – 3%). Hydro One manages its counterparty credit risk through various techniques including: entering into transactions with highly-rated counterparties; limiting total exposure levels with individual counterparties consistent with the Company’s Board-approved Credit Risk Policy; entering into master agreements which enable net settlement and the contractual right of offset; and monitoring the financial condition of counterparties. In addition to payment netting language in master agreements, the Company establishes credit limits, margining thresholds and collateral requirements for each counterparty. Counterparty credit limits are based on an internal credit review that considers a variety of factors, including the results of a scoring model, leverage, liquidity, profitability, credit ratings and risk management capabilities. The determination of credit exposure for a particular counterparty is the sum of current exposure plus the potential future exposure with that counterparty. The current exposure is calculated as the sum of the principal value of money market exposures and the market value of all contracts that have a positive marked-to-market position on the measurement date. The Company would offset the positive market values against negative values with the same counterparty only where permitted by the existence of a legal netting agreement such as an International Swap Dealers Association master agreement. The potential future exposure represents a safety margin to protect against future fluctuations of interest rates, currencies, equities, and commodities. It is calculated based on factors developed by the Bank of International Settlements, following extensive historical analysis of random fluctuations of interest rates and currencies. To the extent that a counterparty’s margining thresholds are exceeded, the counterparty is required to post collateral with the Company as specified in each agreement. The Company monitors current and forward credit exposure to counterparties both on an individual and an aggregate basis. The Company’s credit risk for accounts receivable is limited to the carrying amounts on the Consolidated Balance Sheets. Derivative financial instruments result in exposure to credit risk since there is a risk of counterparty default. The credit exposure of derivative contracts, before collateral, is represented by the fair value of contracts at the reporting date. At December 31, 2013, the counterparty credit risk exposure on the fair value of these interest-rate swap contracts was $14 million (2012 – $22 million). At December 31, 2013, Hydro One’s credit exposure for all derivative instruments, and applicable payables and receivables, had a credit rating of investment grade, with four financial institutions as the counterparties. The credit exposure of three of the four counterparties accounted for more than 10% of the total credit exposure of derivative contracts. Liquidity Risk Liquidity risk refers to the Company’s ability to meet its financial obligations as they come due. Hydro One meets its short-term liquidity requirements using cash and cash equivalents on hand, funds from operations, the issuance of commercial paper, the revolving standby credit facility of $1,500 million, and by holding Province of Ontario Floating-Rate Notes. The short-term liquidity under the Commercial Paper Program, the holding of Province of Ontario Floating-Rate Notes and anticipated levels of funds from operations should be sufficient to fund normal operating requirements.
At December 31, 2013, accounts payable and accrued liabilities in the amount of $795 million (2012 – $722 million) were expected to be settled in cash at their carrying amounts within the next 12 months.
2-30 PUBLIC ACCOUNTS, 2013-2014

HYDRO ONE INC. NOTES TO CONSOLIDATED FINANCIAL STATEMENTS (continued) For the years ended December 31, 2013 and 2012
31
At December 31, 2013, Hydro One had issued long-term debt in the principal amount of $9,045 million (2012 – $8,460 million). Principal outstanding, interest payments and related weighted average interest rates are summarized by the number of years to maturity in the following table:
Principal Outstanding
on Long-term Debt Interest Payments Weighted Average
Interest Rate
Years to Maturity (millions of Canadian dollars) (millions of Canadian dollars) (%)
1 year 750 422 3.12 years 550 398 2.83 years 500 372 4.34 years 600 361 5.25 years 750 330 2.8 3,150 1,883 3.66 – 10 years 900 1,470 3.6Over 10 years 4,995 4,281 5.5 9,045 7,634 4.7 14. CAPITAL MANAGEMENT The Company’s objectives with respect to its capital structure are to maintain effective access to capital on a long-term basis at reasonable rates, and to deliver appropriate financial returns. In order to ensure ongoing effective access to capital, the Company targets to maintain an “A” category long-term credit rating. The Company considers its capital structure to consist of shareholder’s equity, preferred shares, long-term debt, and cash and cash equivalents. At December 31, 2013 and 2012, the Company’s capital structure was as follows: December 31 (millions of Canadian dollars) 2013 2012
Long-term debt payable within one year 756 600Less: cash and cash equivalents 565 195 191 405 Long-term debt 8,301 7,879 Preferred shares 323 323 Common shares 3,314 3,314Retained earnings 3,787 3,202 7,101 6,516 Total capital 15,916 15,123 The Company has customary covenants typically associated with long-term debt. Among other things, Hydro One’s long-term debt and credit facility covenants limit the permissible debt to 75% of the Company’s total capitalization, limit the ability to sell assets and impose a negative pledge provision, subject to customary exceptions. At December 31, 2013 and 2012, Hydro One was in compliance with all of these covenants and limitations. 15. PENSION AND POST-RETIREMENT AND POST-EMPLOYMENT BENEFITS Hydro One has a defined benefit pension plan, a supplementary pension plan, and post-retirement and post-employment benefit plans. The defined benefit pension plan (Pension Plan) is contributory and covers all regular employees of Hydro One and its subsidiaries, except Hydro One Brampton Networks. Employees of Hydro One Brampton Networks participate in the OMERS plan, a multiemployer public sector pension fund. The supplementary pension plan provides members of the
PUBLIC ACCOUNTS, 2013-2014 2-31
HYDRO ONE INC. NOTES TO CONSOLIDATED FINANCIAL STATEMENTS (continued) For the years ended December 31, 2013 and 2012
32
Pension Plan with benefits that would have been earned and payable under the Pension Plan but for the limitations imposed by the Income Tax Act (Canada). The supplementary pension plan obligation is included with other post-retirement and post-employment benefit obligations on the Consolidated Balance Sheets. The OMERS Plan Hydro One contributions to the OMERS plan for the year ended December 31, 2013 were $2 million (2012 – $2 million). Company contributions payable at December 31, 2013 and included in accrued liabilities on the Consolidated Balance Sheets were $0.2 million (2012 – $0.2 million). Hydro One contributions do not represent more than 5% of total contributions to the OMERS plan, as indicated in OMERS’s most recently available annual report for the year ended December 31, 2012. At December 31, 2012, the OMERS plan was 85.6% funded, with an unfunded liability of $9,924 million. This unfunded liability will likely result in future payments by participating employers and members. Hydro One future contributions could be increased substantially if other entities withdraw from the plan. Pension Plan, Post-Retirement and Post-Employment Plans The Pension Plan provides benefits based on highest three-year average pensionable earnings. For new management employees who commenced employment on or after January 1, 2004, and for new Society of Energy Professionals-represented staff hired after November 17, 2005, benefits are based on highest five-year average pensionable earnings. After retirement, pensions are indexed to inflation. Company and employee contributions to the Pension Plan are based on actuarial valuations performed at least every three years. Annual Pension Plan contributions for 2013 of $160 million (2012 – $163 million) were based on an actuarial valuation effective December 31, 2011 and the level of 2013 pensionable earnings. Estimated annual Pension Plan contributions for 2014 are approximately $160 million, based on the December 31, 2011 valuation and the projected level of pensionable earnings. Hydro One recognizes the overfunded or underfunded status of the Pension Plan, and post-retirement and post-employment benefit plans (Plans) as an asset or liability on its Consolidated Balance Sheets, with offsetting regulatory assets and liabilities as appropriate. The underfunded benefit obligations for the Plans, in the absence of regulatory accounting, would be recognized in AOCI. The impact of changes in assumptions used to measure pension, post-retirement and post-employment benefit obligations is generally recognized over the expected average remaining service period of the employees. The measurement date for the Plans is December 31.
2-32 PUBLIC ACCOUNTS, 2013-2014
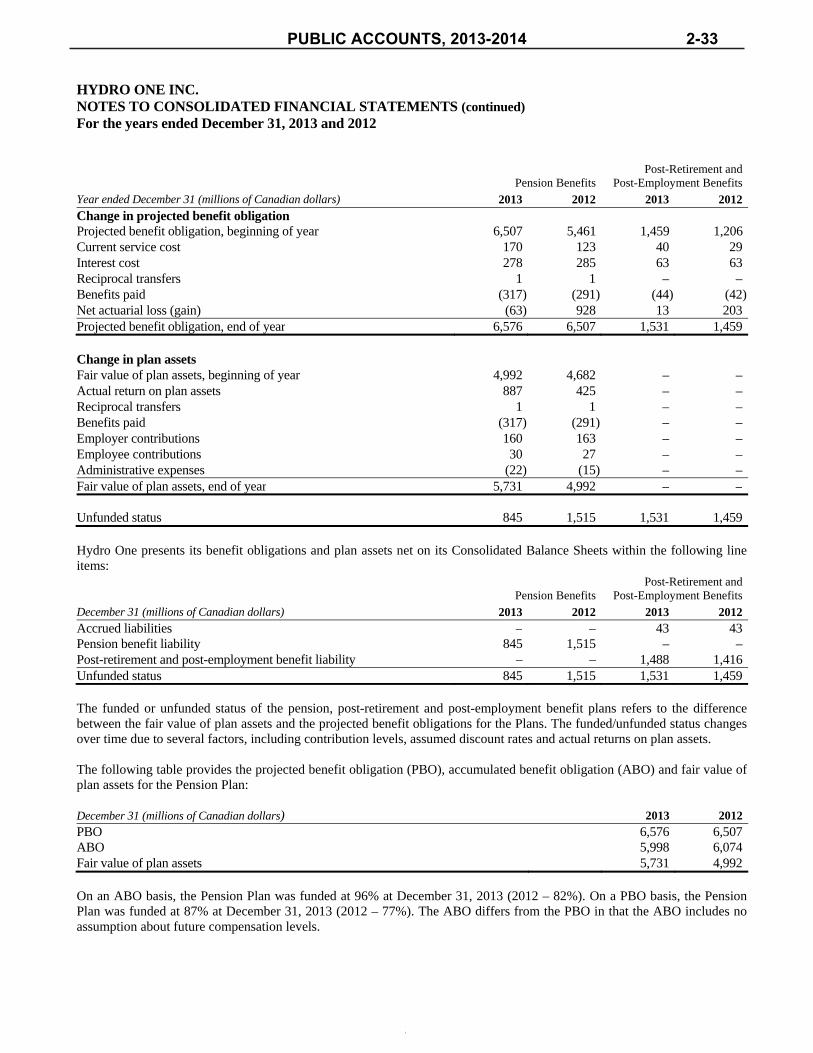
HYDRO ONE INC. NOTES TO CONSOLIDATED FINANCIAL STATEMENTS (continued) For the years ended December 31, 2013 and 2012
33
Pension Benefits
Post-Retirement and Post-Employment Benefits
Year ended December 31 (millions of Canadian dollars) 2013 2012 2013 2012
Change in projected benefit obligation Projected benefit obligation, beginning of year 6,507 5,461 1,459 1,206Current service cost 170 123 40 29Interest cost 278 285 63 63Reciprocal transfers 1 1 – –Benefits paid (317) (291) (44) (42)Net actuarial loss (gain) (63) 928 13 203Projected benefit obligation, end of year 6,576 6,507 1,531 1,459 Change in plan assets Fair value of plan assets, beginning of year 4,992 4,682 – –Actual return on plan assets 887 425 – –Reciprocal transfers 1 1 – –Benefits paid (317) (291) – –Employer contributions 160 163 – –Employee contributions 30 27 – –Administrative expenses (22) (15) – –Fair value of plan assets, end of year 5,731 4,992 – – Unfunded status 845 1,515 1,531 1,459 Hydro One presents its benefit obligations and plan assets net on its Consolidated Balance Sheets within the following line items:
Pension Benefits
Post-Retirement and Post-Employment Benefits
December 31 (millions of Canadian dollars) 2013 2012 2013 2012Accrued liabilities – – 43 43Pension benefit liability 845 1,515 – –Post-retirement and post-employment benefit liability – – 1,488 1,416Unfunded status 845 1,515 1,531 1,459 The funded or unfunded status of the pension, post-retirement and post-employment benefit plans refers to the difference between the fair value of plan assets and the projected benefit obligations for the Plans. The funded/unfunded status changes over time due to several factors, including contribution levels, assumed discount rates and actual returns on plan assets. The following table provides the projected benefit obligation (PBO), accumulated benefit obligation (ABO) and fair value of plan assets for the Pension Plan: December 31 (millions of Canadian dollars) 2013 2012PBO 6,576 6,507ABO 5,998 6,074Fair value of plan assets 5,731 4,992 On an ABO basis, the Pension Plan was funded at 96% at December 31, 2013 (2012 – 82%). On a PBO basis, the Pension Plan was funded at 87% at December 31, 2013 (2012 – 77%). The ABO differs from the PBO in that the ABO includes no assumption about future compensation levels.
PUBLIC ACCOUNTS, 2013-2014 2-33
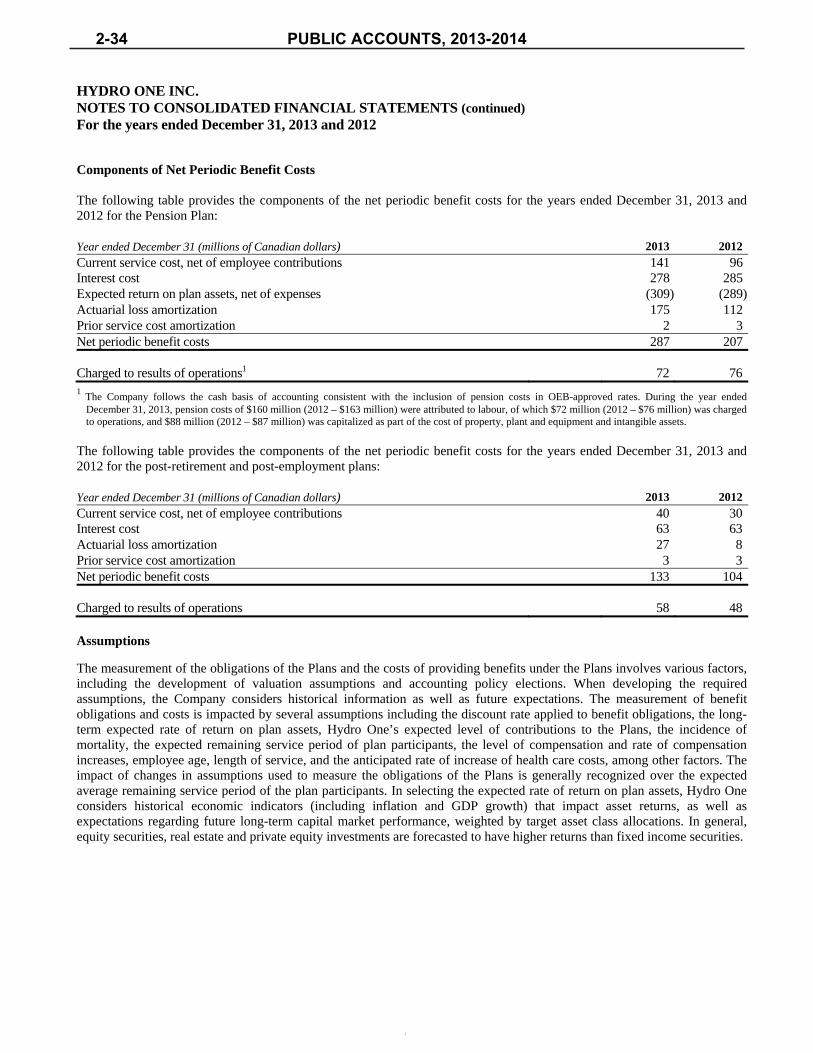
HYDRO ONE INC. NOTES TO CONSOLIDATED FINANCIAL STATEMENTS (continued) For the years ended December 31, 2013 and 2012
34
Components of Net Periodic Benefit Costs The following table provides the components of the net periodic benefit costs for the years ended December 31, 2013 and 2012 for the Pension Plan: Year ended December 31 (millions of Canadian dollars) 2013 2012Current service cost, net of employee contributions 141 96Interest cost 278 285Expected return on plan assets, net of expenses (309) (289)Actuarial loss amortization 175 112Prior service cost amortization 2 3Net periodic benefit costs 287 207 Charged to results of operations1 72 761
The Company follows the cash basis of accounting consistent with the inclusion of pension costs in OEB-approved rates. During the year ended December 31, 2013, pension costs of $160 million (2012 – $163 million) were attributed to labour, of which $72 million (2012 – $76 million) was charged to operations, and $88 million (2012 – $87 million) was capitalized as part of the cost of property, plant and equipment and intangible assets.
The following table provides the components of the net periodic benefit costs for the years ended December 31, 2013 and 2012 for the post-retirement and post-employment plans: Year ended December 31 (millions of Canadian dollars) 2013 2012
Current service cost, net of employee contributions 40 30Interest cost 63 63Actuarial loss amortization 27 8Prior service cost amortization 3 3Net periodic benefit costs 133 104 Charged to results of operations 58 48 Assumptions
The measurement of the obligations of the Plans and the costs of providing benefits under the Plans involves various factors, including the development of valuation assumptions and accounting policy elections. When developing the required assumptions, the Company considers historical information as well as future expectations. The measurement of benefit obligations and costs is impacted by several assumptions including the discount rate applied to benefit obligations, the long-term expected rate of return on plan assets, Hydro One’s expected level of contributions to the Plans, the incidence of mortality, the expected remaining service period of plan participants, the level of compensation and rate of compensation increases, employee age, length of service, and the anticipated rate of increase of health care costs, among other factors. The impact of changes in assumptions used to measure the obligations of the Plans is generally recognized over the expected average remaining service period of the plan participants. In selecting the expected rate of return on plan assets, Hydro One considers historical economic indicators (including inflation and GDP growth) that impact asset returns, as well as expectations regarding future long-term capital market performance, weighted by target asset class allocations. In general, equity securities, real estate and private equity investments are forecasted to have higher returns than fixed income securities.
2-34 PUBLIC ACCOUNTS, 2013-2014

HYDRO ONE INC. NOTES TO CONSOLIDATED FINANCIAL STATEMENTS (continued) For the years ended December 31, 2013 and 2012
35
The following weighted average assumptions were used to determine the benefit obligations at December 31, 2013 and 2012:
Pension Benefits
Post-Retirement and Post-Employment Benefits
Year ended December 31 2013 2012 2013 2012
Significant assumptions: Weighted average discount rate 4.75% 4.25% 4.75% 4.25% Rate of compensation scale escalation (without merit) 2.50% 2.50% 2.50% 2.50% Rate of cost of living increase 2.00% 2.00% 2.00% 2.00% Rate of increase in health care cost trends1 – – 4.39% 4.39%1
6.81% per annum in 2014, grading down to 4.39% per annum in and after 2031 (2012 – 6.91% in 2013, grading down to 4.39% per annum in and after 2031)
The following weighted average assumptions were used to determine the net periodic benefit costs for the years ended December 31, 2013 and 2012. Assumptions used to determine current year-end benefit obligations are the assumptions used to estimate the subsequent year’s net periodic benefit costs. Year ended December 31 2013 2012
Pension Benefits: Weighted average expected rate of return on plan assets 6.25% 6.25% Weighted average discount rate 4.25% 5.25% Rate of compensation scale escalation (without merit) 2.50% 2.50% Rate of cost of living increase 2.00% 2.00% Average remaining service life of employees (years) 11 11 Post-retirement and Post-Employment Benefits: Weighted average discount rate 4.25% 5.25% Rate of compensation scale escalation (without merit) 2.50% 2.50% Rate of cost of living increase 2.00% 2.00% Average remaining service life of employees (years) 11 11 Rate of increase in health care cost trends1 4.39% 4.41%1 6.91% per annum in 2013, grading down to 4.39% per annum in and after 2031 (2012 – 7.03% in 2012, grading down to 4.41% per annum in and after 2031)
The discount rate used to determine the current year pension obligation and the subsequent year’s net periodic benefit costs is based on a yield curve approach. Under the yield curve approach, expected future benefit payments for each plan are discounted by a rate on a third party bond yield curve corresponding to each duration. The yield curve is based on AA long-term corporate bonds. A single discount rate is calculated that would yield the same present value as the sum of the discounted cash flows. The effect of 1% change in health care cost trends on the projected benefit obligation for the post-retirement and post-employment benefits at December 31, 2013 and 2012 is as follows: December 31 (millions of Canadian dollars) 2013 2012
Projected benefit obligation: Effect of 1% increase in health care cost trends 258 246 Effect of 1% decrease in health care cost trends (200) (191)
PUBLIC ACCOUNTS, 2013-2014 2-35

HYDRO ONE INC. NOTES TO CONSOLIDATED FINANCIAL STATEMENTS (continued) For the years ended December 31, 2013 and 2012
36
The effect of 1% change in health care cost trends on the service cost and interest cost for the post-retirement and post-employment benefits for the years ended December 31, 2013 and 2012 is as follows: Year ended December 31 (millions of Canadian dollars) 2013 2012
Service cost and interest cost: Effect of 1% increase in health care cost trends 21 17 Effect of 1% decrease in health care cost trends (16) (13) The following approximate life expectancies were used in the mortality assumptions to determine the projected benefit obligations for the pension and post-retirement and post-employment plans at December 31, 2013 and 2012:
December 31, 2013 December 31, 2012
Life expectancy at 65 for a member currently at Life expectancy at 65 for a member currently at
Age 65 Age 45 Age 65 Age 45 Male Female Male Female Male Female Male Female 23 25 24 26 20 22 21 23
Estimated Future Benefit Payments At December 31, 2013, estimated future benefit payments by the Company to Plan participants were: (millions of Canadian dollars)
Pension Benefits
Post-Retirement and Post-Employment Benefits
2014 310 542015 319 572016 327 592017 335 622018 343 652019 through to 2023 1,698 370Total estimated future benefit payments through to 2023 3,332 667 Components of Regulatory Assets A portion of actuarial gains and losses and prior service costs is recorded within regulatory assets on Hydro One’s Consolidated Balance Sheets to reflect the expected regulatory inclusion of these amounts in future rates, which would otherwise be recorded in OCI. The following table provides the actuarial gains and losses and prior service costs recorded within regulatory assets: Year ended December 31 (millions of Canadian dollars) 2013 2012
Pension Benefits: Actuarial loss (gain) for the year (619) 807 Actuarial loss amortization (175) (112) Prior service cost amortization (2) (3) (796) 692 Post-Retirement and Post-Employment Benefits: Actuarial loss for the year 13 203 Actuarial loss amortization (27) (8) Prior service cost amortization (3) (3) (17) 192
2-36 PUBLIC ACCOUNTS, 2013-2014

HYDRO ONE INC. NOTES TO CONSOLIDATED FINANCIAL STATEMENTS (continued) For the years ended December 31, 2013 and 2012
37
The following table provides the components of regulatory assets that have not been recognized as components of net periodic benefit costs for the years ended December 31, 2013 and 2012: Year ended December 31 (millions of Canadian dollars) 2013 2012
Pension Benefits: Prior service cost 3 5 Actuarial loss 842 1,510 845 1,515 Post-Retirement and Post-Employment Benefits: Prior service cost 2 5 Actuarial loss 306 315 308 320 The following table provides the components of regulatory assets at December 31 that are expected to be amortized as components of net periodic benefit costs in the following year:
Pension Benefits
Post-Retirement and Post-Employment Benefits
December 31 (millions of Canadian dollars) 2013 2012 2013 2012
Prior service cost 2 2 2 3 Actuarial loss 103 175 15 17 105 177 17 20 Pension Plan Assets Investment Strategy On a regular basis, Hydro One evaluates its investment strategy to ensure that plan assets will be sufficient to pay Pension Plan benefits when due. As part of this ongoing evaluation, Hydro One may make changes to its targeted asset allocation and investment strategy. The Pension Plan is managed at a net asset level. The main objective of the Pension Plan is to sustain a certain level of net assets in order to meet the pension obligations of the Company. The Pension Plan fulfills its primary objective by adhering to specific investment policies outlined in its Summary of Investment Policies and Procedures (SIPP), which is reviewed and approved by the Investment-Pension Committee of Hydro One’s Board of Directors. The Company manages net assets by engaging knowledgeable external investment managers who are charged with the responsibility of investing existing funds and new funds (current year’s employee and employer contributions) in accordance with the approved SIPP. The performance of the managers is monitored through a governance structure. Increases in net assets are a direct result of investment income generated by investments held by the Pension Plan and contributions to the Pension Plan by eligible employees and by the Company. The main use of net assets is for benefit payments to eligible Pension Plan members. Pension Plan Asset Mix At December 31, 2013, the Pension Plan target asset allocations and weighted average asset allocations were as follows: Target Allocation (%) Pension Plan Assets (%)
Equity securities 60.0 67.8Debt securities 35.0 32.2Other 1 5.0 0.0 100.0 100.01 Other investments include real estate and infrastructure investments.
At December 31, 2013, the Pension Plan held $15 million of Hydro One corporate bonds (2012 – $20 million) and $217 million of debt securities of the Province (2012 – $243 million).
PUBLIC ACCOUNTS, 2013-2014 2-37

HYDRO ONE INC. NOTES TO CONSOLIDATED FINANCIAL STATEMENTS (continued) For the years ended December 31, 2013 and 2012
38
Concentrations of Credit Risk Hydro One evaluated its Pension Plan’s asset portfolio for the existence of significant concentrations of credit risk as at December 31, 2013 and 2012. Concentrations that were evaluated include, but are not limited to, investment concentrations in a single entity, concentrations in a type of industry, and concentrations in individual funds. At December 31, 2013 and 2012, there were no significant concentrations (defined as greater than 10% of plan assets) of risk in the Pension Plan’s assets. The Pension Plan manages its counterparty credit risk with respect to bonds by investing in investment-grade and government bonds and with respect to derivative instruments by transacting only with financial institutions rated at least “A+” by Standard and Poor’s, Dominion Bond Rating Service, and Fitch Ratings, and “A1” by Moody’s Investors Service Inc., and also by utilizing exposure limits to each counterparty and ensuring that exposure is diversified across counterparties. The risk of default on transactions in listed securities is considered minimal, as the trade will fail if either party to the transaction does not meet its obligation. Fair Value Measurements The following tables present the Pension Plan assets measured and recorded at fair value on a recurring basis and their level within the fair value hierarchy at December 31, 2013 and 2012: December 31, 2013 (millions of Canadian dollars) Level 1 Level 2 Level 3 Total
Pooled funds 1 16 117 134Cash and cash equivalents 150 – – 150Short-term securities – 180 – 180Real estate – – 2 2Corporate shares – Canadian 943 – – 943Corporate shares – Foreign 2,708 – – 2,708Bonds and debentures – Canadian – 1,416 – 1,416Bonds and debentures – Foreign – 186 – 186Total fair value of plan assets1 3,802 1,798 119 5,7191 At December 31, 2013, the total fair value of Pension Plan assets excludes $19 million of interest and dividends receivable, and $7 million relating to accruals for pension administration expense.
December 31, 2012 (millions of Canadian dollars) Level 1 Level 2 Level 3 Total
Pooled funds 2 15 104 121Cash and cash equivalents 125 – – 125Short-term securities – 100 – 100Real estate – – 2 2Corporate shares – Canadian 920 – – 920Corporate shares – Foreign 2,077 – – 2,077Bonds and debentures – Canadian – 1,643 – 1,643Total fair value of plan assets1 3,124 1,758 106 4,9881 At December 31, 2012, the total fair value of Pension Plan assets excludes $16 million of interest and dividends receivable, $4 million relating to accruals for pending sales transactions, and $8 million relating to accruals for pension administration expense.
See Note 13 – Fair Value of Financial Instruments and Risk Management for a description of levels within the fair value hierarchy. Changes in the Fair Value of Financial Instruments Classified in Level 3 The following table summarizes the changes in fair value of financial instruments classified in Level 3 for the years ended December 31, 2013 and 2012. The Pension Plan classifies financial instruments as Level 3 when the fair value is measured based on at least one significant input that is not observable in the markets or due to lack of liquidity in certain markets. The
2-38 PUBLIC ACCOUNTS, 2013-2014
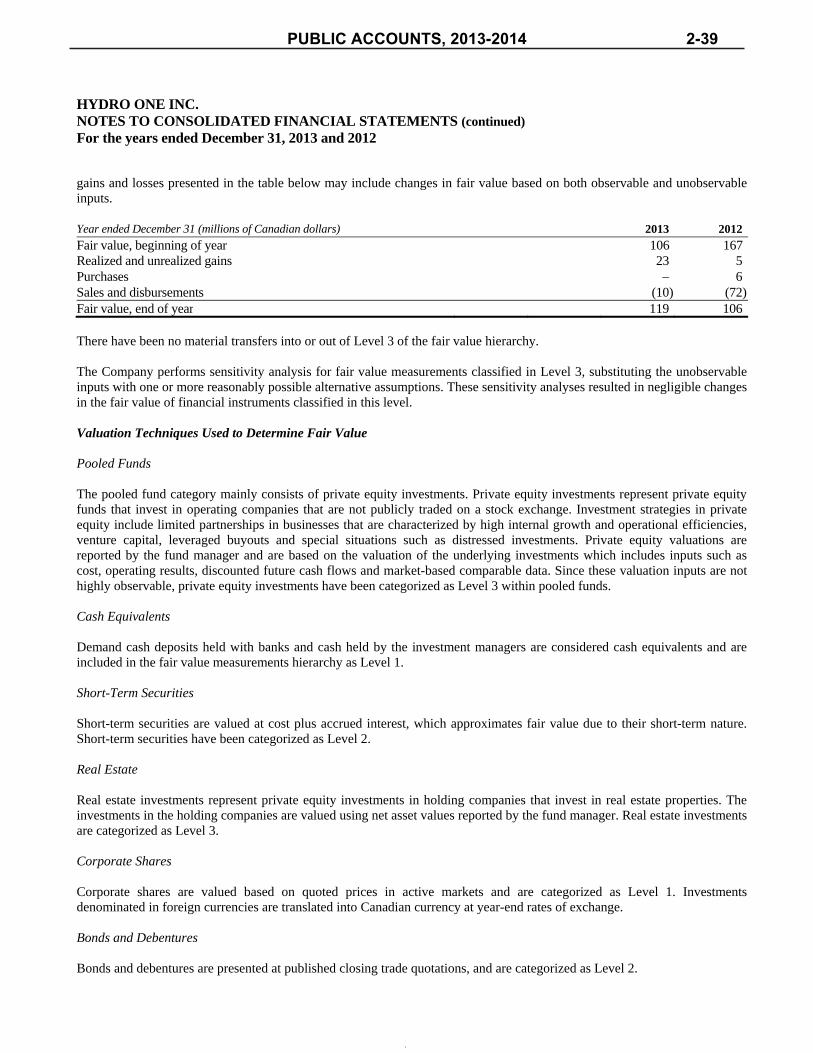
HYDRO ONE INC. NOTES TO CONSOLIDATED FINANCIAL STATEMENTS (continued) For the years ended December 31, 2013 and 2012
39
gains and losses presented in the table below may include changes in fair value based on both observable and unobservable inputs. Year ended December 31 (millions of Canadian dollars) 2013 2012
Fair value, beginning of year 106 167Realized and unrealized gains 23 5Purchases – 6Sales and disbursements (10) (72)Fair value, end of year 119 106 There have been no material transfers into or out of Level 3 of the fair value hierarchy. The Company performs sensitivity analysis for fair value measurements classified in Level 3, substituting the unobservable inputs with one or more reasonably possible alternative assumptions. These sensitivity analyses resulted in negligible changes in the fair value of financial instruments classified in this level. Valuation Techniques Used to Determine Fair Value Pooled Funds The pooled fund category mainly consists of private equity investments. Private equity investments represent private equity funds that invest in operating companies that are not publicly traded on a stock exchange. Investment strategies in private equity include limited partnerships in businesses that are characterized by high internal growth and operational efficiencies, venture capital, leveraged buyouts and special situations such as distressed investments. Private equity valuations are reported by the fund manager and are based on the valuation of the underlying investments which includes inputs such as cost, operating results, discounted future cash flows and market-based comparable data. Since these valuation inputs are not highly observable, private equity investments have been categorized as Level 3 within pooled funds. Cash Equivalents Demand cash deposits held with banks and cash held by the investment managers are considered cash equivalents and are included in the fair value measurements hierarchy as Level 1. Short-Term Securities Short-term securities are valued at cost plus accrued interest, which approximates fair value due to their short-term nature. Short-term securities have been categorized as Level 2. Real Estate Real estate investments represent private equity investments in holding companies that invest in real estate properties. The investments in the holding companies are valued using net asset values reported by the fund manager. Real estate investments are categorized as Level 3. Corporate Shares Corporate shares are valued based on quoted prices in active markets and are categorized as Level 1. Investments denominated in foreign currencies are translated into Canadian currency at year-end rates of exchange. Bonds and Debentures Bonds and debentures are presented at published closing trade quotations, and are categorized as Level 2.
PUBLIC ACCOUNTS, 2013-2014 2-39

HYDRO ONE INC. NOTES TO CONSOLIDATED FINANCIAL STATEMENTS (continued) For the years ended December 31, 2013 and 2012
40
16. ENVIRONMENTAL LIABILITIES
The following tables show the movements in environmental liabilities for the years ended December 31, 2013 and 2012: Year ended December 31, 2013 (millions of Canadian dollars) PCB LAR Total
Environmental liabilities, January 1 197 52 249Interest accretion 9 1 10Expenditures (2) (14) (16)Revaluation adjustment (3) 26 23Environmental liabilities, December 31 201 65 266Less: current portion 15 12 27 186 53 239 Year ended December 31, 2012 (millions of Canadian dollars) PCB LAR Total
Environmental liabilities, January 1 199 58 257Interest accretion 9 2 11Expenditures (8) (10) (18)Revaluation adjustment (3) 2 (1)Environmental liabilities, December 31 197 52 249Less: current portion 13 9 22 184 43 227 The following tables show the reconciliation between the undiscounted basis of the environmental liabilities and the amount recognized on the Consolidated Balance Sheets after factoring in the discount rate: December 31, 2013 (millions of Canadian dollars) PCB LAR TotalUndiscounted environmental liabilities 237 68 305Less: discounting accumulated liabilities to present value 36 3 39Discounted environmental liabilities 201 65 266 December 31, 2012 (millions of Canadian dollars) PCB LAR TotalUndiscounted environmental liabilities 233 54 287Less: discounting accumulated liabilities to present value 36 2 38Discounted environmental liabilities 197 52 249 At December 31, 2013, the estimated future environmental expenditures were as follows: (millions of Canadian dollars) 2014 272015 282016 352017 232018 22Thereafter 170 305
At December 31, 2013, of the total estimated future environmental expenditures, $237 million relates to PCBs (2012 – $233 million) and $68 million relates to LAR (2012 – $54 million). Hydro One records a liability for the estimated future expenditures for the contaminated LAR and for the phase-out and destruction of PCB-contaminated mineral oil removed from electrical equipment. There are uncertainties in estimating future environmental costs due to potential external events such as changes in legislation or regulations, and advances in remediation technologies. In determining the amounts to be recorded as environmental liabilities, the Company estimates the current cost of completing required work and makes assumptions as to when the future expenditures will actually be incurred,
2-40 PUBLIC ACCOUNTS, 2013-2014

HYDRO ONE INC. NOTES TO CONSOLIDATED FINANCIAL STATEMENTS (continued) For the years ended December 31, 2013 and 2012
41
in order to generate future cash flow information. A long-term inflation rate assumption of approximately 2% has been used to express these current cost estimates as estimated future expenditures. Future expenditures have been discounted using factors ranging from approximately 3.3% to 6.3%, depending on the appropriate rate for the period when expenditures are expected to be incurred. All factors used in estimating the Company’s environmental liabilities represent management’s best estimates of the present value of costs required to meet existing legislation or regulations. However, it is reasonably possible that numbers or volumes of contaminated assets, cost estimates to perform work, inflation assumptions and the assumed pattern of annual cash flows may differ significantly from the Company’s current assumptions. In addition, with respect to the PCB environmental liability, the availability of critical resources such as skilled labour and replacement assets and the ability to take maintenance outages in critical facilities may influence the timing of expenditures. Environmental liabilities are reviewed annually or more frequently if significant changes in regulations or other relevant factors occur. Estimate changes are accounted for prospectively. The Company records a regulatory asset reflecting the expectation that future environmental costs will be recoverable in rates. PCBs In September 2008, Environment Canada published regulations governing the management, storage and disposal of PCBs, enacted under the Canadian Environmental Protection Act, 1999. The regulations impose timelines for disposal of PCBs based on certain criteria, including type of equipment, in-use status, and PCB-contamination thresholds. Under these regulations and Hydro One’s approved end-of-use extension, PCBs in concentrations of 500 parts per million (ppm) or more have to be disposed of by the end of 2014, with the exception of specifically exempted equipment, and PCBs in concentrations greater than 50 ppm and less than 500 ppm, or greater than 50 ppm for pole-top transformers, pole-top auxiliary electrical equipment and light ballasts, must be disposed of by the end of 2025. Management judges that the Company currently has very few PCB-contaminated assets in excess of 500 ppm. Contaminated equipment will generally be replaced, or will be decontaminated by removing PCB-contaminated insulating oil and retro filling with replacement oil that contains PCBs in concentrations of less than 2 ppm. The Company’s best estimate of the total estimated future expenditures to comply with current PCB regulations is $237 million. These expenditures are expected to be incurred over the period from 2014 to 2025. As a result of its annual review of environmental liabilities, the Company recorded a revaluation adjustment in 2013 to reduce the PCB environmental liability by $3 million (2012 – $3 million). LAR The Company’s best estimate of the total estimated future expenditures to complete its LAR program is $68 million. These expenditures are expected to be incurred over the period from 2014 to 2022. As a result of its annual review of environmental liabilities, the Company recorded a revaluation adjustment in 2013 to increase the LAR environmental liability by $26 million (2012 – $2 million). 17. ASSET RETIREMENT OBLIGATIONS Hydro One records a liability for the estimated future expenditures for the removal and disposal of asbestos-containing materials installed in some of its facilities and for the decommissioning of specific switching stations located on unowned sites. AROs, which represent legal obligations associated with the retirement of certain tangible long-lived assets, are computed as the present value of the projected expenditures for the future retirement of specific assets and are recognized in the period in which the liability is incurred, if a reasonable estimate of fair value can be made. If the asset remains in service at the recognition date, the present value of the liability is added to the carrying amount of the associated asset in the period the liability is incurred and this additional carrying amount is depreciated over the remaining life of the asset. If an ARO is recorded in respect of an out-of-service asset, the asset retirement cost is charged to results of operations. Subsequent to the initial recognition, the liability is adjusted for any revisions to the estimated future cash flows associated with the ARO, which can occur due to a number of factors including, but not limited to, cost escalation, changes in technology applicable to the assets to be retired, changes in legislation or regulations, as well as for accretion of the liability due to the passage of time until the obligation is settled. Depreciation expense is adjusted prospectively for any increases or decreases to the carrying amount of the associated asset.
PUBLIC ACCOUNTS, 2013-2014 2-41
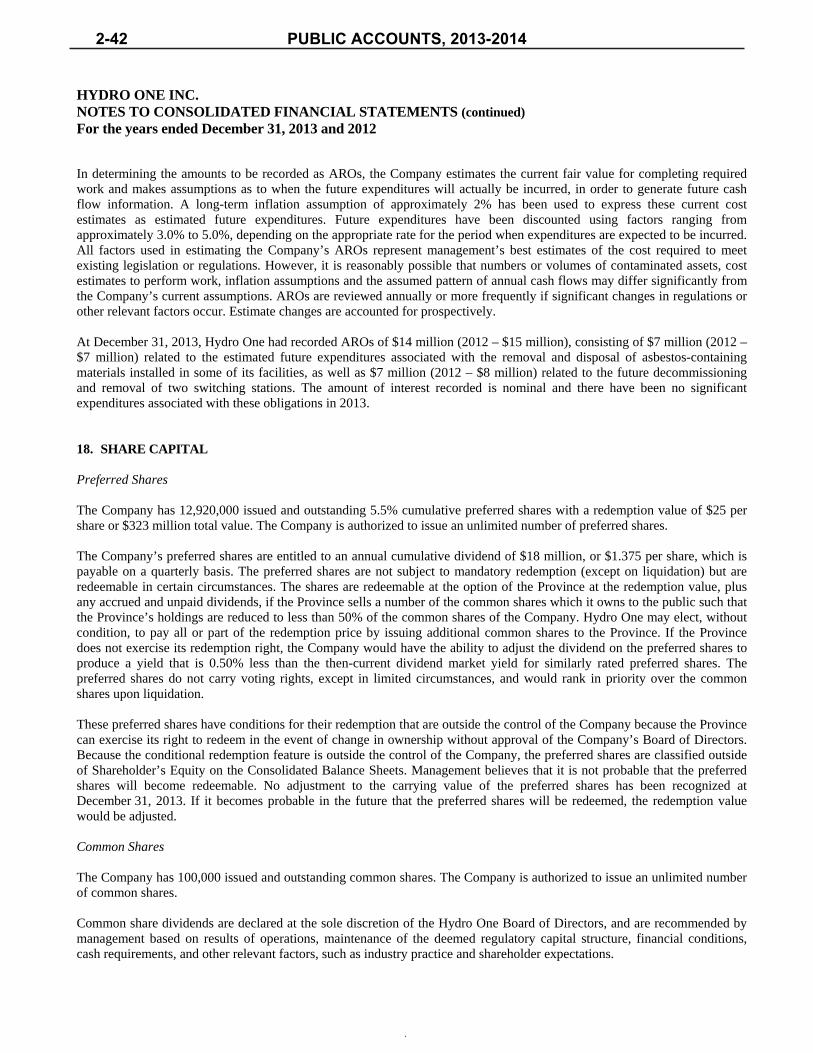
HYDRO ONE INC. NOTES TO CONSOLIDATED FINANCIAL STATEMENTS (continued) For the years ended December 31, 2013 and 2012
42
In determining the amounts to be recorded as AROs, the Company estimates the current fair value for completing required work and makes assumptions as to when the future expenditures will actually be incurred, in order to generate future cash flow information. A long-term inflation assumption of approximately 2% has been used to express these current cost estimates as estimated future expenditures. Future expenditures have been discounted using factors ranging from approximately 3.0% to 5.0%, depending on the appropriate rate for the period when expenditures are expected to be incurred. All factors used in estimating the Company’s AROs represent management’s best estimates of the cost required to meet existing legislation or regulations. However, it is reasonably possible that numbers or volumes of contaminated assets, cost estimates to perform work, inflation assumptions and the assumed pattern of annual cash flows may differ significantly from the Company’s current assumptions. AROs are reviewed annually or more frequently if significant changes in regulations or other relevant factors occur. Estimate changes are accounted for prospectively. At December 31, 2013, Hydro One had recorded AROs of $14 million (2012 – $15 million), consisting of $7 million (2012 – $7 million) related to the estimated future expenditures associated with the removal and disposal of asbestos-containing materials installed in some of its facilities, as well as $7 million (2012 – $8 million) related to the future decommissioning and removal of two switching stations. The amount of interest recorded is nominal and there have been no significant expenditures associated with these obligations in 2013. 18. SHARE CAPITAL Preferred Shares The Company has 12,920,000 issued and outstanding 5.5% cumulative preferred shares with a redemption value of $25 per share or $323 million total value. The Company is authorized to issue an unlimited number of preferred shares. The Company’s preferred shares are entitled to an annual cumulative dividend of $18 million, or $1.375 per share, which is payable on a quarterly basis. The preferred shares are not subject to mandatory redemption (except on liquidation) but are redeemable in certain circumstances. The shares are redeemable at the option of the Province at the redemption value, plus any accrued and unpaid dividends, if the Province sells a number of the common shares which it owns to the public such that the Province’s holdings are reduced to less than 50% of the common shares of the Company. Hydro One may elect, without condition, to pay all or part of the redemption price by issuing additional common shares to the Province. If the Province does not exercise its redemption right, the Company would have the ability to adjust the dividend on the preferred shares to produce a yield that is 0.50% less than the then-current dividend market yield for similarly rated preferred shares. The preferred shares do not carry voting rights, except in limited circumstances, and would rank in priority over the common shares upon liquidation. These preferred shares have conditions for their redemption that are outside the control of the Company because the Province can exercise its right to redeem in the event of change in ownership without approval of the Company’s Board of Directors. Because the conditional redemption feature is outside the control of the Company, the preferred shares are classified outside of Shareholder’s Equity on the Consolidated Balance Sheets. Management believes that it is not probable that the preferred shares will become redeemable. No adjustment to the carrying value of the preferred shares has been recognized at December 31, 2013. If it becomes probable in the future that the preferred shares will be redeemed, the redemption value would be adjusted. Common Shares The Company has 100,000 issued and outstanding common shares. The Company is authorized to issue an unlimited number of common shares. Common share dividends are declared at the sole discretion of the Hydro One Board of Directors, and are recommended by management based on results of operations, maintenance of the deemed regulatory capital structure, financial conditions, cash requirements, and other relevant factors, such as industry practice and shareholder expectations.
2-42 PUBLIC ACCOUNTS, 2013-2014
HYDRO ONE INC. NOTES TO CONSOLIDATED FINANCIAL STATEMENTS (continued) For the years ended December 31, 2013 and 2012
43
Earnings per Share Earnings per share is calculated as net income for the year, after cumulative preferred dividends, divided by the weighted average number of common shares outstanding during the year. 19. DIVIDENDS In 2013, preferred share dividends in the amount of $18 million (2012 – $18 million) and common share dividends in the amount of $200 million (2012 – $352 million) were declared. 20. RELATED PARTY TRANSACTIONS Hydro One is owned by the Province. The OEFC, IESO, Ontario Power Authority (OPA), Ontario Power Generation Inc. (OPG) and the OEB are related parties to Hydro One because they are controlled or significantly influenced by the Province. Hydro One receives revenues for transmission services from the IESO, based on OEB-approved uniform transmission rates. Transmission revenues include $1,509 million (2012 – $1,474 million) related to these services. Hydro One receives amounts for rural rate protection from the IESO. Distribution revenues include $127 million (2012 – $127 million) related to this program. Hydro One also receives revenues related to the supply of electricity to remote northern communities from the IESO. Distribution revenues include $33 million (2012 – $28 million) related to these services. In 2013, Hydro One purchased power in the amount of $2,477 million (2012 – $2,392 million) from the IESO-administered electricity market; $15 million (2012 – $10 million) from OPG; and $8 million (2012 – $7 million) from power contracts administered by the OEFC. Under the Ontario Energy Board Act, 1998, the OEB is required to recover all of its annual operating costs from gas and electricity distributors and transmitters. In 2013, Hydro One incurred $12 million (2012 – $11 million) in OEB fees. Hydro One has service level agreements with OPG. These services include field, engineering, logistics and telecommunications services. In 2013, revenues related to the provision of construction and equipment maintenance services with respect to these service level agreements were $9 million (2012 – $10 million), primarily for the Transmission Business. Operation, maintenance and administration costs related to the purchase of services with respect to these service level agreements were $1 million in 2013 (2012 – $2 million). The OPA funds substantially all of the Company’s conservation and demand management programs. The funding includes program costs, incentives, and management fees. In 2013, Hydro One received $34 million (2012 – $39 million) from the OPA related to these programs. Hydro One pays a $5 million annual fee to the OEFC for indemnification against adverse claims in excess of $10 million paid by the OEFC with respect to certain of Ontario Hydro’s businesses transferred to Hydro One on April 1, 1999. PILs and payments in lieu of property taxes are paid to the OEFC, and dividends are paid to the Province. Sales to and purchases from related parties occur at normal market prices or at a proxy for fair value based on the requirements of the OEB’s Affiliate Relationships Code. Outstanding balances at period end are interest free and settled in cash. At December 31, 2013, the Company held $250 million in Province of Ontario Floating-Rate Notes with a fair value of $251 million (2012 – $251 million).
PUBLIC ACCOUNTS, 2013-2014 2-43

HYDRO ONE INC. NOTES TO CONSOLIDATED FINANCIAL STATEMENTS (continued) For the years ended December 31, 2013 and 2012
44
The amounts due to and from related parties as a result of the transactions referred to above are as follows: December 31 (millions of Canadian dollars) 2013 2012
Due from related parties 197 154Due to related parties1 (230) (261)Investment 251 2511 Included in due to related parties at December 31, 2013 are amounts owing to the IESO in respect of power purchases of $217 million (2012 – $199 million).
21. CONSOLIDATED STATEMENTS OF CASH FLOWS The changes in non-cash balances related to operations consist of the following: Year ended December 31 (millions of Canadian dollars) 2013 2012
Accounts receivable (78) (30)Due from related parties (43) 2Materials and supplies – 2Other assets (5) (4)Accounts payable (60) (5)Accrued liabilities 150 10Due to related parties (31) (85)Accrued interest 5 10Long-term accounts payable and other liabilities (11) 13Post-retirement and post-employment benefit liability 84 56 11 (31) Capital Expenditures The following table illustrates the reconciliation between investments in property, plant and equipment and the amount presented in the Consolidated Statements of Cash Flows after factoring in the net change in related accruals: Year ended December 31 (millions of Canadian dollars) 2013 2012
Capital investments in property, plant and equipment (1,312) (1,363)Net change in accruals included in capital investments in property, plant and equipment (21) (10)Capital expenditures – property, plant and equipment (1,333) (1,373) The following table illustrates the reconciliation between investments in intangible assets and the amount presented in the Consolidated Statements of Cash Flows after factoring in the net change in related accruals: Year ended December 31 (millions of Canadian dollars) 2013 2012
Capital investments in intangible assets (82) (91)Net change in accruals included in capital investments in intangible assets 3 1Capital expenditures – intangible assets (79) (90) Supplementary Information Year ended December 31 (millions of Canadian dollars) 2013 2012
Net interest paid 395 411PILs 138 197
2-44 PUBLIC ACCOUNTS, 2013-2014
HYDRO ONE INC. NOTES TO CONSOLIDATED FINANCIAL STATEMENTS (continued) For the years ended December 31, 2013 and 2012
45
22. CONTINGENCIES Legal Proceedings Hydro One is involved in various lawsuits, claims and regulatory proceedings in the normal course of business. In the opinion of management, the outcome of such matters will not have a material adverse effect on the Company’s consolidated financial position, results of operations or cash flows. Transfer of Assets The transfer orders by which the Company acquired certain of Ontario Hydro’s businesses as of April 1, 1999 did not transfer title to some assets located on Reserves (as defined in the Indian Act (Canada)). Currently, the OEFC holds these assets. Under the terms of the transfer orders, the Company is required to manage these assets until it has obtained all consents necessary to complete the transfer of title of these assets to itself. The Company cannot predict the aggregate amount that it may have to pay, either on an annual or one-time basis, to obtain the required consents. In 2013, the Company paid approximately $2 million (2012 – $1 million) in respect of these consents. If the Company cannot obtain the required consents, the OEFC will continue to hold these assets for an indefinite period of time. If the Company cannot reach a satisfactory settlement, it may have to relocate these assets to other locations at a cost that could be substantial or, in a limited number of cases, to abandon a line and replace it with diesel-generation facilities. The costs relating to these assets could have a material adverse effect on the Company’s results of operations if the Company is not able to recover them in future rate orders. 23. COMMITMENTS Agreement with Inergi LP (Inergi) In 2002, Inergi, an affiliate of Capgemini Canada Inc., began providing services to Hydro One, including business processing and information technology outsourcing services, as well as core system support related primarily to SAP implementation and optimization. The current agreement with Inergi will expire in February 2015. At December 31, 2013, the annual commitments under the Inergi agreement are as follows: 2014 – $130 million; 2015 – $22 million; 2016 and thereafter – nil. Prudential Support Purchasers of electricity in Ontario, through the IESO, are required to provide security to mitigate the risk of their default based on their expected activity in the market. As at December 31, 2013, the Company provided prudential support to the IESO on behalf of Hydro One Networks and Hydro One Brampton Networks using parental guarantees of $325 million (2012 – $325 million), and on behalf of two distributors using guarantees of $1 million (2012 – $1 million). In addition, as at December 31, 2013, the Company has provided letters of credit in the amount of $21 million (2012 – $22 million) to the IESO. The IESO could draw on these guarantees and/or letters of credit if these subsidiaries or distributors fail to make a payment required by a default notice issued by the IESO. The maximum potential payment is the face value of any letters of credit plus the amount of the parental guarantees. Retirement Compensation Arrangements Bank letters of credit have been issued to provide security for the Company’s liability under the terms of a trust fund established pursuant to the supplementary pension plan for eligible employees of Hydro One. The supplementary pension plan trustee is required to draw upon these letters of credit if Hydro One is in default of its obligations under the terms of this plan. Such obligations include the requirement to provide the trustee with an annual actuarial report as well as letters of credit sufficient to secure the Company’s liability under the plan, to pay benefits payable under the plan and to pay the letter of credit fee. The maximum potential payment is the face value of the letters of credit. At December 31, 2013, Hydro One had letters of credit of $127 million (2012 – $127 million) outstanding relating to retirement compensation arrangements.
PUBLIC ACCOUNTS, 2013-2014 2-45

HYDRO ONE INC. NOTES TO CONSOLIDATED FINANCIAL STATEMENTS (continued) For the years ended December 31, 2013 and 2012
46
Operating Leases Hydro One is committed as lessee to irrevocable operating lease contracts for buildings used in administrative and service-related functions and storing telecommunications equipment. These leases have an average life of between one and five years with renewal options for periods ranging from one to 10 years included in some of the contracts. All leases include a clause to enable upward revision of the rental charge on an annual basis or on renewal according to prevailing market conditions. There are no restrictions placed upon Hydro One by entering into these leases. Hydro One Networks and Hydro One Telecom are the principal entities concerned. At December 31, the future minimum lease payments under non-cancellable operating leases were as follows: December 31 (millions of Canadian dollars) 2013 2012Within one year 11 10After one year but not more than five years 28 29More than five years 9 14 48 53 During the year ended December 31, 2013, the Company made lease payments totaling $11 million (2012 – $9 million). 24. SEGMENTED REPORTING Hydro One has three reportable segments: The Transmission Business, which comprises the core business of providing electricity transportation and connection
services, is responsible for transmitting electricity throughout the Ontario electricity grid;
The Distribution Business, which comprises the core business of delivering and selling electricity to customers; and
Other, the operations of which primarily consist of those of the telecommunications business. The designation of segments has been based on a combination of regulatory status and the nature of the products and services provided. Operating segments of the Company are determined based on information used by the chief operating decision maker in deciding how to allocate resources and evaluate the performance of each of the segments. The Company evaluates segment performance based on income before financing charges and provision for PILs from continuing operations (excluding certain allocated corporate governance costs). The accounting policies followed by the segments are the same as those described in the summary of significant accounting policies (see Note 2 – Significant Accounting Policies). Segment information on the above basis is as follows: Year ended December 31, 2013 (millions of Canadian dollars) Transmission Distribution Other ConsolidatedRevenues 1,529 4,484 61 6,074Purchased power – 3,020 – 3,020Operation, maintenance and administration 375 672 59 1,106Depreciation and amortization 327 340 9 676Income (loss) before financing charges and provision for PILs 827 452 (7) 1,272Financing charges 360Income before provision for PILs 912 Capital investments 714 673 7 1,394
2-46 PUBLIC ACCOUNTS, 2013-2014
HYDRO ONE INC. NOTES TO CONSOLIDATED FINANCIAL STATEMENTS (continued) For the years ended December 31, 2013 and 2012
47
Year ended December 31, 2012 (millions of Canadian dollars) Transmission Distribution Other ConsolidatedRevenues 1,482 4,184 62 5,728Purchased power – 2,774 – 2,774Operation, maintenance and administration 402 608 61 1,071Depreciation and amortization 320 329 10 659Income (loss) before financing charges and provision for PILs 760 473 (9) 1,224Financing charges 358Income before provision for PILs 866 Capital investments 776 671 7 1,454 Total Assets by Segment: December 31 (millions of Canadian dollars) 2013 2012
Total assets Transmission 11,846 11,586Distribution 8,805 8,621Other 974 604
21,625 20,811 All revenues, costs and assets, as the case may be, are earned, incurred or held in Canada. 25. SUBSEQUENT EVENT On January 29, 2014, Hydro One issued $50 million notes under its MTN Program, with a maturity date of January 29, 2064 and a coupon rate of 4.29%.
PUBLIC ACCOUNTS, 2013-2014 2-47


Responsibility for
Financial Reporting The preparation, presentation and integrity of the financial statements are the responsibility of management. This responsibility includes the selection and consistent application of appropriate accounting principles and methods in addition to making the estimates, judgments and assumptions necessary to prepare the financial statements in accordance with Canadian generally accepted accounting principles, which complies with International Financial Reporting Standards. The accompanying financial statements of the Liquor Control Board of Ontario have been prepared in accordance with International Financial Reporting Standards and include amounts that are based on management’s best estimates and judgment. Management maintains a system of internal controls designed to provide reasonable assurance that the assets are safeguarded and that reliable financial information is available on a timely basis. The system includes formal policies and procedures and an organizational structure that provides for appropriate delegation of authority and segregation of responsibilities. An internal audit function independently evaluates the effectiveness of these internal controls on an ongoing basis and reports its findings to management and the Audit Committee of the Board. The Board of Directors, through the Audit Committee, is responsible for ensuring that management fulfills its responsibilities for financial reporting and internal controls. The Audit Committee, composed of four Members who are not employees/officers of the LCBO, generally meets periodically with management, the internal auditors and the Office of the Auditor General of Ontario to satisfy itself that each group has properly discharged its respective responsibility. Also, the Office of the Auditor General of Ontario meets with the Audit Committee without management present. The financial statements have been audited by the Office of the Auditor General of Ontario. The Auditor’s responsibility is to express an opinion on whether the financial statements are fairly presented in accordance with International Financial Reporting Standards. The Independent Auditor’s Report outlines the scope of the Auditor’s examination and opinion.
Liquor Control Board of Ontario
PUBLIC ACCOUNTS, 2013-2014 2-49
Independent Auditor’s Report
To the Liquor Control Board of Ontario
and to the Minister of Finance
I have audited the accompanying financial statements of the Liquor Control Board of Ontario,
which comprise the statement of financial position as at March 31, 2014, and the statement of
income and comprehensive income, statement of changes in equity and statement of cash flows for
the year then ended, and a summary of significant accounting policies and other explanatory
information.
Management’s Responsibility for the Financial Statements
Management is responsible for the preparation and fair presentation of these financial statements
in accordance with International Financial Reporting Standards, and for such internal control as
management determines is necessary to enable the preparation of financial statements that are free
from material misstatement, whether due to fraud or error.
Auditor’s Responsibility
My responsibility is to express an opinion on these financial statements based on my audit. I
conducted my audit in accordance with Canadian generally accepted auditing standards. Those
standards require that I comply with ethical requirements and plan and perform the audit to obtain
reasonable assurance about whether the financial statements are free from material misstatement.
An audit involves performing procedures to obtain audit evidence about the amounts and
disclosures in the financial statements. The procedures selected depend on the auditor’s judgment,
including the assessment of the risks of material misstatement of the financial statements, whether
due to fraud or error. In making those risk assessments, the auditor considers internal control
relevant to the entity’s preparation and fair presentation of the financial statements in order to
design audit procedures that are appropriate in the circumstances, but not for the purpose of
expressing an opinion on the effectiveness of the entity’s internal control. An audit also includes
evaluating the appropriateness of accounting policies used and the reasonableness of accounting
estimates made by management, as well as evaluating the overall presentation of the financial
statements.
I believe that the audit evidence I have obtained is sufficient and appropriate to provide a basis for
my audit opinion.
Opinion
In my opinion, the financial statements present fairly, in all material respects, the financial
position of the Liquor Control Board of Ontario as at March 31, 2014, and its financial
performance and its cash flows for the year then ended in accordance with International Financial
Reporting Standards.
Toronto, Ontario Bonnie Lysyk, MBA, CPA, CA, LPA
June 26, 2014 Auditor General
2-50 PUBLIC ACCOUNTS, 2013-2014
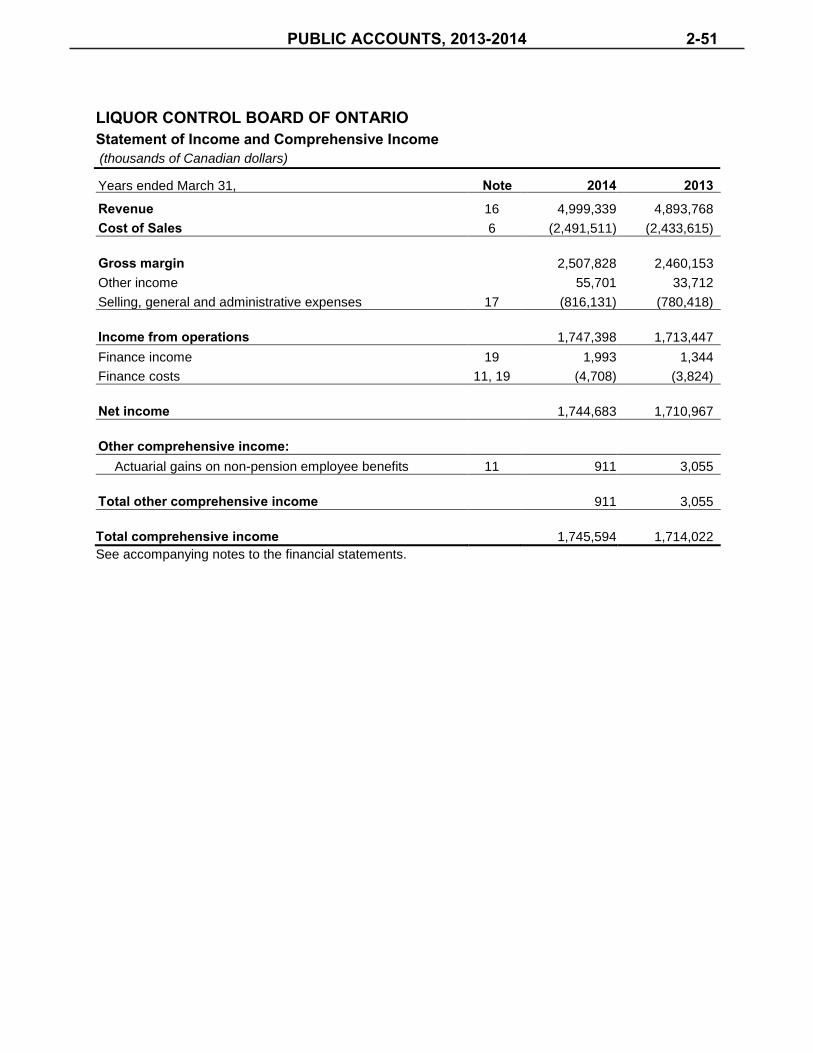
LIQUOR CONTROL BOARD OF ONTARIO Statement of Income and Comprehensive Income (thousands of Canadian dollars)
Years ended March 31, Note 2014 2013
Revenue 16 4,999,339 4,893,768
Cost of Sales 6 (2,491,511) (2,433,615)
Gross margin 2,507,828 2,460,153
Other income 55,701 33,712
Selling, general and administrative expenses 17 (816,131) (780,418)
Income from operations 1,747,398 1,713,447
Finance income 19 1,993 1,344
Finance costs 11, 19 (4,708) (3,824)
Net income 1,744,683 1,710,967
Other comprehensive income:
Actuarial gains on non-pension employee benefits 11 911 3,055
Total other comprehensive income 911 3,055
Total comprehensive income 1,745,594 1,714,022
See accompanying notes to the financial statements.
PUBLIC ACCOUNTS, 2013-2014 2-51

LIQUOR CONTROL BOARD OF ONTARIO Statement of Financial Position (thousands of Canadian dollars)
Note March 31
2014 March 31 2013
ASSETS Current Assets
Cash and cash equivalents 4 286,377 317,423
Trade and other receivables 5 42,831 41,521
Inventories 6 386,745 378,937
Prepaid expenses 10,556 13,069
Total Current Assets 726,509 750,950
Property, plant and equipment and intangible assets 7 364,435 340,210
Total Assets 1,090,944 1,091,160
LIABILITIES & EQUITY
Current Liabilities Trade and other payables 8 549,255 561,119
Provisions 10 19,037 18,628
Current portion of non-pension employee benefits 11 11,700 10,202
Total Current Liabilities 579,992 589,949
Non-pension employee benefits 11 111,769 107,622
Total Liabilities 691,761 697,571
Equity
Retained earnings 400,948 396,265
Accumulated other comprehensive income/(loss) (1,765) (2,676)
Total Equity 399,183 393,589
Total Liabilities and Equity 1,090,944 1,091,160 See accompanying notes to the financial statements.
2-52 PUBLIC ACCOUNTS, 2013-2014

LIQUOR CONTROL BOARD OF ONTARIO Statement of Changes in Equity (thousands of Canadian dollars)
Retained Earnings
Accumulated other comprehensive
income Total Equity
Balance at April 1, 2013 396,265 (2,676) 393,589
Net income 1,744,683 - 1,744,683
Other comprehensive income - 911 911
Dividends paid to province (1,740,000) - (1,740,000)
Balance at March 31, 2014 400,948 (1,765) 399,183
Balance at April 1, 2012 385,298 (5,731) 379,567
Net income 1,710,967 - 1,710,967
Other comprehensive income - 3,055 3,055
Dividends paid to province (1,700,000) - (1,700,000)
Balance at March 31, 2013 396,265 (2,676) 393,589
PUBLIC ACCOUNTS, 2013-2014 2-53

LIQUOR CONTROL BOARD OF ONTARIO Statement of Cash Flows (thousands of Canadian dollars)
Years ended March 31, 2014 2013
Operating activities: Net income 1,744,683 1,710,967
Depreciation and amortization 54,897 51,126
Gain on sale of property, plant and equipment and intangible assets (1,602) (95)
53,295 51,031
Change in non-cash balances related to operations: Trade and other receivables (1,310) (9,498)
Inventories (7,808) (21,993)
Prepaids 2,513 17,201
Trade and other payables (11,864) 89,680
Provisions 409 978
Non-pension employee benefit expenses, net of payments 6,556 9,284
(11,504) 85,652
Net cash provided by operating activities 1,786,474 1,847,650
Investing activities: Purchase of property, plant and equipment and intangible
assets (79,242) (81,317)
Proceeds from sale of property, plant and equipment 1,722 1,698
Net cash used in investing activities (77,520) (79,619)
Financing activities: Dividend paid to the Province of Ontario (1,740,000) (1,700,000)
Net cash used in financing activities (1,740,000) (1,700,000)
Increase (decrease) in cash (31,046) 68,031
Cash and cash equivalents, beginning of year 317,423 249,392
Cash and cash equivalents, end of year 286,377 317,423
2-54 PUBLIC ACCOUNTS, 2013-2014

LIQUOR CONTROL BOARD OF ONTARIO Notes to Financial Statements For the years ended March 31, 2014 and 2013 (thousands of Canadian dollars)
1. General Information
The Liquor Control Board of Ontario (“LCBO”) is a corporation without share capital incorporated under the Liquor Control Act, R.S.O. 1990, Chapter L.18. LCBO is a government enterprise responsible for regulating the production, importation, distribution and sale of alcoholic beverages in the Province of Ontario (“Province”). As an Ontario Crown Corporation, LCBO is exempt from income taxes. LCBO transfers most of its earnings to the Province’s Consolidated Revenue Fund in the form of a dividend. LCBO’s head office is located at 55 Lake Shore Blvd East, Toronto, Ontario, Canada, M5E 1A4.
2. Basis of Preparation
a. Statement of compliance
These financial statements have been prepared in accordance with International Financial Reporting Standards (“IFRS”), as issued by the International Accounting Standards Board (“IASB”). The financial statements are presented in Canadian dollars (“C$”), LCBO’s functional currency. The audited financial statements were approved by the Board of Directors and authorized for issue on June 26, 2014.
b. Basis of presentation
These financial statements have been prepared on the historical cost basis except for financial instruments which are measured at fair value through profit and loss (“FVTPL”).
Use of estimates and judgments LCBO makes judgments and assumptions concerning the future that impact the application of policies and reported amounts. Judgment is used mainly in determining whether a balance or transaction should be recognized in the financial statements. Estimates and assumptions are used mainly in determining the measurement of recognized transactions and balances. However, judgment and estimates are often interrelated. The resulting accounting estimates calculated using these judgments and assumptions will, by definition, seldom equal the related actual future results as they are based on historical experience and expectations of future events. The judgments and key sources of estimation uncertainty that have a significant effect on the amounts recognized in the financial statements are discussed below.
i. Non-pension employee benefits
The present value of the non-pension employee benefits obligations depends on a number of factors that are determined on an actuarial basis using a number of assumptions. The assumptions used in determining the expense for the non-pension employee benefits include the discount rate. Any changes in these assumptions will impact the carrying amount of non-pension employee benefits obligations.
LCBO determines the appropriate discount rate at the end of each year. In determining the appropriate discount rate, LCBO uses the interest rates of high-quality corporate bonds that are denominated in the Canadian dollars in which the benefits will be paid. Other key
PUBLIC ACCOUNTS, 2013-2014 2-55

LIQUOR CONTROL BOARD OF ONTARIO Notes to Financial Statements For the years ended March 31, 2014 and 2013 (thousands of Canadian dollars)
assumptions for employee benefit obligations are based in part on current market conditions. Additional disclosures are presented in Note 11.
ii. Depreciation and amortization
LCBO exercises judgment to determine useful lives of intangibles, and each significant component of property, plant and equipment. The assets are depreciated or amortized over their estimated useful lives. Additional disclosures are presented in Note 7.
iii. Impairment of property, plant and equipment and intangible assets
LCBO has determined each store as a separate cash-generating unit (“CGU”). Where there are indicators for impairment, LCBO performs an impairment test. Intangible assets and property, plant and equipment are subject to impairment reviews based on whether current circumstances suggest that their recoverable amount may be less than their carrying value. Recoverable amount for CGUs are based on a calculation of expected future cash flows using suitable discount rates and includes management assumptions and estimates of future performance. Additional disclosures are presented in Note 7.
iv. Allowance for impairment
LCBO makes an assessment of whether trade and other receivables are collectible from customers. Accordingly, LCBO establishes an allowance for estimated losses arising from non-payment, taking into consideration customer credit worthiness, current economic trends and past experience. If future collections differ from estimates, future earnings would be affected. Additional disclosures are presented in Note 5.
v. Inventories
LCBO makes estimates on the warehouse handling costs that directly relate to bringing inventories to their selling location and condition. Accordingly, LCBO includes the direct warehouse handling costs within inventories and they are expensed to cost of sales in the period the inventories are sold. Additional disclosures are presented in Note 6.
vi. Leases
LCBO leases certain retail stores and other assets. Determining whether a lease arrangement is classified as finance or operating requires judgment with respect to the fair value of the leased asset, the economic life of the lease, and the discount rate of the lease.
vii. Provisions
Provisions have been made for certain employee benefits, sales returns and store closing costs. These provisions are estimates and the actual costs and timing of future cash flows are dependent on future events. Any difference between expectations and the actual future liability will be accounted for in the period when such determination is made. Additional disclosures are presented in Note 10.
viii. Ontario Deposit Return Program unredeemed container deposit income
LCBO has determined that not all deposits paid by customers for the Ontario Deposit Return Program (“ODRP”) containers will be redeemed. Estimates have been made for the redemption rate on ODRP containers based on past history and industry trends. The estimated unredeemed ODRP containers deposits are treated as other income. Any
2-56 PUBLIC ACCOUNTS, 2013-2014

LIQUOR CONTROL BOARD OF ONTARIO Notes to Financial Statements For the years ended March 31, 2014 and 2013 (thousands of Canadian dollars)
difference between the expected and actual ODRP redemption will be accounted for in the year when such determination is made. Additional disclosures are presented in Note 22.
ix. Unredeemed Gift cards
LCBO has determined that not all gift cards purchased will be redeemed in full by customers. Estimates have been made for the redemption rate on gift cards based on past history and industry trends and are included in revenues.
PUBLIC ACCOUNTS, 2013-2014 2-57

LIQUOR CONTROL BOARD OF ONTARIO Notes to Financial Statements For the years ended March 31, 2014 and 2013 (thousands of Canadian dollars)
c. New standards & interpretations not yet adopted
The International Accounting Standards Board (IASB) and International Financial Reporting Interpretations Committee (IFRIC) have issued the following standards and amendments that have not been applied in preparing our March 31, 2014 financial statements as their effective dates fall in periods beginning subsequent to the current financial reporting period.
Proposed standards
and amendments
Description Previous standard
Effective for LCBO
reporting periods
beginning on
Estimated impact
IAS 32 – Financial Instruments: Presentation
Amended in December 2011 to clarify existing requirements for offsetting financial instruments.
IAS 32 – Financial Instruments: Presentation
April 1, 2014 No anticipated
impact
IFRIC 21 -
Levies
Issued in May 2013, the
interpretation provides
guidance regarding when to
recognize a liability to pay a
levy that is accounted for under
IAS 37 Provisions, Contingent
Liabilities and Contingent
Assets.
N/A April 1, 2014 No anticipated
impact
IFRS 9 –
Financial
Instruments
Initially issued in November
2009 to address the
classification and measurement
of financial assets. Additional
guidance issued in October
2010 on the classification and
measurement of financial
liabilities.
IAS 39 –
Financial
Instruments:
Recognition and
Measurement
April 1, 2015 LCBO is
assessing the potential impact
IAS 19 –
Employee
Benefits
Amended in November 2013 to
clarify how contributions from
employees or third parties to
defined benefit plans reduce
service cost or affect
remeasurements of the net
defined benefit liability or asset.
IAS 19 –
Employee
Benefits
April 1, 2015 LCBO is
assessing the potential impact
2-58 PUBLIC ACCOUNTS, 2013-2014
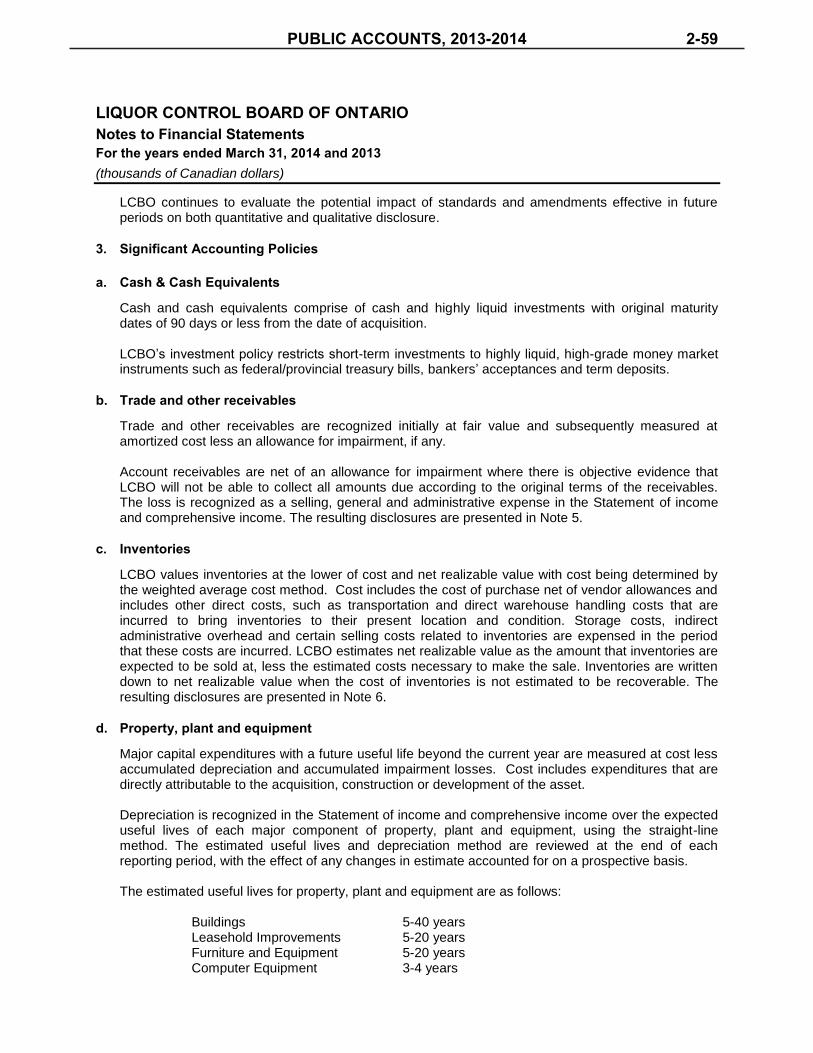
LIQUOR CONTROL BOARD OF ONTARIO Notes to Financial Statements For the years ended March 31, 2014 and 2013 (thousands of Canadian dollars)
LCBO continues to evaluate the potential impact of standards and amendments effective in future periods on both quantitative and qualitative disclosure.
3. Significant Accounting Policies
a. Cash & Cash Equivalents
Cash and cash equivalents comprise of cash and highly liquid investments with original maturity dates of 90 days or less from the date of acquisition. LCBO’s investment policy restricts short-term investments to highly liquid, high-grade money market instruments such as federal/provincial treasury bills, bankers’ acceptances and term deposits.
b. Trade and other receivables
Trade and other receivables are recognized initially at fair value and subsequently measured at amortized cost less an allowance for impairment, if any. Account receivables are net of an allowance for impairment where there is objective evidence that LCBO will not be able to collect all amounts due according to the original terms of the receivables. The loss is recognized as a selling, general and administrative expense in the Statement of income and comprehensive income. The resulting disclosures are presented in Note 5.
c. Inventories
LCBO values inventories at the lower of cost and net realizable value with cost being determined by the weighted average cost method. Cost includes the cost of purchase net of vendor allowances and includes other direct costs, such as transportation and direct warehouse handling costs that are incurred to bring inventories to their present location and condition. Storage costs, indirect administrative overhead and certain selling costs related to inventories are expensed in the period that these costs are incurred. LCBO estimates net realizable value as the amount that inventories are expected to be sold at, less the estimated costs necessary to make the sale. Inventories are written down to net realizable value when the cost of inventories is not estimated to be recoverable. The resulting disclosures are presented in Note 6.
d. Property, plant and equipment
Major capital expenditures with a future useful life beyond the current year are measured at cost less accumulated depreciation and accumulated impairment losses. Cost includes expenditures that are directly attributable to the acquisition, construction or development of the asset. Depreciation is recognized in the Statement of income and comprehensive income over the expected useful lives of each major component of property, plant and equipment, using the straight-line method. The estimated useful lives and depreciation method are reviewed at the end of each reporting period, with the effect of any changes in estimate accounted for on a prospective basis. The estimated useful lives for property, plant and equipment are as follows:
Buildings 5-40 years Leasehold Improvements 5-20 years Furniture and Equipment 5-20 years Computer Equipment 3-4 years
PUBLIC ACCOUNTS, 2013-2014 2-59

LIQUOR CONTROL BOARD OF ONTARIO Notes to Financial Statements For the years ended March 31, 2014 and 2013 (thousands of Canadian dollars)
Land assets are carried at cost, less any recognized impairment losses and are not depreciated. Property, plant and equipment under construction and not available for use, are carried at cost, less any recognized impairment loss. Such assets are classified to the appropriate categories of property, plant and equipment when completed and ready for intended use. Depreciation of these assets, on the same basis as other assets, commences when the assets are ready for their intended use. The cost of subsequently replacing part of an item of property, plant and equipment is recognized in the carrying amount of the item if it is probable that the future economic benefits related to the part will flow to LCBO, and its cost can be measured reliably. The costs of the day-to-day servicing of property, plant and equipment are recognized in the Statement of income and comprehensive income as incurred. The resulting disclosures are presented in Note 7.
e. Intangible assets
i. Acquired intangible assets
Acquired intangible assets, such as software, are measured initially at cost and are amortized on a straight-line basis over their estimated useful lives. The estimated useful lives for intangible assets are as follows: Computer software 3-4 years The resulting disclosures are presented in Note 7.
ii. Internally generated intangible assets – research & development costs
Research costs are expensed as incurred.
Development expenditures incurred are capitalized only if all the following criteria are met:
an asset is created that can be identified (such as software or new processes);
it is probable that the asset created will generate future economic benefits; and
the development cost of the asset can be measured reliably.
Software under development and not available for use, are carried at cost, less any recognized impairment loss. When completed and ready for intended use these assets are amortized on the same basis as other acquired intangible assets. The resulting disclosures are presented in Note 7.
f. Impairment of property, plant and equipment and intangible assets
Annually LCBO reviews the carrying amounts of its property, plant and equipment and intangible assets to determine whether there is any indication of an impairment loss. If any such indication exists, the recoverable amount of the asset is estimated in order to determine the extent of the impairment loss. Where the asset does not generate cash flows that are independent from other assets, LCBO estimates the recoverable amount of the cash-generating unit (“CGU”) to which the asset belongs. For property, plant and equipment and intangible assets, the CGU is deemed to be each retail store. If the recoverable amount of an asset or CGU is estimated to be less than its
2-60 PUBLIC ACCOUNTS, 2013-2014

LIQUOR CONTROL BOARD OF ONTARIO Notes to Financial Statements For the years ended March 31, 2014 and 2013 (thousands of Canadian dollars)
carrying amount, the carrying amount of the asset or CGU is reduced to its recoverable amount. Any impairment charge is recognized in the Statement of income and comprehensive income in the year in which it occurs. The resulting disclosures are presented in Note 7.
g. Trade and other payables
Trade and other payables are classified as other financial liabilities and are generally short term in nature and due within one year of the Statement of financial position date. Trade payables are non interest-bearing and are stated at amortized cost. The resulting disclosures are presented in Note 8.
h. Provisions
Provisions are recognized when there is a present legal or constructive obligation as a result of a past event, for which it is probable that a transfer of economic benefits will be required to settle the obligation and where a reliable estimate can be made of the amount of the obligation. The resulting disclosures are presented in Note 10.
i. Financial instruments
Financial assets and financial liabilities are recognized when LCBO becomes a party to the contractual provisions of the instrument. Financial assets and financial liabilities are initially measured at fair value. LCBO’s financial assets and liabilities are generally classified and measured as follows:
Financial Asset / Financial Liability Category Measurement
Cash and cash equivalents Loans and receivables or available for sale
Fair value which approximates amortized cost due to the short-term nature of the instruments.
Trade and other receivables Loans and receivables Amortized cost
Trade and other payables Other financial liabilities Amortized cost
Derivatives and embedded derivatives
1 Fair value through profit and loss (“FVTPL”)
Fair value through profit and loss (“FVTPL”)
1 Derivatives are included in Trade and other payables in the Statement of financial position. The resulting disclosures are presented in Note 14.
i. Financial assets
Financial assets are classified into the following specified categories: financial assets at ‘fair value through profit or loss' (“FVTPL”), ‘available-for-sale' (“AFS”) financial assets and loans and receivables. The classification depends on the nature and purpose of the financial assets and is determined at the time of initial recognition.
Financial assets at FVTPL
Financial assets are classified as FVTPL when the financial asset is either held for trading or designated as such upon initial recognition. Financial assets are classified as held for trading if acquired principally for the purpose of selling in the near future or it has been part of an
PUBLIC ACCOUNTS, 2013-2014 2-61

LIQUOR CONTROL BOARD OF ONTARIO Notes to Financial Statements For the years ended March 31, 2014 and 2013 (thousands of Canadian dollars)
identified portfolio of financial instruments that LCBO manages together and has a recent actual pattern of short-term profit-making. Derivatives are also categorized as held for trading. Financial assets classified as FVTPL are measured at fair value, with changes in fair value recorded in the Statement of income and comprehensive income in the period in which they arise.
Available for sale (“AFS”)
Financial instruments classified as AFS financial assets are measured at fair value with changes in fair value recognized in other comprehensive income (“OCI”) until realized through disposal or impairment.
Loans and receivables
Loans and receivables are non-derivative financial assets with fixed or determinable payments that are not quoted in an active market. Loans and receivables are measured at amortized cost using the effective interest method, less any impairment.
ii. Financial liabilities
Financial liabilities are classified as ‘other financial liabilities', which are subsequently measured at amortized cost using the effective interest method.
iii. Derivatives
A derivative financial instrument is a fixed price commitment to buy or sell a financial instrument at a future date. Derivative financial instruments are classified as FVTPL. Derivatives are initially recognized at fair value on the date a contract is entered into and are subsequently re-measured at fair value, with changes recognized in the Statement of income and comprehensive income. The resulting disclosures are presented in Note 14.
iv. Embedded derivatives
An embedded derivative is a feature within a contract, where the cash flows associated with that feature behave in a similar fashion to a stand-alone derivative. LCBO enters into inventory purchase contracts in currencies other than the Canadian dollar or that of the supplier’s home or local currency, in which an embedded derivative may exist. These embedded derivatives are accounted for as separate instruments and accounted for independently from the host contract and are measured at fair value at the end of the reporting period using forward exchange market rates. Embedded derivatives are included within trade and other payables in the Statement of financial position, any changes in their fair values are recognized in the Statement of income and comprehensive income. The resulting disclosures are presented in Note 14.
j. Revenue recognition
Revenue consists of the fair value of consideration received or receivable for the sale of goods in the ordinary course of LCBO’s activities less any sales taxes. Sales taxes on the sale of goods are recorded as a liability in the period the sales taxes are deemed to be owed and are excluded from revenues. Revenue is recognized when the significant risks and
2-62 PUBLIC ACCOUNTS, 2013-2014

LIQUOR CONTROL BOARD OF ONTARIO Notes to Financial Statements For the years ended March 31, 2014 and 2013 (thousands of Canadian dollars)
rewards of ownership of the goods have transferred to the buyer and the amount of revenue can be measured reliably. Revenue is recorded net of returns, discounts, applicable taxes and container deposits, in the Statement of income and comprehensive income. Revenue generated from gift cards is recognized when gift cards are redeemed. LCBO also recognizes revenue from unredeemed gift cards if the likelihood of gift card redemption by the customer is considered to be remote.
i. Air Miles®
1
Income from the Air Miles®
1 “program” is recognized in the period in which it is earned, in
accordance with the terms of the contract. The program is split into two distinct components: (1) Base and (2) Bonus. The associated costs of the Base are accounted for as a reduction to revenues in the Statement of income and comprehensive income. The associated income net of costs of the Bonus is accounted for as a reduction to cost of sales in the Statement of income and comprehensive income.
k. Other income
i. Services rendered
Income from services rendered is recognized when the services are provided and the income can be measured reliably. Such services consist principally of border point levies and fees generated from special occasion permits such as those required by an individual or organization, who plan to serve alcohol at an event or location other than a private place.
ii. Unredeemed ODRP container deposits
LCBO recognizes income from estimated unredeemed ODRP container deposits as not all customers return the container for their deposit. LCBO determines its ODRP container redemption rate based on historical redemption data and research of industry experience and estimates the unredeemed ODRP container deposit income. The resulting income is recognized based on historical redemption patterns, commencing when the container deposits are collected. The resulting disclosures are presented in Note 22.
l. Vendor allowances
LCBO receives allowances from certain suppliers whose product it purchases for resale. The allowances are received for a variety of promotional activities, including allowances received for in store promotion of the supplier’s product, advertising the launch of a new product and labeling and shelf space provided on limited time product offers. LCBO recognizes consideration received from vendors as a reduction in the price of the vendors’ products and reflects it as a reduction to cost of sales when recognized in the Statement of income and comprehensive income. Certain exceptions apply where the cash consideration received is a direct reimbursement of specific, incremental and identifiable costs incurred by LCBO for assets or services delivered to the vendor or reimbursement of selling costs incurred to promote the vendor’s product. The consideration is reflected as a reduction in selling, general and administrative expenses.
1 AIR MILES
® is a trademark of AIR MILES International Trading B.V. Used under license by LoyaltyOne, Inc.
PUBLIC ACCOUNTS, 2013-2014 2-63
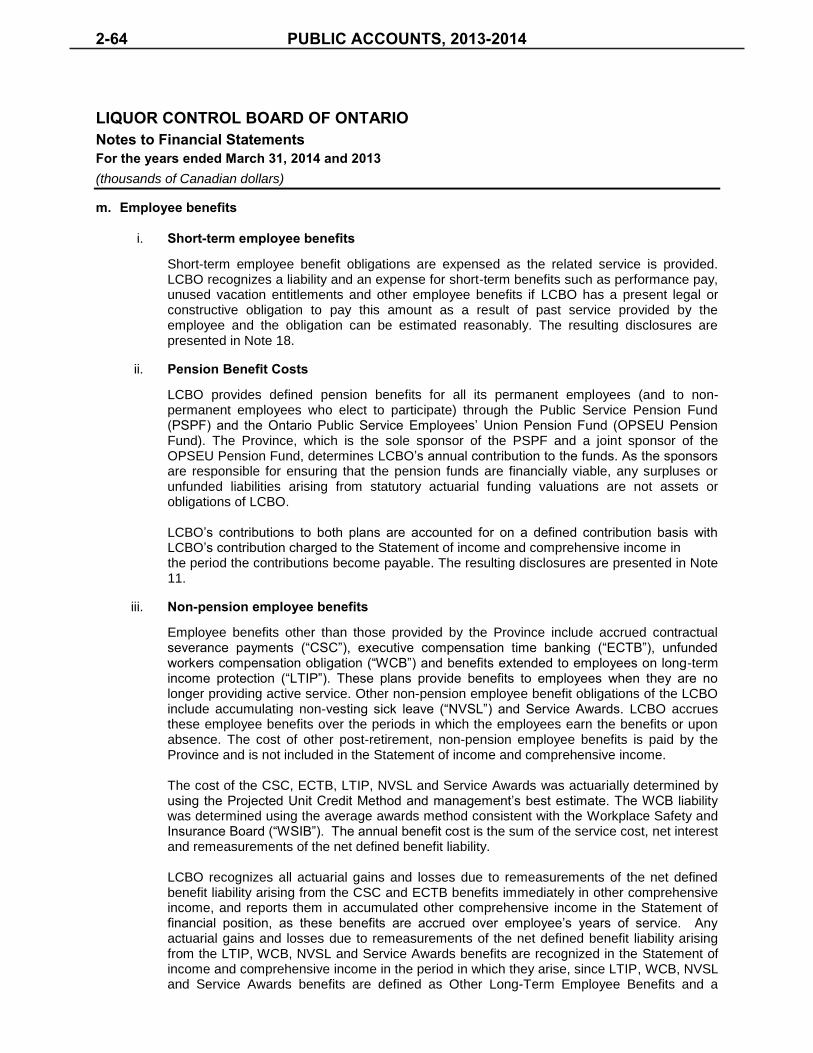
LIQUOR CONTROL BOARD OF ONTARIO Notes to Financial Statements For the years ended March 31, 2014 and 2013 (thousands of Canadian dollars)
m. Employee benefits
i. Short-term employee benefits
Short-term employee benefit obligations are expensed as the related service is provided. LCBO recognizes a liability and an expense for short-term benefits such as performance pay, unused vacation entitlements and other employee benefits if LCBO has a present legal or constructive obligation to pay this amount as a result of past service provided by the employee and the obligation can be estimated reasonably. The resulting disclosures are presented in Note 18.
ii. Pension Benefit Costs
LCBO provides defined pension benefits for all its permanent employees (and to non-permanent employees who elect to participate) through the Public Service Pension Fund (PSPF) and the Ontario Public Service Employees’ Union Pension Fund (OPSEU Pension Fund). The Province, which is the sole sponsor of the PSPF and a joint sponsor of the OPSEU Pension Fund, determines LCBO’s annual contribution to the funds. As the sponsors are responsible for ensuring that the pension funds are financially viable, any surpluses or unfunded liabilities arising from statutory actuarial funding valuations are not assets or obligations of LCBO. LCBO’s contributions to both plans are accounted for on a defined contribution basis with LCBO’s contribution charged to the Statement of income and comprehensive income in the period the contributions become payable. The resulting disclosures are presented in Note 11.
iii. Non-pension employee benefits
Employee benefits other than those provided by the Province include accrued contractual severance payments (“CSC”), executive compensation time banking (“ECTB”), unfunded workers compensation obligation (“WCB”) and benefits extended to employees on long-term income protection (“LTIP”). These plans provide benefits to employees when they are no longer providing active service. Other non-pension employee benefit obligations of the LCBO include accumulating non-vesting sick leave (“NVSL”) and Service Awards. LCBO accrues these employee benefits over the periods in which the employees earn the benefits or upon absence. The cost of other post-retirement, non-pension employee benefits is paid by the Province and is not included in the Statement of income and comprehensive income. The cost of the CSC, ECTB, LTIP, NVSL and Service Awards was actuarially determined by using the Projected Unit Credit Method and management’s best estimate. The WCB liability was determined using the average awards method consistent with the Workplace Safety and Insurance Board (“WSIB”). The annual benefit cost is the sum of the service cost, net interest and remeasurements of the net defined benefit liability.
LCBO recognizes all actuarial gains and losses due to remeasurements of the net defined benefit liability arising from the CSC and ECTB benefits immediately in other comprehensive income, and reports them in accumulated other comprehensive income in the Statement of financial position, as these benefits are accrued over employee’s years of service. Any actuarial gains and losses due to remeasurements of the net defined benefit liability arising from the LTIP, WCB, NVSL and Service Awards benefits are recognized in the Statement of income and comprehensive income in the period in which they arise, since LTIP, WCB, NVSL and Service Awards benefits are defined as Other Long-Term Employee Benefits and a
2-64 PUBLIC ACCOUNTS, 2013-2014

LIQUOR CONTROL BOARD OF ONTARIO Notes to Financial Statements For the years ended March 31, 2014 and 2013 (thousands of Canadian dollars)
simplified accounting methodology for these benefits does not recognize remeasurements in Other comprehensive income. The resulting disclosures are presented in Note 11.
n. Finance income
Finance income comprises interest income on funds invested. Interest income is recognized as it accrues in the Statement of income and comprehensive income, using the effective interest method. The resulting disclosures are presented in Note 19.
o. Finance costs
Finance costs consist of interest expense on the non-pension employee benefits obligation and financing charges on capital leases. The resulting disclosures are presented in Notes 11 and 19.
p. Leasing
Operating lease payments, including scheduled escalations, are recognized as an expense on a straight-line basis over the lease term. In the event that lease incentives are received to enter into operating leases, such incentives are recognized as a liability and amortized over the lease term. The aggregate benefit of incentives is recognized as a reduction of selling, general and administrative expenses on a straight-line basis. The resulting disclosures are presented in Note 9.
q. Foreign currencies
Transactions in currencies other than LCBO’s functional currency are recognized at the rates of
exchange prevailing at the dates of the transactions. At the end of each reporting period, items
denominated in foreign currencies, comprised of US bank accounts and liabilities, are translated at
the prevailing rates. Exchange gains and losses are recognized immediately in the Statement of
income and comprehensive income.
4. Cash and Cash Equivalents
Cash and cash equivalents include both cash on hand and in transit, and short term investments (such as term deposits and bankers’ acceptance), as follows:
March 31, 2014
March 31, 2013
Cash on hand and in transit 74,362 98,752
Term deposits
Bankers’ acceptances
60,000
152,015
-
218,671
286,377 317,423
5. Trade and Other Receivables
March 31,
2014 March 31,
2013 Trade and other receivables 43,120 41,962
Allowance for impairment (289) (441)
42,831 41,521
PUBLIC ACCOUNTS, 2013-2014 2-65

LIQUOR CONTROL BOARD OF ONTARIO Notes to Financial Statements For the years ended March 31, 2014 and 2013 (thousands of Canadian dollars)
Trade and other receivables arise primarily from sales billed to independent businesses, agents and other debtors. As at March 31, 2014, approximately 62% (2013 – 69%) of LCBO’s trade accounts receivable is due from one customer. Almost all of LCBO’s receivables are due within 30 days. The carrying amount of trade and other receivables is reduced through the use of an allowance for impairment at levels LCBO considered adequate to absorb credit losses. Subsequent recoveries of receivables previously provisioned are credited to the Statement of income and comprehensive income.
6. Inventories
All inventories are held for sale. The cost of inventories sold and recognized as a cost of sales during the year ended March 31, 2014 was $2,492 million (2013 - $2,434 million). There were no significant write-downs or reversal of previous write-downs to net realizable value during the year ended March 31, 2014 (2013 – nil).
7. Property, Plant & Equipment and Intangible Assets
Net book value of property, plant & equipment and intangible assets March 31,
2014 March 31,
2013 Land 12,596 12,647
Buildings 104,698 105,016
Furniture and equipment 31,911 27,661
Leasehold improvements 156,296 132,374
Computer equipment 23,129 15,533
Computer software 19,543 17,676
Construction/software in progress 16,262 29,303
364,435 340,210
2-66 PUBLIC ACCOUNTS, 2013-2014

LIQUOR CONTROL BOARD OF ONTARIO Notes to Financial Statements For the years ended March 31, 2014 and 2013 (thousands of Canadian dollars)
a. Property, plant & equipment and intangible assets
Property, plant & equipment and intangible assets continuity for the year ended March 31, 2014
Land Buildings
Furniture and
equipment Leasehold
improvements Computer
equipment Computer
software
Software/ Construction
in progress Total
Cost
Balance at April 1, 2013 12,647 384,716 108,989 381,009 41,295 65,462 29,303 1,023,421
Additions - 9,650 11,753 46,984 13,698 10,198 76,861 169,144
Transfers among categories - - - - - - (89,902) (89,902)
Net Additions - 9,650 11,753 46,984 13,698 10,198 (13,041) 79,242
Disposals/Retirements (51) (1,083) (1,487) - (2,892) (165) - (5,678)
Balance at March 31, 2014 12,596 393,283 119,255 427,993 52,101 75,495 16,262 1,096,985
Accumulated depreciation and impairment
Balance at April 1, 2013 - 279,700 81,328 248,635 25,762 47,786 - 683,211
Depreciation for the year - 9,630 7,407 23,062 6,467 8,331 - 54,897
Impairment losses - - - - - - - -
Transfers among categories - - - - - - - -
Disposals/Retirements - (745) (1,391) - (3,257) (165) - (5,558)
Balance at March 31, 2014 - 288,585 87,344 271,697 28,972 55,952 - 732,550
Net book value at March 31, 2014 12,596 104,698 31,911 156,296 23,129 19,543 16,262 364,435
PUBLIC ACCOUNTS, 2013-2014 2-67
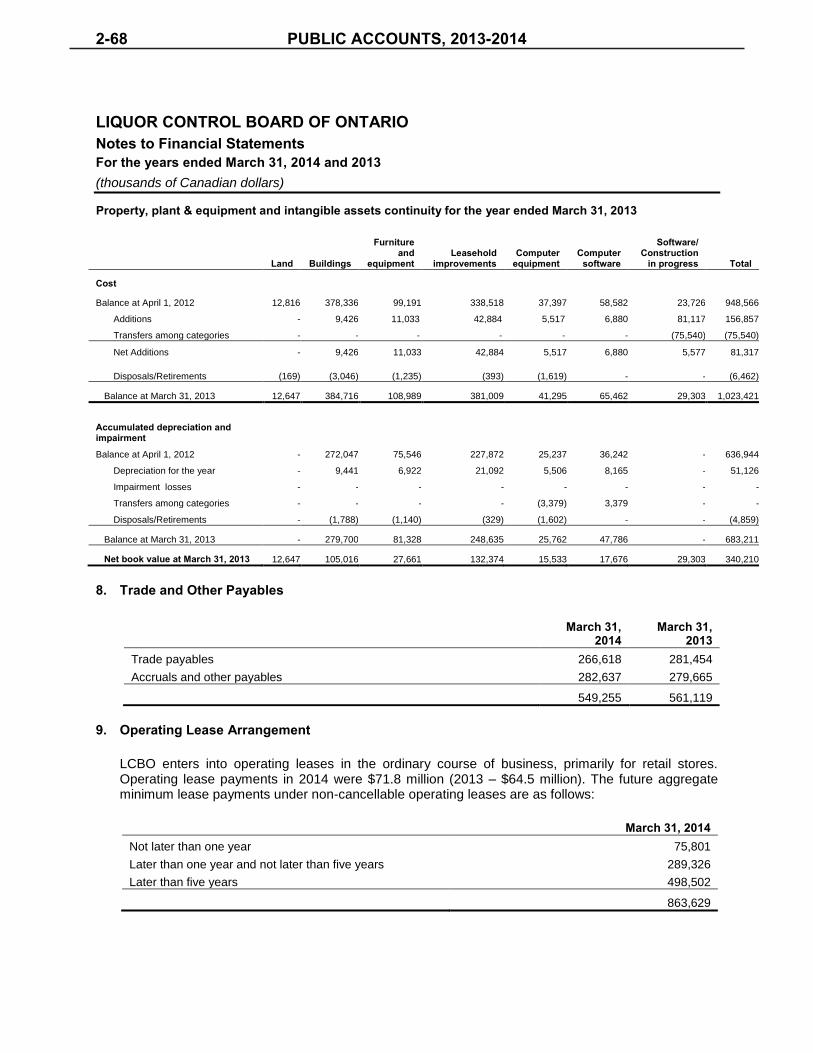
LIQUOR CONTROL BOARD OF ONTARIO Notes to Financial Statements For the years ended March 31, 2014 and 2013 (thousands of Canadian dollars)
Property, plant & equipment and intangible assets continuity for the year ended March 31, 2013
Land Buildings
Furniture and
equipment Leasehold
improvements Computer
equipment Computer
software
Software/ Construction
in progress Total
Cost
Balance at April 1, 2012 12,816 378,336 99,191 338,518 37,397 58,582 23,726 948,566
Additions - 9,426 11,033 42,884 5,517 6,880 81,117 156,857
Transfers among categories - - - - - - (75,540) (75,540)
Net Additions - 9,426 11,033 42,884 5,517 6,880 5,577 81,317
Disposals/Retirements (169) (3,046) (1,235) (393) (1,619) - - (6,462)
Balance at March 31, 2013 12,647 384,716 108,989 381,009 41,295 65,462 29,303 1,023,421
Accumulated depreciation and impairment
Balance at April 1, 2012 - 272,047 75,546 227,872 25,237 36,242 - 636,944
Depreciation for the year - 9,441 6,922 21,092 5,506 8,165 - 51,126
Impairment losses - - - - - - - -
Transfers among categories - - - - (3,379) 3,379 - -
Disposals/Retirements - (1,788) (1,140) (329) (1,602) - - (4,859)
Balance at March 31, 2013 - 279,700 81,328 248,635 25,762 47,786 - 683,211
Net book value at March 31, 2013 12,647 105,016 27,661 132,374 15,533 17,676 29,303 340,210
8. Trade and Other Payables
March 31,
2014 March 31,
2013 Trade payables 266,618 281,454
Accruals and other payables 282,637 279,665
549,255 561,119
9. Operating Lease Arrangement
LCBO enters into operating leases in the ordinary course of business, primarily for retail stores. Operating lease payments in 2014 were $71.8 million (2013 – $64.5 million). The future aggregate minimum lease payments under non-cancellable operating leases are as follows:
March 31, 2014
Not later than one year 75,801
Later than one year and not later than five years 289,326
Later than five years 498,502
863,629
2-68 PUBLIC ACCOUNTS, 2013-2014

LIQUOR CONTROL BOARD OF ONTARIO Notes to Financial Statements For the years ended March 31, 2014 and 2013 (thousands of Canadian dollars)
10. Provisions
The following table represents the changes to LCBO’s provisions: Provisions continuity for the year end March 31, 2014
Short term employee
benefits Other Total Balance at April 1, 2013 17,910 718 18,628
Charges recognized during the year 18,370 667 19,037
Utilization of provision (17,910) (718) (18,628)
Balance at March 31, 2014 18,370 667 19,037
Provisions continuity for the year end March 31, 2013
Short term employee
benefits Other Total Balance at April 1, 2012 17,305 345 17,650
Charges recognized during the year 17,910 718 18,628
Utilization of provision (17,305) (345) (17,650)
Balance at March 31, 2013 17,910 718 18,628
Disclosed as: March 31,
2014 March 31,
2013 Current 19,037 18,628
Non-current - -
19,037 18,628
The employee benefits provision includes vacation entitlements earned by employees and performance bonus payments expected to be paid in the following year. Other provisions include store closure provisions, which arise when LCBO agrees to restore a leased property to a specified condition at the completion of the lease period. These lease retirement provisions relate primarily to leases which expire over the next year. Other provisions also include a sales returns allowance for future returns on goods sold in the current period. The estimate has been made on the basis of historical sales returns trends.
PUBLIC ACCOUNTS, 2013-2014 2-69
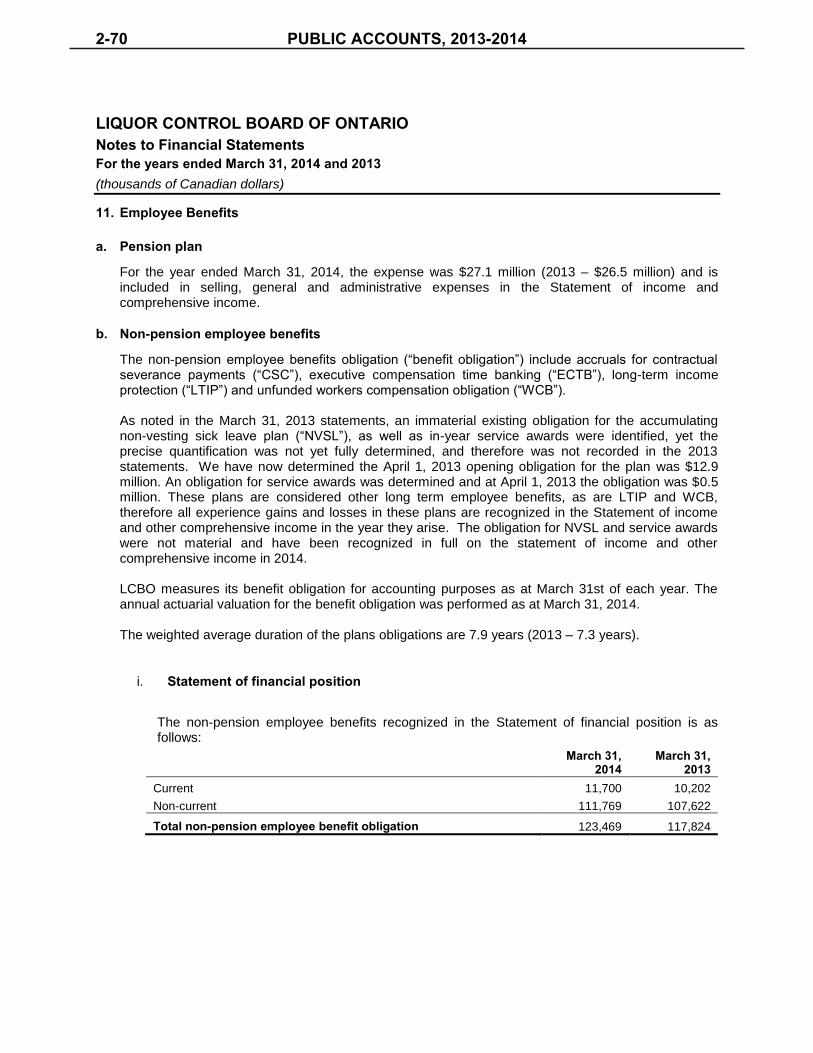
LIQUOR CONTROL BOARD OF ONTARIO Notes to Financial Statements For the years ended March 31, 2014 and 2013 (thousands of Canadian dollars)
11. Employee Benefits
a. Pension plan
For the year ended March 31, 2014, the expense was $27.1 million (2013 – $26.5 million) and is included in selling, general and administrative expenses in the Statement of income and comprehensive income.
b. Non-pension employee benefits
The non-pension employee benefits obligation (“benefit obligation”) include accruals for contractual severance payments (“CSC”), executive compensation time banking (“ECTB”), long-term income protection (“LTIP”) and unfunded workers compensation obligation (“WCB”). As noted in the March 31, 2013 statements, an immaterial existing obligation for the accumulating non-vesting sick leave plan (“NVSL”), as well as in-year service awards were identified, yet the precise quantification was not yet fully determined, and therefore was not recorded in the 2013 statements. We have now determined the April 1, 2013 opening obligation for the plan was $12.9 million. An obligation for service awards was determined and at April 1, 2013 the obligation was $0.5 million. These plans are considered other long term employee benefits, as are LTIP and WCB, therefore all experience gains and losses in these plans are recognized in the Statement of income and other comprehensive income in the year they arise. The obligation for NVSL and service awards were not material and have been recognized in full on the statement of income and other comprehensive income in 2014. LCBO measures its benefit obligation for accounting purposes as at March 31st of each year. The annual actuarial valuation for the benefit obligation was performed as at March 31, 2014. The weighted average duration of the plans obligations are 7.9 years (2013 – 7.3 years).
i. Statement of financial position
The non-pension employee benefits recognized in the Statement of financial position is as follows:
March 31, 2014
March 31, 2013
Current 11,700 10,202
Non-current 111,769 107,622
Total non-pension employee benefit obligation 123,469 117,824
2-70 PUBLIC ACCOUNTS, 2013-2014

LIQUOR CONTROL BOARD OF ONTARIO Notes to Financial Statements For the years ended March 31, 2014 and 2013 (thousands of Canadian dollars)
ii. Statement of income and comprehensive income
The non-pension employee benefit costs recognized in the Statement of income and comprehensive income is as follows:
March 31, 2014
March 31, 2013
Current service cost 12,660 9,008
Past service cost – NVSL and Service Awards
Actuarial (gains)/losses on non-vesting benefits
13,440
(11,078)
-
10,115
Total costs included in expenses 15,022 19,123
Interest costs 4,702 3,824
Total costs included in finance costs 4,702 3,824
Total non-pension employee benefit expenses 19,724 22,947
iii. Other comprehensive income
The non-pension employee benefits recognized in the other comprehensive income are as follows:
March 31, 2014
March 31, 2013
Opening cumulative actuarial losses recognized (2,676) (5,731)
Net actuarial gains recognized 911 3,055
Closing cumulative actuarial losses recognized (1,765) (2,676)
iv. Movement in the obligation
The movements in the non-pension employee benefit obligation are as follows:
March 31, 2014
March 31, 2013
Opening benefit obligation 117,824 111,595
Prior obligation – NVSL and Service Awards
Current service cost
13,440
12,660
-
9,008
Interest on obligation 4,702 3,824
Actuarial losses from changes in demographic assumptions
Actuarial (gains)/losses from changes in financial assumptions
337
(2,616)
4
1,277
Actuarial (gains)/losses from other
Benefits paid
(9,710)
(13,168)
5,779
(13,663)
Closing benefit obligation 123,469 117,824
PUBLIC ACCOUNTS, 2013-2014 2-71

LIQUOR CONTROL BOARD OF ONTARIO Notes to Financial Statements For the years ended March 31, 2014 and 2013 (thousands of Canadian dollars)
v. Significant assumptions
The significant assumptions used are as follows:
CSC, ECTB, NVSL & Service Awards WCB LTIP
2014 2013 2014 2013 2014 2013
Discount rate to determine the benefit obligation
3.80% 3.50% 3.80% 3.50% 3.80% 3.50%
Discount rate to determine the benefit cost
3.50% 3.50% 3.50% 3.50% 3.50% 3.50%
Salary rate increase
1.00% for 1 year
and 3.00%
thereafter
1.00% for 2 years
and 3.00%
thereafter
n/a n/a 2.00% 2.00%
Benefit index n/a n/a 2.5% 2.5% n/a n/a
Health cost rate increase n/a n/a
7.20% per annum
reducing to 4.50% in 2023
7.50% per annum
reducing to 4.50% in 2023
7.20% per annum
reducing to 4.50% in 2023
7.50% per annum
reducing to 4.50% in 2023
vi. Sensitivity analysis
The sensitivity of the non-pension employee benefit obligation to changes in assumptions is set out below. Impact on total non-pension employee benefit obligation Change in
assumption Increase in
assumption Decrease in assumption
Discount rate 0.50% (4,005) 4,274
Health care trend rate 0.50% 2,254 (2,038)
12. Contingent Liabilities
LCBO is involved in various legal actions arising out of the ordinary course and conduct of business. The outcome and ultimate disposition of these actions are not determinable at this time; however, the ultimate disposition is not expected to have a material effect on the financial statements. Accordingly, no provision for these actions is reflected in the financial statements. Settlements, if any, concerning these contingent liabilities will be accounted for in the period in which the settlement occurs.
13. Financial Risk Management
The nature of LCBO’s operations means that it is exposed to a variety of financial risks, which includes market risk (primarily currency risk), credit risk and liquidity risk. LCBO’s risk management approach is to minimize the potential adverse effects from these risks on its financial performance. Financial risk management is carried out by LCBO in accordance with its investment and foreign exchange risk management policy. LCBO identifies, evaluates and mitigates financial risks.
2-72 PUBLIC ACCOUNTS, 2013-2014

LIQUOR CONTROL BOARD OF ONTARIO Notes to Financial Statements For the years ended March 31, 2014 and 2013 (thousands of Canadian dollars)
a. Credit Risk
Credit risk arises from cash and cash equivalents, derivative financial instruments, and outstanding accounts receivable. LCBO minimizes credit risk associated with the various instruments as follows:
Derivative financial instruments and cash and cash equivalents are placed only with major Canadian chartered banks and Canadian subsidiaries of major banks. At March 31, 2014, all derivative instruments and cash and cash equivalents were held with major chartered banks and Canadian subsidiaries of major foreign banks.
Trade and others receivables arise primarily from sales invoiced to independent businesses, agents and other debtors. LCBO does not consider its exposure to credit risk associated with trade and other receivables to be material. As at March 31, 2014, approximately 62% (2013 – 69%) of LCBO’s receivable is due from one customer whose account is in good standing.
Where there is objective evidence that the total balance of an accounts receivable is unlikely to be recovered, an allowance for impairment is made to reduce the carrying amount of the accounts receivable to the recoverable amount. See Note 5 for additional disclosures.
b. Liquidity Risk
Liquidity risk is the risk that LCBO may not have cash available to satisfy financial liabilities as they fall due. LCBO seeks to limit its liquidity risk by actively monitoring and managing its available cash reserves to ensure that it is able to satisfy financial liabilities as they fall due. Cash that is surplus to working capital requirements is managed by LCBO and invested in federal/provincial treasury bills, bankers’ acceptances and bank term deposits, choosing maturities which are aligned with expected cash needs.
c. Market Risk
Market risk is the risk that the fair value or future cash flows of a financial instrument will fluctuate because of changes in market price. Market risk comprises of three types of risk: currency risk, interest rate risk and other price risk. Currently, LCBO is exposed only to currency risk.
d. Currency Risk
LCBO is exposed to currency risk with respect to future inventory purchases denominated in currencies other than the Canadian dollar, primarily US dollars and Euros. LCBO seeks to limit its exposure to currency risk by entering into Canadian dollar contracts on a majority of its inventory purchases. LCBO also limits its exposure to movements in exchange rates by acquiring foreign exchange contracts, which are commitments to purchase foreign currencies at a specified date in the future at a fixed rate.
In LCBO’s assessment, a significant strengthening or weakening of the Canadian dollar against the US dollar or Euro, with all other variables held constant, would not have a significant impact on net income.
The overall effects of changes in exchange rates was a foreign exchange loss of $0.6 million in 2014 (2013 - $3.4 million gain).
PUBLIC ACCOUNTS, 2013-2014 2-73

LIQUOR CONTROL BOARD OF ONTARIO Notes to Financial Statements For the years ended March 31, 2014 and 2013 (thousands of Canadian dollars)
14. Financial Instruments
a. Foreign Exchange Contracts
LCBO uses foreign exchange contracts to manage foreign exchange risk on the purchase of inventory in a currency other than the Canadian dollar. These derivative financial instruments are measured at fair value. As at March 31, 2014, LCBO has no foreign exchange contracts that require separate accounting and disclosure (2013 - $3.4 million).
b. Embedded Derivative
Embedded derivatives arise from the purchase of inventory in a currency other than Canadian dollar or that of the supplier’s domestic or local currency. For the year ended March 31, 2014, LCBO reviewed these contracts and determined that it does not have significant embedded derivatives or gains or losses resulting from these derivatives that require separate accounting and disclosure (2013 - $nil).
15. Capital Management
LCBO is a corporation without share capital and has no long-term debt. Its definition of capital is cash and cash equivalents and retained earnings. LCBO’s main objectives when managing its capital are:
to ensure sufficient liquidity in support of its financial obligations to achieve its business plans;
to maintain healthy liquidity reserves and access to capital as outlined in its investment and foreign exchange policies;
to ensure that cash management decisions are based upon the preservation of capital as a primary objective; and
to safeguard LCBO’s ability to remain as a self-sufficient going concern entity in order to provide continuous dividends to the Province.
As at March 31, 2014 LCBO met these objectives. In managing cash and cash equivalents, LCBO maintains balances that are:
sufficient to meet its accounts payable obligations due within the next 45-60 days;
sufficient to meet the timing of dividend transfers; and
sufficient to meet approved capital expenditures throughout the current period.
LCBO is not subject to any externally imposed capital requirements.
16. Revenue
Virtually all revenue is from the sale of goods.
2-74 PUBLIC ACCOUNTS, 2013-2014

LIQUOR CONTROL BOARD OF ONTARIO Notes to Financial Statements For the years ended March 31, 2014 and 2013 (thousands of Canadian dollars)
17. Selling, General and Administrative Expenses by Nature
The components of selling, general and administration expenses include the following:
March 31, 2014
March 31, 2013
Employee costs (Note 18) 446,244 435,413
Occupancy costs 157,429 141,210
Depreciation and amortization 54,897 51,126
Debit/credit charges 34,823 32,375
Environmental initiatives 37,109 36,091
Other 85,629 84,203
816,131 780,418
18. Employee Costs
Employee costs for LCBO for the year ended amounts to the following:
March 31,
2014 March 31,
2013 Salaries & wages 356,136 340,800
Short-term employee benefits 90,108 94,613
446,244 435,413
19. Finance Income and Finance Costs
Finance income and costs recognized by LCBO for the year ended amounts to the following:
March 31,
2014 March 31,
2013
Finance income
Interest earned 1,993 1,344
Total finance income 1,993 1,344
Finance costs
Interest on non-pension employee benefits 4,702 3,824
Financing charges on capital leases 6 -
Total finance costs 4,708 3,824
20. Related Parties
Key management personnel are those individuals having authority and responsibility for planning, directing and controlling the activities of LCBO. Key management personnel include members of the Board of Directors, President and Chief Executive Officer, Chief Financial Officer and the top senior officers. The Board members receive a per diem remuneration for attending regularly scheduled meetings and for serving on either the Audit Committee or the Governance and Compensation Committee.
PUBLIC ACCOUNTS, 2013-2014 2-75

LIQUOR CONTROL BOARD OF ONTARIO Notes to Financial Statements For the years ended March 31, 2014 and 2013 (thousands of Canadian dollars)
Key management personnel compensation, including director’s fees comprise of:
March 31, 2014
March 31, 2013
Salaries and short-term employee benefits 4,077 3,839
Post employment benefits 247 237
Other long term benefits 69 68
Termination benefits 112 -
4,505 4,144
21. Waste Diversion
LCBO is responsible under the Waste Diversion Act, 2002 to pay municipalities through Stewardship Ontario, an industry funded waste diversion organization for costs associated with container waste and non-container waste recycled through municipal Blue Box systems. For the year ended March 31, 2014, LCBO contributed $1.7 million (2013 - $1.5 million) and these expenditures are included in selling, general and administrative expenses in the Statement of income and comprehensive income.
22. Ontario Deposit Return Program
On November 6, 2006, the Province entered into an agreement with Brewers Retail Inc. for management of a province-wide container deposit return program (“the program”) on wine, liquor and non-common beer containers sold through LCBO and Winery, on-site Microbrewery and Distillery Retail Stores. Brewers Retail Inc. was appointed the exclusive service provider for a period of five years effective February 5, 2007. Effective, February 6, 2012, the Province entered into another agreement with Brewers Retail Inc. for management of the program, thereby extending the program for another period of five years. Under the program, LCBO collects a deposit of 10 or 20 cents on wine, liquor and most beer containers. LCBO reimburses Brewers Retail Inc. for deposits it pays to customers who return containers to locations it operates, plus a service fee. For the year ended March 31, 2014, LCBO collected $61.4 million (2013 – $60.6 million) of deposits on containers and was invoiced $48.1 million (2013 - $48.0 million) for refunds to the customers. The net amounts are included in trade and other payables in the Statement of financial position. In connection with the program, expenditures related to service fees paid to Brewers Retail Inc. for the year ended March 31, 2014, amounted to $35.4 million (2013 - $34.6 million), inclusive of $4.1 million (2013 – $4.0 million) of harmonized sales tax which is unrecoverable by LCBO, but is recoverable by the Province. These expenditures are included in selling, general and administrative expenses in the Statement of income and comprehensive income.
LCBO’s experience indicates that not all container deposits are redeemed. Based upon its redemption data and research of industry experience, part of the container deposits collected would not be redeemed. During the initial three years of the program, a conservative redemption rate was used for determining revenue on unredeemed container deposits based on the limited historical information available. Since inception of the program in 2007, LCBO has now established an estimated program to-date redemption rate of 80% and determined that the likelihood of redemption from the initial three years of the program to be remote. For the year ended March 31, 2014,
2-76 PUBLIC ACCOUNTS, 2013-2014
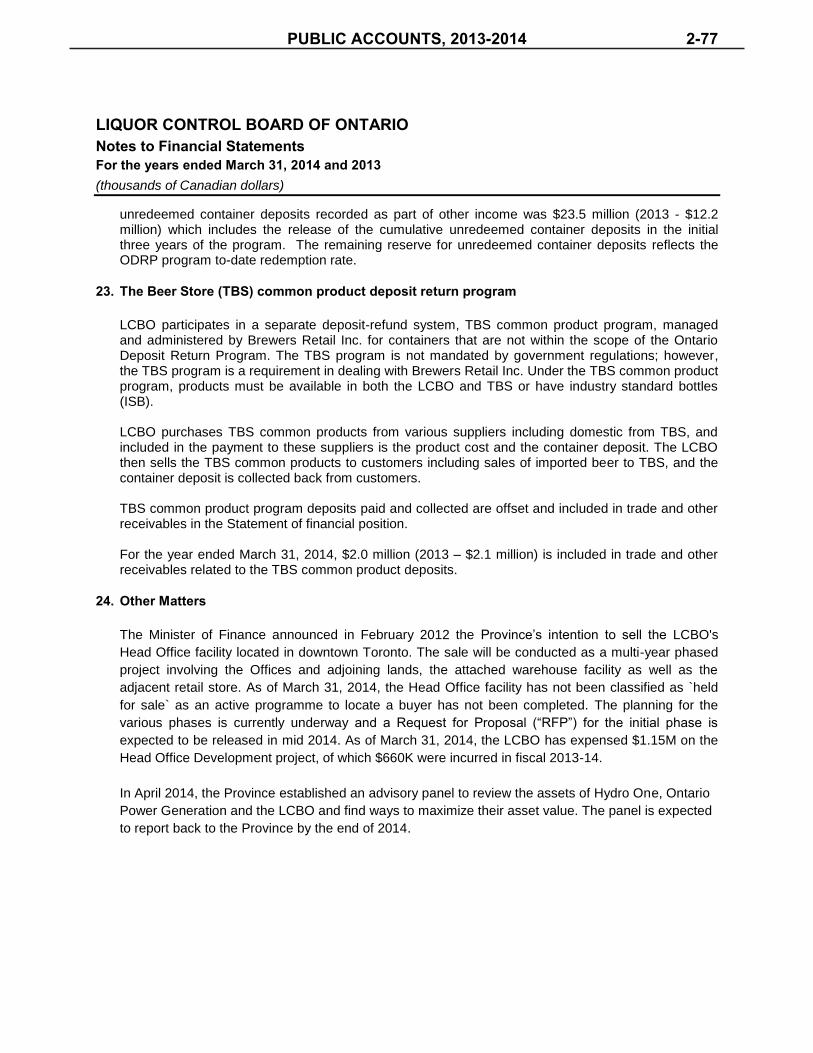
LIQUOR CONTROL BOARD OF ONTARIO Notes to Financial Statements For the years ended March 31, 2014 and 2013 (thousands of Canadian dollars)
unredeemed container deposits recorded as part of other income was $23.5 million (2013 - $12.2 million) which includes the release of the cumulative unredeemed container deposits in the initial three years of the program. The remaining reserve for unredeemed container deposits reflects the ODRP program to-date redemption rate.
23. The Beer Store (TBS) common product deposit return program
LCBO participates in a separate deposit-refund system, TBS common product program, managed and administered by Brewers Retail Inc. for containers that are not within the scope of the Ontario Deposit Return Program. The TBS program is not mandated by government regulations; however, the TBS program is a requirement in dealing with Brewers Retail Inc. Under the TBS common product program, products must be available in both the LCBO and TBS or have industry standard bottles (ISB). LCBO purchases TBS common products from various suppliers including domestic from TBS, and included in the payment to these suppliers is the product cost and the container deposit. The LCBO then sells the TBS common products to customers including sales of imported beer to TBS, and the container deposit is collected back from customers. TBS common product program deposits paid and collected are offset and included in trade and other receivables in the Statement of financial position. For the year ended March 31, 2014, $2.0 million (2013 – $2.1 million) is included in trade and other receivables related to the TBS common product deposits.
24. Other Matters
The Minister of Finance announced in February 2012 the Province’s intention to sell the LCBO's
Head Office facility located in downtown Toronto. The sale will be conducted as a multi-year phased
project involving the Offices and adjoining lands, the attached warehouse facility as well as the
adjacent retail store. As of March 31, 2014, the Head Office facility has not been classified as `held
for sale` as an active programme to locate a buyer has not been completed. The planning for the
various phases is currently underway and a Request for Proposal (“RFP”) for the initial phase is
expected to be released in mid 2014. As of March 31, 2014, the LCBO has expensed $1.15M on the
Head Office Development project, of which $660K were incurred in fiscal 2013-14.
In April 2014, the Province established an advisory panel to review the assets of Hydro One, Ontario
Power Generation and the LCBO and find ways to maximize their asset value. The panel is expected
to report back to the Province by the end of 2014.
PUBLIC ACCOUNTS, 2013-2014 2-77


ONTARIO LOTTERY AND GAMING CORPORATION
MANAGEMENT’S RESPONSIBILITY FOR ANNUAL REPORTING The accompanying consolidated financial statements of the Ontario Lottery and Gaming Corporation and all information in
this annual report are the responsibility of management and have been approved by the Board of Directors.
The consolidated financial statements have been prepared by management in accordance with International Financial
Reporting Standards. Where required, management has made informed judgements and estimates in accordance with
International Financial Reporting Standards.
The Board of Directors oversees management’s responsibilities for financial reporting through its Audit and Risk
Management Committee, which is composed entirely of directors who are neither officers nor employees of the
Corporation. The Audit and Risk Management Committee reviews the financial statements and recommends them to the
Board for approval. This Committee meets periodically with management, internal audit and the external auditors.
To discharge its responsibility, management maintains an appropriate system of internal control to provide reasonable
assurance that relevant and reliable consolidated financial statements are produced and that the Corporation’s assets are
properly safeguarded. The Corporation maintains a staff of internal auditors whose functions include reviewing internal
controls and their applications, on an ongoing basis. The reports prepared by the internal auditors are reviewed by the
Committee. The VP, Audit Services, responsible for Internal Audit, reports directly to the Audit and Risk Management
Committee.
KPMG LLP, the independent auditor appointed by the Board of Directors upon the recommendation of the Audit and Risk
Management Committee, has examined the consolidated financial statements. Their report outlines the scope of their
examination and their opinion on the consolidated financial statements. The independent auditor has full and unrestricted
access to the Committee.
Tom Marinelli Preet Dhindsa Acting President and Chief Executive Officer Executive Vice President, Chief Administrative Officer & Chief Financial Officer June 26, 2014
PUBLIC ACCOUNTS, 2013-2014 2-79

KPMG LLP is a Canadian limited liability partnership and a member of the KPMG network of independent member firms affiliated with KPMG International Cooperative (“KPMG International”), a Swiss entity. KPMG Canada provides services to KPMG LLP
KPMG LLP 4100 Yonge Street Suite 200 North York ON M2P 2H3
Telephone (416) 228-7000 Fax (416) 228-7123 www.kpmg.ca
INDEPENDENT AUDITORS’ REPORT
To the Board of Directors of Ontario Lottery and Gaming Corporation and to the Minister of Finance of
Ontario:
We have audited the accompanying consolidated financial statements of Ontario Lottery and Gaming
Corporation, which comprise the consolidated statements of financial position as at March 31, 2014 and
March 31, 2013, the consolidated statements of comprehensive income, changes in equity and cash flows
for the years ended March 31, 2014 and March 31, 2013, and notes, comprising a summary of significant
accounting policies and other explanatory information.
Management’s responsibility for the consolidated financial statements
Management is responsible for the preparation and fair presentation of these consolidated financial
statements in accordance with International Financial Reporting Standards, and for such internal control as
management determines is necessary to enable the preparation of consolidated financial statements that are
free from material misstatement, whether due to fraud or error.
Auditors’ responsibility
Our responsibility is to express an opinion on these consolidated financial statements based on our audits.
We conducted our audits in accordance with Canadian generally accepted auditing standards. Those
standards require that we comply with ethical requirements and plan and perform the audit to obtain
reasonable assurance about whether the consolidated financial statements are free from material
misstatement.
An audit involves performing procedures to obtain audit evidence about the amounts and disclosures in the
consolidated financial statements. The procedures selected depend on our judgment, including the
assessment of the risks of material misstatement of the consolidated financial statements, whether due to
fraud or error. In making those risk assessments, we consider internal control relevant to the entity’s
preparation and fair presentation of the consolidated financial statements in order to design audit
procedures that are appropriate in the circumstances, but not for the purpose of expressing an opinion on
the effectiveness of the entity’s internal control. An audit also includes evaluating the appropriateness of
accounting policies used and the reasonableness of accounting estimates made by management, as well as
evaluating the overall presentation of the consolidated financial statements.
We believe that the audit evidence we have obtained in our audits is sufficient and appropriate to provide a
basis for our audit opinion.
2-80 PUBLIC ACCOUNTS, 2013-2014

Page 2
Opinion
In our opinion, the consolidated financial statements present fairly, in all material respects, the consolidated
financial position of Ontario Lottery and Gaming Corporation as at March 31, 2014 and March 31, 2013,
and its consolidated financial performance and its consolidated cash flows for the years ended March 31,
2014 and March 31, 2013 in accordance with International Financial Reporting Standards.
Chartered Professional Accountants, Licensed Public Accountants Toronto, Ontario June 26, 2014
PUBLIC ACCOUNTS, 2013-2014 2-81
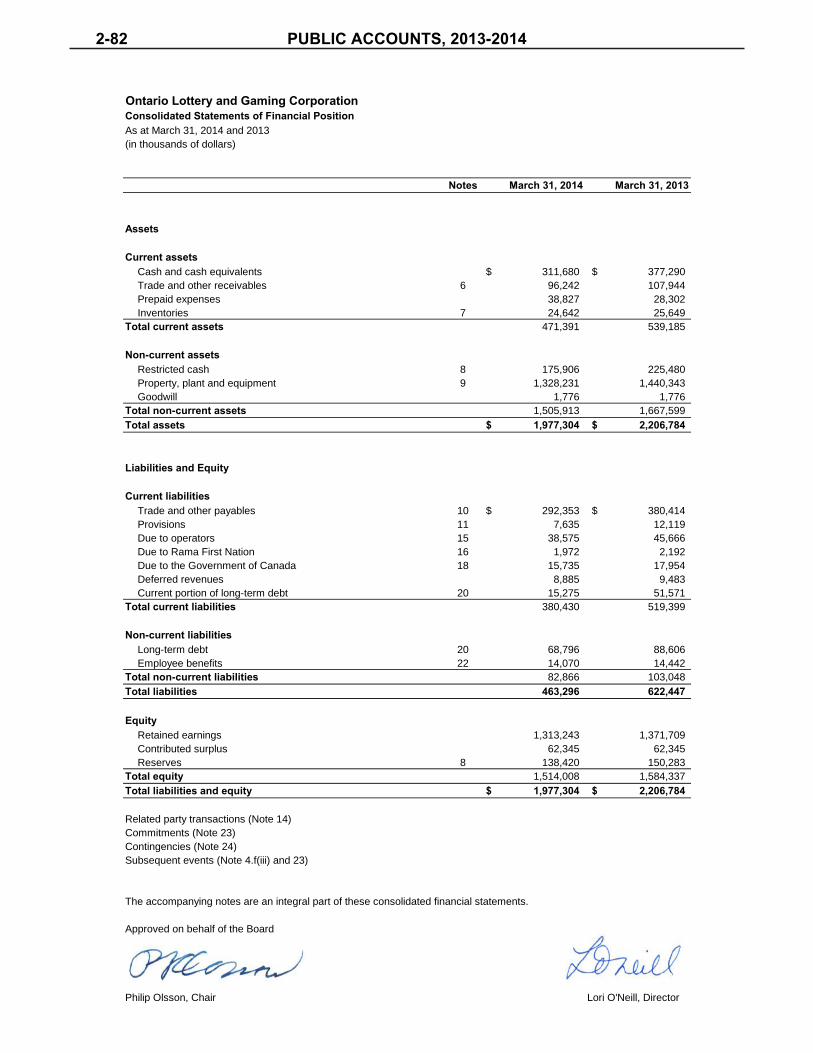
Ontario Lottery and Gaming CorporationConsolidated Statements of Financial Position
(in thousands of dollars)
Notes March 31, 2014 March 31, 2013
Assets
Current assetsCash and cash equivalents $ 311,680 $ 377,290
Trade and other receivables 6 96,242 107,944
Prepaid expenses 38,827 28,302
Inventories 7 24,642 25,649
Total current assets 471,391 539,185
Non-current assetsRestricted cash 8 175,906 225,480
Property, plant and equipment 9 1,328,231 1,440,343
Goodwill 1,776 1,776
Total non-current assets 1,505,913 1,667,599
Total assets $ 1,977,304 $ 2,206,784
Liabilities and Equity
Current liabilitiesTrade and other payables 10 $ 292,353 $ 380,414
Provisions 11 7,635 12,119
Due to operators 15 38,575 45,666
Due to Rama First Nation 16 1,972 2,192
Due to the Government of Canada 18 15,735 17,954
Deferred revenues 8,885 9,483
Current portion of long-term debt 20 15,275 51,571
Total current liabilities 380,430 519,399
Non-current liabilitiesLong-term debt 20 68,796 88,606
Employee benefits 22 14,070 14,442
Total non-current liabilities 82,866 103,048
Total liabilities 463,296 622,447
EquityRetained earnings 1,313,243 1,371,709
Contributed surplus 62,345 62,345
Reserves 8 138,420 150,283
Total equity 1,514,008 1,584,337
Total liabilities and equity $ 1,977,304 $ 2,206,784
Related party transactions (Note 14)
Commitments (Note 23)
Contingencies (Note 24)
Subsequent events (Note 4.f(iii) and 23)
The accompanying notes are an integral part of these consolidated financial statements.
Approved on behalf of the Board
Philip Olsson, Chair Lori O'Neill, Director
As at March 31, 2014 and 2013
2-82 PUBLIC ACCOUNTS, 2013-2014

Ontario Lottery and Gaming CorporationConsolidated Statements of Comprehensive IncomeFor the years ended March 31, 2014 and 2013
(in thousands of dollars)
Notes March 31, 2014 March 31, 2013
RevenuesLottery $ 3,387,571 $ 3,287,469
Charitable gaming 73,817 39,876
Resort casinos 1,244,946 1,297,145
OLG slots and casinos 1,964,044 2,008,081
6,670,378 6,632,571
Expenses
Lottery 2,502,832 2,405,580
Charitable gaming 105,042 61,816
Resort casinos 1,369,182 1,373,033
OLG slots and casinos 954,332 1,197,492
4,931,388 5,037,921
Income before the undernoted 1,738,990 1,594,650
Other income 45,389 39,984
Finance income 13 3,109 3,533
Finance costs 13 -5,866 -6,446
Foreign exchange gain 21.e 6,757 7,896
Other charges 19 -27,429 -80,682
Net income and comprehensive income $ 1,760,950 $ 1,558,935
Segmented information (Note 25)
The accompanying notes are an integral part of these consolidated financial statements.
PUBLIC ACCOUNTS, 2013-2014 2-83

Ontario Lottery and Gaming CorporationConsolidated Statements of Changes in EquityFor the years ended March 31, 2014 and 2013
(in thousands of dollars)
Retained earnings
Contributed surplus
Capital renewals reserves
Operating reserves
Severance reserves Total
Balance at March 31, 2012 $ 1,483,174 $ 62,345 21,984 $ 57,829 $ 46,270 $ 1,671,602
Net income and comprehensive income 1,558,935 - - - - 1,558,935
Contributions or distributions
Transfers from reserves (24,200) - 28,924 (3,242) (1,482) -
Payments to the Province of Ontario (1,646,200) - - - - (1,646,200)
Balance at March 31, 2013 $ 1,371,709 $ 62,345 50,908 $ 54,587 $ 44,788 $ 1,584,337
Net income and comprehensive income 1,760,950 - - - - 1,760,950
Contributions or distributions
Transfers from reserves 11,863 - (11,477) (890) 504 -
Payments to the Province of Ontario (1,831,279) - - - - (1,831,279)
Balance at March 31, 2014 $ 1,313,243 $ 62,345 39,431 $ 53,697 $ 45,292 $ 1,514,008
The accompanying notes are an integral part of these consolidated financial statements.
2-84 PUBLIC ACCOUNTS, 2013-2014

Ontario Lottery and Gaming CorporationConsolidated Statements of Cash FlowsFor the years ended March 31, 2014 and 2013
(in thousands of dollars)
Notes March 31, 2014 March 31, 2013
Cash flows from operating activitiesNet income and comprehensive income $ 1,760,950 $ 1,558,935
Adjustments to reconcile profit for the period to net cash from
operating activities:
Amortization 9 187,230 247,449
Loss on disposal of property, plant and equipment 9 2,502 2,003
Settlement of loans receivable - 16,991
Net finance costs 2,757 2,913
Impairment loss on property, plant and equipment 9 27,429 -
Other long-term employee benefits 22.c (372) (7,125)
Operating cash flows before change in non-cash working capital 1,980,496 1,821,166
Change in non-cash working capital items:
Decrease (increase) in trade and other receivables 11,702 (30,176)
(Increase) decrease in prepaid expenses (10,525) 5,809
Decrease in inventories 1,007 1,028
(Decrease) increase in trade and other payables (82,694) 75,925
(Decrease) in provisions (4,484) (43,350)
(Decrease) increase in due to operators (7,091) 7,556
(Decrease) increase in due to Rama First Nation (220) 599
(Decrease) increase in due to the Government of Canada (2,219) 2,837
(Decrease) in deferred revenues (598) (2,940)
Net cash from operating activities 1,885,374 1,838,454
Cash flows used in investing activitiesInterest received 3,109 3,533
Issuance of loans receivable - (1,554)
Proceeds received on loans receivable - 4,742
Capital expenditures (103,288) (108,234)
Proceeds on disposal of property, plant and equipment 910 1,121
Decrease (increase) in restricted cash 49,574 (27,408)
Net cash used in investing activities (49,695) (127,800)
Cash flows used in financing activitiesInterest paid (5,866) (6,446)
Increase in long-term debt - 19,215
Repayments of long-term debt (64,144) (59,826)
Payments to the Province of Ontario (1,831,279) (1,646,200)
Net cash used in financing activities (1,901,289) (1,693,257)
(Decrease) increase in cash and cash equivalents (65,610) 17,397
Cash and cash equivalents, beginning of year 377,290 359,893
Cash and cash equivalents, end of year $ 311,680 $ 377,290
Supplemental disclosure relating to non-cash financing and
investing activities:
Acquisition of property, plant and equipment through finance leases $ 8,038 $ 5,046
Acquisition of property, plant and equipment not yet paid for $ 3,376 $ 8,743
The accompanying notes are an integral part of these consolidated financial statements.
PUBLIC ACCOUNTS, 2013-2014 2-85

Ontario Lottery and Gaming Corporation Notes to the Consolidated Financial Statements Years ended March 31, 2014 and 2013 (tabular amounts in thousands of Canadian dollars)
1. Reporting entity
The Ontario Lottery and Gaming Corporation (“OLG” or “the Corporation”) was established without share capital on April 1, 2000 pursuant to the Ontario Lottery and Gaming Corporation Act, 1999. The Corporation is classified as an Operational Enterprise Agency of the Ontario government and is responsible for conducting and managing lottery games, charitable gaming, five Casinos and the Great Blue Heron Slot Machine Facility, 14 slot operations at racetracks and four Resort Casinos (Caesars Windsor, Casino Rama, Casino Niagara and Niagara Fallsview Casino Resort (Fallsview)) in the Province of Ontario.
The Corporation has entered into operating agreements with Caesars Entertainment Windsor Limited (“CEWL”), which superseded Windsor Casino Limited on June 6, 2012, CHC Casinos Canada Limited, Falls Management Group, L.P. and Great Blue Heron Gaming Company for the operation of Caesars Windsor, Casino Rama, Casino Niagara and Niagara Fallsview Casino Resort (Fallsview) and the Great Blue Heron Slot Machine Facility, respectively.
The Corporation’s head office and corporate office, respectively, are located at:
70 Foster Drive, Suite 800, Sault Ste. Marie, Ontario, P6A 6V2
4120 Yonge Street, Suite 500, Toronto, Ontario, M2P 2B8
These Consolidated Financial Statements were authorized for issue by the Board of Directors of the Corporation on June 26, 2014.
2. Modernizing Lottery and Gaming in Ontario
On March 12, 2012, then Finance Minister Dwight Duncan accepted a report from OLG entitled Modernizing Lottery and Gaming in Ontario: Strategic Business Review / Advice to Government. This report was the culmination of an evidence-based strategic business review that examined the state of the Corporation’s current operations in the context of a changing market. The report included three recommendations for how the Corporation could achieve greater sustainability and increase Net Profit to the Province (Note 25.a):
1) Become more customer-focused;
2) Expand regulated private sector delivery of lottery and gaming; and
3) Renew OLG’s role in oversight of lottery and gaming.
The Government of Ontario gave the Corporation approval to move forward with all three of these recommendations, and the Corporation embarked on a series of initiatives to support the modernization of its operations. These initiatives include:
The leveraging of private sector expertise in the day-to-day operation of both the lottery network and gaming sites;
The introduction of a new, streamlined Customer Management System and business-wide Gaming Management System;
The launch of a new Internet Gaming business line; and
The revitalization of charitable gaming through the introduction of new electronic gaming at bingo halls.
In addition, as a result of the Government of Ontario’s announcement to end the Slots at Racetracks Program, and in order to continue to conduct and manage its slot machine operations beyond the March 31, 2013 expiration of the program, the Corporation entered into lease agreements or agreements in principle with all 14 of the racetrack facilities.
2-86 PUBLIC ACCOUNTS, 2013-2014
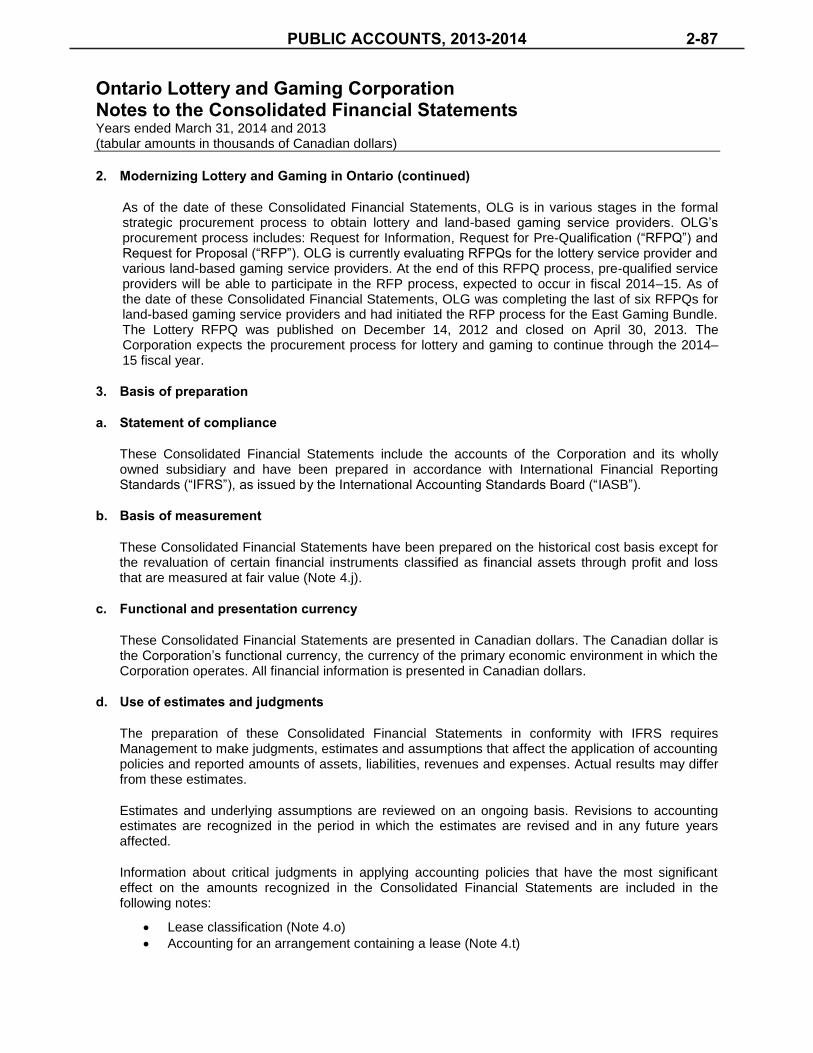
Ontario Lottery and Gaming Corporation Notes to the Consolidated Financial Statements Years ended March 31, 2014 and 2013 (tabular amounts in thousands of Canadian dollars)
2. Modernizing Lottery and Gaming in Ontario (continued)
As of the date of these Consolidated Financial Statements, OLG is in various stages in the formal strategic procurement process to obtain lottery and land-based gaming service providers. OLG’s procurement process includes: Request for Information, Request for Pre-Qualification (“RFPQ”) and Request for Proposal (“RFP”). OLG is currently evaluating RFPQs for the lottery service provider and various land-based gaming service providers. At the end of this RFPQ process, pre-qualified service providers will be able to participate in the RFP process, expected to occur in fiscal 2014–15. As of the date of these Consolidated Financial Statements, OLG was completing the last of six RFPQs for land-based gaming service providers and had initiated the RFP process for the East Gaming Bundle. The Lottery RFPQ was published on December 14, 2012 and closed on April 30, 2013. The Corporation expects the procurement process for lottery and gaming to continue through the 2014–15 fiscal year.
3. Basis of preparation
a. Statement of compliance
These Consolidated Financial Statements include the accounts of the Corporation and its wholly owned subsidiary and have been prepared in accordance with International Financial Reporting Standards (“IFRS”), as issued by the International Accounting Standards Board (“IASB”).
b. Basis of measurement
These Consolidated Financial Statements have been prepared on the historical cost basis except for the revaluation of certain financial instruments classified as financial assets through profit and loss that are measured at fair value (Note 4.j).
c. Functional and presentation currency
These Consolidated Financial Statements are presented in Canadian dollars. The Canadian dollar is the Corporation’s functional currency, the currency of the primary economic environment in which the Corporation operates. All financial information is presented in Canadian dollars.
d. Use of estimates and judgments
The preparation of these Consolidated Financial Statements in conformity with IFRS requires Management to make judgments, estimates and assumptions that affect the application of accounting policies and reported amounts of assets, liabilities, revenues and expenses. Actual results may differ from these estimates.
Estimates and underlying assumptions are reviewed on an ongoing basis. Revisions to accounting estimates are recognized in the period in which the estimates are revised and in any future years affected.
Information about critical judgments in applying accounting policies that have the most significant effect on the amounts recognized in the Consolidated Financial Statements are included in the following notes:
Lease classification (Note 4.o)
Accounting for an arrangement containing a lease (Note 4.t)
PUBLIC ACCOUNTS, 2013-2014 2-87

Ontario Lottery and Gaming Corporation Notes to the Consolidated Financial Statements Years ended March 31, 2014 and 2013 (tabular amounts in thousands of Canadian dollars)
3. Basis of preparation (continued)
d. Use of estimates and judgments (continued)
Areas of significant estimation and uncertainty that have a significant effect on the amounts recognized in the Consolidated Financial Statements and could result in a material adjustment within the next fiscal year, are discussed in subsequent Notes. These items and the Notes in which they are discussed appear below:
Property, plant and equipment useful lives and residual values (Note 4.l – Significant accounting policies - Property, plant and equipment)
Recoverability of property, plant and equipment (Note 9 – Property, plant and equipment)
Provisions (Note 11)
Valuation of financial instruments (Note 21 – Financial risk management and financial instruments)
Employee benefit liabilities (Note 22 – Employee benefits)
Contingencies (Note 24)
4. Significant accounting policies
The following accounting policies have been applied consistently by the Corporation and its wholly owned subsidiary to the Consolidated Financial Statements as at and for the years ended March 31, 2014 and March 31, 2013.
a. Basis of consolidation
The Consolidated Financial Statements include the accounts of the Corporation and its wholly owned subsidiary which it controls. Control is achieved where the Corporation has the power to direct the relevant activities of an entity so as to obtain benefits from its activities. These Consolidated Financial Statements include the financial positions and results of operations of Caesars Windsor, Casino Rama, Casino Niagara and Niagara Fallsview Casino Resort (collectively, “Resort Casinos”).
The assets, liabilities and operations of the Great Blue Heron Slot Machine Facility are also included in these Consolidated Financial Statements. These operating results are included with the results of OLG Slots and Casinos. These Consolidated Financial Statements do not include other operations carried out at the Great Blue Heron Charity Casino, which OLG does not own and over which OLG maintains no authority.
Intra-group balances and transactions, and any unrealized income and expenses arising from intra-group transactions, are eliminated on consolidation.
b. Foreign currency
Monetary assets and liabilities denominated in foreign currencies at the reporting date are translated into the Corporation’s functional currency, Canadian dollars, at the exchange rates at that date. Non-monetary assets and liabilities in foreign currencies measured in terms of historical cost are translated at historical exchange rates at the date of the transaction. Transactions in foreign currencies are translated into the Corporation’s functional currency using the exchange rates at the date of the transactions. The Consolidated Statements of Comprehensive Income items are translated at the rate of exchange in effect at the transaction date. Foreign currency transaction gains and losses are recognized in the Consolidated Statements of Comprehensive Income in the period in which they arise. The Corporation does not have any foreign operations.
2-88 PUBLIC ACCOUNTS, 2013-2014

Ontario Lottery and Gaming Corporation Notes to the Consolidated Financial Statements Years ended March 31, 2014 and 2013 (tabular amounts in thousands of Canadian dollars)
4. Significant accounting policies (continued)
c. Revenue recognition
Revenue is measured at the fair value of the consideration received or receivable. Revenue is recognized for the following major business activities:
i) Lottery
Lottery products are sold to the public by contracted lottery retailers. Revenue from tickets sold to consumers for lottery games, for which results are determined based on a draw, is recognized when the related draw occurs. Revenue from INSTANT games is recognized when retailers make them available for sale to the public, as indicated by the retailer’s activation of tickets. Revenue from Sports wagering games is recognized when the ticket is sold to the consumer. Tickets issued as a result of the redemption of free ticket prizes are not recorded as revenue.
ii) Charitable Gaming
Charitable Gaming products are sold to the public by Charitable Gaming Centre service providers. Revenue from paper break open tickets (“BOT”) is recognized when the ticket is sold to the consumer. For all other Charitable Gaming products, revenue is recognized, net of prizes paid, in the same period the game is played.
iii) Slot and table games
Gaming revenue from slot and table game operations is recognized, net of prizes paid, in the same period the game is played. Gaming revenue is net of the change in accrued jackpot liabilities and liabilities under customer loyalty incentive programs.
iv) Non-gaming revenue
Non-gaming revenue includes revenue from accommodations, food and beverage, entertainment centre and other services excluding the retail value of accommodations, food and beverage and other goods and services provided to customers on a complimentary basis. Non-gaming revenue is recorded at the retail value and is recognized as goods are delivered and services performed.
d. Customer loyalty incentive programs
The Corporation has customer loyalty incentive programs whereby customers have the choice to receive free or discounted goods and services, and in many cases, the right to receive cash. These customer loyalty incentive programs at the Resort Casinos, Great Blue Heron Slot Machine Facility and OLG Slots and Casinos allow customers to earn points based on the volume of play during gaming transactions. These points are recorded as a separate deliverable in the revenue transaction.
If the customer has the right to receive free or discounted goods and services and/or the option of receiving cash, a financial liability is recognized when the points are granted and a corresponding amount equal to the cash value is recorded as a reduction to revenue. The customer’s point balance will be forfeited if the customer does not earn additional points over the subsequent six- to 12-month period. If the points expire or are forfeited, the financial liability is derecognized.
For programs that provide customers the right to receive free or discounted goods and services, the revenue, as determined by the fair value of the undelivered goods and services related to the customer loyalty award, is deferred until the award is provided or expires.
PUBLIC ACCOUNTS, 2013-2014 2-89

Ontario Lottery and Gaming Corporation Notes to the Consolidated Financial Statements Years ended March 31, 2014 and 2013 (tabular amounts in thousands of Canadian dollars)
4. Significant accounting policies (continued)
e. Lottery and Charitable Gaming prizes
Prize expense for Lottery and certain Charitable Gaming products is recognized based on the predetermined prize structure for each game in the period revenue is recognized as described below:
Prize expense for tickets sold to consumers for lottery games, for which results are determined based on a draw, is recognized when the related draw occurs and is based on actual prize liability.
Prize expense for INSTANT games is recognized when retailers make them available for sale to the public, as indicated by the retailers’ activation of tickets and is based on the prize structure.
Prize expense for Sports wagering games is recognized when the last wagered event occurs and is based on actual prize liability.
Prize expense for Charitable Gaming’s paper BOT is recognized when the ticket is sold to the consumer and is based on actual prize liability.
Prize expense for annuity-based top prizes is based on the cost of the annuity purchased by the Corporation from a third party.
Prize expense is adjusted on a monthly basis to reflect amounts actually won and/or unclaimed.
Unclaimed prizes on National Lotto games are returned to players through guaranteed jackpots and bonus draws. Unclaimed prizes on Regional Lotto games are returned to the Province of Ontario through distributions to the Province. Unclaimed prizes are recorded as a reduction to the prize liability included in trade and other payables as well as a reduction to the prize expense. National Lotto games are administered by the Interprovincial Lottery Corporation and sold throughout Canada, while Regional Lotto games are administered by the Corporation and sold only in Ontario.
f. Commissions and bonuses
Commissions and bonuses are recognized in the Consolidated Statements of Comprehensive Income in the period in which they are incurred.
(i) Lottery
Lottery retailers receive a commission of eight per cent on all INSTANT tickets and a commission of five per cent on all Lotto tickets sold. Where a commission has been paid to retailers for ticket sales relating to future draws, the commission amount is recorded as a prepaid expense until the related revenue is recognized. Lottery retailers receive a three per cent commission on INSTANT ticket redemptions and a commission of two per cent on Lotto ticket redemptions. A bonus of up to $1,500 is paid to any retailer who sells a major prize-winning Lotto or INSTANT ticket, excluding Sports and daily games. Commission amounts that are paid to a retailer for selling a major prize are recorded as an expense when the ticket is redeemed.
(ii) Charitable Gaming
Charitable Gaming Centre service providers receive a commission based on percentages of net win (gaming revenue net of prizes paid), adjusted net win (net win after the payment of applicable marketing expenses), or gaming revenue and net win.
Charities and non-profit agencies receive a commission based on percentages of net win, adjusted net win, total revenue or non-gaming revenue.
2-90 PUBLIC ACCOUNTS, 2013-2014

Ontario Lottery and Gaming Corporation Notes to the Consolidated Financial Statements Years ended March 31, 2014 and 2013 (tabular amounts in thousands of Canadian dollars)
4. Significant accounting policies (continued)
f. Commissions and bonuses (continued)
(iii) Site holders
Prior to April 1, 2013, racetrack site holders were entitled to receive twenty per cent of the revenue generated from slots, or other amounts as agreed to, as outlined in the site holder agreement with the corresponding racetrack operators; half of which or ten per cent was then owed to the horse racing industry. The payments were recognized in commissions expense in Note 25. Three of the site holder agreements were terminated by the Corporation on April 30, 2012, one during fiscal 2012–13 and the remaining 14 effective March 31, 2013.
Effective April 1, 2013, the Corporation entered into short-term binding agreements with 11 facilities on a month-to-month basis and lease agreements with three facilities for a term of five years. The agreements have been recognized as leases as disclosed in Note 4.t. This enabled the Corporation to continue to conduct and manage its slot machine operations beyond the March 31, 2013 expiration date of the Slots at Racetracks program. The payments are recognized in facilities expense in Note 25.
Subsequent to March 31, 2014, the Corporation entered into a lease agreement with one of the 11 facilities mentioned above for a term of five years commencing April 1, 2013.
(iv) Municipalities
Municipalities that host an OLG Casino or a Slots at Racetracks facility, including the City of Niagara Falls and the City of Windsor, receive the following as defined in the Municipal Contribution Agreement:
i. 5.25 per cent on the first $65 million of annual slot revenue; plus
ii. 3.00 per cent on the next $135 million of annual slot revenue; plus
iii. 2.50 per cent on the next $300 million of annual slot revenue; plus
iv. 0.50 per cent on the remainder of annual slot revenue; plus
v. 4.00 per cent on table game revenue, where applicable.
Prior to April 1, 2013, municipalities that hosted an OLG Casino or a Slots at Racetracks facility received five per cent of revenue from slot machines up to a total of 450 slot machines and two per cent of revenue from slot machines over 450.
In fiscal 2012–13, under the terms of the agreements between Fallsview and the City of Niagara Falls; and Caesars Windsor and the City of Windsor, these municipalities received compensatory payments of $3,000,000 each from the Corporation.
Municipalities that host the Corporation’s Charitable Gaming Centres receive a commission based on either a percentage of total revenue or net win or a percentage of adjusted net win.
PUBLIC ACCOUNTS, 2013-2014 2-91

Ontario Lottery and Gaming Corporation Notes to the Consolidated Financial Statements Years ended March 31, 2014 and 2013 (tabular amounts in thousands of Canadian dollars)
4. Significant accounting policies (continued)
f. Commissions and bonuses (continued)
(v) Mississaugas of Scugog Island First Nation
As the host community of the slot machines at the Great Blue Heron Slot Machine Facility, the Mississaugas of Scugog Island First Nation receive five per cent of Gross Revenues, as defined, from the slot machines. The Mississaugas of Scugog Island First Nation will continue to receive an amount equal to five per cent of the Gross Revenues, as defined, of the slots at the Great Blue Heron Slot Machine Facility on a month-to-month basis, for up to a maximum period of 24 months from June 28, 2013, which was the date the original agreement expired.
g. Cash and cash equivalents
Cash and cash equivalents include cash and liquid investments that have a term to maturity at the time of purchase of less than 90 days.
h. Trade and other receivables
Trade and other receivables are recognized initially at fair value and subsequently measured at amortized cost, less an allowance for impairment. Trade and other receivables are due for settlement no more than 30 days from the date of recognition.
Trade and other receivables represent lottery proceeds due from lottery retailers for lottery ticket sales net of commissions and prizes paid by the retailers. Also included are Charitable Gaming proceeds due from Charitable Gaming Centres service providers for Charitable Gaming sales net of commissions and prizes paid and amounts due from customers of Resort Casinos.
Collectability of trade receivables is reviewed on an ongoing basis. Accounts which are known to be uncollectible are written off. An allowance for impaired receivables is established when there is objective evidence that the Corporation will not be able to collect all amounts due according to the original terms. The amount of the provision is the difference between the asset’s carrying amount and the present value of estimated future cash flows, not including future credit losses, discounted at the original effective interest rate. The amount of the provision is recognized in the Consolidated Statements of Comprehensive Income.
i. Inventories
Inventories are valued at the lower of cost and net realizable value. Cost is determined using the weighted average cost method. Net realizable value is the estimated selling price in the ordinary course of business less the estimated costs necessary to complete the sale.
Inventories consist of finished goods including slot machine and table game parts, security and surveillance parts, lottery and charitable gaming tickets and paper, food and beverage inventory and retail inventory.
j. Financial instruments
(i) Non-derivative financial assets
The Corporation has the following non-derivative financial assets: financial assets at fair value through profit or loss, and loans and receivables. The Corporation does not have available-for-sale or held-to-maturity financial assets.
2-92 PUBLIC ACCOUNTS, 2013-2014
Ontario Lottery and Gaming Corporation Notes to the Consolidated Financial Statements Years ended March 31, 2014 and 2013 (tabular amounts in thousands of Canadian dollars)
4. Significant accounting policies (continued)
j. Financial instruments (continued)
(i) Non-derivative financial assets (continued)
The Corporation initially recognizes loans and receivables on the date that they originated. All other financial assets (including assets designated at fair value through profit or loss) are recognized initially on the trade date at which the Corporation becomes a party to the contractual provisions of the instrument.
The Corporation derecognizes a financial asset when the contractual rights to the cash flows from the asset expire or when it transfers the rights to receive the contractual cash flows on the financial asset in a transaction in which substantially all the risks and rewards of ownership of the financial asset are transferred. Any interest in transferred financial assets that is created or retained by the Corporation is recognized as a separate asset or liability.
Financial assets at fair value through profit or loss
A financial asset is classified at fair value through profit or loss if it is classified as held for trading or designated as such upon initial recognition. Financial assets are designated at fair value through profit or loss if the Corporation manages such investments and makes purchase and sale decisions based on their fair value in accordance with the Corporation’s documented risk management or investment strategy. Upon initial recognition, attributable transaction costs are recognized as incurred in the Consolidated Statements of Comprehensive Income. Financial assets at fair value through profit or loss are measured at fair value and changes therein are recognized in the Consolidated Statements of Comprehensive Income.
The Corporation classified all cash and cash equivalents and restricted cash as financial assets at fair value through profit or loss.
Loans and receivables
Loans and receivables are financial assets with fixed or determinable payments that are not quoted in an active market. Such assets are recognized initially at fair value plus any directly attributable transaction costs. Subsequent to initial recognition, loans and receivables are measured at amortized cost using the effective interest method, less any impairment losses.
Loans and receivables are comprised of trade and other receivables.
(ii) Non-derivative financial liabilities
The Corporation has the following non-derivative financial liabilities: trade and other payables, provisions, due to operators, due to Rama First Nation, due to the Government of Canada and long-term debt.
The Corporation initially recognizes financial liabilities issued on the date that they originated. Such financial liabilities are recognized initially at fair value plus any directly attributable transaction costs. Subsequent to initial recognition, these financial liabilities are measured at amortized cost using the effective interest method.
All other financial liabilities (designated at fair value through profit or loss) are recognized initially on the trade date at which the Corporation becomes a party to the contractual provisions of the instrument. Any transaction costs that are directly attributable to these financial liabilities are expensed as incurred.
PUBLIC ACCOUNTS, 2013-2014 2-93

Ontario Lottery and Gaming Corporation Notes to the Consolidated Financial Statements Years ended March 31, 2014 and 2013 (tabular amounts in thousands of Canadian dollars)
4. Significant accounting policies (continued)
j. Financial instruments (continued)
(ii) Non-derivative financial liabilities (continued)
The Corporation derecognizes a financial liability when its contractual obligations are discharged, cancelled or have expired.
The Corporation has no non-derivative liabilities classified at fair value through profit or loss.
Financial assets and liabilities are offset and the net amount presented in the Consolidated Statements of Financial Position when, and only when, the Corporation has a legal right to offset the amounts and intends either to settle on a net basis or to realize the asset and settle the liability simultaneously.
k. Restricted cash
Restricted cash consists of cash and liquid investments that have a term to maturity at the time of purchase of less than 90 days. Cash is restricted for the purposes of funding reserves and also includes prize funds on deposit and unused proceeds received from term loans.
l. Property, plant and equipment
(i) Recognition and measurement
The Corporation capitalizes any major capital purchase that has a useful life beyond the current year.
Property, plant and equipment is measured at cost less accumulated amortization and accumulated impairment losses.
Cost includes an expenditure that is directly attributable to the acquisition of the asset. The cost of self-constructed assets includes the cost of materials and direct labour, and other costs directly attributable to bring the assets to a working condition for their intended use, the cost of dismantling and removing the items and restoring the site on which they are located, and capitalized borrowing costs on qualifying assets. When parts of an item of property, plant and equipment have different useful lives, they are accounted for as separate items (major components) of property, plant and equipment.
Gains and losses on disposal of an item of property, plant and equipment are determined by comparing the proceeds from disposal with the carrying amount of property, plant and equipment, and are recognized net within other income in the Consolidated Statements of Comprehensive Income.
(ii) Subsequent costs
The cost of replacing a part of an item of property, plant and equipment is recognized in the carrying amount of the item if it is probable that the future economic benefits embodied within the part will flow to the Corporation and its cost can be measured reliably. The carrying amount of the replaced part is derecognized. The cost of the day-to-day servicing of property, plant and equipment is recognized as incurred in the Consolidated Statements of Comprehensive Income.
2-94 PUBLIC ACCOUNTS, 2013-2014

Ontario Lottery and Gaming Corporation Notes to the Consolidated Financial Statements Years ended March 31, 2014 and 2013 (tabular amounts in thousands of Canadian dollars)
4. Significant accounting policies (continued)
l. Property, plant and equipment (continued)
(iii) Amortization
Amortization is calculated over the depreciable amount, which is the cost of an asset, or other amount substituted for cost, less its residual value.
Amortization is recognized in the Consolidated Statements of Comprehensive Income on a straight-line basis over the estimated useful life of each component of an item of property, plant and equipment, since this most closely reflects the expected pattern of consumption of the future economic benefits embodied in the asset. Leased assets are amortized over the shorter of the lease term and their estimated useful lives unless it is reasonably certain that the Corporation will obtain ownership by the end of the term of the lease.
The estimated useful lives for the current and comparative periods are as follows:
Asset Rate
Buildings 10 to 50 years
Furniture, fixtures and equipment 2 to 10 years
Leasehold improvements Lesser of useful life or term of lease
Lottery gaming assets 5 to 10 years
OLG Slots and Casinos gaming assets 2 to 10 years
Property, plant and equipment are amortized when ready for their intended use. Construction in progress and assets not in use are stated at cost, less any recognized impairment loss. Amortization of these assets, determined on the same basis as other property assets, commences when the assets are ready for their intended use.
Amortization methods, useful lives and residual values are reviewed at each fiscal year end and adjusted if appropriate.
Borrowing costs incurred during the construction and development of qualifying property, plant and equipment are capitalized and amortized over the estimated useful life of the associated property, plant and equipment.
m. Goodwill
Acquisitions of subsidiaries and businesses are accounted for using the acquisition method. The consideration for each acquisition is measured at the aggregate of the fair values (at the exchange date) of assets given and liabilities incurred or assumed. Acquisition-related costs are recognized as incurred in the Consolidated Statements of Comprehensive Income.
PUBLIC ACCOUNTS, 2013-2014 2-95

Ontario Lottery and Gaming Corporation Notes to the Consolidated Financial Statements Years ended March 31, 2014 and 2013 (tabular amounts in thousands of Canadian dollars)
4. Significant accounting policies (continued)
m. Goodwill (continued)
Goodwill arising in a business combination is recognized as an asset at the date that control is acquired (the “acquisition date”). Goodwill is measured as the excess of the sum of the consideration transferred, the amount of any non-controlling interest in the acquiree and the fair value of any previously held equity interest in the entity over net of the acquisition-date amounts of the identifiable assets acquired and the liabilities assumed. Goodwill is not amortized but is reviewed for impairment at least annually. For the purpose of impairment testing, goodwill is allocated to each of the Corporation’s cash generating units (“CGU”) expected to benefit from the synergies of the combination. CGUs to which goodwill has been allocated are tested for impairment annually or more frequently when there is an indication that the unit may be impaired. Absent of any triggering factors during the year, the Corporation conducts its goodwill impairment test in the fourth quarter of the year. If the recoverable amount of the CGU is less than its carrying amount, the impairment loss is allocated to the unit to reduce the carrying amount of any goodwill allocated to it and then allocated pro rata to the other assets of the unit on the basis of the carrying amount of each asset in the unit. An impairment loss recognized for goodwill is not reversed in a subsequent period.
Goodwill is measured at cost less accumulated impairment losses and has an indefinite useful life.
n. Impairment
(i) Financial assets
A financial asset not carried at fair value through profit or loss is assessed at each reporting date to determine whether there is objective evidence that it is impaired. A financial asset is impaired if objective evidence indicates that a loss event has occurred after the initial recognition of the asset and that the loss event had a negative effect on the estimated future cash flows of that asset that can be estimated reliably.
Objective evidence that financial assets are impaired can include default or delinquency by a debtor, restructuring of an amount due to the Corporation on terms that the Corporation would not consider otherwise and indications that a debtor or issuer will enter bankruptcy.
The Corporation considers evidence of impairment for receivables at both a specific asset and collective level. All individually significant receivables are assessed for specific impairment. All individually significant receivables found not to be specifically impaired are then collectively assessed for any impairment that has been incurred but not yet identified. Receivables that are not individually significant are collectively assessed for impairment by grouping together receivables with similar risk characteristics.
An impairment loss in respect of a financial asset measured at amortized cost is calculated as the difference between its carrying amount and the present value of the estimated future cash flows discounted at the asset’s original effective interest rate. Losses are recognized in the Consolidated Statements of Comprehensive Income and reflected in an allowance account against receivables. Interest on the impaired asset continues to be recognized through the unwinding of the discount. When a subsequent event causes the amount of impairment loss to decrease, the decrease in impairment loss is reversed in the Consolidated Statements of Comprehensive Income.
2-96 PUBLIC ACCOUNTS, 2013-2014

Ontario Lottery and Gaming Corporation Notes to the Consolidated Financial Statements Years ended March 31, 2014 and 2013 (tabular amounts in thousands of Canadian dollars)
4. Significant accounting policies (continued)
n. Impairment (continued)
(ii) Non-financial assets
The carrying amounts of the Corporation’s non-financial assets are reviewed at each reporting date to determine whether there is any indication of impairment. If any such indication exists, then the asset’s recoverable amount is estimated. For goodwill, the recoverable amount is estimated each year at the same time.
The recoverable amount of an asset or CGU is the greater of its value in use and its fair value less costs of disposal. In assessing value in use, the estimated future cash flows are discounted to their present value using a pre-tax discount rate that reflects current market assessments of the time value of money and the risks specific to the asset or CGU. For the purpose of impairment testing, assets that cannot be tested individually are grouped together into the smallest group of assets that generates cash inflows from continuing use that are largely independent of the cash inflows of other assets or group of assets. Subject to an operating segment ceiling test, for the purposes of goodwill impairment testing, CGUs to which goodwill has been allocated are aggregated so that the level at which impairment is tested reflects the lowest level at which goodwill is monitored for internal reporting purposes.
The Corporation’s corporate assets do not generate separate cash inflows. If there is an indication that a corporate asset may be impaired, then the recoverable amount is determined for the CGU to which the corporate asset is allocated.
An impairment loss is recognized if the carrying amount of an asset or its CGU exceeds its estimated recoverable amount. Impairment losses are recognized in the Consolidated Statements of Comprehensive Income. Impairment losses recognized in respect of CGUs are first allocated to reduce the carrying amount of any goodwill allocated to the units and then to reduce, on a pro rata basis, the carrying amounts of the other assets in the unit or group of units.
An impairment loss in respect of goodwill is not reversed. In respect of other assets, impairment losses recognized in prior periods are assessed at each reporting date for any indications that the loss has decreased or no longer exists. An impairment loss is reversed if there has been a change in the estimates used to determine the recoverable amount. An impairment loss is reversed only to the extent that the asset’s carrying amount does not exceed the carrying amount that would have been determined, net of amortization, if no impairment loss had been recognized.
o. Leased assets
Leases in terms of which the Corporation assumes substantially all the risks and rewards of ownership are classified as finance leases. On a lease by lease basis, the Corporation estimates whether substantially all of the risks and rewards of ownership are assumed, taking into account the length of the lease, the present value of the minimum lease payments compared to the fair value of the leased asset, and other terms contained within the lease. Upon initial recognition, the leased asset is measured at an amount equal to the lower of its fair value and the present value of the minimum lease payments.
Subsequent to initial recognition, the asset is accounted for in accordance with the accounting policy applicable to that asset.
PUBLIC ACCOUNTS, 2013-2014 2-97

Ontario Lottery and Gaming Corporation Notes to the Consolidated Financial Statements Years ended March 31, 2014 and 2013 (tabular amounts in thousands of Canadian dollars)
4. Significant accounting policies (continued)
o. Leased assets (continued)
Other leases are operating leases and the leased assets are not recognized in the Corporation’s Consolidated Statements of Financial Position. Operating lease payments are recognized as an expense on a straight-line basis over the term of the lease, except when another systematic basis is more representative of the time pattern in which economic benefits from the leased assets are consumed. Contingent rentals arising under operating leases are recognized as an expense in the period in which they are incurred.
p. Deferred revenues
Funds collected from retailers for lottery games for which results are determined based on a draw, sold in advance of the game draw, are recorded as deferred revenue and recognized as revenue once the related draw occurs.
q. Trade and other payables
These amounts represent liabilities for unpaid goods and services provided to the Corporation prior to the end of the financial year. Such liabilities are recognized initially at fair value plus any directly attributable transaction costs. Subsequent to initial recognition, these liabilities are measured at their amortized cost using the effective interest method. The amounts are short-term in nature.
r. Provisions
Provisions are liabilities of uncertain timing and amount. A provision is recognized if, as a result of a past event, the Corporation has a present legal or constructive obligation that can be estimated reliably and it is probable that an outflow of economic benefits will be required to settle the obligation.
Provisions are determined by discounting the expected future cash flows at a pre-tax rate that reflects current market assessments of the time value of money and the risks specific to the liability. The unwinding of the discount is recognized as finance cost.
Provisions are reviewed at each reporting date and adjusted to reflect current best estimates.
(i) Legal claims
The Corporation recognizes obligations for the settlement of current legal claims against the Corporation. The provision is measured based on the best estimate of the expenditure required to settle the matter. Each claim is individually reviewed for the likelihood of settlement and the expected settlement amount.
(ii) Restructuring provisions
A provision for restructuring is recognized when the Corporation has a legal or constructive obligation at the reporting date, which results from a detailed and formal restructuring plan approved by the Corporation, and the restructuring either has commenced or has been announced to those affected by it. Restructuring costs include only the direct incremental expenditures arising from the restructuring, which are necessitated by the restructuring and not associated with the ongoing activities of the Corporation.
2-98 PUBLIC ACCOUNTS, 2013-2014

Ontario Lottery and Gaming Corporation Notes to the Consolidated Financial Statements Years ended March 31, 2014 and 2013 (tabular amounts in thousands of Canadian dollars)
4. Significant accounting policies (continued)
r. Provisions (continued)
(iii) Other provisions
The Corporation recognizes decommissioning obligations for the retirement of certain tangible property, plant and equipment, which result from the acquisition, construction, development and/or normal use of the assets. The provision is measured based on the net present value of Management’s best estimate of the expenditures that will be made. The associated asset retirement costs are capitalized as part of the carrying amount of the long-lived asset and amortized over the estimated useful life. The increase to the provision resulting from unwinding the discount is recognized as a finance cost.
The provision is measured each period and subsequent changes in the provision are capitalized as part of the cost of the long-lived asset and amortized prospectively over the remaining life of the item to which the costs relate. A gain or loss may be incurred upon settlement of the liability.
The Corporation recognizes a provision for insurance claims that the Corporation’s insurance provider has indicated are more than likely to be settled. The provision is measured based on the amounts for each claim that settlement is probable, or the amount of the deductible related to the claim.
The Corporation recognizes onerous provisions when the unavoidable costs of meeting the obligations of a contract exceed the economic benefits expected to be received by it. The provision is initially measured based on the net present value of Management’s best estimate of the net obligations of the contract. Subsequent changes in the measurement amount are charged to the class of expense to which the contract relates.
s. Employee benefits
(i) Defined contribution plans
A defined contribution plan is a post-employment benefit plan under which an entity pays fixed contributions into a separate entity and will have no legal or constructive obligation to pay further amounts. Obligations for contributions to defined contribution pension plans are recognized as an employee benefit expense in the Consolidated Statements of Comprehensive Income in the periods during which services are rendered by employees. Prepaid contributions are recognized as an asset to the extent that a cash refund or a reduction in future payments is available. Contributions to a defined contribution plan, which are due more than 12 months after the end of the period in which the employees render the service, are discounted to their present value.
(ii) Defined benefit plans
A defined benefit plan is a post-employment benefit plan that requires entities to record their net obligation in respect of the plan and is not a defined contribution plan. The Corporation provides defined benefit pension plans through the Public Service Pension Fund (“PSPF”) and the Ontario Public Service Employees Union Pension Fund (“OPSEU Pension Fund”). The Corporation does not have a net obligation in respect of defined benefit pension plans as the plans are sole-sponsored defined benefit plans established by the Province of Ontario. The Province of Ontario controls all entities included in the pension plans. The Corporation has classified these plans as state plans whereby there is no contractual agreement or stated policy for charging the net defined benefit cost of the plans to the Corporation. As such, the Corporation records these post-employment benefits as defined contribution plans and has recorded no additional liability for the plan deficit.
PUBLIC ACCOUNTS, 2013-2014 2-99

Ontario Lottery and Gaming Corporation Notes to the Consolidated Financial Statements Years ended March 31, 2014 and 2013 (tabular amounts in thousands of Canadian dollars)
4. Significant accounting policies (continued)
s. Employee benefits (continued)
(iii) Other long-term employee benefits
The Corporation’s net obligation with respect to long-term employee benefits other than pension plans is the amount of future benefit that employees have earned in return for their service in the current and prior periods. That benefit is discounted to determine its present value and the fair value of any related assets is deducted. The discount rate is the yield at the reporting date on AA credit-rated bonds that have maturity dates approximating the terms of the Corporation’s obligations. The calculation is performed using the projected unit credit method. Any actuarial gains and losses are recognized in the Consolidated Statements of Comprehensive Income in the period in which they arise.
(iv) Termination benefits
Termination benefits are recognized as an expense at the earlier of when the Corporation can no longer withdraw the offer of those benefits and when the Corporation recognizes costs for a restructuring. If benefits are not expected to be settled wholly within 12 months of the end of the reporting period, they are discounted to their present value.
(v) Short-term employee benefits
Short-term employee benefit obligations are measured on an undiscounted basis and are expensed as the related service is provided.
A liability is recognized for the amount expected to be settled wholly within 12 months of the end of the reporting period if the Corporation has a present legal or constructive obligation to pay this amount as a result of past service provided by the employee and the obligation can be estimated reliably.
t. Lease payments
Payments made under operating leases are recognized in the Consolidated Statements of Comprehensive Income on a straight-line basis over the term of the lease. Lease incentives received are recognized as an integral part of the total lease expense over the term of the lease.
Minimum lease payments made under finance leases are apportioned between the finance expense and the reduction of the outstanding liability. The finance expense is allocated to each period during the term of the lease so as to produce a constant periodic rate of interest on the remaining balance of the liability.
(i) Determining whether an arrangement contains a lease
At the inception of an arrangement, the Corporation determines whether such an arrangement is or contains a lease. A specific asset is the subject of a lease if fulfillment of the arrangement is dependent on the use of that specified asset. An arrangement conveys the right to use the asset if the arrangement conveys to the Corporation the right to control the use of the underlying asset.
2-100 PUBLIC ACCOUNTS, 2013-2014
Ontario Lottery and Gaming Corporation Notes to the Consolidated Financial Statements Years ended March 31, 2014 and 2013 (tabular amounts in thousands of Canadian dollars)
4. Significant accounting policies (continued)
t. Lease payments (continued)
(i) Determining whether an arrangement contains a lease (continued)
At the inception or upon the reassessment of the arrangement, the Corporation separates payments and other consideration required by such an arrangement into those for the lease and those for other elements on the basis of their relative fair values. If the Corporation concludes that it is impracticable to separate the payments reliably under a finance lease, an asset and a liability are recognized at an amount equal to the fair value of the underlying asset. Subsequently, the liability is reduced as payments are made and an imputed finance charge on the liability is recognized using the Corporation’s incremental borrowing rate.
u. Borrowing costs
Borrowing costs directly attributable to the acquisition, construction or production of qualifying assets, which are assets that necessarily take a substantial period of time to get ready for their intended use or sale, are added to the cost of those assets. The Corporation ceases to capitalize borrowing costs when substantially all the activities necessary to prepare the qualifying asset for its intended use are complete. The Corporation suspends capitalization of borrowing costs during extended periods in which it has suspended active development of a qualifying asset.
Investment income earned on the temporary investment of specific borrowings pending their expenditure on qualifying assets is deducted from the borrowing costs eligible for capitalization.
All other borrowing costs are recognized in the Consolidated Statements of Comprehensive Income in the period in which they are incurred.
v. Finance income and finance costs
Finance income consists of interest income on funds invested and changes in the fair value of financial assets at fair value through profit or loss. Interest income is recognized as it accrues in the Consolidated Statements of Comprehensive Income using the effective interest method.
Finance costs consist of interest expense on borrowings, unwinding of the discount on provisions and changes in the fair value of financial assets at fair value through profit or loss. Borrowing costs that are not directly attributable to the acquisition, construction or production of a qualifying asset are recognized in the Consolidated Statements of Comprehensive Income using the effective interest method.
w. Segment reporting
An operating segment is a component of the Corporation that engages in business activities from which it may earn revenues and incur expenses, including revenues and expenses that relate to transactions with any of the Corporation’s other components. The operating results of all operating segments are reviewed regularly by the Corporation’s Executive Leadership Team (“ELT”), consisting of the President and CEO and his direct reports, to make decisions about resources to be allocated to the segment and to assess the performance of the segment for which discrete financial information is available.
Segment results that are reported to the chief operating decision-maker, the Corporation’s ELT, include items directly attributable to a segment as well as those that can be allocated on a reasonable basis. Unallocated items are comprised primarily of corporate assets and liabilities.
PUBLIC ACCOUNTS, 2013-2014 2-101
Ontario Lottery and Gaming Corporation Notes to the Consolidated Financial Statements Years ended March 31, 2014 and 2013 (tabular amounts in thousands of Canadian dollars)
4. Significant accounting policies (continued)
w. Segment reporting (continued)
Segment capital expenditure is the total cost incurred during the period to acquire property, plant and equipment and intangible assets other than goodwill.
x. Income taxes
As the Corporation is an agent of the Crown, it is not subject to federal or provincial corporate income taxes or corporate capital taxes.
y. Initial application of standards, interpretation and amendments
The Corporation adopted the following accounting standards on April 1, 2013:
(i) IFRS 7, Financial Instruments: Disclosures (amended 2011) (“IFRS 7”)
On April 1, 2013, the Corporation adopted the amendments to the disclosure requirements in IFRS 7. The amendments require information about all recognized financial instruments that are offset in accordance with IAS 32, Financial Instruments: Presentation (“IAS 32”). The Corporation has assessed the impact of these amendments and determined it did not have a material impact on the Consolidated Financial Statements.
(ii) IFRS 10, Consolidated Financial Statements (“IFRS 10”)
On April 1, 2013, the Corporation adopted IFRS 10, which replaced the consolidation guidance contained in IAS 27, Consolidated and Separate Financial Statements. IFRS 10 provides a single model to be applied in the control analysis for all investees. The Corporation has assessed the impact of the new standard and determined it did not have a material impact on the Consolidated Financial Statements.
(iii) IFRS 12, Disclosure of Interests in Other Entities (“IFRS 12”)
On April 1, 2013, Corporation adopted IFRS 12, which contains the disclosure requirements for entities that have interests in subsidiaries, joint arrangements, associates and/or unconsolidated structured entities. These disclosures provide information to enable users to evaluate the nature of, and the risks associated with an entity’s financial position, financial performance and cash flows. The Corporation has assessed the impact of the new standard and determined it did not have a material impact on the Consolidated Financial Statements.
(iv) IFRS 13, Fair Value Measurement (“IFRS 13”)
On April 1, 2013, the Corporation adopted IFRS 13, which aims to improve consistency and reduce complexity by providing a precise definition of fair value and a single source of fair value measurement and disclosure requirements for use across IFRS. The disclosures required under IFRS 13 are included in Note 21.
(v) IAS 19, Employee Benefits (amended 2011) (“IAS 19”)
On April 1, 2013, the Corporation adopted the amendments in IAS 19, which eliminated the use of the ‘corridor’ approach and mandates all remeasurement impacts be recognized in other comprehensive income and clarified when an entity should recognize a liability and an expense for termination benefits. The Corporation has assessed the impact of these amendments and determined they did not have a material impact on the Consolidated Financial Statements.
2-102 PUBLIC ACCOUNTS, 2013-2014

Ontario Lottery and Gaming Corporation Notes to the Consolidated Financial Statements Years ended March 31, 2014 and 2013 (tabular amounts in thousands of Canadian dollars)
4. Significant accounting policies (continued)
z. Accounting standards issued but not yet effective
A number of new accounting standards, and amendments to standards and interpretations, are not yet effective as at March 31, 2014, and have not been applied in preparing these Consolidated Financial Statements.
(i) IFRS 9, Financial Instruments ("IFRS 9")
In November 2009, the IASB issued IFRS 9 and in October 2010, it published amendments to IFRS 9. IFRS 9 replaces IAS 39, Financial Instruments: Recognition and Measurement, and establishes principles for the financial reporting of financial assets and financial liabilities that will present relevant and useful information to users of financial statements for their assessment of the amounts, timing and uncertainty of an entity's future cash flows. In February 2014, the IASB tentatively decided that IFRS 9 would be mandatorily effective for annual periods beginning on or after January 1, 2018. The Corporation is assessing the impact of this new standard on its Consolidated Financial Statements.
(ii) IAS 32 Offsetting Financial Assets and Liabilities
In December 2011, the IASB published amendments to IAS 32, which provide clarification on when an entity has a legally enforceable right to offset and clarify when a settlement mechanism provides for net settlement or gross settlement that is equivalent to net settlement. The amendments are effective for annual reporting periods beginning on or after January 1, 2014. The Corporation does not expect the amendments to IAS 32 to have a material impact on its Consolidated Financial Statements.
(iii) IAS 36, Recoverable Amount Disclosures for Non-Financial Assets
In May 2013, the IAS issued amendments to IAS 36, Impairment of Assets (“IAS 36”), which reverse the unintended requirement in IFRS 13, to disclose the recoverable amount of every CGU to which significant goodwill or indefinite-life intangible assets have been allocated. Under the amendments, the recoverable amount is required to be disclosed only when an impairment loss has been recognized or reversed. The amendments are effective for annual reporting periods beginning on or after January 1, 2014. The Corporation does not expect the amendments to IAS 36 to have a material impact on its Consolidated Financial Statements.
(iv) IFRIC 21, Levies (“IFRIC 21”)
In May 2013, the IASB issued IFRIC 21 which provides guidance on accounting for levies in accordance with the requirements of IAS 37 Provisions, Contingent Liabilities and Contingent Assets. The interpretation defines a levy as an outflow from an entity imposed by a government in accordance with legislation and it notes that levies do not arise from executory contracts or other contractual arrangements. The interpretation also confirms that an entity recognizes a liability for a levy only when the triggering event specified in the legislation occurs. IFRIC 21 is effective for annual reporting periods beginning on or after January 1, 2014 and is to be applied retrospectively. The Corporation is assessing the impact of IFRIC 21 on its Consolidated Financial Statements.
(v) Annual Improvements to IFRS (2010-2012) and (2011-2013)
In December 2013, the IASB issued narrow-scope amendments to nine standards as part of its annual improvements process. The IASB uses the annual improvements process to make non-urgent but necessary amendments to IFRS. Most amendments will apply prospectively on or after July 1, 2014. The Corporation does not expect the amendments to have a material impact on its Consolidated Financial Statements.
PUBLIC ACCOUNTS, 2013-2014 2-103
Ontario Lottery and Gaming Corporation Notes to the Consolidated Financial Statements Years ended March 31, 2014 and 2013 (tabular amounts in thousands of Canadian dollars)
5. Capital risk management
The capital structure of the Corporation consists of cash and cash equivalents, long-term debt and equity, comprising retained earnings, contributed surplus and reserves.
The Corporation’s objectives in managing capital are to ensure sufficient resources are available for it to continue to fund future development and growth of its operations and to provide returns to the Province of Ontario.
The Board of Directors is responsible for the oversight of Management including policies related to financial and risk management. The Corporation manages its capital structure and makes adjustments to it in light of changes in economic conditions and the risk characteristics of the underlying assets. Operating agreements require the Resort Casinos to establish reserve funds. The Corporation is not subject to any externally imposed capital requirements. Refer to Note 21 for further details on the Corporation’s financial risk management and financial instruments.
6. Trade and other receivables
March 31, 2014 March 31, 2013
Trade receivables $90,309 $92,595
Less: allowance for impairment (3,890) (4,597)
Trade receivables, net 86,419 87,998
Other receivables 9,823 19,946
Trade and other receivables $96,242 $107,944
The Corporation’s exposure to credit and currency risks and impairment losses related to trade and other receivables is disclosed in Note 21.
7. Inventories
March 31, 2014 March 31, 2013
Slot machine and table game parts
$3,811 $4,334
Lottery and charitable gaming tickets and paper
13,666 14,750
Security and surveillance parts
810 979
Food and beverage 3,102 2,954
Retail 422 343
Other 2,831 2,289
Inventories $24,642 $25,649
Inventory costs, included in expenses, for the year ended March 31, 2014, were $97,513,000 (March 31, 2013 – $95,987,000). During fiscal 2013–14, the Corporation recorded inventory write-downs in expenses of $416,000 (March 31, 2013 – $464,000).
2-104 PUBLIC ACCOUNTS, 2013-2014

Ontario Lottery and Gaming Corporation Notes to the Consolidated Financial Statements Years ended March 31, 2014 and 2013 (tabular amounts in thousands of Canadian dollars)
8. Restricted cash
Restricted cash, consisting of the following items and respective amounts, are held in separate bank accounts.
March 31, 2014 March 31, 2013
Reserves (a) Capital renewals Operating Severance
$39,431 53,697 45,292
$50,908 54,587 44,788
138,420 150,283 Less: unrestricted capital renewals and operating (b)
(4,173) (17)
Funded reserves balance 134,247 150,266 Prize funds on deposit (c) 39,615 39,891 Other (d) 2,044 35,323
Restricted cash $175,906 $225,480
a. The Corporation has established reserves at the Resort Casinos in accordance with their respective operating agreements, or other terms as otherwise agreed to, for the following purposes:
(i) Capital renewals reserves – for property, plant and equipment additions other than normal repairs, and to satisfy specified obligations in the event that cash flows will be insufficient to meet such obligations;
(ii) Operating reserves – to satisfy specified operating obligations in the event that cash flows will be insufficient to meet such obligations; and
(iii) Severance reserves – to satisfy certain obligations of the Corporation arising from the termination or layoff of employees of an operator in connection with the termination of an operator.
b. Given the continuing negative cash flows at Caesars Windsor, the Corporation and the operator of Caesars Windsor have agreed that both the operating and capital renewals reserves at Caesars Windsor, totalling $4,173,000 at March 31, 2014 (March 31, 2013 – $17,000), although contractually set aside for the above uses, are available to fund current operations.
c. Prize funds on deposit of $39,615,000 (March 31, 2013 - $39,891,000) are funds set aside representing the estimate of gross prizes outstanding of $70,979,000 (March 31, 2013 – $70,652,000) less an estimate for prizes not expected to be claimed by consumers of $31,364,000 (March 31, 2013 – $30,761,000).
d. Other restricted cash includes interest earned and received at March 31, 2014. At March 31, 2013, the balance included unspent term loan proceeds representing restricted cash used for construction purposes at Caesars Windsor and for the renovation and expansion at Ajax Downs and Woodbine Racetrack. These funds were returned to Ontario Financing Authority during fiscal 2013–14.
PUBLIC ACCOUNTS, 2013-2014 2-105

Ont
ario
Lot
tery
and
Gam
ing
Cor
pora
tion
Not
es to
the
Con
solid
ated
Fin
anci
al S
tate
men
ts
Years
ende
d M
arc
h 3
1,
20
14 a
nd 2
013
(t
abula
r am
ounts
in
tho
usa
nds o
f C
ana
dia
n d
olla
rs)
9. P
rope
rty,
pla
nt a
nd e
quip
men
t
Cos
t
La
nd
Bui
ldin
gs
Furn
iture
, fix
ture
s an
d eq
uipm
ent
Leas
ehol
d im
prov
emen
ts
Lotte
ry
gam
ing
asse
ts
OLG
Slo
ts
and
Cas
inos
ga
min
g as
sets
Ass
ets
unde
r fin
ance
leas
e C
onst
ruct
ion
in p
rogr
ess
and
asse
ts n
ot
yet i
n us
e
Tota
l
Bal
ance
at A
pril
1,
2012
$13
7,8
24
$1,8
94
,747
$59
1,8
36
$60
3,5
08
$84
,13
1
$60
9,1
67
$48
,28
7
$49
,72
9
$4,0
19
,229
Additio
ns a
nd a
ssets
put in
to u
se
-
5,5
01
32,2
81
23,5
04
458
42,5
68
5,3
72
(3
,292
) 106
,39
2
Dis
posals
and
re
tire
men
ts
- (1
,128
) (2
5,4
90)
(2,0
45
) (2
) (5
4,7
92)
- (4
56)
(83
,91
3)
Bal
ance
at M
arch
31,
20
13
$13
7,8
24
$1,8
99
,120
$59
8,6
27
$62
4,9
67
$84
,58
7
$59
6,9
43
$53
,65
9
$45
,98
1
$4,0
41
,708
Bal
ance
at A
pril
1,
2013
$13
7,8
24
$1,8
99
,120
$59
8,6
27
$62
4,9
67
$84
,58
7
$59
6,9
43
$53
,65
9
$45
,98
1
$4,0
41
,708
Additio
ns a
nd a
ssets
put in
to u
se
-
3,1
06
34,2
32
13,4
93
93
54,0
27
6,8
37
(5
,829
) 105
,95
9
Dis
posals
and
re
tire
men
ts
- (1
,016
) (4
6,8
61)
(5,1
16
) -
(51
,25
4)
- (7
60)
(10
5,0
07
)
Bal
ance
at M
arch
31,
20
14
$13
7,8
24
$1,9
01
,21
0
$58
5,9
98
$63
3,3
44
$84
,68
0
$59
9,7
16
$60
,49
6
$39
,39
2
$4,0
42
,660
2-106 PUBLIC ACCOUNTS, 2013-2014

Ont
ario
Lot
tery
and
Gam
ing
Cor
pora
tion
Not
es to
the
Con
solid
ated
Fin
anci
al S
tate
men
ts
Years
ende
d M
arc
h 3
1,
20
14 a
nd 2
013
(t
abula
r am
ounts
in
tho
usa
nds o
f C
ana
dia
n d
olla
rs)
9.
Prop
erty
, pla
nt a
nd e
quip
men
t (co
ntin
ued)
Accu
mul
ated
am
ortiz
atio
n an
d ac
cum
ulat
ed im
pairm
ent l
osse
s
La
nd
Bui
ldin
gs
Furn
iture
, fix
ture
s an
d eq
uipm
ent
Leas
ehol
d im
prov
emen
ts
Lotte
ry
gam
ing
asse
ts
OLG
Slo
ts
and
Cas
inos
ga
min
g as
sets
Ass
ets
unde
r fin
ance
leas
e C
onst
ruct
ion
in p
rogr
ess
and
asse
ts n
ot
yet i
n us
e
Tota
l
Bal
ance
at A
pril
1,
2012
$41
,09
1
$9
70,9
54
$47
4,6
71
$44
5,1
92
$66
,50
5
$42
1,8
76
$14
,41
6
- $2,4
34
,705
Am
ort
ization f
or
the
peri
od
-
54,4
59
42,8
70
72,9
13
6,4
73
67,6
35
3,0
99
-
247
,44
9
Dis
posal a
nd
retire
men
ts
- (5
56)
(24
,76
1)
(1,4
73
) (1
) (5
3,9
98)
- -
(80
,78
9)
Bal
ance
at M
arch
31,
20
13
$41
,09
1
$1,0
24
,857
$49
2,7
80
$51
6,6
32
$72
,97
7
$43
5,5
13
$17
,51
5
- $2,6
01
,365
Bal
ance
at A
pril
1,
2013
$41
,09
1
$1,0
24
,857
$49
2,7
80
$51
6,6
32
$72
,97
7
$43
5,5
13
$17
,51
5
- $2,6
01
,365
Am
ort
ization f
or
the
peri
od
-
51,0
35
34,4
80
14,8
56
6,0
43
76,0
11
4,8
05
-
187
,23
0
Imp
airm
ent lo
ss
- -
17,4
57
-
- -
9,9
72
-
27,4
29
Dis
posal a
nd
retire
men
ts
- (7
96)
(45
,45
3)
(4,3
97
) -
(50
,94
9)
- -
(10
1,5
95
)
Bal
ance
at M
arch
31,
20
14
$41
,09
1
$1,0
75
,096
$49
9,2
64
$52
7,0
91
$79
,02
0
$46
0,5
75
$32
,29
2
- $2,7
14
,429
PUBLIC ACCOUNTS, 2013-2014 2-107

Ont
ario
Lot
tery
and
Gam
ing
Cor
pora
tion
Not
es to
the
Con
solid
ated
Fin
anci
al S
tate
men
ts
Years
ende
d M
arc
h 3
1,
20
14 a
nd 2
013
(t
abula
r am
ounts
in
tho
usa
nds o
f C
ana
dia
n d
olla
rs)
9.
Prop
erty
, pla
nt a
nd e
quip
men
t (co
ntin
ued)
Car
ryin
g am
ount
s
La
nd
Bui
ldin
gs
Furn
iture
, fix
ture
s an
d eq
uipm
ent
Leas
ehol
d im
prov
emen
ts
Lotte
ry
gam
ing
asse
ts
OLG
Slo
ts
and
Cas
inos
ga
min
g as
sets
Ass
ets
unde
r fin
ance
leas
e C
onst
ruct
ion
in p
rogr
ess
and
asse
ts n
ot
yet i
n us
e
Tota
l
Bal
ance
at M
arch
31,
20
13
$96
,73
3
$87
4,2
63
$10
5,8
47
$10
8,3
35
$11
,61
0
$16
1,4
30
$36
,14
4
$45
,98
1
$1,4
40
,343
Bal
ance
at M
arch
31,
20
14
$96
,73
3
$82
6,1
14
$86
,73
4
$10
6,2
53
$5,6
60
$13
9,1
41
$28
,20
4
$39
,39
2
$1,3
28
,231
2-108 PUBLIC ACCOUNTS, 2013-2014
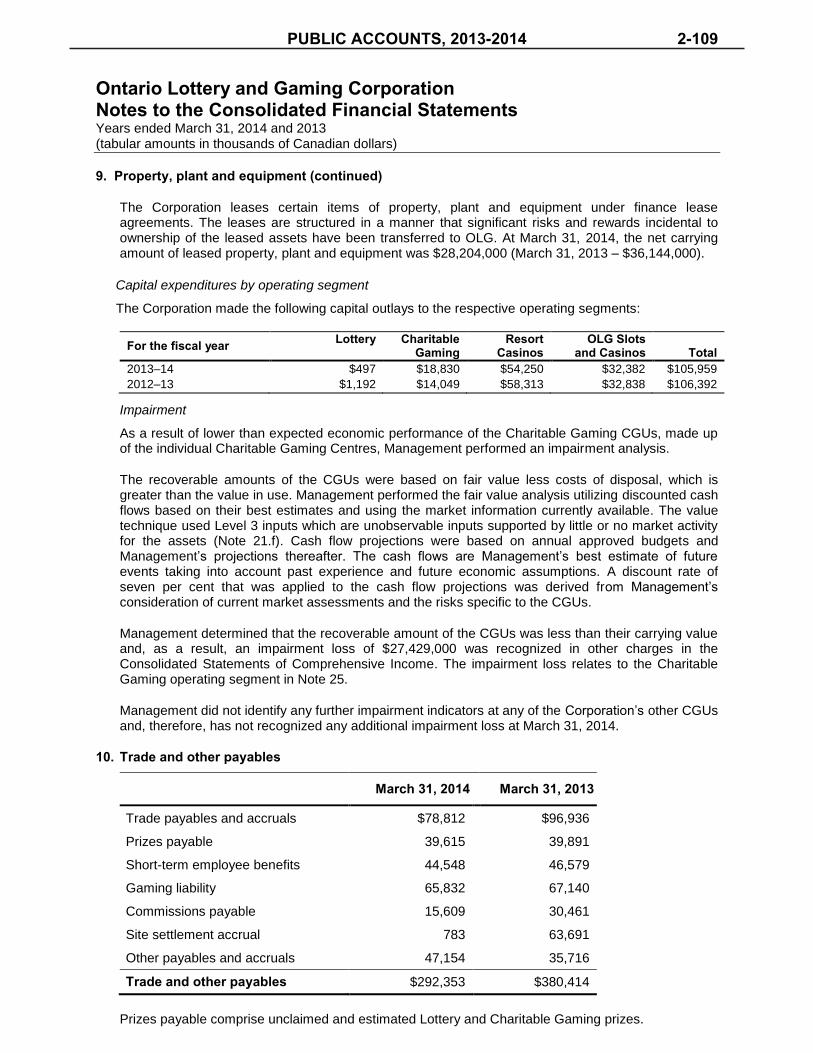
Ontario Lottery and Gaming Corporation Notes to the Consolidated Financial Statements Years ended March 31, 2014 and 2013 (tabular amounts in thousands of Canadian dollars)
9. Property, plant and equipment (continued)
The Corporation leases certain items of property, plant and equipment under finance lease agreements. The leases are structured in a manner that significant risks and rewards incidental to ownership of the leased assets have been transferred to OLG. At March 31, 2014, the net carrying amount of leased property, plant and equipment was $28,204,000 (March 31, 2013 – $36,144,000).
Capital expenditures by operating segment
The Corporation made the following capital outlays to the respective operating segments:
For the fiscal year Lottery Charitable Gaming
Resort Casinos
OLG Slots and Casinos
Total
2013–14 $497 $18,830 $54,250 $32,382 $105,959
2012–13 $1,192 $14,049 $58,313 $32,838 $106,392
Impairment
As a result of lower than expected economic performance of the Charitable Gaming CGUs, made up of the individual Charitable Gaming Centres, Management performed an impairment analysis.
The recoverable amounts of the CGUs were based on fair value less costs of disposal, which is greater than the value in use. Management performed the fair value analysis utilizing discounted cash flows based on their best estimates and using the market information currently available. The value technique used Level 3 inputs which are unobservable inputs supported by little or no market activity for the assets (Note 21.f). Cash flow projections were based on annual approved budgets and Management’s projections thereafter. The cash flows are Management’s best estimate of future events taking into account past experience and future economic assumptions. A discount rate of seven per cent that was applied to the cash flow projections was derived from Management’s consideration of current market assessments and the risks specific to the CGUs.
Management determined that the recoverable amount of the CGUs was less than their carrying value and, as a result, an impairment loss of $27,429,000 was recognized in other charges in the Consolidated Statements of Comprehensive Income. The impairment loss relates to the Charitable Gaming operating segment in Note 25.
Management did not identify any further impairment indicators at any of the Corporation’s other CGUs and, therefore, has not recognized any additional impairment loss at March 31, 2014.
10. Trade and other payables
March 31, 2014 March 31, 2013
Trade payables and accruals $78,812 $96,936
Prizes payable 39,615 39,891
Short-term employee benefits 44,548 46,579
Gaming liability 65,832 67,140
Commissions payable 15,609 30,461
Site settlement accrual 783 63,691
Other payables and accruals 47,154 35,716
Trade and other payables $292,353 $380,414
Prizes payable comprise unclaimed and estimated Lottery and Charitable Gaming prizes.
PUBLIC ACCOUNTS, 2013-2014 2-109

Ontario Lottery and Gaming Corporation Notes to the Consolidated Financial Statements Years ended March 31, 2014 and 2013 (tabular amounts in thousands of Canadian dollars)
10. Trade and other payables (continued)
Short-term employee benefits include salaries payable, incentive accruals, long-term service awards, vacation pay accrual and other short-term employee-related liabilities.
Gaming liability consists of progressive jackpots, unredeemed chips, customer loyalty incentive points and other gaming-related payables. Progressive jackpots are measured based on the anticipated payout of the progressive jackpots. Unredeemed chips are funds deposited by customers before gaming play occurs for chips in the customer’s possession. Customer loyalty incentive points that are earned based on the volume of play and redeemable for complimentary goods and services and/or cash, are recognized as a liability and measured at the amount payable on demand.
Commissions payable include amounts payable to Lottery retailers, Charitable Gaming Centre service providers and municipalities that host an OLG Casino or Slots at Racetracks facility or Charitable Gaming Centre.
Site settlement accrual consists of the costs associated with negotiating new short-term binding agreements with site holders.
Other payables and accruals include accrued win contribution, casino customer deposits, security deposits and other amounts.
The Corporation’s exposure to currency and liquidity risks related to trade and other payables is disclosed in Note 21.
11. Provisions
All provisions are included in current liabilities. The carrying amount is as follows:
Legal claims
Restructuring provision
Other provisions Total
Balance at April 1, 2013 $1,863 $6,865 $3,391 $12,119
Increases and additional provisions 5,165 - 1,909 7,074
Amounts paid (3,842) (1,791) (657) (6,290)
Amounts reversed (800) (3,775) (693) (5,268)
Balance at March 31, 2014 $2,386 $1,299 $3,950 $7,635
Legal claims
The Corporation is, from time to time, involved in various legal proceedings of a character normally incidental to its business. Estimates, where appropriate, have been included in the Consolidated Statements of Financial Position. During fiscal 2013–14, an additional $5,165,000 of potential legal claims was accrued, with an offsetting reduction of $3,842,000 due to payments to claimants. The $800,000 of legal claims reversed in fiscal 2013–14 was due to the likelihood of the obligations becoming remote. The ultimate outcome or actual cost of settlement may vary significantly from the original estimates. Material obligations that have not been recognized as provisions, as the outcome is not probable or the amount cannot be reliably estimated, are disclosed as contingent liabilities, unless the likelihood of outcome is remote (Note 24).
2-110 PUBLIC ACCOUNTS, 2013-2014

Ontario Lottery and Gaming Corporation Notes to the Consolidated Financial Statements Years ended March 31, 2014 and 2013 (tabular amounts in thousands of Canadian dollars)
11. Provisions (continued)
Restructuring provision
During fiscal 2013–14, $1,791,000 of the accrued restructuring liabilities were paid and $3,775,000 of restructuring provisions were reversed as it was no longer likely they would be incurred. It is Management’s expectation the remaining amounts will be paid during fiscal 2014–15.
The recognition of these restructuring charges requires Management to make certain judgments and estimates regarding the nature, timing and amounts associated with these restructuring plans. Adjustments to the recognized amounts may be required to reflect actual experience or changes in future estimates.
Other provisions
Other provisions include provisions for decommissioning obligations and insurance claims.
The Corporation recognized a discounted liability associated with decommissioning obligations arising from terms in certain lease agreements regarding the exiting of leased properties at the end of the respective lease terms. This provision is associated with the retirement of tangible long-lived assets that results from the acquisition, construction, development and/or normal use of the assets. During fiscal 2013–14, an additional $399,000 of decommissioning obligations was recorded.
The Corporation recognizes a provision relating to insurance claims that the Corporation’s insurance provider has indicated are more than likely to be settled. The provision is measured based on the estimated amounts to be settled or actual deductible amounts for each claim that settlement is likely. During fiscal 2013–14, an additional $1,510,000 of insurance claims was accrued, $657,000 of claims were settled and $693,000 of accrued claims were reversed as it was no longer likely they would be incurred.
12. Personnel expenses
Total personnel expenses for the year ended March 31, 2014 amounted to $873,289,000 (March 31, 2013 – $892,470,000).
PUBLIC ACCOUNTS, 2013-2014 2-111
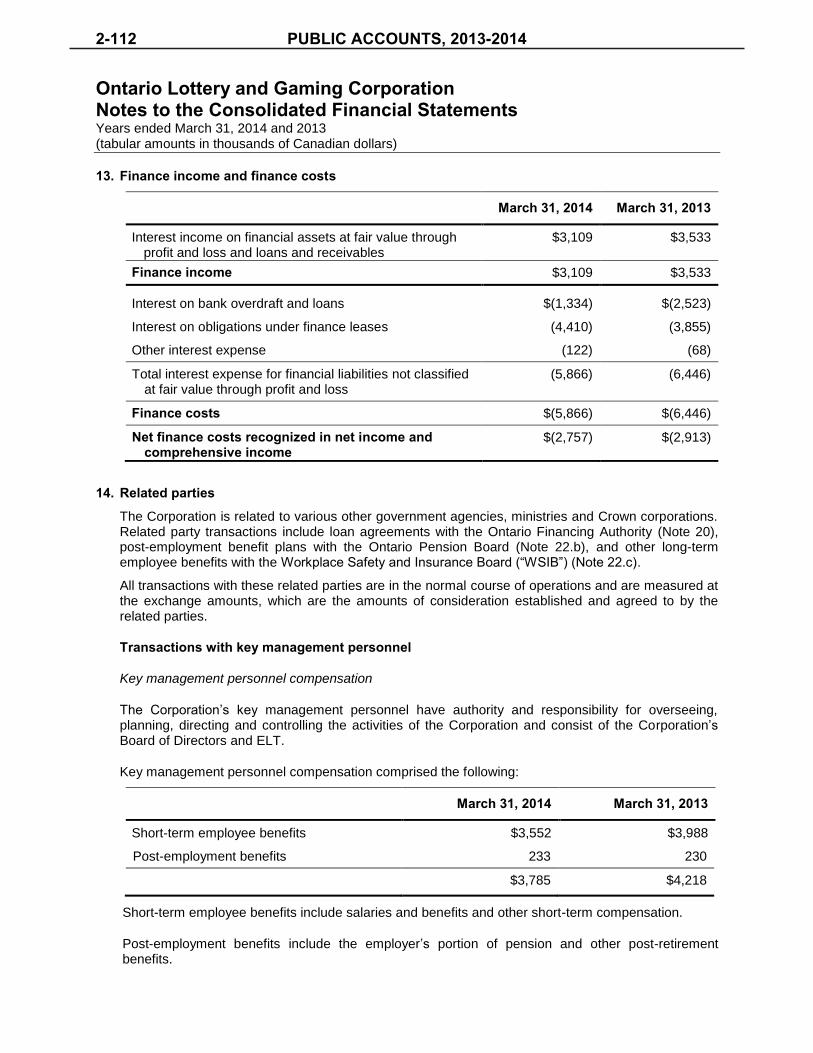
Ontario Lottery and Gaming Corporation Notes to the Consolidated Financial Statements Years ended March 31, 2014 and 2013 (tabular amounts in thousands of Canadian dollars)
13. Finance income and finance costs
March 31, 2014 March 31, 2013
Interest income on financial assets at fair value through profit and loss and loans and receivables
$3,109 $3,533
Finance income $3,109 $3,533
Interest on bank overdraft and loans
Interest on obligations under finance leases
Other interest expense
$(1,334)
(4,410)
(122)
$(2,523)
(3,855)
(68)
Total interest expense for financial liabilities not classified at fair value through profit and loss
(5,866)
(6,446)
Finance costs $(5,866) $(6,446)
Net finance costs recognized in net income and comprehensive income
$(2,757) $(2,913)
14. Related parties
The Corporation is related to various other government agencies, ministries and Crown corporations. Related party transactions include loan agreements with the Ontario Financing Authority (Note 20), post-employment benefit plans with the Ontario Pension Board (Note 22.b), and other long-term employee benefits with the Workplace Safety and Insurance Board (“WSIB”) (Note 22.c).
All transactions with these related parties are in the normal course of operations and are measured at the exchange amounts, which are the amounts of consideration established and agreed to by the related parties.
Transactions with key management personnel
Key management personnel compensation
The Corporation’s key management personnel have authority and responsibility for overseeing, planning, directing and controlling the activities of the Corporation and consist of the Corporation’s Board of Directors and ELT.
Key management personnel compensation comprised the following:
March 31, 2014 March 31, 2013
Short-term employee benefits $3,552 $3,988
Post-employment benefits 233 230
$3,785 $4,218
Short-term employee benefits include salaries and benefits and other short-term compensation.
Post-employment benefits include the employer’s portion of pension and other post-retirement benefits.
2-112 PUBLIC ACCOUNTS, 2013-2014

Ontario Lottery and Gaming Corporation Notes to the Consolidated Financial Statements Years ended March 31, 2014 and 2013 (tabular amounts in thousands of Canadian dollars)
15. Due to operators
Under the terms of the development and operating agreements for each of the Resort Casinos and the Great Blue Heron Slot Machine Facility, each operator is entitled to receive an operator’s fee calculated as a percentage of gross revenue and as a percentage of net operating margin, both as defined in each of the related development and operating agreements. The Resort Casinos, including Great Blue Heron Slot Machine Facility, and each of their respective operators are as follows:
Casino Niagara and Fallsview, operated by Falls Management Group, L.P., the general partner of which is Falls Management Company (owned by Niagara Casino Group, L.P., Highland Gaming, Inc., Shiplake Gaming Corporation, Olympic V, Inc. and 3048505 Nova Scotia Company) and the sole limited partner of which is Falls Entertainment Corporation.
The development and operating agreement expires June 10, 2019, subject to earlier termination and an automatic extension for a further period of ten years unless OLG elects not to extend the term.
Casino Rama, operated by CHC Casinos Canada Limited, an indirectly wholly owned subsidiary of Penn National Gaming, Inc. (“Penn”).
The Corporation and CHC Casinos Canada Limited along with other Penn-related entities entered into an interim operating agreement dated August 1, 2011 (the "Interim Operating Agreement"). The initial terms of the Interim Operating Agreement expired on September 30, 2012 and OLG exercised an option to extend the term on a month-to-month basis immediately following October 1, 2012, for up to a maximum period of 24 months. OLG may terminate the month-to-month arrangement at any time by providing two months’ advance written notice.
Caesars Windsor, operated by Caesars Entertainment Windsor Limited, a wholly owned subsidiary of Caesars Entertainment Corporation.
The development and operating agreement expires on July 31, 2020, subject to earlier termination.
Great Blue Heron Slot Machine Facility, operated by Great Blue Heron Gaming Company, owned by CAI Ontario Inc. and others.
The development and operating agreement, which was set to expire on June 28, 2013, was extended on a month-to-month basis for up to a maximum period of 24 months.
As at March 31, 2014, the amount due to operators was $38,575,000 (March 31, 2013 – $45,666,000).
At each of the Resort Casinos and the Great Blue Heron Slot Machine Facility, the operator is the employer of the employees working at that facility. All payroll and payroll-related costs are charged to the Corporation on a monthly basis and expensed in the Corporation’s Consolidated Statements of Comprehensive Income and included in amounts disclosed in Note 12.
Also included in the amounts due to operators are:
a) Niagara Falls
Under the terms of the Niagara Falls Permanent Casino Operating Agreement, in a Competitive Environment, as defined, the operator is entitled to receive additional Operator services fees and an Attractor fee. The Attractor fee is calculated, as defined, to allow for the amortization of the total capital contribution of the operator to external attractors of $30,000,000, including a convention centre and a people mover. As at March 31, 2014, the Attractor fee accrual included in due to operators was $3,823,000 (March 31, 2013 – $4,528,000). The Corporation’s remaining commitment as at March 31, 2014 is $14,336,000.
PUBLIC ACCOUNTS, 2013-2014 2-113

Ontario Lottery and Gaming Corporation Notes to the Consolidated Financial Statements Years ended March 31, 2014 and 2013 (tabular amounts in thousands of Canadian dollars)
15. Due to operators (continued)
b) Caesars Windsor
Under the terms of a trademark licence agreement for the rebranding of Caesars Windsor, the Corporation pays a licence fee calculated as a percentage of the revenue and operating results, as defined, of Caesars Windsor. The trademark licence agreement, with a wholly-owned indirect subsidiary of CEWL, will terminate on July 31, 2020 or on such earlier date as CEWL or its subsidiary ceases to be the operator of Caesars Windsor. As at March 31, 2014, the amount included in due to operator in respect of the trademark licence agreement was $266,000 (March 31, 2013 – $2,957,000).
16. Due to Rama First Nation
a. Casino Rama is located on reserve lands of Rama First Nation under the authority of a 25-year sublease (expiring in March 2021) between the Corporation and Casino Rama Inc., a wholly owned subsidiary of Rama First Nation. The lands are leased by Casino Rama Inc. from Her Majesty the Queen in Right of Canada under a 25-year lease, which expires in March 2021. Annual rent payable under this lease, adjusted for inflation, is paid out of the gross revenue of the Casino Rama Complex to Rama First Nation in accordance with instructions from Aboriginal Affairs and Northern Development Canada as representative for Her Majesty the Queen. During the year, $4,866,000 was expensed (March 31, 2013 – $4,821,000) and included in facilities expense in Note 25.
b. The terms of various agreements provide for the designation and leasing of Additional Parking Lands, as defined, by Rama First Nation to Casino Rama with an annual rent payable of approximately $1,700,000, adjusted for inflation. While the designation and leases are not yet complete, the lands are permitted and currently in use at Casino Rama for parking. During the year, $2,185,000 was expensed (March 31, 2013 – $2,164,000) and included in facilities expense in Note 25.
c. On January 26, 2010, the Corporation and Rama First Nation announced that they had entered into an agreement dated July 17, 2009, relating to Casino Rama for the 20-year period commencing August 1, 2011 and relating to possible future development (the “Post-2011 Contract”). The key terms of the Post-2011 Contract, relevant to the Corporation, are as follows:
(i) The term of the Post-2011 Contract continues until July 31, 2031, subject to earlier termination or the exercise by the Corporation of two successive options to extend the Post-2011 Contract for successive extension periods of ten years and five years, respectively. The Post-2011 Contract shall terminate on March 14, 2021 if Rama First Nation and Casino Rama Inc. do not replace the existing surrenders and permits with a new surrender or establish a land management regime on or before December 31, 2015;
(ii) Rama First Nation shall be entitled to receive an annual fee for each successive twelve-month period commencing August 1, 2011 in an amount equal to the greater of 1.9 per cent of the Gross Revenues of the Casino Rama Complex, as defined, and $5,500,000; and
(iii) The Corporation agreed to contribute $2,000,000 towards the capital cost of a gaming and executive development training centre upon presentation to and acceptance by the Corporation of a detailed business plan and development concept.
During the year, $7,394,000 was expensed in connection with the Post-2011 Contract (March 31, 2013 – $7,961,000) and included in facilities expense in Note 25. As at March 31, 2014, $580,000 (March 31, 2013 – $674,000) was due to Rama First Nation.
2-114 PUBLIC ACCOUNTS, 2013-2014

Ontario Lottery and Gaming Corporation Notes to the Consolidated Financial Statements Years ended March 31, 2014 and 2013 (tabular amounts in thousands of Canadian dollars)
16. Due to Rama First Nation (continued)
d. In connection with the Post-2011 Contract, Rama First Nation and the Corporation entered into agreements relating to the provision of fire protection and policing services to the Casino Rama Complex for a term commencing on August 1, 2011 and terminating on July 31, 2031, unless otherwise extended.
Payments made to Rama First Nation in connection with fire protection and policing services, snow removal services and water and sewer services amounted to $7,137,000 for the year ended March 31, 2014 (March 31, 2013 – $7,014,000). These payments were included in general and administration expenses in Note 25. At March 31, 2014, $1,285,000 (March 31, 2013 – $1,377,000) was due to Rama First Nation.
e. Pursuant to the terms of the Post-2011 Contract, a company related to Rama First Nation and the Corporation agreed to enter into a lease for the rental of office space for a term commencing on August 1, 2011 and terminating on July 31, 2014. An amount of $745,000 was expensed in fiscal 2013–14 (fiscal 2012–13 – $738,000) and is included in general and administration expenses in Note 25.
Pursuant to the terms of the Post-2011 Contract, a company related to Rama First Nation and the Corporation entered into a lease for warehouse space for a term commencing on August 1, 2011 and terminating on March 13, 2021. An amount of $375,000 was expensed in fiscal 2013–14 (fiscal 2012–13– $372,000) and is included in general and administration expenses in Note 25.
f. Under the Letter of Agreement entered into by the Corporation in January 2007 regarding the management and administration of leasehold improvement projects at Casino Rama, Rama First Nation contracts directly with the contractors selected by the Corporation. During the year, $308,000 (March 31, 2013 – $2,320,000) was paid to Rama First Nation under this Letter of Agreement to pay contractors involved in the acquisition of leasehold improvements. At March 31, 2014, $107,000 (March 31, 2013 – $141,000) is due to Rama First Nation.
g. The Corporation and Rama First Nation executed a letter of intent as of September 7, 2011, as amended and restated by an amended and restated letter of intent executed as of May 31, 2012 (collectively, the "Letter of Intent") which set out, among other things, the principal terms and conditions with respect to the planning and proposed construction, development and location of the Employee Parking Lot. During fiscal 2013–14, $nil (fiscal 2012–13 – $2,662,000) was paid out of the capital reserve account to Rama First Nation under the Letter of Intent.
Pursuant to the Letter of Intent, and in connection with the Post-2011 Contract, the Corporation and Casino Rama Inc. entered into an Employee Parking Lot Licence dated May 31, 2012, which terminates concurrently with the termination of the Post-2011 Contract (unless the permit underlying the licensed lands is terminated earlier in accordance with its terms). During fiscal 2013–14, $505,000 (March 31, 2013 – $417,000) was paid to Casino Rama Inc. under the Employee Parking Lot Licence.
17. Win contribution
The Corporation remits a contribution to the Province of Ontario equal to 20 per cent of gaming revenue from the Resort Casinos and the Great Blue Heron Slot Machine Facility in accordance with the Ontario Lottery and Gaming Corporation Act, 1999, which amounted to $245,461,000 for fiscal 2013–14 (fiscal 2012–13 – $257,056,000) and was recorded as an operating expense.
PUBLIC ACCOUNTS, 2013-2014 2-115

Ontario Lottery and Gaming Corporation Notes to the Consolidated Financial Statements Years ended March 31, 2014 and 2013 (tabular amounts in thousands of Canadian dollars)
18. Due to the Government of Canada
As at March 31, 2014, the amount due to the Government of Canada was $15,735,000 (March 31, 2013 – $17,954,000). The recognition of this obligation requires Management to make certain estimates regarding the nature, timing and amounts associated with the Due to the Government of Canada.
a. Payments on behalf of the Province of Ontario
The provincial lottery corporations make payments to the Government of Canada under an agreement dated August 1979 between the provincial governments and the Government of Canada. The agreement stipulates that the Government of Canada will not participate in the sale of lottery tickets.
b. Goods and Services Tax / Harmonized Sales Tax (“GST/HST”)
As a prescribed registrant, the Corporation makes GST/HST remittances to the Government of Canada pursuant to the Games of Chance (GST/HST) Regulations of the Excise Tax Act. The Corporation's net tax for a reporting period is calculated using net tax attributable to both gaming and non-gaming activities.
The net tax attributable to non-gaming activities is calculated similar to any other GST/HST registrant in Canada. The non-recoverable GST/HST payable to suppliers and the additional imputed tax payable to the Government of Canada on gaming-related expenses were recognized as payments to the Government of Canada.
The net tax attributable to gaming activities results in a 26 per cent tax burden on most taxable gaming expenditures incurred by the Corporation.
19. Other charges
March 31, 2014 March 31, 2013
Site settlement (a) $ - $80,682
Impairment charge (b) 27,429 -
Other charges $27,429 $80,682
a. Site settlement
The Corporation incurred site settlement costs of $80,682,000 for the year ended March 31, 2013, as a result of negotiating the new short-term binding agreements with site holders as disclosed in Note 4.f(iii). Part of the costs incurred were $16,991,000 of loans receivable that were settled on a non-cash basis and an additional $63,691,000 in compensatory costs. The payable for site settlement costs is disclosed in Note 10.
b. Impairment charge
The Corporation recognized an impairment loss for the year ended March 31, 2014 of $27,429,000 (March 31, 2013 - $nil), as disclosed in Note 9.
2-116 PUBLIC ACCOUNTS, 2013-2014

Ontario Lottery and Gaming Corporation Notes to the Consolidated Financial Statements Years ended March 31, 2014 and 2013 (tabular amounts in thousands of Canadian dollars)
20. Long-term debt
March 31, 2014 March 31, 2013
Caesars Windsor loan (a) $ - $32,345
Ajax Downs loan (b) - 7,052
Woodbine loan (c) 32,279 53,069
Obligations under finance leases (d) 51,792 47,711
84,071 140,177
Less: current portion (15,275) (51,571)
Long-term Debt $68,796 $88,606
On June 1, 2012, the Province of Ontario amended the Ontario Lottery and Gaming Corporation Act, 1999 to require the Corporation to finance certain capital expenditures with debt obtained from the Ontario Financing Authority. The approval of the Minister of Finance is required for the Corporation to borrow funds for major capital expenditures.
a. Caesars Windsor loan
In November 2008, the Corporation entered into a loan agreement with the Ontario Financing Authority for purposes of financing the renovation and expansion of Caesars Windsor and for financing the construction of the Windsor Clean Energy Centre (the “Energy Centre”). The Energy Centre was constructed to provide electricity, heating and cooling to the expanded Caesars Windsor facilities. The initial loan balance of $226,483,000 plus interest was repayable over five years in equal monthly payments of $4,092,206. The loan had interest at a rate of 3.2 per cent per annum and was unsecured. The loan was repaid during fiscal 2013–14.
b. Ajax Downs loan
In June 2009, the Corporation entered into a loan agreement with the Ontario Financing Authority for purposes of financing the renovation and expansion of the slots facility at Ajax Downs. The initial loan balance of $18,524,000 plus interest was repayable over five years in equal monthly payments of $327,941. The loan had an interest at a rate of 2.4 per cent per annum and was unsecured. The loan was repaid during fiscal 2013–14.
c. Woodbine loan
In October 2010, the Corporation entered into a loan agreement with the Ontario Financing Authority for purposes of financing the renovation and expansion (in two phases, Phase A and Phase B), of the slots facility at Woodbine Racetrack.
Phase A construction was completed and the related construction loan facility was converted to a term loan in May 2011. The initial loan balance for Phase A of $31,269,000, plus interest is repayable over five years in equal monthly payments of $560,904 until fiscal 2014–15 when the equal monthly payment changes to $384,913 due to a lump sum payment made in fiscal 2013–14. The loan bears interest at a rate of 2.931 per cent per annum and is unsecured.
Phase B construction was completed during fiscal 2012–13 and the related construction loan facility was converted to a term loan in January 2013. The initial loan balance for Phase B of $33,802,000, plus interest is repayable over five years in equal monthly payments of $597,222 until fiscal 2014–15 when the equal monthly payment changes to $514,690 due to a lump sum payment made in fiscal 2013–14. The loan bears interest at a rate of 2.32 per cent per annum and is unsecured.
PUBLIC ACCOUNTS, 2013-2014 2-117

Ontario Lottery and Gaming Corporation Notes to the Consolidated Financial Statements Years ended March 31, 2014 and 2013 (tabular amounts in thousands of Canadian dollars)
20. Long-term debt (continued)
d. Obligations under finance leases
Effective March 2010, the Corporation entered into an amending agreement for an additional 15-year lease term with Maple Leaf Entertainment Inc., Canadian Niagara Hotels Inc., 1032514 Ontario Limited and Greenberg International Inc., to lease the facility which houses Casino Niagara and to license the adjacent parking facilities. The amending agreement extends the term of the original lease and license agreements by an additional term of 15 years from March 10, 2010 to March 9, 2025. This agreement is considered to be a finance lease for accounting purposes and has an implicit interest rate of 8.2 per cent. The total remaining obligation under the finance lease is $40,736,000 at March 31, 2014 (March 31, 2013 – $42,665,000).
During fiscal 2012–13, the Corporation entered into a five year lease arrangement for the use of BOT dispensers. This agreement is considered to be a finance lease for accounting purposes and has an implicit interest rate of 9.0 per cent. The total remaining obligation under the finance lease is $11,056,000 at March 31, 2014 (March 31, 2013 – $5,046,000).
e. Payments over the next five years and thereafter
Payments related to long-term debt and obligations under finance leases that are expected to be made over the next five years and thereafter are approximately as follows:
March 31 Long-term debt Obligations under finance leases Total
Repayments Principal Interest
2015 $10,106 $5,169 $4,260 $19,535
2016 10,371 4,871 3,808 19,050
2017 6,733 4,619 3,408 14,760
2018 5,069 5,559 2,965 13,593
2019 - 4,344 2,510 6,854
Thereafter - 27,230 7,632 34,862
$32,279 $51,792 $24,583 $108,654
21. Financial risk management and financial instruments
a. Overview
The Corporation has exposure to credit risk, liquidity risk and market risk from its use of financial instruments. This note presents information about the Corporation’s exposure to each of the above risks and the Corporation’s objectives, policies and processes for measuring and managing these risks.
b. Risk management framework
The Board of Directors, through its Audit and Risk Management Committee ("ARMC"), provides oversight with respect to the identification and management of risk along with adherence to internal risk management policies and procedures. For the period of May 2013 to April 2014, the ARMC met regularly whereby all the members of the Board of Directors were members of the ARMC.
2-118 PUBLIC ACCOUNTS, 2013-2014

Ontario Lottery and Gaming Corporation Notes to the Consolidated Financial Statements Years ended March 31, 2014 and 2013 (tabular amounts in thousands of Canadian dollars)
21. Financial risk management and financial instruments (continued)
b. Risk management framework (continued)
The Corporation’s financial risk management policies are established to identify and analyze the risks faced by the Corporation, to set appropriate risk limits and controls and to monitor risks and adherence to limits. Risk management policies and systems are reviewed regularly to reflect changes in market conditions and the Corporation’s activities. The Corporation, through its training and management standards and procedures, aims to develop a disciplined and constructive control environment in which all employees understand their roles and obligations.
During fiscal 2013–14, the ARMC oversaw how Management monitored compliance with the Corporation’s risk management policies and procedures and reviewed the adequacy of the risk management framework in relation to the risks faced by the Corporation. The ARMC was assisted in its oversight role by Internal Audit. Internal Audit undertakes both regular and ad hoc reviews of risk management controls and procedures, the results of which are reported to the ARMC.
c. Credit risk
Credit risk is the risk that the Corporation will suffer a financial loss due to a third party failing to meet its financial or contractual obligations with the Corporation. The Corporation has financial instruments that potentially expose it to a concentration of credit risk. The instruments consist of trade and other receivables and liquid investments.
Trade and other receivables
Trade and other receivables include credit provided to retailers of lottery products, Charitable Gaming Centre service providers and customers of Resort Casinos. The Corporation performs ongoing credit evaluations of retailers, Charitable Gaming Centre service providers and customers and maintains reserves for potential credit losses on accounts receivable balances. The carrying amount of these financial assets represents the maximum credit exposure.
The amounts disclosed in the Consolidated Statements of Financial Position are net of allowances for impairment, which consist of a specific provision that relates to individually significant exposures, estimated by Management based on prior experience and its assessment of the current economic environment. The Corporation establishes an allowance for impairment that represents its estimate of potential credit losses. Historically, the Corporation has not experienced any significant losses. As at March 31, 2014, the Corporation had an allowance for impairment of $3,890,000 (March 31, 2013 – $4,597,000), which represented approximately 3.9 per cent (March 31, 2013 – 4.1 per cent) of the Corporation’s consolidated accounts receivable. The Corporation believes that its allowance for impairment is sufficient to reflect the related credit risk.
Liquid investments
The Corporation limits its exposure to credit risk by investing only in short-term debt securities with high credit ratings and minimal market risk. The Corporation has a formal policy in place for short-term investments which provides direction for Management to minimize risk. All investments held by the Corporation are low-risk and have a term to maturity of less than 90 days, and as a result, the risk is considered minimal.
PUBLIC ACCOUNTS, 2013-2014 2-119
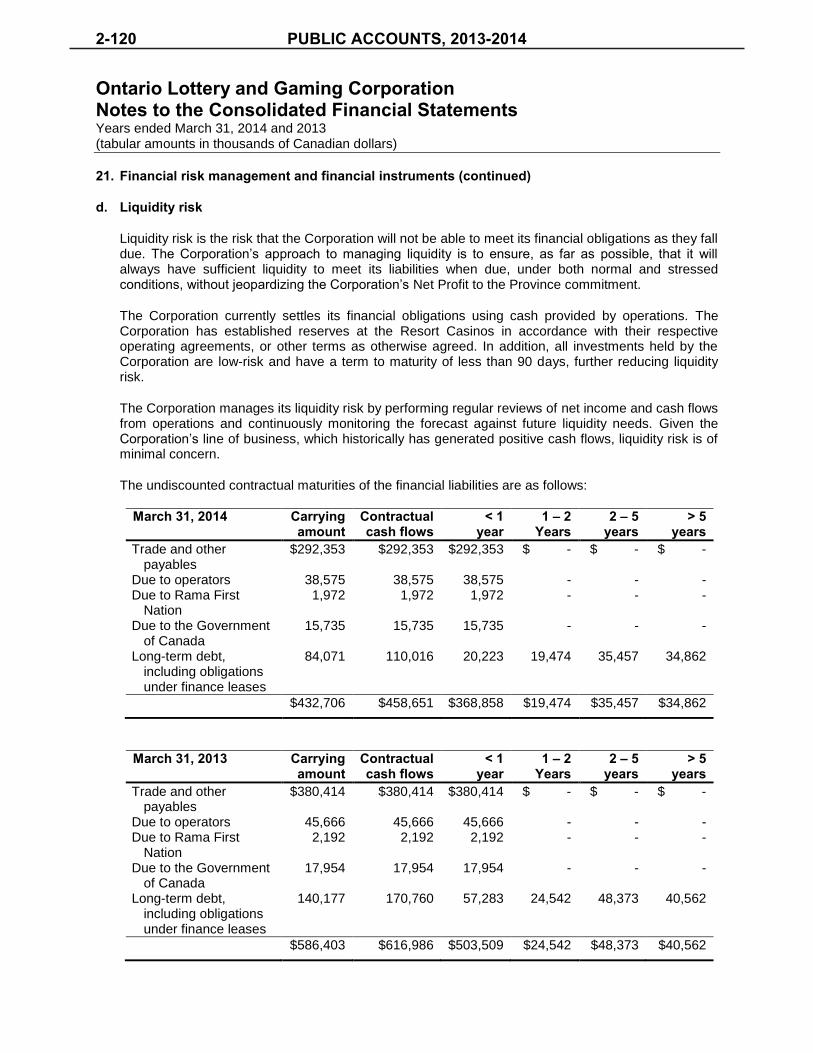
Ontario Lottery and Gaming Corporation Notes to the Consolidated Financial Statements Years ended March 31, 2014 and 2013 (tabular amounts in thousands of Canadian dollars)
21. Financial risk management and financial instruments (continued)
d. Liquidity risk
Liquidity risk is the risk that the Corporation will not be able to meet its financial obligations as they fall due. The Corporation’s approach to managing liquidity is to ensure, as far as possible, that it will always have sufficient liquidity to meet its liabilities when due, under both normal and stressed conditions, without jeopardizing the Corporation’s Net Profit to the Province commitment.
The Corporation currently settles its financial obligations using cash provided by operations. The Corporation has established reserves at the Resort Casinos in accordance with their respective operating agreements, or other terms as otherwise agreed. In addition, all investments held by the Corporation are low-risk and have a term to maturity of less than 90 days, further reducing liquidity risk.
The Corporation manages its liquidity risk by performing regular reviews of net income and cash flows from operations and continuously monitoring the forecast against future liquidity needs. Given the Corporation’s line of business, which historically has generated positive cash flows, liquidity risk is of minimal concern.
The undiscounted contractual maturities of the financial liabilities are as follows:
March 31, 2014 Carrying amount
Contractual cash flows
< 1 year
1 – 2 Years
2 – 5 years
> 5 years
Trade and other payables
$292,353 $292,353 $292,353 $ - $ - $ -
Due to operators 38,575 38,575 38,575 - - - Due to Rama First
Nation 1,972 1,972 1,972 - - -
Due to the Government of Canada
15,735 15,735 15,735 - - -
Long-term debt, including obligations under finance leases
84,071 110,016 20,223 19,474 35,457 34,862
$432,706 $458,651 $368,858 $19,474 $35,457 $34,862
March 31, 2013 Carrying amount
Contractual cash flows
< 1 year
1 – 2 Years
2 – 5 years
> 5 years
Trade and other payables
$380,414 $380,414 $380,414 $ - $ - $ -
Due to operators 45,666 45,666 45,666 - - - Due to Rama First
Nation 2,192 2,192 2,192 - - -
Due to the Government of Canada
17,954 17,954 17,954 - - -
Long-term debt, including obligations under finance leases
140,177 170,760 57,283 24,542 48,373 40,562
$586,403 $616,986 $503,509 $24,542 $48,373 $40,562
2-120 PUBLIC ACCOUNTS, 2013-2014

Ontario Lottery and Gaming Corporation Notes to the Consolidated Financial Statements Years ended March 31, 2014 and 2013 (tabular amounts in thousands of Canadian dollars)
21. Financial risk management and financial instruments (continued)
e. Market risk
Market risk is the risk that the fair value of future cash flows of a financial instrument will fluctuate because of changes in market prices. Market risk includes interest rate risk, foreign currency risk and other market price risk.
(i) Interest rate risk
Interest rate risk is the risk that the fair value of future cash flows of a financial instrument will fluctuate due to changes in market interest rates. The Corporation has financial assets and liabilities that potentially expose it to interest rate risk.
The Corporation is subject to interest rate risk on its cash and cash equivalents, including short-term investments with maturity dates of less than 90 days, and long-term debt.
Long-term debt currently consists of one loan agreement entered into with the Ontario Financing Authority and obligations under finance leases. The obligations under finance leases (Note 20.d), and the term loan agreements have fixed interest rates for their entire terms and are currently subject to limited interest rate risk.
At March 31, 2014, the Corporation had cash and cash equivalents of $311,680,000 (March 31, 2013 – $377,290,000). The impact of fluctuations in interest rates is not significant and, accordingly, a sensitivity analysis of the impact of fluctuations in interest rates on net income has not been provided.
(ii) Foreign currency risk
Foreign currency risk is the risk that the value of a financial instrument will fluctuate due to changes in foreign exchange rates. The Corporation is exposed to foreign currency risk by settling certain obligations in foreign currencies, primarily in U.S. dollars (“USD”), and by holding bank accounts and investments in USD.
The majority of the Corporation’s suppliers and customers are based in Canada and, therefore, transact in Canadian dollars (“CAD”). Some suppliers and customers are based outside of Canada. The suppliers located outside of Canada typically transact in USD. The Corporation’s border properties attract U.S. players who are required to exchange their USD for CAD prior to play. The Corporation exchanges USD using the daily market exchange rate, and utilizes both a ‘buy’ and ‘sell’ rate. The Corporation holds USD cash and bank accounts for the purposes of transacting in USD with customers, as well as paying its U.S.-based suppliers. The balances held in USD are closely monitored to ensure future USD requirements are met. As a result, there is some exposure to foreign currency fluctuations and the Corporation’s foreign exchange gain for the year ended March 31, 2014 was $6,757,000 (March 31, 2013 – $7,896,000).
The Corporation does not enter into financial instruments for trading or speculative purposes.
PUBLIC ACCOUNTS, 2013-2014 2-121

Ontario Lottery and Gaming Corporation Notes to the Consolidated Financial Statements Years ended March 31, 2014 and 2013 (tabular amounts in thousands of Canadian dollars)
21. Financial risk management and financial instruments (continued)
e. Market risk (continued)
(ii) Foreign currency risk (continued)
The Corporation’s exposure to currency risk, based on the carrying amounts, is as follows:
USD March 31, 2014 March 31, 2013
Cash and cash equivalents $16,621 $19,957
Trade and other payables (3,524) (3,246)
Obligations under finance lease (11,056) (5,046)
Net exposure $2,041 $11,665
All USD balances are shown in CAD equivalents.
Sensitivity analysis
A 10 per cent increase in the value of the USD at March 31, 2014 would have increased net income by $204,000. A 10 per cent decrease in the value of the USD at March 31, 2014 would have had the equal but opposite effect. This analysis assumes that all other variables, including interest rates, remain constant.
(iii) Other market price risk
The Corporation offers sports-based lottery products in the marketplace. The Corporation manages risks associated with these products by setting odds for each event within a short time frame before the actual event, by establishing sales liability thresholds by sport, by providing credit management controls, by posting conditions and prize structure statements on OLG.ca and by limiting the aggregate amount of prizes that may be won on any given day for all sports-based products. The Corporation also has the authority to suppress sales of any game at any time when liability risk is a concern.
f. Fair values measurement
Financial instruments are measured subsequent to initial recognition at fair value, grouped into Levels 1 to 3 based on the degree to which the fair value is observable:
Level 1 fair value measurements are those derived from quoted prices (unadjusted) in active markets for identical assets or liabilities;
Level 2 fair value measurements are those derived from inputs other than quoted prices included within Level 1 that are observable for the asset or liability, either directly (e.g. as prices) or indirectly (e.g. derived from prices); and
Level 3 fair value measurements are those derived from valuation techniques that include inputs for the asset or liability that are not based on observable market data (unobservable inputs).
2-122 PUBLIC ACCOUNTS, 2013-2014

Ontario Lottery and Gaming Corporation Notes to the Consolidated Financial Statements Years ended March 31, 2014 and 2013 (tabular amounts in thousands of Canadian dollars)
21. Financial risk management and financial instruments (continued)
f. Fair values measurement (continued)
The Corporation has determined the fair value of its financial instruments as follows:
The Corporation’s financial instruments carried at fair value in the Consolidated Statements of Financial Position, which consist of cash and cash equivalents and restricted cash are valued using quoted market prices, which are included in Level 1.
The carrying amounts in the Consolidated Statements of Financial Position of trade and other payables, due to operators, due to Rama First Nation and due to the Government of Canada approximate fair values because of the short-term nature of these financial instruments or because they are payable on demand.
Trade and other receivables are carried at amortized cost using the effective interest method.
The fair value of the Corporation’s long-term debt, excluding obligations under finance leases, is not determinable given its related party nature and there is no observable market for the Corporation’s long-term debt. The obligations under finance leases are carried at amortized cost using the effective interest method.
There were no financial statement categories in Level 3 (valuation techniques using non-observable data) for the years ended March 31, 2014 or March 31, 2013.
Fair value estimates are made at a specific point in time, based on relevant market information and information about the financial instruments. These estimates are subjective in nature and involve uncertainties and matters of significant judgment and, therefore, cannot be determined with precision. Changes in assumptions could significantly affect the estimates.
22. Employee benefits
a. Defined contribution plans
The operators of the Resort Casinos and the Great Blue Heron Slot Machine Facility have created defined contribution pension plans for their employees. The pension expense for the period ended March 31, 2014 amounted to $19,336,000 (March 31, 2013 – $19,621,000).
b. Other post-employment benefit plans
The Corporation provides pension benefits for all its permanent employees and to non-permanent employees who elect to participate through the PSPF and the OPSEU Pension Fund, which are sole-sponsored defined benefit pension plans established by the Province of Ontario. The Province of Ontario controls all entities included in the PSPF and OPSEU Pension Plans. Contribution rates are set by the Public Service Pension Act, 1990, whereby the Corporation matches all regular contributions made by the member. The Corporation classified these plans as state plans whereby there is no contractual agreement or stated policy for charging the net defined benefit cost of the plans to the Corporation. As such, the Corporation accounts for these post-employment benefits as defined contribution plans and has recorded no additional liability for the plan deficit. The annual contributions made by the Corporation are recorded as an expense in the Consolidated Statements of Comprehensive Income. The Corporation’s contribution and pension expense during the year was $19,607,000 (March 31, 2013 – $20,073,000).
PUBLIC ACCOUNTS, 2013-2014 2-123

Ontario Lottery and Gaming Corporation Notes to the Consolidated Financial Statements Years ended March 31, 2014 and 2013 (tabular amounts in thousands of Canadian dollars)
22. Employee benefits (continued)
c. Other long-term employee benefits
As a Schedule 2 employer under the Workplace Safety and Insurance Act, 1997, (the “Act”), the Corporation is individually responsible for the full cost of accident claims filed by its workers. The WSIB maintains full authority over the claims entitlement process, and administers and processes claims payments on the Corporation’s behalf. WSIB liabilities for self-insured employers are reported in the Consolidated Statements of Financial Position.
The WSIB accrual at March 31, 2014 was $15,129,000 (March 31, 2013 – $15,698,000), of which $14,070,000 (March 31, 2013 – $14,442,000) is included in non-current employee benefits liability and $1,059,000 (March 31, 2013 – $1,256,000) is included in trade and other payables (Note 10). The accrued benefit costs are based on actuarial assumptions.
The operators of the Resort Casinos and the Great Blue Heron Slot Machine Facility are Schedule 1 employers under the Act and are not subject to the financial reporting requirements of self-insured employers.
d. Short-term employee benefits
Short-term employee benefits include salaries payable, incentive accruals, vacation accruals, severance accruals and other employee-related payables which have been recorded in trade and other payables (Note 10).
23. Commitments
a. Obligations under operating leases
The Corporation has entered into several operating leases for property and equipment. The future minimum lease payments are approximately, as follows:
March 31, 2014
No later than 1 year $32,503
Later than 1 year and not later than 5 years 93,836
Later than 5 years 21,315
$147,654
2-124 PUBLIC ACCOUNTS, 2013-2014

Ontario Lottery and Gaming Corporation Notes to the Consolidated Financial Statements Years ended March 31, 2014 and 2013 (tabular amounts in thousands of Canadian dollars)
23. Commitments (continued)
b. HST on lease commitments
The Corporation and the Resort Casinos have entered into several agreements to lease property, plant and equipment from the Corporation’s subsidiary and other external parties. The non-recoverable HST and the additional imputed tax on the gaming-related assets payable to the Government of Canada, as described in Note 18.b, on the future lease payments are approximately, as follows:
2015 $39,519 2016 32,125 2017 25,268 2018 20,117 2019 15,450
132,479 Thereafter 255,376
$387,855
c. Suppliers
The Corporation has computer hardware maintenance agreements with future payments as at March 31, 2014 of approximately:
2015 $8,930 2016 3,234 2017 2,849 2018 2,781 2019 669 Thereafter 1,665
$20,128
d. Caesars Windsor
In fiscal 2013–14, the Corporation transferred cash of $45,000,000 (fiscal 2012–13 – $60,500,000) to Caesars Windsor for its working capital requirements. The Corporation has committed to transfer up to $80,000,000 to Caesars Windsor in 2014–15 for working capital.
e. Casino Rama
As part of the Corporation’s fiscal 2012–13 capital budget, and in connection with the Post-2011 Contract, OLG approved six capital refresh projects (the “Refresh Project”) consisting of an overall gaming floor refresh, a new consolidated west-entrance and expanded high limits room, a poker room and slot expansion, a new entertainment restaurant/pub, a new centre bar and an expanded waste management/recycling area. As at March 31, 2014, the Corporation is committed to construction contracts totalling $3,187,000 associated with the Refresh Project.
PUBLIC ACCOUNTS, 2013-2014 2-125

Ontario Lottery and Gaming Corporation Notes to the Consolidated Financial Statements Years ended March 31, 2014 and 2013 (tabular amounts in thousands of Canadian dollars)
23. Commitments (continued)
f. OLG Slots and Casinos
Eleven of the Slots at Racetracks facilities have entered into short-term binding agreements commencing April 1, 2013 on a month-to-month basis. In addition, the Corporation entered into lease agreements with three facilities for terms of five years commencing April 1, 2013. Subsequent to March 31, 2014, the Corporation entered into a lease agreement with one of the 11 facilities mentioned above for a term of five years, also effective April 1, 2013 (Note 4.f(iii)). The Corporation is committed to make payments to occupy these premises which have been included in the obligations under operating leases disclosed above (Note 23.a).
g. Ontario First Nations (2008) Limited Partnership
On February 19, 2008, Her Majesty the Queen in Right of Ontario, the Corporation, the Ontario First Nations Limited Partnership (“OFNLP”) and Ontario First Nations (2008) Limited Partnership entered into the Gaming Revenue Sharing and Financial Agreement (“GRSFA”). Pursuant to the terms of the GRSFA and an Order-in-Council, the Corporation was directed to pay the Ontario First Nations (2008) Limited Partnership, commencing in fiscal 2011–12 and in each fiscal year during the remainder thereafter of the 20-year term, an amount equal to 1.7 per cent of the Gross Revenues of the Corporation, as defined (“Gaming Revenue Sharing Payment”). Pursuant to the GRSFA, during fiscal 2013–14, $119,877,000 was expensed (fiscal 2012–13 – $119,901,000) as Gaming Revenue Sharing Payment in Note 25.
24. Contingencies
a. On May 20, 2009, the Corporation was served with a statement of claim related to a class action for general damages and punitive damages for an amount yet to be determined. The statement of claim alleges that the Corporation was in breach of contract by not discontinuing the sales of certain INSTANT lottery game tickets once the top prizes were won. The action is at a very early stage, as no action has taken place since May 2009 and no class has been certified by the courts. The Corporation intends to vigorously defend itself. The outcome is undeterminable at this time and no amounts have been accrued in the Consolidated Statements of Financial Position as at March 31, 2014.
b. During fiscal 2012–13, OLG and the Province of Ontario were served with a Notice of Arbitration (the “Arbitration Matter”) from a third party asserting a $205,000,000 claim to certain cash generated by Casino Rama as at March 31, 2011 and the residual value of certain Casino Rama property and equipment. On January 22, 2014, the arbitrator delivered his reasons dismissing the third party’s claims in the Arbitration Matter entirely. The third party is now seeking to appeal the Arbitration Matter in the courts. The outcome of this proceeding is undeterminable at this time and no amounts have been accrued in the Consolidated Statements of Financial Position as at March 31, 2014.
c. The Corporation is, from time to time, involved in various legal proceedings of a character normally incidental to its business. The Corporation believes that the outcome of these outstanding claims will not have a material impact in its Consolidated Statements of Financial Position. Estimates, where appropriate, have been included in the Consolidated Statements of Financial Position, (Note 11); however, additional settlements, if any, concerning these contingencies will be accounted for as a charge in the Consolidated Statements of Comprehensive Income in the period in which the settlement occurs.
2-126 PUBLIC ACCOUNTS, 2013-2014

Ontario Lottery and Gaming Corporation Notes to the Consolidated Financial Statements Years ended March 31, 2014 and 2013 (tabular amounts in thousands of Canadian dollars)
25. Operating segments
The Corporation has four reportable segments, as described below, which are the Corporation’s strategic business units. The strategic business units are distinct revenue-generating business units that offer different products and services and are managed separately because they require different technologies and marketing strategies. The chief operating decision-maker, which is the Corporation’s ELT, reviews internal management reports on a monthly basis for each of the strategic business units and makes resource allocation decisions. The following summary describes the operations in each reportable segment:
Lottery derives its revenue from the sale of lottery products, which includes Lotto, INSTANT and Sports products.
Charitable Gaming derives its revenue from the sale of Charitable Gaming products.
Resort Casinos are full-service casinos that offer customers a variety of amenities in addition to slot and table games, including accommodations, entertainment and food and beverage services.
OLG Slots and Casinos are smaller gaming facilities. OLG Casinos offer slot and table games, as well as food and beverage services. OLG Slots are located at racetrack sites and include only slot games. Food and beverage services are also offered at the racetrack sites; however, at most of the locations, OLG is not the entity providing these services.
PUBLIC ACCOUNTS, 2013-2014 2-127

Ontario Lottery and Gaming Corporation Notes to the Consolidated Financial Statements Years ended March 31, 2014 and 2013 (tabular amounts in thousands of Canadian dollars)
25. Operating segments (continued)
(a) Net Profit to the Province (“NPP”) is the amount the Corporation returns to the Province of Ontario after stakeholder and other payments. NPP is calculated by adding back win contribution to segment profit (loss). The chief operating decision-maker, the ELT, considers NPP to be a key measure in evaluating decisions relating to the Corporation.
March 31, 2014
Lottery Charitable Gaming
Resort Casinos
OLG Slots and Casinos
Total
Revenues Gaming Non-gaming
$3,387,571
-
$73,817
-
$1,157,372
87,574
$1,948,843
15,201
$6,567,603
102,775
3,387,571 73,817 1,244,946 1,964,044 6,670,378 Expenses Non-gaming Gaming and lottery operations Prizes Commissions Marketing and promotion Operators’ fees Amortization General and administration Facilities
Gaming Revenue Sharing Payment
Win contribution (Note 17) Payments to the Government of Canada
-
109,778 1,865,202
240,700 57,904
- 10,781 54,506 8,344
55,887
- 99,730
-
21,819 20,079 31,534 3,869
- 5,904 9,267
482 2,676
-
9,412
219,383 244,449
- 30,069
144,737 60,779
111,093 92,607
124,653 25,861
231,414
84,137
36,326
272,621 -
81,922 101,861
4,991 59,452 88,129
170,918 35,453
14,047 88,612
255,709 648,667
1,885,281 384,225 308,371
65,770 187,230 244,509 304,397 119,877
245,461 281,891
2,502,832 105,042 1,369,182 954,332 4,931,388 Segment income (loss) before the undernoted
884,739 (31,225) (124,236) 1,009,712 1,738,990
Other income 1,539 - 15,536 28,314 45,389
Finance income 264 28 2,800 17 3,109 Finance costs (122) (838) (4,359) (547) (5,866)
Foreign exchange gain (loss) Other charges
- -
(1,279) (27,429)
7,226 -
810 -
6,757 (27,429)
Segment income (loss) $886,420 $(60,743) $(103,033) $1,038,306 $1,760,950 Add: Win contribution (Note 17) - - 231,414 14,047 245,461
Net Profit to the Province (a) $886,420 $(60,743) $128,381 $1,052,353 $2,006,411
2-128 PUBLIC ACCOUNTS, 2013-2014

Ontario Lottery and Gaming Corporation Notes to the Consolidated Financial Statements Years ended March 31, 2014 and 2013 (tabular amounts in thousands of Canadian dollars)
25. Operating segments (continued)
(a) Net Profit to the Province (“NPP”) is the amount the Corporation returns to the Province of Ontario after stakeholder and other payments. NPP is calculated by adding back win contribution to segment profit (loss). The chief operating decision-maker, the ELT, considers NPP to be a key measure in evaluating decisions relating to the Corporation.
26. Comparative figures
Certain comparative figures have been reclassified, where necessary, to reflect the current year’s presentation.
March 31, 2013
Lottery Charitable Gaming
Resort Casinos
OLG Slots and Casinos
Total
Revenues Gaming Non-gaming
$3,287,469
-
39,876
-
$1,212,639
84,506
$1,992,543
15,538
$6,532,527
100,044
3,287,469 39,876 1,297,145 2,008,081 6,632,571 Expenses Non-gaming Gaming and lottery operations Prizes Commissions Marketing and promotion Operators’ fees Amortization General and administration Facilities
Gaming Revenue Sharing Payment
Win contribution (Note 17) Payments to the Government of Canada
-
96,772 1,796,238
228,272 53,836
- 12,046 57,214 8,293
55,514
- 97,395
-
13,792 9,472
20,045 3,452
- 1,780 4,898
627 1,499
-
6,251
222,443 249,357
- -
149,612 68,824
111,816 104,220 116,567
25,922
242,231 82,041
36,860
258,466 -
389,475 90,290 4,022
121,807 89,254 78,250 36,966
14,825 77,277
259,303 618,387
1,805,710 637,792 297,190
72,846 247,449 255,586 203,737 119,901
257,056 262,964
2,405,580 61,816 1,373,033 1,197,492 5,037,921 Segment income (loss) before the undernoted
881,889 (21,940) (75,888) 810,589 1,594,650
Other income 1,075 - 15,584 23,325 39,984
Finance income 156 16 2,856 505 3,533 Finance costs (67) (126) (5,221) (1,032) (6,446)
Foreign exchange gain (loss) - (5) 6,906 995 7,896 Other charges - - - (80,682) (80,682)
Segment income (loss) $883,053 $(22,055) $(55,763) $753,700 $1,558,935 Add: Win contribution (Note 17) - - 242,231 14,825 257,056 Net Profit to the Province (a) $883,053 $(22,055) $186,468 $768,525 $1,815,991
PUBLIC ACCOUNTS, 2013-2014 2-129


STATEMENT OF MANAGEMENT’S RESPONSIBILITY FOR FINANCIAL INFORMATION Ontario Power Generation Inc.’s (OPG) management is responsible for the presentation and preparation of the
annual consolidated financial statements and Management’s Discussion and Analysis (MD&A).
The consolidated financial statements have been prepared in accordance with United States generally accepted
accounting principles (US GAAP) and the rules and regulations of the United States Securities and Exchange
Commission for annual financial statements, as required by Ontario Regulation 395/11, as amended, a regulation
under the Financial Administration Act (Ontario), effective January 1, 2012. The MD&A has been prepared in
accordance with the requirements of securities regulators, including National Instrument 51-102 of the Canadian
Securities Administrators and its related published requirements.
The consolidated financial statements and information in the MD&A necessarily include amounts based on informed
judgments and estimates of the expected effects of current events and transactions with appropriate consideration to
materiality. Something is considered material if it is reasonably expected to have a significant impact on the
Company’s earnings, cash flow, value of an asset or liability, or reputation. In addition, in preparing the financial
information we must interpret the requirements described above, make determinations as to the relevancy of
information to be included, and make estimates and assumptions that affect the reported information. The MD&A
also includes information regarding the impact of current transactions and events, sources of liquidity and capital
resources, operating trends, risks and uncertainties. Actual results in the future may differ materially from our present
assessment of this information because future events and circumstances may not occur as expected.
In meeting our responsibility for the reliability of the financial information, we maintain and rely on a comprehensive
system of internal controls and internal audits, including organizational and procedural controls and internal controls
over financial reporting. Our system of internal controls includes: written communication of our policies and
procedures governing corporate conduct and risk management; comprehensive business planning; effective
segregation of duties; delegation of authority and personal accountability; careful selection and training of personnel;
and accounting policies, which we regularly update. This structure ensures appropriate internal controls over
transactions, assets and records. We also regularly audit internal controls. These controls and audits are designed
to provide us with reasonable assurance that the financial records are reliable for preparing financial statements and
other financial information, assets are safeguarded against unauthorized use or disposition, liabilities are recognized,
and we are in compliance with all regulatory requirements.
Management, including the President and Chief Executive Officer (CEO) and Chief Financial Officer (CFO), is
responsible for maintaining disclosure controls and procedures (DC&P) and internal controls over financial reporting
(ICOFR). DC&P is designed to provide reasonable assurance that all relevant information is gathered and reported
to senior management, including the President and CEO and the CFO, on a timely basis so that appropriate
decisions can be made regarding public disclosure. ICOFR is designed to provide reasonable assurance regarding
the reliability of financial reporting and the preparation of the consolidated financial statements in accordance with US
GAAP.
An evaluation of the effectiveness of the design and operation of OPG’s DC&P and ICOFR was conducted as of
December 31, 2013. Accordingly, we, as OPG’s President and CEO and CFO, will certify OPG’s annual disclosure
documents filed with the Ontario Securities Commission, which includes attesting to the design and effectiveness of
OPG’s DC&P and ICOFR.
The Board of Directors, based on recommendations from its Audit and Finance Committee, reviews and approves the
consolidated financial statements and the MD&A, and oversees management’s responsibilities for the presentation
PUBLIC ACCOUNTS, 2013-2014 2-131
and preparation of financial information, maintenance of appropriate internal controls, management and control of
major risk areas, and assessment of significant and related party transactions.
The consolidated financial statements have been audited by Ernst & Young LLP, independent external auditors
appointed by the Board of Directors. The Independent Auditors’ Report outlines the auditors’ responsibilities and the
scope of their examination and their opinion on OPG’s consolidated financial statements. The independent external
auditors, as confirmed by the Audit and Finance Committee, had direct and full access to the Audit and Finance
Committee, with and without the presence of management, to discuss their audit and their findings therefrom, as to
the integrity of OPG’s financial reporting and the effectiveness of the system of internal controls.
Tom Mitchell Robin Heard President and Chief Executive Officer Interim Chief Financial Officer
March 6, 2014
2-132 PUBLIC ACCOUNTS, 2013-2014
INDEPENDENT
AUDITORS’ REPORT
To the Shareholder of Ontario Power Generation Inc.
We have audited the accompanying consolidated financial statements of Ontario Power Generation Inc., which
comprise the consolidated balance sheets as at December 31, 2013 and 2012, and the consolidated statements of
income, comprehensive income, cash flows, and changes in shareholder’s equity for the years then ended, and a
summary of significant accounting policies and other explanatory information.
Management's Responsibility for the Consolidated Financial Statements
Management is responsible for the preparation and fair presentation of these consolidated financial statements in
accordance with United States generally accepted accounting principles, and for such internal controls as
management determines is necessary to enable the preparation of consolidated financial statements that are free
from material misstatement, whether due to fraud or error.
Auditors' Responsibility
Our responsibility is to express an opinion on these consolidated financial statements based on our audits. We
conducted our audits in accordance with Canadian generally accepted auditing standards. Those standards require
that we comply with ethical requirements and plan and perform the audits to obtain reasonable assurance about
whether the consolidated financial statements are free from material misstatement.
An audit involves performing procedures to obtain audit evidence about the amounts and disclosures in the
consolidated financial statements. The procedures selected depend on the auditors' judgment, including the
assessment of the risks of material misstatement of the consolidated financial statements, whether due to fraud or
error. In making those risk assessments, the auditors consider internal controls relevant to the entity's preparation
and fair presentation of the consolidated financial statements in order to design audit procedures that are appropriate
in the circumstances, but not for the purpose of expressing an opinion on the effectiveness of the entity's internal
controls. An audit also includes evaluating the appropriateness of accounting policies used and the reasonableness
of accounting estimates made by management, as well as evaluating the overall presentation of the consolidated
financial statements.
We believe that the audit evidence we have obtained in our audits is sufficient and appropriate to provide a basis for
our audit opinion.
Opinion
In our opinion, the consolidated financial statements present fairly, in all material respects, the financial position of
Ontario Power Generation Inc. as at December 31, 2013 and 2012 and the results of its operations and its cash flows
for the years then ended in accordance with United States generally accepted accounting principles.
Toronto, Canada Ernst & Young LLP
March 6, 2014 Chartered Accountants,
Licensed Public Accountants
PUBLIC ACCOUNTS, 2013-2014 2-133

CONSOLIDATED STATEMENTS OF INCOME
Years Ended December 31 (millions of dollars except where noted) 2013 2012 Revenue (Note 16) 4,863 4,732 Fuel expense (Note 16) 708 755
Gross margin (Note 16) 4,155 3,977 Expenses (Note 16) Operations, maintenance and administration 2,747 2,648 Depreciation and amortization (Note 4) 963 664 Accretion on fixed asset removal and nuclear waste management 756 725 liabilities (Note 8) Earnings on nuclear fixed asset removal and nuclear waste management (628) (651) funds (Note 8) Property and capital taxes 53 47 Restructuring (Note 22) 50 3
3,941 3,436 Income before other income, interest and income taxes 214 541 Other income (Notes 16 and 19) (38) (10)
Income before interest and income taxes 252 551 Net interest expense (Note 7) 86 117
Income before income taxes 166 434 Income tax expense (Note 9) 31 67
Net income 135 367
Basic and diluted income per common share (dollars) 0.53 1.43
Common shares outstanding (millions) 256.3 256.3
See accompanying notes to the consolidated financial statements
2-134 PUBLIC ACCOUNTS, 2013-2014

CONSOLIDATED STATEMENTS OF COMPREHENSIVE INCOME
Years Ended December 31 (millions of dollars) 2013 2012
Net income 135 367
Other comprehensive income (loss), net of income taxes Net gain (loss) on derivatives designated as cash flow hedges
1 14 (11)
Reclassification to income of losses on derivatives designated as cash 13 18 flow hedges
2
Reclassification to income of amounts related to pension and other 42 27 post-employment benefits
3
Actuarial gain (loss) and past service credits on re-measurement of liabilities 226 (123) for pension and other post-employment benefits
4
Other comprehensive income (loss) for the year 295 (89) Comprehensive income 430 278 1 Net of income tax expenses of $3 million and recoveries of $1 million for 2013 and 2012, respectively.
2 Net of income tax expenses of $2 million and $1 million for 2013 and 2012, respectively.
3 Net of income tax expenses of $15 million and $8 million for 2013 and 2012, respectively.
4 Net of income tax expenses of $75 million and recoveries of $41 million for 2013 and 2012, respectively.
See accompanying notes to the consolidated financial statements
PUBLIC ACCOUNTS, 2013-2014 2-135
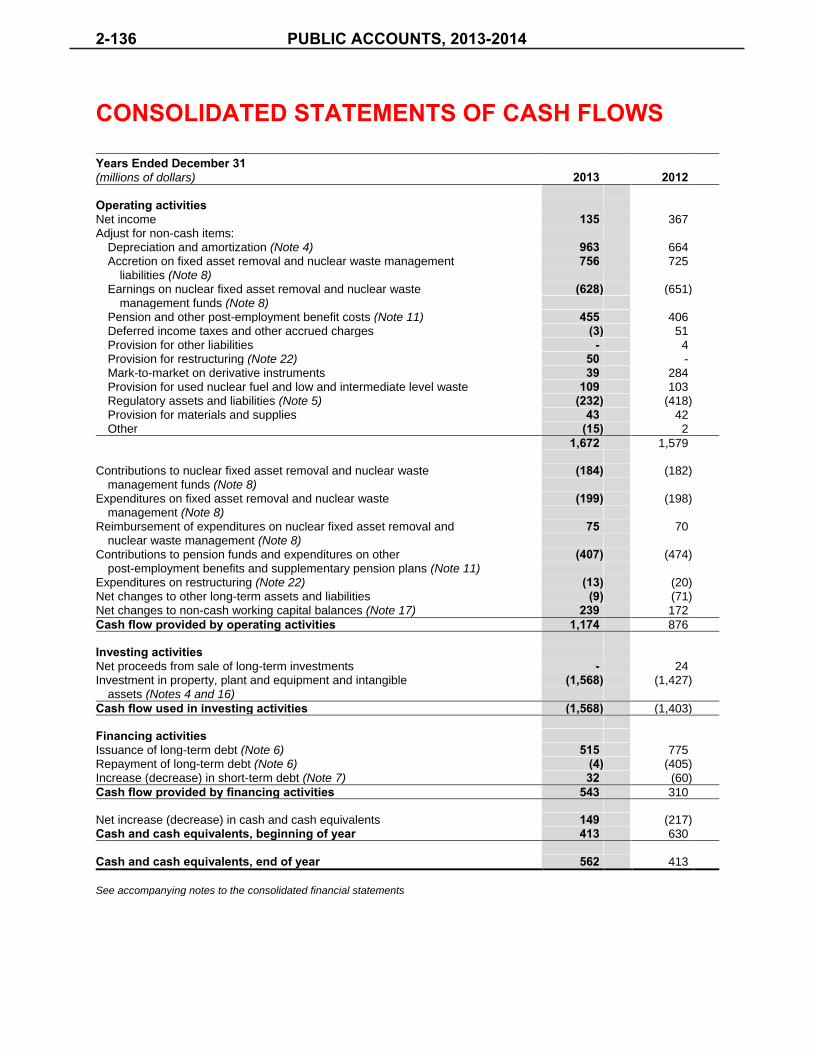
CONSOLIDATED STATEMENTS OF CASH FLOWS
Years Ended December 31 (millions of dollars) 2013 2012 Operating activities Net income 135 367 Adjust for non-cash items: Depreciation and amortization (Note 4) 963 664 Accretion on fixed asset removal and nuclear waste management 756 725 liabilities (Note 8) Earnings on nuclear fixed asset removal and nuclear waste (628) (651) management funds (Note 8) Pension and other post-employment benefit costs (Note 11) 455 406 Deferred income taxes and other accrued charges (3) 51 Provision for other liabilities - 4 Provision for restructuring (Note 22) 50 - Mark-to-market on derivative instruments 39 284 Provision for used nuclear fuel and low and intermediate level waste 109 103 Regulatory assets and liabilities (Note 5) (232) (418) Provision for materials and supplies 43 42 Other (15) 2
1,672 1,579 Contributions to nuclear fixed asset removal and nuclear waste (184) (182) management funds (Note 8) Expenditures on fixed asset removal and nuclear waste (199) (198) management (Note 8) Reimbursement of expenditures on nuclear fixed asset removal and 75 70 nuclear waste management (Note 8) Contributions to pension funds and expenditures on other (407) (474) post-employment benefits and supplementary pension plans (Note 11) Expenditures on restructuring (Note 22) (13) (20) Net changes to other long-term assets and liabilities (9) (71) Net changes to non-cash working capital balances (Note 17) 239 172
Cash flow provided by operating activities 1,174 876 Investing activities Net proceeds from sale of long-term investments - 24 Investment in property, plant and equipment and intangible (1,568) (1,427) assets (Notes 4 and 16)
Cash flow used in investing activities (1,568) (1,403) Financing activities Issuance of long-term debt (Note 6) 515 775 Repayment of long-term debt (Note 6) (4) (405) Increase (decrease) in short-term debt (Note 7) 32 (60)
Cash flow provided by financing activities 543 310 Net increase (decrease) in cash and cash equivalents 149 (217) Cash and cash equivalents, beginning of year 413 630
Cash and cash equivalents, end of year 562 413
See accompanying notes to the consolidated financial statements
2-136 PUBLIC ACCOUNTS, 2013-2014

CONSOLIDATED BALANCE SHEETS
As at December 31 (millions of dollars) 2013 2012 Assets Current assets Cash and cash equivalents 562 413 Receivables from related parties (Note 18) 402 442 Other accounts receivable and prepaid expenses 148 125 Nuclear fixed asset removal and nuclear waste management 25 27 funds (Notes 8 and 16) Fuel inventory (Note 16) 390 505 Materials and supplies (Note 16) 95 90 Regulatory assets (Note 5) 306 - Income taxes recoverable 51 63 Deferred income taxes (Note 9) - 68
1,979 1,733 Property, plant and equipment (Notes 4 and 16) 24,441 22,923 Less: accumulated depreciation 7,703 7,063
16,738 15,860 Intangible assets (Notes 4 and 16) 402 380 Less: accumulated amortization 343 328
59 52 Other assets Nuclear fixed asset removal and nuclear waste management funds (Notes 8 and 16) 13,471 12,690 Long-term materials and supplies (Note 16) 330 355 Regulatory assets (Note 5) 5,094 6,478 Investments subject to significant influence (Note 20) 359 373 Other long-term assets 61 60
19,315 19,956 38,091 37,601
See accompanying notes to the consolidated financial statements
PUBLIC ACCOUNTS, 2013-2014 2-137

CONSOLIDATED BALANCE SHEETS
As at December 31 (millions of dollars) 2013 2012 Liabilities Current liabilities Accounts payable and accrued charges (Note 18) 1,026 891 Short-term debt (Note 7) 32 - Deferred revenue due within one year 12 12 Deferred income taxes (Note 9) 14 - Long-term debt due within one year (Note 6) 5 5 Regulatory liabilities (Note 5) 16 -
1,105 908 Long-term debt (Note 6) 5,620 5,109
Other liabilities Fixed asset removal and nuclear waste management 16,257 15,522 liabilities (Notes 8 and 16) Pension liabilities (Note 11) 2,741 3,621 Other post-employment benefit liabilities (Note 11) 2,628 3,076 Long-term accounts payable and accrued charges 653 707 Deferred revenue 180 150 Deferred income taxes (Note 9) 565 563 Regulatory liabilities (Note 5) 8 41
23,032 23,680 Shareholder’s equity Common shares (Note 14)
1 5,126 5,126
Retained earnings 3,892 3,757 Accumulated other comprehensive loss (Note 10) (684) (979)
8,334 7,904 38,091 37,601 1 256,300,010 common shares outstanding at a stated value of $5,126 million as at December 31, 2013 and 2012.
Commitments and Contingencies (Notes 5, 6, 9, 11, 12, 13, and 15)
See accompanying notes to the consolidated financial statements
On behalf of the Board of Directors: Honourable Jake Epp M. George Lewis Chairman Director
2-138 PUBLIC ACCOUNTS, 2013-2014

CONSOLIDATED STATEMENTS OF CHANGES IN SHAREHOLDER’S EQUITY
Years Ended December 31 (millions of dollars except where noted) 2013 2012 Common shares (Note 14) 5126 5126
Retained earnings Balance at beginning of year 3757 3390 Net income 135 367
Balance at end of year 3892 3757 Accumulated other comprehensive loss, net of income taxes Balance at beginning of year (979) (890) Other comprehensive income (loss) for the year 295 (89)
Balance at end of year (684) (979) Total shareholder’s equity at end of year 8334 7904
See accompanying notes to the consolidated financial statements
PUBLIC ACCOUNTS, 2013-2014 2-139
NOTES TO THE CONSOLIDATED FINANCIAL STATEMENTS For the years ended December 31, 2013 and 2012
1. DESCRIPTION OF BUSINESS
Ontario Power Generation Inc. (OPG or the Company) was incorporated on December 1, 1998 pursuant to the
Business Corporations Act (Ontario) and is wholly owned by the Province of Ontario (the Province). OPG is an
Ontario-based electricity generation company whose principal business is the generation and sale of electricity in
Ontario. OPG’s mission is to be Ontario’s low cost electricity generator through a focus on three corporate strategies:
operational excellence, project excellence, and financial sustainability.
2. BASIS OF PRESENTATION
These consolidated financial statements have been prepared and presented in accordance with United States
generally accepted accounting principles (US GAAP) and the rules and regulations of the United States Securities
and Exchange Commission for annual financial statements, as required by Ontario Regulation 395/11, as amended,
a regulation under the Financial Administration Act (Ontario) (FAA) effective January 1, 2012.
During the first quarter of 2014, OPG received exemptive relief from the Ontario Securities Commission (OSC)
requirements of section 3.2 of National Instrument 52-107 Acceptable Accounting Policies and Auditing Standards.
The exemption allows OPG to file consolidated financial statements based on US GAAP without becoming a
Securities and Exchange Commission registrant, or issuing public debt. The exemption will terminate on the earliest
of the following:
January 1, 2019
the financial year that commences after OPG ceases to have activities subject to rate regulation
the effective date prescribed by the International Accounting Standards Board for the mandatory application of
a standard within International Financial Reporting Standards specific to entities with rate-regulated activities.
This exemption replaces the exemptive relief received by OPG from the OSC in December 2011. The 2011
exemption allowed OPG to file consolidated financial statements based on US GAAP for financial years that began
on or after January 1, 2012, but before January 1, 2015.
All dollar amounts are presented in Canadian dollars. Certain of the 2012 comparative amounts have been
reclassified from financial statements previously presented to conform to the 2013 consolidated financial statement
presentation.
3. SUMMARY OF SIGNIFICANT ACCOUNTING POLICIES
Consolidation
The consolidated financial statements of the Company include the accounts of OPG and its majority-owned
subsidiaries, and a variable interest entity (VIE) where OPG is the primary beneficiary. All significant intercompany
balances and intercompany transactions have been eliminated on consolidation.
Where OPG does not control an investment, but has significant influence over operating and financing policies of the
investee, the investment is accounted for under the equity method. OPG co-owns the Portlands Energy Centre
(PEC) gas-fired combined cycle generating station with TransCanada Energy Ltd. and co-owns the Brighton Beach
2-140 PUBLIC ACCOUNTS, 2013-2014

gas-fired combined cycle generating station with ATCO Power Canada Ltd. OPG accounts for its 50 percent
ownership interest in each of these jointly controlled entities under the equity method.
Variable Interest Entities
OPG performs ongoing analysis to assess whether it holds any VIEs. VIEs of which OPG is deemed to be the
primary beneficiary are consolidated. The primary beneficiary of a VIE has both the power to direct the activities of
the entity that most significantly impact its economic performance and the obligation to absorb losses of the entity that
could potentially be significant to the Company. In circumstances where OPG is not deemed to be the primary
beneficiary, the VIE is not recorded in OPG’s consolidated financial statements.
In 2002, OPG and other Canadian nuclear waste producers established the Nuclear Waste Management
Organization (NWMO) in accordance with the Nuclear Fuel Waste Act (NFWA). The primary long-term mandate of
the NWMO is to implement an approach to address the long-term management of used nuclear fuel. In addition to
the above mandate, the NWMO provides project management services for OPG’s Deep Geologic Repository project
for Low and Intermediate Level Waste (L&ILW) and other nuclear lifecycle liability management services. OPG has
the majority of voting rights at the Board of Directors’ and members’ level. In addition, the NFWA requires the nuclear
fuel waste owners to establish and make payments into trust funds for the purpose of funding the implementation of
the long-term management plan. OPG currently provides approximately 90 percent of NWMO’s funding, primarily
towards the Adaptive Phase Management plan for the long-term management of nuclear used fuel. As a result, OPG
is expected to absorb a majority of the NWMO’s expected losses through future funding in the event of any shortfall.
Therefore, OPG holds a variable interest in the NWMO, of which it is the primary beneficiary. Accordingly, the
applicable amounts in the accounts of the NWMO, after elimination of all significant intercompany transactions, are
consolidated.
Use of Management Estimates
The preparation of financial statements in conformity with US GAAP requires management to make estimates and
assumptions that affect the reported amounts of assets and liabilities at the date of the consolidated financial
statements, and the reported amounts of revenues and expenses during the reporting periods. Management
evaluates the Company’s estimates on an ongoing basis based upon historical experience, current conditions, and
assumptions believed to be reasonable at the time the assumption is made, with any adjustments recognized in the
period incurred. Significant estimates are included in the determination of pension and other post-employment
benefits (OPEB), asset retirement obligations (AROs), income taxes (including deferred income taxes),
contingencies, regulatory assets and liabilities, valuation of derivative instruments, depreciation and amortization
expenses, and inventories. Actual results may differ significantly from these estimates.
Cash and Cash Equivalents and Short-Term Investments
Cash and cash equivalents include cash on deposit and money market securities with a maturity of less than 90 days
on the date of purchase. All other money market securities with a maturity on the date of purchase that is greater
than 90 days, but less than one year, are recorded as short-term investments. These securities are valued at the
lower of cost and market.
Interest earned on cash and cash equivalents and short-term investments was $7 million in 2013 (2012 – $5 million)
at an average effective rate of 1.2 percent (2012 – 1.1 percent). The interest earned was offset against interest
expense in the consolidated statements of income.
Inventories
Inventories, consisting of fuel and materials and supplies, are measured at the lower of cost and market. Cost is
determined as weighted average cost for fuel inventory and average cost for materials and supplies.
PUBLIC ACCOUNTS, 2013-2014 2-141

Property, Plant and Equipment, Intangible Assets and Depreciation and Amortization
Property, plant and equipment, and intangible assets are recorded at cost. Interest costs incurred during construction
and development are capitalized as part of the cost of the asset based on the interest rates on OPG’s long-term debt.
Depreciation and amortization rates for the various classes of assets are based on their estimated service lives. Any
asset removal costs that have not been specifically provided for in current or previous periods are charged to
operations, maintenance and administration (OM&A) expenses. Repairs and maintenance costs are also expensed
when incurred.
Property, plant and equipment are depreciated on a straight-line basis except for computers, and transport and work
equipment. These are mostly depreciated on a declining balance basis. Intangible assets, which consist of major
application software, are amortized on a straight-line basis. As at December 31, 2013, the amortization periods of
property, plant and equipment and intangible assets are as follows:
Nuclear generating stations and major components 15 to 59 years
1
Thermal generating stations and major components 25 to 55 years Hydroelectric generating stations and major components 10 to 100 years Administration and service facilities 10 to 50 years Computers, and transport and work equipment assets – declining balance 9% to 40% per year Major application software 5 years Service equipment 5 to 10 years 1 As at December 31, 2013, the end of station life for depreciation purposes for the Darlington, Pickering, and Bruce A and B
nuclear generating stations ranges between 2019 and 2051. Major components are depreciated over the lesser of the station life and the life of the components.
Impairment of Long-Lived Assets
Long-lived assets are reviewed for impairment whenever events or changes in circumstances indicate that the
carrying amount of an asset may not be recoverable. The review is based on the presence of impairment indicators
such as the future economic benefit of the assets and external market conditions. The net carrying amount of assets
is considered impaired if it exceeds the sum of the estimated undiscounted cash flows expected to result from the
asset’s use and eventual disposition. In cases where the sum of the undiscounted expected future cash flows is less
than the carrying amount, an impairment loss is recognized. This loss equals the amount by which the carrying
amount exceeds the fair value. Fair value is determined using expected discounted cash flows when quoted market
prices are not available. The impairment is recognized in income in the period in which it is identified.
The carrying value of investments accounted for under the equity method are reviewed for the presence of any
indicators of impairment. If an impairment exists and is determined to be other-than-temporary, an impairment
charge is recognized. This charge equals the amount by which the carrying value exceeds the investment’s fair
value.
Rate Regulated Accounting
The Ontario Energy Board Act, 1998 and Ontario Regulation 53/05 provide that OPG receives regulated prices for
electricity generated from the Sir Adam Beck 1, 2 and Pump generating station, DeCew Falls 1 and 2, and R.H.
Saunders hydroelectric facilities, and the Pickering and Darlington nuclear facilities (prescribed or regulated facilities).
OPG’s regulated prices for these facilities are determined by the Ontario Energy Board (OEB). Forty-eight of OPG’s
currently unregulated hydroelectric generating facilities have been prescribed for rate regulation, effective July 1,
2014.
The OEB is a self-funding Crown corporation. Its mandate and authority come from the Ontario Energy Board Act,
1998, the Electricity Act, 1998, and a number of other provincial statutes. The OEB is an independent, quasi-judicial
tribunal that reports to the Legislature of the Province through the Minister of Energy. It regulates market participants
2-142 PUBLIC ACCOUNTS, 2013-2014

in the Province’s natural gas and electricity industries. The OEB carries out its regulatory functions through public
hearings and other more informal processes, such as consultations.
US GAAP recognizes that rate regulation can create economic benefits and obligations that are required by the
regulator to be obtained from, or settled with, the ratepayers. When the Company assesses that there is sufficient
assurance that incurred costs in respect of the regulated facilities will be recovered in the future, those costs are
deferred and reported as a regulatory asset. When the Company is required to refund amounts to ratepayers in the
future in respect of the regulated facilities, including amounts related to costs that have not been incurred and for
which the OEB has provided recovery through current regulated prices, the Company records a regulatory liability.
Certain of the regulatory assets and liabilities recognized by the Company relate to variance and deferral accounts
authorized by the OEB, including those authorized pursuant to Ontario Regulation 53/05. Variance accounts capture
differences between actual costs and revenues, and the corresponding forecast amounts approved in the setting of
regulated prices. The measurement of these regulatory assets and liabilities is subject to certain estimates and
assumptions, including assumptions made in the interpretation of Ontario Regulation 53/05 and the OEB’s decisions.
The estimates and assumptions made in the interpretation of the regulation and the OEB’s decisions are reviewed as
part of the OEB’s regulatory process.
Regulatory assets and liabilities for variance and deferral account balances approved by the OEB for inclusion in
regulated prices are amortized based on approved recovery periods. Disallowed balances, including associated
interest, are charged to operations in the period that the OEB’s decision is issued. Interest is applied to regulatory
balances as prescribed by the OEB, in order to recognize the cost of financing amounts to be recovered from, or
repaid to, ratepayers.
Regulatory asset and liabilities for variance and deferral account balances approved by the OEB are classified as
current if they are expected to be recovered from, or refunded to, ratepayers within 12 months of the end of the
reporting period, based on recovery periods established by the OEB. All other regulatory asset and liability balances
are classified as long-term on the consolidated balance sheets.
In addition to regulatory assets and liabilities for variance and deferral accounts authorized by the OEB, OPG
recognizes regulatory assets for unamortized amounts recorded in accumulated other comprehensive income (AOCI)
in respect of pension and OPEB obligations, and deferred income taxes, in order to reflect the expected recovery or
refund of the amounts in respect of the regulated operations through future regulated prices charged to customers.
There are measurement uncertainties related to these balances due to the assumptions made in the determination of
pension and OPEB obligations and deferred income taxes attributed to the regulated facilities.
See Notes 5, 8, 9, and 11 to these consolidated financial statements for additional disclosures related to the OEB’s
decisions, regulatory assets and liabilities, and rate regulated accounting.
Fixed Asset Removal and Nuclear Waste Management Liabilities
OPG recognizes AROs for fixed asset removal and nuclear waste management, discounted for the time value of
money. OPG estimates both the amount and timing of future cash expenditures based on current plans for fixed
asset removal and nuclear waste management. The liabilities are initially recorded at their estimated fair value, which
is based on a discounted value of the expected costs to be paid.
On an ongoing basis, the liabilities for nuclear fixed asset removal and nuclear waste management (Nuclear
Liabilities) are increased by the present value of the variable cost portion for the nuclear waste generated each year,
with the corresponding amounts charged to operating expenses. Variable expenses relating to low and intermediate
level nuclear waste are charged to OM&A expenses. Variable expenses relating to the management and storage of
nuclear used fuel are charged to fuel expense. The liabilities may also be adjusted due to any changes in the
estimated amount or timing of the underlying future cash flows. Upon settlement of the liabilities, a gain or loss would
be recorded.
PUBLIC ACCOUNTS, 2013-2014 2-143
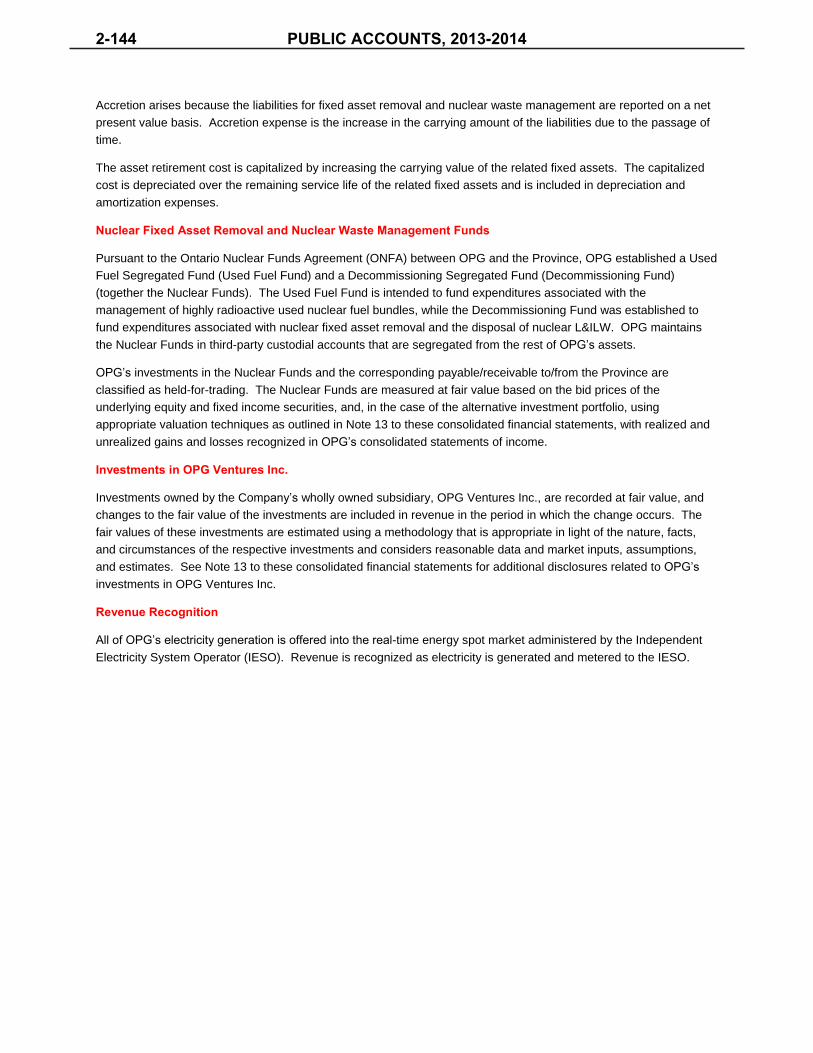
Accretion arises because the liabilities for fixed asset removal and nuclear waste management are reported on a net
present value basis. Accretion expense is the increase in the carrying amount of the liabilities due to the passage of
time.
The asset retirement cost is capitalized by increasing the carrying value of the related fixed assets. The capitalized
cost is depreciated over the remaining service life of the related fixed assets and is included in depreciation and
amortization expenses.
Nuclear Fixed Asset Removal and Nuclear Waste Management Funds
Pursuant to the Ontario Nuclear Funds Agreement (ONFA) between OPG and the Province, OPG established a Used
Fuel Segregated Fund (Used Fuel Fund) and a Decommissioning Segregated Fund (Decommissioning Fund)
(together the Nuclear Funds). The Used Fuel Fund is intended to fund expenditures associated with the
management of highly radioactive used nuclear fuel bundles, while the Decommissioning Fund was established to
fund expenditures associated with nuclear fixed asset removal and the disposal of nuclear L&ILW. OPG maintains
the Nuclear Funds in third-party custodial accounts that are segregated from the rest of OPG’s assets.
OPG’s investments in the Nuclear Funds and the corresponding payable/receivable to/from the Province are
classified as held-for-trading. The Nuclear Funds are measured at fair value based on the bid prices of the
underlying equity and fixed income securities, and, in the case of the alternative investment portfolio, using
appropriate valuation techniques as outlined in Note 13 to these consolidated financial statements, with realized and
unrealized gains and losses recognized in OPG’s consolidated statements of income.
Investments in OPG Ventures Inc.
Investments owned by the Company’s wholly owned subsidiary, OPG Ventures Inc., are recorded at fair value, and
changes to the fair value of the investments are included in revenue in the period in which the change occurs. The
fair values of these investments are estimated using a methodology that is appropriate in light of the nature, facts,
and circumstances of the respective investments and considers reasonable data and market inputs, assumptions,
and estimates. See Note 13 to these consolidated financial statements for additional disclosures related to OPG’s
investments in OPG Ventures Inc.
Revenue Recognition
All of OPG’s electricity generation is offered into the real-time energy spot market administered by the Independent
Electricity System Operator (IESO). Revenue is recognized as electricity is generated and metered to the IESO.
2-144 PUBLIC ACCOUNTS, 2013-2014
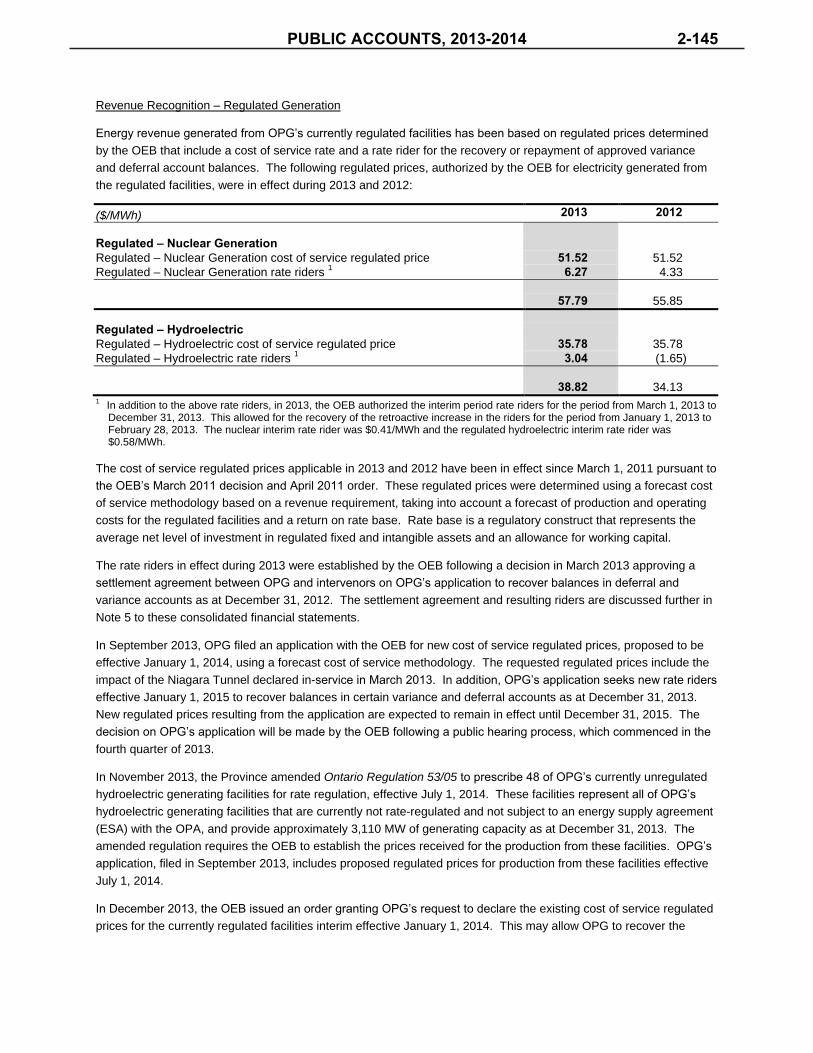
Revenue Recognition – Regulated Generation
Energy revenue generated from OPG’s currently regulated facilities has been based on regulated prices determined
by the OEB that include a cost of service rate and a rate rider for the recovery or repayment of approved variance
and deferral account balances. The following regulated prices, authorized by the OEB for electricity generated from
the regulated facilities, were in effect during 2013 and 2012:
($/MWh) 2013 2012 Regulated – Nuclear Generation Regulated – Nuclear Generation cost of service regulated price 51.52 51.52
Regulated – Nuclear Generation rate riders 1 6.27 4.33
57.79 55.85
Regulated – Hydroelectric Regulated – Hydroelectric cost of service regulated price 35.78 35.78
Regulated – Hydroelectric rate riders 1 3.04 (1.65)
38.82 34.13 1
In addition to the above rate riders, in 2013, the OEB authorized the interim period rate riders for the period from March 1, 2013 to December 31, 2013. This allowed for the recovery of the retroactive increase in the riders for the period from January 1, 2013 to February 28, 2013. The nuclear interim rate rider was $0.41/MWh and the regulated hydroelectric interim rate rider was $0.58/MWh.
The cost of service regulated prices applicable in 2013 and 2012 have been in effect since March 1, 2011 pursuant to
the OEB’s March 2011 decision and April 2011 order. These regulated prices were determined using a forecast cost
of service methodology based on a revenue requirement, taking into account a forecast of production and operating
costs for the regulated facilities and a return on rate base. Rate base is a regulatory construct that represents the
average net level of investment in regulated fixed and intangible assets and an allowance for working capital.
The rate riders in effect during 2013 were established by the OEB following a decision in March 2013 approving a
settlement agreement between OPG and intervenors on OPG’s application to recover balances in deferral and
variance accounts as at December 31, 2012. The settlement agreement and resulting riders are discussed further in
Note 5 to these consolidated financial statements.
In September 2013, OPG filed an application with the OEB for new cost of service regulated prices, proposed to be
effective January 1, 2014, using a forecast cost of service methodology. The requested regulated prices include the
impact of the Niagara Tunnel declared in-service in March 2013. In addition, OPG’s application seeks new rate riders
effective January 1, 2015 to recover balances in certain variance and deferral accounts as at December 31, 2013.
New regulated prices resulting from the application are expected to remain in effect until December 31, 2015. The
decision on OPG’s application will be made by the OEB following a public hearing process, which commenced in the
fourth quarter of 2013.
In November 2013, the Province amended Ontario Regulation 53/05 to prescribe 48 of OPG’s currently unregulated
hydroelectric generating facilities for rate regulation, effective July 1, 2014. These facilities represent all of OPG’s
hydroelectric generating facilities that are currently not rate-regulated and not subject to an energy supply agreement
(ESA) with the OPA, and provide approximately 3,110 MW of generating capacity as at December 31, 2013. The
amended regulation requires the OEB to establish the prices received for the production from these facilities. OPG’s
application, filed in September 2013, includes proposed regulated prices for production from these facilities effective
July 1, 2014.
In December 2013, the OEB issued an order granting OPG’s request to declare the existing cost of service regulated
prices for the currently regulated facilities interim effective January 1, 2014. This may allow OPG to recover the
PUBLIC ACCOUNTS, 2013-2014 2-145

difference between the approved new regulated prices and the current prices, for the period between January 1, 2014
and the issuance of the order establishing new regulated prices.
The existing hydroelectric regulated prices are subject to a hydroelectric incentive mechanism (HIM) approved by the
OEB, with a portion of the resulting net revenues shared with ratepayers. Under the mechanism, OPG receives the
approved regulated price for the actual monthly average net energy production per hour from the regulated
hydroelectric facilities, and in the hours where OPG’s actual net energy production in Ontario is greater or less than
the average net volume in the month, OPG’s regulated hydroelectric revenues are adjusted by the difference
between the average hourly net volume and OPG’s actual net energy production from the regulated hydroelectric
facilities multiplied by the spot market price. The Hydroelectric Incentive Mechanism Variance Account authorized by
the OEB captures net revenues from the HIM that are required to be returned to ratepayers. OPG’s September 2013
application proposes to continue the HIM with certain modifications.
Revenue Recognition – Unregulated Generation and Other Revenue
The electricity generation from OPG’s unregulated assets receives the Ontario electricity spot market price, except
where a cost recovery agreement or an ESA is in place.
The Lambton and Nanticoke generating stations during 2013 were subject to a Contingency Support Agreement with
the Ontario Electricity Financial Corporation (OEFC). The agreement was provided for the recovery of costs
associated with these coal-fired generating stations and maintaining these stations for reliability of supply to meet
system needs after the Shareholder’s resolution and regulations pertaining to carbon dioxide emission reductions.
On November 1, 2013, the OEFC provided written notice that would terminate the Contingency Support Agreement,
effective December 31, 2013, and triggered an amendment that allows OPG to recover certain costs for the 2014
year. Capacity provided by and production from one unit at Thunder Bay generating station was subject to a
Reliability Must Run contract for the period from January 1, 2013 to December 31, 2013. Capacity provided by, and
production from, the Lennox generating station was subject to an agreement with the OPA for the period from
January 1, 2011 to December 31, 2012. In December 2012, the OPA and OPG executed a long-term Lennox ESA
for the period from January 1, 2013 to September 30, 2022. The Lennox ESA allows the station to recover its costs,
including a reasonable return, in providing generating capacity to the Ontario electricity system over the next
10 years.
OPG currently has Hydroelectric ESAs with the OPA for the Lac Seul and Ear Falls generating stations, the Healey
Falls generating station, the Sandy Falls, Wawaitin, Lower Sturgeon, and Hound Chute generating stations, and the
Lower Mattagami River project. Payments under the Lower Mattagami Hydroelectric ESA commenced when the first
incremental unit was declared in service in January 2014.
Revenue generated by generating stations subject to a cost recovery agreement or an ESA is recognized in
accordance with the terms of the agreement or contract.
OPG also sells into, and purchases from, interconnected markets of other provinces and the United States (US)
northeast and midwest. All contracts that are not designated as hedges are recorded in the consolidated balance
sheets at market value, with gains or losses recorded in the consolidated statements of income. Gains and losses on
energy trading contracts (including those to be physically settled) are recorded on a net basis in the consolidated
statements of income. Accordingly, power purchases of $94 million were netted against revenue in 2013 (2012 –
$61 million).
OPG derives non-energy revenue under the terms of a lease arrangement and associated agreements with Bruce
Power L.P. related to the Bruce nuclear generating stations. This includes lease revenue and revenue from services
such as heavy water sales and detritiation. Revenue is also earned from isotope sales and ancillary services. The
minimum lease payments are recognized in revenue on a straight-line basis over the term of the lease.
2-146 PUBLIC ACCOUNTS, 2013-2014

In addition, non-energy revenue includes isotope sales, real estate rentals and other service revenues. Revenues
from these activities are recognized as services are completed, or as products are delivered.
Derivatives
All derivatives, including embedded derivatives that must be separately accounted for, generally are classified as
held-for-trading and recorded at fair value in the consolidated balance sheets. Transaction costs are expensed as
incurred for financial instruments classified or designated as held-for-trading.
Derivatives qualify for hedge accounting if they meet stringent documentation requirements and the derivative
instrument that is designated as a hedge is expected to effectively hedge the identified risk throughout the life of the
hedged item. At the inception of a hedging relationship, OPG documents the relationship between the hedging
instrument and the hedged item, its risk management objective and its strategy for undertaking the hedge. A
documented assessment is made, both at the inception of a hedge and on an ongoing basis, of whether or not the
derivatives that are used in hedging transactions are highly effective in offsetting the changes attributable to the
hedged risks in the fair values or cash flows of the hedged items.
Specifically for cash flow hedges, the portion of the derivative gain or loss that is effective in offsetting the change in
the cost or value of the underlying exposure is deferred in AOCI and later reclassified into net income when the
underlying transaction occurs. Gains and losses on interest rate hedges are recorded as an adjustment to interest
expense for the debt being hedged. Gains and losses that do not meet the effectiveness criteria are recorded in net
income in the period incurred. When a derivative instrument hedge ceases to be effective as a hedge or a hedged
item ceases to exist, any associated deferred gains or losses are derecognized from AOCI and are recognized in
income in the current period.
Some of OPG’s unregulated generation is exposed to changes in electricity prices associated with a wholesale spot
market for electricity in Ontario. All derivative contracts not designated as hedges are recorded on the consolidated
balance sheets as derivative assets or liabilities at fair value with changes in fair value recorded in the revenue of the
Other category. Refer to Note 12 for a discussion of OPG’s risks and the derivative instruments used to manage the
risks.
Fair Value Measurements
Fair value is the price that would be received to sell an asset or paid to transfer a liability in an orderly arm’s-length
transaction between market participants at the measurement date. Fair value measurements are required to reflect
the assumptions that market participants would use in pricing an asset or liability based on the best available
information. These assumptions include the risks inherent in a particular valuation technique, such as a pricing
model, and the risks inherent in the inputs to the model. OPG uses a fair value hierarchy, grouping financial assets
and liabilities into three levels based on the relative objectivity of the inputs used to measure fair value, with Level 1
representing the highest. Refer to Note 13 for a discussion of fair value measurements and the fair value hierarchy.
Foreign Currency Translation
Monetary assets and liabilities denominated in foreign currencies are translated into Canadian currency at exchange
rates prevailing at the consolidated balance sheets date. Any resulting gain or loss is reflected in revenue.
Research and Development
Research and development costs are expensed in the year incurred. Research and development costs incurred to
discharge long-term obligations, such as the nuclear waste management liabilities, for which specific provisions have
already been made, are charged to the related liability.
PUBLIC ACCOUNTS, 2013-2014 2-147

Leases
Leases are evaluated and classified as either operating or capital leases for financial reporting purposes. Capital
leases, which transfer substantially all of the risks and benefits incidental to ownership of the leased item, are
capitalized at the inception of the lease at the fair value of the leased property or, if lower, at the present value of the
minimum lease payments. Capital leases are depreciated over the shorter of the estimated useful life of the asset or
the lease term.
Leases where the lessor retains substantially all the risks and benefits incidental to ownership of the asset are
classified as operating leases. Operating lease payments, other than contingent rentals, are recognized as an
expense in the consolidated statements of income on a straight-line basis over the lease term. Where the amount of
rent expense recognized is less than the actual rental payments, the excess payment amount is recorded as deferred
revenue and included in liabilities on the consolidated balance sheets.
Pension and Other Post-Employment Benefits
OPG’s post-employment benefit programs consist of a contributory defined benefit registered pension plan, a defined
benefit supplementary pension plan, and other post-retirement benefits (OPRB) including group life insurance and
health care benefits, and long-term disability (LTD) benefits. Post-employment benefit programs are also provided by
the NWMO, which is consolidated into OPG’s financial results. Information on the Company’s post-employment
benefit programs is presented on a consolidated basis.
OPG accrues its obligations under pension and OPEB plans in accordance with US GAAP. The obligations for
pension and OPRB are determined using the projected benefit method pro-rated on service. The obligation for LTD
benefits is determined using the projected benefit method on a terminal basis. Pension and OPEB obligations are
impacted by factors including interest rates, adjustments arising from plan amendments, changes in demographic
assumptions, experience gains or losses, salary levels, inflation, and cost escalation. Pension and OPEB costs and
obligations are determined annually by independent actuaries using management’s best estimate assumptions.
Assumptions are significant inputs to actuarial models that measure pension and OPEB obligations and related
effects on operations. Two critical assumptions – discount rate and inflation – are important elements in the
determination of benefit costs and obligations. In addition, the expected return on plan assets is a critical assumption
in the determination of registered pension plan costs. These assumptions, as well as other assumptions involving
demographic factors such as retirement age, mortality, and employee turnover, are evaluated periodically by
management in consultation with independent actuaries. During the evaluation process, the assumptions are
updated to reflect past experience and expectations for the future. Actual results in any given year will often differ
from actuarial assumptions because of economic and other factors. In accordance with US GAAP, for pension and
OPRB, the impact of these updates and differences on the respective benefit obligations is accumulated and
amortized over future periods; for LTD benefits, the impact of these updates and differences is immediately
recognized as OPEB costs in the period incurred.
The discount rates, which are representative of AA corporate bond yields, are used to calculate the present value of
the expected future cash flows on the measurement date to determine the projected benefit obligations for the
Company’s employee benefit plans. A lower discount rate increases the benefit obligations and increases benefit
costs. The expected rate of return on plan assets is based on current and expected asset allocation, as well as the
expected return considering long-term historical risks and returns associated with each asset class within the plan
portfolio. A lower expected rate of return on plan assets increases pension cost.
Pension fund assets include equity securities, corporate and government debt securities, pooled funds, real estate,
infrastructure, and other investments. These assets are managed by professional investment managers. The funds
do not invest in equity or debt securities issued by OPG. Pension fund assets are valued using market-related values
for purposes of determining the amortization of actuarial gains or losses and the expected return on plan assets. The
2-148 PUBLIC ACCOUNTS, 2013-2014

market-related value recognizes gains and losses on equity assets relative to a six percent assumed real return over
a five-year period.
Pension and OPEB costs include current service costs, interest costs on the obligations, the expected return on
pension plan assets, adjustments for plan amendments and adjustments for actuarial gains or losses, which result
from changes in assumptions and experience gains and losses. Past service costs or credits arising from pension
and OPRB plan amendments are amortized on a straight-line basis over the expected average remaining service life
to full eligibility of the employees covered by the plan. Past service costs or credits arising from amendments to LTD
benefits are immediately recognized as OPEB costs in the period incurred. Due to the long-term nature of pension
and OPRB liabilities, the excess of the net cumulative unamortized gain or loss, over 10 percent of the greater of the
benefit obligation and the market-related value of the plan assets (corridor), is amortized over the expected average
remaining service life of the employees since OPG expects to realize the associated economic benefit over that
period. Actuarial gains or losses for LTD benefits are immediately recognized as OPEB costs in the period incurred.
OPG recognizes on its consolidated balance sheets the funded status of its defined benefit plans. The funded status
is measured as the difference between the fair value of plan assets and the benefit obligation on a plan-by-plan basis.
Actuarial gains or losses and past service costs or credits that arise during the year that are not recognized
immediately, as components of benefit costs are recognized as increases or decreases in other comprehensive
income (OCI), net of income taxes. These unamortized amounts in AOCI are subsequently reclassified and
recognized as components of pension and OPRB costs as discussed above.
OPG records an offsetting regulatory asset or liability for the portion of the adjustments to AOCI that is attributable to
regulated operations in order to reflect the expected recovery or refund of these amounts through future regulated
prices charged to customers. For the recoverable or refundable portion attributable to regulated operations, OPG
records a corresponding change in this regulatory asset or liability for the amount of the increases or decreases in
OCI and for the reclassification of AOCI amounts into benefit costs during the period.
When the recognition of the transfer of employees and employee-related benefits gives rise to both a curtailment and
a settlement, the curtailment is accounted for prior to the settlement. A curtailment is the loss by employees of the
right to earn future benefits under the plan. A settlement is the discharge of a plan’s liability.
Income Taxes and Investment Tax Credits
OPG is exempt from income tax under the Income Tax Act (Canada). However, under the Electricity Act, 1998, OPG
is required to make payments in lieu of corporate income taxes to the OEFC. These payments are calculated in
accordance with the Income Tax Act (Canada) and the Taxation Act, 2007 (Ontario), as modified by the Electricity
Act, 1998 and related regulations. This results in OPG effectively paying taxes similar to what would be imposed
under the federal and Ontario tax acts.
OPG follows the liability method of accounting for income taxes. Under the liability method, deferred income tax
assets and liabilities are determined based on differences between the accounting and tax bases of assets and
liabilities. Deferred amounts are measured using the enacted tax rates and laws that will be in effect when the
differences are expected to reverse. The effect of a change in tax rates on deferred income tax assets and liabilities
is included in income in the period the change is enacted.
If management determines that it is more likely than not that some, or all, of a deferred income tax asset will not be
realized, a valuation allowance is recorded to report the balance at the amount expected to be realized.
OPG recognizes deferred income taxes associated with its rate regulated operations and records an offsetting
regulatory asset or liability for the deferred income taxes that are expected to be recovered or refunded through future
regulated prices charged to customers.
PUBLIC ACCOUNTS, 2013-2014 2-149

Tax benefits associated with income tax positions taken, or expected to be taken, in a tax return and investment tax
credits are recorded only when the more likely than not recognition threshold is satisfied. Tax benefits and
investment tax credits recognized are measured at the largest amount of benefit that is greater than 50 percent likely
of being realized upon settlement.
Investment tax credits are recorded as a reduction to income tax expense. OPG classifies interest and penalties
associated with unrecognized tax benefits as income tax expense.
Changes in Accounting Policies and Estimates
Regulatory Assets Related to Newly Regulated Hydroelectric Facilities
Forty-eight of OPG’s currently unregulated hydroelectric facilities have been prescribed for rate regulation, effective
on July 1, 2014. Upon the effective date of the regulation, OPG expects to recognize additional regulatory assets
related to deferred income taxes, and unamortized amounts recorded in AOCI in respect of pension and OPEB
obligations. The recognition of the increase in regulatory assets related to deferred income taxes expected to be
recovered from customers through future regulated prices is expected to result in an extraordinary gain of
approximately $250 million in the consolidated statements of income. The additional regulatory assets related to
pension and OPEB obligations are expected to result in an increase of approximately $200 million in OCI, net of
income taxes.
Pension and Other Post-Employment Benefits
The weighted average discount rate used to determine the projected pension benefit obligations and the projected
benefit obligations for OPEB as at December 31, 2013 was 4.9 percent. This represents an increase, compared to
the 4.3 percent discount rate that was used to determine the obligations as at December 31, 2012.
In 2013, OPG conducted an actuarial valuation for accounting purposes for its pension and OPEB plans using
demographic data as at January 1, 2013, and assumptions as at December 31, 2013. As part of the valuation, the
plan’s demographic assumptions were reviewed and revised by independent actuaries. The revised assumptions
include the adoption of:
an updated OPG mortality table that captures the recent experience of OPG pension plan members
a new scale for expected rates of improvement in future mortality.
The deficit for the registered pension plans decreased from $3,332 million as at December 31, 2012 to $2,461 million
as at December 31, 2013 largely as a result of the increase in the discount rates at 2013 year end and the gain on
pension fund assets in 2013, partially offset by the impact of the new mortality assumptions.
The projected benefit obligations for OPEB decreased from $3,174 million at December 31, 2012 to $2,719 million as
at December 31, 2013. This decrease was largely due to the increase in the discount rates and the lower per capita
health care claims costs assumption. It was partially offset by the impact of the new mortality assumptions.
2-150 PUBLIC ACCOUNTS, 2013-2014

As a result of the accounting policy for pension and OPEB, as at December 31, 2013, the unamortized net actuarial
loss and unamortized past service costs for the pension and OPEB plans totalled $3,899 million (2012 –
$5,593 million). Details of the unamortized net actuarial loss and unamortized past service costs at December 31,
2013 and 2012 are as follows:
Other Post- Registered Supplementary Employment Pension Plans Pension Plans Benefits (millions of dollars) 2013 2012 2013 2012 2013 2012 Net actuarial (gain) loss not yet subject to (886) 91 - - - - amortization due to use of market-related values Net actuarial loss not subject to amortization 1,339 1,367 29 30 245 288 due to use of the corridor Net actuarial loss subject to amortization 3,043 3,079 50 72 78 662
Unamortized net actuarial loss 3,496 4,537 79 102 323 950
Unamortized past service costs - - - - 1 4
A change in assumptions, holding all other assumptions constant, would increase (decrease) 2013 costs as follows: Other Post- Registered Supplementary Employment (millions of dollars) Pension Plans 1 Pension Plans 1 Benefits 1 Expected long-term rate of return 0.25% increase (26) na na 0.25% decrease 26 na na Discount rate 0.25% increase (52) (1) (13) 0.25% decrease 55 1 14 Inflation 0.25% increase 81 2 1 0.25% decrease (85) (2) (1) Salary increases 0.25% increase 19 4 1 0.25% decrease (18) (3) (1) Health care cost trend rate 1% increase na na 94 1% decrease na na (69)
na – change in assumption not applicable. 1 Excluding the impact of the Pension OPEB Cost Variance Account.
Useful Lives of Long-Lived Assets
As a result of the announcement by the Minister of Energy to advance the date to cease operation of the remaining
coal-fired units at the Lambton and Nanticoke generating stations, OPG has revised the end of life dates for the
purposes of calculating depreciation from December 2014 to December 2013 for both generating stations. This
change in estimate increased depreciation expense in 2013 by $58 million reflecting the advancement of the 2014
expense. This increase in depreciation expense was offset by revenue from the Contingency Support Agreement
with the OEFC.
PUBLIC ACCOUNTS, 2013-2014 2-151

OPG’s Reporting Structure
Effective January 1, 2014, OPG revised the composition of its reporting segments to reflect changes in its generation
portfolio and to its internal reporting. These changes primarily reflect 48 of OPG’s currently unregulated hydroelectric
facilities being prescribed for rate regulation, effective July 1, 2014, and ceasing operation of the remaining coal-fired
units at the Nanticoke and Lambton generating stations. For further details, refer to Note 16.
Recent Accounting Pronouncements
Comprehensive Income – Reporting of Amounts Reclassified Out of Accumulated Other Comprehensive Income
In February 2013, the Financial Accounting Standards Board issued an update to Accounting Standards Codification
(ASC) Topic 220 which adds new disclosure requirements for items reclassified out of AOCI. The updates required
OPG to present information about significant items reclassified out of AOCI by component in the consolidated
financial statements. OPG has provided the required information in Note 10 of these consolidated financial
statements and has applied the amendments for reporting periods beginning January 1, 2013.
Investment Companies
For reporting periods beginning January 1, 2014, OPG will adopt the updates to ASC Topic 946, Investment
Companies. Based on the amended scope of the standard, OPG concluded that OPG Ventures Inc., the
Decommissioning Fund, the Used Fuel Fund and the Ontario NFWA Trust should be treated as investment entities
for accounting purposes. As the investments of these entities are already recorded at fair value, there were no
measurement differences upon adoption of this update. However, additional disclosures are required in OPG’s
consolidated financial statements.
4. PROPERTY, PLANT AND EQUIPMENT, INTANGIBLE ASSETS AND DEPRECIATION AND AMORTIZATION Depreciation and amortization expenses for the years ended December 31 consist of the following: (millions of dollars) 2013 2012 Depreciation 513 480 Amortization of intangible assets 14 15 Amortization of regulatory assets and liabilities (Note 5) 436 169
963 664
Property, plant and equipment as at December 31 consist of the following: (millions of dollars) 2013 2012 Nuclear generating stations 9,116 8,809 Regulated hydroelectric generating stations 6,033 4,548 Unregulated hydroelectric generating stations 4,210 4,140 Thermal generating stations 1,552 1,541 Other property, plant and equipment 390 383 Construction in progress 3,140 3,502
24,441 22,923 Less: accumulated depreciation Generating stations 7,483 6,856 Other property, plant and equipment 220 207
7,703 7,063 16,738 15,860
2-152 PUBLIC ACCOUNTS, 2013-2014
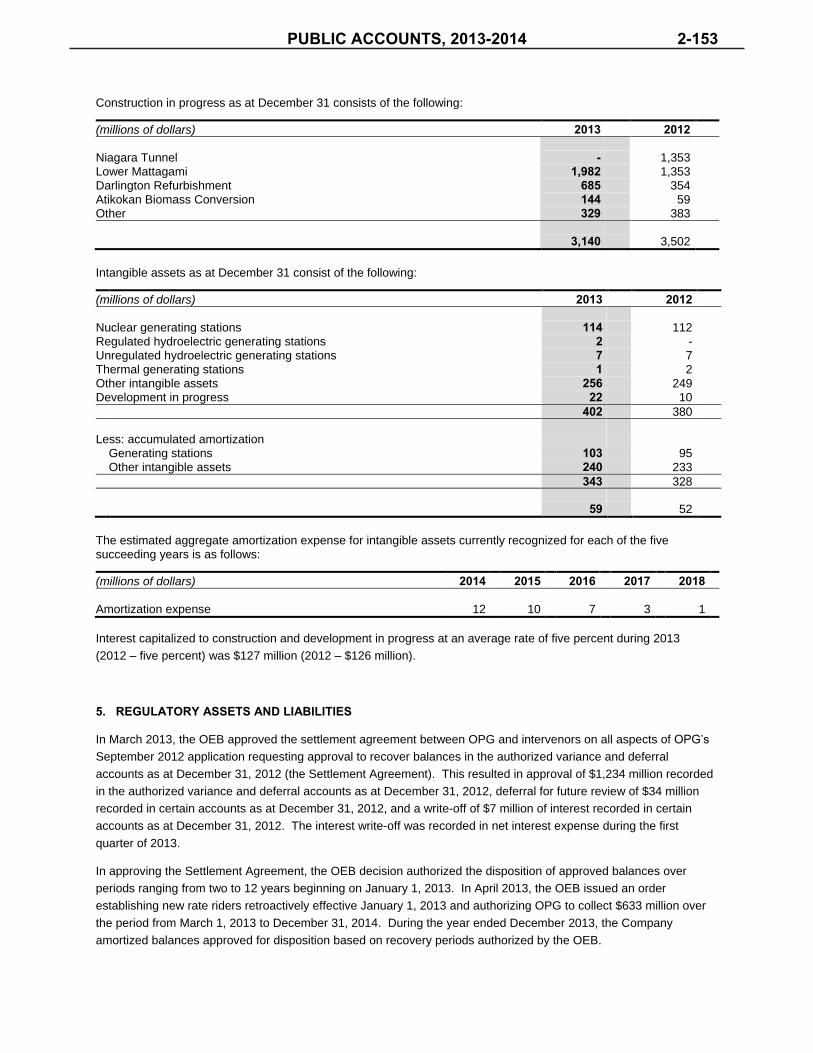
Construction in progress as at December 31 consists of the following: (millions of dollars) 2013 2012 Niagara Tunnel - 1,353 Lower Mattagami 1,982 1,353 Darlington Refurbishment 685 354 Atikokan Biomass Conversion 144 59 Other 329 383
3,140 3,502
Intangible assets as at December 31 consist of the following: (millions of dollars) 2013 2012 Nuclear generating stations 114 112 Regulated hydroelectric generating stations 2 - Unregulated hydroelectric generating stations 7 7 Thermal generating stations 1 2 Other intangible assets 256 249 Development in progress 22 10
402 380 Less: accumulated amortization Generating stations 103 95 Other intangible assets 240 233
343 328 59 52
The estimated aggregate amortization expense for intangible assets currently recognized for each of the five succeeding years is as follows: (millions of dollars) 2014 2015 2016 2017 2018 Amortization expense 12 10 7 3 1
Interest capitalized to construction and development in progress at an average rate of five percent during 2013
(2012 – five percent) was $127 million (2012 – $126 million).
5. REGULATORY ASSETS AND LIABILITIES
In March 2013, the OEB approved the settlement agreement between OPG and intervenors on all aspects of OPG’s
September 2012 application requesting approval to recover balances in the authorized variance and deferral
accounts as at December 31, 2012 (the Settlement Agreement). This resulted in approval of $1,234 million recorded
in the authorized variance and deferral accounts as at December 31, 2012, deferral for future review of $34 million
recorded in certain accounts as at December 31, 2012, and a write-off of $7 million of interest recorded in certain
accounts as at December 31, 2012. The interest write-off was recorded in net interest expense during the first
quarter of 2013.
In approving the Settlement Agreement, the OEB decision authorized the disposition of approved balances over
periods ranging from two to 12 years beginning on January 1, 2013. In April 2013, the OEB issued an order
establishing new rate riders retroactively effective January 1, 2013 and authorizing OPG to collect $633 million over
the period from March 1, 2013 to December 31, 2014. During the year ended December 2013, the Company
amortized balances approved for disposition based on recovery periods authorized by the OEB.
PUBLIC ACCOUNTS, 2013-2014 2-153

Any shortfall or over-recovery of approved balances due to differences between actual and forecast production is
recorded in the authorized Nuclear Deferral and Variance Over/Under Recovery Variance Account and Hydroelectric
Deferral and Variance Over/Under Recovery Variance Account to be collected from, or refunded to, ratepayers in the
future.
Effective January 1, 2013, as part of the approved Settlement Agreement, OPG ceased recording interest on the
balance of the Nuclear Liability Deferral Account (NLDA). For the period from January 1, 2013 to December 31,
2014, OPG is also not recording interest on the balance of the Bruce Lease Net Revenues Variance Account and the
majority of the balance of the Pension and OPEB Cost Variance Account. Pursuant to the OEB’s April 2013 order,
OPG continues to record interest on all other variance and deferral accounts using the interest rate prescribed by the
OEB. For the period from January 1, 2012 to December 31, 2013, the prescribed interest rate was 1.47 percent per
annum.
The OEB’s March 2013 decision and April 2013 order also authorized the continuation of previously existing variance
and deferral accounts, including those authorized pursuant to Ontario Regulation 53/05. During the year ended
December 31, 2013, the Company recorded additions to these variance and deferral accounts as authorized by the
OEB. The OEB also approved OPG’s use of US GAAP for regulatory purposes and, pursuant to the Settlement
Agreement, ordered that only interest and amortization be recorded in the Impact for USGAAP Deferral Account
effective January 1, 2013.
In its September 2013 application with the OEB for new regulated prices, OPG requested new rate riders effective
January 1, 2015 to recover balances as at December 31, 2013 in those variance accounts, the review of which was
deferred as part of the approved Settlement Agreement. These variance accounts are the Hydroelectric Incentive
Mechanism Variance Account, the Hydroelectric Surplus Baseload Generation Variance Account, the nuclear capital
and hydroelectric portions of the Capacity Refurbishment Variance Account, and the Nuclear Development Variance
Account. OPG’s September 2013 application is discussed further in Note 3.
During the year ended December 31, 2012, OPG recorded additions to variance and deferral accounts as authorized
by the applicable OEB decisions and orders and, pursuant to the OEB’s March 2011 decision and April 2011 order on
OPG’s application for regulated prices, amortized account balances as at December 31, 2010.
2-154 PUBLIC ACCOUNTS, 2013-2014

The regulatory assets and liabilities recorded as at December 31 are as follows: (millions of dollars) 2013 2012 Regulatory assets Variance and deferral accounts as authorized by the OEB Pension and OPEB Cost Variance Account 667 324 Bruce Lease Net Revenues Variance Account 353 311 Nuclear Liability Deferral Account 254 208 Tax Loss Variance Account 124 302 Capacity Refurbishment Variance Account 100 14 Nuclear Development Variance Account 57 30 Other variance and deferral accounts 128 127
1,683 1,316 Pension and OPEB Regulatory Asset (Note 11) 3,158 4,494 Deferred Income Taxes (Note 9) 559 668
Total regulatory assets 5,400 6,478 Less: current portion 306 -
Non-current regulatory assets 5,094 6,478
Regulatory liabilities Variance and deferral accounts as authorized by the OEB Other variance and deferral accounts 24 41
Total regulatory liabilities 24 41 Less: current portion 16 -
Non-current regulatory liabilities 8 41
PUBLIC ACCOUNTS, 2013-2014 2-155

The changes in the regulatory assets and liabilities during 2013 and 2012 are as follows:
(millions of dollars)
Pension and
OPEB Cost
Variance
Bruce Lease Net Revenues Variance
Nuclear Liability Deferral
Tax Loss Variance
Capacity Refurbish
-ment Variance
Nuclear Develop-
ment Variance
Pension and OPEB Regulatory
Asset
Deferred Income Taxes
Other Variance
and Deferral
(net)
Net regulatory assets 96 196 22 425 (1) (55) 3,553 699 (72)
(liabilities),
January 1, 2012
Change during the 225 248 206 - 10 25 941 (31) 107
year
Interest 3 3 1 5 - - - - -
Amortization during - (136) (21) (128) 5 60 - - 51
the year
Net regulatory assets 324 311 208 302 14 30 4,494 668 86
December 31,
2012
Change during the 402 110 123 - 93 26 (1,336) (109) 68
year
Interest 1 (5) (2) 3 - 1 - - -
Amortization during (60) (63) (75) (181) (7) - - - (50)
the year
Net regulatory
assets,
December 31, 2013 667 353 254 124 100 57 3,158 559 104
Pension and OPEB Cost Variance Account
The OEB established the Pension and OPEB Cost Variance Account in its June 2011 decision and order. The
variance account records the difference between actual pension and OPEB costs for the regulated business and
related tax impacts, and the corresponding amounts reflected in the current regulated prices. The OEB’s June 2011
decision and order established the account for the period from March 1, 2011 to December 31, 2012. In approving
the Settlement Agreement, the OEB authorized the continuation of the variance account.
In its March 2013 decision and April 2013 order, the OEB authorized the recovery of 2/12 of the balance in the
Pension and OPEB Cost Variance Account as at December 31, 2012 over a 24-month period ending December 31,
2014. The OEB also authorized the recovery of 10/12 of the account balance as at December 31, 2012 over a
144-month period ending December 31, 2024. Accordingly, effective January 1, 2013, OPG recorded amortization of
the regulatory asset for the account on a straight-line basis over these periods.
Bruce Lease Net Revenues Variance Account
As per Ontario Regulation 53/05, the OEB is required to include the difference between OPG’s revenues and costs
associated with its ownership of the two nuclear stations on lease to Bruce Power L.P. in the determination of the
regulated prices for production from OPG’s regulated nuclear facilities. The OEB established a variance account that
captures differences between OPG’s revenues and costs related to the nuclear generating station on lease to Bruce
Power L.P. and the corresponding forecasts included in the approved nuclear regulated prices.
In its March 2013 decision and April 2013 order, the OEB ordered the portion of the balance in the Bruce Lease Net
Revenues Variance Account as at December 31, 2012 related to the impact of the derivative liability embedded in the
Bruce Power lease agreement (Bruce Lease) to be recovered on the basis of OPG’s expected rent rebate payment to
2-156 PUBLIC ACCOUNTS, 2013-2014

Bruce Power L.P., including associated income tax impacts. Effective January 1, 2013, OPG recorded amortization
of the regulatory asset for this portion of the account on this basis.
The remaining portion of the balance as at December 31, 2012 was authorized by the OEB to be recovered over a
48-month period ending December 31, 2016. Effective January 1, 2013, OPG recorded amortization of the regulatory
asset for the non-derivative portion of the account on a straight-line basis over this period.
Nuclear Liability Deferral Account
As per Ontario Regulation 53/05, the OEB has authorized the NLDA in connection with changes to OPG’s liabilities
for nuclear used fuel management and nuclear decommissioning and L&ILW management associated with the
nuclear facilities owned and operated by OPG, which are comprised of the Pickering and Darlington nuclear
generating stations. The deferral account records the revenue requirement impact associated with the changes in
these liabilities arising from an approved reference plan, in accordance with the terms of the ONFA. During 2012, the
Province approved the 2012 ONFA Reference Plan, covering the period from 2012 to 2016, with an effective date of
January 1, 2012. As a result, OPG has been recording an increase to the regulatory asset for the NLDA effective
January 1, 2012.
During the years ended December 31, 2013 and 2012, the following amounts have been recorded as components of
the increase in the regulatory asset for the NLDA relating to the above increase in liabilities, with reductions to
corresponding expenses:
(millions of dollars) 2013 2012 Fuel expense 26 25 Low and intermediate level waste management variable expenses
1 1 1
Depreciation expense 52 98 Return on rate base
2 2 22
Interest3 (2) 1
Income taxes 42 60
121 207 1 Amount was recorded as a reduction to OM&A expenses.
2 Amount was recorded as a reduction to accretion on fixed asset removal and nuclear waste management liabilities.
3 Amount in 2013 represents the write-off of interest recorded on the balance of the account as of December 31, 2012, pursuant to
the approved Settlement Agreement.
In its March 2013 decision and April 2013 order, the OEB approved the recovery of a portion of the balance in the
NLDA as at December 31, 2012 over a 24-month period ending December 31, 2014. Accordingly, effective
January 1, 2013, OPG recorded amortization for this account on a straight-line basis over this period.
Tax Loss Variance Account
The Tax Loss Variance Account pertains to the treatment of tax losses and their use for mitigation. In accordance
with a May 2009 decision by the OEB, this account recorded, up to March 1, 2011, the difference between the
amount of mitigation included in the approved regulated prices established by the OEB’s 2008 decision and the
revenue requirement reduction available from carried forward prior period tax losses, as recalculated per the OEB’s
2008 decision. Only interest and amortization are recorded in this account, effective March 1, 2011.
In its March 2013 decision and April 2013 order, the OEB approved the recovery of the balance in the account as at
December 31, 2012 over a 24-month period ending December 31, 2014. Accordingly, effective January 1, 2013,
OPG recorded amortization for this account on a straight-line basis over this period.
PUBLIC ACCOUNTS, 2013-2014 2-157

Pension and OPEB Regulatory Asset
The regulated prices established by the OEB for generation from OPG’s regulated facilities, using a forecast cost of
service methodology, reflect amounts for pension and OPEB costs attributable to these facilities. These amounts are
determined on the basis of the manner in which these costs are recognized in OPG’s consolidated financial
statements. Unamortized amounts, in respect of OPG’s pension and OPEB plans that are recognized in AOCI, are
not generally reflected in the regulated prices until these amounts are reclassified from AOCI, and recognized as
amortization components of the benefit costs in respect of these plans. As such, OPG recognizes an offsetting
regulatory asset for the unamortized amounts that have not yet been reclassified from AOCI to benefit costs. The
regulatory asset is reversed, as underlying unamortized balances are amortized as components of the benefit costs.
The AOCI amounts related to pension and OPEB plans are presented in Note 11.
Deferred Income Taxes
OPG is required to recognize deferred income taxes associated with its rate regulated operations, including deferred
income taxes on temporary differences related to the regulatory assets and liabilities recognized for accounting
purposes. In addition, OPG is required to recognize a separate regulatory asset or liability for the amount of deferred
income taxes expected to be included in future regulated prices and recovered from, or paid to, customers.
Capacity Refurbishment Variance Account
Pursuant to Ontario Regulation 53/05, the OEB has authorized the Capacity Refurbishment Variance Account
(CRVA). The account captures variances from the forecasts reflected in the regulated prices for capital and non-
capital costs incurred to increase the output of, refurbish, or add operating capacity to one or more of the regulated
facilities. The balance in the account as at December 31, 2013 includes variances related to the Niagara Tunnel, the
refurbishment of the Darlington nuclear generating station, life extension initiatives at the Pickering nuclear
generation station, and other projects.
OPG determines amounts to be recovered from, or refunded to customers, with respect to variances in capital costs
as the difference from forecast depreciation expense and cost of capital associated with OPG’s investment in capital
placed in-service and reflected in the current regulated prices, as well as associated income tax effects. The cost of
capital amount in the account is calculated using the weighted average cost of capital, including a return on equity, as
approved by the OEB in setting the current regulated prices. In accordance with US GAAP, in recognizing a
regulatory asset or liability for the CRVA in its consolidated financial statements, OPG limits the portion of cost of
capital additions recognized as a regulatory asset or liability to the amount calculated using the average rate of
capitalized interest applied to construction and development in progress.
As the existing cost of service regulated prices established in 2011 do not reflect the impact of the Niagara Tunnel,
the CRVA additions in 2013 included $114 million to be recovered from ratepayers related to the Niagara Tunnel that
was declared in-service in March 2013. This amount included $83 million as the capital cost component determined
using the weighted average cost of capital. In these consolidated financial statements, OPG recognized an increase
of $88 million in the regulatory asset for the CRVA related to the Niagara Tunnel in 2013, of which $56 million
represented the capital cost component determined using the average rate of five percent for capitalized interest
applied to construction and development in progress for the year ended December 31, 2013.
OPG’s September 2013 application to the OEB for new regulated prices includes the impact of the Niagara Tunnel
starting in 2014 and requests recovery of the balance of the CRVA related to the Niagara Tunnel as at December 31,
2013. The application also requests recovery of the balance in the account for capital costs related to the
refurbishment of the Darlington nuclear generating station, as at December 31, 2013. The amounts sought in the
2013 application to the OEB, in respect to the CRVA, are $119 million.
2-158 PUBLIC ACCOUNTS, 2013-2014

In its March 2013 decision and April 2013 order, the OEB approved the recovery of the portion of the account balance
as at December 31, 2012 related to non-capital nuclear costs over a 24-month period ending December 31, 2014.
Accordingly, effective January 1, 2013, OPG recorded amortization of the regulatory asset for the non-capital nuclear
portion of the account on a straight-line basis over this period.
Nuclear Development Variance Account
The Nuclear Development Variance Account was established pursuant to Ontario Regulation 53/05 and records
differences between actual non-capital costs incurred by OPG in the course of planning and preparing for the
development of proposed new nuclear facilities, and the forecast amount of these costs included in the current
nuclear regulated prices.
In its March 2013 decision and April 2013 order, the OEB deferred the consideration of the recovery of the balance in
the account as at December 31, 2012. OPG’s September 2013 application to the OEB for new regulated prices
requests recovery of the balance in the account as at December 31, 2013, which includes amounts recorded for the
period from March 1, 2011 to December 31, 2013.
Other Variance and Deferral Accounts
As at December 31, 2013 and 2012, regulatory assets for other variance and deferral accounts included amounts for
the Nuclear Deferral and Variance Over/Under Recovery Variance Account, Ancillary Services Net Revenue Variance
Account, the Impact for USGAAP Deferral Account, the Hydroelectric Water Conditions Variance Account, and the
Hydroelectric Surplus Baseload Generation Variance Account.
The Ancillary Services Net Revenue Variance Account was authorized by the OEB to capture differences between
actual nuclear and regulated hydroelectric ancillary services net revenue and the forecast amounts of such revenue
approved by the OEB in setting regulated prices.
The Impact for USGAAP Deferral Account recorded, for the period from January 1, 2012 to December 31, 2012, the
financial impacts resulting from OPG’s transition to and implementation of US GAAP.
The Hydroelectric Water Conditions Variance Account captures the impact of differences in regulated hydroelectric
electricity production due to differences between forecast water conditions underlying the hydroelectric production
forecast approved by the OEB in setting current regulated hydroelectric prices, and the actual water conditions. The
Hydroelectric Surplus Baseload Generation Variance Account records the impact of foregone production at OPG’s
regulated hydroelectric facilities due to surplus baseload generation conditions.
As at December 31, 2013 and 2012, regulatory liabilities for other variance and deferral accounts included amounts
for the Income and Other Taxes Variance Account and the Hydroelectric Incentive Mechanism Variance Account.
The Income and Other Taxes Variance Account includes deviations in income taxes for the regulated business, from
those approved by the OEB in setting regulated prices and caused by changes in tax rates and rules, as well as
reassessments.
The regulatory assets for other variance and deferral accounts as at December 31, 2013 and the regulatory liabilities
for other variance and deferral accounts as at December 31, 2012 also included amounts for the Hydroelectric
Deferral and Variance Over/Under Recovery Variance Account.
In its March 2013 decision and April 2013 order, the OEB approved the recovery or repayment of the majority of the
balances of the other variance and deferral accounts as at December 31, 2012 over a 24-month period ending
December 31, 2014. Accordingly, effective January 1, 2013, OPG recorded amortization of the balances on a
straight-line basis over this period.
PUBLIC ACCOUNTS, 2013-2014 2-159

6. LONG-TERM DEBT Long-term debt consists of the following as at December 31: (millions of dollars) 2013 2012 Long-term debt 1 Notes payable to the Ontario Electricity Financial Corporation Senior Notes
2
3.43% due 2015 500 500 4.91% due 2016 270 270 5.35% due 2017 900 900 5.27% due 2018 395 395 5.44% due 2019 365 365 4.56% due 2020 660 660 4.28% due 2021 185 185 3.30% due 2022 150 150 3.12% due 2023 40 - 5.07% due 2041 300 300 4.36% due 2042 200 200 UMH Energy Partnership debt
3
Senior Notes 7.86% due to 2041 193 195 Lower Mattagami Energy Limited Partnership
4
Senior Notes 2.59% due 2015 92 94 2.35% due 2017 200 200 4.46% due 2021 225 225 5.26% due 2041 250 250 5.05% due 2043 200 - 4.26% due 2046 275 - 4.26% due 2052 225 225
5,625 5,114 Less: due within one year 5 5
Long-term debt 5,620 5,109 1
The interest rates disclosed reflect the effective interest rate of the debt. 2
OEFC senior debt is entitled to receive, in full, amounts owing in respect of the senior debt and is pari passu to the UMH Energy Partnership and the Lower Mattagami Energy Limited Partnership (LME) senior notes.
3 These notes are secured by the assets of the Upper Mattagami and Hound Chute project and are recourse to OPG until specified conditions have been satisfied following construction. These notes rank pari passu to the OEFC senior notes.
4 These notes are secured by the assets of the Lower Mattagami River project, including existing operating facilities and facilities being constructed, and are recourse to OPG until the recourse release date. These notes rank pari passu to the OEFC senior notes.
OPG maintains a Niagara Tunnel project credit facility with the OEFC for an amount up to $1.6 billion. Interest will be
fixed for each note issued at the time of advance at a rate equal to the prevailing Benchmark Government of Canada
10-Year Bond, plus a credit spread determined by the OEFC based on a survey of market rates. OPG’s borrowing
under this facility is limited to the cost of the project. This credit facility expires on December 31, 2014. As at
December 31, 2013, advances under this facility were $1,065 million (2012 – $1,025 million).
OPG entered into an agreement with the OEFC in December 2013 for a $500 million general corporate credit facility.
As of December 31, 2013, there were no outstanding borrowings under the credit facility. This credit facility expires
on December 31, 2014.
Interest paid in 2013 was $255 million (2012 – $246 million), of which $246 million (2012 – $235 million) relates to
interest paid on long-term corporate debt.
2-160 PUBLIC ACCOUNTS, 2013-2014
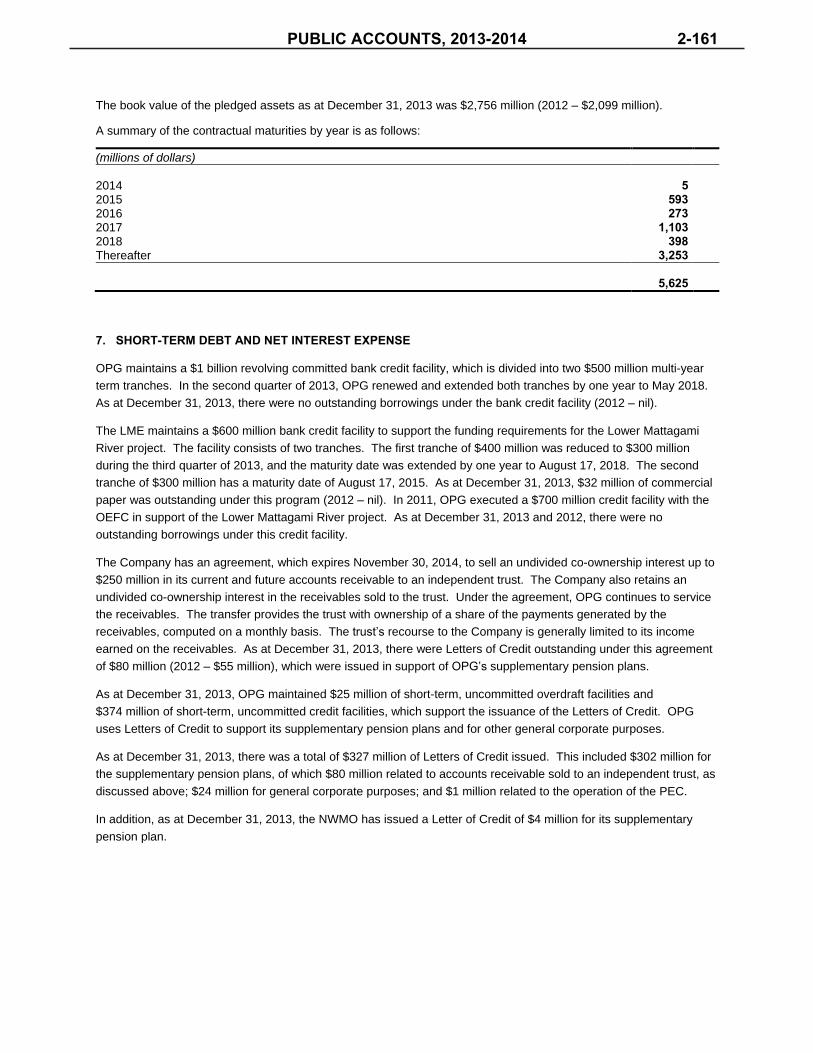
The book value of the pledged assets as at December 31, 2013 was $2,756 million (2012 – $2,099 million).
A summary of the contractual maturities by year is as follows: (millions of dollars) 2014 5 2015 593 2016 273 2017 1,103 2018 398 Thereafter 3,253
5,625
7. SHORT-TERM DEBT AND NET INTEREST EXPENSE
OPG maintains a $1 billion revolving committed bank credit facility, which is divided into two $500 million multi-year
term tranches. In the second quarter of 2013, OPG renewed and extended both tranches by one year to May 2018.
As at December 31, 2013, there were no outstanding borrowings under the bank credit facility (2012 – nil).
The LME maintains a $600 million bank credit facility to support the funding requirements for the Lower Mattagami
River project. The facility consists of two tranches. The first tranche of $400 million was reduced to $300 million
during the third quarter of 2013, and the maturity date was extended by one year to August 17, 2018. The second
tranche of $300 million has a maturity date of August 17, 2015. As at December 31, 2013, $32 million of commercial
paper was outstanding under this program (2012 – nil). In 2011, OPG executed a $700 million credit facility with the
OEFC in support of the Lower Mattagami River project. As at December 31, 2013 and 2012, there were no
outstanding borrowings under this credit facility.
The Company has an agreement, which expires November 30, 2014, to sell an undivided co-ownership interest up to
$250 million in its current and future accounts receivable to an independent trust. The Company also retains an
undivided co-ownership interest in the receivables sold to the trust. Under the agreement, OPG continues to service
the receivables. The transfer provides the trust with ownership of a share of the payments generated by the
receivables, computed on a monthly basis. The trust’s recourse to the Company is generally limited to its income
earned on the receivables. As at December 31, 2013, there were Letters of Credit outstanding under this agreement
of $80 million (2012 – $55 million), which were issued in support of OPG’s supplementary pension plans.
As at December 31, 2013, OPG maintained $25 million of short-term, uncommitted overdraft facilities and
$374 million of short-term, uncommitted credit facilities, which support the issuance of the Letters of Credit. OPG
uses Letters of Credit to support its supplementary pension plans and for other general corporate purposes.
As at December 31, 2013, there was a total of $327 million of Letters of Credit issued. This included $302 million for
the supplementary pension plans, of which $80 million related to accounts receivable sold to an independent trust, as
discussed above; $24 million for general corporate purposes; and $1 million related to the operation of the PEC.
In addition, as at December 31, 2013, the NWMO has issued a Letter of Credit of $4 million for its supplementary
pension plan.
PUBLIC ACCOUNTS, 2013-2014 2-161

The following table summarizes the net interest expense for the years ended December 31: (millions of dollars) 2013 2012 Interest on long-term debt 280 256 Interest on short-term debt 9 11 Interest income (10) (7) Interest capitalized to property, plant and equipment and intangible assets (127) (126) Interest related to regulatory assets and liabilities
1 (66) (17)
Net interest expense 86 117 1 Includes interest to recognize the cost of financing related to regulatory assets and liabilities and interest deferred in the Capacity
Refurbishment Variance Account and the Bruce Lease Net Revenues Variance Account.
8. FIXED ASSET REMOVAL AND NUCLEAR WASTE MANAGEMENT LIABILITIES
The liabilities for fixed asset removal and nuclear waste management on a present value basis consist of the
following as at December 31:
(millions of dollars) 2013 2012 Liability for nuclear used fuel management 9,957 9,469 Liability for nuclear decommissioning and low and intermediate 5,946 5,708 level waste management Liability for non-nuclear fixed asset removal 354 345
Fixed asset removal and nuclear waste management liabilities 16,257 15,522
The changes in the fixed asset removal and nuclear waste management liabilities for the years ended December 31 are as follows: (millions of dollars) 2013 2012 Liabilities, beginning of year 15,522 14,392 Increase in liabilities due to accretion
1 826 774
Increase in liabilities reflecting a change to the useful lives of the Pickering and - 451 Bruce nuclear generating stations Increase in liabilities due to nuclear used fuel, nuclear waste management 109 103 variable expenses and other expenses Liabilities settled by expenditures on fixed asset removal and nuclear waste (199) (198) management Change in the liabilities for non-nuclear fixed asset removal (1) -
Liabilities, end of year 16,257 15,522 1 The increase in liabilities due to accretion for 2013 excludes reductions to accretion expense due to the impact of the NLDA of
$2 million (2012 – $22 million) and the Bruce Lease Net Revenues Variance Account of $68 million (2012 – $27 million).
During 2013, expenditures on fixed asset removal and nuclear waste management included $58 million in funding to
the NWMO related to OPG’s nuclear fixed asset removal and nuclear waste management liabilities (2012 –
$57 million).
OPG’s fixed asset removal and nuclear waste management liabilities are comprised of expected costs to be incurred
up to and beyond termination of operations and the closure of nuclear, thermal generating plant facilities, and other
facilities. Costs will be incurred for activities such as preparation for safe storage, safe storage, dismantling,
demolition and disposal of facilities and equipment, remediation and restoration of sites, and the ongoing and long-
term management of nuclear used fuel and L&ILW waste material. Under the terms of the Bruce agreement, OPG
2-162 PUBLIC ACCOUNTS, 2013-2014
continues to be primarily responsible for the nuclear fixed asset removal and nuclear waste management liabilities
associated with the Bruce nuclear generating stations.
The determination of the accrual for fixed asset removal and nuclear waste management costs requires significant
assumptions since these programs run for many years. The most recent update of the estimates for the nuclear
waste management and decommissioning liabilities is contained in the approved 2012 ONFA Reference Plan. The
update resulted in an increased estimate of costs mainly due to higher costs for the construction of the L&ILW
underground repository, higher costs for handling and storing of used fuel and L&ILW during station operations, and
changes in economic indices. The increase was partially offset by lower expected costs to decommission reactors.
For the purposes of calculating OPG’s nuclear fixed asset removal and nuclear waste management liabilities, as at
December 31, 2013, consistent with the current accounting end of life assumptions, nuclear station decommissioning
is projected to occur over the next 41 years.
To reflect the change in 2012 in estimated station useful lives for the Pickering generating station and the Bruce
generating stations leased to Bruce Power L.P., OPG recorded an increase to the estimate of the Nuclear Liabilities
of $451 million at December 31, 2012.
The updated estimates for the Nuclear Liabilities included cash flow estimates for decommissioning nuclear stations
for approximately 40 years after station shut down and to 2071 for placement of used fuel into the long-term disposal
repository followed by extended monitoring. The undiscounted amount of estimated future cash flows associated
with the liabilities is approximately $33.8 billion in 2013 dollars. The weighted average discount rate used to calculate
the present value of the liabilities at December 31, 2013 was 5.37 percent. The increase in the liabilities recorded as
at December 31, 2012, which reflects the change in estimated useful lives and is consistent with the approved 2012
ONFA Reference Plan, was determined by discounting the net incremental future cash flows at 3.5 percent. The cost
escalation rates used to determine the increase in the cost estimates ranged from 1.9 percent to 3.7 percent.
The significant assumptions underlying operational and technical factors used in the calculation of the accrued
Nuclear Liabilities are subject to periodic review. Changes to these assumptions, including changes to assumptions
on the timing of the programs, end of life dates, financial indicators, or the technology employed may result in
significant changes to the value of the accrued liabilities. With programs of this duration and the evolving technology
to handle the nuclear waste, there is a significant degree of uncertainty surrounding the measurement of the costs for
these programs, which may increase or decrease over time.
Liability for Nuclear Used Fuel Management Costs
The liability for nuclear used fuel management represents the cost of managing the highly radioactive used nuclear
fuel bundles. The federal NFWA, proclaimed into force in 2002, requires that Canada’s nuclear fuel waste owners
form a nuclear waste management organization, and that each waste owner establish a trust fund for used fuel
management costs. To estimate its liability for nuclear used fuel management costs, OPG has adopted a
conservative approach consistent with the Adaptive Phased Management concept approved by the Government of
Canada, which assumes a deep geologic repository in-service date of 2035.
Liability for Nuclear Decommissioning and L&ILW Management Costs
The liability for nuclear decommissioning and L&ILW management represents the estimated costs of
decommissioning nuclear generating stations after the end of their service lives, as well as the cost of managing
L&ILW generated by the nuclear stations. The significant assumptions used in estimating future nuclear fixed asset
removal costs include decommissioning of nuclear generating stations on a deferred dismantlement basis, where the
reactors will remain in a safe storage state for a 30-year period prior to a 10-year dismantlement period.
The life cycle costs of L&ILW management include the costs of processing and storage of such radioactive wastes
during and following the operation of the nuclear stations, as well as the costs of ultimate long-term management of
PUBLIC ACCOUNTS, 2013-2014 2-163

these wastes. The current assumptions used to establish the accrued L&ILW management costs include a L&ILW
deep geologic repository (L&ILW DGR). Agreement has been reached with local municipalities for OPG to develop a
deep geologic repository for the long-term management of L&ILW adjacent to the Western Waste Management
Facility.
OPG has suspended design activities pending receipt of the site preparation and construction licence which is
expected in the first half of 2015.
Liability for Non-Nuclear Fixed Asset Removal Costs
The liability for non-nuclear fixed asset removal primarily represents the estimated costs of decommissioning OPG’s
thermal generating stations. The liability is based on third-party cost estimates after an in-depth review of active plant
sites and an assessment of required clean-up and restoration activities. As at December 31, 2013, the estimated
retirement dates of the thermal stations for the purposes of this liability are between 2014 and 2030. The discount
rates range from 1.5 percent to 5.8 percent. The undiscounted amount of estimated future cash flows associated
with the non-nuclear liabilities is $491 million in 2013 dollars.
As at December 31, 2013, in addition to the $134 million liability for active sites, OPG has an ARO of $220 million for
decommissioning and restoration costs associated with plant sites that are no longer in use for electricity generation,
including the Nanticoke and Lambton generating stations.
Ontario Nuclear Funds Agreement
The Decommissioning Fund was established to fund the future costs of nuclear fixed asset removal, long-term L&ILW
management and a portion of used fuel storage costs after station life. As at December 31, 2013, the
Decommissioning Fund was in an overfunded position.
The Used Fuel Fund was established to fund future costs of long-term nuclear used fuel waste management. OPG is
responsible for the risk and liability of cost increases for used fuel waste management, subject to graduated liability
thresholds specified in the ONFA, which limit OPG’s total financial exposure at approximately $12.9 billion in present
value dollars as at December 31, 2013, based on used fuel bundle projections of 2.23 million bundles, consistent with
the station life assumptions included within the initial financial reference plan. The graduated liability thresholds do
not apply to additional used fuel bundles beyond 2.23 million.
OPG makes quarterly payments to the Used Fuel Fund over the life of its nuclear generating stations, as specified in
the ONFA. Required funding for 2013 under the ONFA was $184 million (2012 – $182 million), including a
contribution to the Ontario NFWA Trust (the Trust) of $154 million (2012 – $149 million). Based on the approved
2012 ONFA Reference Plan, OPG is required to contribute annual amounts to the Used Fuel Fund, ranging from
$139 million to $193 million over the years 2014 to 2018 (Refer to Note 15).
The NFWA was proclaimed into force in November 2002. As required under the NFWA, OPG established the Trust
in November 2002 and made an initial deposit of $500 million into the Trust. The NFWA required OPG to make
annual contributions of $100 million to the Trust, until such time that the NWMO proposed funding formula, designed
to address the future financial costs of implementing the Adapted Phase Management approach, was approved by
the Federal Minister of Natural Resources. In 2009, this funding formula was approved. The Trust forms part of the
Used Fuel Fund, and contributions to the Trust, as required by the NFWA, may be applied towards OPG’s ONFA
payment obligations.
As required by the terms of the ONFA, the Province has provided a Provincial Guarantee to the Canadian Nuclear
Safety Commission (CNSC) since 2003, on behalf of OPG. The Nuclear Safety and Control Act (Canada) requires
OPG to have sufficient funds available to discharge the current nuclear decommissioning and waste management
liabilities. The Provincial Guarantee provides for any shortfall between the CNSC consolidated financial guarantee
requirement and the Nuclear Funds. OPG pays the Province an annual guarantee fee of 0.5 percent of the amount
2-164 PUBLIC ACCOUNTS, 2013-2014

of the Provincial Guarantee provided by the Province. The current value of the Provincial Guarantee amount of
$1,551 million is in effect through to the end of 2017. In each of January 2013 and 2014, OPG paid a guarantee fee
of $8 million based on a Provincial Guarantee amount of $1,551 million.
Decommissioning Fund
Upon termination of the ONFA, the Province has a right to any excess funding in the Decommissioning Fund, which
is the excess of the fair market value of the Decommissioning Fund over the estimated completion costs, as per the
most recently approved ONFA Reference Plan. When the Decommissioning Fund is overfunded, OPG limits the
earnings it recognizes in its consolidated financial statements by recording a payable to the Province, such that the
balance of the Decommissioning Fund is equal the cost estimate of the liability based on the most recently approved
ONFA Reference Plan. The payable to the Province may be reduced in subsequent periods in the event that the
Decommissioning Fund earns less than its target rate of return or in the event that a new ONFA Reference Plan is
approved with a higher estimated decommissioning liability. When the Decommissioning Fund is underfunded, the
earnings on the Decommissioning Fund reflect actual fund returns based on the market value of the assets.
The Province’s right to any excess funding in the Decommissioning Fund upon termination of the ONFA results in
OPG capping its annual earnings at 3.25 percent plus long-term Ontario Consumer Price Index (CPI), which is the
rate of growth in the liability for the estimated completion cost, as long as the Decommissioning Fund is in an
overfunded status.
The Decommissioning Fund’s asset value on a fair value basis was $5,967 million as at December 31, 2013, which
was net of the due to the Province of $624 million, as the asset value of the fund was higher than the liability per the
approved 2012 ONFA Reference Plan. As at December 31, 2012, the Decommissioning Fund’s asset value on a fair
value basis was $5,707 million, also higher than the liability per the 2012 ONFA Reference Plan. Under the ONFA, if
there is a surplus in the Decommissioning Fund such that the liabilities, as defined by the most recently approved
ONFA Reference Plan, are at least 120 percent funded, OPG may direct up to 50 percent of the surplus over
120 percent to be treated as a contribution to the Used Fuel Fund and the OEFC would be entitled to a distribution of
an equal amount. Since OPG is responsible for the risks associated with liability cost increases and investment
returns in the Decommissioning Fund, future contributions to the Decommissioning Fund may be required should the
fund be in an underfunded position at the time of the next liability reference plan review.
The investments in the Decommissioning Fund include a diversified portfolio of equities and fixed income securities
that are invested across geographic markets, as well as investments in infrastructure and Canadian real estate. The
Nuclear Funds are invested to fund long-term liability requirements and, as such, the portfolio asset mix is structured
to achieve the required return over a long-term horizon. While short-term fluctuations in market value will occur,
managing the long-term return of the Nuclear Funds remains the primary goal.
Used Fuel Fund
Under the ONFA, the Province guarantees OPG’s annual return in the Used Fuel Fund at 3.25 percent plus the
change in the Ontario CPI for funding related to the first 2.23 million of used fuel bundles (committed return). OPG
recognizes the committed return on the Used Fuel Fund and includes it in the earnings on the nuclear fixed asset
removal and nuclear waste management funds. The difference between the committed return on the Used Fuel Fund
and the actual market return, based on the fair value of the Used Fuel Fund’s assets, which includes realized and
unrealized returns, is recorded as due to or due from the Province. The due to or due from the Province represents
the amount the fund would pay to or receive from the Province if the committed return were to be settled as of the
consolidated balance sheet date. As prescribed under the ONFA, OPG’s contributions for incremental fuel bundles
are not subject to the Province’s guaranteed rate of return, but rather earn a return based on changes in the market
value of the assets of the Used Fuel Fund.
PUBLIC ACCOUNTS, 2013-2014 2-165
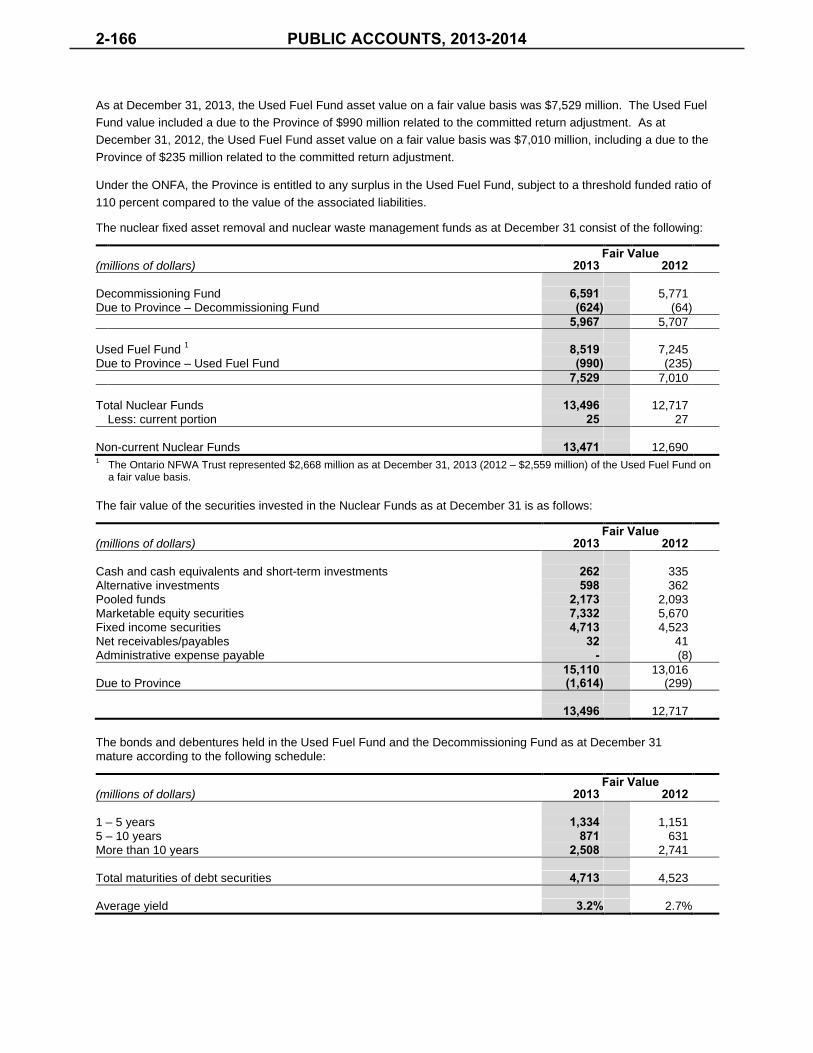
As at December 31, 2013, the Used Fuel Fund asset value on a fair value basis was $7,529 million. The Used Fuel
Fund value included a due to the Province of $990 million related to the committed return adjustment. As at
December 31, 2012, the Used Fuel Fund asset value on a fair value basis was $7,010 million, including a due to the
Province of $235 million related to the committed return adjustment.
Under the ONFA, the Province is entitled to any surplus in the Used Fuel Fund, subject to a threshold funded ratio of
110 percent compared to the value of the associated liabilities.
The nuclear fixed asset removal and nuclear waste management funds as at December 31 consist of the following: Fair Value (millions of dollars) 2013 2012 Decommissioning Fund 6,591 5,771 Due to Province – Decommissioning Fund (624) (64)
5,967 5,707 Used Fuel Fund
1 8,519 7,245
Due to Province – Used Fuel Fund (990) (235)
7,529 7,010 Total Nuclear Funds 13,496 12,717 Less: current portion 25 27
Non-current Nuclear Funds 13,471 12,690 1 The Ontario NFWA Trust represented $2,668 million as at December 31, 2013 (2012 – $2,559 million) of the Used Fuel Fund on
a fair value basis.
The fair value of the securities invested in the Nuclear Funds as at December 31 is as follows: Fair Value (millions of dollars) 2013 2012 Cash and cash equivalents and short-term investments 262 335 Alternative investments 598 362 Pooled funds 2,173 2,093 Marketable equity securities 7,332 5,670 Fixed income securities 4,713 4,523 Net receivables/payables 32 41 Administrative expense payable - (8)
15,110 13,016 Due to Province (1,614) (299)
13,496 12,717
The bonds and debentures held in the Used Fuel Fund and the Decommissioning Fund as at December 31 mature according to the following schedule: Fair Value (millions of dollars) 2013 2012 1 – 5 years 1,334 1,151 5 – 10 years 871 631 More than 10 years 2,508 2,741
Total maturities of debt securities 4,713 4,523
Average yield 3.2% 2.7%
2-166 PUBLIC ACCOUNTS, 2013-2014

The change in the Nuclear Funds for the years ended December 31 is as follows: Fair Value (millions of dollars) 2013 2012 Decommissioning Fund, beginning of year 5,707 5,342 Increase in fund due to return on investments 854 469 Decrease in fund due to reimbursement of expenditures (34) (40) Increase in due to Province (560) (64)
Decommissioning Fund, end of year 5,967 5,707
Used Fuel Fund, beginning of year 7,010 6,556 Increase in fund due to contributions made 184 182 Increase in fund due to return on investments 1,131 584 Decrease in fund due to reimbursement of expenditures (41) (30) Increase in due to Province (755) (282)
Used Fuel Fund, end of year 7,529 7,010
The earnings from the Nuclear Funds during 2013 and 2012 were impacted by the Bruce Lease Net Revenues Variance Account authorized by the OEB. The earnings on the Nuclear Funds for the years ended December 31 are as follows: (millions of dollars) 2013 2012 Decommissioning Fund 294 405 Used Fuel Fund 376 302 Bruce Lease Net Revenues Variance Account (Note 5) (42) (56)
Total earnings 628 651
9. INCOME TAXES
OPG follows the liability method of tax accounting for all of its business segments. The Company records an
offsetting regulatory asset or liability for the deferred income taxes that are expected to be recovered or refunded
through future regulated prices charged to customers for generation from OPG’s regulated facilities.
During 2013, OPG recorded a decrease in the deferred income tax liability for the income taxes that are expected to
be recovered or refunded through regulated prices charged to customers of $109 million (2012 – $31 million). Since
these deferred income taxes are expected to be refunded through future regulated prices, OPG recorded a
corresponding decrease to the regulatory asset for deferred income taxes. As a result, the deferred income tax
expense for 2013 and 2012 was not impacted.
The amount of taxes paid during 2013 was $14 million (tax refund received net of taxes paid during 2012 –
$7 million).
PUBLIC ACCOUNTS, 2013-2014 2-167

The following table summarizes the deferred income tax liabilities recorded for the rate regulated operations that are expected to be recovered through future regulated prices: (millions of dollars) 2013 2012 January 1: Deferred income tax liabilities on temporary differences 500 523 related to regulated operations Deferred income tax liabilities resulting from the regulatory 168 176 asset for deferred income taxes
668 699 Changes during the year: Decrease in deferred income tax liabilities on temporary (82) (23) differences related to regulated operations Decrease in deferred income tax liabilities resulting from (27) (8) the regulatory asset for deferred income taxes
Balance at December 31 559 668
A reconciliation between the statutory and the effective rate of income taxes is as follows: (millions of dollars) 2013 2012 Income before income taxes 166 434
Combined Canadian federal and provincial statutory enacted income tax rates 26.5% 26.5%
Statutory income tax rates applied to accounting income 44 115
(Decrease) increase in income taxes resulting from: Income tax components of the regulatory variance and (102) (17) deferral accounts Non-taxable income items (3) (5) Change in income tax positions 9 (11) Regulatory asset for deferred income taxes 113 15 Scientific Research and Experimental Development (30) (28) investment tax credits Other - (2)
(13) (48) Income tax expense 31 67
Effective rate of income taxes 18.7% 15.4%
2-168 PUBLIC ACCOUNTS, 2013-2014

Significant components of the income tax expense are presented in the table below: (millions of dollars) 2013 2012 Current income tax expense: Current payable 48 21 Change in income tax positions 9 (11) Income tax components of the regulatory variance and deferral accounts 9 23 Scientific Research and Experimental Development investment tax credits (30) (28) Other 7 -
43 5 Deferred income tax (recovery) expense: Change in temporary differences (14) 69 Income tax components of the regulatory variance and deferral accounts (111) (40) Regulatory asset for deferred income taxes 113 33
(12) 62 Income tax expense 31 67
The income tax effects of temporary differences that give rise to deferred income tax assets and liabilities as at December 31 are as follows: (millions of dollars) 2013 2012 Deferred income tax assets: Fixed asset removal and nuclear waste management liabilities 4,055 3,871 Other liabilities and assets 1,672 2,006 Future recoverable Ontario minimum tax 30 37
5,757 5,914 Deferred income tax liabilities: Property, plant and equipment and intangible assets (1,463) (1,497) Nuclear fixed asset removal and nuclear waste management funds (3,374) (3,179) Other liabilities and assets (1,499) (1,733)
(6,336) (6,409) Net deferred income tax liabilities (579) (495)
Represented by: Current portion – (liability) asset (14) 68 Long-term portion – liability (565) (563)
(579) (495)
The tax benefit associated with an income tax position is recognized only when it is more likely than not that such a
position will be sustained upon examination by the taxing authorities based on the technical merits of the position.
The current and deferred income tax benefit is equal to the largest amount, considering possible settlement
outcomes, that is greater than 50 percent likely of being realized upon settlement with the taxing authorities.
A reconciliation of the beginning and ending amount of unrecognized tax benefits is as follows: (millions of dollars) 2013 2012 Opening balance, January 1 82 68 Additions based on tax positions related to the current year 13 29 Reductions for tax positions of prior years (4) (15) Closing balance, December 31 91 82
PUBLIC ACCOUNTS, 2013-2014 2-169

As at December 31, 2013, OPG’s unrecognized tax benefits were $91 million (2012 – $82 million), excluding interest
and penalties, all of which, if recognized, would affect OPG’s effective tax rate. Changes in unrecognized tax benefits
over the next 12 months cannot be predicted with certainty.
OPG recognizes interest and penalties related to unrecognized tax benefits as income tax expense. As at
December 31, 2013, OPG has recorded interest on unrecognized tax benefits of $10 million (2012 – $7 million).
OPG considers its significant tax jurisdiction to be Canada. OPG remains subject to income tax examination for
years after 2008.
10. ACCUMULATED OTHER COMPREHENSIVE LOSS The changes in the balance of each component of accumulated other comprehensive loss (AOCL), net of income
taxes, during the years ended December 31, 2013 and 2012 are as follows: For the year ended December 31, 2013
(millions of dollars)
Unrealized Gains and Losses on
Cash Flow Hedges 1
Pension and Other Post-Employment
Benefits 1 Total 1 AOCL, beginning of year (156) (823) (979) Net gain on cash flow hedges 14 - 14 Actuarial gain and past service credits on - 226 226 remeasurement of liabilities for pension and other post-employment benefits Amounts reclassified from AOCL 13 42 55 Other comprehensive income for the year 27 268 295 AOCL, end of year (129) (555) (684) 1 All amounts are net of income taxes.
For the year ended December 31, 2012
(millions of dollars)
Unrealized Gains and Losses on
Cash Flow Hedges 1
Pension and Other Post-Employment
Benefits 1 Total 1 AOCL, beginning of year (163) (727) (890) Net loss on cash flow hedges (11) - (11) Actuarial loss and past service credits on - (123) (123) re-measurement of liabilities for pension and other post-employment benefits Amounts reclassified from AOCL 18 27 45
Other comprehensive income (loss) for the year 7 (96) (89) AOCL, end of year (156) (823) (979) 1 All amounts are net of income taxes.
2-170 PUBLIC ACCOUNTS, 2013-2014

The significant amounts reclassified out of each component of AOCL, net of income taxes, during the years ended December 31, 2013 and 2012 are as follows: Amount Reclassified from AOCL (millions of dollars) 2013 2012 Statement of Income Line Item Amortization of losses from cash flow hedges Losses 15 19 Net interest expense Income tax expense (2) (1)
13 18 Amortization of amounts related to pension and other post-employment benefits Actuarial gains and past service costs 57 35 See (1) below Income tax (recoveries) expense (15) (8)
42 27 Total reclassifications for the year 55 45 1 These AOCL components are included in the computation of pension and OPEB costs (see Note 11 for additional details).
11. PENSION AND OTHER POST-EMPLOYMENT BENEFITS
Fund Assets
The OPG registered pension fund investment guidelines are stated in an approved Statement of Investment Policies
and Procedures (SIPP). The SIPP is reviewed and approved by OPG’s Audit and Finance Committee at least
annually and includes a discussion regarding investment objectives and expectations, asset mix and rebalancing, and
the basis for measuring the performance of the pension fund assets.
In accordance with the SIPP, investment allocation decisions are made with a view to achieve OPG’s objective to
meet obligations of the plan as they come due. The pension fund assets are invested in two categories of asset
classes. The first category is liability hedging assets which are intended, over the long run, to hedge the inflation and
interest rate sensitivity of the plan liabilities. The second category is return enhancing assets which are intended,
over the long run, to obtain higher investment returns compared to the returns expected for liability hedging assets.
To achieve the above objective, OPG has adopted the following long-term asset mix and allowable ranges: Minimum Minimum Target Maximum Asset Class Fixed income securities 26% 34% 46% Equity securities 44% 54% 64% Alternative investments 0% 12% 20%
The plan may enter into derivative securities, such as interest rate swaps and forward foreign exchange contracts, for
risk management purposes, where such activity is consistent with its investment objective.
Significant Concentrations of Risk in Fund Assets
The assets of the pension fund are diversified to limit the impact of any individual investment. The pension fund is
diversified across multiple asset classes. Fixed income securities are diversified among Canadian structured bonds,
real return bonds, and corporate bonds, and an interest rate overlay hedging program, which is disclosed under
pooled funds. Equity securities are diversified across Canadian, US, and non-North American stocks. There are also
real estate and infrastructure portfolios that are less than five percent of the total pension fund assets. Investments in
the above asset classes are further diversified across funds, investment managers, strategies, vintages, sectors and
geographies, depending on the specific characteristics of each asset class.
PUBLIC ACCOUNTS, 2013-2014 2-171

Credit risk with respect to the pension fund’s fixed income securities is governed by the SIPP, which requires that
fixed income securities comply with various investment constraints that ensure prudent diversification and prescribed
minimum required credit rating quality. Credit risk, as it relates to the pension fund’s derivatives, is managed through
the use of International Swap and Derivatives Association (ISDA) documentation and counterparty management
performed by the fund’s investment managers.
Risk Management
Risk management oversight with respect to the pension fund includes but is not limited to the following activities:
Periodic asset/liability management and strategic asset allocation studies
Monitoring of funding levels and funding ratios
Monitoring compliance with asset allocation guidelines and investment management agreements
Monitoring asset class performance against asset class benchmarks
Monitoring investment manager performance against benchmarks.
Expected Rate of Return on Plan Assets
The expected rate of return on plan assets is based on current and expected asset allocation, as well as the expected
return considering long-term historical risks and returns associated with each asset class within the plan portfolio.
The asset management decisions consider the economic liabilities of the plan.
Fair Value Measurements
OPG is required to classify fair value measurements using a fair value hierarchy. This hierarchy groups financial
instruments into three levels, based on the significance of inputs used in measuring the fair value of the financial
assets and liabilities. Refer to Note 13 for a detailed discussion of fair value measurements and the fair value
hierarchy.
The following tables present pension plan assets measured at fair value in accordance with the fair value hierarchy: December 31, 2013 (millions of dollars) Level 1 Level 2 Level 3 Total Cash and cash equivalents 320 - - 320 Short-term investments - 5 - 5 Fixed income Corporate debt securities - 315 - 315 Non-US government bonds - 1,514 - 1,514 Equities Canadian 2,087 - - 2,087 US 2,031 - - 2,031 Foreign 2,357 - - 2,357 Pooled funds 38 1,959 11 2,008 Infrastructure - - 208 208 Real estate - - 210 210 Other - 2 - 2 6,833 3,795 429 11,057 1 1 The table above excludes pension fund receivables and payables.
2-172 PUBLIC ACCOUNTS, 2013-2014

December 31, 2012 (millions of dollars) Level 1 Level 2 Level 3 Total Cash and cash equivalents 81 116 - 197 Short-term investments - 5 - 5 Fixed income Corporate debt securities - 308 - 308 Non-US government bonds - 1,601 - 1,601 Equities Canadian 1,988 - - 1,988 US 1,664 - - 1,664 Foreign 1,907 - - 1,907 Pooled funds 8 2,396 8 2,412 Infrastructure - - 160 160 Real estate - - 72 72 Other - 5 - 5
5,648 4,431 240 10,319
1
1 The table above exclude pension fund receivables and payables.
The following tables present the changes in the fair value of financial instruments classified in Level 3: For the year ended December 31, 2013 Pooled (millions of dollars) Funds Infrastructure Real Estate Total Opening balance, January 1, 2013 8 160 72 240 Total realized and unrealized gains 3 19 6 28 Purchases, sales, and settlements - 29 132 161 Closing balance, December 31, 2013 11 208 210 429
For the year ended December 31, 2012
Pooled (millions of dollars) Funds Infrastructure Real Estate Total Opening balance, January 1, 2012 7 86 52 145 Total realized and unrealized gains 1 74 7 82 Purchases, sales, and settlements - - 13 13
Closing balance, December 31, 2012 8 160 72 240
During the years ended December 31, 2013 and 2012, there were no transfers between Level 1 and Level 2.
PUBLIC ACCOUNTS, 2013-2014 2-173

Plan Costs and Liabilities Details of OPG’s pension and OPEB obligations, pension fund assets and costs are presented in the following tables: Registered and Supplementary Pension Other Post-Employment Plans Benefits 2013 2012 2013 2012 Weighted Average Assumptions – Benefit Obligations at Year-End Rate used to discount future benefits 4.90% 4.30% 4.91% 4.32% Salary schedule escalation rate 2.50% 2.50% - - Rate of cost of living increase to pensions 2.00% 2.00% - - Initial health care trend rate - - 6.19% 6.38% Ultimate health care trend rate - - 4.34% 4.38% Year ultimate health care trend rate reached - - 2030 2030 Rate of increase in disability benefits - - 2.00% 2.00%
Registered and Supplementary Pension Other Post-Employment Plans Benefits 2013 2012 2013 2012 Weighted Average Assumptions – Costs for the Year Expected return on plan assets, net of expenses 6.25% 6.50% - - Rate used to discount future benefits 4.30% 5.10% 4.32% 5.07% Salary schedule escalation rate 2.50% 3.00% - - Rate of cost of living increase to pensions 2.00% 2.00% - - Initial health care trend rate - - 6.38% 6.48% Ultimate health care trend rate - - 4.38% 4.38% Year ultimate health care trend rate reached - - 2030 2030 Rate of increase in disability benefits - - 2.00% 2.00% Expected average remaining service life for employees 13 12 14 13 (years)
Other Post- Registered Supplementary Employment Pension Plans Pension Plans Benefits (millions of dollars) 2013 2012 2013 2012 2013 2012 Components of Cost Recognized Current service costs 291 264 10 9 86 78 Interest on projected benefit obligation 589 618 13 14 138 139 Expected return on plan assets, net of expenses (648) (668) - - - - Amortization of past service costs
1 - - - - 1 2
Amortization of net actuarial loss 1 244 144 6 4 48 31
Recognition of LTD net actuarial (gain) loss - - - - (11) 10
Cost recognized
2 476 358 29 27 262 260
1 The amortization of past service costs and net actuarial loss was recognized as an increase to OCI. This increase was partially offset by the impact of the Pension and OPEB Regulatory Asset as discussed in Note 5.
2 These pension and OPEB costs exclude the reduction of costs resulting from the recognition of additions to the regulatory assets
for the Pension and OPEB Cost Variance Account and the Impact for USGAAP Deferral Account. The Pension and OPEB Cost Variance Account and the Impact for USGAAP Deferral Account are discussed in Note 5.
2-174 PUBLIC ACCOUNTS, 2013-2014

Total benefit costs, including the impact of the Pension and OPEB Cost Variance Account and Impact for USGAAP Deferral Account, for the years ended December 31 are as follows: (millions of dollars) 2013 2012 Registered pension plans 476 358 Supplementary pension plans 29 27 Other post-employment benefits 262 260 Pension and OPEB Cost Variance Account (Note 5) (312) (192) Impact for USGAAP Deferral Account (Note 5) - (47)
Pension and other post-employment benefit costs 455 406
The pension and OPEB obligations and the pension fund assets measured as at December 31 are as follows: Other Post- Registered Supplementary Employment Pension Plans Pension Plans Benefits (millions of dollars) 2013 2012 2013 2012 2013 2012 Change in Plan Assets Fair value of plan assets at beginning of year 10,337 9,604 - - - - Contributions by employer 306 375 14 16 87 83 Contributions by employees 74 77 - - - - Actual return on plan assets, net of 923 898 - - - - expenses Benefit payments (679) (617) (14) (16) (87) (83)
Fair value of plan assets at end of year 10,961 10,337 - - - -
Change in Projected Benefit Obligations Projected benefit obligations at beginning of year 13,669 12,197 297 261 3,174 2,708 Employer current service costs 291 264 10 9 86 78 Contributions by employees 74 77 - - - - Interest on projected benefit obligation 589 618 13 14 138 139 Benefit payments (679) (617) (14) (16) (87) (83) Past service credits - - - - (2) (7) Net actuarial (gain) loss (522) 1,130 (17) 29 (590) 339
Projected benefit obligations at end of year 13,422 13,669 289 297 2,719 3,174
Funded status – deficit at end of year (2,461) (3,332) (289) (297) (2,719) (3,174)
The following table provides the pension and OPEB liabilities and their classification on the consolidated balance sheets as at December 31: Other Post- Registered Supplementary Employment Pension Plans Pension Plans Benefits (millions of dollars) 2013 2012 2013 2012 2013 2012 Current liabilities - - (9) (8) (91) (98) Non-current liabilities (2,461) (3,332) (280) (289) (2,628) (3,076)
Total liabilities (2,461) (3,332) (289) (297) (2,719) (3,174)
The accumulated benefit obligations for the registered pension plans and supplementary pension plans as at
December 31, 2013 are $12,242 million and $237 million, respectively (2012 – $12,366 million and $242 million,
respectively). The accumulated benefit obligation differs from the projected benefit obligation in that the accumulated
benefit obligation includes no assumption about future compensation levels.
PUBLIC ACCOUNTS, 2013-2014 2-175
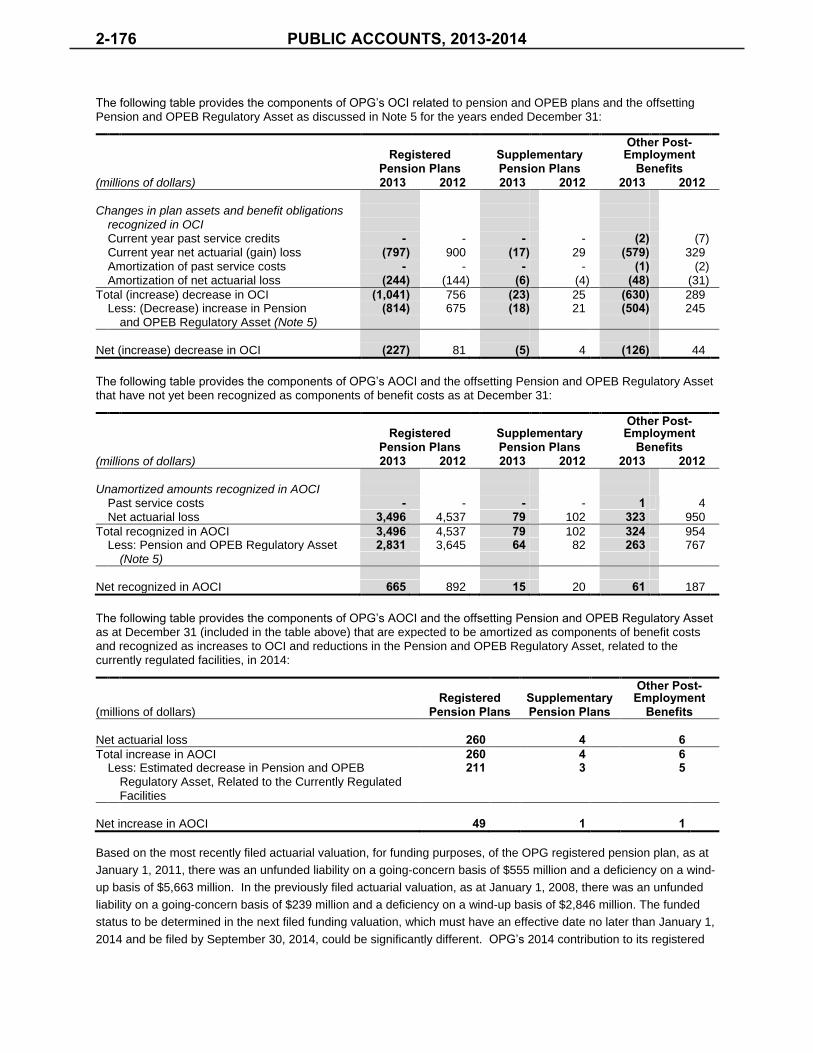
The following table provides the components of OPG’s OCI related to pension and OPEB plans and the offsetting Pension and OPEB Regulatory Asset as discussed in Note 5 for the years ended December 31: Other Post- Registered Supplementary Employment Pension Plans Pension Plans Benefits (millions of dollars) 2013 2012 2013 2012 2013 2012 Changes in plan assets and benefit obligations recognized in OCI Current year past service credits - - - - (2) (7) Current year net actuarial (gain) loss (797) 900 (17) 29 (579) 329 Amortization of past service costs - - - - (1) (2) Amortization of net actuarial loss (244) (144) (6) (4) (48) (31)
Total (increase) decrease in OCI (1,041) 756 (23) 25 (630) 289 Less: (Decrease) increase in Pension (814) 675 (18) 21 (504) 245 and OPEB Regulatory Asset (Note 5)
Net (increase) decrease in OCI (227) 81 (5) 4 (126) 44
The following table provides the components of OPG’s AOCI and the offsetting Pension and OPEB Regulatory Asset that have not yet been recognized as components of benefit costs as at December 31: Other Post- Registered Supplementary Employment Pension Plans Pension Plans Benefits (millions of dollars) 2013 2012 2013 2012 2013 2012 Unamortized amounts recognized in AOCI Past service costs - - - - 1
13
4 Net actuarial loss 3,496 4,537 79 102 323 950
Total recognized in AOCI 3,496 4,537 79 102 324 954 Less: Pension and OPEB Regulatory Asset 2,831 3,645 64 82 263 767 (Note 5)
Net recognized in AOCI 665 892 15 20 61 187
The following table provides the components of OPG’s AOCI and the offsetting Pension and OPEB Regulatory Asset as at December 31 (included in the table above) that are expected to be amortized as components of benefit costs and recognized as increases to OCI and reductions in the Pension and OPEB Regulatory Asset, related to the currently regulated facilities, in 2014: Other Post- Registered Supplementary Employment (millions of dollars) Pension Plans Pension Plans Benefits Net actuarial loss 260 4 6 Total increase in AOCI 260 4 6 Less: Estimated decrease in Pension and OPEB 211 3 5 Regulatory Asset, Related to the Currently Regulated Facilities Net increase in AOCI 49 1 1
Based on the most recently filed actuarial valuation, for funding purposes, of the OPG registered pension plan, as at
January 1, 2011, there was an unfunded liability on a going-concern basis of $555 million and a deficiency on a wind-
up basis of $5,663 million. In the previously filed actuarial valuation, as at January 1, 2008, there was an unfunded
liability on a going-concern basis of $239 million and a deficiency on a wind-up basis of $2,846 million. The funded
status to be determined in the next filed funding valuation, which must have an effective date no later than January 1,
2014 and be filed by September 30, 2014, could be significantly different. OPG’s 2014 contribution to its registered
2-176 PUBLIC ACCOUNTS, 2013-2014

pension plan will be determined as part of the funding valuation which is required to be filed by September 30, 2014.
The amount of OPG’s additional voluntary contribution, if any, is revisited from time to time. OPG will continue to
assess the requirements for contributions to the pension plan.
Based on the most recently filed actuarial valuation, for funding purposes, of the NWMO registered pension plan, as
at January 1, 2013, there was a surplus on a going-concern basis of $14 million and a deficiency on a wind-up basis
of $15 million. In the previously filed actuarial valuation, as at January 1, 2012, there was a surplus on a going-
concern basis of $8 million and a deficiency on a wind-up basis of $15 million. The next filed funding valuation must
have an effective date no later than January 1, 2014.
The supplementary pension plans are not funded, but are secured by Letters of Credit totalling $302 million as at
December 31, 2013 (2012 – $332 million).
Estimated future benefit payments to participants in the pension and OPEB plans based on the assumptions used to measure the benefit obligations as at December 31, 2013 are as follows: Other Post- Registered Supplementary Employment (millions of dollars) Pension Plans Pension Plans Benefits 2014 521 9 91 2015 551 10 96 2016 582 11 100 2017 589 12 105 2018 634 13 110 2019 through 2023 3,658 79 625
A one percent increase or decrease in the health care trend rate would result in an increase in the current service and
interest components of the 2013 OPEB cost recognized of $54 million (2012 – $48 million) or a decrease in the
service and interest components of the 2013 OPEB cost recognized of $39 million (2012 – $36 million). A one
percent increase or decrease in the health care trend rate would result in an increase in the projected OPEB
obligation at December 31, 2013 of $472 million (2012 – $604 million) or a decrease in the projected OPEB obligation
at December 31, 2013 of $360 million (2012 – $456 million).
12. DERIVATIVES
OPG is exposed to risks related to changes in electricity prices associated with a wholesale spot market for electricity
in Ontario, changes in market interest rates on debt expected to be issued in the future, and movements in foreign
currency that affect its assets, liabilities, and forecasted transactions. Select derivative instruments are used to
manage such risks. Derivatives are used as hedging instruments, as well as for trading purposes.
Interest rate risk is the risk that the value of assets and liabilities can change due to movements in related interest
rates. Interest rate risk for OPG arises with the need to refinance existing debt and/or undertake new financing. The
management of these risks is undertaken by using derivatives to hedge the exposure in accordance with corporate
risk management policies. OPG periodically uses interest rate swap agreements to mitigate elements of interest rate
risk exposure associated with anticipated financing.
The LME has entered into forward start interest rate swaps to hedge against the effect of future changes in interest
rates for long-term debt for the Lower Mattagami River project.
Electricity price risk for the Company is the potential for adverse movements in the market price of electricity.
Exposure to electricity price risk is reduced as a result of regulated prices and other contractual arrangements for a
significant portion of OPG’s business. The majority of this exposure should be mitigated with the implementation of a
PUBLIC ACCOUNTS, 2013-2014 2-177

regulated price for most of OPG’s currently unregulated hydroelectric facilities, which have been regulated by the
OEB effective July 1, 2014.
The conditional reduction to revenue in the future, embedded in the terms of the Bruce Lease, is treated as a
derivative. Assumptions related to future electricity prices impact the valuation of the derivative liability embedded in
the Bruce Lease.
OPG’s foreign exchange exposure is attributable to two primary factors: US dollar denominated transactions such as
the purchase of fuels; and the influence of US dollar denominated commodity prices on Ontario electricity market
prices. OPG enters into foreign exchange derivatives and agreements with major financial institutions, when
necessary, in order to manage the Company’s exposure to foreign currency movements.
The majority of OPG’s revenues are derived from sales through the IESO-administered spot market. Although the
credit exposure to the IESO represents a significant portion of OPG’s accounts receivable, the Company’s
management accepts this risk due to the IESO’s primary role in the Ontario electricity market. The remaining
receivables exposure is to a diverse group of generally high quality counterparties. OPG’s allowance for doubtful
accounts as at December 31, 2013 was less than $1 million.
The following is a summary of OPG’s derivative instruments: (millions of dollars except where Notional Fair noted) Quantity Terms Value Balance Sheet Line Item As at December 31, 2013 Commodity derivative instruments 5.0 TWh 1 year 10 Other accounts receivable and prepaid expenses Foreign exchange derivative 37 within 1 year 1 Other accounts receivable and instruments prepaid expenses Commodity derivative instruments 2.8 TWh 1 year (11) Accounts payable and accrued charges Cash flow hedges – Forward start 100 1 - 10 years (8) Long-term accounts payable and interest rate swaps accrued charges Derivative embedded in the Bruce n/a 6 years (346) Long-term accounts payable and Lease accrued charges
Total derivatives (354)
(millions of dollars except where Notional Fair noted) Quantity Terms Value Balance Sheet Line Item As at December 31, 2012 Commodity derivative instruments 4.3 TWh 1 - 2 years 7 Other accounts receivable and prepaid expenses Foreign exchange derivative 63 within 1 year (1) Accounts payable and accrued instruments charges Commodity derivative instruments 2.0 TWh 1 - 2 years (4) Accounts payable and accrued charges Cash flow hedges – Forward start 410 1 - 12 years (66) Long-term accounts payable and interest rate swaps accrued charges Derivative embedded in the Bruce n/a 7 years (392) Long-term accounts payable and Lease accrued charges
Total derivatives (456)
2-178 PUBLIC ACCOUNTS, 2013-2014

The following table shows the amount related to derivatives recorded in AOCL and income for the years ended December 31: (millions of dollars) 2013 2012 Cash flow hedges Gain (loss) in OCI 17 (12) Reclassification of losses to net interest expense 18 12 Reclassification of gains to fuel expense (3) 7 Commodity derivatives Realized losses in revenue (7) (2) Unrealized losses in revenue (4) (2) Embedded derivative Unrealized losses in revenue
1 (33) (284)
1 Excludes the impact of the Bruce Lease Net Revenues Variance Account.
Existing net losses of $19 million deferred in AOCL as at December 31, 2013 are expected to be reclassified to net
income within the next 12 months.
13. FAIR VALUE MEASUREMENTS
OPG is required to classify fair value measurements using a fair value hierarchy. This hierarchy groups financial
assets and liabilities into three levels, based on the significance of inputs used in measuring the fair value of the
financial assets and liabilities. The level within which the financial asset or liability is classified is determined based
on the attribute of significance to the inputs to the fair value measurement. The fair value hierarchy has the following
levels:
Level 1: Valuation of inputs is based on unadjusted quoted market prices observed in active markets for
identical assets or liabilities.
Level 2: Valuation is based on inputs other than quoted prices under Level 1 that are observable for the asset
or liability, either directly or indirectly.
Level 3: Valuation is based on inputs for the asset or liability that are not based on observable market data.
The fair value of financial instruments traded in active markets is based on quoted market prices at the consolidated
balance sheet dates. A market is regarded as active if quoted prices are readily and regularly available from an
exchange, dealer, broker, industry group, pricing service, or regulatory agency, and those prices represent actual and
regularly occurring market transactions on an arm’s length basis. The quoted market price used for financial assets
held by OPG is the current bid price. These instruments are included in Level 1 and are comprised primarily of equity
investments and fund investments.
For financial instruments for which quoted market prices are not directly available, fair values are estimated using
forward price curves developed from observable market prices or rates. The estimation of fair value may include the
use of valuation techniques or models, based wherever possible on assumptions supported by observable market
prices or rates prevailing at the consolidated balance sheet dates. This is the case for over-the-counter derivatives
and securities, which include energy commodity derivatives, foreign exchange derivatives, interest rate swap
derivatives, and fund investments. Pooled fund investments are valued at the unit values supplied by the pooled fund
administrators. The unit values represent the underlying net assets at fair values, determined using closing market
prices. Valuation models use general assumptions and market data and therefore do not reflect the specific risks and
other factors that would affect a particular instrument’s fair value. The methodologies used for calculating the fair
value adjustments are reviewed on an ongoing basis to ensure that they remain appropriate. If all significant inputs
required to fair value an instrument are observable, the instrument is included in Level 2.
PUBLIC ACCOUNTS, 2013-2014 2-179

If one or more of the significant inputs is not based on observable market data, the instrument is included in Level 3.
Specific valuation techniques are used to value these instruments. Significant Level 3 inputs include: recent
comparable transactions, comparable benchmark information, bid/ask spread of similar transactions, and other
relevant factors.
Transfers into, out of, or between levels are deemed to have occurred on the date of the event or change in
circumstances that caused the transfer to occur.
The Company is required to determine the fair value of all its financial instruments. The following is a summary of OPG’s financial instruments as at December 31: Fair Carrying
(millions of dollars except where noted) Value Value 1 Balance Sheet Line Item As at December 31, 2013 Commodity derivative instruments 10 10 Other accounts receivable and prepaid expenses Investment in OPG Ventures Inc. 9 9 Other long-term assets Nuclear fixed asset removal and nuclear 13,496 13,496 Nuclear fixed asset removal and nuclear waste management funds (includes waste management funds current portion) Foreign exchange derivative instruments 1 1 Other accounts receivable and prepaid expenses Commodity derivative instruments (11) (11) Accounts payable and accrued charges Cash flow hedges - Forward start interest (8) (8) Long-term accounts payable and accrued rate swaps charges Payable related to cash flow hedges (56) (56) Long-term accounts payable and accrued charges Derivative embedded in the Bruce Lease (346) (346) Long-term accounts payable and accrued charges Long-term debt (includes current portion) (5,955) (5,625) Long-term debt
As at December 31, 2012 Commodity derivative instruments 7 7 Other accounts receivable and prepaid expenses Investment in OPG Ventures Inc. 10 10 Other long-term assets Nuclear fixed asset removal and nuclear 12,717 12,717 Nuclear fixed asset removal and nuclear waste management funds (includes waste management funds current portion) Foreign exchange derivative instruments (1) (1) Accounts payable and accrued charges Commodity derivative instruments (4) (4) Accounts payable and accrued charges Cash flow hedges - Forward start interest (66) (66) Long-term accounts payable and accrued rate swaps charges Payable related to cash flow hedges (24) (24) Long-term accounts payable and accrued charges Derivative embedded in the Bruce Lease (392) (392) Long-term accounts payable and accrued charges Long-term debt (includes current portion) (5,751) (5,114) Long-term debt 1
The carrying values of other financial instruments included in cash and cash equivalents, receivables from related parties, other accounts receivable and prepaid expenses, and accounts payable and accrued charges approximate their fair values due to the immediate or short-term maturity of these financial instruments.
The fair value of long-term debt instruments is determined based on a conventional pricing model, which is a function
of future cash flows, the current market yield curve and term to maturity. These inputs are considered Level 2 inputs.
2-180 PUBLIC ACCOUNTS, 2013-2014

The following tables present financial assets and liabilities measured at fair value in accordance with the fair value hierarchy: December 31, 2013 (millions of dollars) Level 1 Level 2 Level 3 Total Assets Decommissioning Fund 3,005 2,715 247 5,967 Used Fuel Fund 526 6,961 42 7,529 Commodity derivative instruments 5 2 3 10 Investment in OPG Ventures Inc. - - 9 9 Foreign exchange derivative instruments - 1 - 1 Total 3,536 9,679 301 13,516 Liabilities Derivative embedded in the Bruce Lease - - (346) (346) Forward start interest rate swaps - (8) - (8) Commodity derivative instruments (8) (3) - (11) Total (8) (11) (346) (365) Net assets (liabilities) 3,528 9,668 (45) 13,151
December 31, 2012 (millions of dollars) Level 1 Level 2 Level 3 Total Assets Decommissioning Fund 2,596 2,948 163 5,707 Used Fuel Fund 212 6,785 13 7,010 Commodity derivative instruments 2 2 3 7 Investment in OPG Ventures Inc. - - 10 10
Total 2,810 9,735 189 12,734 Liabilities Derivative embedded in the Bruce Lease - - (392) (392) Forward start interest rate swaps - (66) - (66) Commodity derivative instruments (3) (1) - (4) Foreign exchange derivative instruments - (1) - (1)
Total (3) (68) (392) (463)
Net assets (liabilities) 2,807 9,667 (203) 12,271
During the year ended December 31, 2013, there were no transfers between Level 1 and Level 2. In addition, there
were no transfers into and out of Level 3.
PUBLIC ACCOUNTS, 2013-2014 2-181

The following tables present the changes in OPG's assets and liabilities measured at fair value based on Level 3: For the year ended December 31, 2013 Derivative Decom- Investment Embedded Commodity missioning Used Fuel in OPG in the Bruce Derivative (millions of dollars) Fund Fund Ventures Inc. Lease 1 Instruments Opening balance, January 1, 2013 163 13 10 (392) 3 Unrealized gains included in earnings on 18 3 - - - nuclear fixed asset removal and nuclear waste management funds
1
Unrealized losses included in - - (1) (33) - revenue Realized losses included in revenue (1) - - - (2) Purchases 83 14 - - 2 Sales (3) - - - - Settlements (13) 12 - 79 - Closing balance, December 31, 2013 247 42 9 (346) 3 1
Total gains (losses) exclude the impact of regulatory assets and liabilities.
For the year ended December 31, 2012 Derivative Decom- Investment Embedded Commodity missioning Used Fuel in OPG in the Bruce Derivative (millions of dollars) Fund Fund Ventures Inc. Lease 1 Instruments Opening balance, January 1, 2012 98 6 16 (186) 2 Unrealized gains included in earnings on 11 1 - - - nuclear fixed asset removal and nuclear waste management funds
1
Unrealized losses included in - - (5) (284) (1) revenue Realized losses included in revenue - - - - (5) Purchases 58 6 - - 7 Sales (2) - - - - Settlements (2) - (1) 78 -
Closing balance, December 31, 2012 163 13 10 (392) 3 1
Total gains (losses) exclude the impact of regulatory assets and liabilities.
Derivative Embedded in the Bruce Lease
The revenue from the Bruce Lease is reduced in each calendar year where the expected future annual arithmetic
average hourly Ontario electricity price falls below $30/MWh and certain other conditions are met. The conditional
reduction to revenue in the future, embedded in the terms of the Bruce Lease, is treated as a derivative.
Due to an unobservable input used in the pricing model of the Bruce Lease embedded derivative, the measurement
of the liability is classified within Level 3.
The following table presents the quantitative information about the Level 3 fair value measurement of the Bruce Lease embedded derivative as at December 31, 2013: (millions of dollars except Valuation Unobservable
where noted) Fair Value Technique Input Range
Derivative embedded in the Bruce Lease (346) Option model Risk Premium
1 0% - 30%
1 Represents the range of premiums used in the valuation analysis that OPG has determined market participants would use when pricing the derivative.
2-182 PUBLIC ACCOUNTS, 2013-2014

The term related to the derivative embedded in the Bruce Lease is based on the remaining service lives, for
accounting purposes, for certain units of the Bruce generating stations. In 2012, the service life of these Bruce units
was extended to 2019. The service life extension accounted for $249 million of the total increase in the derivative
liability during 2012. OPG’s exposure to changes in the fair value of the Bruce Lease embedded derivative is
mitigated as part of the OEB regulatory process, since the revenue from the lease of the Bruce generating stations is
included in the determination of regulated prices and is subject to the Bruce Lease Net Revenues Variance Account.
As such, the pre-tax income statement impact, as a result of changes in the derivative liability, is offset by the pre-tax
income statement impact of the Bruce Lease Net Revenues Variance Account.
Decommissioning Fund and Used Fuel Fund
Nuclear Funds investments classified as Level 3 consist of real estate and infrastructure investments within the
alternative investment portfolio. The fair value of the investments within the Nuclear Funds’ alternative investment
portfolio is determined using appropriate valuation techniques, such as recent arm’s length market transactions,
reference to current fair values of other instruments that are substantially the same, discounted cash flow analyses,
third-party independent appraisals, valuation multiples, or other valuation methods. Any control, size, liquidity or
other discounts or premiums on the investments are considered in the determination of fair value.
The process of valuing investments for which no published market price exists is based on inherent uncertainties and
the resulting values may differ from values that would have been used had a ready market existed for the
investments. The values may also differ from the prices at which the investments may be sold.
The following are the classes of investments within the Nuclear Funds that are reported on the basis of net asset value as at December 31, 2013: Fair Unfunded Redemption Redemption (millions of dollars except where noted) Value Commitments Frequency Notice Infrastructure 312 241 n/a n/a Real Estate 286 373 n/a n/a Pooled Funds Short-term Investments 27 - Daily 1 - 5 Days Fixed Income 519 - Daily 1 - 5 Days Equity 1,627 - Daily 1 - 5 Days
Total 2,771 614
The fair value of the above investments is classified as either Level 2 or Level 3.
Infrastructure
This class includes investments in funds whose investment objective is to generate a combination of long-term capital
appreciation and current income generally through investments such as energy, transportation and utilities.
The fair values of investments in this class have been estimated using the Nuclear Funds’ ownership interest in
partners’ capital and/or underlying investments held by subsidiaries of an infrastructure fund.
The investments in the respective infrastructure funds are not redeemable. However, the Nuclear Funds may
transfer any of its partnership interests/shares to another party, as stipulated in the partnership agreements and/or
shareholders’ agreements. Distributions from each infrastructure fund will be received based on the operations of the
underlying investments and/or as the underlying investments of the infrastructure funds are liquidated. It is not
possible to estimate when the underlying assets of the infrastructure funds will be liquidated. However, the
infrastructure funds have a maturity end period ranging from 2019 to 2025.
PUBLIC ACCOUNTS, 2013-2014 2-183

Real Estate
This class includes investment in institutional-grade real estate property located in Canada. The investment objective
is to provide a stable level of income with the opportunity for long-term capital appreciation.
The fair values of the investments in this class have been estimated using the net asset value of the Nuclear Funds’
ownership interest in these investments.
The partnership investments are not redeemable. However, the Nuclear Funds may transfer any of their partnership
interests to another party, as stipulated in the partnership agreement, with prior written consent of the other limited
partners. For investments in private real estate corporations, shares may be redeemed through a pre-established
redemption process. It is not possible to estimate when the underlying assets in this class will be liquidated.
Pooled Funds
This class represents investments in pooled funds, which primarily include a diversified portfolio of fixed income
securities, issued mainly by Canadian corporations and diversified portfolios of US and Emerging Market listed equity
and fixed income securities. The investment objective of the pooled funds is to achieve capital appreciation and
income through professionally managed portfolios.
The fair value of the investments in this class has been estimated using the net asset value per share of the
investments.
There are no significant restrictions on the ability to sell investments in this class.
Investment in OPG Ventures Inc.
Significant Level 3 inputs used in the fair value measurement of the OPG Ventures Inc. investments include recent
comparable transactions, comparable benchmark information, bid/ask spread of similar transactions, and other
relevant factors. Significant increases (decreases) in any of those inputs in isolation would result in significantly
higher (lower) fair value measurement.
14. COMMON SHARES
As at December 31, 2013 and 2012, OPG had 256,300,010 common shares issued and outstanding at a stated value
of $5,126 million. OPG is authorized to issue an unlimited number of common shares without nominal or par value.
Any issue of new shares is subject to the consent of OPG's shareholder.
15. COMMITMENTS AND CONTINGENCIES
Litigation
Various legal proceedings are pending against OPG or its subsidiaries, covering a wide range of matters that arise in
the ordinary course of its business activities.
On August 9, 2006, a Notice of Action and Statement of Claim filed with the Ontario Superior Court of Justice in the
amount of $500 million was served on OPG and Bruce Power L.P. by British Energy Limited and British Energy
International Holdings Limited (together British Energy). The British Energy claim against OPG pertains to corrosion
in the Bruce Unit 8 Steam Generators, in particular, erosion of the support plates through which the boiler tubes pass.
The claim amount includes $65 million due to an extended outage to repair some of the alleged damage. The
balance of the amount claimed is based on an increased probability the steam generators will have to be replaced or
2-184 PUBLIC ACCOUNTS, 2013-2014

the unit taken out of service prematurely. OPG leased the Bruce nuclear generating stations to Bruce Power L.P. in
2001.
British Energy is defending an arbitration commenced by some of the current owners of Bruce Power L.P. regarding
an alleged breach of British Energy’s representations and warranties to the claimants when they purchased British
Energy’s interest in Bruce Power L.P. (the Arbitration). In the second quarter of 2012, the arbitrator released an
interim award. The arbitrator found that British Energy was liable to the claimants for some of the damages they
claimed. The arbitrator determined what elements of the claim British Energy was liable for, but did not award a
specific amount in damages as it was found that further evidence from the parties is necessary to quantify the exact
amount of the damages. If the parties to the Arbitration cannot agree on the quantum of damages, there will be
further proceedings before the arbitrator to determine the amount. British Energy counsel has indicated that the
damages payable to the claimants will likely be less than $70 million.
British Energy previously indicated that they did not require OPG or Bruce Power L.P. to actively defend the court
action until the conclusion of the Arbitration. Although the Arbitration had not concluded, British Energy requested
that OPG file a Statement of Defense. OPG and Bruce Power L.P. advised British Energy that if British Energy
wishes the court action to proceed prior to the conclusion of the Arbitration, the defendants would bring a motion for a
Stay of proceedings, a Dismissal of the current action or, in the alternative, a motion to extend the time for service of
the Statement of Defense until the conclusion of the Arbitration. That motion was scheduled to be heard on March 5,
2010, but was adjourned at the request of British Energy. The return date of that motion is yet to be set.
Certain First Nations have commenced actions against OPG for interference with their respective reserve and
traditional land rights. As well, OPG has been brought into certain actions by the First Nations against other parties
as a third party defendant. Each of these matters is subject to various uncertainties. Some of these matters may be
resolved unfavourably.
While it is not possible to determine the ultimate outcome of the various pending actions, it is the Company’s belief
that their resolution is not likely to have a material adverse impact on its financial position.
Environmental
Current operations are subject to regulation with respect to emissions to air, water, and land as well as other
environmental matters by federal, provincial, and local authorities. The cost of obligations associated with current
operations is provided for on an ongoing basis. Management believes it has made adequate provision in the
consolidated financial statements to meet certain other environmental obligations. As at December 31, 2013, OPG’s
environmental liabilities were $15 million (2012 – $17 million).
Guarantees
The Company and its joint venture partners have jointly guaranteed the financial performance of jointly owned entities
related primarily to the payment of liabilities. As at December 31, 2013, the total amount of guarantees OPG
provided to these entities was $76 million. OPG may terminate some of these guarantees within a short time frame
by providing written notice to the counterparties at any time. Other guarantees have terms ending between 2019 and
2029. The potential impact of the fair value of these guarantees to income has been estimated as at December 31,
2013 to be negligible. As at December 31, 2013, OPG does not expect to make any payments associated with these
guarantees.
PUBLIC ACCOUNTS, 2013-2014 2-185

Contractual and Commercial Commitments
OPG’s contractual obligations and other significant commercial commitments as at December 31, 2013, are as follows: (millions of dollars) 2014 2015 2016 2017 2018 Thereafter Total Contractual obligations: Fuel supply agreements 183 208 163 143 126 159 982 Contributions under the ONFA
1 139 143 150 163 193 2,706 3,494
Long-term debt repayment 5 593 273 1,103 398 3,253 5,625 Interest on long-term debt 262 256 242 223 167 2,104 3,254 Unconditional purchase obligations 98 97 8 - - - 203 Operating lease obligations 16 17 15 15 13 70 146 Commitments related to Darlington 200 - - - - - 200 refurbishment
2
Pension contributions 3 300 - - - - - 300
Operating licence 41 25 25 25 26 - 142 Other - primarily accounts payable 449 33 14 13 12 69 590
1,693 1,372 890 1,685 935 8,361 14,936 Significant commercial commitments: Niagara Tunnel 5 - - - - - 5 Lower Mattagami 298 65 - - - - 363 Atikokan 16 - - - - - 16
Total 2,012 1,437 890 1,685 935 8,361 15,320 1
Contributions under the ONFA are based on the 2012 ONFA Reference Plan contribution schedule approved in 2012. 2
Estimated currently committed costs to close the project, including demobilization of project staff and cancellation of existing contracts, and material orders.
3 The pension contributions include ongoing funding requirements and additional funding requirements towards the deficit, in accordance with the actuarial valuation of the OPG registered pension plan as at January 1, 2011. The next actuarial valuation of the OPG plan must have an effective date no later than January 1, 2014. The pension contributions are affected by various factors including market performance, changes in actuarial assumptions, plan experience, changes in the pension regulatory environment, and the timing of funding valuations. Funding requirements after 2014 for the OPG registered pension plan are excluded due to significant variability in the assumption required to project the timing of future cash flows. The amount of OPG’s additional voluntary contribution, if any, is revisited from time to time.
Niagara Tunnel
In March 2013, the 10.2 kilometre Niagara Tunnel was filled with water and declared in-service, approximately nine
months ahead of the approved project completion date of December 2013. The capital project expenditures for 2013
were $87 million and the life-to-date capital expenditures as at December 31, 2013 were $1.46 billion. The project is
debt financed through the OEFC. Total costs of the project after closure activities are expected to be below
$1.5 billion, compared to the approved budget of $1.6 billion.
Lower Mattagami
The Lower Mattagami River project will increase the capacity of the four generating stations on the Lower Mattagami
River by 438 MW. The capital project expenditures for the year ended December 31, 2013 were $629 million and the
life-to-date expenditures were $1.98 billion. The project budget of $2.6 billion includes the design-build contract, as
well as contingencies, interest, and other OPG costs, including project management, contract management, impact
agreements with First Nations, and transmission connection costs.
Atikokan Biomass Conversion
OPG is in the process of converting the Atikokan generating station from coal to biomass fuel. The converted station
is expected to have a capacity of 200 MW. The capital project expenditures for the year ended December 31, 2013
were $85 million and the life-to-date expenditures were $144 million. The conversion project has an approved cost
estimate of $170 million and is expected to be completed by August 2014.
2-186 PUBLIC ACCOUNTS, 2013-2014

Darlington Refurbishment
As of December 31, 2013, OPG has issued contracts valued at approximately $1.5 billion related to the refurbishment
of the Darlington nuclear station. These contracts contain suspension and termination provisions. The most
significant contracts include the Retube and Feeder Replacement (RFR) contract, and the Turbine Generator
contract.
In March 2013, OPG awarded the Turbine Generator contract for equipment supply and technical services, valued at
approximately $350 million. In March 2012, OPG awarded a RFR contract, with an estimated value at over
$600 million.
OPG signed the contract for the primary and secondary side cleaning of the Steam Generators in December 2013.
The contract for the engineering integration and field installation portion of the Turbine Generator scope of work was
signed in February 2014.
Capital project expenditures for 2013 were $431 million and the life-to-date capital expenditures as at December 31,
2013 were $793 million. A detailed cost and schedule estimate for the refurbishment of the four units is expected to
be completed in 2015.
Lease Commitments
The Company is party to various leases for real estate and equipment under operating lease arrangements. Real
estate and transport equipment base rent expense for the year ended December 31, 2013 was $15 million (2012 –
$16 million).
The Company leases Bruce A and B nuclear generating stations to Bruce Power L.P. until 2018, with Bruce Power
L.P. having an option to renew for up to 25 years thereafter.
As per Ontario Regulation 53/05 pursuant to the Ontario Energy Board Act, 1998, the difference between OPG’s
revenues, including lease revenues, and costs, including depreciation expense, associated with its ownership of the
Bruce A and B nuclear generating stations is included in the determination of OPG’s nuclear regulated prices
established by the OEB. These revenues and costs are determined on the basis of the manner in which they are
recognized in OPG’s consolidated financial statements. As the Bruce assets are not prescribed facilities under
Ontario Regulation 53/05, the net book value of the Bruce assets is not included in the rate base.
During 2013, OPG recorded lease revenue related to the Bruce generating stations of $176 million (2012 –
$164 million), which included supplemental rent from Bruce Power L.P. of $125 million (2012 – $113 million). The
amount of supplemental rent shown was net of a required rebate of $79 million (2012 – $78 million). The net book
value of property, plant and equipment on lease to Bruce Power L.P. as at December 31, 2013 was $1,859 million
(2012 – $1,963 million).
Base rent payments as stipulated in the lease agreement due to the Company from Bruce Power L.P. are as follows: (millions of dollars) 2014 83 2015 85 2016 88 2017 90 2018 92
438
PUBLIC ACCOUNTS, 2013-2014 2-187
Other Commitments
The Company maintains labour agreements with the Power Workers’ Union (PWU) and the Society of Energy
Professionals (The Society). As at December 31, 2013, OPG had approximately 10,270 regular employees and
about 89 percent of its regular labour force was covered by the collective bargaining agreements. The current
collective agreement between OPG and the PWU has a three-year term, which expires on March 31, 2015. The
Company’s most recent collective agreement with The Society was established through an arbitration award issued
on April 8, 2013. The collective agreement between OPG and The Society expires on December 31, 2015. The
Society filed a Judicial Review Application in the second quarter of 2013 to the Superior Court of Ontario in the matter
of the arbitration award.
Contractual and commercial commitments as noted exclude certain purchase orders, as they represent purchase
authorizations rather than legally binding contracts, and are subject to change without significant penalties.
Proxy Property Taxes
In November 2005, OPG received a letter from the Ministry of Finance (MOF) indicating its intent to recommend to
the Minister of Finance that an Ontario regulation covering proxy property taxes be updated retroactive to April 1,
1999, to reflect reassessments and appeal settlements of certain OPG properties since that date. OPG continues to
monitor the resolution to this issue with the MOF, as updates to the regulation may not occur for several years. OPG
has not recorded any amounts relating to this anticipated regulation change.
16. BUSINESS SEGMENTS
OPG has five reportable business segments. The business segments are: Regulated – Nuclear Generation,
Regulated – Nuclear Waste Management, Regulated – Hydroelectric, Unregulated – Hydroelectric, and Unregulated
– Thermal.
Regulated – Nuclear Generation Segment
OPG’s Regulated – Nuclear Generation business segment operates in Ontario, generating and selling electricity from
the nuclear generating stations that it owns and operates. The business segment includes electricity generated by
the Pickering and Darlington nuclear generating stations. This business segment also includes revenue under the
terms of a lease arrangement and related agreements with Bruce Power L.P. related to the Bruce nuclear generating
stations. This revenue includes lease revenue and revenue from services such as heavy water sales and detritiation.
Revenue is also earned from isotope sales and ancillary services. Ancillary revenues are earned through voltage
control and reactive support. Revenues under the agreements with Bruce Power and from isotope sales and
ancillary services are included by the OEB in the determination of the regulated prices for OPG’s nuclear facilities.
Regulated – Nuclear Waste Management Segment
OPG’s Regulated – Nuclear Waste Management segment engages in the management of used nuclear fuel and
L&ILW, the decommissioning of OPG’s nuclear generating stations (including the stations on lease to Bruce Power
L.P.), the management of the Nuclear Funds, and related activities including the inspection and maintenance of the
waste storage facilities. Accordingly, accretion expense on the Nuclear Liabilities and earnings from the Nuclear
Funds are reported under this segment.
As the nuclear generating stations operate over time, OPG incurs variable costs related to nuclear used fuel bundles
and L&ILW generated. These costs increase the Nuclear Liabilities through the generation of additional used nuclear
fuel bundles and L&ILW. These variable costs are charged to current operations in the Regulated – Nuclear
Generation segment to reflect the cost of producing energy and earning revenue under the Bruce Lease and related
agreements. Since variable costs increase the Nuclear Liabilities in the Regulated – Nuclear Waste Management
2-188 PUBLIC ACCOUNTS, 2013-2014

segment, OPG records an inter-segment charge between the Regulated – Nuclear Generation and the Regulated –
Nuclear Waste Management segments. The impact of the inter-segment charge is eliminated on OPG’s consolidated
statements of income and balance sheets.
The Regulated – Nuclear Waste Management segment is considered regulated because the costs associated with
the Nuclear Liabilities are included by the OEB in the determination of regulated prices for production from OPG’s
regulated nuclear facilities.
Regulated – Hydroelectric Segment
OPG’s Regulated – Hydroelectric business segment operates in Ontario, generating and selling electricity from most
of the Company’s baseload hydroelectric generating stations. The business segment is comprised of electricity
generated by the Sir Adam Beck 1, 2 and Pump generating station, DeCew Falls 1 and 2, and the R.H. Saunders
hydroelectric facilities. Ancillary revenues and other revenues are earned through offering available generating
capacity as operating reserve and through the supply of other ancillary services including voltage control and reactive
support, certified black start facilities, regulation service, and other services. These ancillary revenues and other
revenues are included by the OEB in the determination of the regulated prices for these facilities.
Unregulated – Hydroelectric Segment
The Unregulated – Hydroelectric business segment operates in Ontario, generating and selling electricity from the
Company’s hydroelectric generating stations, which are not subject to rate regulation. The segment includes
hydroelectric stations that are subject to ESAs. Ancillary revenues and other revenues are earned through offering
available generating capacity as operating reserve, and through the supply of other ancillary services including
voltage control and reactive support, certified black start facilities, regulation service, and other services.
Unregulated – Thermal Segment
The Unregulated – Thermal business segment operates in Ontario, generating and selling electricity from the
Company’s thermal generating stations, which are not subject to rate regulation. Ancillary revenues are earned
through offering available generating capacity as operating reserve, and the supply of other ancillary services
including voltage control and reactive support, regulation service, and other services.
Other
The Other category includes revenue that OPG earns from its 50 percent joint venture share of Brighton Beach
related to an energy conversion agreement between Brighton Beach and Shell Energy North America (Canada) Inc.
This category also includes revenue that OPG earns from its 50 percent joint venture share of the PEC gas-fired
generating station, which is operated under the terms of an Accelerated Clean Energy Supply contract with the OPA.
The revenue and expenses related to OPG’s trading and other non-hedging activities are also reported in the Other
category. As part of these activities, OPG transacts with counterparties in Ontario and neighbouring energy markets
in predominantly short-term trading activities of typically one year or less in duration. These activities relate primarily
to physical energy that is purchased and sold at the Ontario border, sales of financial risk management products and
sales of energy-related products. All contracts that are not designated as hedges are recorded as assets or liabilities
at fair value, with changes in fair value recorded in the Other category. In addition, the Other category includes
revenue from real estate rentals.
OM&A expenses of the generation segments include an inter-segment service fee for the use of certain property,
plant and equipment, and intangible assets held within the Other category. The total service fee is recorded as a
reduction to the Other category’s OM&A expenses.
PUBLIC ACCOUNTS, 2013-2014 2-189

The service fee included in OM&A expenses by segment for the years ended December 31 is as follows: (millions of dollars) 2013 2012 Regulated – Nuclear Generation 23 23 Regulated – Hydroelectric 2 2 Unregulated – Hydroelectric 3 3 Unregulated – Thermal 5 6 Other (33) (34)
Segment Income (Loss) Regulated Unregulated for the Year Ended Nuclear December 31, 2013 Nuclear Waste Hydro- Hydro-
(millions of dollars) Generation Management electric electric Thermal Other Elimination Total Revenue 2,894 113 843 472 578 72 (109) 4,863 Fuel expense 237 - 268 82 121 - - 708 Gross margin 2,657 113 575 390 457 72 (109) 4,155 Operations, 2,022 121 108 236 362 7 (109) 2,747 maintenance and administration Depreciation and 626 - 129 74 115 19 - 963 amortization Accretion on fixed - 742 - - 14 - - 756 asset removal and nuclear waste management liabilities Earnings on nuclear - (628) - - - - - (628) fixed asset removal and nuclear waste management funds Property and capital 29 - (2) - 16 10 - 53 taxes Restructuring - - - - 50 - - 50 Other (income) loss (1) - - 4 (4) (37) - (38) Income (loss) before interest and income taxes (19) (122) 340 76 (96) 73 - 252
2-190 PUBLIC ACCOUNTS, 2013-2014

Segment Income (Loss) Regulated Unregulated for the Year Ended Nuclear December 31, 2012 Nuclear Waste Hydro- Hydro-
(millions of dollars) Generation Management electric electric Thermal Other Elimination Total Revenue 3,060 107 724 373 507 64 (103) 4,732 Fuel expense 261 - 261 71 162 - - 755
Gross margin 2,799 107 463 302 345 64 (103) 3,977 Operations, 1,930 114 103 236 361 7 (103) 2,648 maintenance and administration Depreciation and 480 - 33 73 59 19 - 664 amortization Accretion on fixed - 712 - - 13 - - 725 asset removal and nuclear waste management liabilities Earnings on nuclear - (651) - - - - - (651) fixed asset removal and nuclear waste management funds Property and capital 26 - (1) (1) 16 7 - 47 taxes Restructuring - - - - 3 - - 3 Other (income) loss (1) - 4 4 9 (26) - (10)
Income (loss) before interest and income taxes 364 (68) 324 (10) (116) 57 - 551
PUBLIC ACCOUNTS, 2013-2014 2-191

Selected Consolidated Regulated Unregulated Balance Sheet Information as at December 31, 2013 Nuclear Nuclear Waste Hydro- Hydro-
(millions of dollars) Generation Management electric electric Thermal Other Total Segment property, plant and 4,864 - 5,099 3,312 153 170 13,598 equipment in-service, net Segment construction in 866 - 24 2,090 146 14 3,140 progress
Segment property, plant and 5,730 - 5,123 5,402 299 184 16,738 equipment, net Segment intangible assets 15 - 1 4 - 17 37 in-service, net Segment development in 2 - - - - 20 22 progress
Segment intangible assets, net 17 - 1 4 - 37 59 Segment materials and supplies inventory, net: Short-term 94 - - - 1 - 95 Long-term 322 - - 1 7 - 330 Segment fuel inventory 334 - - - 56 - 390 Nuclear fixed asset removal - 13,496 - - - - 13,496 and nuclear waste management funds (current and non-current portions) Fixed asset removal and - (15,903) - - (322) (32) (16,257) nuclear waste management liabilities
2-192 PUBLIC ACCOUNTS, 2013-2014

Selected Consolidated Regulated Unregulated Balance Sheet Information as at December 31, 2012 Nuclear Nuclear Waste Hydro- Hydro-
(millions of dollars) Generation Management electric electric Thermal Other Total Segment property, plant and 4,921 - 3,695 3,310 256 176 12,358 equipment in-service, net Segment construction in 554 - 1,396 1,475 69 8 3,502 progress
Segment property, plant and 5,475 - 5,091 4,785 325 184 15,860 equipment, net Segment intangible assets 21 - - 5 - 16 42 in-service, net Segment development in 2 - - - - 8 10 progress
Segment intangible assets, net 23 - - 5 - 24 52 Segment materials and supplies inventory, net: Short-term 83 - - - 7 - 90 Long-term 327 - - 1 27 - 355 Segment fuel inventory 328 - - - 177 - 505 Nuclear fixed asset removal - 12,717 - - - - 12,717 and nuclear waste management funds (current and non-current portion) Fixed asset removal and - (15,177) - - (313) (32) (15,522) nuclear waste management liabilities
Selected Consolidated Cash Regulated Unregulated Flow Information Nuclear Nuclear Waste Hydro- Hydro-
(millions of dollars) Generation Management electric electric Thermal Other Total Year ended December 31, 2013 Investment in property, plant and equipment, and intangible assets 633 - 114 688 95 38 1,568 Year ended December 31, 2012 Investment in property, plant and equipment, and intangible assets 400 - 262 673 62 30 1,427
2014 New Business Segments
Effective January 1, 2014, given the change in OPG’s generation portfolio, OPG has revised its reportable business
segments such that electricity generating facilities with similar revenue mechanisms and risk profiles will be reflected
in separate segments.
PUBLIC ACCOUNTS, 2013-2014 2-193

OPG’s reportable business segments, effective January 1, 2014 are: Regulated – Nuclear Generation, Regulated –
Nuclear Waste Management, Regulated Hydroelectric, Contracted Generation Portfolio, and Services, Trading, and
other Non-Generation. OPG’s Regulated – Nuclear Generation and Regulated – Nuclear Waste Management
segments are unchanged. The Regulated – Hydroelectric segment will continue to include the results of Sir Adam
Beck 1, 2 and Pump GS, DeCew Falls 1 and 2, and the R.H. Saunders hydroelectric facilities and will also include the
results of the 48 hydroelectric stations, which have been prescribed under amended Ontario Regulation 53/05,
effective July 1, 2014. The Contracted Generation Portfolio segment will include the results of generating facilities
that are under an ESA with the OPA or other long-term generation contracts. The Contracted Generation Portfolio
segment will also include OPG’s share of in-service generating capacity and equity income from its 50 percent
ownership interest in PEC and Brighton Beach. The Services, Trading, and other Non-Generation segment will
include revenue and expenses related to OPGs trading and other non-generation activities.
17. NET CHANGES IN NON-CASH WORKING CAPITAL BALANCES
(millions of dollars) 2013 2012 Receivables from related parties 40 (16) Other accounts receivable and prepaid expenses (21) (22) Fuel inventory 115 150 Income taxes payable/recoverable 12 (5) Materials and supplies (5) (8) Accounts payable and accrued charges 98 73
239 172
18. RELATED PARTY TRANSACTIONS
Given that the Province owns all of the shares of OPG, related parties include the Province, Infrastructure Ontario, OPA
and the other successor entities of Ontario Hydro, including Hydro One Inc. (Hydro One), the IESO, and the OEFC, and
jointly controlled entities. The transactions between OPG and related parties are measured at the exchange amount,
which is the amount of consideration established and agreed to by the related parties.
2-194 PUBLIC ACCOUNTS, 2013-2014
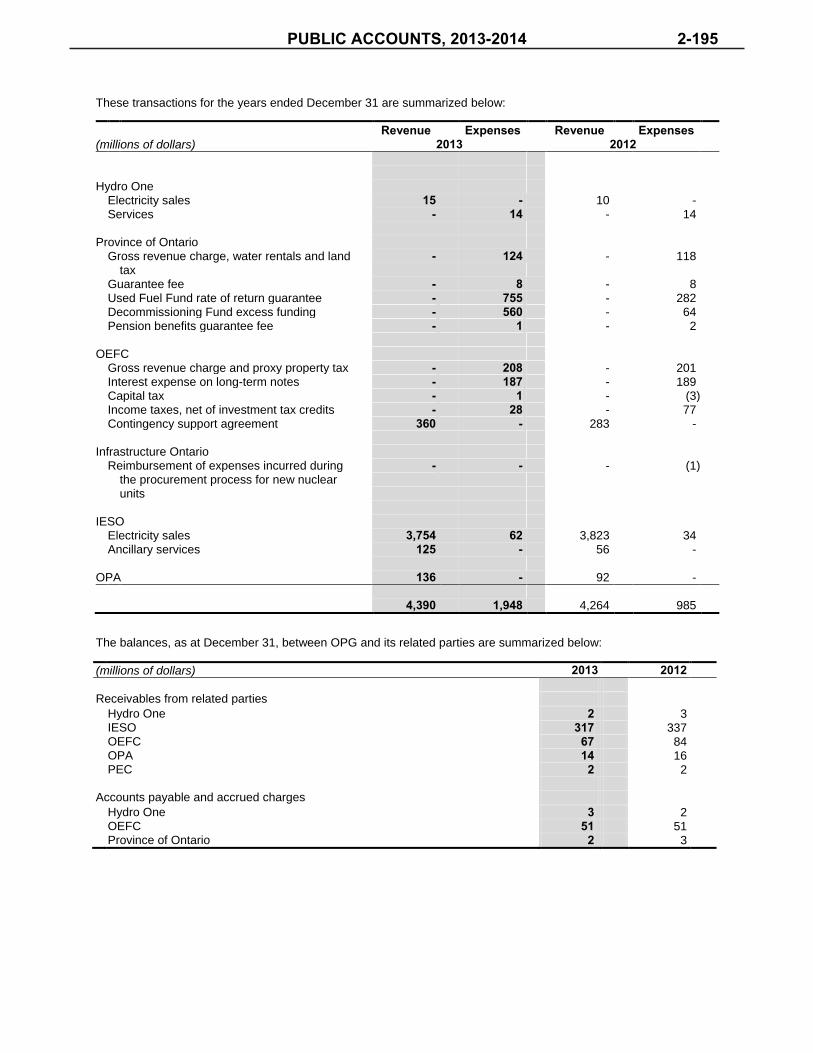
These transactions for the years ended December 31 are summarized below:
Revenue Expenses Revenue Expenses (millions of dollars) 2013 2012
Hydro One Electricity sales 15 - 10 - Services - 14 - 14 Province of Ontario Gross revenue charge, water rentals and land - 124 - 118 tax Guarantee fee - 8 - 8 Used Fuel Fund rate of return guarantee - 755 - 282 Decommissioning Fund excess funding - 560 - 64 Pension benefits guarantee fee - 1 - 2 OEFC Gross revenue charge and proxy property tax - 208 - 201 Interest expense on long-term notes - 187 - 189 Capital tax - 1 - (3) Income taxes, net of investment tax credits - 28 - 77 Contingency support agreement 360 - 283 - Infrastructure Ontario Reimbursement of expenses incurred during - - - (1) the procurement process for new nuclear units IESO Electricity sales 3,754 62 3,823 34 Ancillary services 125 - 56 - OPA 136 - 92 -
4,390 1,948 4,264 985
The balances, as at December 31, between OPG and its related parties are summarized below:
(millions of dollars) 2013 2012 Receivables from related parties
Hydro One 2 3 IESO 317 337 OEFC 67 84 OPA 14 16 PEC 2 2 Accounts payable and accrued charges Hydro One 3 2 OEFC 51 51 Province of Ontario 2 3
PUBLIC ACCOUNTS, 2013-2014 2-195

19. OTHER INCOME (millions of dollars) 2013 2012 Income from investments subject to significant influence (35) (26) Thermal asset retirement obligation estimate change (Note 3) (1) - Thunder Bay Generating Station conversion cost (recovery) write off (3) 9 Other loss 1 7
Other income (38) (10)
20. INVESTMENTS SUBJECT TO SIGNIFICANT INFLUENCE
Investments subject to significant influence consist of OPG’s 50 percent ownership interest in the jointly controlled
entities of PEC and Brighton Beach, which are accounted for using the equity method as described in Note 3. Details
of the balance included in the consolidated balance sheets as at December 31 are as follows: (millions of dollars) 2013 2012 PEC Current assets 19 8 Long-term assets 303 315 Current liabilities (15) (8) Long-term liabilities (4) (3) Brighton Beach Current assets 5 11 Long-term assets 196 209 Current liabilities (11) (11) Long-term liabilities (5) (9) Long-term debt (129) (139)
Investments subject to significant influence 359 373
21. RESEARCH AND DEVELOPMENT
For the year ended December 31, 2013, research and development expenses of $117 million (2012 – $113 million)
were charged to operations.
22. RESTRUCTURING
In 2011, OPG announced its decision to close two additional coal-fired units at the Nanticoke GS, consistent with the
2010 Ontario Long-Term Energy Plan and the 2011 Supply Mix Directive. Total restructuring costs, primarily
severance costs, related to these closures are $21 million and have been recognized in the consolidated financial
statements.
OPG has ceased using coal at the Atikokan GS, which has an impact on staff requirements. Severance costs of
$2 million were recorded during March 2013.
In March 2013, Unit 2 at the Thunder Bay GS was removed from the IESO market as it is not required by the IESO.
The impact on staff requirements has been finalized. The total restructuring costs, exclusively severance costs,
associated with this unit are estimated to be $4 million and were recorded in July 2013.
2-196 PUBLIC ACCOUNTS, 2013-2014

In March 2013, the Minister of Energy issued a declaration mandating that OPG cease the use of coal at the
Nanticoke GS and Lambton GS by the end of 2013. OPG has estimated the restructuring costs, including severance
and relocation to other OPG sites, at $52 million and has accrued $44 million of severance costs during the third and
fourth quarters of 2013. Relocation costs will be recorded as incurred, primarily in 2014.
The change in the restructuring liability for severance costs during 2013 and 2012 is as follows: (millions of dollars)
Liability, January 1, 2012 23 Payments during the year (20)
Liability, December 31, 2012 3 Restructuring charges during the year 50 Payments during the year (13)
Liability, December 31, 2013 40
OPG conducted discussions with key stakeholders, including The Society and PWU, in accordance with their
respective collective bargaining agreements, at all plants impacted to date by the regulation requiring the cessation of
the use of coal for electricity generation. Given collective agreement provisions allowing deferral of severance payout
to future periods, the existing restructuring liability is expected to be drawn down by the end of 2016.
PUBLIC ACCOUNTS, 2013-2014 2-197


TRUSTS AND MISCELLANEOUS STATEMENTS


30 Deposit Insurance Corporation of Ontario 2 0 1 3 A N N U A L R E P O R T
The Deposit Insurance Corporation of Ontario’s management is responsible for the integrity and fair presentation of the annual fi nancial statements and all other information included in the annual report. The fi nancial statements have been prepared in conformity with International Financial Reporting Standards.
The Corporation maintains systems of internal accounting controls of high quality consistent with reasonable cost. Such systems are designed to provide reasonable assurance that the fi nancial information is accurate and reliable and that the Corporation’s assets and liabilities are adequately accounted for and assets safeguarded.
The fi nancial statements have been reviewed by the Corporation’s Audit and Finance Committee and have been approved by its Board of Directors. In addition, the fi nancial statements have been audited by KPMG LLP, whose report follows.
Andrew (Andy) Poprawa, CPA, CA, C.Dir.President & CEO
James Maxwell, CHRP, FLMIChief Administrative and Financial Offi cer
Toronto, Canada
March 19, 2014
Management’s Responsibility for Financial Statements
Deposit Insurance Corporation of Ontario
PUBLIC ACCOUNTS, 2013-2014 3-1

31
assessment of the risks of material misstatement of the fi nancial statements, whether due to fraud or error. In making those risk assessments, the auditor considers internal control relevant to the Corporation's preparation and fair presentation of the fi nancial statements in order to design audit procedures that are appropriate in the circumstances, but not for the purpose of expressing an opinion on the effectiveness of the Corporation's internal control. An audit also includes evaluating the appropriateness of accounting policies used and the reasonableness of accounting estimates made by management, as well as evaluating the overall presentation of the fi nancial statements.
We believe that the audit evidence we have obtained is suffi cient and appropriate to provide a basis for our audit opinion.
OpinionIn our opinion, the fi nancial statements present fairly, in all material respects, the fi nancial position of Deposit Insurance Corporation of Ontario as at December 31, 2013 and the results of its fi nancial performance and cash fl ows for the year ended December 31, 2013 in accordance with International Financial Reporting Standards.
Chartered Professional Accountants, Licensed Public Accountants
March 19, 2014Toronto, Canada
Independent Auditors’ Report
KPMG LLP
To the Board of Directors of Deposit Insurance Corporation of Ontario:
We have audited the fi nancial statements of Deposit Insurance Corporation of Ontario ("the Corporation"), which are comprised of the Statement of Financial Position as at December 31, 2013, and the Statement of Operations and Changes in the Deposit Insurance Reserve Fund, Comprehensive Income, Statement of Equity and Cash Flows for the year then ended, and a summary of signifi cant accounting policies and other explanatory information.
Management's Responsibility for the Financial StatementsManagement is responsible for the preparation and fair presentation of these fi nancial statements in accordance with International Financial Reporting Standards, and for such internal control as management determines is necessary to enable the preparation of fi nancial statements that are free from material misstatement, whether due to fraud or error.
Auditor's ResponsibilityOur responsibility is to express an opinion on these fi nancial statements based on our audit. We conducted our audit in accordance with Canadian generally accepted auditing standards. Those standards require that we comply with ethical requirements and plan and perform an audit to obtain reasonable assurance about whether the fi nancial statements are free from material misstatement.
An audit involves performing procedures to obtain audit evidence about the amounts and disclosures in the fi nancial statements. The procedures selected depend on the auditor's judgment, including the
3-2 PUBLIC ACCOUNTS, 2013-2014

(in thousands of dollars) Notes December 31, 2013
December 31, 2012
ASSETSCurrent assets Cash and cash equivalents $ 2,286 $ 2,284 Investments 5 126,898 119,986 Premiums receivable 1,777 3,050 Prepaid expenses and other receivables 603 729 Total current assets 131,564 126,049
Non-current assets Investments 5 24,081 12,476 Deposit insurance advances recoverable 6 20,864 22,753 Property, plant and equipment 7 417 445 Intangible assets 8 662 666 Total non-current assets 46,024 36,340
Total assets $ 177,588 $ 162,389
LIABILITIESCurrent liabilities Payables and accruals $ 602 $ 803 Deferred premium income 2,477 3,436 Total current liabilities 3,079 4,239
Non-current liabilities Payables and accruals 969 952 Employee benefi ts 9 5,526 5,275 Accrual for deposit insurance claims 6 3,451 4,768 Total non-current liabilities 9,946 10,995
Total Liabilities $ 13,025 $ 15,234
EQUITYAccumulated other comprehensive loss $ (121) $ (376) Deposit Insurance Reserve Fund 164,684 147,531
Total Equity $164,563 $ 147,155
Total Liabilities and Equity $177,588 $ 162,389 See accompanying notes to fi nancial statements.On behalf of the Board: Director Director
Deposit Insurance Corporation of Ontario
Statement of Financial Position
PUBLIC ACCOUNTS, 2013-2014 3-3
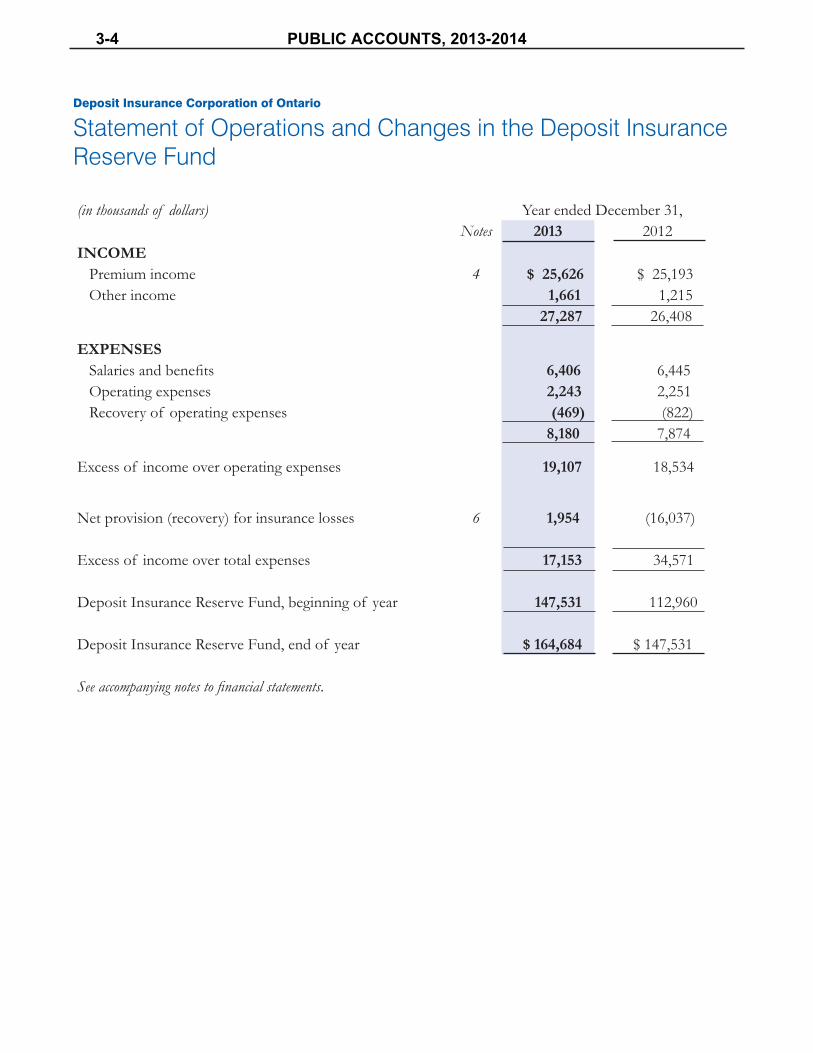
33
(in thousands of dollars) Year ended December 31,Notes 2013 2012
INCOME Premium income 4 $ 25,626 $ 25,193 Other income 1,661 1,215
27,287 26,408
EXPENSES Salaries and benefi ts 6,406 6,445 Operating expenses 2,243 2,251 Recovery of operating expenses (469) (822)
8,180 7,874
Excess of income over operating expenses 19,107 18,534
Net provision (recovery) for insurance losses 6 1,954 (16,037)
Excess of income over total expenses 17,153 34,571
Deposit Insurance Reserve Fund, beginning of year 147,531 112,960
Deposit Insurance Reserve Fund, end of year $ 164,684 $ 147,531
See accompanying notes to fi nancial statements.
Deposit Insurance Corporation of Ontario
Statement of Operations and Changes in the Deposit Insurance Reserve Fund
3-4 PUBLIC ACCOUNTS, 2013-2014

(in thousands of dollars) Year ended December 31,2013 2012
Excess of income over total expenses $ 17,153 $ 34,571
Other comprehensive income: Unrealized gains on available-for-sale investments arising during the year 62 83 Unrealized gains (losses) on available-for-sale investments acquired from liquidated institutions arising during the year
(93)
75
Actuarial gains on post-retirement, non-pension benefi ts arising during the year 286 (189)
Total other comprehensive income (loss) 255 (31)
Comprehensive income $ 17,408 $ 34,540
Statement of Accumulated Other Comprehensive Income (in thousands of dollars) Year ended December 31,
2013 2012Accumulated other comprehensive income (loss), beginning of year
$ (376)
$ (345)
Sale of available-for-sale investment from opening balance of accumulated other comprehensive income (200) (91)
Unrealized gains on available-for-sale investments arising during the year
216
174
Unrealized gains (losses) on available-for-sale investments acquired from liquidated institutions arising during the year (47) 75Actuarial gains (losses) on post-retirement, non-pension benefi ts arising during the year
286 (189)
Net change during the year 255 (31)
Accumulated other comprehensive loss, end of year
$ (121)
$ (376)
See accompanying notes to fi nancial statements.
Deposit Insurance Corporation of Ontario
Statement of Comprehensive Income
PUBLIC ACCOUNTS, 2013-2014 3-5

35
(in thousands of dollars) Actuarial loss on post-retirement,
non-pension benefi ts *
Unrealized gains (losses) on available-
for-sale investments *
Deposit Insurance Reserve
Fund
Total equity
Balance at January 1, 2012 $ (561) $ 216 $ 112,960 $ 112,615
Total comprehensive income for the year:
Excess of income over total expenses 34,571 34,571
Other comprehensive income:Net change in fair value of available-for-sale investments 83 83Net change in fair value of available-for-sale investments acquired from liquidated institutions 75 75Net change in fair value of post-retirement, non-pension benefi ts (189) (189)Total comprehensive income (loss) for the year (189) 158 34,571 34,540
Balance at December 31, 2012 $ (750) $374 $ 147,531 $147,155
Balance at January 1, 2013 $ (750) $ 374 $ 147,531 $ 147,155
Total comprehensive income for the year:Excess of income over total expenses 17,153 17,153
Other comprehensive income:Net change in fair value of available-for-sale investments 62 62Net change in fair value of available-for-sale investments acquired from liquidated institutions
(93)
(93)
Net change in fair value of post-retirement, non-pension benefi ts 286 286
Total comprehensive income (loss) for the year 286 (31) 17,153 17,408
Balance at December 31, 2013 $ (464) $ 343 $ 164,684 $164,563
* Accumulated other comprehensive income
See accompanying notes to fi nancial statements.
Deposit Insurance Corporation of Ontario
Statement of Changes in Equity
3-6 PUBLIC ACCOUNTS, 2013-2014

(in thousands of dollars) Year ended December 31,Notes 2013 2012
Cash fl ows from operating activities:Excess of income over total expenses $ 17,153 $ 34,571 Adjustments for: Provision (Recovery) of losses 1,954 (16,037) Loss on disposal of property, plant and equipment 1 - Unrealized gains (losses) on available-for-sale investments arising during the year
(31)
158
Actuarial gains (losses) on post-retirement, non pension benefi ts arising during the year 286 (189) Depreciation of property, plant and equipment 7 146 159 Amortization of intangible assets 8 138 129 19,647 18,791
Changes in: Premiums receivable 1,273 952 Prepaid expenses and other receivables 126 273 Payables and accruals (184) 173 Deferred premium income (959) (742) Employee benefi ts 251 766
507 1,422
Net deposit insurance (advances) recoveries 6 (1,382) 20,099 18,772 40,312
Cash fl ows from investing activities: Interest received 1,531 1,043 Purchase of investments held at year end (150,979) (132,462) Proceeds on sale of investments 130,931 91,768 Purchase of property, plant and equipment 7 (119) (87) Purchase of intangible assets 8 (134) -
(18,770) (39,738)
Net increase in cash and cash equivalents 2 574
Cash and cash equivalents, beginning of year 2,284 1,710
Cash and cash equivalents, end of year $ 2,286 $ 2,284 Cash and cash equivalents comprise cash and short-term investments.
See accompanying notes to fi nancial statements.
Deposit Insurance Corporation of Ontario
Statement of Cash Flows
PUBLIC ACCOUNTS, 2013-2014 3-7

37
Deposit Insurance Corporation of Ontario
Notes to Financial Statements Year ended December 31, 2013
1. REPORTING ENTITY
Deposit Insurance Corporation of Ontario (“DICO” or “the Corporation”) is an "Operational Enterprise" Agency of the Province of Ontario established without share capital under the provisions of the Credit Unions and Caisses Populaires Act, 1994 (“the Act”).
The statutory objects of the Corporation under the Act are to: • provide insurance against the loss of part or all of
deposits with credit unions; • promote and otherwise contribute to the stability
of the credit union sector in Ontario with due regard to the need to allow credit unions to compete effectively while taking reasonable risks;
• pursue the objects set out in the above clauses for the benefi t of persons having deposits with credit unions and in such manner as will minimize the exposure of the Corporation to loss;
• collect, accumulate and publish such statistics and other information related to credit unions as may be appropriate;
• perform the duties provided under this Act or the regulations or do anything the Corporation is required or authorized to do under this Act or the regulations; and
• carry out such other objects as the Minister may specify in writing or as may be prescribed.
The Act empowers the Corporation to assess its insured institutions deposit insurance premiums to meet the Corporation's requirements for insurance funding and administrative costs. The premium rates are set out in the regulation to the Act. The Corporation reviews the adequacy of the premium rate annually and advises the government accordingly.
The Minister of Finance provides DICO with a $250 million line of credit with the Ontario Financing Authority (OFA) which expired on December 31, 2013. Effective January 1, 2014 a new revolving credit facility agreement is in place with an extension to a further fi ve year period and an increase in the amount
to $400 million. Under the current revolving credit facility arrangement, interest cost on any outstanding debt obligation is charged at an annual rate equal to the province’s cost of funds for borrowings with a three month term, determined by the OFA at the time of the borrowing, plus an additional 0.40 percent per annum (0.575 percent per annum under the new agreement).
2. BASIS OF PREPARATION
(a) Statement of compliance
The fi nancial statements have been prepared in accordance with International Financial Reporting Standards (IFRS). The fi scal year ended December 31, 2013 represents the Corporation’s third annual reporting period under IFRS. These fi nancial statements were approved by the Board of Directors on March 19, 2014.
(b) Basis of measurement
The Corporation’s fi nancial statements have been prepared on the historical cost basis, except for the fi nancial instruments classifi ed as available-for-sale, which are measured at fair value.
(c) Functional and presentation currency
These fi nancial statements are presented in the Corporation’s functional currency which is the Canadian dollar. All fi nancial information presented in Canadian dollars has been rounded to the nearest thousand.
(d) Use of estimates and judgements
The preparation of the fi nancial statements in conformity with IFRS requires management to make judgements, estimates and assumptions that affect the application of accounting policies and the reported amounts of assets, liabilities, income and expenses. Actual results may differ from these estimates.
Estimates and underlying assumptions are reviewed on an ongoing basis. Revisions to accounting estimates are recognized in the period in which the estimates are revised and in any future periods affected.
3-8 PUBLIC ACCOUNTS, 2013-2014
38 Deposit Insurance Corporation of Ontario 2 0 1 3 A N N U A L R E P O R T
The most signifi cant areas of assumptions and judgments are disclosed in provisions for losses (note 6) and measurement of accrued benefi t obligations relating to future non-pension post-retirement benefi ts (note 9).
3. SUMMARY OF SIGNIFICANT ACCOUNTING POLICIES
To facilitate a better understanding of our fi nancial statements, the Corporation has disclosed its signifi cant accounting policies as summarized below. These policies have been applied consistently to all periods presented in the fi nancial statements unless otherwise indicated.
(a) Premium income:
Premiums are based on a Differential Premium Risk Classifi cation System, as defi ned by regulation applied to insured deposits held by insured institutions. Premium income is calculated based on the Annual Institution Return submitted by the insured institution, which is due 75 days after its fi scal year end. Premium income is recognized when earned.
(b) Provision for losses:
The provision for losses includes allowances against deposit insurance advances to insured institutions in liquidation and an accrual for losses for which advances have not been made at the date of the statement of fi nancial position.
Funds advanced in respect of deposit insurance and loans to insured institutions are initially recorded at cost. Deposit insurance advances recoverable are presented on the statement of fi nancial position, net of allowances thereon.
The accrual for deposit insurance claims includes both provisions for specifi c losses and a general accrual for losses. Specifi c provisions for losses in respect of insured deposits are estimated by management and recorded when conditions exist, in management’s opinion, that will likely result in losses to the Corporation.
The general accrual for loss refl ects management's best estimate of losses on insured deposits arising
from the inherent risk in insured institutions. The provision is established by assessing the aggregate risk in insured institutions based on current market and economic conditions, the likelihood of losses and the application of historic loss experience. Future economic conditions are not predictable with certainty and actual losses may vary, perhaps substantially, from management's estimates. A new methodology was developed by management which evaluates all institutions with the highest risk score under our current prospective risk rating system.
The methodology incorporates various iterations and key assumptions, such as historical probabilities of failures (from the Deposit Insurance Reserve Fund “DIRF” model) and actual probabilities of failure when possible. The model also categorizes the institutions based on asset size and discounts the estimated loss to the next 12 month period.Model results are then considered along with the level of the existing allowance, as well as management’s judgement regarding economic and market conditions to come to a fi nal determination of what the general accrual for loss should be.
(c) Employee benefits:
(i) Defi ned contribution plansA defi ned contribution plan is a post-employment benefi t plan under which an entity pays fi xed contributions into an independent entity and will have no legal or constructive obligation to pay further amounts. DICO’s defi ned contribution pension plan covers all of DICO’s regular, non-contractual employees. As well, there are supplemental arrangements which provide pension benefi ts for income in excess of registered pension plan limits. Earnings are charged with the cost of pension benefi ts earned by employees as service is rendered. Pension expense is determined by a fi xed percentage of the employees' income plus the matching of the employees' contribution to a maximum of 4%. The Corporation assumes no actuarial or investment risk.
(ii) Defi ned benefi t plans The Corporation provides future non-pension post-retirement benefi ts which relate to DICO’s extended health, dental and life benefi ts for both
PUBLIC ACCOUNTS, 2013-2014 3-9
39
active employees for whom a full eligibility date was determined and existing qualifi ed retirees. The Corporation accrues obligations under these plans as the employees render the service necessary to earn the future benefi ts and the benefi t is discounted to determine its present value. There are no assets set aside to fund the benefi ts. The accrued benefi ts obligation is calculated annually by a qualifi ed actuary using the projected unit benefi t method prorated on service. In June 2011, the International Accounting Standards Board (“IASB”) amended IAS 19- Employment Benefi ts, which applies to defi ned benefi t plans. The amendments eliminate the existing option to defer actuarial gains and losses (known as the corridor approach), require changes from remeasurement of defi ned benefi t plan assets and liabilities to be recognized in full in the statement of other comprehensive income (“OCI”), and require additional disclosures. The amendments are effective for fi scal years beginning on or after January 1, 2013 but may be applied earlier.
The Corporation elected to apply this amendment effective January 1, 2012. The transition to the OCI approach was recognized on January 1, 2011 with all unrecognized actuarial gains and losses and past service costs refl ected in the DIRF as at that date as a one-off transition adjustment.
(iii) Other long-term employee benefi ts The Corporation’s other obligation in respect of long-term employee benefi ts is the amount of retention benefi ts accrued for some key employees. The plans are designed to ensure the retention of key personnel to provide suffi cient time for effective succession planning. Acceptance of the benefi ts is voluntary and the probabilities of acceptance are estimated at the end of the reporting period. The benefi ts are discounted to their present value if they are payable more than 12 months after the reporting period.
(iv) Short-term employee benefi ts Short-term employee benefi t obligations are measured on an undiscounted basis and are expensed as the related service is provided. The Corporation recognizes the unused entitlement of compensated vacations that has accumulated at the end of the reporting period as accrued short-term benefi ts.
(d) Financial instruments:
DICO’s investments are non-derivative fi nancial assets and are classifi ed, based on management’s intentions, as available-for-sale. Subsequent to initial recognition, they are measured at fair value and changes therein, other than impairment losses, are recognized in OCI and presented within equity. When an investment is derecognized/sold, the cumulative gain or loss in OCI is transferred to Statement of Operations.
(e) Property, plant and equipment:
(i) Recognition and measurementItems of property, plant and equipment are measured at cost less accumulated amortization and impairment losses.
Cost includes expenditures that are directly attributable to the acquisition of the assets and any other costs directly attributable to bringing the assets to a working condition for their intended use, including the borrowing costs on qualifying assets for which the commencement date for capitalization is on or after January 1, 2010. Purchased software that is integral to the functionality of the related equipment is capitalized as part of that equipment. When parts of an item of property, plant and equipment have different useful lives, they are accounted for as separate items of property, plant and equipment.
Gains and losses on disposal of an item of property, plant and equipment are determined by comparing the proceeds from disposal with the carrying amount of property, plant and equipment, and are recognized on a net basis within the other income category. Depreciation methods, useful lives and residual values are reviewed at each fi nancial year end and adjusted if appropriate.
(ii) DepreciationDepreciation is calculated on the depreciable amount, which is the cost of an asset less its residual value, if any. Depreciation of furniture and equipment is provided by the diminishing-balance method at the rate of 20 % per annum. Computer and related equipment and software are amortized
3-10 PUBLIC ACCOUNTS, 2013-2014
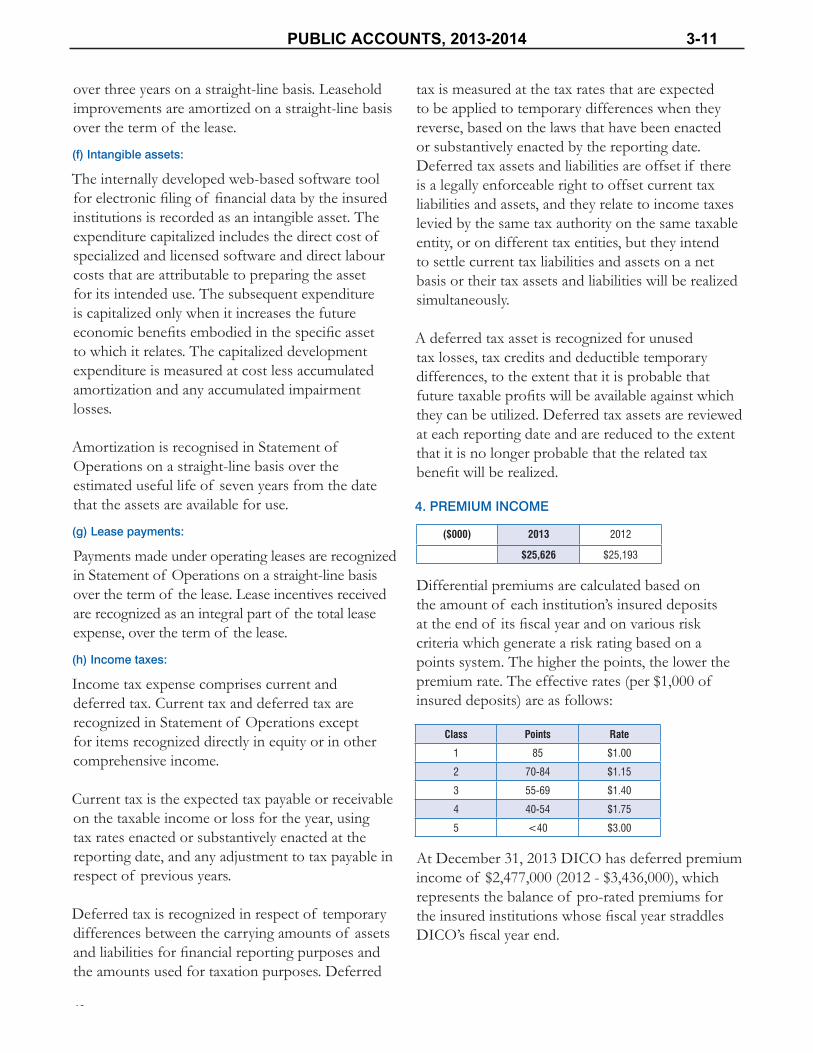
40 Deposit Insurance Corporation of Ontario 2 0 1 3 A N N U A L R E P O R T
over three years on a straight-line basis. Leasehold improvements are amortized on a straight-line basis over the term of the lease.
(f) Intangible assets:
The internally developed web-based software tool for electronic fi ling of fi nancial data by the insured institutions is recorded as an intangible asset. The expenditure capitalized includes the direct cost of specialized and licensed software and direct labour costs that are attributable to preparing the asset for its intended use. The subsequent expenditure is capitalized only when it increases the future economic benefi ts embodied in the specifi c asset to which it relates. The capitalized development expenditure is measured at cost less accumulated amortization and any accumulated impairment losses.
Amortization is recognised in Statement of Operations on a straight-line basis over the estimated useful life of seven years from the date that the assets are available for use.
(g) Lease payments:
Payments made under operating leases are recognized in Statement of Operations on a straight-line basis over the term of the lease. Lease incentives received are recognized as an integral part of the total lease expense, over the term of the lease.
(h) Income taxes:
Income tax expense comprises current and deferred tax. Current tax and deferred tax are recognized in Statement of Operations except for items recognized directly in equity or in other comprehensive income.
Current tax is the expected tax payable or receivable on the taxable income or loss for the year, using tax rates enacted or substantively enacted at the reporting date, and any adjustment to tax payable in respect of previous years.
Deferred tax is recognized in respect of temporary differences between the carrying amounts of assets and liabilities for fi nancial reporting purposes and the amounts used for taxation purposes. Deferred
tax is measured at the tax rates that are expected to be applied to temporary differences when they reverse, based on the laws that have been enacted or substantively enacted by the reporting date. Deferred tax assets and liabilities are offset if there is a legally enforceable right to offset current tax liabilities and assets, and they relate to income taxes levied by the same tax authority on the same taxable entity, or on different tax entities, but they intend to settle current tax liabilities and assets on a net basis or their tax assets and liabilities will be realized simultaneously.
A deferred tax asset is recognized for unused tax losses, tax credits and deductible temporary differences, to the extent that it is probable that future taxable profi ts will be available against which they can be utilized. Deferred tax assets are reviewed at each reporting date and are reduced to the extent that it is no longer probable that the related tax benefi t will be realized.
4. PREMIUM INCOME ($000) 2013 2012
$25,626 $25,193
Differential premiums are calculated based on the amount of each institution’s insured deposits at the end of its fi scal year and on various risk criteria which generate a risk rating based on a points system. The higher the points, the lower the premium rate. The effective rates (per $1,000 of insured deposits) are as follows:
Class Points Rate
1 85 $1.00
2 70-84 $1.15
3 55-69 $1.40
4 40-54 $1.75
5 <40 $3.00
At December 31, 2013 DICO has deferred premium income of $2,477,000 (2012 - $3,436,000), which represents the balance of pro-rated premiums for the insured institutions whose fi scal year straddles DICO’s fi scal year end.
PUBLIC ACCOUNTS, 2013-2014 3-11

41
5. INVESTMENTS
December 31, 2013 December 31, 2012
Amount ($
thousands)
Weighted Average Effective
Yield
Weighted Average Days to Maturity
Amount ($
thousands)
Weighted Average Effective
Yield
Weighted Average Days to Maturity
Treasury bills - Canada and Ontario $ 65,979 0.93% 88 $ 57,850 0.98% 88Bankers’ acceptances / Bank deposit notes $ 41,953 1.10% 49
55,434 1.08% 25Ontario Infrastructure and Land Corp. $ 18,966 1.05% 62
6,702 1.01% 15
Total current investments $ 126,898 0.98% 71 $ 119,986 1.00% 55Laddered government bonds $ 23,608 1.39% 619 $ 11,835 1.34% 616
CUCO Co-op Class B investment shares (acquired from liquidated institutions) $ 473
$ 641
Total non-current Investments $ 24,081
$ 12,476
TotalInvestments $ 150,979 $ 132,462
The Corporation’s current and non-current investments are classifi ed as available-for-sale and are measured at fair value with unrealized gains and losses recorded in the Statement of Accumulated Other Comprehensive Income until the investment is sold.
As of December 31, 2013, the current, highly liquid investments have a weighted-average yield of 0.98% (2012: 1.00%). The non-current investments are the laddered government bonds with a remaining weighted average term to maturity of greater than one year. The weighted average yield of these investments averaged 1.39% (2012: 1.34%). The Corporation has contracted with the OFA to manage its investment portfolio. The composition of DICO's investments refl ects the nature of the Corporation's potential insurance obligations and is structured to comply with the requirements under both the Income Tax Act, the Credit Unions and Caisses Populaires Act, 1994 and Regulation 237/09.
During the year, in order to facilitate the orderly wind-down of some credit unions in liquidation, DICO purchased the CUCO Co-op Class B shares held by these credit unions at the carrying value of $25,000 (2012 - $49,000).
Fair value hierarchy:
The Corporation uses a fair value hierarchy to categorize the inputs used in valuation techniques to measure fair value. As of December 31, 2013, the Corporation’s fi nancial instruments were valued as follows:
Available-for-sale fi nancial assets:
($ thousands) 2013 2012
Level 1 $ 150,506 $ 131,821
Level 2 $ 473 $ 641
Level 3 - -
Total $ 150,979 $ 132,462
The different levels have been defi ned as follows:• Level 1: quoted prices (unadjusted) in active
markets for identical assets or liabilities;• Level 2: inputs other than quoted prices included
within Level 1 that are observable for the asset or liability, either directly (i.e. as prices) or indirectly (i.e. derived from prices);
• Level 3: inputs for the asset or liability that are not based on observable market data (unobservable inputs).
6. DEPOSIT INSURANCE ADVANCES RECOVERABLE AND ACCRUAL FOR DEPOSIT INSURANCE CLAIMS
The provision for losses includes specifi c provisions for known or likely losses from specifi c insured institutions not included in their fi nancial statements and a general accrual for losses not identifi ed with specifi c institutions. That portion of the provision for losses recorded in the year and in previous years which has not yet required payment by the Corporation is shown in liabilities on the statement of fi nancial position as "Accrual for deposit insurance claims". When funds advanced in respect to deposit insurance claims are in excess of the estimated loss provision at the end of the reporting period, the balance is reported as “Deposit Insurance advances recoverable” on the statement of fi nancial position.
3-12 PUBLIC ACCOUNTS, 2013-2014

42 Deposit Insurance Corporation of Ontario 2 0 1 3 A N N U A L R E P O R T
Specifi c provisions for losses in respect of insured deposits are estimated by management and recorded when conditions exist, in management’s opinion, that will likely result in losses to the Corporation.
The general accrual for losses included in "Accrual for deposit insurance claims" is $3,200,000 at December 31, 2013 (2012 - $3,500,000) and is calculated in accordance with the methodology as described in note 3(b).
2013 2012
($ thousands)
Deposit Insurance Advances
Recoverable
Accrual for deposit
insurance claims
Net
Deposit Insurance Advances
Recoverable
Accrual for deposit
insurance claims
Net
Balance at beginning of year 22,753 (4,768) 17,985 27,333 (5,286) 22,047
Net change during the year :
Increase in specifi c provisions for current year losses
- (50)
(50)
-
(1,500)
(1,500)
Reduction in General accrual for the year - 300 300 - 1,500 1,500
Net change in specifi c provisions for prior years’ losses booked and advanced
(2,204)
- (2,204) 16,037
- 16,037
Total net (accrual) / recoveryfor insurance losses
(2,204)
250 (1,954) 16,037 - 16,037
Total cash advances for losses accrued 3,344 1,067 4,411 - 518 518
Total cash recoveries for prior years' losses (3,029) - (3,029) (20,617) - (20,617)
Net deposit insurance advances (recoveries) 315 1,067 1,382 (20,617) 518 (20,099)
Total net change (1,889) 1,317 (572) (4,580) 518 (4,062)
Balance at end of year 20,864 (3,451) 17,413 22,753 (4,768) 17,985
PUBLIC ACCOUNTS, 2013-2014 3-13

43
7. PROPERTY, PLANT AND EQUIPMENT
($ thousands)Furniture
and Fixture
Offi ce Equipment
Computer and Related Equipment
SoftwareLeasehold
ImprovementTotal
Cost or deemed cost
Balance at January 1, 2012 $ 516 $ 75 $ 1,936 $ 719 $ 499 $ 3,745
Additions 8 6 43 12 18 87
Disposals - - (32) - - (32)
Balance at December 31, 2012 $ 524 $ 81 $ 1,947 $ 731 $ 517 $ 3,800
Balance at January 1, 2013 $ 524 $ 81 $ 1,947 $ 731 $ 517 $ 3,800
Additions 8 6 67 28 10 119
Disposals (4) (18) (140) - - (162)
Balance at December 31, 2013 $ 528 $ 69 $ 1,874 $ 759 $ 527 $ 3,757
Depreciation
Balance at January 1, 2012 $ 416 $ 69 $ 1,831 $ 692 $ 220 $ 3,228
Depreciation for the year 21 2 64 22 50 159
Disposals - - (32) - - (32)
Balance at December 31, 2012 $ 437 $ 71 $ 1,863 $ 714 $ 270 $ 3,355
Balance at January 1, 2013 $ 437 $ 71 $ 1,863 $ 714 $ 270 $ 3,355
Depreciation for the year 18 2 56 16 54 146
Disposals (4) (17) (140) - - (161)
Balance at December 31, 2013 $ 451 $ 56 $ 1,779 $ 730 $ 324 $ 3,340
Carrying amount
At January 1, 2012 $ 100 $ 6 $ 105 $ 27 $ 279 $ 517
At December 31, 2012 $ 88 $ 12 $ 81 $ 18 $ 246 $ 445
At December 31, 2013 $ 77 $ 13 $ 95 $ 29 $ 203 $ 417
3-14 PUBLIC ACCOUNTS, 2013-2014

44 Deposit Insurance Corporation of Ontario 2 0 1 3 A N N U A L R E P O R T
8. INTANGIBLE ASSETS
($ thousands) Development Costs
Cost
Balance at January 1, 2012 $ 902
Additions -
Disposals -
Balance at December 31, 2012 $ 902
Balance at January 1, 2013 $ 902
Additions 134
Disposals -
Balance at December 31, 2013 $1,036
Amortization
Balance at January 1, 2012 $ 107
Amortization for the year 129
Balance at December 31, 2012 $ 236
Balance at January 1, 2013 $ 236
Amortization for the year 138
Balance at December 31, 2013 $ 374
Carrying amounts
At January 1, 2012 $ 795
At December 31, 2012 666
At December 31, 2013 $ 662
9. EMPLOYEE BENEFITS
(i) Pension plan
The Corporation operates a defi ned contribution pension plan for all eligible employees. In addition DICO accrues benefi ts to a Supplemental Pension Plan and an Auxiliary Pension Plan (both non-registered). The Supplemental Pension Plan provides the same benefi t as the registered plan on that portion of an employee’s income in excess of the registered plan limits. The Auxiliary Pension Plan provides an additional defi ned contribution amount for the CEO on his base salary. The total pension expense for the Corporation charged to Statement of Operations in 2013 was $517,000 (2012 - $583,000). Total accrued pension plan benefi ts as at December 31, 2013 amounted to $1,453,000 (2012- $1,312,000).
(ii) Future non-pension post-retirement benefits
The Corporation adopted the amended IAS 19 (June 2011) on January 1, 2012. Due to the requirement
to provide comparative information, a transition adjustment was made on January 1, 2011 to equity to bring the existing current IAS 19 balances in line with the requirements of the amended IAS 19.
The Corporation accounts for the current value of future non-pension post-retirement benefi ts. The accrued benefi t liability as at December 31, 2013, as actuarially determined, is $2,892,000 (2012 - $2,997,000). The annual benefi t cost, including current service cost and interest cost amounted $232,000 (2012 - $212,000). The last updated actuarial valuation for the Corporation’s plan was completed as of December 31, 2011 and the next required valuation will be as of December 31, 2014.
The assumptions used in the actuarial valuation of the future benefi ts obligations consisted of: interest rate of 4.85% (2012 - 4.0%), rate of compensation increase of 3.5% (2012 - 3.5%) and initial weighted average trend rate in health and dental costs of 5.72% (2012 - 5.90%), grading down to 4.5 % per annum by 2032. The Corporation measures its accrued benefi t obligations as at December 31st.
Change in non-pension post retirement benefi t obligation ($ thousands)
December 31, 2013
December 31, 2012
Benefi t obligation at beginning of year $ 2,997 $ 2,655
Current service cost 115 95
Interest cost 118 117
Benefi t payments (52) (59)
Re-measurements of effect of changes in assumptions included in OCI
(286) 189
Benefi t obligation at end of year $ 2,892 $ 2,997
Sensitivity analysis: ($ thousands)
December 31, 2013
December 31, 2012
1. Discount rate
a. Discount rate -25 basis points $ 3,011 $3,124
b. Discount rate +25 basis points $ 2,779 $2,877
2. Health care cost trend rates
a. Health care cost trend rates -100 basis points $ 2,461 $2,572
b. Health care cost trend rates +100 basis points $ 3,441 $3,539
3. Mortality
a. Life expectancy plus 1 year $ 2,947 N/A
The Corporation has also implemented a human resources retention plan for key management personnel for the purpose of ensuring effective
PUBLIC ACCOUNTS, 2013-2014 3-15

45
transition and succession planning. Total accrued retention benefi ts were $1,181,000 at December 31, 2013 (2012 - $966,000).
Summary of employees benefi t liabilities (non-current):
($ thousands) December 31, 2013 December 31, 2012
Employee pension benefi ts $ 1,453 $ 1,312
Employee future non-pension post-retirement benefi ts 2,892 2,997
Retention benefi ts for key management personnel 1,181 966
Total $ 5,526 $ 5,275
10. OPERATING LEASES
The non-cancellable annual operating lease payments for the Corporation are summarized as follows:
($ thousands) 2013 2012
Less than 1 year - -
Between 1 and 5 years $320 $310
More than 5 years - -
Under the operating lease for its premises the Corporation is required to pay property taxes and common area maintenance costs which are currently approximately $328,000 per annum.
11. INCOME TAXES
Income tax expense reported in the Statement of Operations is as follows:Recognition of effective tax rate
($ thousands) 2013 2012
Profi t before income tax $ 17,153 $ 34,571
Income tax using the combined statutory rate 26.5% (2012 - 26.5%) 4,545 9,161
Income not included for tax purposes (6,386) (11,125)
Current year losses for which no deferred tax asset was recognized 1,691 1,652
Other, net 150 312
Provision (recovery) $ - $ -
Deferred tax assets and liabilities
Unrecognized deferred tax assets
Deferred tax assets have not been recognized in respect of the following items:
($ thousands) 2013 2012
Deductible temporary differences $ 3,153 $ 3,440
Tax benefi t of loss carry-forwards $ 10,969 $ 9,275
$ 14,122 $ 12,715
The tax losses expire starting in 2014. Deferred tax assets have not been recognized in respect of these items because it is not probable that future taxable profi t will be available against which the Corporation can utilize the benefi ts.
12. RELATED PARTIES
Transactions with key management personnel
Directors and key management personnel compensation
During the year the directors received an aggregate remuneration of $136,000 (2012 - $127,000). Total directors' expenses were $59,000 (2012 - $62,000). The remuneration for the Chair is a minimum of $2,000 per month which includes a per diem rate of $500. The per diem rate for all other Board members is $400 (2012 - $400) plus an annual retainer of $3,500.
Under the public Sector Salary Disclosure Act 1996, DICO publishes the name, title, salary and taxable benefi ts for all employees who earned $100,000 or more during 2013. The information is available on the Ministry of Finance web site at www.fi n.gov.on.ca/en/publications/salarydisclosure.
In addition to their salaries, the Corporation provides human resources retention plans for key management personnel for the purpose of ensuring effective transition and succession planning. The terms of the plans vary with individuals and the acceptance is voluntary. Other benefi ts include DICO’s contributions to the pension plan and non-pension future employee benefi ts in which all employees of DICO are entitled to participate when they meet the qualifi cation criteria.
3-16 PUBLIC ACCOUNTS, 2013-2014

46 Deposit Insurance Corporation of Ontario 2 0 1 3 A N N U A L R E P O R T
Key management personnel compensation included:
($ thousands) 2013 2012
Short-term benefi ts $ 58 $ 55
Post-employment benefi ts 193 167
Other long-term benefi ts 196 275
Total $ 447 $ 497
13. CONTINGENCY
When acting in the capacity of administrator or liquidator of a credit union, the Corporation manages various legal actions in the normal course of business. One of these legal actions led to a counterclaim against the Corporation which remained outstanding at the end of 2013. As management believes there is no merit to the counterclaim, no provision has been made in these fi nancial statements.
14. RISKS ARISING FROM FINANCIAL INSTRUMENTS
(a) Credit risk
Credit risk is the risk of fi nancial loss to the Corporation if a customer or counter party to a fi nancial instrument fails to meet its contractual obligations, and arises principally from the Corporation’s investment securities. The Corporation minimizes its credit risk by investing in high quality fi nancial instruments and by limiting the amount invested in any one counter party. All investments in the DIRF are limited to those permitted by legislation, by the terms of the line of credit agreement with the OFA and to any limits made by the Corporation’s investment policy. The Corporation establishes an allowance for doubtful accounts that represents its estimate of deposit insurance losses in insured institutions. The main components of this allowance are specifi c provisions that relate to individually signifi cant exposures, and a general provision established in respect of losses that have been incurred but not yet identifi ed. The general provision is determined based on historical data of payment statistics for similar fi nancial assets.
(b) Liquidity risk
Liquidity risk is the risk that the Corporation will not be able to meet its fi nancial obligations to depositors as they fall due. The Corporation’s approach to managing liquidity is to ensure, as far as possible, that it will always have suffi cient liquidity to meet its liabilities when due, under both normal and stressed conditions, without incurring unacceptable losses or risking damage to the Corporation’s reputation.
Typically the Corporation ensures that it has suffi cient cash on demand to meet expected operational expenses for a period of 90 days, including the servicing of fi nancial obligations, if any; this excludes the potential impact of extreme circumstances that cannot reasonably be predicted, such as natural disasters. In addition, the Corporation maintains a line of credit approved by the Minister of Finance of $250 million (increased to $400 million effective January 1, 2014) that can be drawn down to provide liquidity to DICO as deposit insurer of insured institutions in the Province of Ontario. The terms of the line of credit require DICO to liquidate its DIRF investments before it can borrow above $20 million. The revolving credit facility has been extended for a 5-year term effective from January 1, 2014 to December 31, 2018. Interest would be payable at an annual rate equal to the province’s cost of funds for borrowings for a three month term, plus an additional 0.575 percent, as determined by the OFA at the commencement of each three month period.
(c) Market risk
Market risk is the risk that changes in market prices, such as foreign exchange rates, interest rates and equity prices, will affect income or the value of the holdings of fi nancial instruments. The Corporation does not have any dealings with foreign currency. DICO’s primary investment objective is to preserve capital and provide necessary liquidity to pay claims and ongoing operating expenses.
PUBLIC ACCOUNTS, 2013-2014 3-17

47
(d) Fair value sensitivity analysis for fixed rate instruments
The Corporation accounts for its fi xed rate fi nancial assets as available-for-sale. Therefore, a change in interest rates at the reporting date would not affect net income with respect to these fi xed rate instruments. A change of 1 percent in interest rates for the investments would have increased or decreased equity by $1,466,000 (2012: $1,239,000).
(e) Capital management
The Board’s policy is to enhance the fi nancial soundness of the credit union and caisse populaire sector. As of December 31, 2013, the Corporation has a DIRF of $164.7 million, which represents 68 basis points of the sector’s insured deposits. DICO’s target range for the reserve fund is 100 basis points of total insured deposits. The Corporation is committed to continue building the fund to ensure that it is adequate to meet the Corporation’s obligations to depositors.
15. FAIR VALUE DISCLOSURE
The fair value of fi nancial assets and liabilities which include cash and cash equivalents, premiums receivable, payables and accruals, and employee benefi ts, approximate their carrying amounts. The fair value of accrual for deposit insurance claims has not been determined because it is not practicable to determine fair value with suffi cient reliability.
3-18 PUBLIC ACCOUNTS, 2013-2014
Motor Vehicle Accident Claims Fund
Management Responsibility for Financial Information
Management maintains a system of internal controls, information systems and processes
designed to provide reasonable assurance that the assets of the Motor Vehicle Accident
Claims Fund (MVACF) are safeguarded and that financial information is reliable and
timely. The internal control systems include formal policies and procedures and an
organizational structure which provides for appropriate Financial Delegation of Authority
and the segregation of incompatible duties. An internal audit function independently
evaluates the effectiveness of these internal controls, information systems and processes on
an ongoing basis and reports its findings to Management and to the Audit and Risk
Committee at Financial Services Commission of Ontario (FSCO).
The Audit and Risk Committee, which includes the Superintendent of Financial Services, is
responsible for ensuring Management fulfils its responsibilities for financial reporting and
internal controls. The Audit and Risk Committee meets periodically with Management,
internal and external auditors to address issues and to review the Financial Statements
before recommending approval.
The accompanying Financial Statements of the MVACF have been prepared in accordance
with the Canadian Public Sector Accounting Standards for Government Not-For-Profit
Organizations (PSA-GNFPO). The preparation of the Financial Statements involves the use
of Management’s professional judgment and best estimates particularly with respect to
transactions affecting the current accounting period that cannot be finalized with certainty
until future periods. Management relies on the work of specialists in evaluating the Unpaid
Claims amount and has adequately considered the qualifications of the specialist in determining
amounts and disclosures used in the notes to financial statements. Management does not give, nor
cause any instructions to be given, to specialists with respect to values or amounts derived, in an
attempt to bias their work, and are not aware of any matters that have impacted the independence or
objectivity of the specialists.
The Financial Statements have been audited by Ernst and Young, Chartered Accountants
who are engaged under the direction of the Auditor General. The auditor’s responsibility is
to express an opinion on whether the Financial Statements are presented fairly, in all
material respects, in accordance with PSA-GNFPO. The Auditor’s Report, which follows,
outlines the scope of the Auditor’s examination and the Auditor’s opinion on the financial
statements.
On behalf of management:
Izabel Scovino Leonard Lobo CGA; CPA
Senior Manager (A) -MVACF Senior Manager (A), Finance
and Planning
PUBLIC ACCOUNTS, 2013-2014 3-19

INDEPENDENT AUDITORS’ REPORT
To the Audit and Risk Committee of the Financial Services Commission of Ontario and the Auditor General of Ontario
Pursuant to our appointment as auditor of the Motor Vehicle Accident Claims Fund (the “Fund” or “MVACF”), which audit is under the direction of the Auditor General of Ontario, we have audited the accompanying financial statements of the Fund, which comprise the statement of financial position as at March 31, 2014 and the statements of operations and MVACF deficit and cash flows for the year then ended and a summary of significant accounting policies and other explanatory information.
Management's responsibility for the financial statements
Management is responsible for the preparation and fair presentation of these financial statements in accordance with Canadian Public Sector Accounting Standards, and for such internal control as management determines is necessary to enable the preparation of financial statements that are free from material misstatement, whether due to fraud or error.
Auditors’ responsibility
Our responsibility is to express an opinion on these financial statements based on our audit. We conducted our audit in accordance with Canadian generally accepted auditing standards. Those standards require that we comply with ethical requirements and plan and perform the audit to obtain reasonable assurance about whether the financial statements are free from material misstatement.
An audit involves performing procedures to obtain audit evidence about the amounts and disclosures in the financial statements. The procedures selected depend on the auditors’ judgment, including the assessment of the risks of material misstatement of the financial statements, whether due to fraud or error. In making those risk assessments, the auditors consider internal control relevant to the entity's preparation and fair presentation of the financial statements in order to design audit procedures that are appropriate in the circumstances, but not for the purpose of expressing an opinion on the effectiveness of the entity's internal control. An audit also includes evaluating the appropriateness of accounting policies used and the reasonableness of accounting estimates made by management, as well as evaluating the overall presentation of the financial statements.
We believe that the audit evidence we have obtained is sufficient and appropriate to provide a basis for our audit opinion.
Opinion
In our opinion, the financial statements present fairly, in all material respects, the financial position of the Motor Vehicle Accident Claims Fund as at March 31, 2014 and its financial performance and its cash flows for the year ended March 31, 2014 in accordance with Canadian Public Sector Accounting Standards.
Kitchener, Canada Chartered Accountants June 25, 2014 Licensed Public Accountants
3-20 PUBLIC ACCOUNTS, 2013-2014
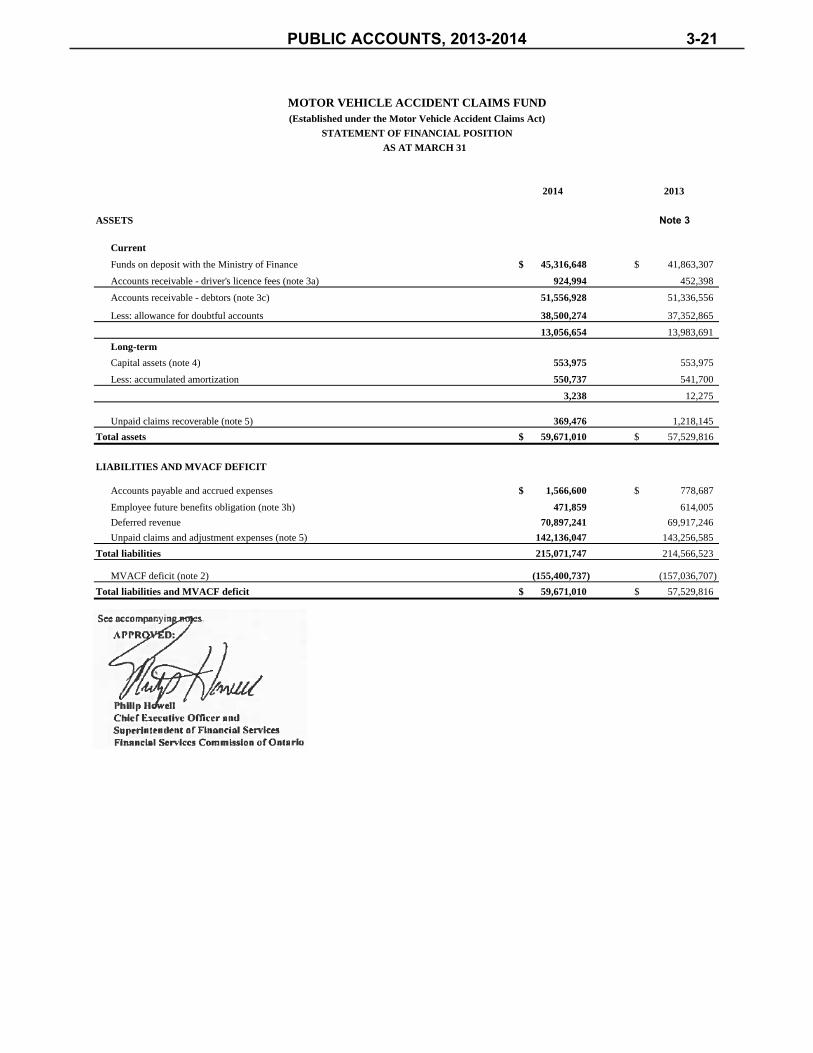
2014 2013
ASSETS Note 3
Current
Funds on deposit with the Ministry of Finance 45,316,648$ 41,863,307$
Accounts receivable - driver's licence fees (note 3a) 924,994 452,398
Accounts receivable - debtors (note 3c) 51,556,928 51,336,556
Less: allowance for doubtful accounts 38,500,274 37,352,865
13,056,654 13,983,691
Long-term
Capital assets (note 4) 553,975 553,975
Less: accumulated amortization 550,737 541,700
3,238 12,275
Unpaid claims recoverable (note 5) 369,476 1,218,145
Total assets 59,671,010$ 57,529,816$
LIABILITIES AND MVACF DEFICIT
Accounts payable and accrued expenses 1,566,600$ 778,687$
Employee future benefits obligation (note 3h) 471,859 614,005
Deferred revenue 70,897,241 69,917,246
Unpaid claims and adjustment expenses (note 5) 142,136,047 143,256,585
Total liabilities 215,071,747 214,566,523
MVACF deficit (note 2) (155,400,737) (157,036,707)
Total liabilities and MVACF deficit 59,671,010$ 57,529,816$
See accompanying notes.
APPROVED:
Philip Howell
Chief Executive Officer and
Superintendent of Financial Services
Financial Services Commission of Ontario
MOTOR VEHICLE ACCIDENT CLAIMS FUND
(Established under the Motor Vehicle Accident Claims Act)
STATEMENT OF FINANCIAL POSITION
AS AT MARCH 31
PUBLIC ACCOUNTS, 2013-2014 3-21

2014 2013
REVENUE
Fees on issue or renewal of driver's licences 29,616,255$ 28,473,324$
Change in deferred revenue (979,995) (271,193)
Fees earned 28,636,260 28,202,131
Prior year recoveries 1,412,802 1,521,761
Other revenue 14 4,888
Total revenue 30,049,076 29,728,780
EXPENSES
Change in net unpaid claims and adjustment expenses (271,869) 4,828,340
Accident benefit claims payments 17,049,530 22,974,433
Salaries and wages 1,733,508 1,740,928
Employees' benefits 128,918 277,925
Transportation and communication 51,388 26,878
Claims (solicitors' fees, etc.) 1,736,864 2,249,325
Accident benefit claims expense 1,708,443 2,082,770
Other services 1,238,229 1,346,492
Bad debts expense 5,017,499 5,332,956
Supplies and equipment 11,558 15,707
Amortization expense 9,038 8,808
Total expenses 28,413,106 40,884,562
Excess of revenue over expenses 1,635,970 (11,155,782)
MVACF deficit, beginning of year (note 3) (157,036,707) (145,880,925)
MVACF deficit, end of year (155,400,737)$ (157,036,707)$
See accompanying notes.
Administrative expenses
STATEMENT OF OPERATIONS AND MVACF DEFICIT
MOTOR VEHICLE ACCIDENT CLAIMS FUND
(Established under the Motor Vehicle Accident Claims Act)
FOR THE YEAR ENDED MARCH 31
Approved on Behalf of the Board
3-22 PUBLIC ACCOUNTS, 2013-2014
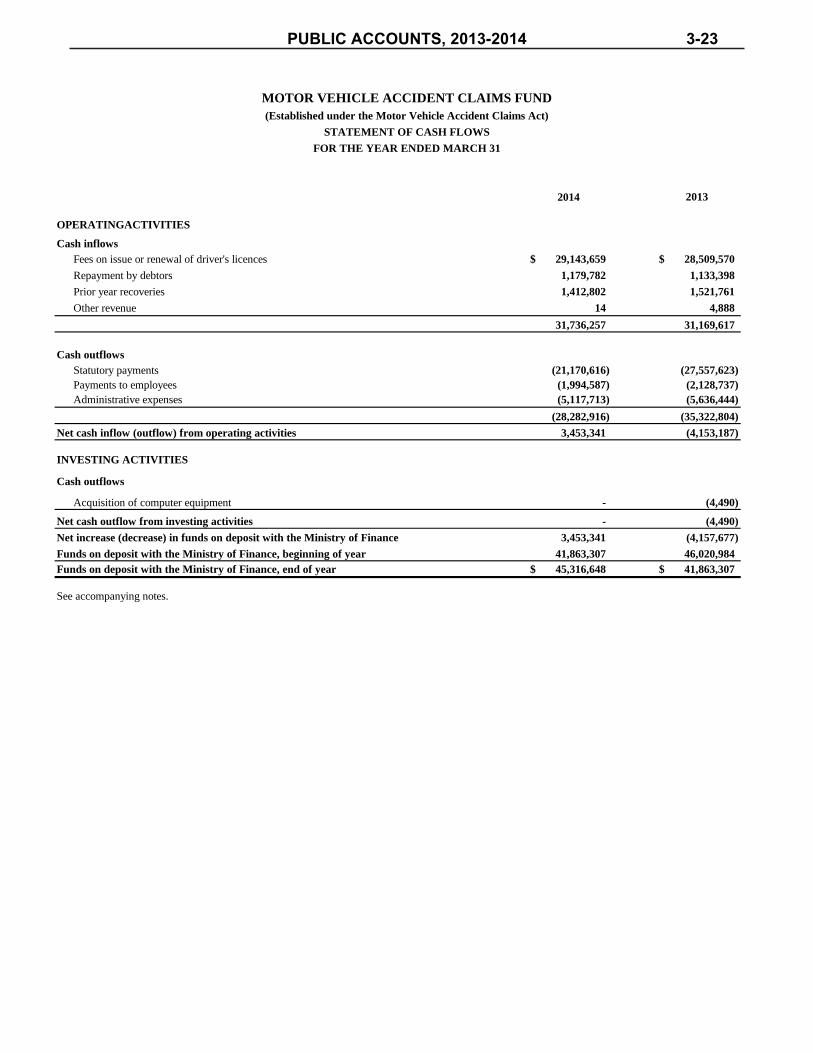
2014 2013
OPERATINGACTIVITIES
Cash inflows
Fees on issue or renewal of driver's licences 29,143,659$ 28,509,570$
Repayment by debtors 1,179,782 1,133,398
Prior year recoveries 1,412,802 1,521,761
Other revenue 14 4,888
31,736,257 31,169,617
Cash outflows
Statutory payments (21,170,616) (27,557,623)
Payments to employees (1,994,587) (2,128,737)
Administrative expenses (5,117,713) (5,636,444)
(28,282,916) (35,322,804)
Net cash inflow (outflow) from operating activities 3,453,341 (4,153,187)
INVESTING ACTIVITIES
Cash outflows
Acquisition of computer equipment - (4,490)
Net cash outflow from investing activities - (4,490)
Net increase (decrease) in funds on deposit with the Ministry of Finance 3,453,341 (4,157,677)
Funds on deposit with the Ministry of Finance, beginning of year 41,863,307 46,020,984
Funds on deposit with the Ministry of Finance, end of year 45,316,648$ 41,863,307$
See accompanying notes.
MOTOR VEHICLE ACCIDENT CLAIMS FUND
(Established under the Motor Vehicle Accident Claims Act)
STATEMENT OF CASH FLOWS
FOR THE YEAR ENDED MARCH 31
Approved on Behalf of the Board
PUBLIC ACCOUNTS, 2013-2014 3-23

MOTOR VEHICLE ACCIDENT CLAIMS FUND
(Established under the Motor Vehicle Accident Claims Act)
NOTES TO THE FINANCIAL STATEMENTS
MARCH 31, 2014
1. STATUTORY AUTHORITY
The Motor Vehicle Accident Claims Fund (MVACF) operates under the authority of the Motor Vehicle
Accident Claims Act (the Act), R.S.O. 1990, Chapter M.41 as amended.
2. MVACF OPERATIONS
MVACF is a program that was created on July 1, 1947 as the Unsatisfied Judgment Fund. Initially, MVACF
was required to respond to victims of uninsured motorists and hit-and-run drivers who could not recover
damages awarded by the courts from an automobile insurance company. MVACF legislation was amended in
the early 1960s, in 1979 with the Compulsory Automobile Insurance Act, and in 1990 by the Insurance Statute
Law Amendment Act which required MVACF to include in its statutory payments, accident benefits on a no-
fault basis for the first time. Currently, MVACF responds to claims in the same fashion and with the same
exclusions as automobile insurers in Ontario, and provides for two types of coverage: third-party bodily injury
and property damage liability (collectively referred to as TPL), and statutory accident benefits or SABS in
accordance with legislated requirements.
The coverage provided by MVACF is analogous to the minimum required coverage under the standard
automobile policy (OAP 1) approved by the provincial regulator. Unlike insurance companies, MVACF does
not cover claims where the accidents occur outside of Ontario, except in the case of accident benefits where
the Ontario insurer is insolvent. In the cases of insurance company insolvencies where MVACF pays claims
for accident benefits, MVACF has powers to assess the industry to recover for claims and adjustment
expenses and also has claimant rights against the estate of the insolvent insurer.
MVACF operates administratively under the direction of the Financial Services Commission of Ontario
(FSCO) and reimburses FSCO for the costs of the services it provides to MVACF.
The Lieutenant Governor in Council, having regard to the condition of MVACF and the amount paid out of
MVACF during any period, may direct payment out of the Province’s Consolidated Revenue Fund of such an
amount as may be considered necessary or advisable to subsidize and fund MVACF’s operations.
3-24 PUBLIC ACCOUNTS, 2013-2014

MOTOR VEHICLE ACCIDENT CLAIMS FUND
(Established under the Motor Vehicle Accident Claims Act)
NOTES TO THE FINANCIAL STATEMENTS
MARCH 31, 2014
3. SUMMARY OF SIGNIFICANT ACCOUNTING POLICIES
The significant accounting policies used in the preparation of these financial statements in accordance with
Canadian Public Sector Accounting Standards for government not-for-profit organizations (PSA-GNFPO) as
issued by the Public Sector Accounting Board (PSAB) are summarized as follows:
a) Driver’s Licence Fees and Deferred Revenue
MVACF earns a fee of $15.00 on the issuance or renewal of each driver’s five-year licence. The
income is earned on a pro-rata basis over the five-year term of the licence and the unearned portion is
reflected as deferred revenue.
b) Accounts Receivable – Driver’s Licence Fees
Under the Act, MVACF receives from the Ministry of Transportation and Serco DES a monthly internal
transfer and payment representing the driver’s licence fee prescribed by Ontario Regulation 800.
Accordingly, unremitted licence fees are reported as accounts receivable.
c) Accounts Receivable – Debtors
MVACF maintains an accounts receivable portfolio, accumulated over the years as a result of
judgments and claims assigned to the Minister of Finance. MVACF will pay damages to injured, not-at-
fault victims who have no recourse to liability insurance, on behalf of defendant uninsured motorists.
In accordance with the Act, these amounts are recoverable from the uninsured motorists. Total
repayments received from defendant/debtors are reflected in the statement of cash flows.
The allowance for doubtful accounts is determined through a process that considers: the age of
defendant/debtor, the defendant/debtor’s current monthly installment required under the regulations, the
amount paid out of MVACF, the activity on the account since the date of the judgment, and the
financial status of the defendant/debtor.
The write-off process depends on established criteria that parallel the criteria established by the Ministry
of Finance. These criteria are used to select a block of accounts as at the beginning of April that is
reviewed by the collections staff. The Ministry of Finance, Internal Audit Section audits the work of the
collections staff and provides a certificate of assurance to verify that the established criteria for the
write-off have been met. The write-off transaction is authorized by an Order-In–Council (OIC) under
the authority set out in the Financial Administration Act.
For March 31, 2014, a write-off of $ 10.0 million was submitted to the Ministry of Finance but has not
yet been approved. A write-off of $4.5 million for March 31, 2013 was approved during the year,
through an OIC. This write-off is recorded in the current year’s financial statements and represents a
reduction of the account receivable debtors and allowance for doubtful accounts. There is no impact in
the current year statement of operations.
Accounts receivables-debtors and the allowance for doubtful accounts are adjusted on receipt of the
OIC approving the write off.
PUBLIC ACCOUNTS, 2013-2014 3-25

MOTOR VEHICLE ACCIDENT CLAIMS FUND
(Established under the Motor Vehicle Accident Claims Act)
NOTES TO THE FINANCIAL STATEMENTS
MARCH 31, 2014
3. SUMMARY OF SIGNIFICANT ACCOUNTING POLICIES (continued)
d) Accounting Adjustment
The Net Funds Balance for 2012-13 has been restated to correct for an overstatement of accounts
receivable - debtors and an understatement of the bad debt expense originating in fiscal 2010-11.
Because these errors are not material to the financial statement for prior years, but correcting them in
the current year would have materially distorted the year’s results, MVACF has corrected the errors by
increasing the opening deficit by $948,484
e) Prior Year Recoveries
Prior year recoveries are generated from three main sources: insurance recoveries, reversionary interest
(note 6) and recoveries of court costs. MVACF is required under the Statutory Accident Benefits
Schedule (SABS) to satisfy the payment of accident benefits claims within specified periods. The
timeframe does not allow for a complete investigation into available insurance coverage and in some
instances information is withheld by police because of criminal investigations. Accordingly, when new
information is available, MVACF may be required to pursue private insurers for recoveries.
From time to time MVACF may also be involved in the defense of uninsured motorists or the
Superintendent of the FSCO, where the legal proceedings are deemed frivolous and MVACF is awarded
costs by the courts.
Prior year recoveries are recorded in the period they are determined. In the current year $1.4 million
(2013 - $1.5 million) recoveries were recorded but related to prior year claims.
f) Unpaid Claims and Adjustment Expenses
Unpaid claims and adjustment expenses represents the estimated amounts required to settle all unpaid
claims, including an amount for unreported claims and claim expenses, and is gross of estimated
recoveries and subrogation. Claim liabilities are established according to accepted actuarial practice in
Canada as applied to public personal injury compensation plans. They do not reflect the time value of
money, because MVACF reports no investment income.
The provision for unpaid claims and adjustment expenses consists of estimates that are necessarily
subject to uncertainty, and the variability could be material in the near term. The estimates are selected
from a range of possible outcomes and are adjusted up or down, as additional information becomes
known during the course of loss settlement proceedings. The estimates are principally based on
historical experience but variability can be caused by changes in judicial interpretations of contracts or
significant changes in severity and frequency of claims from historical trends. All changes in estimates
are recorded in the current period.
MVACF has obligations to pay certain fixed amounts to claimants on a recurring basis and has
purchased annuities from life insurers to provide for those payments in the form of structured
settlements. Note 6 contains additional analysis related to structured settlements.
3-26 PUBLIC ACCOUNTS, 2013-2014
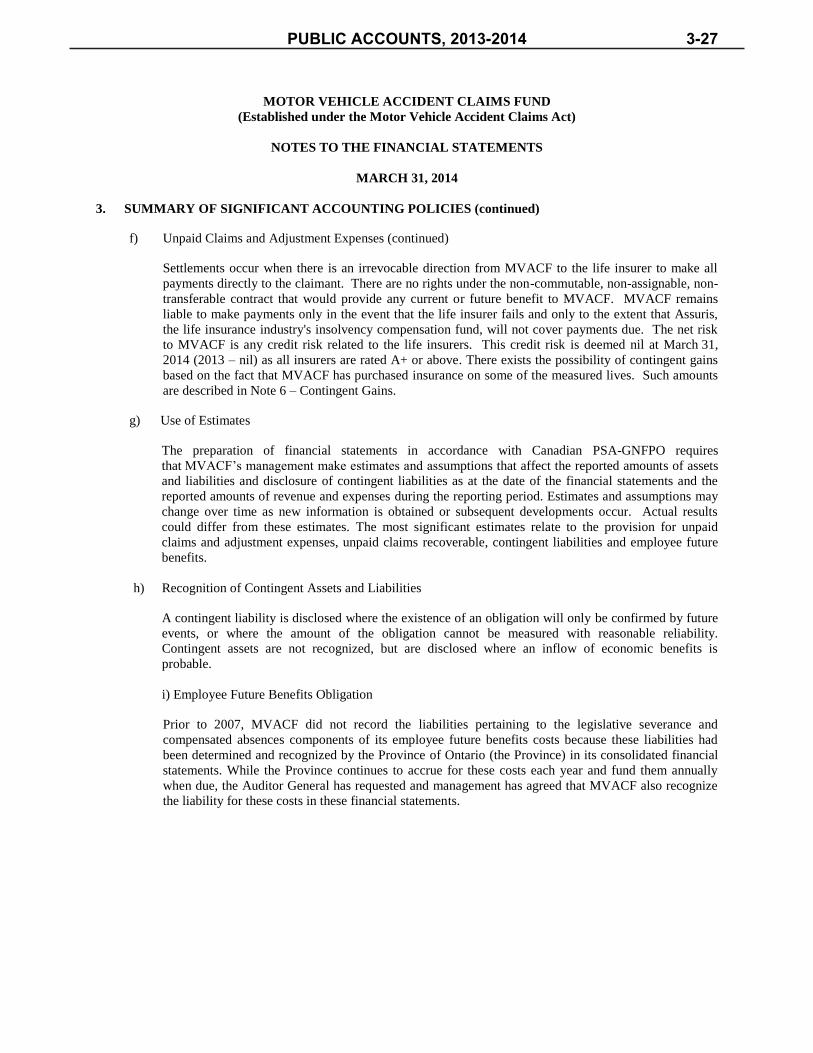
MOTOR VEHICLE ACCIDENT CLAIMS FUND
(Established under the Motor Vehicle Accident Claims Act)
NOTES TO THE FINANCIAL STATEMENTS
MARCH 31, 2014
3. SUMMARY OF SIGNIFICANT ACCOUNTING POLICIES (continued)
f) Unpaid Claims and Adjustment Expenses (continued)
Settlements occur when there is an irrevocable direction from MVACF to the life insurer to make all
payments directly to the claimant. There are no rights under the non-commutable, non-assignable, non-
transferable contract that would provide any current or future benefit to MVACF. MVACF remains
liable to make payments only in the event that the life insurer fails and only to the extent that Assuris,
the life insurance industry's insolvency compensation fund, will not cover payments due. The net risk
to MVACF is any credit risk related to the life insurers. This credit risk is deemed nil at March 31,
2014 (2013 – nil) as all insurers are rated A+ or above. There exists the possibility of contingent gains
based on the fact that MVACF has purchased insurance on some of the measured lives. Such amounts
are described in Note 6 – Contingent Gains.
g) Use of Estimates
The preparation of financial statements in accordance with Canadian PSA-GNFPO requires
that MVACF’s management make estimates and assumptions that affect the reported amounts of assets
and liabilities and disclosure of contingent liabilities as at the date of the financial statements and the
reported amounts of revenue and expenses during the reporting period. Estimates and assumptions may
change over time as new information is obtained or subsequent developments occur. Actual results
could differ from these estimates. The most significant estimates relate to the provision for unpaid
claims and adjustment expenses, unpaid claims recoverable, contingent liabilities and employee future
benefits.
h) Recognition of Contingent Assets and Liabilities
A contingent liability is disclosed where the existence of an obligation will only be confirmed by future
events, or where the amount of the obligation cannot be measured with reasonable reliability.
Contingent assets are not recognized, but are disclosed where an inflow of economic benefits is
probable.
i) Employee Future Benefits Obligation
Prior to 2007, MVACF did not record the liabilities pertaining to the legislative severance and
compensated absences components of its employee future benefits costs because these liabilities had
been determined and recognized by the Province of Ontario (the Province) in its consolidated financial
statements. While the Province continues to accrue for these costs each year and fund them annually
when due, the Auditor General has requested and management has agreed that MVACF also recognize
the liability for these costs in these financial statements.
PUBLIC ACCOUNTS, 2013-2014 3-27
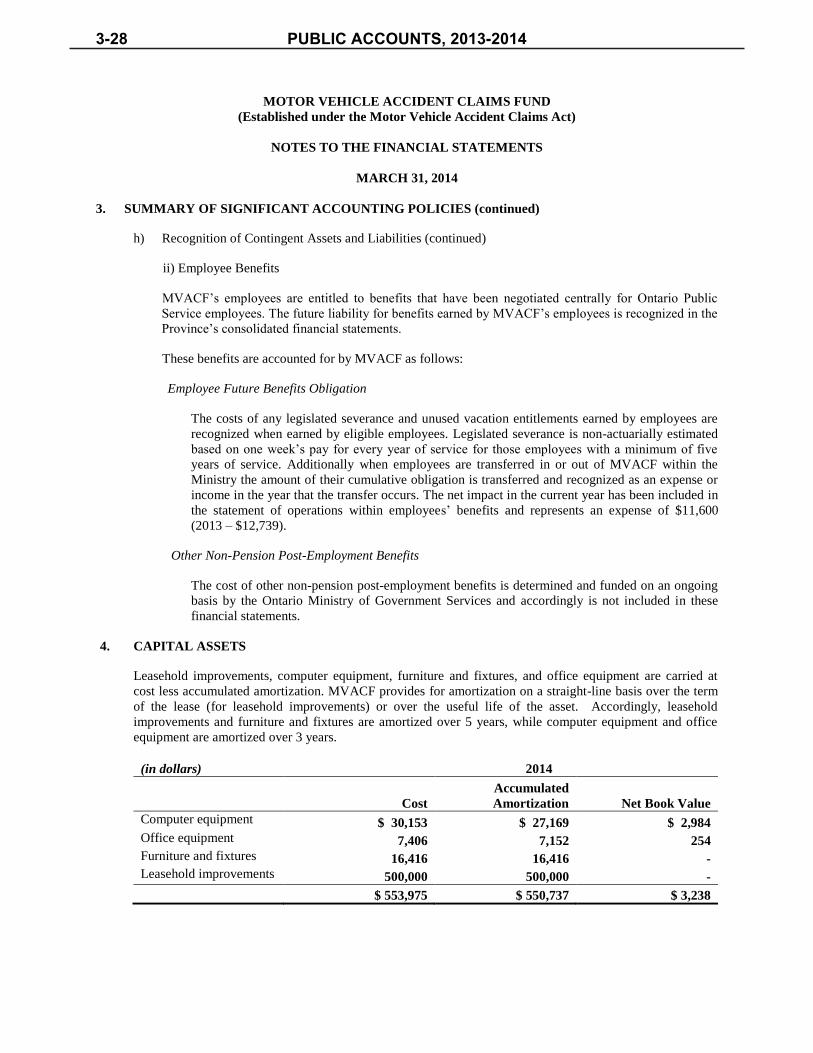
MOTOR VEHICLE ACCIDENT CLAIMS FUND
(Established under the Motor Vehicle Accident Claims Act)
NOTES TO THE FINANCIAL STATEMENTS
MARCH 31, 2014
3. SUMMARY OF SIGNIFICANT ACCOUNTING POLICIES (continued)
h) Recognition of Contingent Assets and Liabilities (continued)
ii) Employee Benefits
MVACF’s employees are entitled to benefits that have been negotiated centrally for Ontario Public
Service employees. The future liability for benefits earned by MVACF’s employees is recognized in the
Province’s consolidated financial statements.
These benefits are accounted for by MVACF as follows:
Employee Future Benefits Obligation
The costs of any legislated severance and unused vacation entitlements earned by employees are
recognized when earned by eligible employees. Legislated severance is non-actuarially estimated
based on one week’s pay for every year of service for those employees with a minimum of five
years of service. Additionally when employees are transferred in or out of MVACF within the
Ministry the amount of their cumulative obligation is transferred and recognized as an expense or
income in the year that the transfer occurs. The net impact in the current year has been included in
the statement of operations within employees’ benefits and represents an expense of $11,600
(2013 – $12,739).
Other Non-Pension Post-Employment Benefits
The cost of other non-pension post-employment benefits is determined and funded on an ongoing
basis by the Ontario Ministry of Government Services and accordingly is not included in these
financial statements.
4. CAPITAL ASSETS
Leasehold improvements, computer equipment, furniture and fixtures, and office equipment are carried at
cost less accumulated amortization. MVACF provides for amortization on a straight-line basis over the term
of the lease (for leasehold improvements) or over the useful life of the asset. Accordingly, leasehold
improvements and furniture and fixtures are amortized over 5 years, while computer equipment and office
equipment are amortized over 3 years.
(in dollars) 2014
Cost
Accumulated
Amortization Net Book Value
Computer equipment $ 30,153 $ 27,169 $ 2,984
Office equipment 7,406 7,152 254
Furniture and fixtures 16,416 16,416 -
Leasehold improvements 500,000 500,000 -
$ 553,975 $ 550,737 $ 3,238
3-28 PUBLIC ACCOUNTS, 2013-2014

MOTOR VEHICLE ACCIDENT CLAIMS FUND
(Established under the Motor Vehicle Accident Claims Act)
NOTES TO THE FINANCIAL STATEMENTS
MARCH 31, 2014
4. CAPITAL ASSETS (continued)
(in dollars) 2013
Cost
Accumulated
Amortization Net Book Value
Computer equipment $ 30,153 $ 18,386 $ 11,767
Office equipment 7,406 6,898 508
Furniture and fixtures 16,416 16,416 -
Leasehold improvements 500,000 500,000 -
$ 553,975 $ 541,700 $ 12,275
5. UNPAID CLAIMS AND ADJUSTMENT EXPENSES
a) MVACF’s unpaid claims and adjustment expenses and unpaid claims recoverable consist of the
following:
2014 2013
(in thousands of dollars) Gross Recoverable Gross Recoverable
ACCIDENT BENEFITS
Statutory accident benefits $ 95,899 - $ 92,291 $ —
THIRD-PARTY LIABILITY (TPL)
Property damage 878 5 1,103 19
Bodily injury 45,359 364 49,862 1,199
Total TPL $46,237 369 50,965 1,218
Totals $142,136 369 $143,256 $ 1,218
b) The change in gross provision for unpaid claims and adjustment expenses is as follows:
(in thousands of dollars) 2014 2013
Balance, beginning of year
$ 143,256 $ 138,709
Increase (decrease) in provision for losses that occurred
in prior years
(2,003) 7,562
Amounts paid during the year on claims of prior years
Statutory payments
(20,713) (27,214)
Claims expenses
(6,228) (7,198)
Amounts paid during the year on claims of the current
year
Statutory payments
(256) (459)
Claims expenses
(77) (121)
Provision for losses on claims that occurred in the
current year
28,157 31,977
Balance, end of year $142,136 $ 143,256
PUBLIC ACCOUNTS, 2013-2014 3-29
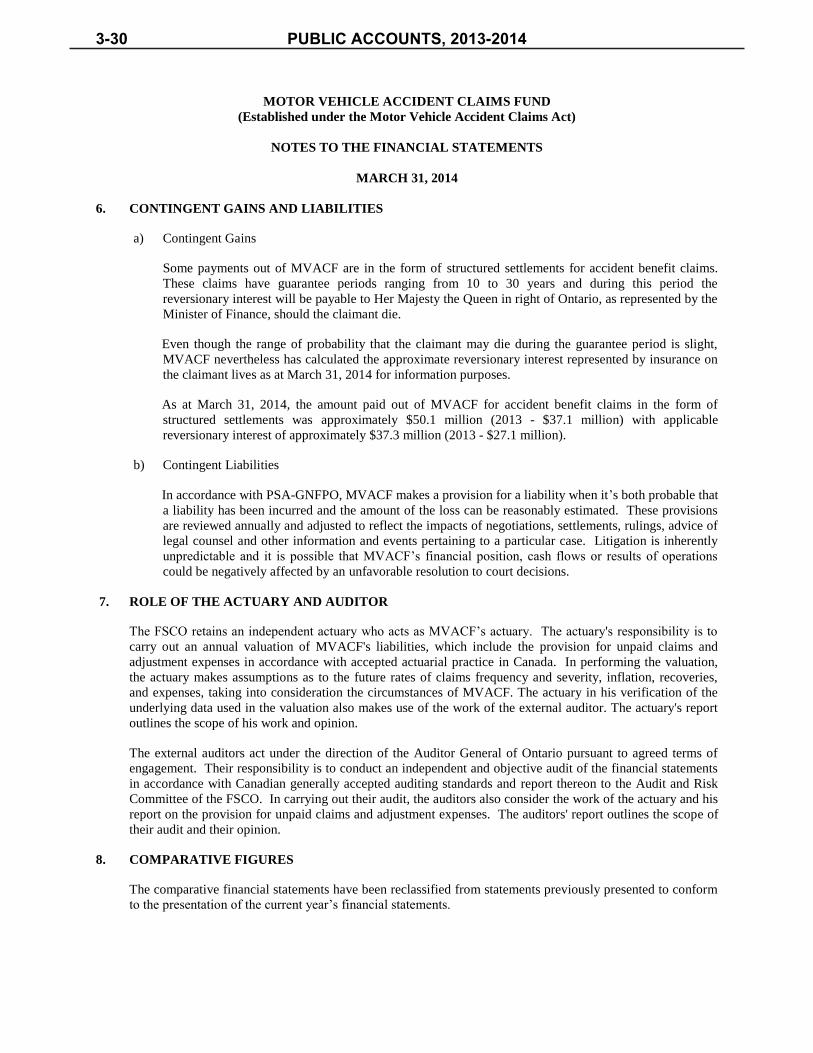
MOTOR VEHICLE ACCIDENT CLAIMS FUND
(Established under the Motor Vehicle Accident Claims Act)
NOTES TO THE FINANCIAL STATEMENTS
MARCH 31, 2014
6. CONTINGENT GAINS AND LIABILITIES
a) Contingent Gains
Some payments out of MVACF are in the form of structured settlements for accident benefit claims.
These claims have guarantee periods ranging from 10 to 30 years and during this period the
reversionary interest will be payable to Her Majesty the Queen in right of Ontario, as represented by the
Minister of Finance, should the claimant die.
Even though the range of probability that the claimant may die during the guarantee period is slight,
MVACF nevertheless has calculated the approximate reversionary interest represented by insurance on
the claimant lives as at March 31, 2014 for information purposes.
As at March 31, 2014, the amount paid out of MVACF for accident benefit claims in the form of
structured settlements was approximately $50.1 million (2013 - $37.1 million) with applicable
reversionary interest of approximately $37.3 million (2013 - $27.1 million).
b) Contingent Liabilities
In accordance with PSA-GNFPO, MVACF makes a provision for a liability when it’s both probable that
a liability has been incurred and the amount of the loss can be reasonably estimated. These provisions
are reviewed annually and adjusted to reflect the impacts of negotiations, settlements, rulings, advice of
legal counsel and other information and events pertaining to a particular case. Litigation is inherently
unpredictable and it is possible that MVACF’s financial position, cash flows or results of operations
could be negatively affected by an unfavorable resolution to court decisions.
7. ROLE OF THE ACTUARY AND AUDITOR
The FSCO retains an independent actuary who acts as MVACF’s actuary. The actuary's responsibility is to
carry out an annual valuation of MVACF's liabilities, which include the provision for unpaid claims and
adjustment expenses in accordance with accepted actuarial practice in Canada. In performing the valuation,
the actuary makes assumptions as to the future rates of claims frequency and severity, inflation, recoveries,
and expenses, taking into consideration the circumstances of MVACF. The actuary in his verification of the
underlying data used in the valuation also makes use of the work of the external auditor. The actuary's report
outlines the scope of his work and opinion.
The external auditors act under the direction of the Auditor General of Ontario pursuant to agreed terms of
engagement. Their responsibility is to conduct an independent and objective audit of the financial statements
in accordance with Canadian generally accepted auditing standards and report thereon to the Audit and Risk
Committee of the FSCO. In carrying out their audit, the auditors also consider the work of the actuary and his
report on the provision for unpaid claims and adjustment expenses. The auditors' report outlines the scope of
their audit and their opinion.
8. COMPARATIVE FIGURES
The comparative financial statements have been reclassified from statements previously presented to conform
to the presentation of the current year’s financial statements.
3-30 PUBLIC ACCOUNTS, 2013-2014
Actuaries’ opinion to the directors of the Ontario Pension Board
Aon Hewitt was retained by the Ontario Pension Board (OPB) to prepare the following actuarial valuations of the Public Service Pension Plan (PSPP):
• An actuarial valuation as at December 31, 2012 on a funding basis, as described in Note 6 of these financial statements, prepared in accordance with the Public Service Pension Act and applicable pension legislation.
• An actuarial valuation as at December 31, 2013 for purposes of these financial statements, prepared in accordance with the Chartered Professional Accountants of Canada Handbook, Section 4600.
The actuarial valuation of the PSPP as at December 31, 2012 on a funding basis was based on membership data provided by OPB as at December 31, 2012.
Using the same data as provided by OPB for the funding valuation of the PSPP, we have prepared a valuation of the liabilities as of December 31, 2012 on the basis of the accounting methodology required by the Chartered Professional Accountants of Canada Handbook, Section 4600, as disclosed in Note 6, and extrapolated the liabilities to December 31, 2013. The valuation as at December 31, 2013 was based on assumptions that reflect OPB’s best estimates of future events such as future rates of inflation, future retirement rates and future rates of return on the pension fund. The amounts are set out in the statement of changes in pension obligations.
We hereby certify that, in our opinion:
• The data provided to us by OPB as of December 31, 2012 are sufficient and reliable;
• The actuarial assumptions used are, in aggregate, appropriate for the purposes of each valuation; emerging experience differing from the assumptions will result in gains or losses which will be revealed in future valuations; and
• The methods used are appropriate for the purposes of each valuation and are consistent with the applicable regulatory requirements.
Our valuations have been prepared, and our opinions given, in accordance with accepted actuarial practice.
AON HEWITT
Allan H. Shapira Andrew M. Hamilton Fellow of the Canadian Institute of Actuaries Fellow of the Canadian Institute of Actuaries
February 28, 2014
Ontario Pension Board
PUBLIC ACCOUNTS, 2013-2014 3-31

Management’s responsibility for financial reporting
The financial statements of the Ontario Pension Board (OPB) have been prepared by management, which is responsible for the integrity and fairness of the data presented. The accounting policies followed in the preparation of these financial statements are in accordance with Canadian accounting standards for pension plans. Of necessity, many amounts in the financial statements must be based on the best estimates and judgment of management with appropriate consideration as to materiality. Financial information presented throughout this annual report is consistent with the financial statements.
Systems of internal control and supporting procedures are maintained to provide assurance that transactions are authorized, assets are safeguarded against unauthorized use or disposition, and proper records are maintained. The system includes careful hiring and training of staff, the establishment of an organizational structure that provides for a well-defined division of responsibilities and the communication of policies and guidelines of business conduct throughout OPB.
The Board of Directors (the Board) is ultimately responsible for the financial statements of OPB. OPB’s Audit Committee assists in this responsibility by reviewing the financial statements in detail with management and the external auditors before such statements are recommended to the Board for approval. The Audit Committee meets regularly with management and the external auditors to review the scope and timing of audits, to review their findings and suggestions for improvements in internal control, and to satisfy themselves that their responsibilities and those of management have been properly discharged.
Mark J. Fuller Armand de Kemp, CPA, CA President & CEO Director, Finance
February 28, 2014
3-32 PUBLIC ACCOUNTS, 2013-2014

Independent auditors’ report to Pension Board We have audited the accompanying financial statements of the Ontario Pension Board, which comprise the statement of financial position as at December 31, 2013, and the statements of changes in net assets available for benefits and changes in pension obligations for the year then ended, and a summary of significant accounting policies and other explanatory information.
MANAGEMENT’S RESPONSIBILITY FOR THE FINANCIAL STATEMENTSManagement is responsible for the preparation and fair presentation of these financial statements in accordance with Canadian accounting standards for pension plans, and for such internal control as management determines is necessary to enable the preparation of financial statements that are free from material misstatement, whether due to fraud or error.
AUDITORS’ RESPONSIBILITYOur responsibility is to express an opinion on these financial statements based on our audit. We conducted our audit in accordance with Canadian generally accepted auditing standards. Those standards require that we comply with ethical requirements and plan and perform the audit to obtain reasonable assurance about whether the financial statements are free from material misstatement.
An audit involves performing procedures to obtain audit evidence about the amounts and disclosures in the financial statements. The procedures selected depend on the auditors’ judgment, including the assessment of the risks of material misstatement of the financial statements, whether due to fraud or error. In making those risk assessments, the auditors consider internal control relevant to the entity’s preparation and fair presentation of the financial statements in order to design audit procedures that are appropriate in the circumstances, but not for the purpose of expressing an opinion on the effectiveness of the entity’s internal control. An audit also includes evaluating the appropriateness of accounting policies used and the reasonableness of accounting estimates made by management, as well as evaluating the overall presentation of the financial statements.
We believe that the audit evidence we have obtained is sufficient and appropriate to provide a basis for our audit opinion.
OPINIONIn our opinion, the financial statements present fairly, in all material respects, the financial position of the Ontario Pension Board as at December 31, 2013, and the changes in its net assets available for benefits and changes in its pension obligations for the year then ended in accordance with Canadian accounting standards for pension plans.
Toronto, Canada Chartered Accountants (signed) February 28, 2014 Licensed Public Accountants
the directors of the Ontario
PUBLIC ACCOUNTS, 2013-2014 3-33

Statement of financial position
As at December 31 (in thousands of dollars) 2013 2012
Assets
Investments (Note 4) $ 20,896,407 $ 19,008,875
Investment-related receivables (Note 4) 74,447 31,554
Contributions receivable
Members 26,354 25,328
Employers 37,637 36,696
Capital assets (Note 5) 2,510 3,164
Total assets 21,037,355 19,105,617
Liabilities
Investment-related liabilities (Note 4) 85,596 83,893
Accounts payable and accrued charges 35,462 29,046
Contributions payable 1,240 1,200
Total liabilities 122,298 114,139
Net assets available for benefits 20,915,057 18,991,478
Pension obligations (Note 6) 21,894,206 20,359,744
Deficit (Note 7) $ (979,149) $ (1,368,266)
See accompanying notes
On behalf of the Board:
M. Vincenza Sera M.E. (Peggy) GilmourChair Chair, Audit Committee
3-34 PUBLIC ACCOUNTS, 2013-2014

Statement of changes in net assets available for benefits
For the year ended December 31 (in thousands of dollars) 2013 2012
Investment operations
Net investment income (Note 8) $ 2,244,167 $ 1,964,316
Operating expenses – investment operations (Note 10) (15,675) (14,041)
Net investment operations 2,228,492 1,950,275
Pension operations
Contributions (Note 9)
Members 298,928 303,622
Employers and sponsor 410,096 409,923
Transfer from other plans 90,748 103,669
Retirement pension payments (958,750) (917,776)
Termination and other benefits (121,557) (105,333)
Operating expenses – pension operations (Note 10) (24,378) (22,754)
Net pension operations (304,913) (228,649)
Net increase in net assets for the year 1,923,579 1,721,626
Net assets, at beginning of year 18,991,478 17,269,852
Net assets, at end of year $ 20,915,057 $ 18,991,478
See accompanying notes
PUBLIC ACCOUNTS, 2013-2014 3-35

Statement of changes in pension obligations
For the year ended December 31 (in thousands of dollars) 2013 2012
Pension obligations, at beginning of year $ 20,359,744 $ 19,524,706
Increase in pension obligations
Interest on pension obligations 1,199,486 1,229,305
Benefits accrued
Service accrual 560,615 556,310
Transfer of service from other plans 90,748 103,670
Past service buybacks 28,313 31,975
Changes in actuarial assumptions (Note 6) 1,155,601 –
Total increase 3,034,763 1,921,260
Decrease in pension obligations
Benefits paid 1,080,305 1,023,109
Experience gains 419,996 30,093
Changes in actuarial assumptions (Note 6) – 33,020
Total decrease 1,500,301 1,086,222
Net increase in pension obligations 1,534,462 835,038
Pension obligations, at end of year $ 21,894,206 $ 20,359,744
See accompanying notes
3-36 PUBLIC ACCOUNTS, 2013-2014
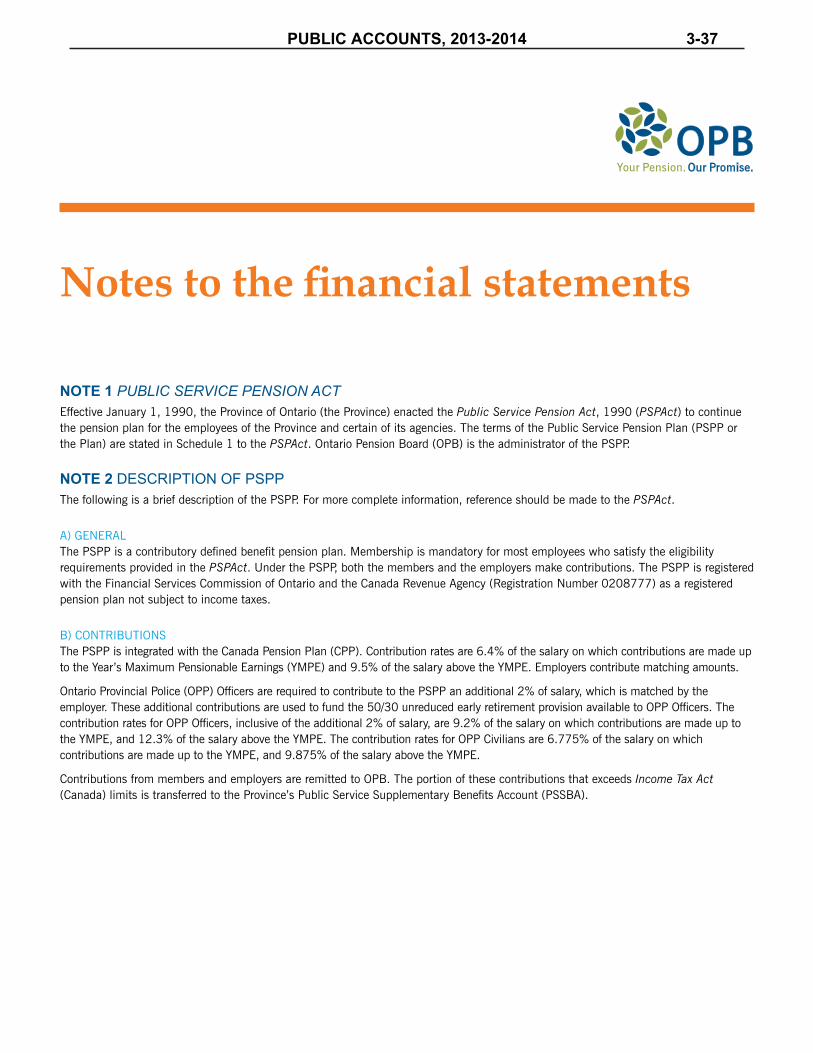
Notes to the financial statements
NOTE 1 PUBLIC SERVICE PENSION ACTEffective January 1, 1990, the Province of Ontario (the Province) enacted the Public Service Pension Act, 1990 (PSPAct) to continue the pension plan for the employees of the Province and certain of its agencies. The terms of the Public Service Pension Plan (PSPP or the Plan) are stated in Schedule 1 to the PSPAct. Ontario Pension Board (OPB) is the administrator of the PSPP.
NOTE 2 DESCRIPTIONOFPSPPThe following is a brief description of the PSPP. For more complete information, reference should be made to the PSPAct.
A) GENERALThe PSPP is a contributory defined benefit pension plan. Membership is mandatory for most employees who satisfy the eligibility requirements provided in the PSPAct. Under the PSPP, both the members and the employers make contributions. The PSPP is registered with the Financial Services Commission of Ontario and the Canada Revenue Agency (Registration Number 0208777) as a registered pension plan not subject to income taxes.
B) CONTRIBUTIONSThe PSPP is integrated with the Canada Pension Plan (CPP). Contribution rates are 6.4% of the salary on which contributions are made up to the Year’s Maximum Pensionable Earnings (YMPE) and 9.5% of the salary above the YMPE. Employers contribute matching amounts.
Ontario Provincial Police (OPP) Officers are required to contribute to the PSPP an additional 2% of salary, which is matched by the employer. These additional contributions are used to fund the 50/30 unreduced early retirement provision available to OPP Officers. The contribution rates for OPP Officers, inclusive of the additional 2% of salary, are 9.2% of the salary on which contributions are made up to the YMPE, and 12.3% of the salary above the YMPE. The contribution rates for OPP Civilians are 6.775% of the salary on which contributions are made up to the YMPE, and 9.875% of the salary above the YMPE.
Contributions from members and employers are remitted to OPB. The portion of these contributions that exceeds Income Tax Act (Canada) limits is transferred to the Province’s Public Service Supplementary Benefits Account (PSSBA).
PUBLIC ACCOUNTS, 2013-2014 3-37

C) PENSIONS A pension is payable at age 65 (or at age 60 for some members with pre-1966 pension credits) based on the number of years of credit in the PSPP multiplied by 2% of the average salary during the best consecutive 60-month period, less an offset for integration with the CPP at age 65. An unreduced pension can be received before age 65 if the member’s age and years of credit total 90 (Factor 90) or when the member reaches age 60 and has 20 or more years of credit. In 2009, the PSPP was amended to permit the Association of Management, Administrative and Professional Crown Employees of Ontario (AMAPCEO) members who are deemed to be surplus by their employer to retire upon attaining Factor 80. To qualify, certain conditions must be satisfied by both the employer and the member. The surplus program for AMAPCEO was extended to March 31, 2014.
OPP Officers are eligible for a pension payable based on the average salary during the best 36-month period. Likewise, OPP Civilians are eligible for a pension payable based on the average salary during the best 48-month period. In addition, OPP Officers are eligible for an unreduced pension after attaining age 50 with 30 years of credit.
D) DEATH BENEFITS Upon the death of the member or retired member, benefits may be payable to a surviving eligible spouse, eligible children, a designated beneficiary or the member’s or retired member’s estate.
E) DISABILITY PENSIONSBased on meeting all eligibility criteria, a disability pension may be available to members with a minimum of 10 years of credit in the PSPP. The amount of the disability pension is dependent on years of credit and average salary.
F) TERMINATION PAYMENTSMembers terminating employment before age 55 who are eligible for a deferred pension may be entitled to transfer the commuted value of the pension to a locked-in registered retirement savings arrangement, to transfer to another pension plan, or to purchase a life annuity.
G) ESCALATION OF BENEFITSCurrent pensions and deferred pension benefits are increased for inflation based on the Consumer Price Index to a maximum of 8% in any one year. Any inflation above 8% in any one year is applied to increase the pension in subsequent years when the adjustment is less than 8%.
NOTE 3 SUMMARYOFSIGNIFICANTACCOUNTINGPOLICIES
BASIS OF PRESENTATIONThe financial statements are prepared in accordance with Canadian accounting standards for pension plans and present the position of the PSPP as a separate entity independent of the employers and Plan members.
In accordance with Section 4600, Pension Plans, of the Chartered Professional Accountants of Canada (CPA Canada) (formerly, the Canadian Institute of Chartered Accountants) Handbook, Canadian accounting standards for private enterprises in Part II of the CPA Canada Handbook have been chosen for accounting policies that do not relate to the investment portfolio or pension obligations to the extent that those standards do not conflict with the requirements of Section 4600.
A) USE OF ESTIMATESThe preparation of financial statements in conformity with Canadian accounting standards for pension plans requires management to make estimates and assumptions that affect the reported amounts of assets and liabilities and disclosure of contingent assets and liabilities at the date of the financial statements and the reported amounts on the statements of changes in net assets available for benefits and changes in pension obligations during the reporting period. Actual results could differ from those estimates.
3-38 PUBLIC ACCOUNTS, 2013-2014
B) INVESTMENTS Investments are stated at fair value, including accrued income. For traded investments, fair value is the amount of consideration that would be agreed upon in an arm’s length transaction between knowledgeable, willing parties who are under no compulsion to act.
Fair value of investments is determined as follows:
(i) Short-term investments are recorded at cost, which, together with accrued interest or discount earned, approximates fair value.
(ii) Special Province of Ontario Debentures (the Special Debentures), bonds and real estate debt are valued at quoted market prices, where available. For those debt instruments for which quoted market prices are not available, estimated values are calculated using discounted cash flows based on current market yields and comparable securities, as appropriate.
(iii) Equities are valued at quoted market prices at closing.
(iv) Pooled fund values for publicly traded securities are supplied by the fund administrators based upon fair value quotations.
(v) Derivative financial instruments consisting of foreign exchange forward and futures contracts are recorded at fair value using year-end market prices.
(vi) Real estate, consisting primarily of income-producing properties, and participating mortgages are valued at estimated fair value determined annually by independent appraisals. For properties acquired and held for less than six months, the fair value of such properties usually approximates the purchase price.
(vii) Private market and alternative investments, which include infrastructure, private equity, private debt and real estate funds, are valued using the most recently available financial information provided by the fund administrator and adjusted for any transactions during the interim period up to the reporting date of these financial statements.
Investment transactions are recorded as of the trade date, which is the date upon which the substantial risks and rewards have been transferred. Interest is recognized on an accrual basis when earned. Dividend income is recognized on the ex-dividend date. Distributions from investments in pooled funds are recognized when declared by the fund administrator. Since real estate is valued on a fair value basis, depreciation and amortization are not recorded. Gains or losses on the sale of investments are recognized when OPB has transferred to the purchaser the significant risks and rewards of ownership of the investment, the purchaser has made a substantial commitment demonstrating its intent to honour its obligation, and collection of any additional consideration is reasonably assured. Income from participating mortgages is accrued at the rate stated in the instrument, and any participation income is recognized on an accrual basis. Net investment income (loss) also includes changes in fair values, which represent realized gains and losses from the sale of investments and unrealized gains and losses determined from the change in the difference between cost and fair value at year-end, including appraisal and fair value adjustments on real estate, private market and alternative investments, and real estate debt. Transaction costs are expensed as incurred.
C) PENSION OBLIGATIONSPension obligations are determined based on an actuarial valuation prepared by an independent firm of actuaries and accounted for under the immediate recognition approach. Under this approach, the pension obligations are based on an actuarial valuation report prepared for funding purposes. This valuation uses the projected benefit method pro-rated on service and management’s best estimate of various economic and non-economic assumptions.
D) CONTRIBUTIONSContributions due to the PSPP at year-end are recorded as receivable. Transfers into the Plan and purchases of prior service are recorded after cash is received and the transfer or purchase transaction is completed.
E) CAPITAL ASSETSCapital assets are carried at cost less accumulated depreciation. Depreciation is provided on a straight-line basis over the estimated useful lives of the capital assets as follows:
Computer equipment 3 yearsLeasehold improvements Remaining term of leaseFurniture and fixtures 10 years
F) FOREIGN CURRENCY TRANSLATIONForeign currency transactions are translated into Canadian dollars at the rates of exchange prevailing at the dates of the transactions. The fair values of investments and cash balances denominated in foreign currencies are translated at the rates in effect at year-end.
PUBLIC ACCOUNTS, 2013-2014 3-39
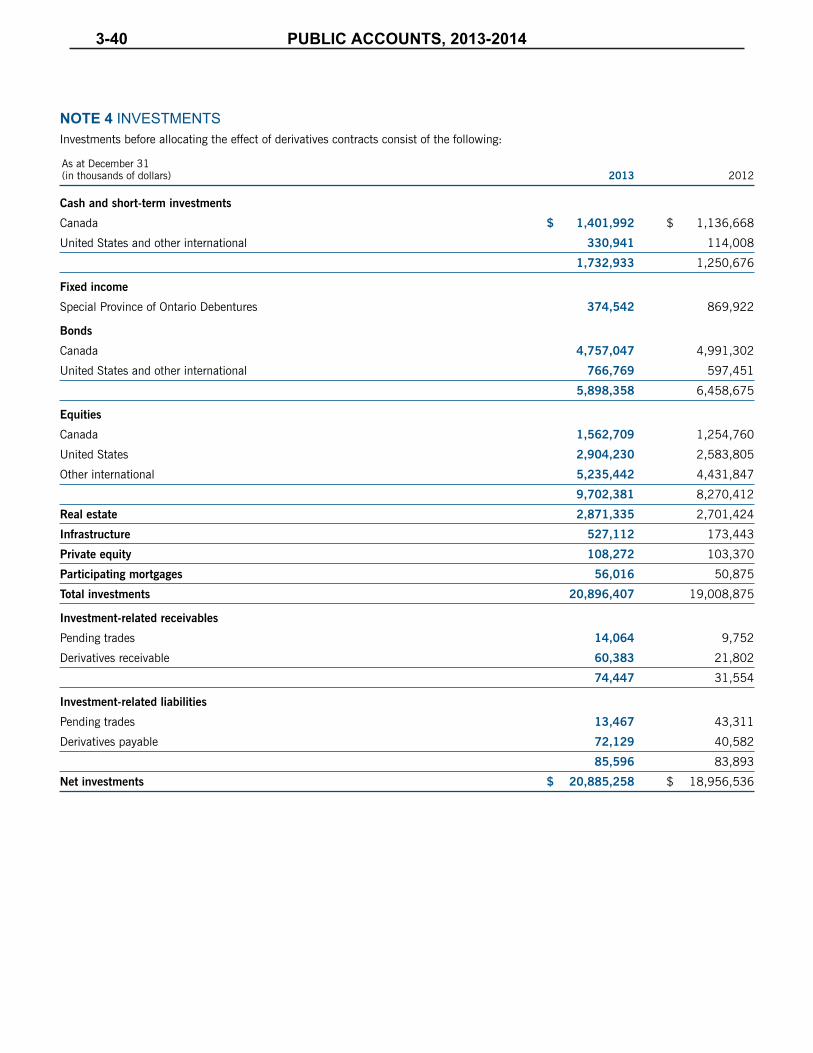
NOTE 4 INVESTMENTSInvestments before allocating the effect of derivatives contracts consist of the following:
As at December 31 (in thousands of dollars) 2013 2012
Cash and short-term investments
Canada $ 1,401,992 $ 1,136,668
United States and other international 330,941 114,008
1,732,933 1,250,676
Fixed income
Special Province of Ontario Debentures 374,542 869,922
Bonds
Canada 4,757,047 4,991,302
United States and other international 766,769 597,451
5,898,358 6,458,675
Equities
Canada 1,562,709 1,254,760
United States 2,904,230 2,583,805
Other international 5,235,442 4,431,847
9,702,381 8,270,412
Real estate 2,871,335 2,701,424
Infrastructure 527,112 173,443
Private equity 108,272 103,370
Participating mortgages 56,016 50,875
Total investments 20,896,407 19,008,875
Investment-related receivables
Pending trades 14,064 9,752
Derivatives receivable 60,383 21,802
74,447 31,554
Investment-related liabilities
Pending trades 13,467 43,311
Derivatives payable 72,129 40,582
85,596 83,893
Net investments $ 20,885,258 $ 18,956,536
3-40 PUBLIC ACCOUNTS, 2013-2014

A) ASSET MIXThe Plan’s Statement of Investment Policies and Procedures (SIP&P) provides guidelines as to the appropriate mix of investments. As at December 31, 2013 and 2012, the investments were allocated as follows in comparison to the asset mix ranges and targets as specified in the SIP&P:
Asset Allocation %
Total Plan as at SIP&P Target as at SIP&P Range
Asset Categories Dec. 31, 2013 Dec. 31, 2012 Dec. 31, 2013 Dec. 31, 2012
Cash and equivalents 8.0% 6.3% 2.0% 2.0% 0%–10%
Fixed income 28.2% 34.1% 31.0% 34.5% 8%–40%
Real return bonds 0.0% 0.0% 2.0% 1.0% 0%–10%
Canadian equities 7.6% 6.6% 10.5% 11.0% 5%–15%
Foreign developed equities 23.7% 21.6% 19.0% 21.0% 8%–26%
Foreign developing equities 15.5% 15.5% 15.0% 15.0% 10%–20%
Real estate 14.0% 14.5% 18.0% 15.0% 10%–30%
Infrastructure 2.5% 0.9% 2.0% 0.5% 0%–10%
Private equity 0.5% 0.5% 0.5% 0.0% 0%–5%
Total investments 100.0% 100.0% 100.0% 100.0%
As at December 31, 2013 and 2012, the asset mix of the Plan’s investments was within the acceptable ranges as specified in the SIP&P.
B) FINANCIAL INSTRUMENTS RISKThe Plan is subject to financial risks as a result of its investing activities that could impact its cash flows, income, and assets available to meet benefit obligations. These risks include market risk (including interest rate risk, foreign currency risk and other price risk), credit risk and liquidity risk. OPB manages these risks in accordance with its SIP&P, which prescribes the asset mix policy, diversification requirements, performance expectations, limits on individual investments, valuation standards, and guidelines for the management of the Plan.
Market risk – Market risk is the risk that the fair value or future cash flows of an investment will fluctuate because of changes in market prices. Market risk comprises the following:
(i) Interest rate risk – Interest rate risk refers to the effect on the fair value of the Plan’s assets and liabilities due to fluctuations in market interest rates. The value of the Plan’s investments is affected by changes in nominal and real interest rates. Pension liabilities are exposed to fluctuations in long-term interest rates and inflation. The Plan has established an asset mix policy that balances interest-sensitive investments with other investments. OPB’s fixed income investments have the most significant exposure to interest rate risk. Duration and weighting for the fixed income portfolio are actively managed. Modified duration is a measure of the sensitivity of the price of a fixed income instrument to a change in interest rates. Given the Plan’s modified duration of 5.9 years at December 31, 2013 (2012 – 5.9 years), a parallel shift in the yield curve of +/-1% would result in an impact on the net investments of $325 million (2012 – $386 million), with all other variables held constant. In practice, actual results may differ materially from this sensitivity analysis. See the schedule of Fixed income maturities for further information.
(ii) Foreign currency risk – Foreign currency exposure arises from the Plan holding foreign exchange denominated investments and entering into contracts that provide exposure to currencies other than the Canadian dollar. Fluctuations in the value of the Canadian dollar against these foreign currencies can have an impact on the fair value of investments. The Plan hedges a portion of its foreign currency exposure through the use of foreign exchange forward contracts, which are accounted for at fair value. The total currency exposure, the impact of foreign exchange forward contracts and the net currency exposure are as follows on the next page.
PUBLIC ACCOUNTS, 2013-2014 3-41

Foreign Foreign Exchange Exchange As at December 31, 2013 Gross Contracts Contracts Net (in thousands of dollars) Exposure Receivable Payable Exposure
U.S. Dollar $ 4,993,124 $ 843,628 $ (3,605,114) $ 2,231,638 Hong Kong Dollar 565,999 724 (8,895) 557,828South Korean Won 339,560 5,802 (5,931) 339,431 Brazilian Real 227,400 8,810 (292) 235,918
Indian Rupee 229,405 – – 229,405South African Rand 178,060 505 (6,911) 171,654Chinese Renminbi 167,958 – – 167,958
Other 2,665,366 165,215 (1,524,444) 1,306,137
Total foreign 9,366,872 1,024,684 (5,151,587) 5,239,969Canadian dollar 11,577,300 4,802,358 (734,369) 15,645,289 $ 20,944,172 $ 5,827,042 $ (5,885,956) $ 20,885,258
Foreign Foreign Exchange Exchange As at December 31, 2012 Gross Contracts Contracts Net(in thousands of dollars) Exposure Receivable Payable Exposure
U.S. Dollar $ 4,152,117 $ 1,246,774 $ (3,372,643) $ 2,026,248
Hong Kong Dollar 513,577 4,938 (21,356) 497,159
South Korean Won 288,402 217 (241) 288,378
Brazilian Real 245,594 8,033 (107) 253,520
South African Rand 179,237 995 (6,632) 173,600
Indian Rupee 159,145 8,885 – 168,030
Taiwan Dollar 138,783 – – 138,783
Turkish Lira 148,378 – (10,912) 137,466
Other 1,890,712 137,913 (1,107,898) 920,727
Total foreign 7,715,945 1,407,755 (4,519,789) 4,603,911
Canadian dollar 11,265,362 4,245,318 (1,158,055) 14,352,625
$ 18,981,307 $ 5,653,073 $ (5,677,844) $ 18,956,536
The impact of a 5% absolute change in foreign exchange rates compared to the Canadian dollar, holding all other variables constant, is 5% of the net exposure of the impacted currency, as follows:
Change in Net Assets Available for Benefits as of
Change in December 31, 2013 December 31, 2012 Exchange Rates (in thousands of dollars) (in thousands of dollars)
U.S. Dollar + / - 5% + / - $ 111,582 + / - $ 101,312
Hong Kong Dollar + / - 5% + / - 27,891 + / - 24,858
South Korean Won + / - 5% + / - 16,972 + / - 14,419
Brazilian Real + / - 5% + / - 11,796 + / - 12,676
Indian Rupee + / - 5% + / - 11,470 + / - 8,402
South African Rand + / - 5% + / - 8,583 + / - 8,680
Chinese Renminbi + / - 5% + / - 8,398 + / - 318
Other + / - 5% + / - 65,307 + / - 59,531
Total + / - 5% + / - 261,999 + / - 230,196
3-42 PUBLIC ACCOUNTS, 2013-2014
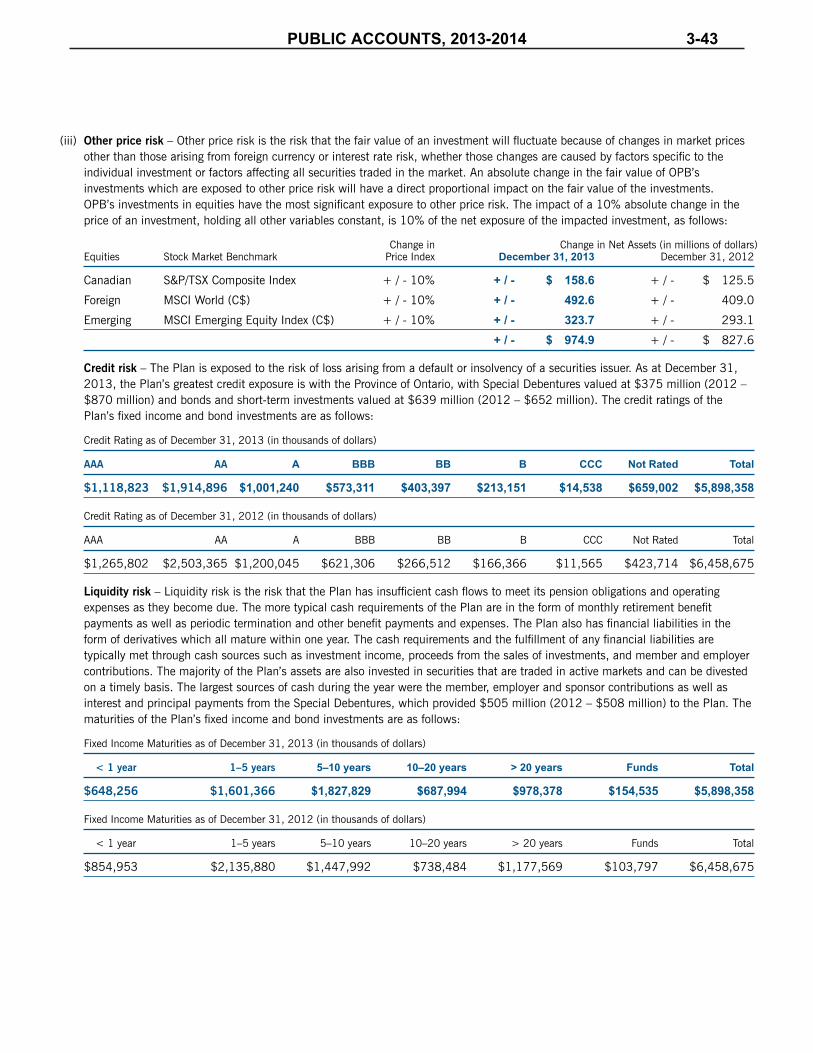
(iii) Other price risk – Other price risk is the risk that the fair value of an investment will fluctuate because of changes in market prices other than those arising from foreign currency or interest rate risk, whether those changes are caused by factors specific to the individual investment or factors affecting all securities traded in the market. An absolute change in the fair value of OPB’s investments which are exposed to other price risk will have a direct proportional impact on the fair value of the investments. OPB’s investments in equities have the most significant exposure to other price risk. The impact of a 10% absolute change in the price of an investment, holding all other variables constant, is 10% of the net exposure of the impacted investment, as follows:
Change in Change in Net Assets (in millions of dollars)Equities Stock Market Benchmark Price Index December 31, 2013 December 31, 2012
Canadian S&P/TSX Composite Index + / - 10% + / - $ 158.6 + / - $ 125.5
Foreign MSCI World (C$) + / - 10% + / - 492.6 + / - 409.0
Emerging MSCI Emerging Equity Index (C$) + / - 10% + / - 323.7 + / - 293.1
+ / - $ 974.9 + / - $ 827.6
Credit risk – The Plan is exposed to the risk of loss arising from a default or insolvency of a securities issuer. As at December 31, 2013, the Plan’s greatest credit exposure is with the Province of Ontario, with Special Debentures valued at $375 million (2012 – $870 million) and bonds and short-term investments valued at $639 million (2012 – $652 million). The credit ratings of the Plan’s fixed income and bond investments are as follows:
Credit Rating as of December 31, 2013 (in thousands of dollars)
AAA AA A BBB BB B CCC Not Rated Total
$1,118,823 $1,914,896 $1,001,240 $573,311 $403,397 $213,151 $14,538 $659,002 $5,898,358
Credit Rating as of December 31, 2012 (in thousands of dollars)
AAA AA A BBB BB B CCC Not Rated Total
$1,265,802 $2,503,365 $1,200,045 $621,306 $266,512 $166,366 $11,565 $423,714 $6,458,675
Liquidity risk – Liquidity risk is the risk that the Plan has insufficient cash flows to meet its pension obligations and operating expenses as they become due. The more typical cash requirements of the Plan are in the form of monthly retirement benefit payments as well as periodic termination and other benefit payments and expenses. The Plan also has financial liabilities in the form of derivatives which all mature within one year. The cash requirements and the fulfillment of any financial liabilities are typically met through cash sources such as investment income, proceeds from the sales of investments, and member and employer contributions. The majority of the Plan’s assets are also invested in securities that are traded in active markets and can be divested on a timely basis. The largest sources of cash during the year were the member, employer and sponsor contributions as well as interest and principal payments from the Special Debentures, which provided $505 million (2012 – $508 million) to the Plan. The maturities of the Plan’s fixed income and bond investments are as follows:
Fixed Income Maturities as of December 31, 2013 (in thousands of dollars)
< 1 year 1–5 years 5–10 years 10–20 years > 20 years Funds Total
$648,256 $1,601,366 $1,827,829 $687,994 $978,378 $154,535 $5,898,358
Fixed Income Maturities as of December 31, 2012 (in thousands of dollars)
< 1 year 1–5 years 5–10 years 10–20 years > 20 years Funds Total
$854,953 $2,135,880 $1,447,992 $738,484 $1,177,569 $103,797 $6,458,675
PUBLIC ACCOUNTS, 2013-2014 3-43
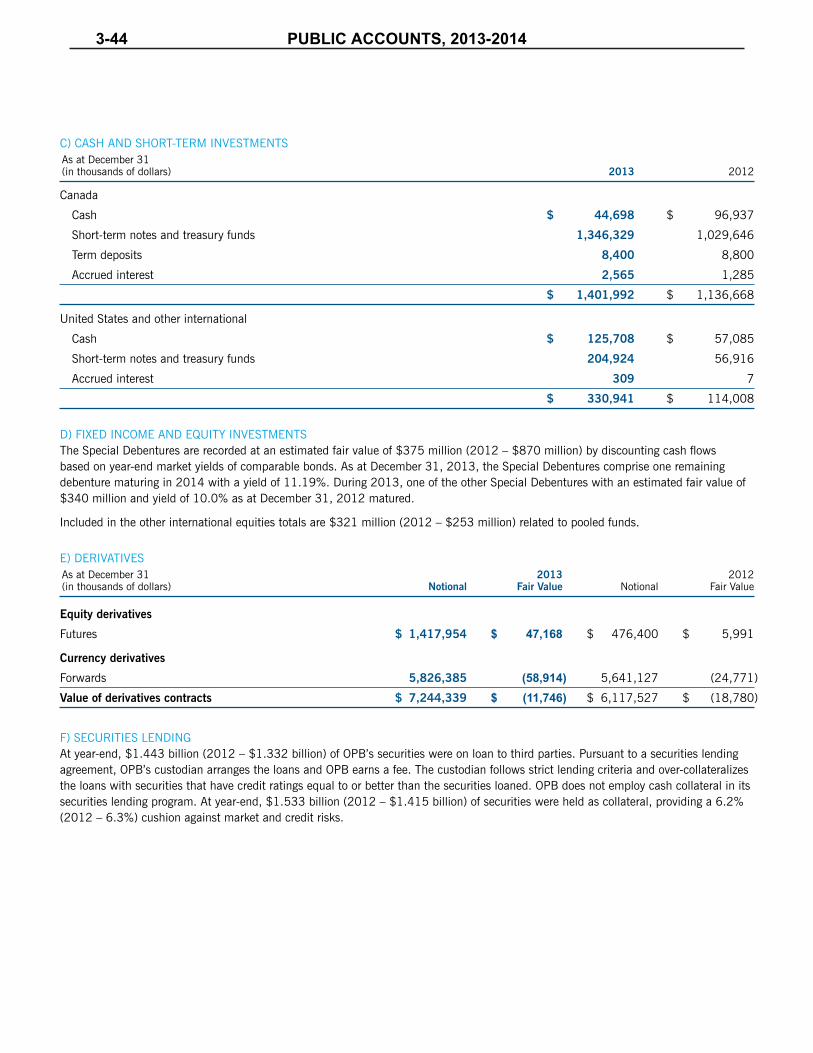
C) CASH AND SHORT-TERM INVESTMENTSAs at December 31 (in thousands of dollars) 2013 2012
Canada
Cash $ 44,698 $ 96,937
Short-term notes and treasury funds 1,346,329 1,029,646
Term deposits 8,400 8,800
Accrued interest 2,565 1,285
$ 1,401,992 $ 1,136,668
United States and other international
Cash $ 125,708 $ 57,085
Short-term notes and treasury funds 204,924 56,916
Accrued interest 309 7
$ 330,941 $ 114,008
D) FIXED INCOME AND EQUITY INVESTMENTSThe Special Debentures are recorded at an estimated fair value of $375 million (2012 – $870 million) by discounting cash flows based on year-end market yields of comparable bonds. As at December 31, 2013, the Special Debentures comprise one remaining debenture maturing in 2014 with a yield of 11.19%. During 2013, one of the other Special Debentures with an estimated fair value of $340 million and yield of 10.0% as at December 31, 2012 matured.
Included in the other international equities totals are $321 million (2012 – $253 million) related to pooled funds.
E) DERIVATIVESAs at December 31 2013 2012 (in thousands of dollars) Notional Fair Value Notional Fair Value
Equity derivatives
Futures $ 1,417,954 $ 47,168 $ 476,400 $ 5,991
Currency derivatives
Forwards 5,826,385 (58,914) 5,641,127 (24,771)
Value of derivatives contracts $ 7,244,339 $ (11,746) $ 6,117,527 $ (18,780)
F) SECURITIES LENDINGAt year-end, $1.443 billion (2012 – $1.332 billion) of OPB’s securities were on loan to third parties. Pursuant to a securities lending agreement, OPB’s custodian arranges the loans and OPB earns a fee. The custodian follows strict lending criteria and over-collateralizes the loans with securities that have credit ratings equal to or better than the securities loaned. OPB does not employ cash collateral in its securities lending program. At year-end, $1.533 billion (2012 – $1.415 billion) of securities were held as collateral, providing a 6.2% (2012 – 6.3%) cushion against market and credit risks.
3-44 PUBLIC ACCOUNTS, 2013-2014

G) FAIR VALUESCanadian accounting standards for pension plans require disclosure of a three-level hierarchy for fair value measurements based on the transparency of inputs to the valuation of an asset or liability as of the financial statement date. The three levels are defined as follows:
Level 1: Fair value is based on quoted market prices in active markets for identical assets or liabilities. Level 1 assets and liabilities generally include equity securities traded in an active exchange market.
Level 2: Fair value is based on observable inputs other than Level 1 prices, such as quoted market prices for similar (but not identical) assets or liabilities in active markets, quoted market prices for identical assets or liabilities in markets that are not active, and other inputs that are observable or can be corroborated by observable market data for substantially the full term of the assets or liabilities. Level 2 assets and liabilities include debt securities with quoted prices that are traded less frequently than exchange-traded instruments and derivative contracts whose value is determined using a pricing model with inputs that are observable in the market or can be derived principally from or corroborated by observable market data. This category generally includes mutual and pooled funds; hedge funds; Government of Canada, provincial and other government bonds; Canadian corporate bonds; and certain derivative contracts.
Level 3: Fair value is based on non-observable inputs that are supported by little or no market activity and that are significant to the fair value of the assets or liabilities. This category generally includes investments with underlying real estate properties, private equity investments and securities that have liquidity restrictions.
The following tables present the level within the fair value hierarchy for each of the financial assets and liabilities measured at fair value. The tables exclude accrued income, other assets, and other liabilities that are valued at their carrying amount, which represents a reasonable approximation of fair value due to their short-term nature.
As at December 31, 2013 Total Fair (in thousands of dollars) Level 1 Level 2 Level 3 Value
Financial assets
Short-term investments
Canada $ – $ 1,354,729 $ – $ 1,354,729 United States and other international – 204,923 – 204,923Fixed income
Special Province of Ontario Debentures – 350,694 – 350,694Bonds
Canada – 4,292,164 430,553 4,722,717 United States and other international – 742,099 11,264 753,363Equities
Canada 1,559,019 – – 1,559,019 United States 2,900,429 – – 2,900,429 Other international 4,905,366 321,448 – 5,226,814Futures 47,168 – – 47,168Participating mortgages – – 56,016 56,016Real estate – – 2,871,335 2,871,335Private equity – – 108,272 108,272Infrastructure – – 527,112 527,112Forward exchange contracts – 13,215 – 13,215 $ 9,411,982 $ 7,279,272 $ 4,004,552 $ 20,695,806
Financial liabilities
Forward exchange contracts $ – $ (72,129) $ – $ (72,129)
PUBLIC ACCOUNTS, 2013-2014 3-45

As at December 31, 2012 Total Fair (in thousands of dollars) Level 1 Level 2 Level 3 Value
Financial assets
Short-term investments
Canada $ – $ 1,038,446 $ – $ 1,038,446
United States and other international – 56,915 – 56,915
Fixed income
Special Province of Ontario Debentures – 823,008 – 823,008
Bonds
Canada – 4,586,641 366,896 4,953,537
United States and other international – 586,434 – 586,434
Equities
Canada 1,251,101 – – 1,251,101
United States 2,581,093 – – 2,581,093
Other international 4,173,980 252,515 – 4,426,495
Futures 5,991 – – 5,991
Participating mortgages – – 50,875 50,875
Real estate – – 2,701,424 2,701,424
Private equity – – 103,370 103,370
Infrastructure – – 173,443 173,443
Forward exchange contracts – 15,811 – 15,811
$ 8,012,165 $ 7,359,770 $ 3,396,008 $ 18,767,943
Financial liabilities
Forward exchange contracts $ – $ (40,582) $ – $ (40,582)
There were no significant transfers between Levels 1, 2, or 3 during the years ended December 31, 2013 and 2012.
3-46 PUBLIC ACCOUNTS, 2013-2014

The following tables present a reconciliation of all Level 3 assets and liabilities measured at fair value for the years ended December 31, 2013 and 2012.
Fair Value Fair Value as at as at January 1, Transfers Issuance Fair Value December 31, (in thousands of dollars) 2013 In/(Out) Acquisitions Dispositions of Debt Changes 2013
Financial assets
Bonds
Canada $ 366,896 $ – $ 85,063 $ (5,102) $ – $ (16,304) $ 430,553 Other international – – 10,892 – – 372 11,264Participating mortgages 50,875 – – – – 5,141 56,016Real estate 2,701,424 – 795,314 (478,954) (250,000) 103,551 2,871,335Private equity 103,370 – 10,637 (15,183) – 9,448 108,272Infrastructure 173,443 – 346,723 (27,585) – 34,531 527,112 $ 3,396,008 $ – $ 1,248,629 $ (526,824) $ (250,000) $ 136,739 $ 4,004,552
Fair Value Fair Value as at as at January 1, Transfers Issuance Fair Value December 31, (in thousands of dollars) 2012 In/(Out) Acquisitions Dispositions of Debt Changes 2012
Financial assets
Bonds
Canada $ 260,661 $ (5,085) $ 101,869 $ (3,583) $ – $ 13,034 $ 366,896
Equities
Canada 194 – – – – (194) –
Participating mortgages 50,155 – – – – 720 50,875
Real estate 2,654,157 – 527,533 (200,402) (500,000) 220,136 2,701,424
Private equity – – 105,354 (4,119) – 2,135 103,370
Infrastructure 4,256 – 165,372 (996) – 4,811 173,443
$ 2,969,423 $ (5,085) $ 900,128 $ (209,100) $ (500,000) $ 240,642 $ 3,396,008
H) COMMITMENTS AND GUARANTEESAs at December 31, 2013, OPB has provided funding commitments for certain investments in the amount of $1,427 million (2012 – $966 million) of which $826 million (2012 – $500 million) has been advanced to date.
OPB has provided a guarantee for the payment of principal and interest on $750 million in debentures, of which $250 million and $500 million were issued in 2013 and 2012, respectively, by OPB Finance Trust, a trust established for the benefit of OPB and its subsidiaries. Three series of debentures were issued:
1. $350 million, Series A, 30-year debentures due 2042, with interest payable semi-annually at 3.89%.
2. $150 million, Series B, 50-year debentures due 2062, with interest payable semi-annually at 3.87%.
3. $250 million, Series C, 10-year debentures due 2023, with interest payable semi-annually at 2.90%.
The proceeds from the issuance of the 30-year and 50-year debentures were loaned to two OPB real estate subsidiaries. In turn, these real estate companies repaid amounts owed to OPB.
The proceeds from the issuance of the 10-year debentures were loaned to a real estate trust established for the benefit of OPB.
PUBLIC ACCOUNTS, 2013-2014 3-47

NOTE 5 CAPITALASSETS 2013 As at December 31 Accumulated Net Book (in thousands of dollars) Cost Depreciation Value
Computer equipment $ 3,712 $ 3,175 $ 537
Furniture and fixtures 2,460 1,345 1,115
Leasehold improvements 1,535 677 858
Total capital assets $ 7,707 $ 5,197 $ 2,510
2012 As at December 31 Accumulated Net Book (in thousands of dollars) Cost Depreciation Value
Computer equipment $ 3,606 $ 2,783 $ 823
Furniture and fixtures 2,457 1,110 1,347
Leasehold improvements 1,529 535 994
Total capital assets $ 7,592 $ 4,428 $ 3,164
NOTE 6 PENSIONOBLIGATIONS
A) ACCOUNTING BASISThe value of pension obligations of $21.894 billion (2012 – $20.360 billion) is an estimate of pension benefit obligations accrued to date for members and retired members accounted for under the immediate recognition approach. The accounting valuation is determined by applying best estimate assumptions and the projected benefit method (pro-rated on service), as required under Canadian accounting standards for pension plans. Under this method, the accrued pension benefits are based on service earned up to the reporting date. The accrued pension benefits as at December 31, 2013 were computed by extrapolating data used for the December 31, 2012 funding valuation prepared by the independent actuary for management purposes.
Actuarial assumptions – The actuarial assumptions used in determining the value of accrued pension benefits reflect management’s best estimate of future economic and non-economic events. The primary economic assumptions, as at December 31, are:
2013 2012
Investment return 5.95% 5.95%
Inflation 2.10% 2.10%
Real rate of return 3.85% 3.85%
Salary increases 3.10% + promotional scale 3.10% + promotional scale
The non-economic assumptions include mortality, withdrawal and retirement rates. During 2013, the changes in actuarial assumptions resulted in an increase of $1.156 billion (2012 – $33 million decrease) to the Plan’s pension obligations. The use of updated mortality tables accounted for most of the 2013 increase.
B) FUNDING BASIS The funding valuation of the PSPP is based on methods required under the PSPAct and the Pension Benefits Act (Ontario) (PBA). The PBA and the Income Tax Act (Canada) require that an actuarial funding valuation of the PSPP be completed and filed with the regulatory authorities at least every three years. The most recent filing was a funding valuation as at December 31, 2010, prepared by Aon Hewitt, which disclosed a funding shortfall of $1.191 billion on a going-concern basis. The next funding valuation that is required to be filed will be as at December 31, 2013. A funding valuation was prepared for management purposes as at December 31, 2012 by Aon Hewitt, which disclosed a funding shortfall of $1.300 billion on a going-concern basis.
The funding valuation is used as a basis for funding and Plan design decisions. Differences between the accounting and funding valuation results may arise due to such factors as variances between estimated and actual data, economic and demographic assumptions or conditions, actuarial methodology, and subsequent events.
3-48 PUBLIC ACCOUNTS, 2013-2014

NOTE 7 DEFICITIn these financial statements, the amount by which net assets available for benefits is less than the pension obligations is represented by the deficit, which as at December 31, 2013 was $979 million (2012 – $1.368 billion).
NOTE 8 NETINVESTMENTINCOMEFor the year ended December 31 Investment Fair Value Investment Fair Value
(in thousands of dollars) Income1 Changes2 2013 Total Income1 Changes2 2012 Total
Cash and short-term investments
Canada $ 15,601 $ (2,666) $ 12,935 $ 10,478 $ (1,201) $ 9,277
United States and other international 1,830 (203,571) (201,741) 2 34,326 34,328
17,431 (206,237) (188,806) 10,480 33,125 43,605
Fixed income
Special Province of Ontario Debentures 61,655 (52,322) 9,333 105,395 (91,567) 13,828
Bonds
Canada 209,894 (171,680) 38,214 196,268 85,768 282,036
United States and other international 46,371 (796) 45,575 37,984 11,056 49,040
317,920 (224,798) 93,122 339,647 5,257 344,904
Equities
Canada 38,621 336,841 375,462 48,086 124,276 172,362
United States 49,735 796,656 846,391 51,710 250,959 302,669
Other international 117,315 676,722 794,037 109,266 587,262 696,528
205,671 1,810,219 2,015,890 209,062 962,497 1,171,559
Real estate 223,946 103,551 327,497 231,773 220,136 451,909
Infrastructure 3,637 34,531 38,168 (338) 4,811 4,473
Private equity 7,095 9,448 16,543 (5,491) 8,547 3,056
Participating mortgages 1,074 5,141 6,215 1,345 720 2,065
Total investment income $ 776,774 $ 1,531,855 $ 2,308,629 $ 786,478 $ 1,235,093 $ 2,021,571
Investment management and custodial fees (64,462) (57,255)
Net investment income $ 2,244,167 $ 1,964,316
1 Investment income includes interest on cash and short-term investments, fixed income and participating mortgages, dividend income on equities, and real estate operating income.
2 Gains (losses) on cash and short-term investments include foreign exchange contracts.
PUBLIC ACCOUNTS, 2013-2014 3-49

A) INTEREST INCOMEFor the year ended December 31 (in thousands of dollars) 2013 2012
Cash and short-term investments
Canada
Cash $ 2,486 $ 2,452
Short-term notes and treasury funds 13,019 7,973
Term deposits 96 53
$ 15,601 $ 10,478
United States and other international
Cash $ 1,044 $ (22)
Short-term notes and treasury funds 786 23
Term deposits – 1
$ 1,830 $ 2
Earnings from pooled short-term investment funds are included with short-term notes and treasury funds.
B) DIVIDEND INCOME Dividend income includes $8.19 million (2012 – $7.02 million) from pooled equity funds.
C) INVESTMENT FEESFor the year ended December 31 (in thousands of dollars) 2013 2012
Portfolio fund management $ 50,237 $ 42,602
Transaction costs 9,347 9,554
Custodial 3,444 3,654
Real estate 1,434 1,445
$ 64,462 $ 57,255
Transaction costs include commissions and fees on trades. Additional transaction costs included in real estate expense total $0.141 million (2012 – $1.279 thousand).
3-50 PUBLIC ACCOUNTS, 2013-2014

NOTE 9 CONTRIBUTIONSFor the year ended December 31 (in thousands of dollars) 2013 2012
Members
Current service required $ 274,734 $ 276,227
Prior service 24,194 27,395
Total contributions from members 298,928 303,622
Employers
Current service
Regular contributions 274,588 276,383
PSSBA transfer (13,363) (14,930)
For members receiving Long Term Income Protection benefits 10,508 9,948
Prior service 4,120 4,580
275,853 275,981
Sponsor payments
Special payments 127,235 127,235
Additional current service 7,008 6,707
134,243 133,942
Total contributions from employers and sponsor 410,096 409,923
Total contributions $ 709,024 $ 713,545
The contribution requirements are set out in the PSPAct and summarized in Note 2(b).
Members who are receiving benefits on Long Term Income Protection have their contributions to the PSPP paid by their employers.
The Province, as sponsor of the Plan, contributed $127.235 million (2012 – $127.235 million) in Special Payments in 2013 towards the funding shortfall identified in the filed funding valuation as at December 31, 2010. In 2013, the Province made $7.008 million (2012 – $6.707 million) in additional employer current service contributions.
For 2013 and 2012, the contributions to the Plan were made in accordance with the funding requirements as specified by the most recently filed actuarial funding valuation.
There were no required contributions past due as at December 31, 2013 and 2012.
NOTE 10 OPERATINGEXPENSES
PENSION OPERATIONSFor the year ended December 31 (in thousands of dollars) 2013 2012
Staffing costs $ 13,657 $ 12,949
Staff development and support 281 277
Office premises and operations 3,274 3,157
Information technology and project management 5,216 4,475
Professional services 935 969
Communication 241 194
Depreciation 520 465
Board remuneration 92 99
Audit 162 169
$ 24,378 $ 22,754
PUBLIC ACCOUNTS, 2013-2014 3-51

INVESTMENT OPERATIONSFor the year ended December 31 (in thousands of dollars) 2013 2012
Staffing costs $ 9,133 $ 7,507
Staff development and support 223 200
Office premises and operations 2,034 1,925
Information technology and project management 2,195 2,171
Professional services 1,484 1,665
Communication 103 83
Depreciation 249 222
Board remuneration 92 99
Audit 162 169
$ 15,675 $ 14,041
Included in the above operating expenses are:
EXTERNAL AUDIT SERVICESFor the year ended December 31 (in thousands of dollars) 2013 2012
External audit and related services provided to Ontario Pension Board $ 114 $ 104
External audit and related services provided to and recorded by subsidiary operations 319 286
Total fees $ 433 $ 390
ACTUARIAL SERVICESFor the year ended December 31 (in thousands of dollars) 2013 2012
Actuarial services provided to Ontario Pension Board $ 404 $ 391
NOTE 11 CAPITALMANAGEMENTThe funding surpluses or deficits determined periodically through the funding valuations prepared by an independent actuary are defined as the Plan’s capital. The actuary’s funding valuation is used to measure the long-term health of the Plan. The last filed actuarial valuation report for funding purposes was prepared by Aon Hewitt as of December 31, 2010, which disclosed a funding shortfall of $1.191 billion on a going-concern basis and an excess of $784 million on a solvency basis. The date of the next required actuarial valuation for funding purposes is December 31, 2013. The latest actuarial valuation report prepared for management purposes as at December 31, 2012 disclosed a funding shortfall of $1.300 billion on a going-concern basis.
The objective of managing the Plan’s capital is to ensure the Plan is funded to fully pay out the Plan’s benefits. The funding valuation determines the annual minimum contribution levels to eliminate any shortfalls. The Plan’s SIP&P also provides guidance with respect to the investment of the Plan’s assets (see Note 4(a)) in order to assist with the management of any funding excesses or shortfalls. The SIP&P was last amended in December 2011, resulting in the asset mix targets as shown in Note 4(a). The Plan’s rate of return expectation has been set in the SIP&P at a 3.85% real rate of return, net of fees.
NOTE 12 COMPARATIVEFINANCIALSTATEMENTSThe comparative financial statements have been reclassified from statements previously presented to conform to the presentation of the 2013 financial statements.
3-52 PUBLIC ACCOUNTS, 2013-2014
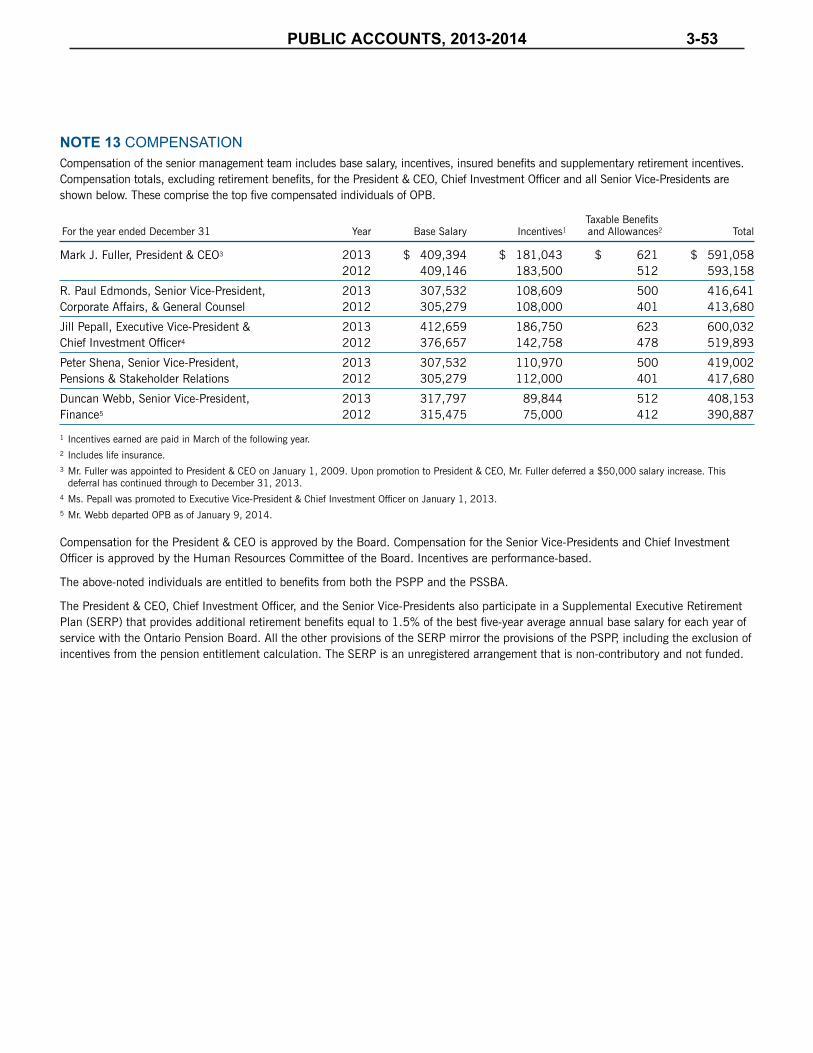
NOTE 13 COMPENSATIONCompensation of the senior management team includes base salary, incentives, insured benefits and supplementary retirement incentives. Compensation totals, excluding retirement benefits, for the President & CEO, Chief Investment Officer and all Senior Vice-Presidents are shown below. These comprise the top five compensated individuals of OPB.
Taxable Benefits For the year ended December 31 Year Base Salary Incentives1 and Allowances2 Total
Mark J. Fuller, President & CEO3 2013 $ 409,394 $ 181,043 $ 621 $ 591,058 2012 409,146 183,500 512 593,158
R. Paul Edmonds, Senior Vice-President, 2013 307,532 108,609 500 416,641Corporate Affairs, & General Counsel 2012 305,279 108,000 401 413,680
Jill Pepall, Executive Vice-President & 2013 412,659 186,750 623 600,032Chief Investment Officer4 2012 376,657 142,758 478 519,893
Peter Shena, Senior Vice-President, 2013 307,532 110,970 500 419,002Pensions & Stakeholder Relations 2012 305,279 112,000 401 417,680
Duncan Webb, Senior Vice-President, 2013 317,797 89,844 512 408,153Finance5 2012 315,475 75,000 412 390,887
1 Incentives earned are paid in March of the following year.2 Includes life insurance. 3 Mr. Fuller was appointed to President & CEO on January 1, 2009. Upon promotion to President & CEO, Mr. Fuller deferred a $50,000 salary increase. This
deferral has continued through to December 31, 2013.4 Ms. Pepall was promoted to Executive Vice-President & Chief Investment Officer on January 1, 2013.5 Mr. Webb departed OPB as of January 9, 2014.
Compensation for the President & CEO is approved by the Board. Compensation for the Senior Vice-Presidents and Chief Investment Officer is approved by the Human Resources Committee of the Board. Incentives are performance-based.
The above-noted individuals are entitled to benefits from both the PSPP and the PSSBA.
The President & CEO, Chief Investment Officer, and the Senior Vice-Presidents also participate in a Supplemental Executive Retirement Plan (SERP) that provides additional retirement benefits equal to 1.5% of the best five-year average annual base salary for each year of service with the Ontario Pension Board. All the other provisions of the SERP mirror the provisions of the PSPP, including the exclusion of incentives from the pension entitlement calculation. The SERP is an unregistered arrangement that is non-contributory and not funded.
PUBLIC ACCOUNTS, 2013-2014 3-53
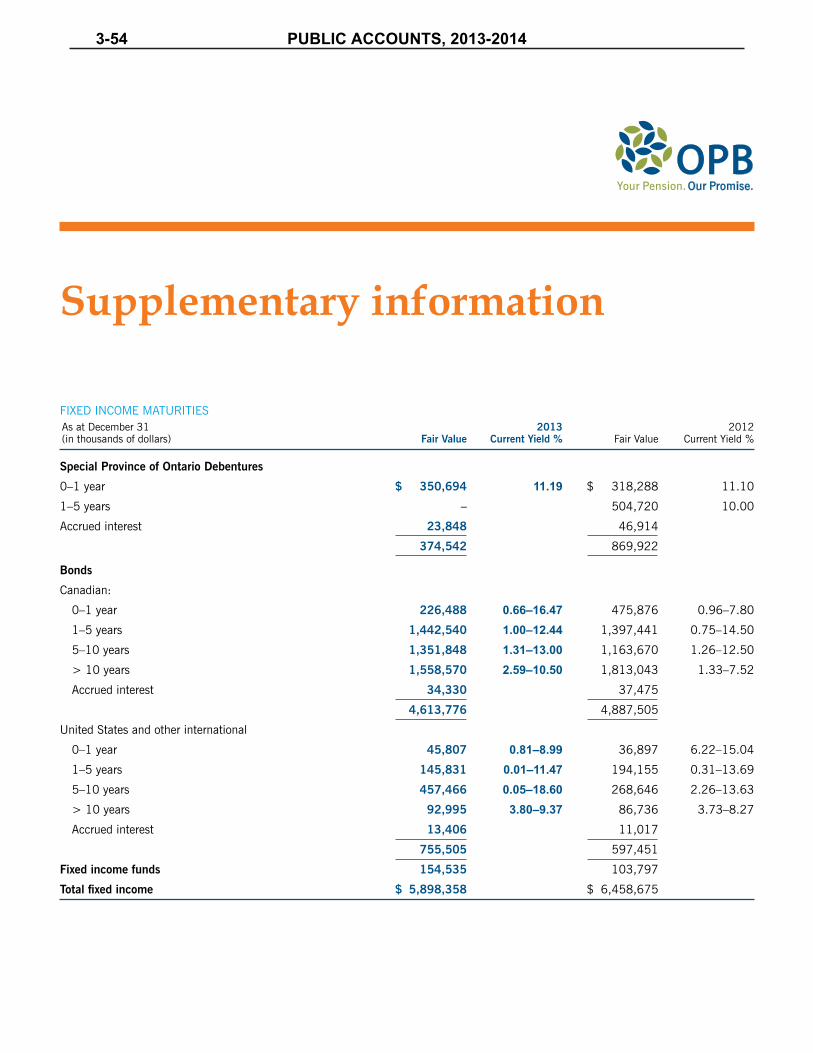
Supplementary information
FIXED INCOME MATURITIESAs at December 31 2013 2012 (in thousands of dollars) Fair Value Current Yield % Fair Value Current Yield %
Special Province of Ontario Debentures
0–1 year $ 350,694 11.19 $ 318,288 11.10
1–5 years – 504,720 10.00
Accrued interest 23,848 46,914
374,542 869,922
Bonds
Canadian:
0–1 year 226,488 0.66–16.47 475,876 0.96–7.80
1–5 years 1,442,540 1.00–12.44 1,397,441 0.75–14.50
5–10 years 1,351,848 1.31–13.00 1,163,670 1.26–12.50
> 10 years 1,558,570 2.59–10.50 1,813,043 1.33–7.52
Accrued interest 34,330 37,475
4,613,776 4,887,505
United States and other international
0–1 year 45,807 0.81–8.99 36,897 6.22–15.04
1–5 years 145,831 0.01–11.47 194,155 0.31–13.69
5–10 years 457,466 0.05–18.60 268,646 2.26–13.63
> 10 years 92,995 3.80–9.37 86,736 3.73–8.27
Accrued interest 13,406 11,017
755,505 597,451
Fixed income funds 154,535 103,797
Total fixed income $ 5,898,358 $ 6,458,675
3-54 PUBLIC ACCOUNTS, 2013-2014

INVESTMENTS OVER $50 MILLIONAs at December 31, 2013 (in thousands of dollars) Maturities Coupon % Fair Value¹
Cash and short-term investments
Canada:
Government of Canada $ 404,209
Province of Ontario 165,287
CIBC 119,681
Royal Bank of Canada 81,264
TD Bank 95,568
Bank of Nova Scotia 92,429
Province of British Columbia 62,898
Province of Alberta 60,351
Province of New Brunswick 55,370
Province of Quebec 53,146
Fixed income
Special Province of Ontario Debentures 2014 11.19 $ 350,694
OPB Investments Inc. (holding company, 100% owned) 305,574
OPB Investments Limited (holding company, 100% owned) 121,855
Bonds
Canada:
Government of Canada 2014–2045 0.75–10.50 $ 531,754
Province of Ontario 2014–2045 1.90–9.50 468,609
Canada Housing Trust No. 1 2014–2023 1.33–4.10 321,396
Province of Quebec 2015–2045 0.00–9.38 166,909
Royal Bank of Canada 2014–2085 0.44–6.82 176,191
Bank of Nova Scotia 2015–2108 1.80–7.80 138,865
Bank of Montreal 2014–2025 1.89–6.17 101,390
CIBC 2015–2108 1.75–10.25 101,292
SLM Corporation 2017–2033 4.63–7.25 75,678
GE Capital Canada Funding Co. 2015–2037 1.63–5.73 75,588
Shaw Communications Inc. 2016–2039 5.50–6.75 69,828
Maple Leaf Sports & Entertainment Ltd. 2023 4.94 68,223
Province of British Columbia 2017–2044 2.70–9.95 63,501
Loblaw Companies Ltd. 2019–2039 3.75–6.85 73,020
Royal Bank of Scotland 2015–2049 2.00–10.50 70,655
Enbridge Inc. 2016–2050 3.19–7.20 59,000
Toronto-Dominion Bank 2016–2108 2.17–10.00 54,719
Real estate
Investment in real estate holdings over $50 million, comprising OPB Realty Inc. (holding company, 100% owned), OPB (EMTC) Inc. (holding company, 100% owned), OPB (Southgate) Inc. (holding company, 100% owned), OPB (155 Wellington) Inc. (holding company, 100% owned), RXR Real Estate Funds and OPB Finance Trust (financing entity, 100% beneficial interest), OPB Real Estate Investments Limited (holding company, 100% owned), and OPB Real Estate Investments 2 Limited (holding company, 100% owned) $ 3,467,810
1 Excludes accrued income, includes guaranteed instruments issued by subsidiaries/agencies.
PUBLIC ACCOUNTS, 2013-2014 3-55

(in thousands of dollars) Shares/Units² Fair Value²
Infrastructure
OPB Infrastructure 2 Limited (holding company, 100% owned) 437,183
OPB Infrastructure 3 Limited (holding company, 100% owned) 45,628
Equities
Canada:
Toronto-Dominion Bank 1,260 $ 126,104
Bank of Nova Scotia 1,680 111,599
Royal Bank of Canada 1,462 104,375
Canadian National Railway Co. 1,315 79,610
Canadian Natural Resources Ltd. 1,903 68,391
Manulife Financial Corp. 3,251 68,143
Canadian Imperial Bank of Commerce 608 55,190
Rogers Communications Inc. 1,101 52,943
United States:
Apple Inc. 103 61,636
OPB Private Equity Limited (holding company, 100% owned) 64,011
Amazon.com Inc. 173 73,212
Johnson & Johnson 515 50,082
Google Inc. 62 73,548
Other international:
Leith Wheeler International Fund 18,599 321,448
Samsung Electronics Co Ltd. 160 140,976
Taiwan Semiconductor Manufacturing Co. 19,121 105,875
Vale SA 4,525 70,246
Tencent Holdings Limited 979 66,321
AIA Group Ltd. 11,870 63,271
Baidu Inc. 329 62,164
2 Includes all share classes and American Depository Receipts.
3-56 PUBLIC ACCOUNTS, 2013-2014

REAL ESTATE PROPERTIESAs at December 31, 2013 (in thousands of square feet) Location Area
Retail
Pen Centre St. Catharines 1,040
Southgate Centre Edmonton 942
St. Vital Centre Winnipeg 928
Pickering Town Centre Pickering 903
Erin Mills Town Centre Mississauga 848
Woodgrove Centre British Columbia 747
Midtown Plaza Saskatchewan 731
Cornwall Centre Saskatchewan 567
Halifax Shopping Centre Halifax 532
Carlingwood Shopping Centre Ottawa 529
Halifax Shopping Centre Annex Halifax 420
West End Mall Halifax 184
Erin Mills Town Plaza Mississauga 59
8,430
Office
155 Wellington Street West Toronto 1,211
Pickering Office Tower/Durham College Pickering 128
Halifax Office Complex Halifax 114
1,453
Total properties 9,883
* Southgate Centre and 155 Wellington Street West are 50% owned by Ontario Pension Board through its subsidiaries OPB (Southgate) Inc. and OPB (155 Wellington) Inc. Woodgrove Centre, Midtown Plaza and Cornwall Centre are 50% owned by Ontario Pension Board through its subsidiary OPB Real Estate Investments 2 Limited.
PUBLIC ACCOUNTS, 2013-2014 3-57


Financial Services Commission des
Commission services financiers
of Ontario de l’Ontario
Deputy Superintendent Surintendant adjoint
Pension Division Division des régimes de retraite
5160 Yonge Street 5160, rue Yonge
Box 85, 8th
Floor boîte 85 8e étage
Toronto ON M2N 6L9 Toronto ON M2N 6L9
Telephone: (416) 226-7795 Téléphone: (416) 226-7795
Facsimile: (416) 226-7787 Télécopieur: (416) 226-7787
June 25, 2014
Pension Benefits Guarantee Fund
Management’s Responsibility for Financial Information
The CEO and Superintendent of Financial Services of the Financial Services Commission of
Ontario (“FSCO”), pursuant to the Financial Services Commission of Ontario Act, 1997 and
specifically, subsection 82(2) of the Pension Benefits Act, is responsible for the administration of
the Pension Benefits Guarantee Fund (PBGF).
The PBGF Management Committee which comprises of senior management, professional
actuarial, investment and accounting staff oversees the administration of the PBGF. The PBGF
Management Committee meets quarterly to review and discuss issues related to the administration
of the PBGF, and makes recommendations on these issues to the Superintendent of Financial
Services.
In addition, Management maintains a system of internal controls, information systems and
processes designed to provide reasonable assurance that the assets of the PBGF are safeguarded
and that financial information is reliable and timely. The internal control systems include formal
policies and procedures and an organizational structure which provides for appropriate Financial
Delegation of Authority and the segregation of incompatible duties.
The Audit and Risk Committee, which includes the Superintendent of Financial Services, is
responsible for ensuring Management fulfils its responsibilities for financial reporting and internal
controls. The Audit and Risk Committee meets periodically with Management, internal and
external auditors to address issues and to review the Financial Statements before recommending
approval.
The accompanying Financial Statements of the PBGF have been prepared in accordance with the
Canadian Public Sector Accounting Standards for Government Not-For-Profit Organizations
(PSA-GNFPO). The preparation of the Financial Statements involves the use of Management’s
professional judgment and best estimates particularly when transactions affecting the current
accounting period that cannot be finalized with certainty until future periods.
PUBLIC ACCOUNTS, 2013-2014 3-59
The Financial Statements have been audited by the Auditor General of Ontario. The Auditor
General’s responsibility is to express an opinion on whether the Financial Statements are presented
fairly, in all material respects, in accordance with PSA-GNFPO. The Auditor’s Report, which
follows, outlines the scope of the Auditor’s examination and the Auditor’s opinion on the financial
statements.
On behalf of management:
Brian Mills Leonard Lobo CGA; CPA
Deputy Superintendent, Pensions Senior Manager, Finance and Planning
3-60 PUBLIC ACCOUNTS, 2013-2014

Independent Auditor’s Report
To the Financial Services Commission of Ontario and to the Minister of Finance
I have audited the accompanying financial statements of the Pension Benefits Guarantee Fund of
the Financial Services Commission of Ontario, which comprise the statement of financial position
as at March 31, 2014 and the statements of operations and fund surplus, cash flows and re-
measurment gains and losses for the year then ended, and a summary of significant accounting
policies and other explanatory information.
Management’s Responsibility for the Financial Statements
Management is responsible for the preparation and fair presentation of these financial statements
in accordance with Canadian public sector accounting standards, and for such internal control as
management determines is necessary to enable the preparation of financial statements that are free
from material misstatement, whether due to fraud or error.
Auditor’s Responsibility
My responsibility is to express an opinion on these financial statements based on my audit. I
conducted my audit in accordance with Canadian generally accepted auditing standards. Those
standards require that I comply with ethical requirements and plan and perform the audit to obtain
reasonable assurance about whether the financial statements are free from material misstatement.
An audit involves performing procedures to obtain audit evidence about the amounts and
disclosures in the financial statements. The procedures selected depend on the auditor’s
judgment, including the assessment of the risks of material misstatement of the financial
statements, whether due to fraud or error. In making those risk assessments, the auditor considers
internal control relevant to the entity’s preparation and fair presentation of the financial statements
in order to design audit procedures that are appropriate in the circumstances, but not for the
purpose of expressing an opinion on the effectiveness of the entity’s internal control. An audit
also includes evaluating the appropriateness of accounting policies used and the reasonableness of
accounting estimates made by management, as well as evaluating the overall presentation of the
financial statements.
I believe that the audit evidence I have obtained is sufficient and appropriate to provide a basis for
my opinion.
Opinion
In my opinion, the financial statements present fairly, in all material respects, the financial
position of the Commission’s Pension Benefits Guarantee Fund as at March 31, 2014, and the
results of its operations and fund surplus, its cash flows and its re-measurement gains and losses
for the year then ended in accordance with Canadian public sector accounting standards.
Toronto, Ontario Gary R. Peall, CPA, CA, LPA
June 25, 2014 Deputy Auditor General
PUBLIC ACCOUNTS, 2013-2014 3-61

FINANCIAL SERVICES COMMISSION OF ONTARIO
Pension Benefits Guarantee Fund
Statement of Financial Position
As at March 31, 2014
March 31, March 31,
2014 2013
($ '000) ($ '000)
ASSETS
Current
Cash 1 752
Accounts receivable 124,088 140,247
Investments (Note 4) 450,237 345,321
574,326 486,320
LIABILITIES AND FUND SURPLUS
Current
Accounts payable and accrued liabilities 11,044 10,834
Current portion of loan payable (Note 5) 11,000 11,000
Claims payable 50,916 78,739
72,960 100,573
Loan payable (Note 5) 125,657 129,577
198,617 230,150
Fund surplus from operation 375,717 256,165
Accumulated remeasurement gains (losses) (8) 5
Fund surplus 375,709 256,170
574,326 486,320
See accompanying notes to financial statements
Approved by:
Philip Howell
Chief Executive Officer
and Superintendent of Financial Services
Financial Services Commission of Ontario
3-62 PUBLIC ACCOUNTS, 2013-2014

FINANCIAL SERVICES COMMISSION OF ONTARIO
Pension Benefits Guarantee Fund
Statement of Operations and Fund Surplus
For the year ended March 31, 2014
March 31, March 31,
2014 2013
($ '000) ($ '000)
Revenue
Premium revenue 138,819 145,295
Pension plan recoveries (Note 7) 9,424 52,770
Investment income (Note 4) 4,389 3,281
152,632 201,346
Expenses
Claims 18,532 12,051
Amortization of loan discount (Note 5) 7,081 7,268
Pension consulting services (Note 8) 6,886 1,420
Administration fee (Note 9) 451 474
Investment management fees (Note 9) 130 96 Unrealized loss (gain) on investments (note 5)
33,080 21,309
Excess of revenue over expenses 119,552 180,037
Fund surplus, beginning of year 256,165 76,128
Fund surplus, end of year 375,717 256,165
See accompanying notes to financial statements
PUBLIC ACCOUNTS, 2013-2014 3-63

FINANCIAL SERVICES COMMISSION OF ONTARIO
Pension Benefits Guarantee Fund
Statement of Cash Flows
For the year ended March 31, 2014
March 31, March 31,
2014 2013
($ '000) ($ '000)
Net inflow (outflow) of cash related to
the following activities
Cash flows from operating activities
Excess of revenue over expenses 119,552 180,037
Items not affecting cash:
Amortization of loan discount (Note 5) 7,081 7,268
(Gains) losses on disposal of investments 116 (74)
126,749 187,231
Changes in non cash working capital
Accounts receivable 16,159 (35,559)
Claims payable (27,823) (30,548)
Accounts payable and accrued liabilities 210 2,897
115,295 124,021
Cash flows from investing activities
Purchases of investments (3,633,576) (3,792,182)
Proceeds from sale of investments 3,528,530 3,679,912
(105,046) (112,270)
Cash flows from financing activities
Loan repayments (11,000) (11,000)
(11,000) (11,000)
Change in cash position (751) 751
Cash position, beginning of year 752 1
Cash position, end of year 1 752
See accompanying notes to financial statements
3-64 PUBLIC ACCOUNTS, 2013-2014
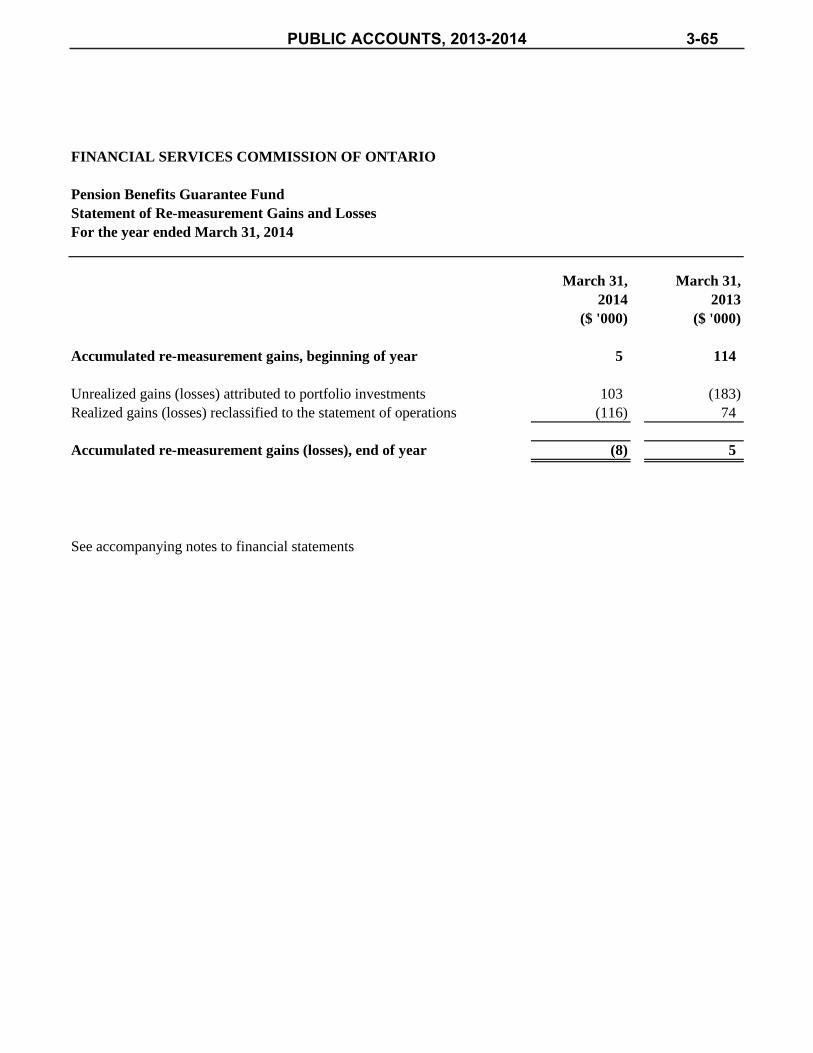
FINANCIAL SERVICES COMMISSION OF ONTARIO
Pension Benefits Guarantee Fund
Statement of Re-measurement Gains and Losses
For the year ended March 31, 2014
March 31, March 31,
2014 2013
($ '000) ($ '000)
Accumulated re-measurement gains, beginning of year 5 114
Unrealized gains (losses) attributed to portfolio investments 103 (183)
Realized gains (losses) reclassified to the statement of operations (116) 74
Accumulated re-measurement gains (losses), end of year (8) 5
See accompanying notes to financial statements
PUBLIC ACCOUNTS, 2013-2014 3-65
FINANCIAL SERVICES COMMISSION OF ONTARIO
Pension Benefits Guarantee Fund
Notes to the Financial Statements
March 31, 2014
1. STATUTORY AUTHORITY
The Pension Benefits Guarantee Fund (the “Fund”) is continued under the Pension
Benefits Act, R.S.O. 1990, c. P.8 (the “Act”).
2. FUND OPERATIONS
The purpose of the Fund is to guarantee payment of pension benefits of certain defined
benefit pension plans that are wound up under conditions specified in the Act and
regulations thereto. The regulations also prescribe an assessment payable into the Fund by
plan registrants.
The Act provides that if the assets of the Fund are insufficient to meet payments for
claims, the Lieutenant Governor in Council may authorize the Minister of Finance of
Ontario to make loans or grants on such terms and conditions as the Lieutenant Governor
in Council directs. The total liability of the Fund to guarantee pension benefits is limited
to the assets of the Fund including any loans or grants received from the Province.
The Superintendent of the Financial Services Commission of Ontario (“FSCO”) pursuant
to the Financial Services Commission of Ontario Act, 1997 is responsible for the
administration of the Fund, and the Fund reimburses FSCO for the costs of the services
provided to the Fund. The investments of the Fund are managed by the Ontario Financing
Authority, on a fee-for-service basis which is paid by the Fund.
3. SIGNIFICANT ACCOUNTING POLICIES
The financial statements of the Fund have been prepared by the management of FSCO in
accordance with Public Sector Accounting Standards for Government Not-For-Profit
organizations (PSA-GNFPO) as issued by the Public Sector Accounting Board (PSAB).
Accordingly, management has used the following significant accounting policies in their
preparation.
(a) Financial Instruments
The Fund follows PSA-GNFPO accounting standards relating to financial
instruments. Under these standards, all financial instruments are included on the balance
sheet and are measured either at fair value or at cost or amortized cost as follows:
o Cash and investments are recorded at fair value, with changes in fair value during the
period recognized in the statement of re-measurement gains and losses until realized.
Fair value is determined from quoted prices for similar investments.
3-66 PUBLIC ACCOUNTS, 2013-2014

FINANCIAL SERVICES COMMISSION OF ONTARIO
Pension Benefits Guarantee Fund
Notes to the Financial Statements
March 31, 2014
o Accounts receivable, account payable and accrued liabilities are valued at cost which
approximate fair value given their short term maturities.
o The non-interest bearing loan payable is reflected at amortized cost using the effective
interest rate method due to the concessionary nature of the loan. The initial valuation
was determined by discounting future cash flows using the provincial cost of
borrowing. The resulting benefit (the difference between the face value of the loan and
the net present value) was accounted for as a grant in the year received and is
amortized to loan discount expense over the term of the loan.
(b) Claims Payable
Claims payable are estimates of the liabilities in respect of those defined benefit pension
plans prescribed by the Act that are wound up or in the process of being ordered wound up
under conditions specified in the Act, and the claim amounts can be reasonably estimated.
Liabilities are also recognized when there is a high probability that a company will not
emerge from creditor protection and the pension plan will be wound up on a specified date
and the claim can be reasonably estimated. Claims payable are based on information
provided by appointed pension plan administrators from estimates provided by actuarial
consultants. These estimates represent the present value of future payments to settle claims
for benefits and expenses by pension plans.
Differences in the liabilities, if any, between the amounts recognized based on estimates
and the actual claims made, will be charged or credited to claims expense in the year when
the actual amounts are determined.
(c) Premium Revenue
An estimate of the premium revenue due from defined benefit pension plans at rates
prescribed by the Act is recorded until receipt of the annual assessment certificate nine
months after the plan’s fiscal year end.
Differences in premium revenue, if any, between the estimated amounts recognized and
the actual revenues due are charged or credited to premium revenue in the year.
(d) Use of Estimates
The preparation of financial statements in accordance with PSA-GNFPO accounting
standards requires that FSCO’s management make estimates and assumptions that affect
the reported amount of assets and liabilities and disclosure of contingent liabilities as at
the date of the financial statements and the reported amounts of revenue and expenses for
PUBLIC ACCOUNTS, 2013-2014 3-67

FINANCIAL SERVICES COMMISSION OF ONTARIO
Pension Benefits Guarantee Fund
Notes to the Financial Statements
March 31, 2014
the period. Estimates and assumptions may change over time as new information is
obtained or subsequent developments occur. Actual results could differ from these
estimates and the differences could be material. Areas where significant estimates must be
made include premium revenue and claims payable.
(e) Comparative Figures
Certain of the prior year's comparative figures have been reclassified to conform to the
current years’ financial presentation.
4. INVESTMENTS
As the administrator, investing the assets of the Fund, FSCO has established a Pension
Benefits Guarantee Fund Management Committee. The Committee has developed a
Statement of Investment Policies and Guidelines which is reviewed regularly and provides
operational objectives, investment principles, policies and guidelines for the management
of the investments.
Investments consist of:
2014 2013
($’000) ($’000)
Fair
Value
Cost Fair
Value
Cost
Discounted notes
443,819 443,819
252,205 252,204
Government bonds 6,418
6,426
93,116 93,111
450,237 450,245 345,321 345,315
Investment income includes interest earned from interest bearing securities and realized
gains and losses from the sale of securities.
The Fund’s investment portfolio is exposed to various risks, which are mitigated by the
type of investment and therefore risk is low.
The market value sensitivity of the portfolio at the end of the last quarter was $0.7M for a
1.00% change in rates.
3-68 PUBLIC ACCOUNTS, 2013-2014

FINANCIAL SERVICES COMMISSION OF ONTARIO
Pension Benefits Guarantee Fund
Notes to the Financial Statements
March 31, 2014
Discounted notes with maturities between April 2014 and July 2014 have yields in the
range of 0.880% to 1.130% (2013 – maturities between April 2013 and July 2013 had
yields in the range of 0.960% to 1.140%).
The Government bond matures in October 2014 and has yield of 1.515% (2013 –
maturities between June 2013 and December 2013 had yields of 1.275% to 1.294%).
5. LOAN PAYABLE
Non-interest Bearing Loan
On March 31, 2004, the Fund obtained a $330M loan from the Province, a related party.
The loan is non-interest bearing and repayable to the Province in thirty equal annual
installments of $11M. The loan agreement provides for the Minister of Finance to advance
any installment payment date depending on the cash position of the Fund. Repayments
over the next five years total $55M.
The face value of this non-interest bearing loan has been discounted at an effective interest
rate of 5.0368% to reflect its amortized cost outstanding as of March 31, 2014 as follows:
2014 2013 2011
($’000) ($’000) ($’000)
Face Value 220,000 231,000 253,000
Less: Discount (83,343) (90,423) (105,139)
Amortized Cost 136,657 140,577 147,861
Classified as:
Current Portion 11,000 11,000 11,000
Long Term Portion 125,657 129,577 136,861
Balance 136,657 140,577 147,861
PUBLIC ACCOUNTS, 2013-2014 3-69

FINANCIAL SERVICES COMMISSION OF ONTARIO
Pension Benefits Guarantee Fund
Notes to the Financial Statements
March 31, 2014
The discount of $83.3M is amortized to loan discount expense over the term of the loan,
based on the effective interest rate method. The amortization schedule for the
subsequent five fiscal years is as follows:
Fiscal
Year
($’000)
2015 6,883
2016 6,676
2017 6,458
2018 6,229
2019 5,989
6. FINANCIAL INSTRUMENTS
The main risks that the Fund’s financial instruments are exposed to are credit risk,
liquidity risk and market risk.
Credit risk
Credit risk is the risk that the counterparty to a financial instrument may fail to discharge
an obligation or commitment that it has entered into. The Fund is exposed to credit risk
relating to the collection of receivables. The Fund considers this risk to be low.
The Fund’s accounts receivable consists of premium revenue receivable of $124M,
investment income receivable of $0.28M and the HST receivable of $0.19M.
The premium revenue receivable recorded is based on an assessment formula set out in
section 37 of Regulation 909 of the Act and is calculated as follows:
Base assessment of $5 per Ontario plan beneficiary plus specified percentages of
the plans PBGF assessment base.
Maximum assessment of $300 per Ontario plan beneficiary and
Minimum assessment of $250 for each plan
The probability for a pension plan to become insolvent and not pay the premium within a
year is very low. In addition, in the event that a pension plan would become insolvent
within a year, there are legal options for the Fund that can be exercised to collect the
premiums. Historically, the Fund has been able to collect the amounts estimated as
premium receivable.
3-70 PUBLIC ACCOUNTS, 2013-2014

FINANCIAL SERVICES COMMISSION OF ONTARIO
Pension Benefits Guarantee Fund
Notes to the Financial Statements
March 31, 2014
The risk of not collecting the investment income and the HST receivable is considered to
be minimal.
Liquidity Risk
Liquidity risk is the risk that the Fund will not be able to meet its cash flow obligations as
they fall due. The Fund’s exposure to liquidity risk is minimal as the Fund has sufficient
funds in its investment portfolio to settle all current liabilities. As at March 31, 2014, the
Fund has an investment balance of $450M (2013 - $345M) to settle current liabilities of
$73M (2013 - $101M). In addition, the Fund has the ability to meet sudden and
unexpected claims by converting the investment holdings to cash without delay or
significant transaction costs.
Market risk
Market risk arises from the possibility that changes in market prices will affect the value
of the financial instruments of the Fund. Short-term financial instruments (receivables,
accounts payable) are not subject to significant market risk. The Fund manages its market
risk by investing assets in low-risk and liquid securities. The Fund’s market risk is
considered to be low.
7. PENSION PLAN RECOVERIES
Following the settlement of all benefits, payment of expenses and the submission of the
final wind up report, any remaining funds are recovered by the Fund. During fiscal 2014,
the Fund had $9.4M (2013 - $52.8M) in recoveries. Approximately $1M in recoveries is
expected in the fiscal year 2015.
8. PENSION CONSULTING SERVICES
The Fund periodically engages the services of external experts to represent the Fund’s
interests in insolvency proceedings respecting employers who are unable to meet their
funding obligations under the Pension Benefits Act. For fiscal 2014, $6.9M was paid to
such external experts (2013 - $1.4M paid).
9. RELATED PARTY TRANSACTIONS
For fiscal 2014, an administration fee of $0.5M (2013 - $0.5M) was incurred and has been
paid to FSCO for management salaries and benefits, accounting, information technology,
legal, pension and other services. The Fund and FSCO are related parties.
PUBLIC ACCOUNTS, 2013-2014 3-71

FINANCIAL SERVICES COMMISSION OF ONTARIO
Pension Benefits Guarantee Fund
Notes to the Financial Statements
March 31, 2014
Investment Management fees consist mainly of fees paid to the Ontario Financing
Authority, a related party.
The costs of processing premium revenue transactions are absorbed by FSCO without
charge to the Fund.
Other related party transactions during the year have been disclosed in note 5.
3-72 PUBLIC ACCOUNTS, 2013-2014

Independent Auditor’s Report
To the Provincial Judges Pension Board and to the Minister of Finance
I have audited the accompanying Statement of Changes in Fund Balance of the Provincial Judges
Pension Fund as at March 31, 2014, and a summary of significant accounting policies and other
explanatory information (together the “financial statement”). The financial statement has been
prepared by management in accordance with the financial reporting provisions prescribed by the
Memorandum of Agreement between the Ontario Conference of Judges and the Lieutenant Governor
in Council, Minister of Government Services and the Provincial Judges Pension Board (the Standstill
Agreement) dated December 20, 2013.
Management's Responsibility for the Financial Statement
Management is responsible for the preparation of this financial statement in accordance with the
financial reporting provisions prescribed by the Standstill Agreement, and for such internal control as
management determines is necessary to enable the preparation of a financial statement that is free from
material misstatement, whether due to fraud or error.
Auditor's Responsibility
My responsibility is to express an opinion on this financial statement based on my audit. I conducted
my audit in accordance with Canadian generally accepted auditing standards. Those standards require
that I comply with ethical requirements and plan and perform the audit to obtain reasonable assurance
about whether the financial statement is free from material misstatement.
An audit involves performing procedures to obtain audit evidence about the amounts and disclosures in
the financial statement. The procedures selected depend on the auditor's judgment, including the
assessment of the risks of material misstatement of the financial statement, whether due to fraud or
error. In making those risk assessments, the auditor considers internal control relevant to the entity's
preparation of the financial statement in order to design audit procedures that are appropriate in the
circumstances, but not for the purpose of expressing an opinion on the effectiveness of the entity's
internal control. An audit also includes evaluating the appropriateness of accounting policies used and
the reasonableness of accounting estimates made by management, as well as evaluating the overall
presentation of the financial statement.
I believe that the audit evidence obtained is sufficient and appropriate to provide a basis for my audit
opinion.
Opinion
In my opinion, the financial statement of the Provincial Judges Pension Fund as at March 31, 2014 is
prepared in accordance with the financial reporting provisions of the Standstill Agreement.
Basis of Accounting
Without modifying my opinion, I draw attention to Note 2 to the financial statement, which describes
the basis of accounting. The financial statement is prepared to assist the Provincial Judges Pension
Fund to meet the reporting requirements of the Standstill Agreement, and as a result the financial
statement may not be suitable for another purpose.
Toronto, Ontario Gary R. Peall, CPA, CA, LPA
June 10, 2014 Deputy Auditor General
Provincial Judges Pension Fund
PUBLIC ACCOUNTS, 2013-2014 3-73
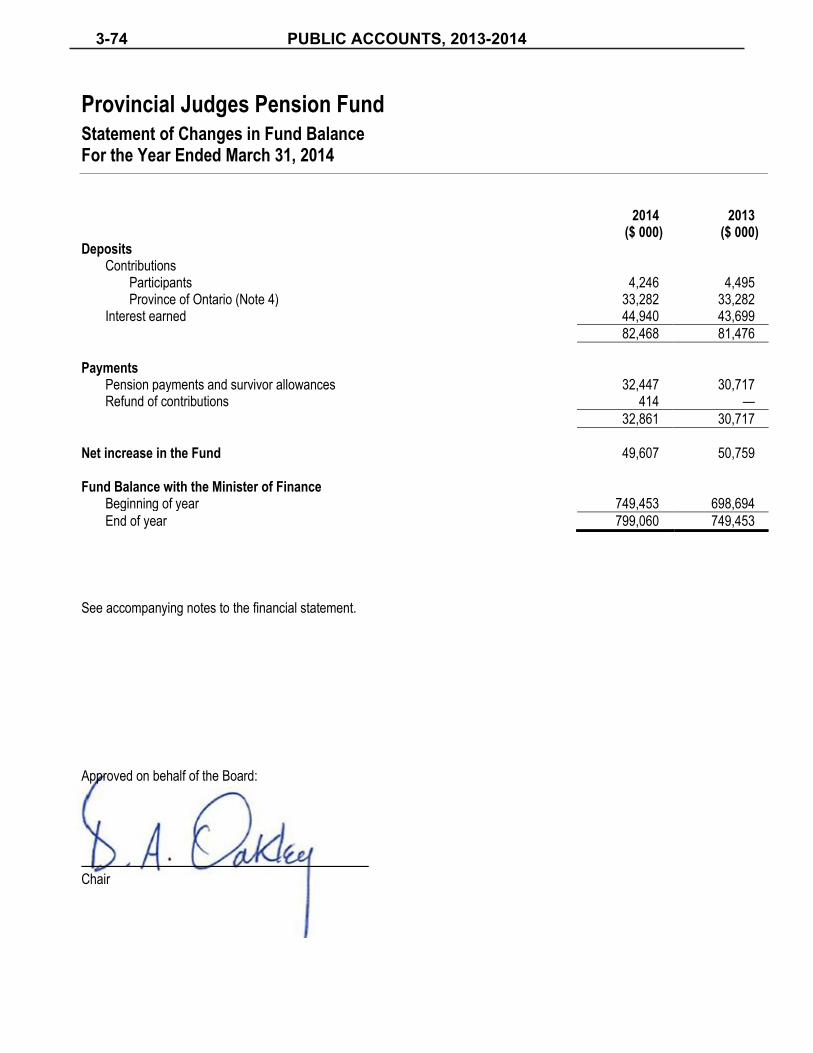
Provincial Judges Pension Fund Statement of Changes in Fund Balance For the Year Ended March 31, 2014
2014 2013 ($ 000) ($ 000) Deposits
Contributions Participants 4,246 4,495 Province of Ontario (Note 4) 33,282 33,282
Interest earned 44,940 43,699
82,468 81,476
Payments
Pension payments and survivor allowances 32,447 30,717 Refund of contributions 414 —
32,861 30,717
Net increase in the Fund 49,607 50,759
Fund Balance with the Minister of Finance
Beginning of year 749,453 698,694
End of year 799,060 749,453
See accompanying notes to the financial statement. Approved on behalf of the Board:
Chair
3-74 PUBLIC ACCOUNTS, 2013-2014

Provincial Judges Pension Fund Notes to Financial Statement March 31, 2014
1. Description and Administration of the Fund
The Ministry of Government Services is responsible for overall oversight of the Fund including administration of all
contributions to the funds and interest earned. The Provincial Judges Pension Board, as originally designated by Ontario
Regulation 67/92 of the Courts of Justice Act, is responsible for the administration of pension payments and survivor
allowances.
On Oct 31, 2013, Ontario Regulation 67/92 was repealed and was replaced by Ontario Regulation 290/13 under the same
legislation. The new Regulation splits the Provincial Judges Pension Fund into two plans, the Provincial Judges Pension
Fund and the Provincial Judges Supplementary Pension Account.
The Provincial Judges Pension Fund is registered for income tax purposes and provides for pension benefits up to the
limit permitted under the Income Tax Act. The Provincial Judges Supplementary Pension Account provides for pension
benefits above the limit prescribed by the Income Tax Act for post-1991 service.
On December 20, 2013, a Court Order was issued that effectively ordered management to administer the Fund as one plan
under the administrative provisions of the repealed Ontario Regulation 67/92, until litigation challenging the
constitutionality of the Supplementary Pension Account is resolved. The terms of the Court Order had been agreed to in
advance among the parties to the litigation in a Memorandum of Agreement called the Standstill Agreement.
As a result, this financial statement continues to be presented as one Fund.
The Fund is held within the Consolidated Revenue Fund of the Province of Ontario and is included as an employee future
benefit liability within the consolidated financial statements of the Province.
The Fund is not subject to the reporting requirements under the Pension Benefits Act and Regulations.
The following brief description of the Fund is provided for general purposes only. For more complete information,
reference should be made to the Regulations.
(A) GENERAL
The purpose of the Fund is to provide pension payments to retired Provincial Judges and Masters who are members of the
Plan or survivor allowances to the dependents of these Judges and Masters.
(B) FUNDING POLICY
Participants are required to contribute 7% of their salary to the earlier occurrence of meeting their basic service
requirement or attaining age 70 years.
The contribution required from the Province is determined by an actuarial valuation as described in note 4.
PUBLIC ACCOUNTS, 2013-2014 3-75

Provincial Judges Pension Fund Notes to Financial Statement March 31, 2014
1. Description and Administration of the Fund (Continued)
(C) PENSION PAYMENTS
A pension payment is available based on the age and the number of years of full-time service for which the participant has
credit upon ceasing to hold office and is based on the salary of a full-time judge of the highest judicial rank held by the
participant while in office. The participant is entitled to these payments during his/her lifetime.
(D) DISABILITY PENSION PAYMENTS
A full pension is available at age 65 for participants with a minimum of five years of full-time service who are unable to
serve in office due to injury or chronic illness.
(E) SURVIVOR ALLOWANCES
A survivor allowance equal to 60% of the pension payment is paid to the spouse during the spouse’s lifetime or to
children who meet the age, custody, education or disability criteria defined by Regulation.
(F) DEATH REFUNDS
A death refund can be payable to the personal representative of a participant where there is no further entitlement to a
survivor allowance. The amount of the refund is equal to the participant’s contributions in the Fund plus interest, less
entitlements already paid out.
(G) WITHDRAWAL REFUNDS
Upon ceasing to hold office for a reason other than death, participants not eligible to receive pension payments are
entitled to receive a refund of their contributions to the Fund plus interest.
(H) ANNUAL INFLATIONARY ESCALATION OF ENTITLEMENTS
• Judges Retired Before June 1, 2007:
The annual inflationary increase for judges who retired before June 1, 2007 is based on changes in the Average
Weekly Earnings published by Statistics Canada and subject to a maximum of 7% in any one year, and is effective on
April 1 in every year. In addition, the pensions are adjusted based on the salary increases of sitting judges as
recommended by the Provincial Judges Remuneration Commission.
• Judges Retired On Or After June 1, 2007:
The increase for judges who retired on or after June 1, 2007 and elected to be paid under the plan provisions effective
on that date is based on changes in the Consumer Price Index, and is effective on January 1 in every year.
3-76 PUBLIC ACCOUNTS, 2013-2014
Provincial Judges Pension Fund Notes to Financial Statement March 31, 2014
1. Description and Administration of the Fund (Continued)
(I) INTEREST REVENUE
Interest is credited to the account for the Fund, held in the Consolidated Revenue Fund of the Province of Ontario, at the
average of the monthly Ontario Borrowing Rates for a 25-year maturity as follows:
• on the net monthly increases to the account accumulating during the fiscal year at the interest rate for the fiscal year;
and
• on the net increases to the account for each of the preceding 25 years at the interest rates applicable to those years,
providing the funds remain on deposit with the Consolidated Revenue Fund.
2. Significant Accounting Policies
The financial statement has been prepared on a basis of accounting prescribed by the Memorandum of Agreement
between the Ontario Conference of Judges and the Lieutenant Governor in Council, Minister of Government Services and
the Provincial Judges Pension Board (the Standstill Agreement). The basis of accounting prescribed by the Standstill
Agreement is consistent with both the repealed Regulation 67/92 and the current Regulation 290/13 under the Courts of
Justice Act and consists of contributions and money paid, transferred or credited to the Fund, less money paid out, except
for the fact no Supplementary Pension Account was established.
3. Administrative Expenses
Administrative expenses are paid by the Province of Ontario.
4. Liability for Future Benefits
The Provincial Judges Remuneration Commission (Commission) was established under the Courts of Justice Act to
conduct an independent review of the salary, pension and benefits for all provincial judges. The Commission’s salary and
non-pension benefits recommendations are binding; recommendations on pension benefits are non-binding. The most
recent report of the Commission was the Eighth Provincial Judges Remuneration Commission released on November 12,
2013, covering the period April 1, 2010 to March 31, 2014. The report did not recommend any salary increases in
addition to the annual inflationary increases already received.
The Province is responsible for the unfunded liability of the Provincial Judges Pension Fund and funds this liability in
amounts recommended by periodic actuarial valuations of the Plan. The most recent actuarial funding valuation on plan
data as at March 31, 2012 recommended a contribution from the Province for fiscal 2014 of $33,282,000 based on 44.6%
of the payroll of sitting judges until the next actuarial valuation.
The 2012 actuarial valuation calculated the present value of the required future government contributions as $300,421,000
(2011 - $283,590,000).
PUBLIC ACCOUNTS, 2013-2014 3-77

Provincial Judges Pension Fund Notes to Financial Statement March 31, 2014
4. Liability for Future Benefits (Continued)
Significant assumptions in the March 31, 2012 actuarial funding valuation are as follows:
Assumption March 2012 Valuation
Expected Return on Plan Assets 4.0%
Discount Rate on Future Cash Inflows 4.0%
Salary Rate Increases 3.6%
Age of Retirement graduated scale from age 60 to 75
Method of Valuation Aggregate Cost Method
3-78 PUBLIC ACCOUNTS, 2013-2014
Management’s Responsibility for Financial Information
Management is responsible for the financial statements and all other information presented in
the financial statements. The financial statements have been prepared by management in
accordance with International Financial Reporting Standards (IFRS), and, where appropriate,
include amounts based on management’s best estimates and judgments.
Management is also responsible for developing and maintaining systems of internal control that
provide reasonable assurance that financial information is reliable, that all financial transactions
are properly authorized, that assets are safeguarded, and that the Public Guardian and Trustee for
the Province of Ontario adheres to legislation and regulatory requirements. These systems
include the communication of policies and the Public Guardian and Trustee for the Province of
Ontario’s code of ethics and business conduct throughout the organization. Management
continually monitors the systems of internal controls for compliance.
The financial statements have been examined by the Office of the Auditor General of Ontario.
The Auditor General’s responsibility is to express an opinion on whether the financial
statements are fairly presented in accordance with International Financial Reporting Standards
(IFRS). The Auditor’s Report outlines the scope of the auditor’s examination and opinion.
Kenneth R. Goodman Joy Stevenson, CA, CFA, CFE
Public Guardian and Trustee Chief Financial Officer
June 24, 2014
The Public Guardian and Trustee For the Province of Ontario
PUBLIC ACCOUNTS, 2013-2014 3-79

Independent Auditor’s Report
To the Public Guardian and Trustee for the Province of Ontario
and to the Attorney General
I have audited the accompanying financial statements of The Public Guardian and Trustee for the
Province of Ontario, which comprise the statement of financial position as at March 31, 2014, and the
statements of income and comprehensive income, statement of changes in net assets attributable to
beneficiaries of estates and trusts administered, statement of changes in equity of the administration fund
and statement of cash flows for the year then ended and a summary of significant accounting policies
and other explanatory information.
Management’s Responsibility for the Financial Statements
Management is responsible for the preparation and fair presentation of these financial statements in
accordance with International Financial Reporting Standards, and for such internal control as
management determines is necessary to enable the preparation of financial statements that are free from
material misstatement, whether due to fraud or error.
Auditor’s Responsibility
My responsibility is to express an opinion on these financial statements based on my audits. I conducted
my audits in accordance with Canadian generally accepted auditing standards. Those standards require
that I comply with ethical requirements and plan and perform the audit to obtain reasonable assurance
about whether the financial statements are free from material misstatement.
An audit involves performing procedures to obtain audit evidence about the amounts and disclosures in
the financial statements. The procedures selected depend on the auditor’s judgment, including the
assessment of the risks of material misstatement of the financial statements, whether due to fraud or
error. In making those risk assessments, the auditor considers internal control relevant to the entity’s
preparation and fair presentation of the financial statements in order to design audit procedures that are
appropriate in the circumstances, but not for the purpose of expressing an opinion on the effectiveness of
the entity’s internal control. An audit also includes evaluating the appropriateness of accounting policies
used and the reasonableness of accounting estimates made by management, as well as evaluating the
overall presentation of the financial statements.
I believe that the audit evidence I have obtained is sufficient and appropriate to provide a basis for my
audit opinion.
Opinion
In my opinion, the financial statements present fairly, in all material respects, the financial position of
The Public Guardian and Trustee for the Province of Ontario as at March 31, 2014, and its financial
performance and its cash flows for the year then ended in accordance with International Financial
Reporting Standards.
Toronto, Ontario Gary Peall, CPA, CA, LPA
June 24, 2014 Deputy Auditor General
3-80 PUBLIC ACCOUNTS, 2013-2014

As at March 31
in thousands of dollars Note 2014 2013
Estates and Trusts
AssetsCash and cash equivalents 4.1 $ 69,326 $ 59,021
Accounts receivable 6 8,673 4,965
Investments at fair value through profit or loss:
Bonds and other debt securities - client owned 4.1 40,101 42,419
Diversified fund 4.2 76,112 68,197
Canadian income and dividend fund 4.3 82,177 73,488
Equity securities - client owned 4.4 31,798 28,800
Held to maturity investments:
Fixed income funds 4.5 1,113,387 1,082,052
Real estate 94,395 98,685
Other assets 7 14,468 14,099
Total assets 1,530,437 1,471,726
LiabilitiesAccounts payable and accrued liabilities 8 49,295 53,384
Net assets attributable to
beneficiaries of Estates and Trusts 1,481,142 1,418,342
Total liabilities and net assets attributable to beneficiaries of Estates and Trusts $ 1,530,437 $ 1,471,726
Administration FundAssetsCash and cash equivalents $ 2,717 $ 356
Accounts receivable 6 4,683 2,732
Investments at fair value through profit or loss:
Diversified fund 4.2 65,571 58,453
Canadian income and dividend fund 4.3 22,602 20,624
Intangible assets:
Computer Software - Client Management Information System 9 - 2,326
Total assets 95,573 84,491
LiabilitiesAccounts payable and accrued liabilities 8 8,301 4,359
Total liabilities 8,301 4,359
EquityFunds and reserves 17,500 19,826
Unappropriated fund 69,772 60,306
Total equity 87,272 80,132
Total liabilities and equity $ 95,573 $ 84,491
On behalf of The Public Guardian and Trustee for the Province of Ontario
Public Guardian and Trustee Chief Financial Officer
Statement of Financial Position
PUBLIC ACCOUNTS, 2013-2014 3-81
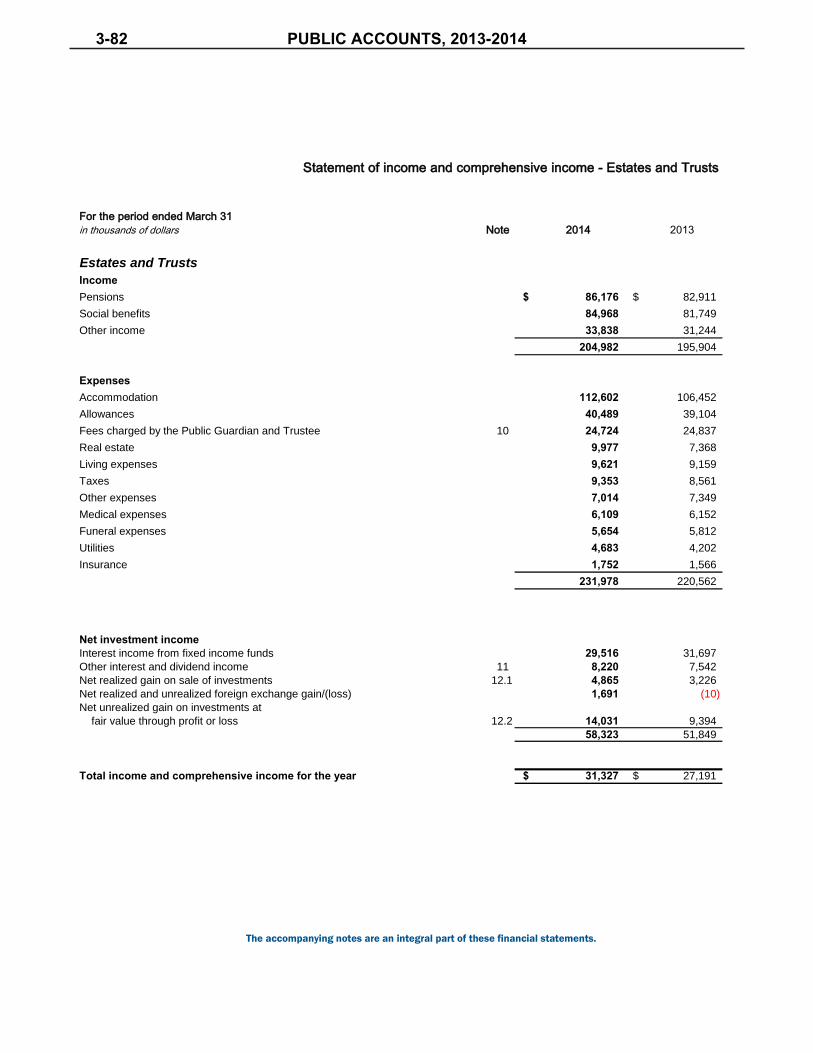
The accompanying notes are an integral part of these financial statements.
For the period ended March 31
in thousands of dollars Note 2014 2013
Estates and Trusts
IncomePensions $ 86,176 $ 82,911
Social benefits 84,968 81,749
Other income 33,838 31,244
204,982 195,904
ExpensesAccommodation 112,602 106,452
Allowances 40,489 39,104
Fees charged by the Public Guardian and Trustee 10 24,724 24,837
Real estate 9,977 7,368
Living expenses 9,621 9,159
Taxes 9,353 8,561
Other expenses 7,014 7,349
Medical expenses 6,109 6,152
Funeral expenses 5,654 5,812
Utilities 4,683 4,202
Insurance 1,752 1,566
231,978 220,562
Net investment incomeInterest income from fixed income funds 29,516 31,697
Other interest and dividend income 11 8,220 7,542
Net realized gain on sale of investments 12.1 4,865 3,226
Net realized and unrealized foreign exchange gain/(loss) 1,691 (10)
Net unrealized gain on investments at
fair value through profit or loss 12.2 14,031 9,394
58,323 51,849
Total income and comprehensive income for the year $ 31,327 $ 27,191
Statement of income and comprehensive income - Estates and Trusts
3-82 PUBLIC ACCOUNTS, 2013-2014

The accompanying notes are an integral part of these financial statements.
For the period ended March 31
in thousands of dollars Note 2014 2013
Administration Fund
Revenue Fees charged on estates and trusts 10 $ 24,724 $ 24,837
Grants received from the Ministry of the Attorney General 16 16,395 17,270
41,119 42,107
ExpensesSalaries, wages and benefits 14 34,063 33,781
General administration 15 2,978 4,040
Amortization of intangible assets:
Computer Software - Client Management Information System 9 2,326 2,327
Fees incurred 1,523 1,341
Transportation and communication expenses 1,053 1,021
Claims 771 265
Supplies and equipment expenses 352 356
43,066 43,131
Net investment income/ (loss)Other interest and dividend income 11 2,656 2,428
Interest (expense)/income from fixed income funds (664) 708
Net foreign exchange gain/(loss) 1,457 (9)
Net realized gain on sale of investments 12.1 2,480 991
Net unrealized gain on investments at 12.2 5,004 2,933
fair value through profit or loss
10,933 7,051
Investment expenses 13 1,846 1,744
Net investment income 9,087 5,307
Total income and comprehensive income for the year $ 7,140 $ 4,283
Statement of income and comprehensive income - Administration Fund
PUBLIC ACCOUNTS, 2013-2014 3-83

The
acco
mpa
nyin
g no
tes
are
an in
tegr
al p
art
of t
hese
fina
ncia
l sta
tem
ents
.
( in th
ousa
nds
of d
olla
rs)
Forf
eite
dC
lient
D
ecea
sed
Cem
eter
yC
orpo
rate
Cor
pora
teLa
ndTr
usts
Min
ors
Litig
ants
Esta
tes
Trus
tsA s
sets
Trus
tsTi
tles
Tota
l
Bal
ance
at M
arch
31,
201
2$
525,
127
390,
681
319,
702
138,
725
23,5
3819
,803
291,
789
$1,
419,
394
Tot
al in
com
e/(lo
ss)
and
com
preh
ensi
ve in
com
e/(l
oss)
for
the
year
9,95
812
,515
6,57
4(2
,569
)23
942
2-
5227
,191
Oth
er c
hang
es in
net
ass
ets
attr
ibut
able
to b
enef
icia
ries:
Co
ntr
ibu
tion
s d
uri
ng
th
e y
ea
r25
7,57
450
,650
103,
360
60,7
261,
020
592
-
-
47
3,92
2D
istr
ibu
tion
s d
uri
ng
th
e y
ea
r(2
34,2
49)
(66,
085)
(156
,283
)(4
9,11
6)(8
1)(8
00)
-
(3
70)
(506
,984
)O
the
r a
dju
stm
ent
s to
Clie
nt
acc
oun
ts2,
190
-
333
4,65
4-
296
-
-
7,
473
Fun
ds e
sche
ated
to th
e C
row
n (n
ote
17)
(470
)-
-
(2,1
84)
-
-
-
-
(2,6
54)
Tot
al in
crea
se/(
decr
ease
) in
net
ass
ets
attr
ibut
able
to b
enef
icia
ries
35,0
03(2
,920
)(4
6,01
6)11
,511
1,17
851
0-
(318
)(1
,052
)
Bal
ance
at M
arch
31,
201
3$
560,
130
387,
761
273,
686
150,
236
24,7
1620
,313
291,
471
$1,
418,
342
Tot
al in
com
e/(lo
ss)
and
com
preh
ensi
ve in
com
e/(l
oss)
for
the
year
11,2
6117
,176
5,51
8(3
,605
)47
739
954
4731
,327
Oth
er c
hang
es in
net
ass
ets
attr
ibut
able
to b
enef
icia
ries:
Co
ntr
ibu
tion
s d
uri
ng
th
e y
ea
r18
1,20
561
,670
112,
350
50,0
911,
008
1,91
9-
2140
8,26
4D
istr
ibu
tion
s d
uri
ng
th
e y
ea
r(1
53,6
71)
(67,
742)
(107
,755
)(4
0,54
1)(3
56)
(109
)(1
)(1
50)
(370
,325
)O
the
r a
dju
stm
ent
s to
Clie
nt
acc
oun
ts48
280
047
2(7
,164
)49
8-
-
(5,3
53)
Fun
ds e
sche
ated
to th
e C
row
n (n
ote
17)
-
-
-
(1,1
13)
-
-
-
-
(1,1
13)
Tot
al in
crea
se/(
decr
ease
) in
net
ass
ets
attr
ibut
able
to b
enef
icia
ries
39,2
7711
,904
10,5
85(2
,332
)1,
178
2,21
753
(82)
62,8
00
Bal
ance
at M
arch
31,
201
4$
599,
407
399,
665
284,
271
147,
904
25,8
9422
,530
821,
389
$1,
481,
142
Stat
emen
t of c
hang
es in
net
ass
ets
attri
buta
ble
to b
enef
icia
ries
of E
stat
es a
nd T
rust
s Ad
min
iste
red
3-84 PUBLIC ACCOUNTS, 2013-2014

The
acco
mpa
nyin
g no
tes
are
an in
tegr
al p
art
of t
hese
fina
ncia
l sta
tem
ents
.
( in th
ousa
nds
of d
olla
rs)
Clie
ntM
anag
emen
tLi
tigat
ion
Res
erve
Cap
acity
In
form
atio
nA s
sura
nce
Res
erve
for D
oubt
ful
A sse
ssm
ent
Tota
l Fun
dsU
napp
ropr
iate
dSy
stem
Res
erve
Fund
Fund
Acco
unts
Fund
and
Res
erve
sFu
ndTo
tal
Bal
ance
at M
arch
31,
201
2$
4,65
3$
14,3
00$
3,00
0$
100
$10
0$
22,1
53$
53,6
96$
75,8
49
Tota
l inc
ome
and
com
preh
ensi
ve in
com
e-
-
-
-
-
-
4,
283
4,28
3
Tran
sfer
s to
/(fro
m) r
eser
ves
T
rans
fers
mad
e -
176
73-
15
264
(264
)-
R
eser
ves
rele
ased
(2
,327
)(1
76)
(73)
-
(15)
(2,5
91)
2,59
1-
Tota
l inc
reas
e/(d
ecre
ase)
in e
quit y
(2,3
27)
-
-
-
-
(2,3
27)
6,61
04,
283
Bal
ance
at M
arch
31,
201
3$
2,32
6$
14,3
00$
3,00
0$
100
$10
0$
19,8
26$
60,3
06$
80,1
32
Tota
l inc
ome
and
com
preh
ensi
ve in
com
e-
-
-
-
-
-
7,
140
7,14
0
Tran
sfer
s to
/(fro
m) r
eser
ves
T
rans
fers
mad
e -
586
158
-
2777
1(7
71)
-
R
eser
ves
rele
ased
(2
,326
)(5
86)
(158
)-
(2
7)(3
,097
)3,
097
-
Tota
l inc
reas
e/(d
ecre
ase)
in e
quit y
(2,3
26)
-
-
-
-
(2,3
26)
9,46
67,
140
Bal
ance
at M
arch
31 ,
201
4$
-$
14,3
00$
3,00
0$
100
$10
0$
17,5
00$
69,7
72$
87,2
72
Stat
emen
t of c
hang
es in
equ
ity o
f the
Adm
inis
tratio
n Fu
nd
PUBLIC ACCOUNTS, 2013-2014 3-85

The accompanying notes are an integral part of these financial statements.
For the period ended March 31
in thousands of dollars 2014 2013 2014 2013
Cash flows from operating activitiesIncome and comprehensive income $ 31,327 $ 27,191 $ 7,140 $ 4,283Adjustments for:
Amortization of intangible assets: Computer Software - Client Management Information System - - 2,326 2,327
Net unrealized gain on investments and foreign (15,603) (9,649) (6,462) (2,924) currency at fair value
Changes in working capital items Accounts receivable (3,708) (1,242) (1,951) (255) Accounts payable and accrued liabilities (4,089) 3,142 3,942 (240)
Cash generated from operating activities (7,797) 1,900 1,991 (495)
Net cash from operating activities 7,927 19,442 4,995 3,191
Cash flows from investing activitiesAcquisition of investments (1,215,589) (1,342,732) (4,734) (3,420)Proceeds from sale of investments 1,182,574 1,379,694 2,100 500Acquisition of real estate (42,075) (48,416) - - Proceeds from sale of real estate 46,364 38,893 - - Net (increase)/decrease in other assets (369) 2,018 - -
Net cash (used in)/from investing activities (29,095) 29,457 (2,634) (2,920)
Cash flows from financing activitiesClient Capital Contributions 408,264 473,921 - - Client Capital Distributions (370,325) (506,984) - - Client Capital Net Other (6,466) 4,819 - -
Net cash from/(used in) financing activities 31,473 (28,244) - -
Increase in cash and cash equivalents 10,305 20,655 2,361 271
Cash and cash equivalent, beginning of the year 59,021 38,366 356 85Cash and cash equivalent, end of the year $ 69,326 $ 59,021 $ 2,717 $ 356
Estates and Trusts Administration Fund
Statement of Cash flows
3-86 PUBLIC ACCOUNTS, 2013-2014

Notes to financial statements March 31, 2014 and 2013 1. Reporting entity
The Office of the Public Guardian and Trustee for the Province of Ontario, Canada (“The Public Guardian and Trustee” or “OPGT”) is part of the Province of Ontario's Ministry of the Attorney General. The Public Guardian and Trustee is appointed under The Public Guardian and Trustee Act and performs duties under a number of statutes with the following main responsibilities: The guardianship of property of incapable adults; The administration of estates of persons who have died in Ontario intestate and without next-of-kin; The gathering of assets reverting to the Crown under the Escheats Act; The management of funds, mortgages and securities paid into or lodged with the Accountant of the Superior
Court of Justice on behalf of minors and litigants; and A general supervisory role over charitable property. The Public Guardian and Trustee has perpetual succession and an official seal and may sue and be sued in his or her corporate name. The Office of The Public Guardian and Trustee has close to 400 staff located in six regional offices throughout the Province of Ontario with the main office located in Toronto at 595 Bay Street, Suite 800, Toronto, ON, M5G 2M6. These financial statements comprise the following:
a) Estates and Trusts: This represents accounts administered by the Public Guardian and Trustee acting as guardian or trustee under the Substitute Decisions Act, the Public Guardian and Trustee Act, the Crown Administration of Estates Act, the Estates Act and various other statutes;
b) Administration Fund: This represents the operating account of The Public Guardian and Trustee. The Administration Fund is used to accumulate fees charged to each estate and trust for services as prescribed by the Fee Schedule created pursuant to The Public Guardian and Trustee Act. Operating grants are received as required from the Ministry of the Attorney General to fund the operations of OPGT.
Cash balances in the Administration Fund which are not required for operating purposes are invested along with the cash funds of Estates and Trusts. The Administration Fund receives the net interest income of these investment activities, after interest is distributed on the funds of Estates and Trusts in accordance with the interest rates prescribed by The Public Guardian and Trustee Act.
The Public Guardian and Trustee in its capacity as Accountant of the Superior Court of Justice also acts as custodian of miscellaneous securities and documents having a face value of $1,025,790 (March 31, 2013: $1,216,156) and mortgages as required. These amounts are not reflected in the financial statements as The Public Guardian and Trustee does not act as trustee of these funds but simply as custodian of the instruments on behalf of the client. The Public Guardian and Trustee as custodian also holds letters of credit, lien bonds, guardianship bonds and performance guarantee bonds for litigants.
2. Basis of preparation (a) Statement of compliance
The financial statements have been prepared in accordance with International Financial Reporting Standards ("IFRS") as issued by the International Accounting Standards Board. These financial statements were authorized for issue by the Public Guardian and Trustee on June 24, 2014.
PUBLIC ACCOUNTS, 2013-2014 3-87

Notes to financial statements (continued) March 31, 2014 and 2013 2. Basis of preparation (continued) (b) Basis of measurement
These financial statements have been prepared on the historical cost basis except for the investments at fair value through profit or loss in the statement of financial position which are measured at fair value.
(c) Functional and presentation currency These financial statements are presented in Canadian dollars, which is the functional currency for both Estates and Trusts and the Administration Fund. Except as otherwise indicated, all financial information presented in Canadian dollars has been rounded to the nearest dollar.
(d) Use of estimates and judgements The preparation of the financial statements in conformity with IFRS requires management to make judgements, estimates and assumptions that affect the application of accounting policies and the reported amounts of assets, liabilities, income and expenses. Actual results may differ from those estimates. Estimates and underlying assumptions are reviewed on an ongoing basis. Revisions to accounting estimates are recognized in the year in which the estimates are revised and in any future periods affected. Information about assumptions and estimation uncertainties that have a significant risk of resulting in a material adjustment within the next financial year, as well as critical judgments in applying accounting policies that have the most significant effect on the amounts recognized in the financial statements are included in note 3(d) and note 5.
3. Significant accounting policies The significant accounting policies set out below have been applied consistently to all periods presented in these financial statements.
(a) Foreign currency
Transactions in foreign currencies are translated into Canadian Dollars using exchange rates prevailing at the dates of the transactions. Monetary assets and liabilities denominated in foreign currencies are converted to Canadian Dollars at the exchange rate at the reporting period end date. The foreign currency gain or loss on monetary items is the difference between the amortized cost in Canadian Dollars at the beginning of the period, adjusted for effective interest and payments during the period, and the amortized cost in foreign currency translated at the exchange rate at the reporting period end date. Non-monetary assets and liabilities denominated in foreign currencies that are measured at fair value are retranslated to Canadian Dollars at the exchange rate at the reporting period end date. Foreign currency differences arising on translation are recognized in profit or loss on a net basis.
3-88 PUBLIC ACCOUNTS, 2013-2014

Notes to financial statements (continued) March 31, 2014 and 2013 3. Significant accounting policies (continued) (b) Net investment income (loss) Net investment income (loss) comprises interest income on funds invested, dividend income, gains or losses on the
disposal of investment securities, changes in the value of financial assets at fair value through profit or loss and impairment losses recognized on financial assets. Income and expenses are presented on a net basis only when permitted under IFRS, for example, gains and losses from financial instruments at fair value through profit or loss.
(i) Interest income and expense
Interest income and expense is recognized on an accrual basis in profit or loss, using the effective interest method. The effective interest rate is the rate that exactly discounts the estimated future cash payments and receipts through the expected life of the financial instrument (or, when appropriate, a shorter period) to the carrying amount of the financial instrument. When calculating the effective interest rate, estimates are made of future cash flows considering all contractual terms of the financial instrument, but not future credit losses.
(ii) Dividend income Dividend income is recognized in profit or loss on the date that the fund’s right to receive payment is established, which in the case of quoted securities is the ex-dividend date.
(iii) Net gain (loss) on investments at fair value through profit or loss Net gain (loss) on investments at fair value through profit or loss includes realized and unrealized fair value changes,
but excludes interest and dividend income. The net realized gain (loss) on investments at fair value through profit or loss is calculated using the average cost method.
(c) Financial assets and liabilities (i) Financial assets
Financial assets in OPGT include the following: financial assets at fair value through profit or loss, held-to-maturity financial assets and loans and receivables. The Public Guardian and Trustee does not directly enter into derivative financial contracts. Financial assets at fair value through profit or loss Financial assets are designated at fair value through profit or loss upon initial recognition when the Public Guardian and Trustee on behalf of Estates and Trusts and the Administration Fund manages, evaluates and reports internally such investments on a fair value basis and makes purchase and sale decisions based on their fair value in accordance with their documented risk management or investment strategy. Upon initial recognition, transaction costs associated with the asset are recognized in profit or loss as incurred. Financial assets at fair value through profit or loss are measured at fair value, and changes therein are recognized in profit or loss. The Public Guardian and Trustee does not acquire or hold financial instruments for the purpose of trading or short-term profit taking on behalf of the Estates and Trusts and the Administration Fund. Financial assets at fair value through profit or loss comprise investments in client-owned bonds and other debt securities, the Diversified Fund, the Canadian Income and Dividend fund and client-owned equity securities. Financial assets are derecognized when the contractual rights to the cash flows from the asset expire, or when the rights to receive the contractual cash flows or when substantially all the risks and rights of ownership of the financial asset are transferred. Financial assets and liabilities are offset and the net amount presented in the statement of financial position when, and only when, OPGT has a legal right to offset the amounts and intend either to settle on a net basis or to realize the asset and settle the liability simultaneously.
PUBLIC ACCOUNTS, 2013-2014 3-89

Notes to financial statements (continued) March 31, 2014 and 2013 3. Significant accounting policies (continued) (c) Financial assets and liabilities (continued) (i) Financial assets (continued)
Held-to-maturity financial assets If the Public Guardian and Trustee on behalf of Estates and Trusts and the Administration Fund has the positive intent and ability to hold debt securities to maturity, then such financial assets are classified as held-to-maturity. Held-to-maturity financial assets are recognized initially at fair value, which includes any premium or discount, plus any directly attributable transaction costs. Subsequent to initial recognition, held-to-maturity financial assets are measured at amortized cost using the effective interest method, less any impairment losses. Any sale or reclassification of a more than insignificant amount of held-to-maturity investments not close to their maturity would result in the reclassification of all held-to-maturity investments as available-for-sale, and would prevent these investment securities from being classified as held-to-maturity for the current and the following two financial years. Held-to-maturity financial assets comprise investments in fixed income funds. Fixed income funds are funds invested in money-market instruments and in bonds under a laddered buy-and-hold strategy. Loans and receivables Loans and receivables are financial assets with fixed or determinable payments that are not quoted in an active market. Such assets are recognized initially at fair value plus any directly attributable transaction costs. Loans and receivables comprise accounts receivable. Loans and receivables of Estates and Trust clients are recognized initially on the date that the OPGT assumes guardianship of an individual’s property or becomes estate trustee. All other purchases and sales of financial assets (including assets designated at fair value through profit or loss) are recognized on the settlement date, which is the date that the financial assets are delivered to or on behalf of Estates and Trusts. Cash and Cash Equivalents Cash and cash equivalents comprise cash on hand, current bank balances and short-term deposits with banks. All cash equivalents are highly liquid financial assets with original maturities of three months or less from the acquisition date that are subject to an insignificant risk of changes in their fair value.
(ii) Financial liabilities Financial liabilities are recognized initially on the date at which the Public Guardian and Trustee on behalf of Estates and Trusts and the Administration Fund become a party to the contractual provisions of the instrument. The Public Guardian and Trustee on behalf of the Estates and Trusts and the Administration Fund derecognizes a financial liability when its contractual obligations are discharged or cancelled or expire. Financial liabilities comprise accounts payable and accrued liabilities. Such financial liabilities are recognized initially at fair value plus any directly attributable transaction costs.
3-90 PUBLIC ACCOUNTS, 2013-2014

Notes to financial statements (continued) March 31, 2014 and 2013 3. Significant accounting policies (continued) (c) Financial assets and liabilities (continued) (iii) Fair value measurement
Fair value is the amount for which an asset could be exchanged, or a liability settled, between knowledgeable, will-ing parties in an arm’s-length transaction on the measurement date. Fair value does not take into consideration transaction costs expected to be incurred on transfer or disposal of a financial instrument. The Public Guardian and Trustee on behalf of Estates and Trusts and the Administration Fund measures the fair value of an instrument using quoted prices in an active market for that instrument. A market is regarded as active if quoted prices are readily and regularly available and represent actual and regularly occurring market transactions on an arm’s length basis. The best evidence of the fair value of a financial instrument at initial recognition is the transaction price, i.e., the fair value of the consideration given or received, unless the fair value of that instrument is evidenced by comparison with other observable current market transactions in the same instrument (i.e., without modification or repackaging) or based on a valuation technique whose variables include only data from observable markets. When transaction price provides the best evidence of fair value at initial recognition, the financial instrument is initially measured at the transaction price and any difference between this price and the value initially obtained from a valuation model is subsequently recognized in profit or loss on an appropriate basis over the life of the instrument but not later than when the valuation is supported wholly by observable market data or the transaction is closed out. Equity and fixed income securities publicly traded are measured at the bid price. Fair values reflect the credit risk of the instrument and include adjustments to take account of the credit risk of the counter party where appropriate. All changes in fair value are recognized in profit or loss as part of net gain from financial instruments at fair value through profit or loss. Other interest and dividend income is recognized in profit and loss separately.
(iv) Impairment A financial asset not carried at fair value through profit or loss is assessed at each reporting date to determine
whether there is objective evidence that its value is impaired. A financial asset is impaired if objective evidence indicates that a loss event has occurred after the initial recognition of the asset, and that the loss event had a negative effect on the estimated future cash flows of that asset that can be estimated reliably.
Objective evidence that financial assets (including equity securities) are impaired includes significant financial
difficulty of the borrower, default or delinquency by a borrower, restructuring of an amount due on terms that the Public Guardian and Trustee on behalf of Estates and Trusts and the Administration Fund would not consider otherwise, indications that a borrower or issuer will enter bankruptcy, or the disappearance of an active market for a security. In addition, for an investment in an equity security, a significant or prolonged decline in its fair value below its cost is objective evidence of impairment.
An impairment loss in respect of a financial asset measured at amortized cost is calculated as the difference between its carrying amount and the present value of the estimated future cash flows discounted at the asset’s original effective interest rate. Losses are recognized in profit or loss. Interest on the impaired asset continues to be recognized through the unwinding of the discount. When a subsequent event causes the amount of impairment loss to decrease, the decrease in impairment loss is reversed through profit or loss.
PUBLIC ACCOUNTS, 2013-2014 3-91

Notes to financial statements (continued) March 31, 2014 and 2013 3. Significant accounting policies (continued) (d) Real estate and other assets
Real estate included within the statement of financial position primarily represents residential properties currently owned by clients of The Public Guardian and Trustee. Other assets comprise jewellery, art, collectibles, nominal assets, vehicles, cash value of insurance policies, prepaid funeral costs and similar items. The IFRS Framework identifies acceptable measurement bases for all assets, which include cost and fair value. The policy is to measure real estate assets at historic cost and other assets at the fair value determined when the asset is initially recognized.
(e) Intangible assets: Computer software – Client Management Information System (i) Recognition and measurement
Intangible assets that are acquired by the Administration Fund and have finite useful lives are measured at cost less accumulated amortization and accumulated impairment losses.
(ii) Subsequent expenditure Subsequent expenditure is capitalized only when it increases the future economic benefits embodied in the specific asset to which it relates. All other costs including the costs of day-to-day servicing of intangible assets are recognized in profit or loss as incurred.
(iii) Amortization Amortization is calculated over the life of the asset less its residual value. Amortization is recognized in profit or loss on a straight-line basis over the estimated useful lives of intangible assets, from the date that they are available for use, since this most closely reflects the expected pattern of consumption of the future economic benefits embodied in the asset. The estimated useful life for the current and comparative period is 5 years.
(f) Operating leases All the leases entered into by the Public Guardian and Trustee on behalf of the Estates and Trusts and the Administration Fund are classified as operating leases and are not recognized in the statement of financial position. Payments made under operating leases are recognized in profit or loss on a straight-line basis over the term of the lease. Lease incentives received are recognized as an integral part of the total lease expense, over the term of the lease. Contingent lease payments are accounted for in the period in which they are incurred or when they are reasonably estimable and become known.
3-92 PUBLIC ACCOUNTS, 2013-2014

Notes to financial statements (continued) March 31, 2014 and 2013 3. Significant accounting policies (continued) (g) Employee benefits (i) Short-term employee benefits
Short-term employee benefit obligations are measured on an undiscounted basis and are expensed as the related service is provided. A liability is recognized for the amount expected to be paid under short-term employee benefit plans if the Administration Fund has a present legal or constructive obligation to pay the amount as a result of past service provided by the employee, and the obligation can be estimated reliably.
(ii) Post-employment benefits Staff of the Public Guardian and Trustee are employees of the Ontario Public Service which provides pension benefits to its employees through participation in the Public Service Pension Fund and the Ontario Public Service Employees’ Union Pension Fund. The Ministry of Government Services (MGS) funds the employer’s contribution to the Pension Funds. In addition, the cost of post-retirement, non-pension employee benefits are paid by MGS. As such, the Public Guardian and Trustee makes no contributions on these post-employment benefit plans. There is no contractual agreement or stated policy for charging the net benefit cost for the plans as a whole (measured in accordance with IAS 19, Employee Benefits) to individual reporting entities of the Government of Ontario. As a result, the costs associated with post-employment benefits are not reflected in the financial statements.
(h) Income and expenses
Income from pensions, social benefits and settlements and items of a related nature is recognized when received or receivable. Other income comprising compensation, transaction and service fees are recognized as the related services are performed. Expenses are recognized as incurred on an accrual basis. Investment management fees, placement and transaction fees that do not qualify for inclusion as part of the initial measurement of an asset are expensed as the services are received.
(i) Government grants Grants are in the form of funding of the Public Guardian and Trustee operating expenses as the expenses are incurred.
Grants that compensate the Administration Fund for the operations of The Public Guardian and Trustee by way of amounts recovered from the Ministry of the Attorney General, are recognized in profit or loss as income on a systematic basis in the same periods in which the expenses are recognized.
(j) Income taxes The Public Guardian and Trustee is exempt from federal and provincial income taxes under the Income Tax Act (Canada).
(k) Funds and reserves – Administration Fund Client Management Information System Reserve This reserve represents funds that were appropriated for the specific purpose of developing and implementing a new client management information system. The client management information system was developed from 2002 to 2009. During each reporting period, an amount equal to the amortization charge incurred on the client management information system is transferred from this reserve to the Unappropriated Fund. Assurance Fund The Public Guardian and Trustee Act and the regulations under the Act provide that an Assurance Fund shall be established to meet losses for which The Public Guardian and Trustee might become liable. During the year, the Assurance Fund released and was reimbursed $585,751 (2013: $176,158) by the Unappropriated Fund. Litigation Reserve Fund This reserve is used to cover expenses and costs of legal proceedings paid by The Public Guardian and Trustee on behalf of its litigation guardian clients. During the year, legal costs incurred on behalf of clients of $158,417 (2013: $73,491) were released from this reserve and were reimbursed by the Unappropriated Fund.
PUBLIC ACCOUNTS, 2013-2014 3-93

Notes to financial statements (continued) March 31, 2014 and 2013 3. Significant accounting policies (continued) (k) Funds and reserves (continued)
Reserve for Doubtful Accounts The intent of this reserve is to provide for all clients’ accounts whereby The Public Guardian and Trustee has advanced funds on a client’s behalf and has a statutory lien pursuant to section 8.1 of the Public Guardian and Trustee Act but may not be able to recover the amount from the client. Capacity Assessment Fund This reserve was set up to cover fees of capacity assessors when a client is unable to pay costs of an assessment or re-assessment. During the year, the Capacity Assessment Fund released and was reimbursed $26,702 (2013: $15,338) by the Unappropriated Fund. Unappropriated Fund Pursuant to Section 9(5) of the Public Guardian and Trustee Act, the Lieutenant Governor in Council may from time to time direct the payment into the Consolidated Revenue Fund of the Province of any balance at the credit of the Administration Fund. No such transfers were made during the year.
(l) Provisions
A provision is recognized if, as a result of a past event, the Public Guardian and Trustee has a present legal or constructive obligation that can be estimated reliably, and it is probable that an outflow of economic benefits will be required to settle the obligation.
(m) New standards and interpretations not yet adopted IFRS 9, Financial Instruments IFRS 9 deals with recognition, derecognition, classification and measurement of financial assets and financial liabilities. Its requirements represent a significant change from the existing requirements in IAS 39 in respect of financial assets. The standard contains two primary measurement categories for financial assets: at amortized cost and fair value. A financial asset would be measured at amortized cost if it is held within a business model whose object is to hold assets in order to collect contractual cash flows, and the asset’s contractual cash terms give rise on specified dates to cash flows that are solely payments of principal and interest on the principal outstanding. All other financial assets would be measured at fair value. The standard eliminates the existing IAS 39 categories of held to maturity, available for sale and loans and receivables. For an investment in an equity instrument that is not held for trading, the standard permits an irrevocable election, on initial recognition, on an individual security-by-security basis, to present all fair value changes from the investment in other comprehensive income. No amount recognized in other comprehensive income would ever be reclassified to profit or loss. However, dividends on such investments are recognized in profit or loss, rather than other comprehensive income unless they clearly represent a partial recovery of the cost of the investment. Investments in equity instruments in respect of which an entity does not elect to present fair value changes in other comprehensive income would be measured at fair value with changes in fair value recognized in profit or loss. The requirements of IFRS 9 relating to derecognition are unchanged from IAS 39. The required implementation date of IFRS 9 has been postponed indefinitely. Although early application is permitted, management does not plan to adopt this standard until necessary for the OPGT. Management expects that the adoption of this standard will not have a significant impact on the measurement of the amounts recognized in the financial statements.
3-94 PUBLIC ACCOUNTS, 2013-2014
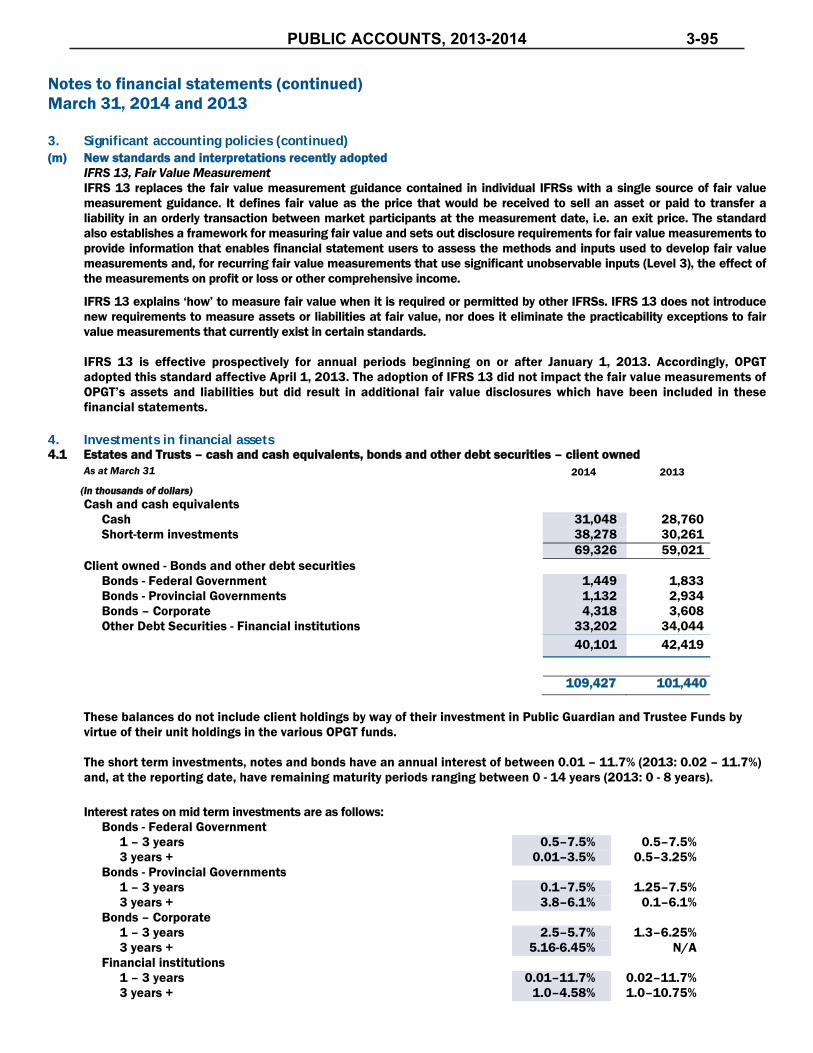
Notes to financial statements (continued) March 31, 2014 and 2013 3. Significant accounting policies (continued) (m) New standards and interpretations recently adopted
IFRS 13, Fair Value Measurement IFRS 13 replaces the fair value measurement guidance contained in individual IFRSs with a single source of fair value measurement guidance. It defines fair value as the price that would be received to sell an asset or paid to transfer a liability in an orderly transaction between market participants at the measurement date, i.e. an exit price. The standard also establishes a framework for measuring fair value and sets out disclosure requirements for fair value measurements to provide information that enables financial statement users to assess the methods and inputs used to develop fair value measurements and, for recurring fair value measurements that use significant unobservable inputs (Level 3), the effect of the measurements on profit or loss or other comprehensive income.
IFRS 13 explains ‘how’ to measure fair value when it is required or permitted by other IFRSs. IFRS 13 does not introduce new requirements to measure assets or liabilities at fair value, nor does it eliminate the practicability exceptions to fair value measurements that currently exist in certain standards. IFRS 13 is effective prospectively for annual periods beginning on or after January 1, 2013. Accordingly, OPGT adopted this standard affective April 1, 2013. The adoption of IFRS 13 did not impact the fair value measurements of OPGT’s assets and liabilities but did result in additional fair value disclosures which have been included in these financial statements.
4. Investments in financial assets 4.1 Estates and Trusts – cash and cash equivalents, bonds and other debt securities – client owned
As at March 31 2014 2013
(In thousands of dollars) Cash and cash equivalents
Cash 31,048 28,760 Short-term investments 38,278 30,261 69,326 59,021
Client owned - Bonds and other debt securities Bonds - Federal Government 1,449 1,833 Bonds - Provincial Governments 1,132 2,934 Bonds – Corporate 4,318 3,608 Other Debt Securities - Financial institutions 33,202 34,044
40,101 42,419
109,427 101,440 These balances do not include client holdings by way of their investment in Public Guardian and Trustee Funds by virtue of their unit holdings in the various OPGT funds. The short term investments, notes and bonds have an annual interest of between 0.01 – 11.7% (2013: 0.02 – 11.7%) and, at the reporting date, have remaining maturity periods ranging between 0 - 14 years (2013: 0 - 8 years). Interest rates on mid term investments are as follows:
Bonds - Federal Government 1 – 3 years 0.5–7.5% 0.5–7.5% 3 years + 0.01–3.5% 0.5–3.25%
Bonds - Provincial Governments 1 – 3 years 0.1–7.5% 1.25–7.5% 3 years + 3.8–6.1% 0.1–6.1%
Bonds – Corporate 1 – 3 years 2.5–5.7% 1.3–6.25% 3 years + 5.16-6.45% N/A
Financial institutions 1 – 3 years 0.01–11.7% 0.02–11.7% 3 years + 1.0–4.58% 1.0–10.75%
PUBLIC ACCOUNTS, 2013-2014 3-95

Notes to financial statements (continued) March 31, 2014 and 2013 4. Investments in financial assets (continued) 4.1 Estates and Trust – client owned (continued)
Interest income is distributed to client accounts based on an interest rate as approved by The Public Guardian and Trustee’s Investment Advisory Committee. During the year, the approved rate for Canadian funds from April 1, 2013 to March 31, 2014: 2.75% (at March 31, 2013: 3.00%), and for the United States Dollar funds: 0.30% (2013: 0.30%).
4.2 Diversified fund The Public Guardian and Trustee has a Diversified fund that includes high quality equity and fixed income securities. This
fund is a unitized trust and was established in order to provide an alternative for those clients whose investment objectives require a broader, longer range investment strategy. The fund is subject to the investment guidelines of the Trustee Act and the guidelines and limitations as set by The Public Guardian and Trustee with emphasis on the need to preserve and enhance capital over the longer term.
As at March 31 2014 2013 (In thousands of dollars) Cash 1,861 1,352 Short-term notes 369 383 Bonds 45,946 42,583 Canadian equity securities 54,407 50,599 Foreign equity securities 38,834 31,856 Net accrual and payable 266 (123) 141,683 126,650
The short term notes and bonds yield, on a fair value basis, annual interest of between -0.95 – 12.2% (2013: -0.11 – 6.29 %) and, at the reporting date, have remaining maturity periods ranging between 1 month – 53 years (2013: 2 months – 95 years). The weighted average yield on investments in Canadian and Foreign equity securities is 26.22% (2013: 12.23%).
The financial assets held in the Diversified fund as at March 31 are held by: In thousands of dollars 2014 2013 Estates and Trusts 76,112 68,197 Administration Fund 65,571 58,453 141,683 126,650
The investment returns on this fund accrue directly to the unit holders.
4.3 Canadian income and dividend fund
The Public Guardian and Trustee has a Canadian income and dividend fund that consists of a balanced portfolio of high quality income-producing Canadian securities. The fund includes dividend-paying common and preferred equities and fixed income securities intended to generate a consistent stream of income and long-term capital appreciation. The fund is subject to the investment guidelines of the Trustee Act and the guidelines and limitations as set by The Public Guardian and Trustee.
As at March 31 2014 2013
(In thousands of dollars) Cash 173 26 Short-term notes 851 752 Bonds 43,974 39,873 Canadian equity securities 58,884 52,397 Other assets 897 1,064 104,779 94,112
3-96 PUBLIC ACCOUNTS, 2013-2014

Notes to financial statements (continued) March 31, 2014 and 2013 4. Investments in financial assets (continued) 4.3 Canadian income and dividend fund (continued)
The short term notes and bonds yield, on a fair value basis, annual interest of between 0.95 – 11.0% (2013: 0.49 – 3.93%) and, at the reporting date, have remaining maturity periods ranging between 2 months – 53 years (2013: 5 months – 94 years). The average yield on investments in Canadian equity securities is 16.0% (2013: 10.1% ). The financial assets held in the Canadian Income and Dividend Fund as March 31 are held by: As at March 31 2014 2013 (In thousands of dollars) Estates and Trusts 82,177 73,488 Administration Fund 22,602 20,624 104,779 94,112
The income earned in this fund may be distributed in cash to unit holders monthly or reinvested in this fund.
4.4 Equity securities – client owned
As at March 31 2014 2013 (In thousands of dollars) Canadian listed securities 26,836 24,978 United States listed securities 863 796 Other listed securities 3,572 2,938 Unlisted securities 527 88 31,798 28,800
These balances do not include indirect client holdings by way of their investment in Public Guardian and Trustee Funds by virtue of unit holdings in the various OPGT funds.
4.5 Fixed Income Funds – Estates and Trusts
As at March 31 2014 2013 (In thousands of dollars) Bonds - Federal Government 21,789 47,911 Bonds - Provincial and Municipal Governments 409,921 480,524 Bonds – Corporate 673,130 544,512 Cash and Accrued Interest 8,547 9,105 1,113,387 1,082,052
The bonds yield (at cost) annual interest of between 1.9 – 5.5% (2013: 1.15 – 5.13%) and, at the reporting date, have remaining maturity periods ranging between 0 – 6 years (2013: 0 – 7.8 years).
PUBLIC ACCOUNTS, 2013-2014 3-97

Notes to financial statements (continued) March 31, 2014 and 2013 5. Financial risk management
The Public Guardian and Trustee has exposure to credit risk, liquidity risk and market risk arising from financial instruments. This note presents information about OPGT’s exposure to each of the above risks, and the OPGT’s objectives, policies and processes for management of capital and measuring and managing risk.
5.1 Credit risk Management of credit risk
Credit risk is the risk that a counterparty to a financial instrument will fail to discharge an obligation or commitment that it has entered into with the Public Guardian and Trustee, resulting in a financial loss to the Estates and Trusts and the Administration Fund. It arises principally from debt securities held and accounts receivable. The Public Guardian and Trustee mitigates this risk by engaging experienced investment managers and structuring their investment policies and goals to minimize the risk to clients’ capital. In particular, investments in lower investment grade fixed income instruments (typically a rating of BBB) are minimized. As well, investment managers are required to report immediately adverse changes in the credit ratings of financial instruments. Client accounts receivable are reviewed on an individual basis; any necessary adjustments to amounts recorded are made at that time. Exposure to credit risk The carrying amount of financial assets represents the maximum credit exposure. The maximum exposure to credit risk at the reporting date for the financial assets of both Estates and Trusts and the Administration Fund was: As at March 31 2014 2013 (In thousands of dollars) Cash and cash equivalents 72,043 59,377 Accounts receivable 13,356 7,697 Investments at fair value through profit or loss: Bonds and other debt securities– client owned 40,101 42,419 Diversified fund 48,176 44,318 Canadian income and dividend fund 44,998 40,651 Held to maturity investments: Fixed income funds 1,113,387 1,082,052 1,332,061 1,276,514
Credit quality As at March 31, Estates and Trusts and the Administration Fund hold unit investments in the Public Guardian and Trustee’s unit funds that have underlying debt securities with the following credit quality: Debt Securities
2014 2013
AAA/Aaa 14.92% 19.24% AA/Aa 82.83% 80.42% BBB/Baa 2.25% 0.34%
3-98 PUBLIC ACCOUNTS, 2013-2014

Notes to financial statements (continued) March 31, 2014 and 2013
5. Financial risk management (continued) 5.1 Credit risk (continued)
Concentration of credit risk As at March 31, the debt securities of Estates and Trusts and the Administration Fund hold unit investments in the Public Guardian and Trustee’s unitized funds that have underlying debt securities that were concentrated in the following sectors: Debt Securities
2014 2013
Government and public sector 28.67% 48.42% Banks and financial services 65.12% 45.10% Other corporate 6.21% 6.48% Past due and impaired assets No financial assets carried at amortized cost were past due or impaired at March 31, 2014.
5.2 Liquidity risk Liquidity risk is the risk that investment managers engaged by the Public Guardian and Trustee will not be able to easily
liquidate a financial asset or liability.
The objective of the Public Guardian and Trustee is to ensure that adequate financial resources are available to meet ongoing requirements and to discharge the obligations of Estates and Trusts and the Administration Fund. The Public Guardian and Trustee mitigates liquidity risk by maintaining significant holdings in short-term, liquid, money market instruments within OPGT’s fixed income funds.
Maturity analysis for financial instruments As at March 31, the financial assets and liabilities of Estates and Trusts and the Administration Fund had the following remaining contractual maturity profile: 2014 In thousands of dollars
Carrying Amount Less than 3 months 3 to 12 months >1 year
Financial assets Cash and cash equivalents 72,043 72,043 - - Accounts receivable 13,356 12,417 - 939 Investments at fair value through profit or loss: Bonds and other debt securities– client owned 40,101 11,309 10,654 18,138 Diversified fund 141,683 96,194 3,276 42,213 Canadian income and dividend fund 104,779 60,998 1,814 41,967 Equity securities – client owned 31,798 31,798 - - Held to maturity investments: Fixed income funds 1,113,387 92,545 214,216 806,626
1,517,147 377,304 229,960 909,883 Financial liabilities Accounts payable and accrued liabilities 57,596 10,385 - 47,211 Net assets attributable to beneficiaries of Estates and Trusts
1,481,142 1,180,205 38,136 262,801
1,538,738 1,190,590 38,136 310,012
PUBLIC ACCOUNTS, 2013-2014 3-99

Notes to financial statements (continued) March 31, 2014 and 2013
5. Financial risk management (continued) 5.2 Liquidity risk (continued)
2013 In thousands of dollars
Carrying Amount Less than 3 months 3 to 12 months >1 year
Financial assets Cash and cash equivalents 59,377 59,377 - - Accounts receivable 7,697 6,807 - 890 Investments at fair value through profit or loss: Bonds and other debt securities– client owned 42,419 7,572 10,556 24,291 Diversified fund 126,650 83,922 388 42,340 Canadian income and dividend fund 94,112 53,305 1,190 39,617 Equity securities – client owned 28,800 28,800 - - Held to maturity investments: Fixed income funds 1,082,052 153,762 121,252 807,038
1,441,107 393,545 133,386 914,176 Financial liabilities Accounts payable and accrued liabilities 57,743 6,978 - 50,765 Net assets attributable to beneficiaries of Estates and Trusts
1,418,342 1,122,644 38,390 257,308
1,476,085 1,129,622 38,390 308,073
5.3 Market risk Market risk is the risk that changes in market prices, such as interest rates, equity prices, foreign exchange rates and credit spreads (not relating to changes in the obligor’s/issuer’s credit standing) will affect investment income or the value of the holdings in financial instruments. The objective of market risk management is to manage and control market risk exposures within acceptable parameters, while optimizing the return on risk. Market risk comprises currency risk, interest rate risk and other price risks (including equity price risk).
5.3.1 Currency risk Currency risk is the risk that the fair value of investment assets and earnings on those assets will fluctuate as a result of changes in foreign exchange rates. Investments in the Diversified fund are exposed to this risk which is also part of the return potential in the fund. Hedging foreign currency exposure is considered by management as part of an annual review of investment policies. At March 31, the carrying value of net financial assets and liabilities held in foreign currencies expressed in Canadian Dol-lars is as follows: In thousands of dollars 2014 2013 Estates and Trusts United States Dollars 28,116 25,777 Euros 5,007 3,151 Other foreign currencies 6,405 3,362 39,528 32,290
3-100 PUBLIC ACCOUNTS, 2013-2014

Notes to financial statements (continued) March 31, 2014 and 2013
5. Financial risk management (continued) 5.3 Market risk (continued) 5.3.1 Currency risk (continued)
The table below sets out the impact on net financial assets and liabilities from a reasonably possible weakening of the Canadian Dollar against the other currencies by 5% (2013: 5%) at March 31. The analysis assumes that all other variables, in particular interest rates, remain constant. In thousands of dollars 2014 2013
United States Dollars 1,406 1,289
Euros 250 158
Other foreign currencies 320 168
1,976 1,615 A strengthening of the Canadian Dollar against the other currencies would have resulted in a proportionate but opposite effect to the amounts shown above.
5.3.2 Interest rate risk Interest rate risk is the risk that the fair value of future cash flows of a financial instrument will fluctuate because of changes in market interest rates. By adopting a hold to maturity policy on its fixed income funds, the Public Guardian and Trustee has significantly mitigated this risk, particularly for short-term, temporary movements in market interest rates. The table below sets out the impact on the net financial assets and liabilities from a reasonably possible increase of 50-75 basis points in interest rates as at March 31. The impact of such an increase has been estimated by calculating the fair value changes of the fixed interest debt securities, excluding the fixed income funds which are held to maturity. This analysis assumes that all other variables, in particular foreign currency rates, remain constant.
In thousands of dollars 2014 2013
Impact on client (Estates and Trusts) and Administration fund assets
(673)
(753)
5.3.3 Equity price risk
Equity price risk is the risk that the fair value of equity securities will fluctuate as a result of changes in the market price of equity instruments whether caused by factors specific to an individual investment or factors affecting all instruments traded in the market which, for international equities, includes changes in currency rates. The Public Guardian and Trustee has mitigated this risk by engaging experienced investment managers and structuring their investment policies and goals, including limits on the holding of individual securities, limits on the investments in non-government debt, and defining asset component ranges to minimize the risk to clients’ capital. As well, investments in financial instruments that are subject to changes in market prices, including equity securities, are undertaken only when the client can invest for a medium to longer term. Investments are made in funds, namely the Diversified fund and the Canadian income and dividend fund that have the following benchmarks for concentration of asset portfolios: Equity investments listed on Canadian stock exchanges - 50% of fund assets Equity investments listed on US stock exchanges - 15% of fund assets Equity investments listed on other stock exchanges - 15% of fund assets Unlisted equity investments - none Investment managers are permitted to vary from these benchmarks within stipulated limits.
PUBLIC ACCOUNTS, 2013-2014 3-101

Notes to financial statements (continued) March 31, 2014 and 2013 5. Financial risk management (continued) 5.3 Market risk (continued) 5.3.3 Equity price risk (continued)
Investment managers further monitor concentration of risk based on counterparties and industry sectors. At March 31, equity investments are concentrated in the following sectors: 2014 2013 Banks and financial services 47% 47% Information technology 10% 13% Retail 6% 11% Industrial and manufacturing 13% 23% Other 24% 6% 100% 100% Investment managers engaged by the Public Guardian and Trustee estimate future reasonably possible equity price fluctuations for equity securities on an individual investment basis. The table below sets out the impact on the net financial assets and liabilities from a reasonably possible decrease of 10% in the price of individual equity securities as at March 31. This analysis assumes that all other variables, in particular interest and foreign currency rates, remain constant. In thousands of dollars 2014 2013
Impact on value of equity securities (18,392) (16,365) A strengthening in the individual equity market prices of 10% as at March 31 would have resulted in a proportionate but opposite effect to the amounts shown above.
5.4 Fair value disclosures The accounting policy for fair value measurements is detailed in accounting policy 3c(iii).
5.4.1 Fair values versus carrying amounts
The carrying amounts approximate fair value for all financial assets and liabilities, except for the fixed income funds which are held to maturity investments whose fair values for the Estates and Trusts administered by OPGT is $1,128,300 (2013: $1,105,448). As a result, the fair value of net assets attributable to beneficiaries of Estates and Trust clients is $1,496,054 (2013: $1,441,738).
5.4.2 Fair value hierarchy The fair value measurements used by the Public Guardian and Trustee place the highest priority on observable market inputs and the lowest priority on unobservable internally developed inputs. Accordingly, the Public Guardian and Trustee classifies its assets and liabilities that are measured at fair value, or for which fair value information is disclosed, within a three-level valuation hierarchy that reflects the inputs to valuation techniques used to determine fair value. Level 1 represents valuations based on unadjusted quoted prices in active markets for identical assets or liabilities, level 2 comprises valuations using models or techniques that incorporate observable market information and level 3 comprises valuations based models without observable market information as inputs. Refer to IFRS13 –Fair value measurement in Note 3(m). The classification determination is based on the lowest level of input that is significant to the valuation.
3-102 PUBLIC ACCOUNTS, 2013-2014

Notes to financial statements (continued) March 31, 2014 and 2013 5. Financial risk management (continued) 5.4 Fair value disclosures (continued) 5.4.2 Fair value hierarchy (continued)
The following fair value hierarchy table presents information about financial assets measured at fair value on a recurring basis as of March 31, 2014 and 2013. Estates and Trusts As of March 31, 2014 Level 1 Level 2 Level 3 Total In thousands of dollars
Cash and cash equivalents 69,326 - - 69,326 Investments at fair value through profit or loss: Bonds and other debt securities– client owned - 40,101 - 40,101 Diversified fund 76,112 - - 76,112 Canadian income and dividend fund 82,177 - - 82,177 Equity securities – client owned - 31,798 - 31,798 227,615 71,899 - 299,514
As of March 31, 2013 Level 1 Level 2 Level 3 Total In thousands of dollars
Cash and cash equivalents 59,021 - - 59,021 Investments at fair value through profit or loss: Bonds and other debt securities– client owned - 42,419 - 42,419 Diversified fund 68,197 - - 68,197 Canadian income and dividend fund 73,488 - - 73,488 Equity securities – client owned - 28,800 - 28,800 200,706 71,219 - 271,925
Administration Fund As of March 31, 2014 Level 1 Level 2 Level 3 Total In thousands of dollars
Cash and cash equivalents 2,717 - - 2,717 Investments at fair value through profit or loss: Diversified fund 65,571 - - 65,571 Canadian income and dividend fund 22,602 - - 22,602 90,890 - - 90,890
As of March 31, 2013 Level 1 Level 2 Level 3 Total In thousands of dollars
Cash and cash equivalents 356 - - 356 Investments at fair value through profit or loss: Diversified fund 58,453 - - 58,453 Canadian income and dividend fund 20,624 - - 20,624 79,433 - - 79,433
The following was used to determine the fair value measurements categorized in Level 2: The fair value of bonds and equities was determined by obtaining quoted market prices or executable dealer quotes
for identical or similar instruments in inactive markets, or other inputs that are observable or can be corroborated by observable market data.
Transfers between fair value hierarchy levels are considered effective from the beginning of the reporting period in which the transfer is identified. During 2014 and 2013 there were no significant transfers of financial instruments between Level 1 and Level 2.
PUBLIC ACCOUNTS, 2013-2014 3-103

Notes to financial statements (continued) March 31, 2014 and 2013 5. Financial risk management (continued) 5.5 Capital management
The Public Guardian and Trustee’s operating capital is shown in the Administration Fund, and consists of various specific purpose funds and an unappropriated fund (detailed in the statement of changes in equity of the Administration Fund). The Public Guardian and Trustee is not subject to externally imposed capital requirements. The Public Guardian and Trustee’s objectives when managing its Administration Fund are to safeguard its ability to continue operations and provide adequate resources to service clients and safeguard clients’ interests. The Public Guardian and Trustee expects its current capital (fund) resources, together with future cash flows from operations, to be sufficient to support The Public Guardian and Trustee’s ability to operate on an ongoing basis. The objectives have not changed during the year. The Public Guardian and Trustee has invested part of its Administration Fund in the Diversified and Canadian income and dividend funds. Investment income earned is, in part, used to replenish the various specific purpose funds for expenses incurred.
3-104 PUBLIC ACCOUNTS, 2013-2014

Notes to financial statements (continued) March 31, 2014 and 2013
Estates and
Trusts 2014
Estates and
Trusts 2013
Admin Fund 2014
Admin Fund 2013
6. Accounts receivable
As at March 31
In thousands of dollars
Accrued revenue - - 2,144 2,707
Balances due from the Federal and Provincial Government, its Agencies and Crown Corporations
-
-
16
-
Balances due from the Administration Fund 6,256 2,535 - -
Other receivables 2,417 2,430 2,523 25
8,673 4,965 4,683 2,732
7. Other assets
As at March 31
In thousands of dollars
Life Insurance 5,930 5,663 - -
Prepaid Funerals, Cemetery plots and burial instruments
5,102 5,136 - -
Furniture and Medical Aid Equipment 928 950 - -
Jewellery 894 844 - -
Vehicles 761 484 - -
Collectibles 152 306 - -
Art 3 6 - -
Other 698 710 - -
14,468 14,099 - -
8. Accounts payable and accrued liabilities
As at March 31
In thousands of dollars
Accrued expenses 2,082 2,618 2,045 1,824
Balances due to the Federal and Provincial Government, its Agencies and Crown Corporations
6,964
11,755
-
-
Balances due to Estates and Trusts - - 6,256 2,535
Other liabilities of Estates and Trust clients 40,249 39,011 - -
49,295 53,384 8,301 4,359
Other liabilities of Estates and Trusts include mortgages payable, credit card balances, health facility accommodation fees, and charges for services such as telecommunication and utilities.
PUBLIC ACCOUNTS, 2013-2014 3-105

Notes to financial statements (continued) March 31, 2014 and 2013
Admin Fund 2014
Admin Fund 2013
9. Intangible assets
As at March 31
In thousands of dollars
Computer software - client management information system
Cost – beginning and end of the year 11,633 11,633
Accumulated amortization – beginning of the year 9,307 6,980
Amortization for the year 2,326 2,327
Accumulated amortization – end of the year 11,633 9,307
Net book value – beginning of the year 2,326 4,653
Amortization for the year 2,326 2,327
Net book value – end of the year - 2,326
10. Fees charged by the Administration Fund to Estates and Trusts
For the year ended March 31
In thousands of dollars
Client trusts 17,311 17,647
Minors 2,635 2,661
Deceased Estates 2,862 2,540
Litigants 1,595 1,734
Cemetery trusts 198 193
Forfeited corporate assets/corporate trusts 123 62
24,724 24,837
3-106 PUBLIC ACCOUNTS, 2013-2014

Notes to financial statements (continued) March 31, 2014 and 2013
Estates and
Trusts 2014
Estates and
Trusts 2013
Admin Fund 2014
Admin Fund 2013
11. Other interest income
Other interest and dividend income - other sources
For the year ended March 31
In thousands of dollars
Earned on investments at fair value through profit or loss
Bonds and other debt securities-client owned 2,787 2,507 - -
Diversified fund 2,056 1,897 1,804 1,638
Canadian income and dividend fund 3,061 2,765 852 790
Earned on loans and receivables
Accounts receivable 316 373 - -
8,220 7,542 2,656 2,428
12. Gain/loss on investments
12.1 Net realized gain on sale of investments at fair value through profit or loss
For the year ended March 31
In thousands of dollars
Bonds and other debt securities-client owned 90 140 - -
Diversified fund 2,035 1,267 2,316 858
Canadian income and dividend fund 585 473 164 133
Equity securities-client owned 2,155 1,346 - -
4,865 3,226 2,480 991
12.2 Net unrealized gain on investments at fair
value through profit or loss
For the year ended March 31
In thousands of dollars
Bonds and other debt securities-client owned 418 633 - -
Diversified fund 5,112 2,663 4,042 2,464
Canadian income and dividend fund 3,450 1,765 962 469
Equity securities-client owned 5,051 4,333 - -
14,031 9,394 5,004 2,933
PUBLIC ACCOUNTS, 2013-2014 3-107

Notes to financial statements (continued) March 31, 2014 and 2013
Admin Fund 2014
Admin Fund 2013
13. Investment expenses
For the year ended March 31
In thousands of dollars
Investment management fees 886 850
Investment dealer fees 224 175
Custodian fees 266 252
Investment counsel fees 179 175
Bank charges 291 292
1,846 1,744
14. Salaries, wages and benefits
For the year ended March 31
In thousands of dollars
Salaries and wages 30,049 29,830
Compulsory employer contributions 1,970 1,911
Other benefits 1,653 1,832
Termination benefits 391 208
34,063 33,781
15. General Administration
For the year ended March 31
In thousands of dollars
Systems Development and Data Processing 1,857 2,863
Leases and rentals 370 395
Training and education 171 175
Security 230 171
Miscellaneous expenses 350 436
2,978 4,040
3-108 PUBLIC ACCOUNTS, 2013-2014

Notes to financial statements (continued) March 31, 2014 and 2013 16. Related party transactions
The Government of the Province of Ontario, its Agencies and its Crown Corporations are related parties to the Public Guardian and Trustee. Under IFRS, a reporting entity is exempt from the disclosure requirements of IAS 24, Related Party Disclosures in relation to related party transactions and outstanding balances, including commitments, with a government that has control, joint control or significant influence over the reporting entity and another entity that is a related party because the same government has control, joint control or significant influence over both the reporting entity and the other entity. The Public Guardian and Trustee has utilized this exemption in preparing these financial statements. In the normal course of business, transactions occur with the Government of the Province of Ontario, its Agencies and its crown Corporations and include the following types of transactions and outstanding balances, all of which have been recognized in these financial statements: a) Investments in certain financial instruments that are issued by these related parties; b) Expenditure on certain services including information technology and telecommunication costs provided by
these related parties; and c) The Province of Ontario provides funding for the operations of OPGT including expenditures relating to salaries,
wages and benefits, transportation and communication costs, supplies, equipment and general administrative costs. In addition, OPGT remits surplus income to the Province of Ontario on a quarterly basis. During the year the Province provided funding amounting to $38,446,018 (2013: $39,198,546) and recovered $22,051,298 (2013: $21,928,500), for a net grant by the Province of $16,394,720 (2013: $17,270,046).
In addition, in the normal course of business, the following transactions are entered into with these related parties at no charge to the Public Guardian and Trustee and therefore are not reflected in the financial statements: a) Staff of the Public Guardian and Trustee are employees of the Ontario Public Service which provides pension
benefits to its employees through participation in the Public Service Pension Fund and the Ontario Public Service Employees’ Union Pension Fund. The Ministry of Government Services (MGS) funds the employer’s contribution to the Pension Funds;
b) The cost of post-retirement, non-pension employee benefits are paid by MGS; c) The Public Guardian and Trustee occupies leased premises paid for by the Ministry of the Attorney General; and d) MGS provides payroll and payment processing for the Public Guardian and Trustee.
Key management personnel compensation
Staff, including key management personnel are employees of the Ministry of the Attorney General, Ontario Public Service (OPS). All management compensation is in accordance with Management Board of Cabinet Compensation Directives and compensation follows approved OPS compensation practices. This includes public disclosure for all individuals earning more than $100,000 in a calendar year.
The benefit plans do not include any specific post–employment, termination or other long term benefits but, as noted in Note 3(g) (ii) the cost of these benefits are funded by MGS.
In addition to the salaries and mandatory employer contributions to government programs (Canada Pension Plan and Employment Insurance), senior managers also participate in various group life, health and dental plans for which the employer shares the premiums.
PUBLIC ACCOUNTS, 2013-2014 3-109

Notes to financial statements (continued) March 31, 2014 and 2013 Key management personnel compensation comprises the following:
In thousands of dollars
Admin Fund 2014
Admin Fund 2013
Salaries and Wages 1,089 985
Employee benefits 23 19
17. Funds Escheated to the Crown
Deceased Estates include estates administered under the Crown Administration of Estates Act and the Estates Act. The Public Guardian and Trustee is authorized by the Escheats Act to take possession of property reverting to the Crown under the Succession Law Reform Act. After a period of ten years, any property so received by the Public Guardian and Trustee which remains unclaimed is required to be transferred to the Consolidated Revenue Fund (CRF) of the Province of Ontario. Such property transfers to the CRF are included in the statement of changes in net assets attributable to beneficiaries of Estates and Trusts. During the year, escheats from Deceased Estates totalling $1,112,991 (2013: $2,183,784) were transferred to the CRF. Under the Escheats Act, the Public Guardian and Trustee may take possession of assets of dissolved corporations which have been forfeited to the Crown under various corporate statutes. Such property transfers to the CRF are included in the statement of changes in net assets attributable to beneficiaries of Estates and Trusts.
18. Contingencies and commitments
The Public Guardian and Trustee is involved in various legal actions arising in the normal course of business operations, the outcome and ultimate disposition of which are not determinable at this time. Liabilities for any settlements will be recognized if and when the criteria for recognizing provisions is met (see accounting policy note 3 (l)).
19. Subsequent events
There have not been any events subsequent to March 31, 2014 that would impact the information presented in these financial statements.
3-110 PUBLIC ACCOUNTS, 2013-2014

RESPONSIBILITY FOR FINANCIAL REPORTING
Role of Management
The accompanying consolidated financial statements are the responsibility of the management of the Workplace Safety and Insurance Board (the “WSIB”) and have been prepared in accordance with International Financial Reporting Standards. The consolidated financial statements include amounts based on management's best estimates and judgments.
Management is responsible for the preparation and fair presentation of these consolidated financial statements, and for such internal control as management determines is necessary to enable the preparation of consolidated financial statements that are free from material misstatement, whether due to fraud or error. The Board of Directors has established an Audit and Finance Committee to oversee that management fulfills these responsibilities. The Audit and Finance Committee meets periodically with management, internal auditors, and external auditors to oversee that their responsibilities are properly discharged with respect to the application of critical accounting policies, consolidated financial statement presentation, disclosures, and recommendations on internal controls.
Role of the Chief Actuary
With respect to the preparation of the consolidated financial statements, the Chief Actuary works with the WSIB actuarial staff to prepare a valuation, including the selection of appropriate assumptions applicable to the WSIB’s benefit liabilities at the consolidated statement of financial position date to determine the valuation of benefit liabilities. Additionally, the Chief Actuary provides an opinion to the Board of Directors regarding the appropriateness of the benefit liabilities recorded by management of the WSIB at the date of the consolidated statement of financial position. The work to form that opinion includes an examination of the sufficiency and reliability of data and a review of the valuation processes. The Chief Actuary is responsible for assessing whether the assumptions and methods used for the valuation of the benefit liabilities are in accordance with accepted actuarial practice, applicable legislation, and associated regulations and directives. In performing the valuation of these liabilities, which are by their very nature inherently variable, the Chief Actuary makes assumptions as to future interest and mortality rates, expenses, related trends, and other contingencies, taking into consideration the circumstances of the WSIB. It is certain that the benefit liabilities will not develop exactly as projected and may, in fact, vary significantly from the projections. Further, the projections make no provision for future claim categories not sufficiently recognized in the claims experience and inventories. The Chief Actuary’s report outlines the scope of the valuation and his opinion.
Role of the External Auditors
The external auditors, Ernst & Young LLP, working under the direction of the Auditor General of Ontario, have performed an independent and objective audit of the consolidated financial statements of the WSIB in accordance with Canadian generally accepted auditing standards. In carrying out their audit, the external auditors make use of the work of the Chief Actuary and his report on the benefit liabilities of the WSIB. The external auditors have full and unrestricted access to the Board of Directors and the Audit and Finance Committee to discuss audit, financial reporting, and related findings. The external auditors’ report outlines the scope of their audit and their opinion on the consolidated financial statements of the WSIB.
I. David Marshall President and Chief Executive Officer
Lawrence E. Davis Chief Financial Officer
April 24, 2014 Toronto, Ontario
PUBLIC ACCOUNTS, 2013-2014 3-111

INDEPENDENT AUDITORS’ REPORT To the Workplace Safety and Insurance Board,
The Minister of Labour and the Auditor General of Ontario
Pursuant to the Workplace Safety and Insurance Act, 1997 (Ontario), which provides that the accounts of the Workplace Safety and Insurance Board (the “WSIB”) shall be audited by the Auditor General of Ontario or under his direction by an auditor appointed by the Lieutenant Governor in Council for that purpose, we have audited the accompanying consolidated financial statements of the WSIB, which comprise the consolidated statement of financial position as at December 31, 2013, the consolidated statements of comprehensive income, changes in deficiency of assets, and cash flows for the year ended December 31, 2013, and the notes to the financial statements.
Management's responsibility for the consolidated financial statements
Management is responsible for the preparation and fair presentation of these consolidated financial statements in accordance with International Financial Reporting Standards, and for such internal control as management determines is necessary to enable the preparation of consolidated financial statements that are free from material misstatement, whether due to fraud or error.
Auditors' responsibility
Our responsibility is to express an opinion on these consolidated financial statements based on our audit. We conducted our audit in accordance with Canadian generally accepted auditing standards. Those standards require that we comply with ethical requirements and plan and perform the audit to obtain reasonable assurance about whether the consolidated financial statements are free from material misstatement.
An audit involves performing procedures to obtain audit evidence about the amounts and disclosures in the consolidated financial statements. The procedures selected depend on judgment, including the assessment of the risks of material misstatement of the consolidated financial statements, whether due to fraud or error. In making those risk assessments, we consider internal control relevant to the entity's preparation and fair presentation of the consolidated financial statements in order to design audit procedures that are appropriate in the circumstances, but not for the purpose of expressing an opinion on the effectiveness of the entity's internal control. An audit also includes evaluating the appropriateness of accounting policies used and the reasonableness of accounting estimates made by management, as well as evaluating the overall presentation of the consolidated financial statements.
We believe that the audit evidence we have obtained is sufficient and appropriate to provide a basis for our audit opinion.
Opinion
In our opinion, the consolidated financial statements present fairly, in all material respects, the consolidated financial position of the Workplace Safety and Insurance Board as at December 31, 2013 and its consolidated financial performance and its consolidated cash flows for the year then ended, in accordance with International Financial Reporting Standards.
PUBLIC ACCOUNTS, 2013-20143-112

Other matter
The financial statements of the Workplace Safety and Insurance Board for the year ended December 31, 2012 were audited by another auditor who expressed an unmodified opinion on those statements on April 25, 2013.
Toronto, Canada April 24, 2014
Chartered AccountantsLicensed Public AccountantsChartered AccountantsLicensed Public Accountants
PUBLIC ACCOUNTS, 2013-2014 3-113

ACTUARIAL OPINION On the Valuation of the Benefit Liabilities of the Workplace Safety and Insurance Board as at December 31, 2013
I have completed the actuarial valuation of the benefit liabilities of the Workplace Safety and Insurance Board (WSIB) for its consolidated statements of financial position as at December 31, 2013 (the “valuation date”).
In my opinion, the benefit liabilities of $26,960 million make reasonable provision for future payments for loss of earnings, other short and long term disability, health care, survivor and retirement income benefits with respect to claims which occurred on or before the valuation date, and for occupational disease claims expected to arise after the valuation date as a result of exposures incurred in the workplace on or before the valuation date in respect of occupational diseases with a long latency period that are recognized by the WSIB. This amount provides for future claim administration costs, but does not include a provision for claims related to workers of Schedule 2 employers.
The valuation was based on the provisions of the Workplace Safety and Insurance Act (Ontario), 1997 and on the WSIB's policies and administrative practices in effect at the time of the valuation.
The data on which the valuation is based were provided by the WSIB; I applied such checks of reasonableness of the data as I considered appropriate, and have concluded that the data are sufficiently reliable to permit a realistic valuation of the liabilities and are consistent with WSIB’s consolidated financial statements. In my opinion, the data on which the valuation is based are sufficient and reliable for the purpose of the valuation.
The economic assumptions adopted for purposes of computing the liabilities have been selected taking account of the WSIB’s strategic plan and investment policies. For this valuation, an annual discount rate of 5.00% for 2014 to 2017 (5.50% for the previous valuation) and 5.50% thereafter (6.00% for the previous valuation) was used to discount expected payments. Other economic assumptions underlying the calculations include annual changes in the Consumer Price Index (CPI) of 2.00% (2.50% for the previous valuation), amounts subject to partial indexing to increase at 0.5% annually, health care costs and wage annual escalation rates of 4.00% (4.50% for the previous valuation) and 3.00% (3.50% for the previous valuation) respectively. In my opinion, the assumptions are appropriate for the purpose of the valuation.
The methods and assumptions employed in the valuation were consistent with those used in the previous valuation, after taking account of changes in claim patterns. Projections of future claim payments and awards have been made using factors developed from the WSIB’s claims experience, mortality and other assumptions. In my opinion, the methods employed in the valuation are appropriate for the purpose of the valuation.
Changes to the actuarial basis, in addition to those to economic assumptions mentioned above, include new mortality tables and future mortality improvement rates. The impact of the changes in actuarial assumptions and methods on the benefit liabilities is disclosed in note 18 to the consolidated financial statements.
Details of the data, actuarial assumptions, valuation methods and analysis of results are set out in my actuarial report as at the valuation date, of which this statement of opinion forms part.
In my opinion, the amount of the benefit liabilities makes appropriate provision for all personal injury compensation obligations and the consolidated financial statements fairly represent the results of the valuation. This report has been prepared, and my opinions given, in accordance with accepted actuarial practice in Canada.
Donald Blue, FCIA, FSA Vice-President and Chief Actuary Workplace Safety and Insurance Board April 24, 2014
PUBLIC ACCOUNTS, 2013-20143-114
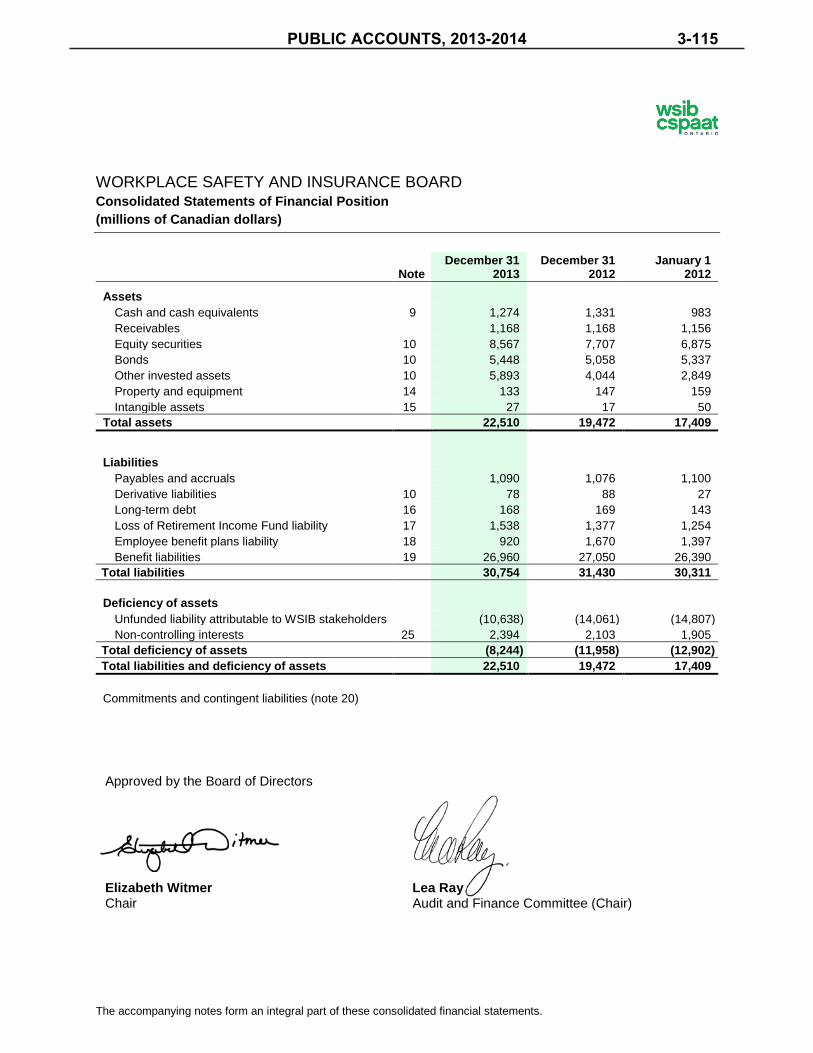
The accompanying notes form an integral part of these consolidated financial statements.
WORKPLACE SAFETY AND INSURANCE BOARD Consolidated Statements of Financial Position (millions of Canadian dollars)
Note December 31
2013 December 31
2012 January 1
2012
Assets
Cash and cash equivalents 9 1,274 1,331 983 Receivables 1,168 1,168 1,156 Equity securities 10 8,567 7,707 6,875 Bonds 10 5,448 5,058 5,337 Other invested assets 10 5,893 4,044 2,849 Property and equipment 14 133 147 159 Intangible assets 15 27 17 50
Total assets 22,510 19,472 17,409
Liabilities
Payables and accruals 1,090 1,076 1,100 Derivative liabilities 10 78 88 27 Long-term debt 16 168 169 143 Loss of Retirement Income Fund liability 17 1,538 1,377 1,254 Employee benefit plans liability 18 920 1,670 1,397 Benefit liabilities 19 26,960 27,050 26,390
Total liabilities 30,754 31,430 30,311
Deficiency of assets
Unfunded liability attributable to WSIB stakeholders (10,638) (14,061) (14,807) Non-controlling interests 25 2,394 2,103 1,905
Total deficiency of assets (8,244) (11,958) (12,902) Total liabilities and deficiency of assets 22,510 19,472 17,409 Commitments and contingent liabilities (note 20)
Approved by the Board of Directors
Elizabeth Witmer Lea Ray Chair Audit and Finance Committee (Chair)
PUBLIC ACCOUNTS, 2013-2014 3-115
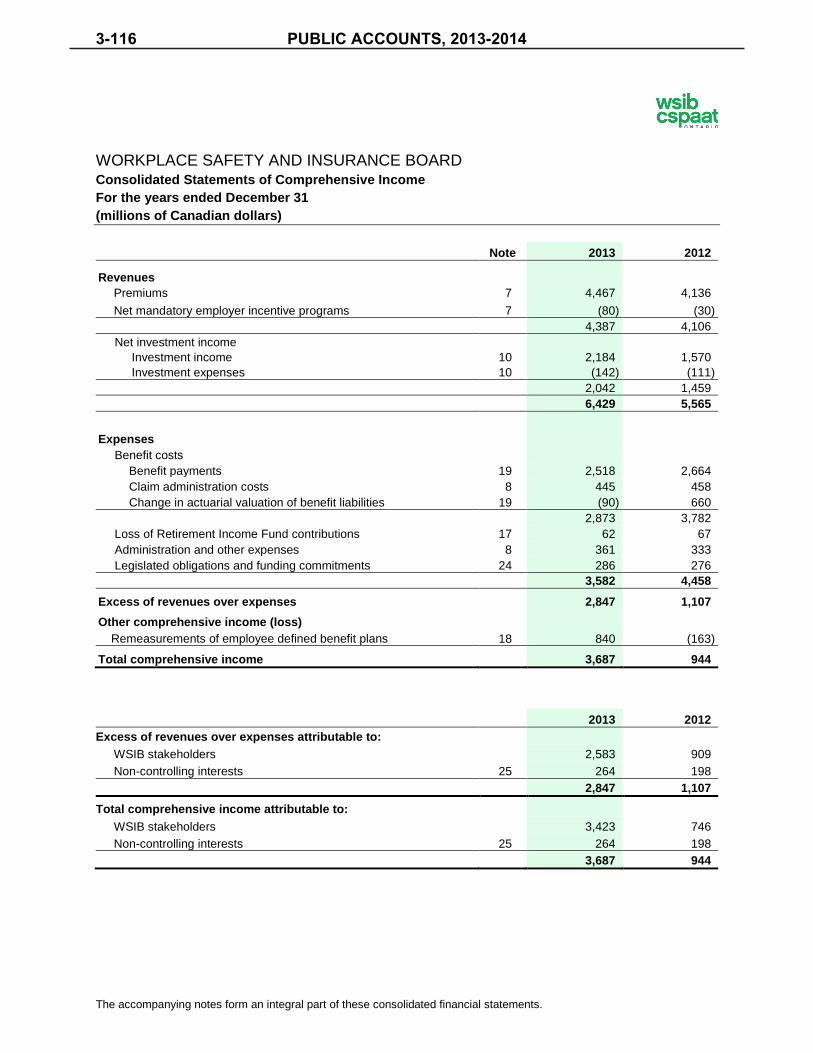
The accompanying notes form an integral part of these consolidated financial statements.
WORKPLACE SAFETY AND INSURANCE BOARD Consolidated Statements of Comprehensive Income For the years ended December 31 (millions of Canadian dollars)
Note 2013 2012
Revenues Premiums 7 4,467 4,136
Net mandatory employer incentive programs 7 (80) (30) 4,387 4,106 Net investment income
Investment income 10 2,184 1,570 Investment expenses 10 (142) (111)
2,042 1,459 6,429 5,565
Expenses Benefit costs
Benefit payments 19 2,518 2,664 Claim administration costs 8 445 458 Change in actuarial valuation of benefit liabilities 19 (90) 660
2,873 3,782 Loss of Retirement Income Fund contributions 17 62 67 Administration and other expenses 8 361 333 Legislated obligations and funding commitments 24 286 276
3,582 4,458
Excess of revenues over expenses 2,847 1,107 Other comprehensive income (loss)
Remeasurements of employee defined benefit plans 18 840 (163)
Total comprehensive income 3,687 944
2013 2012 Excess of revenues over expenses attributable to:
WSIB stakeholders 2,583 909
Non-controlling interests 25 264 198
2,847 1,107
Total comprehensive income attributable to:
WSIB stakeholders 3,423 746
Non-controlling interests 25 264 198
3,687 944
PUBLIC ACCOUNTS, 2013-20143-116
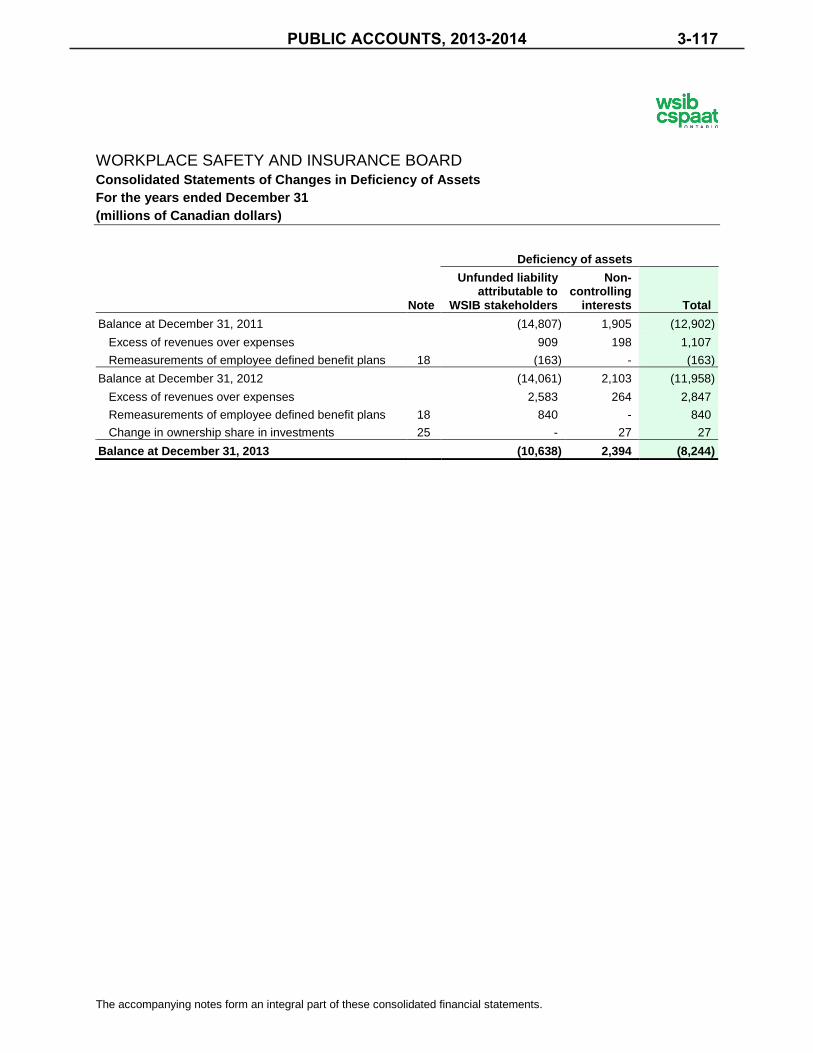
The accompanying notes form an integral part of these consolidated financial statements.
WORKPLACE SAFETY AND INSURANCE BOARD Consolidated Statements of Changes in Deficiency of Assets For the years ended December 31 (millions of Canadian dollars)
Deficiency of assets
Note
Unfunded liability attributable to
WSIB stakeholders
Non-controlling
interests Total Balance at December 31, 2011 (14,807) 1,905 (12,902)
Excess of revenues over expenses 909 198 1,107
Remeasurements of employee defined benefit plans 18 (163) - (163)
Balance at December 31, 2012 (14,061) 2,103 (11,958)
Excess of revenues over expenses 2,583 264 2,847
Remeasurements of employee defined benefit plans 18 840 - 840
Change in ownership share in investments 25 - 27 27
Balance at December 31, 2013 (10,638) 2,394 (8,244)
PUBLIC ACCOUNTS, 2013-2014 3-117
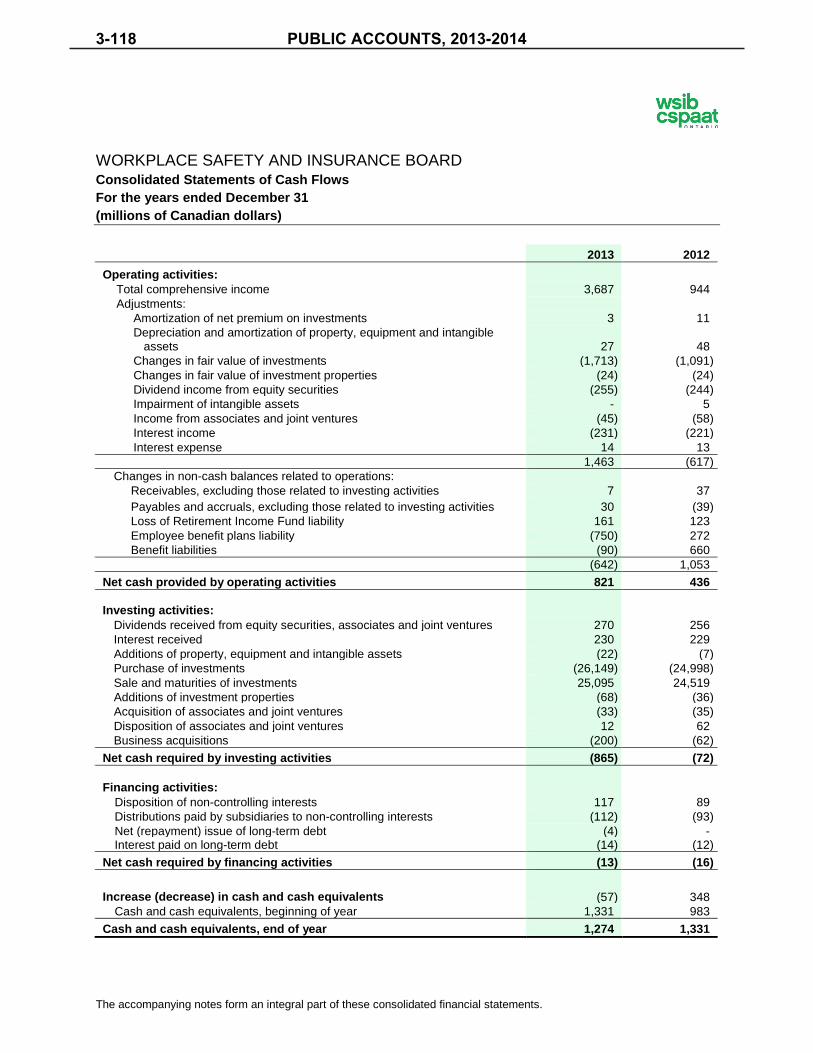
The accompanying notes form an integral part of these consolidated financial statements.
WORKPLACE SAFETY AND INSURANCE BOARD Consolidated Statements of Cash Flows For the years ended December 31 (millions of Canadian dollars)
2013 2012
Operating activities: Total comprehensive income 3,687 944
Adjustments: Amortization of net premium on investments 3 11
Depreciation and amortization of property, equipment and intangible assets 27 48
Changes in fair value of investments (1,713) (1,091) Changes in fair value of investment properties (24) (24) Dividend income from equity securities (255) (244) Impairment of intangible assets - 5 Income from associates and joint ventures (45) (58) Interest income (231) (221) Interest expense 14 13
1,463 (617)
Changes in non-cash balances related to operations: Receivables, excluding those related to investing activities 7 37
Payables and accruals, excluding those related to investing activities 30 (39) Loss of Retirement Income Fund liability 161 123 Employee benefit plans liability (750) 272 Benefit liabilities (90) 660
(642) 1,053
Net cash provided by operating activities 821 436
Investing activities: Dividends received from equity securities, associates and joint ventures 270 256
Interest received 230 229 Additions of property, equipment and intangible assets (22) (7) Purchase of investments (26,149) (24,998) Sale and maturities of investments 25,095 24,519 Additions of investment properties (68) (36) Acquisition of associates and joint ventures (33) (35) Disposition of associates and joint ventures 12 62 Business acquisitions (200) (62)
Net cash required by investing activities (865) (72)
Financing activities: Disposition of non-controlling interests 117 89
Distributions paid by subsidiaries to non-controlling interests (112) (93) Net (repayment) issue of long-term debt (4) - Interest paid on long-term debt (14) (12)
Net cash required by financing activities (13) (16)
Increase (decrease) in cash and cash equivalents (57) 348 Cash and cash equivalents, beginning of year 1,331 983
Cash and cash equivalents, end of year 1,274 1,331
PUBLIC ACCOUNTS, 2013-20143-118

WORKPLACE SAFETY AND INSURANCE BOARD Notes to Consolidated Financial Statements December 31, 2013 (millions of Canadian dollars)
1. Nature of Operations
The Workplace Safety and Insurance Board (the “WSIB”) is a statutory corporation created by an Act of the Ontario Legislature in 1914 and domiciled in the Province of Ontario (the “Province”). As a trust agency of the Government of Ontario, the WSIB is responsible for administering the Workplace Safety and Insurance Act, 1997 (Ontario) (the “WSIA”), which establishes a no-fault insurance scheme that provides benefits to workers who experience workplace injuries or illnesses.
The WSIB promotes workplace health and safety in the Province and provides a workplace compensation system for Ontario based employers and workers. The WSIB is funded entirely by employer premiums and does not receive any government funding or assistance. Revenues are also earned from a diversified investment portfolio held to meet future obligations on existing claims.
The WSIB’s registered office is located at 200 Front Street West, Toronto, Ontario M5V 3J1.
2. Statement of Compliance
These consolidated financial statements have been prepared in accordance with International Financial Reporting Standards (“IFRS”).
The consolidated financial statements as at and for the year ended December 31, 2013 were authorized for issuance by the WSIB’s Board of Directors on April 24, 2014.
3. Summary of Significant Accounting Policies
Basis of presentation
The consolidated financial statements have been prepared on the historical cost basis, except for the following items:
a) financial instruments classified as at fair value through profit or loss, which are measured at fair value;
b) investment properties, which are measured at fair value; and
c) liabilities for employee defined benefit plans, which are measured as the present value of the defined benefit obligations less the fair value of plan assets.
Basis of consolidation
a) Subsidiaries
Subsidiaries are entities controlled by the WSIB.
The financial statements of subsidiaries are included in the WSIB’s consolidated financial statements from the date control commences until the date control ceases. Where necessary, adjustments are made to the financial statements of subsidiaries to reflect accounting policies consistent with those of the WSIB. All intercompany transactions and balances are eliminated.
The majority of the WSIB’s investment portfolio is held in subsidiaries in which the WSIB Employees’ Pension Plan is a non-controlling interest (note 25).
b) Non-controlling interests
Non-controlling interests represent the WSIB Employees’ Pension Plan and other investors’ proportionate interest of the net assets and total comprehensive income of subsidiaries in which the WSIB directly or indirectly owns less than a 100% interest. Total comprehensive income and the
PUBLIC ACCOUNTS, 2013-2014 3-119

WORKPLACE SAFETY AND INSURANCE BOARD Notes to Consolidated Financial Statements December 31, 2013 (millions of Canadian dollars)
surplus or deficiency of assets related to these subsidiaries are allocated to WSIB stakeholders and non-controlling interests.
c) Investments in associates and joint ventures
Associates are those entities over which the WSIB has significant influence over the financial and operating policies but not control or joint control of the entity. Generally, the WSIB is considered to have significant influence when it holds 20% or more of the voting power of an entity, but does not control or jointly control that entity. Joint ventures are entities over which the WSIB has joint control and has rights to the net assets of the arrangement. Joint control exists when the strategic, financial and operating decisions related to the entity require unanimous consent of parties sharing control.
Investments in associates and joint ventures are accounted for using the equity method. Under the equity method, investments are initially recognized at cost and adjusted for the WSIB’s proportionate share of the associates’ or joint ventures’ total comprehensive income.
d) Joint operations
Joint operations are investments in economic activities or entities over which the WSIB has joint control and has rights to specific assets, and obligations for specific liabilities, relating to the arrangement. Joint control exists when the strategic, financial and operating decisions related to the economic activity or entity require unanimous consent of parties sharing control.
The WSIB’s consolidated financial statements include its share of assets, liabilities, revenues and expenses related to the joint operations.
Business combinations
At times, the WSIB’s investment properties are acquired through business combinations. Acquisitions of businesses are accounted for using the acquisition method. The acquiree’s identifiable assets and liabilities are recognized at their fair values at the date of acquisition. The transaction costs associated with business combinations are expensed as incurred.
Foreign currency
The WSIB’s functional and presentation currency is the Canadian dollar. The Canadian dollar is also the functional currency of each of the WSIB’s subsidiaries, associates and joint ventures.
Foreign currency transactions are translated into the functional currency using the exchange rates prevailing at the date of the transaction. Monetary assets and liabilities denominated in a foreign currency are translated at the period-end rates of exchange. Non-monetary assets and liabilities that are measured at fair value are also translated at the period-end rates of exchange. Foreign exchange gains and losses are recognized in investment income or administration and other expenses.
Financial instruments
The WSIB recognizes financial assets and financial liabilities when it becomes a party to a contract. Financial assets and liabilities are offset and the net amount is presented in the consolidated statement of financial position only when the WSIB has a legal right to offset the amounts and intends either to settle on a net basis or to realize the asset and settle the liability simultaneously.
Financial assets and financial liabilities, with the exception of those classified as at fair value through profit or loss (“FVTPL”), are measured at fair value plus transaction costs on initial recognition. Financial assets and financial liabilities at FVTPL are measured at fair value on initial recognition and transaction costs are expensed when incurred.
PUBLIC ACCOUNTS, 2013-20143-120

WORKPLACE SAFETY AND INSURANCE BOARD Notes to Consolidated Financial Statements December 31, 2013 (millions of Canadian dollars)
Measurement in subsequent periods depends on the classification of the financial instrument. The WSIB’s financial assets and financial liabilities are classified as follows:
Financial asset or financial liability Classification Cash and cash equivalents FVTPL (a)
Receivables Loans and receivables (b)
Equity securities FVTPL (a)
Bonds FVTPL (a)
Other invested assets
Investment funds FVTPL (a)
Real estate debentures FVTPL (a)
Derivative assets FVTPL (a)
Annuities FVTPL (a)
Payables and accruals Other financial liabilities (c)
Derivative liabilities FVTPL (a)
Long-term debt Other financial liabilities (c)
a) Financial assets and financial liabilities at FVTPL
Financial assets and financial liabilities are classified as FVTPL when acquired principally for the purpose of trading, if so designated by management, or if they are derivatives. Financial assets and financial liabilities classified as FVTPL are measured at fair value, with changes recognized in investment income.
Financial assets and financial liabilities that are classified as FVTPL are managed based on their fair value in accordance with the WSIB’s documented risk management or investment strategy.
b) Loans and receivables
Loans and receivables are non-derivative financial assets that have fixed or determinable payments and are not quoted in an active market. Subsequent to initial recognition, loans and receivables are carried at amortized cost using the effective interest method. Loans and receivables are considered for impairment when they are past due or when other objective evidence is received that a specific counterparty will default.
c) Other financial liabilities
Other financial liabilities are financial liabilities that are not derivative liabilities or classified as FVTPL. Subsequent to initial recognition, other financial liabilities are carried at amortized cost using the effective interest method.
The effective interest method is a method of calculating the amortized cost of a financial instrument and allocating interest over the relevant period. The effective interest rate is the rate that exactly discounts estimated future cash flows (including all transaction costs and other premiums or discounts) through the expected life of the financial instrument to the net carrying amount on initial recognition.
PUBLIC ACCOUNTS, 2013-2014 3-121

WORKPLACE SAFETY AND INSURANCE BOARD Notes to Consolidated Financial Statements December 31, 2013 (millions of Canadian dollars)
Investment properties
Investment properties are properties held either to earn rental income or for capital appreciation, or both. Investment properties acquired through a business combination are recognized at fair value and the related transaction costs are expensed as incurred. Investment properties acquired through an asset purchase are recognized at cost, which includes transaction costs. Subsequent to initial recognition, investment properties are measured at fair value with changes in fair value recognized as investment income during the period in which they arise.
Fair values of investment properties are primarily based on discounted expected future cash flows of each property, using discount and terminal capitalization rates reflective of the characteristics, location and market of each property. The future cash flows of each property are based on estimates of future cash flows from current and future leases.
Valuations of significant investment properties are performed by third-party appraisers, on an annual basis at a minimum, at varying dates throughout the year. On a quarterly basis, the fair value of investment properties is updated based on valuation models incorporating available market evidence.
Property and equipment
Property and equipment are measured at cost less accumulated depreciation and any accumulated impairment losses. When significant components of an item of property and equipment have different useful lives, they are accounted for as separate items.
Property and equipment are depreciated on a straight-line basis over their estimated useful lives as follows:
Land Not depreciated
Buildings
Primary structure 60 years
Components with different useful lives 10 - 30 years
Leasehold improvements Lesser of the lease term or 10 years
Office and computer equipment 3 - 5 years
Intangible assets
Intangible assets, which include internally developed and acquired software, are measured at cost less accumulated amortization and any accumulated impairment losses. Intangible assets are amortized on a straight-line basis over their estimated useful lives of three to five years.
Development costs associated with internally developed software are recognized as an intangible asset when certain criteria are met. The criteria to capitalize development costs include the WSIB’s intention and ability to complete the development of the software from which it is probable the WSIB will generate future economic benefits.
Leases
Leases are classified as either finance or operating leases. Finance leases are those that substantially transfer the benefits and risks of ownership of an asset to the lessee.
a) Leases where the WSIB is the lessee
Assets held under finance leases are recognized as assets and included in property and equipment. At the inception of the lease, the asset is measured at the lower of the present value of the minimum lease payments and the fair value of the leased asset. A corresponding liability is recognized as a
PUBLIC ACCOUNTS, 2013-20143-122

WORKPLACE SAFETY AND INSURANCE BOARD Notes to Consolidated Financial Statements December 31, 2013 (millions of Canadian dollars)
finance lease obligation. Lease payments are apportioned between interest expense and a reduction of the lease obligation to achieve a constant rate of interest on the remaining liability.
Total payments under operating leases are recognized as an expense in administration and other expenses on a straight-line basis over the term of the lease. As an exception, operating leases for investment properties are accounted for as a finance lease. Investment properties held under operating leases are recognized as an asset and measured at fair value.
b) Leases where the WSIB is the lessor
All leases under which the WSIB is the lessor are leases of its investment properties and have been determined to be operating leases. Rental revenue from operating leases is recognized in investment income on a straight-line basis over the terms of the leases.
Impairment of non-financial assets
At each reporting date, the WSIB’s property and equipment and intangible assets are reviewed to determine whether there is an indication those assets are impaired. If such an indication exists, the recoverable amount of the asset is estimated in order to determine the extent of the impairment, if any. If the recoverable amount of an asset is estimated to be less than its carrying amount, the carrying amount of the asset is reduced to its recoverable amount and the impairment loss is recognized in administration and other expenses. The recoverable amount is the higher of fair value less costs to sell and value in use. In assessing value in use, the estimated future cash flows are discounted at a rate that reflects current market assessments of the time value of money and the risks specific to the asset.
For the purposes of assessing for indications of impairment and impairment testing, assets that do not have largely independent cash inflows are grouped into cash-generating units. Cash-generating units are the smallest identifiable groups of assets with independent cash inflows.
Premium revenues
Premium revenues are comprised of premiums from Schedule 1 employers and administration fees from Schedule 2 employers.
a) Schedule 1 employer premiums
Schedule 1 employers are those for which the WSIB is liable to pay benefit compensation for workers' claims. Schedule 1 employers are required by legislation to pay premiums to the WSIB, which are recognized over the period that coverage is provided.
b) Schedule 2 employer administration fees
Schedule 2 employers are employers that self-insure the provision of benefits under the WSIA. Schedule 2 employers are liable to pay all benefit compensation and administration costs for their workers’ claims.
The WSIB administers the payment of the benefits for workers of Schedule 2 employers and recovers the cost of these benefits plus administration fees from the employers. The administration fees are recognized as the services are provided. The benefits paid on behalf of Schedule 2 employers and the amounts collected to recover the benefits paid are not included in the WSIB’s revenues or expenses.
PUBLIC ACCOUNTS, 2013-2014 3-123
WORKPLACE SAFETY AND INSURANCE BOARD Notes to Consolidated Financial Statements December 31, 2013 (millions of Canadian dollars)
Investment income
Investment income is comprised of the following:
a) Realized and unrealized gains and losses on financial instruments
Financial assets and financial liabilities classified as FVTPL are measured at fair value, with changes recognized in investment income in the period they arise.
b) Interest and dividend income
Interest income is determined using the effective interest method and is recognized in investment income as it accrues. Dividend income is recognized in investment income when the WSIB’s right to receive payment has been established.
c) Income from associates and joint ventures
The WSIB’s proportionate share of its associates’ and joint ventures’ total comprehensive income is recognized in investment income in the period it is recognized by the associate or joint venture.
d) Income from investment properties
Investment properties are measured at fair value with changes in fair value recognized as investment income during the period in which they arise. Rental income and service charges from investment properties are also included in investment income and recognized in the period to which they relate.
Mandatory employer incentive programs
Schedule 1 employers participate in mandatory employer incentive programs that may result in adjustments to premium rates. Certain of these programs involve a surcharge to, or refund of, premiums based on the employer’s claims experience. An estimate of the surcharges or refunds is recognized in the period to which they relate.
Legislated obligations and funding commitments
a) Legislated obligations
The WSIB is required to reimburse the Government of Ontario for all administrative costs of the Occupational Health and Safety Act (the “OHSA”). The WSIB is also required to fund costs associated with the Ministry of Labour’s (the “MoL”) prevention activities, the Workplace Safety and Insurance Appeals Tribunal, and the offices of each of the Worker and Employer Adviser. The expenses related to these legislated obligations are recognized as an expense in the period to which the funding relates.
b) Funding commitments
The WSIB is committed to provide funding for the Institute for Work & Health, Safe Workplace Associations, clinics, and training centres. The expenses related to these funding commitments are recognized as an expense in the period to which the funding relates.
c) Voluntary employer incentive programs
The WSIB is committed to provide financial incentives to Schedule 1 employers who undertake specific measures to improve health and safety. An estimate of the cost of these incentive programs is recognized as an expense in legislated obligations and funding commitments in the period the measures are undertaken by the employer.
PUBLIC ACCOUNTS, 2013-20143-124

WORKPLACE SAFETY AND INSURANCE BOARD Notes to Consolidated Financial Statements December 31, 2013 (millions of Canadian dollars)
Loss of Retirement Income Fund liability
The Loss of Retirement Income Fund liability represents an obligation for payments of retirement benefits to certain workers. The WSIB makes contributions to the Loss of Retirement Income Fund for injured workers who have received certain benefits for twelve consecutive months. The WSIB’s contributions, and any voluntary contributions from injured workers, are segregated within the WSIB’s investment portfolio as the Loss of Retirement Income Fund.
The WSIB’s obligation to injured workers is to provide retirement benefits equal to the total contributions plus income earned on those contributions. As such, the Loss of Retirement Income Fund liability is measured at an amount equivalent to the fair value of the assets in the Loss of Retirement Income Fund. The WSIB’s contributions to the Loss of Retirement Income Fund are recognized as the Loss of Retirement Income Fund contributions expense.
Benefit liabilities
Benefit liabilities represent the actuarially determined present value of the estimated future payments for reported and unreported claims incurred on or prior to the reporting date using best estimate assumptions. In addition, an obligation is estimated for claims in respect of occupational diseases currently recognized by the WSIB for which a claim has not yet been reported. The future payments are for estimated obligations for loss of earnings, labour market re-entry costs, short and long-term disability, health care, survivor benefits, retirement income benefits and claim administration costs. The benefit liabilities are determined in accordance with the Standards of Practice of the Canadian Institute of Actuaries, including the standards for Public Personal Injury Compensation Plans, and legislation in effect at the end of the reporting period. Changes in the estimate of future benefit payments are recognized in benefit costs expense.
Benefit liabilities do not include any amounts for claims related to workers of Schedule 2 employers; these claims are ultimately paid by the self-insured Schedule 2 employers.
Employee future benefits
The WSIB maintains two employee defined benefit pension plans, and other defined benefit plans that provide benefits such as post-employment dental, extended health and life insurance benefits.
The obligations for these plans are measured as the present value of the benefit obligation less the fair value of plan assets and are included in the employee benefit plans liability. The employee benefit plans liability represents the combined deficit of the plans at the reporting date.
The cost of the defined benefit plans is actuarially determined using the projected unit credit method and includes management’s estimate of expected plan investment performance, compensation level increases and retirement ages of workers.
The changes in defined benefit obligations and plan assets are recognized when they occur as follows:
a) Service costs and the net interest cost are recognized in administration and other expenses; and
b) Remeasurements, which include actuarial gains and losses, are recognized in other comprehensive income. Remeasurements are never reclassified to expenses; other comprehensive income related to the remeasurements is immediately transferred to the unfunded liability.
Termination benefits
Termination benefits refer to benefits payable to employees as a result of voluntary or involuntary termination of employment. The cost of termination benefits is recognized in administration and other expenses when the offer of the benefits can no longer be withdrawn.
PUBLIC ACCOUNTS, 2013-2014 3-125
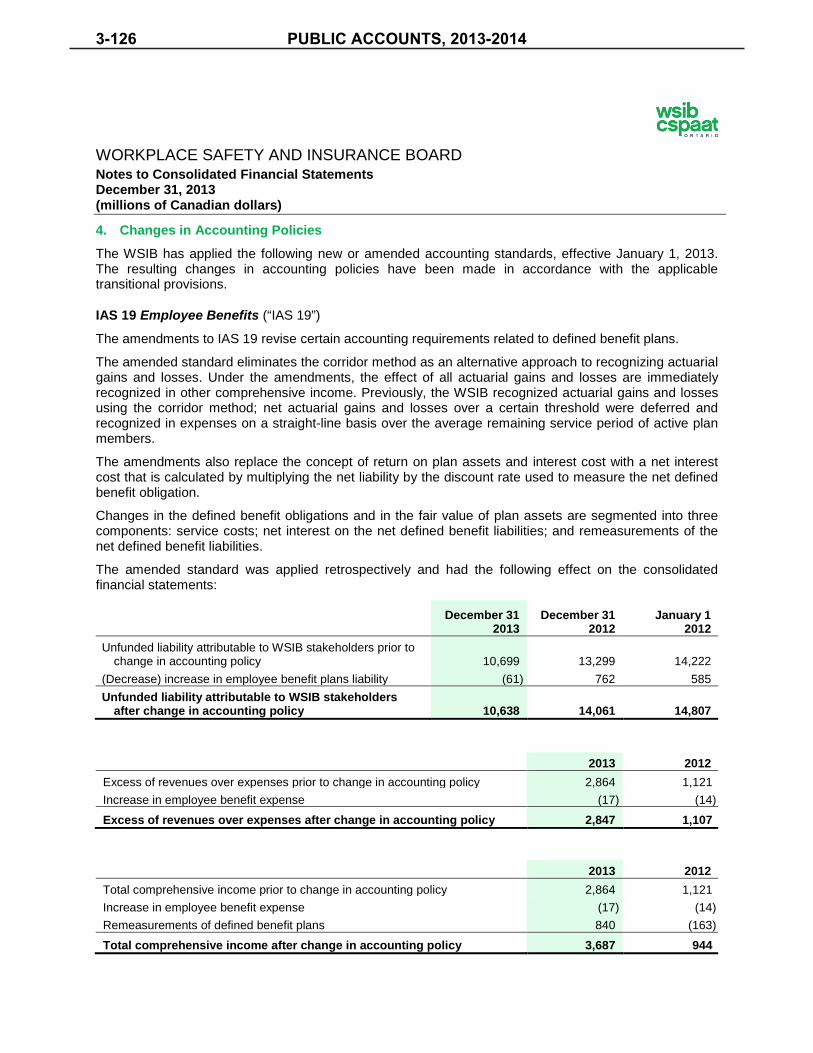
WORKPLACE SAFETY AND INSURANCE BOARD Notes to Consolidated Financial Statements December 31, 2013 (millions of Canadian dollars)
4. Changes in Accounting Policies
The WSIB has applied the following new or amended accounting standards, effective January 1, 2013. The resulting changes in accounting policies have been made in accordance with the applicable transitional provisions.
IAS 19 Employee Benefits (“IAS 19”)
The amendments to IAS 19 revise certain accounting requirements related to defined benefit plans.
The amended standard eliminates the corridor method as an alternative approach to recognizing actuarial gains and losses. Under the amendments, the effect of all actuarial gains and losses are immediately recognized in other comprehensive income. Previously, the WSIB recognized actuarial gains and losses using the corridor method; net actuarial gains and losses over a certain threshold were deferred and recognized in expenses on a straight-line basis over the average remaining service period of active plan members.
The amendments also replace the concept of return on plan assets and interest cost with a net interest cost that is calculated by multiplying the net liability by the discount rate used to measure the net defined benefit obligation.
Changes in the defined benefit obligations and in the fair value of plan assets are segmented into three components: service costs; net interest on the net defined benefit liabilities; and remeasurements of the net defined benefit liabilities.
The amended standard was applied retrospectively and had the following effect on the consolidated financial statements:
December 31 2013
December 31 2012
January 1 2012
Unfunded liability attributable to WSIB stakeholders prior to change in accounting policy 10,699 13,299 14,222
(Decrease) increase in employee benefit plans liability (61) 762 585
Unfunded liability attributable to WSIB stakeholders after change in accounting policy 10,638 14,061 14,807
2013 2012
Excess of revenues over expenses prior to change in accounting policy 2,864 1,121
Increase in employee benefit expense (17) (14)
Excess of revenues over expenses after change in accounting policy 2,847 1,107
2013 2012 Total comprehensive income prior to change in accounting policy 2,864 1,121
Increase in employee benefit expense (17) (14)
Remeasurements of defined benefit plans 840 (163)
Total comprehensive income after change in accounting policy 3,687 944
PUBLIC ACCOUNTS, 2013-20143-126
WORKPLACE SAFETY AND INSURANCE BOARD Notes to Consolidated Financial Statements December 31, 2013 (millions of Canadian dollars)
IFRS 10 Consolidated Financial Statements (“IFRS 10”)
IFRS 10 is a new standard, replacing the previous guidance for assessing when the WSIB controls, and therefore is required to consolidate, an investee.
IFRS 10 requires an entity to consolidate an investee when it is exposed, or has rights, to variable returns from its involvement with the investee and has the ability to affect those returns through its power over the investee. There have not been significant changes to the accounting requirements applied when an investee is consolidated.
The WSIB has assessed its investees under the requirements of IFRS 10 and has determined that its application does not result in any significant change to the WSIB’s consolidated financial statements.
IFRS 11 Joint Arrangements (“IFRS 11”)
IFRS 11 is a new standard, replacing the previous guidance related to joint arrangements.
The new standard requires interests in joint arrangements to be classified as a joint venture or joint operation. A joint arrangement is an arrangement in which two or more parties have joint control. Joint ventures are accounted for using the equity method of accounting whereas a party with joint control of a joint operation recognizes its share of the assets, liabilities, revenues and expenses of the joint operation.
The WSIB has assessed its joint arrangements under the requirements of IFRS 11 and has determined that its application does not result in any significant change to the WSIB’s consolidated financial statements.
IFRS 12 Disclosures of Interests in Other Entities (“IFRS 12”)
IFRS 12 is a new standard establishing disclosure requirements for interests in other entities, such as subsidiaries, joint arrangements, associates and unconsolidated structured entities. IFRS 12 carries forward existing disclosures and also introduces additional disclosure requirements that address the nature of, and risks associated with, an entity’s interests in other entities. The standard also requires enhanced disclosures of how control was determined and any restrictions that might exist on consolidated assets and liabilities within the consolidated financial statements.
The WSIB has amended its consolidated financial statement note disclosures to reflect the requirements of IFRS 12.
IFRS 13 Fair Value Measurement (“IFRS 13”)
IFRS 13 is a new standard that sets out a single IFRS framework for measuring fair value that is applied in most circumstances where IFRS requires or permits measurements or disclosures of fair value.
IFRS 13 clarifies that fair value is the price that would be received to sell an asset, or paid to transfer a liability, in an orderly transaction between market participants at the measurement date.
The WSIB has assessed its fair value measurements under the requirements of IFRS 13 and has determined that its application does not result in any significant change to the WSIB’s consolidated financial statements. The WSIB has amended its consolidated financial statement note disclosures to reflect the new disclosure requirements of IFRS 13.
PUBLIC ACCOUNTS, 2013-2014 3-127
WORKPLACE SAFETY AND INSURANCE BOARD Notes to Consolidated Financial Statements December 31, 2013 (millions of Canadian dollars)
5. Critical Accounting Estimates and Judgments
The WSIB is required to apply judgment when making estimates and assumptions that affect the reported amounts recognized in the consolidated financial statements. These estimates have a direct effect on the measurement of transactions and balances recognized in the consolidated financial statements, and actual results could differ from those estimates. Estimates are reviewed on an ongoing basis, with any related revisions recorded in the period in which they are adjusted.
In addition, the WSIB has made judgments, aside from those that involve estimates, in the process of applying its accounting policies. These judgments can affect the amounts recognized in the consolidated financial statements.
Benefit liabilities (note 19)
Benefit liabilities represent the actuarially determined present value of estimated future payments for reported and unreported claims incurred on or prior to the reporting date, including claims in respect of occupational diseases currently recognized by the WSIB. The measurement of benefit liabilities requires the actuary to make estimates and assumptions for a number of factors, including those for claim duration, mortality rates, wage escalation, general inflation and discount rates. Changes in these estimates and assumptions could have a significant impact on the measurement of benefit liabilities and benefit costs.
Employee benefit plans (note 18)
The costs and liabilities associated with defined benefit pension plans and other long-term employee benefit plans are determined in accordance with actuarial valuations. The actuarial valuations rely on estimates and assumptions including those for wage escalation, expected return on plan assets, health care and dental cost inflation, retirement ages, life expectancies and discount rates. Changes in these estimates could have an impact on the employee benefit plans liability and total comprehensive income.
Fair value measurement of financial instruments (note 21)
Where possible, the fair value of publicly traded financial instruments is based on quoted market prices. The fair value for a substantial majority of financial instruments is based on quoted market prices or valuation models that use observable market inputs such as interest rate yield curves. Valuation models incorporate prevailing market rates and may require estimates for economic risks and projected cash flows.
Fair value measurement of investment properties (note 12)
The WSIB’s investment properties are owned indirectly through subsidiaries or joint operations. Investment properties are re-measured to fair value at each reporting date, estimated based on the annual valuations performed by independent qualified appraisers. The annual third-party appraisals are performed at varying dates throughout the year; at each reporting date the fair value of investment properties is updated based on valuation models incorporating available market evidence. When estimating the fair value of investment properties, estimates and assumptions are made that have a significant effect on the reported value of investment properties. Estimates and assumptions used in determining the fair value of the investment properties include discount and terminal capitalization rates, inflation rates, vacancy rates and future net cash flows of the property.
PUBLIC ACCOUNTS, 2013-20143-128

WORKPLACE SAFETY AND INSURANCE BOARD Notes to Consolidated Financial Statements December 31, 2013 (millions of Canadian dollars)
6. Future Changes in Accounting Standards
The following new or amended accounting standards have been issued by the International Accounting Standards Board (“IASB”). These new or amended standards are not yet effective and the WSIB has not completed its assessment of their impact on its consolidated financial statements.
IFRS 9 Financial Instruments (“IFRS 9”)
IFRS 9 was issued in November 2009, and subsequently revised in October 2010 and November 2013 as part of the IASB’s ongoing project to replace IAS 39 Financial Instruments: Recognition and Measurement (“IAS 39”). The effective date for IFRS 9 has not yet been determined, but is not expected to be effective for the WSIB any earlier than January 1, 2016.
IFRS 9 uses a single approach to determine whether a financial asset is measured at amortized cost or at fair value, replacing the multiple classifications in IAS 39. The approach in IFRS 9 is based on how an entity manages its financial instruments in the context of its business model and the contractual cash flow characteristics of the financial assets. The standard also includes guidance on the classification and measurement of financial liabilities, which largely carries forward the existing requirements in IAS 39. IFRS 9 was further amended on November 15, 2013 to introduce new guidance related to hedge accounting.
The IASB has proposed further amendments including an additional financial asset category for certain investments in debt securities, as well as amendments that address impairment.
IAS 32 Financial Instruments Presentation (“IAS 32”)
Amendments to IAS 32 were issued in December 2011. The amended IAS 32 will be effective for the WSIB beginning January 1, 2014.
The amendments to IAS 32 clarify the existing requirements for offsetting financial instruments.
IAS 19 Employee Benefits (“IAS 19”)
Amendments to IAS 19 were issued in November 2013, which will be effective for the WSIB beginning January 1, 2015.
The amendments to IAS 19 clarify the accounting for contributions by employees or third parties to defined benefit plans.
Exposure drafts
a) Insurance contracts
In June 2013, the IASB issued a revised exposure draft containing proposals for significant changes to the existing recognition, measurement, presentation and disclosure requirements for insurance contracts. The IASB continues to work on these proposals with the objective of finalizing a new standard to replace IFRS 4 Insurance Contracts. This is an important standard that is expected to have a significant effect on the WSIB’s consolidated financial statements, primarily as it relates to the measurement of benefit liabilities. The new standard is not finalized and will not have an effect on the consolidated financial statements until it is issued and effective. The date the new standard will be issued and the date the new standard will be effective are uncertain.
PUBLIC ACCOUNTS, 2013-2014 3-129

WORKPLACE SAFETY AND INSURANCE BOARD Notes to Consolidated Financial Statements December 31, 2013 (millions of Canadian dollars)
b) Other
The IASB regularly issues exposure drafts with proposals for new standards or amendments to existing standards. The WSIB’s consolidated financial statements do not include disclosure of all exposure drafts issued by the IASB.
7. Revenues 2013 2012 Premiums
Schedule 1 employer premiums
Gross Schedule 1 premiums 4,347 4,024
Interest and penalties 48 38
Other income 1 8
4,396 4,070
Schedule 2 employer administration fees 71 66
4,467 4,136
Net mandatory employer incentive programs (80) (30)
4,387 4,106
Net investment income (note 10) 2,042 1,459
6,429 5,565
Premiums
Schedule 1 employers are those for which the WSIB is liable to pay benefit compensation for workers' claims. Premiums are primarily derived from total insurable earnings of Schedule 1 employers and are recognized over the period that coverage is provided.
Schedule 2 employers are employers that self-insure the provision of benefits under the WSIA. The WSIB administers the payment of the benefits for workers of Schedule 2 employers. The Schedule 2 employer administration fees represent revenues received for the administration of Schedule 2 benefit payments.
Net mandatory employer incentive programs
Net mandatory employer incentive programs represent the net surcharges and refunds related to Schedule 1 employer premiums based on an employer’s claims experience.
Net investment income
Details of net investment income are provided in note 10.
PUBLIC ACCOUNTS, 2013-20143-130

WORKPLACE SAFETY AND INSURANCE BOARD Notes to Consolidated Financial Statements December 31, 2013 (millions of Canadian dollars)
8. Administration and Other Expenses
Administration and other expenses for the year ended December 31 are comprised of the following:
2013 2012 Salaries and short-term benefits 373 367
Long-term benefit plans 189 181
Depreciation and amortization 22 43
Bad debts 39 25
Communications 10 10
Equipment and maintenance 48 36
Facilities 43 44
Impairment of intangible assets - 5
New systems development and integration 21 22
Termination benefits 18 29
Other 43 29
806 791
Claim administration costs allocated to benefit costs (note 19) (445) (458)
361 333
Claim administration costs allocated to benefit costs represent management’s estimate of the administration and other expenses directly related to the administration of benefit claims. For the purposes of this allocation, the WSIB has identified the roles and activities that are directly involved in the claim adjudication and payment processes. The direct costs of these roles and activities, including associated overhead costs, are allocated to benefit costs. Note 19 provides further details on the benefit liabilities and benefit costs.
9. Cash and Cash Equivalents
Highly liquid investments with a maturity of three months or less from the date of purchase are considered to be cash equivalents. Cash and cash equivalents are comprised of the following:
2013 2012 Cash 747 631
Short-term money market securities 527 700
1,274 1,331
For management purposes, cash and cash equivalents are held as follows:
2013 2012 Held for operating purposes 364 439
Held for investment purposes 740 737
Held in Loss of Retirement Income Fund (note 17) 170 155
1,274 1,331
PUBLIC ACCOUNTS, 2013-2014 3-131
WORKPLACE SAFETY AND INSURANCE BOARD Notes to Consolidated Financial Statements December 31, 2013 (millions of Canadian dollars)
10. Invested Assets and Net Investment Income
Invested Assets
The Board of Directors of the WSIB has established a Statement of Investment Policies and Procedures (“SIPP”), which establishes the policies governing the WSIB’s investment portfolio. The SIPP is reviewed by the Board of Directors on no less than an annual basis and is amended as required.
The SIPP requires that the WSIB’s investment portfolio be diversified across certain asset classes. The invested assets are currently diversified among five primary asset strategies as follows:
Fixed income Bonds, debentures and other fixed income investments.
Public equities Investment in the equity, or securities convertible into equity, of public corporations.
Multi-asset Investments that seek to provide a diversified source of total return generated from the broad market and from active management. Investments within multi-asset may include derivatives, commodities, currencies, hedge funds, equities and fixed income investments.
Real estate Real estate debentures and properties in Canada diversified across office, retail, industrial and mixed-use assets.
Infrastructure Investments in transportation, utilities, energy and health care facilities.
The WSIB’s invested assets are held directly or held indirectly through investments in subsidiaries, associates, joint ventures or joint operations.
The following provides a summary of the nature of the invested assets by asset strategy:
Fixed
income Public
equities Multi- asset
Real estate
Infra-structure Other
2012 2013
Equity securities - 7,866 562 - 139 - 8,567 7,707
Bonds 5,004 - 444 - - - 5,448 5,058
Other invested assets
Investment funds - - 3,673 - 331 - 4,004 2,550
Real estate debentures - - - 379 - - 379 356
Investment properties (note 12) - - - 962 - - 962 643
Investments in associates and joint ventures (note 11) - - - 379 57 - 436 386
Derivative assets - 3 34 - - - 37 38
Annuities - - - - - 75 75 71
- 3 3,707 1,720 388 75 5,893 4,044
PUBLIC ACCOUNTS, 2013-20143-132
WORKPLACE SAFETY AND INSURANCE BOARD Notes to Consolidated Financial Statements December 31, 2013 (millions of Canadian dollars)
Investments under securities lending program
The WSIB participates in a securities lending program through an intermediary for the purpose of generating fee income. Non-cash collateral, the fair value of which represents at least 102% of the fair value of the loaned securities, is maintained until the underlying securities have been returned to the WSIB. The fair value of the loaned securities is monitored on a daily basis by an intermediary financial institution with additional collateral obtained or refunded as the fair value of the underlying securities fluctuates. While in the possession of the counterparties, the loaned securities may be resold or repledged by such counterparties. The intermediary indemnifies the WSIB against any shortfalls in collateral. These transactions are conducted under terms that are usual and customary to security lending activities as well as requirements determined by exchanges where a financial institution acts as an intermediary.
Under the terms of the securities lending program, the WSIB retains substantially all the risks and rewards of ownership of the loaned securities and also retains contractual rights to the cash flows. These securities are not derecognized from the consolidated statement of financial position.
As at December 31, 2013, the fair value of investments under the securities lending program was $1,247 (2012 – $592). As at December 31, 2013, the fair value of securities maintained as collateral was approximately $1,338 (2012 – $627).
Derivative assets and derivative liabilities
Derivative assets and derivative liabilities include foreign exchange forward contracts primarily utilized to hedge investments denominated in a foreign currency, and to a lesser extent, held for active trading. Equity index, fixed income and commodity futures are held to provide international and asset class diversification. These futures are collateralized with cash and treasury bills to replicate the return of the respective equity, fixed income or commodity investments
The foreign exchange and swap derivative assets and derivative liabilities are subject to netting arrangements and in practice are settled on a net basis, but do not meet the criteria to present on a net basis. As such, the derivative assets and derivative liabilities are presented separately on the consolidated statement of financial position.
The following provides further information regarding derivative assets and derivative liabilities at December 31:
2013 2012
Fair value Fair value
Notional amount Assets Liabilities Notional
amount Assets Liabilities
Forward exchange contracts 9,768 27 52 8,248 31 79
Fixed income futures 2,640 1 20 2,528 4 6
Commodity futures 360 3 6 126 1 3
Equity Index futures 211 6 - 128 2 -
Swaps 81 - - - - -
13,060 37 78 11,030 38 88
PUBLIC ACCOUNTS, 2013-2014 3-133

WORKPLACE SAFETY AND INSURANCE BOARD Notes to Consolidated Financial Statements December 31, 2013 (millions of Canadian dollars)
Net investment income
Net investment income by asset strategy for the years ended December 31 is as follows:
Fixed income
Public equities Multi-asset
Real estate
Infra-structure Other
2012 2013
Equity securities - 2,109 169 - 11 1 2,290 948
Bonds (45) 1 23 - - 2 (19) 205
Investment funds - - 273 - 56 - 329 171
Real estate debentures - - - 44 - - 44 31
Investment properties - - - 101 - - 101 82 Income from associates and joint
ventures (note 11) - - - 42 3 - 45 58
Derivatives - (153) (285) - (24) - (462) 181
Annuities - - - - - 11 11 4
Short-term securities - - - - - 4 4 5
Investment expenses (1) (53) (32) (42) (14) - (142) (111) Less: Loss (Income) attributable
to Loss of Retirement Income Fund (note 17) 3 (126) (11) (9) (3) (13) (159) (115)
(43) 1,778 137 136 29 5 2,042 1,459
Net investment income for the years ended December 31 is comprised of the following:
2013 2012 Realized and unrealized gains on financial instruments 5,116 3,693
Realized and unrealized losses on financial instruments (3,402) (2,602)
Interest and dividend income 483 454
Income from associates and joint ventures (note 11) 45 58
Income from investment properties 101 82
Less: Income attributable to Loss of Retirement Income Fund (note 17) (159) (115)
Investment income 2,184 1,570
Investment expenses (142) (111)
2,042 1,459
11. Investments in Associates and Joint Ventures
Investments in associates and joint ventures are comprised of the following:
2013 2012 Investments in associates 13 17
Investments in joint ventures 423 369
436 386
PUBLIC ACCOUNTS, 2013-20143-134

WORKPLACE SAFETY AND INSURANCE BOARD Notes to Consolidated Financial Statements December 31, 2013 (millions of Canadian dollars)
Income from associates and joint ventures for the years ended December 31 is comprised of the following:
2013 2012 Net loss from associates (1) (1)
Net income from joint ventures 46 59
45 58
Investments in associates
Associates are those entities over which the WSIB has significant influence over the financial and operating policies but not control or joint control of the entity. Generally, the WSIB is considered to have significant influence when it holds 20% or more of the voting power of an entity, but does not control or jointly control that entity. Investments in associates are accounted for using the equity method.
2013 2012 Balance, beginning of year 17 9
Additional investment 1 9
Return of capital (3) -
WSIB’s share of net loss from associates (1) (1)
Dividends received and receivable (1) -
Balance, end of year 13 17
As at December 31, 2013, the WSIB had $26 (2012 – $28) of outstanding commitments for additional investments in existing associates.
The following provides a summary of the financial position information of the WSIB’s associates:
2013 2012 Total assets 87 103
Total liabilities (8) (19)
Net assets 79 84 WSIB's share of net assets 13 17
The following provides a summary of the net loss of the WSIB’s associates:
2013 2012 Revenues 7 7
Expenses (6) (8)
Gain on sale of investment properties - 1
Loss on change in fair value of investment properties (2) (2)
Net loss (1) (2) WSIB’s share of net loss (1) (1)
PUBLIC ACCOUNTS, 2013-2014 3-135

WORKPLACE SAFETY AND INSURANCE BOARD Notes to Consolidated Financial Statements December 31, 2013 (millions of Canadian dollars)
Investments in joint ventures
Joint ventures are entities over whose activities the WSIB has joint control. Joint control exists when the strategic, financial and operating decisions related to the entity require unanimous consent of parties sharing control. Investments in joint ventures are accounted for using the equity method.
2013 2012
Balance, beginning of year 369 366
Additional investment 30 26
Disposition (5) (63)
Classification change - (9)
WSIB’s share of net income from joint ventures 46 59
Dividends received and receivable (17) (10)
Balance, end of year 423 369
The WSIB’s ownership in the joint ventures, which hold investment properties, ranges from 38% - 77%. While the WSIB’s ownership in certain joint ventures is greater or less than 50%, there are contractual agreements in place requiring unanimous consent for significant strategic, financial and operating decisions.
As of December 31, 2013, the WSIB had commitments to make additional capital contributions of $172 (2012 – $194) to joint ventures. As at December 31, 2013, the joint ventures had total commitments to fund loans for qualified projects over the next five years in the amount of $99 (2012 – $131) from the capital contributions from their investors. The WSIB’s ownership share represents $76 (2012 – $101) of these commitments.
The following provides a summary of the financial position information of the WSIB’s joint ventures:
2013 2012 Total assets 1,251 1,159
Total liabilities (324) (334)
Net assets 927 825 WSIB's share of net assets 423 369
The following provides a summary of the net income of the WSIB’s joint ventures:
2013 2012 Revenues 105 101
Expenses (64) (80)
Gains from increases in fair value 62 114
Net income 103 135 WSIB’s share of net income 46 59
PUBLIC ACCOUNTS, 2013-20143-136
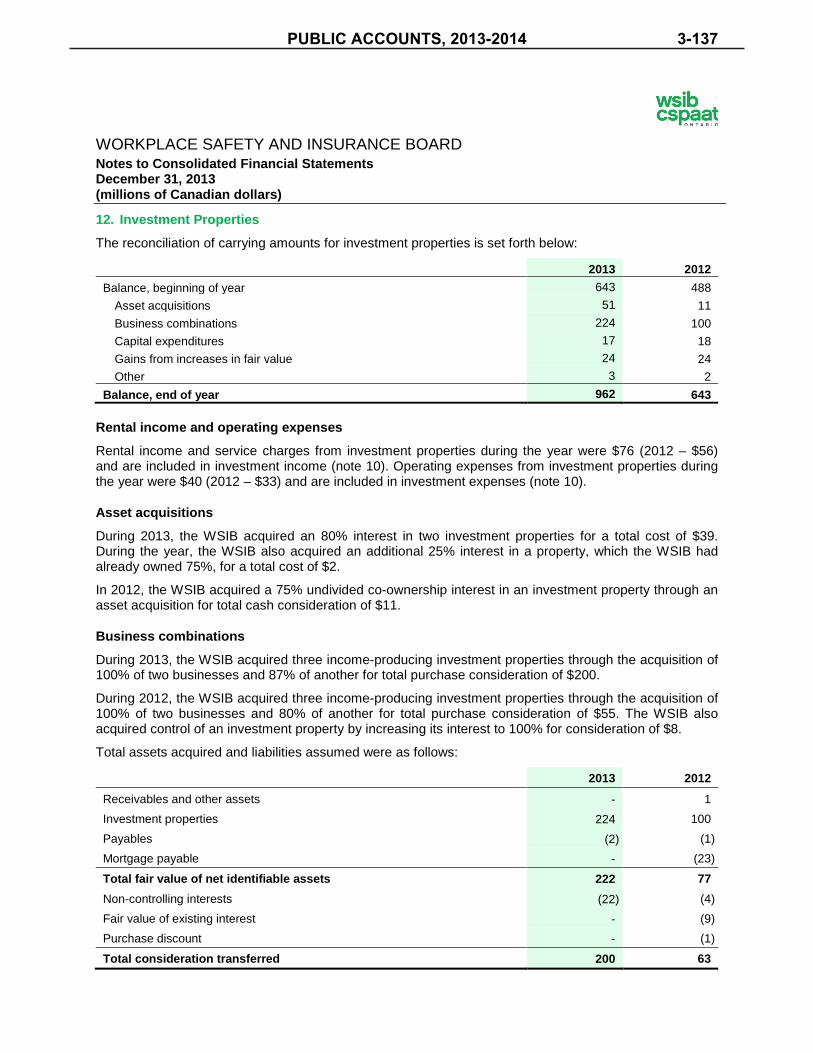
WORKPLACE SAFETY AND INSURANCE BOARD Notes to Consolidated Financial Statements December 31, 2013 (millions of Canadian dollars)
12. Investment Properties
The reconciliation of carrying amounts for investment properties is set forth below:
2013 2012 Balance, beginning of year 643 488
Asset acquisitions 51 11
Business combinations 224 100
Capital expenditures 17 18
Gains from increases in fair value 24 24
Other 3 2
Balance, end of year 962 643
Rental income and operating expenses
Rental income and service charges from investment properties during the year were $76 (2012 – $56) and are included in investment income (note 10). Operating expenses from investment properties during the year were $40 (2012 – $33) and are included in investment expenses (note 10).
Asset acquisitions
During 2013, the WSIB acquired an 80% interest in two investment properties for a total cost of $39. During the year, the WSIB also acquired an additional 25% interest in a property, which the WSIB had already owned 75%, for a total cost of $2.
In 2012, the WSIB acquired a 75% undivided co-ownership interest in an investment property through an asset acquisition for total cash consideration of $11.
Business combinations
During 2013, the WSIB acquired three income-producing investment properties through the acquisition of 100% of two businesses and 87% of another for total purchase consideration of $200.
During 2012, the WSIB acquired three income-producing investment properties through the acquisition of 100% of two businesses and 80% of another for total purchase consideration of $55. The WSIB also acquired control of an investment property by increasing its interest to 100% for consideration of $8.
Total assets acquired and liabilities assumed were as follows:
2013 2012
Receivables and other assets - 1
Investment properties 224 100
Payables (2) (1)
Mortgage payable - (23)
Total fair value of net identifiable assets 222 77 Non-controlling interests (22) (4)
Fair value of existing interest - (9)
Purchase discount - (1)
Total consideration transferred 200 63
PUBLIC ACCOUNTS, 2013-2014 3-137

WORKPLACE SAFETY AND INSURANCE BOARD Notes to Consolidated Financial Statements December 31, 2013 (millions of Canadian dollars)
Fair value measurements
Fair values of investment properties are estimated based on valuations performed by qualified appraisers. The fair values of investment properties are updated quarterly based primarily on the discounted expected future cash flows of the properties. At least one valuation per year for each property is based on an independent appraisal.
Further details on the fair value measurement of investment properties are included in Note 21.
Leases of investment properties
The WSIB is the lessor for a number of operating leases of its investment properties. These leases typically have a term of 1 to 15 years, with an option to renew. All operating lease contracts contain market review clauses in the event the lessee exercises its option to renew. The leases do not provide the lessee with an option to purchase the property at the end of the lease term.
The future minimum lease payments to be received under non-cancellable leases are as follows:
Minimum lease payments
Not later than one year 44
Later than one year and not later than five years 156
Later than five years 113
313
13. Joint Operations
Joint operations are investments in economic activities or entities over which the WSIB has joint control and has rights to specific assets, and obligations for specific liabilities, relating to the arrangement. Joint control exists when the strategic, financial and operating decisions related to the economic activity or entity require the unanimous consent of parties sharing control.
The WSIB’s consolidated financial statements include its share of the assets, liabilities, revenues and expenses related to the joint operations.
The WSIB’s ownership interests in joint operations at December 31, 2013 are as follows:
Ownership
Simcoe Place (a) 75%
Mississauga Property (b) 50%
Calgary Property (c) 50%
Montreal Property (d) 75%
a) The WSIB has a 75% undivided co-ownership interest in an office tower situated at 200 Front Street West, Toronto, Ontario (“Simcoe Place”). The WSIB occupies approximately 71% of the premises and recognizes its share of the property within property and equipment and its share of operating expenses in administration and other expenses. As at December 31, 2013, the WSIB had no capital commitments with respect to Simcoe Place. While the WSIB has a 75% interest, unanimous consent of both parties with ownership interests is required for significant financial and operating decisions.
PUBLIC ACCOUNTS, 2013-20143-138

WORKPLACE SAFETY AND INSURANCE BOARD Notes to Consolidated Financial Statements December 31, 2013 (millions of Canadian dollars)
b) The WSIB has a 50% undivided co-ownership interest in an office and retail complex of four office buildings and adjoining development lands located in Mississauga, Ontario (the “Mississauga Property”). As at December 31, 2013, the WSIB had no capital commitments with respect to the Mississauga Property.
c) The WSIB has a 50% undivided co-ownership interest in a retail development located in Calgary (the “Calgary Property”), held through a limited partnership. As at December 31, 2013, the WSIB had $13 capital commitments with respect to the Calgary Property.
d) The WSIB has a 75% undivided co-ownership interest in an industrial development located in Montreal (the “Montreal Property”), which is classified as an investment property. As at December 31, 2013, the WSIB had no capital commitments with respect to this property. While the WSIB has a 75% interest, unanimous consent of both parties with ownership interests is required for significant financial and operating decisions.
The following amounts related to the joint operations are included in the WSIB’s consolidated financial statements:
Simcoe Place
Mississauga Property
Calgary Property
Montreal Property
2012 2013
Other assets 8 8 - 1 17 16
Property and equipment 123 - - - 123 127
Investment properties - 78 33 9 120 81
Payables (4) (2) - - (6) (7)
Long-term debt (80) - (12) - (92) (82)
Net assets 47 84 21 10 162 135
Investment income - 15 - - 15 14
Investment expenses - (6) - - (6) (7)
Administration and other expenses (28) - - - (28) (28)
Total comprehensive income (loss) (28) 9 - - (19) (21)
PUBLIC ACCOUNTS, 2013-2014 3-139

WORKPLACE SAFETY AND INSURANCE BOARD Notes to Consolidated Financial Statements December 31, 2013 (millions of Canadian dollars)
14. Property and Equipment
Land Buildings Leasehold
improvements
Office and computer
equipment Total
Cost
Balance at December 31, 2011 40 102 67 29 238
Additions - - - 2 2
Balance at December 31, 2012 40 102 67 31 240
Additions - - 1 1 2
Disposals - - - (2) (2)
Balance at December 31, 2013 40 102 68 30 240
Accumulated depreciation
Balance at December 31, 2011 - 11 55 13 79
Depreciation - 4 4 6 14
Balance at December 31, 2012 - 15 59 19 93
Depreciation - 4 4 7 15
Disposals - - - (1) (1)
Balance at December 31, 2013 - 19 63 25 107
Carrying amounts At December 31, 2013 40 83 5 5 133
At December 31, 2012 40 87 8 12 147
Depreciation of property and equipment is included in administration and other expenses on the consolidated statement of comprehensive income.
The WSIB has a 75% undivided co-ownership interest in Simcoe Place, and occupies approximately 71% of the property. The WSIB’s share of the land, building and leasehold improvements is included in property and equipment.
Property and equipment includes the following carrying values for assets under finance leases:
2013 2012 Land 40 40
Office and computer equipment - 3
40 43
PUBLIC ACCOUNTS, 2013-20143-140

WORKPLACE SAFETY AND INSURANCE BOARD Notes to Consolidated Financial Statements December 31, 2013 (millions of Canadian dollars)
15. Intangible Assets Internally
developed software
Acquired software Total
Cost Balance at December 31, 2011 75 5 80
Additions 3 1 4
Impairment (5) - (5)
Balance at December 31, 2012 73 6 79
Additions 20 3 23
Disposals (8) (1) (9)
Balance at December 31, 2013 85 8 93
Accumulated amortization Balance at December 31, 2011 26 4 30
Amortization 31 1 32
Balance at December 31, 2012 57 5 62
Amortization 11 1 12
Disposals (8) - (8)
Balance at December 31, 2013 60 6 66
Carrying amounts At December 31, 2013 25 2 27
At December 31, 2012 16 1 17
The carrying amount for internally developed software at December 31, 2013 includes $20 of costs for software that is not yet available for use and therefore is not yet subject to amortization (2012 – $4).
Amortization and impairment of intangible assets is included in administration and other expenses on the consolidated statement of comprehensive income.
Impairment
During 2012, management determined that certain elements of internally developed software may not be implemented as originally intended due to business transformation initiatives. An impairment charge of $5 was recognized in the consolidated statement of comprehensive income during 2012, and the carrying amount of the impaired elements of internally developed software was reduced to nil at December 31, 2012.
PUBLIC ACCOUNTS, 2013-2014 3-141

WORKPLACE SAFETY AND INSURANCE BOARD Notes to Consolidated Financial Statements December 31, 2013 (millions of Canadian dollars)
16. Long-term Debt
Long-term debt is comprised of the following:
2013 2012 Mortgages payable 120 111
Bank loan - 10
Obligations under finance leases 48 48
168 169
Current portion (32) (7)
136 162
Mortgages payable
The WSIB has a mortgage loan agreement related to Simcoe Place (note 13) that is secured by the building and matures in 2015. The interest rate is fixed at 10.25% per annum compounded semi-annually. The balance of this mortgage as at December 31, 2013 was $59 (2012 – $61). For the year ended December 31, 2013, interest of $6 was included in administration and other expenses (2012 – $6).
Mortgages related to investment properties are held with a total principal balance of $61 (2012 – $50). The mortgages have annual fixed interest rates of 4.1% - 6.1%, and mature between 2014 and 2016. For the year ended December 31, 2013, interest of $2 was included in investment expenses (2012 – $2).
At December 31, 2013, future principal payments on mortgages payable were as follows:
Principal payments
Not later than one year 31
Later than one year and not later than five years 89
Later than five years -
120
Bank loan
The bank loan is comprised of the following:
2013 2012 Bank loan - 10
The WSIB entered into a bank loan on January 1, 2012 related to an investment property. The loan is secured by the investment property, bearing interest on a floating rate basis at the lender’s inter-bank rate plus 3% per annum. The loan was fully repaid on December 17, 2013.
Obligations under finance leases
The WSIB has a finance lease related to the land at Simcoe Place (note 13) with minimum annual lease payments of $4 (2012 – $4). The lease expires in 2027, at which point the WSIB has an option to purchase a 75% interest in the land for $2. Management considers this option to be advantageous and expects the option will be exercised. The interest rate on this finance lease is 19.59%.
PUBLIC ACCOUNTS, 2013-20143-142

WORKPLACE SAFETY AND INSURANCE BOARD Notes to Consolidated Financial Statements December 31, 2013 (millions of Canadian dollars)
The WSIB has three operating leases for investment properties. The WSIB has elected to measure these investment properties at fair value and to account for the related operating leases as finance leases. These leases have total annual minimum lease payments of $2 and interest rates ranging from 5.6% - 7.8%. Two of the leases have remaining lease terms of 38 years; the other has a remaining lease term of 74 years.
The WSIB has two finance leases for computer equipment with remaining lease terms of one year and interest rates ranging from 3.5% - 4.2%. The leases have total annual minimum lease payments of $0.2 for the next 12 months.
Future minimum lease payments under finance leases are as follows:
Future minimum lease
payments Interest
Present value of minimum
lease payments Not later than one year 6 (5) 1
Later than one year and not later than five years 24 (22) 2
Later than five years 120 (75) 45
150 (102) 48
17. Loss of Retirement Income Fund Liability
The Loss of Retirement Income Fund liability represents an obligation for payments of retirement benefits to eligible workers.
2013 2012 Balance, beginning of year 1,377 1,254
Contributions from the WSIB 62 67
Optional contributions from injured workers 8 9
Contributions from Schedule 2 employers 4 4
Investment income (note 10) 159 115
Benefits paid in cash (72) (72)
Balance, end of year 1,538 1,377
The WSIB contributes five percent of the loss of earnings benefits once a worker of a Schedule 1 employer has been receiving loss of earnings benefits for twelve continuous months. The WSIB’s contributions are recognized in the consolidated statement of comprehensive income as the Loss of Retirement Income Fund contributions expense.
Workers eligible for loss of retirement income benefits can choose to contribute a further five percent from their loss of earnings benefits. Schedule 2 employers are required to contribute five percent of the loss of earnings benefits for their workers once loss of earnings benefits are received for twelve continuous months.
For claims incurred prior to January 1, 1998, the contribution from the WSIB and Schedule 2 employers is 10% of every future economic loss payment made to injured workers.
Total contributions are segregated within the WSIB’s investment portfolio as Loss of Retirement Income Fund. The WSIB’s obligation pursuant to the WSIA is to provide retirement benefits equal to the WSIB’s contributions, contributions from injured workers and contributions from Schedule 2 employers, plus the investment income earned on those contributions. As such, the Loss of Retirement Income Fund liability is measured as the fair value of the assets in the Loss of Retirement Income Fund.
PUBLIC ACCOUNTS, 2013-2014 3-143

WORKPLACE SAFETY AND INSURANCE BOARD Notes to Consolidated Financial Statements December 31, 2013 (millions of Canadian dollars)
The assets of the Loss of Retirement Income Fund are included in the consolidated statement of financial position. The following provides a summary of the assets by category as defined by the WSIB’s SIPP:
2013 2012 Public equities 520 34% 498 36%
Fixed income 306 20% 306 22%
Real estate 105 7% 84 6%
Infrastructure 35 2% 18 1%
Multi-asset 339 22% 256 19%
Other 63 4% 60 5%
Included in total invested assets (note 10) 1,368 89% 1,222 89%
Cash and cash equivalents (note 9) 170 11% 155 11%
1,538 100% 1,377 100%
18. Employee Benefit Plans
The WSIB maintains two employee defined benefit pension plans, and other defined benefit plans that provide benefits such as post-employment dental, extended health and life insurance benefits. The cost of employee benefit plans is recognized as the employees provide service to the WSIB, and the liabilities for these plans are measured individually as the present value of the benefit obligation less the fair value of plan assets. The employee benefit plans liability represents the combined deficit of the plans at the reporting date.
The WSIB Employees’ Pension Plan provides for partially indexed pensions based on years of service and the best five consecutive years’ average earnings in the last 10 years of employment. The WSIB Employees’ Supplementary Pension Plan ensures that employees whose earnings exceed the threshold earnings for the maximum pension benefit permitted under the Federal Income Tax Act (ITA) will receive pension benefits based on their total earnings. The other long-term employee benefit plan provides certain post-employment medical, dental and insurance benefits.
Regulatory framework
The WSIB Employees’ Pension Plan is a registered pension plan under the Ontario Pension Benefits Act (PBA), which requires certain minimum benefit standards and funding levels. Minimum funding requirements under the PBA are determined based on actuarial valuations on a going concern basis that are required at a minimum of every three years. Deficits under the going concern basis may be funded over up to 15 years, beginning one year from the valuation date. In addition, solvency valuations must be performed which simulate a plan wind-up. Deficiencies established on a solvency basis may be funded over up to five years, beginning one year from the valuation date.
The WSIB Employees’ Supplementary Pension Plan is funded to the extent of employee contributions in excess of ITA limits, which are matched by the WSIB, and special contributions from the WSIB as may be necessary to meet expected benefit outflows. The other employee benefit plans are not funded in advance.
Funding and arrangements
With respect to the WSIB Employees’ Pension Plan, the WSIB’s practice is to contribute the minimum required under the PBA, but additional contributions may be made for tactical purposes, such as to meet a particular funding threshold. The WSIB Employees’ Pension Plan is open to new entrants, and employees pay contributions based on a fixed formula (as percentages of payroll), with the WSIB responsible for the balance of the cost of the WSIB Employees’ Pension Plan.
The WSIB applied for temporary solvency funding relief based on the December 31, 2012 solvency
PUBLIC ACCOUNTS, 2013-20143-144

WORKPLACE SAFETY AND INSURANCE BOARD Notes to Consolidated Financial Statements December 31, 2013 (millions of Canadian dollars)
valuation of the WSIB Employees’ Pension Plan, and the application was approved in June 2013. The temporary solvency relief provisions allow a longer period over which to fund the solvency deficiencies.
Governance of defined benefit plans
The Board of Directors of the WSIB oversees the administration of the employee benefit plans in accordance with applicable legislation and approves the governance structure, including the mandates of those to whom administrative duties and responsibilities have been delegated. The Board of Directors approves actuarial valuation reports and establishes employer contributions, approves audited plan financial statements, appoints and terminates key service providers and monitors plan funded status and regulatory, legislative and governance compliance.
The Board of Directors receives assistance in the fulfilment of its responsibilities related to the employee benefit plans through various committees, including the Audit and Finance Committee, the Human Resources and Compensation Committee and the Investment Committee.
Risks
Given that employee contributions to the employee benefit plans (if any) are fixed, the WSIB generally bears the risks associated with the defined benefit plans. The most significant sources of risk for the WSIB include:
a) A decline in discount rates that increases the measurement of the employee benefit plans liability;
b) For the WSIB Employees’ Pension Plan which is funded, investment returns which are lower than expected or which do not keep pace with changes in the defined benefit obligation due to interest rate changes;
c) Lower than expected rates of mortality; and
d) For retiree health and dental benefits, health care cost inflation being higher than expected.
In general, the WSIB manages the risks through plan design reviews and, in relation to investment risks, through risk control mechanisms in the WSIB’s SIPP.
Defined benefit plans expense
The cost of the employee defined benefit plans recognized in administration and other expenses is as follows:
2013 2012 Service cost 121 119
Net interest on the employee benefit plans liability 68 62
189 181
PUBLIC ACCOUNTS, 2013-2014 3-145

WORKPLACE SAFETY AND INSURANCE BOARD Notes to Consolidated Financial Statements December 31, 2013 (millions of Canadian dollars)
Remeasurements of the employee benefit plans recognized in other comprehensive income are as follows:
2013 2012 Actuarial gains and losses arising from changes in demographic assumptions - (55)
Actuarial gains and losses arising from changes in financial assumptions 678 (203)
Actuarial gains and losses arising from demographic and other experience (14) (19)
Return in excess of interest income on plan assets 176 114
840 (163)
Remeasurements are never reclassified to expenses; other comprehensive income related to the remeasurements is immediately transferred to the unfunded liability.
Employee benefit plans liability
The employee benefit plans liability is comprised of the following:
December 31
2013 December 31
2012 January 1
2012 Present value of unfunded obligations 598 655 594
Present value of wholly or partly funded obligations 2,665 3,089 2,686
Total present value of obligations 3,263 3,744 3,280
Fair value of plan assets (2,343) (2,074) (1,883)
Deficit 920 1,670 1,397
The movement in the total present value of defined benefit obligations is as follows:
2013 2012
Balance, beginning of year 3,744 3,280
Current service cost 112 95
Past service cost - 25
Contributions by employees 26 28
Interest expense on the defined benefit obligations 149 143
Actuarial gains and losses arising from demographic and other experience 27 18
Actuarial gains and losses arising from changes in demographic assumptions - 55
Actuarial gains and losses arising from changes in financial assumptions (683) 203
Benefits paid (112) (103)
Balance, end of year 3,263 3,744
Benefits to be paid during 2014 are projected to be $112, and the WSIB’s contributions to the plans are projected to be $112.
PUBLIC ACCOUNTS, 2013-20143-146

WORKPLACE SAFETY AND INSURANCE BOARD Notes to Consolidated Financial Statements December 31, 2013 (millions of Canadian dollars)
The WSIB Employees’ Pension Plan and Retiree Health, Dental and Life Insurance Benefit Plan together comprise approximately 95% of the defined benefit obligations as at December 31, 2013. The weighted average duration of the defined benefit obligations for these two plans, determined on the Modified basis, is as follows:
Pension Retiree welfare 2013 2013 Weighted average duration 15.5 19.6
Fair value of plan assets
The movement in the total fair value of plan assets is as follows:
2013 2012
Balance, beginning of year 2,074 1,883
Return in excess of interest income on plan assets 176 114
Interest income on plan assets 81 80
Contributions by the WSIB 98 72
Contributions by employees 26 28
Benefits paid (112) (103)
Balance, end of year 2,343 2,074
Plan assets are comprised of the following: 2013 2012
Plan assets by major category
Public equities 902 39% 871 42%
Fixed income 560 24% 547 26%
Real estate 193 8% 154 7%
Infrastructure 63 3% 33 2%
Multi-asset and other 625 26% 469 23%
Total 2,343 100% 2,074 100%
The plan assets and the associated risk are managed in accordance with the WSIB’s SIPP. The SIPP requires that the plan assets be diversified across certain asset classes and investment strategies (note 10). Measurement, assessment and management of risk is conducted using tools and analysis, including asset-liability studies, measures of standard deviation and tracking error, and sensitivity analysis. Other risks, such as operational risks, are managed through internal controls or other risk control mechanisms.
PUBLIC ACCOUNTS, 2013-2014 3-147

WORKPLACE SAFETY AND INSURANCE BOARD Notes to Consolidated Financial Statements December 31, 2013 (millions of Canadian dollars)
Actuarial assumptions
The significant actuarial assumptions used in the determination of the present value of the defined benefit obligations are as follows:
2013 2012 Discount rate – plan expenses 3.9% 4.3%
Discount rate – accrued benefit obligation 4.7% 3.9%
Inflation 2.0% 2.5%
Salary increases 3.0%-4.0% 3.5%-4.5%
Health care increases1 7.0% 8.0%
Dental increases 4.0% 4.0%
1. The assumptions for health care increases are for the subsequent year, after which the increase assumptions decline 100 basis points per annum to 4.0% in 2017 and thereafter.
The assumptions for mortality rates are based on the UP94 table projected generationally using scale AA for pension and benefit plans as at December 31, 2013 (unchanged from December 31, 2012).
Sensitivity of actuarial assumptions
Changes in the actuarial assumptions used have a significant effect on the employee benefit plans liability. The following provides an estimate of the potential impact of a change in the more significant assumptions:
Increase (decrease) in the defined benefit obligations
Change in assumption 2013
100 basis point increase in the discount rate (470)
100 basis point decrease in the discount rate 600
100 basis point increase in salary, indexation, government benefit increases 337
100 basis point decrease in salary, indexation, government benefit increases (284)
100 basis point increase in health care and dental costs escalation rate 82
100 basis point decrease in health care and dental costs escalation rate (68)
The sensitivities above assume all other assumptions are held constant.
The measurement of the defined benefit obligations is also sensitive to the mortality assumptions. A recently finalized report from the Canadian Institute of Actuaries on Canadian Pensioners’ Mortality confirms that the life expectancy of Canadian pensioners continues to increase and is significantly longer than commonly anticipated by pension actuaries. The current longevities underlying the measurement of the defined benefit obligations as at December 31 are as follows:
2013 Longevity for those currently age 65
Males 19.8 years
Females 22.2 years
Longevity at age 65 for those currently age 45
Males 21.3 years
Females 23.0 years
PUBLIC ACCOUNTS, 2013-20143-148
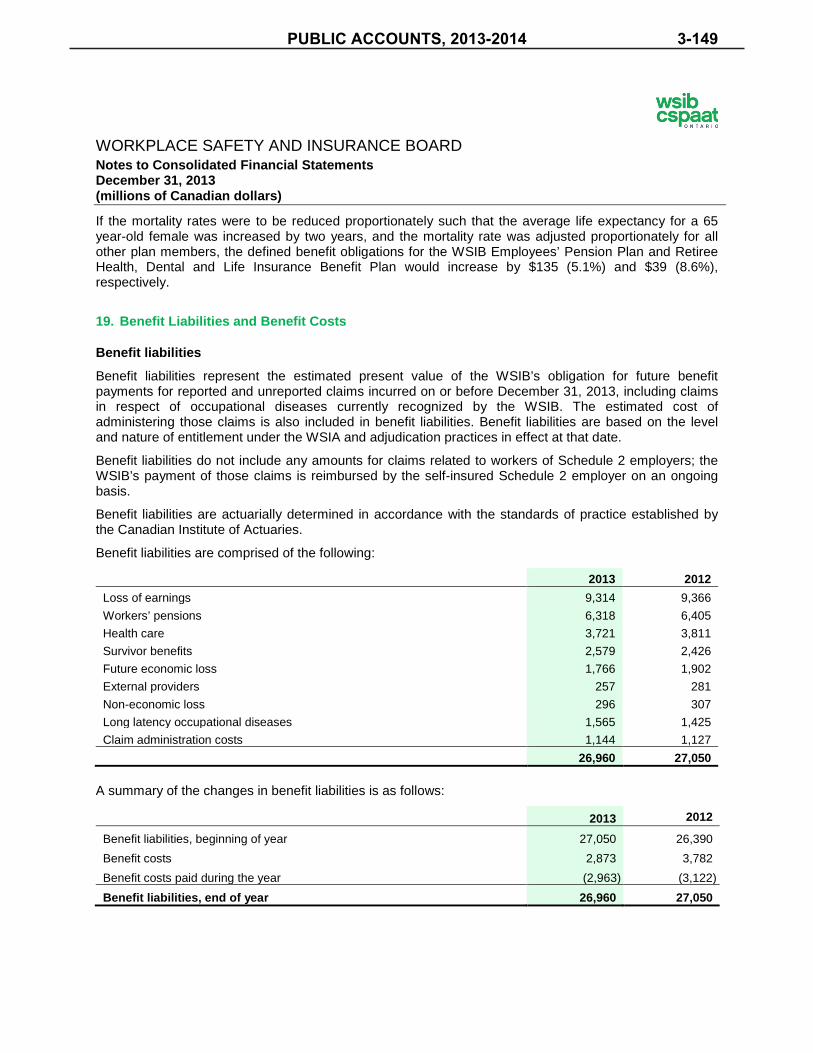
WORKPLACE SAFETY AND INSURANCE BOARD Notes to Consolidated Financial Statements December 31, 2013 (millions of Canadian dollars)
If the mortality rates were to be reduced proportionately such that the average life expectancy for a 65 year-old female was increased by two years, and the mortality rate was adjusted proportionately for all other plan members, the defined benefit obligations for the WSIB Employees’ Pension Plan and Retiree Health, Dental and Life Insurance Benefit Plan would increase by $135 (5.1%) and $39 (8.6%), respectively.
19. Benefit Liabilities and Benefit Costs
Benefit liabilities
Benefit liabilities represent the estimated present value of the WSIB’s obligation for future benefit payments for reported and unreported claims incurred on or before December 31, 2013, including claims in respect of occupational diseases currently recognized by the WSIB. The estimated cost of administering those claims is also included in benefit liabilities. Benefit liabilities are based on the level and nature of entitlement under the WSIA and adjudication practices in effect at that date.
Benefit liabilities do not include any amounts for claims related to workers of Schedule 2 employers; the WSIB’s payment of those claims is reimbursed by the self-insured Schedule 2 employer on an ongoing basis.
Benefit liabilities are actuarially determined in accordance with the standards of practice established by the Canadian Institute of Actuaries.
Benefit liabilities are comprised of the following:
2013 2012 Loss of earnings 9,314 9,366
Workers’ pensions 6,318 6,405
Health care 3,721 3,811
Survivor benefits 2,579 2,426
Future economic loss 1,766 1,902
External providers 257 281
Non-economic loss 296 307
Long latency occupational diseases 1,565 1,425
Claim administration costs 1,144 1,127
26,960 27,050
A summary of the changes in benefit liabilities is as follows:
2013 2012
Benefit liabilities, beginning of year 27,050 26,390
Benefit costs 2,873 3,782
Benefit costs paid during the year (2,963) (3,122)
Benefit liabilities, end of year 26,960 27,050
PUBLIC ACCOUNTS, 2013-2014 3-149

WORKPLACE SAFETY AND INSURANCE BOARD Notes to Consolidated Financial Statements December 31, 2013 (millions of Canadian dollars)
Further details of the changes in benefit liabilities are as follows:
Loss of earnings
Workers’ pensions
Future economic
loss Health care
Non-economic
loss External
providers Survivor benefits
Claim admin.
Occupa-tional
diseases 2012 2013 Benefit liabilities, beginning of year
9,366
6,405
1,902
3,811
307
281
2,426
1,127
1,425
27,050
26,390
Claim costs recognized during the year
845 - -
435
49
56
104
392
(42)
1,839 1,889
Payments processed during the year
(945)
(633)
(271)
(455)
(48)
(52)
(178)
(428) -
(3,010) (3,163)
Interest expense on the liability
490
335 97
200
16
14
129
56
75
1,412
1,371
Impact of actuarial remeasurement
172
342 53
4
10 -
174
27
114
896 1,638
Changes in claims experience
(614)
(131)
(15)
(274)
(38)
(42)
(76)
(30)
(7)
(1,227) (1,075)
Benefit liabilities, end of year
9,314
6,318
1,766
3,721
296
257
2,579
1,144
1,565
26,960
27,050
Benefit costs
Benefit costs are comprised of the following:
2013 2012 Benefit payments 2,518 2,664
Claim administration costs 445 458
Change in actuarial valuation of benefit liabilities (90) 660
2,873 3,782
Benefit payments represent cash paid during the year to or on behalf of injured workers. Benefit payments are comprised of the following:
2013 2012 Loss of earnings 908 968
Workers’ pensions 624 652
Health care 455 457
Survivor benefits 178 176
Future economic loss 242 259
External providers 52 65
Non-economic loss 48 60
Other 11 27
Benefit costs paid to or on behalf of injured workers 2,518 2,664 Claim administration costs 445 458
Benefit costs paid during the year 2,963 3,122
PUBLIC ACCOUNTS, 2013-20143-150

WORKPLACE SAFETY AND INSURANCE BOARD Notes to Consolidated Financial Statements December 31, 2013 (millions of Canadian dollars)
Change in actuarial valuation
The change in the actuarial valuation of benefit liabilities is comprised of the following:
2013 2012 Changes in estimate of cost of claims (2,398) (2,349)
Changes in actuarial assumptions and methods 896 1,638
Accretion1 1,412 1,371
(90) 660
1. Accretion represents the estimated interest cost of the benefits liability, considering the discount rate, benefit liabilities at the beginning of the year and payments during the year.
The changes in actuarial assumptions and methods are comprised of the following:
2013 2012 Change in discount rate 941 150
Changes in methods and assumptions for loss of earnings benefits - 310
Changes in mortality rates 343 -
Changes in occupational disease assumptions and methods 114 775
Changes for health care benefits - 196
Changes for future claim administration costs - 29
Other changes of methodology and assumptions (502) 178
896 1,638
Actuarial assumptions and methods
The actuarial present value of future benefit payments depends on actuarial assumptions, including economic assumptions, which are based on past experience modified for current trends and expected development. Actuarial assumptions are reviewed annually when the actuarial valuation is performed. Management believes the valuation methods and assumptions are, in aggregate, appropriate for the valuation of benefit liabilities.
PUBLIC ACCOUNTS, 2013-2014 3-151
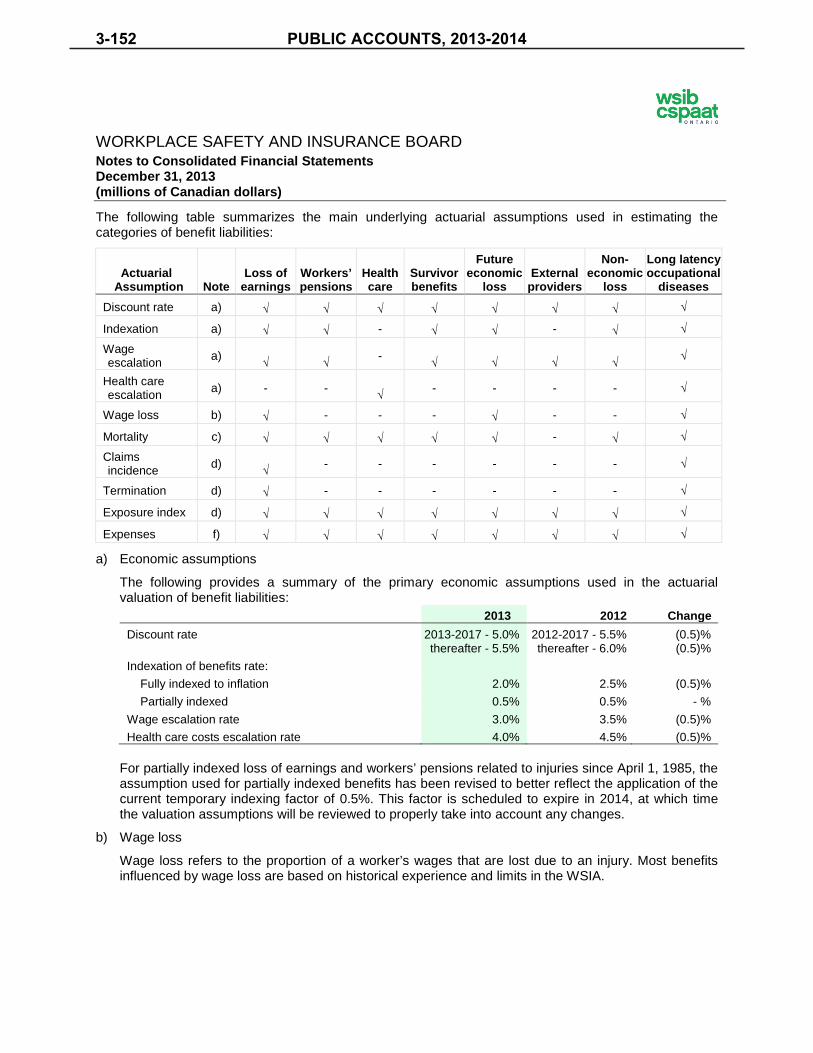
WORKPLACE SAFETY AND INSURANCE BOARD Notes to Consolidated Financial Statements December 31, 2013 (millions of Canadian dollars)
The following table summarizes the main underlying actuarial assumptions used in estimating the categories of benefit liabilities:
Actuarial Assumption Note
Loss of earnings
Workers’ pensions
Health care
Survivor benefits
Future economic
loss External
providers
Non-economic
loss
Long latency occupational
diseases Discount rate a) √ √ √ √ √ √ √ √
Indexation a) √ √ - √ √ - √ √
Wage escalation
a) √ √ - √ √ √ √
√
Health care escalation
a) - - √ - - - - √
Wage loss b) √ - - - √ - - √
Mortality c) √ √ √ √ √ - √ √
Claims incidence
d) √ - - - - - - √
Termination d) √ - - - - - - √
Exposure index d) √ √ √ √ √ √ √ √
Expenses f) √ √ √ √ √ √ √ √
a) Economic assumptions
The following provides a summary of the primary economic assumptions used in the actuarial valuation of benefit liabilities:
2013 2012 Change Discount rate 2013-2017 - 5.0%
thereafter - 5.5% 2012-2017 - 5.5%
thereafter - 6.0% (0.5)% (0.5)%
Indexation of benefits rate:
Fully indexed to inflation 2.0% 2.5% (0.5)%
Partially indexed 0.5% 0.5% - %
Wage escalation rate 3.0% 3.5% (0.5)%
Health care costs escalation rate 4.0% 4.5% (0.5)%
For partially indexed loss of earnings and workers’ pensions related to injuries since April 1, 1985, the assumption used for partially indexed benefits has been revised to better reflect the application of the current temporary indexing factor of 0.5%. This factor is scheduled to expire in 2014, at which time the valuation assumptions will be reviewed to properly take into account any changes.
b) Wage loss
Wage loss refers to the proportion of a worker’s wages that are lost due to an injury. Most benefits influenced by wage loss are based on historical experience and limits in the WSIA.
PUBLIC ACCOUNTS, 2013-20143-152

WORKPLACE SAFETY AND INSURANCE BOARD Notes to Consolidated Financial Statements December 31, 2013 (millions of Canadian dollars)
c) Mortality
The assumptions for mortality rates were updated in 2013 to reflect current experience and updated expectations for future mortality improvements derived from recent recognized studies. Mortality rates are used to estimate the duration for which the WSIB will continue to be required to make payments to injured workers or survivors receiving monthly pension amounts. The mortality assumptions are determined separately for injured workers and survivors as follows:
i) the mortality assumption for injured workers is based on an actuarial study of the mortality levels by age and gender experienced by WSIB disability income recipients from 2006-2010, adjusted to reflect any prevailing improvements (or otherwise) in the experience of WSIB injured workers up to and including 2013;
ii) the mortality assumption for those receiving survivor benefits is based on an actuarial study of mortality levels experienced by WSIB survivors, and the 2009-2011 Province of Ontario population mortality table developed by Statistics Canada, adjusted to reflect any prevailing improvements (or otherwise) in the experience of WSIB survivors up to and including 2013; and
iii) the mortality rates for both injured workers and survivors are projected for future years using the Canada Pension Plan’s mortality improvement factors. As such, future mortality rates are reduced to allow for greater future longevity expected for injured workers and survivors.
d) Claims incidence, termination and exposure index
Claims incidence refers to the number of claims incurred during the year and requires actuarial assumptions for the number of claims expected to have been incurred but not reported at December 31, 2013. Termination refers to the actuarial assumptions regarding the future duration of claims. Exposure index refers to the indicator used to assist in predicting certain future costs for different injury years and represents, on a relative basis, the level of risk insured by the WSIB.
The assumptions regarding claims incidence are determined based on the number of claims incurred in past years. The termination assumption is determined using average termination experience of the WSIB from three recent injury years and modified for the existing claims expected to be of longer duration. The exposure index has been developed using the number of claims incurred up to injury year 1998, and for subsequent years, the number of workers covered by the WSIB, adjusted by the variation in the average risk associated with these workers.
e) Occupational diseases
Occupational diseases refer to future occupational disease claims arising from exposures up to the valuation date to hazardous substances or conditions, such as asbestos and excessive noise. An in-depth study was performed in 2013 to estimate the number of latent occupational disease claims, the latency periods and their expected costs. These costs are for loss of earnings, labour market re-entry, future economic loss, health care, survivor benefits, retirement income benefits, and claim administration costs. The assumptions used for the determination of benefit liabilities were primarily based on the historical experience of the WSIB.
f) Expenses
Ratios of claim administration costs to the amounts of claims paid are used to estimate the future costs of claim administration for current claims. These ratios had been developed in analyzing claims administration and other claims related management costs for all cost centers at the WSIB by claim type, duration and amount.
PUBLIC ACCOUNTS, 2013-2014 3-153

WORKPLACE SAFETY AND INSURANCE BOARD Notes to Consolidated Financial Statements December 31, 2013 (millions of Canadian dollars)
Sensitivity of actuarial assumptions
Changes in the actuarial assumptions used have a significant effect on the benefit costs recognized. The following provides an estimate of the potential impact of a change in the more significant assumptions:
Increase in benefit costs
Change in assumption 2013 100 basis point decrease in the discount rate 2,568
100 basis point increase in the inflation rate:
Impact of benefit indexation rate 773
Impact of wage growth 446
Impact of health care cost escalation 461
Claims development
Benefit liabilities include the current estimate of future payments related to claims incurred during 2013 and prior years. Each reporting period, benefit liabilities are adjusted for changes in the estimate of the future payments, and the change in estimate is recognized in benefit costs. The table below provides the development of the estimates related to claims incurred from 2007 – 2013.
Year of injury 2007 2008 2009 2010 2011 2012 2013 Total Year of estimate
2007 2,488
2008 2,458 2,393
2009 2,786 2,620 2,164
2010 3,105 3,052 2,418 2,361
2011 3,286 3,065 2,207 2,744 2,760
2012 3,423 3,241 2,518 2,270 2,363 2,815
2013 3,135 3,077 2,340 2,065 2,019 2,274 2,627
Current estimate of cumulative claims costs
3,135
3,077
2,340
2,065
2,019 2,274
2,627
17,537
Cumulative payments made (1,357) (1,156) (718) (514) (396) (319) (169) (4,629)
Outstanding claims (undiscounted) 1,778 1,921 1,622 1,551 1,623 1,955 2,458 12,908
Effect of discounting (799) (870) (767) (762) (811) (970) (1,138) (6,117)
Discounted outstanding claims 979 1,051 855 789 812 985 1,320 6,791
Discounted outstanding claims prior to 2007 injury year 17,460
Claim administration costs 1,144
Long latency occupational diseases 1,565
Total outstanding claims 26,960
PUBLIC ACCOUNTS, 2013-20143-154

WORKPLACE SAFETY AND INSURANCE BOARD Notes to Consolidated Financial Statements December 31, 2013 (millions of Canadian dollars)
Rate setting
In accordance with the WSIA, the WSIB’s obligations are satisfied by charging annual premiums to all Schedule 1 employers and investment income. The premiums are determined based on a percentage of insurable earnings of each Schedule 1 employer. Schedule 1 employers are classified within specific rate groups, which are based on the nature of the employer’s business. The premium rate applicable to particular rate groups and Schedule 1 employers within that group is determined as the sum of four main components:
a) the cost of new claims, which is based on the expected number of claims and benefit payment costs of that rate group;
b) administration costs, which is based on the rate group’s share of expected administration costs and legislative obligations of the WSIB;
c) the cost of old claims, which is based on the amortization of the shortfall between the costs of old claims and the accumulated assets supporting those claims; and
d) experience rating, which, depending on the size and class of the employer, is based on relative historical cost performance of the employer relative to other employers in the same rate group.
Concentration of risks
The WSIB provides workplace injury insurance for all Schedule 1 employers with workers in the Province. In this respect, the WSIB’s risk is concentrated among the workplace risks associated with the various industries in the Province. The insurable earnings by industry for the year ended December 31, 2013 is provided below.
Industry Insurable earnings % of total
Agriculture 1,895 1.1%
Automotive 7,076 4.2%
Construction 18,040 10.6%
Education 6,554 3.9%
Electrical 5,378 3.2%
Food 4,853 2.9%
Forestry 391 0.2%
Health care 22,296 13.1%
Manufacturing 36,940 21.7%
Mining 2,002 1.2%
Municipal 2,058 1.2%
Primary metals 1,634 1.0%
Process and chemicals 4,490 2.6%
Pulp and paper 745 0.4%
Services 45,834 26.9%
Transportation 9,895 5.8%
Total 170,081 100.0%
In addition, the WSIB’s risks are concentrated among the workplace injuries and diseases that result in disabilities or deaths to injured workers. The WSIA does not provide the WSIB with the ability to diversify away from these risks. Additional risks can arise from appeals or legislative changes, which can produce an immediate increase in benefit liabilities.
PUBLIC ACCOUNTS, 2013-2014 3-155

WORKPLACE SAFETY AND INSURANCE BOARD Notes to Consolidated Financial Statements December 31, 2013 (millions of Canadian dollars)
Premium rates are the only means to mitigate these risks, other than investment income. Premium rates are adjusted annually as benefit liabilities and risks are reviewed and then differentiated by rate group in order to reflect the higher or lower expected costs and loss frequency associated with particular rate groups. In addition, the rates charged to larger employers in the same rate group are further adjusted based on the historical claims experience of that employer relative to the rate group as a whole.
Liquidity of benefit liabilities risks
The following table provides an estimate of the expected timing of undiscounted cash flows for benefit payments for claims:
2013 2012 Up to one year 5% 5%
Over one year and up to five years 18% 18%
Over five years and up to ten years 19% 19%
Over ten years and up to fifteen years 16% 16%
Over fifteen years 42% 42%
100% 100%
20. Commitments and Contingent Liabilities
Operating leases
The WSIB is the lessee to a number of operating leases for office space and computer equipment, with lease terms up to 10 years.
The future aggregate minimum lease payments under non-cancellable operating leases are as follows:
Minimum lease payments
Not later than one year 15
Later than one year and not later than five years 20
Later than five years 13
48
During the year ended December 31, 2013, operating lease payments of $14 (2012 – $13) were recognized in administration and other expenses. The payments included charges for operating expenses related to the leases of office space.
Investment commitments
The WSIB had the following commitments related to its investment portfolio:
2013 2012 Real estate, multi-asset and infrastructure investments 606 491
Investments in associates and joint ventures 198 222
Purchase or development of investment properties 197 -
1,001 713
PUBLIC ACCOUNTS, 2013-20143-156

WORKPLACE SAFETY AND INSURANCE BOARD Notes to Consolidated Financial Statements December 31, 2013 (millions of Canadian dollars)
Legislated obligations and funding commitments
Known commitments related to legislated obligations and funding commitments as at December 31, 2013 were approximately $254 for 2014 (2012 – $240 for 2013). Known commitments for voluntary employer incentive programs as at December 31, 2013 were nil (2012 – nil).
Other commitments
At December 31, 2013, the WSIB has additional commitments going forward under non-cancellable contracts for purchases of goods and services with minimum future payments of approximately $149 (2012 – $133).
Legal actions
The WSIB is engaged in various legal proceedings and claims that have arisen in the ordinary course of business, the outcome of which is subject to future resolution. Based on information currently known to the WSIB, management believes the probable ultimate resolution of all existing legal proceedings and claims will not have a material effect on the WSIB’s financial position.
The WSIB has provided formal written indemnities to its current and former directors to indemnify them, to the extent permitted by law, against any and all charges, costs, expenses, and amounts paid in settlement and damages incurred as a result of any lawsuit or any other judicial, administrative or investigative proceeding in which they are involved as a result of their services.
Additionally, the WSIB has purchased directors’ and officers’ liability insurance. The WSIB also indemnifies and provides legal representation to all its employees, former employees and persons engaged by the WSIB to conduct an examination, test, enquiry or other authorized function in legal proceedings arising out of alleged acts or omissions in the performance of their duties, provided the person has acted honestly and in good faith.
Also, in the normal course of operations, the WSIB may enter into contractual arrangements with external parties that involve promises to indemnify the other party under certain circumstances. As part of its investment function, the WSIB may also provide indemnification agreements to counterparties that would require the WSIB to compensate them for costs incurred as a result of changes in laws and regulations or as a result of litigation claims or statutory sanctions that may be suffered by the counterparty as a consequence of the transaction. The terms of these indemnification arrangements vary.
PUBLIC ACCOUNTS, 2013-2014 3-157

WORKPLACE SAFETY AND INSURANCE BOARD Notes to Consolidated Financial Statements December 31, 2013 (millions of Canadian dollars)
21. Fair Value Measurement and Disclosures
Estimates of fair value used for measurement and disclosure are designed to approximate amounts that would be received to sell an asset, or paid to transfer a liability, in an orderly transaction between market participants.
Assets / Liabilities Fair value measurement
Cash and cash equivalents, equity securities, bonds, investment funds, real estate debentures, annuities, derivative assets and derivative liabilities
Measured at fair value in the consolidated statement of financial position.
Receivables, payables and accruals Measured at amortized cost in the consolidated statement of financial position.
Due to the short-term nature of these financial assets and financial liabilities, the carrying amount approximates fair value.
Investment properties Measured at fair value in the consolidated statement of financial position.
Long-term debt Measured at amortized cost in the consolidated statement of financial position.
Fair value at December 31, 2013 was $191 (carrying amount – $168).
Fair value at December 31, 2012 was $204 (carrying amount – $169).
Due to the estimation process and the need to use judgment, the aggregate fair value amounts should not be interpreted as being necessarily realizable in an immediate settlement of assets or liabilities.
Fair value hierarchy
The WSIB uses a fair value hierarchy to categorize the inputs used in valuation techniques to estimate the fair values of assets and liabilities.
The classifications are as follows:
a) the use of quoted market prices for identical assets or liabilities (Level 1);
b) valuation techniques for which the lowest level input that is significant to the fair value measurement is directly or indirectly observable (Level 2); and
c) valuation techniques for which the lowest level input that is significant to the fair value measurement is unobservable (Level 3).
Measurements of the fair value of an asset or liability may use multiple inputs that are categorized in different levels of the fair value hierarchy. In these cases, the asset or liability is classified in the hierarchy level of the lowest level input that is significant to the measurement.
During the year ended December 31, 2013 and the year ended December 31, 2012, there were no changes in the levels of classification of financial instruments. Transfers between levels within the hierarchy are recognized at the end of the reporting period.
PUBLIC ACCOUNTS, 2013-20143-158
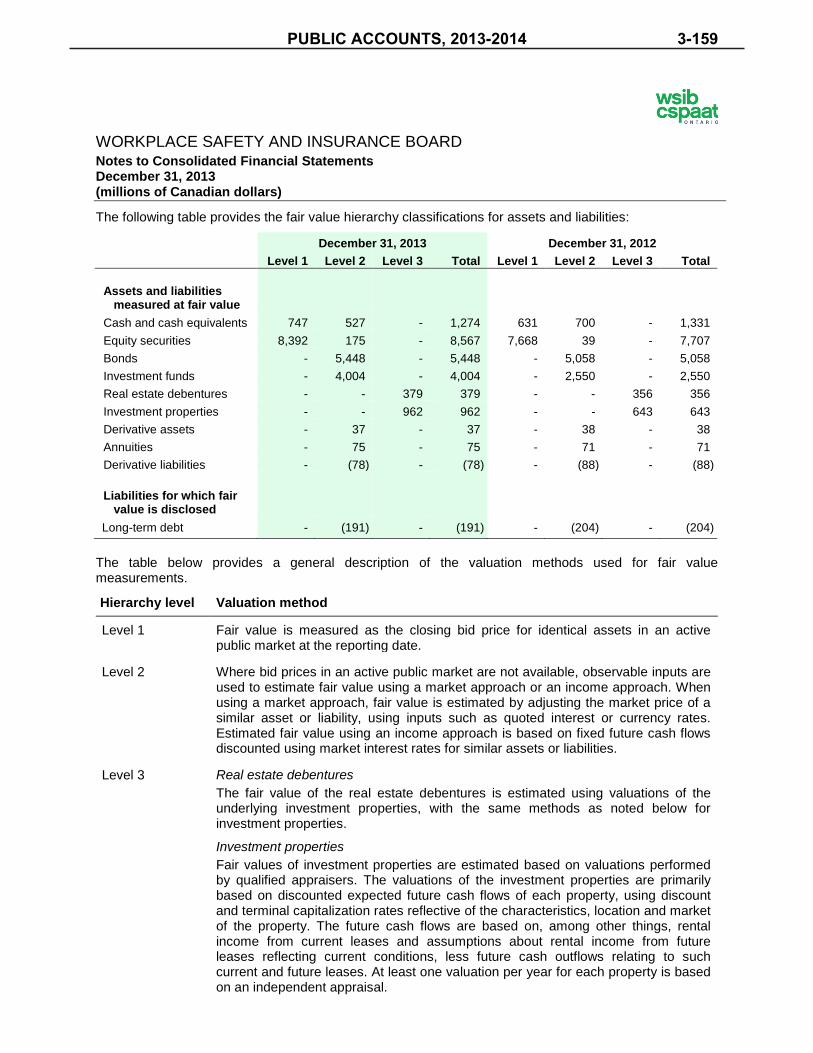
WORKPLACE SAFETY AND INSURANCE BOARD Notes to Consolidated Financial Statements December 31, 2013 (millions of Canadian dollars)
The following table provides the fair value hierarchy classifications for assets and liabilities:
December 31, 2013 December 31, 2012
Level 1 Level 2 Level 3 Total Level 1 Level 2 Level 3 Total
Assets and liabilities measured at fair value
Cash and cash equivalents 747 527 - 1,274 631 700 - 1,331
Equity securities 8,392 175 - 8,567 7,668 39 - 7,707
Bonds - 5,448 - 5,448 - 5,058 - 5,058
Investment funds - 4,004 - 4,004 - 2,550 - 2,550
Real estate debentures - - 379 379 - - 356 356
Investment properties - - 962 962 - - 643 643
Derivative assets - 37 - 37 - 38 - 38
Annuities - 75 - 75 - 71 - 71
Derivative liabilities - (78) - (78) - (88) - (88)
Liabilities for which fair value is disclosed
Long-term debt - (191) - (191) - (204) - (204)
The table below provides a general description of the valuation methods used for fair value measurements.
Hierarchy level Valuation method
Level 1 Fair value is measured as the closing bid price for identical assets in an active public market at the reporting date.
Level 2 Where bid prices in an active public market are not available, observable inputs are used to estimate fair value using a market approach or an income approach. When using a market approach, fair value is estimated by adjusting the market price of a similar asset or liability, using inputs such as quoted interest or currency rates. Estimated fair value using an income approach is based on fixed future cash flows discounted using market interest rates for similar assets or liabilities.
Level 3 Real estate debentures The fair value of the real estate debentures is estimated using valuations of the underlying investment properties, with the same methods as noted below for investment properties.
Investment properties Fair values of investment properties are estimated based on valuations performed by qualified appraisers. The valuations of the investment properties are primarily based on discounted expected future cash flows of each property, using discount and terminal capitalization rates reflective of the characteristics, location and market of the property. The future cash flows are based on, among other things, rental income from current leases and assumptions about rental income from future leases reflecting current conditions, less future cash outflows relating to such current and future leases. At least one valuation per year for each property is based on an independent appraisal.
PUBLIC ACCOUNTS, 2013-2014 3-159

WORKPLACE SAFETY AND INSURANCE BOARD Notes to Consolidated Financial Statements December 31, 2013 (millions of Canadian dollars)
Real estate debentures (level 3 fair value measurements)
The table below provides a reconciliation of the fair value of real estate debentures:
2013 2012 Balance at beginning of year 356 337
Purchases 11 9
Sales (1) (10)
Realized gains recognized in net investment income - 2
Unrealized gains recognized in net investment income 13 18
Balance at end of year 379 356
The following discount and terminal capitalization rates were used in the discounted cash flow estimates of fair value:
2013 2012 Real estate debentures
Discount rates 5.5% - 8.5% 6.3% - 8.5%
Terminal capitalization rates 4.8% - 7.8% 5.3% - 7.5%
The WSIB has estimated that a 50 basis point increase in the assumptions used for both the terminal capitalization rate and discount rate would result in a $40 decrease (2012 – $34) in the fair value of the real estate debentures. A 50 basis point decrease in the assumptions used for both the terminal capitalization rate and discount rate would result in an estimated $45 increase (2012 – $35) in the fair value of the real estate debentures. The WSIB has also estimated that a five percent increase (decrease) in the expected future cash flows of the underlying properties would result in a $21 (2012 – $19) increase (decrease) in the fair value of the real estate debentures.
Investment properties (level 3 fair value measurements)
Note 12 provides a reconciliation of the fair value of investment properties.
The following discount and terminal capitalization rates were used in the discounted cash flow estimates of fair value:
2013 2012 Office properties
Discount rates 6.5% - 8.0% 7.0% - 8.3%
Terminal capitalization rates 5.8% - 7.0% 6.3% - 7.3% Industrial properties
Discount rates 6.0% - 8.0% 7.0% - 8.0%
Terminal capitalization rates 5.0% - 7.3% 6.5% - 7.3% Retail properties
Discount rates 7.3% - 8.0% 7.5% - 8.0%
Terminal capitalization rates 6.0% - 6.5% 6.3% - 6.8%
PUBLIC ACCOUNTS, 2013-20143-160

WORKPLACE SAFETY AND INSURANCE BOARD Notes to Consolidated Financial Statements December 31, 2013 (millions of Canadian dollars)
The WSIB has estimated that a 50 basis point increase in the assumptions used for both the terminal capitalization rate and discount rate would result in a $69 (2012 – $45) decrease in the fair value of the investment properties. A 50 basis point decrease in the assumptions used for both the terminal capitalization rate and discount rate would result in an estimated $82 (2012 – $49) increase in the fair value of the investment properties. The WSIB has also estimated that a five percent increase (decrease) in the stabilized net operating income or expected future cash flows would result in a $44 (2012 – $29) increase (decrease) in the fair value of the investment properties.
22. Funding and Capital Management
As the trust agency for administering the Province’s compensation system, the WSIB’s capital management objective is to ensure sufficient funding to provide compensation and other benefits to workers and to the survivors of deceased workers. The WSIA requires the WSIB to make payments for current benefits as they come due and to provide for future benefits. Further, the WSIA requires the WSIB to maintain sufficient funding so as not to burden unduly or unfairly any class of Schedule 1 employers with payments, in any year in respect of current benefits, or in future years in respect of future benefits.
The capital resources available to the WSIB are comprised of its total assets less total liabilities, excluding those attributable to non-controlling interests. At December 31, 2013, the WSIB’s capital is represented by the unfunded liability attributable to WSIB stakeholders of $10,638 (2012 - $14,061).
Ontario Regulation 141/12 (“Regulation 141”), which came into force January 1, 2013, requires the WSIB to meet prescribed Sufficiency Ratios by certain dates over the next 15 years. This regulation was amended by Ontario Regulation 338/13, which comes into force January 1, 2014 and further clarifies the measurement of assets and liabilities included in the Sufficiency Ratio. The Sufficiency Ratio is calculated by comparing total assets to total liabilities, with certain assets and liabilities measured on a different basis than that required under IFRS. The WSIB is required to meet the following Sufficiency Ratios, as defined by regulation:
December 31, 2017 60%
December 31, 2022 80%
December 31, 2027 100%
On August 8, 2013, the Minister of Labour formally accepted the WSIB’s Sufficiency Plan describing the measures being taken by the WSIB to improve the Sufficiency Ratio and how these measures will achieve the prescribed targets. The WSIB prepares a quarterly Sufficiency Report to Stakeholders to report on its progress towards meeting the legislated funding requirements.
As at December 31, 2013, the Sufficiency Ratio, as defined in Regulation 141, was 66.0% (2012 – 57.0%).
PUBLIC ACCOUNTS, 2013-2014 3-161
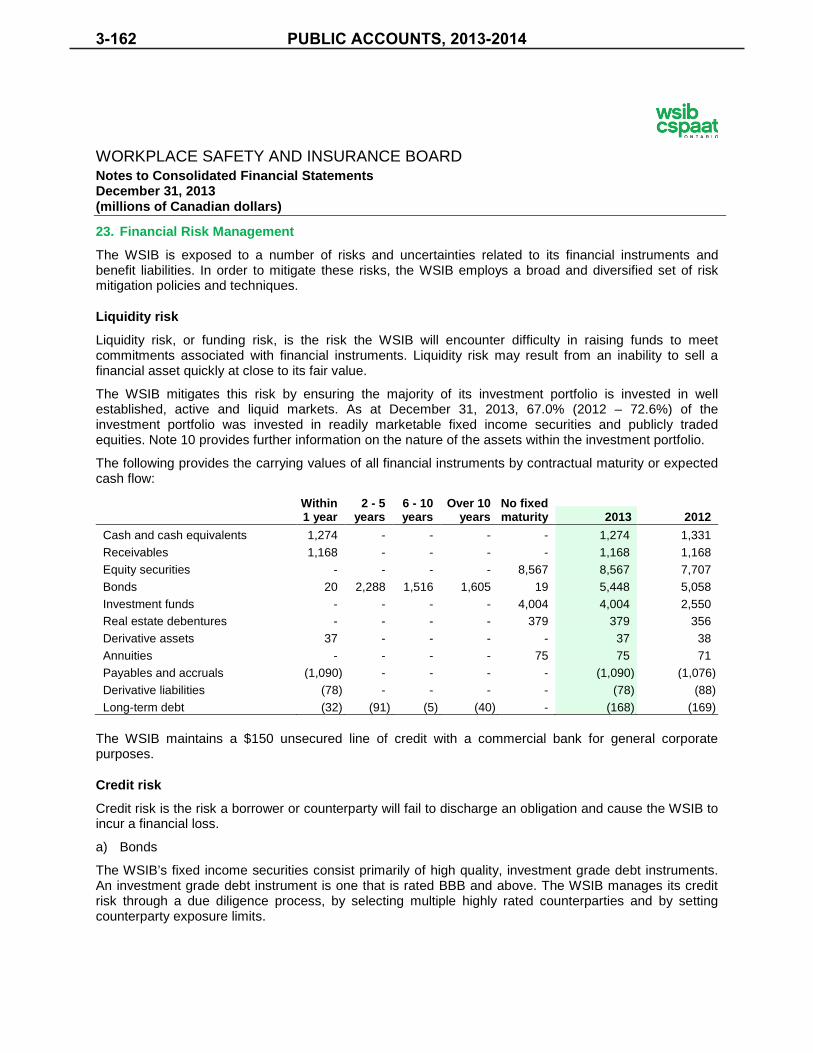
WORKPLACE SAFETY AND INSURANCE BOARD Notes to Consolidated Financial Statements December 31, 2013 (millions of Canadian dollars)
23. Financial Risk Management
The WSIB is exposed to a number of risks and uncertainties related to its financial instruments and benefit liabilities. In order to mitigate these risks, the WSIB employs a broad and diversified set of risk mitigation policies and techniques.
Liquidity risk
Liquidity risk, or funding risk, is the risk the WSIB will encounter difficulty in raising funds to meet commitments associated with financial instruments. Liquidity risk may result from an inability to sell a financial asset quickly at close to its fair value.
The WSIB mitigates this risk by ensuring the majority of its investment portfolio is invested in well established, active and liquid markets. As at December 31, 2013, 67.0% (2012 – 72.6%) of the investment portfolio was invested in readily marketable fixed income securities and publicly traded equities. Note 10 provides further information on the nature of the assets within the investment portfolio.
The following provides the carrying values of all financial instruments by contractual maturity or expected cash flow:
Within 1 year
2 - 5 years
6 - 10 years
Over 10 years
No fixed maturity 2012 2013
Cash and cash equivalents 1,274 - - - - 1,274 1,331
Receivables 1,168 - - - - 1,168 1,168
Equity securities - - - - 8,567 8,567 7,707
Bonds 20 2,288 1,516 1,605 19 5,448 5,058
Investment funds - - - - 4,004 4,004 2,550
Real estate debentures - - - - 379 379 356
Derivative assets 37 - - - - 37 38
Annuities - - - - 75 75 71
Payables and accruals (1,090) - - - - (1,090) (1,076)
Derivative liabilities (78) - - - - (78) (88)
Long-term debt (32) (91) (5) (40) - (168) (169)
The WSIB maintains a $150 unsecured line of credit with a commercial bank for general corporate purposes.
Credit risk
Credit risk is the risk a borrower or counterparty will fail to discharge an obligation and cause the WSIB to incur a financial loss.
a) Bonds
The WSIB’s fixed income securities consist primarily of high quality, investment grade debt instruments. An investment grade debt instrument is one that is rated BBB and above. The WSIB manages its credit risk through a due diligence process, by selecting multiple highly rated counterparties and by setting counterparty exposure limits.
PUBLIC ACCOUNTS, 2013-20143-162

WORKPLACE SAFETY AND INSURANCE BOARD Notes to Consolidated Financial Statements December 31, 2013 (millions of Canadian dollars)
The following provides information regarding the credit rating of the WSIB’s bonds:
2013 2012 AAA 2,074 38.1% 1,830 36.2%
AA 1,570 28.8% 1,445 28.6%
A 1,465 26.9% 1,413 27.9%
BBB 338 6.2% 369 7.3%
BB 1 - % 1 - %
5,448 100.0% 5,058 100.0%
The following provides further information regarding the maximum credit exposure of bonds:
2013 2012 Bonds
Canadian bonds 5,042 4,551
United States bonds 183 208
Global bonds 223 299
5,448 5,058
Credit risk associated with bonds also includes concentration risk. Concentration risk arises from the exposure of investments from one particular issuer, a group of issuers, a geographic region, or an industry sector. These groups share similar characteristics such as type of industry, regulatory compliance, and economic and political conditions, which may impact the issuers’ ability to meet their contractual commitments.
The WSIB manages concentration risk through limits on exposure to issuers, regions and industry sectors. Through these limits, not more than five percent of the fair value of the investment portfolio is invested in the securities of a single non-government issuer.
The following provides information regarding the concentration of bonds.
2013 2012 Provincial and municipal 2,572 47.2% 2,073 41.0%
Federal government and agencies 1,515 27.8% 1,452 28.7%
Financial services 623 11.4% 726 14.3%
Utilities and telecommunications 315 5.8% 357 7.1%
Other corporate 147 2.7% 157 3.1%
Natural resources 92 1.7% 111 2.2%
Consumer products and merchandising 76 1.4% 75 1.5%
Real estate 51 0.9% 41 0.8%
Asset-backed securities 31 0.6% 29 0.6%
Communications and publishing 22 0.4% 32 0.6%
Industrial products 4 0.1% 5 0.1%
5,448 100.0% 5,058 100.0%
PUBLIC ACCOUNTS, 2013-2014 3-163
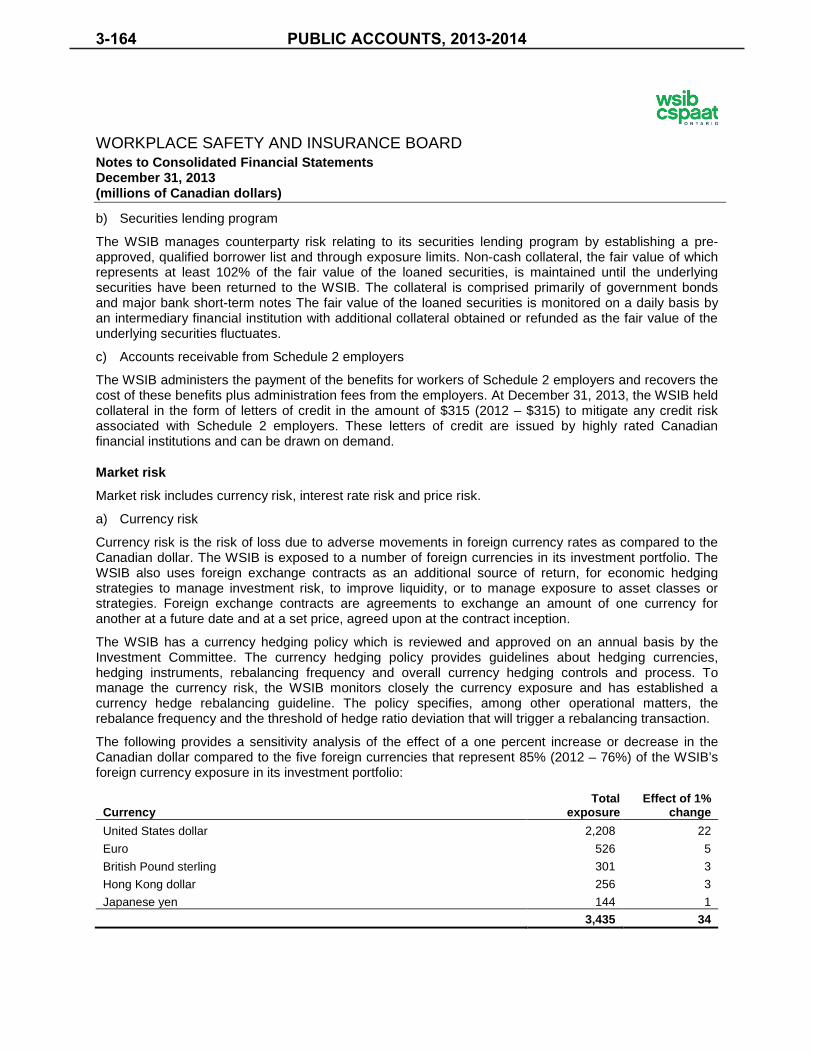
WORKPLACE SAFETY AND INSURANCE BOARD Notes to Consolidated Financial Statements December 31, 2013 (millions of Canadian dollars)
b) Securities lending program
The WSIB manages counterparty risk relating to its securities lending program by establishing a pre-approved, qualified borrower list and through exposure limits. Non-cash collateral, the fair value of which represents at least 102% of the fair value of the loaned securities, is maintained until the underlying securities have been returned to the WSIB. The collateral is comprised primarily of government bonds and major bank short-term notes The fair value of the loaned securities is monitored on a daily basis by an intermediary financial institution with additional collateral obtained or refunded as the fair value of the underlying securities fluctuates.
c) Accounts receivable from Schedule 2 employers
The WSIB administers the payment of the benefits for workers of Schedule 2 employers and recovers the cost of these benefits plus administration fees from the employers. At December 31, 2013, the WSIB held collateral in the form of letters of credit in the amount of $315 (2012 – $315) to mitigate any credit risk associated with Schedule 2 employers. These letters of credit are issued by highly rated Canadian financial institutions and can be drawn on demand.
Market risk
Market risk includes currency risk, interest rate risk and price risk.
a) Currency risk
Currency risk is the risk of loss due to adverse movements in foreign currency rates as compared to the Canadian dollar. The WSIB is exposed to a number of foreign currencies in its investment portfolio. The WSIB also uses foreign exchange contracts as an additional source of return, for economic hedging strategies to manage investment risk, to improve liquidity, or to manage exposure to asset classes or strategies. Foreign exchange contracts are agreements to exchange an amount of one currency for another at a future date and at a set price, agreed upon at the contract inception.
The WSIB has a currency hedging policy which is reviewed and approved on an annual basis by the Investment Committee. The currency hedging policy provides guidelines about hedging currencies, hedging instruments, rebalancing frequency and overall currency hedging controls and process. To manage the currency risk, the WSIB monitors closely the currency exposure and has established a currency hedge rebalancing guideline. The policy specifies, among other operational matters, the rebalance frequency and the threshold of hedge ratio deviation that will trigger a rebalancing transaction.
The following provides a sensitivity analysis of the effect of a one percent increase or decrease in the Canadian dollar compared to the five foreign currencies that represent 85% (2012 – 76%) of the WSIB’s foreign currency exposure in its investment portfolio:
Currency Total
exposure Effect of 1%
change United States dollar 2,208 22
Euro 526 5
British Pound sterling 301 3
Hong Kong dollar 256 3
Japanese yen 144 1
3,435 34
PUBLIC ACCOUNTS, 2013-20143-164

WORKPLACE SAFETY AND INSURANCE BOARD Notes to Consolidated Financial Statements December 31, 2013 (millions of Canadian dollars)
b) Interest rate risk
Interest rate risk is the potential for financial loss arising from changes in interest rates. The WSIB reviews interest rate risk through periodic analyses that assess the impact of different interest rate scenarios on its assets and liabilities over a period of time. Interest rate risk is mitigated over the long-term primarily through asset allocation.
The WSIB uses option adjusted modified duration to measure the sensitivity of the fair value of bonds to a change in interest rates. A parallel shift in the yield curve of one percent, with all other variables held constant, would result in an increase or decrease in the fair value of bonds of approximately $677 (2012 – $701). This information is based on the assumption that the bonds are not impaired and interest rates and equity prices move independently.
c) Price risk
Price risk is the risk the value of an equity security will fluctuate as a result of changes in market prices, whether those changes are caused by factors specific to the individual instrument, specific to its issuer, or affecting all instruments traded in the market.
The WSIB mitigates price risk by diversifying its investment portfolio in accordance with its investment policies. The investment policies establish the policies governing the WSIB investment portfolio, and is reviewed by the Board of Directors on no less than an annual basis and is amended as required. The investment policies require that the WSIB’s investment portfolio be diversified across certain asset classes and investment strategies.
The estimated effect on the fair value of equity securities resulting from a 10% change in market indices, holding all other factors constant, is as follows:
Total exposure
Effect of 10% change
MSCI All Country World Index 9,103 910
Benefit liabilities
Benefit liabilities represent the actuarially determined present value of future payments for reported and unreported claims related to workers of Schedule 1 employers incurred on or prior to the reporting date. Benefit liabilities do not represent an exact calculation of liability, but instead represent estimates at a given point in time involving actuarial and statistical projections of the WSIB’s expectations of the ultimate settlement and administration costs of claims incurred. Establishing an appropriate level of benefit liabilities is an inherently uncertain process.
The WSIB is exposed to the risk that the actual obligations for benefit payments exceed its estimate of benefit liabilities. Benefit liabilities are influenced by factors such as the discount rate used to value future claims, expected inflation, availability, utilization and cost of health care services, injury severity and duration, availability of return-to-work programs and re-employment opportunities at pre-injury employers, wage growth, new medical findings that affect the recognition of occupational diseases, legislated changes to benefit rates or modification of the recognition of workplace injuries, which are sometimes applied retroactively, and precedents established through various claims appeals processes.
The WSIB mitigates these risks by utilizing both proprietary and commercially available actuarial models, assessing historical loss development patterns in addition to augmenting its resources with the recruitment of a Chief Statistician and the formation of an Actuarial Advisory Board consisting of individuals with expertise in the area of actuarial science and specifically as it relates to worker compensation matters.
Note 19 provides further information regarding the nature of benefit liabilities.
PUBLIC ACCOUNTS, 2013-2014 3-165

WORKPLACE SAFETY AND INSURANCE BOARD Notes to Consolidated Financial Statements December 31, 2013 (millions of Canadian dollars)
24. Related Party Transactions
Government of Ontario and related entities
The WSIB is a trust agency of the Government of Ontario, responsible for administering the WSIA. As such, the WSIB is considered a government-related entity and is provided partial exemptions under IFRS from its disclosure of transactions with the Government of Ontario and its controlled ministries, agencies, and Crown corporations.
Pursuant to the WSIA, the WSIB is required to reimburse the Government of Ontario for all administrative costs of the OHSA. The WSIB is also required to fund costs associated with the MoL’s prevention activities, the Workplace Safety and Insurance Appeals Tribunal and the offices of each of the Worker and Employer Adviser. These reimbursements and associated amounts charged to employers are determined and approved by the Minister of Labour. The WSIB is also committed to providing funding for voluntary employer incentive programs, the Institute for Work & Health and the Safe Workplace Associations, clinics and training centres. The total funding provided under these legislated obligations and funding commitments for the year ended December 31, 2013 was $286 (2012 – $276).
In addition to legislated obligations and workplace health and safety expenses, which the WSIB collectively presents in legislated obligations and funding commitments expense, the consolidated financial statements include amounts resulting from transactions conducted in the normal course of operations with various controlled ministries, agencies and Crown corporations of the Government of Ontario.
Included in bonds are $1,083 of marketable fixed income securities issued by the Government of Ontario and related entities (2012 – $960).
Key management remuneration
The remuneration of key management, which includes the Board of Directors, is included in administration and other expenses.
2013 2012 Salaries and short-term benefits 2.7 2.7
Long-term benefit plans 0.2 0.2
2.9 2.9
Post-employment benefit plans
The WSIB’s two employee defined benefit pension plans and other long-term employee benefit plans are considered related parties. Note 18 provides details of transactions with these post-employment benefit plans.
PUBLIC ACCOUNTS, 2013-20143-166

WORKPLACE SAFETY AND INSURANCE BOARD Notes to Consolidated Financial Statements December 31, 2013 (millions of Canadian dollars)
25. Interests in Other Entities
Interests in subsidiaries
The WSIB’s consolidated financial statements include the financial statements of all its subsidiaries.
a) Directly owned subsidiaries
The WSIB’s invested assets are held directly or indirectly by the following subsidiaries:
WSIB’s ownership
Country of incorporation and operation
2013 2012
Wholly owned subsidiary
799549 Ontario Inc. 100.0% 100.0% Canada
Partly-owned subsidiaries (“Investment Pools”)
Absolute Return (2012) Pooled Fund Trust 88.4% 88.0% Canada
Diversified Markets (2010) Pooled Fund Trust (i) 88.8% n/a Canada
Diversified Beta Strategies Limited (i) n/a 88.0% Canada Diversified Markets (2009) Pooled Fund Trust 88.8% 88.3% Canada
WSIB Investments (Fixed Income) Pooled Fund Trust 88.9% 88.0% Canada
WSIB Investments (Infrastructure) Pooled Fund Trust 88.1% 87.9% Canada
WSIB Investments (Public Equities) Pooled Fund Trust 88.9% 88.4% Canada
WSIB Investments (Realty) Limited 87.9% 87.9% Canada
WSIB Investments (Total Return) Pooled Fund Trust 88.3% 87.9% Canada (i) During 2013, Diversified Beta Strategies Limited was wound-up, and Diversified Markets (2010) Pooled Fund Trust was
established.
The WSIB Employees’ Pension Plan is the non-controlling interest in each of the Investment Pools listed above; its non-controlling ownership ranges from 11.1% - 12.1%. The following provides aggregated summary financial information for the Investment Pools, before intercompany eliminations:
Summary information from statements of financial position 2013 2012 Total assets 20,774 17,660
Total liabilities (199) (221)
Surplus of assets 20,575 17,439
Attributable to the WSIB Employees’ Pension Plan 2,313 2,054
Summary information from statements of comprehensive income 2013 2012 Investment income 2,325 1,674
Investment expenses (62) (59)
Net investment income, net income and comprehensive income 2,263 1,615
Attributable to the WSIB Employees’ Pension Plan 258 191
Details of the nature of investments held by the Investment Pools are included in note 10.
PUBLIC ACCOUNTS, 2013-2014 3-167

WORKPLACE SAFETY AND INSURANCE BOARD Notes to Consolidated Financial Statements December 31, 2013 (millions of Canadian dollars)
b) Other subsidiaries
WSIB Investments (Realty) Limited and WSIB Investments (Infrastructure) Pooled Fund Trust hold invested assets in a number of wholly and partly-owned subsidiaries. The WSIB’s consolidated financial statements include the financial statements of these subsidiaries.
c) Reconciliation of non-controlling interests
The following provides a reconciliation of the unfunded liability attributable to WSIB stakeholders and non-controlling interests, including the effect of changes in ownership:
Unfunded
liability attributable
to WSIB stakeholders
Non-controlling interests
Investment Pools
Other subsidiaries Total
Balance at December 31, 2011 (14,807) 1,867 38 1,905
Total comprehensive income 746 191 7 198
Acquisition of businesses with non-controlling interests (note 12) - - 4 4
Distributions paid by subsidiaries to non-controlling interests - (91) (2) (93)
Disposition of non-controlling interests (i) - 87 2 89
Balance at December 31, 2012 (14,061) 2,054 49 2,103
Total comprehensive income 3,423 258 6 264
Acquisition of a businesses with non-controlling interests (note 12) - - 22 22
Distributions paid by subsidiaries to non-controlling interests - (109) (3)
(112)
Disposition of non-controlling interests1 - 110 7 117
Balance at December 31, 2013 (10,638) 2,313 81 2,394 1. Disposition of non-controlling interests represent net contributions by non-controlling interests and resulted in
changes in the WSIB’s ownership share in the Investment Pools, however there was no effect on the unfunded liability attributable to WSIB stakeholders. The net contributions by non-controlling interests in other subsidiaries did not result in any changes in the WSIB’s ownership share.
Interests in associates
WSIB Investments (Realty) Limited holds invested assets in a number of associates. The WSIB’s investments in associates are accounted for in the consolidated financial statements using the equity method; investments are initially recognized at cost and adjusted for the WSIB’s proportionate share of the associates’ comprehensive income.
Summary financial information for these associates in aggregate is provided in note 11.
Interests in joint ventures
WSIB Investments (Realty) Limited and WSIB Investments (Infrastructure) Pooled Fund Trust hold invested assets in a number of joint ventures. The WSIB’s investments in joint ventures are accounted for in the consolidated financial statements using the equity method; investments are initially recognized at cost and adjusted for the WSIB’s proportionate share of the joint ventures’ comprehensive income.
Summary financial information for the joint ventures in aggregate is provided in note 11.
PUBLIC ACCOUNTS, 2013-20143-168

WORKPLACE SAFETY AND INSURANCE BOARD Notes to Consolidated Financial Statements December 31, 2013 (millions of Canadian dollars)
Interests in joint operations
799549 Ontario Inc. and WSIB Investments (Realty) Limited hold invested assets in a number of joint operations. The WSIB’s consolidated financial statements include its share of assets, liabilities, revenues and expenses related to the joint operations.
Summary financial information for the joint operations in aggregate is provided in note 13.
PUBLIC ACCOUNTS, 2013-2014 3-169


MINISTRY 2013-14
FINANCE....................................................................................... 284,266,757.12
TRAINING, COLLEGES AND UNIVERSITIES.............................. 82,507,373.70
COMMUNITY AND SOCIAL SERVICES....................................... 8,625,207.72
HEALTH AND LONG-TERM CARE............................................... 6,636,494.78
ATTORNEY GENERAL................................................................. 5,679,366.96
TRANSPORTATION...................................................................... 1,287,084.49
AGRICULTURE AND FOOD/RURAL AFFAIRS............................ 520,878.85
CHILDREN AND YOUTH SERVICES........................................... 306,253.22
NATURAL RESOURCES.............................................................. 168,267.42
EDUCATION.................................................................................. 35,744.34
GOVERNMENT SERVICES.......................................................... 23,938.80
NORTHERN DEVELOPMENT AND MINES.................................. 17,013.92
COMMUNITY SAFETY AND CORRECTIONAL SERVICES......... 14,474.55
ENVIRONMENT............................................................................ 2,747.68
LABOUR........................................................................................ 1,135.73
Total............................................................................... 390,092,739.28$
(Under the Financial Administration Act )
LOSSES DELETED FROM THE ACCOUNTS
for the year ended March 31, 2014
PUBLIC ACCOUNTS, 2013-2014 3-171

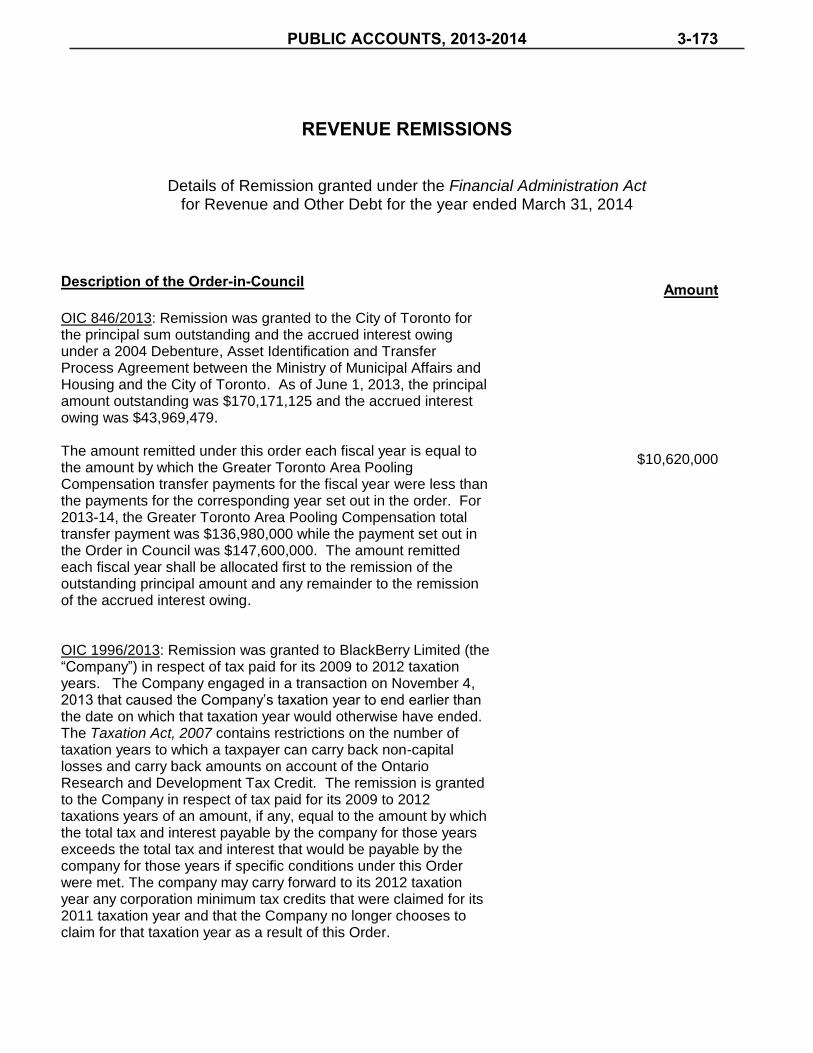
REVENUE REMISSIONS
Details of Remission granted under the Financial Administration Act for Revenue and Other Debt for the year ended March 31, 2014
Description of the Order-in-Council
Amount
OIC 846/2013: Remission was granted to the City of Toronto for the principal sum outstanding and the accrued interest owing under a 2004 Debenture, Asset Identification and Transfer Process Agreement between the Ministry of Municipal Affairs and Housing and the City of Toronto. As of June 1, 2013, the principal amount outstanding was $170,171,125 and the accrued interest owing was $43,969,479. The amount remitted under this order each fiscal year is equal to the amount by which the Greater Toronto Area Pooling Compensation transfer payments for the fiscal year were less than the payments for the corresponding year set out in the order. For 2013-14, the Greater Toronto Area Pooling Compensation total transfer payment was $136,980,000 while the payment set out in the Order in Council was $147,600,000. The amount remitted each fiscal year shall be allocated first to the remission of the outstanding principal amount and any remainder to the remission of the accrued interest owing.
$10,620,000
OIC 1996/2013: Remission was granted to BlackBerry Limited (the “Company”) in respect of tax paid for its 2009 to 2012 taxation years. The Company engaged in a transaction on November 4, 2013 that caused the Company’s taxation year to end earlier than the date on which that taxation year would otherwise have ended. The Taxation Act, 2007 contains restrictions on the number of taxation years to which a taxpayer can carry back non-capital losses and carry back amounts on account of the Ontario Research and Development Tax Credit. The remission is granted to the Company in respect of tax paid for its 2009 to 2012 taxations years of an amount, if any, equal to the amount by which the total tax and interest payable by the company for those years exceeds the total tax and interest that would be payable by the company for those years if specific conditions under this Order were met. The company may carry forward to its 2012 taxation year any corporation minimum tax credits that were claimed for its 2011 taxation year and that the Company no longer chooses to claim for that taxation year as a result of this Order.
PUBLIC ACCOUNTS, 2013-2014 3-173
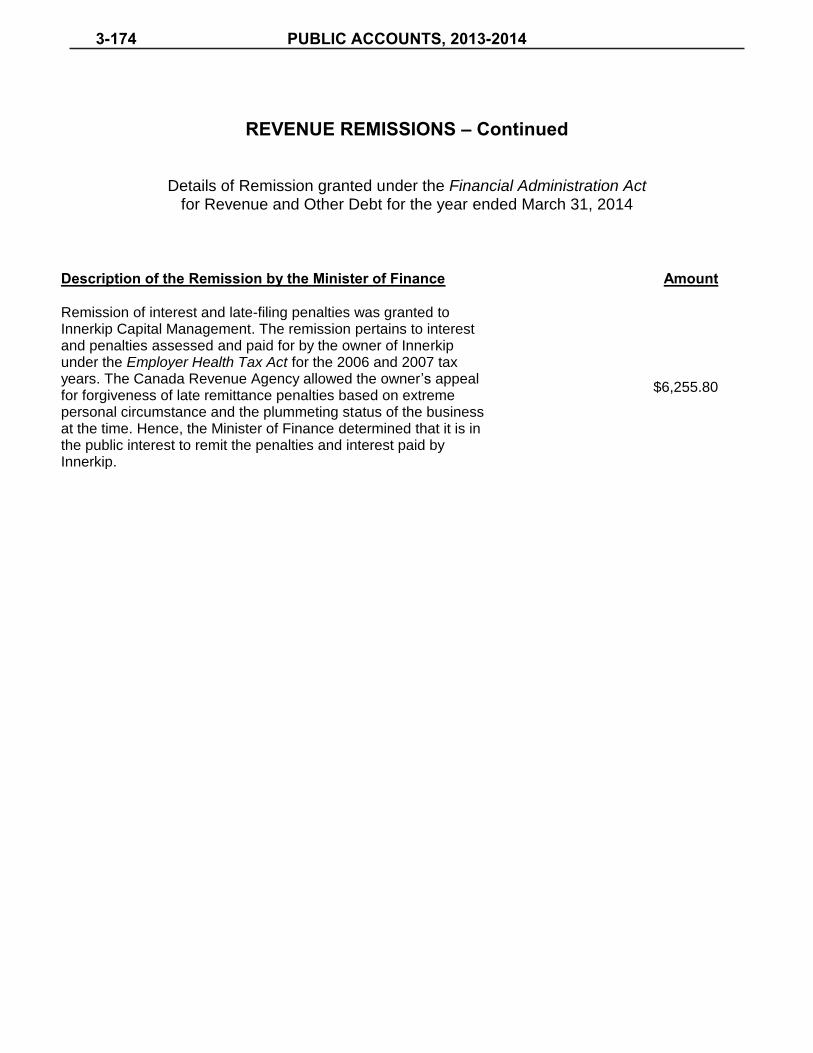
REVENUE REMISSIONS – Continued
Details of Remission granted under the Financial Administration Act for Revenue and Other Debt for the year ended March 31, 2014
Description of the Remission by the Minister of Finance
Amount
Remission of interest and late-filing penalties was granted to Innerkip Capital Management. The remission pertains to interest and penalties assessed and paid for by the owner of Innerkip under the Employer Health Tax Act for the 2006 and 2007 tax years. The Canada Revenue Agency allowed the owner’s appeal for forgiveness of late remittance penalties based on extreme personal circumstance and the plummeting status of the business at the time. Hence, the Minister of Finance determined that it is in the public interest to remit the penalties and interest paid by Innerkip.
$6,255.80
PUBLIC ACCOUNTS, 2013-20143-174

This publication is available in English and French. CD-ROM copies in either language may be obtained from:
ServiceOntario PublicationsTelephone: (416) 326-5300Toll-free: 1-800-668-9938
TTY Toll-free: 1-800-268-7095Website: www.serviceontario.ca/publications
For electronic access, visit the Ministry of Finance website at www.fin.gov.on.ca
Le présent document est publié en français et en anglais.On peut en obtenir une version sur CD-ROM dans l’une ou l’autre langue auprès de :
Publications ServiceOntarioTéléphone : 416 326-5300Sans frais : 1 800 668-9938
Téléimprimeur (ATS) sans frais : 1 800 268-7095Site Web : www.serviceontario.ca/publications
Pour en obtenir une version électronique, il suffit de consulter le site Web du ministère des Finances à www.fin.gov.on.ca
© Queen’s Printer for Ontario, 2014ISSN 0381-2375 (Print)
ISSN 1913-5556 (Online) Volume 2c
P U B L I CA C C O U N T S
of
O N T A R I O
2013–2014
Ministry of Finance
F INANCIAL S TATEMENTS OF
G OVERNMENT B USINESS E NTERPRISES ,
T RUSTS AND M ISCELLANEOUS
S TATEMENTS
20
13
–2
01
4O
NT
AR
IO
2 c
Pu
blic A
ccou
nts o
f