2013 u.s. healthcare efficiency index index reporting standards and data submission guide ... such...
TRANSCRIPT

2013 U.S. Healthcare Efficiency Index Electronic Administrative Transaction Adoption and Savings
Revised May 5, 2014
2 2013 Index
TABLE OF CONTENTS
2013 U.S. Healthcare Efficiency Index
Executive Summary ....................................................................................................................................... 3
Forward ......................................................................................................................................................... 5
2013 Index: Adoption Rates and Cost Savings ............................................................................................... 7
Overall Industry Results ................................................................................................................... 8
Specific Findings and Observations ............................................................................................... 13
Claim Submission ......................................................................................................... 14
Eligibility and Benefit Verification ................................................................................... 15
Prior Authorization and Referral Certification ................................................................. 16
Claim Status Inquiries ................................................................................................... 17
Claim Payment ............................................................................................................. 18
Claim Remittance Advice .............................................................................................. 19
Questions for Future Study ........................................................................................................................... 20
Call to Action ................................................................................................................................................. 22
2013 Index Reporting Standards and Data Submission Guide ..................................................................... 24
Guidelines for Data Collection and Reporting ................................................................................. 29
Appendix A. 2014 Index Advisory Council .................................................................................................... 32
Appendix B. Glossary of Terms Used in This and Prior Index Documents ................................................... 33
Appendix C. Index Data Submission Information Forms and Data Collection Tool Templates ..................... 35
Appendix D. Guiding Principles to Measurement and Reporting .................................................................. 39
Appendix E. HIPAA and Patient Protection and Affordable Care Act Definitions and Standards .................. 41
Appendix F. Data Submission Acknowledgment .......................................................................................... 42
©2014 CAQH. All rights reserved.
3 2013 Index
EXECUTIVE SUMMARY
Administrative costs are part of doing business. But in healthcare, there is a general consensus that the
costs of basic business transactions – such as claims and billing, and benefit verification and authorizations
– remain too high. While some administrative costs are inescapable, many routine processes can be
automated, saving time and money for healthcare providers1 and insurers. Over the last two decades,
healthcare industry-led initiatives, combined with legislation and regulatory mandates, have provided a new
framework for improving the efficiency of these processes.
Healthcare providers and health insurance plans are using increasingly
sophisticated information technology infrastructures to streamline and simplify
the routine exchange of healthcare administrative data. Today, individual
providers, facilities, payers, and related business partners conduct more
administrative transactions electronically than ever before, streamlining
workflows for greater productivity, improving data accuracy, and reducing
administrative costs.
For this report, CAQH collected an extensive quantitative dataset on major administrative transactions
through its initiative, the U.S. Healthcare Efficiency Index® (Index). Health plans representing over 100
million covered lives contributed to the effort. The dataset includes information from over 1 billion claims and
3 billion transactions. In cooperation with Milliman, Inc., we also surveyed healthcare providers and health
plans on the costs of manual and automated transactions, based on publicly available information and
proprietary Milliman cost data.
We conclude that the healthcare industry could save billions by continuing the shift from manual to electronic
transactions for the six processes studied. We estimate that most of the potential savings from continued
automation of routine processes would accrue to healthcare providers and facilities.
Highlights from the 2013 analysis:
1. Electronic claim submission had the highest rate of adoption (91 percent) in our study. To get
closer to 100 percent may require proactive solutions to encourage electronic submissions from
small provider offices.
2. Among the transactions studied, electronic eligibility and benefit verification presents the
greatest opportunity to eliminate costs permanently and could save health plans and healthcare
providers $3 each per transaction.
3. Provider organizations have an opportunity to realize significant administrative cost savings though
the migration from manual to electronic transactions for prior authorization and referral
certification, a potential savings of $13 per transaction for this particularly labor-intensive process.
4. Claim status inquiries showed increased use of automation in our study, but the number of
telephone calls related to these transactions is static or falling only slightly. The duplicative manual
paper- and phone-based legacy processes must be eliminated to realize efficiency.
1 In this report, we often use the shorthand terms "healthcare providers" or "providers" to include hospitals
and other healthcare facilities as well as clinical outpatient centers and physicians' offices.
The healthcare industry
could save billions by
continuing the shift from
manual to electronic
transactions.
4 2013 Index
5. In our study, over 40 percent of claim payments continued to be made by paper checks.
Healthcare providers have been relatively slow to adopt electronic funds transfer (EFT), but use is
expected to grow rapidly.
6. Electronic claim remittance advice and posting and receiving of payments showed the lowest
level of adoption in our study (53 percent), with more than 10 percent being transmitted both
electronically and via paper. This is a high-value opportunity to eliminate redundancies.
Overall, the healthcare industry is making progress toward realizing significant savings by replacing manual
administrative processes with electronic processes. We estimate that moving to electronic processes for
these six transactions alone has already saved the healthcare industry tens of billions of dollars, compared
to manual or paper-based processes.
But our analysis suggests there is still more to do:
1. The use of electronic processes among health plans varies widely. For example, in our study of
health plan transactions we noted that use of automated transactions for claim remittance advice
ranged from a high of 74 percent to a low of 14 percent. (The aggregated average was 53 percent.)
The range of automation for electronic claim submission was 73 to 96 percent (aggregated average
was 91 percent), and the range for electronic claim payment was 36 to 61 percent (aggregated
average was 56 percent).
2. The full value of some electronic transactions cannot be realized until redundant manual paper-
and phone-based legacy processes are eliminated.
3. The six transactions studied in this report are only some of the processes that could be automated,
with others possibly generating billions of dollars in additional savings.
We invite health plans, healthcare providers, and facilities to contribute data to future analyses, and, in turn,
receive critical information about how your organization compares with our benchmark averages.
A Role for All Stakeholders
A sustained effort by providers, hospitals, payers, related business partners, employers, government
agencies, and consumers is essential to propel the transition to electronic administrative transactions
successfully forward. We encourage healthcare industry stakeholders to support the adoption of electronic
administrative transactions, recognize the importance of benchmarking, and actively participate in this
initiative by contributing data.
Over time, the value and return on investment for all stakeholders will accelerate as interactions between
providers and health plans, as well as intermediaries such as clearinghouses, become less costly and more
uniform, predictable, timely, accurate, and secure.
Participation in the Index is open to organizations that are able to extract and report data according to the
Index Reporting Standards and Data Submission Guide. The Index process allows for participating
organizations to receive company-specific reports and briefings on how your organization's results compare
to national benchmarks. All data submitted in the Index process is confidential, and is reported only in an
aggregated or de-identified format.
5 2013 Index
FORWARD
The 2013 Index is the inaugural report by CAQH since ownership of the Index was transferred from
Emdeon, Inc. The Index raises awareness about improvements in business efficiency of the healthcare
delivery system. It provides a national reference point to monitor, track, and measure the adoption of
administrative electronic transactions, including claims and payment, and, in the future, other administrative
processes, such as coordination of benefits.
We believe that for the Index to be truly meaningful and actionable for stakeholders, it must be based on
wide-ranging data and that the measures used must be both reliable and accepted across the industry. The
Index draws on consensus-based measures that track industry progress to permanently eliminate wasteful
administrative spending and improve efficiency by using automated electronic technology. We worked with
the U.S. Healthcare Efficiency Index Advisory Council, an independent, multi-stakeholder group
representing a broad view of the healthcare industry, to develop the data collection and reporting
methodology.
CAQH also engaged the consulting firm, Milliman, Inc., to conduct a study focused on quantifying the
administrative costs incurred by healthcare providers, facilities, and health insurance plans when conducting
common administrative transactions. In preparing this report, CAQH and the Advisory Council relied on
information collected and prepared by Milliman. CAQH is solely responsible for the contents of this report
and any conclusions made herein.
The 2013 methodology was redesigned to capture the most objective, accurate, and valuable snapshot
possible of progress by the healthcare industry to adopt electronic administrative transactions and the
concurrent reduction in manual and phone-based processes. While these changes preclude comparisons
with the findings contained in previous reports, they were essential to enable enhanced benchmarking and
tracking moving forward.
The 2013 Index report provides insights on six key administrative transactions2:
Claim Submission
Eligibility and Benefit Verification
Prior Authorization and Referral Certification
Claim Status Inquiries
Claim Payment
Claim Remittance Advice and Receiving and Posting Payments
2 In this report, we use shorthand terms for some transaction types. For example, “eligibility and benefit verification” may be referred to as “eligibility verification,” “prior authorization and referral certification” may be referred to as “prior authorization,” “claim status inquiries” may be referred to as “claim status,” and “claim remittance advice and posting and receiving of payments” may be referred to as “remittance advice.”

6 2013 Index
For purposes of this report, the scope of each transaction studied was focused narrowly on the sending and
receiving of transactions and did not take into account the effort required to prepare information for a given
transaction or to work with the results of a transaction response. For example, we did not attempt to study
the costs of physicians' or nurses' work time to prepare information for the transactions; only the direct costs
of the transactions themselves were counted.
In addition, only pure electronic transactions were considered “electronic,” and those that were defined as
partially electronic (e.g., fax) were classified as manual. Further, it should be noted that some transactions,
such as telephonic self-service, can be manual for a healthcare provider, but electronic for a health plan. In
such cases, we considered the transaction to be automated for plans, but not for providers.
Moving forward, we intend to augment annual Index data collection by broadening the measures considered
and expanding the scope to include more payers in the analysis. We will also continue to refine current
measures of progress, examine how to measure progress from the perspectives of additional stakeholders,
increase the involvement of providers and clearinghouses in the data collection process, and provide
thought leadership via reports and analyses.
We believe that building out and consistently measuring and reporting on progress is essential to driving the
move to electronically based processes, as these efforts provide important information for stakeholders.
Early adopters of electronic transactions know from firsthand experience that cost savings and operational
efficiencies are meaningful and real. By sharing information and working together, including engaging
business partners to identify ways to eliminate barriers and encourage adoption of electronic transactions,
the value and return on investment accelerates for all market participants.
The main focus of the Index Advisory Council in 2013 was on the standardization of metrics for the
extensive transactions data gathered from contributing health plans. This standardization helps to ensure
that all responding plans interpret the data submission specifications identically and provides an essential
baseline for measuring progress in subsequent years. A condensed version of the 2013 Index Reporting
Standards and Data Submission Guide follows this report.
CAQH hopes to foster an industry dialogue about the transition from manual to electronic administrative
transactions and raise awareness of the remaining savings opportunity. We encourage and welcome
industry input about the findings and methodology used to report progress.

7 2013 Index
2013 INDEX: ADOPTION RATES AND COST SAVINGS
The primary source of data for the 2013 Index is an extensive dataset collected from health plans voluntarily
contributing information based on the 2013 Index Reporting Standards and Data Submission Guide.
Together, these health plans cover 104 million individuals and account for 1.3 billion healthcare claims and
more than 3.3 billion claim-related transactions each year.
Data contributors are primarily large, multi-state commercial plans and large, single-state plans. Their
responses represent all or most of their lines of business, including commercial, Medicare Advantage,
Medicaid HMO, and risk plan claims and transactions. In addition, one smaller regional plan contributed
data. The data reflected in the 2013 Index are for the full calendar year 2012. We estimate that data
contributed account for approximately 40 percent of the covered U.S. population.
For the 2013 Index, CAQH and Milliman also conducted surveys of health plans and healthcare providers
and facilities on costs of manual and automated transaction processes. Health plans responding to the
questions on transaction costs were mainly large commercial multi-state plans and large single-state plans,
again representing large numbers of enrollees. Healthcare providers ranged from large facilities to small
physician groups.
In addition to the data submission and surveys, we interviewed health plan and provider respondents to
validate data, gain insights about the way it was gathered, and to get their outlook and perspectives. Finally,
Milliman conducted an analysis of the volume of prior authorizations based on its proprietary healthcare
management benchmarking data.
The key findings of the 2013 Index are divided into two primary categories: Industry progress overall and
specific findings on participant progress by the six types of transactions studied.
Transactions Studied for the 2013 Index
Name HIPAA ASC X12 Identifier
Description
Claim Submission 837 Submitting claims to a health insurer.
Eligibility Verification 270/271 Sending and receiving information about member eligibility and benefits.
Prior Authorization 278 Sending and receiving information about patient referrals and prior authorizations for care.
Claim Status 276/277 Sending and receiving information about the processing status of a claim.
Claim Payment 835 Sending and receiving payment for a claim.
Remittance Advice 835
Sending and receiving notice of and reasons for payment, adjustment, denial and/or uncovered charges of a medical claim. The Remittance Advice may accompany payment and is sometimes referred to as an explanation of payment (EOP).

8 2013 Index
Overall Industry Results
Our projections for the U.S. healthcare sector are based on a simple extrapolation of the industry-wide level
of adoption of electronic administrative transactions instead of paper-based processes. The projections are
intended to show the nationwide impact of full industry use of electronic transactions, including all
commercial insurance transactions and transactions performed by commercial health plans supplying
Medicare and Medicaid coverage (for example, Medicare Advantage and Medicaid HMO plans).
Here are several highlights of our analysis:
1. Nationwide, we estimate that health plans have the potential to save approximately $460 million
annually from increased use of electronic eligibility verification transactions; $410 million from
electronic prior authorization processes; $280 million from continued automation of claim status
inquiries; and $280 million (combined) from additional use of electronic claim submission, claim
payment, and remittance advice/payment posting transactions.
2. We project that healthcare providers and facilities could save more than $3.5 billion from electronic
eligibility verification processes and approximately $1.5 billion via electronic prior authorization
transactions. For healthcare providers, the combined potential savings from electronic claim
submission, claim payment, claim inquiry, and remittance advice processes totals an additional
$1.7 billion.
3. Eligibility verification transactions offer the greatest opportunity to reduce cost on a per-transaction
basis for the industry as a whole. The cost for each eligibility verification could be reduced from
$6.83 (manual transaction cost) to $0.22 (electronic transaction cost), for a total estimated savings
of $4 billion annually for health plans and providers combined.
4. The estimated costs of manual prior authorization processes were the highest among the six
transactions studied, ranging from $3.95 per transaction for health plans to $18.53 per transaction
for healthcare providers.
5. Duplicative or redundant manual processes are still used in conjunction with some electronic
processes, particularly for eligibility verification, claim status, and remittance advice processes.
Unless eliminated, this redundancy would offset a portion of the estimated cost savings that are
possible.
Projecting Numbers of Transactions. To illustrate the potential impact of additional conversion from
manual to electronic processes, we projected a nationwide baseline for the aggregate number of the six
transactions studied. Table 1 shows tabulated counts of five transactions, based on the data responses
representing 104 million enrollees, for the full year 2012 processes: claim submission, eligibility verification,
claim status, claim payment, and remittance advice. Milliman independently analyzed transaction counts for
prior authorization. The counts do not include retail pharmacy transactions.
Since respondents’ data included transactions for public plan enrollees where possible and applicable
(Medicare Advantage, Medicaid managed care/risk), we projected to U.S. total private enrollment plus the
total managed care/commercially covered population in Medicare, Medicaid, and other public programs –
approximately 240 million covered lives.3
3
Our estimate of total enrollment is based on the AIS Directory of Health Plans.

9 2013 Index
For example, based on data from the 1.3 billion claims submitted to health plans representing 104 million
enrollees, we project that more than 3 billion claims were submitted to commercial health plans nationwide
for payment in 2012. Likewise, we estimate that there were approximately 130 million requests for prior
authorization or referral certification.
Of course, health plans and providers perform these transactions using different modalities, or combinations
of modalities. It can be difficult to categorize these processes as being either fully electronic or fully manual
since electronic modalities may have a manual component and vice versa. For example, there are several
ways that a provider may conduct an eligibility verification transaction:
1. A staff member may call the payer and speak with a call center agent.
2. A staff member may call the payer and interact with an automated touch-tone or voice recognition
system.
3. A staff member may log into a payer’s eligibility portal and enter information.
4. A practice management system may transmit an electronic eligibility request directly to a payer or
through a clearinghouse.
Similarly, the information received by the provider may come in multiple forms, including voice, fax, web
response, or electronic transaction.
Thus, it is possible for some transactions to be “manual” for one party and “electronic” for the other. For
example, if a provider’s office staff phones a request to the health plan, and the call is handled by the health
plan's interactive voice response (IVR) system, that transaction would be classified as “manual” for the
provider and “electronic” for the health plan.
Table 1. Numbers of Transactions in 2012, by Manual vs. Electronic
2013 Index Data Submission (Millions)
Payer Provider
Manual Electronic Manual Electronic
Claim Submission 119 1,178 119 1,178
Eligibility and Benefit Verification 62 1,259 445 876
Claim Status Inquiries 32 258 128 161
Claim Payment 101 113 101 113
Remittance Advice 71 78 87 62
Nationwide Projection (Billions)
Claim Submission 0.3 2.8 0.3 2.8
Eligibility Verification 0.1 3.0 1.0 2.1
Prior Authorization 0.1 * 0.1 *
Claim Status 0.1 0.6 0.3 0.4
Claim Payment 0.2 0.3 0.2 0.3
Remittance Advice 0.2 0.2 0.2 0.2
Sources: CAQH, Index; Prior Authorization projections by Milliman, Inc.
Note: Transaction counts do not include separate retail pharmacy benefits.
*Less than 50,000,000

10 2013 Index
For simplicity, we focused on the ends of the spectrum, considering the “primarily manual” or “primarily
electronic” forms as the modalities quantified. Likewise, the study focused on the actual resources required
to submit a transaction and receive the result, without regard for the resources required to prepare
information for the transaction or resolve issues with a transaction. Of course, the costs of physician, nurse,
and health plan staff time to prepare for inquiries and responses are likely substantial.
Costs Per Transaction. The second step in calculating potential cost savings is estimating costs per
transaction, both for healthcare providers and for health plans. For these calculations, we relied mainly on
surveys and an analysis performed by Milliman, Inc.
Table 2 shows the estimated cost of each transaction, by type, to health plans, providers, and the industry
overall, as well as the estimated per-transaction savings opportunity by transaction by type.
Table 2. Estimated Per-Transaction Costs and Savings Opportunity by Transaction Type
Claim Submission
Estimated Health Plan Cost
Estimated Provider-Facility
Cost
Estimated Total Industry Cost
Potential Savings Opportunity
Manual $0.74 $1.84 $2.58 $2.03
Electronic $0.26 $0.28 $0.54
Eligibility and Benefit Verification
Manual $3.28 $3.55 $6.83 $6.61
Electronic $0.06 $0.16 $0.22
Prior Authorization
Manual $3.95 $18.53 $22.48 $17.10
Electronic $0.18 $5.20 $5.38
Claim Status Inquiries
Manual $3.84 $2.25 $6.09 $5.81
Electronic $0.06 $0.23 $0.29
Claim Payment
Manual $0.66 $1.83 $2.49 $1.98
Electronic $0.21 $0.30 $0.51
Remittance Advice
Manual $0.45 $1.83 $2.28 $1.77
Electronic $0.21 $0.30 $0.51
Sources: CAQH, Index; Milliman Inc.

11 2013 Index
To capture transaction costs, Milliman conducted interviews with healthcare provider organizations and
facilities representing a range of sizes, provider types, and regions of the country, and with large health
plans. Using the information submitted by each organization, Milliman prepared an estimate of the number
of minutes required to perform each transaction by type and modality for each organization participating in
the study, and estimated the fully loaded per-minute cost for each transaction. Salary information associated
with staff positions relevant to each transaction were derived from the Medical Group Management
Association (MGMA) 2012 Physician Compensation and Production Survey (PCPS).
Milliman added benefits and overhead costs using factors developed from the PCPS and assumed that
organizations using electronic transactions would incur overhead costs similar to those using electronic
medical records and that organizations using manual transactions would incur overhead costs similar to
those using paper-based records.
Table 3 illustrates the potential industry-wide savings opportunity from full adoption of automated process for
these six transactions. In the table, “savings opportunity” represents the gap between current levels of
electronic administrative transaction adoption and full adoption. By our estimates, eligibility and benefit
verification and prior authorization yield the largest potential savings among these processes.
These estimates provide a benchmark for measuring progress forward in time. The 2013 Index process
involved careful specification of the data submission requirements so that health plans could report identical
measures from their varied internal tracking systems.
However, the nationwide savings estimates are subject to a degree of uncertainty in several areas. First, the
transaction cost survey reflected costs in very large health plans. Therefore, Milliman applied adjustments
for large, medium, and small plans to better reflect the cost experience of smaller plans, which have fewer
opportunities for returns to scale from major automation investments.
Table 3. Projected Industry Savings Opportunity
(Millions of Dollars)
Health Plan Savings
Opportunity
Provider- Facility Savings
Opportunity
Industry Savings Opportunity
Claim Submission $130 $430 $570
Eligibility and Benefit Verification $460 $3,530 $4,000
Prior Authorization $410 $1,470 $1,880
Claim Status Inquiries $280 $610 $890
Claim Payment $110 $360 $470
Remittance Advice $40 $350 $400
Source: CAQH, Index. Note: Components may not sum to totals due to rounding.

12 2013 Index
While the transaction cost data from health plans was fairly similar from health plan to health plan, the range
of responses from healthcare providers and facilities was quite broad. Since the number of responding
providers and facilities was small, we believe that the 2013 transaction cost estimates for the provider-facility
side are subject to a higher degree of uncertainty. A key focus of the Index process for 2014 will be to
expand the number of provider and facility respondents to enrich and verify the provider transaction cost
data and obtain additional insights about trends in both transaction numbers and costs.
Finally, we believe that many of the responding health plans reflect first movers and industry leaders in the
shift from manual to electronic administrative processes. Because they are mostly large plans, these
companies could benefit from economies of scale in their investments in automation. Therefore, it is possible
that our results and estimates lean closer toward industry best practices in some cases, rather than industry
averages or median performance.

13 2013 Index
Specific Findings and Observations
The findings and insights on the six particular transactions studied stem from a combination of the data
collected, survey results, qualitative discussions with respondents, and analysis by Milliman and CAQH.
Here are some highlights:
1. The vast majority (91%) of the claims submissions analyzed were submitted electronically; this is
the highest level of electronic adoption of any of the measures.
2. Roughly half (56%) of the participating payers are using electronic claim payment, a relatively new
electronic transaction option.
3. Electronic claim remittance advice shows the lowest level of adoption at 53 percent. However, the
effective adoption rate is likely even lower because more than 10 percent of electronically delivered
claim remittance advice documents are also requested and delivered by another method.
Eliminating this duplication would yield additional savings.
4. Virtually all of the electronic claim payment transactions in 2012 used the Automated Clearing
House Network (ACH), a financial services industry standard, to facilitate electronic funds transfers.
5. Adoption rates for electronic eligibility and benefit verification and claim status transactions are
somewhat uncertain due to a low response rate and the preliminary nature of some health plans’
tracking capabilities. The 2014 Index is expected to have more complete information as additional
health plans track these transactions and tracking metrics stabilize.
Following is a more detailed analysis used to assess progress on key transactions. The electronic
transactions examined for this report predominantly used the HIPAA ASC X12 standards, followed by portal
transactions and other electronic systems, such as interactive voice response.
The Affordable Care Act (ACA) mandated new operating rules for claim status and eligibility and benefit
verification transactions, which became effective January 1, 2013. Since the data for the 2013 Index report
are from calendar year 2012, they predate the implementation of the new rules. Therefore, future Index
reports will help identify the impact of the changes.

14 2013 Index
Claim Submission
Overall, 91 percent of claim submission transactions analyzed were conducted electronically in 2012. Each
remaining paper-based claim submission costs the healthcare system $2.58; $1.84 to providers and $0.74
to payers. By contrast, electronic claims cost the healthcare system $0.54 each; divided nearly equally at
$0.28 for providers and $0.26 for health plans.
Some participating health plans were unable to distinguish between claim submissions for payment and
transmissions of encounter information made only for the purpose of reporting care delivery (for example, for
Medicare Advantage or Medicaid managed care plans paid on a capitated basis). All claim submissions
made in a standard format were included in our counts. The measure does not account for claims that were
later adjusted or identified as duplicate claims in the adjudication process.
In aggregate, the source of claims had little effect on the use of electronic transactions. The proportion of
electronic to manual claims from providers is nearly equal to that of those coming from facilities.
Participating health plans reported nearly 12.5 claim submissions per member, with the vast majority, not
surprisingly, coming from providers.
Health plans reporting the highest percentages of electronic claim submission transactions indicated in
interviews that these achievements were the result of thoughtful and deliberate organizational efforts to drive
electronic adoption.
Health plans have successfully partnered with facilities and large provider organizations to boost the
percentage of claims submitted electronically. One health plan, for example, worked proactively with
vendors and institutions to remove barriers to
submitting claims electronically and, after a year-
long outreach effort, mandated the use of
electronic claim submission by facilities.
Closing the remaining gaps may require a
different approach. Small provider offices account
for the majority of remaining manual claims, and
they face an entirely different set of barriers to
submitting claims electronically. Therefore, health
plans may need alternative – and innovative –
solutions. For example, one health plan built a
free web tool for small provider practices that
allows providers to submit claims electronically.
The health plan also examined and adjusted
some of its exclusions and documentation
requirements to facilitate electronic claims
submissions by this group.
Claim Submissions, Number By Transaction Type
Manual by Provider 107,519,687
Manual by Facility 11,574,661
Electronic via HIPAA
837M 1,048,442,318
Electronic via HIPAA
837I 130,051,194
Total Submissions 1,297,587,860
Percent of all Claim Submissions Conducted
Electronically
Aggregate 91%
High 96%
Low 73%

15 2013 Index
Eligibility and Benefit Verification
Use of electronic eligibility and benefit verification transactions is strong and growing, but many of these
electronic transactions are duplicated with telephonic follow-up, according to participant interviews.
Consequently, the effectiveness of electronic transactions is undermined by a continued reliance on
redundant manual operations.
Complex coverage designs, such as multiple tiers, are one of the primary reasons for the number of
telephone calls. Frequently, the complexity of the plan design exceeds the capacity of the HIPAA ASC X12
standard. As a result, information retrieved electronically may be insufficient to confirm benefits. Second,
these benefit designs can be a source of confusion for providers and patients, elevating the need for such
verifications by telephone. These challenges can erode trust between stakeholders and slow progress
toward eliminating manual transactions.
Some participants indicated that tracking the number of eligibility and benefit verification telephone calls is a
more meaningful metric than measuring the number of electronic eligibility and benefit verification
transactions. The participating health plans reported fielding more than 60 million telephone calls to verify
eligibility and benefits in 2012. At a per-call cost of $6.83, including $3.55 to providers and $3.28 to health
plans, we estimate that non-automated eligibility and benefit verification calls contributed approximately $4
billion in cost to the healthcare system.
Data on eligibility and benefit verification can be complex and difficult to standardize across plans.
Traditional, non-electronic processes for both eligibility and benefit verification and claim status inquiries
generally take the form of telephone conversations between providers and health plan representatives.
Multiple questions are often resolved in a single
phone call, making records about the primary
purpose of calls highly subjective. For instance,
representatives may respond to inquiries about
multiple patients or multiple diagnosis codes and
services for a single patient during a single call.
Further, some participating health plans were
unable to track eligibility and benefit verification
and claim status inquiry transactions as unique
events, making it impossible to ensure the data
are free of double-counting.
Eligibility and Benefit Verification, Number by
Transaction Type
Telephone 60,402,909
Fax 1,157,012
Interactive Voice Response 33,536,481
Portal 349,679,840
HIPAA 270 875,689,400
Total Verifications 1,320,465,642

16 2013 Index
Prior Authorization and Referral Certification
For the 2013 Index, Milliman crafted a preliminary estimate of prior authorization transactions based on
Milliman benchmarks for inquiries per member-year and overall estimates of enrollment. Although the exact
benchmarks are proprietary for each type of payer, Milliman estimates that fewer than one annual prior
authorization event occurs per member per year, with a relatively higher rate for Medicare Advantage
enrollees than for commercial and Medicaid members. Milliman estimates that approximately six out of
every seven prior authorization events are handled via manual transactions. Milliman studied prior
authorization transactions for medical and surgical benefits, and did not include prior authorizations related
to retail pharmacy transactions.
Costs of prior authorization and referral certification transactions were estimated by Milliman as part of their
surveys of health plans and providers. Average estimated costs per transaction were $0.18 for automated
and $3.95 for manual transactions for health plans, and $5.20 for automated and $18.53 for manual
transaction for providers.
In total, Milliman estimates that there were nearly 130 million prior authorization and referral certification
transactions in 2013, and that almost 110 million of them were handled manually, via phone, fax, or paper-
based communication. Even though there may be far fewer prior authorization transactions than other types
of business transactions, such as claims submission or eligibility verification, the high estimated transaction
costs of prior authorization imply that health plans could save an additional $0.4 billion from automation, and
providers could save approximately $1.5 billion.
The Index intends to build on Milliman's preliminary estimates by rolling prior authorization and referral
certification into the 2014 Index data submission for health plans.

17 2013 Index
Claim Status Inquiries
Electronic claim status inquiries represent another significant opportunity for the industry to streamline
routine operations and reduce cost.
More than one in 4.5 claims generated an inquiry in 2012. While the vast majority of those were electronic
inquiries, the participating health plans nevertheless fielded more than 28 million telephone inquiries
regarding claim status. At a cost of $6.09 per transaction, including $2.25 to providers and $3.84 to health
plans, we estimate that manual claim status inquiries contributed approximately $0.9 billion in unnecessary
administrative costs to the healthcare industry.
Participants also indicated that streamlining this specific transaction is a relatively new focus, and growing
awareness is expected to increase use of electronic systems. However, the transition from manual or
telephonic transactions to electronic is expected to follow a pattern similar to that of eligibility and benefit
verification transactions. That is, the number of electronic transactions may climb as the number of
telephonic transactions remains static.
Vendor service-level agreements may mandate
automated inquiries until the claim is completed,
driving the number of transactions up overall. As
electronic systems mature and are able to deliver
more complete and consistent information, health
plans hope to further encourage use of electronic
channels. At least one participating health plan has
contemplated a system to facilitate cost-effective
escalation of claim status inquiries, which would ask
providers to use the HIPAA ASC X12 transaction
first and, as necessary, inquire by portal and, finally,
by telephone.
Claim Status, Number by Transaction Type
Telephone 28,279,064
Fax 3,351,753
Interactive Voice Recognition (IVR) 19,720,235
Portal 77,061,410
HIPAA 276 161,368,175
Total Inquiries 289,780,637

18 2013 Index
Claim Payment
Forty-four percent (44%) of all claim payments by participating health plans continued to be made by paper
check in 2012 at a cost of $0.66 each, representing another opportunity to reduce cost by streamlining
payment to providers. Our counts of claim payments do not include payments made by patients, such as
through a Health Savings Account (HSA), but do include adjudicated claims resulting in $0 payments, and
may include claims with dates of service in the prior year.
Participants believe that the expanded availability
of electronic funds transfer (EFT) will foster
increased and rapid adoption of electronic claims
payment. Health plans and related entities are
actively campaigning to enroll providers in EFT,
focusing initially on providers responsible for
generating the highest number of claims, such as
facilities and large provider groups, to most quickly
increase the percentage of claims being paid
electronically. In addition, health plans are working
to reduce the per-transaction cost by settling more
claims in each payment.
The newly mandated EFT standard, ACH CCD+, is
also making EFT an attractive option for providers.
Its 80-character addendum capability allows health
plans to convey more information about payments,
which can ease the re-association burden in the
provider office.
Claim Payment, Number by Transaction Type
Printed Check or Paper-
Based Instrument 93,682,425
EFT via ACH Network 113,273,002
Non-Funded Payments
(Correspondence / Zero
Payment)
7,195,379
Total Payments 214,150,806
Percent of all Claim Payment Transactions
Conducted Electronically
Aggregate 56%
High 61%
Low 36%

19 2013 Index
Claim Remittance Advice
Claim remittance advice represents a high-value opportunity to reduce cost by eliminating redundancies and
expanding adoption of electronic transactions. Participants indicated they receive a significant number of
requests for paper claim remittance advice documentation, in addition to the electronic advice.
Approximately 11 percent of the electronic claim remittance advice transactions reported by participants –
nearly 17 million documents – were also requested on paper in 2012. At a cost of $0.45 per transaction,
these redundant paper claim remittance advice
documents represent an estimated $10 million
opportunity to reduce administrative costs for health
plans alone.
Slightly more than half, or 53 percent, of the claim
remittance advice documents processed by
participating health plans in 2012 were electronic,
and we estimate that approximately $400 million
could be saved in the healthcare industry by full
conversion to electronic statements.
Participants cited three key factors that they believe
will spur the adoption of electronic claim remittance
advice. First, the transaction is now linked to
electronic claim payment, or EFT, as an integrated
transaction in HIPAA standards. Second, ACA-
mandated operating rules are expected to boost
adoption of both transactions. Third, a number of
health plans currently have their own initiatives
aimed at specifically increasing the use of electronic
claim remittance advice.
Remittance Advice, Number by Transaction Type
Printed or Paper-Based
Remittance Advice 54,201,444
Portal Remittance Advice
or Other Electronic EOP 16,219,298
Electronic Remittance
Advice (HIPAA 835) 62,049,239
Electronic Remittance
Advice (HIPAA 835) with
Printed or Paper-Based
Remittance Advice Sent
16,544,460
Total Remittances 149,014,440
Percent of all Remittance Advice Transactions Conducted Electronically
Aggregate 53%
High 74%
Low 14%

20 2013 Index
QUESTIONS FOR FUTURE STUDY
The 2013 Index analysis suggests that billions of dollars in savings are possible from continued automation
of several routine administrative processes: claim submission, eligibility verification, prior authorization, claim
status, claim payment, and remittance advice. We estimate that the potential annual savings from further
automation of these six transactions alone could total nearly $7 billion for healthcare providers and facilities,
and more than $1 billion for health plans.
Our estimates and projections are subject to several limitations. For example, some plans were unable to
provide information segmented by major insurance type – private commercial vs. Medicare Advantage vs.
Medicaid – because the data was not collected in ways that allowed that classification. Thus, we chose to
use relatively simple methods to project nationwide impacts and the industry-wide potential for additional
savings. With more granular data, future Index reports may be able to use more precise projections of
national-level savings.
Second, we report transaction costs and savings incurred by health plans and providers only, and solely for
the transaction itself, not the time and cost associated with preparing information for the transactions. These
untracked costs could be extensive for some health plans and providers. On the other hand, the reported
savings opportunities represent the gap between current levels of electronic administrative transaction
adoption and full adoption. This latter approach overestimates the opportunity to reduce costs in cases
where achieving 100 percent adoption may not be realistic.
Another key issue is the possibility of bundled or duplicative transaction counts, notably for eligibility and
benefit verification. For example, call center representatives often respond to multiple questions in a single
phone-based inquiry (i.e., multiple patients; multiple diagnosis codes; or multiple reasons, such as eligibility,
coverage, benefits, appeals, resubmissions, or status of claim within the adjudication cycle). This
fundamental characteristic of health plan operations may cause transaction counts to be understated. Thus,
many health plans are unable to track eligibility and benefit verification transactions as unique events. On
the other hand, we believe there may be some duplicative counting because health plans may have difficulty
classifying manual transactions (primarily telephone calls) in a reliable and consistent manner by type of
transaction.
Fourth, the health plans responding to our data submission process for transaction counting, and the health
plans and providers responding to the Milliman surveys of transaction costs, may not be representative of all
health plans and providers. In particular, our analysis would be improved from a broader response from
small and medium-sized health plans, and from a larger array of healthcare providers and facilities.
Nevertheless, we believe the large scale of our data collection efforts likely reflects a reasonable
approximation of industry-wide results.

21 2013 Index
Finally, the Index does not include data from Medicare's traditional fee-for-service program and Medicaid
programs that are operated directly by the states. Operationally, these programs require many of the same
payer/provider inquiries and interactions; therefore, substantial additional savings for the industry could be
available through automation that is not reflected in our current estimates. In general, data on Medicare fee-
for-service claims are available with a lag; however, Medicaid program data can be much more difficult to
obtain. The Index Advisory Council may consider approaches to filling out the Medicare and Medicaid
sections to provide a more complete result for the entire U.S. covered population in future reports.
On balance, we have probably underestimated potential industry savings in some areas and overestimated
it in others. We believe the 2013 total national savings estimates should be taken as a benchmark for 2012
industry results, and ongoing refinements in data specification and collection will improve the precision of
our future estimates.

22 2013 Index
CALL TO ACTION
It has been almost 20 years since HIPAA established rules for the adoption of electronic transaction
standards and the use of electronic administrative transactions over manual processes. While the healthcare
industry has made significant progress in the intervening years, the transformation is far from complete.
Based on this analysis, it is estimated that the industry as a whole today could save an additional $8 billion
annually by both expanding the use of the six transactions analyzed and concurrently eliminating related and
often redundant manual transactions. The ACA will significantly magnify the savings opportunity across the
industry. To start, the number of insured individuals is expected to grow substantially over the coming
decade under the ACA, simultaneously increasing the number of administrative transactions that are
conducted daily and the amount that can be saved by conducting them electronically. In addition, the third
set of ACA-mandated operating rules that go into effect January 1, 2016, and address healthcare claims,
health plan enrollment/disenrollment, health plan premium payments, referral/certification/prior authorization,
and claim attachments, provide new avenues for moving away from manual administrative processes.
To achieve a truly efficient healthcare system, we encourage every health plan, provider, vendor, and
business partner to be part of the process:
Adopt electronic administrative transactions and reduce manual and phone-based
processes. Healthcare providers, health plans, and their business partners are already realizing
the savings potential of electronic administrative transactions. There is more work to do, and the
remaining opportunity to reduce costs and inefficiency is substantial. By supporting and
encouraging broad adoption of electronic transactions in their organizations, stakeholders can help
drive wasteful costs out of the system while adding value for business partners.
Benchmark progress. It is incumbent upon stakeholders to measure the progress of their
organization to eliminate administrative waste and reduce costs. The Index report can be used as
an industry benchmark to gauge progress against peers, as well as to estimate current and future
savings. The Index has created an online calculator that both plans and providers can use to
estimate their potential cost savings by transaction (www.caqh.org).
Become an Index participating organization. To ensure that the data on healthcare
administrative transactions best represents the industry as a whole, and to most effectively and
objectively identify and analyze trends, the Index needs data from as many organizations as
possible across the full spectrum of the healthcare delivery system: individual providers, multi-
specialty providers groups, facilities, health plans, vendors, and other related business partners. By
participating as a data contributor, organizations at every stage of adoption can help improve the
overall quality of the analysis, enabling deeper insight into the transition, advancing its ability to
demonstrate industry progress and quantify the actual cost savings and efficiency gains achieved.
Participation is open to organizations that are able to extract and report data according to the Index
Reporting Standards and Data Submission Guide. The 2013 Index Reporting Standards and Data
Submission Guide follows this Index report.

23 2013 Index
At a time when eliminating unnecessary costs from the healthcare system has become a universal
imperative, administrative simplification is an integral part of the solution.
The 2014 Index is targeted for release by CAQH in late 2014, based on data collected for all of calendar
year 2013 and surveys conducted in the spring and summer of 2014. Organizations interested in
participating in the 2014 Index may contact Jeff Lemieux, CAQH Director of Research, at

24 2013 Index
2013 REPORTING STANDARDS AND
DATA SUBMISSION GUIDE
Measure Descriptions
All measures for the 2013 data submission were based on data representing the January 1, 2012 to
December 31, 2012 calendar year.
Claim Submission
Measures and reports the percentage of all legitimate claims that are received electronically as a proportion
of the total of all legitimate claims received by the health plan.
Legitimate Claim is defined as an itemized statement of rendered services and costs from a healthcare
provider or facility received by the health plan for payment for health care. A claim can be submitted via a
manual process using paper or electronic system either directly or through intermediary billers and claims
clearinghouses.
The total number of Legitimate Claims represents the denominator for the Claim Submission calculation.
Note:
If there is no direct claim for payment given reimbursement contracts, the transaction is considered
the transmission of encounter information for the purpose of reporting health care. Encounters may
or may not be included depending on the ability to report separately by the health plan. If
encounters cannot be separated from claims, the participant should notify CAQH upon data
submission. Encounters may be reported within the appropriate data submission field.
Claims reported should be only those received for medical expense services for insured/enrollees
participating in the health plan. Only ASC X12N/005010X2I2 Health Care Claim 837 I (Institutional)
and 837 P (Professional) claims are included at this time.
Reporting of claims to CAQH should be grouped based on commercial, Medicare, Medicaid,
Medigap or other supplementary policies when available to track separately. Where available,
claims should be grouped by source of claim submission (provider or facility). Notify CAQH of data
included within data submission. Each product will be reported separately and aggregated.
Adjusted claims and duplicate claims may be received by the health plan system as a legitimate
claim and will not be rejected until after claim logic is applied. These claims should be counted in
the measure as they are received by the health plan. Processed or Adjudicated Claims would be a
step beyond received and should not be used for determining a received claim as it would narrow
the denominator of the intended measurement.
Claims per member months will be tracked as a secondary metric.
Electronic Claim is defined as an electronic data interchange (EDI) of the received claim submission
transaction. The HIPAA standard title is ASC X12N/005010X2I2 Health Care Claim 837 I and P. Only HIPAA
compliant claims should be included as an electronic claim.

25 2013 Index
Eligibility and Benefit Verification
Measures and reports the percentage of all eligibility and benefit verifications received electronically to
inquire about the eligibility, coverage, or benefits associated with a benefit plan or product as a proportion of
all eligibility and benefit verifications received by the health plan. A normalized proportion of verifications per
1,000 claims is calculated by subcategory to show relative volume.
Eligibility and Benefit Verification is defined as when a health plan receives a request to obtain any of the
following information about a benefit plan for an enrollee or member:
1. Eligibility to receive health care under the health plan.
2. Coverage of health care under the health plan.
3. Benefits associated with the benefit plan.
The total number of Eligibility and Benefit Verifications represents the denominator for the Eligibility and
Benefit Verifications calculation.
Note:
Eligibility and benefit verifications are done in a variety of ways including the following:
o Accessing enrollee or member information via a health plan’s secure Web site -
Portal/Direct Data Entry (DDE). Tracked individually for reporting.
o Telephone, Interactive Voice Response (IVR) and fax. Tracked individually for reporting.
o The ASC X12 270 Health Care Eligibility Benefit Inquiry.
These modes of verifications should be reported separately to measure trend of electronic
transaction adoption and the movement away from manual transactions and communications.
As it may be difficult to differentiate and categorize between inquiries for eligibility, coverage and
benefits, grouping of the inquiries is acceptable for reporting calculations.
Total number of legitimate claims from the Claim Submission measure is used to provide a
normalized calculation of the above sub-categories.
Electronic Eligibility and Benefit Verification is defined as an electronic data interchange (EDI) transaction
when the health plan IT system receives a request to obtain information about a benefit plan for an enrollee
electronically through direct data entry, via portal, or through batch file submission and the system responds
with the requested eligibility and benefit information using the same modality as the inquiry. The HIPAA
standard title is ASC X12 270 Health Care Eligibility Benefit Inquiry.
Subcategories will be reported between HIPAA-compliant electronic transactions and transactions that are
not HIPAA-compliant transactions. Transactions that are not HIPAA-compliant that are electronic or
automatic will be considered automated and reported separately.
Note:
ASC X12 270 is the standard for electronic eligibility and benefit verification for both providers and
health plans and is the primary metric for the measure.

26 2013 Index
From the health plan perspective, IVR, portal, and DDE may be considered electronic and reduces
the manual interactions of phone calls and faxes for health plans. Given there is value to track both
types of electronic transactions, each subcategory will be reported and tracked as secondary
metrics at this time. The automated category is used to report the non-HIPAA compliant electronic
transactions.
Claim Status Inquiries
Measures and reports the percentage of all inquiries received electronically to inquire about the status of a
healthcare claim as a proportion of all claim status inquiries received by the health plan. A normalized
proportion of inquiries per 1,000 claims is calculated by subcategory to show relative volume.
Claim Status Inquiry is defined as when a health plan receives a request on the status of a claim.
Note:
Claim status inquiries are done in a variety of ways including the following:
o Accessing claim information via a health plan’s secure Web site - Portal/Direct Data Entry
(DDE). Tracked individually for reporting.
o Telephone, Interactive Voice Response (IVR) and fax. Tracked individually for reporting.
o The ASC X12 276 Health Care Claim Status Request.
o These modes of requests should be reported separately to measure trend of electronic
transaction adoption and the movement away from manual transactions and
communications.
As it may be difficult to differentiate and categorize between inquiries for appeals, resubmissions
and the status of the claim within the adjudication cycle, inquiries on claim status should be
counted when there is the ability to track separately.
Total number of legitimate claims from Claim Submission is used to provide a normalized
calculation of the above sub-categories.
Electronic Claim Status Inquiry is defined as an electronic data interchange (EDI) transaction when the
health plan IT system receives a request on claim status electronically through direct data entry via portal or
through real time and batch file submission and system responds with requested status update using the
same modality as the inquiry. The HIPAA standard title is the ASC X12N/005010X212 276 Health Care
Claim Status Request.
Subcategories will be reported between HIPAA compliant electronic transactions and non-HIPAA compliant
transactions. Non-HIPAA compliant transactions that are electronic or automatic will be considered
automated and reported separately.
Note:
ASC X12 276 is the standard for electronic claim status inquiry for both providers and health plans
and is the primary metric for the measure.
27 2013 Index
From the health plan perspective, IVR, portal, and DDE may be considered electronic and reduces
the manual interactions of phone calls and faxes for health plans. Given there is value to track both
types of electronic transactions, each subcategory will be reported and tracked as secondary
metrics at this time. The automated category is used to report the non-HIPAA compliant electronic
transactions.
Claim Payment
Measures and reports the percentage of transactions used by the health plan to make a payment to the
healthcare provider as a proportion of all healthcare claim payments by the health plan.
Claim Payment is defined as any transfer of funds or payment to the financial institution of a healthcare
provider for a health care claim.
Note:
HSA and member payments should not be included.
Claim payment may be done in a variety of ways including the following:
o Cash, check or similar paper instrument.
o Payment via a credit card network, Fedwire network or other non-Automated Clearing
House (ACH) network governed by NACHA (The Electronic Payments Association).
o Electronic Funds Transfer (EFT) via the ACH Network.
Claim payments, regardless of the delivery function can also be a transaction type of credit, debit or
an unfunded credit (zero pay).
Claim Payment is reported and tracked by number of payments made in the measurement year
along with the number of claims paid within the cohort of payments. Reporting at the payment level
alone understates the volume of claims paid given multiple claims may be included in a single
payment. Dollar value of claims or payments are not tracked.
Claims submitted from the prior year may be paid within the payments being reported (e.g., claim
submitted on December 15 is paid or payment is sent on January 15). Only ASC X12N/005010X2I2
Health Care Claim 837 I (Institutional) and 837 P (Professional) claims are included at this time.
Claims paid per payment is calculated to provide insight into the number of claims bundled per
payment mechanism as a secondary measure.
Electronic Claim Payment or Electronic Funds Transfer (EFT) is defined as any electronic data interchange
(EDI) transfer of funds (EFT), other than a transaction originated by cash, check, or similar paper instrument
that is initiated through an electronic terminal, telephone, computer, or magnetic tape for the purpose of
ordering, instructing or authorizing a financial institution to debit or credit an account. The term includes
Automated Clearing House (ACH) transfers, Fedwire transfers over the Federal Reserve Wire Network,
transfers made at automatic teller machines (ATMs), and point-of-sale terminals.
The total number of claims paid through electronic claim payments or electronic funds transfer represents
the numerator for the Claim Payment calculation.

28 2013 Index
Note:
Claims adjudicated resulting in $0 payment (zero pay) are included.
Each electronic payment instrument will be tracked and reported with the Total Electronic Claim
Payment being the sum of these payment instruments.
Claim Remittance Advice
Measures and reports the percentage of transactions used by the health plan to send a remittance advice
directly to a healthcare provider as a proportion of all healthcare remittance advice messages by the health
plan.
A Remittance Advice (RA) is defined as a document or a transmission of a message supplied by the health
plan or payer that provides notice of and explanation reasons for payment, adjustment, denial and/or
uncovered charges of a medical claim back to the provider or facility. The RA may accompany payment and
is sometimes referred to as an explanation of payment (EOP).
Note:
Claim Remittance Advice is reported and tracked by remittances made in the measurement year
along with the number of claims represented within the cohort of remittances.
A remittance advice may reference claims submitted in the prior year (e.g., claim submitted on
December 15 is remittance is sent on January 15).
Claims represented per remittance is calculated to provide insight into the number of RAs bundled
per remittance as a secondary measure.
A Remittance Advice or other Electronic EOP may be viewed via a health plan’s secure Website.
These modes should be reported separately to measure the trend of electronic transaction
adoption and the movement away from manual transactions and communications.
o From the health plan perspective this may be considered electronic leading to a reduction
in paper based RAs.
o Given there is value to track both types of electronic transactions, this subcategory will be
reported and tracked as secondary metrics at this time. The automated category is used
to report the non-HIPAA compliant electronic transactions.
Electronic Remittance Advice (ERA) is defined as an explanation of the health care payment or an
explanation of why there is no payment for the claim that is transmitted electronically through the health care
payer payment or claims processing system and is received by the provider or provider’s agent (e.g.,
clearinghouse, billing service). The ERA includes detailed identifiable health information. The ERA may be
submitted electronically through a secure message or batch file.
Note:
The HIPAA standard title is ASC X12 005010X221A1 835 Health Care Claim Advice.

29 2013 Index
In some relationships between the health plan and the provider, an ERA may be accompanied with
a paper RA. ERA with paper RA will be tracked and reported separately as a secondary measure
when available for reporting from the health plan. This is considered to be a manual transaction
given resources and costs associated with printing and mailing an RA. These transactions should
separated from paper RA only or ERA only counts to avoid duplication of total counts.
GUIDELINES FOR DATA COLLECTION AND REPORTING
Data Collection Model
Initial work has focused on defining an action plan and priorities for developing a model for data collection
and reporting. Below is a summary of the model:
1. Participants enroll with CAQH to participate and receive data submission instruction and are
provided CAQH data submission IDs that will only be seen by CAQH. Individual entity results are
not publicly reported at this time.
a. Demographic information will be collected where available to segment and weight data.
b. Unique IDs are created to mitigate duplicate data contribution depending on definition of
submitting entity.
2. Participants submit data annually with ability to retrieve, update or correct during the submission
period. Participants may decide to withdraw a data submission, but aggregate statistics will not be
recalculated after annual report is released.
3. CAQH aggregates, de-duplicates data and extrapolates final numbers based on estimation
methodology developed and approved by Data Standards Workgroup after final number of data
contribution participants have been determined.
4. Methodology Audit Reviewers (Milliman) validate final numbers and releases for posting key
aggregate Index statistics to the Internet and the creation of industry report by CAQH.
Data Collection Process
A set of standardized definitions are provided in this guide to ensure Participants are extracting and
reporting comparable numbers. The Participant should follow the instructions provided in this guide as a set
of guidelines and consult CAQH where there may be barriers or deviations. Any deviation from the written
guidelines will be reviewed by the Data Standards Workgroup to determine impact to Index calculations and
if deviation will be permitted for data submission. Material, but accepted, deviations will be documented and
listed in any published reports.
1. Participant identified by CAQH, Advisory Panel or existing Participant. New Participants should
contact CAQH if interested in participating.
30 2013 Index
2. CAQH works with Participant to define reporting entity and assign IDs. Advisory Council will be
engaged if there is a need to address defining the unique entity or data submission. Upon
assignment of CAQH ID, the Participant will be enrolled to participate in data contribution.
3. Participant will review Data Submission Guide and request conference call with CAQH to address
any questions or data reporting challenges. Any material issues will be reviewed by Data Standards
Workgroup to include or exclude in data reporting.
4. Participant submits data file by reporting due date to CAQH. See Appendix C for the Index Data
Submission Form and Data Collection Template.
5. Participant attests to the submitting complete and faithful data to CAQH in the designated format
and in accordance with data submission standards written in this Reporting Standards and Data
Submission Guide. See Appendix F for the Data Submission Acknowledgement.
6. Participant will receive a final report with individual results upon the release of the U.S. Healthcare
Efficiency Index™ report. Individual participant data remains in confidence at CAQH and individual
results will not be published.
Defining the Data Contribution Entity (Participant)
CAQH will conduct an initial interview with the contributing entity (participant) to gain an understanding of the
data that will be submitted along with the general defining characteristics of the participant. Data submission
characteristics are used to weigh and segment the submitted data.
A key set of characteristics are used to determine the Reportable Entity and Reportable Unit. Recognizing
the possible limitations within the participant entity to extract and report segmented data, CAQH may allow
aggregated data submission across multiple business lines, health plans and product types that can be used
for aggregate industry statistics. The preferred method is to collect data at the most granular level as is
feasible and possible at the participant entity that is of the lowest burden to allow for benchmarking and
comparative analysis based on common key characteristics.
Reportable Entity (Organization ID) characteristics will be required to determine if the entity is a
unique organization contributing data.
o Legal Entity or Organization Name
o Name of Person Submitting Data with Title and Contact Information
o Entity Type
o Ownership (Public, Private, Profit Status)
Reportable Unit (Submission ID) will be determined based on the Reportable Entity requirements
and if there is a need for multiple data submissions per entity.
o Line of Business (commercial, Medicare, Medicaid) or Plan Type if applicable
o Individual Product Type if applicable
o Geographical Business Unit or area represented by Reportable Unit with:

31 2013 Index
Number of Members (If using member months, divide the total member months
by 12 months to report the membership represented for the annual data
submission time period)
Number of Contracted Providers (broken out by physicians and non-physicians)
Number of Contracted Hospitals and Facilities
Additional characteristics may be recorded to help define the Reportable Entity and Unit.
Comments and Assumptions will be tracked for consideration in any statistical analysis or
aggregate reporting of statistics.
Additional data characteristics will be collected where applicable. Notify CAQH if the reported data is not
representative of the standard reporting calendar year. Where multiple geographical segmentation is
available, membership size and percentage of total membership should be reported. The systems and
platforms used should also be reported along with any changes that may have impact to the data reported
and the impact to trending over time.
32 2013 Index
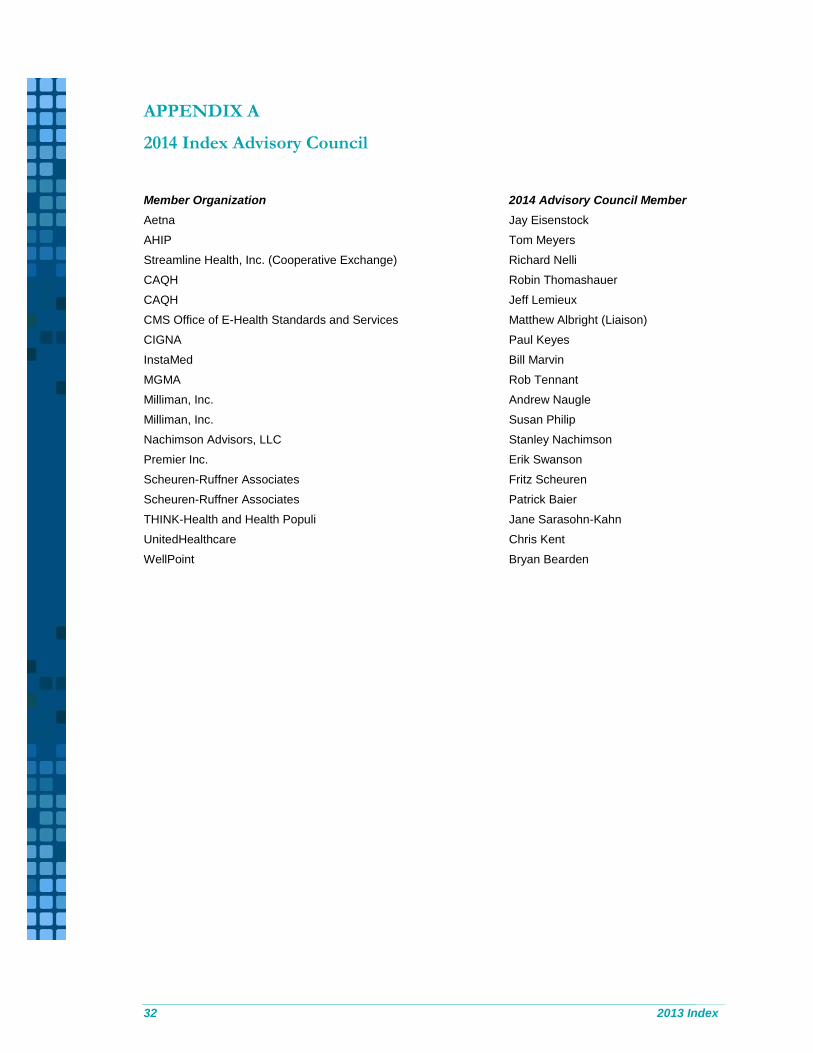
APPENDIX A
2014 Index Advisory Council
Member Organization 2014 Advisory Council Member
Aetna Jay Eisenstock
AHIP Tom Meyers
Streamline Health, Inc. (Cooperative Exchange) Richard Nelli
CAQH Robin Thomashauer
CAQH Jeff Lemieux
CMS Office of E-Health Standards and Services Matthew Albright (Liaison)
CIGNA Paul Keyes
InstaMed Bill Marvin
MGMA Rob Tennant
Milliman, Inc. Andrew Naugle
Milliman, Inc. Susan Philip
Nachimson Advisors, LLC Stanley Nachimson
Premier Inc. Erik Swanson
Scheuren-Ruffner Associates Fritz Scheuren
Scheuren-Ruffner Associates Patrick Baier
THINK-Health and Health Populi Jane Sarasohn-Kahn
UnitedHealthcare Chris Kent
WellPoint Bryan Bearden

33 2013 Index
APPENDIX B
Glossary of Terms Used in This Report and Prior Index Documents
Claim Payment. Any transfer of funds or payment to the financial institution of a health care provider for a
health care claim.
Claim Remittance Advice. A document or a transmission of a message supplied by the health plan or
payer that provides notice of and explanation of reasons for payment, adjustment, denial and/or uncovered
charges of a medical claim back to the provider or facility. The Remittance Advice may accompany payment
and is sometimes referred to as an explanation of payment (EOP).
Claim Status Inquiry. Instances when a health plan receives a request on the status of a claim. The total
number of claim status inquiries represents the denominator for the Claim Status calculation.
Cost Savings. The difference between the cost of a purely electronic (HIPAA) transaction and its manual
alternative.
Electronic Claim. An electronic data interchange (EDI) of the received Claim Submission transaction.
Electronic Claim Payment. See Electronic Funds Transfer (EFT)
Electronic Claim Status Inquiry. An electronic data interchange (EDI) transaction when the health plan IT
system receives a request on claim status electronically through direct data entry via portal or through real
time and batch file submission and system responds with requested status update using the same modality
as the inquiry. The HIPAA standard title is the ASC X12N/005010X212 276 Health Care Claim Status
Request.
Electronic Eligibility and Benefit Verification. An electronic data interchange (EDI) transaction when the
health plan IT system receives a request to obtain information about a benefit plan for an enrollee
electronically through direct data entry, via portal, or through batch file submission and the system responds
with the requested eligibility and benefit information using the same modality as the inquiry. The HIPAA
standard title is ASC X12 270 Health Care Eligibility Benefit Inquiry.
Electronic Funds Transfer (EFT) or Electronic Claim Payment. Any electronic data interchange (EDI)
transfer of funds (EFT), other than a transaction originated by cash, check, or similar paper instrument that
is initiated through an electronic terminal, telephone, computer, or magnetic tape for the purpose of ordering,
instructing or authorizing a financial institution to debit or credit an account. The term includes Automated
Clearing House (ACH) transfers, Fedwire transfers over the Federal Reserve Wire Network, transfers made
at automatic teller machines (ATMs), and point-of-sale terminals.

34 2013 Index
Electronic Remittance Advice (ERA). An explanation of the health care payment or an explanation of why
there is no payment for the claim that is transmitted electronically through the health care payer payment or
claims processing system and is received by the provider or provider’s agent (e.g., clearinghouse, billing
service) The ERA includes detailed identifiable health information. The ERA may be submitted electronically
through a secure message or batch file.
Eligibility and Benefit Verification. Instances when a health plan receives a request to obtain any of the
following information about a benefit plan for an enrollee or member: 1) Eligibility to receive health care
under the health plan; 2) Coverage of health care under the health plan; or 3) Benefits associated with the
benefit plan.
Industry Cost. The sum of health plan and provider costs.
Legitimate Claim. An itemized statement of rendered services and costs from a health care provider or
facility received by the health plan for payment for health care. A claim can be submitted via a manual
process using paper or electronic system, either directly or through intermediary billers and claims
clearinghouses.
Measurement Year. The January 1 to December 31, 2012.
Method. Refers to the general modality used to conduct transactions, i.e. manual or electronic.
Modality. Refers to the transaction type by detailed category, i.e. telephone, fax, web portal, etc.
Percent Electronic. Represents the current level of adoption for a type of electronic transaction as a
percent of all transactions of that type by all methods.
Realized Savings. The total of annual administrative costs that have been eliminated as a result of
electronic administrative transaction adoption.
Remittance Advice (RA). A document or a transmission of a message supplied by the health plan or payer
that provides notice of and explanation reasons for payment, adjustment, denial and/or uncovered charges
of a medical claim back to the provider or facility. The RA may accompany payment and is sometimes
referred to as an explanation of payment (EOP).
Savings Opportunity. The difference in the total cost of a transaction at the reported level of electronic use
and full adoption.

35 2013 Index
APPENDIX C
Index Data Submission Information Forms and
Data Collection Tool Templates

36 2013 Index
Data Collection Tool

37 2013 Index
Payer Administrative Cost Workbook

38 2013 Index
Provider Administrative Cost Workbook

39 2013 Index
APPENDIX D
Guiding Principles to Measurement and Reporting
CAQH and the Index Advisory Council believe that when collecting and reporting industry data it is
imperative that the results are collected and reported consistently and accurately from one entity to another
and from year to year. While there will always be some inherent differences between business operations
and there will be barriers and challenges to defining measurement standards that can be applied across the
large and diverse healthcare industry, all steps should be taken to set guiding principles, standardized
definitions and a foundation to measurement and reporting.
There are many characteristics, attributes and methodologies that are important to defining useful,
actionable and reliable measurement and reporting.
Measures should be relevant, meaningful and address processes and outcomes that are applicable and
actionable for improvement (e.g., Improve Results, Reduce Cost, Increase Efficiency).
Meaningful and Important
o Significant to those being measured and the findings are useful for action.
o The item of measurement is prevalent enough to warrant measurement and/or the
financial implications are large enough to be considered for measurement.
Controllable and Actionable
o Impact can be made acting on the results of the measurement.
o The item of measurement is controllable and action can be taken to improve that which is
being measured.
Strategically Important or Cost Effective
o The measurement drives competition and recognition in the marketplace.
o Promotes efficient uses of resources, or reduce waste/low cost-effective activities.
Variation and Potential for Improvement
o Wide variation shows an opportunity for improvement, cost reduction and control.
o Benchmarking against current state and working towards better performance drives
improvement and efficiency.
Standardized methods, data availability and clear definitions are required for consistent, valid and accurate
measurements for comparison and action. Measurement should not create an unnecessary burden for data
collection and reporting, and should use a reliable methodology that is feasible to implement.
Evidence Based
o There is strong evidence supporting the need for measurement.
o There are guidelines or standards documenting the benefits and need for measurement.

40 2013 Index
Reproducible, Valid and Accurate
o Measures should produce the same results when applied to the same population and
setting using the same method.
o Measures are logical and precisely evaluate what is being studied or measured.
Data Availability and Comparability
o Data is accessible and available.
o Stratification to account for differences among variables and reporting entities (e.g., entity
type, geography, size, level of sophistication).
o If there is potential for inconsistent measurement or manipulation that is undetectable,
clear instructions and documentation must be provided to address limitations.
Precise Specifications for data extraction, analysis methods and reporting
o The measurement is clearly defined and reproducible by an independent third party.
o Clear definitions and standardized reporting methods to drive repeatable and consistent
measurement are necessary to achieve adoption and use of results as industry
benchmarks.

41 2013 Index
APPENDIX E
HIPAA and ACA Definitions and Standards
Health Plan – an Individual or group health plan that provides, pays the cost of, medical care. This definition
is based on the role of health plans conducting administrative transactions for the purposes of implementing
the provisions of administrative simplification. (Federal Register/Vol. 63, No. 88)
HIPAA-Related Standards for Index Transactions Relevant to CAQH CORE Operating Rules
Transaction Standard
Health Care Eligibility Benefit Inquiry ASC X12 270
Health Care Eligibility Benefit Information Response ASC X12 271
Health Care Claim Status Request ASC X12 276
Health Care Claim Status Notification ASC X12 277
Health Care Services Review Inquiry/Response ASC X12 278
Health Care Claim Payment/Advice ASC X12 835
Health Care Claim ASC X12 837

42 2013 Index
APPENDIX F
2013 Data Submission Acknowledgment
US Healthcare Efficiency Index® Data Submission Acknowledgment
This Data Submission Acknowledgement (the “Acknowledgement”) governs the contribution of healthcare
data by the organization identified below (“Submitter”) to the Council for Affordable Quality Healthcare
(“CAQH”) in connection with the US Healthcare Efficiency Index® (“Index”) program and website located at
www.caqh.org.
Submitter acknowledges that the value of the Index is dependent on full and accurate data from the
contributing organizations. Accordingly Submitter agrees to submit complete and faithful data to the Index in
the designated format and in accordance with data submission standards made available to respondents.
Submitter represents that any data submitted is accurate and has not been falsified.
Supplier hereby grants to CAQH, the operator of the Index, a non-exclusive, irrevocable, royalty-free,
worldwide license to manipulate the data submitted by Submitter, to incorporate such data into the Index,
and to present such data as aggregated into the Index for public use on the Index website. Supplier
represents that it has all rights necessary to grant such license to CAQH, and will defend and hold harmless
CAQH against any claims to the contrary.
The Index aggregates data to report on industry trends. Accordingly, CAQH agrees that it will keep the
disaggregated data submitted by Submitter confidential and will not disclose it to third parties other than (i)
to subcontractors for the purpose of aggregating the data into the Index; and (ii) if and as required by
applicable law. CAQH owns all data as modified and/or aggregated into the Index, and any use of the Index
data is governed by the terms available on the Index website or under a separate license agreement.
NEITHER PARTY, ITS EMPLOYEES, OFFICERS, DIRECTORS, MEMBERS, AND/OR
REPRESENTATIVES WILL BE LIABLE FOR ANY SPECIAL, INDIRECT, INCIDENTAL, EXEMPLARY,
CONSEQUENTIAL LOSSES OR OTHER DAMAGES ARISING OUT OF OR IN CONNECTION WITH THIS
ACKNOWLEDGEMENT.
This Acknowledgement is governed by the laws of the State of New York.
Acknowledged and Agreed:
Organization: _____________________________________________________
By: _____________________________________________________________
Name: __________________________________________________________
Title: ____________________________________________________________
Date: ____________________________________________________________