2013 scag economic summit report orange county economic …economy.scag.ca.gov/economy site document...
TRANSCRIPT
Prepared for the Southern California Association of Governments
Orange County Business Council
October 2013
2013 SCAG ECONOMIC SUMMIT REPORT
Orange County Economic Update
Table of Contents Page | 2
Table of Contents
Section 1: Introduction ................................................................................................................... 3
Section 2: Orange County Overview ............................................................................................... 4
Section 3: Key Existing and Emerging Industries ............................................................................ 8
Section 4: Occupational Employment and Salary Growth ............................................................ 16
Section 5: Income and Poverty Statistics ...................................................................................... 20
Section 6: Educational Attainment Demographics ....................................................................... 22
Section 7: Housing Market and Construction Activity .................................................................. 24
Section 8: Employment Estimations for Economic Recovery ....................................................... 29
Section 9: Other Predictions for Post-Recession Recovery .......................................................... 34
Appendix: EDD Job and Unemployment Estimates ...................................................................... 41
Section 1 – Introduction Page | 3
Section 1: Introduction In preparation for the 2013 Southern California Association of Governments (SCAG) Economic
Summit, this report provides an update of the current state of the Orange County economy,
with special attention paid to estimates and projections for economic recovery and job creation
in the aftermath of the Great Recession, including data indicators focusing on Orange County’s:
Key Existing and Emerging Industries
Occupational Employment and Salary Growth
Income and Poverty Statistics
Educational Attainment Demographics
Housing Market and Construction Activity
The barometers and analysis contribute to understanding a clear picture of Orange County’s
recovery progress, and helps answer questions regarding when Orange County can expect to
re-attain its pre-Recession peak employment levels. Beginning with a general overview of the
county’s economy and demographics, key barometers show in greater detail the likeliest
sources of employment growth amidst the shifting economic landscape. Finally, the report
closes with an analysis of Orange County’s current and projected economic growth and job
creation trends, including estimations and timeline for the county’s return to pre-Recession
employment levels.

Section 2 – Orange County Overview Page | 4
Section 2: Orange County Overview For the past several decades, Orange County has consistently enjoyed unemployment rates
below regional, state, and national averages. Exhibit 2.1 demonstrates that even during the
peak months of the Great Recession, Orange County’s unemployment rate tracked with the
national average, and tended to be at least two percent below California’s overall rate. As 2013
has progressed, the gap between Orange County’s unemployment rate compared to state and
national averages has widened.
However, unemployment levels alone cannot demonstrate the long-lasting impacts the Great
Recession has left on the county’s labor force, particularly in terms of labor participation rates,
students prolonging their education careers, underemployed, discouraged workers, and the
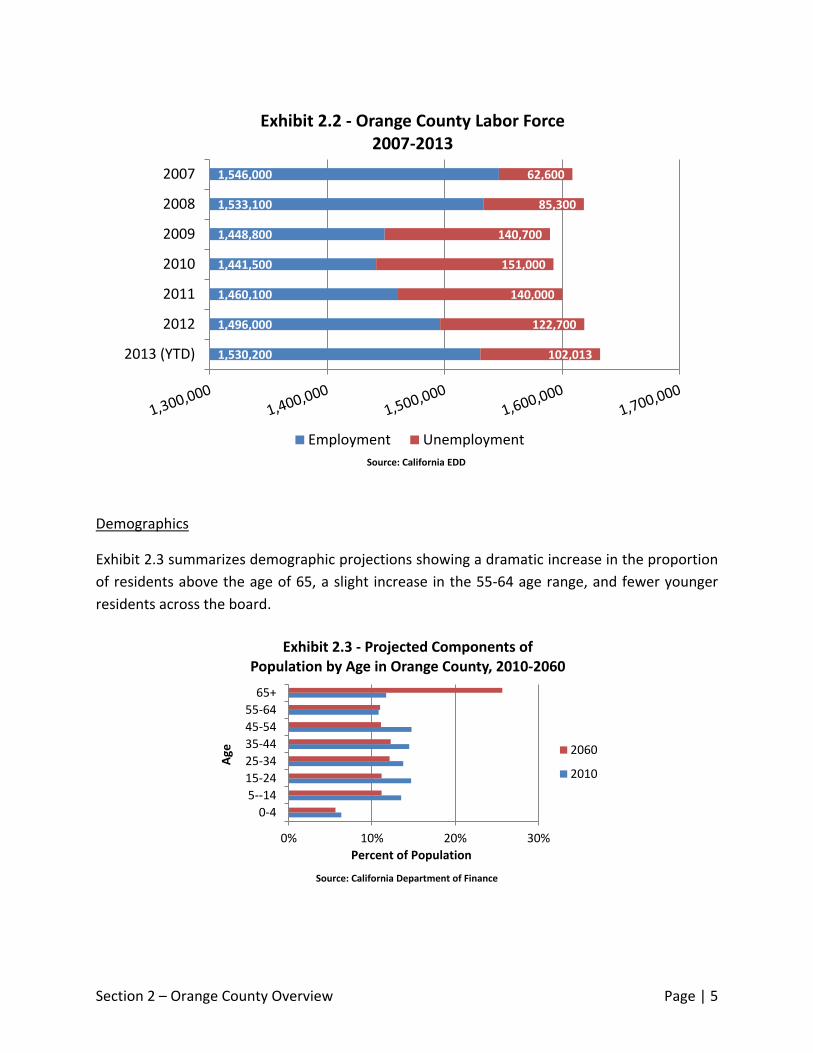
long-term unemployed. Exhibit 2.2 shows levels for both employed and unemployed in Orange
County, and demonstrates how the labor force shrank during the Recession. The labor force
accounts for all those employed and those seeking employment; but does not include
discouraged workers, unemployed persons who are not actively looking for work.
0.0%
2.0%
4.0%
6.0%
8.0%
10.0%
12.0%
14.0%
Exhibit 2.1 - Unemployment Rates January 2007 - August 2013
Orange County (6.2%) California (8.8%) United States (7.3%)
Source: California EDD
Section 2 – Orange County Overview Page | 5
Demographics
Exhibit 2.3 summarizes demographic projections showing a dramatic increase in the proportion
of residents above the age of 65, a slight increase in the 55-64 age range, and fewer younger
residents across the board.
1,530,200
1,496,000
1,460,100
1,441,500
1,448,800
1,533,100
1,546,000
102,013
122,700
140,000
151,000
140,700
85,300
62,600
2013 (YTD)
2012
2011
2010
2009
2008
2007
Exhibit 2.2 - Orange County Labor Force 2007-2013
Employment Unemployment
0% 10% 20% 30%
0-4
5--14
15-24
25-34
35-44
45-54
55-64
65+
Percent of Population
Age
Exhibit 2.3 - Projected Components of Population by Age in Orange County, 2010-2060
2060
2010
Source: California EDD
Source: California Department of Finance
Section 2 – Orange County Overview Page | 6
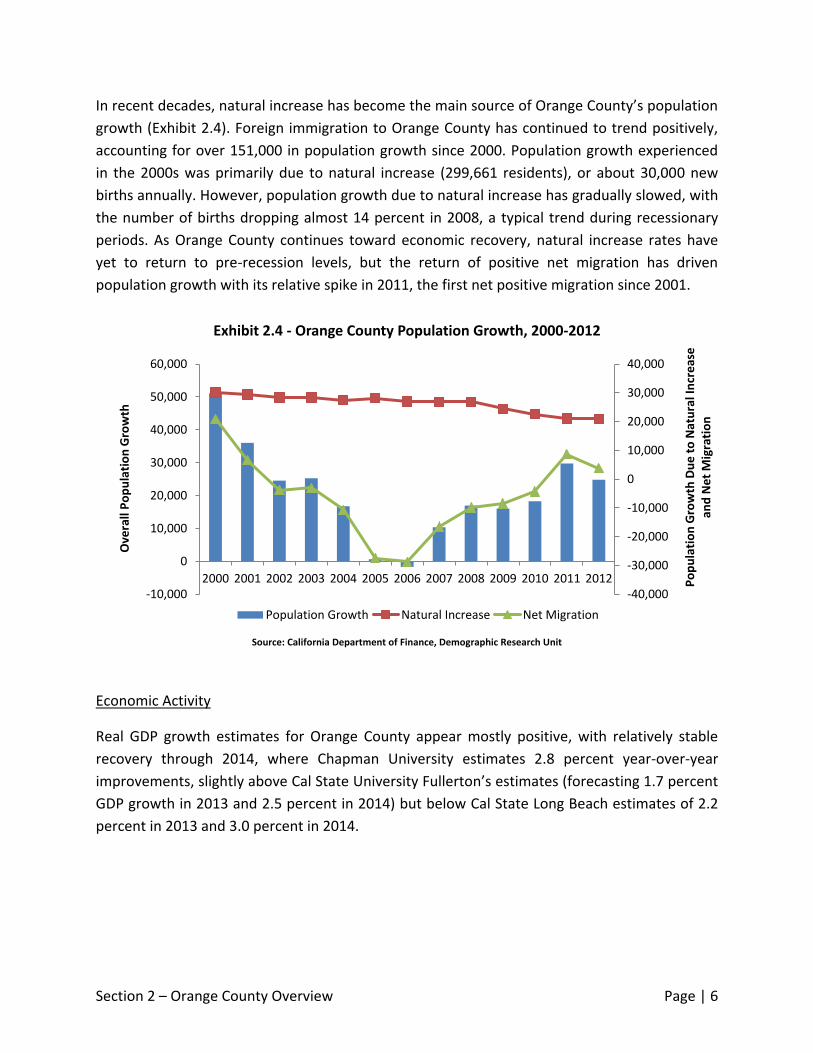
In recent decades, natural increase has become the main source of Orange County’s population
growth (Exhibit 2.4). Foreign immigration to Orange County has continued to trend positively,
accounting for over 151,000 in population growth since 2000. Population growth experienced
in the 2000s was primarily due to natural increase (299,661 residents), or about 30,000 new
births annually. However, population growth due to natural increase has gradually slowed, with
the number of births dropping almost 14 percent in 2008, a typical trend during recessionary
periods. As Orange County continues toward economic recovery, natural increase rates have
yet to return to pre-recession levels, but the return of positive net migration has driven
population growth with its relative spike in 2011, the first net positive migration since 2001.
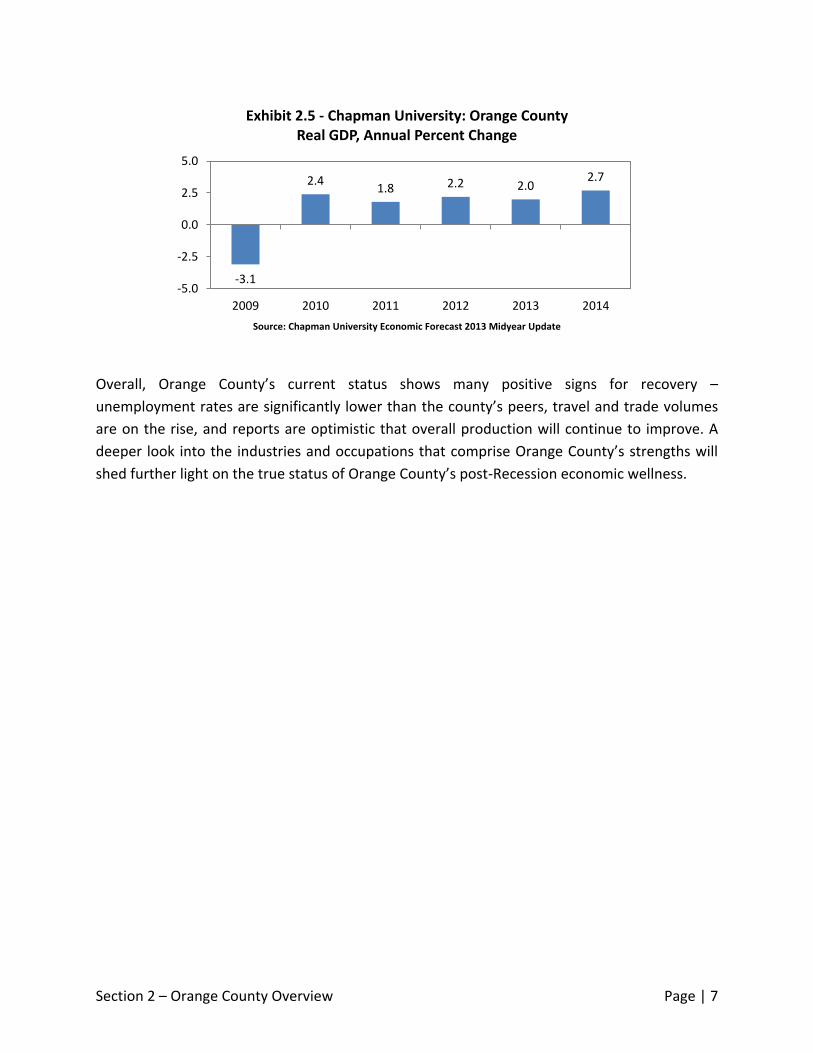
Economic Activity
Real GDP growth estimates for Orange County appear mostly positive, with relatively stable
recovery through 2014, where Chapman University estimates 2.8 percent year-over-year
improvements, slightly above Cal State University Fullerton’s estimates (forecasting 1.7 percent
GDP growth in 2013 and 2.5 percent in 2014) but below Cal State Long Beach estimates of 2.2
percent in 2013 and 3.0 percent in 2014.
-40,000
-30,000
-20,000
-10,000
0
10,000
20,000
30,000
40,000
-10,000
0
10,000
20,000
30,000
40,000
50,000
60,000
2000 2001 2002 2003 2004 2005 2006 2007 2008 2009 2010 2011 2012 Po
pu
lati
on
Gro
wth
Du
e t
o N
atu
ral I
ncr
eas
e
and
Ne
t M
igra
tio
n
Ove
rall
Po
pu
lati
on
Gro
wth
Exhibit 2.4 - Orange County Population Growth, 2000-2012
Population Growth Natural Increase Net Migration
Source: California Department of Finance, Demographic Research Unit
Section 2 – Orange County Overview Page | 7
Overall, Orange County’s current status shows many positive signs for recovery –
unemployment rates are significantly lower than the county’s peers, travel and trade volumes
are on the rise, and reports are optimistic that overall production will continue to improve. A
deeper look into the industries and occupations that comprise Orange County’s strengths will
shed further light on the true status of Orange County’s post-Recession economic wellness.
-3.1
2.4 1.8 2.2 2.0
2.7
-5.0
-2.5
0.0
2.5
5.0
2009 2010 2011 2012 2013 2014
Exhibit 2.5 - Chapman University: Orange County Real GDP, Annual Percent Change
Source: Chapman University Economic Forecast 2013 Midyear Update

Section 3 – Key Existing and Emerging Industries Page | 8
Section 3: Key Existing and Emerging Industries At the two-digit NAICS level, Orange County’s largest industries in terms of total employment
are Professional & Business Services, Leisure & Hospitality, and Educational & Health Services.
As of August 2013, the greatest year-over-year percentage growth has been seen in
Construction at 9.4 percent, Financial Activities at 6.5 percent and Leisure & Hospitality at 3.5
percent; only Retail Trade and Nondurable Goods Manufacturing have seen year-over-year
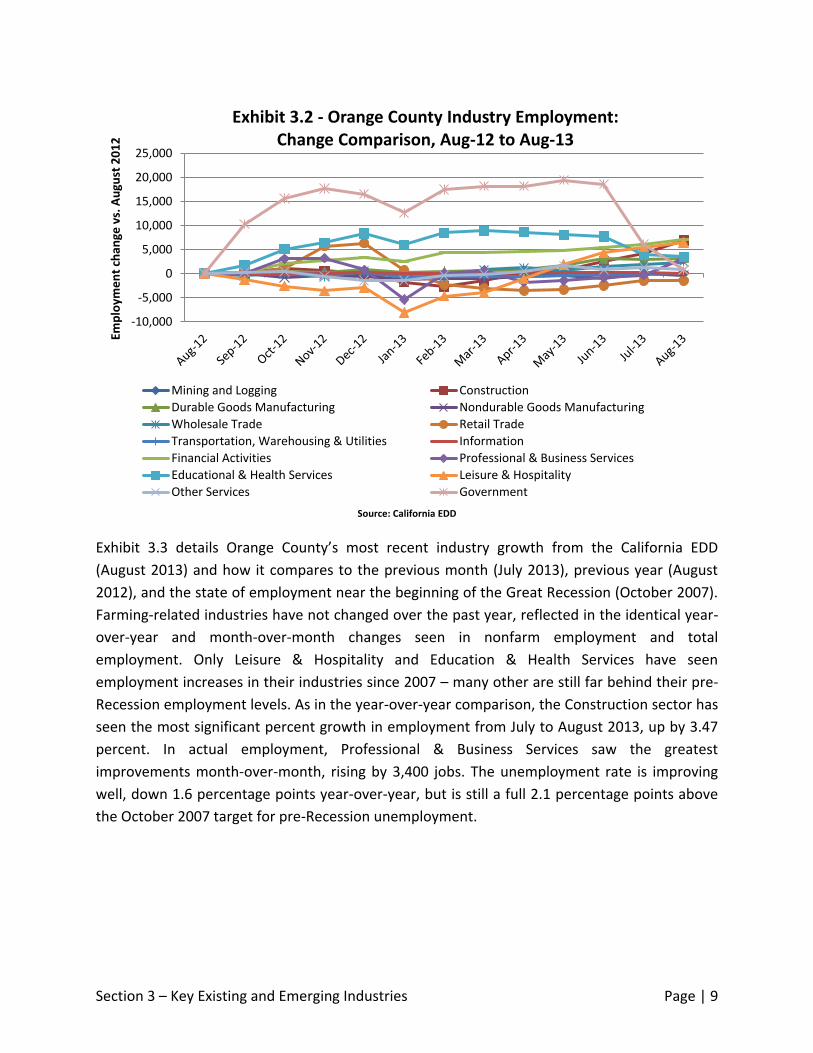
employment declines, dropping by 1.1 percent and 0.7 percent, respectively. While Exhibit 3.1
is a six-year overview of employment changes for the county, Exhibit 3.2 explores changes in
the last year in greater detail, showing how each major industry varied in each month’s
employment leading to the latest month to date. Government employment spiked dramatically
from September 2012 to June 2013, only to drop to almost identical year-over-year levels in
August 2013. Conversely, Leisure & Hospitality dropped significantly at the beginning of 2013,
but rebounded through the first half of 2013 to experience the second-highest actual growth in
employment for the county overall.
0
100,000
200,000
300,000
Jan
-08
Ap
r-0
8
Jul-
08
Oct
-08
Jan
-09
Ap
r-0
9
Jul-
09
Oct
-09
Jan
-10
Ap
r-1
0
Jul-
10
Oct
-10
Jan
-11
Ap
r-1
1
Jul-
11
Oct
-11
Jan
-12
Ap
r-1
2
Jul-
12
Oct
-12
Jan
-13
Ap
r-1
3
Jul-
13
Exhibit 3.1 - Orange County Monthly Industry Trends, 2008-2013
Mining and Logging ConstructionDurable Goods Manufacturing Nondurable Goods ManufacturingWholesale Trade Retail TradeTransportation, Warehousing & Utilities InformationFinancial Activities Professional & Business ServicesEducational & Health Services Leisure & HospitalityOther Services Government
Source: California EDD
Section 3 – Key Existing and Emerging Industries Page | 9
Exhibit 3.3 details Orange County’s most recent industry growth from the California EDD
(August 2013) and how it compares to the previous month (July 2013), previous year (August
2012), and the state of employment near the beginning of the Great Recession (October 2007).
Farming-related industries have not changed over the past year, reflected in the identical year-
over-year and month-over-month changes seen in nonfarm employment and total
employment. Only Leisure & Hospitality and Education & Health Services have seen
employment increases in their industries since 2007 – many other are still far behind their pre-
Recession employment levels. As in the year-over-year comparison, the Construction sector has
seen the most significant percent growth in employment from July to August 2013, up by 3.47
percent. In actual employment, Professional & Business Services saw the greatest
improvements month-over-month, rising by 3,400 jobs. The unemployment rate is improving
well, down 1.6 percentage points year-over-year, but is still a full 2.1 percentage points above
the October 2007 target for pre-Recession unemployment.
-10,000
-5,000
0
5,000
10,000
15,000
20,000
25,000
Emp
loym
en
t ch
ange
vs.
Au
gust
20
12
Exhibit 3.2 - Orange County Industry Employment:
Change Comparison, Aug-12 to Aug-13
Mining and Logging Construction
Durable Goods Manufacturing Nondurable Goods Manufacturing
Wholesale Trade Retail Trade
Transportation, Warehousing & Utilities Information
Financial Activities Professional & Business Services
Educational & Health Services Leisure & Hospitality
Other Services Government
Source: California EDD

Section 3 – Key Existing and Emerging Industries Page | 10
Exhibit 3.3 - Industry Employment Change Vs. July 2013 Vs. August 2012 Vs. October 2007
Industry Aug-13 Actual
Change Percent Change
Actual Change
Percent Change
Actual Change
Percent Change
Civilian Labor Force 1,633,900 -6,100 -0.37% 22,900 1.42% 21,600 1.34%
Civilian Employment 1,532,900 -300 -0.02% 48,200 3.25% -13,300 -0.86%
Civilian Unemployment 101,000 -5,800 -5.43% -25,300 -20.03% 35,000 53.03%
Total, All Industries 1,429,300 2,400 0.17% 32,500 2.33% -94,000 -6.17%
Total Nonfarm 1,426,800 2,400 0.17% 32,500 2.33% -91,400 -6.02%
Mining and Logging 500 0 0.00% 0 0.00% -100 -16.67%
Construction 80,400 2,700 3.47% 6,900 9.39% -22,200 -21.64%
Durable Goods Manufacturing 117,500 300 0.26% 3,200 2.80% -7,800 -6.23%
Nondurable Goods Manufacturing 43,700 -300 -0.68% -300 -0.68% -9,900 -18.47%
Wholesale Trade 79,800 500 0.63% 2,400 3.10% -7,600 -8.70%
Retail Trade 140,400 0 0.00% -1,500 -1.06% -20,900 -12.96%
Transportation, Warehousing & Utilities 27,700 200 0.73% 0 0.00% -1,800 -6.10%
Information 24,300 -100 -0.41% 100 0.41% -6,500 -21.10%
Financial Activities 115,400 900 0.79% 7,000 6.46% -5,600 -4.63%
Professional & Business Services 261,100 3,400 1.32% 3,100 1.20% -15,100 -5.47%
Educational & Health Services 164,500 -400 -0.24% 3,500 2.17% 19,000 13.06%
Leisure & Hospitality 191,900 1,000 0.52% 6,500 3.51% 16,500 9.41%
Other Services 45,300 -500 -1.09% 800 1.80% -2,600 -5.43%
Government 134,300 -5,300 -3.80% 800 0.60% -26,800 -16.64%
Civilian Unemployment Rate 6.2% -0.3% -1.6% 2.1%
Exhibit 3.4 highlights the fastest growing industries in Orange County since January 2010 at the
3-digit NAICS level. Notable appearances include Credit Intermediation at over 45 percent job
growth, Scientific Consulting at nearly 20 percent growth and College Employment at over 17
percent growth. These rapidly-growing industries are correlated with Orange County’s sizable
employment pools in its top three largest 2-digit NAICS-classified industries, and further
highlight improvements in the Construction industry – an essential indicator of post-Recession
recovery due to expanded land development.
Source: California EDD

Section 3 – Key Existing and Emerging Industries Page | 11
California’s Employment Development Department (EDD) has created estimates for the fastest-
growing industries in Orange County through 2020 – Exhibit 3.5 contrasts the EDD’s predictions
with actual percent growth from January 2010 to June 2013, showing progress thus far toward
reaching the EDD’s predictions. Currently, the only industries that are not meeting or exceeding
the EDD’s model are those related to retail stores. Nondepository Credit Intermediation has
already surpassed the EDD’s ten-year expectations in just three years, while others such as
Ambulatory Health Care and Social Assistance are over halfway to reaching the EDD’s
predictions – meaning that employment will likely grow to those levels in less than ten years.
For further analysis, review the appendix for a full breakdown of the top 20 industries by
employment and their estimated growth through 2016.
0% 10% 20% 30% 40% 50%
Heavy and Civil Engineering Construction
Nondepository Credit Intermediation
Employment Services
Amusement, Gambling and Recreation
Credit Intermediation and Related Activities
Management, Scientific and Technical…
Colleges, Universities and Professional…
Full-Service Restaurants
Ambulatory Health Care Services
Limited-Service Eating Places
Exhibit 3.4 - Top Ten Fastest Growing Industries in Orange County by Percent Growth, Jan-2010 to June-2013
Percent Growth (Jan 2010 - June 2013)
-10% 0% 10% 20% 30% 40% 50%
Nondepository Credit IntermediationNursing and Residential Care Facilities
General Merchandise StoresAmbulatory Health Care Services
Clothing and Clothing Accessories StoresSocial Assistance
Health and Personal Care StoresFood Services and Drinking Places
AccommodationAdministrative and Support Services
Exhibit 3.5 - Projected vs. Actual Percent Industry Growth
Percent Growth (Jan 2010 - June 2013) Projected Percent Growth (2010 - 2020)
Source: California EDD
Source: California EDD

Section 3 – Key Existing and Emerging Industries Page | 12
The entrepreneurial and innovative community of Orange County is world-renowned, and it is
an ideal platform for employers and workforce professionals to unite and develop new
opportunities in four emerging groups of industries that blur traditional cluster boundaries –
International Trade, Information Technology, Creativity, and Green Technology. These four
drivers have become important elements of employment from all of Orange County’s major
industry clusters, offering a better understanding of the County’s workforce needs in the
County’s most critical areas for growth potential.
Exhibit 3.6 shows the employment levels of each cross-cutting cluster across 12 different
industry groups, as well as total employment. The four cross-cutting clusters consist of
approximately 246,634 jobs across 12 different industry clusters in 2012. Workers in these
cluster drivers earn consistently higher wages than Orange County’s average salary indicates, at
nearly $20,000 above the average. Though the vast majority of industries have an International
Trade component, Creativity and Information Technology have their greatest impact on
Business Services, one of Orange County’s most important clusters for innovation.
International Trade
Orange County is an ideal partner for international trade with many distinct advantages,
including proximity to the ports of Long Beach and Los Angeles, a well-connected freeway and
road system for fleet transportation, rail lines providing national trade linkages, proximity to
- 20,000 40,000 60,000 80,000
100,000 120,000 140,000 160,000 180,000 200,000
Exhibit 3.6 - Orange County Cluster Drivers, 2012
Creativity Green Technology Information Technology International Trade Outside of Cluster
Source: OCBC Analysis of California EDD Data, OTIS Report, Next10, and LAEDC

Section 3 – Key Existing and Emerging Industries Page | 13
international and domestic airports including John Wayne Airport and LAX, and a constantly
growing multicultural presence. CSUF estimates that the Los Angeles-Long Beach-Santa Ana
MSA ranks third in the nation for merchandise export volume in 2013, and that roughly 13
percent of Orange County’s gross metropolitan product is generated from exports. As
demonstrated by Exhibit 3.7, Asia’s dominant regions of China, Japan and South Korea round
out the top five trade partners for the County – the three countries together accounting for
35.3 percent of the county’s merchandise exports. Transportation Equipment and Computer
Products combined accounted for over 45 percent of total exports in 2011, together exceeding
$11.3 billion in exports.
Exhibit 3.8 shows how shipping container activity has remained relatively strong, even through
the roughest heights of the Great Recession. The Port of Los Angeles is above activity recorded
in August 2012, while the Port of Long Beach hit a significant record for port activity in August
2013, surpassing 600,000 total containers for the first time since October 2010.
$0
$10,000
$20,000
$30,000
$40,000
$0
$2,000
$4,000
$6,000
$8,000
2005 2006 2007 2008 2009 2010 2011 2012f 2013f 2014fCo
un
ty E
xpo
rts
in M
illio
ns
Exhibit 3.7 - Orange County Exports by Country, 2005-2014 Forecast
Canada China Japan
South Korea Mexico Rest of World
Total Export VolumeSource: IEES, California State University Fullerton

Section 3 – Key Existing and Emerging Industries Page | 14
Tourism is a key component of Orange County’s economic prosperity; beautiful beaches and
world-class theme parks draw in visitors from throughout the country and contribute
significantly to the county’s monetary inflows. Orange County is home to John Wayne Airport as
its travel gateway, and JWA has demonstrated significant recovery in air travel frequency and
volume since the Great Recession. Over 850,000 travelers were reported in August 2013, an
increase of over 12,000 compared to August 2012. Both passenger totals and air cargo tons
have generally been on the rise year-over-year.
Port of Long Beach, Aug-13, 630,292
Port of Los Angeles, Aug-13, 709,677
0
100,000
200,000
300,000
400,000
500,000
600,000
700,000
800,000
900,000
Jan
-09
Mar
-09
May
-09
Jul-
09
Sep
-09
No
v-0
9Ja
n-1
0M
ar-1
0M
ay-1
0Ju
l-1
0Se
p-1
0N
ov-
10
Jan
-11
Mar
-11
May
-11
Jul-
11
Sep
-11
No
v-1
1Ja
n-1
2M
ar-1
2M
ay-1
2Ju
l-1
2Se
p-1
2N
ov-
12
Jan
-13
Mar
-13
May
-13
Jul-
13
Exhibit 3.8 - Port of Long Beach & Port of Los Angeles, Total Container Activity, 2009-2013
Port of Long Beach Port of Los Angeles
Aug-13, 850,988
500,000
600,000
700,000
800,000
900,000
1,000,000
Exhibit 3.9 - John Wayne Airport 2006-2013 Monthly Total Passengers
Source: Port of Long Beach, Port of Los Angeles
Source: John Wayne Airport

Section 3 – Key Existing and Emerging Industries Page | 15
Information Technology is one essential industry with tremendous growth potential for the
county; through Orange County’s Information industry is relatively small, IT is an essential
element of many Orange County businesses, and regions with a large and diverse high-tech
economy have an edge in attracting and retaining high-tech firms. To this end, Orange County
has long been a key player in electronic software, technical services, and hardware
manufacturing. As discussed in Section 2’s overview of International Trade, the majority of
Orange County’s international exports are reliant on the success of Information Technology,
leaving an ideal foundation for new entrants to build upon. The average IT salary is $83,078,
about $28,000 more than County’s annual average salary for all industries. According to the
EDD, the state’s top-earning occupations in Information Technology include Information
Systems Managers ($138,874 annual salary), Systems Software Developers ($114,795 annual
salary) and Information Research Scientists ($115,535 annual salary).
The Creativity sector consists of industries that emphasize culture, art, and design either as a
primary driver or significant contributor. Specifically, the sector consists of creative
professionals and enterprises that take powerful, original ideas and transform them into
practical and innovative goods. Two-thirds of the Creativity cluster’s employment is derived
from the Business & Professional Services cluster; like Information Technology, creative
professions are critical to business success, and have great potential for the future of the
county.
Green Technology refers to industries that create solutions for energy, infrastructure, and
advanced materials that are both environmentally conscious and cost minimizing. The clusters
with the greatest employment totals in Green Technology for 2012 included Business &
Professional Services, Advanced Manufacturing, and Construction – a split emphasis in
producing environmentally-conscious products and applying concepts at a strategic level via
consulting services. The greatest employment growth has stemmed from Advanced Materials,
which includes the production of specialized energy-efficiency equipment such as solar cells.
Section 4 – Occupational Employment and Salary Growth Page | 16
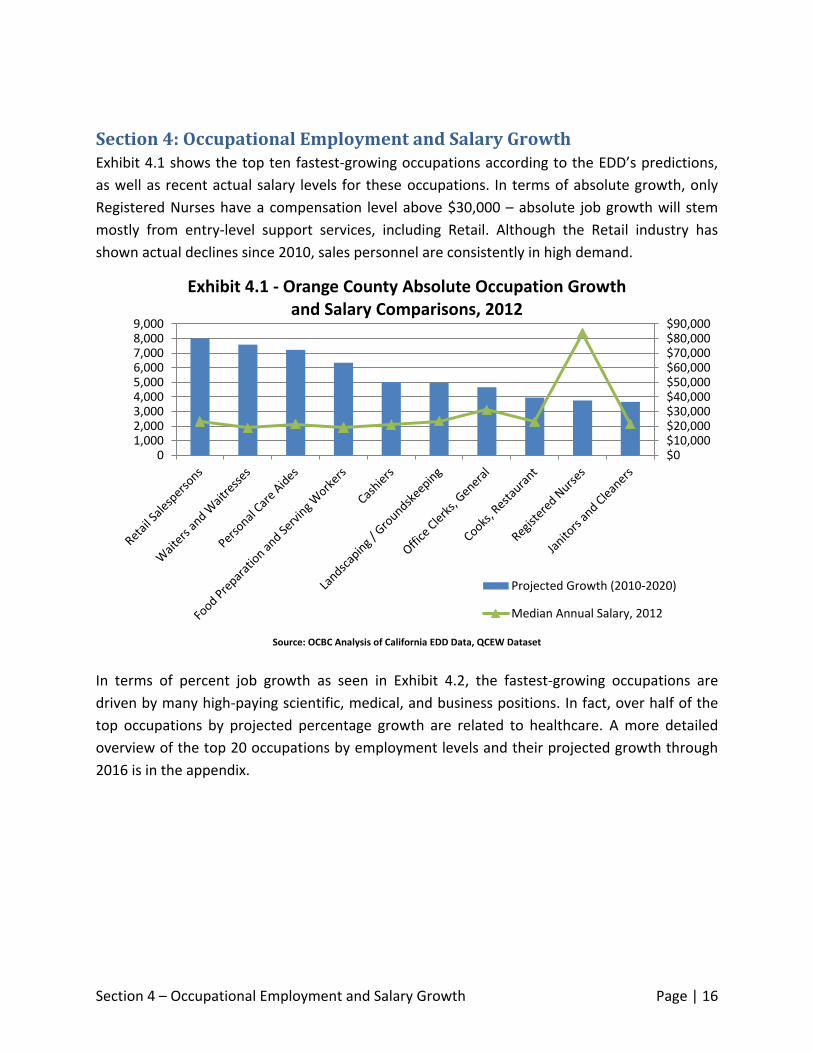
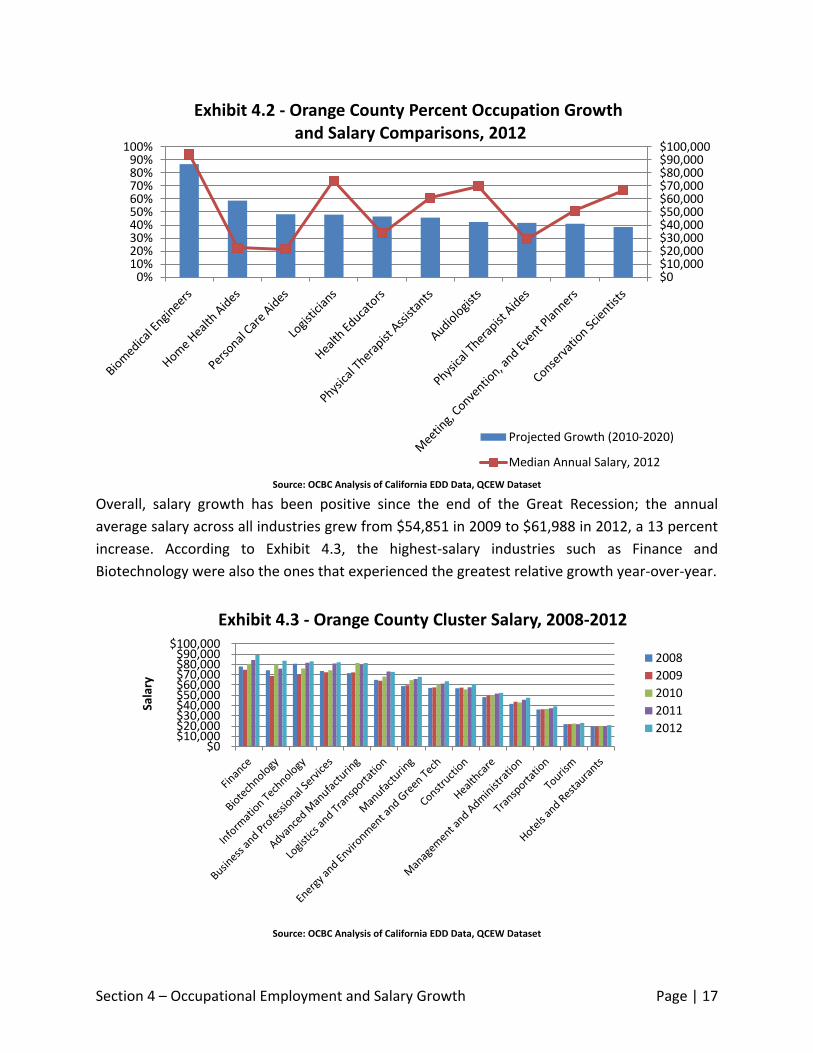
Section 4: Occupational Employment and Salary Growth Exhibit 4.1 shows the top ten fastest-growing occupations according to the EDD’s predictions,
as well as recent actual salary levels for these occupations. In terms of absolute growth, only
Registered Nurses have a compensation level above $30,000 – absolute job growth will stem
mostly from entry-level support services, including Retail. Although the Retail industry has
shown actual declines since 2010, sales personnel are consistently in high demand.
In terms of percent job growth as seen in Exhibit 4.2, the fastest-growing occupations are
driven by many high-paying scientific, medical, and business positions. In fact, over half of the
top occupations by projected percentage growth are related to healthcare. A more detailed
overview of the top 20 occupations by employment levels and their projected growth through
2016 is in the appendix.
$0$10,000$20,000$30,000$40,000$50,000$60,000$70,000$80,000$90,000
01,0002,0003,0004,0005,0006,0007,0008,0009,000
Exhibit 4.1 - Orange County Absolute Occupation Growth and Salary Comparisons, 2012
Projected Growth (2010-2020)
Median Annual Salary, 2012
Source: OCBC Analysis of California EDD Data, QCEW Dataset
Section 4 – Occupational Employment and Salary Growth Page | 17
Overall, salary growth has been positive since the end of the Great Recession; the annual
average salary across all industries grew from $54,851 in 2009 to $61,988 in 2012, a 13 percent
increase. According to Exhibit 4.3, the highest-salary industries such as Finance and
Biotechnology were also the ones that experienced the greatest relative growth year-over-year.
$0$10,000$20,000$30,000$40,000$50,000$60,000$70,000$80,000$90,000$100,000
0%10%20%30%40%50%60%70%80%90%
100%
Exhibit 4.2 - Orange County Percent Occupation Growth and Salary Comparisons, 2012
Projected Growth (2010-2020)
Median Annual Salary, 2012
$0$10,000$20,000$30,000$40,000$50,000$60,000$70,000$80,000$90,000
$100,000
Sala
ry
Exhibit 4.3 - Orange County Cluster Salary, 2008-2012
2008
2009
2010
2011
2012
Source: OCBC Analysis of California EDD Data, QCEW Dataset
Source: OCBC Analysis of California EDD Data, QCEW Dataset

Section 4 – Occupational Employment and Salary Growth Page | 18
Exhibit 4.4 shows the results of the California EDD’s Quarterly Census of Earnings and Wages
(QCEW) for 2013, and how the results compare to 2010’s annual average salary and
employment levels by major occupation group. In aggregate, all occupations have improved
their wage levels by 5.5 percent since 2010, averaging $52,219. The greatest salary growth both
in terms of actual and percentage was seen in Computer and Mathematical Occupations,
increasing by $8,129 or 10.2 percent to an average of $87,677. Other leaders in actual growth
include Life, Physical and Social Science ($6,672 increase) and Architecture and Engineering
Occupations ($5,344 increase).
Percent growth leaders include Construction and Extraction Occupations (8.0 percent) and
Protective Service Occupations (8.5 percent), among others. Only three major occupation
groups saw declines in their average salaries since 2010: Community and Social Services (down
$2,444), Education, Training and Library (down $24) and Legal Occupations (down $6,587).
Interestingly, the occupations that experienced employment declines were not the same as
those that experienced wage depreciation over the same period of time – in fact, Community
and Social Services employment increased by 9.6 percent, the 4th-highest percent growth out of
compared occupation groups. However, occupation groups with the highest employment
growth tended to also feature higher salary growth over the same period, as seen in examples
including Business and Financial Operations, Computer and Mathematical, and various
Sciences.

Section 4 – Occupational Employment and Salary Growth Page | 19
Annual Average Salary Annual Average Employment
Occupational Title Q1 2013 Q1 2010 Actual
Change Percent Change Q1 2013 Q1 2010
Actual Change
Percent Change
Total, All Occupations $52,219 $49,513 $2,706 5.5% 1,410,970 1,374,310 36,660 2.7%
Management $126,368 $121,048 $5,320 4.4% 86,460 82,930 3,530 4.3%
Business and Financial Operations $74,527 $69,611 $4,916 7.1% 89,060 80,480 8,580 10.7%
Computer and Mathematical $87,677 $79,548 $8,129 10.2% 46,740 39,060 7,680 19.7%
Architecture and Engineering $87,924 $82,580 $5,344 6.5% 33,500 31,060 2,440 7.9%
Life, Physical, and Social Science $75,398 $68,726 $6,672 9.7% 12,970 10,330 2,640 25.6%
Community and Social Services $50,830 $53,274 -$2,444 -4.6% 14,940 13,630 1,310 9.6%
Legal $107,697 $114,284 -$6,587 -5.8% 11,410 11,370 40 0.4%
Education, Training, and Library $60,876 $60,900 -$24 0.0% 71,910 70,650 1,260 1.8%
Arts, Design, Entertainment, Sports, and Media $54,641 $50,984 $3,657 7.2% 19,910 23,040 -3,130 -13.6%
Healthcare Practitioners and Technical $82,827 $78,039 $4,788 6.1% 66,410 65,040 1,370 2.1%
Healthcare Support $33,035 $30,942 $2,093 6.8% 34,820 35,320 -500 -1.4%
Protective Service $51,507 $47,471 $4,036 8.5% 21,920 22,360 -440 -2.0%
Food Preparation and Serving-Related $23,157 $22,453 $704 3.1% 130,780 125,910 4,870 3.9%
Building and Grounds Cleaning and Maintenance $26,167 $26,133 $34 0.1% 51,770 49,310 2,460 5.0%
Personal Care and Service $26,871 $25,244 $1,627 6.4% 32,550 32,490 60 0.2%
Sales and Related $44,352 $43,876 $476 1.1% 154,130 148,690 5,440 3.7%
Office and Administrative Support $38,970 $37,395 $1,575 4.2% 257,730 255,160 2,570 1.0%
Farming, Fishing, and Forestry $23,585 $23,444 $141 0.6% 1,650 1,770 -120 -6.8%
Construction and Extraction $52,975 $49,050 $3,925 8.0% 54,070 58,160 -4,090 -7.0%
Installation, Maintenance, and Repair $49,027 $47,656 $1,371 2.9% 44,030 41,170 2,860 6.9%
Production $33,262 $31,919 $1,343 4.2% 103,330 98,630 4,700 4.8%
Transportation and Material Moving $31,558 $30,723 $835 2.7% 70,890 77,740 -6,850 -8.8%
Exhibit 4.4 – Orange County Occupational Wages and
Employment, 2010-2013
Source: OCBC Analysis of California EDD Data, QCEW Dataset
Section 5 – Income and Poverty Level Demographics Page | 20
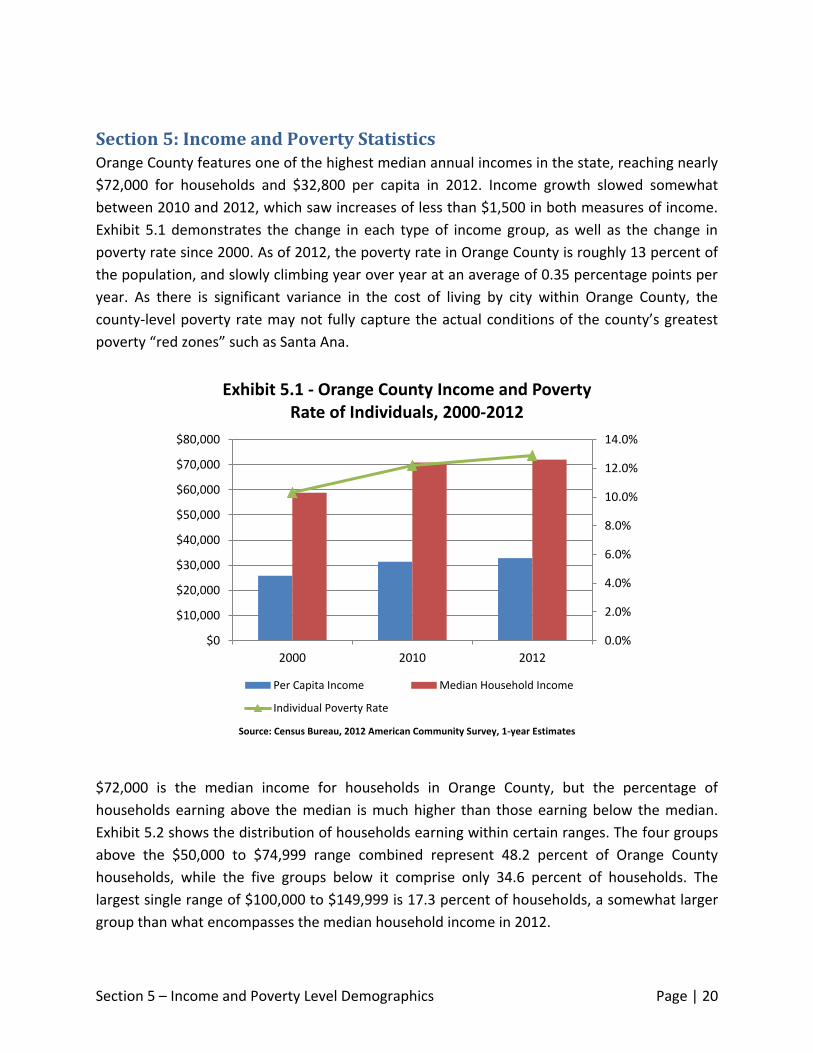
Section 5: Income and Poverty Statistics Orange County features one of the highest median annual incomes in the state, reaching nearly
$72,000 for households and $32,800 per capita in 2012. Income growth slowed somewhat
between 2010 and 2012, which saw increases of less than $1,500 in both measures of income.
Exhibit 5.1 demonstrates the change in each type of income group, as well as the change in
poverty rate since 2000. As of 2012, the poverty rate in Orange County is roughly 13 percent of
the population, and slowly climbing year over year at an average of 0.35 percentage points per
year. As there is significant variance in the cost of living by city within Orange County, the
county-level poverty rate may not fully capture the actual conditions of the county’s greatest
poverty “red zones” such as Santa Ana.
$72,000 is the median income for households in Orange County, but the percentage of
households earning above the median is much higher than those earning below the median.
Exhibit 5.2 shows the distribution of households earning within certain ranges. The four groups
above the $50,000 to $74,999 range combined represent 48.2 percent of Orange County
households, while the five groups below it comprise only 34.6 percent of households. The
largest single range of $100,000 to $149,999 is 17.3 percent of households, a somewhat larger
group than what encompasses the median household income in 2012.
0.0%
2.0%
4.0%
6.0%
8.0%
10.0%
12.0%
14.0%
$0
$10,000
$20,000
$30,000
$40,000
$50,000
$60,000
$70,000
$80,000
2000 2010 2012
Exhibit 5.1 - Orange County Income and Poverty Rate of Individuals, 2000-2012
Per Capita Income Median Household Income
Individual Poverty Rate
Source: Census Bureau, 2012 American Community Survey, 1-year Estimates

Section 5 – Income and Poverty Level Demographics Page | 21
4.6%
3.6%
7.8%
7.6%
11.1%
17.1%
12.8%
17.3%
8.5%
9.6%
0.0% 5.0% 10.0% 15.0% 20.0%
Less than $10,000
$10,000 to $14,999
$15,000 to $24,999
$25,000 to $34,999
$35,000 to $49,999
$50,000 to $74,999
$75,000 to $99,999
$100,000 to $149,999
$150,000 to $199,999
$200,000 or more
Exhibit 5.2 - Orange County Income Groups by Percent of Total Households, 2012
Households
Source: Census Bureau, 2012 American Community Survey, 1-year Estimates

Section 7 – Housing Market and Construction Activity Page | 22
Section 6: Educational Attainment Demographics Greater educational attainment leads to a better-equipped workforce that earns more, creating
greater social and economic contributions back to the county. The following chart in Exhibit 6.1
demonstrates the education demographics of Orange County’s population above the age of 25.
In 2012, Orange County’s over-25 population totaled 2,037,907. Orange County’s workforce is
relatively well-educated – 45 percent of Orange County’s “working age” residents have
obtained at least an Associate’s degree, and 84 percent have obtained at least a high school
diploma. The three largest groups are Bachelor’s holders, high school diploma holders, and
those who have attended college but have not obtained a degree.
Earning potential and declining poverty rates significantly increase with each successive step in
educational attainment, as seen in Exhibits 6.2 and 6.3. Bachelor’s degree holders comprise the
majority of Orange County’s workers above age 25, with a median annual wage of nearly
$58,000.
8.7%
7.3%
17.9%
21.1% 7.7%
24.0%
13.3%
Exhibit 6.1 - Orange County Educational Attainment, Population Above Age 25, 2012
Less than 9th grade
9th to 12th grade, no diploma
High school graduate
Some college, no degree
Associate's degree
Bachelor's degree
Graduate or professional degree
Total Population Age 25+: 2.04 million
Source: Census Bureau, 2012 American Community Survey, 1-year Estimates

Section 7 – Housing Market and Construction Activity Page | 23
$18,994
$27,498
$38,178
$57,796
$82,145
$0
$10,000
$20,000
$30,000
$40,000
$50,000
$60,000
$70,000
$80,000
$90,000
Less than highschool
graduate
High schoolgraduate
Some collegeor associate's
degree
Bachelor'sdegree
Graduate orprofessional
degree
Exhibit 6.2 - Median Wages by Educational Attainment, Workers Over Age 25, 2012
23.5%
13.0%
8.0%
4.7%
7.8% 8.1% 6.7%
4.2% 0.0%
5.0%
10.0%
15.0%
20.0%
25.0%
Less than high schoolgraduate
High school graduate Some college orassociate's degree
Bachelor's degree orhigher
Exhibit 6.3 - Unemployment and Poverty Rates by Educational Attainment, Population Above Age 25, 2012
Poverty Rate Unemployment Rate
Source: Census Bureau, 2012 American Community Survey, 1-year Estimates
Source: Census Bureau, 2012 American Community Survey, 1-year Estimates

Section 7 – Housing Market and Construction Activity Page | 24
Section 7: Housing Market and Construction Activity While long-term workforce housing demand continues to grow due to job creation and
population growth, very few new housing units were constructed in the last five years,
particularly at the height of the Great Recession. The Orange County real estate market has
recently turned around, with home prices rebounding dramatically since the start of 2013.
Exhibit 7.1 shows how Orange County’s median home price has changed throughout recent
months, comparing the values of existing home sales and the combined forces of new and
existing homes in the market.
According to the California Association of Realtors (CAR), 60.8 percent of Orange County units
are owner-occupied, while 39.2 percent are renter-occupied units. In June 2013, the Orange
County median price of an existing single-family detached home was $661,740 — a drastic 16.5
percent increase over June 2012’s median price of $567,910, and a 1 percent month over-
month increase from May 2013. This indicates not just improvement, but a housing boom from
the real estate market as property values jumped dramatically at the start of the year and
maintained high price points.
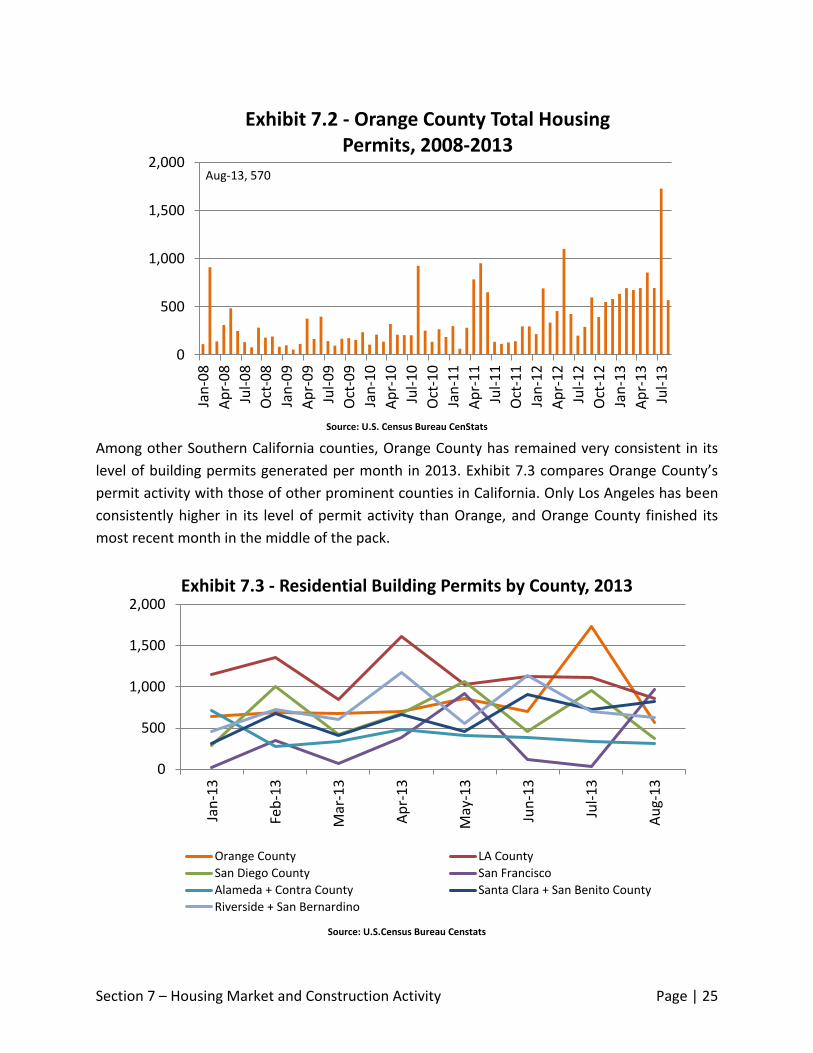
Orange County’s rate of building new housing units has noticeably escalated for 2013,
averaging above 600 units per month since January. In particular, July 2013 brought a great
influx of new projects to the county, with over 1,700 housing permits totaled for the month.
Irvine is the primary city responsible for the majority of new residential permits, with cities such
as Yorba Linda, Fullerton and Anaheim contributing small but notable amounts. The full
breakdown of building permits per month for Orange County is shown below in Exhibit 7.2.
$0
$100,000
$200,000
$300,000
$400,000
$500,000
$600,000
$700,000
$800,000
Jan
-08
Jul-
08
Jan
-09
Jul-
09
Jan
-10
Jul-
10
Jan
-11
Jul-
11
Jan
-12
Jul-
12
Jan
-13
Jul-
13
Exhibit 7.1 - Orange County Median Home Prices 2008-2013 New Versus Existing Homes
New + Existing Existing Only
Source: California Association of Realtors
Section 7 – Housing Market and Construction Activity Page | 25
Among other Southern California counties, Orange County has remained very consistent in its
level of building permits generated per month in 2013. Exhibit 7.3 compares Orange County’s
permit activity with those of other prominent counties in California. Only Los Angeles has been
consistently higher in its level of permit activity than Orange, and Orange County finished its
most recent month in the middle of the pack.
Aug-13, 570
0
500
1,000
1,500
2,000
Jan
-08
Ap
r-0
8
Jul-
08
Oct
-08
Jan
-09
Ap
r-0
9
Jul-
09
Oct
-09
Jan
-10
Ap
r-1
0
Jul-
10
Oct
-10
Jan
-11
Ap
r-1
1
Jul-
11
Oct
-11
Jan
-12
Ap
r-1
2
Jul-
12
Oct
-12
Jan
-13
Ap
r-1
3
Jul-
13
Exhibit 7.2 - Orange County Total Housing Permits, 2008-2013
0
500
1,000
1,500
2,000
Jan
-13
Feb
-13
Mar
-13
Ap
r-1
3
May
-13
Jun
-13
Jul-
13
Au
g-1
3
Exhibit 7.3 - Residential Building Permits by County, 2013
Orange County LA County
San Diego County San Francisco
Alameda + Contra County Santa Clara + San Benito County
Riverside + San Bernardino
Source: U.S. Census Bureau CenStats
Source: U.S.Census Bureau Censtats
Section 7 – Housing Market and Construction Activity Page | 26
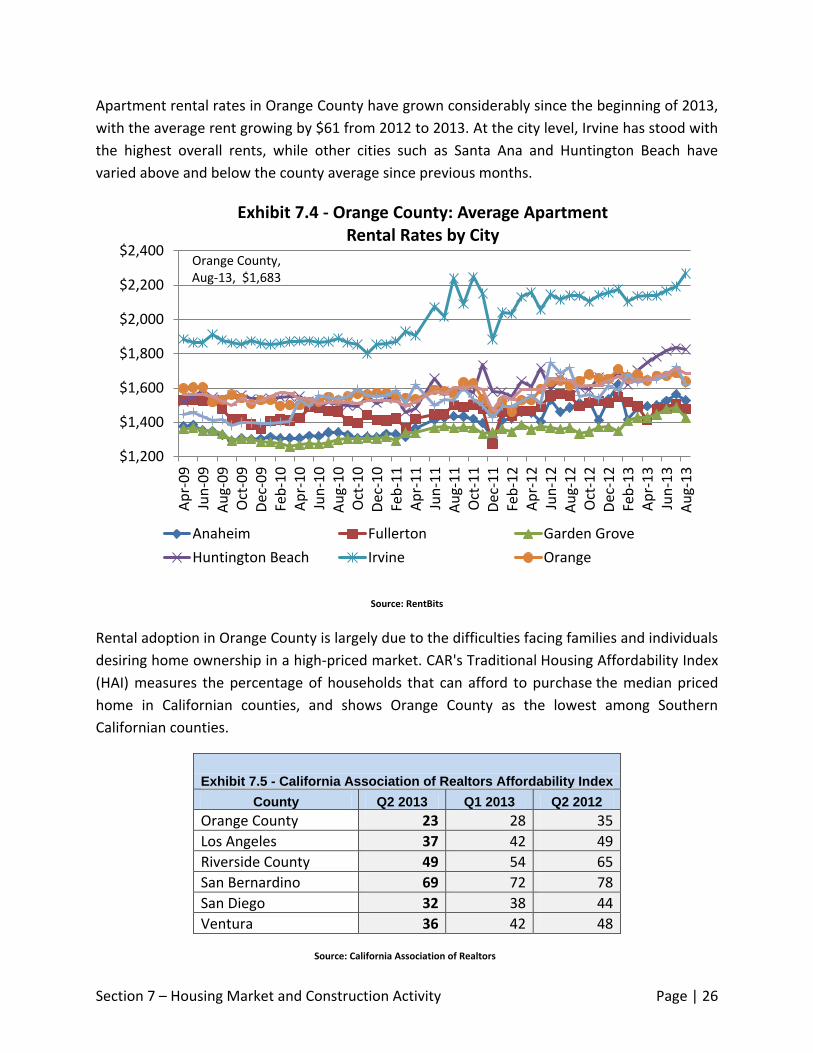
Apartment rental rates in Orange County have grown considerably since the beginning of 2013,
with the average rent growing by $61 from 2012 to 2013. At the city level, Irvine has stood with
the highest overall rents, while other cities such as Santa Ana and Huntington Beach have
varied above and below the county average since previous months.
Rental adoption in Orange County is largely due to the difficulties facing families and individuals
desiring home ownership in a high-priced market. CAR's Traditional Housing Affordability Index
(HAI) measures the percentage of households that can afford to purchase the median priced
home in Californian counties, and shows Orange County as the lowest among Southern
Californian counties.
Exhibit 7.5 - California Association of Realtors Affordability Index
County Q2 2013 Q1 2013 Q2 2012
Orange County 23 28 35
Los Angeles 37 42 49
Riverside County 49 54 65
San Bernardino 69 72 78
San Diego 32 38 44
Ventura 36 42 48
Orange County, Aug-13, $1,683
$1,200
$1,400
$1,600
$1,800
$2,000
$2,200
$2,400
Ap
r-0
9Ju
n-0
9A
ug-
09
Oct
-09
Dec
-09
Feb
-10
Ap
r-1
0Ju
n-1
0A
ug-
10
Oct
-10
Dec
-10
Feb
-11
Ap
r-1
1Ju
n-1
1A
ug-
11
Oct
-11
Dec
-11
Feb
-12
Ap
r-1
2Ju
n-1
2A
ug-
12
Oct
-12
Dec
-12
Feb
-13
Ap
r-1
3Ju
n-1
3A
ug-
13
Exhibit 7.4 - Orange County: Average Apartment Rental Rates by City
Anaheim Fullerton Garden Grove
Huntington Beach Irvine Orange
Source: California Association of Realtors
Source: RentBits
Section 7 – Housing Market and Construction Activity Page | 27
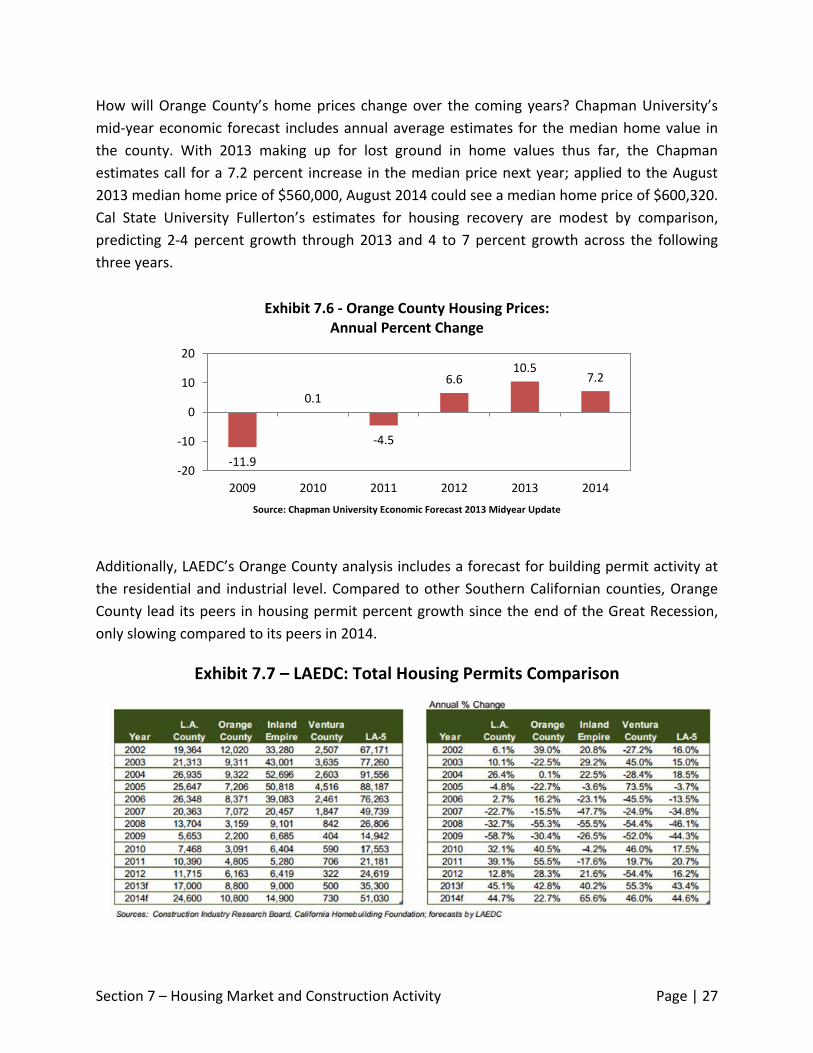
How will Orange County’s home prices change over the coming years? Chapman University’s
mid-year economic forecast includes annual average estimates for the median home value in
the county. With 2013 making up for lost ground in home values thus far, the Chapman
estimates call for a 7.2 percent increase in the median price next year; applied to the August
2013 median home price of $560,000, August 2014 could see a median home price of $600,320.
Cal State University Fullerton’s estimates for housing recovery are modest by comparison,
predicting 2-4 percent growth through 2013 and 4 to 7 percent growth across the following
three years.
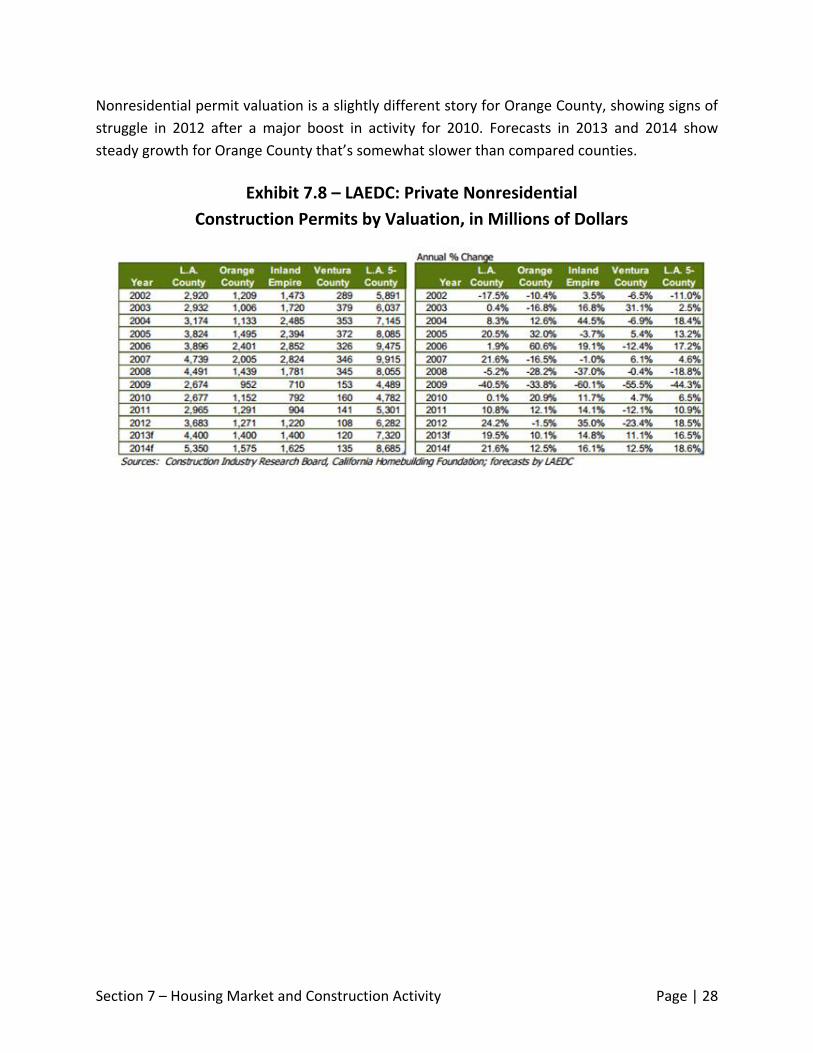
Additionally, LAEDC’s Orange County analysis includes a forecast for building permit activity at
the residential and industrial level. Compared to other Southern Californian counties, Orange
County lead its peers in housing permit percent growth since the end of the Great Recession,
only slowing compared to its peers in 2014.
-11.9
0.1
-4.5
6.6 10.5
7.2
-20
-10
0
10
20
2009 2010 2011 2012 2013 2014
Exhibit 7.6 - Orange County Housing Prices: Annual Percent Change
Exhibit 7.7 – LAEDC: Total Housing Permits Comparison
Source: Chapman University Economic Forecast 2013 Midyear Update
Section 7 – Housing Market and Construction Activity Page | 28
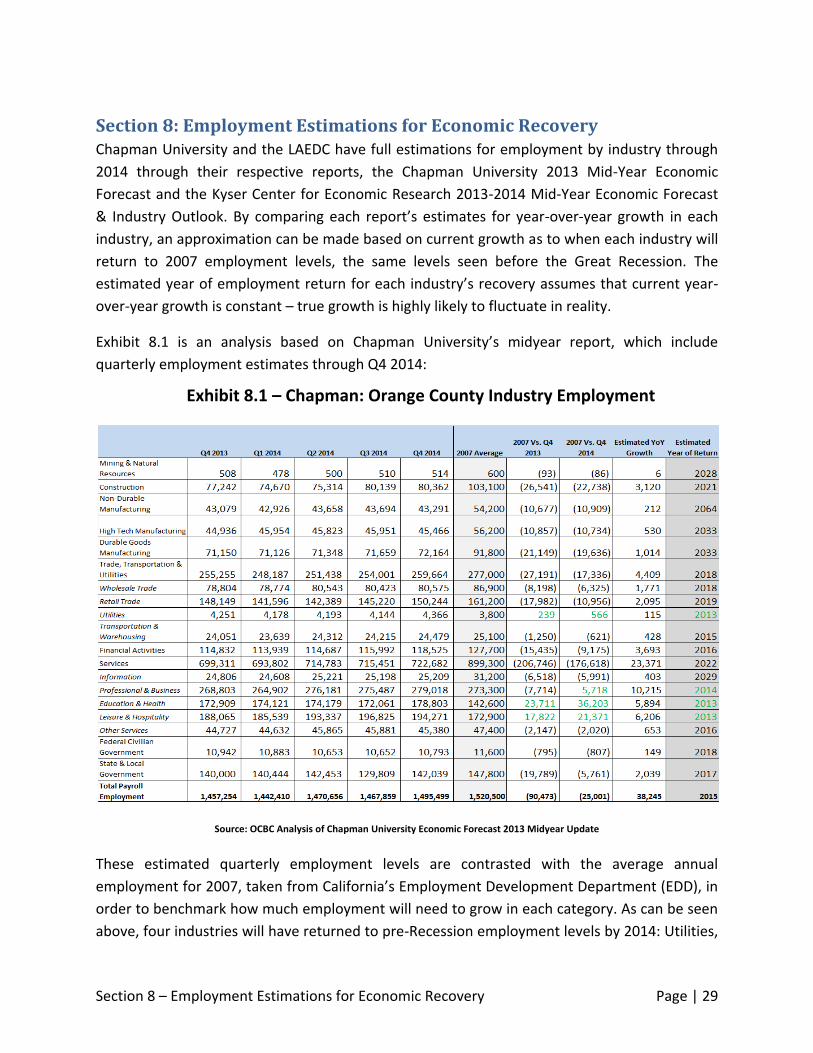
Nonresidential permit valuation is a slightly different story for Orange County, showing signs of
struggle in 2012 after a major boost in activity for 2010. Forecasts in 2013 and 2014 show
steady growth for Orange County that’s somewhat slower than compared counties.
Exhibit 7.8 – LAEDC: Private Nonresidential
Construction Permits by Valuation, in Millions of Dollars
Section 8 – Employment Estimations for Economic Recovery Page | 29
Section 8: Employment Estimations for Economic Recovery Chapman University and the LAEDC have full estimations for employment by industry through
2014 through their respective reports, the Chapman University 2013 Mid-Year Economic
Forecast and the Kyser Center for Economic Research 2013-2014 Mid-Year Economic Forecast
& Industry Outlook. By comparing each report’s estimates for year-over-year growth in each
industry, an approximation can be made based on current growth as to when each industry will
return to 2007 employment levels, the same levels seen before the Great Recession. The
estimated year of employment return for each industry’s recovery assumes that current year-
over-year growth is constant – true growth is highly likely to fluctuate in reality.
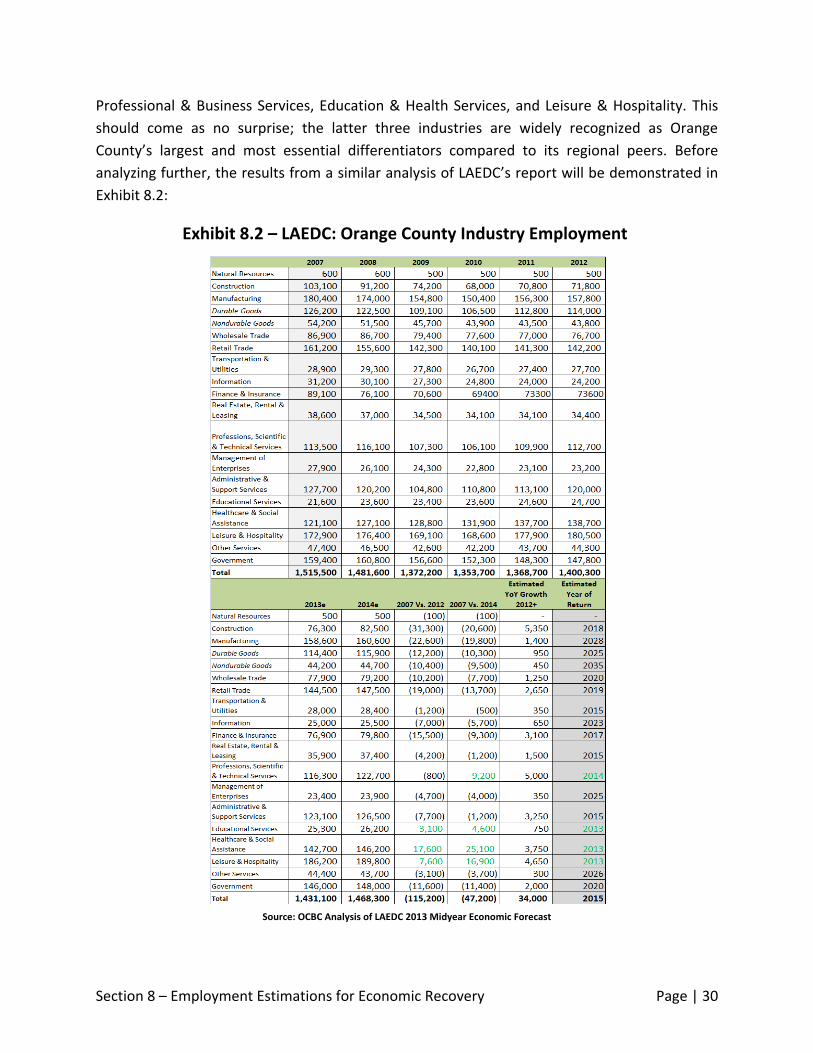
Exhibit 8.1 is an analysis based on Chapman University’s midyear report, which include
quarterly employment estimates through Q4 2014:
These estimated quarterly employment levels are contrasted with the average annual
employment for 2007, taken from California’s Employment Development Department (EDD), in
order to benchmark how much employment will need to grow in each category. As can be seen
above, four industries will have returned to pre-Recession employment levels by 2014: Utilities,
Exhibit 8.1 – Chapman: Orange County Industry Employment
Source: OCBC Analysis of Chapman University Economic Forecast 2013 Midyear Update
Section 8 – Employment Estimations for Economic Recovery Page | 30
Professional & Business Services, Education & Health Services, and Leisure & Hospitality. This
should come as no surprise; the latter three industries are widely recognized as Orange
County’s largest and most essential differentiators compared to its regional peers. Before
analyzing further, the results from a similar analysis of LAEDC’s report will be demonstrated in
Exhibit 8.2:
Exhibit 8.2 – LAEDC: Orange County Industry Employment
Source: OCBC Analysis of LAEDC 2013 Midyear Economic Forecast

Section 8 – Employment Estimations for Economic Recovery Page | 31
LAEDC’s estimates are annual averages, yet comparable to the Chapman forecast. Four
industries are anticipated to regain pre-Recession employment by 2014, three of which are the
same being forecasted using Chapman’s predictions. The addition of Healthcare & Social
Assistance is another example of speedy recovery in one of Orange County’s most prominent
industries. Seven other industries in the Chapman analysis are slated to regain 2007
employment within the next seven years, while LAEDC anticipates five. Both forecasts predict
Transportation & Utilities, Finance & Insurance, Wholesale Trade and Retail Trade to be among
those industries with relatively speedy recoveries.
Both analyses share the conclusion that total employment levels will be equivalent to 2007
levels by 2015. However, the distribution of this employment has shifted dramatically since the
beginning of the Great Recession, meaning that each industry will vary in the time it takes to
return to pre-Recession employment, if that industry should ever regain its previous
employment levels. One example of such a case shared by both reports is Manufacturing:
growth has been particularly sluggish compared to other industries, and combined with
external factors limiting the expansion of manufacturing in lieu of other industries, there is a
high likelihood that the Manufacturing industry in Orange County will not return to its former
size for decades.
Both reports differ on which industries are believed to have the fastest year-over-year growth.
While LAEDC estimates Construction to be the leader followed closely by Technical Services,
Leisure & Hospitality and Healthcare & Social Assistance, Chapman’s growth estimates place
Construction far behind same-digit NAICS estimates for Professional & Business Services,
Education & Health, Leisure & Hospitality, and Transportation & Utilities.
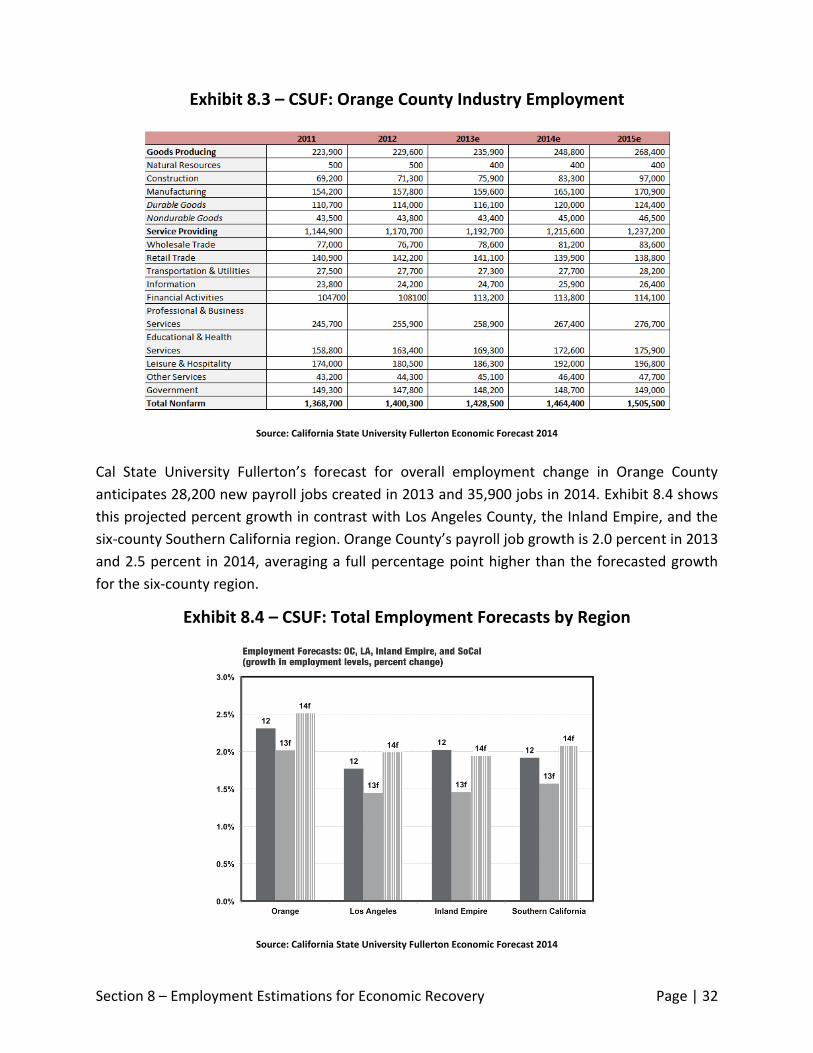
In its latest release, the Cal State University Fullerton Annual Economic Forecast analyzes
employment change for Orange County from 2011 through 2015 – beginning in the years just
following the end of the Recession. According to the figures projected in Exhibit 8.3, CSUF is
bullish on Construction, Durable Goods Manufacturing, and Information employment growth;
from 2012 to 2015, Construction employment is anticipated to grow by 36 percent, while
Durable Goods and Information are slated to grow by 9.1 percent. Aside from Natural
Resources, only Retail Trade is anticipated to decline in employment growth, falling by an
anticipated 2.4 percent from 2012 to 2015. CSUF anticipates Goods Producing to overshadow
Services in terms of percentage employment growth, rising by an estimated 16.9 percent from
2012 to 2015 compared to 5.7 anticipated growth. Total employment for 2014 is a forecasted
1.464 million workers, an estimate slightly below that of Chapman and LAEDC.
Section 8 – Employment Estimations for Economic Recovery Page | 32
Cal State University Fullerton’s forecast for overall employment change in Orange County
anticipates 28,200 new payroll jobs created in 2013 and 35,900 jobs in 2014. Exhibit 8.4 shows
this projected percent growth in contrast with Los Angeles County, the Inland Empire, and the
six-county Southern California region. Orange County’s payroll job growth is 2.0 percent in 2013
and 2.5 percent in 2014, averaging a full percentage point higher than the forecasted growth
for the six-county region.
Exhibit 8.3 – CSUF: Orange County Industry Employment
Source: California State University Fullerton Economic Forecast 2014
Source: California State University Fullerton Economic Forecast 2014
Exhibit 8.4 – CSUF: Total Employment Forecasts by Region

Section 8 – Employment Estimations for Economic Recovery Page | 33
An important distinction to make is that the above analyses concern nonfarm employment,
sometimes called payroll employment, which also excludes self-employed individuals. Many
Orange County residents have transitioned to contracted or entrepreneurial work in response
to the Great Recession’s negative impact on traditional employer hiring habits. Comparing total
employment in the labor force to nonfarm employment, Orange County’s total employment
will fully recover much sooner than diagnosed by nonfarm employment forecasts. Exhibit 8.5
shows both of these employment totals side by side, and also demonstrates in what year each
is estimated to return to its pre-Recession state. The gap between nonfarm employment and
total employment widened significantly from 2008 onward, demonstrating a larger
concentration of the labor force migrating to non-payroll means of employment. While
nonfarm employment is scheduled to recover between 2015 and 2016, total employment
including self-employed and contracted workers may recover as soon as 2014.
Answering when Orange County will recover its lost employment following the Great Recession
is a multifaceted question. While aggregate employment is on track to reach 2007 levels within
the next two years, individual recovery in each industry widely varies – some have already
achieved pre-Recession employment, while other may never truly regain their former size.
Regardless, Orange County is growing where it is most important: in its key industries that
differentiate the region and that may help pull forward additional recovery in lagging industries
faster than anticipated.
1,000,000
1,100,000
1,200,000
1,300,000
1,400,000
1,500,000
1,600,000
1,700,000
2006 2007 2008 2009 2010 2011 2012 2013 2014 2015 2016
Exhibit 8.5 - Orange County Employment Forecast: Total Employment vs. Total Nonfarm
Total Employment Total Nonfarm/Payroll Employment
Source: OCBC Analysis
Section 9 – Other Predictions for Post-Recession Recovery Page | 34
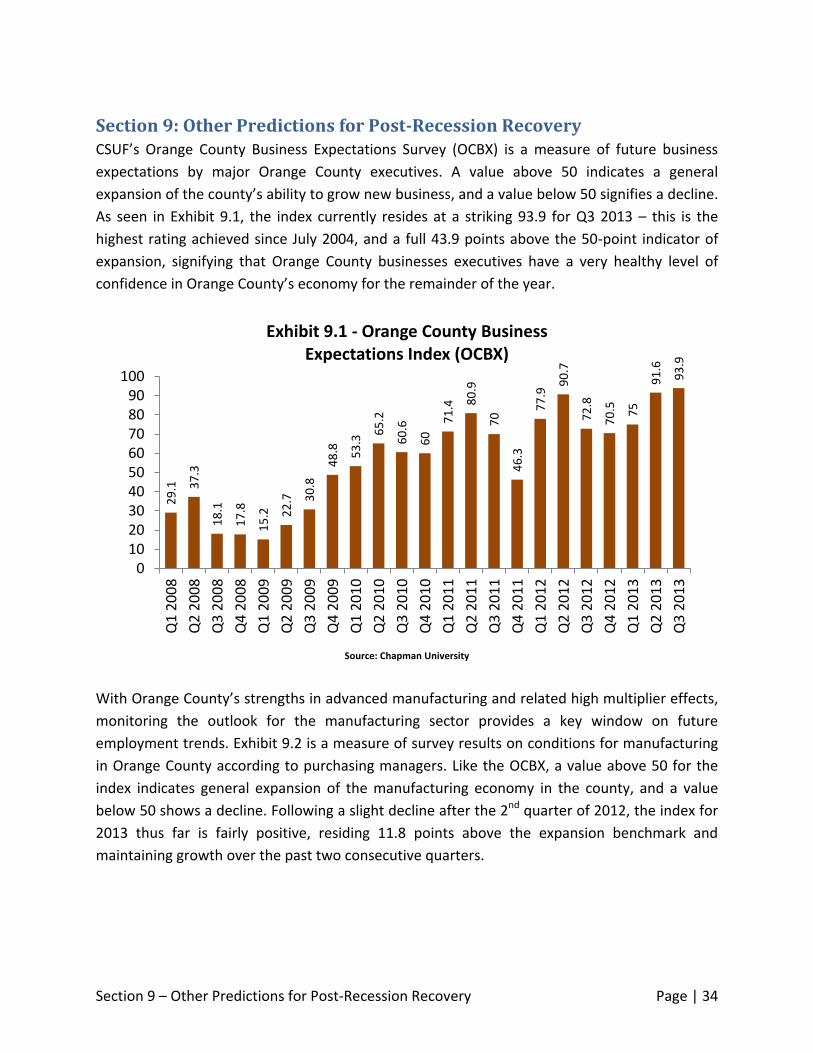
Section 9: Other Predictions for Post-Recession Recovery CSUF’s Orange County Business Expectations Survey (OCBX) is a measure of future business
expectations by major Orange County executives. A value above 50 indicates a general
expansion of the county’s ability to grow new business, and a value below 50 signifies a decline.
As seen in Exhibit 9.1, the index currently resides at a striking 93.9 for Q3 2013 – this is the
highest rating achieved since July 2004, and a full 43.9 points above the 50-point indicator of
expansion, signifying that Orange County businesses executives have a very healthy level of
confidence in Orange County’s economy for the remainder of the year.
With Orange County’s strengths in advanced manufacturing and related high multiplier effects,
monitoring the outlook for the manufacturing sector provides a key window on future
employment trends. Exhibit 9.2 is a measure of survey results on conditions for manufacturing
in Orange County according to purchasing managers. Like the OCBX, a value above 50 for the
index indicates general expansion of the manufacturing economy in the county, and a value
below 50 shows a decline. Following a slight decline after the 2nd quarter of 2012, the index for
2013 thus far is fairly positive, residing 11.8 points above the expansion benchmark and
maintaining growth over the past two consecutive quarters.
29
.1
37
.3
18
.1
17
.8
15
.2
22
.7
30
.8
48
.8
53
.3 65
.2
60
.6
60
71
.4 80
.9
70
46
.3
77
.9 9
0.7
72
.8
70
.5
75
91
.6
93
.9
0102030405060708090
100
Q1
20
08
Q2
20
08
Q3
20
08
Q4
20
08
Q1
20
09
Q2
20
09
Q3
20
09
Q4
20
09
Q1
20
10
Q2
20
10
Q3
20
10
Q4
20
10
Q1
20
11
Q2
20
11
Q3
20
11
Q4
20
11
Q1
20
12
Q2
20
12
Q3
20
12
Q4
20
12
Q1
20
13
Q2
20
13
Q3
20
13
Exhibit 9.1 - Orange County Business Expectations Index (OCBX)
Source: Chapman University

Section 9 – Other Predictions for Post-Recession Recovery Page | 35
Where will employment growth stem from through the end of 2013? The LAEDC’s assessment
of Orange County’s job gains falls in line with post-recession growth since 2012 – driven
primarily by Leisure & Hospitality, Construction, and Health Services. These figures capture
absolute growth instead of percent growth, and again demonstrate the ever-present industry
clusters involving business and tourism indicative of the county.
54
.8
52
.2
47
.0
48
.9
45
.1
40
.6
33
.9
40
.3
50
.2
50
.0
58
.9
62
.2
61
.7
61
.9
60
.9
65
.0
59
.3
60
.9
60
.2
65
.9
53
.1
54
.6
50
.0
59
.7
61
.8
0102030405060708090
1003
rd 2
00
7
4th
20
07
1st
20
08
2n
d 2
00
8
3rd
20
08
4th
20
08
1st
20
09
2n
d 2
00
9
3rd
20
09
4th
20
09
1st
20
10
2n
d 2
01
0
3rd
20
10
4th
20
10
1st
20
11
2n
d 2
01
1
3rd
20
11
4th
20
11
1st
20
12
2n
d 2
01
2
3rd
20
12
4th
20
12
1st
20
13
2n
d 2
01
3
3rd
20
13
Exhibit 9.2 - Orange County Manufacturing Composite Index
Exhibit 9.3 – Orange County Employment Growth,
2013 Forecast, in Thousands of Jobs
2013 Forecast
Source: Chapman University
Source: LAEDC 2013 Midyear Economic Forecast
Section 9 – Other Predictions for Post-Recession Recovery Page | 36
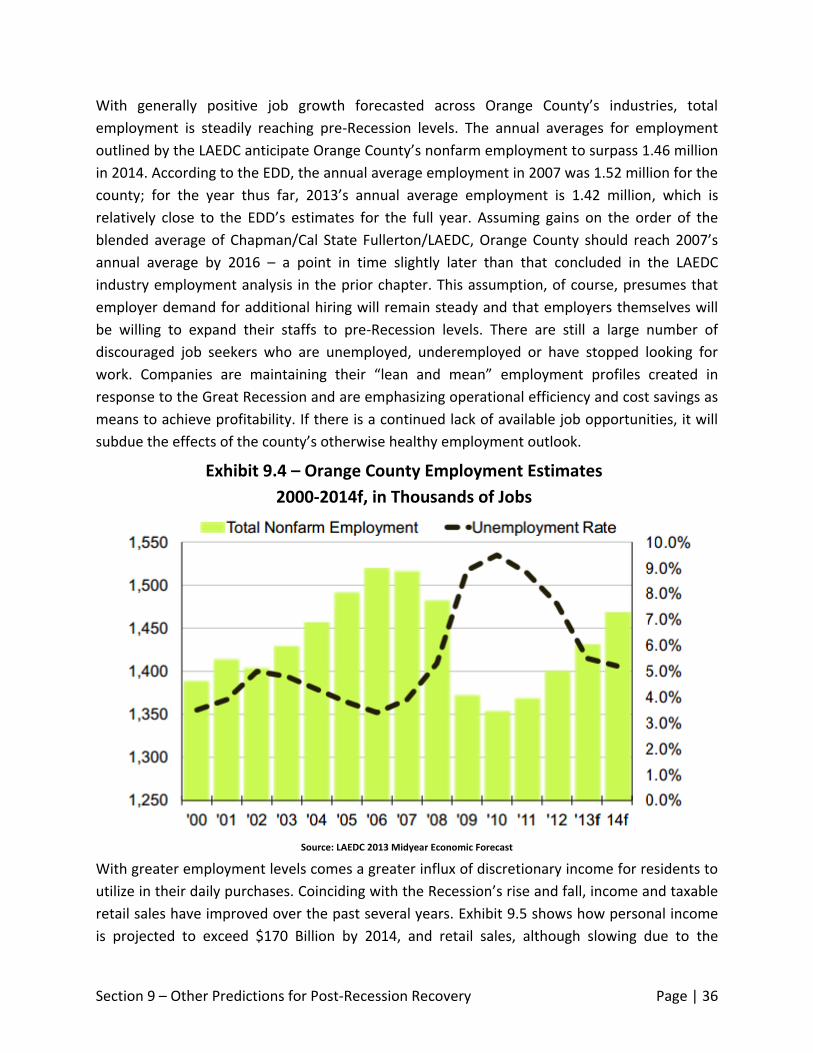
With generally positive job growth forecasted across Orange County’s industries, total
employment is steadily reaching pre-Recession levels. The annual averages for employment
outlined by the LAEDC anticipate Orange County’s nonfarm employment to surpass 1.46 million
in 2014. According to the EDD, the annual average employment in 2007 was 1.52 million for the
county; for the year thus far, 2013’s annual average employment is 1.42 million, which is
relatively close to the EDD’s estimates for the full year. Assuming gains on the order of the
blended average of Chapman/Cal State Fullerton/LAEDC, Orange County should reach 2007’s
annual average by 2016 – a point in time slightly later than that concluded in the LAEDC
industry employment analysis in the prior chapter. This assumption, of course, presumes that
employer demand for additional hiring will remain steady and that employers themselves will
be willing to expand their staffs to pre-Recession levels. There are still a large number of
discouraged job seekers who are unemployed, underemployed or have stopped looking for
work. Companies are maintaining their “lean and mean” employment profiles created in
response to the Great Recession and are emphasizing operational efficiency and cost savings as
means to achieve profitability. If there is a continued lack of available job opportunities, it will
subdue the effects of the county’s otherwise healthy employment outlook.
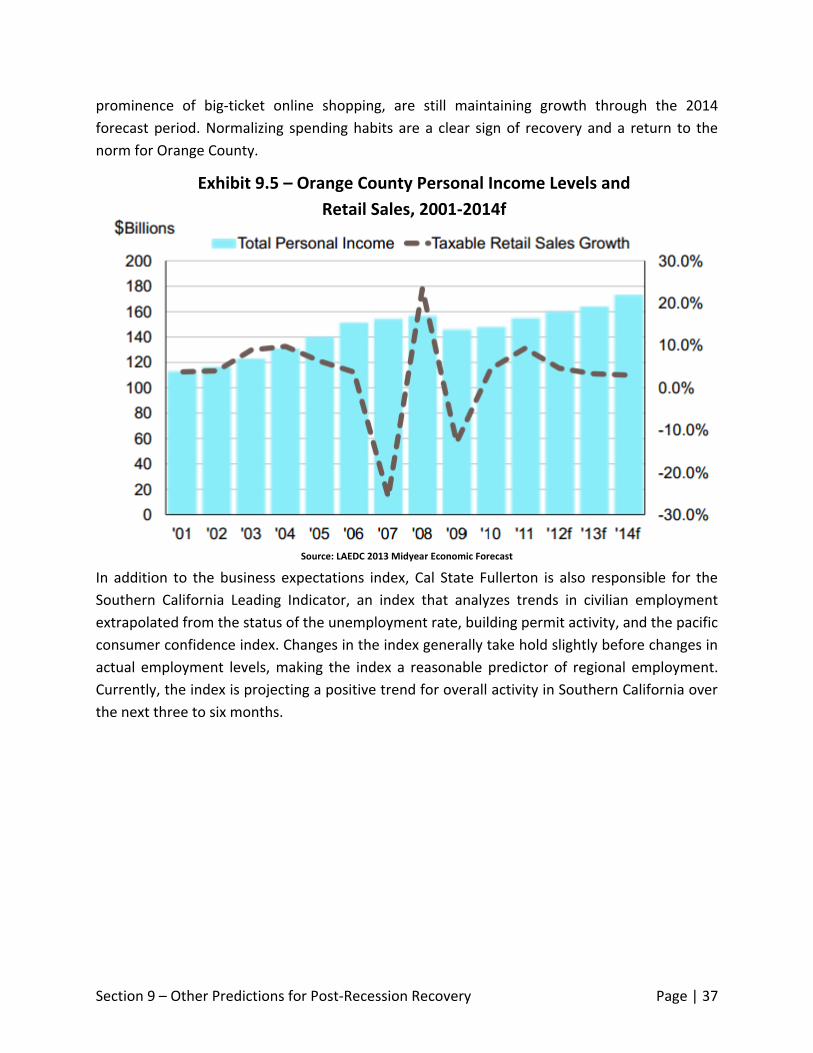
With greater employment levels comes a greater influx of discretionary income for residents to
utilize in their daily purchases. Coinciding with the Recession’s rise and fall, income and taxable
retail sales have improved over the past several years. Exhibit 9.5 shows how personal income
is projected to exceed $170 Billion by 2014, and retail sales, although slowing due to the
Exhibit 9.4 – Orange County Employment Estimates
2000-2014f, in Thousands of Jobs
Source: LAEDC 2013 Midyear Economic Forecast
Section 9 – Other Predictions for Post-Recession Recovery Page | 37
prominence of big-ticket online shopping, are still maintaining growth through the 2014
forecast period. Normalizing spending habits are a clear sign of recovery and a return to the
norm for Orange County.
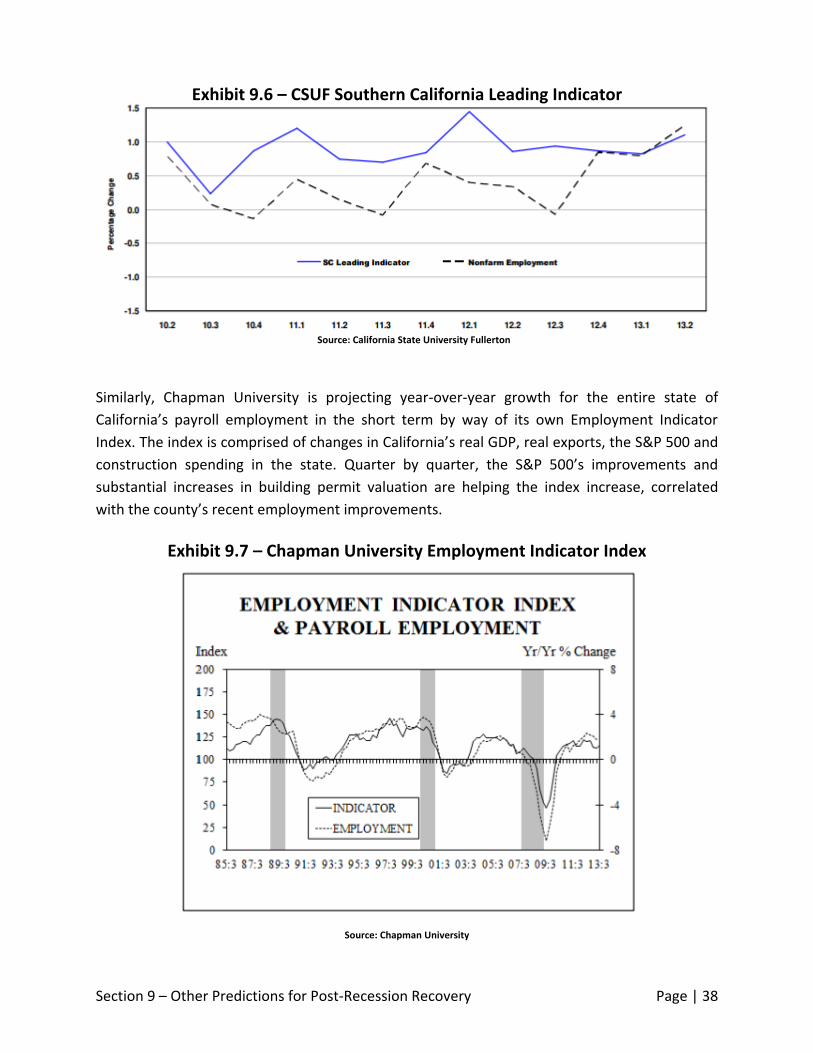
In addition to the business expectations index, Cal State Fullerton is also responsible for the
Southern California Leading Indicator, an index that analyzes trends in civilian employment
extrapolated from the status of the unemployment rate, building permit activity, and the pacific
consumer confidence index. Changes in the index generally take hold slightly before changes in
actual employment levels, making the index a reasonable predictor of regional employment.
Currently, the index is projecting a positive trend for overall activity in Southern California over
the next three to six months.
Exhibit 9.5 – Orange County Personal Income Levels and
Retail Sales, 2001-2014f
Source: LAEDC 2013 Midyear Economic Forecast
Section 9 – Other Predictions for Post-Recession Recovery Page | 38
Similarly, Chapman University is projecting year-over-year growth for the entire state of
California’s payroll employment in the short term by way of its own Employment Indicator
Index. The index is comprised of changes in California’s real GDP, real exports, the S&P 500 and
construction spending in the state. Quarter by quarter, the S&P 500’s improvements and
substantial increases in building permit valuation are helping the index increase, correlated
with the county’s recent employment improvements.
Exhibit 9.6 – CSUF Southern California Leading Indicator
Exhibit 9.7 – Chapman University Employment Indicator Index
Source: California State University Fullerton
Source: Chapman University
Section 9 – Other Predictions for Post-Recession Recovery Page | 39
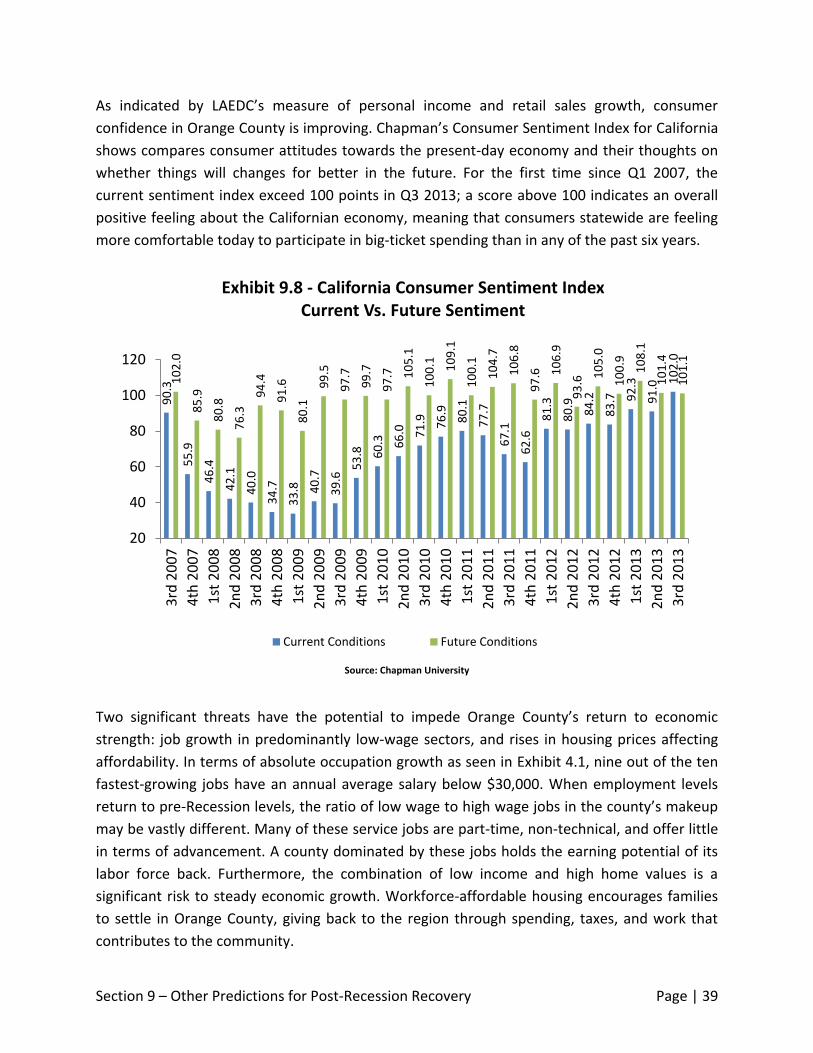
As indicated by LAEDC’s measure of personal income and retail sales growth, consumer
confidence in Orange County is improving. Chapman’s Consumer Sentiment Index for California
shows compares consumer attitudes towards the present-day economy and their thoughts on
whether things will changes for better in the future. For the first time since Q1 2007, the
current sentiment index exceed 100 points in Q3 2013; a score above 100 indicates an overall
positive feeling about the Californian economy, meaning that consumers statewide are feeling
more comfortable today to participate in big-ticket spending than in any of the past six years.
Two significant threats have the potential to impede Orange County’s return to economic
strength: job growth in predominantly low-wage sectors, and rises in housing prices affecting
affordability. In terms of absolute occupation growth as seen in Exhibit 4.1, nine out of the ten
fastest-growing jobs have an annual average salary below $30,000. When employment levels
return to pre-Recession levels, the ratio of low wage to high wage jobs in the county’s makeup
may be vastly different. Many of these service jobs are part-time, non-technical, and offer little
in terms of advancement. A county dominated by these jobs holds the earning potential of its
labor force back. Furthermore, the combination of low income and high home values is a
significant risk to steady economic growth. Workforce-affordable housing encourages families
to settle in Orange County, giving back to the region through spending, taxes, and work that
contributes to the community.
90
.3
55
.9
46
.4
42
.1
40
.0
34
.7
33
.8
40
.7
39
.6 5
3.8
60
.3
66
.0
71
.9
76
.9
80
.1
77
.7
67
.1
62
.6
81
.3
80
.9
84
.2
83
.7
92
.3
91
.0 10
2.0
10
2.0
85
.9
80
.8
76
.3
94
.4
91
.6
80
.1
99
.5
97
.7
99
.7
97
.7
10
5.1
10
0.1
10
9.1
10
0.1
10
4.7
10
6.8
97
.6
10
6.9
93
.6 10
5.0
10
0.9
10
8.1
10
1.4
10
1.1
20
40
60
80
100
120
3rd
20
07
4th
20
07
1st
20
08
2n
d 2
00
8
3rd
20
08
4th
20
08
1st
20
09
2n
d 2
00
9
3rd
20
09
4th
20
09
1st
20
10
2n
d 2
01
0
3rd
20
10
4th
20
10
1st
20
11
2n
d 2
01
1
3rd
20
11
4th
20
11
1st
20
12
2n
d 2
01
2
3rd
20
12
4th
20
12
1st
20
13
2n
d 2
01
3
3rd
20
13
Exhibit 9.8 - California Consumer Sentiment Index Current Vs. Future Sentiment
Current Conditions Future Conditions
Source: Chapman University

Section 9 – Other Predictions for Post-Recession Recovery Page | 40
In summation, Orange County’s outlook to achieve pre-Recession employment recovery
appears on track to occur in the 2014-2016 timeframe. Consumers and business executives
alike are united in reporting positive outlooks for the county’s economic growth and job
creation. Manufacturing improvement has a significant multiplier effect on employment in
other sectors, as does Construction with its ability to renew activity in commercial
development. The challenge for Orange County will be to maintain this positive push through
the next several years – improving the job pipeline from education to employment and
accommodating high-wage and/or emerging occupations will be critical in maintaining this
momentum. Should Orange County continue on its current trajectory, a full-scale recovery for
payroll employment could come within the next two to three years, and even sooner than that
for total employment.

Appendix – Other Estimates Page | 41
Appendix: EDD Job and Unemployment Estimates
1.8%
-0.7%
1.8% 1.9% 2.4% 1.9%
-0.2%
-2.2%
-7.4%
-1.3%
1.1% 2.3%
1.4% 2.1% 1.9% 1.8%
-8.00%
-6.00%
-4.00%
-2.00%
0.00%
2.00%
4.00%
Total Nonfarm Employment Job Growth 2001-2016e
Total Nonfarm Employment Job Growth (OC)
Total Nonfarm Employment Job Growth (CA)
3.5
%
4.0
%
5.0
%
4.8
%
4.3
%
3.8
%
3.4
%
3.9
%
5.3
%
8.9
%
9.5
%
8.8
%
7.6
%
6.3
%
5.6
%
5.1
%
4.6
%
0.0%
2.0%
4.0%
6.0%
8.0%
10.0%
12.0%
14.0%
Unemployment Rate 2000-2016e
Civilian Unemployment Rate (OC) Civilian Unemployment Rate (CA)
Source: California EDD
Source: California EDD