2013 risks and process of retirement survey report of findings
TRANSCRIPT

2013 Risks and Process of
Retirement Survey
Report of Findings
Sponsored by
The Society of Actuaries
Prepared by
Mathew Greenwald & Associates, Inc. December 2013
© 2013 Society of Actuaries, All Rights Reserved
The opinions expressed and conclusions reached by the authors are their own and do not represent any official position or opinion
of the Society of Actuaries or its members. The Society of Actuaries makes no representation or warranty to the accuracy of the
information.

© 2013 Society of Actuaries, All Rights Reserved Mathew Greenwald & Associates, Inc.
Page 1
TABLE OF CONTENTS
EXECUTIVE SUMMARY .......................................................................................................................... 2
INTRODUCTION & METHODOLOGY .................................................................................................... 5
STATISTICAL HIGHLIGHTS .................................................................................................................... 8
SURVEY FINDINGS ................................................................................................................................. 16
THE PROCESS OF RETIRING ............................................................................................................. 16
PHASES OF RETIREMENT ................................................................................................................. 39
PLANNING FOR RETIREMENT/FINANCIAL PLANNING ............................................................. 64
MANAGING RETIREMENT RISKS .................................................................................................... 90
TRENDED FINDINGS ............................................................................................................................ 115
PROFILE OF SURVEY RESPONDENTS .............................................................................................. 130
APPENDIX: POSTED QUESTIONNAIRE ............................................................................................ 133
TRENDED CORE QUESTIONS
Issues of Concern: 2013 Findings ............................................................................................................... 94
Issues of Concern: Trended Findings .......................................................................................... 121
Risk Management Strategies: 2013 Findings ............................................................................................ 105
Risk Management Strategies: Trended Findings ......................................................................... 126

© 2013 Society of Actuaries, All Rights Reserved Mathew Greenwald & Associates, Inc.
Page 2
EXECUTIVE SUMMARY
The Society of Actuaries (SOA) Survey of the Risks and Process of Retirement provides insights into
how Americans decide to retire, how they perceive post-retirement risks and how they manage financial
resources in retirement. This is the seventh in the SOA’s Surveys of the Risks and Process of Retirement
series. Unlike the first six surveys in this series that were conducted by telephone, this survey was
conducted via an online questionnaire. It was preceded earlier in 2013 by a series of eight retiree focus
groups that probed participants on their decision process for retiring and their views on managing assets
after retirement. The results of the focus groups were used to formulate certain questions for this survey
and provide additional context for the responses.
Since its inception almost 15 years ago, the SOA’s Committee on Post-Retirement Needs and Risks has
focused on improving the management of issues encountered after retirement. Of particular interest to the
committee are the retirement issues and decisions with which middle-income Americans grapple. To this
end, the committee has striven to understand how these Americans make decisions about retirement and
how they deal with its key financial risks. The committee has sponsored a significant body of research
that explores this area from a variety of approaches and perspectives. Results of these research efforts
have been communicated by the SOA to the public, plan sponsors, actuaries, public policymakers,
journalists, financial planners and other influential groups. The ultimate aim of these concerted efforts is
both to raise awareness of retirement risks and to educate the audience so as to help strengthen financial
security and the systems that support it.
This survey examines Americans ages 45 to 80 and includes both pre-retirees and retirees at various
income levels. The key focus, however, is on middle-income households and, consequently, the survey
does not oversample individuals with high levels of assets. Although some potential users of this survey
may be particularly interested in higher net worth individuals, the results are not necessarily indicative of
the decisions that would be made by these groups. This survey, like the previous ones, includes core
questions related to perceptions of a range of post-retirement risks and strategies used to manage them. It
also includes special emphasis on the process of retirement and expectations about changes encountered
during retirement. This report includes the survey questionnaire with a complete set of the responses to all
questions. It provides data summarized by gender, type of retirement coverage, age group and income
© 2013 Society of Actuaries, All Rights Reserved Mathew Greenwald & Associates, Inc.
Page 3
level. For each question, the overall results are provided, followed by the data by subgroups. The primary
purpose of this report is to present the complete statistical results of the survey with less emphasis on
commentary as to the underlying drivers of those results. Commentary will appear in a series of highlights
reports intended to supplement these results. These will include an overview report of the key results and
put them in context, a report on special issues for women, a report on risk management, and a report on
the phases of retirement. Results can be considered together with the focus group report, “The Decision to
Retire and Post-Retirement Financial Strategies: A Report on Eight Focus Groups,” which can be found
on the SOA website, www.soa.org.
Several major themes emerge in this survey. The exploration of the decision to retire is more in-depth
than in prior reports, and the 2013 focus group research from the SOA includes important new insights
about voluntary retirement. The explorations about risk perceptions and management are generally similar
to those incorporated into prior surveys, and the findings are generally consistent. The exploration with
regard to changes experienced during retirement expands on work done in 2005, and focuses on three new
issues: what changes are expected in functional capability with age, what Americans think about housing
and moving as part of retirement management, and what they think about their roles in assuming
caregiving. The Statistical Highlights section provides a summary of some of the key findings with
extensive detailed findings found in the body of the report. The findings are divided into four main topics:
the process of retirement, phases of retirement, planning for retirement, and managing risks.
Overall, this survey shows that older Americans can expect a challenging future. Some of the most
significant findings are as follows:
Pre-retiree expectations vs. actual experience: Pre-retiree expectations about retirement often differ
from retirees’ actual experience. For example, pre-retirees expect to retire later, at a median age of
65, whereas retirees actually retired at a median age of 58. Pre-retirees are more likely to say they will
work in retirement than retirees actually did. In addition, pre-retirees say they will do more financial
planning for retirement than retirees actually do.
How and when people retire: Many people retire involuntarily. And even when retirement is
described as voluntary, it is clear that many also feel they have been pushed into retirement. The
survey examines decision factors related to work, personal issues and finances. Many people not
forced to retire still feel pushed out of the workforce. The 2013 focus group research indicates that the
difference between a voluntary and involuntary decision to retire is not always clear and distinct.

© 2013 Society of Actuaries, All Rights Reserved Mathew Greenwald & Associates, Inc.
Page 4
Concerns about risk: As in prior iterations of the survey, pre-retirees exhibit a considerably higher
level of concern about most retirement risks than do retirees. Also consistent with previous years,
both pre-retirees and retirees most often say their top three concerns are inflation, paying for health
care costs, and long-term care.
Gaps in knowledge and planning: Gaps in knowledge and retirement preparation persist. For many
people, planning horizons are much shorter than the expected period of retirement. It is clear that not
enough people engage in long-term planning. Even though housing is the largest asset for many
middle-income households, housing alternatives are often not integrated into the retirement plan.
Social Security claiming strategies are very important to the many families who depend on Social
Security for all or most of their regular income in retirement. However, alternatives with regard to
claiming and the value of claiming benefits at different times are not well understood.
Risk management strategies: The financial and risk management approaches used by many pre-
retirees and retirees are not always the most sophisticated. Expense reduction and debt management
are the major strategies used to avoid running out of money and there is little use of financial risk
management products. The preferred spending strategy is to preserve principal and spend only
investment earnings and pension/Social Security income.
Expectations about changes during retirement: Retirees underestimate the likelihood of future
decline in their mental and physical capabilities. When combined with the failure to plan for the long
term, many will likely face challenges as their capabilities are compromised. Such changes lead to the
need for various forms of living assistance and caregiving needs. However, few families are planning
for these financial and lifestyle changes in advance of such needs.

© 2013 Society of Actuaries, All Rights Reserved Mathew Greenwald & Associates, Inc.
Page 5
INTRODUCTION & METHODOLOGY
This report presents the results of an online survey of Americans ages 45 to 80 conducted by Mathew
Greenwald & Associates, Inc. on behalf of the Society of Actuaries (SOA). The purpose of the study was
to evaluate Americans’ awareness of potential financial risks in retirement, how this awareness impacts
the management of their finances with respect to retirement, and how Americans are managing the
process of leaving the workforce.
This is the seventh study sponsored by the SOA that focuses on these issues. The first was conducted in
August 2001, before both the events of Sept. 11 and the subsequent significant declines in investment
markets. The second study was conducted in August 2003, the third in June/July 2005, the fourth in June
2007, the fifth in July 2009, and the sixth in July 2011. The latest study was conducted in August 2013,
during a period of slowly recovering housing values and employment. However, concerns about the
economy, public policy, the federal deficit, and programs for supporting retirement remained high.
The 2013 study includes some of the questions posed in the 2011 study and repeats some questions that
were asked in earlier iterations of the survey. Emphasis was placed on questions that focus on reasons for
retiring, retirement financial planning, and the stages of retirement. Areas of emphasis vary by year, so
this report should be considered together with reports from prior years. This report includes some of the
repeated questions in the section on trended findings. The same major themes and concerns are found in
repeated survey results.
However, a great deal of caution should be exercised when comparing specific numerical results of the
2013 study with the results from questions from earlier iterations of the survey. While the 2013 study was
conducted online, all previous studies in the series were conducted by telephone. A test comparing online
and telephone results for pre-retirees showed that telephone respondents were more likely than online
respondents to choose responses at the extremes of attitudinal scales and to respond in what they may
have perceived as socially more acceptable ways, such as providing later expected ages for retirement and
indicating that they have a financial plan for retirement income and spending. In addition, telephone
respondents are less likely than online respondents to select the “don’t know” response. Therefore, many
of the differences between the 2013 findings and the findings from previous years may be the result of the
© 2013 Society of Actuaries, All Rights Reserved Mathew Greenwald & Associates, Inc.
Page 6
change in survey mode rather than an indication of a true shift in attitudes or behavior of the pre-retiree
and retiree populations.
The questionnaire for the study was designed by Greenwald & Associates, in cooperation with the SOA
Committee on Post-Retirement Needs and Risks and its Project Oversight Group appointed by that
committee. A total of 2,000 interviews (1,000 pre-retirees and 1,000 retirees) lasting an average of 20
minutes were conducted using Research Now’s online consumer panel, from Aug. 19 through Aug. 28,
2013. Respondents born between 1933 and 1968 qualified for participation in the study. An additional
200 interviews were conducted among retired widows, and results for these widows are presented in the
report where these results differ meaningfully from the results for retirees overall.
As in previous iterations, respondents were classified as retirees if they described their employment status
as retiree, had retired from a previous career, or were not currently employed and were either age 65 or
older or had a retired spouse. All other respondents were classified as pre-retirees. The questions to
determine retiree or pre-retiree status were asked early in the questionnaire.
This study includes pre-retirees and retirees at all income levels. No effort has been made to oversample
individuals with high levels of assets. Five percent of pre-retirees and 12 percent of retirees report having
investable assets of $1 million or more.
The sample data are weighted by age, sex, and census region to the 2012 population estimates released by
the Census Bureau in July 2013. Additional details about the weighting procedure are available upon
request.
No theoretical basis exists for judging the accuracy of estimates obtained from non-probability samples,
such as the online sample used for this survey. Most online samples are considered non-probability
samples because selection is not random and the probability that an individual from the target population
will be included is unknown. However, there are possible sources of error in all surveys (both probability
and non-probability) that may affect the reliability of survey results. These include imperfect sampling
frames, refusals to be interviewed and other forms of nonresponse, the effects of question wording and
question order, interviewer bias, and screening. While attempts are made to minimize these factors, it is
impossible to quantify the errors that may result from them.

© 2013 Society of Actuaries, All Rights Reserved Mathew Greenwald & Associates, Inc.
Page 7
This report was prepared by Greenwald and Associates and its content is the responsibility of the firm.
Following this introduction is an overview of the statistical highlights of the report. Page numbers are
included for each of the highlighted findings so that the corresponding survey results can be easily located
in the body of the report. The subsequent section presents the survey findings for each question asked on
the survey. Findings for each question are also broken out for both pre-retirees and retirees by gender,
household income, age, and presence of defined-contribution and defined-benefit plans. This is followed
by a comparison of the 2013 results to the results from previous iterations of the study (where available)
and a demographic profile of the survey respondents. A posted questionnaire, which lists all of the survey
questions and tabulated responses, is appended to the end of the report. As with the Statistical Highlights
section, page numbers for locating more detailed survey results are included in the posted questionnaire.
Data presented in this report may not total to 100 percent due to rounding or missing categories.
© 2013 Society of Actuaries, All Rights Reserved Mathew Greenwald & Associates, Inc.
Page 8
STATISTICAL HIGHLIGHTS
THE PROCESS OF RETIRING
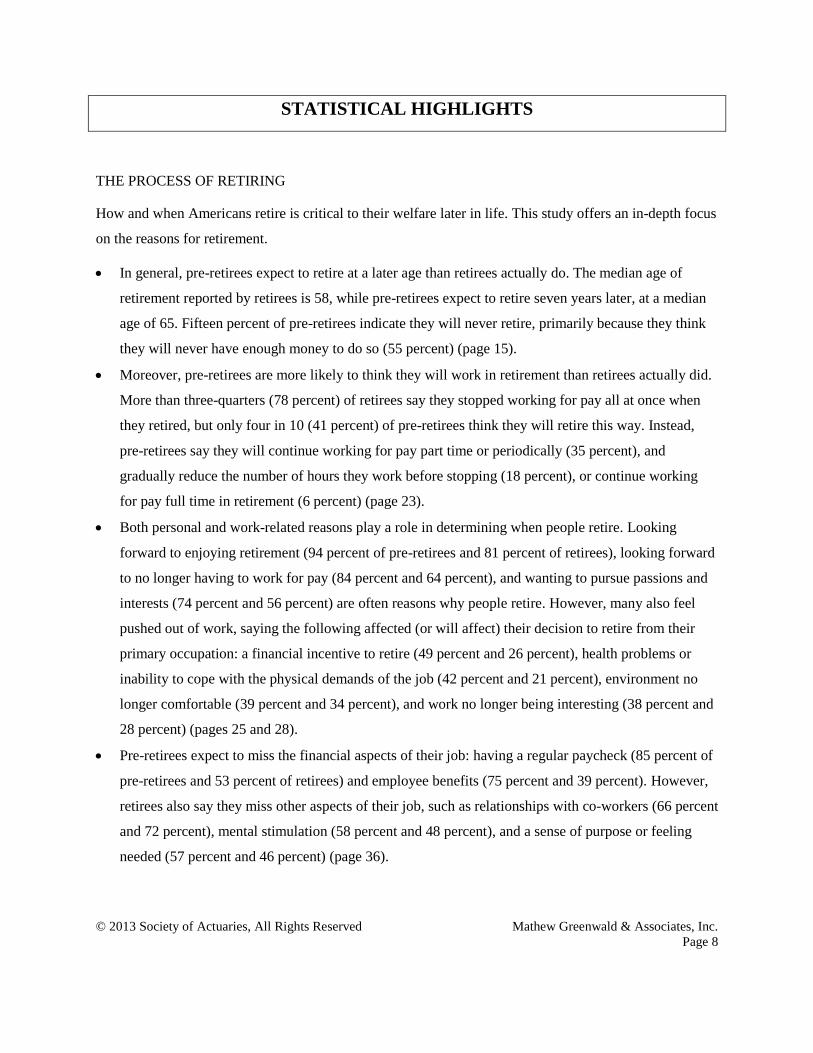
How and when Americans retire is critical to their welfare later in life. This study offers an in-depth focus
on the reasons for retirement.
In general, pre-retirees expect to retire at a later age than retirees actually do. The median age of
retirement reported by retirees is 58, while pre-retirees expect to retire seven years later, at a median
age of 65. Fifteen percent of pre-retirees indicate they will never retire, primarily because they think
they will never have enough money to do so (55 percent) (page 15).
Moreover, pre-retirees are more likely to think they will work in retirement than retirees actually did.
More than three-quarters (78 percent) of retirees say they stopped working for pay all at once when
they retired, but only four in 10 (41 percent) of pre-retirees think they will retire this way. Instead,
pre-retirees say they will continue working for pay part time or periodically (35 percent), and
gradually reduce the number of hours they work before stopping (18 percent), or continue working
for pay full time in retirement (6 percent) (page 23).
Both personal and work-related reasons play a role in determining when people retire. Looking
forward to enjoying retirement (94 percent of pre-retirees and 81 percent of retirees), looking forward
to no longer having to work for pay (84 percent and 64 percent), and wanting to pursue passions and
interests (74 percent and 56 percent) are often reasons why people retire. However, many also feel
pushed out of work, saying the following affected (or will affect) their decision to retire from their
primary occupation: a financial incentive to retire (49 percent and 26 percent), health problems or
inability to cope with the physical demands of the job (42 percent and 21 percent), environment no
longer comfortable (39 percent and 34 percent), and work no longer being interesting (38 percent and
28 percent) (pages 25 and 28).
Pre-retirees expect to miss the financial aspects of their job: having a regular paycheck (85 percent of
pre-retirees and 53 percent of retirees) and employee benefits (75 percent and 39 percent). However,
retirees also say they miss other aspects of their job, such as relationships with co-workers (66 percent
and 72 percent), mental stimulation (58 percent and 48 percent), and a sense of purpose or feeling
needed (57 percent and 46 percent) (page 36).

© 2013 Society of Actuaries, All Rights Reserved Mathew Greenwald & Associates, Inc.
Page 9
The results on the Process of Retirement should be considered together with the findings of the recent
Society of Actuaries sponsored focus group study, “The Decision to Retire and Post-Retirement
Financial Strategies: A Report on Eight Focus Groups.”
THE PHASES OF RETIREMENT
One of the important considerations in focusing on post-retirement is how abilities and lifestyle change
during that period. The questions in the section of the survey on phases of retirement include a number of
new questions and supplement work done on this topic in the 2005 survey.
Despite the fact physical and mental decline are often inevitable consequences of aging, many,
particularly among retirees, do not believe these things will ever happen to them. In particular, sizable
percentages say they will never become less able to manage their money (38 percent of pre-retirees
and 54 percent of retirees), mentally unable to work (34 percent and 46 percent), unable to drive (19
percent and 33 percent), less able to provide caregiving (15 percent and 30 percent), and less able to
do household chores (18 percent and 28 percent). In addition, 23 percent of married pre-retirees and
32 percent of married retirees report they will never lose their spouse (page 39).
Few have made plans for how they would respond if these changes were to occur. Only about one-
quarter (23 percent) of married pre-retirees and three in 10 (31 percent) married retirees have made
plans for the loss of their spouse or partner. Similarly, fewer have made plans in case they are less
able to manage their money (15 percent of pre-retirees and 31 percent of retirees), are physically no
longer able to work (15 percent and 29 percent), are no longer able to do household chores (10
percent and 23 percent), or are less able to move around (10 percent and 24 percent) (page 42).
While a large majority wish to remain in their primary home, both pre-retirees and retirees foresee a
number of factors that might eventually cause them to leave, including reduced responsibility for
upkeep and maintenance (77 percent of pre-retirees and 74 percent of retirees), health or physical
disability (76 percent and 78 percent), changed needs if they lose their spouse (75 percent and 78
percent, among those married), reduced housing expenses (75 percent and 61 percent), and more
suitable layout (70 percent and 60 percent). Retired widows are more likely than either pre-retirees or
retirees to see themselves moving to tap into the equity in their home (77 percent), for better climate
(76 percent), better access to services, transportation or support (70 percent), or better access to
friends or activities (69 percent) (page 60).

© 2013 Society of Actuaries, All Rights Reserved Mathew Greenwald & Associates, Inc.
Page 10
Approximately one in seven pre-retirees (14 percent) and retirees (15 percent) say they have used
household assets to help pay for caregiving for a relative or friend (other than a spouse/partner).
However, one-third (32 percent) of pre-retirees and one-quarter (26 percent) of retirees indicate they
are likely to use household assets to help pay for caregiving in the future (pages 48 and 50).
PLANNING FOR RETIREMENT/FINANCIAL PLANNING
During retirement, the income sources that most people rely on before retirement are no longer available.
For some people, retirement will last 30 or even 40 years so planning is very important. A focus of the
survey is to understand how people plan.
Both pre-retirees and retirees report a median planning horizon of 10 years, although 17 percent of
pre-retirees and 18 percent of retirees say their planning horizon is 20 years or more. Seven percent of
pre-retirees and 8 percent of retirees indicate they do not plan ahead, while more than one-quarter say
they have not thought about it (27 percent of pre-retirees and 29 percent of retirees) (page 65).
A determination of ability to pay monthly bills appears to be the primary financial planning input into
the decision to retire. Almost nine in 10 pre-retirees (87 percent) and three-quarters (73 percent) of
retirees report this determination will affect or has affected their decision to retire a great deal or
somewhat (page 72).
Other financial planning considerations appear to have less impact, including the determination that
sufficient funds have been accumulated (87 percent of pre-retirees and 59 percent of retirees),
becoming eligible for Social Security (76 percent and 42 percent), becoming eligible for Medicare or
retiree health benefits (73 percent and 36 percent), and becoming eligible for benefits from a
traditional pension or defined-benefit plan (69 percent and 51 percent) (page 72).
Nevertheless, four in 10 say they try to plan for as many possibilities as they can when managing their
finances in retirement (43 percent of pre-retirees and 41 percent of retirees), and 46 percent of pre-
retirees and retirees report they try to plan for the things they know are likely to happen (page 75).
While 45 percent of pre-retirees and 58 percent of retirees think it is very possible to plan for day-to-
day expenses, they are less likely to think it very possible to plan for other issues in retirement. Only
three in 10 think it is very possible to plan for changes in finances resulting from the death of a
spouse (27 percent of married pre-retirees and 35 percent of married retirees). Fewer think it possible
to plan for health care expenses (22 percent of pre-retirees and 33 percent of retirees), longevity (18
percent and 25 percent), and long-term care expenses (19 percent and 27 percent) (page 78).

© 2013 Society of Actuaries, All Rights Reserved Mathew Greenwald & Associates, Inc.
Page 11
Despite the fact that few think it very possible to plan for the financial consequences of the death of a
spouse, a majority of married pre-retirees and retirees state they have planned a great deal or
moderately to ensure adequate assets and income for the surviving spouse (62 percent of pre-retirees
and 79 percent of retirees), management of day-to-day finances (52 percent and 73 percent), and
adequate, affordable and manageable housing (50 percent and 68 percent). Interestingly, however,
retired widows indicate they did not plan quite so well as currently married retirees claim to have
done. Only 62 percent of retired widows say they had planned for adequate assets and income, 66
percent planned for day-to-day expenses, and 59 percent planned for housing (page 81).
Regular use of a financial planner or adviser appears to double after retirement. Twenty-five percent
of retirees report consulting with a financial planner or adviser regularly, compared with 13 percent of
pre-retirees (page 87).
MANAGING RETIREMENT RISKS
Retirees are faced with many different risks over a long period of time. A major goal of these studies is to
understand how retirees perceive post-retirement risks and which ones they view as most important.
Perhaps because retirement is still in their future, pre-retirees exhibit far more concern about their
finances in retirement than do retirees. Nearly two-thirds (64 percent) of pre-retirees, but only about
four in 10 retirees (43 percent) report they are very or somewhat concerned about their finances in the
five years after retirement (if pre-retiree) or their current finances (if retiree). Similarly, three-quarters
(76 percent) of pre-retirees, but only half (49 percent) of retirees indicate they are concerned about
their long-term financial future (pages 89 and 91).
Pre-retirees are also more likely than retirees to express concern about various retirement risks.
Nevertheless, key concerns for both pre-retirees and retirees are inflation (77 percent of pre-retirees
and 58 percent of retirees), being able to afford adequate health care (73 percent and 46 percent), and
being able to afford long-term care (68 percent and 52 percent). Pre-retirees also express a high level
of concern about depleting their savings (66 percent and 41 percent) and maintaining a reasonable
standard of living (65 percent and 41 percent) (page 93).
Although nearly half of pre-retirees (48 percent) and retirees (49 percent) report knowing someone in
their family who lived past age 90, most do not expect to live that long. In general, pre-retirees predict
they will live to age 85 (median), while retirees predict they will live to age 86 (median). At the same

© 2013 Society of Actuaries, All Rights Reserved Mathew Greenwald & Associates, Inc.
Page 12
time, 28 percent of pre-retirees and 37 percent of retirees are unwilling to offer an estimate of their
longevity (pages 100 and 102).
Pre-retirees and retirees continue to rely on reducing spending, increasing savings, and debt reduction
to manage retirement risks. Almost all say they have already eliminated or plan to eliminate their
consumer debt (95 percent of pre-retirees and 92 percent of retirees), and almost nine in 10
homeowners indicate they have already paid off or plan to completely pay off their mortgage (88
percent and 86 percent). Large majorities also plan to try or already have tried to save as much money
as possible (93 percent and 81 percent) and cut back on spending (88 percent and 76 percent) (page
104).
Nearly three-quarters (73 percent) of pre-retirees plan to work in retirement as a risk management
strategy, while half (49 percent) plan to or have postponed retirement. In contrast, just 37 percent of
retirees report using the work-in-retirement strategy, while only 16 percent try to postpone retirement,
perhaps in anticipation of an unplanned early retirement (page 104).
Risk pooling strategies for managing financial risks are less popular. Only about one-third have
already purchased a product or chosen (or plan to purchase or choose) an employer plan option that
will provide them with guaranteed income for life (38 percent of retirees and 33 percent of pre-
retirees). Moreover, while half (52 percent) of pre-retirees say they will postpone taking Social
Security, just 23 percent of retirees report having already turned to this strategy (page 104).
DIFFERENCES BY POPULATION SUBGROUP
This section summarizes meaningful differences by population subgroup. Detailed tabulations by
subgroup are shown in the subsequent sections describing individual questions.
Differences by Gender
Among both pre-retirees and retirees, women are more likely than men to say that caregiving
responsibilities will affect or did affect their decision to retire (page 26). In addition, women are more
likely than men to report they will spend or did spend at least an hour a week in retirement providing
caregiving for a spouse/partner, children or grandchildren, other relatives, and others not related to
them (page 47).
Retiree females are more apt than males to plan to grow their financial assets in retirement by saving
more or not withdrawing earnings (page 70). They are also more apt to be already cutting back on
spending to protect themselves financially (page 107).

© 2013 Society of Actuaries, All Rights Reserved Mathew Greenwald & Associates, Inc.
Page 13
While men tend to spend more years in full-time employment, female pre-retirees are more likely
than male pre-retirees to think they will miss multiple aspects of their job when they retire, such as a
sense of purpose or feeling needed, the mental stimulation, having structure to their day, and a regular
paycheck (page 36).
Moreover, female pre-retirees are more likely than male pre-retirees to express concern about their
finances in the early stages of retirement and long term and about specific retirement risks. These
include inflation, having enough money for adequate health care, depleting their savings, and
maintaining a reasonable standard of living (page 96).
Female retirees are more apt than male retirees to have considered and planned for changes in their
mental and physical abilities (page 43). They are also more likely to turn to services provided through
a senior housing community or paid help purchased independently for assistance and support (page
85).
Differences by Household Income
Differences in responses by household income status reveal few surprises. On average, pre-retirees
with lower household income plan to retire at an older age than those with higher income. Lower-
income pre-retirees are also more likely than higher-income pre-retirees to state they do not expect to
retire. Similarly, lower-income retirees tend to have retired at a slightly older age than did higher-
income retirees (page 16).
Pre-retirees with household income under $100,000 are more likely than their higher-income
counterparts to say they will retire due to health or disability issues, while pre-retirees with income of
at least $100,000 are more apt to indicate they will retire because the work will no longer be
interesting or because they will no longer want to deal with travel. Higher-income retirees are more
apt than lower-income retirees to say they were given a financial incentive to retire (page 29).
Among pre-retirees and retirees, the propensity to think it is possible to plan for retirement risks, such
as the death of a spouse and longevity, is greater among those with higher household income (page
79).
As in previous years, both retirees and pre-retirees with lower household income are more likely than
those with higher income to be concerned about most retirement risks (page 97).
Affluent retirees and pre-retirees tend to use different risk management strategies than do those who
are less affluent. Cutting back on spending is a preferred strategy among those with lower household

© 2013 Society of Actuaries, All Rights Reserved Mathew Greenwald & Associates, Inc.
Page 14
income, while the probability of eliminating consumer debt, saving as much as possible, investing in
stocks or stock mutual funds, moving assets into more conservative investments, or paying off the
primary home mortgage increases as household income or assets increase (page 108).
Differences by Age
Differences in responses by age, particularly among pre-retirees, tend to mirror differences between
pre-retirees and retirees. For example, just as retirees are more likely than pre-retirees to have
considered and made plans for dealing with some retirement risks, older pre-retirees are more likely
than their younger counterparts to report they have considered and made plans for such possibilities
as being unable to manage their money and becoming physically unable to work (page 44).
Younger retirees are more likely than older retirees to indicate they are very or somewhat concerned
about inflation, health care, long-term care, and other retirement risks. Similarly, younger pre-retirees
are more apt than their older counterparts to say they are concerned about health care, depleting
savings, and maintaining a reasonable standard of living (page 98).
Differences by Participation in Employer-Provided Retirement Plans
Among both retirees and pre-retirees, the likelihood of reporting income or money from one or more
defined-benefit or defined-contribution plans increases as household income increases. Therefore,
differences by participation in employer-provided retirement plans generally mirror differences by
household income (page 110).
Pre-retirees and retirees with benefits from a defined-benefit or contribution plan are more likely than
those without one to expect or to have received a financial incentive to retire. Pre-retirees with a
defined-contribution plan are less likely to think they will retire due to poor health or disability (page
30).
Just as the likelihood of planning for income and assets increases with household income, it is also
higher for those with a retirement plan than for those without (page 64).
Of particular note, both retirees and pre-retirees who did not receive or do not expect to receive
income or money from a defined-benefit plan are more likely than those with or expecting this benefit
to be very or somewhat concerned about having enough money to pay for adequate health care. They

© 2013 Society of Actuaries, All Rights Reserved Mathew Greenwald & Associates, Inc.
Page 15
also tend to be more likely to express concern about other retirement risks such as depleting savings
and maintaining a reasonable standard of living (page 99).
Perhaps not surprisingly, pre-retirees and retirees with benefits from a defined-contribution plan are
more likely than those without this benefit to indicate they have invested in equities as a risk
management strategy (page 110). Retirees with a defined-contribution plan are also more likely than
their counterparts without one to have already eliminated their consumer debt (page 110), while pre-
retirees with a defined-contribution plan are more likely to have consulted a financial professional
(page 88).

© 2013 Society of Actuaries, All Rights Reserved Mathew Greenwald & Associates, Inc.
Page 16
SURVEY FINDINGS
THE PROCESS OF RETIRING
How and when Americans retire is critical to their welfare later in life. This section examines when
people retire, personal and work-related reasons for retiring, and paid employment during retirement. It
also looks at what aspects of employment people miss during retirement.
Overall, pre-retirees plan to retire at a considerably older age than retirees actually retired. Although just
over half of retirees (52 percent) retired before age 60, about the same proportion of pre-retirees (53
percent) expect to retire at age 65 or later. Another 15 percent of pre-retirees do not expect to retire at all.
Figure 1: Age of Retirement or Expected Retirement
At what age (do you expect to/did you) retire or begin to retire from your primary occupation?
1%
9%
8%
15%
38%
15%
15%
28%
24%
8%
18%
11%
6%
6%
Under 55
55 to 59
60 to 61
62 to 64
65 to 67
68 or older
Don’t expect to retire
Don’t consider self retired
Pre-retirees (n=1,000) Retirees (n=1,000)
Median: 65
Median: 58

© 2013 Society of Actuaries, All Rights Reserved Mathew Greenwald & Associates, Inc.
Page 17
Differences by Population Subgroup
Letters in superscript indicate meaningful differences between subgroups. For example, a number with
the superscript “a” indicates that the number is meaningfully higher than the corresponding number in
column (a). Comparisons are not made between pre-retiree subgroups and retiree subgroups.
Figure 2: Age of Retirement or Expected Retirement, by Gender Pre-Retirees Retirees
Male
(n=500)
Female
(n=500)
Male
(n=500)
Female
(n=500)
(a) (b) (c) (d)
Under 55 1% 1% 31% 26%
55 to 59 9 8 25 23
60 to 61 8 8 7 8
62 to 64 14 15 15 20c
65 to 67 41 35 11 11
68 or older 15 16 6 5
Don’t expect to retire 12 17a -- --
Don’t consider self retired -- -- 5 7
Figure 3: Age of Retirement or Expected Retirement, by Income Pre-Retirees Retirees
<$50K
(n=159)
$50K-
99K
(n=406)
$100K+
(n=373)
<$50K
(n=254)
$50K-
99K
(n=416)
$100K+
(n=235)
(a) (b) (c) (d) (e) (f)
Under 55 -- 1% 2% 29% 26% 35%e
55 to 59 1% 9a 12
a 17 24
d 29
d
60 to 61 4 7 11ab
6 9 5
62 to 64 10 14 16 23f 19
f 11
65 to 67 36 39 38 11 12 9
68 or older 18 16 14 7 5 4
Don’t expect to retire 31bc
14c 7 -- -- --
Don’t consider self retired -- -- -- 6 5 5
Figure 4: Age of Retirement or Expected Retirement, by Age Pre-Retirees Retirees
45-49
(n=324)
50-54
(n=324)
55-80
(n=352)
45-59
(n=295)
60-69
(n=374)
70-80
(n=331)
(a) (b) (c) (d) (e) (f)
Under 55 2% 2% -- 66%ef
16%f 8%
55 to 59 12c 12
c 3 23 31
df 17
60 to 61 10 7 7 -- 15f 7
62 to 64 11 14 19a -- 23
d 28
d
65 to 67 36 35 42 -- 10 22e
68 or older 17 14 15 -- * 16de
Don’t expect to retire 13 16 15 -- -- --
Don’t consider self retired -- -- -- 11ef 5
f 2
© 2013 Society of Actuaries, All Rights Reserved Mathew Greenwald & Associates, Inc.
Page 18
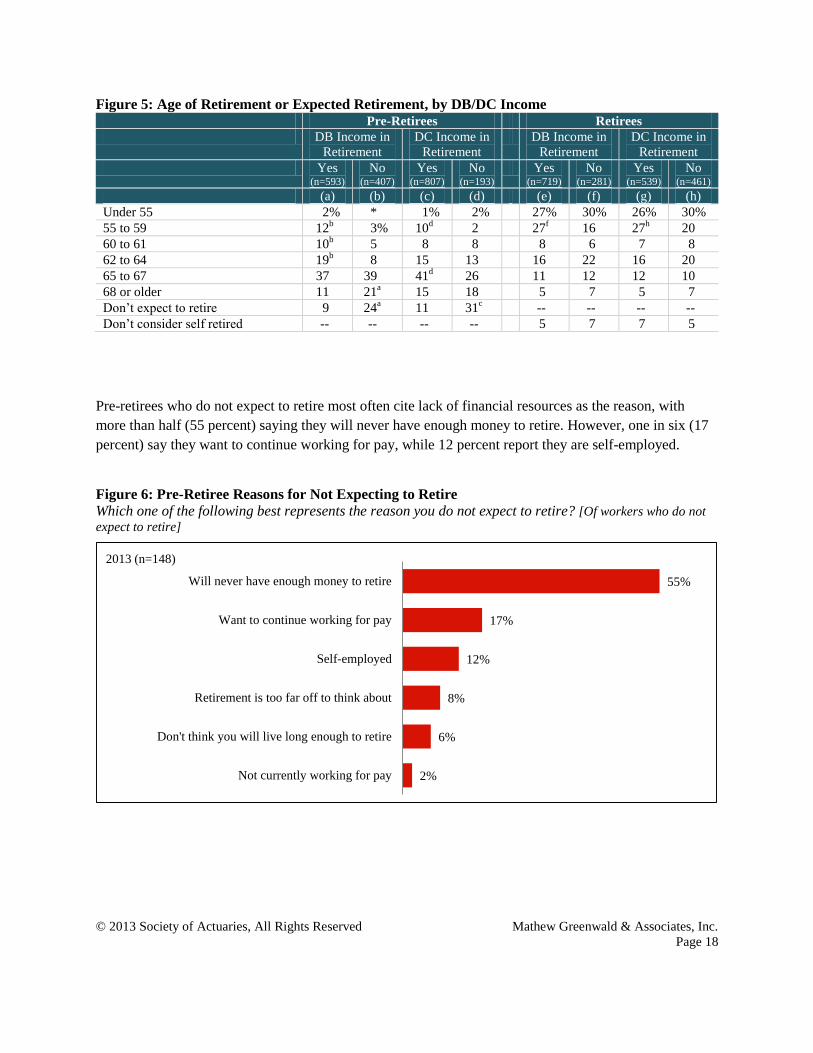
Figure 5: Age of Retirement or Expected Retirement, by DB/DC Income Pre-Retirees Retirees
DB Income in
Retirement
DC Income in
Retirement
DB Income in
Retirement
DC Income in
Retirement
Yes (n=593)
No (n=407)
Yes (n=807)
No (n=193)
Yes (n=719)
No (n=281)
Yes (n=539)
No (n=461)
(a) (b) (c) (d) (e) (f) (g) (h)
Under 55 2% * 1% 2% 27% 30% 26% 30%
55 to 59 12b 3% 10
d 2 27
f 16 27
h 20
60 to 61 10b 5 8 8 8 6 7 8
62 to 64 19b 8 15 13 16 22 16 20
65 to 67 37 39 41d 26 11 12 12 10
68 or older 11 21a 15 18 5 7 5 7
Don’t expect to retire 9 24a 11 31
c -- -- -- --
Don’t consider self retired -- -- -- -- 5 7 7 5
Pre-retirees who do not expect to retire most often cite lack of financial resources as the reason, with
more than half (55 percent) saying they will never have enough money to retire. However, one in six (17
percent) say they want to continue working for pay, while 12 percent report they are self-employed.
Figure 6: Pre-Retiree Reasons for Not Expecting to Retire
Which one of the following best represents the reason you do not expect to retire? [Of workers who do not
expect to retire]
55%
17%
12%
8%
6%
2%
Will never have enough money to retire
Want to continue working for pay
Self-employed
Retirement is too far off to think about
Don't think you will live long enough to retire
Not currently working for pay
2013 (n=148)

© 2013 Society of Actuaries, All Rights Reserved Mathew Greenwald & Associates, Inc.
Page 19
Differences by Population Subgroup
Letters in superscript indicate meaningful differences between subgroups. For example, a number with
the superscript “a” indicates that the number is meaningfully higher than the corresponding number in
column (a). Comparisons are not made between pre-retiree subgroups and retiree subgroups.
Figure 7: Pre-Retiree Reasons for Not Expecting to Retire, by Gender Pre-Retirees
Male
(n=62)
Female
(n=86)
(a) (b)
Will never have enough money to retire 53% 56%
Want to continue working for pay 14 19
Self-employed 15 10
Retirement is too far off to think about 7 9
Don't think you will live long enough to retire 10 3
Not currently working for pay 1 3
Figure 8: Pre-Retiree Reasons for Not Expecting to Retire, by Income Pre-Retirees
<$50K
(n=48)
$50K-99K
(n=56)
$100K+
(n=27)
(a) (b) (c)
Will never have enough money to retire 63% 54% 45%
Want to continue working for pay 5 26a 25
a
Self-employed 11 7 25b
Retirement is too far off to think about 11 6 --
Don't think you will live long enough to retire 7 6 --
Not currently working for pay 2 -- 5
Figure 9: Pre-Retiree Reasons for Not Expecting to Retire, by Age Pre-Retirees
45-49
(n=43)
50-54
(n=54)
55-80
(n=51)
(a) (b) (c)
Will never have enough money to retire 47% 59% 49%
Want to continue working for pay 15 13 23
Self-employed 8 11 16
Retirement is too far off to think about 14 6 6
Don't think you will live long enough to retire 4 9 4
Not currently working for pay 3 2 1

© 2013 Society of Actuaries, All Rights Reserved Mathew Greenwald & Associates, Inc.
Page 20
Figure 10: Pre-Retiree Reasons for Not Expecting to Retire, by DB/DC Plan Income Pre-Retirees
DB Income in
Retirement
DC Income in
Retirement
Yes
(n=51)
No
(n=97)
Yes
(n=87)
No
(n=61)
(a) (b) (c) (d)
Will never have enough money to retire 55% 55% 55% 54%
Want to continue working for pay 21 15 18 16
Self-employed 10 13 9 16
Retirement is too far off to think about 6 9 11 4
Don't think you will live long enough to retire 6 6 4 8
Not currently working for pay 2 2 3 1
Commensurate with a later retirement age, pre-retirees expect to spend more years working full time for
pay during their working life. While roughly one-third of retirees (35 percent) report having worked full
time for at least 40 years, almost two-thirds of pre-retirees (62 percent) say they will work that long.
Figure 11: Years of Full-Time Work (Actual or Expected)
In total, how many years (do you expect to work/did you work) full time for pay over your working life?
6%
7%
6%
18%
37%
26%
3%
6%
16%
39%
28%
7%
Less than 10
10 to 19
20 to 29
30 to 39
40 to 49
50 years or more
Pre-retirees (n=1,000) Retirees (n=1,000)

© 2013 Society of Actuaries, All Rights Reserved Mathew Greenwald & Associates, Inc.
Page 21
Differences by Population Subgroup
Letters in superscript indicate meaningful differences between subgroups. For example, a number with
the superscript “a” indicates that the number is meaningfully higher than the corresponding number in
column (a). Comparisons are not made between pre-retiree subgroups and retiree subgroups.
Figure 12: Years of Full-Time Work (Actual or Expected), by Gender Pre-Retirees Retirees
Male
(n=500)
Female
(n=500)
Male
(n=500)
Female
(n=500)
(a) (b) (c) (d)
Less than 10 4% 9%a * 5%
c
10 to 29 6 8 2% 11c
20 to 29 3 9a 13 19
c
30 to 39 19 17 40 39
40 to 49 43b 31 34
d 22
50 years or more 25 26 11d 4
Figure 13: Years of Full-Time Work (Actual or Expected), by Income Pre-Retirees Retirees
<$50K
(n=159)
$50K-
99K
(n=406)
$100K+
(n=373)
<$50K
(n=254)
$50K-
99K
(n=416)
$100K+
(n=235)
(a) (b) (c) (d) (e) (f)
Less than 10 7% 8%c 4% 3% 3% 2%
10 to 29 10 8 5 9 6 5
20 to 29 9 5 6 16 13 20e
30 to 39 12 18 21a 37 42 42
40 to 49 24 37a 43
a 24 28 28
50 years or more 39bc
25 20 10f 9
f 3
Figure 14: Years of Full-Time Work (Actual or Expected), by Age Pre-Retirees Retirees
45-49
(n=324)
50-54
(n=324)
55-80
(n=352)
45-59
(n=295)
60-69
(n=374)
70-80
(n=331)
(a) (b) (c) (d) (e) (f)
Less than 10 4% 6% 9%a 2% 2% 4%
10 to 29 6 8 7 9e 5 6
20 to 29 9bc
5 4 28ef 10 12
30 to 39 22c 17 15 50
ef 42
f 27
40 to 49 33 38 39 10 37d 34
d
50 years or more 25 25 27 -- 4d 17
de

© 2013 Society of Actuaries, All Rights Reserved Mathew Greenwald & Associates, Inc.
Page 22
Figure 15: Years of Full-Time Work (Actual or Expected), by DB/DC Income Pre-Retirees Retirees
DB Income in
Retirement
DC Income in
Retirement
DB Income in
Retirement
DC Income in
Retirement
Yes (n=593)
No (n=407)
Yes (n=807)
No (n=193)
Yes (n=719)
No (n=281)
Yes (n=539)
No (n=461)
(a) (b) (c) (d) (e) (f) (g) (h)
Less than 10 6% 7% 6% 9% 3% 3% 4% 2%
10 to 29 6 9 6 11 6 8 5 8
20 to 29 6 6 5 8 16 16 17 15
30 to 39 23b 11 19 15 41
f 34 39 40
40 to 49 38 35 40d 23 28 28 29 26
50 years or more 21 33a 24 34
c 6 12
e 6 9
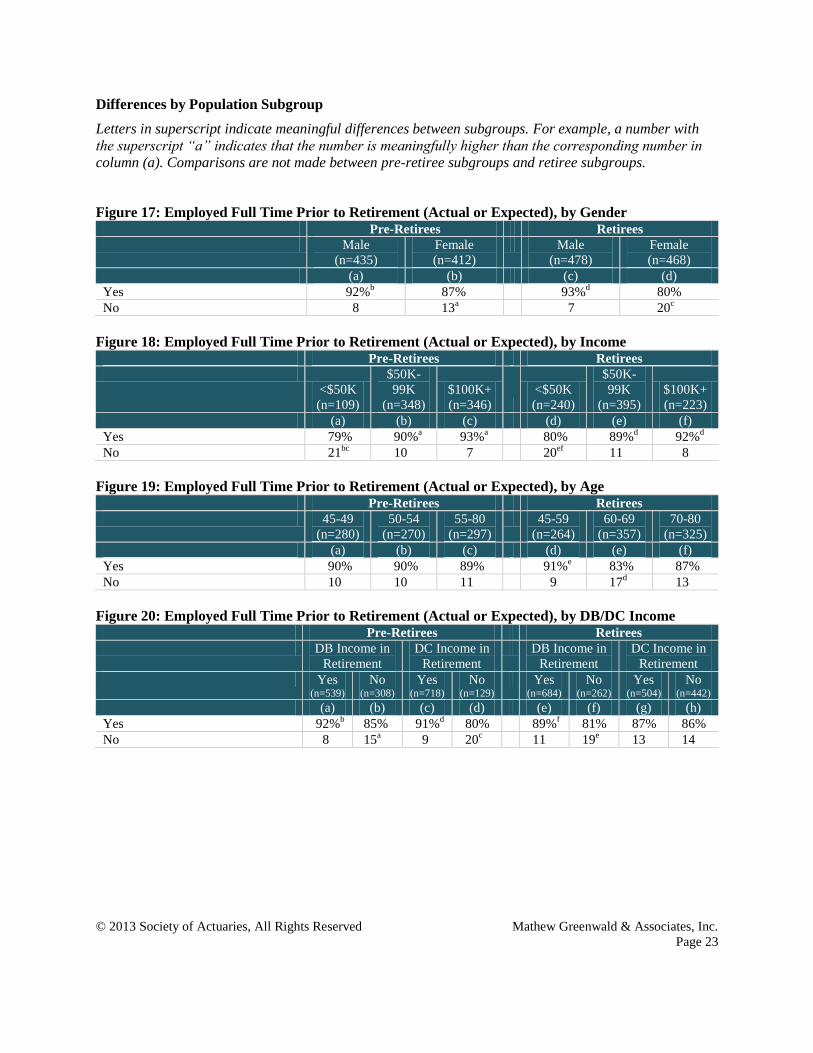
Roughly nine in 10 pre-retirees (90 percent) and retirees (87 percent) report they expect to be or were
employed full time for pay in the year before they retired from their primary occupation.
Figure 16: Employed Full Time Prior to Retirement (Actual or Expected)
Do you think you will be (were you) employed full time for pay in the year before you (retire/retired) from
your primary occupation? [Of those who gave retirement age]
90%
87%
Pre-retirees (n=847) Retirees (n=946)
Percentage Saying Yes
© 2013 Society of Actuaries, All Rights Reserved Mathew Greenwald & Associates, Inc.
Page 23
Differences by Population Subgroup
Letters in superscript indicate meaningful differences between subgroups. For example, a number with
the superscript “a” indicates that the number is meaningfully higher than the corresponding number in
column (a). Comparisons are not made between pre-retiree subgroups and retiree subgroups.
Figure 17: Employed Full Time Prior to Retirement (Actual or Expected), by Gender Pre-Retirees Retirees
Male
(n=435)
Female
(n=412)
Male
(n=478)
Female
(n=468)
(a) (b) (c) (d)
Yes 92%b 87% 93%
d 80%
No 8 13a 7 20
c
Figure 18: Employed Full Time Prior to Retirement (Actual or Expected), by Income Pre-Retirees Retirees
<$50K
(n=109)
$50K-
99K
(n=348)
$100K+
(n=346)
<$50K
(n=240)
$50K-
99K
(n=395)
$100K+
(n=223)
(a) (b) (c) (d) (e) (f)
Yes 79% 90%a 93%
a 80% 89%
d 92%
d
No 21bc
10 7 20ef 11 8
Figure 19: Employed Full Time Prior to Retirement (Actual or Expected), by Age Pre-Retirees Retirees
45-49
(n=280)
50-54
(n=270)
55-80
(n=297)
45-59
(n=264)
60-69
(n=357)
70-80
(n=325)
(a) (b) (c) (d) (e) (f)
Yes 90% 90% 89% 91%e 83% 87%
No 10 10 11 9 17d 13
Figure 20: Employed Full Time Prior to Retirement (Actual or Expected), by DB/DC Income Pre-Retirees Retirees
DB Income in
Retirement
DC Income in
Retirement
DB Income in
Retirement
DC Income in
Retirement
Yes (n=539)
No (n=308)
Yes (n=718)
No (n=129)
Yes (n=684)
No (n=262)
Yes (n=504)
No (n=442)
(a) (b) (c) (d) (e) (f) (g) (h)
Yes 92%b 85% 91%
d 80% 89%
f 81% 87% 86%
No 8 15a 9 20
c 11 19
e 13 14

© 2013 Society of Actuaries, All Rights Reserved Mathew Greenwald & Associates, Inc.
Page 24
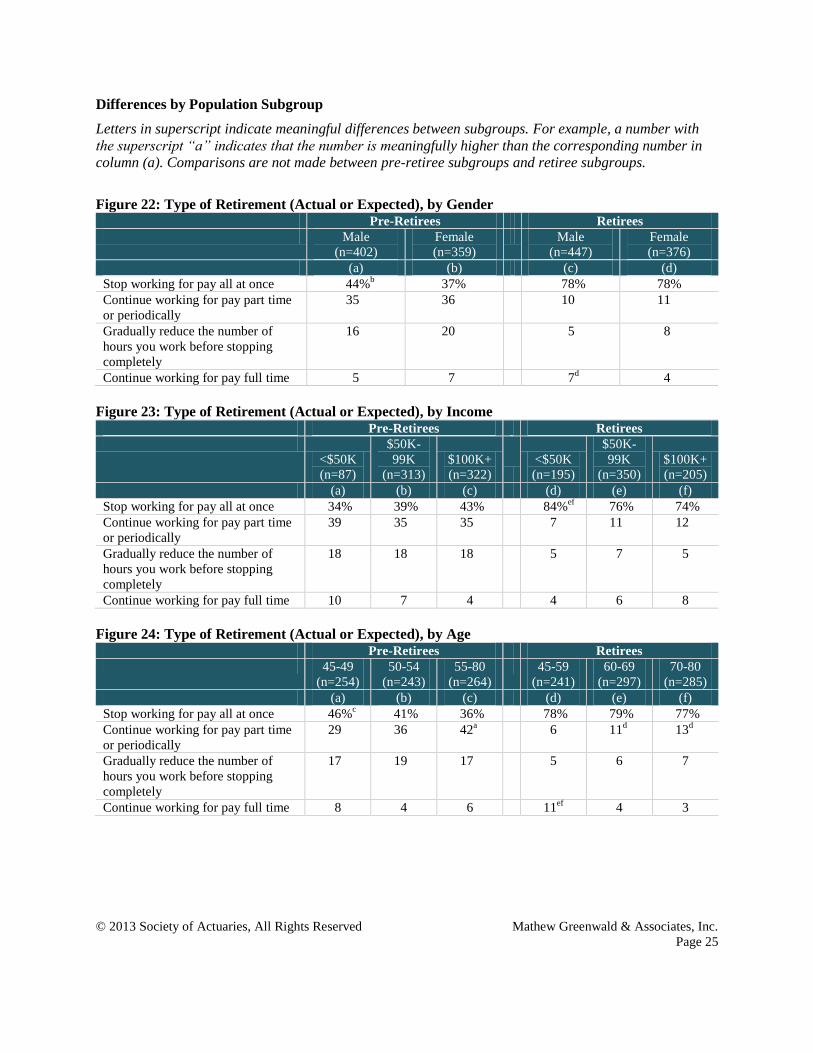
Only four in 10 pre-retirees (41 percent) who plan to work full time in their primary occupation the year
before they retire intend to stop working for pay all at once when they do so. By contrast, the large
majority (78 percent) of retirees who worked full time in the year before retiring report they actually
stopped working for pay all at once. This disparity between what pre-retirees plan and what retirees
actually end up doing is a consistent theme in responses throughout the survey. In this example, it is
further emphasized by the percentage of pre-retirees (35 percent) who expect to continue working for pay
part time or periodically, or to gradually reduce the number of hours they work (18 percent) as against the
much smaller number of retirees (10 percent and 6 percent, respectively) who reported being able to
phase their retirement this way.
Figure 21: Type of Retirement (Actual or Expected)
Which statement comes closest to describing how you (plan to retire/retired) from your primary
occupation? [Of those employed full time (before retiring)]
41%
35%
18%
6%
78%
10%
6%
5%
Stop working for pay all at once
Continue working for pay part time or periodically
Gradually reduce the number of hours you work before
stopping completely
Continue working for pay full-time
Pre-retirees (n=761)
Retirees (n=823)
© 2013 Society of Actuaries, All Rights Reserved Mathew Greenwald & Associates, Inc.
Page 25
Differences by Population Subgroup
Letters in superscript indicate meaningful differences between subgroups. For example, a number with
the superscript “a” indicates that the number is meaningfully higher than the corresponding number in
column (a). Comparisons are not made between pre-retiree subgroups and retiree subgroups.
Figure 22: Type of Retirement (Actual or Expected), by Gender Pre-Retirees Retirees
Male
(n=402)
Female
(n=359)
Male
(n=447)
Female
(n=376)
(a) (b) (c) (d)
Stop working for pay all at once 44%b 37% 78% 78%
Continue working for pay part time
or periodically
35 36 10 11
Gradually reduce the number of
hours you work before stopping
completely
16 20 5 8
Continue working for pay full time 5 7 7d 4
Figure 23: Type of Retirement (Actual or Expected), by Income Pre-Retirees Retirees
<$50K
(n=87)
$50K-
99K
(n=313)
$100K+
(n=322)
<$50K
(n=195)
$50K-
99K
(n=350)
$100K+
(n=205)
(a) (b) (c) (d) (e) (f)
Stop working for pay all at once 34% 39% 43% 84%ef
76% 74%
Continue working for pay part time
or periodically
39 35 35 7 11 12
Gradually reduce the number of
hours you work before stopping
completely
18 18 18 5 7 5
Continue working for pay full time 10 7 4 4 6 8
Figure 24: Type of Retirement (Actual or Expected), by Age Pre-Retirees Retirees
45-49
(n=254)
50-54
(n=243)
55-80
(n=264)
45-59
(n=241)
60-69
(n=297)
70-80
(n=285)
(a) (b) (c) (d) (e) (f)
Stop working for pay all at once 46%c 41% 36% 78% 79% 77%
Continue working for pay part time
or periodically
29 36 42a 6 11
d 13
d
Gradually reduce the number of
hours you work before stopping
completely
17 19 17 5 6 7
Continue working for pay full time 8 4 6 11ef 4 3

© 2013 Society of Actuaries, All Rights Reserved Mathew Greenwald & Associates, Inc.
Page 26
Figure 25: Type of Retirement (Actual or Expected), by DB/DC Income Pre-Retirees Retirees
DB Income in
Retirement
DC Income in
Retirement
DB Income in
Retirement
DC Income in
Retirement
Yes (n=497)
No (n=264)
Yes (n=656)
No (n=105)
Yes (n=612)
No (n=211)
Yes (n=442)
No (n=381)
(a) (b) (c) (d) (e) (f) (g) (h)
Stop working for pay all at once 47%b 28% 42% 33% 79% 74% 77% 80%
Continue working for pay part time
or periodically
34 37 35 40 11 9 12 9
Gradually reduce the number of
hours you work before stopping
completely
13 27a 18 18 5 11
e 5 8
Continue working for pay full time 5 8 5 10 5 6 7 4
Personal issues play a role in the decision to retire. Almost all pre-retirees (94 percent) and the large
majority of retirees (81 percent) say they are or were looking forward to enjoying their retirement. Many
also say they are or were looking forward to the day when they no longer work for pay (84 percent of pre-
retirees and 64 percent of retirees) and are free to pursue their passions and interests (74 percent and 56
percent).
Figure 26: Influence of Personal Issues on Decision to Retire
And how much (do you think/did) each of the following personal issues (will) affect your decision to retire
from your primary occupation? [Of those employed full time (before retiring)]
94%
84%
74%
51%
32%
30%
81%
64%
56%
25%
6%
13%
Looking forward to enjoying your retirement
Looking forward to the day when you no longer have to
work for pay
Wanting to pursue your passions and interests
Spouse/Partner may retire*
Needing to care for spouse/partner*
Needing to care for family members Pre-retirees (n=761)
Retirees (n=823)*Pre-retirees n=550; Retirees n=688
Percentage Saying A Great Deal or Somewhat

© 2013 Society of Actuaries, All Rights Reserved Mathew Greenwald & Associates, Inc.
Page 27
Differences by Population Subgroup
Letters in superscript indicate meaningful differences between subgroups. For example, a number with
the superscript “a” indicates that the number is meaningfully higher than the corresponding number in
column (a). Comparisons are not made between pre-retiree subgroups and retiree subgroups.
Figure 27: Influence of Personal Issues on Decision to Retire, by Gender Pre-Retirees Retirees
Male
(n=402)
Female
(n=359)
Male
(n=447)
Female
(n=376)
A Great Deal or Somewhat (a) (b) (c) (d)
Looking forward to enjoying your
retirement
94% 95% 82% 79%
Looking forward to the day when
you no longer have to work for pay
83 85 63 66
Wanting to pursue your passions
and interests
73 75 55 57
Spouse/Partner may retire1 44 60a 16 36
c
Needing to care for spouse/partner1 29 37 5 7
Needing to care for family members 26 35a 8 17
c
1Pre-retiree: Male (n=321), Female (n=229); Retiree: Male (n=385), Female (n=303)
Figure 28: Influence of Personal Issues on Decision to Retire, by Income Pre-Retirees Retirees
<$50K
(n=87)
$50K-
99K
(n=313)
$100K+
(n=322)
<$50K
(n=195)
$50K-
99K
(n=350)
$100K+
(n=205)
A Great Deal or Somewhat (a) (b) (c) (d) (e) (f)
Looking forward to enjoying your
retirement
95% 96% 93% 76% 83% 78%
Looking forward to the day when
you no longer have to work for pay
86 84 84 62 69f 59
Wanting to pursue your passions
and interests
67 74 77 45 60d 57
d
Spouse/Partner may retire1 27 51a 52
a 31 24 21
Needing to care for spouse/partner1 45 34 30 9 6 6
Needing to care for family members 36 30 29 14 10 13 1Pre-retiree: <$50K (n=17), $50K-99K (n=219), $100K+ (n=281); Retiree: <$50K (n=126), $50K-99K (n=311), $100K+ (n=188)

© 2013 Society of Actuaries, All Rights Reserved Mathew Greenwald & Associates, Inc.
Page 28
Figure 29: Influence of Personal Issues on Decision to Retire, by Age Pre-Retirees Retirees
45-49
(n=254)
50-54
(n=243)
55-80
(n=264)
45-59
(n=241)
60-69
(n=297)
70-80
(n=285)
A Great Deal or Somewhat (a) (b) (c) (d) (e) (f)
Looking forward to enjoying your
retirement
95% 94% 94% 73% 85%d 82%
d
Looking forward to the day when
you no longer have to work for pay
87c 86 79 59 74
df 60
Wanting to pursue your passions
and interests
79 72 72 54 59 53
Spouse/Partner may retire1 61c 51 42 18 26
d 30
d
Needing to care for spouse/partner1 38b 27 33 5 5 8
Needing to care for family members 36c 31 24 15 13 11
1Pre-retiree: 45-49 (n=179), 50-54 (n=182), 55-80 (n=189); Retiree: 45-59 (n=188), 60-69 (n=252), 70-80 (n=248)
Figure 30: Influence of Personal Issues on Decision to Retire, by DB/DC Income Pre-Retirees Retirees
DB Income in
Retirement
DC Income in
Retirement
DB Income in
Retirement
DC Income in
Retirement
Yes (n=497)
No (n=264)
Yes (n=656)
No (n=105)
Yes (n=612)
No (n=211)
Yes (n=442)
No (n=381)
A Great Deal or Somewhat (a) (b) (c) (d) (e) (f) (g) (h)
Looking forward to enjoying your
retirement
95% 94% 94% 93% 81% 78% 81% 80%
Looking forward to the day when
you no longer have to work for pay
86b 79 85 78 67
f 57 66 63
Wanting to pursue your passions
and interests
77b 70 75 70 56 55 59
h 51
Spouse/Partner may retire1 54b 44 52 41 25 25 23 29
Needing to care for spouse/partner1 31 34 33 31 6 7 6 7
Needing to care for family
members
30 31 30 33 12 13 12 13
1Pre-retiree: Yes DB (n=374), No DB (n=176), Yes DC (n=492), No DC (n=58); Retiree: Yes DB (n=532), No DB (n=156), Yes DC (n=393), No
DC (n=295)

© 2013 Society of Actuaries, All Rights Reserved Mathew Greenwald & Associates, Inc.
Page 29
Work-related issues can also be an important factor in the decision to retire. Roughly two-thirds of pre-
retirees and retirees mentioned at least one work-related reason for retiring (67 percent and 65 percent,
respectively). Retirees most often say the work-related issues that affected their decision to retire a great
deal or somewhat were the environment no longer being comfortable (34 percent) and work no longer
being interesting (28 percent); pre-retirees appear to be counting on a financial incentive (49 percent) or
expect to leave their primary occupation due to health problems or disability (42 percent).
Figure 31: Influence of Work-Related Issues on Decision to Retire
How much (do you think/did) each of the following work-related issues (will) affect your decision to retire
from your primary occupation? [Of those employed full time (before retiring)]
49%
42%
39%
38%
35%
34%
29%
26%
26%
21%
34%
28%
13%
11%
20%
10%
Given a financial incentive to retire
Health problems/Unable to cope with physical demands
Environment no longer comfortable
Work no longer interesting
May lose your job
Desire to move to a different type of work
No longer wanting to deal with commute/travel
Company sold or merged
Pre-retirees (n=761)
Retirees (n=823)
Percentage Saying A Great Deal or Somewhat

© 2013 Society of Actuaries, All Rights Reserved Mathew Greenwald & Associates, Inc.
Page 30
Differences by Population Subgroup
Letters in superscript indicate meaningful differences between subgroups. For example, a number with
the superscript “a” indicates that the number is meaningfully higher than the corresponding number in
column (a). Comparisons are not made between pre-retiree subgroups and retiree subgroups.
Figure 32: Influence of Work-Related Issues on Decision to Retire, by Gender Pre-Retirees Retirees
Male
(n=402)
Female
(n=359)
Male
(n=447)
Female
(n=376)
A Great Deal or Somewhat (a) (b) (c) (d)
Given a financial incentive to retire 49% 49% 32%d 20%
Health problems/Unable to cope
with physical demands
40 44 22 21
Environment no longer comfortable 39 39 37 31
Work no longer interesting 41 34 32d 24
May lose your job 33 38 12 14
Desire to move to a different type of
work
35 34 12 9
No longer wanting to deal with
commute/travel
28 29 21 19
Company sold or merged 28 23 11 9
Figure 33: Influence of Work-Related Issues on Decision to Retire, by Income Pre-Retirees Retirees
<$50K
(n=87)
$50K-
99K
(n=313)
$100K+
(n=322)
<$50K
(n=195)
$50K-
99K
(n=350)
$100K+
(n=205)
A Great Deal or Somewhat (a) (b) (c) (d) (e) (f)
Given a financial incentive to retire 51% 49% 48% 21% 26% 35%de
Health problems/Unable to cope
with physical demands
53c 45
c 36 32
ef 20 18
Environment no longer comfortable 41 39 39 35 33 38
Work no longer interesting 30 34 45ab
25 30 28
May lose your job 41 35 35 19f 13 9
Desire to move to a different type of
work
43 33 34 9 9 16de
No longer wanting to deal with
commute/travel
26 25 34b 17 20 22
Company sold or merged 29 24 28 9 11 7

© 2013 Society of Actuaries, All Rights Reserved Mathew Greenwald & Associates, Inc.
Page 31
Figure 34: Influence of Work-Related Issues on Decision to Retire, by Age Pre-Retirees Retirees
45-49
(n=254)
50-54
(n=243)
55-80
(n=264)
45-59
(n=241)
60-69
(n=297)
70-80
(n=285)
A Great Deal or Somewhat (a) (b) (c) (d) (e) (f)
Given a financial incentive to retire 52% 52%c 44% 31%
f 29%
f 19%
Health problems/Unable to cope
with physical demands
46 38 41 35ef 18 13
Environment no longer comfortable 40 41 35 40f 38
f 26
Work no longer interesting 37 41 34 34f 28 23
May lose your job 36 38 33 10 16d 12
Desire to move to a different type of
work
42c 37
c 24 23
ef 6 5
No longer wanting to deal with
commute/travel
27 30 29 22 21 16
Company sold or merged 29 27 22 8 12 9
Figure 35: Influence of Work-Related Issues on Decision to Retire, by DB/DC Income Pre-Retirees Retirees
DB Income in
Retirement
DC Income in
Retirement
DB Income in
Retirement
DC Income in
Retirement
Yes (n=497)
No (n=264)
Yes (n=656)
No (n=105)
Yes (n=612)
No (n=211)
Yes (n=442)
No (n=381)
A Great Deal or Somewhat (a) (b) (c) (d) (e) (f) (g) (h)
Given a financial incentive to retire 54%b 40% 50% 45% 29%
f 18% 31%
h 21%
Health problems/Unable to cope
with physical demands
38 49a 42 44 19 27
e 19 24
Environment no longer comfortable 40 36 40d 29 35 33 37 31
Work no longer interesting 37 39 39 30 28 28 29 27
May lose your job 36 34 36 33 10 22e 12 14
Desire to move to a different type
of work
35 33 35 31 10 14 10 11
No longer wanting to deal with
commute/travel
28 29 29 24 20 19 22h 17
Company sold or merged 24 29 26 27 8 14e 10 10

© 2013 Society of Actuaries, All Rights Reserved Mathew Greenwald & Associates, Inc.
Page 32
Most feel they are able to work for as long as they wish. Almost nine in 10 pre-retirees (87 percent) and
eight in 10 retirees (81 percent) report expecting to be able or having been able to work for as long as they
wanted.
Figure 36: Ability to Work as Long as Desired
(Do you think you will be/Were you) able to work for as long as you (want/wanted)? [Of those employed for
pay or laid off]
Differences by Population Subgroup
Letters in superscript indicate meaningful differences between subgroups. For example, a number with
the superscript “a” indicates that the number is meaningfully higher than the corresponding number in
column (a). Comparisons are not made between pre-retiree subgroups and retiree subgroups.
Figure 37: Ability to Work as Long as Desired, by Gender Pre-Retirees Retirees
Male
(n=483)
Female
(n=478)
Male
(n=476)
Female
(n=460)
(a) (b) (c) (d)
Yes 84% 90%a 83% 79%
No 16b 10 17 21
87%
81%
Pre-retirees (n=961) Retirees (n=936)
Percentage Saying Yes

© 2013 Society of Actuaries, All Rights Reserved Mathew Greenwald & Associates, Inc.
Page 33
Figure 38: Ability to Work as Long as Desired, by Income Pre-Retirees Retirees
<$50K
(n=148)
$50K-
99K
(n=390)
$100K+
(n=367)
<$50K
(n=226)
$50K-
99K
(n=393)
$100K+
(n=228)
(a) (b) (c) (d) (e) (f)
Yes 82% 87% 90%a 75% 83%
d 84%
d
No 18c 13 10 25
ef 17 16
Figure 39: Ability to Work as Long as Desired, by Age Pre-Retirees Retirees
45-49
(n=314)
50-54
(n=317)
55-80
(n=330)
45-59
(n=249)
60-69
(n=358)
70-80
(n=329)
(a) (b) (c) (d) (e) (f)
Yes 86% 86% 89% 80% 81% 83%
No 14 14 11 20 19 17
Figure 40: Ability to Work as Long as Desired, by DB/DC Income Pre-Retirees Retirees
DB Income in
Retirement
DC Income in
Retirement
DB Income in
Retirement
DC Income in
Retirement
Yes (n=572)
No (n=389)
Yes (n=787)
No (n=174)
Yes (n=687)
No (n=249)
Yes (n=515)
No (n=421)
(a) (b) (c) (d) (e) (f) (g) (h)
Yes 88% 86% 89%d 80% 84%
f 73% 82% 80%
No 12 14 11 20c 16 27
e 18 20

© 2013 Society of Actuaries, All Rights Reserved Mathew Greenwald & Associates, Inc.
Page 34
Among pre-retirees who do not expect to be able to work for pay as long as they would like, health
problems top the list of reasons why they feel they will be unable to do so (42 percent). Although retirees
who were unable to work for as long as they would have liked give more varied reasons, approximately
one-quarter of both pre-retirees (25 percent) and retirees (27 percent) mention disability or no longer
being able to cope with the physical demands of the job.
Figure 41: Primary Reason for Early Retirement
What is the primary reason why (you do not think you will be able to work for pay for as long as you
want/you did not work for pay for as long as you would have liked)? [Of those not able to work for as long as
desired]
42%
25%
15%
9%
5%
1%
1%
1%
1%
1%
14%
27%
19%
5%
3%
7%
8%
9%
6%
3%
Health problems
Disability or no longer being able to cope with the
physical demands of your job
Lost job and do not have good options for a new one
Not wanting to look for a new job
Age discrimination
Caregiving responsibilities
Wanted to retire/needed a change
Company downsized/moved/closed
Forced retirement
Other
Pre-retirees (n=126)
Retirees (n=177)

© 2013 Society of Actuaries, All Rights Reserved Mathew Greenwald & Associates, Inc.
Page 35
Differences by Population Subgroup
Letters in superscript indicate meaningful differences between subgroups. For example, a number with
the superscript “a” indicates that the number is meaningfully higher than the corresponding number in
column (a). Comparisons are not made between pre-retiree subgroups and retiree subgroups.
Figure 42: Primary Reason for Early Retirement, by Gender Pre-Retirees Retirees
Male
(n=77)
Female
(n=49)
Male
(n=81)
Female
(n=96)
(a) (b) (c) (d)
Health problems 42% 42% 16% 12%
Disability or no longer being able to
cope with the physical demands of
your job
31b 16 26 28
Lost job and do not have good
options for a new one
15 14 21 17
Not wanting to look for a new job 8 11 6 4
Age discrimination 1 11a 1 4
Caregiving responsibilities -- 3 3 10
Wanted to retire/needed a change 1 -- 10 7
Company downsized/moved/closed -- 4 8 10
Forced retirement 2 -- 6 6
Other 1 -- 3 3
Figure 43: Primary Reason for Early Retirement, by Income Pre-Retirees Retirees
<$50K
(n=26)
$50K-
99K
(n=54)
$100K+
(n=40)
<$50K
(n=60)
$50K-
99K
(n=68)
$100K+
(n=34)
(a) (b) (c) (d) (e) (f)
Health problems 47% 40% 40% 16% 15% 10%
Disability or no longer being able to
cope with the physical demands of
your job
26 29 19 37 24 21
Lost job and do not have good
options for a new one
12 17 14 17 23 15
Not wanting to look for a new job 3 6 17a 3 2 8
Age discrimination 4 4 3 2 1 8
Caregiving responsibilities -- 3 -- 10 8 --
Wanted to retire/needed a change 3 -- -- 4 5 16
Company downsized/moved/closed 4 1 -- 9 12f 2
Forced retirement -- -- 3 -- 6 16
Other -- -- 2 3 3 4

© 2013 Society of Actuaries, All Rights Reserved Mathew Greenwald & Associates, Inc.
Page 36
Figure 44: Primary Reason for Early Retirement, by Age Pre-Retirees Retirees
45-49
(n=43)
50-54
(n=47)
55-80
(n=36)
45-59
(n=51)
60-69
(n=69)
70-80
(n=57)
(a) (b) (c) (d) (e) (f)
Health problems 38% 47% 39% 16% 7% 19%e
Disability or no longer being able to
cope with the physical demands of
your job
34 21 17 43ef 22 18
Lost job and do not have good
options for a new one
15 13 16 6 30d 18
Not wanting to look for a new job 11 6 10 7 4 4
Age discrimination 2 3 12 -- 3 5
Caregiving responsibilities -- -- 4 5 8 7
Wanted to retire/needed a change -- 2 2 5 9 11
Company downsized/moved/closed -- 2 2 5 11 11
Forced retirement -- 3 -- 7 4 6
Other -- 2 -- 6 1 2
Figure 45: Primary Reason for Early Retirement, by DB/DC Income Pre-Retirees Retirees
DB Income in
Retirement
DC Income in
Retirement
DB Income in
Retirement
DC Income in
Retirement
Yes (n=70)
No (n=56)
Yes (n=90)
No (n=36)
Yes (n=110)
No (n=67)
Yes (n=92)
No (n=85)
(a) (b) (c) (d) (e) (f) (g) (h)
Health problems 37% 48% 43% 40% 14% 13% 13% 14%
Disability or no longer being able
to cope with the physical demands
of your job
24 25 22 31 26 28 21 34
Lost job and do not have good
options for a new one
15 14 14 17 18 20 24 14
Not wanting to look for a new job 13b 3 10 7 6 3 2 8
Age discrimination 3 8 6 3 -- 7 4 2
Caregiving responsibilities 2 -- 2 -- 7 6 7 7
Wanted to retire/needed a change -- 2 -- 3 12f 3 8 9
Company downsized/moved/closed 3 -- 2 -- 6 13 8 10
Forced retirement 2 -- 1 -- 8f 1 8 3
Other 1 -- 1 -- 2 4 5 1
© 2013 Society of Actuaries, All Rights Reserved Mathew Greenwald & Associates, Inc.
Page 37
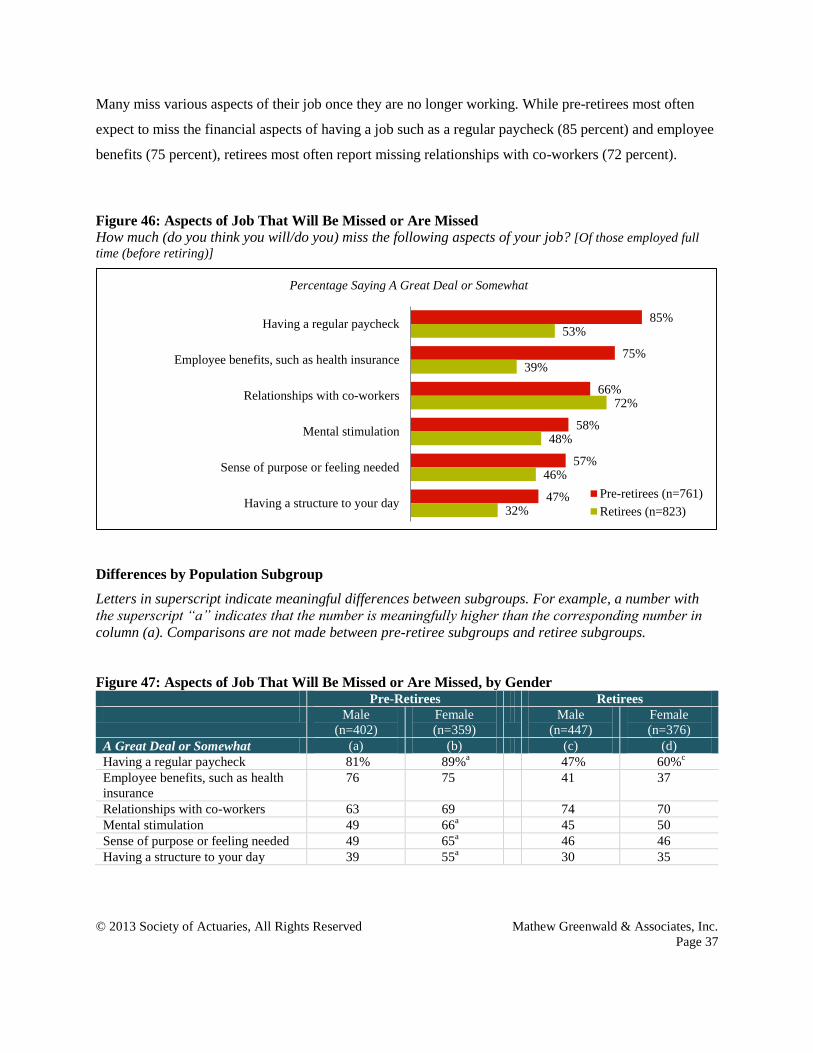
Many miss various aspects of their job once they are no longer working. While pre-retirees most often
expect to miss the financial aspects of having a job such as a regular paycheck (85 percent) and employee
benefits (75 percent), retirees most often report missing relationships with co-workers (72 percent).
Figure 46: Aspects of Job That Will Be Missed or Are Missed
How much (do you think you will/do you) miss the following aspects of your job? [Of those employed full
time (before retiring)]
Differences by Population Subgroup
Letters in superscript indicate meaningful differences between subgroups. For example, a number with
the superscript “a” indicates that the number is meaningfully higher than the corresponding number in
column (a). Comparisons are not made between pre-retiree subgroups and retiree subgroups.
Figure 47: Aspects of Job That Will Be Missed or Are Missed, by Gender Pre-Retirees Retirees
Male
(n=402)
Female
(n=359)
Male
(n=447)
Female
(n=376)
A Great Deal or Somewhat (a) (b) (c) (d)
Having a regular paycheck 81% 89%a 47% 60%
c
Employee benefits, such as health
insurance
76 75 41 37
Relationships with co-workers 63 69 74 70
Mental stimulation 49 66a 45 50
Sense of purpose or feeling needed 49 65a 46 46
Having a structure to your day 39 55a 30 35
85%
75%
66%
58%
57%
47%
53%
39%
72%
48%
46%
32%
Having a regular paycheck
Employee benefits, such as health insurance
Relationships with co-workers
Mental stimulation
Sense of purpose or feeling needed
Having a structure to your dayPre-retirees (n=761)
Retirees (n=823)
Percentage Saying A Great Deal or Somewhat

© 2013 Society of Actuaries, All Rights Reserved Mathew Greenwald & Associates, Inc.
Page 38
Figure 48: Aspects of Job That Will Be Missed or Are Missed, by Income Pre-Retirees Retirees
<$50K
(n=87)
$50K-
99K
(n=313)
$100K+
(n=322)
<$50K
(n=195)
$50K-
99K
(n=350)
$100K+
(n=205)
A Great Deal or Somewhat (a) (b) (c) (d) (e) (f)
Having a regular paycheck 91%c 84% 83% 70%
ef 48% 45%
Employee benefits, such as health
insurance
76 75 75 50ef 38 31
Relationships with co-workers 64 62 68 70 73 71
Mental stimulation 56 54 62b 45 47 51
Sense of purpose or feeling needed 52 56 58 47 46 45
Having a structure to your day 55 44 47 39f 32 27
Figure 49: Aspects of Job That Will Be Missed or Are Missed, by Age Pre-Retirees Retirees
45-49
(n=254)
50-54
(n=243)
55-80
(n=264)
45-59
(n=241)
60-69
(n=297)
70-80
(n=285)
A Great Deal or Somewhat (a) (b) (c) (d) (e) (f)
Having a regular paycheck 89%c 86% 80% 60%
e 49% 52%
Employee benefits, such as health
insurance
82bc
73 71 47f 39 32
Relationships with co-workers 65 66 66 68 75 72
Mental stimulation 61b 50 61
b 43 47 52
Sense of purpose or feeling needed 59 52 58 49 46 44
Having a structure to your day 46 49 46 34 30 33
Figure 50: Aspects of Job That Will Be Missed or Are Missed, by DB/DC Income Pre-Retirees Retirees
DB Income in
Retirement
DC Income in
Retirement
DB Income in
Retirement
DC Income in
Retirement
Yes (n=497)
No (n=264)
Yes (n=656)
No (n=105)
Yes (n=612)
No (n=211)
Yes (n=442)
No (n=381)
A Great Deal or Somewhat (a) (b) (c) (d) (e) (f) (g) (h)
Having a regular paycheck 83% 88% 86%d 76% 49% 67%
e 49% 59%
g
Employee benefits, such as health
insurance
77 72 78d 60 35 52
e 40 38
Relationships with co-workers 68 61 66 61 73 70 76h 67
Mental stimulation 56 60 59 51 46 52 49 46
Sense of purpose or feeling needed 54 62a 57 56 44 51 46 45
Having a structure to your day 45 50 46 50 29 41e 31 34

© 2013 Society of Actuaries, All Rights Reserved Mathew Greenwald & Associates, Inc.
Page 39
PHASES OF RETIREMENT
Abilities and needs change over the course of retirement, and the extent to which individuals recognize
this is important when focusing on the post-retirement period. This section looks at how and when people
expect their abilities and needs to change, the extent to which people have planned for these changes,
their caregiving responsibilities in retirement, their desire to remain in their current home, and the factors
that might prompt them to leave. These questions supplement work done on this topic in the 2005 survey.
Roughly half of retirees think they will never lose the mental capacity to work or to manage money (46
percent and 54 percent, respectively). There is a greater degree of acceptance among retirees than among
pre-retirees that they may experience changes in their physical abilities over the course of their retirement,
yet a quarter of retirees still expect to never be physically unable to work or less able to move around (23
percent and 25 percent, respectively). Pre-retirees are more likely to think they will experience each of
these changes in retirement than those already retired report having done.

© 2013 Society of Actuaries, All Rights Reserved Mathew Greenwald & Associates, Inc.
Page 40
Figure 51: Changing Abilities over Time
People’s abilities and needs often change over the course of their retirement. When do you think you,
yourself, will begin to experience the following changes, if ever?
Less than
20 years
into
retirement
20+ years
into
retirement Never
Less able to provide caregiving to relatives/friends
Pre-retirees (n=1,000) 49% 36% 15%
Retirees (n=1,000) 33% 37% 30%
Physically no longer able to work
Pre-retirees (n=1,000) 45% 40% 16%
Retirees (n=1,000) 35% 41% 23%
Less able to do household chores
Pre-retirees (n=1,000) 42% 40% 18%
Retirees (n=1,000) 31% 41% 28%
Less able to move around
Pre-retirees (n=1,000) 40% 45% 15%
Retirees (n=1,000) 29% 47% 25%
Mentally no longer able to work
Pre-retirees (n=1,000) 32% 35% 34%
Retirees (n=1,000) 19% 35% 46%
Loss of a spouse/partner
Pre-retirees (n=709) 30% 47% 23%
Retirees (n=749) 17% 51% 32%
No longer able to drive
Pre-retirees (n=1,000) 28% 52% 19%
Retirees (n=1,000) 16% 51% 33%
Less able to manage money
Pre-retirees (n=1,000) 25% 36% 38%
Retirees (n=1,000) 12% 33% 54%

© 2013 Society of Actuaries, All Rights Reserved Mathew Greenwald & Associates, Inc.
Page 41
Differences by Population Subgroup
Letters in superscript indicate meaningful differences between subgroups. For example, a number with
the superscript “a” indicates that the number is meaningfully higher than the corresponding number in
column (a). Comparisons are not made between pre-retiree subgroups and retiree subgroups.
Figure 52: Changing Abilities over Time, by Gender Pre-Retirees Retirees
Male
(n=500)
Female
(n=500)
Male
(n=500)
Female
(n=500)
Less than 20 years into retirement (a) (b) (c) (d)
Less able to provide caregiving to
relatives/friends
50% 48% 28% 38%c
Physically no longer able to work 47 42 36 34
Less able to do household chores 42 42 29 32
Less able to move around 43 38 29 28
Mentally no longer able to work 33 31 19 19
Loss of a spouse/partner1 24 37a 10 24
c
No longer able to drive 25 31a 15 17
Less able to manage money 25 25 12 12 1Pre-retiree: Male (n=391), Female (n=318); Retiree: Male (n=408), Female (n=341)
Figure 53: Changing Abilities over Time, by Income Pre-Retirees Retirees
<$50K
(n=159)
$50K-
99K
(n=406)
$100K+
(n=373)
<$50K
(n=254)
$50K-
99K
(n=416)
$100K+
(n=235)
Less than 20 years into retirement (a) (b) (c) (d) (e) (f)
Less able to provide caregiving to
relatives/friends
49% 51% 48% 37% 31% 33%
Physically no longer able to work 48 47 40 45ef 31 32
Less able to do household chores 44 43 41 34 29 31
Less able to move around 44 41 38 36e 25 30
Mentally no longer able to work 27 32 34 23e 16 21
Loss of a spouse/partner1 46bc
28 29 21 16 17
No longer able to drive 35c 28 24 19 14 16
Less able to manage money 34bc
23 24 19ef 11 9
1Pre-retiree: <$50K (n=43), $50K-99K (n=288), $100K+ (n=327); Retiree: <$50K (n=120), $50K-99K (n=349), $100K+ (n=206)

© 2013 Society of Actuaries, All Rights Reserved Mathew Greenwald & Associates, Inc.
Page 42
Figure 54: Changing Abilities over Time, by Age Pre-Retirees Retirees
45-49
(n=324)
50-54
(n=324)
55-80
(n=352)
45-59
(n=295)
60-69
(n=374)
70-80
(n=331)
Less than 20 years into retirement (a) (b) (c) (d) (e) (f)
Less able to provide caregiving to
relatives/friends
46% 45% 57%ab
37%f 34% 29%
Physically no longer able to work 43 40 50b 40
f 37
f 30
Less able to do household chores 42 35 48b 30 33 28
Less able to move around 37 37 46ab
33f 29 25
Mentally no longer able to work 31 30 34 21 19 17
Loss of a spouse/partner1 30 27 32 14 19 17
No longer able to drive 26 23 36ab
14 16 17
Less able to manage money 22 22 31ab
14 11 12 1Pre-retiree: 45-49 (n=223), 50-54 (n=232), 55-80 (n=254); Retiree: 45-59 (n=213), 60-69 (n=301), 70-80 (n=235)
Figure 55: Changing Abilities over Time, by DB/DC Income Pre-Retirees Retirees
DB Income in
Retirement
DC Income in
Retirement
DB Income in
Retirement
DC Income in
Retirement
Yes (n=593)
No (n=407)
Yes (n=807)
No (n=193)
Yes (n=719)
No (n=281)
Yes (n=539)
No (n=461)
Less than 20 years into retirement (a) (b) (c) (d) (e) (f) (g) (h)
Less able to provide caregiving to
relatives/friends
45% 55%a 48% 54% 32% 37% 36% 30%
Physically no longer able to work 42 48 44 48 33 42e 34 36
Less able to do household chores 38 47a 42 41 29 35 31 30
Less able to move around 35 48a 40 40 26 35
e 29 29
Mentally no longer able to work 29 36a 32 30 17 23
e 18 19
Loss of a spouse/partner1 28 32 29 34 17 17 18 15
No longer able to drive 26 32a 28 28 16 17 17 15
Less able to manage money 22 30a 24 32
c 11 16
e 12 13
1Pre-retiree: Yes DB (n=445), No DB (n=264), Yes DC (n=601), No DC (n=108); Retiree: Yes DB (n=567), No DB (n=182), Yes DC (n=443),
No DC (n=306)

© 2013 Society of Actuaries, All Rights Reserved Mathew Greenwald & Associates, Inc.
Page 43
A majority of pre-retirees and retirees have considered how they would respond to a number of major life
changes that might occur in retirement, yet too few have actually made plans to deal with these
circumstances. For example, only about a quarter of pre-retirees (23 percent) and three in 10 retirees (31
percent) have made plans to cope with the loss of a spouse or partner. Planning for other life changes is
even less common.
Figure 56: Planning for Changes in Retirement
Have you considered and planned for how you (and your spouse/partner) would respond if the following
changes were to occur (in retirement)?
Considered,
and made
plans
Considered,
but no plans
Total
considered
You lost your spouse/partner
Pre-retirees (n=709) 23% 42% 66%
Retirees (n=749) 31% 45% 76%
You were physically no longer able to work
Pre-retirees (n=1,000) 15% 52% 66%
Retirees (n=1,000) 29% 40% 70%
You were less able to move around
Pre-retirees (n=1,000) 10% 53% 62%
Retirees (n=1,000) 24% 50% 74%
You were less able to manage your money
Pre-retirees (n=1,000) 15% 43% 58%
Retirees (n=1,000) 31% 36% 68%
You were less able to do household chores
Pre-retirees (n=1,000) 10% 48% 58%
Retirees (n=1,000) 23% 48% 72%
You were mentally no longer able to work
Pre-retirees (n=1,000) 9% 44% 53%
Retirees (n=1,000) 20% 39% 59%
You were no longer able to drive
Pre-retirees (n=1,000) 9% 44% 53%
Retirees (n=1,000) 19% 47% 65%
You were less able to provide caregiving
Pre-retirees (n=1,000) 9% 44% 53%
Retirees (n=1,000) 18% 41% 59%

© 2013 Society of Actuaries, All Rights Reserved Mathew Greenwald & Associates, Inc.
Page 44
Differences by Population Subgroup
Letters in superscript indicate meaningful differences between subgroups. For example, a number with
the superscript “a” indicates that the number is meaningfully higher than the corresponding number in
column (a). Comparisons are not made between pre-retiree subgroups and retiree subgroups.
Figure 57: Planning for Changes in Retirement, by Gender Pre-Retirees Retirees
Male
(n=500)
Female
(n=500)
Male
(n=500)
Female
(n=500)
Considered, and made plans (a) (b) (c) (d)
You lost your spouse/partner1 21% 26% 24% 37%c
You were physically no longer able
to work
15 14 25 34c
You were less able to move around 10 9 20 27c
You were less able to manage your
money
13 16 28 34c
You were less able to do household
chores
9 11 19 27c
You were mentally no longer able to
work
8 9 17 23
You were no longer able to drive 8 9 15 23
You were less able to provide
caregiving
9 10 16 20
1Pre-retiree: Male (n=391), Female (n=318); Retiree: Male (n=408), Female (n=341)
Figure 58: Planning for Changes in Retirement, by Income Pre-Retirees Retirees
<$50K
(n=159)
$50K-
99K
(n=406)
$100K+
(n=373)
<$50K
(n=254)
$50K-
99K
(n=416)
$100K+
(n=235)
Considered, and made plans (a) (b) (c) (d) (e) (f)
You lost your spouse/partner1 13% 20% 28%ab
20% 31%d 33%d
You were physically no longer able
to work
13 10 19b 33 27 30
You were less able to move around 8 9 10 21 22 29de
You were less able to manage your
money
13 12 18b 27 29 35d
You were less able to do household
chores
7 8 12 22 22 26
You were mentally no longer able
to work
7 6 12ab
21 20 19
You were no longer able to drive 7 8 10 21 18 17
You were less able to provide
caregiving
10 7 11 19 18 15
1Pre-retiree: <$50K (n=43), $50K-99K (n=288), $100K+ (n=327); Retiree: <$50K (n=120), $50K-99K (n=349), $100K+ (n=206)

© 2013 Society of Actuaries, All Rights Reserved Mathew Greenwald & Associates, Inc.
Page 45
Figure 59: Planning for Changes in Retirement, by Age Pre-Retirees Retirees
45-49
(n=324)
50-54
(n=324)
55-80
(n=352)
45-59
(n=295)
60-69
(n=374)
70-80
(n=331)
Considered, and made plans (a) (b) (c) (d) (e) (f)
You lost your spouse/partner1 20% 24% 25% 32% 32% 28%
You were physically no longer able
to work
13 12 19ab
32 27 29
You were less able to move around 8 8 12 24 24 23
You were less able to manage your
money
10 13 21ab
29 30 34
You were less able to do household
chores
6 8 16ab
23 23 24
You were mentally no longer able
to work
6 7 13ab
22 19 20
You were no longer able to drive 6 7 12ab
19 17 21
You were less able to provide
caregiving
6 9 12a 19 17 18
1Pre-retiree: 45-49 (n=223), 50-54 (n=232), 55-80 (n=254); Retiree: 45-59 (n=213), 60-69 (n=301), 70-80 (n=235)
Figure 60: Planning for Changes in Retirement, by DB/DC Income Pre-Retirees Retirees
DB Income in
Retirement
DC Income in
Retirement
DB Income in
Retirement
DC Income in
Retirement
Yes (n=593)
No (n=407)
Yes (n=807)
No (n=193)
Yes (n=719)
No (n=281)
Yes (n=539)
No (n=461)
Considered, and made plans (a) (b) (c) (d) (e) (f) (g) (h)
You lost your spouse/partner1 24% 22% 25%d 16% 31% 30% 33% 28%
You were physically no longer able
to work
16 13 15 13 29 30 32 27
You were less able to move around 10 9 10 9 24 23 26 21
You were less able to manage your
money
16 13 15 12 31 32 33 29
You were less able to do household
chores
11 8 10 10 24 22 24 22
You were mentally no longer able
to work
10 7 9 7 20 20 22 18
You were no longer able to drive 9 8 9 8 18 20 19 19
You were less able to provide
caregiving
10 7 9 11 19 16 19 17
1Pre-retiree: Yes DB (n=445), No DB (n=264), Yes DC (n=601), No DC (n=108); Retiree: Yes DB (n=567), No DB (n=182), Yes DC (n=443), No DC (n=306)

© 2013 Society of Actuaries, All Rights Reserved Mathew Greenwald & Associates, Inc.
Page 46
In contrast, half of retired widows (52 percent) report having made plans for how they would cope with
the loss of a spouse. However, three in 10 (30 percent) retired widows had not even considered how they
would respond following the loss of their spouse.
Figure 61: Planning for the Loss of a Spouse
Did you (and your spouse) consider and plan for how you would respond if you lost your spouse? [Of
retired widows]
30%
18%
52%
Did not consider
Considered, but made no plans
Considered and made plans
2013 (n=271)

© 2013 Society of Actuaries, All Rights Reserved Mathew Greenwald & Associates, Inc.
Page 47
About a third of retirees spent at least one hour a week caring for their spouse or partner (30 percent),
parents or parents-in-law (37 percent), and/or children or grandchildren (34 percent) during the time in
their retirement when caregiving duties were at their heaviest. Pre-retirees have higher expectations for
their caregiving workload, but this may reflect the fact that some retirees will have more caregiving duties
later in their retirement.
Figure 62: Time Spent Providing Caregiving (Actual or Expected)
Thinking about the year when your caregiving duties in retirement, if any, (will be/were) at their heaviest,
about how many hours a week on average (do you think you will/did you) spend caring for others?
No time
At least one
hour a week
Your spouse/partner
Pre-retirees (n=709) 20% 80%
Retirees (n=837) 70% 30%
Retired widows (n=271) 54% 46%
Parents or parents-in-law
Pre-retirees (n=1,000) 52% 48%
Retirees (n=1,000) 63% 37%
Retired widows (n=271) 68% 32%
Children or grandchildren
Pre-retirees (n=1,000) 44% 56%
Retirees (n=1,000) 66% 34%
Retired widows (n=271) 60% 40%
Other relatives
Pre-retirees (n=1,000) 66% 34%
Retirees (n=1,000) 86% 14%
Retired widows (n=271) 86% 14%
Others not related to you
Pre-retirees (n=1,000) 70% 30%
Retirees (n=1,000) 84% 16%
Retired widows (n=271) 83% 17%

© 2013 Society of Actuaries, All Rights Reserved Mathew Greenwald & Associates, Inc.
Page 48
Differences by Population Subgroup
Letters in superscript indicate meaningful differences between subgroups. For example, a number with
the superscript “a” indicates that the number is meaningfully higher than the corresponding number in
column (a). Comparisons are not made between pre-retiree subgroups and retiree subgroups.
Figure 63: Time Spent Providing Caregiving (Actual or Expected), by Gender Pre-Retirees Retirees
Male
(n=500)
Female
(n=500)
Male
(n=500)
Female
(n=500)
At least one hour a week (a) (b) (c) (d)
Your spouse/partner1 76% 84%a 26% 33%
c
Parents or parents-in-law 47 48 37 37
Children or grandchildren 47 64a 30 38
c
Other relatives 30 38a 14 13
Others not related to you 26 33a 13 19
c
1Pre-retiree: Male (n=391), Female (n=318); Retiree: Male (n=425), Female (n=412)
Figure 64: Time Spent Providing Caregiving (Actual or Expected), by Income Pre-Retirees Retirees
<$50K
(n=159)
$50K-
99K
(n=406)
$100K+
(n=373)
<$50K
(n=254)
$50K-
99K
(n=416)
$100K+
(n=235)
At least one hour a week (a) (b) (c) (d) (e) (f)
Your spouse/partner1 80% 77% 82% 39%ef
26% 29%
Parents or parents-in-law 43 49 47 42 34 38
Children or grandchildren 50 58 57 35 34 32
Other relatives 37 34 33 14 15 13
Others not related to you 36 29 27 17 14 18 1Pre-retiree: <$50K (n=43), $50K-99K (n=288), $100K+ (n=327); Retiree: <$50K (n=166), $50K-99K (n=372), $100K+ (n=215)
Figure 65: Time Spent Providing Caregiving (Actual or Expected), by Age Pre-Retirees Retirees
45-49
(n=324)
50-54
(n=324)
55-80
(n=352)
45-59
(n=295)
60-69
(n=374)
70-80
(n=331)
At least one hour a week (a) (b) (c) (d) (e) (f)
Your spouse/partner1 78% 80% 81% 30% 27% 32%
Parents or parents-in-law 57c 51
c 36 46
ef 38
f 29
Children or grandchildren 58 58 52 37 36 30
Other relatives 38c 34 30 16 13 12
Others not related to you 33 30 28 15 16 17 1Pre-retiree: 45-49 (n=223), 50-54 (n=232), 55-80 (n=254); Retiree: 45-59 (n=230), 60-69 (n=320), 70-80 (n=287)

© 2013 Society of Actuaries, All Rights Reserved Mathew Greenwald & Associates, Inc.
Page 49
Figure 66: Time Spent Providing Caregiving (Actual or Expected), by DB/DC Income Pre-Retirees Retirees
DB Income in
Retirement
DC Income in
Retirement
DB Income in
Retirement
DC Income in
Retirement
Yes (n=593)
No (n=407)
Yes (n=807)
No (n=193)
Yes (n=719)
No (n=281)
Yes (n=539)
No (n=461)
At least one hour a week (a) (b) (c) (d) (e) (f) (g) (h)
Your spouse/partner1 80% 79% 80% 79% 30% 28% 28% 32%
Parents or parents-in-law 47 49 48 47 36 40 38 35
Children or grandchildren 55 57 56 54 34 34 35 33
Other relatives 34 35 33 40 14 13 14 14
Others not related to you 29 32 30 30 16 15 17 15 1Pre-retiree: Yes DB (n=445), No DB (n=264), Yes DC (n=601), No DC (n=108); Retiree: Yes DB (n=628), No DB (n=209), Yes DC (n=478),
No DC (n=359)
Using household assets to help pay for caregiving for a relative or friend, not including a spouse or
partner, is relatively uncommon. Only about one in seven report having used household assets for these
purposes (14 percent for pre-retirees, 15 percent for both retirees and retired widows).
Figure 67: Using Household Assets to Pay for Caregiving Have you used any of your household assets to help pay for caregiving for a relative or friend (other than
your spouse/partner)?
14%15% 15%
Pre-retirees (n=1,000) Retirees (n=1,000) Retired widows (n=271)
Percentage Saying Yes
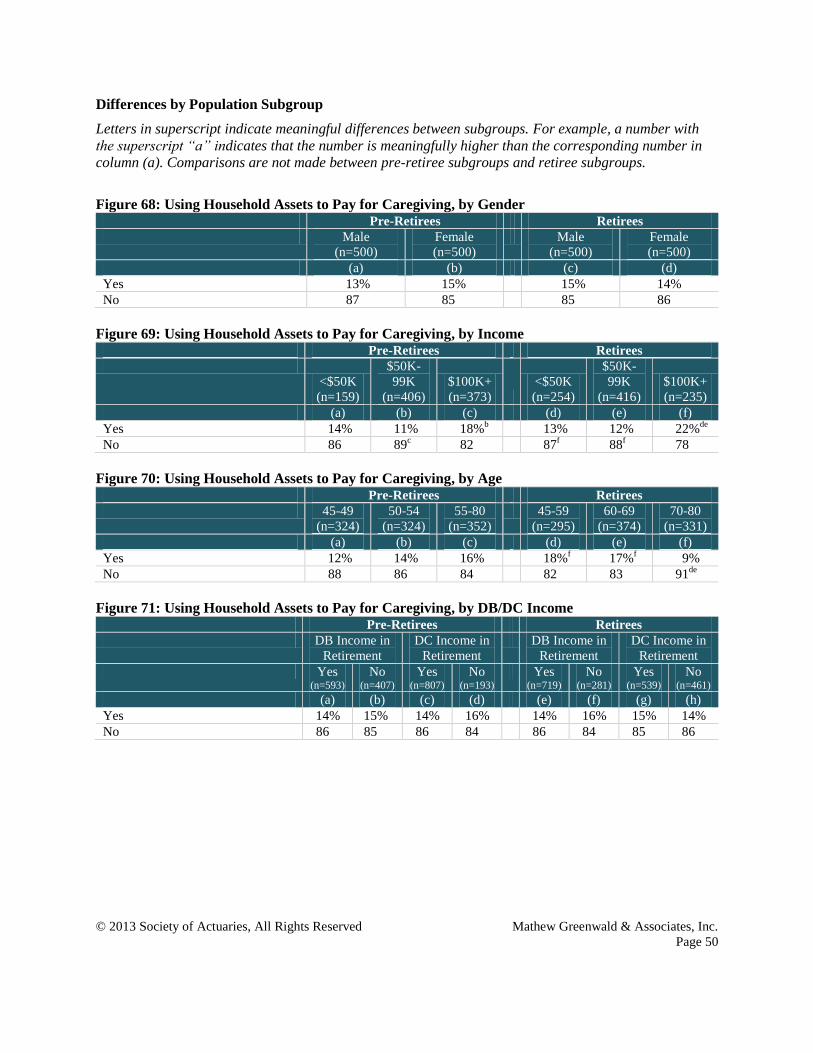
© 2013 Society of Actuaries, All Rights Reserved Mathew Greenwald & Associates, Inc.
Page 50
Differences by Population Subgroup
Letters in superscript indicate meaningful differences between subgroups. For example, a number with
the superscript “a” indicates that the number is meaningfully higher than the corresponding number in
column (a). Comparisons are not made between pre-retiree subgroups and retiree subgroups.
Figure 68: Using Household Assets to Pay for Caregiving, by Gender Pre-Retirees Retirees
Male
(n=500)
Female
(n=500)
Male
(n=500)
Female
(n=500)
(a) (b) (c) (d)
Yes 13% 15% 15% 14%
No 87 85 85 86
Figure 69: Using Household Assets to Pay for Caregiving, by Income Pre-Retirees Retirees
<$50K
(n=159)
$50K-
99K
(n=406)
$100K+
(n=373)
<$50K
(n=254)
$50K-
99K
(n=416)
$100K+
(n=235)
(a) (b) (c) (d) (e) (f)
Yes 14% 11% 18%b 13% 12% 22%
de
No 86 89c 82 87
f 88
f 78
Figure 70: Using Household Assets to Pay for Caregiving, by Age Pre-Retirees Retirees
45-49
(n=324)
50-54
(n=324)
55-80
(n=352)
45-59
(n=295)
60-69
(n=374)
70-80
(n=331)
(a) (b) (c) (d) (e) (f)
Yes 12% 14% 16% 18%f 17%
f 9%
No 88 86 84 82 83 91de
Figure 71: Using Household Assets to Pay for Caregiving, by DB/DC Income Pre-Retirees Retirees
DB Income in
Retirement
DC Income in
Retirement
DB Income in
Retirement
DC Income in
Retirement
Yes (n=593)
No (n=407)
Yes (n=807)
No (n=193)
Yes (n=719)
No (n=281)
Yes (n=539)
No (n=461)
(a) (b) (c) (d) (e) (f) (g) (h)
Yes 14% 15% 14% 16% 14% 16% 15% 14%
No 86 85 86 84 86 84 85 86

© 2013 Society of Actuaries, All Rights Reserved Mathew Greenwald & Associates, Inc.
Page 51
Naturally, a higher percentage of respondents have expectations of using household assets to help pay for
caregiving for a relative or friend in the future. A third of pre-retirees (32 percent) say they are at least
somewhat likely to use household assets in this way.
Figure 72: Likelihood of Using Household Assets to Pay for Caregiving
In the future, how likely do you think you will be to use your household assets to help pay for caregiving
for a relative or friend (other than your spouse/partner)?
Differences by Population Subgroup
Letters in superscript indicate meaningful differences between subgroups. For example, a number with
the superscript “a” indicates that the number is meaningfully higher than the corresponding number in
column (a). Comparisons are not made between pre-retiree subgroups and retiree subgroups.
Figure 73: Likelihood of Using Household Assets to Pay for Caregiving, by Gender Pre-Retirees Retirees
Male
(n=500)
Female
(n=500)
Male
(n=500)
Female
(n=500)
(a) (b) (c) (d)
Very or somewhat likely 34% 31% 27% 25%
Very likely 6 7 6 6
Somewhat likely 27 24 21 19
7%
6%
6%
26%
20%
14%
32%
26%
20%
Pre-retirees (n=1,000)
Retirees (n=1,000)
Retired widows (n=271)
Very likely Somewhat likely

© 2013 Society of Actuaries, All Rights Reserved Mathew Greenwald & Associates, Inc.
Page 52
Figure 74: Likelihood of Using Household Assets to Pay for Caregiving, by Income Pre-Retirees Retirees
<$50K
(n=159)
$50K-
99K
(n=406)
$100K+
(n=373)
<$50K
(n=254)
$50K-
99K
(n=416)
$100K+
(n=235)
(a) (b) (c) (d) (e) (f)
Very or somewhat likely 35% 28% 38%b 23% 24% 33%
de
Very likely 5 5 9ab
5 6 11de
Somewhat likely 30 22 29b 18 19 22
Figure 75: Likelihood of Using Household Assets to Pay for Caregiving, by Age Pre-Retirees Retirees
45-49
(n=324)
50-54
(n=324)
55-80
(n=352)
45-59
(n=295)
60-69
(n=374)
70-80
(n=331)
(a) (b) (c) (d) (e) (f)
Very or somewhat likely 36%c 38%
c 24% 36%
ef 24 19
Very likely 6 9 6 8 6 5
Somewhat likely 30c 29
c 19 28
ef 19 14
Figure 76: Likelihood of Using Household Assets to Pay for Caregiving, by DB/DC Income Pre-Retirees Retirees
DB Income in
Retirement
DC Income in
Retirement
DB Income in
Retirement
DC Income in
Retirement
Yes (n=593)
No (n=407)
Yes (n=807)
No (n=193)
Yes (n=719)
No (n=281)
Yes (n=539)
No (n=461)
(a) (b) (c) (d) (e) (f) (g) (h)
Very or somewhat likely 33% 31% 31% 39% 25% 28% 27% 25%
Very likely 7 7 6 8 6 8 7 6
Somewhat likely 26 25 25 30 19 20 20 19

© 2013 Society of Actuaries, All Rights Reserved Mathew Greenwald & Associates, Inc.
Page 53
Unsurprisingly, a majority of pre-retirees and retirees state that their spouse or partner would be most
likely to provide caregiving in retirement if needed (53 percent and 59 percent, respectively). Children are
the next likeliest expected caregivers for all respondents. Interestingly, respondents are more likely to
expect to receive care from a paid caregiver than from a family member who is not a spouse/partner or
child.
Figure 77: Likely Caregivers in Retirement
Suppose you, yourself, needed caregiving (in retirement). Who do you think would realistically be most
likely to provide the care you needed?
Differences by Population Subgroup
Letters in superscript indicate meaningful differences between subgroups. For example, a number with
the superscript “a” indicates that the number is meaningfully higher than the corresponding number in
column (a). Comparisons are not made between pre-retiree subgroups and retiree subgroups.
Figure 78: Likely Caregivers in Retirement, by Gender Pre-Retirees Retirees
Male
(n=500)
Female
(n=500)
Male
(n=500)
Female
(n=500)
(a) (b) (c) (d)
Your spouse/partner 63%b 44% 67%
d 51
A child or stepchild 31 45a 30 35
A paid caregiver in your home 15 15 17 25c
A paid caregiver in a facility 8 10 11 9
Another family member 8 8 7 8
A friend 4 5 2 3
Don’t know 10 10 6 11c
53%
38%
15%
9%
8%
4%
10%
59%
33%
21%
10%
7%
3%
9%
49%
34%
17%
11%
6%
14%
Your spouse/partner
Your child or stepchild
A paid caregiver in your home
A paid caregiver in a facility
Another family member
A friend
Don't know
Pre-retirees (n=1,000)
Retirees (n=1,000)
Retired widows (n=271)

© 2013 Society of Actuaries, All Rights Reserved Mathew Greenwald & Associates, Inc.
Page 54
Figure 79: Likely Caregivers in Retirement, by Income Pre-Retirees Retirees
<$50K
(n=159)
$50K-
99K
(n=406)
$100K+
(n=373)
<$50K
(n=254)
$50K-
99K
(n=416)
$100K+
(n=235)
(a) (b) (c) (d) (e) (f)
Your spouse/partner 15% 55%a 66%
ab 34% 69%
d 68%
d
A child or stepchild 37 41 35 37f 34 27
A paid caregiver in your home 13 13 18 17 20 28de
A paid caregiver in a facility 11 9 7 11 9 11
Another family member 13 9 6 11e 6 7
A friend 6 4 3 5f 2 1
Don’t know 24bc
7 6 17ef 4 5
Figure 80: Likely Caregivers in Retirement, by Age Pre-Retirees Retirees
45-49
(n=324)
50-54
(n=324)
55-80
(n=352)
45-59
(n=295)
60-69
(n=374)
70-80
(n=331)
(a) (b) (c) (d) (e) (f)
Your spouse/partner 53% 53% 52% 57% 64%f 54%
A child or stepchild 40 37 39 33 31 34
A paid caregiver in your home 16 14 14 21 20 22
A paid caregiver in a facility 8 10 9 9 7 13e
Another family member 10c 10
c 6 11
f 7 5
A friend 4 3 6 3 4 2
Don’t know 10 10 10 7 8 10
Figure 81: Likely Caregivers in Retirement, by DB/DC Income Pre-Retirees Retirees
DB Income in
Retirement
DC Income in
Retirement
DB Income in
Retirement
DC Income in
Retirement
Yes (n=593)
No (n=407)
Yes (n=807)
No (n=193)
Yes (n=719)
No (n=281)
Yes (n=539)
No (n=461)
(a) (b) (c) (d) (e) (f) (g) (h)
Your spouse/partner 55%b 49% 56%
d 41% 61%
f 51% 65%
h 52%
A child or stepchild 40 37 38 39 32 35 32 34
A paid caregiver in your home 17b 12 15 13 22 20 24
h 18
A paid caregiver in a facility 8 11 9 8 10 8 8 11
Another family member 7 10 8 9 7 9 7 8
A friend 4 5 4 6 2 4 3 3
Don’t know 9 12 9 13 8 11 6 11g
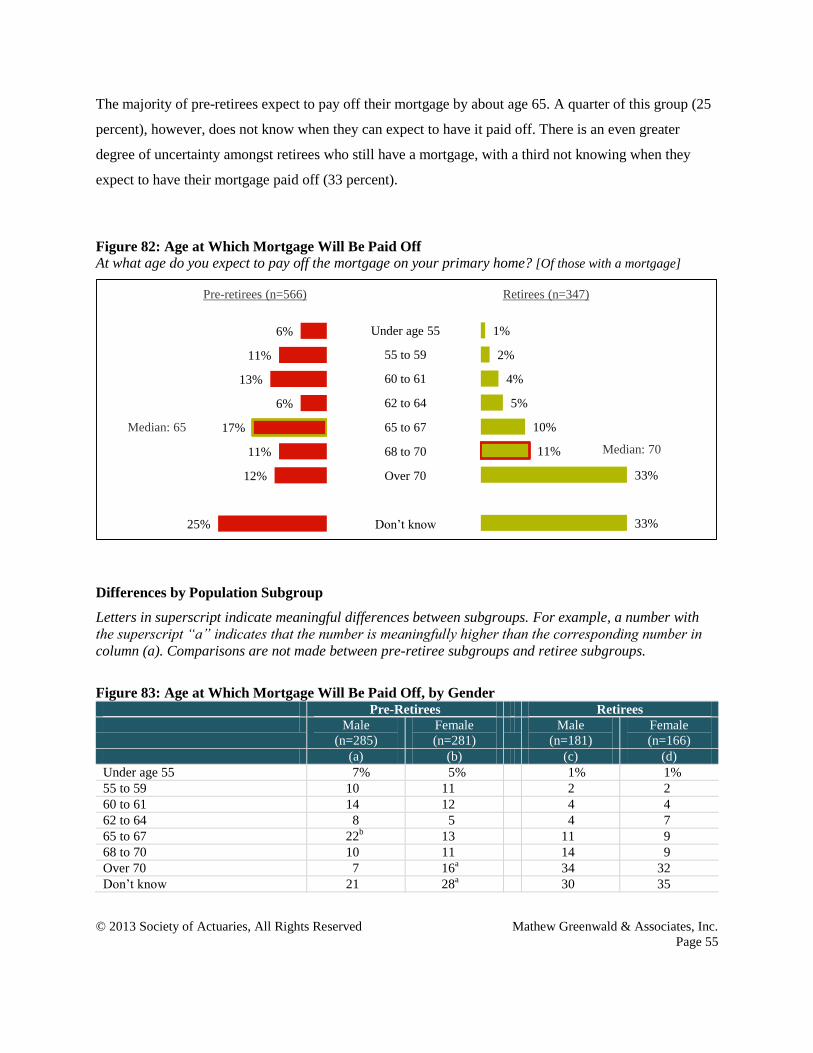
© 2013 Society of Actuaries, All Rights Reserved Mathew Greenwald & Associates, Inc.
Page 55
The majority of pre-retirees expect to pay off their mortgage by about age 65. A quarter of this group (25
percent), however, does not know when they can expect to have it paid off. There is an even greater
degree of uncertainty amongst retirees who still have a mortgage, with a third not knowing when they
expect to have their mortgage paid off (33 percent).
Figure 82: Age at Which Mortgage Will Be Paid Off
At what age do you expect to pay off the mortgage on your primary home? [Of those with a mortgage]
Differences by Population Subgroup
Letters in superscript indicate meaningful differences between subgroups. For example, a number with
the superscript “a” indicates that the number is meaningfully higher than the corresponding number in
column (a). Comparisons are not made between pre-retiree subgroups and retiree subgroups.
Figure 83: Age at Which Mortgage Will Be Paid Off, by Gender Pre-Retirees Retirees
Male
(n=285)
Female
(n=281)
Male
(n=181)
Female
(n=166)
(a) (b) (c) (d)
Under age 55 7% 5% 1% 1%
55 to 59 10 11 2 2
60 to 61 14 12 4 4
62 to 64 8 5 4 7
65 to 67 22b 13 11 9
68 to 70 10 11 14 9
Over 70 7 16a 34 32
Don’t know 21 28a 30 35
6%
11%
13%
6%
17%
11%
12%
25%
1%
2%
4%
5%
10%
11%
33%
33%
Under age 55
55 to 59
60 to 61
62 to 64
65 to 67
68 to 70
Over 70
Don’t know
Pre-retirees (n=566) Retirees (n=347)
Median: 65
Median: 70

© 2013 Society of Actuaries, All Rights Reserved Mathew Greenwald & Associates, Inc.
Page 56
Figure 84: Age at Which Mortgage Will Be Paid Off, by Income Pre-Retirees Retirees
<$50K
(n=59)
$50K-
99K
(n=228)
$100K+
(n=248)
<$50K
(n=60)
$50K-
99K
(n=159)
$100K+
(n=102)
(a) (b) (c) (d) (e) (f)
Under age 55 4% 4% 8% 2% 1% 1%
55 to 59 3 10a 13
a -- 2 4
60 to 61 11 14 13 1 5 5
62 to 64 4 4 9b 2 6 6
65 to 67 14 14 20 8 5 17e
68 to 70 11 15c 6 7 13 13
Over 70 21c 15
c 8 42 31 35
Don’t know 31 25 22 38f 36
f 20
Figure 85: Age at Which Mortgage Will Be Paid Off, by Age Pre-Retirees Retirees
45-49
(n=207)
50-54
(n=187)
55-80
(n=172)
45-59
(n=128)
60-69
(n=137)
70-80
(n=82)
(a) (b) (c) (d) (e) (f)
Under age 55 13b 4 -- 3% -- --
55 to 59 14c 14
c 3 6 -- --
60 to 61 16c 17
c 5 10
e 1% --
62 to 64 6 7 7 12e 3 --
65 to 67 15 20 17 18e 8 --
68 to 70 10 7 16b 16 15 --
Over 70 6 13a 17
a 14 41
d 49
d
Don’t know 20 19 35ab
21 32d 51
de
Figure 86: Age at Which Mortgage Will Be Paid Off, by DB/DC Income Pre-Retirees Retirees
DB Income in
Retirement
DC Income in
Retirement
DB Income in
Retirement
DC Income in
Retirement
Yes (n=355)
No (n=211)
Yes (n=486)
No (n=80)
Yes (n=257)
No (n=90)
Yes (n=208)
No (n=139)
(a) (b) (c) (d) (e) (f) (g) (h)
Under age 55 5% 7% 7%d 2% * 4% 1% 2%
55 to 59 13b 6 11 6 3% 1 3 2
60 to 61 12 14 12 16 4 5 5 3
62 to 64 5 8 7 3 6 4 5 5
65 to 67 20b 13 18 13 11 7 11 9
68 to 70 11 10 10 11 11 14 11 12
Over 70 11 13 9 26c 33 35 32 34
Don’t know 22 29 25 22 34 29 33 32

© 2013 Society of Actuaries, All Rights Reserved Mathew Greenwald & Associates, Inc.
Page 57
Four in 10 pre-retirees and half of retirees feel that it is very important to keep their primary home
because it is comfortable and familiar to them (42 percent and 55 percent, respectively). Respondents
place less importance on the ability to use the money from the home as an emergency fund or to leave the
home as inheritance.
Figure 87: Importance of Keeping Current Primary Home
How important is it for you (and your spouse) to keep your current primary home so that you can… [Of
those who own home]
Differences by Population Subgroup
Letters in superscript indicate meaningful differences between subgroups. For example, a number with
the superscript “a” indicates that the number is meaningfully higher than the corresponding number in
column (a). Comparisons are not made between pre-retiree subgroups and retiree subgroups.
Figure 88: Importance of Keeping Current Primary Home, by Gender Pre-Retirees Retirees
Male
(n=413)
Female
(n=397)
Male
(n=448)
Female
(n=440)
Very or Somewhat Important (a) (b) (c) (d)
Stay in a place that time has made
comfortable and familiar
76% 81% 84% 86%
Use the money from your home as
an emergency fund, if necessary
56 67a 51 60
c
Leave your home as an inheritance
to your children or other family
members
41 50a 47 49
42%
55%
24%
20%
23%
24%
36%
30%
38%
36%
23%
24%
78%
85%
62%
56%
46%
48%
Pre-retirees (n=810)
Retirees (n=888)
Pre-retirees (n=810)
Retirees (n=888)
Pre-retirees (n=810)
Retirees (n=888)
Very important Somewhat important
Stay in a place that time has made
comfortable and familiar
Use the money from your home as an
emergency fund, if necessary
Leave your home as an inheritance to
your children or other family members

© 2013 Society of Actuaries, All Rights Reserved Mathew Greenwald & Associates, Inc.
Page 58
Figure 89: Importance of Keeping Current Primary Home, by Income Pre-Retirees Retirees
<$50K
(n=89)
$50K-
99K
(n=321)
$100K+
(n=348)
<$50K
(n=187)
$50K-
99K
(n=386)
$100K+
(n=225)
Very or Somewhat Important (a) (b) (c) (d) (e) (f)
Stay in a place that time has made
comfortable and familiar
86%c 79% 77% 88%
f 86%
f 78%
Use the money from your home as
an emergency fund, if necessary
72c 64 59 67
ef 55 48
Leave your home as an inheritance
to your children or other family
members
54c 49
c 41 54
f 46 40
Figure 90: Importance of Keeping Current Primary Home, by Age Pre-Retirees Retirees
45-49
(n=253)
50-54
(n=262)
55-80
(n=295)
45-59
(n=252)
60-69
(n=346)
70-80
(n=290)
Very or Somewhat Important (a) (b) (c) (d) (e) (f)
Stay in a place that time has made
comfortable and familiar
78% 76% 80% 78% 85%d 91%
de
Use the money from your home as
an emergency fund, if necessary
67c 62 58 59 54 55
Leave your home as an inheritance
to your children or other family
members
48 46 43 47 45 52
Figure 91: Importance of Keeping Current Primary Home, by DB/DC Income Pre-Retirees Retirees
DB Income in
Retirement
DC Income in
Retirement
DB Income in
Retirement
DC Income in
Retirement
Yes (n=510)
No (n=300)
Yes (n=680)
No (n=130)
Yes (n=652)
No (n=236)
Yes (n=506)
No (n=382)
Very or Somewhat Important (a) (b) (c) (d) (e) (f) (g) (h)
Stay in a place that time has made
comfortable and familiar
76% 81% 77% 82% 86% 83% 85% 85%
Use the money from your home as
an emergency fund, if necessary
62 63 62 63 54 60 57 54
Leave your home as an inheritance
to your children or other family
members
49b 40 45 49 47 52 45 52
g

© 2013 Society of Actuaries, All Rights Reserved Mathew Greenwald & Associates, Inc.
Page 59
A fifth of pre-retirees (18 percent) have already made changes to their home or moved to a new home in
order to have a more suitable living arrangement as they age. Not surprisingly, retirees and retired widows
are twice as likely to have done so (36 percent and 40 percent, respectively). These changes or moves,
however, appear to be unaffected by gender and income and only slightly by age.
Figure 92: Changes Made to Primary Home or Movement to a New Home
Have you already made changes to your current home or moved to a new home that is more suitable for
you as you age?
Differences by Population Subgroup
Letters in superscript indicate meaningful differences between subgroups. For example, a number with
the superscript “a” indicates that the number is meaningfully higher than the corresponding number in
column (a). Comparisons are not made between pre-retiree subgroups and retiree subgroups.
Figure 93: Changes Made to Primary Home or Movement to a New Home, by Gender Pre-Retirees Retirees
Male
(n=500)
Female
(n=500)
Male
(n=500)
Female
(n=500)
(a) (b) (c) (d)
Yes 18% 19% 34% 38%
No 82 81 66 62
18%
36%
40%
Pre-retirees (n=1,000) Retirees (n=1,000) Retired widows (n=271)
Percentage Saying Yes

© 2013 Society of Actuaries, All Rights Reserved Mathew Greenwald & Associates, Inc.
Page 60
Figure 94: Changes Made to Primary Home or Movement to a New Home, by Income Pre-Retirees Retirees
<$50K
(n=159)
$50K-
99K
(n=406)
$100K+
(n=373)
<$50K
(n=254)
$50K-
99K
(n=416)
$100K+
(n=235)
(a) (b) (c) (d) (e) (f)
Yes 18% 18% 19% 35% 39% 33%
No 82 82 81 65 61 67
Figure 95: Changes Made to Primary Home or Movement to a New Home, by Age Pre-Retirees Retirees
45-49
(n=324)
50-54
(n=324)
55-80
(n=352)
45-59
(n=295)
60-69
(n=374)
70-80
(n=331)
(a) (b) (c) (d) (e) (f)
Yes 16% 15% 24%ab
29% 45%df
34%
No 84c 85
c 76 71
e 55 66
e
Figure 96: Changes Made to Primary Home or Movement to a New Home, by DB/DC Income Pre-Retirees Retirees
DB Income in
Retirement
DC Income in
Retirement
DB Income in
Retirement
DC Income in
Retirement
Yes (n=593)
No (n=407)
Yes (n=807)
No (n=193)
Yes (n=719)
No (n=281)
Yes (n=539)
No (n=461)
(a) (b) (c) (d) (e) (f) (g) (h)
Yes 20% 17% 18% 21% 36% 37% 39% 34%
No 80 83 82 79 64 63 61 66
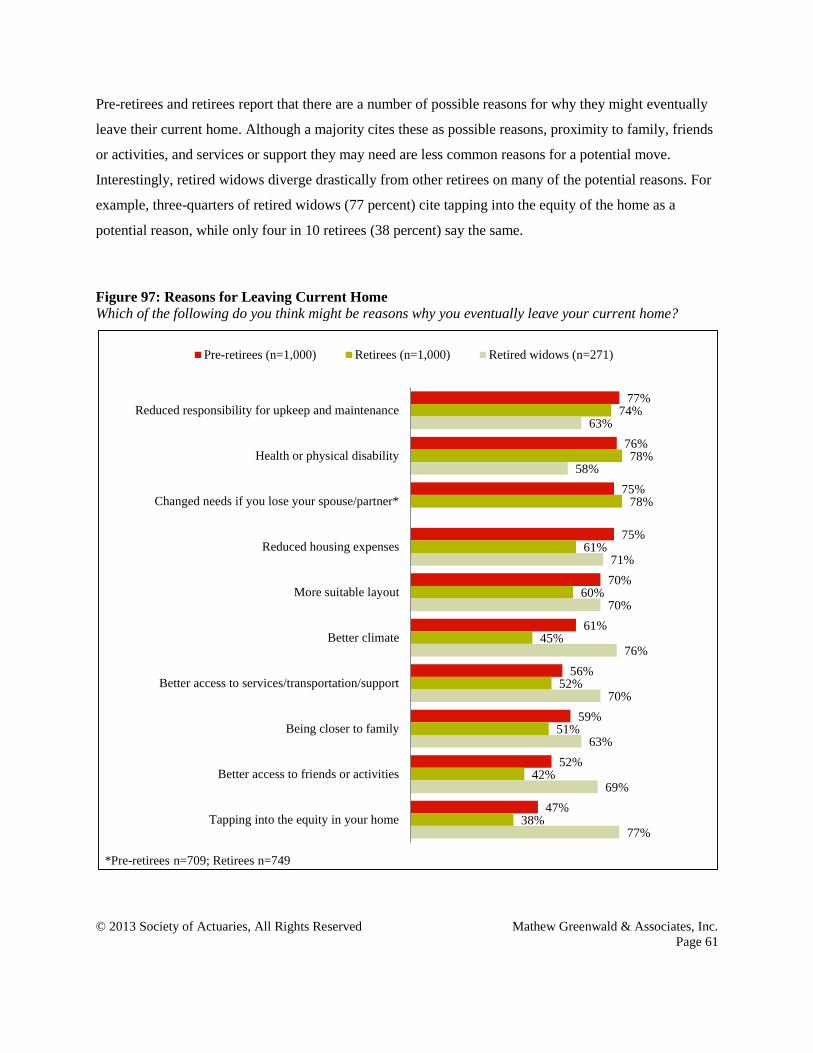
© 2013 Society of Actuaries, All Rights Reserved Mathew Greenwald & Associates, Inc.
Page 61
Pre-retirees and retirees report that there are a number of possible reasons for why they might eventually
leave their current home. Although a majority cites these as possible reasons, proximity to family, friends
or activities, and services or support they may need are less common reasons for a potential move.
Interestingly, retired widows diverge drastically from other retirees on many of the potential reasons. For
example, three-quarters of retired widows (77 percent) cite tapping into the equity of the home as a
potential reason, while only four in 10 retirees (38 percent) say the same.
Figure 97: Reasons for Leaving Current Home
Which of the following do you think might be reasons why you eventually leave your current home?
77%
76%
75%
75%
70%
61%
56%
59%
52%
47%
74%
78%
78%
61%
60%
45%
52%
51%
42%
38%
63%
58%
71%
70%
76%
70%
63%
69%
77%
Reduced responsibility for upkeep and maintenance
Health or physical disability
Changed needs if you lose your spouse/partner*
Reduced housing expenses
More suitable layout
Better climate
Better access to services/transportation/support
Being closer to family
Better access to friends or activities
Tapping into the equity in your home
Pre-retirees (n=1,000) Retirees (n=1,000) Retired widows (n=271)
*Pre-retirees n=709; Retirees n=749

© 2013 Society of Actuaries, All Rights Reserved Mathew Greenwald & Associates, Inc.
Page 62
Differences by Population Subgroup
Letters in superscript indicate meaningful differences between subgroups. For example, a number with
the superscript “a” indicates that the number is meaningfully higher than the corresponding number in
column (a). Comparisons are not made between pre-retiree subgroups and retiree subgroups.
Figure 98: Reasons for Leaving Current Home, by Gender Pre-Retirees Retirees
Male
(n=500)
Female
(n=500)
Male
(n=500)
Female
(n=500)
Major or Minor Reason (a) (b) (c) (d)
Reduced responsibility for upkeep
and maintenance
73% 80%a 74% 74%
Health or physical disability 72 79a 76 81
Changed needs if you lose your
spouse/partner1
68 82a 76 79
Reduced housing expenses 72 76 65d 57
More suitable layout 69 70 63 57
Better climate 62 60 50d 41
Being closer to family 58 59 50 52
Better access to services/
transportation/support
53 58 54 51
Better access to friends or activities 50 54 44 40
Tapping into the equity in your
home
48 47 40 36
1Pre-retiree: Male (n=391), Female (n=318); Retiree: Male (n=408), Female (n=341)
Figure 99: Reasons for Leaving Current Home, by Income Pre-Retirees Retirees
<$50K
(n=159)
$50K-
99K
(n=406)
$100K+
(n=373)
<$50K
(n=254)
$50K-
99K
(n=416)
$100K+
(n=235)
Major or Minor Reason (a) (b) (c) (d) (e) (f)
Reduced responsibility for upkeep
and maintenance
71% 74% 82%ab
68% 74% 81%de
Health or physical disability 77 75 76 77 79 80
Changed needs if you lose your
spouse/partner1
70 75 76 73 78 80
Reduced housing expenses 79c 78
c 69 63 61 62
More suitable layout 68 67 74b 55 61 64
d
Better climate 57 62 62 45 45 51
Being closer to family 57 61 58 50 53 51
Better access to services/
transportation/support
62 55 54 47 53 58d
Better access to friends or activities 51 52 55 40 43 46
Tapping into the equity in your
home
41 47 51a 36 40 40
1Pre-retiree: <$50K (n=43), $50K-99K (n=288), $100K+ (n=327); Retiree: <$50K (n=120), $50K-99K (n=349), $100K+ (n=206)
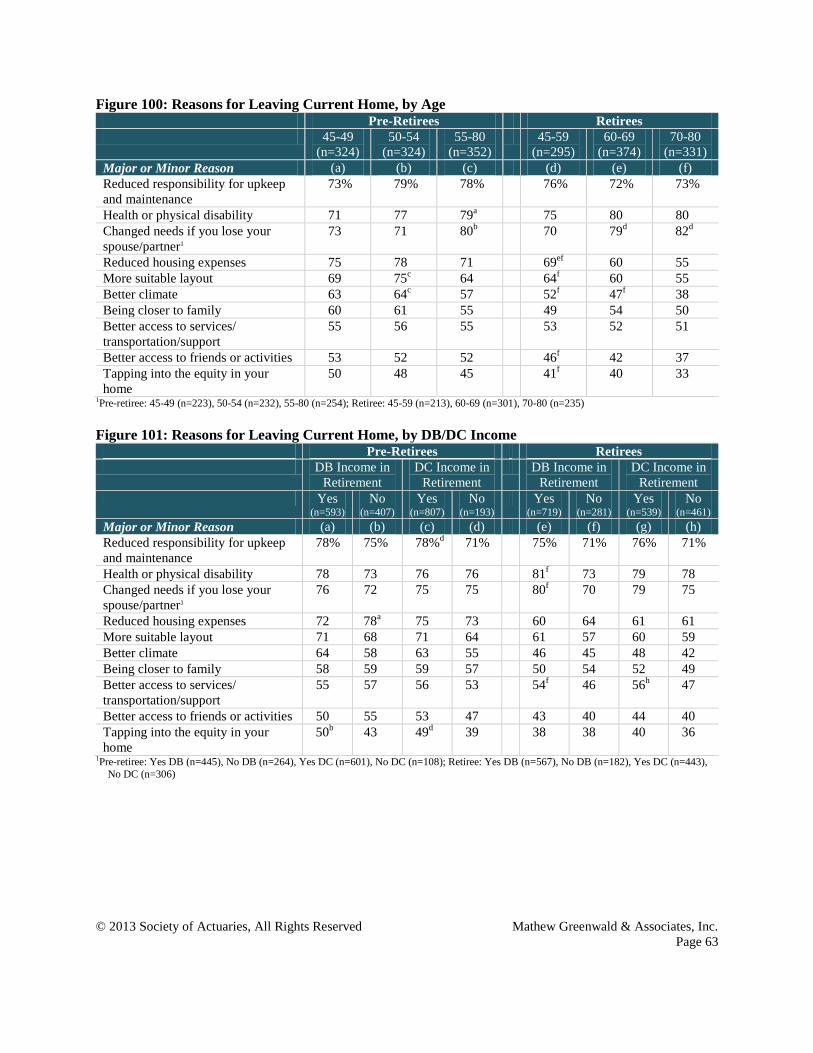
© 2013 Society of Actuaries, All Rights Reserved Mathew Greenwald & Associates, Inc.
Page 63
Figure 100: Reasons for Leaving Current Home, by Age Pre-Retirees Retirees
45-49
(n=324)
50-54
(n=324)
55-80
(n=352)
45-59
(n=295)
60-69
(n=374)
70-80
(n=331)
Major or Minor Reason (a) (b) (c) (d) (e) (f)
Reduced responsibility for upkeep
and maintenance
73% 79% 78% 76% 72% 73%
Health or physical disability 71 77 79a 75 80 80
Changed needs if you lose your
spouse/partner1
73 71 80b 70 79
d 82
d
Reduced housing expenses 75 78 71 69ef 60 55
More suitable layout 69 75c 64 64
f 60 55
Better climate 63 64c 57 52
f 47
f 38
Being closer to family 60 61 55 49 54 50
Better access to services/
transportation/support
55 56 55 53 52 51
Better access to friends or activities 53 52 52 46f 42 37
Tapping into the equity in your
home
50 48 45 41f 40 33
1Pre-retiree: 45-49 (n=223), 50-54 (n=232), 55-80 (n=254); Retiree: 45-59 (n=213), 60-69 (n=301), 70-80 (n=235)
Figure 101: Reasons for Leaving Current Home, by DB/DC Income Pre-Retirees Retirees
DB Income in
Retirement
DC Income in
Retirement
DB Income in
Retirement
DC Income in
Retirement
Yes (n=593)
No (n=407)
Yes (n=807)
No (n=193)
Yes (n=719)
No (n=281)
Yes (n=539)
No (n=461)
Major or Minor Reason (a) (b) (c) (d) (e) (f) (g) (h)
Reduced responsibility for upkeep
and maintenance
78% 75% 78%d 71% 75% 71% 76% 71%
Health or physical disability 78 73 76 76 81f 73 79 78
Changed needs if you lose your
spouse/partner1
76 72 75 75 80f 70 79 75
Reduced housing expenses 72 78a 75 73 60 64 61 61
More suitable layout 71 68 71 64 61 57 60 59
Better climate 64 58 63 55 46 45 48 42
Being closer to family 58 59 59 57 50 54 52 49
Better access to services/
transportation/support
55 57 56 53 54f 46 56
h 47
Better access to friends or activities 50 55 53 47 43 40 44 40
Tapping into the equity in your
home
50b 43 49
d 39 38 38 40 36
1Pre-retiree: Yes DB (n=445), No DB (n=264), Yes DC (n=601), No DC (n=108); Retiree: Yes DB (n=567), No DB (n=182), Yes DC (n=443),
No DC (n=306)
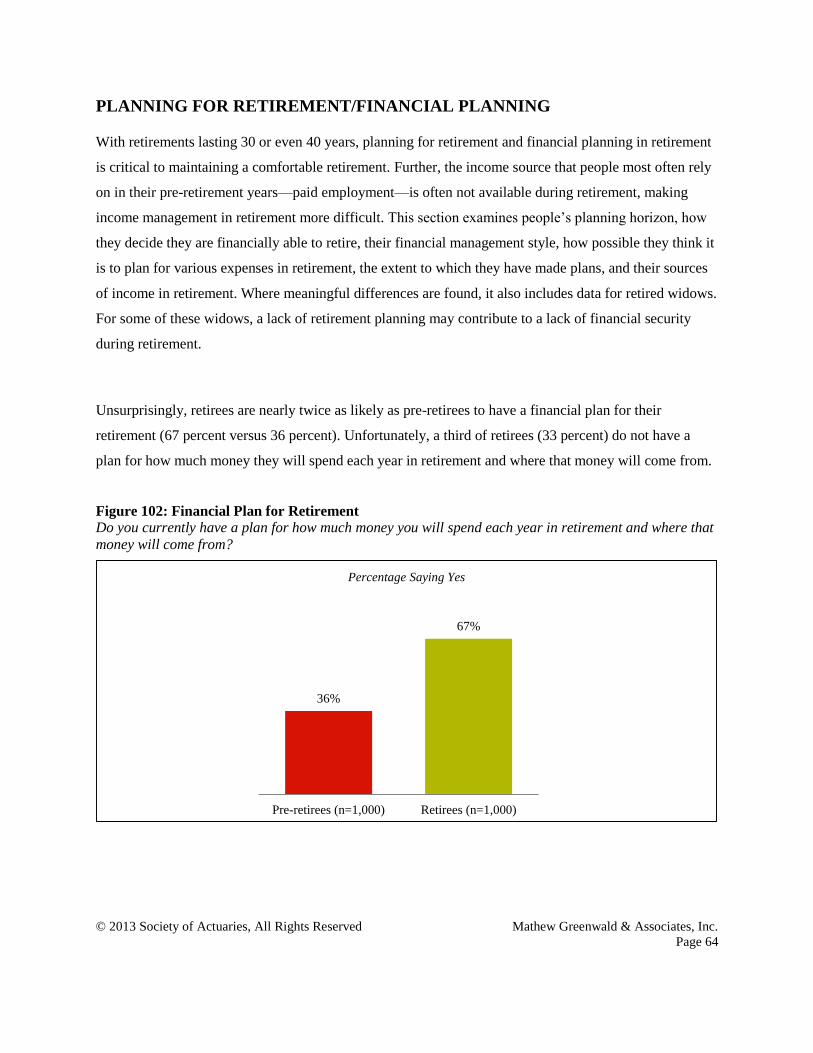
© 2013 Society of Actuaries, All Rights Reserved Mathew Greenwald & Associates, Inc.
Page 64
PLANNING FOR RETIREMENT/FINANCIAL PLANNING
With retirements lasting 30 or even 40 years, planning for retirement and financial planning in retirement
is critical to maintaining a comfortable retirement. Further, the income source that people most often rely
on in their pre-retirement years—paid employment—is often not available during retirement, making
income management in retirement more difficult. This section examines people’s planning horizon, how
they decide they are financially able to retire, their financial management style, how possible they think it
is to plan for various expenses in retirement, the extent to which they have made plans, and their sources
of income in retirement. Where meaningful differences are found, it also includes data for retired widows.
For some of these widows, a lack of retirement planning may contribute to a lack of financial security
during retirement.
Unsurprisingly, retirees are nearly twice as likely as pre-retirees to have a financial plan for their
retirement (67 percent versus 36 percent). Unfortunately, a third of retirees (33 percent) do not have a
plan for how much money they will spend each year in retirement and where that money will come from.
Figure 102: Financial Plan for Retirement
Do you currently have a plan for how much money you will spend each year in retirement and where that
money will come from?
36%
67%
Pre-retirees (n=1,000) Retirees (n=1,000)
Percentage Saying Yes

© 2013 Society of Actuaries, All Rights Reserved Mathew Greenwald & Associates, Inc.
Page 65
Differences by Population Subgroup
Letters in superscript indicate meaningful differences between subgroups. For example, a number with
the superscript “a” indicates that the number is meaningfully higher than the corresponding number in
column (a). Comparisons are not made between pre-retiree subgroups and retiree subgroups.
Figure 103: Financial Plan for Retirement, by Gender Pre-Retirees Retirees
Male
(n=500)
Female
(n=500)
Male
(n=500)
Female
(n=500)
(a) (b) (c) (d)
Yes 43%b 30% 67% 66%
No 57 70a 33 34
Figure 104: Financial Plan for Retirement, by Income Pre-Retirees Retirees
<$50K
(n=159)
$50K-
99K
(n=406)
$100K+
(n=373)
<$50K
(n=254)
$50K-
99K
(n=416)
$100K+
(n=235)
(a) (b) (c) (d) (e) (f)
Yes 18% 33%a 48%
ab 50% 72%
d 74%
d
No 82bc
67c 52 50
ef 28 26
Figure 105: Financial Plan for Retirement, by Age Pre-Retirees Retirees
45-49
(n=324)
50-54
(n=324)
55-80
(n=352)
45-59
(n=295)
60-69
(n=374)
70-80
(n=331)
(a) (b) (c) (d) (e) (f)
Yes 31% 32% 45%ab
58% 73%d 67%
d
No 69c 68
c 55 42
ef 27 33
Figure 106: Financial Plan for Retirement, by DB/DC Income Pre-Retirees Retirees
DB Income in
Retirement
DC Income in
Retirement
DB Income in
Retirement
DC Income in
Retirement
Yes (n=593)
No (n=407)
Yes (n=807)
No (n=193)
Yes (n=719)
No (n=281)
Yes (n=539)
No (n=461)
(a) (b) (c) (d) (e) (f) (g) (h)
Yes 42%b 28% 39%
d 26% 69%
f 61% 74%
h 58%
No 58 72a 61 74
c 31 39
e 26 42
g

© 2013 Society of Actuaries, All Rights Reserved Mathew Greenwald & Associates, Inc.
Page 66
For both pre-retirees and retirees, the time horizon for financial planning is about 10 years on average.
However, for both groups, roughly one in 10 (7 percent of pre-retirees and 8 percent of retirees) don’t
think ahead at all and three in 10 (27 percent and 29 percent, respectively) say they haven’t thought about
it.
Figure 107: Time Horizon for Financial Planning
When you (and your spouse/partner) make important financial decisions, such as when you think about
whether you can afford to retire or to purchase a new home, about how many years do you look into the
future?
Differences by Population Subgroup
Letters in superscript indicate meaningful differences between subgroups. For example, a number with
the superscript “a” indicates that the number is meaningfully higher than the corresponding number in
column (a). Comparisons are not made between pre-retiree subgroups and retiree subgroups.
Figure 108: Time Horizon for Financial Planning, by Gender Pre-Retirees Retirees
Male
(n=500)
Female
(n=500)
Male
(n=500)
Female
(n=500)
(a) (b) (c) (d)
<5 years 4% 4% 9% 8%
5 to 9 16 18 15 14
10 to 14 20 19 19 15
15 to 19 8 8 4 6
20 or more 18 17 18 18
You don’t plan ahead 7 7 8 8
Haven’t thought about it 27 27 26 32
4%
17%
19%
8%
17%
7%
27%
8%
15%
17%
5%
18%
8%
29%
<5 years
5 to 9
10 to 14
15 to 19
20 or more
You don’t plan ahead
Haven’t thought about it
Pre-retirees (n=1,000) Retirees (n=1,000)
Median: 10 Median: 10

© 2013 Society of Actuaries, All Rights Reserved Mathew Greenwald & Associates, Inc.
Page 67
Figure 109: Time Horizon for Financial Planning, by Income Pre-Retirees Retirees
<$50K
(n=159)
$50K-
99K
(n=406)
$100K+
(n=373)
<$50K
(n=254)
$50K-
99K
(n=416)
$100K+
(n=235)
(a) (b) (c) (d) (e) (f)
<5 years 3% 5% 3% 7% 10% 7%
5 to 9 16 16 19 14 13 17
10 to 14 16 18 23a 12 20
d 21
d
15 to 19 4 7 11a 3 4 9
de
20 or more 10 18a 21
a 10 19
d 24
d
You don’t plan ahead 15bc
7c 3 13
ef 7 6
Haven’t thought about it 36c 29
c 20 41
ef 27
f 16
Figure 110: Time Horizon for Financial Planning, by Age Pre-Retirees Retirees
45-49
(n=324)
50-54
(n=324)
55-80
(n=352)
45-59
(n=295)
60-69
(n=374)
70-80
(n=331)
(a) (b) (c) (d) (e) (f)
<5 years 1% 5%a 6%
a 8% 10% 7%
5 to 9 14 13 23ab
15 16 13
10 to 14 21 21 16 17 17 16
15 to 19 7 11 7 5 6 5
20 or more 23bc
14 16 22f 21
f 10
You don’t plan ahead 6 9 6 7 6 10
Haven’t thought about it 29 27 26 26 23 37de
Figure 111: Time Horizon for Financial Planning, by DB/DC Income Pre-Retirees Retirees
DB Income in
Retirement
DC Income in
Retirement
DB Income in
Retirement
DC Income in
Retirement
Yes (n=593)
No (n=407)
Yes (n=807)
No (n=193)
Yes (n=719)
No (n=281)
Yes (n=539)
No (n=461)
(a) (b) (c) (d) (e) (f) (g) (h)
<5 years 3% 5% 3% 6% 8% 9% 7% 10%
5 to 9 18 16 17 17 15 14 16 13
10 to 14 21 17 20 16 18 15 20h 14
15 to 19 9 6 8 8 5 5 6 4
20 or more 18 17 19d 8 18 17 22
h 13
You don’t plan ahead 5 10a 5 16
c 7 9 6 10
g
Haven’t thought about it 26 29 27 28 28 31 23 36g

© 2013 Society of Actuaries, All Rights Reserved Mathew Greenwald & Associates, Inc.
Page 68
The most common source of expected income or the actual source in retirement is Social Security (90
percent of pre-retirees and 89 percent of retirees). Pre-retirees expect to receive income from an
employer-sponsored retirement savings plan more than retirees (81 percent and 53 percent, respectively),
while the opposite is true of pension plans (59 percent and 73 percent, respectively). Meanwhile, pre-
retirees are twice as likely to expect income from work in retirement than retirees report actually
receiving (57 percent and 28 percent, respectively).
Figure 112: Sources of Income in Retirement (Actual or Expected)
Which of the following (do you expect will be/are) sources of income for your (and your
spouse’s/partner’s) retirement?
90%
81%
59%
57%
55%
39%
19%
19%
8%
89%
53%
73%
28%
57%
42%
24%
17%
6%
Social Security benefits
Employer-sponsored retirement savings plan
Defined-benefit pension plan
Employment in retirement, including self-employment
IRA or Roth IRA
Taxable investment or bank accounts
Payout annuity
Rental property or real estate (excluding your primary
home)
A reverse mortgage or home equity loan
Pre-retirees (n=1,000)
Retirees (n=1,000)

© 2013 Society of Actuaries, All Rights Reserved Mathew Greenwald & Associates, Inc.
Page 69
Differences by Population Subgroup
Letters in superscript indicate meaningful differences between subgroups. For example, a number with
the superscript “a” indicates that the number is meaningfully higher than the corresponding number in
column (a). Comparisons are not made between pre-retiree subgroups and retiree subgroups.
Figure 113: Sources of Income in Retirement (Actual or Expected), by Gender Pre-Retirees Retirees
Male
(n=500)
Female
(n=500)
Male
(n=500)
Female
(n=500)
(a) (b) (c) (d)
Social Security benefits 89% 92% 87% 90%
Employer-sponsored retirement
savings plan
82 80 56 51
Defined-benefit pension plan 59 60 73 72
Employment in retirement,
including self-employment
57 58 30 26
IRA or Roth IRA 57 53 58 56
Taxable investment or bank
accounts
45b 34 44 40
Payout annuity 19 19 25 24
Rental property or real estate
(excluding your primary home)
21 16 18 15
A reverse mortgage or home equity
loan
9 7 5 7
Figure 114: Sources of Income in Retirement (Actual or Expected), by Income Pre-Retirees Retirees
<$50K
(n=159)
$50K-
99K
(n=406)
$100K+
(n=373)
<$50K
(n=254)
$50K-
99K
(n=416)
$100K+
(n=235)
(a) (b) (c) (d) (e) (f)
Social Security benefits 94% 90% 90% 90% 90% 85%
Employer-sponsored retirement
savings plan
50 82a 92
ab 33 55
d 74
de
Defined-benefit pension plan 41 60a 67
ab 56 80
d 76
d
Employment in retirement,
including self-employment
60 57 59 19 29d 38
de
IRA or Roth IRA 32 48a 72
ab 44 60
d 67
d
Taxable investment or bank
accounts
18 35a 54
ab 46 42
d 57
de
Payout annuity 13 16 24ab
20 24 28d
Rental property or real estate
(excluding your primary home)
14 16 25ab
5 17d 27
de
A reverse mortgage or home equity
loan
8 9 8 6 8 5

© 2013 Society of Actuaries, All Rights Reserved Mathew Greenwald & Associates, Inc.
Page 70
Figure 115: Sources of Income in Retirement (Actual or Expected), by Age Pre-Retirees Retirees
45-49
(n=324)
50-54
(n=324)
55-80
(n=352)
45-59
(n=295)
60-69
(n=374)
70-80
(n=331)
(a) (b) (c) (d) (e) (f)
Social Security benefits 86% 89% 96%ab
73% 93%d 98%
de
Employer-sponsored retirement
savings plan
83 80 79 56f 57
f 46
Defined-benefit pension plan 59 60 59 70 74 73
Employment in retirement,
including self-employment
54 59 59 40ef 31
f 14
IRA or Roth IRA 49 53 62ab
48 58d 64
d
Taxable investment or bank
accounts
39 36 43 42 43 40
Payout annuity 15 18 23a 21 25 27
Rental property or real estate
(excluding your primary home)
19 18 19 22f 17
f 11
A reverse mortgage or home equity
loan
9 7 8 8 4 6
Figure 116: Sources of Income in Retirement (Actual or Expected), by DB/DC Income Pre-Retirees Retirees
DB Income in
Retirement
DC Income in
Retirement
DB Income in
Retirement
DC Income in
Retirement
Yes (n=593)
No (n=407)
Yes (n=807)
No (n=193)
Yes (n=719)
No (n=281)
Yes (n=539)
No (n=461)
(a) (b) (c) (d) (e) (f) (g) (h)
Social Security benefits 90% 91% 90% 91% 89% 88% 91%h 86%
Employer-sponsored retirement
savings plan
87b 71 100 -- 59
f 37 100 --
Defined-benefit pension plan 100 -- 64d 39 100 -- 81
h 63
Employment in retirement,
including self-employment
55 60 57 56 28 28 33h 22
IRA or Roth IRA 56 54 60d 33 60
f 49 70
h 42
Taxable investment or bank
accounts (not including a checking
or savings account)
38 41 42d 29 43 39 51
h 32
Payout annuity 22b 14 19 16 25 23 28
h 20
Rental property or real estate
(excluding your primary home)
18 19 18 20 16 19 18 15
A reverse mortgage or home equity
loan
6 11a 8 10 6 7 6 6

© 2013 Society of Actuaries, All Rights Reserved Mathew Greenwald & Associates, Inc.
Page 71
Roughly four in 10 pre-retirees and retirees (36 percent and 43 percent, respectively) plan to maintain
their financial assets by withdrawing only earnings and leaving the principal intact. This is the most
common plan for managing financial assets for each group.
Figure 117: Plan for Managing Financial Assets
Which one of the following best describes how you plan to manage your financial assets (in retirement)?
Differences by Population Subgroup
Letters in superscript indicate meaningful differences between subgroups. For example, a number with
the superscript “a” indicates that the number is meaningfully higher than the corresponding number in
column (a). Comparisons are not made between pre-retiree subgroups and retiree subgroups.
Figure 118: Plan for Managing Financial Assets, by Gender Pre-Retirees Retirees
Male
(n=500)
Female
(n=500)
Male
(n=500)
Female
(n=500)
(a) (b) (c) (d)
You plan to maintain your financial
assets by withdrawing only earnings
and leaving the principal intact
18% 26%a 43% 43%
You plan to grow your financial
assets by saving more money or not
withdrawing earnings
40b 33 19 24
c
You plan to spend down your
financial assets
26b 18 24 20
You have no plan for managing your
financial assets
16 24a 14 13
36%
22%
22%
20%
43%
22%
22%
13%
You plan to maintain your financial assets by
withdrawing only earnings and leaving the principal
intact
You plan to grow your financial assets by saving more
money or not withdrawing earnings
You plan to spend down your financial assets
You have no plan for managing your financial assets
Pre-retirees (n=1,000)
Retirees (n=1,000)

© 2013 Society of Actuaries, All Rights Reserved Mathew Greenwald & Associates, Inc.
Page 72
Figure 119: Plan for Managing Financial Assets, by Income Pre-Retirees Retirees
<$50K
(n=159)
$50K-
99K
(n=406)
$100K+
(n=373)
<$50K
(n=254)
$50K-
99K
(n=416)
$100K+
(n=235)
(a) (b) (c) (d) (e) (f)
You plan to maintain your financial
assets by withdrawing only earnings
and leaving the principal intact
26% 24% 19% 32% 47%d 44%
d
You plan to grow your financial
assets by saving more money or not
withdrawing earnings
18 35a 45
ab 15 22
d 28
d
You plan to spend down your
financial assets
18 20 26a 24 23 22
You have no plan for managing
your financial assets
39bc
21c 10 29
ef 9 6
Figure 120: Plan for Managing Financial Assets, by Age Pre-Retirees Retirees
45-49
(n=324)
50-54
(n=324)
55-80
(n=352)
45-59
(n=295)
60-69
(n=374)
70-80
(n=331)
(a) (b) (c) (d) (e) (f)
You plan to maintain your financial
assets by withdrawing only earnings
and leaving the principal intact
26%c 23% 17% 35% 46%
d 47%
d
You plan to grow your financial
assets by saving more money or not
withdrawing earnings
34 34 40 30ef 19 18
You plan to spend down your
financial assets
19 21 25a 18 25
d 22
You have no plan for managing
your financial assets
21 22 17 18e 10 13
Figure 121: Plan for Managing Financial Assets, by DB/DC Income Pre-Retirees Retirees
DB Income in
Retirement
DC Income in
Retirement
DB Income in
Retirement
DC Income in
Retirement
Yes (n=593)
No (n=407)
Yes (n=807)
No (n=193)
Yes (n=719)
No (n=281)
Yes (n=539)
No (n=461)
(a) (b) (c) (d) (e) (f) (g) (h)
You plan to maintain your financial
assets by withdrawing only
earnings and leaving the principal
intact
41%b 29% 40%
d 23% 45%
f 36% 50%
h 35%
You plan to grow your financial
assets by saving more money or not
withdrawing earnings
23 21 23 19 25f 14 21 23
You plan to spend down your
financial assets
19 26a 22 21 20 27
e 24 20
You have no plan for managing
your financial assets
17 24a 16 37
c 10 22
e 6 22
g

© 2013 Society of Actuaries, All Rights Reserved Mathew Greenwald & Associates, Inc.
Page 73
For pre-retirees and retirees alike, the most common financial issue weighing on the decision to retire is
the determination of being able to pay monthly bills (87 percent and 73 percent, respectively). Pre-retirees
think that the determination of having accumulated enough money to last throughout retirement would
similarly affect their decision (87 percent). Interestingly, this determination mattered for only six in 10
retirees (59 percent). There is a sizable gap between pre-retirees and retirees across all of the financial
issues, however, perhaps reflecting the difference between pre-retirement “what-ifs” and an often simpler
reconciliation to reality once retired.
Figure 122: Impact of Financial Issues on Decision to Retire
How much (do you think each of the following financial issues will/did each of the following financial
issues) affect your decision to retire when you (do/did)? [Of those who gave retirement age]
Differences by Population Subgroup
Letters in superscript indicate meaningful differences between subgroups. For example, a number with
the superscript “a” indicates that the number is meaningfully higher than the corresponding number in
column (a). Comparisons are not made between pre-retiree subgroups and retiree subgroups.
87%
87%
76%
73%
69%
64%
53%
48%
73%
59%
42%
36%
51%
21%
23%
19%
Determining you would be able to pay your monthly bills
Determining that you had accumulated enough money to
last for your full retirement
Becoming eligible for Social Security
Becoming eligible for Medicare or retiree health benefits
from your employer
Becoming eligible for benefits from your traditional
pension or defined-benefit plan
Receiving a financial incentive to retire from your
employer
Financial adviser informing you that you are financially
able to retire
Becoming eligible for benefits from an annuity Pre-retirees (n=847)
Retirees (n=946)
Percentage Saying A Great Deal or Somewhat
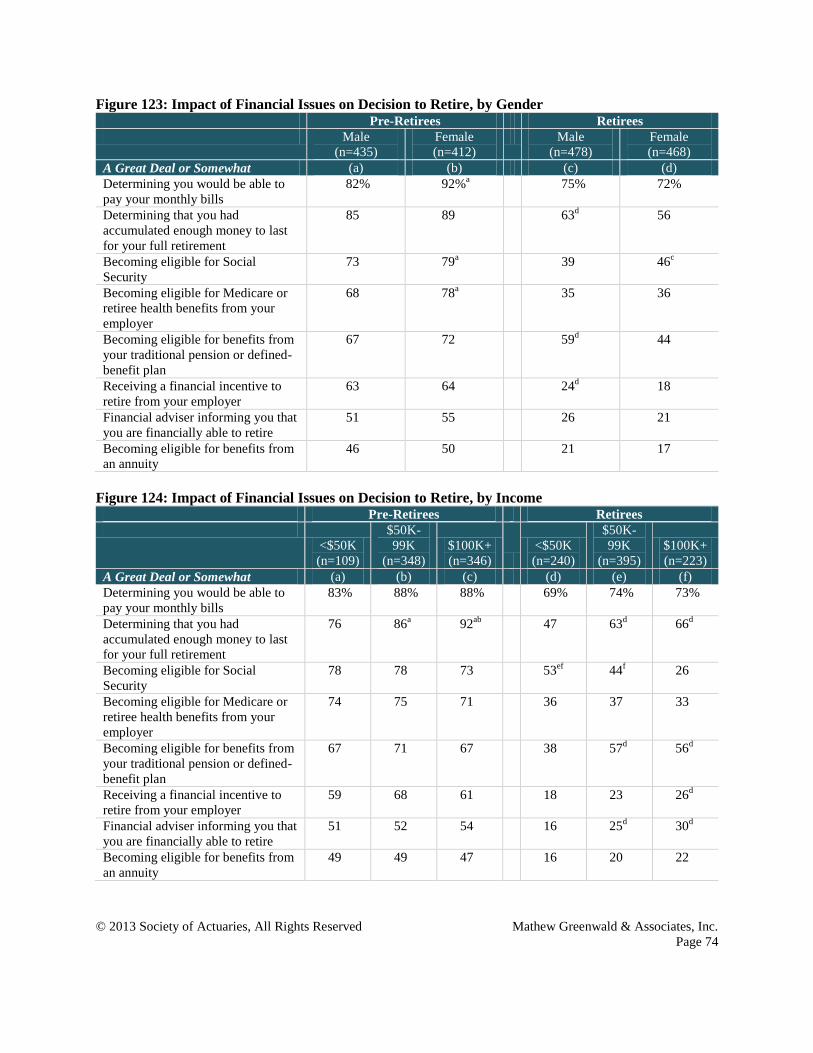
© 2013 Society of Actuaries, All Rights Reserved Mathew Greenwald & Associates, Inc.
Page 74
Figure 123: Impact of Financial Issues on Decision to Retire, by Gender Pre-Retirees Retirees
Male
(n=435)
Female
(n=412)
Male
(n=478)
Female
(n=468)
A Great Deal or Somewhat (a) (b) (c) (d)
Determining you would be able to
pay your monthly bills
82% 92%a 75% 72%
Determining that you had
accumulated enough money to last
for your full retirement
85 89 63d 56
Becoming eligible for Social
Security
73 79a 39 46
c
Becoming eligible for Medicare or
retiree health benefits from your
employer
68 78a 35 36
Becoming eligible for benefits from
your traditional pension or defined-
benefit plan
67 72 59d 44
Receiving a financial incentive to
retire from your employer
63 64 24d 18
Financial adviser informing you that
you are financially able to retire
51 55 26 21
Becoming eligible for benefits from
an annuity
46 50 21 17
Figure 124: Impact of Financial Issues on Decision to Retire, by Income Pre-Retirees Retirees
<$50K
(n=109)
$50K-
99K
(n=348)
$100K+
(n=346)
<$50K
(n=240)
$50K-
99K
(n=395)
$100K+
(n=223)
A Great Deal or Somewhat (a) (b) (c) (d) (e) (f)
Determining you would be able to
pay your monthly bills
83% 88% 88% 69% 74% 73%
Determining that you had
accumulated enough money to last
for your full retirement
76 86a 92
ab 47 63
d 66
d
Becoming eligible for Social
Security
78 78 73 53ef 44
f 26
Becoming eligible for Medicare or
retiree health benefits from your
employer
74 75 71 36 37 33
Becoming eligible for benefits from
your traditional pension or defined-
benefit plan
67 71 67 38 57d 56
d
Receiving a financial incentive to
retire from your employer
59 68 61 18 23 26d
Financial adviser informing you that
you are financially able to retire
51 52 54 16 25d 30
d
Becoming eligible for benefits from
an annuity
49 49 47 16 20 22

© 2013 Society of Actuaries, All Rights Reserved Mathew Greenwald & Associates, Inc.
Page 75
Figure 125: Impact of Financial Issues on Decision to Retire, by Age Pre-Retirees Retirees
45-49
(n=280)
50-54
(n=270)
55-80
(n=297)
45-59
(n=264)
60-69
(n=357)
70-80
(n=325)
A Great Deal or Somewhat (a) (b) (c) (d) (e) (f)
Determining you would be able to
pay your monthly bills
86% 89% 87% 65% 78%d 76%
d
Determining that you had
accumulated enough money to last
for your full retirement
87 87 87 50 64d 61
d
Becoming eligible for Social
Security
69 73 84ab
19 44d 59
de
Becoming eligible for Medicare or
retiree health benefits from your
employer
71 73 75 26 36d 44
de
Becoming eligible for benefits from
your traditional pension or defined-
benefit plan
70 72 66 51 52 50
Receiving a financial incentive to
retire from your employer
69c 68
c 55 26
f 23
f 15
Financial adviser informing you that
you are financially able to retire
55 50 53 21 27 21
Becoming eligible for benefits from
an annuity
52 48 45 19 20 17
Figure 126: Impact of Financial Issues on Decision to Retire, by DB/DC Income Pre-Retirees Retirees
DB Income in
Retirement
DC Income in
Retirement
DB Income in
Retirement
DC Income in
Retirement
Yes (n=539)
No (n=308)
Yes (n=718)
No (n=129)
Yes (n=684)
No (n=262)
Yes (n=504)
No (n=442)
A Great Deal or Somewhat (a) (b) (c) (d) (e) (f) (g) (h)
Determining you would be able to
pay your monthly bills
91%b 82% 89%
d 78% 76%
f 67% 76%
h 70%
Determining that you had
accumulated enough money to last
for your full retirement
89b 83 88 82 61
f 53 68
h 49
Becoming eligible for Social
Security
75 76 76 75 40 50e 40 45
Becoming eligible for Medicare or
retiree health benefits from your
employer
76b 68 74 68 37 32 38 34
Becoming eligible for benefits from
your traditional pension or defined-
benefit plan
83b 45 71
d 57 62
f 22 57
h 44
Receiving a financial incentive to
retire from your employer
73b 47 66
d 49 24
f 14 24
h 18
Financial adviser informing you
that you are financially able to
retire
56b 47 54 46 24 22 30
h 16
Becoming eligible for benefits from
an annuity
57b 32 49 44 21
f 14 24
h 14

© 2013 Society of Actuaries, All Rights Reserved Mathew Greenwald & Associates, Inc.
Page 76
Pre-retirees, retirees and retired widows all describe their attitude about managing finances in retirement
as “planning-oriented.” Roughly half of pre-retirees and retirees (46 percent for each) and only slightly
fewer retired widows (39 percent) say that they try to plan for the things they know are likely to happen in
the future. Similarly, about two in five of each group (43 percent of pre-retirees and retired widows and
41 percent of retirees) try to plan for as many possibilities as they can.
Figure 127: Attitude about Managing Finances in Retirement
Which one of the following best describes your attitude about managing your finances in retirement?
10%
46%
43%
1%
11%
46%
41%
2%
16%
39%
43%
2%
You concentrate on the present and don't worry too much
about what might happen in the future
You try to plan for the things you know are likely to
happen in the future
You try to plan for as many possibilities as you can
You do not actively participate in managing your
household's financesPre-retirees (n=1,000)
Retirees (n=1,000)
Retired widows (n=271)

© 2013 Society of Actuaries, All Rights Reserved Mathew Greenwald & Associates, Inc.
Page 77
Differences by Population Subgroup
Letters in superscript indicate meaningful differences between subgroups. For example, a number with
the superscript “a” indicates that the number is meaningfully higher than the corresponding number in
column (a). Comparisons are not made between pre-retiree subgroups and retiree subgroups.
Figure 128: Attitude about Managing Finances in Retirement, by Gender Pre-Retirees Retirees
Male
(n=500)
Female
(n=500)
Male
(n=500)
Female
(n=500)
(a) (b) (c) (d)
You concentrate on the present and
don't worry too much about what
might happen in the future
12% 8% 12% 10%
You try to plan for the things you
know are likely to happen in the
future
49 43 47 45
You try to plan for as many
possibilities as you can
39 47a 39 42
You do not actively participate in
managing your household's finances
1 1 2 2
Figure 129: Attitude about Managing Finances in Retirement, by Income Pre-Retirees Retirees
<$50K
(n=159)
$50K-
99K
(n=406)
$100K+
(n=373)
<$50K
(n=254)
$50K-
99K
(n=416)
$100K+
(n=235)
(a) (b) (c) (d) (e) (f)
You concentrate on the present and
don't worry too much about what
might happen in the future
23%bc
11%c 4% 17%
ef 9% 9%
You try to plan for the things you
know are likely to happen in the
future
36 42 55ab
47 49f 41
You try to plan for as many
possibilities as you can
40 46 40 34 40 47d
You do not actively participate in
managing your household's finances
1 1 1 2 2 2

© 2013 Society of Actuaries, All Rights Reserved Mathew Greenwald & Associates, Inc.
Page 78
Figure 130: Attitude about Managing Finances in Retirement, by Age Pre-Retirees Retirees
45-49
(n=324)
50-54
(n=324)
55-80
(n=352)
45-59
(n=295)
60-69
(n=374)
70-80
(n=331)
(a) (b) (c) (d) (e) (f)
You concentrate on the present and
don't worry too much about what
might happen in the future
11% 11% 8% 14% 10% 10%
You try to plan for the things you
know are likely to happen in the
future
49 46 43 47 46 45
You try to plan for as many
possibilities as you can
39 42 48a 37 43 42
You do not actively participate in
managing your household's finances
1 2 * 2 1 3
Figure 131: Attitude about Managing Finances in Retirement, by DB/DC Income Pre-Retirees Retirees
DB Income in
Retirement
DC Income in
Retirement
DB Income in
Retirement
DC Income in
Retirement
Yes (n=593)
No (n=407)
Yes (n=807)
No (n=193)
Yes (n=719)
No (n=281)
Yes (n=539)
No (n=461)
(a) (b) (c) (d) (e) (f) (g) (h)
You concentrate on the present and
don't worry too much about what
might happen in the future
7% 14%a 7% 22%
c 11% 13% 9% 14%
g
You try to plan for the things you
know are likely to happen in the
future
46 46 47 40 47 44 46 46
You try to plan for as many
possibilities as you can
45 40 45d 37 41 40 44 37
You do not actively participate in
managing your household's
finances
1 1 1 1 2 3 2 2
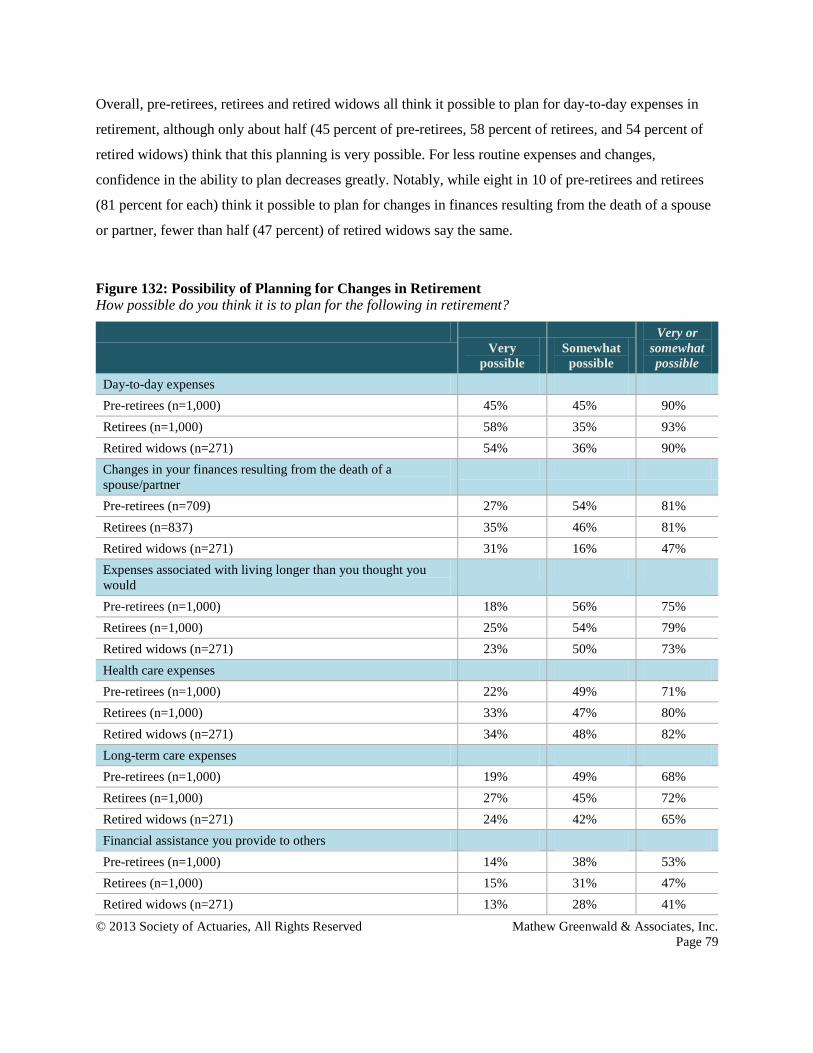
© 2013 Society of Actuaries, All Rights Reserved Mathew Greenwald & Associates, Inc.
Page 79
Overall, pre-retirees, retirees and retired widows all think it possible to plan for day-to-day expenses in
retirement, although only about half (45 percent of pre-retirees, 58 percent of retirees, and 54 percent of
retired widows) think that this planning is very possible. For less routine expenses and changes,
confidence in the ability to plan decreases greatly. Notably, while eight in 10 of pre-retirees and retirees
(81 percent for each) think it possible to plan for changes in finances resulting from the death of a spouse
or partner, fewer than half (47 percent) of retired widows say the same.
Figure 132: Possibility of Planning for Changes in Retirement
How possible do you think it is to plan for the following in retirement?
Very
possible
Somewhat
possible
Very or
somewhat
possible
Day-to-day expenses
Pre-retirees (n=1,000) 45% 45% 90%
Retirees (n=1,000) 58% 35% 93%
Retired widows (n=271) 54% 36% 90%
Changes in your finances resulting from the death of a
spouse/partner
Pre-retirees (n=709) 27% 54% 81%
Retirees (n=837) 35% 46% 81%
Retired widows (n=271) 31% 16% 47%
Expenses associated with living longer than you thought you
would
Pre-retirees (n=1,000) 18% 56% 75%
Retirees (n=1,000) 25% 54% 79%
Retired widows (n=271) 23% 50% 73%
Health care expenses
Pre-retirees (n=1,000) 22% 49% 71%
Retirees (n=1,000) 33% 47% 80%
Retired widows (n=271) 34% 48% 82%
Long-term care expenses
Pre-retirees (n=1,000) 19% 49% 68%
Retirees (n=1,000) 27% 45% 72%
Retired widows (n=271) 24% 42% 65%
Financial assistance you provide to others
Pre-retirees (n=1,000) 14% 38% 53%
Retirees (n=1,000) 15% 31% 47%
Retired widows (n=271) 13% 28% 41%

© 2013 Society of Actuaries, All Rights Reserved Mathew Greenwald & Associates, Inc.
Page 80
Differences by Population Subgroup
Letters in superscript indicate meaningful differences between subgroups. For example, a number with
the superscript “a” indicates that the number is meaningfully higher than the corresponding number in
column (a). Comparisons are not made between pre-retiree subgroups and retiree subgroups.
Figure 133: Possibility of Planning for Changes in Retirement, by Gender Pre-Retirees Retirees
Male
(n=500)
Female
(n=500)
Male
(n=500)
Female
(n=500)
Very or Somewhat Possible (a) (b) (c) (d)
Day-to-day expenses 90% 90% 94% 92%
Changes in your finances resulting
from the death of a spouse/partner
79 83 80 82
Expenses associated with living
longer than you thought you would
74 75 81 78
Health care expenses 71 70 83d 77
Long-term care expenses 69 67 74 70
Financial assistance you provide to
others
51 54 51d 43
Figure 134: Possibility of Planning for Changes in Retirement, by Income Pre-Retirees Retirees
<$50K
(n=159)
$50K-
99K
(n=406)
$100K+
(n=373)
<$50K
(n=254)
$50K-
99K
(n=416)
$100K+
(n=235)
Very or Somewhat Possible (a) (b) (c) (d) (e) (f)
Day-to-day expenses 85% 91% 92% 90% 94% 94%
Changes in your finances resulting
from the death of a spouse/partner
62 78a 85
ab 68 82
d 87
d
Expenses associated with living
longer than you thought you would
60 74a 81
ab 73 82
d 83
d
Health care expenses 63 70 75a 74 82
d 84
d
Long-term care expenses 58 69a 72
a 62 74
d 78
d
Financial assistance you provide to
others
37 53a 59
a 38 46
d 57
de

© 2013 Society of Actuaries, All Rights Reserved Mathew Greenwald & Associates, Inc.
Page 81
Figure 135: Possibility of Planning for Changes in Retirement, by Age Pre-Retirees Retirees
45-49
(n=324)
50-54
(n=324)
55-80
(n=352)
45-59
(n=295)
60-69
(n=374)
70-80
(n=331)
Very or Somewhat Possible (a) (b) (c) (d) (e) (f)
Day-to-day expenses 89% 87% 94%ab
91% 95% 92%
Changes in your finances resulting
from the death of a spouse/partner
81 77 84b 82 84
f 76
Expenses associated with living
longer than you thought you would
76 72 76 79 80 79
Health care expenses 72 67 73 78 79 83
Long-term care expenses 72b 64 68 69 69 76
e
Financial assistance you provide to
others
48 53 57a 54
f 47 40
Figure 136: Possibility of Planning for Changes in Retirement, by DB/DC Income Pre-Retirees Retirees
DB Income in
Retirement
DC Income in
Retirement
DB Income in
Retirement
DC Income in
Retirement
Yes (n=593)
No (n=407)
Yes (n=807)
No (n=193)
Yes (n=719)
No (n=281)
Yes (n=539)
No (n=461)
Very or Somewhat Possible (a) (b) (c) (d) (e) (f) (g) (h)
Day-to-day expenses 91% 89% 91% 88% 94% 91% 95%h 91%
Changes in your finances resulting
from the death of a spouse/partner
83 78 83d 71 83
f 75 85 75
Expenses associated with living
longer than you thought you would
78b 69 77
d 65 80 77 84
h 74
Health care expenses 74b 66 71 67 82 76 85
h 75
Long-term care expenses 71b 64 70
d 61 72 70 76
h 67
Financial assistance you provide to
others
55b 48 54 47 48 42 51
h 42

© 2013 Society of Actuaries, All Rights Reserved Mathew Greenwald & Associates, Inc.
Page 82
Unsurprisingly, retirees have done more planning than pre-retirees regarding issues that often arise after
the death of a spouse. Eight in 10 retirees (79 percent) have planned for having adequate assets and
income in this circumstance, while only six in 10 of pre-retirees (62 percent) report having planned for
this. Retired widows, unfortunately, are more in line with the planning of pre-retirees, although this is
possibly due to the fact that they are more aware of how much they had or had not planned.
Figure 137: Planning for Issues Following Death of a Spouse
To what extent (have/did) you and your spouse/partner (planned/plan) for the following issues that often
arise (in retirement) after the first person in a couple dies? [Of those who are married or widowed]
62%
52%
50%
45%
44%
42%
37%
30%
30%
79%
73%
68%
63%
63%
60%
49%
48%
46%
62%
66%
59%
54%
49%
46%
39%
40%
39%
Adequate assets and income
Ability to manage day-to-day finances
Adequate, affordable and manageable housing
Availability of family and friends
Investment management and estate planning issues
Health and long-term care coverage
Access to activities of interest
Access to transportation
Access to physical and emotional help
Pre-retirees (n=731) Retirees (n=837) Retired widows (n=271)
Percentage Saying A Great Deal or Moderately
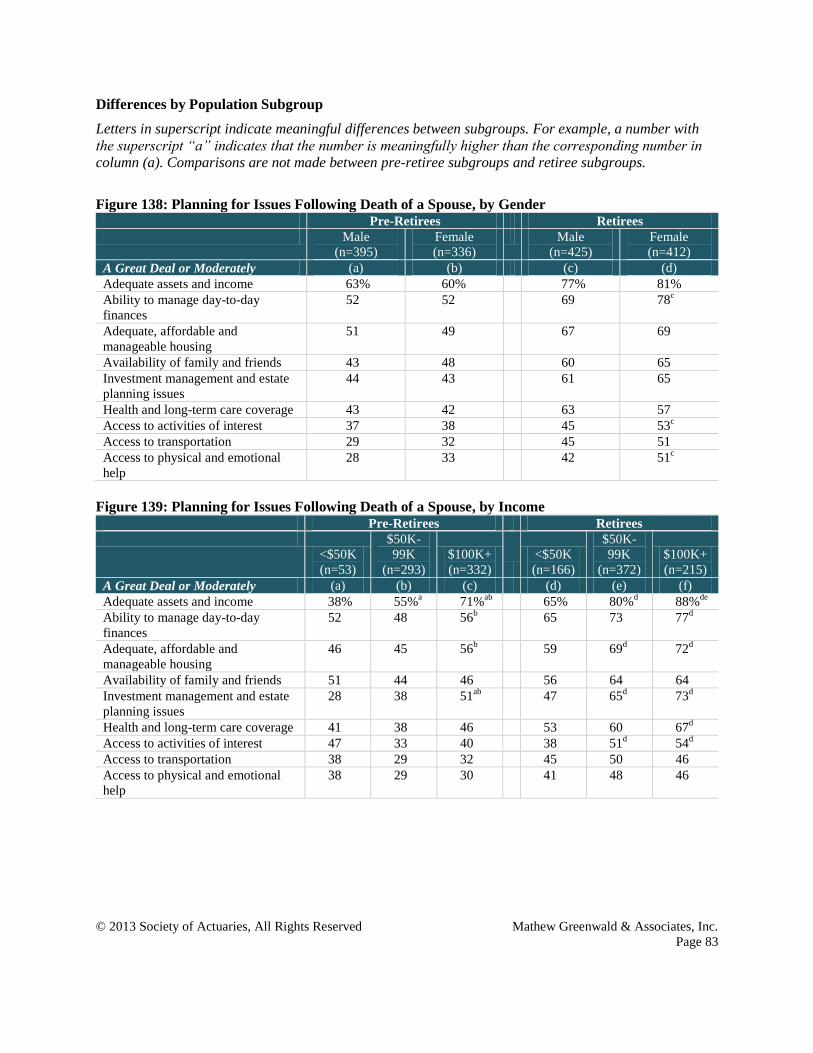
© 2013 Society of Actuaries, All Rights Reserved Mathew Greenwald & Associates, Inc.
Page 83
Differences by Population Subgroup
Letters in superscript indicate meaningful differences between subgroups. For example, a number with
the superscript “a” indicates that the number is meaningfully higher than the corresponding number in
column (a). Comparisons are not made between pre-retiree subgroups and retiree subgroups.
Figure 138: Planning for Issues Following Death of a Spouse, by Gender Pre-Retirees Retirees
Male
(n=395)
Female
(n=336)
Male
(n=425)
Female
(n=412)
A Great Deal or Moderately (a) (b) (c) (d)
Adequate assets and income 63% 60% 77% 81%
Ability to manage day-to-day
finances
52 52 69 78c
Adequate, affordable and
manageable housing
51 49 67 69
Availability of family and friends 43 48 60 65
Investment management and estate
planning issues
44 43 61 65
Health and long-term care coverage 43 42 63 57
Access to activities of interest 37 38 45 53c
Access to transportation 29 32 45 51
Access to physical and emotional
help
28 33 42 51c
Figure 139: Planning for Issues Following Death of a Spouse, by Income Pre-Retirees Retirees
<$50K
(n=53)
$50K-
99K
(n=293)
$100K+
(n=332)
<$50K
(n=166)
$50K-
99K
(n=372)
$100K+
(n=215)
A Great Deal or Moderately (a) (b) (c) (d) (e) (f)
Adequate assets and income 38% 55%a 71%
ab 65% 80%
d 88%
de
Ability to manage day-to-day
finances
52 48 56b 65 73 77
d
Adequate, affordable and
manageable housing
46 45 56b 59 69
d 72
d
Availability of family and friends 51 44 46 56 64 64
Investment management and estate
planning issues
28 38 51ab
47 65d 73
d
Health and long-term care coverage 41 38 46 53 60 67d
Access to activities of interest 47 33 40 38 51d 54
d
Access to transportation 38 29 32 45 50 46
Access to physical and emotional
help
38 29 30 41 48 46

© 2013 Society of Actuaries, All Rights Reserved Mathew Greenwald & Associates, Inc.
Page 84
Figure 140: Planning for Issues Following Death of a Spouse, by Age Pre-Retirees Retirees
45-49
(n=224)
50-54
(n=241)
55-80
(n=266)
45-59
(n=230)
60-69
(n=320)
70-80
(n=287)
A Great Deal or Moderately (a) (b) (c) (d) (e) (f)
Adequate assets and income 56% 57% 71%ab
74% 84%d 78%
Ability to manage day-to-day
finances
45 51 60ab
67 76d 76
d
Adequate, affordable and
manageable housing
43 47 58ab
64 72d 68
Availability of family and friends 37 42 55ab
56 63 68d
Investment management and estate
planning issues
39 40 51ab
58 66d 63
Health and long-term care coverage 33 39 54ab
57 59 62
Access to activities of interest 29 38 44a 46 52 49
Access to transportation 24 29 37a 45 51 48
Access to physical and emotional
help
24 24 41ab
44 45 50
Figure 141: Planning for Issues Following Death of a Spouse, by DB/DC Income Pre-Retirees Retirees
DB Income in
Retirement
DC Income in
Retirement
DB Income in
Retirement
DC Income in
Retirement
Yes (n=459)
No (n=272)
Yes (n=611)
No (n=120)
Yes (n=628)
No (n=209)
Yes (n=478)
No (n=359)
A Great Deal or Moderately (a) (b) (c) (d) (e) (f) (g) (h)
Adequate assets and income 65%b 56% 64%
d 50% 81%
f 73% 85%
h 71%
Ability to manage day-to-day
finances
57b 44 54 45 75
f 68 77
h 69
Adequate, affordable and
manageable housing
55b 41 51 47 69 67 72
h 64
Availability of family and friends 49b 38 45 46 63 61 65 60
Investment management and estate
planning issues
48b 36 46
d 30 65 58 70
h 54
Health and long-term care coverage 48b 32 44 35 62
f 52 63 56
Access to activities of interest 41b 32 38 35 51 44 53
h 45
Access to transportation 33 27 31 29 49 44 52h 44
Access to physical and emotional
help
33b 25 31 27 49
f 39 48 45

© 2013 Society of Actuaries, All Rights Reserved Mathew Greenwald & Associates, Inc.
Page 85
In the event of the death of a spouse or partner, the most likely sources of assistance and support for pre-
retirees and retirees are family members (74 percent of pre-retirees and 70 percent of retirees) and friends
(54 percent and 52 percent, respectively). Pre-retirees and retirees are less likely to turn to help and
services that are paid for or provided by other sources.
Figure 142: Potential Sources of Assistance
Should you or your spouse/partner die, how likely do you think the surviving spouse/partner would be to
turn to the following sources of assistance and support (financial and non-financial)? [Of those who are
married]
Very likely
Somewhat
likely
Very or
somewhat
likely
Family members
Pre-retirees (n=709) 34% 39% 74%
Retirees (n=749) 35% 35% 70%
Friends
Pre-retirees (n=709) 17% 36% 54%
Retirees (n=749) 15% 36% 52%
Services paid for through long-term care or other insurance
Pre-retirees (n=709) 13% 34% 47%
Retirees (n=749) 17% 24% 41%
Church, community, or state services
Pre-retirees (n=709) 12% 30% 43%
Retirees (n=749) 13% 28% 41%
Paid help purchased independently
Pre-retirees (n=709) 6% 35% 40%
Retirees (n=749) 7% 38% 45%
Services provided through a senior housing community
Pre-retirees (n=709) 5% 33% 38%
Retirees (n=749) 9% 31% 40%

© 2013 Society of Actuaries, All Rights Reserved Mathew Greenwald & Associates, Inc.
Page 86
Differences by Population Subgroup
Letters in superscript indicate meaningful differences between subgroups. For example, a number with
the superscript “a” indicates that the number is meaningfully higher than the corresponding number in
column (a). Comparisons are not made between pre-retiree subgroups and retiree subgroups.
Figure 143: Potential Sources of Assistance, by Gender Pre-Retirees Retirees
Male
(n=391)
Female
(n=318)
Male
(n=408)
Female
(n=341)
Very or somewhat likely (a) (b) (c) (d)
Family members 75% 73% 69% 72%
Friends 53 54 51 52
Services provided for through long-
term care or other insurance
47 48 43 39
Church, community, or state
services
43 43 39 42
Paid help purchased independently 39 41 39 52c
Services provided through a senior
housing community
37 38 34 46c
Figure 144: Potential Sources of Assistance, by Income Pre-Retirees Retirees
<$50K
(n=43)
$50K-
99K
(n=288)
$100K+
(n=327)
<$50K
(n=120)
$50K-
99K
(n=349)
$100K+
(n=206)
Very or somewhat likely (a) (b) (c) (d) (e) (f)
Family members 62% 72% 77% 64% 73% 69%
Friends 50 49 58b 39 53
d 55
d
Services provided for through long-
term care or other insurance
48 43 51b 46 38 46
Church, community, or state
services
58b 41 43 35 44 38
Paid help purchased independently 35 28 50b 35 44 51
d
Services provided through a senior
housing community
46 35 40 51f 40 32
Figure 145: Potential Sources of Assistance, by Age Pre-Retirees Retirees
45-49
(n=223)
50-54
(n=232)
55-80
(n=254)
45-59
(n=213)
60-69
(n=301)
70-80
(n=235)
Very or somewhat likely (a) (b) (c) (d) (e) (f)
Family members 78% 71% 73% 66% 73% 71%
Friends 60 51 51 52 54 49
Services provided for through long-
term care or other insurance
50 45 47 45 40 40
Church, community, or state
services
42 50c 37 40 41 41
Paid help purchased independently 43b 33 44
b 39 46 50
d
Services provided through a senior
housing community
35 37 41 37 41 42

© 2013 Society of Actuaries, All Rights Reserved Mathew Greenwald & Associates, Inc.
Page 87
Figure 146: Potential Sources of Assistance, by DB/DC Income Pre-Retirees Retirees
DB Income in
Retirement
DC Income in
Retirement
DB Income in
Retirement
DC Income in
Retirement
Yes (n=445)
No (n=264)
Yes (n=601)
No (n=108)
Yes (n=567)
No (n=182)
Yes (n=443)
No (n=306)
Very or somewhat likely (a) (b) (c) (d) (e) (f) (g) (h)
Family members 74% 74% 75% 67% 70% 70% 73% 67%
Friends 55 50 54 50 51 53 55h 47
Services provided for through long-
term care or other insurance
52b 39 48 43 42 39 43 39
Church, community, or state
services
46b 37 42 48 40 42 42 40
Paid help purchased independently 43 36 43d 26 48
f 36 49
h 40
Services provided through a senior
housing community
39 35 39 33 38 45 38 43
Retired widows report similar sources of assistance following the death of their spouse. Six in 10 turned
to family members (61 percent) and half turned to friends (47 percent). Interestingly, a third of retired
widows (32 percent) state that they turned to none of these sources for (financial or non-financial)
assistance and support.
Figure 147: Sources of Assistance for Retired Widows Which of the following sources of assistance and support (financial and non-financial) have you turned to
since your spouse died? [Of those who are widowed]
61%
47%
22%
8%
4%
2%
32%
Family members
Friends
Church, community, or state services
Paid help purchased independently
Services paid for through long-term care or other
insurance
Services provided through a senior housing community
None of these
2013 (n=271)
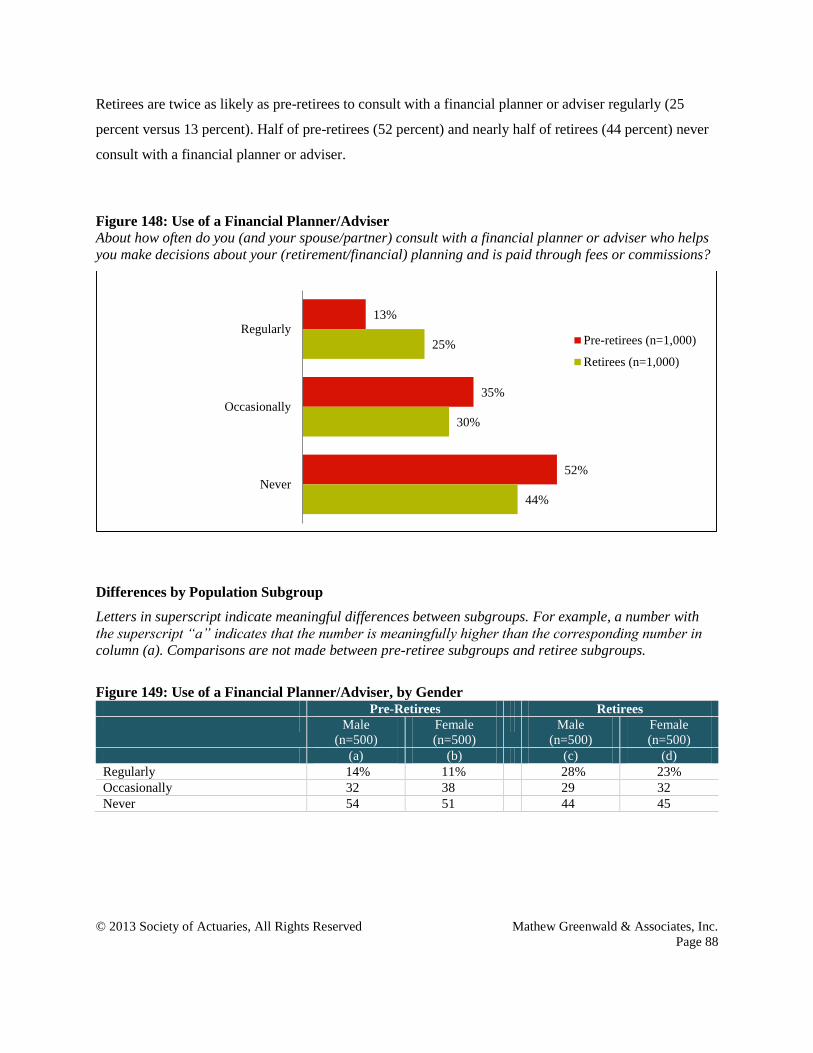
© 2013 Society of Actuaries, All Rights Reserved Mathew Greenwald & Associates, Inc.
Page 88
Retirees are twice as likely as pre-retirees to consult with a financial planner or adviser regularly (25
percent versus 13 percent). Half of pre-retirees (52 percent) and nearly half of retirees (44 percent) never
consult with a financial planner or adviser.
Figure 148: Use of a Financial Planner/Adviser
About how often do you (and your spouse/partner) consult with a financial planner or adviser who helps
you make decisions about your (retirement/financial) planning and is paid through fees or commissions?
Differences by Population Subgroup
Letters in superscript indicate meaningful differences between subgroups. For example, a number with
the superscript “a” indicates that the number is meaningfully higher than the corresponding number in
column (a). Comparisons are not made between pre-retiree subgroups and retiree subgroups.
Figure 149: Use of a Financial Planner/Adviser, by Gender Pre-Retirees Retirees
Male
(n=500)
Female
(n=500)
Male
(n=500)
Female
(n=500)
(a) (b) (c) (d)
Regularly 14% 11% 28% 23%
Occasionally 32 38 29 32
Never 54 51 44 45
13%
35%
52%
25%
30%
44%
Regularly
Occasionally
Never
Pre-retirees (n=1,000)
Retirees (n=1,000)

© 2013 Society of Actuaries, All Rights Reserved Mathew Greenwald & Associates, Inc.
Page 89
Figure 150: Use of a Financial Planner/Adviser, by Income Pre-Retirees Retirees
<$50K
(n=159)
$50K-
99K
(n=406)
$100K+
(n=373)
<$50K
(n=254)
$50K-
99K
(n=416)
$100K+
(n=235)
(a) (b) (c) (d) (e) (f)
Regularly 4% 10%a 20%
ab 13% 26%
d 34%
de
Occasionally 23 36a 38
a 25 33
d 33
Never 73bc
54c 42 62
ef 41
f 33
Figure 151: Use of a Financial Planner/Adviser, by Age Pre-Retirees Retirees
45-49
(n=324)
50-54
(n=324)
55-80
(n=352)
45-59
(n=295)
60-69
(n=374)
70-80
(n=331)
(a) (b) (c) (d) (e) (f)
Regularly 9% 11% 18%ab
21% 30%d 25%
Occasionally 34 33 37 27 29 34
Never 57c 56
c 45 52
ef 41 41
Figure 152: Use of a Financial Planner/Adviser, by DB/DC Income Pre-Retirees Retirees
DB Income in
Retirement
DC Income in
Retirement
DB Income in
Retirement
DC Income in
Retirement
Yes (n=593)
No (n=407)
Yes (n=807)
No (n=193)
Yes (n=719)
No (n=281)
Yes (n=539)
No (n=461)
(a) (b) (c) (d) (e) (f) (g) (h)
Regularly 14% 12% 14%d 8% 27% 22% 31%
h 19%
Occasionally 37 32 38d 22 31 29 34
h 27
Never 50 56a 48 70
c 43 49 35 55
g
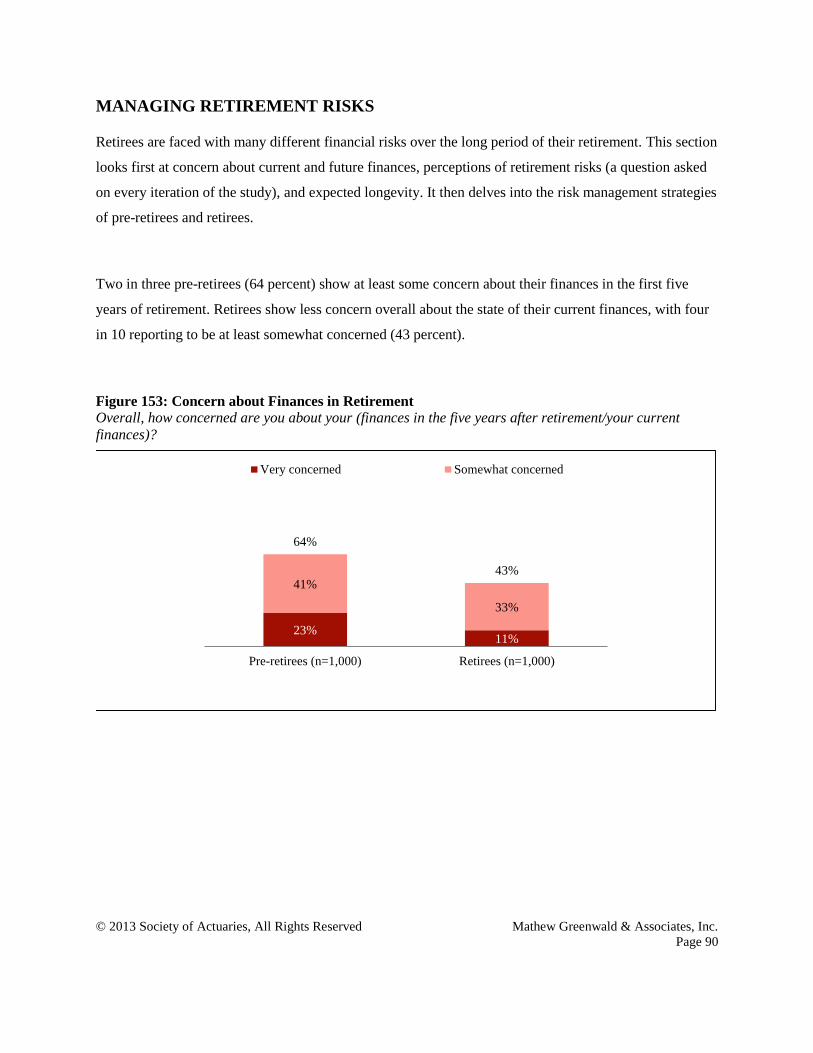
© 2013 Society of Actuaries, All Rights Reserved Mathew Greenwald & Associates, Inc.
Page 90
MANAGING RETIREMENT RISKS
Retirees are faced with many different financial risks over the long period of their retirement. This section
looks first at concern about current and future finances, perceptions of retirement risks (a question asked
on every iteration of the study), and expected longevity. It then delves into the risk management strategies
of pre-retirees and retirees.
Two in three pre-retirees (64 percent) show at least some concern about their finances in the first five
years of retirement. Retirees show less concern overall about the state of their current finances, with four
in 10 reporting to be at least somewhat concerned (43 percent).
Figure 153: Concern about Finances in Retirement
Overall, how concerned are you about your (finances in the five years after retirement/your current
finances)?
23%11%
41%
33%
64%
43%
Pre-retirees (n=1,000) Retirees (n=1,000)
Very concerned Somewhat concerned

© 2013 Society of Actuaries, All Rights Reserved Mathew Greenwald & Associates, Inc.
Page 91
Differences by Population Subgroup
Letters in superscript indicate meaningful differences between subgroups. For example, a number with
the superscript “a” indicates that the number is meaningfully higher than the corresponding number in
column (a). Comparisons are not made between pre-retiree subgroups and retiree subgroups.
Figure 154: Concern about Finances in Retirement, by Gender Pre-Retirees Retirees
Male
(n=500)
Female
(n=500)
Male
(n=500)
Female
(n=500)
(a) (b) (c) (d)
Very or somewhat concerned 57% 70%a 43% 44%
Very concerned 17 29a 9 12
Somewhat concerned 40 41 34 32
Figure 155: Concern about Finances in Retirement, by Income Pre-Retirees Retirees
<$50K
(n=159)
$50K-
99K
(n=406)
$100K+
(n=373)
<$50K
(n=254)
$50K-
99K
(n=416)
$100K+
(n=235)
(a) (b) (c) (d) (e) (f)
Very or somewhat concerned 78%bc
68%c 53% 56%
ef 42% 35%
Very concerned 35bc
23c 17 23
ef 7 5
Somewhat concerned 43 44c 37 33 35 30
Figure 156: Concern about Finances in Retirement, by Age Pre-Retirees Retirees
45-49
(n=324)
50-54
(n=324)
55-80
(n=352)
45-59
(n=295)
60-69
(n=374)
70-80
(n=331)
(a) (b) (c) (d) (e) (f)
Very or somewhat concerned 64% 68%c 60% 55%
ef 39% 38%
Very concerned 25 25 21 16ef 9 8
Somewhat concerned 39 43 39 39ef 31 30
Figure 157: Concern about Finances in Retirement, by DB/DC Income Pre-Retirees Retirees
DB Income in
Retirement
DC Income in
Retirement
DB Income in
Retirement
DC Income in
Retirement
Yes (n=593)
No (n=407)
Yes (n=807)
No (n=193)
Yes (n=719)
No (n=281)
Yes (n=539)
No (n=461)
(a) (b) (c) (d) (e) (f) (g) (h)
Very or somewhat concerned 62% 67% 62% 72% c 42% 48% 42% 45%
Very concerned 21 26 22 31c 8 18
e 8 14
g
Somewhat concerned 40 41 40 41 34 30 35 31

© 2013 Society of Actuaries, All Rights Reserved Mathew Greenwald & Associates, Inc.
Page 92
Pre-retirees and retirees show slightly more concern about their long-term financial future, although a
similar pattern emerges. Three in four pre-retirees, but only half of retirees, are at least somewhat
concerned with their long-term financial future (76 percent and 49 percent, respectively).
Figure 158: Concern about Long-Term Financial Future
Overall, how concerned are you about your (long-term financial future in retirement/your financial
future)?
Differences by Population Subgroup
Letters in superscript indicate meaningful differences between subgroups. For example, a number with
the superscript “a” indicates that the number is meaningfully higher than the corresponding number in
column (a). Comparisons are not made between pre-retiree subgroups and retiree subgroups.
Figure 159: Concern about Long-Term Financial Future, by Gender Pre-Retirees Retirees
Male
(n=500)
Female
(n=500)
Male
(n=500)
Female
(n=500)
(a) (b) (c) (d)
Very or somewhat concerned 71% 80%a 46% 52%
Very concerned 22 34a 11 13
Somewhat concerned 49 46 35 38
28%12%
48%
37%
76%
49%
Pre-retirees (n=1,000) Retirees (n=1,000)
Very concerned Somewhat concerned

© 2013 Society of Actuaries, All Rights Reserved Mathew Greenwald & Associates, Inc.
Page 93
Figure 160: Concern about Long-Term Financial Future, by Income Pre-Retirees Retirees
<$50K
(n=159)
$50K-
99K
(n=406)
$100K+
(n=373)
<$50K
(n=254)
$50K-
99K
(n=416)
$100K+
(n=235)
(a) (b) (c) (d) (e) (f)
Very or somewhat concerned 82%c 80%
c 70% 62%
ef 47% 40%
Very concerned 40bc
29c 20 22
ef 9 8
Somewhat concerned 42 50 49 40 37 32
Figure 161: Concern about Long-Term Financial Future, by Age Pre-Retirees Retirees
45-49
(n=324)
50-54
(n=324)
55-80
(n=352)
45-59
(n=295)
60-69
(n=374)
70-80
(n=331)
(a) (b) (c) (d) (e) (f)
Very or somewhat concerned 78% 77% 72% 58%ef
47% 43%
Very concerned 32c 29 24 18
ef 10 9
Somewhat concerned 46 49 48 40 37 34
Figure 162: Concern about Long-Term Financial Future, by DB/DC Income Pre-Retirees Retirees
DB Income in
Retirement
DC Income in
Retirement
DB Income in
Retirement
DC Income in
Retirement
Yes (n=593)
No (n=407)
Yes (n=807)
No (n=193)
Yes (n=719)
No (n=281)
Yes (n=539)
No (n=461)
(a) (b) (c) (d) (e) (f) (g) (h)
Very or somewhat concerned 74% 79%a 75% 78% 47% 53% 47% 50%
Very concerned 26 32 27 34 9 20e 10 15
g
Somewhat concerned 48 48 48 44 38 33 38 35
As is the case with general financial concerns, pre-retirees report being more concerned than retirees with
most of the following potential issues. Pre-retirees and retirees show the most concern about inflation (29
percent and 19 percent very concerned, respectively), and having enough money for health care (30
percent and 15 percent very concerned, respectively) and long-term care (27 percent and 17 percent very
concerned, respectively).
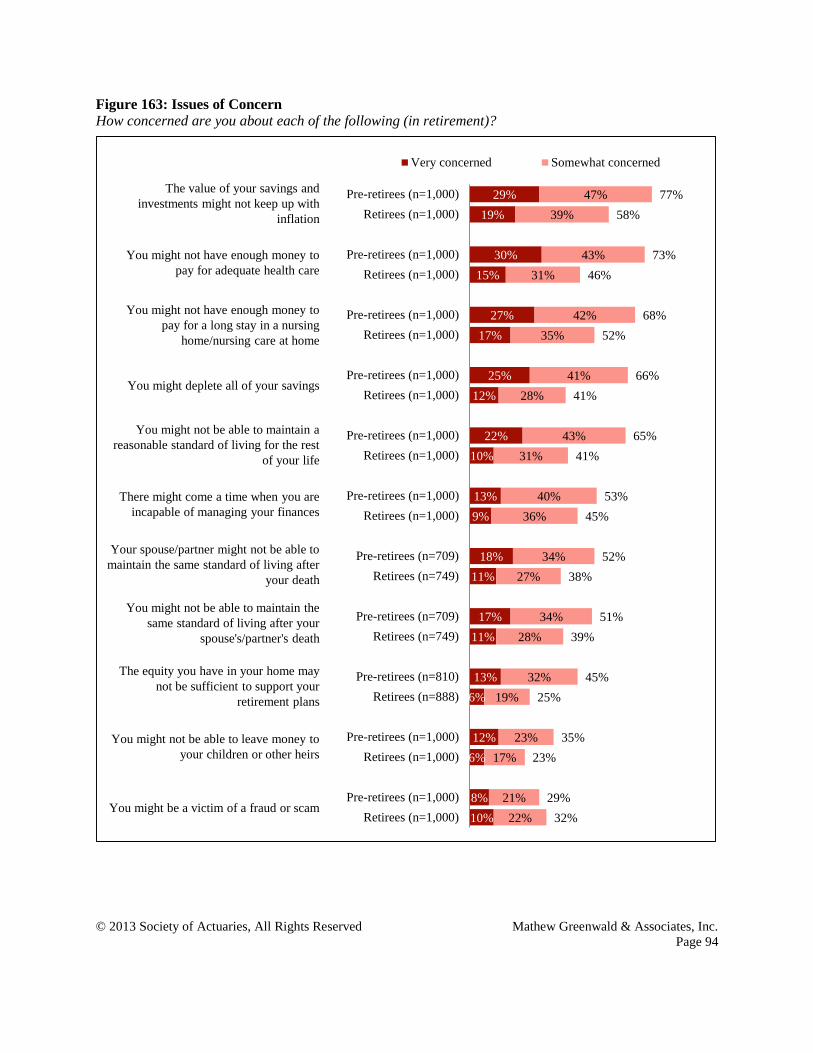
© 2013 Society of Actuaries, All Rights Reserved Mathew Greenwald & Associates, Inc.
Page 94
Figure 163: Issues of Concern
How concerned are you about each of the following (in retirement)?
29%
19%
30%
15%
27%
17%
25%
12%
22%
10%
13%
9%
18%
11%
17%
11%
13%
6%
12%
6%
8%
10%
47%
39%
43%
31%
42%
35%
41%
28%
43%
31%
40%
36%
34%
27%
34%
28%
32%
19%
23%
17%
21%
22%
77%
58%
73%
46%
68%
52%
66%
41%
65%
41%
53%
45%
52%
38%
51%
39%
45%
25%
35%
23%
29%
32%
Pre-retirees (n=1,000)
Retirees (n=1,000)
Pre-retirees (n=1,000)
Retirees (n=1,000)
Pre-retirees (n=1,000)
Retirees (n=1,000)
Pre-retirees (n=1,000)
Retirees (n=1,000)
Pre-retirees (n=1,000)
Retirees (n=1,000)
Pre-retirees (n=1,000)
Retirees (n=1,000)
Pre-retirees (n=709)
Retirees (n=749)
Pre-retirees (n=709)
Retirees (n=749)
Pre-retirees (n=810)
Retirees (n=888)
Pre-retirees (n=1,000)
Retirees (n=1,000)
Pre-retirees (n=1,000)
Retirees (n=1,000)
Very concerned Somewhat concerned
The value of your savings and
investments might not keep up with
inflation
You might not have enough money to
pay for adequate health care
You might not have enough money to
pay for a long stay in a nursing
home/nursing care at home
You might deplete all of your savings
You might not be able to maintain a
reasonable standard of living for the rest
of your life
You might be a victim of a fraud or scam
You might not be able to leave money to
your children or other heirs
The equity you have in your home may
not be sufficient to support your
retirement plans
You might not be able to maintain the
same standard of living after your
spouse's/partner's death
Your spouse/partner might not be able to
maintain the same standard of living after
your death
There might come a time when you are
incapable of managing your finances

© 2013 Society of Actuaries, All Rights Reserved Mathew Greenwald & Associates, Inc.
Page 95
Figure 163: Issues of Concern (Table Version)
How concerned are you about each of the following (in retirement)?
Very
concerned
Somewhat
concerned
Very or
somewhat
concerned
The value of your savings and investments might not keep up
with inflation
Pre-retirees (n=1,000) 29% 47% 77%
Retirees (n=1,000) 19% 39% 58%
You might not have enough money to pay for adequate health
care
Pre-retirees (n=1,000) 30% 43% 73%
Retirees (n=1,000) 15% 31% 46%
You might not have enough money to pay for a long stay in a
nursing home/nursing care at home
Pre-retirees (n=1,000) 27% 42% 68%
Retirees (n=1,000) 17% 35% 52%
You might deplete all of your savings
Pre-retirees (n=1,000) 25% 41% 66%
Retirees (n=1,000) 12% 28% 41%
You might not be able to maintain a reasonable standard of
living for the rest of your life
Pre-retirees (n=1,000) 22% 43% 65%
Retirees (n=1,000) 10% 31% 41%
There might come a time when you are incapable of managing
your finances
Pre-retirees (n=1,000) 13% 40% 53%
Retirees (n=1,000) 9% 36% 45%
Your spouse/partner might not be able to maintain the same
standard of living after your death
Pre-retirees (n=709) 18% 34% 52%
Retirees (n=749) 11% 27% 38%

© 2013 Society of Actuaries, All Rights Reserved Mathew Greenwald & Associates, Inc.
Page 96
Figure 163: Issues of Concern (Cont.)
How concerned are you about each of the following (in retirement)?
Very
concerned
Somewhat
concerned
Very or
somewhat
concerned
You might not be able to maintain the same standard of living
after your spouse's/partner's death
Pre-retirees (n=709) 17% 34% 51%
Retirees (n=749) 11% 28% 39%
The equity you have in your home may not be sufficient to
support your retirement plans
Pre-retirees (n=810) 13% 32% 45%
Retirees (n=888) 6% 19% 25%
You might not be able to leave money to your children or other
heirs
Pre-retirees (n=1,000) 12% 23% 35%
Retirees (n=1,000) 6% 17% 23%
You might be a victim of a fraud or scam
Pre-retirees (n=1,000) 8% 21% 29%
Retirees (n=1,000) 10% 22% 32%
Differences by Population Subgroup
Letters in superscript indicate meaningful differences between subgroups. For example, a number with
the superscript “a” indicates that the number is meaningfully higher than the corresponding number in
column (a). Comparisons are not made between pre-retiree subgroups and retiree subgroups.

© 2013 Society of Actuaries, All Rights Reserved Mathew Greenwald & Associates, Inc.
Page 97
Figure 164: Issues of Concern, by Gender Pre-Retirees Retirees
Male
(n=500)
Female
(n=500)
Male
(n=500)
Female
(n=500)
Very or somewhat concerned (a) (b) (c) (d)
The value of your savings and
investments might not keep up with
inflation
72% 81%a 53% 62%
c
You might not have enough money
to pay for adequate health care
69 77a 43 48
You might not have enough money
to pay for a long stay in a nursing
home/nursing care at home
64 72a 49 55
You might deplete all of your
savings
60 70a 38 43
You might not be able to maintain a
reasonable standard of living for the
rest of your life
60 70a 39 44
There might come a time when you
are incapable of managing your
finances
48 57a 44 46
Your spouse/partner might not be
able to maintain the same standard
of living after your death1
56b 48 43
d 33
You might not be able to maintain
the same standard of living after
your spouse's/partner's death1
44 58a 30 48
c
The equity you have in your home
may not be sufficient to support
your retirement plans2
37 53a 22 27
You might not be able to leave
money to your children or other
heirs
29 42a 21 25
You might be a victim of a fraud or
scam
24 33a 32 31
1Pre-retiree: Male (n=391), Female (n=318); Retiree: Male (n=408), Female (n=341) 2Pre-retiree: Male (n=413), Female (n=397); Retiree: Male (n=448), Female (n=440)

© 2013 Society of Actuaries, All Rights Reserved Mathew Greenwald & Associates, Inc.
Page 98
Figure 165: Issues of Concern, by Income Pre-Retirees Retirees
<$50K
(n=159)
$50K-
99K
(n=406)
$100K+
(n=373)
<$50K
(n=254)
$50K-
99K
(n=416)
$100K+
(n=235)
Very or somewhat concerned (a) (b) (c) (d) (e) (f)
The value of your savings and
investments might not keep up with
inflation
74% 80%c 74% 61% 56% 56%
You might not have enough money
to pay for adequate health care
79c 78
c 67 57
ef 43 38
You might not have enough money
to pay for a long stay in a nursing
home/nursing care at home
69 71 67 58f 53
f 44
You might deplete all of your
savings
72c 72
c 57 52
ef 38 32
You might not be able to maintain a
reasonable standard of living for the
rest of your life
76c 68
c 58 54
ef 37 36
There might come a time when you
are incapable of managing your
finances
55 53 51 47 44 44
Your spouse/partner might not be
able to maintain the same standard
of living after your death1
71c 57
c 48 50
f 40
f 29
You might not be able to maintain
the same standard of living after
your spouse's/partner's death1
68bc
53 48 52ef 38 30
The equity you have in your home
may not be sufficient to support
your retirement plans2
61c 50
c 37 35
ef 21 21
You might not be able to leave
money to your children or other
heirs
40c 38
c 30 28
f 22 17
You might be a victim of a fraud or
scam
35c 30 25 36 29 30
1Pre-retiree: <$50K (n=43), $50K-99K (n=288), $100K+ (n=327); Retiree: <$50K (n=120), $50K-99K (n=349), $100K+ (n=206) 2Pre-retiree: <$50K (n=89), $50K-99K (n=321), $100K+ (n=348); Retiree: <$50K (n=187), $50K-99K (n=386), $100K+ (n=225)

© 2013 Society of Actuaries, All Rights Reserved Mathew Greenwald & Associates, Inc.
Page 99
Figure 166: Issues of Concern, by Age Pre-Retirees Retirees
45-49
(n=324)
50-54
(n=324)
55-80
(n=352)
45-59
(n=295)
60-69
(n=374)
70-80
(n=331)
Very or somewhat concerned (a) (b) (c) (d) (e) (f)
The value of your savings and
investments might not keep up with
inflation
77% 78% 75% 64%f 57% 53%
You might not have enough money
to pay for adequate health care
77c 74 68 55
ef 43 40
You might not have enough money
to pay for a long stay in a nursing
home/nursing care at home
70 70 66 57e 49 51
You might deplete all of your
savings
69c 67 61 49
ef 36 38
You might not be able to maintain a
reasonable standard of living for the
rest of your life
67c 68
c 60 55
ef 37 34
There might come a time when you
are incapable of managing your
finances
53 54 51 47 42 47
Your spouse/partner might not be
able to maintain the same standard
of living after your death1
53 59c 46 42
e 33 42
e
You might not be able to maintain
the same standard of living after
your spouse's/partner's death1
56c 53 44 46
e 36 37
The equity you have in your home
may not be sufficient to support
your retirement plans2
48 46 42 37ef 18 22
You might not be able to leave
money to your children or other
heirs
42c 35 30 26 20 24
You might be a victim of a fraud or
scam
31 28 28 33 32 30
1Pre-retiree: 45-49 (n=223), 50-54 (n=232), 55-80 (n=254); Retiree: 45-59 (n=213), 60-69 (n=301), 70-80 (n=235) 2Pre-retiree: 45-49 (n=253), 50-54 (n=262), 55-80 (n=295); Retiree: 45-59 (n=252), 60-69 (n=346), 70-80 (n=290)

© 2013 Society of Actuaries, All Rights Reserved Mathew Greenwald & Associates, Inc.
Page 100
Figure 167: Issues of Concern, by DB/DC Income Pre-Retirees Retirees
DB Income in
Retirement
DC Income in
Retirement
DB Income in
Retirement
DC Income in
Retirement
Yes (n=593)
No (n=407)
Yes (n=807)
No (n=193)
Yes (n=719)
No (n=281)
Yes (n=539)
No (n=461)
Very or somewhat concerned (a) (b) (c) (d) (e) (f) (g) (h)
The value of your savings and
investments might not keep up with
inflation
76% 77% 78%d 70% 57% 59% 60% 54%
You might not have enough money
to pay for adequate health care
70 77a 73 74 42 55
e 45 46
You might not have enough money
to pay for a long stay in a nursing
home/nursing care at home
68 69 68 69 50 57 55 49
You might deplete all of your
savings
61 73a 65 66 39 45 40 42
You might not be able to maintain a
reasonable standard of living for the
rest of your life
62 70a 64 70 39 48
e 40 43
There might come a time when you
are incapable of managing your
finances
53 52 52 53 44 47 47 43
Your spouse/partner might not be
able to maintain the same standard
of living after your death1
51 54 50 65c 37 44 37 40
You might not be able to maintain
the same standard of living after
your spouse's/partner's death1
51 51 49 61c 38 42 39 40
The equity you have in your home
may not be sufficient to support
your retirement plans2
42 51a 43 55
c 22 33
e 25 26
You might not be able to leave
money to your children or other
heirs
35 36 34 39 21 28e 20 26
g
You might be a victim of a fraud or
scam
30 27 29 27 31 32 32 31
1Pre-retiree: Yes DB (n=445), No DB (n=264), Yes DC (n=601), No DC (n=108); Retiree: Yes DB (n=567), No DB (n=182), Yes DC (n=443),
No DC (n=306) 2Pre-retiree: Yes DB (n=510), No DB (n=300), Yes DC (n=680), No DC (n=130); Retiree: Yes DB (n=652), No DB (n=236), Yes DC (n=506),
No DC (n=382)

© 2013 Society of Actuaries, All Rights Reserved Mathew Greenwald & Associates, Inc.
Page 101
Pre-retirees and retirees both expect to live to about the same age, with the median life expectancy for the
two groups at 85 and 86, respectively. There is great uncertainty about this question, however: three in 10
pre-retirees (28 percent) and four in 10 retirees (37 percent) don’t know how long they expect to live.
Figure 168: Life Expectancy Estimates
Knowing how long you can expect to live can be important for retirement planning. Until what age do
you think that you can expect to live?
Differences by Population Subgroup
Letters in superscript indicate meaningful differences between subgroups. For example, a number with
the superscript “a” indicates that the number is meaningfully higher than the corresponding number in
column (a). Comparisons are not made between pre-retiree subgroups and retiree subgroups.
Figure 169: Life Expectancy Estimates, by Gender Pre-Retirees Retirees
Male
(n=500)
Female
(n=500)
Male
(n=500)
Female
(n=500)
(a) (b) (c) (d)
70 to 74 4% 3% 4% 2%
75 to 79 9b 5 6
d 3
80 to 84 17 15 11 9
85 to 89 25 20 20 18
90 13 15 14 14
91+ 8 11 11 13
Don’t know 25 32a 33 41
c
3%
7%
16%
22%
14%
9%
28%
3%
4%
10%
19%
14%
12%
37%
70 to 74
75 to 79
80 to 84
85 to 89
90
91+
Don’t know
Pre-retirees (n=1,000) Retirees (n=1,000)
Median: 85 Median: 86

© 2013 Society of Actuaries, All Rights Reserved Mathew Greenwald & Associates, Inc.
Page 102
Figure 170: Life Expectancy Estimates, by Income Pre-Retirees Retirees
<$50K
(n=159)
$50K-
99K
(n=406)
$100K+
(n=373)
<$50K
(n=254)
$50K-
99K
(n=416)
$100K+
(n=235)
(a) (b) (c) (d) (e) (f)
70 to 74 5% 3% 3% 6%ef
2% 2%
75 to 79 7 8 7 4 4 4
80 to 84 12 19a 15 10 10 11
85 to 89 18 21 27 9 24d 26
d
90 9 11 19bc
13 15 15
91+ 11 9 10 9 13 17d
Don’t know 37c 29
c 20 49
ef 32
f 24
Figure 171: Life Expectancy Estimates, by Age Pre-Retirees Retirees
45-49
(n=324)
50-54
(n=324)
55-80
(n=352)
45-59
(n=295)
60-69
(n=374)
70-80
(n=331)
(a) (b) (c) (d) (e) (f)
70 to 74 3% 6%c 1% 7%
e 3%
h --
75 to 79 10c 7 4 9
ef 4
f 1%
80 to 84 16 15 17 14f 12
f 5
85 to 89 19 20 27a 20 21 17
90 11 16 14 10 15 16
91+ 11 8 9 11 12 14
Don’t know 29 27 29 29 34 48de
Figure 172: Life Expectancy Estimates, by DB/DC Income Pre-Retirees Retirees
DB Income in
Retirement
DC Income in
Retirement
DB Income in
Retirement
DC Income in
Retirement
Yes (n=593)
No (n=407)
Yes (n=807)
No (n=193)
Yes (n=719)
No (n=281)
Yes (n=539)
No (n=461)
(a) (b) (c) (d) (e) (f) (g) (h)
70 to 74 3% 4% 3% 4% 3% 4% 2% 4%
75 to 79 7 6 6 10 4 5 4 4
80 to 84 17 15 17 13 10 10 9 11
85 to 89 24 20 22 22 21f 15 22
h 16
90 14 14 15d 9 14 14 14 13
91+ 9 10 10 7 13 11 14 10
Don’t know 26 31 27 36c 35 41 34 41
g

© 2013 Society of Actuaries, All Rights Reserved Mathew Greenwald & Associates, Inc.
Page 103
Meanwhile, half of both groups report knowing (or having known) a family member who lived over 90
years. Using the median age, pre-retirees and retirees both expect to live six years less than their oldest-
living family member.
Figure 173: Longest-Living Family Member Please think about the person you knew in your family who lived the longest. How old were they when
they died?
Differences by Population Subgroup
Letters in superscript indicate meaningful differences between subgroups. For example, a number with
the superscript “a” indicates that the number is meaningfully higher than the corresponding number in
column (a). Comparisons are not made between pre-retiree subgroups and retiree subgroups.
Figure 174: Longest-Living Family Member, by Gender Pre-Retirees Retirees
Male
(n=500)
Female
(n=500)
Male
(n=500)
Female
(n=500)
(a) (b) (c) (d)
70 to 74 2% 3% 2% 2%
75 to 79 5 6 4 3
80 to 84 12 14 11 10
85 to 89 18 17 20 19
90 6 5 6 5
91+ 47 49 46 52b
Don’t know 10 7 10 9
2%
5%
13%
18%
5%
48%
9%
2%
4%
11%
20%
6%
49%
9%
70 to 74
75 to 79
80 to 84
85 to 89
90
91+
Don’t know
Pre-retirees (n=1,000) Retirees (n=1,000)
Median: 91 Median: 92

© 2013 Society of Actuaries, All Rights Reserved Mathew Greenwald & Associates, Inc.
Page 104
Figure 175: Longest-Living Family Member, by Income Pre-Retirees Retirees
<$50K
(n=159)
$50K-
99K
(n=406)
$100K+
(n=373)
<$50K
(n=254)
$50K-
99K
(n=416)
$100K+
(n=235)
(a) (b) (c) (d) (e) (f)
70 to 74 4% 3% 2% 2% 1% 2%
75 to 79 5 6 3 4 5 3
80 to 84 11 15 12 14 11 9
85 to 89 16 16 20 17 21 23
90 6 6 4 4 6 7
91+ 48 44 54b 46 48 52
Don’t know 10 10c 6 13
f 8
f 4
Figure 176: Longest-Living Family Member, by Age Pre-Retirees Retirees
45-49
(n=324)
50-54
(n=324)
55-80
(n=352)
45-59
(n=295)
60-69
(n=374)
70-80
(n=331)
(a) (b) (c) (d) (e) (f)
70 to 74 2% 3% 2% 4% 2% --
75 to 79 6 4 5 5f 5 2%
80 to 84 12 14 11 11 11 10
85 to 89 17 18 19 23 20 17
90 4 5 6 7 6 5
91+ 46 48 50 41 51d 54
d
Don’t know 12c 8 6 9 5 13
e
Figure 177: Longest-Living Family Member, by DB/DC Income Pre-Retirees Retirees
DB Income in
Retirement
DC Income in
Retirement
DB Income in
Retirement
DC Income in
Retirement
Yes (n=593)
No (n=407)
Yes (n=807)
No (n=193)
Yes (n=719)
No (n=281)
Yes (n=539)
No (n=461)
(a) (b) (c) (d) (e) (f) (g) (h)
70 to 74 2% 3% 2% 2% 2% 2% 2% 2%
75 to 79 4 6 5 7 4 4 3 4
80 to 84 12 13 13 13 11 9 10 12
85 to 89 20 15 19d 12 20 19 21 18
90 5 6 5 5 5 7 6 5
91+ 48 48 48 49 50 47 50 48
Don’t know 9 8 8 13 8 13e 7 11
g
For pre-retirees and retirees alike, the most common risk management strategies include paying off their
consumer debt and mortgage, saving as much money as possible, and cutting back on spending. On the
other hand, many more pre-retirees expect to postpone their retirement, work in retirement, and postpone
taking Social Security benefits than retirees actually do.

© 2013 Society of Actuaries, All Rights Reserved Mathew Greenwald & Associates, Inc.
Page 105
Figure 178: Risk Management Strategies For each, please indicate whether you (and your spouse/partner) have done that, plan to do that in the
future, or have no plans to do that.
43%
65%
48%
55%
38%
49%
27%
54%
8%
21%
22%
47%
50%
60%
32%
46%
10%
20%
7%
11%
10%
10%
16%
26%
52%
27%
46%
25%
50%
27%
60%
32%
65%
16%
48%
20%
19%
7%
33%
12%
45%
31%
45%
12%
39%
6%
22%
7%
95%
92%
93%
81%
88%
76%
88%
86%
73%
37%
70%
67%
69%
67%
65%
58%
56%
51%
52%
23%
49%
16%
38%
33%
Pre-retirees (n=1,000)
Retirees (n=1,000)
Pre-retirees (n=1,000)
Retirees (n=1,000)
Pre-retirees (n=1,000)
Retirees (n=1,000)
Pre-retirees (n=810)
Retirees (n=888)
Pre-retirees (n=1,000)
Retirees (n=1,000)
Pre-retirees (n=1,000)
Retirees (n=1,000)
Pre-retirees (n=1,000)
Retirees (n=1,000)
Pre-retirees (n=1,000)
Retirees (n=1,000)
Pre-retirees (n=1,000)
Retirees (n=1,000)
Pre-retirees (n=1,000)
Retirees (n=1,000)
Pre-retirees (n=1,000)
Retirees (n=1,000)
Pre-retirees (n=1,000)
Retirees (n=1,000)
Already done Plan to do
Eliminate all of your consumer debt
Try to save as much money as you can
Cut back on spending
Completely pay off your mortgage
Work in retirement
Buy a product or choose an employer
plan option that will provide you with
guaranteed income for life
Postpone taking Social Security
Move to a smaller home or less
expensive area
Consult a financial professional for
advice or guidance
Invest a portion of your money in
stocks or stock mutual funds
Move your assets to less risky
investments as you get older
Postpone retirement

© 2013 Society of Actuaries, All Rights Reserved Mathew Greenwald & Associates, Inc.
Page 106
Figure 178: Risk Management Strategies (Table Version) For each, please indicate whether you (and your spouse/partner) have done that, plan to do that in the
future, or have no plans to do that.
Already
done Plan to do
Already
done or
plan to do
Eliminate all of your consumer debt
Pre-retirees (n=1,000) 43% 52% 95%
Retirees (n=1,000) 65% 27% 92%
Try to save as much money as you can
Pre-retirees (n=1,000) 48% 46% 93%
Retirees (n=1,000) 55% 25% 81%
Cut back on spending
Pre-retirees (n=1,000) 38% 50% 88%
Retirees (n=1,000) 49% 27% 76%
Completely pay off your mortgage
Pre-retirees (n=810) 27% 60% 88%
Retirees (n=888) 54% 32% 86%
Work in retirement
Pre-retirees (n=1,000) 8% 65% 73%
Retirees (n=1,000) 21% 16% 37%
Move your assets to less risky investments as you get older
Pre-retirees (n=1,000) 22% 48% 70%
Retirees (n=1,000) 47% 20% 67%
Invest a portion of your money in stocks or stock mutual funds
Pre-retirees (n=1,000) 50% 19% 69%
Retirees (n=1,000) 60% 7% 67%
Consult a financial professional for advice or guidance
Pre-retirees (n=1,000) 32% 33% 65%
Retirees (n=1,000) 46% 12% 58%
Move to a smaller home or less expensive area
Pre-retirees (n=1,000) 10% 45% 56%
Retirees (n=1,000) 20% 31% 51%
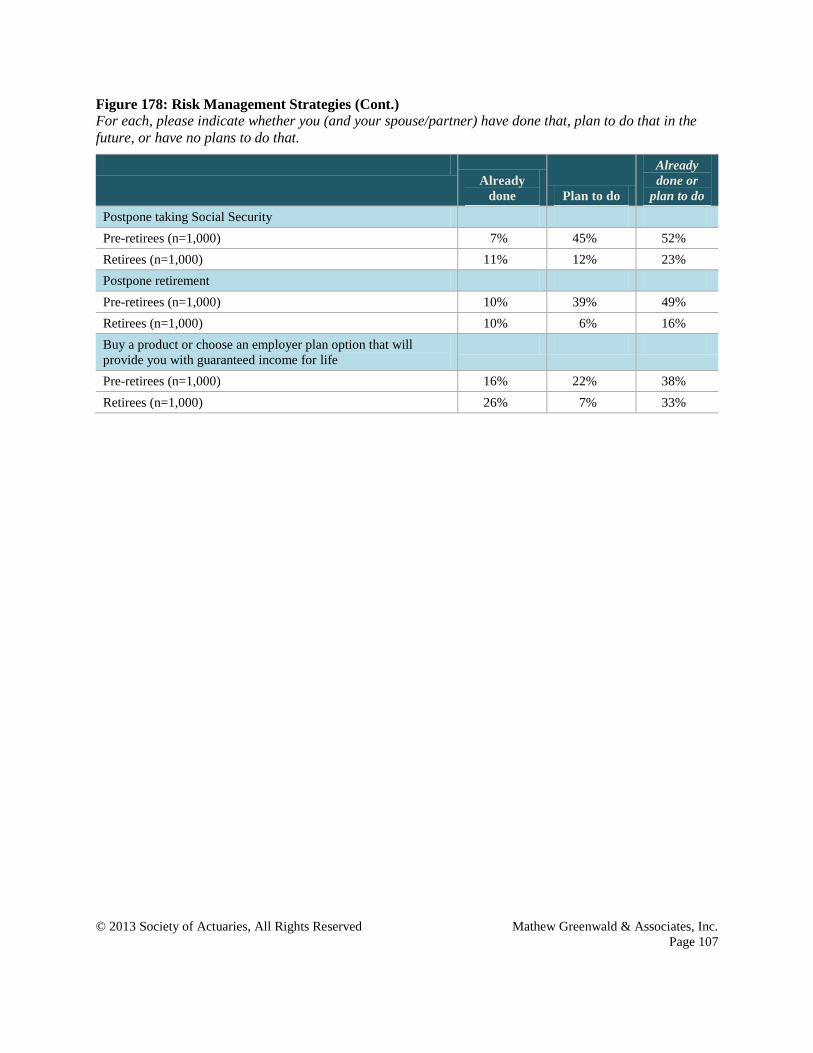
© 2013 Society of Actuaries, All Rights Reserved Mathew Greenwald & Associates, Inc.
Page 107
Figure 178: Risk Management Strategies (Cont.)
For each, please indicate whether you (and your spouse/partner) have done that, plan to do that in the
future, or have no plans to do that.
Already
done Plan to do
Already
done or
plan to do
Postpone taking Social Security
Pre-retirees (n=1,000) 7% 45% 52%
Retirees (n=1,000) 11% 12% 23%
Postpone retirement
Pre-retirees (n=1,000) 10% 39% 49%
Retirees (n=1,000) 10% 6% 16%
Buy a product or choose an employer plan option that will
provide you with guaranteed income for life
Pre-retirees (n=1,000) 16% 22% 38%
Retirees (n=1,000) 26% 7% 33%

© 2013 Society of Actuaries, All Rights Reserved Mathew Greenwald & Associates, Inc.
Page 108
Differences by Population Subgroup
Letters in superscript indicate meaningful differences between subgroups. For example, a number with
the superscript “a” indicates that the number is meaningfully higher than the corresponding number in
column (a). Comparisons are not made between pre-retiree subgroups and retiree subgroups.
Figure 179: Risk Management Strategies, by Gender Pre-Retirees Retirees
Male
(n=500)
Female
(n=500)
Male
(n=500)
Female
(n=500)
Already done/Plan to do in future (a) (b) (c) (d)
Eliminate all of your consumer debt 94% 96% 93% 91%
Try to save as much money as you
can
92 95 79 83
Cut back on spending 85 92a 72 80
c
Completely pay off your mortgage1 88 87 86 86
Work in retirement 71 74 41d 34
Move your assets to less risky
investments as you get older
74b 67 67 67
Invest a portion of your money in
stocks or stock mutual funds
73b 65 68 66
Consult a financial professional for
advice or guidance
63 66 55 61
Move to a smaller home or less
expensive area
54 57 49 52
Postpone taking Social Security 49 55 24 22
Postpone retirement 43 55a 15 17
Buy a product or choose an
employer plan option that will
provide you with guaranteed income
for life
41 35 35 31
1Pre-retiree: Male (n=413), Female (n=397); Retiree: Male (n=448), Female (n=440)

© 2013 Society of Actuaries, All Rights Reserved Mathew Greenwald & Associates, Inc.
Page 109
Figure 180: Risk Management Strategies, by Income Pre-Retirees Retirees
<$50K
(n=159)
$50K-
99K
(n=406)
$100K+
(n=373)
<$50K
(n=254)
$50K-
99K
(n=416)
$100K+
(n=235)
Already done/Plan to do in future (a) (b) (c) (d) (e) (f)
Eliminate all of your consumer debt 89% 94%a 97%
a 88% 93%
d 94%
d
Try to save as much money as you
can
88 93 96a 76 81 85
d
Cut back on spending 88 90c 86 79 77 73
Completely pay off your mortgage1 76 86
a 91
ab 83 85 89
Work in retirement 79c 75
c 68 27 40
d 44
d
Move your assets to less risky
investments as you get older
43 69a 83
ab 46 70
d 81
de
Invest a portion of your money in
stocks or stock mutual funds
42 65a 83
ab 44 72
d 82
de
Consult a financial professional for
advice or guidance
46 63a 74
ab 43 61
d 69
de
Move to a smaller home or less
expensive area
54 60 53 50 51 55
Postpone taking Social Security 47 47 61ab
19 21 34de
Postpone retirement 62bc
49 44 15 15 20
Buy a product or choose an
employer plan option that will
provide you with guaranteed
income for life
32 35 44ab
23 34d 44
de
1Pre-retiree: <$50K (n=89), $50K-99K (n=321), $100K+ (n=348); Retiree: <$50K (n=187), $50K-99K (n=386), $100K+ (n=225)

© 2013 Society of Actuaries, All Rights Reserved Mathew Greenwald & Associates, Inc.
Page 110
Figure 181: Risk Management Strategies, by Age Pre-Retirees Retirees
45-49
(n=324)
50-54
(n=324)
55-80
(n=352)
45-59
(n=295)
60-69
(n=374)
70-80
(n=331)
Already done/Plan to do in future (a) (b) (c) (d) (e) (f)
Eliminate all of your consumer debt 94% 95% 95% 90% 94% 91%
Try to save as much money as you
can
93 93 94 88ef 77 78
Cut back on spending 86 92ac
87 85ef 73 72
Completely pay off your mortgage1 91
c 88 85 92
ef 84 83
Work in retirement 71 74 73 49ef 40
f 24
Move your assets to less risky
investments as you get older
66 71 73 67 71f 62
Invest a portion of your money in
stocks or stock mutual funds
67 70 70 64 68 69
Consult a financial professional for
advice or guidance
62 65 67 57 60 57
Move to a smaller home or less
expensive area
54 53 60 58f 52
f 43
Postpone taking Social Security 47 52 57a 37
ef 23
f 11
Postpone retirement 46 49 53 23ef 13 13
Buy a product or choose an
employer plan option that will
provide you with guaranteed
income for life
37 39 37 42ef 34
f 24
1Pre-retiree: 45-49 (n=253), 50-54 (n=262), 55-80 (n=295); Retiree: 45-59 (n=252), 60-69 (n=346), 70-80 (n=290)

© 2013 Society of Actuaries, All Rights Reserved Mathew Greenwald & Associates, Inc.
Page 111
Figure 182: Risk Management Strategies, by DB/DC Income Pre-Retirees Retirees
DB Income in
Retirement
DC Income in
Retirement
DB Income in
Retirement
DC Income in
Retirement
Yes (n=593)
No (n=407)
Yes (n=807)
No (n=193)
Yes (n=719)
No (n=281)
Yes (n=539)
No (n=461)
Already done/Plan to do in future (a) (b) (c) (d) (e) (f) (g) (h)
Eliminate all of your consumer debt 95% 94% 96%d 90% 94%
f 87% 94%
h 89%
Try to save as much money as you
can
93 94 95d 88 82 77 84
h 76
Cut back on spending 88 89 88 90 75 79 76 76
Completely pay off your mortgage1 88 87 89 83 86 86 87 85
Work in retirement 68 79a 71 81
c 37 37 41
h 33
Move your assets to less risky
investments as you get older
75b 64 77
d 43 71
f 56 79
h 53
Invest a portion of your money in
stocks or stock mutual funds
72b 65 75
d 44 70
f 61 78
h 55
Consult a financial professional for
advice or guidance
70b 57 68
d 49 61
f 51 68
h 48
Move to a smaller home or less
expensive area
55 56 56 53 50 52 51 50
Postpone taking Social Security 52 52 54d 42 22 26 26
h 20
Postpone retirement 43 59a 47 58
c 14 21
e 16 16
Buy a product or choose an
employer plan option that will
provide you with guaranteed
income for life
45b 27 41
d 25 38
f 20 40
h 25
1Pre-retiree: Yes DB (n=510), No DB (n=300), Yes DC (n=680), No DC (n=130); Retiree: Yes DB (n=652), No DB (n=236), Yes DC (n=506), No DC (n=382)
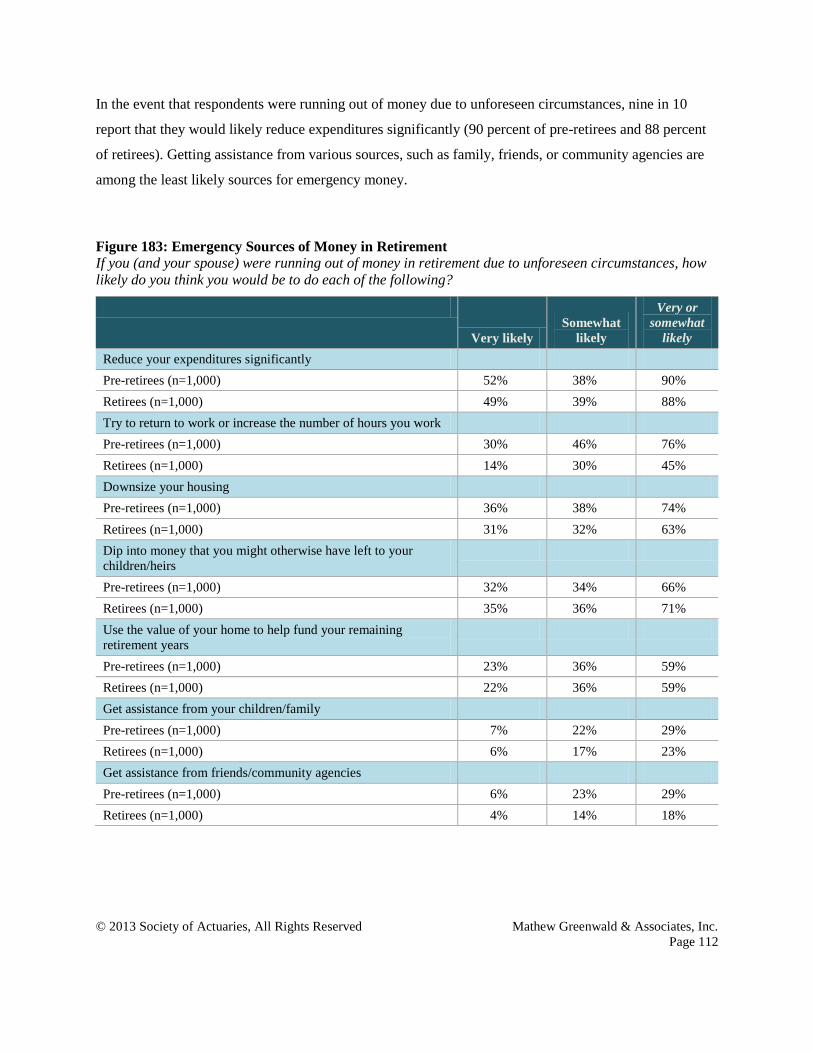
© 2013 Society of Actuaries, All Rights Reserved Mathew Greenwald & Associates, Inc.
Page 112
In the event that respondents were running out of money due to unforeseen circumstances, nine in 10
report that they would likely reduce expenditures significantly (90 percent of pre-retirees and 88 percent
of retirees). Getting assistance from various sources, such as family, friends, or community agencies are
among the least likely sources for emergency money.
Figure 183: Emergency Sources of Money in Retirement If you (and your spouse) were running out of money in retirement due to unforeseen circumstances, how
likely do you think you would be to do each of the following?
Very likely
Somewhat
likely
Very or
somewhat
likely
Reduce your expenditures significantly
Pre-retirees (n=1,000) 52% 38% 90%
Retirees (n=1,000) 49% 39% 88%
Try to return to work or increase the number of hours you work
Pre-retirees (n=1,000) 30% 46% 76%
Retirees (n=1,000) 14% 30% 45%
Downsize your housing
Pre-retirees (n=1,000) 36% 38% 74%
Retirees (n=1,000) 31% 32% 63%
Dip into money that you might otherwise have left to your
children/heirs
Pre-retirees (n=1,000) 32% 34% 66%
Retirees (n=1,000) 35% 36% 71%
Use the value of your home to help fund your remaining
retirement years
Pre-retirees (n=1,000) 23% 36% 59%
Retirees (n=1,000) 22% 36% 59%
Get assistance from your children/family
Pre-retirees (n=1,000) 7% 22% 29%
Retirees (n=1,000) 6% 17% 23%
Get assistance from friends/community agencies
Pre-retirees (n=1,000) 6% 23% 29%
Retirees (n=1,000) 4% 14% 18%

© 2013 Society of Actuaries, All Rights Reserved Mathew Greenwald & Associates, Inc.
Page 113
Differences by Population Subgroup
Letters in superscript indicate meaningful differences between subgroups. For example, a number with
the superscript “a” indicates that the number is meaningfully higher than the corresponding number in
column (a). Comparisons are not made between pre-retiree subgroups and retiree subgroups.
Figure 184: Emergency Sources of Money in Retirement, by Gender Pre-Retirees Retirees
Male
(n=500)
Female
(n=500)
Male
(n=500)
Female
(n=500)
(a) (b) (c) (d)
Reduce your expenditures
significantly
87% 92%a 85% 91%
c
Try to return to work or increase the
number of hours you work
73 79 45 45
Downsize your housing 72 76 63 64
Dip into money that you might
otherwise have left to your
children/heirs
66 66 70 72
Use the value of your home to help
fund your remaining retirement
years
60 58 58 59
Get assistance from your
children/family
28 30 21 25
Get assistance from
friends/community agencies
27 31 17 19
Figure 185: Emergency Sources of Money in Retirement, by Income Pre-Retirees Retirees
<$50K
(n=159)
$50K-
99K
(n=406)
$100K+
(n=373)
<$50K
(n=254)
$50K-
99K
(n=416)
$100K+
(n=235)
(a) (b) (c) (d) (e) (f)
Reduce your expenditures
significantly
84% 92%a 90% 87% 87% 89%
Try to return to work or increase the
number of hours you work
79 78c 72 38 44 55
de
Downsize your housing 66 75a 77
a 57 63 75
de
Dip into money that you might
otherwise have left to your
children/heirs
49 65a 74
ab 58 75
d 74
d
Use the value of your home to help
fund your remaining retirement
years
44 59a 66
b 48 59
d 70
de
Get assistance from your
children/family
40b 29 24 26 22 19

© 2013 Society of Actuaries, All Rights Reserved Mathew Greenwald & Associates, Inc.
Page 114
Get assistance from
friends/community agencies
51bc
28c 21 27
ef 15 13
Figure 186: Emergency Sources of Money in Retirement, by Age Pre-Retirees Retirees
45-49
(n=324)
50-54
(n=324)
55-80
(n=352)
45-59
(n=295)
60-69
(n=374)
70-80
(n=331)
(a) (b) (c) (d) (e) (f)
Reduce your expenditures
significantly
91% 90% 88% 89% 88% 87%
Try to return to work or increase the
number of hours you work
73 79 76 59e 50
f 26
Downsize your housing 78c 77
c 68 69
f 63 59
Dip into money that you might
otherwise have left to your
children/heirs
66 64 68 64 72 76d
Use the value of your home to help
fund your remaining retirement
years
61 58 59 57 60 58
Get assistance from your
children/family
27 32 28 24 20 26
Get assistance from
friends/community agencies
29 27 30 24ef 15 16
Figure 187: Emergency Sources of Money in Retirement, by DB/DC Income Pre-Retirees Retirees
DB Income in
Retirement
DC Income in
Retirement
DB Income in
Retirement
DC Income in
Retirement
Yes (n=593)
No (n=407)
Yes (n=807)
No (n=193)
Yes (n=719)
No (n=281)
Yes (n=539)
No (n=461)
(a) (b) (c) (d) (e) (f) (g) (h)
Reduce your expenditures
significantly
89% 91% 91% 86% 89% 85% 90%h 86%
Try to return to work or increase
the number of hours you work
74 79 76 76 44 46 51h 38
Downsize your housing 74 75 76d 68 64 62 66 61
Dip into money that you might
otherwise have left to your
children/heirs
68 64 67 61 72 67 76h 65
Use the value of your home to help
fund your remaining retirement
years
61 56 61d 50 59 57 66
h 50
Get assistance from your
children/family
30 28 28 36c 22 26 22 24
Get assistance from
friends/community agencies
27 32 26 42c 17 22 17 19
© 2013 Society of Actuaries, All Rights Reserved Mathew Greenwald & Associates, Inc.
Page 115
TRENDED FINDINGS
A great deal of caution should be exercised when comparing the results of the 2013 study with the results
from questions from earlier iterations of the survey. While the 2013 study was conducted online, all
previous studies in the series were conducted by telephone. A test comparing online and telephone results
for pre-retirees showed that telephone respondents were more likely than online respondents to choose
responses at the extremes of attitudinal scales and to respond in what they may have perceived as socially
more acceptable ways, such as providing later expected ages for retirement and indicating that they have a
financial plan for retirement income and spending. In addition, telephone respondents are less likely than
online respondents to select the “don’t know” response. Therefore, many of the differences between the
2013 findings and the findings from previous years may be the result of the change in survey mode rather
than an indication of a true shift in attitudes or behavior of the pre-retiree and retiree populations.
Nevertheless, some conclusions about recurring themes and trends can be drawn, which are outlined
below and illustrated in subsequent figures.
Pre-retirees continue to say they will retire at a later age than retirees actually did retire.
As in prior studies, the large majority of retirees stopped working for pay all at once; the
majority of pre-retirees think they will continue to work in retirement.
The planning horizon for pre-retirees continues to be only about 10 years.
Retirees remain more likely than pre-retirees to regularly consult a financial adviser, but a
sizable percentage of both pre-retirees and retirees never work with an adviser.
Inflation, health care and long-term care continue to head the list of retirement risks that pre-
retirees and retirees are concerned about, and pre-retirees remain more likely than retirees to
say they are concerned about these risks.
The median life expectancy reported by retirees and pre-retirees continues to match fairly
closely to the median life expectancy from actuarial tables.
The three primary risk management strategies used by both pre-retirees and retirees remain
elimination of debt, saving as much as possible, and reducing spending. Only a minority use
insurance products other than health insurance to manage risks.
These recurring themes do not change much, even though the environment has changed. During the time
since the survey series started, there has been a continued shift to defined-contribution plans, the average

© 2013 Society of Actuaries, All Rights Reserved Mathew Greenwald & Associates, Inc.
Page 116
age of the population has continued to increase, and there have been two periods of economic turmoil
including a major decline in housing prices. The Affordable Care Act was also passed. These
environmental changes have served to complicate the challenges that face Americans.
Figure 188: Pre-Retiree Expected Retirement
At what age do you expect to retire or begin to retire from your primary occupation?*
*Due to differences in response options, percentages in Figure 188 have been recalculated based on only those who reported an
age of retirement.
Figure 189: Retiree Actual Age of Retirement
At what age did you retire or begin to retire from your primary occupation?*
*Due to differences in response options, percentages in Figure 189 have been recalculated based on only those who reported an
age of retirement.
1%
11%
16% 17%
38%
17%
1%
12%10%
17%
41%
18%
1%
10% 9%
17%
44%
18%
Under 55 55 to 59 60 to 61 62 to 64 65 to 67 68 or older
2009 (n=250, telephone) 2011 (n=466, telephone) 2013 (n=847, online)
29%
25%
9%
20%
12%
5%
31%
21%
11%
22%
12%
4%
30%
25%
8%
19%
12%
6%
Under 55 55 to 59 60 to 61 62 to 64 65 to 67 68 or older
2009 (n=383, telephone) 2011 (n=746, telephone) 2013 (n=946, online)

© 2013 Society of Actuaries, All Rights Reserved Mathew Greenwald & Associates, Inc.
Page 117
Figure 190: Expected Type of Retirement, Among Pre-Retirees
Which statement comes closest to describing how you (plan to retire/retired) from your primary
occupation? [Of those employed full time (before retiring)]
Figure 191: Type of Retirement, Among Retirees
Which statement comes closest to describing how you (plan to retire/retired) from your primary
occupation? [Of those employed full time (before retiring)]
41%
20%
38%
1%
7%
46%
19%
32%
4%
24%
41%
18%
35%
6%
2007 (n=401, telephone) 2011 (n=800, telephone) 2013 (n=761, online)
Stop Working All
At Once
Gradually Reduce
Number of Hours
Continue to Work
Part Time
Continue to Work
Full Time
Don’t Know
69%
10% 12% 9%
77%
9% 9%5%
78%
6%10%
5%
2007 (n=400, telephone) 2011 (n=800, telephone) 2013 (n=823, online)
Stop Working All at Once Gradually Reduce
Number of Hours
Continue to Work
Part Time
Continue to Work
Full Time

© 2013 Society of Actuaries, All Rights Reserved Mathew Greenwald & Associates, Inc.
Page 118
Figure 192: Time Horizon for Financial Planning, Among Pre-Retirees
When you (and your spouse/partner) make important financial decisions, such as when you think about
whether you can afford to retire or to purchase a new home, about how many years do you look into the
future?
Figure 193: Time Horizon for Financial Planning, Among Retirees
When you (and your spouse/partner) make important financial decisions, such as when you think about
whether you can afford to retire or to purchase a new home, about how many years do you look into the
future?
10%
23%
29%
9%
19%
10%
4%
17%19%
8%
17%
7%
27%
Less than 5
Years
5 to 9 Years 10 to 14 Years 15 to 19 Years 20 Years or
More
Don't Plan
Ahead
Don't Know/
Haven't
Thought About
It
2011 (n=800, telephone) 2013 (n=1,000, online)
23%27%
18%
5%
11%
16%
8%
15%17%
5%
18%
8%
29%
Less than 5
Years
5 to 9 Years 10 to 14 Years 15 to 19 Years 20 Years or
More
Don't Plan
Ahead
Don't Know/
Haven't
Thought About
It
2011 (n=800, telephone) 2013 (n=1,000, online)

© 2013 Society of Actuaries, All Rights Reserved Mathew Greenwald & Associates, Inc.
Page 119
Figure 194: Use of a Financial Planner/Adviser, Among Pre-Retirees
About how often do you (and your spouse/partner) consult with a financial planner or adviser who helps
you make decisions about your (retirement/financial) planning and is paid through fees or commissions?
Figure 195: Use of a Financial Planner/Adviser, Among Retirees
About how often do you (and your spouse/partner) consult with a financial planner or adviser who helps
you make decisions about your (retirement/financial) planning and is paid through fees or commissions?
17%
30%
52%
13%
35%
52%
Regularly Occasionally Never
2011 (n=800, telephone) 2013 (n=1,000, online)
21%
26%
53%
25%
30%
44%
Regularly Occasionally Never
2011 (n=800, telephone) 2013 (n=1,000, online)

© 2013 Society of Actuaries, All Rights Reserved Mathew Greenwald & Associates, Inc.
Page 120
Figure 196: Financial Plan for Retirement, Among Pre-Retirees
Do you currently have a plan for how much money you will spend each year in retirement and where that
money will come from?
Figure 197: Financial Plan for Retirement, Among Retirees
Do you currently have a plan for how much money you will spend each year in retirement and where that
money will come from?
31%36% 36%
2005 (n=300, telephone) 2011 (n=800, telephone) 2013 (n=1,000, online)
Percentage Saying Yes
45%
57%
67%
2005 (n=302, telephone) 2011 (n=800, telephone) 2013 (n=1,000, online)
Percentage Saying Yes
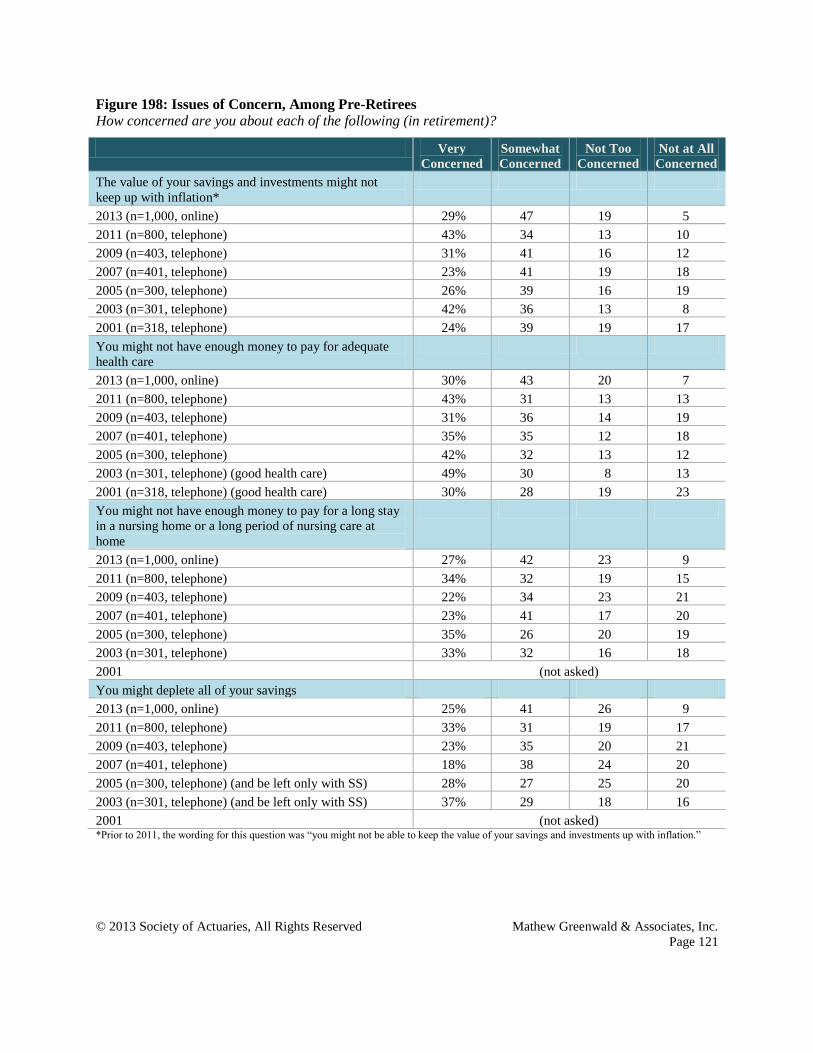
© 2013 Society of Actuaries, All Rights Reserved Mathew Greenwald & Associates, Inc.
Page 121
Figure 198: Issues of Concern, Among Pre-Retirees
How concerned are you about each of the following (in retirement)?
Very
Concerned
Somewhat
Concerned
Not Too
Concerned
Not at All
Concerned
The value of your savings and investments might not
keep up with inflation*
2013 (n=1,000, online) 29% 47 19 5
2011 (n=800, telephone) 43% 34 13 10
2009 (n=403, telephone) 31% 41 16 12
2007 (n=401, telephone) 23% 41 19 18
2005 (n=300, telephone) 26% 39 16 19
2003 (n=301, telephone) 42% 36 13 8
2001 (n=318, telephone) 24% 39 19 17
You might not have enough money to pay for adequate
health care
2013 (n=1,000, online) 30% 43 20 7
2011 (n=800, telephone) 43% 31 13 13
2009 (n=403, telephone) 31% 36 14 19
2007 (n=401, telephone) 35% 35 12 18
2005 (n=300, telephone) 42% 32 13 12
2003 (n=301, telephone) (good health care) 49% 30 8 13
2001 (n=318, telephone) (good health care) 30% 28 19 23
You might not have enough money to pay for a long stay
in a nursing home or a long period of nursing care at
home
2013 (n=1,000, online) 27% 42 23 9
2011 (n=800, telephone) 34% 32 19 15
2009 (n=403, telephone) 22% 34 23 21
2007 (n=401, telephone) 23% 41 17 20
2005 (n=300, telephone) 35% 26 20 19
2003 (n=301, telephone) 33% 32 16 18
2001 (not asked)
You might deplete all of your savings
2013 (n=1,000, online) 25% 41 26 9
2011 (n=800, telephone) 33% 31 19 17
2009 (n=403, telephone) 23% 35 20 21
2007 (n=401, telephone) 18% 38 24 20
2005 (n=300, telephone) (and be left only with SS) 28% 27 25 20
2003 (n=301, telephone) (and be left only with SS) 37% 29 18 16
2001 (not asked) *Prior to 2011, the wording for this question was “you might not be able to keep the value of your savings and investments up with inflation.”
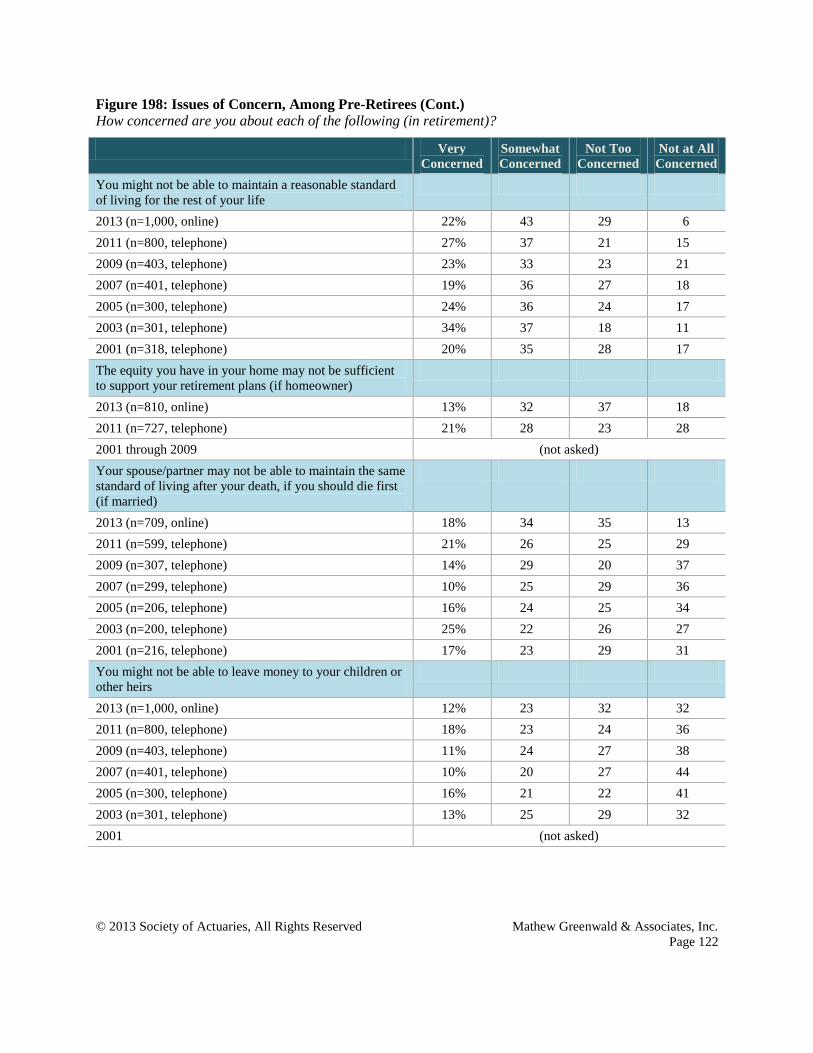
© 2013 Society of Actuaries, All Rights Reserved Mathew Greenwald & Associates, Inc.
Page 122
Figure 198: Issues of Concern, Among Pre-Retirees (Cont.)
How concerned are you about each of the following (in retirement)?
Very
Concerned
Somewhat
Concerned
Not Too
Concerned
Not at All
Concerned
You might not be able to maintain a reasonable standard
of living for the rest of your life
2013 (n=1,000, online) 22% 43 29 6
2011 (n=800, telephone) 27% 37 21 15
2009 (n=403, telephone) 23% 33 23 21
2007 (n=401, telephone) 19% 36 27 18
2005 (n=300, telephone) 24% 36 24 17
2003 (n=301, telephone) 34% 37 18 11
2001 (n=318, telephone) 20% 35 28 17
The equity you have in your home may not be sufficient
to support your retirement plans (if homeowner)
2013 (n=810, online) 13% 32 37 18
2011 (n=727, telephone) 21% 28 23 28
2001 through 2009 (not asked)
Your spouse/partner may not be able to maintain the same
standard of living after your death, if you should die first
(if married)
2013 (n=709, online) 18% 34 35 13
2011 (n=599, telephone) 21% 26 25 29
2009 (n=307, telephone) 14% 29 20 37
2007 (n=299, telephone) 10% 25 29 36
2005 (n=206, telephone) 16% 24 25 34
2003 (n=200, telephone) 25% 22 26 27
2001 (n=216, telephone) 17% 23 29 31
You might not be able to leave money to your children or
other heirs
2013 (n=1,000, online) 12% 23 32 32
2011 (n=800, telephone) 18% 23 24 36
2009 (n=403, telephone) 11% 24 27 38
2007 (n=401, telephone) 10% 20 27 44
2005 (n=300, telephone) 16% 21 22 41
2003 (n=301, telephone) 13% 25 29 32
2001 (not asked)

© 2013 Society of Actuaries, All Rights Reserved Mathew Greenwald & Associates, Inc.
Page 123
Figure 199: Issues of Concern, Among Retirees
How concerned are you about each of the following (in retirement)?
Very
Concerned
Somewhat
Concerned
Not Too
Concerned
Not at All
Concerned
The value of your savings and investments might not
keep up with inflation*
2013 (n=1,000, online) 19% 39 30 12
2011 (n=800, telephone) 37% 33 11 19
2009 (n=401, telephone) 23% 35 17 24
2007 (n=400, telephone) 23% 34 19 24
2005 (n=302, telephone) 22% 30 22 27
2003 (n=303, telephone) 25% 33 21 22
2001 (n=282, telephone) 21% 35 22 23
You might not have enough money to pay for adequate
health care
2013 (n=1,000, online) 15% 31 35 20
2011 (n=800, telephone) 34% 27 14 24
2009 (n=401, telephone) 23% 27 20 31
2007 (n=400, telephone) 26% 26 16 33
2005 (n=302, telephone) 23% 23 18 35
2003 (n=303, telephone) (good health care) 22% 24 26 27
2001 (n=282, telephone) (good health care) 22% 21 25 32
You might not have enough money to pay for a long stay
in a nursing home or a long period of nursing care at
home
2013 (n=1,000, online) 17% 35 30 18
2011 (n=800, telephone) 32% 29 16 23
2009 (n=401, telephone) 18% 28 22 32
2007 (n=400, telephone) 27% 25 15 33
2005 (n=302, telephone) 24% 29 18 30
2003 (n=303, telephone) 20% 27 27 25
2001 (not asked)
You might not be able to maintain a reasonable standard
of living for the rest of your life
2013 (n=1,000, online) 10% 31 42 17
2011 (n=800, telephone) 28% 31 17 23
2009 (n=401, telephone) 17% 29 21 33
2007 (n=400, telephone) 20% 28 19 33
2005 (n=302, telephone) 17% 26 26 31
2003 (n=303, telephone) 17% 29 24 30
2001 (n=282, telephone) 17% 30 27 26 *Prior to 2011, the wording for this question was “you might not be able to keep the value of your savings and investments up with inflation.”

© 2013 Society of Actuaries, All Rights Reserved Mathew Greenwald & Associates, Inc.
Page 124
Figure 199: Issues of Concern, Among Retirees (Cont.)
How concerned are you about each of the following (in retirement)?
Very
Concerned
Somewhat
Concerned
Not Too
Concerned
Not at All
Concerned
You might deplete all of your savings
2013 (n=1,000, online) 12% 28 39 21
2011 (n=800, telephone) 27% 28 19 26
2009 (n=401, telephone) 20% 28 20 32
2007 (n=400, telephone) 23% 23 19 35
2005 (n=302, telephone) (and be left only with Social
Security)
20% 18 24 38
2003 (n=303, telephone) (and be left only with Social
Security)
25% 15 23 36
2001 (not asked)
Your spouse/partner may not be able to maintain the same
standard of living after your death, if you should die first
(if married)
2013 (n=749, online) 11% 27 37 25
2011 (n=521, telephone) 20% 25 18 36
2009 (n=260, telephone) 14% 23 17 47
2007 (n=261, telephone) 17% 23 17 44
2005 (n=181, telephone) 18% 19 22 40
2003 (n=194, telephone) 15% 20 24 41
2001 (n=169, telephone) 16% 27 22 35
The equity you have in your home may not be sufficient
to support your retirement plans (if homeowner)
2013 (n=888, online) 6% 19 41 34
2011 (n=723, telephone) 21% 24 17 38
2001 through 2009 (not asked)
You might not be able to leave money to your children or
other heirs
2013 (n=1,000, online) 6% 17 35 42
2011 (n=800, telephone) 17% 20 23 40
2009 (n=401, telephone) 9% 19 22 50
2007 (n=400, telephone) 14% 15 18 53
2005 (n=302, telephone) 10% 16 24 50
2003 (n=303, telephone) 11% 16 27 46
2001 (not asked)

© 2013 Society of Actuaries, All Rights Reserved Mathew Greenwald & Associates, Inc.
Page 125
Figure 200: Life Expectancy, Among Pre-Retirees
Knowing how long you can expect to live can be important for retirement planning. Until what age do
you think that you can expect to live?
Figure 201: Life Expectancy, Among Retirees
Knowing how long you can expect to live can be important for retirement planning. Until what age do
you think that you can expect to live?
9%
12%
22%21%
13%15%
7%
3%
7%
16%
22%
14%
9%
28%
70 to 74 75 to 79 80 to 84 85 to 89 90 91+ Don't know
2011 (n=800, telephone) 2013 (n=1,000, online)
9%
13%
23%20%
14%
10% 11%
3% 4%
10%
19%
14%12%
37%
70 to 74 75 to 79 80 to 84 85 to 89 90 91+ Don't know
2011 (n=800, telephone) 2013 (n=1,000, online)

© 2013 Society of Actuaries, All Rights Reserved Mathew Greenwald & Associates, Inc.
Page 126
Figure 202: Risk Management Strategies, Among Pre-Retirees
For each, please indicate whether you (and your spouse/partner) have done that, plan to do that in the
future, or have no plans to do that.
Total
Use of
Strategy
Already
Done
Plan to
Do in
Future
No Plans
to Do
Eliminate all of your consumer debt, by paying off all credit
cards and loans
2013 (n=1,000, online) 95% 43 42 5
2011 (n=800, telephone) 90% 49 42 10
2009 (n=403, telephone) 90% 45 46 9
2007 (n=401, telephone) 89% 41 50 10
2005 (n=300, telephone) 88% 44 44 11
Try to save as much money as you can
2013 (n=1,000, online) 93% 48 46 7
2011 (n=800, telephone) 89% 52 39 10
2009 (n=403, telephone) 85% 47 42 14
2007 (n=401, telephone) 90% 49 46 9
2005 (n=300, telephone) 84% 48 39 14
Cut back on spending
2013 (n=1,000, online) 88% 38 50 12
2011 (n=800, telephone) 83% 54 29 17
2009 (n=403, telephone) 78% 54 26 22
2007 (n=401, telephone) 73% 37 38 26
2005 (n=300, telephone) 79% 45 34 20
Completely pay off your mortgage
2013 (n=810, online) 88% 27 60 12
2011 (n=800, telephone) 82% 26 56 18
2009 (n=403, telephone) 80% 29 51 19
2007 (n=401, telephone) 76% 25 51 22
2005 (n=212, telephone) 88% 36 51 12
Invest a portion of your money in stocks or stock mutual
funds
2013 (n=1,000, online) 69% 50 19 31
2011 (n=800, telephone) 67% 56 11 32
2009 (n=403, telephone) 64% 55 10 35
2007 (n=401, telephone) 65% 54 13 34
2005 (n=300, telephone) 62% 50 13 37

© 2013 Society of Actuaries, All Rights Reserved Mathew Greenwald & Associates, Inc.
Page 127
Figure 202: Risk Management Strategies, Among Pre-Retirees (Cont.)
For each, please indicate whether you (and your spouse/partner) have done that, plan to do that in the
future, or have no plans to do that.
Total
Use of
Strategy
Already
Done
Plan to
Do in
Future
No Plans
to Do
Move your assets to less risky investments as you get older
2013 (n=1,000, online) 70% 22 48 30
2011 (n=800, telephone) 65% 32 34 34
2009 (n=403, telephone)* 65% 26 39 33
2007 (n=401, telephone)* 59% 22 40 37
2005 (n=300, telephone)* 56% 20 36 43
Consult a financial professional for advice or guidance
2013 (n=1,000, online) 65% 32 33 35
2011 (n=800, telephone) 63% 43 20 37
2005 through 2009 (not asked)
Work in retirement
2013 (n=1,000, online) 73% 8 65 27
2011 (n=800, telephone) 62% 17 47 36
2009 (n=403, telephone) 58% 14 44 39
2007 (n=401, telephone) 53% 13 43 45
2005 (n=300, telephone) 52% 10 43 47
Buy a product or choose an employer plan option that will
provide you with guaranteed income for life
2013 (n=1,000, online) 38% 16 22 62
2011 (n=800, telephone) 40% 27 14 58
2009 (n=403, telephone) 38% 20 18 60
2007 (n=401, telephone) 32% 19 14 63
2005 (n=300, telephone) 39% 23 16 58
Move to a smaller home or less expensive area
2013 (n=1,000, online) 56% 10 45 44
2011 (n=800, telephone) 45% 10 36 53
2009 (n=403, telephone) 36% 7 28 64
2007 (n=401, telephone) 37% 6 31 61
2005 (n=300, telephone) 37% 9 28 61
Postpone taking Social Security
2013 (n=1,000, online) 52% 7 45 48
2011 (n=800, telephone) 44% 7 38 51
2009 (n=403, telephone) 39% 7 32 55
2005 through 2007 (not asked) *Prior wording: “increasingly conservative investments.”

© 2013 Society of Actuaries, All Rights Reserved Mathew Greenwald & Associates, Inc.
Page 128
Figure 203: Risk Management Strategies, Among Retirees
For each, please indicate whether you (and your spouse/partner) have done that, plan to do that in the
future, or have no plans to do that.
Total
Use of
Strategy
Already
Done
Plan to
Do in
Future
No Plans
to Do
Eliminate all of your consumer debt, by paying off all credit
cards and loans
2013 (n=1,000, online) 92% 65 27 8
2011 (n=800, telephone) 83% 56 28 16
2009 (n=401, telephone) 81% 60 23 16
2007 (n=400, telephone) 79% 55 25 20
2005 (n=302, telephone) 81% 56 26 18
Try to save as much money as you can
2013 (n=1,000, online) 81% 55 25 19
2011 (n=800, telephone) 81% 61 23 18
2009 (n=401, telephone) 75% 53 25 25
2007 (n=400, telephone) 76% 52 27 23
2005 (n=302, telephone) 74% 56 20 25
Cut back on spending
2013 (n=1,000, online) 76% 49 27 24
2011 (n=800, telephone) 76% 62 16 23
2009 (n=401, telephone) 68% 56 13 31
2007 (n=400, telephone) 67% 48 20 32
2005 (n=302, telephone) 65% 51 14 34
Completely pay off your mortgage
2013 (n=888, online) 86% 54 32 14
2011 (n=800, telephone) 75% 47 28 24
2009 (n=401, telephone) 77% 48 29 22
2007 (n=400, telephone) 76% 50 26 23
2005 (n=269, telephone) 83% 56 27 15
Move your assets to less risky investments as you get older
2013 (n=1,000, online) 67% 47 20 33
2011 (n=800, telephone) 58% 47 11 40
2009 (n=401, telephone)* 58% 43 16 41
2007 (n=400, telephone)* 49% 33 17 48
2005 (n=302, telephone)* 52% 35 18 48
*Prior wording: “increasingly conservative investments.”

© 2013 Society of Actuaries, All Rights Reserved Mathew Greenwald & Associates, Inc.
Page 129
Figure 203: Risk Management Strategies, Among Retirees (Cont.)
For each, please indicate whether you (and your spouse/partner) have done that, plan to do that in the
future, or have no plans to do that.
Total
Use of
Strategy
Already
Done
Plan to
Do in
Future
No Plans
to Do
Consult a financial professional for advice or guidance
2013 (n=1,000, online) 58% 46 12 42
2011 (n=800, telephone) 56% 50 6 43
2005 through 2009 (not asked)
Invest a portion of your money in stocks or stock mutual
funds
2013 (n=1,000, online) 67% 60 7 33
2011 (n=800, telephone) 53% 50 3 46
2009 (n=401, telephone) 52% 48 5 48
2007 (n=400, telephone) 56% 50 8 43
2005 (n=302, telephone) 54% 48 6 46
Buy a product or choose an employer plan option that will
provide you with guaranteed income for life
2013 (n=1,000, online) 33% 26 7 67
2011 (n=800, telephone) 39% 33 7 60
2009 (n=401, telephone) 24% 19 4 75
2007 (n=400, telephone) 25% 23 2 72
2005 (n=302, telephone) 33% 27 6 66
Move to a smaller home or less expensive area
2013 (n=1,000, online) 51% 20 31 49
2011 (n=800, telephone) 38% 17 21 61
2009 (n=401, telephone) 30% 10 20 69
2007 (n=400, telephone) 35% 16 19 62
2005 (n=302, telephone) 36% 18 18 64
Postpone taking Social Security
2013 (n=1,000, online) 23% 11 12 77
2011 (n=800, telephone) 35% 25 11 62
2009 (n=401, telephone) 33% 24 10 65
2005 through 2007 (not asked)
Work in retirement
2013 (n=1,000, online) 37% 21 16 63
2011 (n=800, telephone) 28% 14 15 71
2009 (n=401, telephone) 28% 15 14 71
2007 (n=400, telephone) 27% 13 16 71
2005 (n=302, telephone) 24% 14 10 75

© 2013 Society of Actuaries, All Rights Reserved Mathew Greenwald & Associates, Inc.
Page 130
PROFILE OF SURVEY RESPONDENTS
Figure 204: Demographics
Pre-
Retirees
(n=1,000)
Retirees
(n=1,000)
Retired
widows
(n=271)
Age
45 to 49 32% 4% --
50 to 54 33 9 2%
55 to 59 19 17 6
60 to 64 14 17 12
65 to 69 2 19 27
70 to 74 * 19 31
75 to 80 * 15 22
Sex
Men 48% 48% --
Women 52 52 100%
Marital status
Married 65% 71% --
Living with a partner 5 4 --
Separated 2 1 --
Divorced 16 10 --
Widowed 2 8 100%
Never married 10 5 --
Education
Some high school or less 1% 2% 3%
High school graduate 35 37 51
Some college/trade or vocational school 30 29 24
Bachelor’s degree 18 15 9
Postgraduate work 4 4 3
Graduate or professional degree 13 13 10
Employment status
Working 95% 13% 1%
Retired -- 80 93
A homemaker 1 1 1
Laid off/unemployed seeking work 1 * *
Disabled and unable to work 1 5 4
Other 2 1 *

© 2013 Society of Actuaries, All Rights Reserved Mathew Greenwald & Associates, Inc.
Page 131
Figure 204: Demographics (Cont.)
Pre-
Retirees
(n=1,000)
Retirees
(n=1,000)
Retired
widows
(n=271)
Number of children/stepchildren
None 22% 16% 8%
One 18 14 14
Two 33 33 34
Three 16 21 24
Four or more 11 17 20
Provide financial support for anyone other than spouse/partner?
Yes 31% 14% 8%
Health status
Excellent 24% 20% 6%
Very good 47 44 18
Good 23 25 29
Fair 5 9 33
Poor * 2 15
Household income
Less than $25,000 3% 8% 23%
$25,000 to $34,999 5 9 18
$35,000 to $49,999 8 9 17
$50,000 to $74,999 18 24 15
$75,000 to $99,999 22 18 8
$100,000 to $149,999 23 16 5
$150,000 or more 15 8 1
Don’t know/Refused/Prefer not to say 6 10 13
Total savings/investments
(not including primary residence)
Less than $10,000 13% 11% 17%
$10,000 to $24,999 6 3 3
$25,000 to $49,999 7 4 3
$50,000 to $99,999 10 7 8
$100,000 to $249,999 17 15 13
$250,000 to $499,999 18 15 11
$500,000 to $999,999 11 13 10
$1 million or more 5 12 5
Don’t know/Refused/Prefer not to say 13 22 29
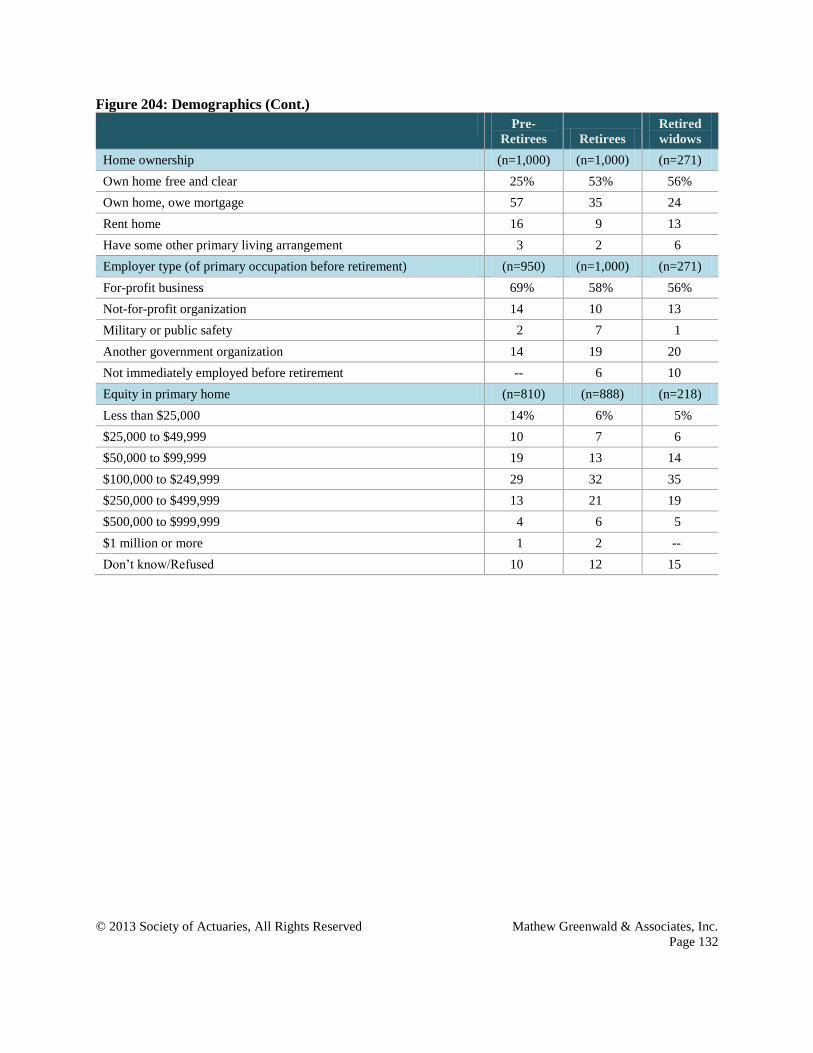
© 2013 Society of Actuaries, All Rights Reserved Mathew Greenwald & Associates, Inc.
Page 132
Figure 204: Demographics (Cont.)
Pre-
Retirees Retirees
Retired
widows
Home ownership (n=1,000) (n=1,000) (n=271)
Own home free and clear 25% 53% 56%
Own home, owe mortgage 57 35 24
Rent home 16 9 13
Have some other primary living arrangement 3 2 6
Employer type (of primary occupation before retirement) (n=950) (n=1,000) (n=271)
For-profit business 69% 58% 56%
Not-for-profit organization 14 10 13
Military or public safety 2 7 1
Another government organization 14 19 20
Not immediately employed before retirement -- 6 10
Equity in primary home (n=810) (n=888) (n=218)
Less than $25,000 14% 6% 5%
$25,000 to $49,999 10 7 6
$50,000 to $99,999 19 13 14
$100,000 to $249,999 29 32 35
$250,000 to $499,999 13 21 19
$500,000 to $999,999 4 6 5
$1 million or more 1 2 --
Don’t know/Refused 10 12 15

© 2013 Society of Actuaries, All Rights Reserved Mathew Greenwald & Associates, Inc.
Page 133
APPENDIX: POSTED QUESTIONNAIRE
Welcome to this survey! 1. In what year were you born? [AGE] (page 129)
Pre- Retired Retirees Retirees Widows (n=1,000) (n=1,000) (n=271)
45 to 49 .................................................................... 32% 4% -- 50 to 54 .................................................................... 33 9 2% 55 to 59 .................................................................... 19 17 6 60 to 64 .................................................................... 14 17 12 65 to 69 ...................................................................... 2 19 27 70 to 74 ....................................................................... * 19 31 75 to 80 ....................................................................... * 15 22 2. Are you… (page 129)
Pre- Retired Retirees Retirees Widows (n=1,000) (n=1,000) (n=271)
Male .......................................................................... 48% 48% -- Female ..................................................................... 52 52 100%
3. Are you… (page 129)
Pre- Retired Retirees Retirees Widows (n=1,000) (n=1,000) (n=271)
Married ..................................................................... 65% 71% -- Unmarried and living with a partner in a permanent relationship ............................................................ 5 4 -- Separated ................................................................... 2 1 -- Divorced ................................................................... 16 10 -- Widowed ..................................................................... 2 8 100% Single, never married ............................................... 10 5 --
4. What is the highest level of education you completed? (page 129)
Pre- Retired Retirees Retirees Widows (n=1,000) (n=1,000) (n=271)
Some high school or less ........................................... 1% 2% 3% High school graduate ................................................ 35 37 51 Some college/trade or vocational school .................. 30 29 24
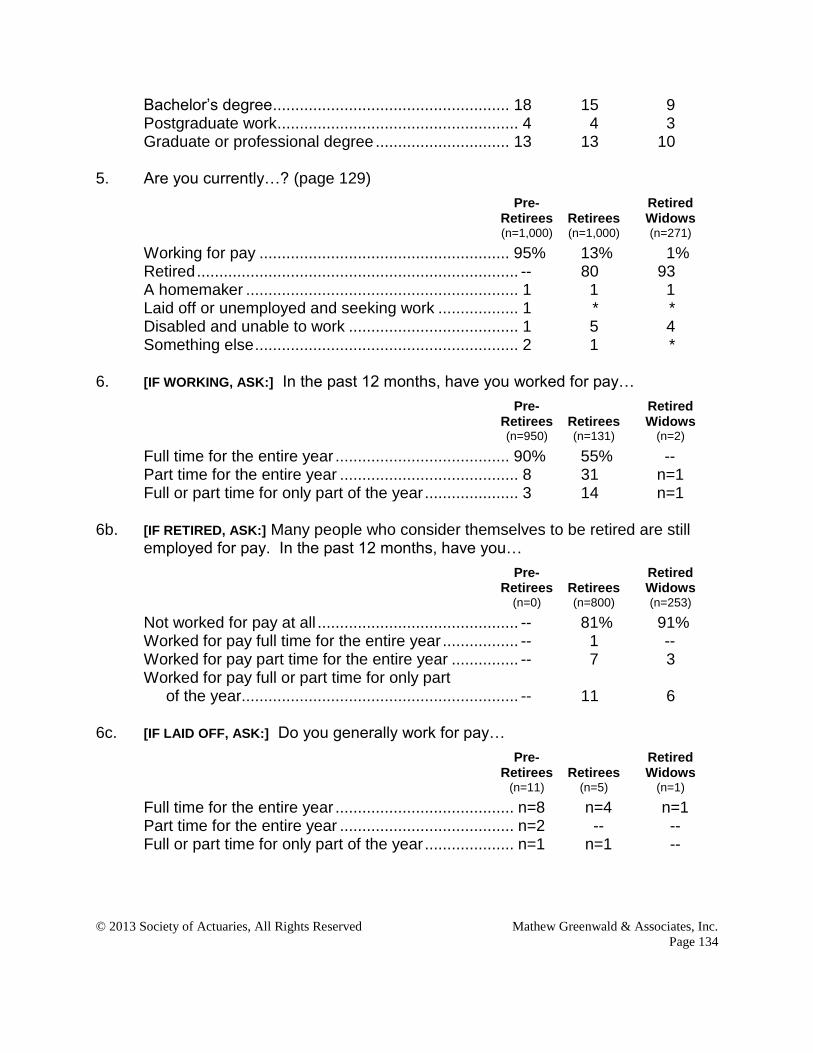
© 2013 Society of Actuaries, All Rights Reserved Mathew Greenwald & Associates, Inc.
Page 134
Bachelor’s degree ..................................................... 18 15 9 Postgraduate work ...................................................... 4 4 3 Graduate or professional degree .............................. 13 13 10
5. Are you currently…? (page 129)
Pre- Retired Retirees Retirees Widows (n=1,000) (n=1,000) (n=271)
Working for pay ........................................................ 95% 13% 1% Retired ........................................................................ -- 80 93 A homemaker ............................................................. 1 1 1 Laid off or unemployed and seeking work .................. 1 * * Disabled and unable to work ...................................... 1 5 4 Something else ........................................................... 2 1 *
6. [IF WORKING, ASK:] In the past 12 months, have you worked for pay…
Pre- Retired Retirees Retirees Widows (n=950) (n=131) (n=2)
Full time for the entire year ....................................... 90% 55% -- Part time for the entire year ........................................ 8 31 n=1 Full or part time for only part of the year ..................... 3 14 n=1
6b. [IF RETIRED, ASK:] Many people who consider themselves to be retired are still
employed for pay. In the past 12 months, have you…
Pre- Retired Retirees Retirees Widows (n=0) (n=800) (n=253)
Not worked for pay at all ............................................. -- 81% 91% Worked for pay full time for the entire year ................. -- 1 -- Worked for pay part time for the entire year ............... -- 7 3 Worked for pay full or part time for only part of the year .............................................................. -- 11 6
6c. [IF LAID OFF, ASK:] Do you generally work for pay…
Pre- Retired Retirees Retirees Widows (n=11) (n=5) (n=1)
Full time for the entire year ........................................ n=8 n=4 n=1 Part time for the entire year ....................................... n=2 -- -- Full or part time for only part of the year .................... n=1 n=1 --

© 2013 Society of Actuaries, All Rights Reserved Mathew Greenwald & Associates, Inc.
Page 135
7. [IF WORKING/LAID OFF/DISABLED, ASK:] Do you consider yourself retired from a previous career or primary occupation?
Pre- Retired Retirees Retirees Widows (n=967) (n=186) (n=14)
Yes ............................................................................. -- 100% 100% No .......................................................................... 100% -- --
[IF MARRIED/PARTNER, CONTINUE. ELSE SKIP TO CHECKPOINT.]
8. Is your (spouse/partner) currently…
Pre- Retired Retirees Retirees Widows (n=709) (n=749) (n=0)
Working .................................................................... 75% 33% -- Retired ........................................................................ 7 58 -- A homemaker ........................................................... 10 6 -- Laid off or unemployed and seeking work .................. 3 1 -- Disabled and unable to work ...................................... 4 1 -- Something else ........................................................... 2 1 --
9. [IF SPOUSE WORKING/LAID OFF/DISABLED, ASK:] Does your (spouse/partner)
consider himself or herself retired from a previous career or primary occupation?
Pre- Retired Retirees Retirees Widows (n=577) (n=271) (n=0)
Yes ............................................................................. 5% 20% -- No ............................................................................ 95 80 --
CHECKPOINT: RETIREE IF: --RETIRED (Q5 = 2) --EMPLOYED/LAID-OFF/DISABLED (Q5 = 1, 4, 5) AND RETIRED FROM PRIMARY OCCUPATION (Q7=1) --HOMEMAKER OR SOMETHING ELSE (Q5 = 3, 6) AND AGE 65+ (Q1 <= 1946) --HOMEMAKER OR SOMETHING ELSE (Q5 = 3, 6) AND SPOUSE RETIRED (Q8=2 OR Q9=1) ALL OTHERS ARE WORKER.
10. Version [AUTOCODE]
Pre- Retired Retirees Retirees Widows (n=1,000) (n=1,000) (n=271)
Worker version ....................................................... 100% -- -- Retiree version ........................................................... -- 100% 100%

© 2013 Society of Actuaries, All Rights Reserved Mathew Greenwald & Associates, Inc.
Page 136
The Process of Retiring
11. [trend] [IF WORKER AND EMPLOYED/LAID OFF FULL TIME, ASK:] At what age do you expect to retire or begin to retire from your primary occupation? (page 15)
[IF WORKER AND NOT EMPLOYED/LAID OFF FULL TIME, ASK:] At what age do you think you will begin to think of yourself as retired?
[IF RETIREE AND PERSONALLY RETIRED, ASK:] How old were you when you retired or began to retire from your primary occupation?
[IF RETIREE AND HOMEMAKER/DISABLED/SOMETHING ELSE, ASK:] At what age did you begin to think of yourself as retired?
Pre- Retired Retirees Retirees Widows (n=1,000) (n=1,000) (n=271)
Under age 55 .............................................................. 1% 28 12 55 to 59 ...................................................................... 9 24 20 60 to 61 ...................................................................... 8 8 14 62 to 64 .................................................................... 15 18 25 65 to 67 .................................................................... 38 11 19 68 or older ................................................................ 15 6 8
[IF WORKER:] Do not expect to retire ........................ 15 -- -- [IF RETIREE:] Do not consider yourself retired ............ -- 6 2
12. [new] [IF WORKER AND DO NOT EXPECT TO RETIRE, ASK:] Which one of the following
best represents the reason you do not expect to retire? [RANDOMIZE LIST] (page 17)
Pre- Retired Retirees Retirees Widows (n=148) (n=0) (n=0)
You will never have enough money to retire ............. 55% -- -- You want to continue working for pay ....................... 17 -- -- You are self-employed .............................................. 12 -- -- Retirement is too far off to think about ........................ 8 -- -- You don’t think you will live long enough to retire ....... 6 -- -- You are not currently working for pay ......................... 2 -- --
[IF DO NOT CONSIDER THEMSELVES RETIRED OR WILL NEVER RETIRE, SHOW:] Many of the questions in this survey will ask about your retirement. Since you’ve said that (IF DOES
NOT CONSIDER THEMSELVES RETIRED: you do not consider yourself retired/IF WILL NEVER
RETIRE: you will never retire) please think about the period from age 65 on whenever retirement is mentioned.

© 2013 Society of Actuaries, All Rights Reserved Mathew Greenwald & Associates, Inc.
Page 137
13. [new] [IF GAVE RETIREMENT AGE, ASK:] (WORKER: Do you think you will be/RETIREE: Were you) employed full time for pay in the year before you (WORKER: retire/RETIREE: retired) from your primary occupation? (page 21)
Pre- Retired Retirees Retirees Widows (n=847) (n=946) (n=265)
Yes ........................................................................... 90% 87% 72% No ............................................................................ 10 13 28
14. [2003/05/07/11] [IF EMPLOYED FULL TIME BEFORE RETIRING, ASK:] Which statement
comes closest to describing how you (WORKER: plan to retire/RETIREE: retired) from your primary occupation? [DO NOT RANDOMIZE LIST] (page 23)
Pre- Retired Retirees Retirees Widows (n=761) (n=823) (n=191)
You (WORKER: plan to stop/RETIREE: stopped) working for pay all at once ................................... 41% 78% 75% You (plan to gradually reduce the number of hours you work/gradually reduced the number of hours you work) for pay before stopping completely ..... 18 6 7 You (plan to continue/continued) to work for pay part time or periodically ....................................... 35 10 14 You (plan to continue/continued) to work for pay full time .................................................................. 6 5 4
15. [new] [IF EMPLOYED FULL TIME BEFORE RETIRING, ASK:] How much (WORKER: do
you think each of the following work-related issues will/RETIREE: did each of the following work-related issues) affect your decision to retire from your primary occupation? [RANDOMIZE LIST] (page 28)
Pre-Retirees (n=761), Retirees (n=823), Retired Widows (n=191)
A Great Deal Somewhat
Not Too Much
Not at All
a. You (WORKER: may have health problems or no longer be able to/RETIREE: had health problems or could no longer) cope with the physical demands of the job
Pre-Retirees 16% 26 32 26
Retirees 13% 8 5 73
Retired Widows 12% 11 4 73
b. The environment at work (may no longer be/was no longer) comfortable (office politics, feeling unwelcome, supervisor too young, etc.)
Pre-Retirees 11% 27 30 31
Retirees 16% 18 11 54

© 2013 Society of Actuaries, All Rights Reserved Mathew Greenwald & Associates, Inc.
Page 138
Pre-Retirees (n=761), Retirees (n=823), Retired Widows (n=191)
A Great Deal Somewhat
Not Too Much
Not at All
Retired Widows 12% 17 9 62
Pre-Retirees (n=761), Retirees (n=823),
Retired Widows (n=191) A Great
Deal Somewhat Not Too
Much Not at
All
c. Work (may no longer be/was no longer) interesting
Pre-Retirees 10% 28 31 31
Retirees 8% 20 13 59
Retired Widows 4% 12 16 69
d. You (may lose/lost) your job
Pre-Retirees 14% 21 30 35
Retirees 10% 3 1 86
Retired Widows 12% 2 2 84
e. Your company (may be/was) sold or merged
Pre-Retirees 8% 18 21 53
Retirees 6% 3 2 89
Retired Widows 5% 4 3 88
f. You (may no longer want/no longer wanted) to deal with the commute or required travel
Pre-Retirees 9% 20 31 40
Retirees 6% 13 9 71
Retired Widows 4% 14 5 77
g. You (may be/were) given a financial incentive to retire
Pre-Retirees 18% 31 22 29
Retirees 15% 11 4 70
Retired Widows 9% 7 4 80
h. You (may want/wanted) to move to a different type of work
Pre-Retirees 8% 26 29 36
Retirees 4% 7 6 84
Retired Widows 1% 4 4 92

© 2013 Society of Actuaries, All Rights Reserved Mathew Greenwald & Associates, Inc.
Page 139
16. [new] [IF EMPLOYED FULL TIME BEFORE RETIRING, ASK:] And how much (WORKER: do you think each of the following personal issues will/RETIREE: did each of the following personal issues) affect your decision to retire from your primary occupation? [RANDOMIZE LIST. KEEP A/B IN ORDER.] (page 25)
Pre-Retirees (n=761), Retirees (n=823), Retired Widows (n=191)
A Great Deal Somewhat
Not Too Much
Not at All
a. [IF MARRIED/PARTNER/RETIRED WIDOW]: You (may need/needed) to care for your spouse/partner
Pre-Retirees (n=550) 7% 25 41 27
Retirees (n=688) 3% 3 4 90
Retired Widows (n=191) 10% 6 2 82
b. You (may need/needed) to care for other family members
Pre-Retirees 6% 24 41 28
Retirees 5% 7 5 83
Retired Widows 4% 7 5 85
c. You (are/were) looking forward to the day when you no longer (have/had) to work for pay
Pre-Retirees 50% 34 13 3
Retirees 36% 28 14 22
Retired Widows 35% 25 14 27
d. You (are/were) looking forward to enjoying your retirement
Pre-Retirees 64% 30 4 2
Retirees 53% 27 7 13
Retired Widows 51% 26 6 17
e. You (may want/wanted) to pursue your passions and interests
Pre-Retirees 33% 42 18 8
Retirees 24% 32 14 30
Retired Widows 21% 27 12 40
f. [IF MARRIED/PARNER/RETIRED WIDOW:] Your spouse/partner (may retire/retired)
Pre-Retirees (n=550) 20% 31 23 26
Retirees (n=688) 17% 9 7 68
Retired Widows (n=191) 19% 8 2 71

© 2013 Society of Actuaries, All Rights Reserved Mathew Greenwald & Associates, Inc.
Page 140
17. [new] In total, how many years (WORKER: do you expect to work/RETIREE: did you work) full time for pay over your working life? (page 19)
Pre- Retired Retirees Retirees Widows (n=1,000) (n=1,000) (n=271)
Less than 10 ............................................................... 6% 3% 6% 10 to 19 ...................................................................... 7 6 12 20 to 29 ...................................................................... 6 16 24 30 to 39 .................................................................... 18 39 29 40 to 49 .................................................................... 37 28 23 50 years or more ...................................................... 26 7 7
18. [new] [IF WORKER OR RETIREE EMPLOYED FOR PAY/LAID OFF:] Do you think you will
be able to work for as long as you want? (page 31)
[IF RETIREE AND NOT EMPLOYED FOR PAY:] Were you able to work for as long as you wanted?
Pre- Retired Retirees Retirees Widows (n=961) (n=936) (n=256)
Yes ........................................................................... 87% 81% 75% No ............................................................................ 13 19 25
19. [new] [IF NOT ABLE TO WORK FOR AS LONG AS WANT, ASK:] What is the primary
reason why (WORKER: you do not think you will be able to work for pay for as long as you want/RETIREE: you did not work for pay for as long as you would have liked)? Please select only one response. [RANDOMIZE LIST] (page 33)
Pre- Retired Retirees Retirees Widows (n=126) (n=177) (n=65)
Health problems ....................................................... 42% 14% 25% Disability or no longer being able to cope with the physical demands of your job .............................. 25 27 14 Lost job and do not have good options for a new one ............................................................... 15 19 25 Not wanting to look for a new job ................................ 9 5 5 Age discrimination ...................................................... 5 3 3 Caregiving responsibilities .......................................... 1 7 17 Wanted to retire/needed a change ............................. 1 8 6 Company downsized/moved/closed ........................... 1 9 2 Forced retirement ....................................................... 1 6 2 Other .......................................................................... 1 3 3

© 2013 Society of Actuaries, All Rights Reserved Mathew Greenwald & Associates, Inc.
Page 141
20. [new] [IF EMPLOYED FULL TIME BEFORE RETIRING, ASK:] How much (WORKER: do you think you will/RETIREE: do you) miss the following aspects of your job? [RANDOMIZE LIST] (page 36)
Pre-Retirees (n=761), Retirees (n=823), Retired Widows (n=191)
A Great Deal Somewhat
Not Too Much
Not at All
a. A sense of purpose or feeling needed
Pre-Retirees 16% 40 27 16
Retirees 14% 32 23 31
Retired Widows 14% 33 18 35
b. The mental stimulation
Pre-Retirees 18% 39 28 14
Retirees 13% 34 24 28
Retired Widows 19% 33 17 31
c. The relationships you (have/had) with your co-workers
Pre-Retirees 23% 43 24 10
Retirees 26% 46 16 12
Retired Widows 26% 47 18 10
d. Having a structure to your day
Pre-Retirees 13% 34 34 19
Retirees 8% 24 27 41
Retired Widows 9% 28 24 39
e. Having a regular paycheck
Pre-Retirees 47% 38 10 5
Retirees 25% 29 22 25
Retired Widows 30% 34 17 19
f. Employee benefits, such as health insurance
Pre-Retirees 49% 26 12 13
Retirees 22% 17 16 45
Retired Widows 24% 19 18 40

© 2013 Society of Actuaries, All Rights Reserved Mathew Greenwald & Associates, Inc.
Page 142
Phases of Retirement 21. [new] People’s abilities and needs often change over the course of their
retirement. When do you think you, yourself, will begin to experience the following changes, if ever? [RANDOMIZE LIST] (page 39)
Years into Retirement
Pre-Retirees (n=1,000), Retirees (n=1,000), Retired Widows (n=271)
Less than 10 Years
10-19 Years
20+ Years Never
a. Physically no longer able to work
Pre-Retirees 13% 32 40 16
Retirees 14% 22 41 23
Retired Widows 14% 24 38 24
b. Mentally no longer able to work
Pre-Retirees 7% 25 35 34
Retirees 5% 14 35 46
Retired Widows 7% 10 28 55
c. Less able to do household chores
Pre-Retirees 10% 32 40 18
Retirees 9% 22 41 28
Retired Widows 11% 20 40 29
d. Less able to manage your money
Pre-Retirees 5% 20 36 38
Retirees 3% 9 33 54
Retired Widows 5% 10 26 60
e. No longer able to drive
Pre-Retirees 3% 25 52 19
Retirees 3% 13 51 33
Retired Widows 3% 14 51 32
f. Less able to move around
Pre-Retirees 11% 29 45 15
Retirees 10% 18 47 25
Retired Widows 10% 20 41 29
g. [IF MARRIED:] Loss of a spouse/partner
Pre-Retirees (n=709) 6% 23 47 23
Retirees (n=749) 2% 15 51 32
Retired Widows (n=0) -- -- -- --
h. Less able to provide caregiving to relatives or friends
Pre-Retirees 15% 34 36 15
Retirees 10% 23 37 30
Retired Widows 14% 20 38 28
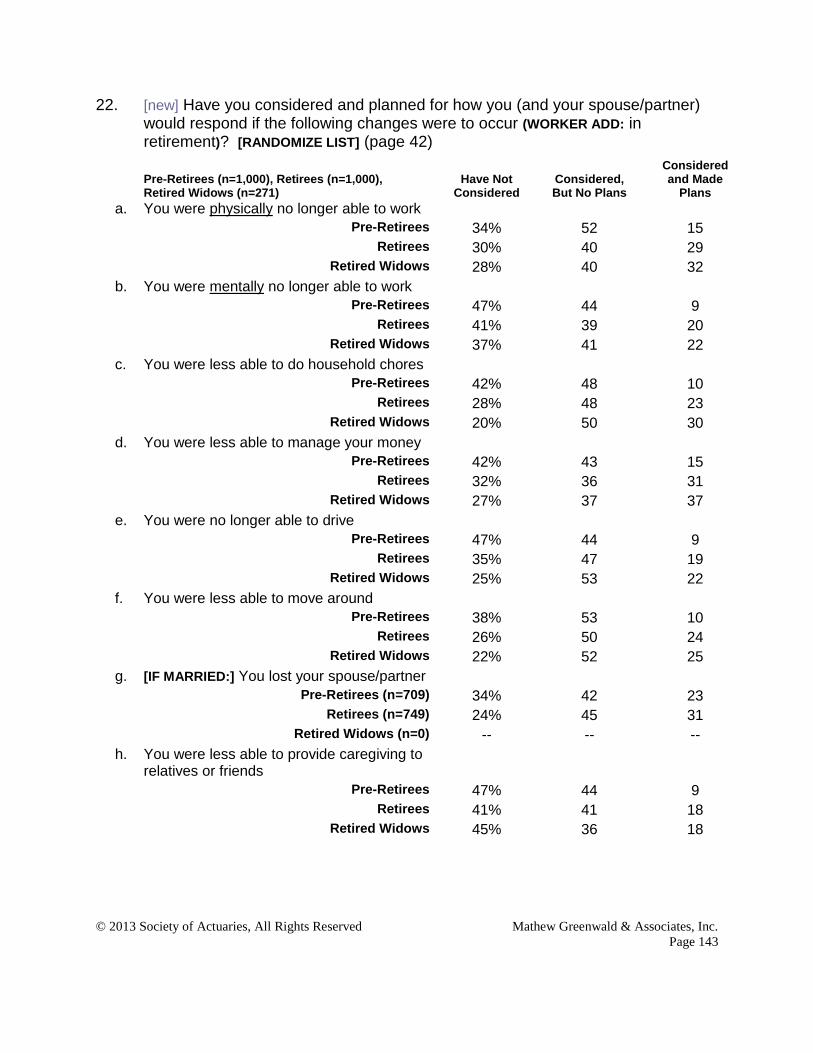
© 2013 Society of Actuaries, All Rights Reserved Mathew Greenwald & Associates, Inc.
Page 143
22. [new] Have you considered and planned for how you (and your spouse/partner) would respond if the following changes were to occur (WORKER ADD: in retirement)? [RANDOMIZE LIST] (page 42)
Pre-Retirees (n=1,000), Retirees (n=1,000), Retired Widows (n=271)
Have Not Considered
Considered, But No Plans
Considered and Made
Plans
a. You were physically no longer able to work
Pre-Retirees 34% 52 15
Retirees 30% 40 29
Retired Widows 28% 40 32
b. You were mentally no longer able to work
Pre-Retirees 47% 44 9
Retirees 41% 39 20
Retired Widows 37% 41 22
c. You were less able to do household chores
Pre-Retirees 42% 48 10
Retirees 28% 48 23
Retired Widows 20% 50 30
d. You were less able to manage your money
Pre-Retirees 42% 43 15
Retirees 32% 36 31
Retired Widows 27% 37 37
e. You were no longer able to drive
Pre-Retirees 47% 44 9
Retirees 35% 47 19
Retired Widows 25% 53 22
f. You were less able to move around
Pre-Retirees 38% 53 10
Retirees 26% 50 24
Retired Widows 22% 52 25
g. [IF MARRIED:] You lost your spouse/partner
Pre-Retirees (n=709) 34% 42 23
Retirees (n=749) 24% 45 31
Retired Widows (n=0) -- -- --
h. You were less able to provide caregiving to relatives or friends
Pre-Retirees 47% 44 9
Retirees 41% 41 18
Retired Widows 45% 36 18

© 2013 Society of Actuaries, All Rights Reserved Mathew Greenwald & Associates, Inc.
Page 144
23. [new] [IF RETIRED WIDOW, ASK:] Did you (and your spouse) consider and plan for how you would respond if you lost your spouse? [DO NOT RANDOMIZE LIST] (page 45)
Pre- Retired Retirees Retirees Widows (n=0) (n=0) (n=271)
Did not consider .......................................................... -- -- 30% Considered, but made no plans .................................. -- -- 18 Considered and made plans ....................................... -- -- 52
24. [new] Many retirees provide unpaid care to a relative or friend to help them take
care of themselves. Unpaid care may include help with personal needs or household chores. It might also be managing a person’s finances, arranging for outside services, or visiting regularly to see how they are doing. (page 46)
[IF WORKER, CONTINUE:] Thinking about the year when your caregiving duties in retirement, if any, will be at their heaviest, about how many hours a week on average do you think you will spend caring for others? Your best estimate is fine. [DO NOT RANDOMIZE LIST.]
[IF RETIREE, CONTINUE:] Thinking about the year when your caregiving duties in retirement, if any, were at their heaviest, how many hours a week on average did you spend caring for others? Your best estimate is fine. [DO NOT RANDOMIZE
LIST.]
Pre-Retirees (n=1,000), Retirees (n=1,000),
Retired Widows (n=271) No Time
1-9 Hours
A Week
10-19 Hours
A Week
20-39 Hours
A Week
40-59 Hours
A Week
60+ Hours
A Week
a. [IF MARRIED/PARTNER/ RETIRED WIDOW OR:] Your spouse/partner
Pre-Retirees (n=709) 20% 19 17 16 7 20
Retirees (n=837) 70% 11 6 5 1 7
Retired Widows (n=271) 54% 7 4 5 3 26
b. Parents or parents-in-law
Pre-Retirees 52% 20 14 9 2 2
Retirees 63% 18 9 4 2 3
Retired Widows 68% 15 7 4 2 3
c. Children or grandchildren
Pre-Retirees 44% 26 17 9 2 2
Retirees 66% 20 6 4 2 2
Retired Widows 60% 24 6 4 3 3

© 2013 Society of Actuaries, All Rights Reserved Mathew Greenwald & Associates, Inc.
Page 145
Pre-Retirees (n=1,000), Retirees (n=1,000),
Retired Widows (n=271) No Time
1-9 Hours
A Week
10-19 Hours
A Week
20-39 Hours
A Week
40-59 Hours
A Week
60+ Hours
A Week
d. Other relatives
Pre-Retirees 66% 24 7 2 1 *
Retirees 86% 10 3 1 -- *
Retired Widows 86% 10 3 1 -- 1
e. Others not related to you
Pre-Retirees 70% 24 4 1 * 1
Retirees 84% 13 2 1 * *
Retired Widows 83% 14 2 * 1 --
25. [new] Have you used any of your household assets to help pay for caregiving for
a relative or friend (IF MARRIED/WIDOWED: other than your spouse/partner)? This could include paying someone else to provide care at home, paying toward facility costs, or paying for caregiving supplies. (page 48)
Pre- Retired Retirees Retirees Widows (n=1,000) (n=1,000) (n=271)
Yes ........................................................................... 14% 15% 15% No ............................................................................ 86 85 85
26. [new] In the future, how likely do you think you will be to use your household
assets to help pay for caregiving for a relative or friend (IF MARRIED/WIDOWED: other than your spouse/partner)? (page 50)
Pre- Retired Retirees Retirees Widows (n=1,000) (n=1,000) (n=271)
Very likely ................................................................... 7% 6% 6% Somewhat likely ........................................................ 26 20 14 Not too likely ............................................................. 44 41 28 Not at all likely .......................................................... 23 33 52

© 2013 Society of Actuaries, All Rights Reserved Mathew Greenwald & Associates, Inc.
Page 146
27. [new] Suppose you, yourself, needed caregiving (WORKER ADD: in retirement). Who do you think would realistically be most likely to provide the care you needed? Please select no more than two. [DO NOT RANDOMIZE LIST] (page 52)
Pre- Retired Retirees Retirees Widows (n=1,000) (n=1,000) (n=271)
[IF MARRIED/PARTNER:] Your spouse/partner ............ 53% 59% -- Your child or stepchild .............................................. 38 33 49% A paid caregiver in your home .................................. 15 21 34 A paid caregiver in a facility ........................................ 9 10 17 Another family member .............................................. 8 7 11 A friend ....................................................................... 4 3 6 Don’t know ................................................................ 10 9 14
28. [demo] Now let’s talk about housing. Do you currently… (page 131)
Pre- Retired Retirees Retirees Widows (n=1,000) (n=1,000) (n=271)
Own your primary home free and clear .................... 25% 53% 56% Own your primary home and owe money on a mortgage ............................................................. 57 35 24 Rent your primary home ........................................... 16 9 13 Have some other primary living arrangement ............ 3 2 6
29. [new] [IF HAVE MORTGAGE, ASK:] At what age do you expect to pay off the
mortgage on your primary home? (page 54)
Pre- Retired Retirees Retirees Widows (n=566) (n=347) (n=66)
Under age 55 .............................................................. 6% 1% -- 55 to 59 .................................................................... 11 2 -- 60 to 61 .................................................................... 13 4 2% 62 to 64 ...................................................................... 6 5 2 65 to 67 .................................................................... 17 10 2 68 to 70 .................................................................... 11 11 2 Over 70 ..................................................................... 12 33 39 Don’t know ................................................................ 25 33 55
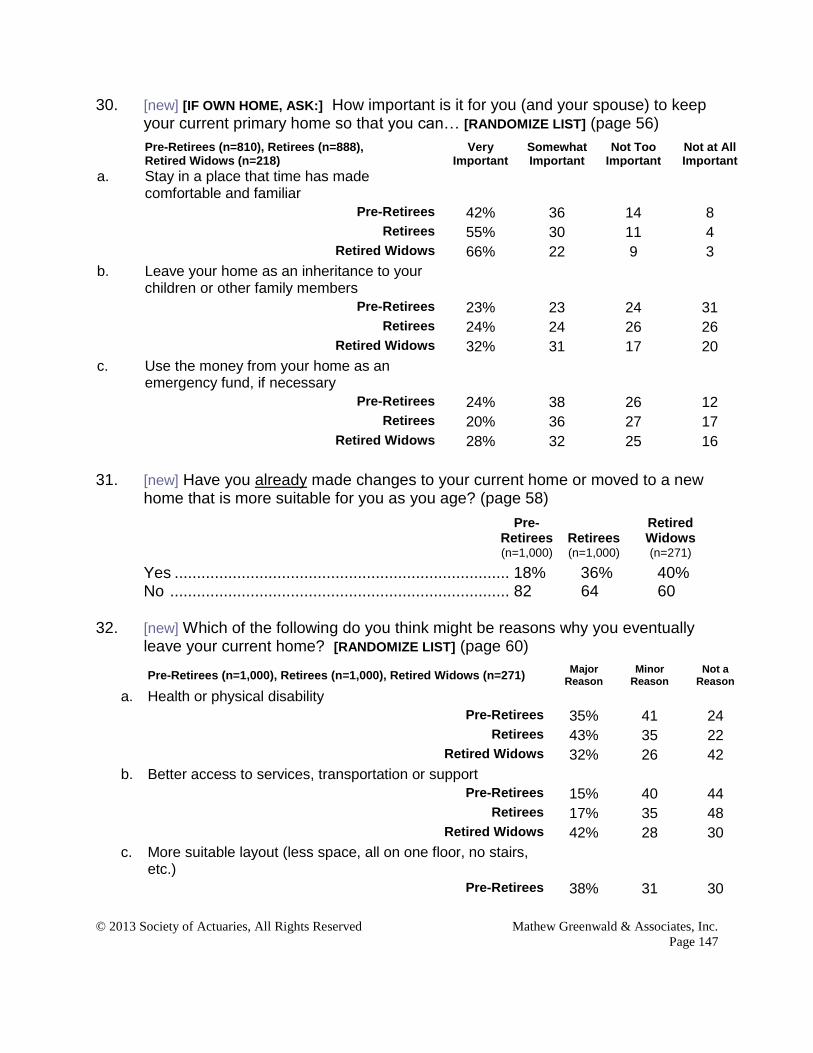
© 2013 Society of Actuaries, All Rights Reserved Mathew Greenwald & Associates, Inc.
Page 147
30. [new] [IF OWN HOME, ASK:] How important is it for you (and your spouse) to keep your current primary home so that you can… [RANDOMIZE LIST] (page 56)
Pre-Retirees (n=810), Retirees (n=888), Retired Widows (n=218)
Very Important
Somewhat Important
Not Too Important
Not at All Important
a. Stay in a place that time has made comfortable and familiar
Pre-Retirees 42% 36 14 8
Retirees 55% 30 11 4
Retired Widows 66% 22 9 3
b. Leave your home as an inheritance to your children or other family members
Pre-Retirees 23% 23 24 31
Retirees 24% 24 26 26
Retired Widows 32% 31 17 20
c. Use the money from your home as an emergency fund, if necessary
Pre-Retirees 24% 38 26 12
Retirees 20% 36 27 17
Retired Widows 28% 32 25 16
31. [new] Have you already made changes to your current home or moved to a new
home that is more suitable for you as you age? (page 58)
Pre- Retired Retirees Retirees Widows (n=1,000) (n=1,000) (n=271)
Yes ........................................................................... 18% 36% 40% No ............................................................................ 82 64 60
32. [new] Which of the following do you think might be reasons why you eventually
leave your current home? [RANDOMIZE LIST] (page 60)
Pre-Retirees (n=1,000), Retirees (n=1,000), Retired Widows (n=271)
Major Reason
Minor Reason
Not a Reason
a. Health or physical disability
Pre-Retirees 35% 41 24
Retirees 43% 35 22
Retired Widows 32% 26 42
b. Better access to services, transportation or support
Pre-Retirees 15% 40 44
Retirees 17% 35 48
Retired Widows 42% 28 30
c. More suitable layout (less space, all on one floor, no stairs, etc.)
Pre-Retirees 38% 31 30

© 2013 Society of Actuaries, All Rights Reserved Mathew Greenwald & Associates, Inc.
Page 148
Pre-Retirees (n=1,000), Retirees (n=1,000), Retired Widows (n=271)
Major Reason
Minor Reason
Not a Reason
Retirees 34% 25 40
Retired Widows 48% 22 30
d. Being closer to family
Pre-Retirees 27% 32 41
Retirees 23% 28 49
Retired Widows 43% 20 37
e. Better access to friends or activities
Pre-Retirees 16% 36 48
Retirees 12% 30 58
Retired Widows 44% 25 31
f. Reduced responsibility for upkeep and maintenance
Pre-Retirees 37% 39 23
Retirees 37% 36 26
Retired Widows 32% 31 37
g. Better climate
Pre-Retirees 28% 33 39
Retirees 20% 26 55
Retired Widows 55% 21 24
h. Reduced housing expenses
Pre-Retirees 39% 36 25
Retirees 24% 37 39
Retired Widows 41% 30 29
i. Tapping into the equity in your home
Pre-Retirees 14% 34 53
Retirees 9% 29 62
Retired Widows 53% 24 23
j. [IF MARRIED:] Changed needs if you lose your spouse/partner
Pre-Retirees (n=709) 40% 35 25
Retirees (n=749) 44% 33 22
Retired Widows (n=0) -- -- --

© 2013 Society of Actuaries, All Rights Reserved Mathew Greenwald & Associates, Inc.
Page 149
Planning for Retirement/Financial Planning 33. [2009] [IF WORKER, ASK:] When you (and your spouse/partner) make important
financial decisions, such as when you think about whether you can afford to retire or to purchase a new home, about how many years do you look into the future? Your best estimate is fine. (page 65)
[IF RETIREE, ASK:] When you (and your spouse/partner) make important financial decisions, such as when you think about your retirement finances or a large purchase, about how many years do you look into the future? Your best estimate is fine.
Pre- Retired Retirees Retirees Widows (n=1,000) (n=1,000) (n=271)
Less than 5 years ....................................................... 4% 8% 9% 5 to 9 ........................................................................ 17 15 11 10 to 14 .................................................................... 19 17 14 15 to 19 ...................................................................... 8 5 4 20 or more ................................................................ 17 18 13 You don’t plan ahead .................................................. 7 8 9 Don’t know/Haven’t thought about it ......................... 27 29 40 34. [new] [IF GAVE RETIREMENT AGE, ASK:] How much (WORKER: do you think each of
the following financial issues will/RETIREE: did each of the following financial issues) affect your decision to retire when you (do/did)? [RANDOMIZE LIST] (page 72)
Pre-Retirees (n=847), Retirees (n=946), Retired Widows (n=265)
A Great Deal Somewhat
Not Too Much
Not at All
a. A financial adviser (WORKER: informs/RETIREE: informed) you that you (are/were) financially able to retire
Pre-Retirees 20% 33 23 24
Retirees 10% 14 10 66
Retired Widows 7% 13 8 72
b. You (become/became) eligible for Social Security
Pre-Retirees 36% 39 17 7
Retirees 24% 18 9 49
Retired Widows 37% 18 6 39
c. You (become/became) eligible for benefits from your traditional pension or defined-benefit plan
Pre-Retirees 36% 33 13 18
Retirees 32% 19 8 41
Retired Widows 33% 16 7 44

© 2013 Society of Actuaries, All Rights Reserved Mathew Greenwald & Associates, Inc.
Page 150
Pre-Retirees (n=847), Retirees (n=946),
Retired Widows (n=265) A Great
Deal Somewhat Not Too
Much Not at
All
d. You (determine/determined) you would be able to pay your monthly bills in retirement
Pre-Retirees 53% 35 8 4
Retirees 44% 29 8 19
Retired Widows 47% 22 8 24
e. You (determine/determined) that you had accumulated enough money to last for your full retirement
Pre-Retirees 55% 32 8 6
Retirees 27% 32 14 27
Retired Widows 18% 33 14 35
f. You (receive/received) a financial incentive to retire from your employer
Pre-Retirees 28% 36 14 22
Retirees 13% 8 6 73
Retired Widows 8% 4 5 83
g. You (become/became) eligible for benefits from an annuity
Pre-Retirees 19% 29 18 34
Retirees 9% 10 8 73
Retired Widows 7% 9 8 76
h. You (become/became) eligible for Medicare or retiree health benefits from your employer
Pre-Retirees 33% 40 18 9
Retirees 20% 16 9 55
Retired Widows 26% 11 9 54
35. [new] Which one of the following best describes your attitude about managing
your finances in retirement? (page 75)
Pre- Retired Retirees Retirees Widows (n=1,000) (n=1,000) (n=271)
You (IF WORKER: will) concentrate on the present and don’t worry too much about what might happen in the future. ............................................ 10% 11% 16% You (will) try to plan for the things you know are likely to happen in the future. ............................... 46 46 39 You (will) try to plan for as many possibilities as you can. .......................................................... 43 41 43 You do not actively participate in managing your household’s finances ............................................. 1 2 2

© 2013 Society of Actuaries, All Rights Reserved Mathew Greenwald & Associates, Inc.
Page 151
36. [new] How possible do you think it is to plan for the following (WORKERS ADD: in retirement)? [RANDOMIZE LIST] (page 78)
Pre-Retirees (n=1,000), Retirees (n=1,000), Retired Widows (n=271)
Very Possible
Somewhat Possible
Not Very Possible
Not at All Possible
a. Day-to-day expenses (food, clothing, utilities, etc.)
Pre-Retirees 45% 45 8 2
Retirees 58% 35 5 2
Retired Widows 54% 36 7 3
b. Health care expenses
Pre-Retirees 22% 49 23 6
Retirees 33% 47 15 5
Retired Widows 34% 48 11 6
c. Long-term care expenses
Pre-Retirees 19% 49 24 8
Retirees 27% 45 21 8
Retired Widows 24% 42 24 10
d. Expenses associated with living longer than you thought you would
Pre-Retirees 18% 56 21 5
Retirees 25% 54 15 5
Retired Widows 23% 50 19 7
e. [IF MARRIED/PARTNER/RETIRED WIDOW:] Changes in your finances resulting from the death of a spouse/partner
Pre-Retirees (n=709) 27% 54 15 4
Retirees (n=837) 35% 46 10 10
Retired Widows (n=271) 31% 16 9 44
f. Financial assistance you provide to others
Pre-Retirees 14% 38 33 14
Retirees 15% 31 28 26
Retired Widows 13% 28 24 35

© 2013 Society of Actuaries, All Rights Reserved Mathew Greenwald & Associates, Inc.
Page 152
37. [new] [IF MARRIED, ASK:] To what extent have you and your spouse/partner planned for the following issues that often arise (WORKERS ADD: in retirement) after the first person in a couple dies? [RANDOMIZE LIST] (page 81)
[IF WIDOWED, ASK:] To what extent did you and your spouse plan for the following issues that often arise (WORKERS ADD: in retirement) after the first person in a couple dies? [RANDOMIZE LIST]
Pre-Retirees (n=731), Retirees (n=837), Retired Widows (n=271)
A Great Deal Moderately A Little
Not at All
a. Adequate assets and income
Pre-Retirees 24% 37 21 17
Retirees 46% 33 14 7
Retired Widows 40% 22 15 23
b. Ability to manage day-to-day finances
Pre-Retirees 17% 35 25 22
Retirees 37% 36 16 10
Retired Widows 37% 29 11 23
c. Adequate, affordable and manageable housing
Pre-Retirees 18% 32 21 29
Retirees 33% 35 17 15
Retired Widows 34% 25 14 27
d. Health and long-term care coverage
Pre-Retirees 14% 28 30 28
Retirees 31% 28 21 20
Retired Widows 24% 22 16 38
e. Access to physical and emotional help
Pre-Retirees 7% 23 25 45
Retirees 17% 30 26 27
Retired Widows 19% 20 19 42
f. Availability of family and friends
Pre-Retirees 14% 31 26 29
Retirees 25% 38 20 17
Retired Widows 31% 23 18 28
g. Access to transportation
Pre-Retirees 8% 23 24 46
Retirees 15% 33 22 30
Retired Widows 18% 22 14 46
h. Investment management and estate planning issues
Pre-Retirees 15% 29 27 29
Retirees 32% 31 19 18
Retired Widows 25% 24 15 36

© 2013 Society of Actuaries, All Rights Reserved Mathew Greenwald & Associates, Inc.
Page 153
Pre-Retirees (n=731), Retirees (n=837), Retired Widows (n=271)
A Great Deal Moderately A Little
Not at All
i. Access to activities of interest
Pre-Retirees 10% 28 25 38
Retirees 17% 33 26 25
Retired Widows 19% 20 18 43
38. [new] [IF MARRIED, ASK:] Should you or your spouse/partner die, how likely do
you think the surviving spouse/partner would be to turn to the following sources of assistance and support (financial and non-financial)? [RANDOMIZE LIST] (page 84)
Pre-Retirees (n=709), Retirees (n=749), Retired Widows (n=0)
Very Likely
Somewhat Likely
Not Too Likely
Not at All Likely
a. Family members
Pre-Retirees 34% 39 18 9
Retirees 35% 35 19 11
Retired Widows -- -- -- --
b. Friends
Pre-Retirees 17% 36 31 15
Retirees 15% 36 28 21
Retired Widows -- -- -- --
c. Services provided through a senior housing community
Pre-Retirees 5% 33 40 22
Retirees 9% 31 39 21
Retired Widows -- -- -- --
d. Services paid for through long-term care or other insurance
Pre-Retirees 13% 34 34 19
Retirees 17% 24 30 29
Retired Widows -- -- -- --
e. Church, community, or state services
Pre-Retirees 12% 30 37 20
Retirees 13% 28 32 28
Retired Widows -- -- -- --
f. Paid help purchased independently
Pre-Retirees 6% 35 40 20
Retirees 7% 38 33 22
Retired Widows -- -- -- --

© 2013 Society of Actuaries, All Rights Reserved Mathew Greenwald & Associates, Inc.
Page 154
39. [new] [IF WIDOWED, ASK:] Which of the following sources of assistance and support (financial and non-financial) have you turned to since your spouse died? Please click on all that apply. [RANDOMIZE LIST] (page 86)
Pre- Retired Retirees Retirees Widows (n=0) (n=0) (n=271)
Family members ......................................................... -- -- 61% Friends ....................................................................... -- -- 47% Church, community, or state services ......................... -- -- 22% Services paid for through long-term care or other insurance ............................................................... -- -- 4% Paid help purchased independently ............................ -- -- 8% Services provided through a senior housing community ............................................................. -- -- 2% None of these ............................................................. -- -- 32%
40. [2011] About how often do you (and your spouse/partner) consult with a financial
planner or adviser who helps you make decisions about your (WORKER: retirement/RETIREE: financial) planning and is paid through fees or commissions? (page 87)
Pre- Retired Retirees Retirees Widows (n=1,000) (n=1,000) (n=271)
Regularly .................................................................. 13% 25% 24% Occasionally ............................................................. 35 30 31 Never ........................................................................ 52 44 45
Retirement Income 41. [2005/11] Do you currently have a plan for how much money you will spend each
year in retirement and where that money will come from? (page 63)
Pre- Retired Retirees Retirees Widows (n=1,000) (n=1,000) (n=271)
Yes ........................................................................... 36% 67% 66% No ............................................................................ 64 33 34

© 2013 Society of Actuaries, All Rights Reserved Mathew Greenwald & Associates, Inc.
Page 155
42. [new] Retirees rely on many different sources to provide them with the money they need to cover their expenses. Which of the following (IF WORKER: do you expect will be/IF RETIREE: are) sources of income for your (and your spouse’s/partner’s) retirement? [DO NOT RANDOMIZE LIST] (page 67)
Pre-Retirees (n=1,000), Retirees (n=1,000), Retired Widows (n=271) Source of
Income
Not a Source of Income
a. Social Security benefits
Pre-Retirees 90% 10
Retirees 89% 11
Retired Widows 94% 6
b. Payments from a defined-benefit pension plan, with benefits typically based on salary and years of service. This is sometimes called a traditional pension plan.
Pre-Retirees 59% 41
Retirees 73% 27
Retired Widows 63% 37
c. Withdrawals from an employer-sponsored retirement savings plan, such as a 401(k), 403(b), or 457 plan, or from funds rolled over from this type of plan
Pre-Retirees 81% 19
Retirees 53% 47
Retired Widows 33% 67
d. Withdrawals from an IRA or Roth IRA
Pre-Retirees 55% 45
Retirees 57% 43
Retired Widows 51% 49
e. Withdrawals from taxable investment or bank accounts (not including a checking or savings account)
Pre-Retirees 39% 61
Retirees 42% 58
Retired Widows 36% 64
f. Payments from a payout annuity
Pre-Retirees 19% 81
Retirees 24% 76
Retired Widows 18% 82
g. Rental property or real estate (excluding your primary home)
Pre-Retirees 19% 81
Retirees 17% 83
Retired Widows 9% 91
h. A reverse mortgage or home equity loan
Pre-Retirees 8% 92
Retirees 6% 94

© 2013 Society of Actuaries, All Rights Reserved Mathew Greenwald & Associates, Inc.
Page 156
Pre-Retirees (n=1,000), Retirees (n=1,000), Retired Widows (n=271) Source of
Income
Not a Source of Income
Retired Widows 6% 94 Pre-Retirees (n=1,000), Retirees (n=1,000),
Retired Widows (n=271) Source of Income
Not a Source of Income
i. Employment in retirement, including self-employment
Pre-Retirees 57% 43
Retirees 28% 72
Retired Widows 8% 92
43. [new] Which one of the following best describes how you plan to manage your
financial assets (WORKER: in retirement)? [RANDOMLY REVERSE LIST] (page 70)
Pre- Retired Retirees Retirees Widows (n=1,000) (n=1,000) (n=271)
You plan to grow your financial assets by saving more money or not withdrawing earnings . 22% 22% 22% You plan to maintain your financial assets by withdrawing only earnings and leaving the principal intact ...................................................... 36 43 38 You plan to spend down your financial assets .......... 22 22 19 You have no plan for managing your financial assets .................................................... 20 13 21
Managing Risks
44. [new] Overall, how concerned are you about your (IF WORKER: finances in the five
years after retirement/IF RETIREE: your current finances)? (page 89)
Pre- Retired Retirees Retirees Widows (n=1,000) (n=1,000) (n=271)
Very concerned ........................................................ 23% 11% 14% Somewhat concerned ............................................... 41 33 31 Not too concerned .................................................... 29 43 39 Not at all concerned .................................................... 7 13 15
45. [new] Overall, how concerned are you about your (IF WORKER: long-term financial
future in retirement/IF RETIREE: your financial future)? (page 91)
Pre- Retired Retirees Retirees Widows (n=1,000) (n=1,000) (n=271)
Very concerned ........................................................ 28% 12% 16%

© 2013 Society of Actuaries, All Rights Reserved Mathew Greenwald & Associates, Inc.
Page 157
Somewhat concerned ............................................... 48 37 36 Not too concerned .................................................... 20 40 36 Not at all concerned .................................................... 4 11 12
46. [trend] How concerned are you about each of the following (WORKER ADD: in
retirement)? [RANDOMIZE LIST] (page 93)
Pre-Retirees (n=1,000), Retirees (n=1,000), Retired Widows (n=271)
Very Concerned
Somewhat Concerned
Not Too Concerned
Not at All Concerned
a. You might not be able to maintain a reasonable standard of living for the rest of your life
Pre-Retirees 22% 43 29 6
Retirees 10% 31 42 17
Retired Widows 13% 28 45 14
b. You might not have enough money to pay for adequate health care
Pre-Retirees 30% 43 20 7
Retirees 15% 31 35 20
Retired Widows 18% 28 41 14
c. You might not have enough money to pay for a long stay in a nursing home or a long period of nursing care at home
Pre-Retirees 27% 42 23 9
Retirees 17% 35 30 18
Retired Widows 18% 35 30 17
d. The value of your savings and investments might not keep up with inflation
Pre-Retirees 29% 47 19 5
Retirees 19% 39 30 12
Retired Widows 23% 33 31 13
e. [new] [IF MARRIED/PARTNER:] You might not be able to maintain the same standard of living after your spouse’s/partner’s death, if he/she should die first
Pre-Retirees (n=709) 17% 34 36 13
Retirees (n=749) 11% 28 38 23
Retired Widows (n=0) -- -- -- --
f. [IF MARRIED/PARTNER:] Your (spouse/partner) might not be able to maintain the same standard of living after your death, if you should die first
Pre-Retirees (n=709) 18% 34 35 13
Retirees (n=749) 11% 27 37 25
Retired Widows (n=0) -- -- -- --
g. You might deplete all of your savings
Pre-Retirees 25% 41 26 9

© 2013 Society of Actuaries, All Rights Reserved Mathew Greenwald & Associates, Inc.
Page 158
Pre-Retirees (n=1,000), Retirees (n=1,000), Retired Widows (n=271)
Very Concerned
Somewhat Concerned
Not Too Concerned
Not at All Concerned
Retirees 12% 28 39 21
Retired Widows 18% 25 38 18
h. [IF OWN HOME:] The equity you have in your home may not be sufficient to support your retirement plans
Pre-Retirees (n=810) 13% 32 37 18
Retirees (n=888) 6% 19 41 34
Retired Widows (n=218) 6% 13 49 32
i. You might not be able to leave money to your children or other heirs
Pre-Retirees 12% 23 32 32
Retirees 6% 17 35 42
Retired Widows 9% 18 37 36
j. [new] You might be a victim of a fraud or scam
Pre-Retirees 8% 21 40 31
Retirees 10% 22 37 32
Retired Widows 8% 18 39 34
k. [new] There might come a time when you (and your spouse/partner) are incapable of managing your finances
Pre-Retirees 13% 40 38 10
Retirees 9% 36 41 13
Retired Widows 12% 33 45 10
47. [trend] Which one of these would you say you are most concerned about
(WORKER ADD: in retirement)? [SHOW ALL VERY CONCERNED IN PRIOR Q. IF NO
VERY CONCERNED, SHOW ALL SOMEWHAT CONCERNED. AUTOCODE SINGLE RESPONSES/NONE OF THESE AS APPROPRIATE.]
Pre- Retired Retirees Retirees Widows (n=1,000) (n=1,000) (n=271)
You might not be able to maintain a reasonable standard of living for the rest of your life ............. 21% 8% 8% You might not have enough money to pay for adequate health care ........................................... 16 8 7 The value of your savings and investments might not keep up with inflation ..................................... 14 15 17 You might not have enough money to pay for a long stay in a nursing home or a long period of nursing care at home ........................................................ 11 13 15 You might deplete all of your savings ....................... 10 5 11 Your (spouse/partner) might not be able to

© 2013 Society of Actuaries, All Rights Reserved Mathew Greenwald & Associates, Inc.
Page 159
maintain the same standard of living after your death, if you should die first ................................... 5 8 -- There might come a time when you (and your spouse/partner) are incapable of managing your finances ......................................................... 4 9 10 You might not be able to maintain the same standard of living after your spouse’s/partner’s death, if he/she should die first .............................. 3 5 -- You might not be able to leave money to your children or other heirs ............................................ 3 3 5 You might be a victim of a fraud or scam ................... 2 6 6 The equity you have in your home may not be sufficient to support your retirement plans ............ 1 1 1 None of these ............................................................. 9 19 21
48. [2003/05/11] Knowing how long you can expect to live can be important for
retirement planning. Until what age do you think that you can expect to live? (page 100)
Pre- Retired Retirees Retirees Widows (n=1,000) (n=1,000) (n=271)
Less than 74 ............................................................... 3% 3% 2% 75 to 79 ...................................................................... 7 4 3 80 to 84 .................................................................... 16 10 6 85 to 89 .................................................................... 22 19 12 90 ............................................................................ 14 14 12 91 or older .................................................................. 9 12 13 Don’t know ................................................................ 28 37 52
49. [new] Please think about the person you knew in your family who lived the
longest. How old were they when they died? If this person is still living, please enter their current age. (page 102)
Pre- Retired Retirees Retirees Widows (n=1,000) (n=1,000) (n=271)
Less than 74 ............................................................... 2% 2% 1% 75 to 79 ...................................................................... 5 4 3 80 to 84 .................................................................... 13 11 13 85 to 89 .................................................................... 18 20 15 90 .............................................................................. 5 6 5 91 or older ................................................................ 48 49 51 Don’t know .................................................................. 9 9 10

© 2013 Society of Actuaries, All Rights Reserved Mathew Greenwald & Associates, Inc.
Page 160
50. [2005/07/09/11] Below is a list of things that some people do to protect themselves financially (WORKER: after they retire/RETIREE: as they get older). For each, please indicate whether you (and your spouse/partner) have done that, plan to do that in the future, or have no plans to do that. [RANDOMIZE LIST] (page 104)
Pre-Retirees (n=1,000), Retirees (n=1,000), Retired Widows (n=271)
Already Done
Plan to Do in Future
No Plans
a. Cut back on spending
Pre-Retirees 38% 50 12
Retirees 49% 27 24
Retired Widows 50% 23 28
b. Move to a smaller home or less expensive area
Pre-Retirees 10% 45 44
Retirees 20% 31 49
Retired Widows 24% 21 54
c. Invest a portion of your money in stocks or stock mutual funds
Pre-Retirees 50% 19 31
Retirees 60% 7 33
Retired Widows 55% 1 44
d. Move your assets to less risky investments as you get older
Pre-Retirees 22% 48 30
Retirees 47% 20 33
Retired Widows 46% 10 44
e. Postpone retirement
Pre-Retirees 10% 39 51
Retirees 10% 6 84
Retired Widows 12% 1 87
f. Work in retirement
Pre-Retirees 8% 65 27
Retirees 21% 16 63
Retired Widows 7% 12 81
g. Try to save as much money as you can
Pre-Retirees 48% 46 7
Retirees 55% 25 19
Retired Widows 54% 22 24
h. Completely pay off your mortgage
Pre-Retirees (n=810) 27% 60 12
Retirees (n=888) 54% 32 14
Retired Widows (n=218) 61% 18 21
i. Eliminate all of your consumer debt, by paying off all credit cards and loans
Pre-Retirees 43% 52 5
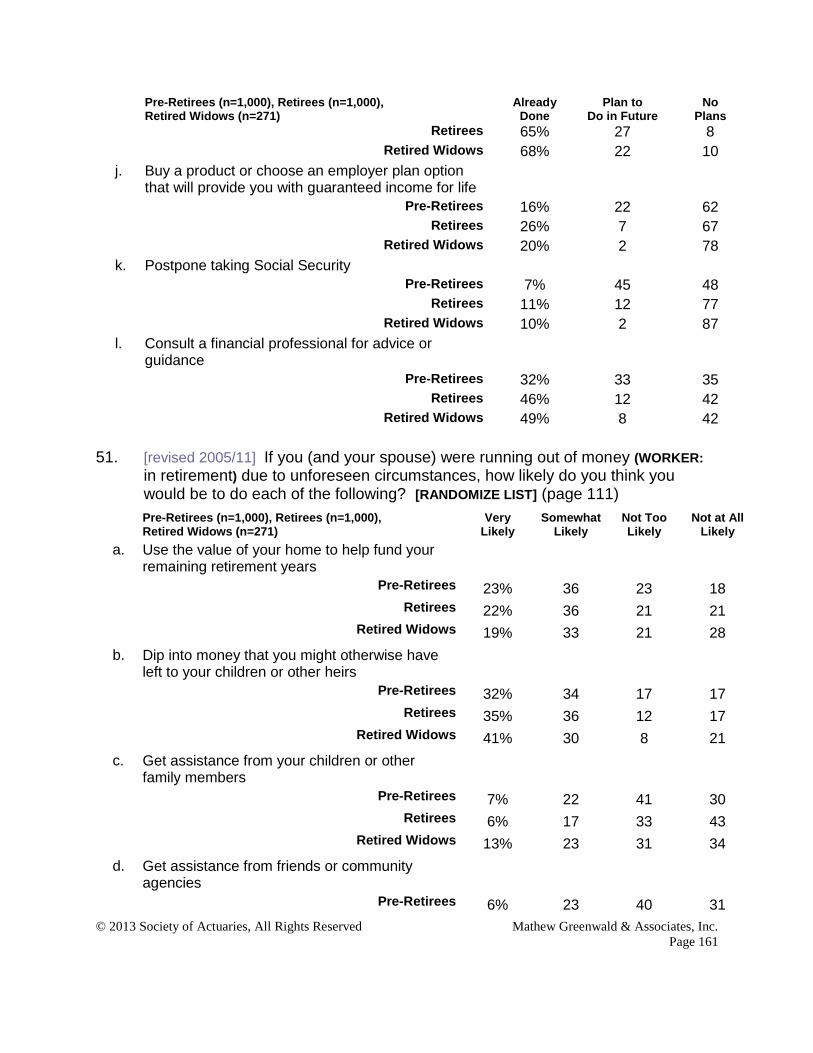
© 2013 Society of Actuaries, All Rights Reserved Mathew Greenwald & Associates, Inc.
Page 161
Pre-Retirees (n=1,000), Retirees (n=1,000), Retired Widows (n=271)
Already Done
Plan to Do in Future
No Plans
Retirees 65% 27 8
Retired Widows 68% 22 10
j. Buy a product or choose an employer plan option that will provide you with guaranteed income for life
Pre-Retirees 16% 22 62
Retirees 26% 7 67
Retired Widows 20% 2 78
k. Postpone taking Social Security
Pre-Retirees 7% 45 48
Retirees 11% 12 77
Retired Widows 10% 2 87
l. Consult a financial professional for advice or guidance
Pre-Retirees 32% 33 35
Retirees 46% 12 42
Retired Widows 49% 8 42
51. [revised 2005/11] If you (and your spouse) were running out of money (WORKER:
in retirement) due to unforeseen circumstances, how likely do you think you would be to do each of the following? [RANDOMIZE LIST] (page 111)
Pre-Retirees (n=1,000), Retirees (n=1,000), Retired Widows (n=271)
Very Likely
Somewhat Likely
Not Too Likely
Not at All Likely
a. Use the value of your home to help fund your remaining retirement years
Pre-Retirees 23% 36 23 18
Retirees 22% 36 21 21
Retired Widows 19% 33 21 28
b. Dip into money that you might otherwise have left to your children or other heirs
Pre-Retirees 32% 34 17 17
Retirees 35% 36 12 17
Retired Widows 41% 30 8 21
c. Get assistance from your children or other family members
Pre-Retirees 7% 22 41 30
Retirees 6% 17 33 43
Retired Widows 13% 23 31 34
d. Get assistance from friends or community agencies
Pre-Retirees 6% 23 40 31

© 2013 Society of Actuaries, All Rights Reserved Mathew Greenwald & Associates, Inc.
Page 162
Pre-Retirees (n=1,000), Retirees (n=1,000), Retired Widows (n=271)
Very Likely
Somewhat Likely
Not Too Likely
Not at All Likely
Retirees 4% 14 36 46
Retired Widows 7% 16 29 48
e. Reduce your expenditures significantly
Pre-Retirees 52% 38 8 2
Retirees 49% 39 10 2
Retired Widows 55% 34 9 3
f. Downsize your housing
Pre-Retirees 36% 38 16 9
Retirees 31% 32 20 16
Retired Widows 28% 31 20 21
g. Try to return to work or increase the number of hours you work for pay
Pre-Retirees 30% 46 18 6
Retirees 14% 30 23 33
Retired Widows 8% 20 20 52
Demographics
Now, a few questions for statistical purposes.
52. In general, would you say your health is… (page 130)
Pre- Retired Retirees Retirees Widows (n=1,000) (n=1,000) (n=271)
Excellent ................................................................... 24% 20% 6% Very good ................................................................. 47 44 18 Good ......................................................................... 23 25 29 Fair ............................................................................. 5 9 33 Poor ............................................................................. * 2 15

© 2013 Society of Actuaries, All Rights Reserved Mathew Greenwald & Associates, Inc.
Page 163
53. [new] [IF WORKER AND EMPLOYED:] Is your current employer... (page 131)
[IF RETIREE:] Was your employer immediately before you retired from your primary occupation…
Pre- Retired Retirees Retirees Widows (n=950) (n=1,000) (n=271)
A for-profit business .................................................. 69% 58% 56% A not-for-profit organization ...................................... 14 10 13 Military or public safety (police, fire, etc.) .................... 2 7 1 Another government organization ............................. 14 19 20 [IF RETIREE:] Not employed immediately before retirement .............................................................. -- 6 10
54. How many children or stepchildren do you have? (page 130)
Pre- Retired Retirees Retirees Widows (n=1,000) (n=1,000) (n=271)
None ......................................................................... 22% 16% 8% One ........................................................................... 18 14 14 Two ........................................................................... 33 33 34 Three ........................................................................ 16 21 24 Four or more ............................................................. 11 17 20
55. Do you provide significant financial support for anyone other than yourself (and
your spouse/partner)? (page 130)
Pre- Retired Retirees Retirees Widows (n=1,000) (n=1,000) (n=271)
Yes ........................................................................... 31% 14% 8% No ............................................................................ 69 86 92
56. What was your total household income in 2012, before taxes? (page 130)
Pre- Retired Retirees Retirees Widows (n=1,000) (n=1,000) (n=271)
Less than $25,000 ...................................................... 3% 8% 23% $25,000 to $34,999 ..................................................... 5 9 18 $35,000 to $49,999 ..................................................... 8 9 17 $50,000 to $74,999 ................................................... 18 24 15 $75,000 to $99,999 ................................................... 22 18 8 $100,000 to $149,999 ............................................... 23 16 5 $150,000 or more ..................................................... 15 8 1 Prefer not to say ......................................................... 6 10 13

© 2013 Society of Actuaries, All Rights Reserved Mathew Greenwald & Associates, Inc.
Page 164
57. In total, about how much money would you say you currently have in savings and investments, including any money that you have in retirement plans from work in which you can decide how the money is invested? Please do not include the value of your primary home. (page 130)
Pre- Retired Retirees Retirees Widows (n=1,000) (n=1,000) (n=271)
Less than $10,000 .................................................... 13% 11% 17% $10,000 to $24,999 ..................................................... 6 3 3 $25,000 to $49,999 ..................................................... 7 4 3 $50,000 to $99,999 ................................................... 10 7 8 $100,000 to $249,999 ............................................... 17 15 13 $250,000 to $499,999 ............................................... 18 15 11 $500,000 to $999,999 ............................................... 11 13 10 $1 million or more ....................................................... 5 12 5 Prefer not to say ....................................................... 13 22 29
58. [new] [IF OWN HOME, ASK:] How much equity do you currently have in your primary
home? Equity is the value of your home minus money you owe on any mortgages or home improvement loans. (page 131)
Pre- Retired Retirees Retirees Widows (n=810) (n=888) (n=218)
Less than $25,000 .................................................... 14% 6% 5% $25,000 to $49,999 ................................................... 10 7 6 $50,000 to $99,999 ................................................... 19 13 14 $100,000 to $249,999 ............................................... 29 32 35 $250,000 to $499,999 ............................................... 13 21 19 $500,000 to $999,999 ................................................. 4 6 5 $1 million or more ....................................................... 1 2 -- Prefer not to say ....................................................... 10 12 15
Thank you very much for completing this survey!