2013 port of green bay opportunity study · port of green bay . economic opportunity study . funded...
TRANSCRIPT

Port of Green Bay Economic Opportunity Study
Funded in part by the Wisconsin Coastal Management Program and the National Oceanic and Atmospheric Administration, Office of Ocean and Coastal Resource Management under the Coastal Zone Management Act, Grant #AD129611-013.15
Prepared by: Brown County Planning Commission 305 E. Walnut Street, Room 320 PO Box 23600 Green Bay, WI 54305-3600 www.co.brown.wi.us/planning
Prepared for: Brown County Port and Resource Recovery Department 2561 South Broadway Green Bay, WI 54304
1
Adopted by the Brown County Harbor Commission on December 9, 2013 Acknowledgements The Brown County Planning Commission would like to thank the members of the Brown County Harbor Commission, Dean Haen, Mark Walter, and Jodi Meyer for their assistance in the completion of the 2013 Port of Green Bay Economic Opportunity Study. Brown County Harbor Commission Neil McKloskey, Chairman Ron Antonneau Craig Dickman Bernie Erickson Greg Flisram John Hanitz Bryan Hyska Tom Klimek Henry Wallace Brown County Planning Commission Staff Chuck Lamine, AICP, Planning Director Cole Runge, Principal Planner Aaron Schuette, Principal Planner Peter Schleinz, Senior Planner Lisa J. Conard, Planner Dan Teaters, Planner Jeff DuMez, LIO Coordinator Jeremy DuChateau, GIS Technician Lori Williams, Administrative Coordinator Dorean Sandri, Administrative Secretary

2

3
TABLE OF CONTENTS
CHAPTER 1: INTRODUCTION ...................................................................................................................... 5 CHAPTER 2: PORT OF GREEN BAY GUIDANCE DOCUMENTS ................................................................... 13 CHAPTER 3: EXISTING CONDITIONS ......................................................................................................... 17 CHAPTER 4: PORT DEVELOPMENT ........................................................................................................... 43 CHAPTER 5: PORT INVESTMENT ANALYSIS .............................................................................................. 61 Figure 1-1: Total Number of Vessels to Port of Green Bay 2002-2012 .................................................... 7 Figure 1-2: Total Tonnage of Domestic Imports and Exports ................................................................... 8 Figure 1-3: Total Tonnage of Foreign Imports and Exports ...................................................................... 8 Figure 1-4: Percentages of Domestic Inbound Commodities 2010-2012 ........................................... 9-10 Figure 3-1: Port Operator Locations ....................................................................................................... 18 Figure 3-2: Summary of Existing Port Operations and Port-Related Amenities .................................... 35 Figure 3-3: Lakes Michigan and Huron Average Yearly Low Water Levels ............................................ 40 Figure 3-4: Lake Michigan Highest Annual Average Percent Ice Cover ................................................. 40 Figure 4-1: Waterfront Plan Opportunity Areas for Port Development ................................................ 46 Figure 5-1: Part of 700 Eastman Avenue ................................................................................................ 64 Figure 5-2: Part of 1601 North Quincy Street ........................................................................................ 65 Figure 5-3: McDonald Street Properties ................................................................................................ 66 Figure 5-4: 1341 State Street and 130 Ninth Street ............................................................................... 67 Figure 5-5: 239 Arndt Street ................................................................................................................... 68 Figure 5-6: 1611 State Street ................................................................................................................. 69 Figure 5-7: MARAD Port Kit Outputs ...................................................................................................... 72 APPENDIX A: Detailed MARAD Port Kit Results ......................................................................................... 75

4

5
CHAPTER 1
Introduction
Project Description and Purpose
The Port of Green Bay is a critical component of the greater Green Bay and Northeastern Wisconsin economy. Over two million metric tons of commodities, including coal, limestone, cement, salt, pig iron, fuel oil, forest products, and liquid asphalt valued at more than $300 million1, moves through the port every year. Both the 2004 Brown County Comprehensive Plan and 2010 Lower Fox River and Green Bay Shoreline Waterfront Redevelopment Plan identify expansion of port-related activities as a primary economic development objective. However, the businesses that utilize the Port of Green Bay for the shipping of goods via the Great Lakes have generally used all of the readily available land for port operations. Without access to additional properties, the ability for existing port operators to expand, and new port operators to locate within close proximity to the navigation channel is severely limited.
Over the past 25 years, the Fox River waterfront has undergone a dramatic change; from one that was primarily industrial in nature to one that is a mixture of industrial, commercial, residential, and recreational areas. As a result of this gradual change, the waterfront has become a more dynamic, defining characteristic of the Green Bay urbanized area, thereby driving up demand for waterfront property for non-port related activities, further diminishing the amount of available waterfront property for port-related businesses. In 2010, Brown County developed the Lower Fox River and Green Bay Waterfront Redevelopment Plan to identify general areas of the waterfront that should continue to be encouraged to transition from industrial uses to more mixed uses and those that should remain reserved for industrial activities related to the Port of Green Bay. The waterfront plan identified twelve distinct “opportunity areas” along the Fox River from the Bay of Green Bay to the De Pere Dam, of which four were identified that should remain primarily for port-related and/or industrial uses.
The intent of this document is to identify properties within the four port-related and/or industrial use opportunity areas that if redeveloped for port-related uses would maximize the return on investment
1 2010 Strategic Plan, Port of Green Bay, p. 6. www.portofgreenbay.com/media/2251/strategic-plan.pdf.

6
for the Port of Green Bay, Brown County, and Northeastern Wisconsin in terms of compatible land uses, projected employment, tax revenues, and overall contribution to the economy. The economic impact information identified by this update for each of the potential sites can then be provided to existing and prospective port operators when they are looking to expand or locate within proximity to the Port of Green Bay. Furthermore, the study identifies potential resources for the Port to utilize, including grants and services, as well as opportunities for the Port to capitalize upon, such as its designation as a Foreign Trade Zone.
Overview of the Port of Green Bay
Port of Green Bay History
According to the Port of Green Bay2, the history of the Port dates back to the early 1800s when commerce focused on fur trading and peltry. The first U.S. merchant vessel arrived in 1816 to stock Fort Howard with garrison troops and provisions. By 1867, the principal products carried by commercial vessels were lumber, barrels, shingles, wood, railroad ties, and other forest products; however, the 1871 Peshtigo fire dealt a severe setback to these wood-based shipments. Forest products eventually gave way to flour shipping as wheat became the major agricultural crop. By the late 1800s, Green Bay was the largest flour shipping port on the Great Lakes. Flour shipping remained strong through the mid-1930s; however, coal and petroleum coke became the predominant commodities as manufacturing gained a strong foothold in the area. In anticipation of the 1959 opening of the St. Lawrence Seaway System which connects Green Bay to worldwide markets, Brown County created the Brown County Harbor Commission, which today oversees the operations of the Port of Green Bay.
2 Port Overview, Port of Green Bay. http://www.portofgreenbay.com/business-opportunities/port-overview

7
Port of Green Bay Today
The Port of Green Bay now includes 15 independent private operators who utilize the Port of Green Bay to move an average of about two million tons of cargo on an average of about 200 ships each year. Port businesses handle dry bulk commodities such as coal, limestone, and salt; bulk liquids such as petroleum products, liquid asphalt, and tallow; breakbulk commodities including wood pulp and forest products; and oversized cargo including machinery and wind turbine components. The Port maintains a shipping channel from the entrance light to Grassy Island at a 26 foot depth and 500 foot width, from Grassy Island to the Mason Street Bridge at a 24 foot depth and 300 foot width, and from the Mason Street Bridge to the Georgia-Pacific turning basin at a 22 foot depth and 300 foot width.
Over the past ten years, port activity has largely mirrored the national economy, with strong growth in the early part of the past decade, a sharp decrease in activity at the height of the national recession, and subsequent slow, intermittent growth. Figure 1-1 depicts the total number of vessels visiting the Port of Green Bay from 2002 through 2012.
Figure 1-1: Total Number of Vessels to Port of Green Bay 2002-2012
Source: Port of Green Bay Yearly Tonnage Reports, 2002-2012
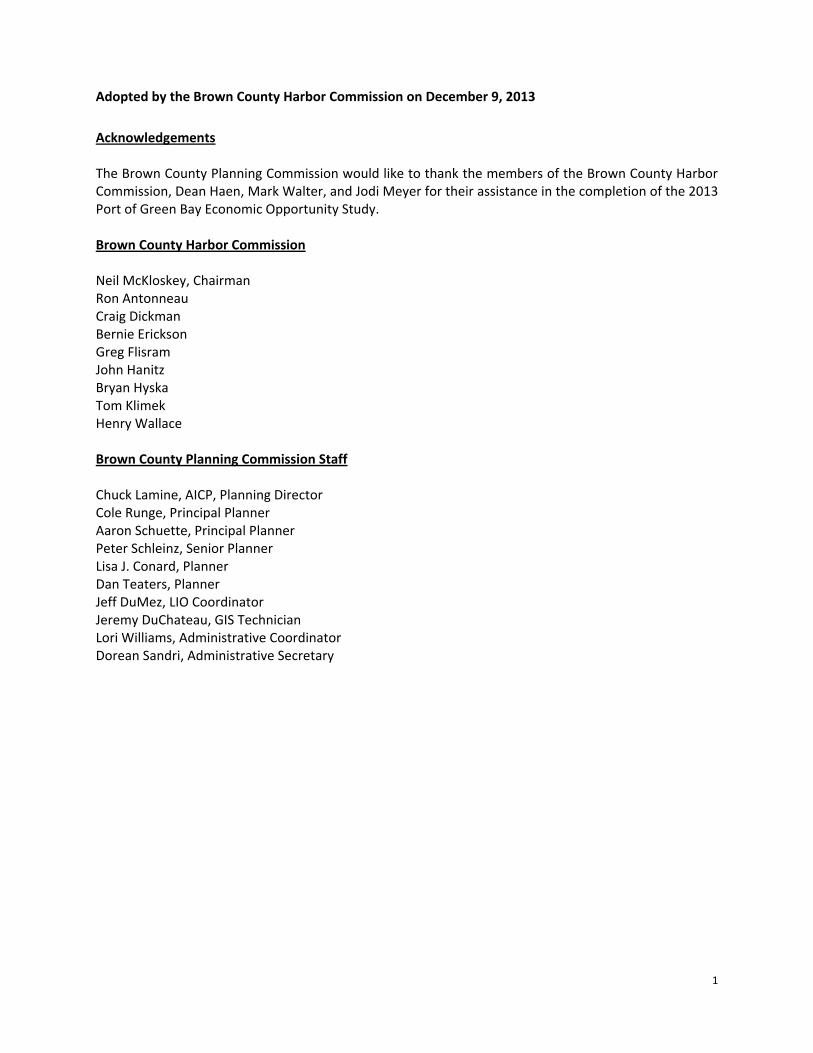
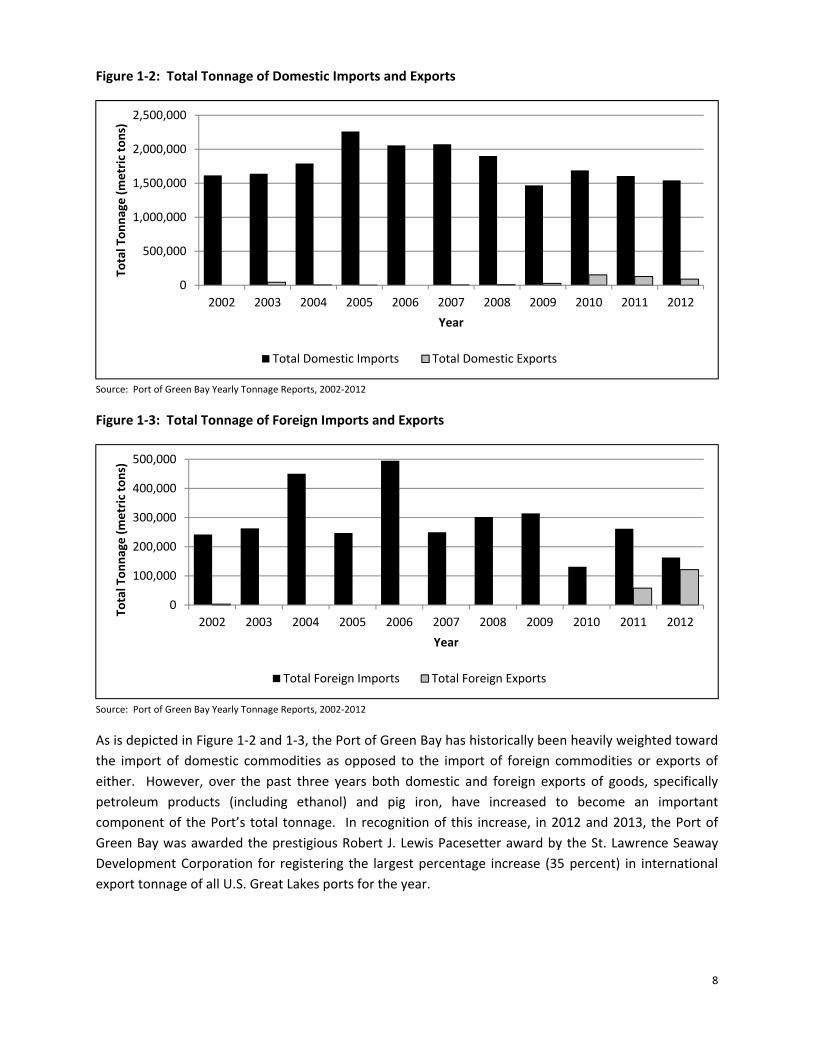
In addition to the total number of vessels, a similar trend can be seen in total domestic and foreign shipping through the Port. Figure 1-2 depicts the total inbound and exported domestic goods shipped through the Port of Green Bay. Figure 1-3 depicts the total imported and exported foreign goods shipped through the Port of Green Bay.
164
223 212234
214
182 175
140 142
188170
0
50
100
150
200
250
2002 2003 2004 2005 2006 2007 2008 2009 2010 2011 2012
Num
ber o
f Ves
sels
Year
8
Figure 1-2: Total Tonnage of Domestic Imports and Exports
Source: Port of Green Bay Yearly Tonnage Reports, 2002-2012
Figure 1-3: Total Tonnage of Foreign Imports and Exports
Source: Port of Green Bay Yearly Tonnage Reports, 2002-2012
As is depicted in Figure 1-2 and 1-3, the Port of Green Bay has historically been heavily weighted toward the import of domestic commodities as opposed to the import of foreign commodities or exports of either. However, over the past three years both domestic and foreign exports of goods, specifically petroleum products (including ethanol) and pig iron, have increased to become an important component of the Port’s total tonnage. In recognition of this increase, in 2012 and 2013, the Port of Green Bay was awarded the prestigious Robert J. Lewis Pacesetter award by the St. Lawrence Seaway Development Corporation for registering the largest percentage increase (35 percent) in international export tonnage of all U.S. Great Lakes ports for the year.
0
500,000
1,000,000
1,500,000
2,000,000
2,500,000
2002 2003 2004 2005 2006 2007 2008 2009 2010 2011 2012
Tota
l Ton
nage
(met
ric to
ns)
Year
Total Domestic Imports Total Domestic Exports
0
100,000
200,000
300,000
400,000
500,000
2002 2003 2004 2005 2006 2007 2008 2009 2010 2011 2012
Tota
l Ton
nage
(met
ric to
ns)
Year
Total Foreign Imports Total Foreign Exports

9
The types of products moving into the Port of Green Bay on a yearly basis may change significantly depending on the local, regional, national, and even international economy. Additional fluctuations may occur due to changing manufacturing processes or products, or in the case of domestic salt imports, how severe the past winter was. This is evident in Figure 1-4, which compares the total percentages of domestic inbound commodities which moved into the Port from 2010 - 2012.
Figure 1-4: Total Percentages of Domestic Inbound Commodities 2010-2012
15.8%
36.9%
0.6%
36.7%
1.5%3.2% 5.4%
2010
Cement
Coal
Gypsum
Limestone
Liquid Asphalt
Petroleum Coke
U.S. Salt
16.7%
36.3%
0.9%
38.0%
1.0%4.1% 0.3% 2.8%
2011Cement
Coal
Gypsum
Limestone
Liquid Asphalt
Petroleum Coke
Pig Iron
U.S. Salt

10
Source: Port of Green Bay Yearly Tonnage Reports, 2010-2012
In addition to being a conduit for the importation and exportation of goods via Great Lakes shippers, the Port of Green Bay operates Foreign Trade Zone #167, which was established in 1990. Within foreign trade zones (FTZs), foreign and domestic merchandise may be moved into foreign trade zones for operations not otherwise prohibited by law, generally including storage, exhibition, assembly, manufacturing, and processing. Within a foreign trade zone (or sub zone) typical customs and border patrol entry procedures and payments of duties are not required on foreign merchandise unless and until it exits the Foreign Trade Zone for domestic consumption.
The Port of Green Bay’s Foreign Trade Zone #167 currently consists of a total of 4,001 acres of land, generally located in Brown and Winnebago Counties. Specific sites within the foreign trade zone include:
Site 1 (60 acres) – is located at South Point Road and Airport Road, adjacent to Austin Straubel International Airport in the Village of Ashwaubenon, Brown County.
Site 2 (289 acres) – is in the Oshkosh Southwest Development Park located west of Oakwood Road, north of STH 91, east of Clairville Road, and south of 20th Avenue in the City of Oshkosh and Town of Algoma, Winnebago County.
Site 3 (1,654 acres) – is at the Austin Straubel International Airport, located in the Villages of Ashwaubenon and Hobart, Brown County.
Site 4 (650 acres) - includes the Ashwaubenon Industrial Park and nearby properties, located generally southwest of the intersection of South Ridge Road and Waube Lane in the Village of Ashwaubenon in Brown County.
Site 5 (20 acres) – includes the Seven Generations Corporation facility, located west of Packerland Drive, north of Partnership Drive, east of Commodity Lane, and south of Glory Road in the Village of Ashwaubenon, Brown County.
20.2%
35.2%
38.4%
0.8% 5.4%
2012
Cement
Coal
Limestone
Liquid Asphalt
U.S. Salt

11
Site 6 (162 acres) – includes the Oneida Industrial Park located at the intersection of East Adam Drive and Short Road in the Village of Ashwaubenon, Brown County.
Site 7 (10 acres) – includes the SJ Spanbauer (Fox Valley Technical College) facility bounded by West 20th Avenue to the north, Oregon Street to the east, West 23rd Avenue to the south, and Minnesota Street to the west in the City of Oshkosh, Winnebago County.
Site 8 (1,318 acres) – includes Wittman Regional Airport in the City of Oshkosh and the Towns of Algoma and Nekimi, Winnebago County.
Foreign Trade Zone #167 also includes subzones #167a, #167b, #167c, and #167d. Subzones may be established by the federal Foreign Trade Zone Board when the board finds that existing zone facilities cannot serve the specific purpose proposed.
FTZ #167a was established in 1996 and includes the Robin Manufacturing, USA, Inc. small engine facilities located in Hudson, Wisconsin.
FTZ #167b was established in 1997, expanded in 1999, and includes the Polaris Industries Inc. small-engine facilities located in Osceola, Wisconsin.
FTZ #167c was established in 1998 and includes the Sargento Foods cheese processing facilities located in Plymouth, Wisconsin. The federal approval for FTZ #167c subsequently lapsed and is therefore no longer active.
FTZ #167d was established in 2008 and includes the Marinette Marine Corporation shipbuilding facilities located in Marinette, Wisconsin.
Utilizing the established FTZ and the existing and future subzones could provide a unique incentive for businesses to work with the Port of Green Bay. Within Wisconsin, only Milwaukee has an active Foreign Trade Zone program (Dane County has an established FTZ, but no active users). As Northeastern Wisconsin’s economy becomes increasingly global in nature, the utilization of the Port’s FTZ designation can provide a locational advantage to businesses and administration of the FTZ can provide an outside revenue source for the Port.
Summary
The following chapters of the Port of Green Bay Opportunity Study will provide background on the various guidance documents the Port uses, as well as the recommendations contained within them. Furthermore, the document will identify the existing port operators and the opportunities that may exist for the expansion of port-related uses to benefit the environment and the economy of Northeastern Wisconsin.

12

13
CHAPTER 2
Port of Green Bay Guidance Documents
There are four primary documents that deal directly with the vision and operations of the Port of Green Bay and/or guide land uses in areas with Port activity. The following section is intended to identify the specific recommendations contained within those documents in regards to the Port of Green Bay.
Guidance Document Review
Port of Green Bay Strategic Plan
A strategic plan is a guiding document that sets forth specific initiatives or objectives to make progress toward attaining an overarching vision. The Port of Green Bay Strategic Plan, last updated in 2010, states as its overarching vision, “The Port of Green Bay is an integral part of a healthy Northeastern Wisconsin economy and provides a critical link to national and global markets for Wisconsin enterprises”3. This vision is broken down into four separate, but related, strategic themes:
1. Open Markets – Open markets to Northeast Wisconsin enterprises through cost-effective and environmentally-conscious transportation. Specific strategic initiatives include the following:
2. Sustainable Economics – Sustainable economics are creative, market-based decisions that strengthen the economy while protecting the environment.
3. Expand Markets and Revenue – Expand markets and revenue by looking for ways for the Port to generate new revenue streams while maintaining existing revenue streams.
4. World Class Operations – Strive for the Port of Green Bay to be a world-class operation.
Lower Fox River and Green Bay Shoreline Waterfront Redevelopment Plan
The purpose of the Lower Fox River and Green Bay Shoreline Waterfront Redevelopment Plan (Waterfront Plan) was to identify potential ways the existing diverse waterfront uses and future waterfront demands can be coordinated and balanced to create a sustainable future for the Lower Fox River and Green Bay shoreline. The major developments associated with the completion of the plan were an increased understanding of the competing interests along the waterfront and increased communication and coordination among the waterfront communities and county.
3 Port of Green Bay 2010 Strategic Plan. http://www.portofgreenbay.com/media/2251/strategic-plan.pdf. Accessed on December 12, 2012.

14
The Waterfront Plan was completed in December 2010 and identifies twelve distinct “opportunity areas” based on similar existing land uses. The plan specifically recommends increasing port activity in the North and South Bay Port Industrial Areas and the East Shore Paper Mill Area, which are generally north of the Nitschke (Main Street) Bridge in Green Bay. The plan also recommends maintaining existing port activities in the West Shore Paper Mill Area, except for the coal piles south of the Mason Street Bridge, which is recommended for redevelopment consistent with the City of Green Bay Comprehensive Plan.
Specifically within the West Shore Paper Mill Area, the plan recommends the relocation of the non-waterfront dependent Green Bay Drop Forge for port use. Additionally, the building and site currently being used to compress sediments from the Fox River’s polychlorinated
biphenyl (PCB) clean-up may be available for port use following completion of the remediation project.
Much of the western end of the North Bay Port Industrial Area is already used by the Port of Green Bay for the Bay Port Confined Disposal Facility to dewater sediments dredged from the outer harbor. The eastern end of the North Bay Port Industrial Area includes many existing port-related businesses and petroleum tank farms, including the 12.6 acre “Bylsby Property”, located at 1445 Bylsby Avenue, which was recently purchased by the Port of Green Bay. The port is currently improving the property by bringing in clean fill to ready the site for port-related business development. The port is continuing to evaluate other properties in this area for purchase as they become available.
The South Bay Port Industrial Area is heavily industrialized and includes a number of active port users, such as Graymont Lime and Stone, U.S. Venture, and St. Mary’s Cement. There are also a number of underutilized waterfront and non-waterfront properties within this area, which the plan recommends should be utilized for port-related uses if/when they become available.
City of Green Bay Comprehensive Plan
The purpose of a comprehensive plan is to set a vision for how a community is to develop over typically, a 20-year timeframe. The City of Green Bay Comprehensive Plan was adopted in 2003, consistent with the direction set forth in Chapter 66.1001 of the Wisconsin Statutes and the 14 state-identified “Smart Growth Goals”.

15
Specific to the Port of Green Bay, the City of Green Bay Comprehensive Plan recognizes the port as, “…vital to the local and regional economy and must be maintained.”4 In addition to supporting the activities of the Port of Green Bay, the comprehensive plan recommends the following: “Concentrate port activities north of Main Street on the west side of the Fox River and north of the East River on the east side of the Fox River. Also provide additional land for potential port users by relocating away from the Fox River land uses that do not depend on the port/river.”5 This is also consistent with the direction in the aforementioned Waterfront Plan.
Brown County Comprehensive Plan
The Brown County Comprehensive Plan – A Vision for Great Communities, adopted in October, 2004 was developed to create a guiding document upon which Brown County bases land division and shoreland ordinance decisions in cooperation with the local units of government. Brown County’s comprehensive plan provides local communities with examples of tools they can utilize to implement their local comprehensive plans. Brown County’s future land use map is a composite of the locally-developed maps, while the goals, objectives, and policies are intended to be applied county-wide in partnership with the local municipalities, non-profit groups, and private sector. A comprehensive plan provides a 20-year vision for a community based upon public input, the state comprehensive planning law, and sound planning and engineering principles. As with the City of Green Bay Comprehensive Plan, the Brown County Comprehensive Plan recognizes the Port of Green Bay as a critical component of Brown County’s and Northeastern Wisconsin’s regional economy. Recommendations in the Brown County Comprehensive Plan specific to the Port of Green Bay include6:
Increasing the depth of the navigation channel in the Fox River from 24 feet to 26 feet, and the width from 100 feet to 250 feet.
Seek additional products to export from the area, such as finished foundry products, paper converting machines, grain, and wood pulp.
Expand the port’s relationship with the area’s rail and trucking companies to receive additional exportable goods and continue to enable imported materials to be shipped throughout the region.
Continue to accumulate funds through docking fees and other charges to purchase land that can be leased to port-related industries in the future.
4 Green Bay Smart Growth 2022, Adopted May of 2003. Volume I page 15-4. 5 Green Bay Smart Growth 2022, Adopted May of 2003. Volume II page 18-30. 6 Brown County Comprehensive Plan, pp. 129-130, adopted October 20, 2004, Brown County Planning Commission.

16
Coordinate land use activities with the City of Green Bay.
Continue to pursue federal and state grants to expand port activities.
The Brown County Planning Commission is currently in the process of updating the Brown County Comprehensive Plan which will likely be completed in 2015. With regard to the port, it is expected the plan will focus on opportunities to utilize the Port of Green Bay as a catalyst for economic development in Northeastern Wisconsin through expanded intermodal transportation options, leveraging the Port’s Foreign Trade Zone designation, and beneficial reuse of clean dredged material.
Summary
The four primary guiding documents for the Port of Green Bay all recognize the Port as being an integral component of Northeastern Wisconsin’s economy and provide sound direction for the Port’s future. There is an understanding that the Port is dependent upon improved waterfront locations for its activities and therefore is a desire to cooperatively relocate non-waterfront dependent uses to other locations in favor of Port-related activities. However, the location of new and expanded port uses should be located within the four opportunity areas identified in the Waterfront Plan, which will not conflict with the ongoing Downtown Green Bay redevelopment efforts, but will still support port activities and by extension, the regional economy.

17
CHAPTER 3
Existing Conditions
The Port of Green Bay is spread out along the shores of the Fox River from Green Bay south approximately three miles upstream to the Georgia-Pacific Broadway Mill. Along this three-mile stretch of river are located 15 private terminal operators that either import or export commodities through the Port of Green Bay. A map depicting the location of the current (2013) port operators is located in Figure 3-1 and a short description of each follows:
C. Reiss Coal Company – The C. Reiss Coal Company has an improved dockwall and is located on the west shore of the Fox River, immediately south of the Mason Street Bridge. It is a dry bulk terminal company with additional facilities located around the Great Lakes Region. The C. Reiss Coal Company is located on approximately 35 acres of riverfront property and has a 1,400 foot sheet piling dockwall for the offloading of coal shipped into the Port of Green Bay. There have been a number of efforts undertaken to relocate the bulk coal piles out of the downtown Green Bay area, but to date, a site that meets the needs of the company and City has not been identified.

!.
!.
!.!.!.
!.!.!.
!.
!.!.!.
!.
!.
!.
!.
!.
!.
C. ReissCoal Company
Georgia-PacificWest Mill
RGLHoldings
ConstructionResourceManagement
LafargeNorth
America
GraymontLime andStone
St Mary'sCement
Sanimax
U.S.Venture
Fox RiverDock Company
Flint HillResources
GreatLakesCalcium
BylsbyProperty
Bay PortCDF
KK IntegratedLogistics
NoblePetro
KK IntegratedLogistics
WisconsinPublic Service
Figure 3-1
Port Operator Locations
µ0 0.2 0.40.1
Miles
Map prepared by the Brown County Planning Commission staff
Green Bay
FoxRiv
er

19
Construction Resource Management (CRM) – CRM is a captive service provider representing Payne & Dolan, Zenith Tech, and Northeast Asphalt. CRM is a leader in materials and construction for the heavy and highway construction business and specializes in the importation of bulk asphalt. CRM is located on approximately 7 acres on the west shore of the Fox River at the end of Ninth Street. The property includes a 400’ long slip with a sheet piling dockwall.

20
Flint Hill Resources (FHR) – FHR is a leading producer of fuels, petrochemicals and other petroleum products such as base oils for lubricants and asphalt. FHR operates an asphalt terminal near the mouth of the Fox River on approximately 3.5 acres of land. The site is located immediately south of the Wisconsin Public Service Pulliam Power Plant on the west shore of the Fox River, where it sells asphalt and polymer-modified asphalt for use in road paving projects in Northeastern Wisconsin and Upper Michigan. The property includes approximately 990’ of sheet piling dockwall along the Fox River and adjacent slip.
21
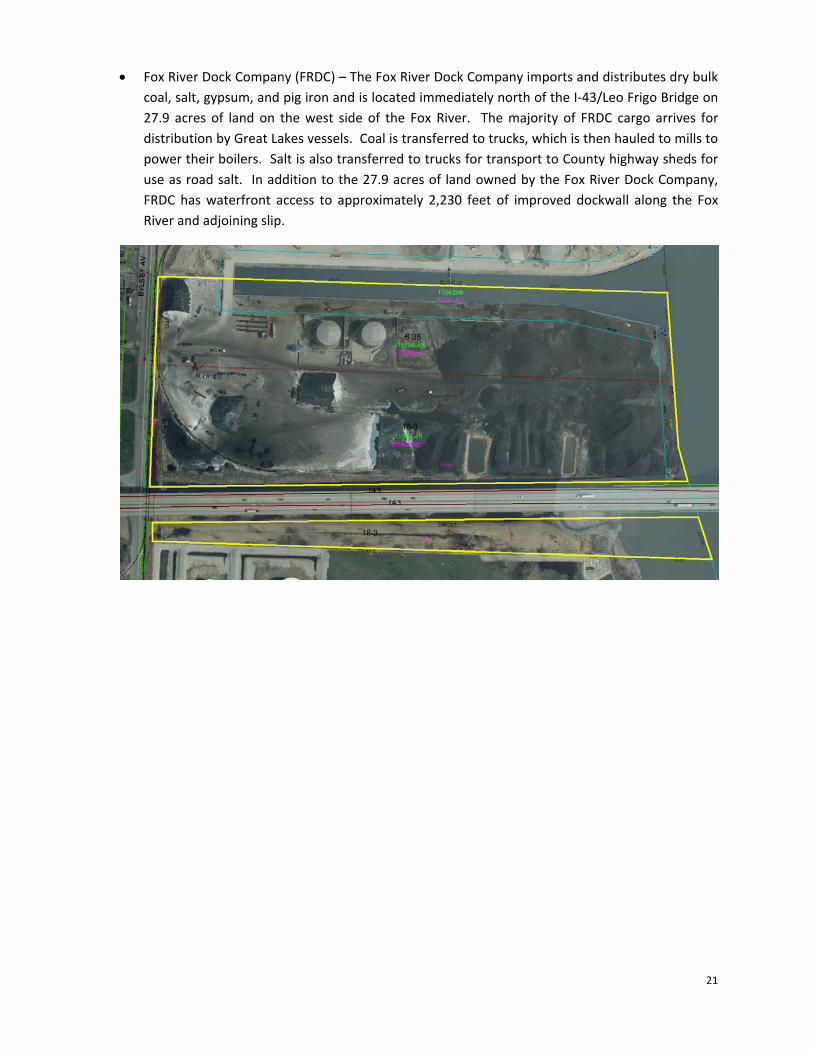
Fox River Dock Company (FRDC) – The Fox River Dock Company imports and distributes dry bulk coal, salt, gypsum, and pig iron and is located immediately north of the I-43/Leo Frigo Bridge on 27.9 acres of land on the west side of the Fox River. The majority of FRDC cargo arrives for distribution by Great Lakes vessels. Coal is transferred to trucks, which is then hauled to mills to power their boilers. Salt is also transferred to trucks for transport to County highway sheds for use as road salt. In addition to the 27.9 acres of land owned by the Fox River Dock Company, FRDC has waterfront access to approximately 2,230 feet of improved dockwall along the Fox River and adjoining slip.

22
Georgia Pacific – Georgia Pacific in Green Bay consists of four paper manufacturing facilities,including the East Mill at the confluence of the East River with the Fox River and the West Mill atthe southern end of the port. The West Mill, as depicted below, utilizes the Port of Green Bayfor the importation of coal to fire its boilers. The West Mill is located on approximately 197acres of land on the west side of the Fox River and includes a 1,300’ slip with sheet pilingdockwall along its northerly property boundary, adjacent to the Wisconsin Central rail line. Theremaining 1,540 feet of Georgia-Pacific shoreline largely consists of limestone riprap.Additionally, the Georgia-Pacific West Mill has a crane pad, modern lighting, and securitymeasures for ship activity.

23
Great Lakes Calcium (GLC) – GLC provides customized mineral processing for the production ofagricultural products, glass, plastic fillers, coatings, adhesives and sealants, rubber, waste watertreatment, and fuel burning boilers. GLC is located on 10.2 acres of property on Bylsby Avenueimmediately south of the Wisconsin Public Service Pulliam Power Plant on the west side of theFox River. GLC has approximately 860’ of frontage on the north side of a sheet-pile slip it shareswith the Fox River Dock Company and Flint Hills Resources

24
KK Integrated Logistics – KK Integrated Logistics is a fully integrated global logistics company with the ability to truck, rail, barge, ship, and manage inventory from origin to destination. KK Integrated Logistics is located immediately south of the Walnut Street Bridge on the west side of the Fox River in downtown Green Bay. ACE Marine rents a portion of the KK Integrated Logistics site for modular aluminum vessel manufacturing. This 9.8 acre site includes an extensive warehousing complex and approximately 940’ of sheet piling dockwall. Additionally KK Integrated Logistics leases the two warehouses immediately north of Leicht Park from Graymont Lime and Stone

25
Lafarge North America – Lafarge North America is a major supplier of construction materials in the U.S. and Canada. They produce and sell cement, ready-mixed concrete, gypsum wallboard, aggregates, asphalt, and related products for use in residential, commercial, and public works construction projects across North America. The Lafarge property includes approximately 4.6 acres of land on the west side of the Fox River and includes access to an approximately 200’ sheet piling lined slip. The Lafarge property is located toward the southern end of the Port, immediately north of Construction Resource Management.
26
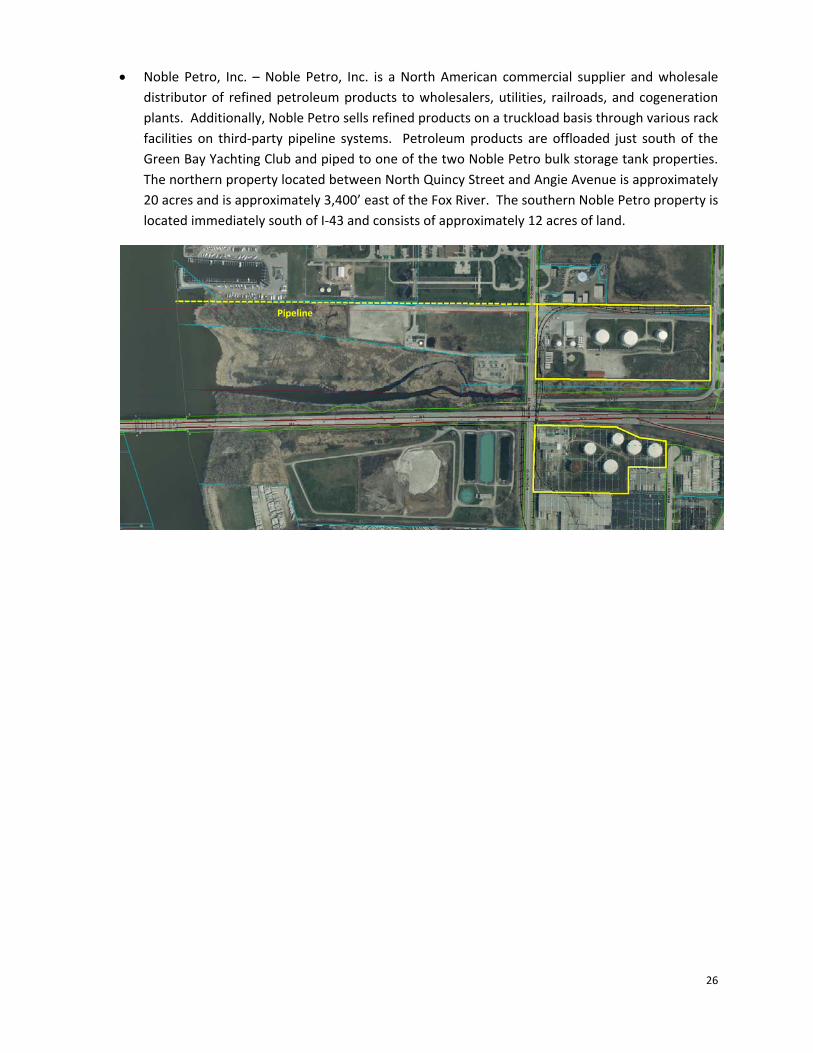
Noble Petro, Inc. – Noble Petro, Inc. is a North American commercial supplier and wholesale distributor of refined petroleum products to wholesalers, utilities, railroads, and cogeneration plants. Additionally, Noble Petro sells refined products on a truckload basis through various rack facilities on third-party pipeline systems. Petroleum products are offloaded just south of the Green Bay Yachting Club and piped to one of the two Noble Petro bulk storage tank properties. The northern property located between North Quincy Street and Angie Avenue is approximately 20 acres and is approximately 3,400’ east of the Fox River. The southern Noble Petro property is located immediately south of I-43 and consists of approximately 12 acres of land.
Pipeline

27
RGL Holdings – RGL Holdings represents a family of businesses including Leicht, Checker Logistics, and RGL Specialty Services. These companies offer integrated material management services, including expert capabilities in product handling, storage, and transportation supported by flexible capacity and engineered processes. Its capabilities extend beyond warehousing and transportation to include supply chain services and “one call distribution” for customers. The RGL Holdings slip and warehouses total approximately 31 acres of land and are located on the west bank of the Fox River, adjacent to Lafarge and CRM. The RGL Holdings slip includes approximately 300’ of sheet piling dockwall.

28
Sanimax – Sanimax collects cooking oils and animal by-products from the food and meat industries and processes them into useful materials for other industry sectors. Sanimax generally exports tallow through the Port of Green Bay. The Sanimax terminal is located on 2.1 acres of land, has 240’ of sheet piling dockwall and is located on the west bank of the Fox River, immediately north of St. Mary’s Cement.

29
St. Mary’s Cement – St. Mary’s Cement is a leading manufacturer of cement and related construction products in the United States and Canada. For over 90 years, St. Mary’s Cement has supplied cement-related materials to the Great Lakes Region and is also a significant producer of concrete and aggregates to the Ontario, Canada market. St. Mary’s Cement has a three acre site on the west bank of the Fox River with a 130’ sheet piling dockwall, immediately north of Graymont Lime and Stone.

30
U.S. Venture – The petroleum operations division of U.S. Venture includes bulk petroleum storage terminals, wholesale and branded distribution of petroleum products, multiple brand convenience store wholesaling, and gas station-related real estate activities. The U.S. Venture terminal includes approximately 43 acres of land lying on the east and west sides of N. Broadway on the west side of the Fox River. The easterly parcel includes bulk petroleum storage tanks, distribution system for trucking, and a 450’ sheet piling dockwall. The parcel on the west side of North Broadway includes larger bulk petroleum tanks.
31
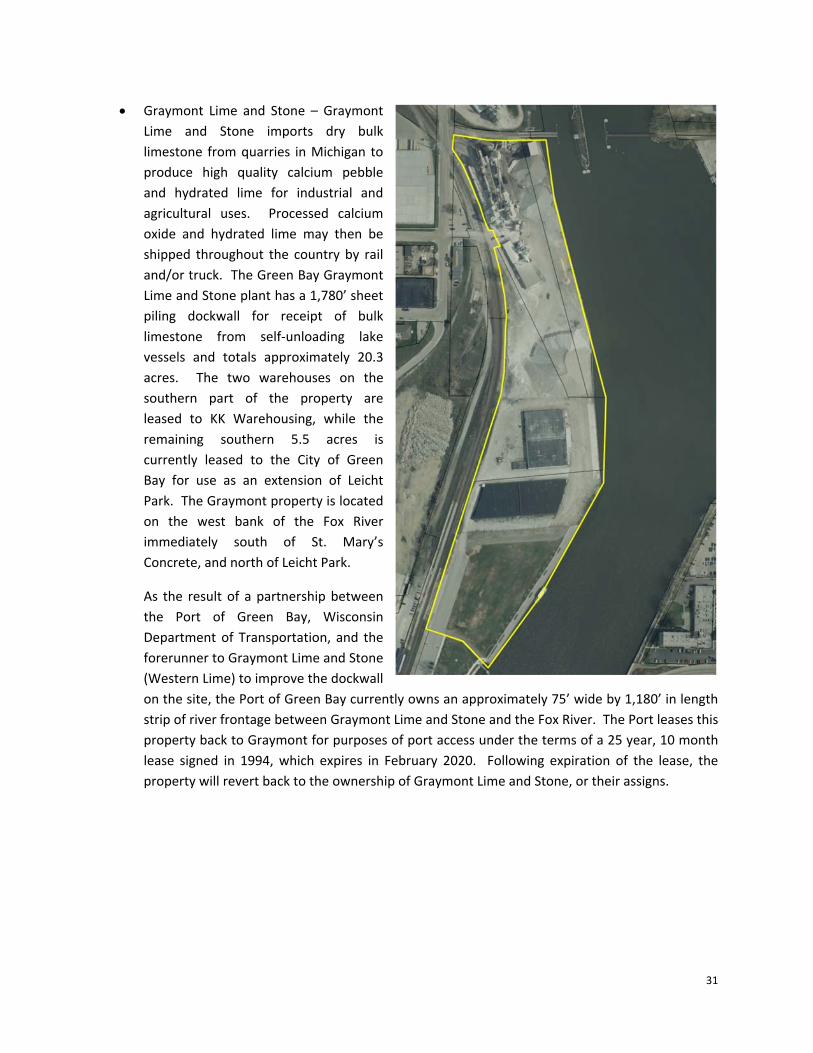
Graymont Lime and Stone – Graymont Lime and Stone imports dry bulk limestone from quarries in Michigan to produce high quality calcium pebble and hydrated lime for industrial and agricultural uses. Processed calcium oxide and hydrated lime may then be shipped throughout the country by rail and/or truck. The Green Bay Graymont Lime and Stone plant has a 1,780’ sheet piling dockwall for receipt of bulk limestone from self-unloading lake vessels and totals approximately 20.3 acres. The two warehouses on the southern part of the property are leased to KK Warehousing, while the remaining southern 5.5 acres is currently leased to the City of Green Bay for use as an extension of Leicht Park. The Graymont property is located on the west bank of the Fox River immediately south of St. Mary’s Concrete, and north of Leicht Park.
As the result of a partnership between the Port of Green Bay, Wisconsin Department of Transportation, and the forerunner to Graymont Lime and Stone (Western Lime) to improve the dockwall on the site, the Port of Green Bay currently owns an approximately 75’ wide by 1,180’ in length strip of river frontage between Graymont Lime and Stone and the Fox River. The Port leases this property back to Graymont for purposes of port access under the terms of a 25 year, 10 month lease signed in 1994, which expires in February 2020. Following expiration of the lease, the property will revert back to the ownership of Graymont Lime and Stone, or their assigns.

32
Wisconsin Public Service – Wisconsin Public Service (WPS) operates the coal-fired Pulliam Power Plant on the west side of the mouth of the Fox River and bay shore. Although coal is currently delivered to the power plant via rail, WPS has had coal delivered via Great Lakes vessels in the past. The approximately 225 acre WPS property includes the power plant, bulk coal storage, rail access, and an approximately 690’ long slip lined with sheet pile dockwall on all sides. Additionally, WPS owned property includes much of the Atkinson Marsh area between Hurlbut Street and the west bay shore.
Port of Green Bay Owned Property
In addition to serving as the manager of the Port of Green Bay, the Brown County Port and Resource Recovery Department also owns property for the storing of channel dredgings and properties deemed to be advantageous for the future growth and development of the Port of Green Bay.
o Bay Port Property – The Bay Port Property located near the northern end of Military Avenue and along the western bay shore is utilized as an engineered confined disposal facility (CDF) for the dewatering and storage of outer harbor dredgings. The property totals approximately 200 acres of land, including the areas actively used as a CDF and potential future expansion cells.

33
The Port of Green Bay is currently working with the Wisconsin Department of Transportation and other public and private partners to identify “beneficial reuse” possibilities for clean dredge materials from the outer ship channel. Additional clean dredge materials are being used to rebuild the Cat Island Chain of Islands. Based on the utilization of these materials for the Cat Island restoration and other beneficial reuse activities, it is generally expected that the Bay Port CDF will have capacity to function well into the future.

34
o Bylsby Property – The Bylsby Property is a 12.6 acre site located west of the Fox River Dock Company and Great Lakes Calcium across Bylsby Avenue. The property formerly was the site of a small bulk petroleum product tank farm and other buildings, which except for a warehouse, have been removed. The Port of Green Bay is currently leasing a portion of the land to Greenwood Energy and Great Lakes Calcium for bulk commodity storage.

35
Figure 3-2: Summary of Existing Port Operators and Port-Related Amenities
Property Primary Product(s)
Acreage Slip Dockwall Rail Access
C. Reiss Coal Company
Coal 35.0 acres No 1,400’ Yes
Construction Resource Management (CRM)
Asphalt 7.0 acres 400’ In slip Yes
Flint Hill Resources (FHR)
Petroleum 3.5 acres 990’ In slip and 120’ along Fox River.
Yes
Fox River Dock Company
Coal and salt 27.9 acres 2,230’ In slip and 660’ along Fox River
Yes
Georgia-Pacific West Mill
Coal 197.0 acres 1,300’ In slip Yes
Graymont Lime and Stone
Bulk limestone
25.8 acres No 1,780’ Yes
Great Lakes Calcium (GLC)
Customized mineral processing
7.8 acres 860’ In slip Yes
KK Integrated Logistics
Construction materials
9.8 acres No 940’ Yes
LaFarge North America
Construction materials
4.6 acres 200’ In slip Yes
Noble Petro Petroleum 12.0 acres No No (pipeline) YesRGL Holdings Warehousing 31.0 acres 300’ In slip YesSanimax Tallow 2.1 acres No 240’ YesSt. Mary’s Cement
Cement 3.0 acres No 130’ Yes
U.S. Venture Petroleum 43.0 acres No 450’ NoWisconsin Public Service (WPS)
Coal 225.0 acres 690’ In slip Yes
Bay Port Property
Confined disposal facility
200.0 acres No No No
Bylsby Property Bulk commodities
12.6 acres No No Yes

36
Port Operator Survey
As a component of this study, a survey of the 17 existing port operators was prepared to ascertain their current and future needs and how the Port of Green Bay can help to facilitate the growth of their business. The surveys asked the following questions:
Name of the port-related business.
Listing of top three commodities imported or exported through the port.
Whether the port operator foresees an expansion, contraction, or no change of the port-relatedbusiness over the next 10 years.
If an expansion is foreseen, will there be a need to increase the amount of land needed for port-related activities.
How the Port of Green Bay can help facilitate the growth of the port-related business.
Of the 17 port operators, seven responses were received within three weeks of the initial distribution and follow-up email. Of the seven respondents:
Six indicated no need for additional land, but one anticipated growth within the port operator’sexisting land base.
One indicated a need for additional land to accommodate business growth of approximately 7% - 8% per year.
Four stated that dredging of the Fox River and at a minimum maintaining the shipping channeldepth and width is a primary concern.
One stated that increasing the shipping channel to Seaway draft of 26’-27’ will be needed tocompete with other ports for new opportunities.
One stated a new shipping canal north of Atkinson Drive, northwest of the Fox River would bebeneficial.
One cited government regulations as a reason for closed export markets for their product.
Based on the results of this survey, it is apparent that at a minimum maintaining the current depth of the shipping channel is critical to the future plans of the responding port operators. Although only one respondent stated that increasing the depth to Seaway draft would be beneficial, it can be reasonably assumed that all port operators would benefit from the ability to increase the tonnage of imports or exports through the Port of Green Bay.

37
Environmental Conditions
Except for a few rivers and streams in the southeastern and far eastern parts of Brown County, the majority of rivers and streams, including major rivers such as the Fox River, East River, Duck Creek, and the Suamico River all flow into the Bay of Green Bay. Because of past point-source pollution, the Lower Green Bay and Fox River has been designated as an Area of Concern (AOC) under the United States – Canada Great Lakes Water Quality Agreement (Annex 2 of the 1987 Protocol). According to the U.S. Environmental Protection Agency, an AOC is a geographic area within the Great Lakes, “…that fail to meet the general or specific objectives of the agreement where such failure has caused or is likely to cause impairment of beneficial use of the area's ability to support aquatic life."7 The causes of impairment of the Fox River and Lower Green Bay have historically been thought of the result of point sources of pollution (end of pipe), such as industrial discharges and sewage treatment plants. Although additional progress remains to be made on point sources, non-point source pollution is now (post Clean Water Act) recognized as the major contributor to poor surface water quality in the Fox River and Lower Green Bay.
On May 18, 2012, the U.S. Environmental Protection Agency approved the Total Maximum Daily Load report (TMDL) for the Lower Fox River extending from the Lake Winnebago outlet through the lower Bay of Green Bay. A TMDL is required under the Clean Water Act for all 303(d) impaired waters. According to the TMDL, 63.0 percent of the sources of total phosphorus and 97.6 percent of the total suspended solids within the Lower Fox River Basin are from non-point sources, such as residential yards, streets, parking lots, farm fields, and barnyards. Proper management of Brown County’s shoreland zones and environmentally sensitive areas will be a critical component of reducing total phosphorus and total suspended solids to attain the goals identified in the TMDL.
The outlet of the Fox River into Green Bay receives the drainage from over 6,300 square miles of urban, suburban, and agricultural runoff from Central and Northeastern Wisconsin. During the early spring snowmelt period or immediately following spring and summer rain storms, the effect of nonpoint sources of pollution becomes very apparent in the Fox River. The water turns dark brown, loaded with suspended solids which carry excess nutrients and other pollutants from a multitude of nonpoint sources. The solids are carried into the lower bay and as the water flow slows, the solids drop out of the water column and are deposited in the river and lower bay. The photo documenting a Fox River sediment plume was taken in April 2011 and is included in the Brown County Land and Water Conservation Department 2011 Annual Report and 2012 Work Plan8.
7 http://www.epa.gov/glnpo/aoc/index.html 8 Brown County Land and Water Conservation Department 2011 Annual Report and 2012 Work Plan. http://www.co.brown.wi.us/i_brown/d/land__water_conservation/2011_annual_report__2012_annual_work_plan.pdf

38
The impact to the Port of Green Bay and the port operators from non-point source sedimentation is the need for continued dredging within the 14-mile maintained shipping channel, slips, and dockwalls. Low water levels have exacerbated the impact of the deposited sediments from the Fox River and increased the need for dredging to maintain the authorized depths within the shipping channel. According to the U.S. Army Corps of Engineers, approximately 180,000 cubic yards of material must be dredged each year to provide for one-way vessel traffic at the authorized channel depths9. The Army Corps of Engineers estimates that a loss of between one and two feet of channel depth results in increased transportation costs of between $467,000 and $1.13 million annually.10
Dredging sediments from the Fox River must be done in a manner that minimizes the disturbance of sediments contaminated with polychlorinated biphenyls (PCBs). The Fox River is currently undergoing a massive PCB remediation effort through a combination of hydraulic dredging and capping to minimize the risk to human health and the environment. Mechanical dredging of the shipping channel and the hydraulic dredging of the contaminated river sediments are coordinated by the state and federal oversight agencies to ensure there is little, if any, release of contaminant laden sediment back into the water column.
One way to reduce the sedimentation of the shipping channel, and the subsequent cost, is to prevent the soils from entering the waterways in the first place. Brown County has an extensive program in place to establish vegetated waterways in agricultural fields to significantly reduce suspended solids in
9 U.S. Army Corps of Engineers, Green Bay Harbor, WI Overview page 1. http://www.lre.usace.army.mil/ETSPubs/HFS/Green%20Bay%20Harbor.pdf. 10 U.S. Army Corps of Engineers, Green Bay Harbor, WI Overview page 2. http://www.lre.usace.army.mil/ETSPubs/HFS/Green%20Bay%20Harbor.pdf.

39
stormwater and the corresponding nutrients from agricultural lands, from entering the ditches, streams, and rivers that eventually reach the Fox River. The Port of Green Bay should work with the Green Bay Metropolitan Sewerage District (GBMSD), U.S. Army Corps of Engineers, Wisconsin Department of Natural Resources, and the Brown County Land and Water Conservation Department to evaluate the dredging cost savings associated with the quantity of soils currently being prevented from entering the Fox River through the grassed waterways, and the potential future dredging cost savings should the grassed waterways be expanded throughout the county and Fox-Wolf Watershed.
Great Lakes Water Levels
Water levels within the Great Lakes have a direct impact on water-borne shipping throughout the region. When lake levels are high, Great Lakes vessels may carry full loads without fear of scraping bottom. However, when lake levels are low, the vessels must lighten their loads in order to maintain adequate draft. The Lake Michigan/Lake Huron basin is currently experiencing historic low water levels, which is negatively impacting the quantity and therefore the relative efficiency of shipping goods into and out of the Port of Green Bay.
According to the National Oceanographic and Atmospheric Administration Great Lakes Environmental Research Laboratory (NOAA-GLERL), in December 2012 and January 2013, the monthly average low water level in the Lake Michigan/Lake Huron basin (175.57 meters) dropped below the record low recorded in 1964 (175.58 meters). The yearly low water levels have remained below the long-term average yearly low water level (176.21 meters) since 1999.11. Figure 3-3 depicts the yearly average low water levels for the Lakes Michigan and Huron basin since 1918.
11 NOAA-GLERL Water Levels of the Great Lakes, March 2013 brochure. http://www.glerl.noaa.gov/pubs/brochures/lakelevels/lakelevels.pdf.

40
Figure 3-3: Lakes Michigan and Huron Average Yearly Low Water Levels
Based on computerized modeling, seasonal outlooks indicate that water levels may continue to set new record lows into the foreseeable future. According to NOAA-GLERL, the current record-setting low water levels on Lakes Michigan and Huron are a result of many factors, including the large decrease in water levels that took place on the upper lakes in the late 1990’s, the cyclical nature of the lake levels, and increases in lake evaporation due to a lack of winter ice cover on the lakes, among others.
Figure 3-4 depicts the average percent ice cover for Lake Michigan for the years of 1973 through 2012. In a typical year, the greatest percentage of ice cover occurs in February, which is reflected in the graph.
Figure 3-4: Lake Michigan Highest Annual Average Percent Ice Cover
Source: NOAA-GLERI Great Lakes Water Level Dashboard, Accessed 3/13/2013 http://www.glerl.noaa.gov/data/now/wlevels/dbd/.
175.0
175.5
176.0
176.5
177.0
177.5
1918
1921
1924
1927
1930
1933
1936
1939
1942
1945
1948
1951
1954
1957
1960
1963
1966
1969
1972
1975
1978
1981
1984
1987
1990
1993
1996
1999
2002
2005
2008
2011
Surf
ace
Wat
er E
leva
tion
(m)
Year
Long Term Average Low Water Level Yearly Low Water Level
0102030405060708090
100
Perc
ent I
ce C
over
Year
Percent Ice Cover

41
For the Port of Green Bay, it is estimated that each inch of lost water accounts for about 100 tons of cargo being left behind due to shallower drafts12. As a result of the historic low water levels, dredging has taken on an even greater importance to ensure adequate draft is available for the Great Lakes vessels importing and exporting commodities through the Port of Green Bay.
If the ports are not adequately dredged and are eventually closed to shipping, all commodities currently entering and leaving the port would need to be shipped via rail and truck. According to the U.S. Army Corps of Engineers, switching the import/export of these commodities from ship to rail and truck due to closure of the Port of Green Bay would increase annual harmful emission rates by over 4,400 tons of harmful particulate matter (PM-10), increase costs by $875,000 due to increased railroad related accidents and $642,000 due to increased trucking related accidents. Furthermore, even the loss of just one to two feet channel depth would result in increased transportation costs of between $467,000 and $1.13 million annually.13 In order to ensure the Port’s continued viability, it is critical the shipping channel continues to be dredged to, at a minimum, its federally authorized depths. This will allow imports and exports vital to many of northeastern Wisconsin’s industries and municipalities to continue to be delivered in the most environmentally friendly and economically efficient manner possible.
12Nathan Phelps, “Low Water Levels Hurt Great Lakes Shippers’ Bottom Line”, Green Bay Press-Gazette, March 29, 2013. 13 U.S. Army Corps of Engineers, Green Bay Harbor, WI Overview, February 2012, pages 1-2. http://www.lre.usace.army.mil/ETSPubs/HFS/Green%20Bay%20Harbor.pdf.

42

43
CHAPTER 4
Port Development
The Port of Green Bay fills a critical role in the economy of Northeastern Wisconsin by providing an efficient mode of transportation for the export and import of various commodities. In January 2013 the Research and Traffic Group, in collaboration with the Chamber of Marine Commerce, the Canadian Shipowners-Association, the St. Lawrence Seaway Management Corporation, and The Saint Lawrence Seaway Development Corporation, prepared a report comparing the energy costs and environmental impacts associated with transport of commodities by Great Lakes vessels, rail, and truck. The report, Environmental and Social Impacts of Marine Transport in the Great Lakes – St. Lawrence Seaway Region compares the three modes of transport in 2010 and after proposed “renewal” requirements, which are expected regulations to improve the energy efficiency and lower the environmental impact of the three modes of transport.
The report states a Great Lakes vessel (U.S. Fleet) can currently (2010) move a ton of freight approximately 610 miles on one gallon of fuel. For comparison, railroads can move a ton of freight approximately 550 miles per gallon of fuel and trucks can move a ton of freight approximately 88 miles per gallon of fuel. Post renewal actions, a Great Lakes vessel (U.S. Fleet) is projected to move a ton of freight 887 miles on one gallon of fuel, as compared to rail at 581 miles per ton per gallon of fuel and truck at 104 miles per ton per gallon of fuel.14
Similar to the fuel efficiency advantages associated with Great Lakes vessels, under current conditions greenhouse gas (GHG) emissions are significantly less for Great Lakes vessels than rail or truck. Compared to the U.S. Great Lakes Fleet carrying one ton of cargo one mile, rail would emit 15% more GHG and trucks 534% more GHG15. Post-renewal, the disparity in GHG emissions among the three modes is expected to increase, furthering the advantage of the Great Lakes vessels. According to the
14 Environmental and Social Impacts of Marine Transport in the Great Lakes-St. Lawrence Seaway Region Executive Summary p.6, Research and Traffic Group, January 2013. 15 Environmental and Social Impacts of Marine Transport in the Great Lakes-St. Lawrence Seaway Region Executive Summary p.8, Research and Traffic Group, January 2013.
44
report, rail and trucks carrying one ton of cargo a distance of one mile is projected to emit 57% and 698% more GHG, respectively as compared to the U.S. Fleet16.
The efficiencies exhibited by the report demonstrate the inherent efficiencies associated with shipping commodities via Great Lakes vessels and by extension, the Port of Green Bay. The commodities, whether bulk commodities such as salt, limestone, coal, or fuel oil, or break bulk commodities such as wood pulp or forest products comprise essential raw material for major employers within Brown County and the greater Northeastern Wisconsin region. In order for the Port of Green Bay to provide greater levels of service for businesses to take advantage of these efficiencies, the Port will need to increase the acreage devoted to port-related land uses.
Ideally for port development, available vacant land would be located adjacent to the Fox River with improved bulkheads and slips for ships. However, the majorities of lands with these attributes are already being utilized by port-related businesses or are located in the heart of downtown Green Bay and are committed to non-port redevelopment. Therefore future growth of the Port will have to occur on riverfront lands already occupied by other uses or on compatible non-waterfront properties. For instance, the Port of Green Bay recently purchased the Bylsby property, which although not located directly on the river, is located in relatively close proximity to the river, which indicates a willingness to look at properties beyond the river’s edge and be creative in their use for port-related or port-supportive businesses.
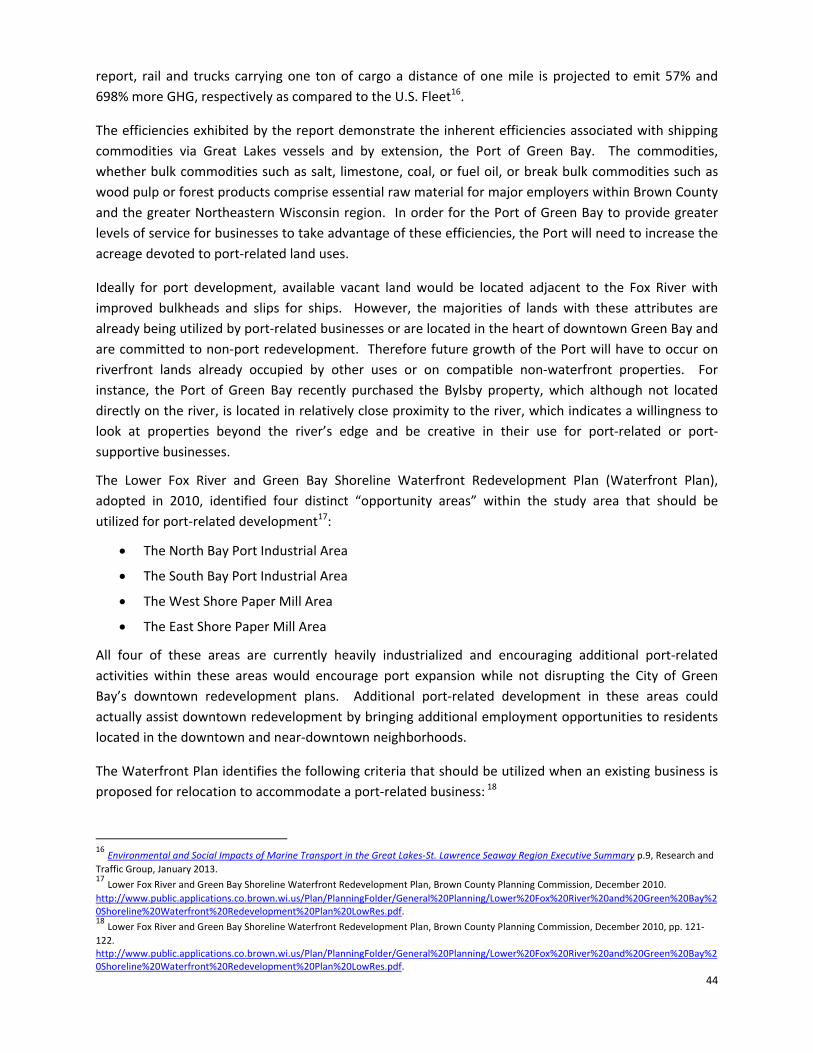
The Lower Fox River and Green Bay Shoreline Waterfront Redevelopment Plan (Waterfront Plan), adopted in 2010, identified four distinct “opportunity areas” within the study area that should be utilized for port-related development17:
The North Bay Port Industrial Area
The South Bay Port Industrial Area
The West Shore Paper Mill Area
The East Shore Paper Mill Area
All four of these areas are currently heavily industrialized and encouraging additional port-related activities within these areas would encourage port expansion while not disrupting the City of Green Bay’s downtown redevelopment plans. Additional port-related development in these areas could actually assist downtown redevelopment by bringing additional employment opportunities to residents located in the downtown and near-downtown neighborhoods.
The Waterfront Plan identifies the following criteria that should be utilized when an existing business is proposed for relocation to accommodate a port-related business: 18
16 Environmental and Social Impacts of Marine Transport in the Great Lakes-St. Lawrence Seaway Region Executive Summary p.9, Research and Traffic Group, January 2013. 17 Lower Fox River and Green Bay Shoreline Waterfront Redevelopment Plan, Brown County Planning Commission, December 2010. http://www.public.applications.co.brown.wi.us/Plan/PlanningFolder/General%20Planning/Lower%20Fox%20River%20and%20Green%20Bay%20Shoreline%20Waterfront%20Redevelopment%20Plan%20LowRes.pdf. 18 Lower Fox River and Green Bay Shoreline Waterfront Redevelopment Plan, Brown County Planning Commission, December 2010, pp. 121-122. http://www.public.applications.co.brown.wi.us/Plan/PlanningFolder/General%20Planning/Lower%20Fox%20River%20and%20Green%20Bay%20Shoreline%20Waterfront%20Redevelopment%20Plan%20LowRes.pdf.

45
The relocation project should:
Promote economic development activity, generating tax base, and the creation or preservationof jobs.
Be based on a cooperative venture with the business to be relocated.
Protect the viability of the displaced business.
Result in an expansion of lands for port activities.
Result in increased efficiencies and improved economic viability of the port-related business.
Encourage the cleanup and restoration of brownfield sites.
Be conducted in a manner that reduces or eliminates negative externalities of incompatible landuses.
Promote future port uses which do not involve bulk storage.
Be consistent with long-range port and city plans.
Incorporate waterfront public access for non-port related developments.
Enhance the property tax base within the community.
The following section will review specific properties within the identified opportunity areas both along and in relatively close proximity to the Fox River that could be considered for acquisition by the Port of Green Bay for port-related use, should they become available in the future. The focus will be on parcels or portions of parcels that are vacant, underutilized, or are not dependent on waterfront locations. It is important to note that any acquisition of property would be done in a cooperative manner with willing sellers. If fee-simple purchase is not feasible, then a lease of land by a port-related user could also be considered. Each photo is hyperlinked to an interactive web-based map and aerial photo of the site.
Many of the properties identified in the following section have a long history of usage including industrial and likely many other unknown uses. In order to protect the County from environmental liability associated with any potential contamination on the sites, it is critical that as part of a purchase negotiation the County work with a qualified environmental consultant to perform an environmental investigation to the standards of the Wisconsin Department of Natural Resources and U.S. Environmental Protection Agency. An environmental investigation will aid the county and seller in determining an appropriate purchase price, and should the purchase be approved, protect the county from environmental liability associated with past contamination.

Figure 4-1
Port-Related Opportunity Areas
µ0 0.25 0.50.125
Miles
Map prepared by the Brown County Planning Commission staff
Green Bay
FoxRiv
er
As Identified in the Lower Fox River and Green Bay Shoreline Waterfront Redevelopment Plan
North Bay PortIndustrial Area
South Bay PortIndustrial Area
West Shore PaperMill Area
East Shore PaperMill Area

47
Potential Port User Expansion Locations
1341 State Street Ownership Green Bay Drop Forge Land Use Industrial Surrounding Land Use Industrial and Commercial Zoning District General Industrial (GI) Acreage 10.6 acres Waterfront Yes Established Bulkhead Line Yes Improved Dockwall or Slip No Shoreline Materials Stone/rock rip-rap Rail Access Yes Distance to closest state/federal highway 1,700 feet Current depth at Dockage Approx. <3’
The 10.6 acre property at 1341 State Street is located on the west side of the Fox River toward the southerly end of the dredged shipping channel. The business currently located on the site, Green Bay Drop Forge is not dependent on a waterfront location for either import/export of goods or use of the water for manufacturing purposes, and would therefore be a good candidate for a cooperative relocation. LaFarge Corporation and RGL Holdings are two port operators located immediately south of the property and the C. Reiss Coal Company is located to the immediate north. A rail spur runs along the western end of the property, adjacent to State Street. The property’s location between two current port operators and other commercial/industrial development lends itself well to potential future use for port-related activities.
In order to take advantage of the waterfront site for port-related purposes, the existing rock/stone rip-rap shoreline would need to be improved to provide property dockage for port-related imports or exports via lake-bound ships. Typical dockage would involve the installation of sheet piling or other

48
docking mechanisms to facilitate the offloading or loading of the various types of materials shipped through the Port of Green Bay. In addition to an improved dockwall, the river would most likely need to be dredged to the 24’ depth necessary for most Great Lakes cargo ships.
130 Ninth Street Ownership End of Ninth, LLC Land Use Industrial Surrounding Land Use Industrial Zoning District General Industrial (GI) Acreage 2.7 acres Waterfront Yes Established Bulkhead Line Yes Improved Dockwall or Slip No Shoreline Materials Stone/rock rip-rap Rail Access No Distance to closest state/federal highway 1,700 feet Depth at Dockage Approx. <3’
The 2.7 acre parcel of land located at 130 Ninth Street is located on the west side of the Fox River toward the southerly end of the dredged shipping channel. It is not evident the business currently located on the site is required to have waterfront access for either import/export of goods or use of the water for manufacturing purposes, and could therefore be a good candidate for a cooperative relocation. LaFarge Corporation and RGL Holdings are two port operators located immediately south of the property and Green Bay Drop Forge, also a potential candidate for cooperative relocation is located to the immediate north. The property’s location immediately north of current port operators and immediately south of a potential future port related use lends itself well to potential future use for port-related activities.
Although the site is located on the waterfront, it only has approximately 120 feet of the shoreline. Provided a cooperative relocation is successful with Green Bay Drop Forge and the current owners of this site, it may be advantageous to combine the two parcels into one larger parcel to maximize the potential dockage area. In order to take advantage of the waterfront site for port-related purposes, the existing rock/stone rip-rap shoreline would need to be improved to provide property dockage for port-related imports or exports via lake-bound ships. Typical dockage would involve the installation of sheet

49
piling or other docking mechanisms to facilitate the offloading or loading of the various types of materials shipped through the Port of Green Bay. In addition to an improved dockwall, the river would most likely need to be dredged to the 24’ depth necessary for most Great Lakes cargo ships.
1611 State Street Ownership Georgia Pacific (TetraTech) Land Use Industrial Surrounding Land Use Industrial Zoning District General Industrial (GI) Acreage 27.2 acres Waterfront Yes Established Bulkhead Line Yes Improved Dockwall or Slip No Shoreline Materials Stone/rock rip-rap Rail Access Adjacent Distance to closest state/federal highway 2,500 feet Depth at Dockage Approx. 0-10’
1611 State Street, located on the west bank of the Fox River near the southerly limits of the shipping channel is the current site of the Green Bay processing facility for polychlorinated biphenyl (PCBs) remediation of the Fox River. This is the primary base of operations for the dewatering, sediment processing, water treatment operations, and material handling occurs. The land is currently owned by Georgia-Pacific and the buildings holding the presses for compacting the hydraulically dredged sediments are located on site. Adjacent uses include port operators RGL Holdings to the north and
50
Georgia-Pacific to the south. A grade elevated rail line is located along the southerly boundary of the property and extends on a bridge across the Fox River.
Considering the sediment cleanup project is anticipated to be completed in 2017, the use of the site for processing sediments will no longer be needed. The existing buildings on the site are all modern steel shell buildings with very high ceilings and could conceivably be retrofitted for port-related manufacturing processes such as shipbuilding, warehousing, or other similar uses that could take advantage of the site’s waterfront location and potential rail access.
In order to efficiently utilize the waterfront site for port-related purposes, the existing rock/stone rip-rap shoreline and partial slip would need to be improved to provide proper dockage for port-related imports or exports via lake-bound ships. Typical dockage would involve the installation of sheet piling or other docking mechanisms to facilitate the offloading or loading of the various types of materials shipped through the Port of Green Bay. In addition to an improved dockwall, the river would most likely need to be dredged to the 24’ depth necessary for most Great Lakes cargo ships.
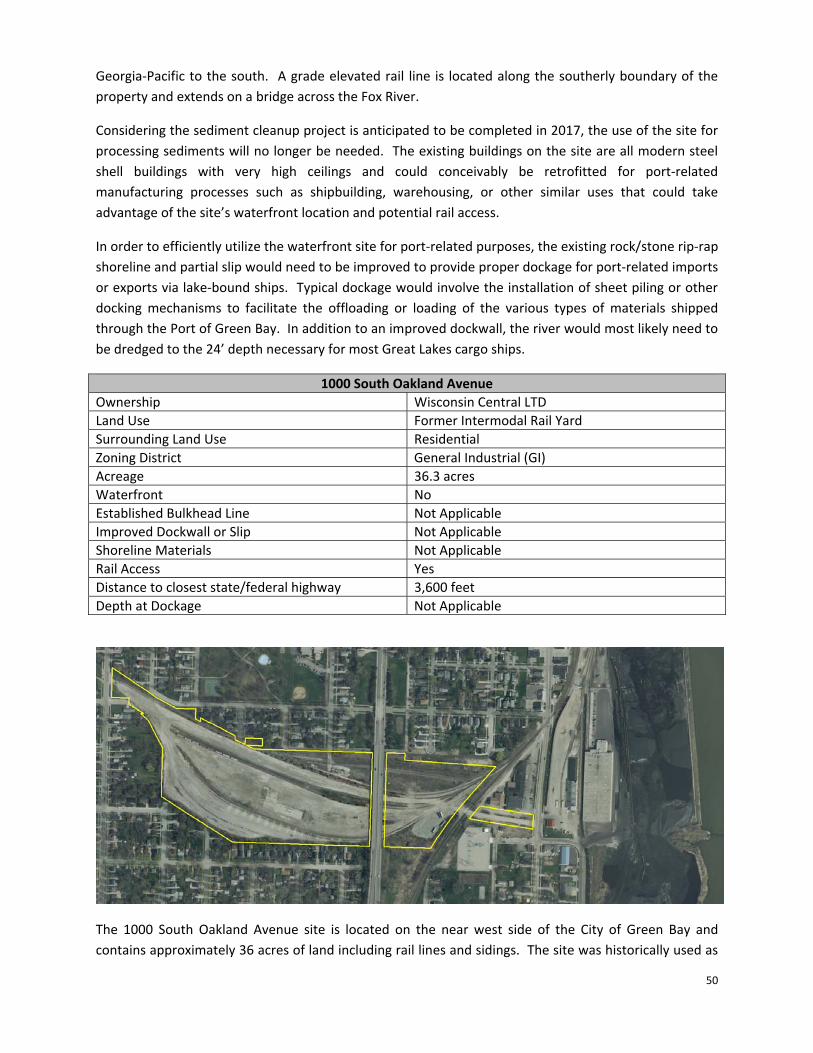
1000 South Oakland Avenue Ownership Wisconsin Central LTD Land Use Former Intermodal Rail Yard Surrounding Land Use Residential Zoning District General Industrial (GI) Acreage 36.3 acres Waterfront No Established Bulkhead Line Not Applicable Improved Dockwall or Slip Not Applicable Shoreline Materials Not Applicable Rail Access Yes Distance to closest state/federal highway 3,600 feet Depth at Dockage Not Applicable
The 1000 South Oakland Avenue site is located on the near west side of the City of Green Bay and contains approximately 36 acres of land including rail lines and sidings. The site was historically used as

51
an intermodal site for the transfer of goods shipped on rail to trucks for local delivery and more recently as a staging area for delivery of wind turbine components. The site has not been actively used as an intermodal site for a number of years, however it is still owned by Wisconsin Central, which is a subsidiary of Canadian National. The surrounding land uses are predominantly residential with industrial/commercial uses on the far eastern side of the property. Although the site is not located on the waterfront, it is approximately 2,000 feet from the Fox River and is a large parcel of land with rail access that has generally been used for transportation purposes.
The Port of Green Bay, Brown County, and a number of regional businesses are interested in restarting the intermodal yard to take advantage of the potential port/rail/truck connections at the site. According to a survey conducted by the Brown County Port/Rail Intermodal Ramp Committee, there is a potential for 80,000 container lifts in the area. By utilizing rail instead of truck, the committee found a potentially significant cost savings to area manufacturers and bottom-line benefits to Canadian National. Reopening an intermodal yard at this site would help to facilitate the efficient import, export, and distribution of goods throughout Northeastern Wisconsin and the Upper Peninsula of Michigan by rail and ship.
Part of 1601 N. Quincy Street Ownership Green Bay Packaging, Inc. Land Use Trailer Storage Surrounding Land Use Industrial Zoning District General Industrial (GI) Acreage 8.9 acres (approximately) Waterfront Yes Established Bulkhead Line Yes Improved Dockwall or Slip No Shoreline Materials Stone/rock rip-rap Rail Access Yes Distance to closest state/federal highway 5,100 feet Depth at Dockage Approx. 10-15’

52
1601 North Quincy Street is part of Green Bay Packaging’s manufacturing complex on the east side of the Fox River, just south of the I-43 (Leo Frigo) Bridge. The potential port use site is currently utilized by Green Bay Packaging for semi-trailer storage, which is not a waterfront dependent land use. Surrounding land uses are mixture of industrial uses (manufacturing and landfill) and environmental areas. The shoreline consists of rock rip-rap, trees, and brushy vegetation.
In order to utilize this site for port-related uses, a parcel sale or long-term lease agreement would first need to be reached with Green Bay Packaging for the land and alternative trailer parking would need to be found. In addition, access to the site would need to be obtained from North Quincy Street via easement or the creation of a separate parcel with street frontage. Although the process to utilize the site for a port-related use may be difficult, the site location has strong advantages, including it being located relatively close to the mouth of the Fox River which eliminates the need for bridge openings, located in a heavy industrial area, and the approximately nine acres of contiguous, waterfront land. Even if the Port of Green Bay could not reach an agreement with Green Bay Packaging to lease the site, Green Bay Packaging could conceivably privately lease the site to a waterfront dependent business, thereby expanding overall economic development activity.

53
1016 McDonald Street Ownership Jolliffe Geraldine A. Trust Agt et.al. Land Use Residential Surrounding Land Use Industrial Zoning District General Industrial (GI) Acreage 0.40 acres Waterfront Yes Established Bulkhead Line Yes Improved Dockwall or Slip No Shoreline Materials Rock/stone rip-rap and brush Rail Access Yes Distance to closest state/federal highway 2,060 feet Depth at Dockage Approx. <3’
The 1016 McDonald Street site is a small, residential waterfront parcel located in a heavily industrialized part of the west side of the Fox River, immediately north of the Sanimax terminal and south of indoor/outdoor boat storage and a small warehouse. The shoreline consists of small rock rip-rap and brushy vegetation and a rail spur crosses the front of the parcel. Although the site is relatively small for port-related uses, it could be combined with the three parcels immediately north of the subject parcel to create an approximately 4.8 acre waterfront parcel with rail access. Additionally, there are a number of small parcels west of State Street and south of Alexander Street with warehouses that are either for sale or in a general state of disrepair. These parcels could be combined to create an additional 4.6 acres of land to support the subject parcel’s potential port-related reuse. Vacating Warren Street would add an additional 0.4 acres to the total available land.

54
1020 McDonald Street Ownership Thomas N. Hermes Land Use Industrial Surrounding Land Use Residential and Industrial Zoning District General Industrial (GI) Acreage 0.81 acres Waterfront Yes Established Bulkhead Line Yes Improved Dockwall or Slip No Shoreline Materials Rock/stone rip-rap and brush Rail Access No Distance to closest state/federal highway 2,100 feet Depth at Dockage Approx. <3’
The 1020 McDonald Street site is immediately north of the 1016 McDonald Street site and consists of a small warehouse and outdoor storage on approximately 0.8 acres of land on the west side of the Fox River, generally north of the Sanimax Terminal. Surrounding land uses are primarily industrial with a residential use located immediately to the south and indoor/outdoor boat storage located to the north. The shoreline consists of small rock rip-rap and brushy vegetation. Although the site is relatively small for port-related uses, it could be combined with the two parcels immediately north and one parcel immediately south of the subject parcel to create an approximately 4.8 acre waterfront parcel with rail access. Additionally, there are a number of small parcels west of State Street and south of Alexander Street with warehouses that are either for sale or in a general state of disrepair. These parcels could be combined to create an additional 4.6 acres of land to support the subject parcel’s potential port-related reuse. Vacating Warren Street would add an additional 0.4 acres to the total available land.

55
1028 McDonald Street Ownership The Boatyard, LLC Land Use Commercial Indoor/Outdoor Boat Storage Surrounding Land Use Industrial Zoning District General Industrial (GI) Acreage 1.65 acres Waterfront Yes Established Bulkhead Line Yes Improved Dockwall or Slip No Shoreline Materials Rock/stone rip-rap and brush Rail Access No Distance to closest state/federal highway 2,250 feet Depth at Dockage Approx. 5-10’
The 1028 McDonald Street site is approximately 1.7 acres and is located on the west side of the Fox River near the end of McDonald Street. The building is currently owned by The Boatyard, LLC for indoor and outdoor boat storage, maintenance, and dockage. A wholesale seafood business is located to the north and a small warehouse is located to the south. The shoreline generally consists of rock rip-rap, brushy vegetation, and a boat launch facility for the business. Because this use is dependent upon a waterfront location, relocation of the business could be problematic. Although the site is relatively small for port-related uses, it could be combined with the two parcels immediately south and one parcel immediately north of the subject parcel to create an approximately 4.8 acre waterfront parcel with rail access. Additionally, there are a number of small parcels west of State Street and south of Alexander

56
Street with warehouses that are either for sale or in a general state of disrepair. These parcels could be combined to create an additional 4.6 acres of land to support the subject parcel’s potential port-related reuse. Vacating Warren Street would add an additional 0.4 acres to the total available land.
1112 McDonald Street Ownership CompuFab, LLC Land Use Wholesale Surrounding Land Use Industrial Zoning District General Industrial (GI) Acreage 1.9 acres Waterfront Yes Established Bulkhead Line Yes Improved Dockwall or Slip No Shoreline Materials Rock/stone rip-rap and brush Rail Access No Distance to closest state/federal highway 2,460 feet Depth at Dockage Approx. <3’
The 1112 McDonald Street site is approximately 1.9 acres and is located on the west side of the Fox River at the end of McDonald Street. A petroleum trucking company associated with the bulk petroleum storage tanks is located to the north and indoor/outdoor boat storage is located to the south. The building is currently used by Blue Harbor Fish and Seafood LLC for wholesale distribution of fish and seafood to Wisconsin and surrounding states, while the exterior portions of the site are used for outdoor boat and trailer storage. The unimproved shoreline consists of small rock rip-rap and brushy vegetation. Although the site is relatively small for port-related uses, it could be combined with the three parcels immediately south of the subject parcel to create an approximately 4.8 acre waterfront parcel with rail access. Additionally, there are a number of small parcels west of State Street and south of Alexander Street with warehouses that are either for sale or in a general state of disrepair. These parcels could be combined to create an additional 4.6 acres of land to support the subject parcel’s

57
potential port-related reuse. Vacating Warren Street would add an additional 0.4 acres to the total available land.
Part of 700 Eastman Avenue Ownership Procter & Gamble Paper Products Company Land Use Industrial Surrounding Land Use Industrial Zoning District General Industrial (GI) Acreage 21.9 acres (approximately) Waterfront Yes Established Bulkhead Line Yes Improved Dockwall or Slip Partial – 605’ Shoreline Materials Sheet piling, rock/stone rip-rap and brush Rail Access Yes Distance to closest state/federal highway 4,980 feet Depth at Dockage Approx. 17-21’
The 700 Eastman Avenue site is part of the Procter & Gamble Paper Products Company. The potential port use site is currently utilized by Procter & Gamble for semi-trailer storage, and rail access, which are not waterfront-dependent uses of land. Surrounding land uses are heavily industrialized with a main rail line running east-west across the southern boundary of the property. The shoreline consists of an existing 605’ section of sheet piling, rock rip-rap, trees, and brushy vegetation.

58
In order to utilize this site for port-related uses, a parcel sale or long-term lease agreement would first need to be reached with Green Bay Packaging for the land, alternative trailer parking would need to be found, and rail spur access to the mill would need to remain uninterrupted. In addition, street access to the site would need to be obtained from North Quincy Street via easement or the creation of a separate parcel with street frontage. Although the process to utilize the site for a port-related use may be difficult, the site location has strong advantages, including it being located relatively close to the mouth of the Fox River which eliminates the need for bridge openings, located in a heavy industrial area, and the approximately 22 acres of contiguous, waterfront land. Even if the Port of Green Bay could not reach an agreement with Procter & Gamble to lease the site, Procter & Gamble could conceivably privately lease the site to a waterfront dependent business, thereby expanding overall economic development activity.
239 Arndt Street Ownership City of Green Bay Redevelopment Authority Land Use Vacant Surrounding Land Use Commercial / Industrial Zoning District Downtown District 2 Acreage 13.7 acres (approximately) Waterfront Yes Established Bulkhead Line Yes Improved Dockwall or Slip Partial Shoreline Materials 525’ sheet piling, rock/stone rip-rap and brush Rail Access Yes Distance to closest state/federal highway 4,980 feet Depth at Dockage Approx. 6’ in slip; Approx. 16-20’ at existing
southerly dockwall’

59
The 239 Arndt Street site is currently owned by the Green Bay Redevelopment Authority. The site was a former bulk coal and salt storage site, which was subsequently cleaned up through a grant in the late 1990’s to ready the site for non-port related redevelopment. For various reasons, redevelopment of the site for residential, commercial, and recreational use has not occurred. Surrounding land uses include an active rail line, mixture of commercial and industrial uses, and the Mason Street Bridge. The site includes a slip and the shoreline generally consists of section of 525’ section of sheet piling south of the slip and rock rip-rap.
The City of Green Bay intends for this property to be redeveloped in a manner consistent with their comprehensive plan, which means a mixture of commercial and residential uses to anchor the southern end of the Broadway District. Although this site is outside one of the four port-related opportunity areas, the site could be used as a temporary transfer point for non-bulk commodities, such as shipping containers, steel, and wind turbine components under a lease agreement with the Green Bay Redevelopment Authority until redevelopment of the site is proposed. Use of the property in this manner would temporarily utilize the locational advantages associated with the site, including the slip, rail access, and highway access to STH 54/W. Mason Street, while not negatively impacting the long-term redevelopment vision of the City of Green Bay.

60

61
CHAPTER 5
Port Investment Analysis
The eleven properties identified in Chapter 4 all hold potential for port-related uses based upon such factors, as waterfront location, compatible surrounding land uses, appropriate zoning, and parcel sizes (some if combined). The following chapter groups the properties together, where applicable, to determine the port-related development needs of the properties, including estimated volume and costs of dredging needed to provide access to the navigation channel, estimated length of dockwall needed to provide suitable dockage for commercial ships, estimated cost of providing rail access (where appropriate), and estimated basic site preparation costs (fill, demolition, etc.).
In order to determine which parcels hold the potentially best return on investment, the U.S. Maritime Administration’s (MARAD) Port Kit software model was utilized. The Port Kit model uses input-output (I-O) analysis to perform the advanced mathematics to evaluate each site based upon the previously listed site-specific factors and produce a short-term and long-term economic return on those investments in terms of resultant jobs, income, and taxes generated. The economic impact assessment is intended to provide a clear estimate of the benefits of port-related investments into the subject properties to the public, elected officials, business community, and potential investors into the subject properties.
When using a model such as the MARAD Port Kit, it must be acknowledged that the identified costs and benefits are estimates only and should not be misconstrued as actual expenditures and revenues that will be realized should port-related redevelopment occur on the site(s). The model and resultant outputs are intended to provide a general idea of how port-related redevelopment on the site could promote economic development provided certain improvements are made.
MARAD Port Kit Analysis
The intent of this study was to update the results of the 2004 Port Opportunity Study to determine the potential impacts associated with the utilization of sites for port-related activities that are not currently used for such activities. The six sites identified range greatly in terms of current uses, waterfront availability, rail access, and availability for port-related uses. The identification of the sites in this report does not mean the Port of Green Bay will necessarily purchase the property, but rather that the property may be better utilized for a port-related activity. This means the current owner could conceivably lease the property for a port use, sell to a port operator, or continue to remain in place for

62
the foreseeable future. As discussed earlier in the report, any relocation of an existing business for a port-related activity will need to be of a benefit to the Port of Green Bay and the relocated business. Although the former Ashland Avenue intermodal yard is identified as a potential site for port-related redevelopment, it was not included in the MARAD model runs. This is due to ongoing discussions among the Port of Green Bay, Brown County, Advance, and Canadian National regarding the potential future usage of the site as a rail ramp for container shipping.
The MARAD Port Kit model factors in the following activities when evaluating a site for port investment, as applicable:
Property acquisition / site purchase – Property acquisition costs were estimated utilizing the 2012 total value assessment for each property when available, or the applicable percentage of the land value where an undeveloped portion of a property was utilized. If an assessed valuation was not available, a $0 cost was used and is noted in the summary table.
Bulkhead/dock/berth improvement – The bulkhead/dock/berth improvement costs were estimated utilizing the Brown County Land Information Office Geographic Information System to calculate the length of new or reconstructed dockwall necessary for waterborne port-related usage. Costs were estimated utilizing an estimated $2,000 per linear foot to construct/reconstruct dockwalls.
Site preparation, including fill, paving, and demolition – These costs were estimated utilizing the Brown County Land Information Office Geographic Information System to calculate fill required behind new bulkhead lines, as applicable. A per unit cost of $25 per cubic yard of gravel was used to calculate the fill costs. An estimated demolition cost was included for those properties for which demolition would likely be necessary prior to port-related usage. Demolition costs were not included if there was an existing structure on site that could conceivably be used for a port-related activity.
Equipment, such as cranes, yard equipment, telecommunications, and other similar property-specific improvements – These improvements would be user-specific and since no end-user is determined, were not factored into the analysis
Structures, such as sheds, warehouses, and administration buildings – These improvements would be user-specific and since no end-user is determined, were not factored into the analysis.
On and near-dock rail terminals, including rail track, intermodal yards, and other rail needed for the movement of waterborne cargo – These improvements were estimated based on $150 per linear foot of spur rail for properties where rail was not directly available, or where a spur would be needed to reach the interior of the property.
Dredging – Dredging costs were estimated using the Brown County Land Information Office Geographic Information System to calculate the amount of dredge material required to be removed to reach a depth of 24’ to the shipping channel, and a dredging cost estimate of $25/yard.

63
Services including port agency overhead, engineering, architectural, contingency and legal services - An estimate of 20% of the hard costs was utilized for the total combined soft costs of engineering, architectural, overhead, contingency, and legal services.
Figures 5-1 through 5-6 depict the six potential port-related use sites and the necessary dredging and/or filling that would need to take place.
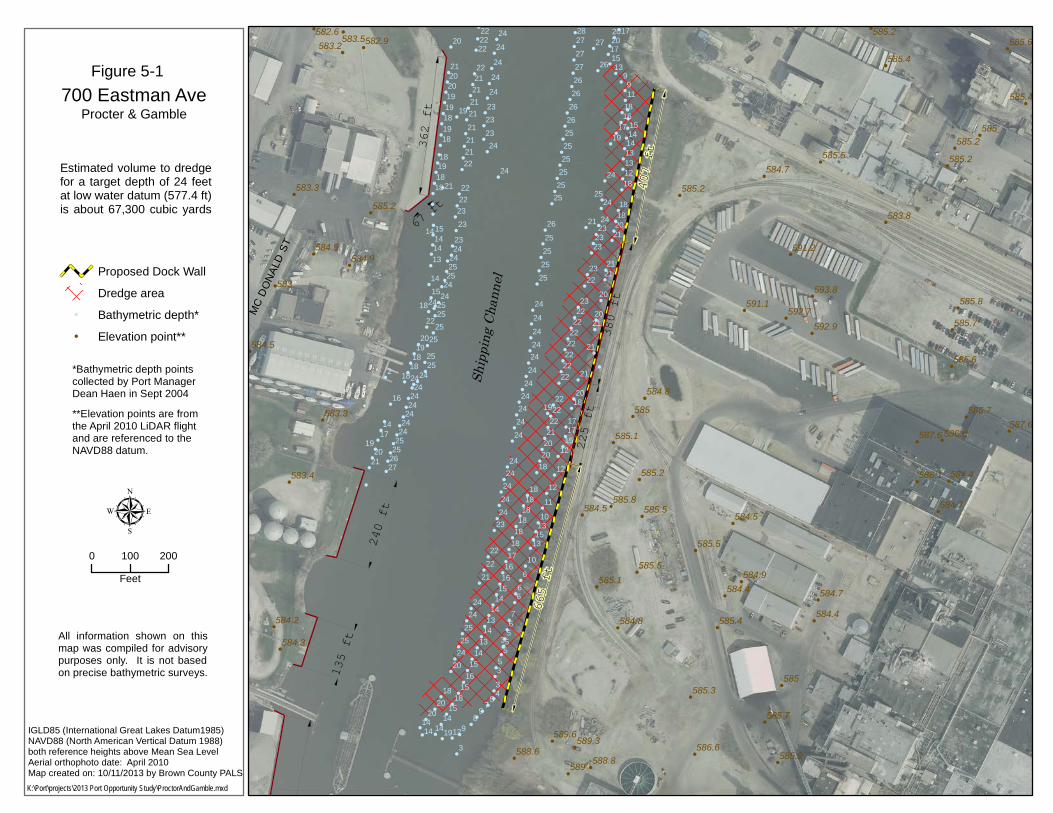
!
!
!
!
!
!
!
!
!
!
!
!
!
!
!
!
!
!
!
!
!
!
!
!
!
!
!
!
!
!
!
!
!
!
!
!
!
!
!
!
!
!
!
!
!
!
!
!
!
!
!
!
!
!
!
!
!
!
!
!
!
!
!
!
!
!
!
!
895ft
135 ft
240 ft
362
ft
67 ft
380 ft
225 ft
MC D
ONAL
D ST
!
!
!
!
!
!
!
!
!
!
!
!
!
!
!
!
!
!
!
!
!
!
!
!
!
!
!
!
!
!
!
!
!
!
!
!
!
!
!
!
!
!
!
!
!
!
!
!
!
!
!
!
!
!
!
!
!
!
!
!
!
!
!
!
!
!
!
!
!
!
!
!
!
!
!
!
!
!
!
!
!
!
!
!
!
!
!
!
!!
!
!
!
!
!
!
!
!
!
!
!
!
!
!
!
!
!
!
!
!
!
!
!
!
!
!
!
!
!
!
!
!
!
!
!
!
!
!
!
!
!
!
!
!
!
!
!
!
!
!
!
!
!
!
!
!
!
!
!
!
!
!
!
!
!
!
!
!
!
!
!
!!
!
!
!
!
!
!
!
!
!
!
!
!
!
!
!
!
!
!
!
!
!
!
!
!
!
!
!
!
!
!
!
!
!
!
!
!
!
!
!
!
!
!
!
!
!
!
!
!
!
!
!
!
!
!
!
!
!
!
!
!
!
!
!
!
!
!
!
!
!
!
!
!
!
!
!
!
!
!
!
!
!
!
!
!
!
!
!
!
!
!
!
!
!
!
!
!
!
!
!
!
!
!
!
!
!
!
!
!
!
!
!
!
!
!
!
!
!
!
!
!
!
!
!
!
!
!
!
!
!
!!!
!
!
!
!
!
!!!
!
!
!
!
!
!
!!
!
!!
!
!
!
!
!
!
!
!!!
!
!
!
!!
!
!!
!
!
! !!
!
!
!
!
!
!
!
!
!
!
!
!
!
!
!
!
!
!
!
!
!
!
!
!
!
!
!
!
!
!
!
!
!
!
!
!
!
!
!
!
!
!
!
!
!
!
!
!
!
!
!
!
!
!
!
!
!
!
!
!
!
!
!
!
!
!
!
!
!
!
!
!
!
!
!
665 ft
407 ft
589
585
585
583
585
585.2
585.2
584.7
585.5
588.8
584.5
591.1
584.5
585.4
585.6
587.6
585.6582.9
584.8584.3
585.2
585.2
584.5
589.3
585.5
586.1
592.9
584.4
582.6
583.3
585.3
584.7
585.4
593.8
583.3
591.2
583.8
588.6
584.4
584.8
585.7
585.1
585.8
586.7
592.7
587.6
584.9
584.2
585.5
583.5583.2
589.6
585.2
584.7
586.6
585.1
585.8
585.2
583.4
585.4
584.5
584.4
584.9
586.8
585.2
585.7
585.5
2
98
9
99
6
66
76555
53
34
57
3
3
24
24
23
23
23
24
24
24
24
24222222
2221
21
21
21
21
21
21
22
22
22
23
23
2324
1219
242525
24
242524
25
25
25
2525
242424
2424
2424
2425
252627
2120
191714
16
1818181920
22
18
15
14
13
14141514
18181918
1819
181919202021
202827
27
27
26
26
26
26
25
25
25
25
25
25
26
25
25
25
25
24
24
24
24
24
24
24
24
24
24
24
24
24
24
24
24
23
22
22
21
24
24
25
25
24
20
18
2020
1414 14
1415
1815
16
15
14
13
141314141516
16
17
18
18
18181818
18
20
202122
22
22
22
22222222222223
22
23
23232324
2425
24
1917
1618
26
27
172020171513
11
15141413131218
18182021
2121
20
2021
21
21
2018
1717
1512
12
12
11
1013
1513
10
19
21
21
19Procter & Gamble
Proposed Dock Wall
Dredge area
! Bathymetric depth*
! Elevation point**
µ0 100 200
Feet
700 Eastman Ave
All information shown on thismap was compiled for advisorypurposes only. It is not basedon precise bathymetric surveys.
Shipp
ing C
hann
el
Estimated volume to dredgefor a target depth of 24 feetat low water datum (577.4 ft)is about 67,300 cubic yards
IGLD85 (International Great Lakes Datum1985) NAVD88 (North American Vertical Datum 1988) both reference heights above Mean Sea LevelAerial orthophoto date: April 2010Map created on: 10/11/2013 by Brown County PALS
K:\Port\projects\2013 Port Opportunity Study\ProctorAndGamble.mxd
*Bathymetric depth pointscollected by Port ManagerDean Haen in Sept 2004
**Elevation points are fromthe April 2010 LiDAR flightand are referenced to theNAVD88 datum.
Figure 5-1

362
ft
67 ft
I43
!
!
!
!
!
!
!
!
!
!
!
!
!
!
!
!
!
!
!
!
!
!
!
!
!
!
!
!
!
!
!
!
!
!
!
!
!
!
!
!
!
!
!
!
!
!
!
!
!
!
!
!
!
!
!
!
!
!
!
!
!
!
!
!
!
!
!
!
!
!
!
!
!
!
!
!
!
!
!
!
!
!
!
!
!
!
!
!
!
!!
!
!
!
!
!
!
!
!
!
!
!
!
!
!
!
!
!
!
!
!
!
!
!
!
!
!
!
!
!
!
!
!
!
!
!
!
!
!
!
!
!
!
!
!
!
!
!
!
!
!
!
!
!
!
!
!
!
!
!
!
!
!
!
!
!!
!
!
!
!
!
!
!
!
!
!
!
!
!
!
!
!
!
!
!
!
!
!
!
!
!
!
!
!
!
!
!
!
!
!
!
!
!
!
!
!
!
!
!
!
!
!
!
!
!
!
!
!
!
!
!
!
!
!
!
!
!
!
!
!
!
!
!
!
!
!
!
!
!
!
!
!
!
!
!
!
!
!
!
!
!
!
!
!
!
!
!
!
!
!
!
!
!
!
!
!
!
!
!
!
!
!
!
!
!
!
!
!
!
!
!
!
!
!
!
!
!
!
!
!
!
!
!
!
!
!
!
!
!
!
!
!
!
!
!
!
!
!
!
!
!
!
!
!
!
!!!
!
!
!
!
!
!!!
!
!
!
!
!
!
!
!
!
!
!
!
!
!
!
!
!
!
!
!
!
!
!
!
!
!
!
!
!
!
!
!
!
!
!
!
!
!
!
!
!
!
!
!
!
!
!
!
!
!
!
!
!
!
!
!
!
!
!
!
!
!
!
!
!
!
!
!
!
!
!
!
!
!
!
!
!
!
!
!
!
!
!
!
!
!
!
!
!
!
!
!
!
!
!
!
!
!
!
!
!
!
!
!
!
!
!
!
!
!
!
!
!
!
!
!
!
!
!
!
!
!
!
!
!
!
!
!
!
!
!
!
875 f
t9
9
8
7
6
9
9
8
9
8
8
8
7
8
8
8
8
8
8
88 7 5
55
5
7
8
8
9
99
5
2
1
1
3
20
21
21
21
21
22
22
22
23
23
23
24
23
23
23
22
22
22
22
22
24
24
23
23
23
24
24
24
24
24
24
24
25
25
24
24
24
24
25
25
25
25
25
25
25
25
25
24
25
25
24
24
24
24
25
24
22
17
18
18
19
19
19
19
19
18
17
16
16
16
15
17
17
17
18
19
19
20
20
20
20
20
22
21
22
22
22
22
21
21
21
21
21
21
21
22
22
22
23
2314
18
18
19
1818
18
19
18
19
19
20
20
21
20
15
15
14
14
13
13
13
12
11
11
10
11
10
22
21
20
21
21
22
24
24
24
25
25
25
25
25
25
25
25
25
26
26
27
27
27
28
27
27
27
26
26
26
26
25
25
25
25
25
25
2624
2425
24
19
17
16
18
26
27
27
27
26
25
24
24
24
23
23
23
23
23
23
24
24
23
23
23
23
22
22
21
20
19
17
17
16
16
16
16
16
15
15
12
11
10
1011
12
12
14
14
14
12
12
13
14
14
14
15
15
15
14
13
13
13
11
12
13
13
1313
1720
2017
15
13
11
14
1514
14
13
13
12
18
18
18
20
21
21
19
Green Bay Packaging Inc
Proposed Dock Wall
Dredge area
! Bathymetric depth*
µ0 100 200
Feet
1601 N Quincy Street
Datum: International Great Lakes Datum 1985Aerial orthophoto date: April 2010Map created on: 10/11/2013 by Brown County PALS
Shipp
ing C
hann
el
Estimated volume to dredgefor a target depth of 24 feetat low water datum (577.4 ft)is about 32,000 cubic yards
*Bathymetric depth pointscollected by Port ManagerDean Haen in Sept 2004
All information shown on thismap was compiled for advisorypurposes only. It is not basedon precise surveys or studies.
K:\Port\projects\2013 Port Opportunity Study\GB Packaging.mxd
Figure 5-2

!
!
!
!
!
!
!
!
!
!
!
!
!
!
!
!
!
!
!
!
!
!
!
!
!
!
!
!
!
!
!
!
!
!
!
!
!
!
!
!
!
!
!
!
!
!
!
!
!
!
!
!
!
!
!
!
!
!
!
!
!
!
!
!
!
!
!
!
!
!
!
!
!
!
!
!
!
!
!
!
!
!
!
!
!
!
!
!
!
!
!
!
!
!
!
!
!
!!
!
!
!
!
!
!
!
!
!
!
!
!
!
!
!
!
!
!
!
!
!
!
!
!
!
!
!
!
!
!
!
!
!
!
!
!
!
!
!
!
!
!
!
!
!
!
!
!
!
!
!
!
!
!
!
!
!
!
!
!
!
!
!
!
!
!
!
!
!
!
!
!
!
!
!
!
!
!
!
!
!
!
!
!
!
!
!
!
!
!
!
!
!
!
!
!
!
!
!
!
!
!
!
!
!
!
!
!!
!
!
!
!
!!
!
!
!
!
!
! !
!
!
!
!
!
!
!
!
!
!
!
!
!
!
!
736 ft
583
585
584.3
585.3
584.5
585.2
584.5
583.3
583.3
585.7
584.7
583.4
584.6
584.9
MC
DO
NA
LD S
T
ALEXANDER ST
24
2421
22
22
22
23
23
23
24
24
25
25
24
2425
2425
25
25
25
25
2424
24
24
24
24
24
24
25
25
26
27
24
21
20
19
17
14
13
16
18
18
18
19
20
22
18
15
14
13
14
14
15
14
15
18
18
18
19
18
18
24
24
24
24
21CompuFab, LLCThe Boatyard LLC
Thomas N. Hermes andJolliffe Geraldine Trust etal
properties
Proposed Dock Wall
Fill area
Dredge Area
! Bathymetric depth*
! Elevation point**
µ0 100 200
Feet
McDonald Street
Shipp
ing Ch
anne
l
Estimated volume to dredgefor a target depth of 24 feetat low water datum (577.4 ft)is about 15,000 cubic yards
Estimated volume of fill tocreate a level land surfaceextending from the existingshoreline to the proposeddock wall (bulkhead line)is about 17,000 cubic yards
Fill approximately17,000 cubic yardsto create a levelsurface planeat 585 ft (MSL)
Dredge approximately15,000 cubic yards toa target depth of 24 ft
Fill
Fill
Fill
IGLD85 (International Great Lakes Datum1985) NAVD88 (North American Vertical Datum 1988) both reference heights above Mean Sea LevelAerial orthophoto date: April 2010Map created on: 10/11/2013 by Brown County PALS
All information shown on thismap was compiled for advisorypurposes only. It is not basedon precise surveys or studies.
K:\Port\projects\2013 Port Opportunity Study\ThreeProperties.mxd
*Bathymetric depth pointscollected by Port ManagerDean Haen in Sept 2004
**Elevation points are fromthe April 2010 LiDAR flightand are referenced to theNAVD88 datum.
Figure 5-3

187 ft
305 ft
8TH ST
STAT
E ST
9TH ST
!!
!
!
!
!
!
!
!
!
!
!
!
!
!
!
!
!
!
!
!
!
!
!
!!
!
!
!
!
!
!
!
!
!
!
!
!
!!
!
!
!
!
!
!
!
!
!
!
!
!
!
!
!
!
!
!
!
!
!
!
!
!
!
!
!
!
!
!
!
!
!
!
!
!
!
!
!
!
!
!
!
!
!
!
!
!
!
!
!
!
!
!
!
!
!
!
!
!
!
!
!
!
!
!
!
!
!
!
!
!
!
!
!
!
!
!
!
!!
!
!
!
!
!
!!
!
!
!
!
!
!
!
!
!
!
!
!
!
!
!
!
!
!
!
!
!
!
!
!
!
!
!
!!
!
!
!
!
!
!
!
!
!
!
!
!
!
!
!
!
!
!
!
!
!
!
!
!
!
!
!
!
!
!
!
!
!
!
!
!
!
!
!
!
!
!
!
!
!
!
! !
!
!
!
!
!
!
!
!
!
!
!
!
!
!
!
!
!
!
310 ft
737 ft
587
587.1
586.9
588.6
588.8
588.7
587.6
586.2
588.8
586.9588.8
585.1
588.4588.9
587.5
588.7
586.8
586.3
586.9
586.3
585.4
582.5
588.8
589.2
588.6
589.3
586.6
588.9
588.8
587.5
588.7
589.1
589.8
588.8
589.2
589.7
589.5
587.1
588.5
588.8
4
6
9
2
2
2
3
3
3
44
3
3
3
6
8
9
6
3
3
3
4
3
4
7
8
9
64
4
3
3
3
3
3
3
3
3
2
2
2
2
3
45
6
5
2
32
3
3
3
3
3
3
3
34
6
7
6
6
6
9
24
2525
26
25
24
23
25
25
25
26
27
2519
22
2425
27
28
27
26
27
2624
21
20
19
17
20
20
19
18
20
25
26
18
19
22
24
25
22
22
10
25
10
14
17
19
19
22
21
14
16
13
11
11
24
16
15
14
25
10
12
14
19
18
21Green Bay Drop Forge
Proposed Dock Wall
Fill area
Dredge area
! Bathymetric depth*
! Elevation point**
µ0 100 200
Feet
Fill approximately51,000 cubic yardsto create a levelsurface planeat 585 ft (MSL)
1341 State Street
IGLD85 (International Great Lakes Datum1985) NAVD88 (North American Vertical Datum 1988) both reference heights above Mean Sea LevelAerial orthophoto date: April 2010Map created on: 10/11/2013 by Brown County PALS
*Bathymetric depth pointscollected by Port ManagerDean Haen in Sept 2004
Estimated volume to dredgefor a target depth of 24 feet
at low water datum (577.4 ft)is about 61,600 cubic yards
All information shown on thismap was compiled for advisorypurposes only. It is not basedon precise surveys or studies.
Shipping Channel
Estimated volume of fill tocreate a level land surfaceextending from the existingshoreline to the proposeddock wall (bulkhead line)is about 51,000 cubic yards
**Elevation points are fromthe April 2010 LiDAR flightand are referenced to theNAVD88 datum.
Dredge approximately61,600 cubic yards toa target depth of 24 ft
K:\Port\projects\2013 Port Opportunity Study\GB Drop Forge2.mxd
Figure 5-4

!
!
!
!
!
!
!
!
!
!
!
!
!
!
!
!
!
!
!
!
!
!
!
!
!
!
!
!
!
!
!
!
!
!
!
!
!
!
!
!
!
!
!
!!
!
!
!
!
!
855ft
525 ft
210Feet
1612
ft
S BRO
ADWA
Y ST
ARNDT ST
S PEA
RLST
W MASON ST
COMMISSION CT
ARNDT ST
3RD ST
!
!
!
!
!
!
!
!
!
!
!
!
!
!
!
!
!
!
!
!
!
!
!
!
!
!
!
!
!
!
!
!
!
!
!
!
!
!
!
!
!
!
!
!
!
!
!
!
!
!
!
!
!
!
!
!
!
!
!
!
!
!
!
!!
!
!
!
!
!
!
!
!
!
!
!!!
!
!!
!
!
!
!
!
!
!
!!
!
!
!
!
!
!
!
!
!
!
!
!
!
!
!
!
!
!
!
!
!
!
!
!
!
!
!
!
!
!
!
!
!
!
!
!
!
!
!
!
!!!
!
!
!
!
!
!
!
!
!!
!
!
!
!!
!
!!
!!
!
! !
!
!
!
!
!
!
!!
!
!
!
!
!
!
644 ft
459 ft171 ft
508 ft 25
10
6
26
26
22
25
19
20
21
20
20
20
20
21
21
22
23
24
24
24
25
25
25
25
23
23
23
21
21
18
16
17
20
19
20
2125
25
27
26
2626
26
26
26
27
26
26
26
25
25
23
23
23
2323
232323
23
252525
24
26
23
23
25
23
23
24
19121097
666
66
66
5
171613
14
16
14
16
1922
21
20
18
18171918181819
18
20
18
17
1717
17
1719
20
19
19
19
19
17
17
16
1615
16
1614
1213
1319
18
20
16
15
56
6
66
6 66
66
7 77
88
910
11 1317
18
1915
106
666
66
3
77
7
587
584.9
586.9
586.9
586.3
582.8
586.7
583.3
587.3
587.4
587.3
587.4586.8
584.7
585.1
585.7
587.2
582.4
585.1
586.7586.7
582.1
586.7
586.2
584.3
583.1
583.5
584.8
586.6
583.1
583.8
584.9
585.1
583
587.2
584.3
583.7
585.7
584.9
584.6
584.6584.7
585.2
585
585.1
586.9
583.4
City of Green BayRedevelopment Authority
Proposed Dock Wall
Dredge Area
! Bathymetric depth*
! Elevation point**
µ0 100 200
Feet
239 Arndt Street
All information shown on thismap was compiled for advisorypurposes only. It is not basedon precise bathymetric surveys.
Shipp
ing C
hann
el
Estimated volume to dredgefor a target depth of 24 feet
at low water datum (577.4 ft)is about 71,600 cubic yards
*Bathymetric depth pointscollected by Port ManagerDean Haen in Sept 2004
**Elevation points are fromthe April 2010 LiDAR flightand are referenced to theNAVD88 datum.
IGLD85 (International Great Lakes Datum1985) NAVD88 (North American Vertical Datum 1988) both reference heights above Mean Sea LevelAerial orthophoto date: April 2010Map created on: 10/11/2013 by Brown County PALSK:\Port\projects\2013 Port Opportunity Study\ZoneKLM_Greenfield.mxd
Figure 5-5

!
!
!
!
!
!
!
!
!
!
!
!
421 ft
110 Feet
880 ft
!
!
!
!
!!
!
!
!
!
!
!
!
!
!
!
!
!
!
!
!
!
!
!
!
!
!
!
!
!
!
!
!
!
!
!
!
!
!
!
!
!
!!
!
!
!
!
!
!
!
!
!
!
!
!
!
!
!
!
!
!
!
!
!
!
!
!
!
!
!
!!
!
!
!
!
!
!
!
!
!
!
!
!
!
!
!
!
!
!
!
!
!
!
!
!
!
!
!
!
!
!
!
!
!
!
!
!
!
!
!
!
!
!
!
!
!!
!
!
!
!
!
!
!
!
!
!
!
!
!
!
!
!
!
!
!
!
!
!
!
!
!
!
!
!
!
!
!
!
!
!
!
!
!
!
!
!
!
!
!
!
!
!
!
!
!
!
!
!
!
!
!
!
!
!
!
!
!
!
!
!
!
!
!
!
!
!
!
!
!
!
!
!
!
!
!
!
!
!
!
!
!
!
!
!
!
!
!
!
!
!
!
!
!
!
!
!
!
!
!
!
!
!
!
!
!
!
!
!
!
!
!
!
!
!
!
!
!
!
!
!
!
!
!
!
!
!
!
!
!
!
!
!
!
!
!
!
!
!
!
!
!
!
!
!
!
!
!
!
!
!
!
!
!
!
!
!
!
!
!
!
!!
!
!
!
!
!
!
!
!
!
!
!
!
!
!
!
!
!
!
!
!
!
!
!
!
!
!
!
!
!
!
!
!
!
!
!
!
!
!!
!
!
!
!
!
!
!
!
!
!
!
!
!
!
!
!
!
!
!
!
!
!
!
!
!
!
480 ft
720 ft
311 ft
587
587.3586.1
586.6
581.6586.5
586.9
590.9
583.1
582.5
9
9
9
9
9
9
9
8
8
9
7
7
7
7
7
8
8
8
9
9
9
9
9
878
8
9
9
88
8 89
9
8
77
7
7
77
7
8
8
9
8
8
6
64
3
3
8
6
9
9
9
94
57
7
78
88
8
8
99
7
9
9
9
9
8
8
8
8
7
7
7
7
7
7
7
7
9
8
888
8 7
8
20
2325
23
20
19
15
13
14
12
12
11
11
11
11
11
11
11
11
13
14
16
19
20
15
16
15
13
12
1211
1111
11
11
11
11
1011
10
11
11
12
13
12
14
18
20
20
20
20
21
21
21
2420
19
17
16
16
16
14
14
1313
12
12
11
1110
10
10
10
10
10
12
13
16
12
10
10
10
10
10
10
11
11
12
13
14
15
15
17
1912
14
15
15
15
14
1315
17
10
1010
10
10
11
10
12
14
15
14
13
12
10
11
1010
10
1010
1010
1011
12 11
13
14
19
17
15
18
11
1010
13
15
15
11
10
17
Georgia-Pacific / TetraTech
Proposed Dock Wall
Fill area
Dredge area
! Bathymetric depth*
! Elevation point**
µ0 100 200
Feet
1611 State Street
All information shown on thismap was compiled for advisorypurposes only. It is not basedon precise bathymetric surveys.
Shipping Channel
IGLD85 (International Great Lakes Datum1985) NAVD88 (North American Vertical Datum 1988) both reference heights above Mean Sea LevelAerial orthophoto date: April 2010Map created on: 10/11/2013 by Brown County PALSK:\Port\projects\2013 Port Opportunity Study\TetraTech.mxd
Estimated volume to dredgefor a target depth of 24 feetat low water datum (577.4 ft)is about 168,000 cubic yards
Estimated volume of fill tocreate a level land surfaceextending from the existingshoreline to the proposeddock wall (bulkhead line)is about 84,000 cubic yards
Fill approximately84,000 cubic yardsto create a level surfaceplane at 585 ft (MSL)
Dredge approximately168,000 cubic yards fora target depth of 24 ft
*Bathymetric depth pointscollected by Port ManagerDean Haen in Sept 2004
**Elevation points are fromthe April 2010 LiDAR flightand are referenced to theNAVD88 datum.
Figure 5-6

70
Figure 5-7 provides a tabular summary of the results of the MARAD Port Kit analysis. Appendix A contains the detailed results for each of the six properties.
Site Specific Summary and Recommendations
The six sites are ranked based upon the MARAD Port Kit outputs and overall Port and County priorities. Based upon the model run:
In terms of estimated total development costs, the McDonald Street Properties were the lowest to develop at an estimated $4,112,100, but they also comprised the smallest total acreage at 4.8 total acres. On a per acre development cost basis, the combined 1341 State Street and 130 Ninth Street properties were the lowest at an estimated $393,563 per acre to develop for port-related uses.
All properties resulted in a relatively narrow range of approximately 20 – 22 jobs per million dollars of initial expenditure.
In terms of total income, the McDonald Street Properties resulted in the highest projected income at $772,240 per million dollars of initial expenditure. 1611 State Street was the second-highest at a projected $731,354 of income per million dollars of initial expenditure.
The McDonald Street Properties also resulted in the highest projected gross state product at $1,077,073 per million dollars of initial expenditure. The combined 1341 State Street and 130 Ninth Street properties projection of $1,001,196 in gross state product per million dollars of initial expenditure was next highest.
It must be noted that two of the sites, 1611 State Street (Georgia-Pacific / Tetra Tech) and 239 Arndt Street (Green Bay Redevelopment Authority) did not have available assessment data and therefore an estimated acquisition cost could not be determined. Additionally, when moving a company or property owner, typically relocation costs are included in the sale. Due to the variables associated with calculating relocation costs on speculation, relocation costs were not included. The “Estimated Total Development Costs” for the sites must be reviewed within the framework of these data limitations.
Based upon the MARAD Port Kit model outputs, the McDonald Street properties hold small advantages over the other identified properties in terms of projected job creation, income, and gross state product. However, these properties also comprise the lowest total acreage at approximately 4.8 acres, resulting in a relatively high projected development cost of $856,688 per acre. The second priority location of 1611 State Street also has a projected 22 jobs per million dollars of initial expenditure and has the second highest projected income effect, however, as previously stated, there was no assessment data available for the site and therefore a valid estimated per acre development cost could not be calculated.
Although the sites are prioritized based on estimated employment and secondly on estimated income per million dollars of initial expenditure, it does not mean that site #1 must be addressed before site #2 or site #2 before site #6 for that matter. The MARAD Port Kit model is but only one tool among many factors to help guide decisions regarding port investments. It is understood that there are many variables that enter into the redevelopment of sites for port activities, or any other activity for that matter. Activation of each identified site for port-related activity must take into account the entirety of

71
the property, including but not limited to, the willingness of the existing property owner to work with the Port, consistency with local and county plans, zoning, site planning, environmental suitability, financial feasibility, and potential economic benefit.

72
Figure 5-7 MARAD Port Kit Outputs
Source: U.S. Department of Transportation Maritime Administration, MARAD Port Economic Impact Kit and Brown County Planning Commission, 2013.
Priority Site Address OwnerApproximate Acreage
Estimated Acquisition Costs
Estimated Dredging Costs
Estimated Dockwall Costs
Estimated Rail Access Costs
Estimated Site Preparation Costs
Soft Costs / Contingency
Estimated Total Development Costs
Employment (Jobs) Income State Taxes Local Taxes
Gross State Product
1McDonald Street Properties Multiple 4.8 $ 1,055,700 $ 375,000 $ 1,472,000 $ 75,000 $ 625,000 $ 509,400 $ 4,112,100 22 $ 772,240 $ 50,715 $ 41,004 $ 1,077,073
2 1611 State StreetGeorgia-Pacific (TetraTech) 27.2
No assessment data available $ 4,200,000 $ 3,022,000 $ 180,000 $ 2,100,000 $ 1,900,400 $ 11,402,400 22 $ 731,354 $ 46,630 $ 31,807 $ 1,001,196
31341 State Street and 130 Ninth Street
Green Bay Drop Forge and End of Ninth, LLC 13.3 $ 1,003,500 $ 1,540,000 $ 620,737 $ 90,000 $ 1,275,000 $ 705,147 $ 5,234,384 22 $ 718,665 $ 50,341 $ 40,327 $ 1,027,986
4 239 Arndt Street
Green Bay Redevelopment Authority 13.7
No assessment data available $ 1,790,000 $ 3,564,000 $ 99,000 $ - $ 1,090,600 $ 6,543,600 21 $ 712,791 $ 47,103 $ 34,591 $ 1,002,659
5Part 1601 N. Quincy Street
Green Bay Packaging, Inc. 8.9 $ 1,436,341 $ 800,000 $ 1,750,000 $ 225,000 $ - $ 842,268 $ 5,053,609 21 $ 701,153 $ 48,827 $ 42,822 $ 1,011,354
6Part 700 Eastman Avenue Procter & Gamble 21.9 $ 8,563,418 $ 1,682,500 $ 2,144,000 $ - $ - $ 2,477,984 $ 14,867,902 20 $ 645,358 $ 51,558 $ 61,566 $ 1,005,021
Estimated Effects per Million Dollars of Initial ExpenditureEstimated Site Development Expenditures

73
General Recommendations
General recommendations are not necessarily site-specific, but rather discuss improvements to processes and other policy-related issues. These are generally completed with minimal up front cost, but may result in improved efficiencies, long-term cost savings/avoidance, and new opportunities.
Work with the U.S. Army Corps of Engineers to, at a minimum; maintain the existing shipping channel depth. Due to the Port of Green Bay’s location at the mouth of the Fox River, there will be a continuing need for maintenance dredging of sediments from the shipping channel. Keeping the shipping channel dredged to a minimum of 24’ will ensure the port remains open for the import and export of commodities via the Great Lakes.
Coordinate with the U.S. EPA regarding PCB hydraulic dredging within the Fox River segment served by the Port of Green Bay. It is critical that ships arriving and departing the Port of Green Bay are not negatively impacted by the PCB remediation project and conversely that port activities do not negatively impact the PCB remediation. Close coordination among all entities will be necessary.
Advanced negotiation of framework lease agreements with non-port related waterfront users to expedite siting of new port uses. One of the major issues confronting the Port of Green Bay is the lack of readily available waterfront parcels for new port activities. This creates a timing issue when a new port user is prospecting for locations in the Great Lakes in a relatively short amount of time. Having a framework lease agreement with private property owners who have unused or underutilized waterfront property could expedite the siting of new port uses. The details of the lease would need to be worked out between the property owner and potential lessee. However, simply being able to provide basic lease terms to a potential new port user in a timely manner may lead to increased interest in the sites.
Continue to investigate uses for the beneficial reuse of clean dredgings. Utilizing clean and dried dredgings in such projects as road construction or reconstruction, soil additives, and other projects where fill is required will greatly extend the life of the Bay Port Confined Disposal Facility. Providing a location for additional clean dredge material will also provide stability for existing and future port operators regarding maintenance dredging of the shipping channel.

74
Support the efforts of the Brown County Land and Water Conservation Department to reduce agricultural stormwater carrying sediments into the Fox River and its tributaries. Reducing the flow of agricultural runoff from the fields will reduce the need for maintenance dredging in the shipping channel.
Maintain open lines of communication with the existing port operators to ensure their port-related needs are met. This may involve meetings, periodical surveys, or phone calls to find out if there are current or future needs related to their operation, which may identify opportunities for the Port.
Maintain open lines of communication with the City of Green Bay. With the Port’s location entirely within the City of Green Bay, it is imperative the Port and City operate cooperatively. Many of the Port operators directly or indirectly provide basic goods through the Port to some of the City’s largest employers. Likewise, the City should continue to view the Port as an asset for economic development, particularly when viewed in terms of its Foreign Trade Zone designation and efficient, environmentally-friendly bulk commodity transportation.

75
APPENDIX A: Detailed MARAD Port Kit Results

76

Gross State
Product (000$)
Income
(000$)
Employment
(jobs)
1. Agriculture 0 1.3 4.0
I. TOTAL EFFECTS (Direct and Indirect/Induced)*
Economic Component
Private
1 11.2 10.82. Agri. Serv., Forestry, & Fish
3. Mining 178.883.22
4. Construction 37 2,201.5
759.8
798.1
242.8
977.0
1,454.6
503.5
456.5
138.6
272.3
507.9
2,377.0
994.5
13
16
4
23
17
37
5. Manufacturing
6. Transport. & Public Utilities
7. Wholesale
9. Finance, Ins., & Real Estate
10. Services
Private Subtotal
8. Retail Trade 479.0
149 5,170.5 7,282.0
Public
11. Government 1 22.3 22.5
Total Effects (Private and Public) 150 5,192.8 7,304.5
II. DISTRIBUTION OF EFFECTS/MULTIPLIER
1. Direct Effects 68 3,213.2 3,974.7
2. Indirect and Induced Effects 82 1,979.5 3,329.8
150 5,192.8 7,304.53. Total Effects
4. Multipliers (3/1) 2.191 1.616 1.838
1. Wages--Net of Taxes 4,151.3
2. Taxes
a. Local 252.0
b. State 343.1
c. Federal
496.1General
Social Security 425.2
921.4
1,516.5
3. Profits, dividends, rents, and other 1,636.7
4. Total Gross State Product (1+2+3) 7,304.5
EFFECTS PER MILLION DOLLARS OF INITIAL EXPENDITURE
Employment (Jobs) 21
Income 712,791.3
State Taxes 47,102.7
Local Taxes 34,591.0
Gross State Product 1,002,658.8
Note: Detail may not sum to totals due to rounding.
*Terms:
Direct Effects --the proportion of direct port-related spending on goods and services produced in the specified region.
Indirect Effects--the value of goods and services needed to support the provision of those direct economic effects.
Induced Effects--the value of goods and sevices needed by households that provide the direct and indirect labor.
III. COMPOSITION OF GROSS STATE PRODUCT
239 Arndt Street
Green Bay Redevelopment Authority
10/10/2013
Output
(000 $)
6.1
14.8
219.0
2,884.9
1,873.4
1,656.6
363.8
771.6
1,439.0
2,503.5
11,732.7
49.1
11,781.8
11,781.8
6,129.5
1.922
5,652.3

Gross State
Product (000$)
Income
(000$)
Employment
(jobs)
1. Agriculture 0 1.3 4.1
I. TOTAL EFFECTS (Direct and Indirect/Induced)*
Economic Component
Private
1 12.1 11.42. Agri. Serv., Forestry, & Fish
3. Mining 109.550.61
4. Construction 24 1,494.0
581.9
776.1
219.3
1,532.4
2,274.7
386.5
439.1
125.2
274.8
546.6
1,619.5
1,550.0
10
15
3
24
19
53
5. Manufacturing
6. Transport. & Public Utilities
7. Wholesale
9. Finance, Ins., & Real Estate
10. Services
Private Subtotal
8. Retail Trade 483.7
151 4,880.2 7,612.5
Public
11. Government 1 23.0 23.2
Total Effects (Private and Public) 152 4,903.2 7,635.8
II. DISTRIBUTION OF EFFECTS/MULTIPLIER
1. Direct Effects 65 2,809.5 4,102.2
2. Indirect and Induced Effects 87 2,093.7 3,533.6
152 4,903.2 7,635.83. Total Effects
4. Multipliers (3/1) 2.330 1.745 1.861
1. Wages--Net of Taxes 4,131.0
2. Taxes
a. Local 467.8
b. State 391.7
c. Federal
520.8 General
Social Security 437.0
957.8
1,817.3
3. Profits, dividends, rents, and other 1,687.4
4. Total Gross State Product (1+2+3) 7,635.8
EFFECTS PER MILLION DOLLARS OF INITIAL EXPENDITURE
Employment (Jobs) 20
Income 645,357.8
State Taxes 51,558.3
Local Taxes 61,565.5
Gross State Product 1,005,021.2
Note: Detail may not sum to totals due to rounding.
*Terms:
Direct Effects --the proportion of direct port-related spending on goods and services produced in the specified region.
Indirect Effects--the value of goods and services needed to support the provision of those direct economic effects.
Induced Effects--the value of goods and sevices needed by households that provide the direct and indirect labor.
III. COMPOSITION OF GROSS STATE PRODUCT
Part of 700 Eastman Avenue
Procter & Gamble
10/10/2013
Output
(000 $)
6.3
15.4
134.9
1,996.9
1,490.5
1,586.0
328.0
779.9
2,124.6
3,992.6
12,454.9
50.8
12,505.6
12,505.6
6,583.8
1.899
5,921.8

Gross State
Product (000$)
Income
(000$)
Employment
(jobs)
1. Agriculture 0 0.9 2.8
I. TOTAL EFFECTS (Direct and Indirect/Induced)*
Economic Component
Private
0 6.5 6.32. Agri. Serv., Forestry, & Fish
3. Mining 191.789.92
4. Construction 31 1,498.0
356.5
632.4
177.0
761.4
974.5
238.4
365.0
101.1
201.6
365.7
1,607.0
668.3
6
13
3
17
12
25
5. Manufacturing
6. Transport. & Public Utilities
7. Wholesale
9. Finance, Ins., & Real Estate
10. Services
Private Subtotal
8. Retail Trade 353.9
110 3,535.4 5,063.6
Public
11. Government 0 15.6 15.8
Total Effects (Private and Public) 111 3,551.0 5,079.4
II. DISTRIBUTION OF EFFECTS/MULTIPLIER
1. Direct Effects 54 2,191.3 2,790.1
2. Indirect and Induced Effects 57 1,359.7 2,289.3
111 3,551.0 5,079.43. Total Effects
4. Multipliers (3/1) 2.057 1.621 1.821
1. Wages--Net of Taxes 2,834.2
2. Taxes
a. Local 199.3
b. State 248.7
c. Federal
350.7 General
Social Security 297.7
648.4
1,096.4
3. Profits, dividends, rents, and other 1,148.7
4. Total Gross State Product (1+2+3) 5,079.4
EFFECTS PER MILLION DOLLARS OF INITIAL EXPENDITURE
Employment (Jobs) 22
Income 718,664.5
State Taxes 50,341.1
Local Taxes 40,327.1
Gross State Product 1,027,986.0
Note: Detail may not sum to totals due to rounding.
*Terms:
Direct Effects --the proportion of direct port-related spending on goods and services produced in the specified region.
Indirect Effects--the value of goods and services needed to support the provision of those direct economic effects.
Induced Effects--the value of goods and sevices needed by households that provide the direct and indirect labor.
III. COMPOSITION OF GROSS STATE PRODUCT
1341 State Street and 130 Ninth Street
Green Bay Drop Forge and End of Ninth LLC
10/10/2013
Output
(000 $)
4.3
8.8
231.4
1,953.5
954.6
1,320.9
265.0
569.7
1,105.4
1,669.5
8,082.9
34.3
8,117.2
8,117.2
4,232.8
1.918
3,884.4

Gross State
Product (000$)
Income
(000$)
Employment
(jobs)
1. Agriculture 0 0.7 2.2
I. TOTAL EFFECTS (Direct and Indirect/Induced)*
Economic Component
Private
0 6.5 6.22. Agri. Serv., Forestry, & Fish
3. Mining 90.141.91
4. Construction 20 1,146.7
398.6
392.5
130.8
623.7
938.3
263.0
221.2
74.7
151.8
283.5
1,238.5
640.6
7
8
2
13
10
23
5. Manufacturing
6. Transport. & Public Utilities
7. Wholesale
9. Finance, Ins., & Real Estate
10. Services
Private Subtotal
8. Retail Trade 267.1
83 2,830.5 4,088.1
Public
11. Government 0 12.3 12.4
Total Effects (Private and Public) 84 2,842.8 4,100.5
II. DISTRIBUTION OF EFFECTS/MULTIPLIER
1. Direct Effects 38 1,733.4 2,232.9
2. Indirect and Induced Effects 46 1,109.4 1,867.5
84 2,842.8 4,100.53. Total Effects
4. Multipliers (3/1) 2.210 1.640 1.836
1. Wages--Net of Taxes 2,299.4
2. Taxes
a. Local 173.6
b. State 198.0
c. Federal
278.0 General
Social Security 237.5
515.5
887.1
3. Profits, dividends, rents, and other 913.9
4. Total Gross State Product (1+2+3) 4,100.5
EFFECTS PER MILLION DOLLARS OF INITIAL EXPENDITURE
Employment (Jobs) 21
Income 701,153.3
State Taxes 48,827.2
Local Taxes 42,822.2
Gross State Product 1,011,354.4
Note: Detail may not sum to totals due to rounding.
*Terms:
Direct Effects --the proportion of direct port-related spending on goods and services produced in the specified region.
Indirect Effects--the value of goods and services needed to support the provision of those direct economic effects.
Induced Effects--the value of goods and sevices needed by households that provide the direct and indirect labor.
III. COMPOSITION OF GROSS STATE PRODUCT
Part of 1601 N. Quincy Street
Green Bay Packaging, Inc.
10/10/2013
Output
(000 $)
3.4
8.5
110.4
1,507.3
990.3
802.9
196.6
430.2
897.2
1,629.8
6,576.4
27.1
6,603.5
6,603.5
3,442.5
1.918
3,161.0

Gross State
Product (000$)
Income
(000$)
Employment
(jobs)
1. Agriculture 0 2.3 7.1
I. TOTAL EFFECTS (Direct and Indirect/Induced)*
Economic Component
Private
1 22.7 21.62. Agri. Serv., Forestry, & Fish
3. Mining 423.6197.25
4. Construction 77 4,110.4
1,115.7
1,722.3
471.4
1,798.3
1,501.9
743.7
992.2
269.2
503.4
930.8
4,466.8
1,037.7
19
35
7
43
31
43
5. Manufacturing
6. Transport. & Public Utilities
7. Wholesale
9. Finance, Ins., & Real Estate
10. Services
Private Subtotal
8. Retail Trade 884.2
262 8,809.6 12,413.0
Public
11. Government 26 802.6 745.9
Total Effects (Private and Public) 289 9,612.3 13,158.9
II. DISTRIBUTION OF EFFECTS/MULTIPLIER
1. Direct Effects 144 5,900.4 7,002.7
2. Indirect and Induced Effects 145 3,711.9 6,156.1
289 9,612.3 13,158.93. Total Effects
4. Multipliers (3/1) 2.010 1.629 1.879
1. Wages--Net of Taxes 7,687.2
2. Taxes
a. Local 418.0
b. State 612.9
c. Federal
880.5 General
Social Security 751.9
1,632.4
2,663.3
3. Profits, dividends, rents, and other 2,808.4
4. Total Gross State Product (1+2+3) 13,158.9
EFFECTS PER MILLION DOLLARS OF INITIAL EXPENDITURE
Employment (Jobs) 22
Income 731,353.8
State Taxes 46,630.4
Local Taxes 31,806.8
Gross State Product 1,001,196.0
Note: Detail may not sum to totals due to rounding.
*Terms:
Direct Effects --the proportion of direct port-related spending on goods and services produced in the specified region.
Indirect Effects--the value of goods and services needed to support the provision of those direct economic effects.
Induced Effects--the value of goods and sevices needed by households that provide the direct and indirect labor.
III. COMPOSITION OF GROSS STATE PRODUCT
1611 State Street
Georgia-Pacific / TetraTech
10/10/2013
Output
(000 $)
10.9
29.6
515.6
5,572.3
2,864.9
3,609.3
705.0
1,423.0
2,645.6
2,458.2
19,834.4
2,018.8
21,853.2
21,853.2
11,349.5
1.925
10,503.7
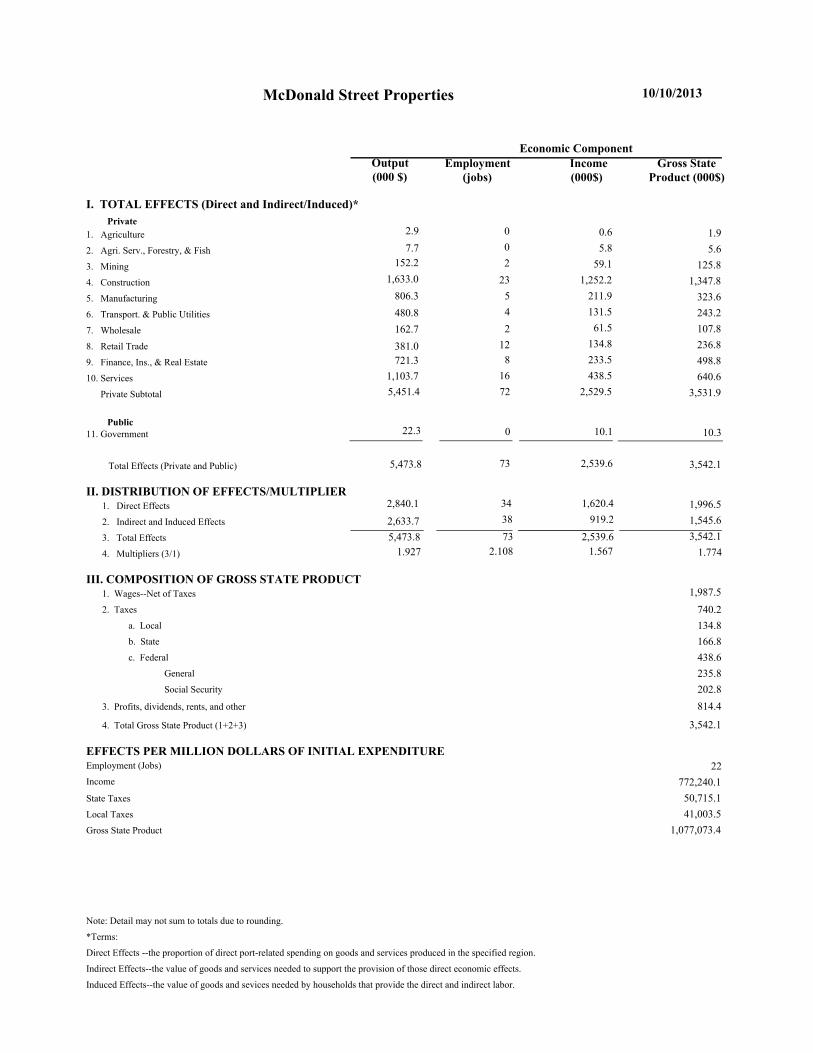
Gross State
Product (000$)
Income
(000$)
Employment
(jobs)
1. Agriculture 0 0.6 1.9
I. TOTAL EFFECTS (Direct and Indirect/Induced)*
Economic Component
Private
0 5.8 5.62. Agri. Serv., Forestry, & Fish
3. Mining 125.859.12
4. Construction 23 1,252.2
323.6
243.2
107.8
498.8
640.6
211.9
131.5
61.5
134.8
233.5
1,347.8
438.5
5
4
2
12
8
16
5. Manufacturing
6. Transport. & Public Utilities
7. Wholesale
9. Finance, Ins., & Real Estate
10. Services
Private Subtotal
8. Retail Trade 236.8
72 2,529.5 3,531.9
Public
11. Government 0 10.1 10.3
Total Effects (Private and Public) 73 2,539.6 3,542.1
II. DISTRIBUTION OF EFFECTS/MULTIPLIER
1. Direct Effects 34 1,620.4 1,996.5
2. Indirect and Induced Effects 38 919.2 1,545.6
73 2,539.6 3,542.13. Total Effects
4. Multipliers (3/1) 2.108 1.567 1.774
1. Wages--Net of Taxes 1,987.5
2. Taxes
a. Local 134.8
b. State 166.8
c. Federal
235.8 General
Social Security 202.8
438.6
740.2
3. Profits, dividends, rents, and other 814.4
4. Total Gross State Product (1+2+3) 3,542.1
EFFECTS PER MILLION DOLLARS OF INITIAL EXPENDITURE
Employment (Jobs) 22
Income 772,240.1
State Taxes 50,715.1
Local Taxes 41,003.5
Gross State Product 1,077,073.4
Note: Detail may not sum to totals due to rounding.
*Terms:
Direct Effects --the proportion of direct port-related spending on goods and services produced in the specified region.
Indirect Effects--the value of goods and services needed to support the provision of those direct economic effects.
Induced Effects--the value of goods and sevices needed by households that provide the direct and indirect labor.
III. COMPOSITION OF GROSS STATE PRODUCT
McDonald Street Properties 10/10/2013
Output
(000 $)
2.9
7.7
152.2
1,633.0
806.3
480.8
162.7
381.0
721.3
1,103.7
5,451.4
22.3
5,473.8
5,473.8
2,840.1
1.927
2,633.7