2013 national budget - department of treasury national budget volume 1 economic and development...
TRANSCRIPT

2013 NATIONAL BUDGET
VOLUME 1
ECONOMIC AND DEVELOPMENT POLICIES
For the year ending 31 st December, 2013
PRESENTED BY HON. DON POMB POLYE,
CMG, BE (Civil), MBA, MIEPNG [Reg.], MP MINISTER FOR TREASURY
ON THE OCCASION OF THE PRESENTATION OF 2013 NATIONA L BUDGET
2013 Budget, Volume 1
2013 Budget, Volume 1
FOREWORD
I am proud to present to the people of Papua New Guinea the first O’Neill-Dion Government’s National Budget. The 2013 Budget is a historic budget of a record K13.0 billion. This is a decisive and a responsible budget that cares for the livelihood of all of our population.
I believe in empowering the people of Papua New Guinea and I am confident that this unique budget does empower our people.
This Budget is about growing our future by making key investments now. It is a deliberate intervention by the O’Neill-Dion Government to have a development strategy focused on inclusive and sustainable growth for all our people, especially those in our rural areas. We believe the future of this great nation lies in getting more decision-making outside of Waigani. We believe this is the future we need to nurture and grow.
Through this document, there are many examples of how we are directing the Budget to grow the future and meet our people’s aspirations. This Budget is focused on the key enablers to nurture the development of our children and our economy – towards better education, better health, better infrastructure, and better law and order. Let me highlight three historic reforms in this foreword.
First, we will empower our people by giving greater financial responsibility and accountability to lower levels of the Governments. It is our conviction that empowering Governments that are closer to our people will significantly improve the delivery of vital goods and services. From 2013, a total of K1,492.0 million will be provided in direct financing to the Provinces, Districts and LLGs. From 2013 onwards, each District will receive funding of K10.0 million each year (K890.0 million per year), Provinces will receive K5.0 million per District (K445.0 million per year) in addition to the existing functional grants, and Local Level Governments will receive K0.5 million each (K157.0 million per year). Overall, funding to sub-national levels of Government will increase by 87.6 per cent to K3.6 billion in 2013.
Second, we will focus on increasing the share of the Budget to key enablers such as education, health, infrastructure, and law and order. In this Budget, we take a historic "step-up" with an overall 50.9 per cent funding increase in these key areas. By 2017, we want such critical funding to have more than doubled - from around K5.0 billion in 2012 to over K10.0 billion by 2017. In 2013, we will increase support for infrastructure by 69.0 per cent to K2.6 billion, mainly through support for roads. Health will see a 64.0 per cent increase to K1.3 billion, including free primary health care. Education will have a 41.0 per cent increase to K2.3 billion, including extending the tuition fee free education policy to years 11 and 12 and supporting the recruitment of a further 3,132 teachers. Funding for the police forces will also be substantially strengthened with on-going funding to support an extra 400 recruits every year. We will also support key sectors such as agriculture, tourism and small and medium sized enterprises by good policies to ensure they can efficiently prosper, as well as programs to assist with their development.
Third, we will ensure that there is greater certainty of funding for key Nation Building Productive Investments Infrastructure, such as the Highlands Highway, through the introduction of multiyear budgeting through the use of ‘forward estimates’. This is a significant budgetary reform undertaken by this Government to demonstrate its commitment to investing in our future in a smarter and cost effective way, with emphasis on project design and scoping before these projects are fully funded. Over K6.0 billion is earmarked for Nation Building Productive Infrastructure Investment over the medium term with the Highlands Highway getting K3.1 billion, Lae City and Port Moresby roads are

2013 Budget, Volume 1
getting K184.0 million and K500.0 million respectively. A further K1,370.0 million is set aside for other priority projects such as future major hospital refurbishments based on the K300.0 million set aside for the Port Moresby Hospital over the next 4 years with K50.0 million provided in 2013. Combined with an estimated K4,041.0 million in concessional loans focused on infrastructure, supported with counterpart funding of K1,531.0 million, this Budget includes a priority Nation Building Productive Infrastructure package totalling over K12.1 billion over the next five years. This supports our philosophy of growing our future.
The Budget will continue to implement key institutional and regulatory reforms in the areas of governance and public finance management to support and strengthen the delivery of the Government’s development objectives. One of the focus areas will be the implementation of the Right sizing Report to reduce wastage and duplication to improve the effectiveness and efficiency of service delivery. We will also move towards an integrated budget for next year’s 2014 Budget so that the recurrent and development budgets are brought together. This will make for more effective expenditure, so that we can make sure that when we build new schools we are thinking also about teachers, or when we fund hospitals, we are also thinking about health workers, or when we build roads, we are also thinking about their future maintenance. We will also be introducing financial management reforms, including the introduction of Government Finance Statistics 2001, to update our systems for a much more modern economy and to ensure greater support for and accountability from the sub-national level.
The 2013 Budget has been framed in the context of the new Medium Term Fiscal Strategy (MTFS) (2013-2017), where total revenue as a share of non-resource GDP is set to decline over this period particularly in 2013 and 2014. This poses a significant challenge in devising a prudent and feasible medium term fiscal strategy that ensures fiscal sustainability, macroeconomic stability and at the same time promotes growth and meets the significant development needs of our people. The challenge is to get the balance right, and we believe we have a strategy that meets this requirement.
Against this setback of an ending of the rapid growth in revenues of recent years, we must take action to support our revenues. For the second year, we are providing the Internal Revenue Commission and PNG Customs with substantial extra funding to ensure they have the resources to build their agencies. With this improved resourcing, we expect much stronger levels of compliance with the law. Some of this will be improved education on the responsibilities we have towards paying tax. But these will increasingly be backed by more comprehensive audit programs to ensure there is a level playing field with all businesses paying what they should be. We will also conduct a taxation review in 2013 with a focus on the minerals sector to ensure that the people of PNG are receiving their fair share of their mineral wealth.
The 2013 Budget will be a deficit budget of K2.6 billion or 7.2 per cent of GDP. Whilst the size of the deficit is unprecedented there are exceptional justifications which I have highlighted earlier. We can afford this within the fiscal sustainability framework because our prudent fiscal and macroeconomic management of the past that has created the fiscal space by lowering our debt to GDP ratio below debt sustainability levels. We have a financing strategy in place to take care of the significant financing task in 2013. New issuance methods and products are required to manage the financing task. The strategy for this new borrowing is to diversify the funding base to manage risks; use concessional loan funding where available; and harness the power of domestic savings (including superannuation) to build PNG’s financing market and to minimise exchange rate risk. We are working already with a range of organisations to raise the necessary financing, and I am confident that we can do so.
We are also committed to moving back to a small surplus in 2017. This will require some tough expenditure decisions in future years, but we believe we can do this by actions such as reducing the

2013 Budget, Volume 1
number of departments and authorities, through the better design and costing of our infrastructure, through focusing on core areas of government and selling non-core assets. To demonstrate commitment to these expenditure reforms, this Budget announces immediate action to reduce waste and duplication in the public service by the combining of several Departments and agencies.
Looking ahead and over the medium term, the Government will continue to support growth in 2014 with a similar deficit forecast, but then move gradually to reduce deficits so as to reach a balanced budget by 2017. This is enshrined in new MTFS (2013 – 2017) which I am proud to announce as a key component of the 2013 Budget. We believe that such a strategy is crucial to our business and international community as it demonstrates the O’Neill-Dion Government’s genuineness and commitment to prudent fiscal management and discipline.
This is a peoples’ budget. Their empathetic voices have been heard. It is time to “Grow the future – in empowering our people for inclusive and sustainable growth”. The challenge is now on effective implementation of this K13.0 billion Budget. In this regard, I urge all Government departments and agencies to ensure an effective and efficient implementation of the 2013 Budget.
I challenge all Provincial, District and Local Level Government leaders to provide strong, honest and prudent leadership to support the O’Neill-Dion Government’s endeavours to develop Papua New Guinea.
May I finally add here that, to implement this unique budget successfully, we need political stability. We need national solidarity. Only then, we can create such conducive environment. Above all political differences and ambitions, let us work together because the country’s future is at stake.
I commend the 2013 Budget to Honourable Members and to people of Papua New Guinea.

2013 Budget, Volume 1
i
CONTENTS
FOREWORD 1
CHAPTER 1. BUDGET OVERVIEW ................................................................................................................. 1
1.1 ECONOMIC OUTLOOK ..................................................................................................................... 1
1.2 2013 BUDGET – OVERVIEW AND REVENUE ............................................................................. 2
1.3 2012 BUDGET – EXPENDITURE AND FINANCING ........... ........................................................ 2
1.4 STATUS OF TRUST ACCOUNTS .................................................................................................... 3
1.5 TAXATION MEASURES ................................. ................................................................................... 3
1.6 BUILDING THE ECONOMY THROUGH SUSTAINED REFORMS .... ....................................... 7
1.7 IMPROVING PUBLIC ENTERPRISES AND COMMERCIAL INVESTM ENT PERFORMANCE ................................................................................................................................. 8
1.8 DEVELOPMENT STRATEGY ........................................................................................................... 8
1.9 SECTORAL POLICIES ................................. ...................................................................................... 9
1.10 MEDIUM TERM FISCAL OUTLOOK ........................ ....................................................................... 9
1.11 MEDIUM TERM DEBT STRATEGY ............................................................................................... 10
1.12 MEDIUM TERM FISCAL STRATEGY 2013 - 2017 ........... .......................................................... 10
1.13 IMPLEMENTATION OF PNG SOVEREIGN WEALTH FUND........ ........................................... 10
CHAPTER 2. ECONOMIC OUTLOOK ............................................................................................................ 12
2.1 WORLD ECONOMIC GROWTH .................................................................................................... 12
2.2 DOMESTIC ECONOMIC OUTLOOK ............................................................................................ 20
2.3 GROSS DOMESTIC PRODUCT .................................................................................................... 21
2.4 LABOUR MARKET ..................................... ...................................................................................... 26
2.5 PRICES ................................................................................................................................................ 29
2.6 MONETARY DEVELOPMENTS ..................................................................................................... 33
2013 Budget, Volume 1
ii
2.7 BALANCE OF PAYMENTS AND INTERNATIONAL PRICES ...... ............................................ 34
2.7 RISKS TO THE ECONOMIC AND FISCAL OUTLOOK .......... .................................................. 38
CHAPTER 3. 2013 BUDGET – OVERVIEW AND REVENUE .................................................................... 39
3.1 2013 BUDGET OVERVIEW ............................................................................................................. 39
3.2 FISCAL STRATEGY ................................... ...................................................................................... 40
3.3 REVENUE AND GRANTS ............................................................................................................... 41
CHAPTER 4. EXPENDITURE AND FINANCING ......................................................................................... 47
4.1 OVERVIEW ......................................................................................................................................... 47
4.2 SERVICE DELIVERY FUNDING .................................................................................................... 47
4.3 NON-FINANCIAL INSTRUCTIONS .................... ........................................................................... 59
4.4 FINANCING ........................................................................................................................................ 66
4.5 PUBLIC DEBT........................................ ............................................................................................ 67
CHAPTER 5. STATUS OF TRUST ACCOUNTS ........................................................................................... 70
5.1 OVERVIEW ......................................................................................................................................... 70
5.2 SUMMARY OF TRUST ACCOUNT MOVEMENTS .................................................................... 70
5.3 APPROPRIATION FOR TRUST ACCOUNTS: 2012-2013 ....... ................................................. 71
5.4 TRUST ACCOUNT FUND MOVEMENTS IN 2012 ..................................................................... 71
5.5 DISTRICT SERVICE IMPROVEMENT PROGRAM TRUST ACCOUNTS ............................. 74
CHAPTER 6. TAXATION MEASURES ................................. .......................................................................... 78
6.1 OVERVIEW ......................................................................................................................................... 78
6.2 TAX POLICY AMENDMENTS ............................. ............................................................................ 79
6.3 MINOR TECHNICAL AMENDMENTS ........................ ................................................................... 84
6.4 RESTATING EXISTING TAX POLICY REGARDING ADDITIONAL PROFITS TAX ............ 85
6.5 AREAS OF POLICY DEVELOPMENT IN 2013 ............... ............................................................ 85
2013 Budget, Volume 1
iii
CHAPTER 7. BUILDING THE ECONOMY THROUGH SUSTAINED REFORMS .... ............................. 86
7.1 OVERVIEW ......................................................................................................................................... 86
7.2 PUBLIC SECTOR REFORM ........................................................................................................... 86
7.3 A COMPETITIVE AND DYNAMIC PRIVATE SECTOR .......... .................................................... 92
CHAPTER 8. IMPROVING PUBLIC ENTERPRISE AND COMMERCIAL INVESTME NT PERFORMANCE .................................................................................................................................................... 98
8.1 OVERVIEW ......................................................................................................................................... 98
8.2 POLICY DIALOGUE AND PUBLIC ENTERPRISE PERFORMANCE . .................................. 98
8.3 POLICY SETTINGS FOR PUBLIC ENTERPRISES ............ ..................................................... 101
8.4 STRENTHENING POLICY FORMULATION ................... ........................................................... 106
8.5 CONTINUING REFORMS TO THE INDEPENDENT PUBLIC BUSINESS CORPORATION .............................................................................................................................. 106
8.6 STATE INVESTMENT IN EXTRACTIVE INDUSTRIES ............................................................ 106
CHAPTER 9. DEVELOPMENT STRATEGY ................................................................................................ 110
9.1 2012 DEVELOPMENT BUDGET STRATEGY.................. ........................................................ 110
9.2 DEVELOPMENT BUDGET 2013 ................................................................................................ 114
9.3 MONITORING DEVELOPMENT .................................................................................................. 119
9.4 FUTURE DEVELOPMENT BUDGET S AND STRATEGIES ........ .......................................... 120
CHAPTER 10. SECTORAL POLICIES ................................. .......................................................................... 122
10.1 MEDIUM TERM DEVELOPMENT PLAN ENABLERS ............. ............................................... 122
10.2 ECONOMIC SECTORS .................................................................................................................. 137
10.3 CROSS-CUTTING ........................................................................................................................... 142
CHAPTER 11. MEDIUM TERM FISCAL OUTLOOK ........................ ........................................................... 145
11.1 OVERVIEW ....................................................................................................................................... 145
11.2 REVENUE AND GRANTS ............................................................................................................. 147
11.3 EXPENDITURE AND NET LENDING .......................................................................................... 150
2013 Budget, Volume 1
iv
11.4 FINANCING ...................................................................................................................................... 152
CHAPTER 12. MEDIUM TERM DEBT STRATEGY ..................................................................................... 154
12.1 OVERVIEW ....................................................................................................................................... 154
12.2 MAINTAINING DEBT AT SUSTAINABLE LEVELS ............ ...................................................... 154
12.3 REDUCING FINANCIAL RISKS .......................... ......................................................................... 155
12.4 DEVELOPING DOMESTIC DEBT MARKET ................... .......................................................... 158
12.5 LONGER-TERM CHALLENGES ............................ ..................................................................... 158
CHAPTER 13. MEDIUM TERM FISCAL STRATEGY 2013-2017 ............. ................................................. 159
13.1 OVERVIEW ....................................................................................................................................... 159
13.2 REPORTING..................................................................................................................................... 160
13.3 GUIDING PRINCIPLES .................................................................................................................. 160
13.4 KEY CHALLENGES FOR THE 2013-2017 MTFS ............. ....................................................... 160
13.5 MEDIUM TERM REVENUE OUTLOOK 2013-2017 ................................................................. 163
13.6 MACROECONOMIC STABILITY ........................... ...................................................................... 164
13.7 MEDIUM TERM EXPENDITURE OUTLOOK 2013-2017 ........................................................ 170
13.8 HIGH PRIORITY REFORMS ......................................................................................................... 171
CHAPTER 14. IMPLEMENTATION OF PNG SOVEREIGN WEALTH FUND ....... .................................. 173
14.1 OVERVIEW ....................................................................................................................................... 173
14.2 KEY FEATURES OF PNG SWF ................................................................................................... 173
14.3 MAINTAINING FISCAL DISCIPLINE ..................... ...................................................................... 178
14.4 THE IMPLEMENTATION PHASE .......................... ....................................................................... 179
2013 Budget, Volume 1
v
FIGURES Figure 1: Growth in MTDP Enablers 6
Figure 2: World Economic Growth Projections 12
Figure 3: IMF All Commodity Price Index 15
Figure 4: PNG Export Weighted Index 15
Figure 5: Copper Prices 16
Figure 6: Copper Prices against Stocks 16
Figure 7: Oil Prices - Long Term 17
Figure 8: Oil Prices against Stocks 17
Figure 9: Gold Prices 18
Figure 10: PNG Export Weighted Agriculture Price I ndex 19
Figure 11: Price Index of Key PNG cash crops 19
Figure 12: Imported Weighted Trade Index 20
Figure 13: Exchange Rate Developments 20
Figure 14: Economic Growth 2001 - 2017 22
Figure 15: Contribution to growth by sectors, 2012 and 2013 24
Figure 16: Declining oil production over the medium term 26
Figure 17: Employment Index 27
Figure 18: Total Employment growth 27
Figure 19: Industry Employment Growth – Year to Jun e quarter 2012 27
Figure 20: Mining and Non-Mining Employment 28
Figure 21: Minimum Wages 29
Figure 22: Headline & Underlying CPI - Quarterly gr owth (%) 30
Figure 23: Headline & Underlying CPI – Through the year growth (%) 30
Figure 24: Tradable and non- tradable inflation-Qua rterly growth (%) 31
Figure 25: Tradable and non- tradable inflation-Thr ough the year growth (%) 31
Figure 26: Quarterly Growth CPI Growth by Regions (%) 32
Figure 27: Through the Year CPI Growth (%) by Regi on 32
Figure 28: Actual and Projected Inflation: 2001 – 2 013 32
Figure 29: Nominal and Real Interest Rates on Treas ury Bills 33
Figure 30: Money Supply and Private Sector Credit G rowth 34
2013 Budget, Volume 1
vi
Figure 31: Drivers of the Current Account Balance 2 006-2012 36
Figure 32: International Reserves (Kina Million) 36
Figure 33: Projected Current Account Balance 37
Figure 34: Public Debt 2007-2017 (Per cent of GDP) 68
Figure 35: Government’s On-lending Arrangement 105
Figure 36: Benefits from OK Tedi Mining Limited 108
Figure 37: Budget balances over the medium term 145
Figure 38: Budget balances over the medium term 145
Figure 39: Mining and Non-Mining Revenue 2006-2017 148
Figure 40: Total Revenue and Grants 2006-2017 (Kina Million) 150
Figure 41: Composition of Domestic Debt 2007-2017 ( Kina Million) 157
Figure 42: Resource Revenue 161
Figure 43: Government Fiscal Performance: 2000 - 20 11 162
Figure 44: Revenue projections 163
Figure 45: Increased Funding to MTDP Enablers 168
Figure 46: Fiscal outlook 170
Figure 47 Shows the forecast nominal revenue accrui ng to the Government as a result of the PNG LNG project. 174
Figure 48: PNG SWF Stabilisation Fund 176
Figure 49 PNG SWF – 2024 Example 177
2013 Budget, Volume 1
vii
TABLES Table 1: Key Economic Assumptions 2011–2013 2
Table 2:Changes in Expenditure in Key Priority Area s (Kina Million) 6
Table 3: Budget Balance 2010–2013 (Kina Million) 39
Table 4: Revenue Summary 2011–2013 (Kina Million) 42
Table 5: Tax Revenue 2011–2013 (Kina Million) 42
Table 6: Tax Revenue 2011–2012 (Kina Million) 43
Table 7: Taxes on Income and Profits 2011–2013 (Kin a Million) 43
Table 8: Taxes on Income and Profits 2011–2012 (Kin a Million) 44
Table 9: Domestic Taxes on Goods and Services 2011- 2013 (Kina Million) 44
Table 10: Domestic Taxes on Goods and Services 2011 -2012 (Kina Million) 44
Table 11: Taxes on International Trade 2011–2013 (K ina Million) 45
Table 12: Taxes on International Trade 2011–2012 (K ina Million) 45
Table 13: Non-Tax Revenue 2011–2013 (Kina Million) 45
Table 14: Non-tax Revenue 2011–2012 (Kina Million) 46
Table 15: Total Expenditure and Net Lending 2011–20 13 (Kina Million) 47
Table 16: Service Delivery Funding by Agency Type ( Kina Million) 49
Table 17: Education (Kina Million) 50
Table 18: Health (Kina Million) 51
Table 19: Transport (Kina Million) 52
Table 20: Law and Order (Kina Million) 53
Table 21: 2012 Revised and 2013 Projected Expenditu re − Small Businesses and Agriculture (Kina Million) 54
Table 22: Personnel Emoluments (Kina Millions) 55
Table 23: Personnel Emoluments Top Five Increases ( Kina Millions) 55
Table 24: Personnel Emoluments by Provinces (Kina M illions) 56
Table 25: Provincial Personnel Emoluments Expenditu re by Account type (Kina Million) 57
Table 26: Goods and Services (Kina Million) 57
Table 27: Goods and Services Top Five Increases (Ki na Million) 58
Table 28: Provincial Goods and Services Grants (exc l. ABG) (Kina Million) 59
Table -29 ABG Functional Grants 59
2013 Budget, Volume 1
viii
Table 30: Summary of Trust Accounts movements since 2005–2012 (Kina Million) 70
Table 31: Appropriation for each Trust account: 201 2-2013 (Kina Million) 71
Table 32: Trust Account Movements from 1 January to 30 September 2012 (Kina Million) 72
Table 33: Movement of the 89 District Service Impro vement Program Bank Accounts from 1 January to 30 September 2012 (Kina Million) 75
Table 34: Excise Rate Increase for Pre-used Motor V ehicles 80
Table 35: Valuation of public enterprises and other investment, as at 31 December 2011 99
Table 36: Recent Dividends from Public Enterprises and Commercial Investments 102
Table 37: Indicative Budget for the IPBC (KinaMill ion) 104
Table 38: Development Budget Framework (Kina Milli on) 115
Table 39: Components of the 2013 Development Budget 115
Table 40: Provincial Services Improvement Programme (PSIP) Allocation in the 2013 Development Budget to Provincial Treasuries Operat ing Accounts (Kina Million) 116
Table 41: District Services Improvement (DSIP) Allo cation in the 2013 Development Budget to District Treasuries Operating Accounts (Kina Millio n) 117
Table 42: Local Level Government Support (Kina Mill ion) 117
Table 43: Infrastructure Investment Projects (Kina Million) 118
Table 44: Other Priority Infrastructure Investments (Kina Million) 118
Table 45: Alotau Accord Priority Areas (Kina Millio n) 119
Table 46: Fixed Commitements including loan project s K626.6 million (Kina Million) 119
Table 47: Development Appropriations for Law and Ju stice 2007-2013 (Kina Million) 123
Table 48: 2013 Development Expenditure on Law and J ustice (Kina Million) 123
Table 49: Development Appropriations for Primary an d Secondary Education 2007-2013 (Kina Million) 124
Table 50: 2013 Development Expenditure on Primary a nd Secondary Education (Kina Million) 125
Table 51: Development Appropriations for Higher and Technical Education 2007-2013 (Kina Million) 126
Table 52: 2013 Development Expenditure on Higher an d Technical Education (Kina Million) 127
Table 53: Development Appropriations for Primary an d Preventative Health 2006-2012 (Kina Million) 129
Table 54: Development Appropriations for Transport Maintenance and Rehabilitation 2005-2013 (Kina Million) 130
Table 55: 2013 Development Expenditure on Transport Maintenance and Rehabilitation (Kina Million) 131
Table 56: Development Appropriations for Water and Sanitation 2007-2013 (Kina Million) 132

2013 Budget, Volume 1
ix
Table 57: 2013 Development Expenditure on Water and Sanitation (Kina Million) 133
Table 58: Development Appropriations for Energy Dev elopment 2007-2013 (Kina Million) 134
Table 59: 2013 Development Expenditure on Energy De velopment (Kina Million) 134
Table 60: Development Appropriations for ICT 2007-2 013 (Kina Million) 135
Table 61: 2013 Development Expenditure on ICT (Kina Million) 135
Table 62: Development Appropriations for Land 2006- 2013 (Kina Million) 136
Table 63: 2013 Development Expenditure on Land (Kin a Million) 137
Table 64: 2013 Development Expenditure for Agricult ure (Kina Million) 138
Table 65: Total Revenue and Grants and Forward Esti mates (Kina Million) 149
Table 66: Proposed 2013 Budget and Indicative Estim ates 2014-2017 (Kina Million) 151
Table 67:Estimated Percentage of Foreign Currency D ebt in Public Debt Portfolio 156
Table 68:Estimated Percentage of Treasury Bills in Domestic Debt Portfolio 156

2013 Budget, Volume 1
1
CHAPTER 1. BUDGET OVERVIEW 1.1 ECONOMIC OUTLOOK
The global economic recovery has been riddled with new setbacks and uncertainty weighs heavily on the outlook. It appears that advanced economies have struggled in their attempts to rebuild confidence and at the same time construct a convincing path for global recovery. Tail risks stemming from worries about the ability of European policymakers to control the euro crisis including the failures of the US policy makers to agree on a fiscal plan have weakened the recovery in 2012. According to the International Monetary Fund’s (IMF) October World Economic Outlook (WEO), global economy is forecast to mildly improve from the relatively slow pace at the start of the year with projected global growth at 3.3 per cent in 2012 and 3.6 per cent in 2013.
Looking ahead the outlook for PNG economy remains positive despite the slowing global economy. In 2012 the economy is expected to grow by 9.2 per cent driven by a peak in the construction phase of the PNG LNG project. The outlook for 2013 is also solid with the PNG economy forecast to grow at 4 per cent. Expenditure on the PNG LNG project has reached its peak and although high levels of investment will continue in 2013, they will no longer be a driver to push growth rates well above historic averages. Despite this slow down to a growth rate that would still be well regarded in most countries in the world, it still represents 13 consecutive years of uninterrupted economic growth.
Over the medium term, economic growth is projected to be higher in 2014 and substantially boosted in 2015 with the commencement of gas production. The economy is expected to be boosted by the initial flow of gas with the first shipment of PNG LNG expected in the latter part of the year. The agriculture sector is also expected to pick up in the same year with the roll-out of key Budget programs over recent years. Full gas production in 2015 will mark the time when measured GDP is expected to grow at 20 per cent in real terms while the news of the extension of mine life at Ok Tedi is a positive development.
The economic and fiscal outlook downside risks include;
(i) Potential disruptions to the global economy as this would have serious implication on PNG’s trade and Government revenues;
(ii) Volatility in commodity prices - revenue collections could be lower if they fall sharply;
(iii) Any disruptions to the progress of PNG LNG project and existing agricultural, mining and petroleum projects; and
(iv) Difficulties in meeting the financing requirements of this Budget.
On the upside there are a number of mining and petroleum projects including the second LNG project that are under active consideration. Should these projects proceed, current GDP and Revenue forecasts could be significantly boosted in the forecast period.
In addition, the recent announcements on the PNG LNG project were made only just before the Budget, and some key elements such as the continued construction profile through 2013 have not been built into the forecasts. This news represents potential upsides for growth and revenue in 2013, and possible downsides for the rate of growth in 2014. These developments will be assessed along with other developments in the months ahead and an update will be provided as part of the Mid Year Economic and Fiscal Outlook.
Table 1 shows the current economic assumptions for economic growth, inflation, interest rates and commodity prices.

2013 Budget, Volume 1
2
Table 1: Key Economic Assumptions 2011–2013
2011 Actual 2012 Estimate 2013
Projection Economic Growth GDP Growth 11.1 9.2 4.0 Non-Mining GDP Growth 13.2 9.8 3.4 Inflation
Year average (%) 8.5 4.1 8.0 Dec on Dec (%) 6.9 6.4 6.8 Interest Rates
Interest Rate (Treasury Bills) 7.75 6.75 6.75 Inscribed Stock (3 year Yield) 9.0 5.0 5.0 Commodity Prices
Oil Price (USD/Barrel) 104.0 96.0 103.0 Copper Price (USD/Tonne) 8,823.0 7,824.0 8,047.3 Gold Price (USD/Ounce) 1,569.0 1,648.0 1,701.8 Nickel Price (USD/Tonne) 22,909.0 17,454.0
Source: Department of Treasury
1.2 2013 BUDGET – OVERVIEW AND REVENUE
The 2013 Budget will be PNG’s first budget to reach K13.0 billion. Even with its large size, it has been framed to be a responsible budget given PNG’s circumstances. The Budget is designed to be in deficit in order to greatly increase expenditure on the Medium Term Development Enablers (Infrastructure, Education, Health, Law & Order and Land), in particular at the sub-national level. Expenditure in these key areas are estimated to increase by 50.0 per cent from around K5.0 billion in 2012 to K7.5 billion in 2013. This is a very significant "step-up" in investing for our future.
This Budget is set against assumptions of a modest increase in activity in the global economy in 2013 in comparison to 2012. This is as a result of a potential reduction in uncertainty relating to the fiscal crisis in the Euro area and the United States, as well as continuing monetary policy accommodation and gradually easier financial conditions.
Revenue is anticipated to grow slowly relative to recent years. Total revenue and grants are expected to total K10,481.9 million, up 3.2 per cent from 2012 levels. As a share of GDP, this represents a decline from 31.1 per cent in 2012 to 29.5 per cent in 2013.
It is also framed within a planned budget deficit of around 7.2 per cent of GDP for 2013, with the level of deficit being reduced so that it returns to surplus by 2017.
In addition to borrowing for the anticipated deficit in 2013, there will be a need to raise additional financing to maintain the PNG Government's share of the PNG LNG project given the recently announced increase in costs for the project.
1.3 2012 BUDGET – EXPENDITURE AND FINANCING
Total Expenditure and Net Lending in 2013 is estimated to be K13,030.8 million, which is PNG’s biggest ever budget. This indicates a K2,470.7 million or 23.4 per cent increase to the 2012 revised estimate.
There are three key expenditure highlights in this Budget. First, there will be an 87 per cent increase in funding for sub-national levels of Government, primarily through a K1,492.0 million per year program of direct funding. Second, support for the key enablers of infrastructure, education, health and law and order will increase by 50.9 per cent, from
2013 Budget, Volume 1
3
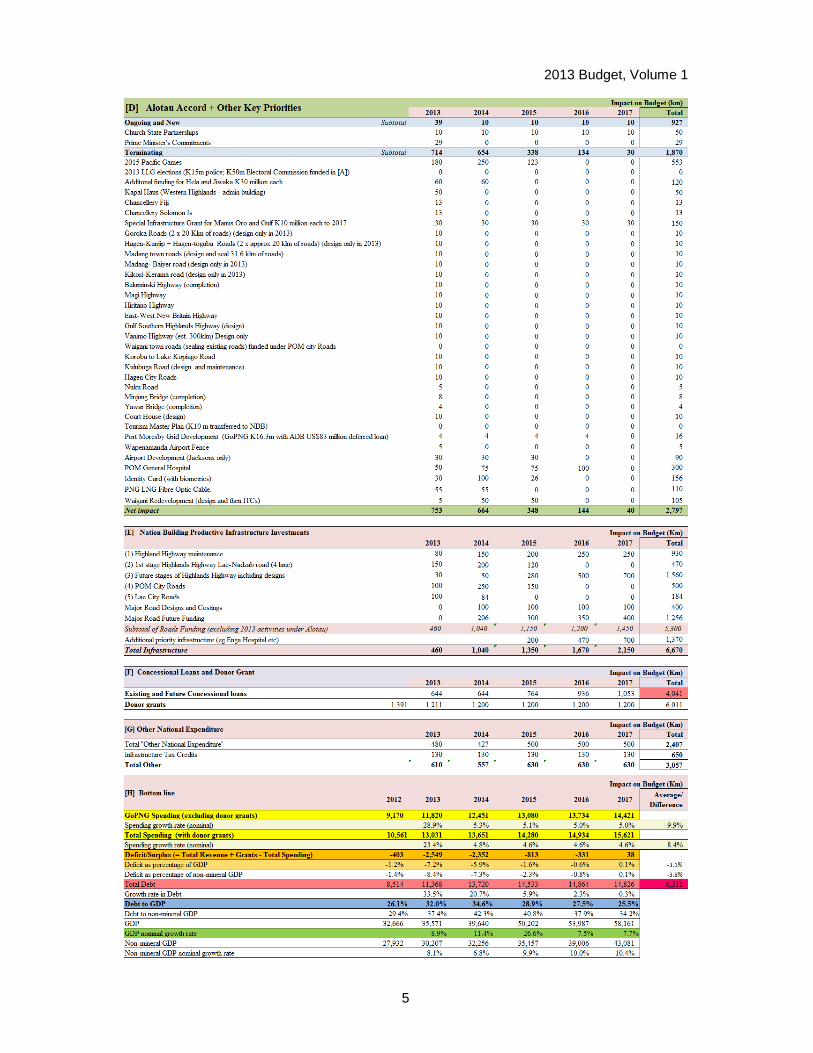
around K5.0 billion to K7.5 billion (see Box 1). Third, there will be a major commitment to sustained planning, design, costing and implementation of key Nation Building Productive Infrastructure Investments, with K12.1 billion commited over the next five years.
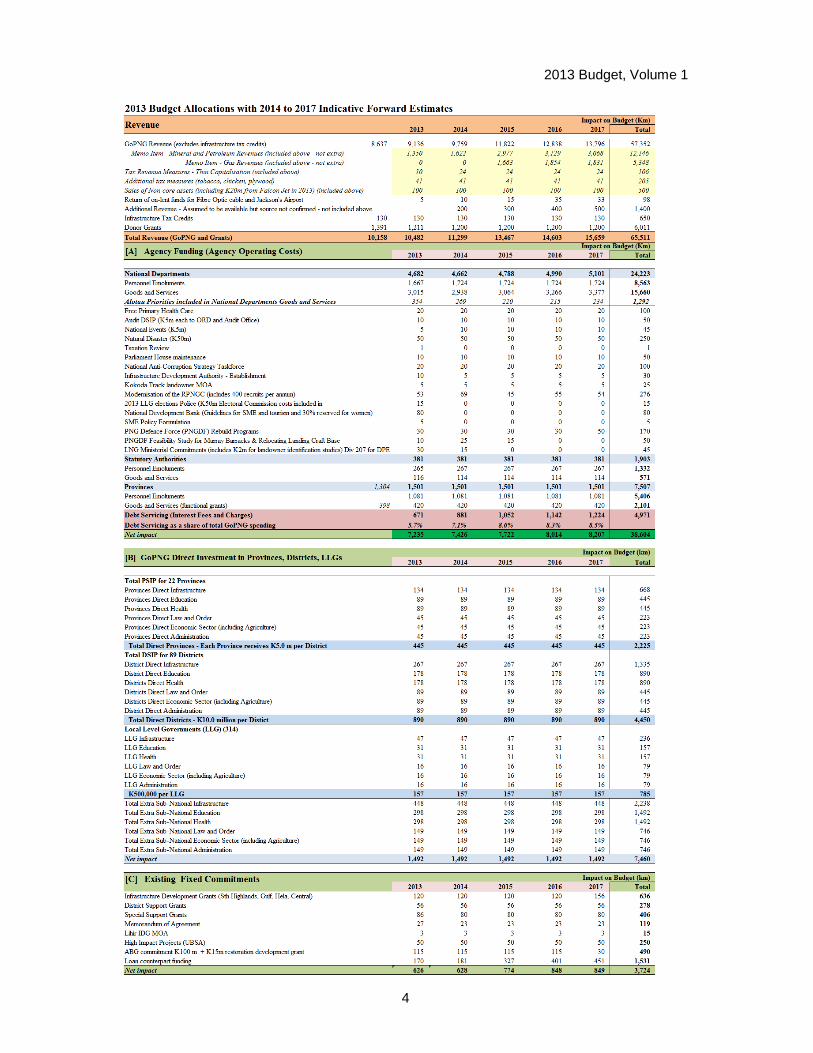
Details of the key revenue and expenditure areas for 2013 and indicative forward estimates through to 2017 are set out in detail in the following two pages.
1.4 STATUS OF TRUST ACCOUNTS
This chapter provides a summary of movements in budget funded trust accounts (trust accounts) as at 30 September 2012. These trust accounts contain funds appropriated through additional priority expenditure (APE), supplementary budget expenditure (SBE) and annual Budgets, predominantly from additional mineral revenue from the commodity boom.
As outlined in the Medium Term Fiscal Strategy 2008-12, the purpose of holding funds in trust accounts is to spread public investment spending over time to manage inflationary and demand pressures in the economy and to provide time for implementing agencies to properly design implementation strategies.
As at 30 September 2012, a total of K649.3 million was held in trust accounts, with K292.0 million in outstanding appropriations due for transfer to trust accounts from the 2012 Budget.
1.5 TAXATION MEASURES
The 2013 Budget introduces a number of taxation policy measures and other minor technical amendments as part of the Government’s ongoing effort to improve and refine the tax system. 2013 will represent the first full year of the significant tax cuts introduced in the last Budget, particularly raising the income tax threshold from K7,000 to K10,000.
In this Budget, the Government seeks to increase import tariffs for poultry and plywood. This measure will provide short term support to these two industries. Treasury will undertake a review of the tariff rates and costs of doing business in PNG in 2013, to advise the government on reforms in these areas going forward.
The Government will also increase excise duty on tobacco by 10 per cent in this Budget to discourage smoking and minimise health costs imposed on the government. Excise duty on pre-used motor vehicles will also be increased to address concerns regarding undervaluation and to minimise road congestion.
As announced in previous budgets, the Government will also amend the Income Tax Act 1959 to recognise a Nil Assessment as an assessment to give taxpayers greater certainty and fairness that their tax affairs are finalised following an appropriate review period, while balancing the need to ensure that Internal Revenue Commission (IRC) has the necessary time to review tax payers assessments.
The Government will also seek to ensure that tax policy does not add to inflation, is economically efficient and does not distort markets by forfeiting provinces 60 per cent share of Goods and Services Tax (GST) in the event that they introduce sales and services tax ontop of GST.
2013 Budget, Volume 1
4
2013 Budget, Volume 1
5
2013 Budget, Volume 1
6
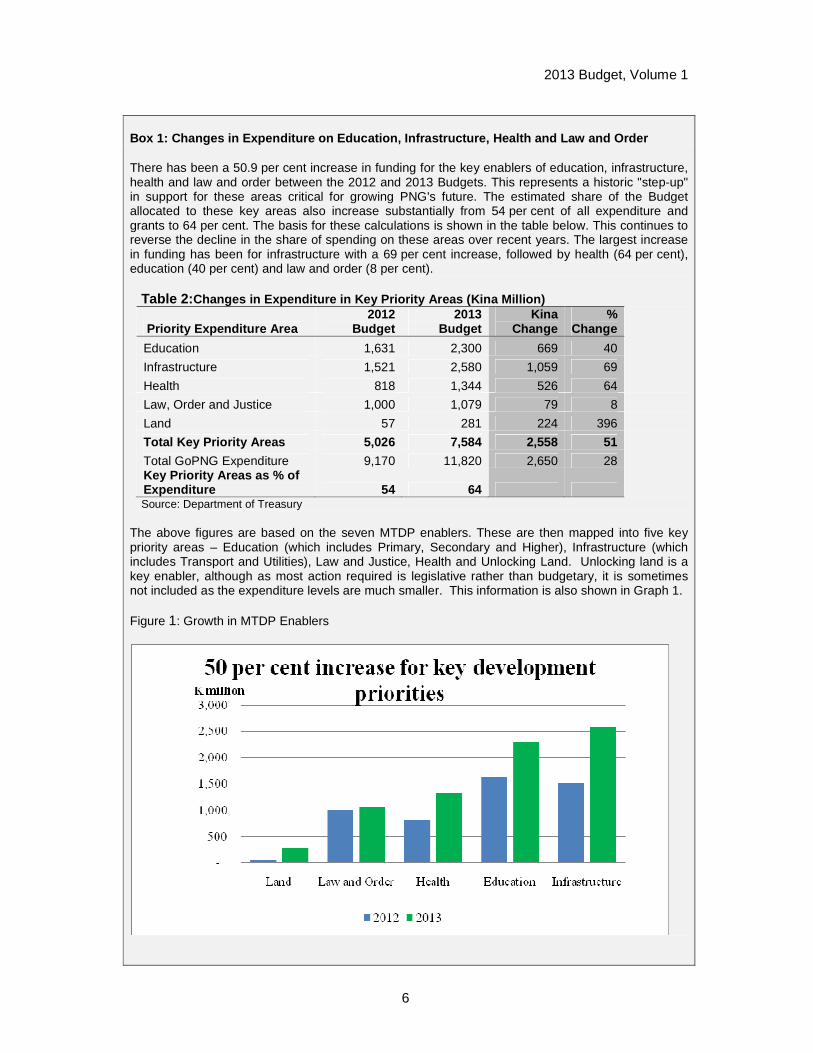
Box 1: Changes in Expenditure on Education, Infrast ructure, Health and Law and Order
There has been a 50.9 per cent increase in funding for the key enablers of education, infrastructure, health and law and order between the 2012 and 2013 Budgets. This represents a historic "step-up" in support for these areas critical for growing PNG's future. The estimated share of the Budget allocated to these key areas also increase substantially from 54 per cent of all expenditure and grants to 64 per cent. The basis for these calculations is shown in the table below. This continues to reverse the decline in the share of spending on these areas over recent years. The largest increase in funding has been for infrastructure with a 69 per cent increase, followed by health (64 per cent), education (40 per cent) and law and order (8 per cent).
Table 2: Changes in Expenditure in Key Priority Areas (Kina Million)
Priority Expenditure Area 2012
Budget 2013
Budget Kina
Change %
Change
Education 1,631 2,300 669 40
Infrastructure 1,521 2,580 1,059 69
Health 818 1,344 526 64
Law, Order and Justice 1,000 1,079 79 8
Land 57 281 224 396
Total Key Priority Areas 5,026 7,584 2,558 51
Total GoPNG Expenditure 9,170 11,820 2,650 28 Key Priority Areas as % of Expenditure 54 64 Source: Department of Treasury
The above figures are based on the seven MTDP enablers. These are then mapped into five key priority areas – Education (which includes Primary, Secondary and Higher), Infrastructure (which includes Transport and Utilities), Law and Justice, Health and Unlocking Land. Unlocking land is a key enabler, although as most action required is legislative rather than budgetary, it is sometimes not included as the expenditure levels are much smaller. This information is also shown in Graph 1.
Figure 1: Growth in MTDP Enablers
2013 Budget, Volume 1
7
The Government further embarks on extending the Thin Capitalisation rules (which currently exist for extractive industries) to all companies, other than approved finance companies, with the aim of minimising the ability for multinational companies to shift their profits offshore through excessive debt financing. This will ensurethat PNG receives its fair share of taxation for profits earned in the country.
Other minor tax policies include:
• amending the Gaming Control Act 2007 to address two conflicting laws regarding the distribution of the Bookmakers Turnover Tax. The amendment will ensure that Bookmakers turnover tax is distributed to the provinces consistent with the intent of the reforms in the Inter-Government Funding Arrangement.
• amending the Regulations 10I of the Income Tax Regulations 1959 to ensure that gas oil ratio is based on resources sold. The current law determines the gas oil ratio on the basis of petroleum resource that is extracted and does not require any gas or oil to be sold. The proposed law will correct the legislation by applying the gas oil ratio on the gas and oil resources for sale and not on the basis of the petroleum resource extracted.
This Budget also introduces a number of minor technical amendments to correct technical errors to clarify the law and administrative procedures to increase administrative efficiency.
1.6 BUILDING THE ECONOMY THROUGH SUSTAINED REFORMS
Papua New Guinea continues to benefit from past reform. These reforms have contributed to sustained economic growth that shielded the economy from external shocks and has provided a conducive environment for investment as evidenced by the PNG LNG Project. They have also contributed to lower prices and better services such as with mobile phones, air transport and banking services. They have also freed up fiscal space for the Government to concentrate on what it does best – providing essential services in areas such as education and health.
Developing and promoting a competitive private sector continues to be a priority of the Government. The Government recognises that developing and promoting this sector will continue to boost productivity that will generate more employment, income earning opportunities, improve service delivery, reliability and affordability, thus stimulating the country’s economic growth. The Government will continue to pursue the following strategies to support greater private sector activity in 2013:
• Promoting and Enhancing Competition;
• Improving Economic Regulation;
• Developing More Effective and Efficient Competitive Markets; and
• Reducing Impediments to the Business Development and Investment Climate.
The new Government will remain committed to public sector reform. These reforms will enhance the efficiency and effectiveness of the public sector. More details on public sector reforms are outlined in Chapter 11.
The Government will also continue to support the development of a competitive and dynamic private sector. In 2013, the Government will strengthen existing reforms to make sure that they achieve their objectives and explore areas for further reforms. In addition, the Government’s commitment to removing impediments to doing business and investment in

2013 Budget, Volume 1
8
PNG will remain a priority to provide a stable investment climate that promotes a competitive and dynamic private sector in the long term.
1.7 IMPROVING PUBLIC ENTERPRISES AND COMMERCIAL INV ESTMENT PERFORMANCE
Public enterprises and State investments in commercial businesses are an important part of the PNG Economy.
Public enterprises have a major role in providing power, telecommunications and other services that are essential for a growing economy. Good public policy will help ensure that public enterprises are run in a way that helps ensure that these critical services are available broadly within PNG, are reliable, and are provided as efficiently as possible.
The State also has commercial investments in large businesses, including the Bank of South Pacific, the PNG LNG project and the Ok Tedi mine. Good commercial performance of these investments and of public enterprises helps ensure that the people of PNG receive an appropriate return on the significant investment they have made in these businesses.
Over the last eighteen months, the Government has announced that it would take a new approach to increase the level of transparency and accountability of public enterprises, which should improve their performance. The inclusion of a chapter on these reforms in the 2012 Budget signaled the start of this new approach. This chapter provides an update on public enterprise performance and reforms, and outlines further reforms planned for 2013.
1.8 DEVELOPMENT STRATEGY
The O’Neil-Dion Government is aiming to establish an investment platform with at least a five year outlook to support the major development programmes required to support future growth. The formulation of the Develoment and Capital Investment Funding reflects the Government’s committment to achieving growth and prosperity by implementing the Alotau Accord key priorities, consistent with the Medium Term Development Plan (MTDP 2011-2015), the Development Strategic Plan (DSP 2010-2030) and the Millenium Development Goals.
The 2013 Development Budget Strategy aims to empower Provinces, Districts and LLGs for effective participation in inclusive and sustainable growth to diversify our economy and expand our productive base, and therefore improve livelihoods. This strategy is supported by high impact and productive investments in the 2013 Development Budget, providing access and opportunities to the rural majority through roads infrastructure to lay the foundations for sustainable growth. The 2013 Development and Capital Investment Funding is structured around the following principles:
1. Directing resources to the Provinces, Districts and LLGs
2. Delivering a policy-driven Budget in line with the Alotau Accord and MTDP;
3. The appropriation of funding across all sectors of the economy, with particular focus on the MTDP Key Enablers so as to maximise social and economic returns;
4. Redirection of expenditure towards the MTDP enablers and away from lower priority and ineffective programs, so as to guarantee tangible outcomes and clear, measurable impacts;
5. Close alignment with the Service Delivery Funding as well as funds held in Trust Accounts so as to minimise duplication of resources and ensure the sustainability of investments made; and
2013 Budget, Volume 1
9
6. An effective and aligned relationship between Government, National Agencies, Sub National Agencies and our development partners.
The Development Budget for this year is K5.8 billion or 44.0 per cent of the total 2013 Budget for Papua New Guinea. The Government is committing to priority infrastructures that connect all of Papua New Guinea and allows the effective implementation of projects and services across other key sectors such as health services delivery and education. To invest in our future, the Development and Capital Investment Funding has grown to finance these targeted investments that accelerate sustainable and inclusive growth.
1.9 SECTORAL POLICIES
The successful delivery of goods and services, as envisioned under the MTDP, will in part depend on how well development expenditure is led by sector policy. This Chapter details the Government’s sector policies that guide expenditure decisions and provide clarity on the desired targets to be achieved by 2015. It provides information on the current status of the sector, the challenges faced by the sector, and details the key implementers of sector priorities. Further details are provided on the development appropriations to the sector since 2006 and major programs and projects funded through the 2013 Development and Capital Investment Funding by both Government and development partners are highlighted.
The sectors discussed in this chapter are: land, law and justice, transport, higher education, primary and secondary education, utilities (water and sanitation), energy development,information and communications technology, primary and preventative health, agriculture, fisheries, forestry, tourism, oil and gas, mining, manufacturing, environment and HIV/AIDS.
1.10 MEDIUM TERM FISCAL OUTLOOK
For the 2013 Budget the Government anticipates a budget deficit and then a return to surplus by 2017. One source of the deficit in 2013 is the rapid slowing in revenue growth in 2013 to only 3.0 per cent. This is in contrast to the large increases over the previous three years. Revenue growth is expected to resume more strongly from 2015 with the start of the PNG LNG project.
The Government has also decided to make a historic "step up" in funding support for Districts, Provinces and LLGs, a 50.9 per cent increase in funding in 2013 for the key areas of infrastructure, education, health and law and order and support for a K12.1 billion package for Nation Building Productive Infrastructure Investments. Given the importance of ensuring a responsible and sustainable medium-term fiscal strategy, expenditure growth from 2013 has been set to grow at around 5 per cent per annum, broadly in line with inflation forecasts.
This expenditure constraint will require commitment to expenditure discipline in future years. Key elements of this approach, which is important for the credibility of the Medium Term Fiscal Strategy, include the following: immediate freezing on recruitment for several agencies targetted as part of a crack down on waste and duplication, with at least 17 agencies to be incorporated into other Departments or wound back by 2014; the immediate introduction of charging for funds on-lent to commercially viable projects (such as Jacksons Airport and the Fibre Optic cable funded as part of this Budget; the introduction of multi-year budgeting; rolling out the Integrated Financial Management System with improved expenditure controls following its successful use in pilot agencies in this Budget; and establishment of the Sovereign Wealth Fund by the end of 2013 to help stabilise and
2013 Budget, Volume 1
10
manage development expenditure. A detailed set of arrangements to support this fiscal discipline is set out in Chapter 11.
The combination of these revenue and expenditure profiles leads to an expected deficit of 7.2 per cent of GDP in 2013, and then falling especially from 2015 onwards as the additional PNG LNG revenue becomes available. A small surplus is forecast by 2017.
1.11 MEDIUM TERM DEBT STRATEGY
The objective of the Medium Term Debt Strategy 2012–2016 (Debt Strategy) is to minimise the cost of debt consistent with the Government’s tolerance for financial risk. There are three major strategies: (i) maintain debt at sustainable levels; (ii) maintain financial risk at prudent levels; and (iii) develop the domestic debt market. The Debt Strategy is aligned to the Fiscal Strategy and Development Strategic Plan.
Total public debt is projected to increase from K8,514.0 million in 2012 to K11,368.0 million at the end of 2013 as a result of the projected budget deficit for 2013 and the need to raise additional revenue for the PNG LNG project. Similarly, debt as a share of nominal GDP is projected to increase from 25.0 per cent to 32.0 per cent to meet the Government’s development agenda.
Over the last five years, the Government has made strong progress in implementing the current and prior Debt Strategy by reducing Public Debt, particularly foreign currency debt, to prudent levels. However, this has been offset by an increase in off-balance sheet foreign currency liabilities. That is, borrowing by State owned agencies which are not included in the budget process or general Government debt. Due to the high level of State liabilities, maintaining debt at prudent levels and managing financial risks remain important objectives of this Strategy. Public-sector capital expenditure funded by debt should remain consistent with this strategy and Public Financial Management Act requirements.
1.12 MEDIUM TERM FISCAL STRATEGY 2013 - 2017
This chapter sets out the Medium Term Fiscal Strategy 2013-2017. The 2013 Budget marks the first year of operation of the new Medium Term Fiscal Strategy 2013-2017 (MTFS), which has been published in conjunction with this Budget. This new MTFS seeks to both provide a level shift up in critical expenditure, in particular on infrastructure, while also ensuring the maintenance of macroeconomic stability now and into the future.
It does this by simultaneously increasing total Government expenditure while shifting this expenditure toward a focus on the Medium Term Development Enablers (infrastructure, health, education, law and order and land reform). Overall their share of the Budget is expected to increase from just over half at present, to at least two thirds by 2017.
To ensure the maintenance of macroeconomic stability it requires that the initial deficit of 7.2 per cent in 2013 is brought back to surplus by 2017. It also anchors debt to GDP at 30 per cent, apart from when it is expected to temporarily exceed it in 2013 and 2014. In all, a total of 8 fiscal rules focus Government expenditure on where it is needed most and provide the economic stability that is essential for sustainable growth.
1.13 IMPLEMENTATION OF PNG SOVEREIGN WEALTH FUND
Although Papua New Guinea (PNG) continues to enjoy solid economic growth, there are long term risks that the Government wishes to guard against. One important risk is that caused by the impact that the great variation in revenue that mining, oil and gas has on the economy and on Government revenue. Without a stabilisation mechanism, this variation in
2013 Budget, Volume 1
11
revenue would lead to a reduced ability for the Government to maintain stable program expenditures.
A further risk is that posed by the impact that the PNG Liquefied Natural Gas (LNG) project may have on the exchange rate, and therefore, on domestic exporters or import competing industries. This phenomenon, known as ‘Dutch disease’, occurs when a very large amount of exports in one industry, places upward pressure on the exchange rate. The higher exchange rate, in turn, makes other exporters less competitive, as the amount a foreign buyer must pay goes up. A higher exchange rate also makes imports cheaper making it harder for domestic producers of that same good to compete.
The Government is also mindful of the risk that any sudden large increases in expenditure, driven by expectations of future revenue from the PNG LNG project, is likely to have on domestic inflation and therefore PNG’s macroeconomic stability.
To mitigate these risks, the Government has begun the establishment of an offshore Sovereign Wealth Fund (PNG SWF). The Sovereign Wealth Fund Organic Law, which sets out the PNG SWF governance and drawdown arrangements, was enacted by Parliament in February 2012. Further elements of the PNG SWF operation will be contained in forthcoming subordinate legislations.
2013 Budget, Volume 1
12
CHAPTER 2. ECONOMIC OUTLOOK 2.1 WORLD ECONOMIC GROWTH
The global economic recovery in 2012 has suffered new set backs and significant uncertainty weighs heavily on the outlook. Growth is expected to remain sluggish in advanced countries but still relatively solid in emerging market and developing economies. Unemployment is expected to remain elevated in many parts of the world while financial conditions remain fragile.
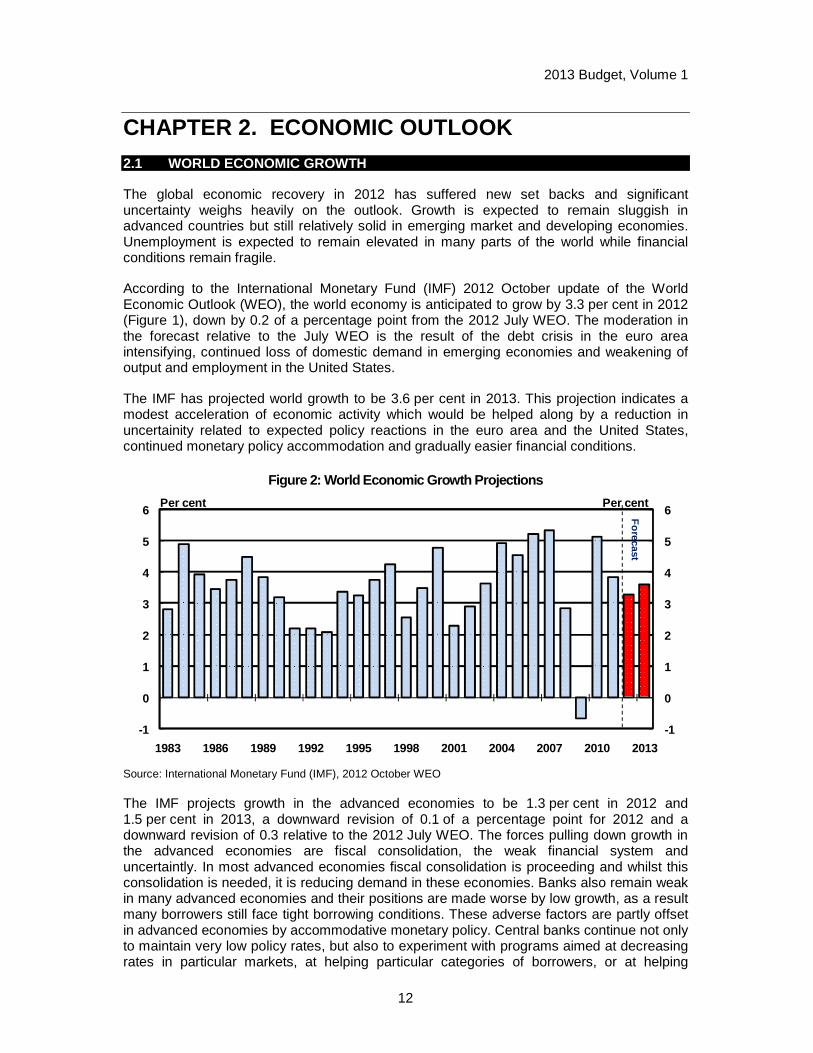
According to the International Monetary Fund (IMF) 2012 October update of the World Economic Outlook (WEO), the world economy is anticipated to grow by 3.3 per cent in 2012 (Figure 1), down by 0.2 of a percentage point from the 2012 July WEO. The moderation in the forecast relative to the July WEO is the result of the debt crisis in the euro area intensifying, continued loss of domestic demand in emerging economies and weakening of output and employment in the United States.
The IMF has projected world growth to be 3.6 per cent in 2013. This projection indicates a modest acceleration of economic activity which would be helped along by a reduction in uncertainity related to expected policy reactions in the euro area and the United States, continued monetary policy accommodation and gradually easier financial conditions.
Figure 2: World Economic Growth Projections
-1
0
1
2
3
4
5
6
-1
0
1
2
3
4
5
6
1983 1986 1989 1992 1995 1998 2001 2004 2007 2010 2013
Per cent Per cent
Forecast
Source: International Monetary Fund (IMF), 2012 October WEO
The IMF projects growth in the advanced economies to be 1.3 per cent in 2012 and 1.5 per cent in 2013, a downward revision of 0.1 of a percentage point for 2012 and a downward revision of 0.3 relative to the 2012 July WEO. The forces pulling down growth in the advanced economies are fiscal consolidation, the weak financial system and uncertaintly. In most advanced economies fiscal consolidation is proceeding and whilst this consolidation is needed, it is reducing demand in these economies. Banks also remain weak in many advanced economies and their positions are made worse by low growth, as a result many borrowers still face tight borrowing conditions. These adverse factors are partly offset in advanced economies by accommodative monetary policy. Central banks continue not only to maintain very low policy rates, but also to experiment with programs aimed at decreasing rates in particular markets, at helping particular categories of borrowers, or at helping
2013 Budget, Volume 1
13
financial intermediation in general. General uncertainty is also driving down growth. Reduced uncertainty would result in a stronger than forecast recovery in advanced economies.
The United States economy is projected to grow by 2.2 per cent in 2012 and 2.1 per cent in 2013, a downward revision of 0.1 percentage points in 2012 and 2013 from the July WEO projections. The labour market and consumption have failed to garner much strength. The persistent weakeness has prompted another round of policy stimulus by the Federal Reserve. On the positive side, the housing market may be stabilizing, albeit at depressed levels, and private credit has continued to expand despite retrenchment in the United States market by EU banks.
The Euro area (Germany, France, Italy and Spain) is projected to contract by 0.4 per cent in 2012 and grow by 0.2 per cent in 2013, a downward revision of 0.1 percentage points in 2012 and 0.5 percentage points in 2013 from the July WEO projections. In the Euro area, the sovereign crisis has intensified and new policy interventions have been necessary to prevent matters from deteriorating rapidly. Banks, insurers, and firms have swept spare liquidity from the periphery to the core of the euro area, causing Spanish sovereign spreads to record highs and Italian spreads to move up sharply too. This is triggered by continued doubts about the capacity of countries in the periphery to deliever the required fiscal and structural adjustments, questions about the readiness of national institutions to implement euro area wide policies adequate to combat the crisis.
Growth in emerging and developing economies is expected to moderate to 5.3 per cent in 2012 before picking up to 5.6 per cent in 2013, a downward revision of 0.2 and 0.3 of a percentage point, respectively, relative to the 2012 July WEO. Low growth and uncertainty in advanced economies are affecting emerging market and developing economies, through both trade and financial channels, adding to homegrown weakness.
In developing Asia, growth is estimated to have weakened to less than 7.0 per cent in the first half of 2012, as activity in China slowed sharply, owing to a tightening in credit conditions (in response to threats of a real estate bubble), a return to a more sustained pace of public investment, and weaker external demand. India’s activity suffered from waning business confidence amid slow approvals for new projects, sluggish structural reforms, policy rate hikes designed to rein in inflation, and flagging external demand.
Growth also decelerated in Latin America to about 3.0 per cent in the first half of 2012, largely due to declining growth in Brazil. This reflects the effect of past policy tightening to contain inflationary pressures and steps to moderate credit growth in some market segments, with increased drag recently from global factors. Emerging European economies,following a strong rebound from their credit crisis, have now been hit hard by slowing exports in the euro area, with GDP growth coming to a halt.
Unemployment
According to the IMF October WEO, the world unemployment rate is estimated to remain flat at nearly 6¼ per cent during 2012-2013. In emerging markets and developing economies, unemployment rates have, on average, declined below precrisis levels, but they remain elevated in advanced economies and are not expected to fall significantly during 2012-2013.
In the United States, the unemployment rate dropped from close to 10.0 per cent in 2010 to about 8.0 per cent in 2012 where it is expected to remain through 2013. However, the larger part of the decline is due to sluggish labour force expansion in 2011. In addition more than 40.0 per cent of those unemployed have been out of work for more than 6 months.

2013 Budget, Volume 1
14
In Europe, more than 1 in 10 labour force participants are projected to be unemployed through 2013. In Greece and Spain, the ratio is 1 in 4 workers. Generally, almost half of all young labour force participants are without jobs in the periphery of the euro area. As in the United States, the number of long term unemployed has increased starkly.
In the emerging and developing economies, unemployment rates varied widely. In many parts of developing Asia and Latin America, unemployment remains relatively low but high in the economies hit by the crisis and the Middle East and North Africa (MENA) region, mainly among oil importers. These economies face a number of major challenges ranging from major political changes to social needs related to rapidly expanding populations to decrease revenue from tourism – all of which are weighing on employment prospects.
Inflation
Global consumer price inflation is projected to ease as demand softens and commodity prices recede. Inflation for advanced economies is projected to ease from 1.9 per cent in 2012 to 1.6 per cent in 2013. Similarly, inflation in emerging economies is projected to ease from 6.1 per cent in 2012 to 5.8 per cent in 2013. The slight decline in 2013 in inflation reflects the broadly unchanged commodity prices outlook, however, the IMF is mindful of the sharp increase in food prices recently.
• Energy and food prices: These have been a key driver of the 2007-2008 global inflation. The prices have been stabilising below their 2011 peaks, however recently there have been some sharp increases in both energy and food prices. Food demand remained robust in 2012 despite the slowdown in global economic activity with most of the demand expected to come from the emerging and developing economies led by China. According to the IMF, the increasing food prices worldwide are raising fear of another food crisis simillar to the 2007-2008 food price crisis, however the current food price is less severe because it has not affected all key crops uniformly and has not been aggravated by trade restrictions and high energy input costs.
• Output gaps: Cyclical indicators point to ample slack in many advanced economies but capacity constraints in a number of emerging market economies. In 2012, the output gap in the advanced economies was large, varying from about 2.5 per cent of GDP in the Euro area and Japan to 4.0 per cent in the United States. These gaps are consistent with weak demand due to tight financial conditions and fiscal consolidation. By contrast, most emerging market and developing economies that were not hit by the crisis continue to operate above precrisis trends.
Commodity Prices
Commodity prices continued to remain sensitive to developments in the global economy in 2012. Weak global demand including supply side issues, speculative activity and geo-political tensions have steered the trajectory of prices in 2012. Slow growth and fragilities in the financial markets continue to weigh down on the progress in advanced economies and this has had a negative effect on the emerging economies especially through the trade and financial channels. This quickly wore on the tight demand from China and India further translating into a general weakening of global demand hence weighing down on prices. However supply side issues including the geopolitical tensions in the middle-east and speculative activities that have emerged in the copper and gold markets have translated into a rebound in prices since the mid year.
In light of these developments prices of PNG’s key exports including oil, copper and gold have moved higher in the latter half of the year as the above mentioned supply concerns
2013 Budget, Volume 1
15
together with the speculation on demand appear to have overtaken the concerns over the weak global demand. This has seen all three of PNG’s key mineral exports of oil, copper and gold increase by 11.0 per cent since the mid year.
It is important to note that while the weakness exhibited by the prices is explained by underlying weakness in fundamentals the spike in prices, especially from speculative activity, is only temporary and is not attributed to real demand but only expected demand. Supposing this expected demand does not materialize or if the euphoria from speculation driving it run outs and fundamentals reassert themselves, prices could drop very quickly, most notably copper. On the other hand, intensifying geo-political tensions remain to be addressed and while this may not be sooner, the delays are likely to extend the high price of oil seen since the start of tensions.
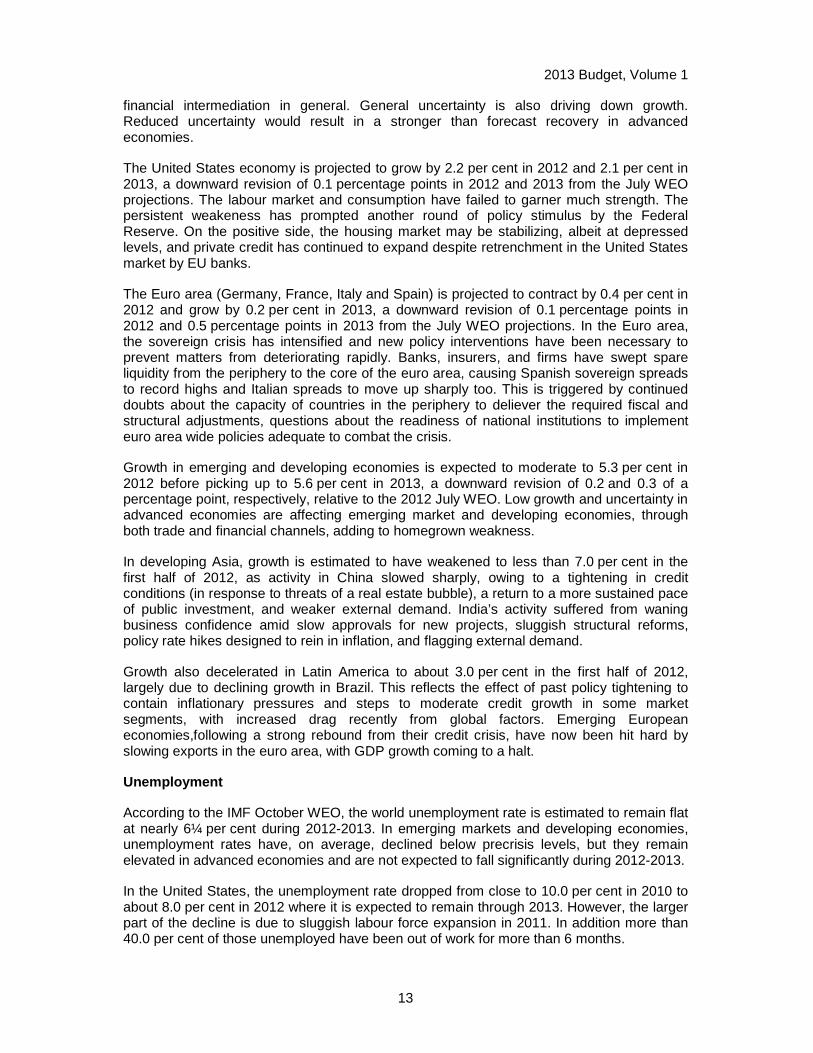
According to the IMF’s All Commodity Price Index, prices of commodities continue to be volatile in 2012. In October 2012, prices have fallen by 2.8 per cent compared to prices at the beginning of the year but are up by 0.3 per cent compared to October 2011. In assessing the effect of developments in price on the PNG economy, the PNG Export Weighted Price Index is the more relevant indicator. This shows that mineral prices are up by 2.0 per cent since the beginning of the year but are 2.0 per cent lower in the June quarter 2012 compared to the same time last year.
Figure 3: IMF All Commodity Price Index Figure 4: P NG Export Weighted Index
50
100
150
200
250
50
100
150
200
250
Oct -06 Oct -08 Oct -10 Oct -12
Index 2005=100 Index 2005=100
40
45
50
55
40
45
50
55
Oct-06 Oct-08 Oct-10 Oct-12
Index: 1995=100 Index: 1995=100
Source: International Monetary Fund (IMF) Source: Bank of PNG
The following discussion is centered on the main mineral, petroleum and agricultural commodities that PNG exports.
Copper With less turmoil in the markets and steady progress in the advanced economies at the beginning of the year, copper prices maintained the lofty levels seen at the end of 2011. Prices traded at around US$8,298 per tonne in the first quarter of the year. However this steady state at the beginning did not last for too long before conditions started to deteriorate especially in the top metal consumers China, the euro zone and the US economy. A slowing Chinese economy (the top consumer of copper), intensifying debt woes in the euro-zone and a sluggish US economy weakened global demand for copper resulting in the drop in price to a low of around US$7,251 per tonne in mid June. However despite the falling demand, expectations for central bank stimulus assisted in limiting the slide in copper prices. With this artificially holding up demand, prices were able to be locked in at a trading range of
2013 Budget, Volume 1
16
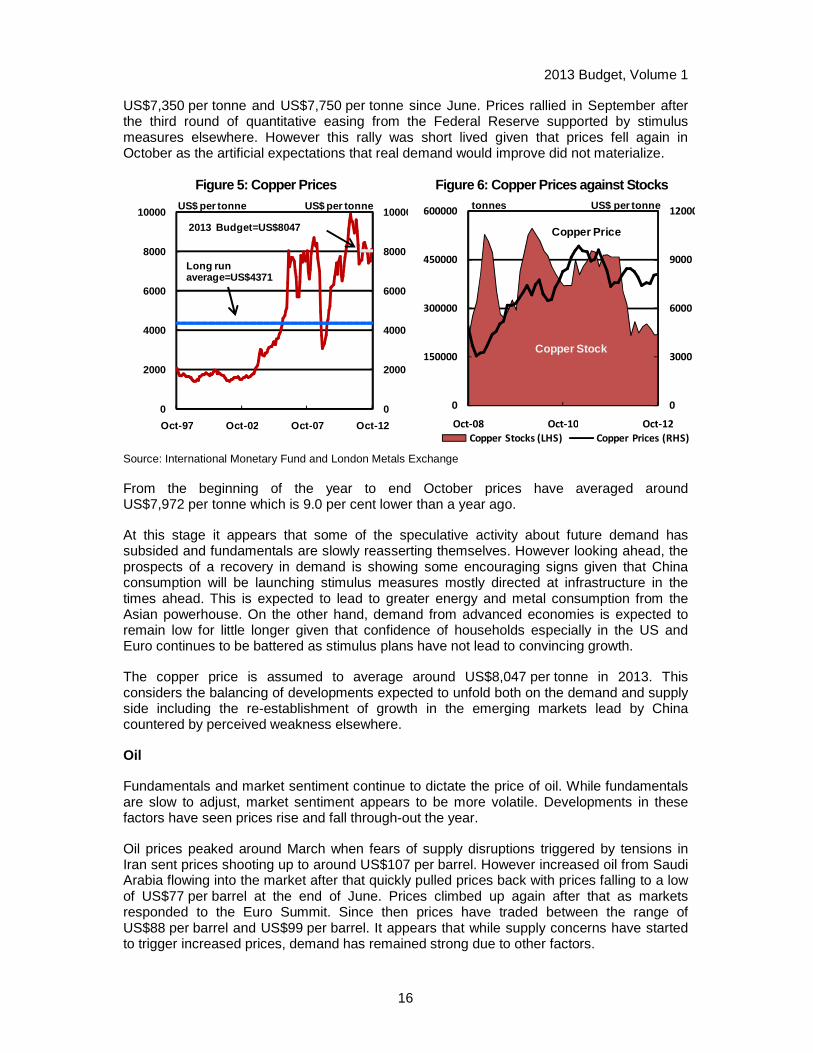
US$7,350 per tonne and US$7,750 per tonne since June. Prices rallied in September after the third round of quantitative easing from the Federal Reserve supported by stimulus measures elsewhere. However this rally was short lived given that prices fell again in October as the artificial expectations that real demand would improve did not materialize.
Figure 5: Copper Prices Figure 6: Copper Prices aga inst Stocks
0
2000
4000
6000
8000
10000
0
2000
4000
6000
8000
10000
Oct -97 Oct -02 Oct -07 Oct -12
Long run average=US$4371
2013 Budget=US$8047
US$ per tonne US$ per tonne
0
3000
6000
9000
12000
0
150000
300000
450000
600000
Oct-08 Oct-10 Oct-12
Copper Stocks (LHS) Copper Prices (RHS)
US$ per tonne
Copper Stock
Copper Price
tonnes
Source: International Monetary Fund and London Metals Exchange
From the beginning of the year to end October prices have averaged around US$7,972 per tonne which is 9.0 per cent lower than a year ago.
At this stage it appears that some of the speculative activity about future demand has subsided and fundamentals are slowly reasserting themselves. However looking ahead, the prospects of a recovery in demand is showing some encouraging signs given that China consumption will be launching stimulus measures mostly directed at infrastructure in the times ahead. This is expected to lead to greater energy and metal consumption from the Asian powerhouse. On the other hand, demand from advanced economies is expected to remain low for little longer given that confidence of households especially in the US and Euro continues to be battered as stimulus plans have not lead to convincing growth.
The copper price is assumed to average around US$8,047 per tonne in 2013. This considers the balancing of developments expected to unfold both on the demand and supply side including the re-establishment of growth in the emerging markets lead by China countered by perceived weakness elsewhere.
Oil
Fundamentals and market sentiment continue to dictate the price of oil. While fundamentals are slow to adjust, market sentiment appears to be more volatile. Developments in these factors have seen prices rise and fall through-out the year.
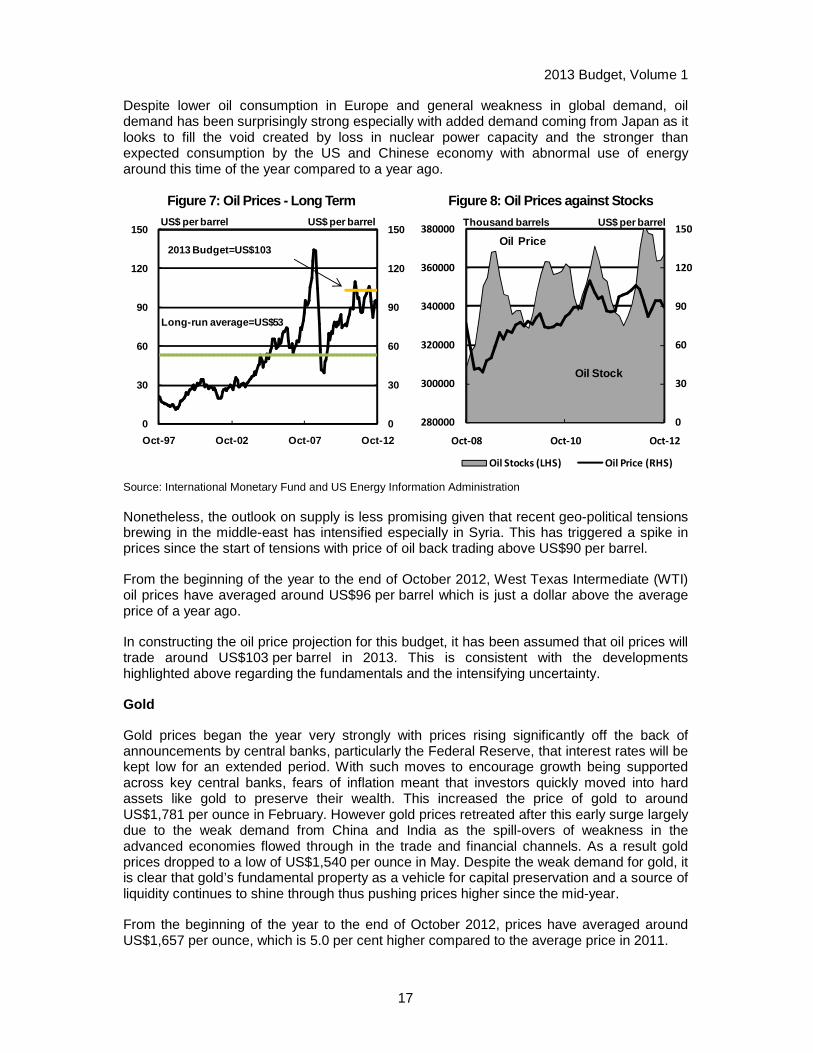
Oil prices peaked around March when fears of supply disruptions triggered by tensions in Iran sent prices shooting up to around US$107 per barrel. However increased oil from Saudi Arabia flowing into the market after that quickly pulled prices back with prices falling to a low of US$77 per barrel at the end of June. Prices climbed up again after that as markets responded to the Euro Summit. Since then prices have traded between the range of US$88 per barrel and US$99 per barrel. It appears that while supply concerns have started to trigger increased prices, demand has remained strong due to other factors.
2013 Budget, Volume 1
17
Despite lower oil consumption in Europe and general weakness in global demand, oil demand has been surprisingly strong especially with added demand coming from Japan as it looks to fill the void created by loss in nuclear power capacity and the stronger than expected consumption by the US and Chinese economy with abnormal use of energy around this time of the year compared to a year ago.
Figure 7: Oil Prices - Long Term Figure 8: Oil Pric es against Stocks
0
30
60
90
120
150
0
30
60
90
120
150
Oct -97 Oct -02 Oct -07 Oct -12
US$ per barrel
2013 Budget=US$103
Long-run average=US$53
US$ per barrel
0
30
60
90
120
150
280000
300000
320000
340000
360000
380000
Oct-08 Oct-10 Oct-12
Oil Stocks (LHS) Oil Price (RHS)
Thousand barrels US$ per barrel
Oil Stock
Oil Price
Source: International Monetary Fund and US Energy Information Administration
Nonetheless, the outlook on supply is less promising given that recent geo-political tensions brewing in the middle-east has intensified especially in Syria. This has triggered a spike in prices since the start of tensions with price of oil back trading above US$90 per barrel.
From the beginning of the year to the end of October 2012, West Texas Intermediate (WTI) oil prices have averaged around US$96 per barrel which is just a dollar above the average price of a year ago.
In constructing the oil price projection for this budget, it has been assumed that oil prices will trade around US$103 per barrel in 2013. This is consistent with the developments highlighted above regarding the fundamentals and the intensifying uncertainty.
Gold
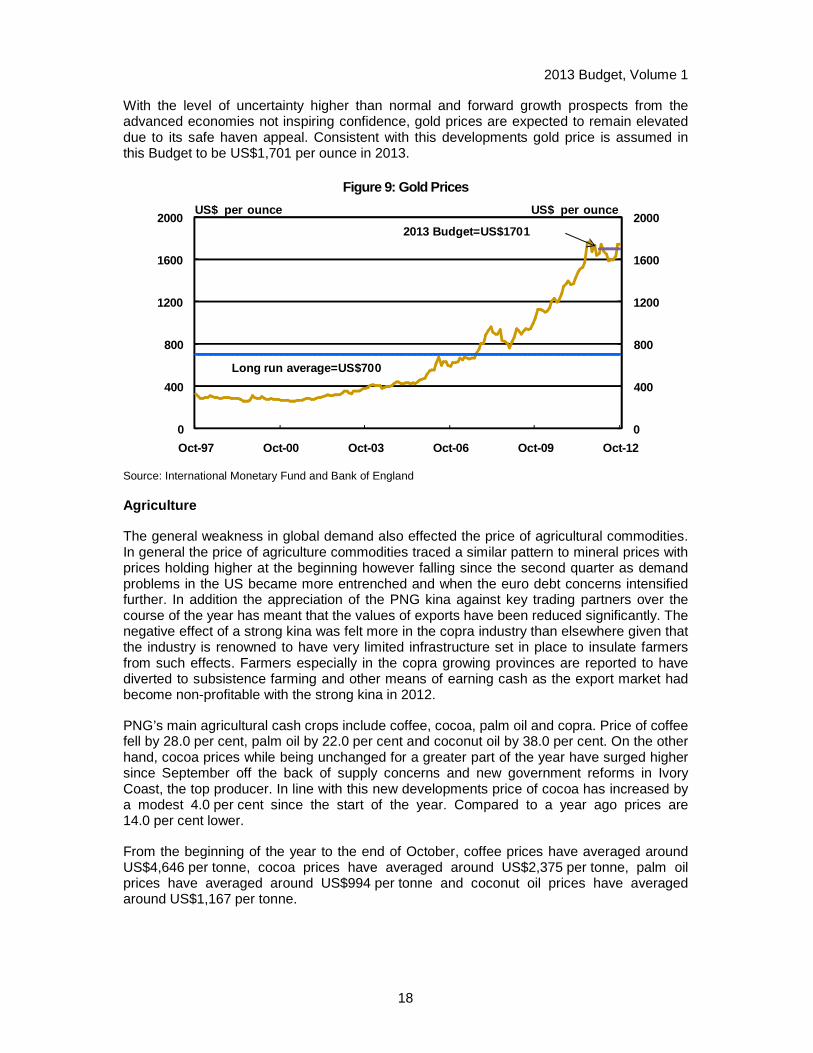
Gold prices began the year very strongly with prices rising significantly off the back of announcements by central banks, particularly the Federal Reserve, that interest rates will be kept low for an extended period. With such moves to encourage growth being supported across key central banks, fears of inflation meant that investors quickly moved into hard assets like gold to preserve their wealth. This increased the price of gold to around US$1,781 per ounce in February. However gold prices retreated after this early surge largely due to the weak demand from China and India as the spill-overs of weakness in the advanced economies flowed through in the trade and financial channels. As a result gold prices dropped to a low of US$1,540 per ounce in May. Despite the weak demand for gold, it is clear that gold’s fundamental property as a vehicle for capital preservation and a source of liquidity continues to shine through thus pushing prices higher since the mid-year.
From the beginning of the year to the end of October 2012, prices have averaged around US$1,657 per ounce, which is 5.0 per cent higher compared to the average price in 2011.
2013 Budget, Volume 1
18
With the level of uncertainty higher than normal and forward growth prospects from the advanced economies not inspiring confidence, gold prices are expected to remain elevated due to its safe haven appeal. Consistent with this developments gold price is assumed in this Budget to be US$1,701 per ounce in 2013.
Figure 9: Gold Prices
0
400
800
1200
1600
2000
0
400
800
1200
1600
2000
Oct-97 Oct-00 Oct-03 Oct-06 Oct-09 Oct-12
US$ per ounce US$ per ounce
2013 Budget=US$1701
Long run average=US$700
Source: International Monetary Fund and Bank of England
Agriculture
The general weakness in global demand also effected the price of agricultural commodities. In general the price of agriculture commodities traced a similar pattern to mineral prices with prices holding higher at the beginning however falling since the second quarter as demand problems in the US became more entrenched and when the euro debt concerns intensified further. In addition the appreciation of the PNG kina against key trading partners over the course of the year has meant that the values of exports have been reduced significantly. The negative effect of a strong kina was felt more in the copra industry than elsewhere given that the industry is renowned to have very limited infrastructure set in place to insulate farmers from such effects. Farmers especially in the copra growing provinces are reported to have diverted to subsistence farming and other means of earning cash as the export market had become non-profitable with the strong kina in 2012.
PNG’s main agricultural cash crops include coffee, cocoa, palm oil and copra. Price of coffee fell by 28.0 per cent, palm oil by 22.0 per cent and coconut oil by 38.0 per cent. On the other hand, cocoa prices while being unchanged for a greater part of the year have surged higher since September off the back of supply concerns and new government reforms in Ivory Coast, the top producer. In line with this new developments price of cocoa has increased by a modest 4.0 per cent since the start of the year. Compared to a year ago prices are 14.0 per cent lower.
From the beginning of the year to the end of October, coffee prices have averaged around US$4,646 per tonne, cocoa prices have averaged around US$2,375 per tonne, palm oil prices have averaged around US$994 per tonne and coconut oil prices have averaged around US$1,167 per tonne.
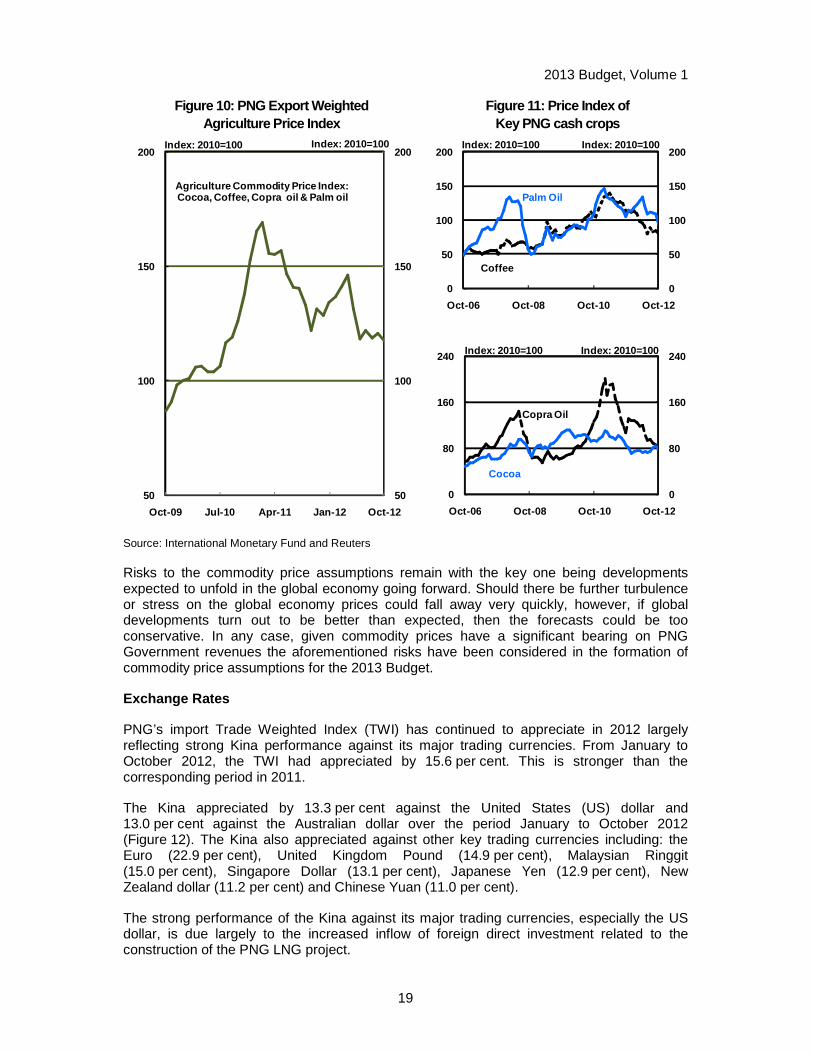
2013 Budget, Volume 1
19
Figure 10: PNG Export Weighted Agriculture Price Index
Figure 11: Price Index of Key PNG cash crops
50
100
150
200
50
100
150
200
Oct -09 Jul -10 Apr -11 Jan -12 Oct -12
Index: 2010=100 Index: 2010=100
Agriculture Commodity Price Index: Cocoa, Coffee, Copra oil & Palm oil
0
50
100
150
200
0
50
100
150
200
Oct -06 Oct -08 Oct -10 Oct -12
Index: 2010=100 Index: 2010=100
Coffee
Palm Oil
0
80
160
240
0
80
160
240
Oct -06 Oct -08 Oct -10 Oct -12
Index: 2010=100 Index: 2010=100
Copra Oil
Cocoa
Source: International Monetary Fund and Reuters
Risks to the commodity price assumptions remain with the key one being developments expected to unfold in the global economy going forward. Should there be further turbulence or stress on the global economy prices could fall away very quickly, however, if global developments turn out to be better than expected, then the forecasts could be too conservative. In any case, given commodity prices have a significant bearing on PNG Government revenues the aforementioned risks have been considered in the formation of commodity price assumptions for the 2013 Budget.
Exchange Rates
PNG’s import Trade Weighted Index (TWI) has continued to appreciate in 2012 largely reflecting strong Kina performance against its major trading currencies. From January to October 2012, the TWI had appreciated by 15.6 per cent. This is stronger than the corresponding period in 2011.
The Kina appreciated by 13.3 per cent against the United States (US) dollar and 13.0 per cent against the Australian dollar over the period January to October 2012 (Figure 12). The Kina also appreciated against other key trading currencies including: the Euro (22.9 per cent), United Kingdom Pound (14.9 per cent), Malaysian Ringgit (15.0 per cent), Singapore Dollar (13.1 per cent), Japanese Yen (12.9 per cent), New Zealand dollar (11.2 per cent) and Chinese Yuan (11.0 per cent).
The strong performance of the Kina against its major trading currencies, especially the US dollar, is due largely to the increased inflow of foreign direct investment related to the construction of the PNG LNG project.
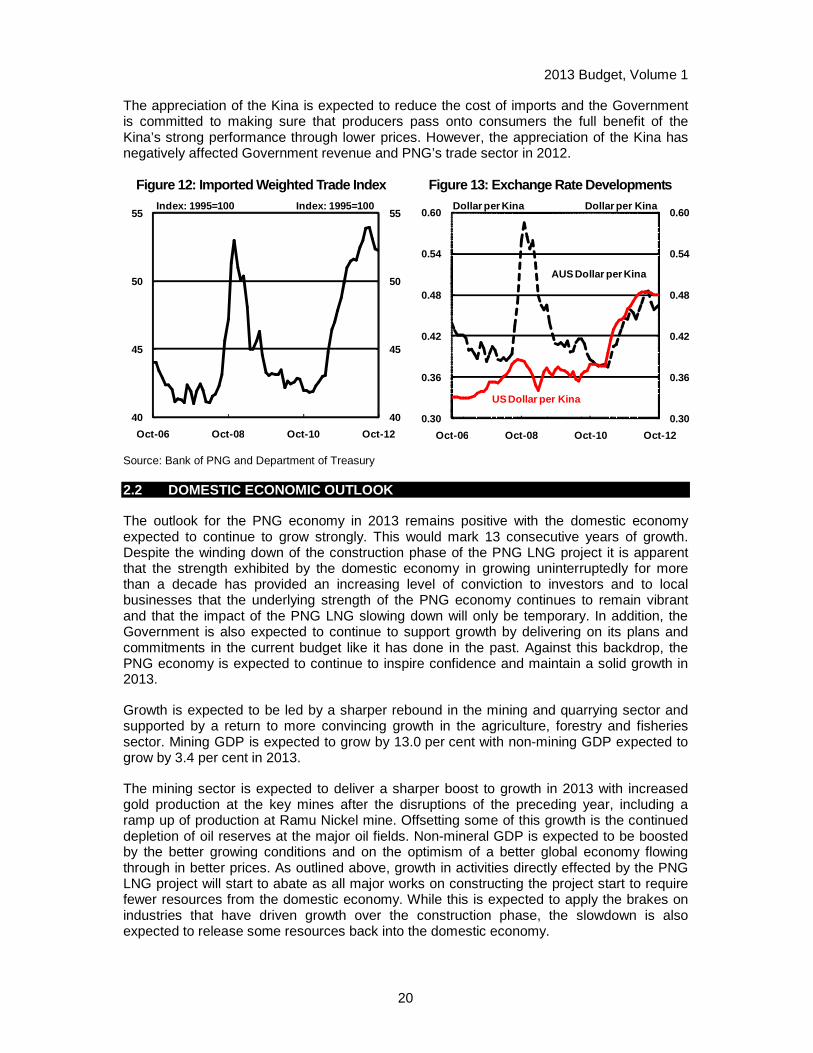
2013 Budget, Volume 1
20
The appreciation of the Kina is expected to reduce the cost of imports and the Government is committed to making sure that producers pass onto consumers the full benefit of the Kina’s strong performance through lower prices. However, the appreciation of the Kina has negatively affected Government revenue and PNG’s trade sector in 2012.
Figure 12: Imported Weighted Trade Index Figure 13: Exchange Rate Developments
40
45
50
55
40
45
50
55
Oct -06 Oct -08 Oct -10 Oct -12
Index: 1995=100 Index: 1995=100
0.30
0.36
0.42
0.48
0.54
0.60
0.30
0.36
0.42
0.48
0.54
0.60
Oct -06 Oct -08 Oct -10 Oct -12
Dollar per Kina Dollar per Kina
USDollar per Kina
AUS Dollar per Kina
Source: Bank of PNG and Department of Treasury
2.2 DOMESTIC ECONOMIC OUTLOOK
The outlook for the PNG economy in 2013 remains positive with the domestic economy expected to continue to grow strongly. This would mark 13 consecutive years of growth. Despite the winding down of the construction phase of the PNG LNG project it is apparent that the strength exhibited by the domestic economy in growing uninterruptedly for more than a decade has provided an increasing level of conviction to investors and to local businesses that the underlying strength of the PNG economy continues to remain vibrant and that the impact of the PNG LNG slowing down will only be temporary. In addition, the Government is also expected to continue to support growth by delivering on its plans and commitments in the current budget like it has done in the past. Against this backdrop, the PNG economy is expected to continue to inspire confidence and maintain a solid growth in 2013.
Growth is expected to be led by a sharper rebound in the mining and quarrying sector and supported by a return to more convincing growth in the agriculture, forestry and fisheries sector. Mining GDP is expected to grow by 13.0 per cent with non-mining GDP expected to grow by 3.4 per cent in 2013.
The mining sector is expected to deliver a sharper boost to growth in 2013 with increased gold production at the key mines after the disruptions of the preceding year, including a ramp up of production at Ramu Nickel mine. Offsetting some of this growth is the continued depletion of oil reserves at the major oil fields. Non-mineral GDP is expected to be boosted by the better growing conditions and on the optimism of a better global economy flowing through in better prices. As outlined above, growth in activities directly effected by the PNG LNG project will start to abate as all major works on constructing the project start to require fewer resources from the domestic economy. While this is expected to apply the brakes on industries that have driven growth over the construction phase, the slowdown is also expected to release some resources back into the domestic economy.

2013 Budget, Volume 1
21
The PNG economy has continued to grow strongly in 2012 with most industries still riding the wave of benefits association with the PNG LNG construction phase. For most, the direct benefits include the provision of goods and services to the project while the flow through of increased spending continues to raise incomes and consumption spending in the domestic economy.
On the other hand several factors have also reduced this growth including the lower commodity prices and the appreciation of the Kina. In addition disruptions faced by key gold mines through-out the course of the year have downgraded gold production while the depletion of oil fields continues to weigh down on production. Growth in the agriculture, forestry and fisheries sector has also felt the negative effects of weaker prices, a strong Kina and unfavorable growing conditions. This has significantly weakened activity in 2012.
Inflation is expected to be 4.1 per cent during the year in 2012 due to the positive impacts of a strong Kina and Government policies including the tariff reduction program and the free education policy.
2.3 GROSS DOMESTIC PRODUCT
2011 Update
The PNG economy grew at a record pace of 11.1 per cent in 2011. The strong growth was attributed to increased momentum of the PNG LNG project construction activities and strong agricultural production supported by high commodity prices.
The PNG LNG project construction activities continued to provide a significant boost to the PNG economy, as the project’s construction activities gained momentum with increased capital expenditures and more man hours worked at key construction sites in 2011. These PNG LNG Project construction activities also had associated spin off benefits noticeable in the transport, storage and communication sector, the wholesale and retail sector and the manufacturing sector. Reports gathered from Treasury’s discussions with key stakeholders including the Bank of Papua New Guinea confirmed that sales and production activity in these sectors grew at record rates during the year.
The other contributing factor to the impressive growth in 2011 was strong agriculture production due to a combination of favorable growing conditions and high commodity prices. Coffee recorded its highest annual production during the year as the crop experienced one of its most favorable growing conditions (due to fine weather) producing a bumper harvest during the year. In addition, coffee prices nudged record levels during the year providing added incentive for farmers to mobilize coffee elsewhere especially in remote areas and bring to the market. All this pushed production up to a record 1.4 million bags for the year which was the highest ever seen.
Furthermore, production of other key cash crops including copra and palm oil also expanded during the year supported by higher than expected prices and better growing conditions. Cocoa production which had remained depressed over the past two years due to the ‘cocoa pod borer’ picked up in areas outside of East New Britain especially in Bougainville and the Momase region. Overall, better prices and growing conditions significantly boosted the output from the Agriculture/Fisheries/Agriculture sector enabling the sector to grow at an exceptional 8.0 per cent in 2011, the strongest growth recorded since records were kept.
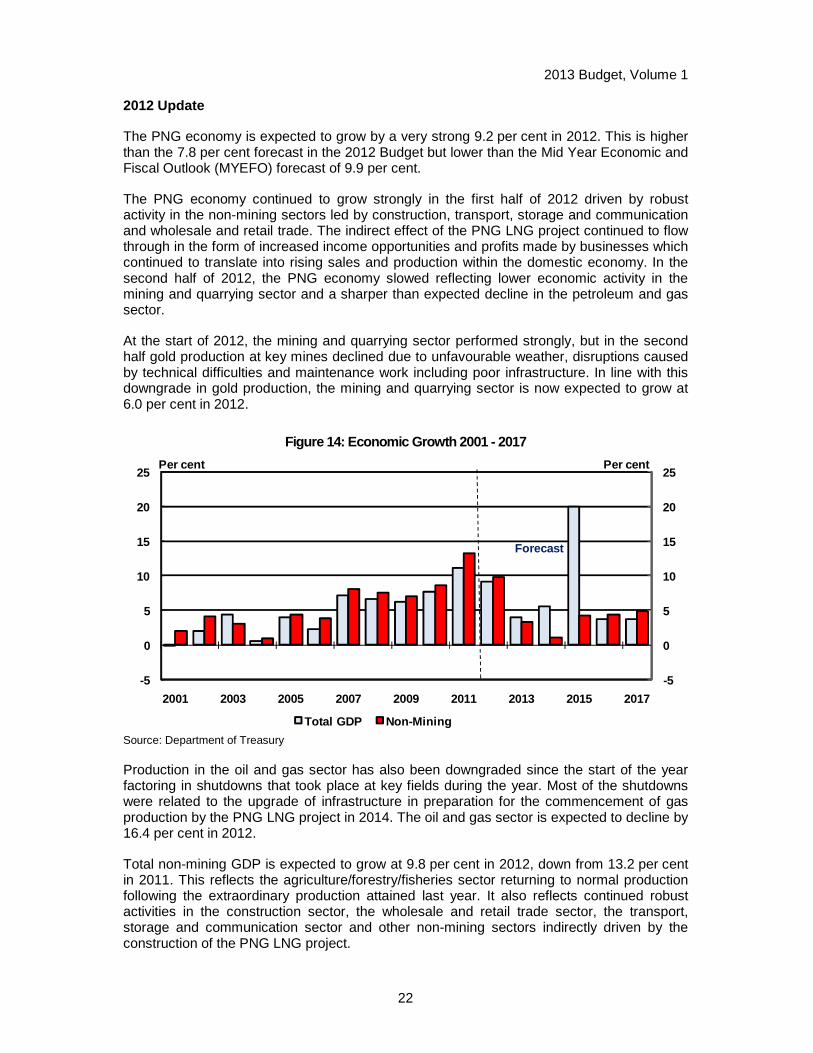
2013 Budget, Volume 1
22
2012 Update
The PNG economy is expected to grow by a very strong 9.2 per cent in 2012. This is higher than the 7.8 per cent forecast in the 2012 Budget but lower than the Mid Year Economic and Fiscal Outlook (MYEFO) forecast of 9.9 per cent.
The PNG economy continued to grow strongly in the first half of 2012 driven by robust activity in the non-mining sectors led by construction, transport, storage and communication and wholesale and retail trade. The indirect effect of the PNG LNG project continued to flow through in the form of increased income opportunities and profits made by businesses which continued to translate into rising sales and production within the domestic economy. In the second half of 2012, the PNG economy slowed reflecting lower economic activity in the mining and quarrying sector and a sharper than expected decline in the petroleum and gas sector.
At the start of 2012, the mining and quarrying sector performed strongly, but in the second half gold production at key mines declined due to unfavourable weather, disruptions caused by technical difficulties and maintenance work including poor infrastructure. In line with this downgrade in gold production, the mining and quarrying sector is now expected to grow at 6.0 per cent in 2012.
Figure 14: Economic Growth 2001 - 2017
-5
0
5
10
15
20
25
-5
0
5
10
15
20
25
2001 2003 2005 2007 2009 2011 2013 2015 2017
Total GDP Non-Mining
Per cent Per cent
Forecast
Source: Department of Treasury
Production in the oil and gas sector has also been downgraded since the start of the year factoring in shutdowns that took place at key fields during the year. Most of the shutdowns were related to the upgrade of infrastructure in preparation for the commencement of gas production by the PNG LNG project in 2014. The oil and gas sector is expected to decline by 16.4 per cent in 2012.
Total non-mining GDP is expected to grow at 9.8 per cent in 2012, down from 13.2 per cent in 2011. This reflects the agriculture/forestry/fisheries sector returning to normal production following the extraordinary production attained last year. It also reflects continued robust activities in the construction sector, the wholesale and retail trade sector, the transport, storage and communication sector and other non-mining sectors indirectly driven by the construction of the PNG LNG project.

2013 Budget, Volume 1
23
The construction sector is expected to grow at 24 per cent in 2012. The PNG LNG project is the driving force behind this strong construction sector growth. The PNG LNG project construction has accomplished various milestones set for 2012. These milestones included completing (1) the offshore pipeline (EPC2) with the installation of the 407 kilometre offshore pipeline, (2) the LNG Plant and Marine Facilities (EPC3) with the completing of the 2.4 kilometre jetty trestle, plus the north and south LNG tank outer shells and roof installation, (3) the Drilling site at Wellpad B with over 80 per cent of the Drilling Rig 702 set up, (4) the Komo Airfield (EPC5B) with more than 800 metres of runway length completed and (5) associated gas development like the completion of the commissioning and performance testing of the Triethylene glycol unit and associated gas cooler at the Kutubu Central Processing Facility.
In addition the continued strong growth of the PNG economy has instilled a lot of confidence in the private sector which continues to lead to strong business investment. This is showing up in the increase in the construction of infrastructure in the domestic economy, especially in the major cities of Port Moresby and Lae. While this continues to provide a significant boost to the economy, the rapid pace of growth experienced over the past two years has placed a lot of strain on the limited supply of skilled labour and available land in the economy. In order to support the growth, businesses have had to seek skilled labour from abroad.
The wholesale and retail trade sector is expected to grow by a strong 15.0 per cent in 2012. This continues to reflect the flow through of the indirect effects of the PNG LNG project. According to discussions held with the business community and the Bank of Papua New Guinea, sales and turnover remain very healthy in the economy due largely to additional activity that the PNG LNG continues to generate in the economy. In addition the increase in election related spending during the election period contributed to the strong performance of the sector in the year.
The transport, storage and communication sector is expected to grow at 16.0 per cent in 2012, the same pace at which the sector grew at in 2011. Growth in the communication industry is expected to continue to grow, due to strong mobile phone growth. The growth in the transport and storage sector is expected to continue to grow, due activity associated with the movement of PNG LNG cargo and the increase in general economic activity.
The electricity, gas and water sector is expected to grow at 12.0 per cent in 2012. Demand for utilities has increased significantly with the increase in population and the growing domestic economy. Utility providers have seen an increase in profits largely as a result of increased demand as an increasing number of new businesses and households get connected to electricity and water. The price of utilities continues to be controlled by the Independent Consumer Competing Commission (ICCC) and any change depends on the different agreements the utility providers have with the regulator. The strong growth of the economy has also led to capacity issues facing the distribution of electricity and water with domestic demand already exceeding capacity of utility providers. This is a concern as it continues to lead to illegal connections of electricity and water in many parts of the urban areas.
The manufacturing sector is expected to grow at a strong 10.0 per cent in 2012. This strong growth is driven by the continued increase in domestic demand fuelled by the PNG LNG project. Increased growth in employment and the rise in incomes are translating into increased domestic spending and this is finding its way into the strong sales activity as reported by firms in the sector. The positive effects of the rising Kina against key partners have also supported growth in 2012.
The finance, real estate and business services sector is expected to grow by 10.0 per cent in 2012. While growth has been driven by the increase in financial transactions associated with
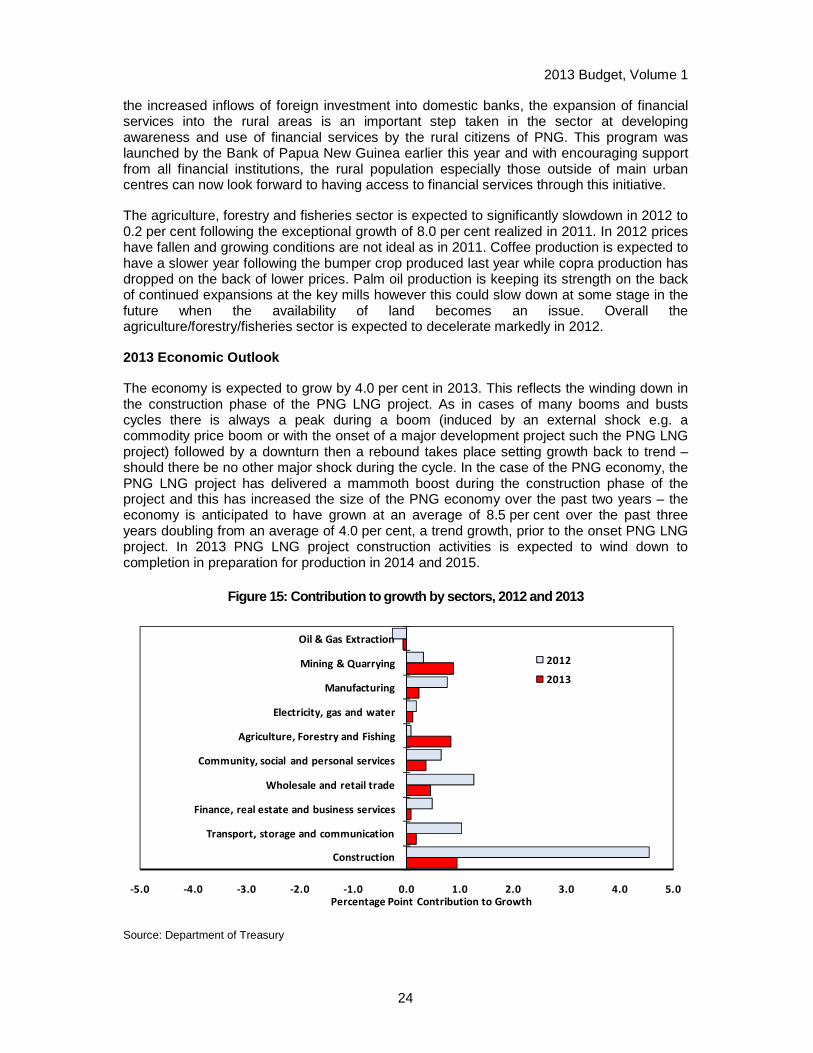
2013 Budget, Volume 1
24
the increased inflows of foreign investment into domestic banks, the expansion of financial services into the rural areas is an important step taken in the sector at developing awareness and use of financial services by the rural citizens of PNG. This program was launched by the Bank of Papua New Guinea earlier this year and with encouraging support from all financial institutions, the rural population especially those outside of main urban centres can now look forward to having access to financial services through this initiative.
The agriculture, forestry and fisheries sector is expected to significantly slowdown in 2012 to 0.2 per cent following the exceptional growth of 8.0 per cent realized in 2011. In 2012 prices have fallen and growing conditions are not ideal as in 2011. Coffee production is expected to have a slower year following the bumper crop produced last year while copra production has dropped on the back of lower prices. Palm oil production is keeping its strength on the back of continued expansions at the key mills however this could slow down at some stage in the future when the availability of land becomes an issue. Overall the agriculture/forestry/fisheries sector is expected to decelerate markedly in 2012.
2013 Economic Outlook
The economy is expected to grow by 4.0 per cent in 2013. This reflects the winding down in the construction phase of the PNG LNG project. As in cases of many booms and busts cycles there is always a peak during a boom (induced by an external shock e.g. a commodity price boom or with the onset of a major development project such the PNG LNG project) followed by a downturn then a rebound takes place setting growth back to trend – should there be no other major shock during the cycle. In the case of the PNG economy, the PNG LNG project has delivered a mammoth boost during the construction phase of the project and this has increased the size of the PNG economy over the past two years – the economy is anticipated to have grown at an average of 8.5 per cent over the past three years doubling from an average of 4.0 per cent, a trend growth, prior to the onset PNG LNG project. In 2013 PNG LNG project construction activities is expected to wind down to completion in preparation for production in 2014 and 2015.
Figure 15: Contribution to growth by sectors, 2012 and 2013
-5.0 -4.0 -3.0 -2.0 -1.0 0.0 1.0 2.0 3.0 4.0 5.0
Transport, storage and communication
Finance, real estate and business services
Wholesale and retail trade
Community, social and personal services
Agriculture, Forestry and Fishing
Electricity, gas and water
Manufacturing
Mining & Quarrying
Oil & Gas Extraction
2012
2013
Percentage Point Contribution to Growth
Construction
Source: Department of Treasury
2013 Budget, Volume 1
25
The winding down of the PNG LNG project construction activities is expected to be most profound in sectors which have led growth over the past two years including the construction, transport, storage, manufacturing and communication and wholesale and retail trade. These sectors have benefited hugely from the direct impacts flowing through from the project which included the increased spending on locally produced goods and services, hiring of equipment and engagement of small to medium business in the project, movement of cargo, and recruitment of local labour. In 2013 the flow through of the impact of the PNG LNG project in these sectors will start to abate as most of the construction activity will have been completed leaving very little work left to do. The need for additional resources will not be there anymore hence activity is expected to be reduced significantly and it is likely that resources will be freed up for use elsewhere in the economy.
The construction sector is expected to slow down from 24.0 per cent in 2012 to 4.4 per cent in 2013, transport storage and communication sector from 16.0 per cent to 2.6 per cent and the wholesale and retail trade sector moderating from 15.0 per cent to 5.0 per cent. This trend is also expected to be displayed across the other non-mining sectors including manufacturing, electricity gas and water, finance and real estate and community, social and personal services.
Despite the temporary slowdown in most non-mining sectors, the agriculture/forestry/fisheries sector is expected to rebound and grow at 2.8 per cent in 2013 following the depressed levels of activity experienced in 2012. Prices are expected to perform better on the assumption that global demand improves and production is also anticipated to increase as growing conditions are expected to be better than what they have been in 2012. In addition it is also anticipated that by 2013 some of the key projects like the Productive Partnership in Agriculture (PPAP) will have set up its administrative infrastructures and will commence resulting in rehabilitation of plantations. The effect of the project at the time of 2012 Budget was anticipated to kick in by 2012, however with new information on the delays associated with the administration of the project, PPAP is now expected to have a small effect in 2013 and gradually increasing in the outer years when all infrastructure has been set up.
The mining sector is expected to rebound and grow at a strong 17.8 per cent in 2013. This reflects the rebound in gold production at key mines after the disruptions encountered in 2011. Nickel production is also expected to ramp up to half of full capacity lifting total output from the sector in 2013.
The petroleum sector is expected to continue to decline by 6.0 per cent in 2013 as the oil fields continue to be depleted.
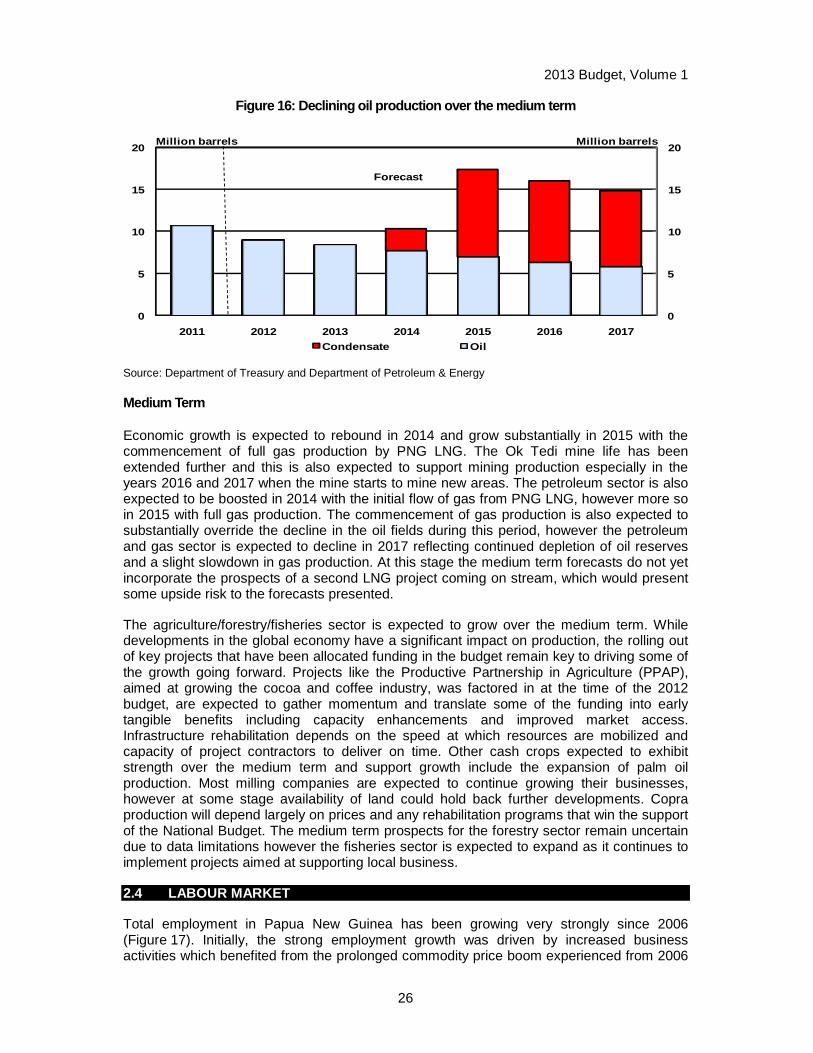
2013 Budget, Volume 1
26
Figure 16: Declining oil production over the medium term
0
5
10
15
20
0
5
10
15
20
2011 2012 2013 2014 2015 2016 2017
Condensate Oil
Million barrels Million barrels
Forecast
Source: Department of Treasury and Department of Petroleum & Energy
Medium Term
Economic growth is expected to rebound in 2014 and grow substantially in 2015 with the commencement of full gas production by PNG LNG. The Ok Tedi mine life has been extended further and this is also expected to support mining production especially in the years 2016 and 2017 when the mine starts to mine new areas. The petroleum sector is also expected to be boosted in 2014 with the initial flow of gas from PNG LNG, however more so in 2015 with full gas production. The commencement of gas production is also expected to substantially override the decline in the oil fields during this period, however the petroleum and gas sector is expected to decline in 2017 reflecting continued depletion of oil reserves and a slight slowdown in gas production. At this stage the medium term forecasts do not yet incorporate the prospects of a second LNG project coming on stream, which would present some upside risk to the forecasts presented.
The agriculture/forestry/fisheries sector is expected to grow over the medium term. While developments in the global economy have a significant impact on production, the rolling out of key projects that have been allocated funding in the budget remain key to driving some of the growth going forward. Projects like the Productive Partnership in Agriculture (PPAP), aimed at growing the cocoa and coffee industry, was factored in at the time of the 2012 budget, are expected to gather momentum and translate some of the funding into early tangible benefits including capacity enhancements and improved market access. Infrastructure rehabilitation depends on the speed at which resources are mobilized and capacity of project contractors to deliver on time. Other cash crops expected to exhibit strength over the medium term and support growth include the expansion of palm oil production. Most milling companies are expected to continue growing their businesses, however at some stage availability of land could hold back further developments. Copra production will depend largely on prices and any rehabilitation programs that win the support of the National Budget. The medium term prospects for the forestry sector remain uncertain due to data limitations however the fisheries sector is expected to expand as it continues to implement projects aimed at supporting local business.
2.4 LABOUR MARKET
Total employment in Papua New Guinea has been growing very strongly since 2006 (Figure 17). Initially, the strong employment growth was driven by increased business activities which benefited from the prolonged commodity price boom experienced from 2006
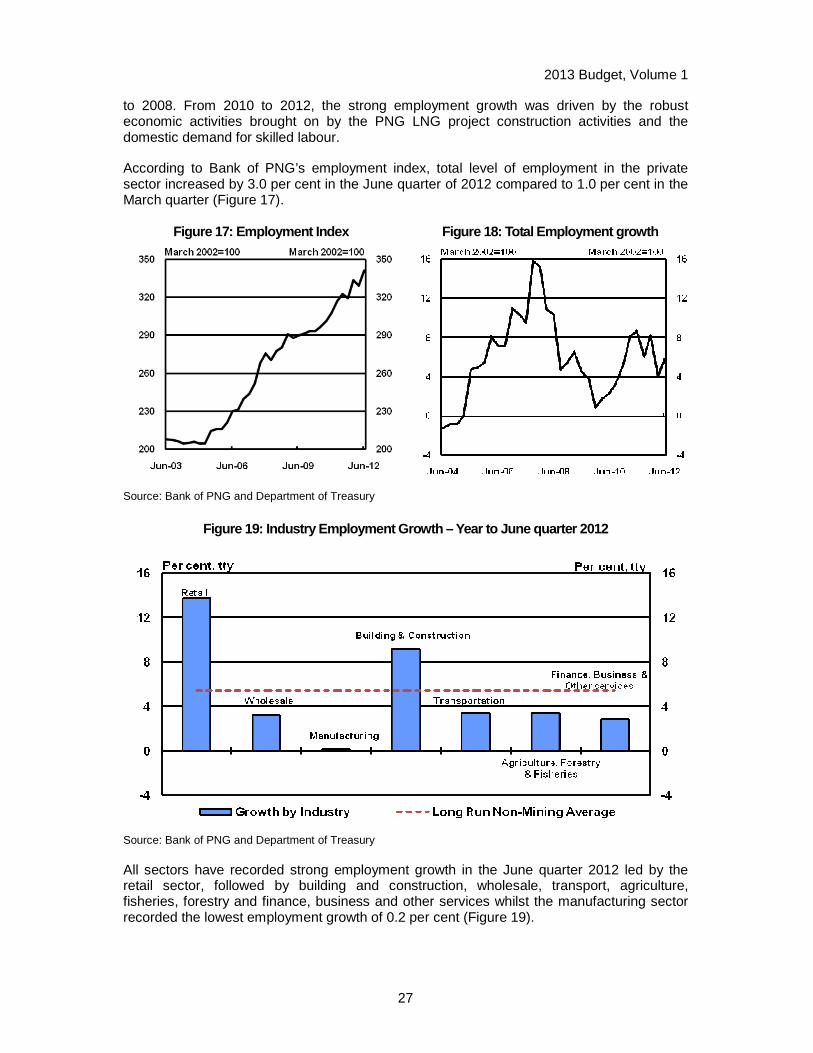
2013 Budget, Volume 1
27
to 2008. From 2010 to 2012, the strong employment growth was driven by the robust economic activities brought on by the PNG LNG project construction activities and the domestic demand for skilled labour.
According to Bank of PNG’s employment index, total level of employment in the private sector increased by 3.0 per cent in the June quarter of 2012 compared to 1.0 per cent in the March quarter (Figure 17).
Figure 17: Employment Index Figure 18: Total Employ ment growth
Source: Bank of PNG and Department of Treasury
Figure 19: Industry Employment Growth – Year to Jun e quarter 2012
Source: Bank of PNG and Department of Treasury
All sectors have recorded strong employment growth in the June quarter 2012 led by the retail sector, followed by building and construction, wholesale, transport, agriculture, fisheries, forestry and finance, business and other services whilst the manufacturing sector recorded the lowest employment growth of 0.2 per cent (Figure 19).
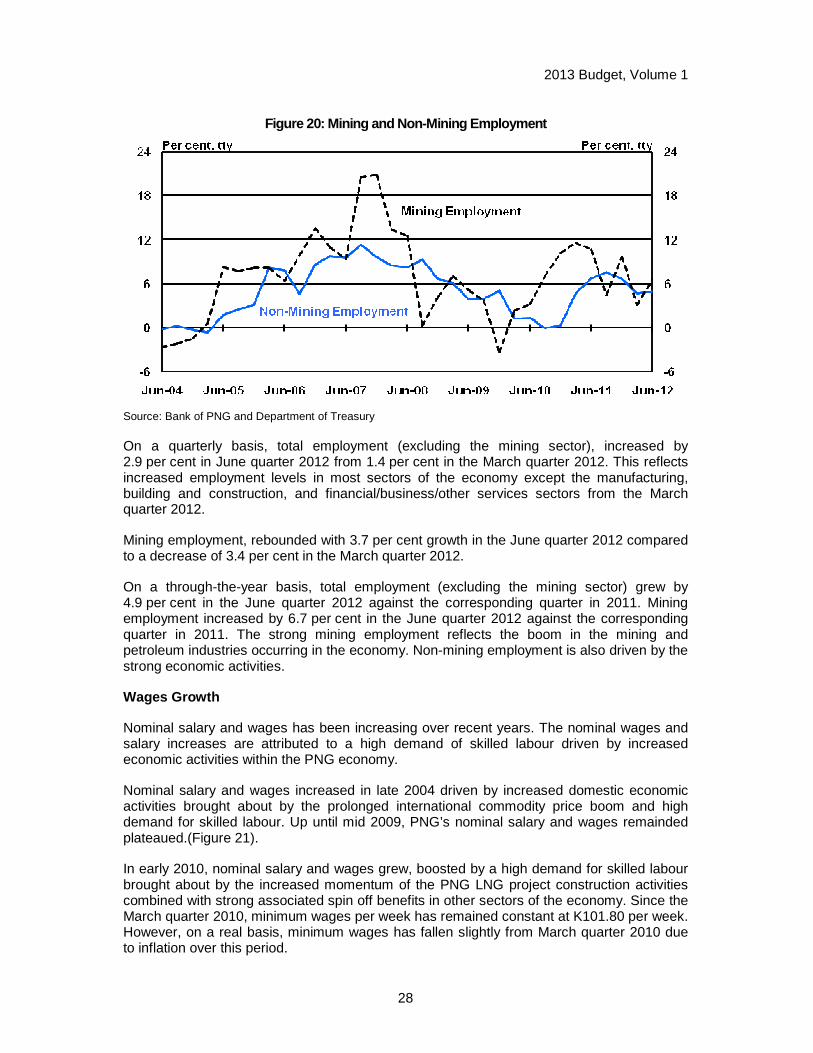
2013 Budget, Volume 1
28
Figure 20: Mining and Non-Mining Employment
Source: Bank of PNG and Department of Treasury
On a quarterly basis, total employment (excluding the mining sector), increased by 2.9 per cent in June quarter 2012 from 1.4 per cent in the March quarter 2012. This reflects increased employment levels in most sectors of the economy except the manufacturing, building and construction, and financial/business/other services sectors from the March quarter 2012.
Mining employment, rebounded with 3.7 per cent growth in the June quarter 2012 compared to a decrease of 3.4 per cent in the March quarter 2012.
On a through-the-year basis, total employment (excluding the mining sector) grew by 4.9 per cent in the June quarter 2012 against the corresponding quarter in 2011. Mining employment increased by 6.7 per cent in the June quarter 2012 against the corresponding quarter in 2011. The strong mining employment reflects the boom in the mining and petroleum industries occurring in the economy. Non-mining employment is also driven by the strong economic activities.
Wages Growth
Nominal salary and wages has been increasing over recent years. The nominal wages and salary increases are attributed to a high demand of skilled labour driven by increased economic activities within the PNG economy.
Nominal salary and wages increased in late 2004 driven by increased domestic economic activities brought about by the prolonged international commodity price boom and high demand for skilled labour. Up until mid 2009, PNG’s nominal salary and wages remainded plateaued.(Figure 21).
In early 2010, nominal salary and wages grew, boosted by a high demand for skilled labour brought about by the increased momentum of the PNG LNG project construction activities combined with strong associated spin off benefits in other sectors of the economy. Since the March quarter 2010, minimum wages per week has remained constant at K101.80 per week. However, on a real basis, minimum wages has fallen slightly from March quarter 2010 due to inflation over this period.
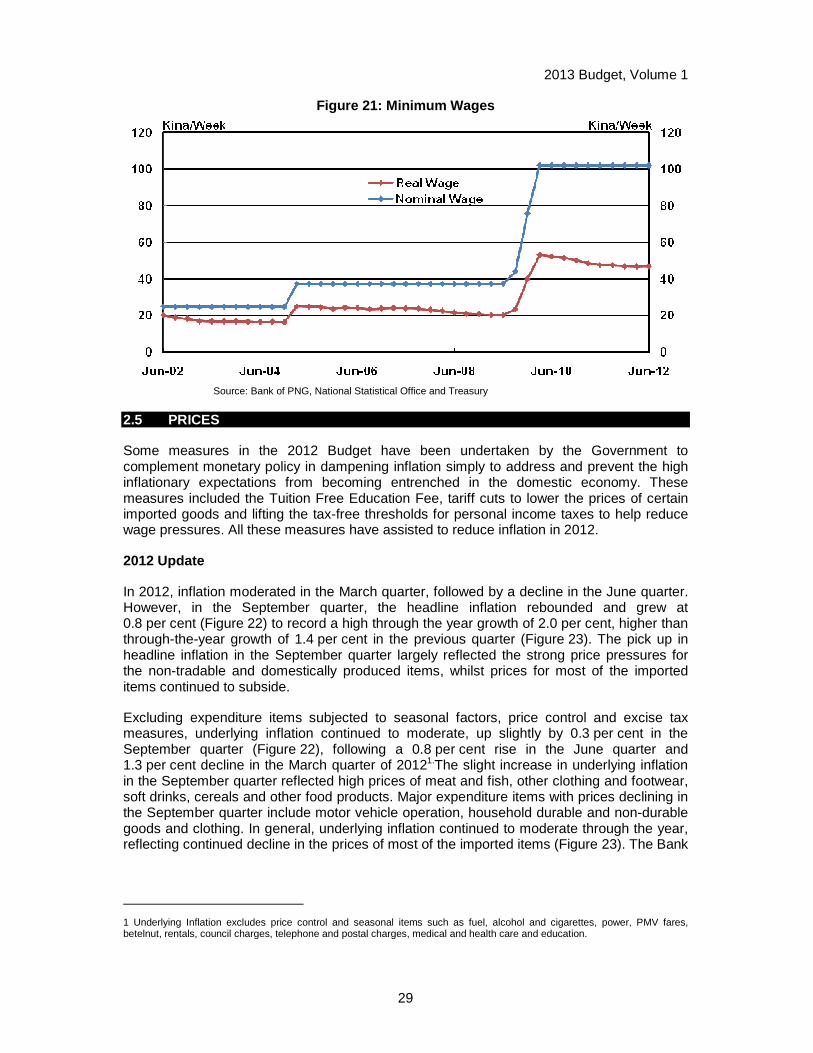
2013 Budget, Volume 1
29
Figure 21: Minimum Wages
Source: Bank of PNG, National Statistical Office and Treasury
2.5 PRICES
Some measures in the 2012 Budget have been undertaken by the Government to complement monetary policy in dampening inflation simply to address and prevent the high inflationary expectations from becoming entrenched in the domestic economy. These measures included the Tuition Free Education Fee, tariff cuts to lower the prices of certain imported goods and lifting the tax-free thresholds for personal income taxes to help reduce wage pressures. All these measures have assisted to reduce inflation in 2012.
2012 Update
In 2012, inflation moderated in the March quarter, followed by a decline in the June quarter. However, in the September quarter, the headline inflation rebounded and grew at 0.8 per cent (Figure 22) to record a high through the year growth of 2.0 per cent, higher than through-the-year growth of 1.4 per cent in the previous quarter (Figure 23). The pick up in headline inflation in the September quarter largely reflected the strong price pressures for the non-tradable and domestically produced items, whilst prices for most of the imported items continued to subside.
Excluding expenditure items subjected to seasonal factors, price control and excise tax measures, underlying inflation continued to moderate, up slightly by 0.3 per cent in the September quarter (Figure 22), following a 0.8 per cent rise in the June quarter and 1.3 per cent decline in the March quarter of 20121.The slight increase in underlying inflation in the September quarter reflected high prices of meat and fish, other clothing and footwear, soft drinks, cereals and other food products. Major expenditure items with prices declining in the September quarter include motor vehicle operation, household durable and non-durable goods and clothing. In general, underlying inflation continued to moderate through the year, reflecting continued decline in the prices of most of the imported items (Figure 23). The Bank
1 Underlying Inflation excludes price control and seasonal items such as fuel, alcohol and cigarettes, power, PMV fares, betelnut, rentals, council charges, telephone and postal charges, medical and health care and education.
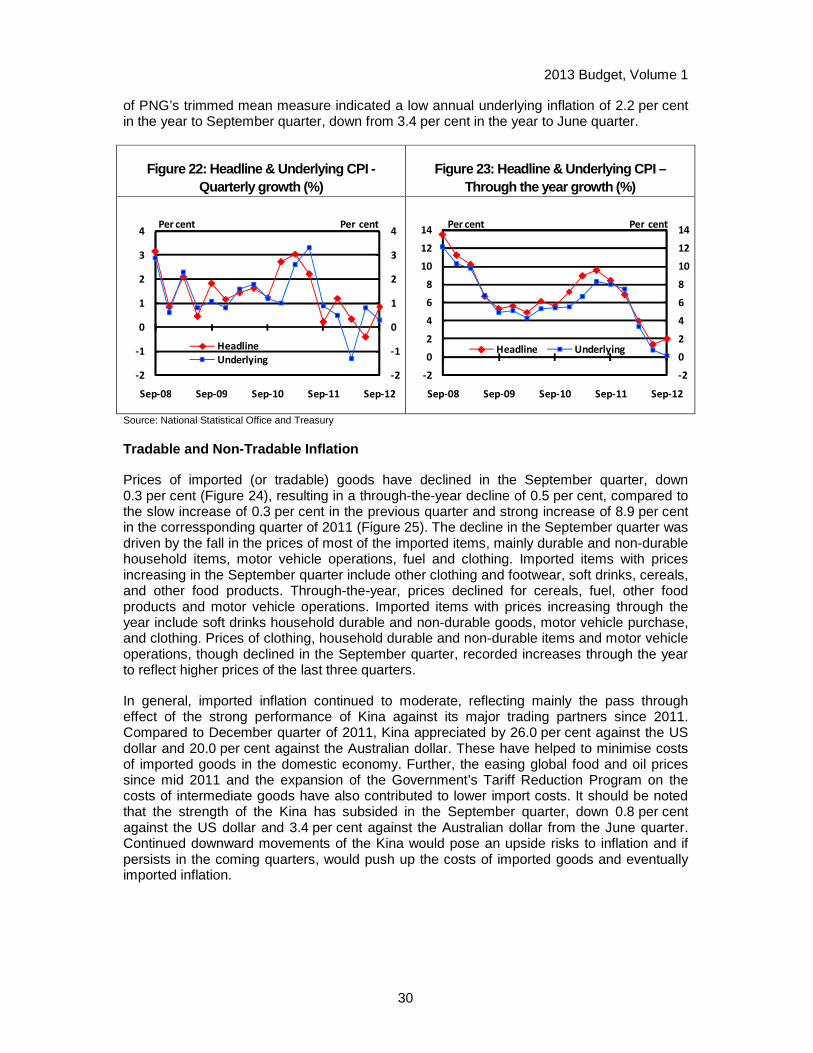
2013 Budget, Volume 1
30
of PNG’s trimmed mean measure indicated a low annual underlying inflation of 2.2 per cent in the year to September quarter, down from 3.4 per cent in the year to June quarter.
Figure 22: Headline & Underlying CPI - Quarterly growth (%)
Figure 23: Headline & Underlying CPI – Through the year growth (%)
-2
-1
0
1
2
3
4
-2
-1
0
1
2
3
4
Sep-08 Sep-09 Sep-10 Sep-11 Sep-12
Headline
Underlying
Per cent Per cent
-2
0
2
4
6
8
10
12
14
-2
0
2
4
6
8
10
12
14
Sep-08 Sep-09 Sep-10 Sep-11 Sep-12
Headline Underlying
Per cent Per cent
Source: National Statistical Office and Treasury
Tradable and Non-Tradable Inflation
Prices of imported (or tradable) goods have declined in the September quarter, down 0.3 per cent (Figure 24), resulting in a through-the-year decline of 0.5 per cent, compared to the slow increase of 0.3 per cent in the previous quarter and strong increase of 8.9 per cent in the corressponding quarter of 2011 (Figure 25). The decline in the September quarter was driven by the fall in the prices of most of the imported items, mainly durable and non-durable household items, motor vehicle operations, fuel and clothing. Imported items with prices increasing in the September quarter include other clothing and footwear, soft drinks, cereals, and other food products. Through-the-year, prices declined for cereals, fuel, other food products and motor vehicle operations. Imported items with prices increasing through the year include soft drinks household durable and non-durable goods, motor vehicle purchase, and clothing. Prices of clothing, household durable and non-durable items and motor vehicle operations, though declined in the September quarter, recorded increases through the year to reflect higher prices of the last three quarters.
In general, imported inflation continued to moderate, reflecting mainly the pass through effect of the strong performance of Kina against its major trading partners since 2011. Compared to December quarter of 2011, Kina appreciated by 26.0 per cent against the US dollar and 20.0 per cent against the Australian dollar. These have helped to minimise costs of imported goods in the domestic economy. Further, the easing global food and oil prices since mid 2011 and the expansion of the Government’s Tariff Reduction Program on the costs of intermediate goods have also contributed to lower import costs. It should be noted that the strength of the Kina has subsided in the September quarter, down 0.8 per cent against the US dollar and 3.4 per cent against the Australian dollar from the June quarter. Continued downward movements of the Kina would pose an upside risks to inflation and if persists in the coming quarters, would push up the costs of imported goods and eventually imported inflation.

2013 Budget, Volume 1
31
Figure 24: Tradable and non- tradable inflation-Quarterly growth (%)
Figure 25: Tradable and non- tradable inflation-Through the year growth (%)
-2
-1
0
1
2
3
4
5
-2
-1
0
1
2
3
4
5
Sep-08 Sep-09 Sep-10 Sep-11 Sep-12
Tradable
Non-Tradable
Per cent Per cent
-3
0
3
6
9
12
15
-3
0
3
6
9
12
15
Sep-08 Sep-09 Sep-10 Sep-11 Sep-12
Tradable
Non-Tradable
Per cent Per cent
Source: NSO and Department of Treasury
Non-tradable or domestic inflation has also been trending low since mid 2011 (Figure 25), however in the September quarter 2012, non-tradable prices rebounded from a decline of 1.4 per cent in the June quarter, up 1.9 per cent (Figure 25) to record a through-the-year high outcome of 4.2 per cent, compared to 2.3 per cent in the previous quarter (Figures 24 and 25). The rise in the non-tradable inflation in the September quarter was driven by the increases in the price of cigarettes and tobacco (up 5.7 per cent), fruits and vegetables (up 2.5 per cent) and meat and fish and alcohol drinks (up 0.9 per cent). Through-the-year, higher prices were recorded for cigarettes and tobacco (up 15.0 per cent), fruits and vegetables (up 11.4 per cent), alcohol drinks (up 9.5 per cent), telephone and postal charges (up 6.5 per cent), meat and fish (up 5.2 per cent) and airline, taxi bus and PMV fares (up 3.4 per cent).
From September quarter 2008 to June quarter 2011, non-tradable inflation has been higher, but generally moving in line with tradable inflation. Since then, non-tradable inflation has narrowed the gap to be in line with tradable inflation (Figure 25). This could indicate the pass through of lower import costs to domestic prices as PNG is import dependent and overtime intermediate costs of imported goods and services pass through to prices of domestic consumer goods.
Of the total expenditure groups, the major contributors to the increase in the CPI in the September quarter were drinks, cigarettes, tobacco and betelnut and food. Prices of cigarettes and tobacco were high in Rabaul (up 13.4 per cent), followed by Port Moresby (up 8.8 per cent), Lae (up 2.4 per cent), Goroka (up 1.5 per cent) and Madang (up 0.8 per cent). Betelnut prices were also high in Madang, Goroka and Lae, up 20.9 per cent, 19.5 per cent and 5.8 per cent respectively. However, the high declines in Rabaul (down 24.3 per cent) and Port Moresby (down 11.7 per cent) have offset the increases in Madang, Goroka and Lae, thus resulting in an overall decline of 1.1 per cent in the September quarter. Under the food category, higher prices were felt in Madang, in particular, fruits and vegetables (up 12.1 per cent) whilst Rabaul recorded decline of 9.4 per cent and Goroka, decline of 3.5 per cent. Prices of meat and fish and cereals also increased across the major urban centres, except Lae (down 0.1 per cent for meat and fish). The major contributors to the rise in prices through-the-year were drinks, cigarettes, tobacco and betelnut and transport and communication. Contribution to growth by transport and communication was largely driven by higher prices for motor vehicle purchase and telephone and postal charges.
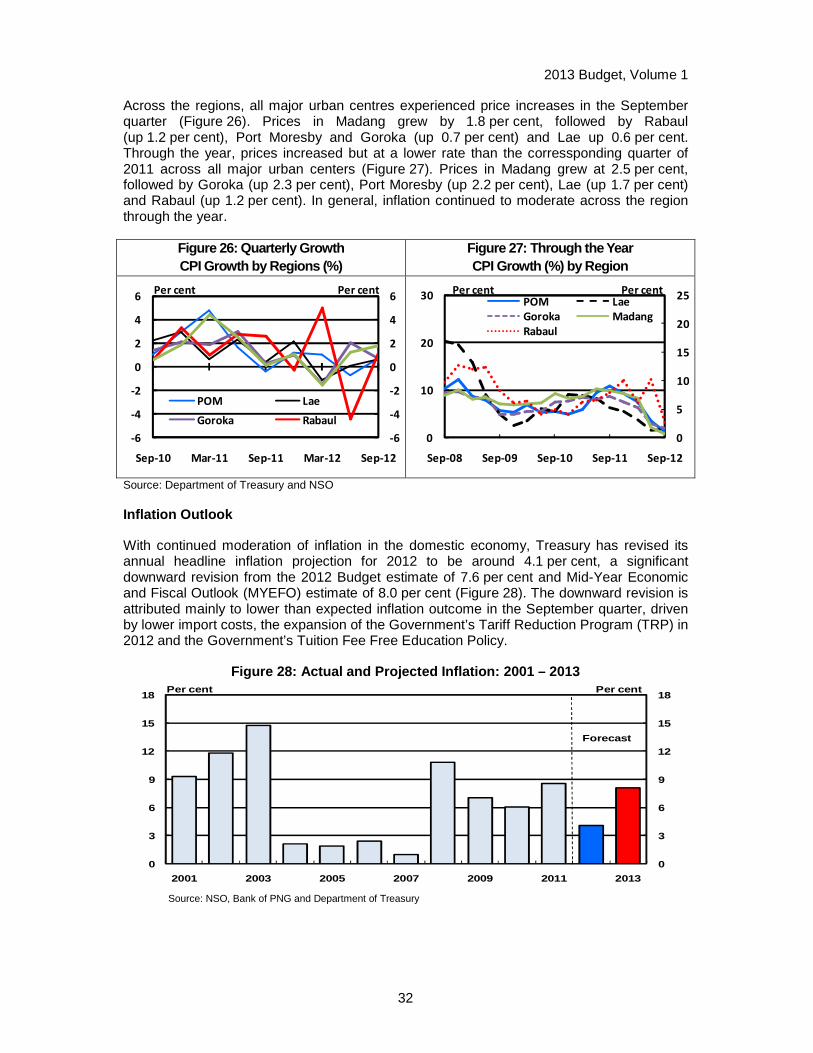
2013 Budget, Volume 1
32
Across the regions, all major urban centres experienced price increases in the September quarter (Figure 26). Prices in Madang grew by 1.8 per cent, followed by Rabaul (up 1.2 per cent), Port Moresby and Goroka (up 0.7 per cent) and Lae up 0.6 per cent. Through the year, prices increased but at a lower rate than the corressponding quarter of 2011 across all major urban centers (Figure 27). Prices in Madang grew at 2.5 per cent, followed by Goroka (up 2.3 per cent), Port Moresby (up 2.2 per cent), Lae (up 1.7 per cent) and Rabaul (up 1.2 per cent). In general, inflation continued to moderate across the region through the year.
Figure 26: Quarterly Growth CPI Growth by Regions (%)
Figure 27: Through the Year CPI Growth (%) by Region
-6
-4
-2
0
2
4
6
-6
-4
-2
0
2
4
6
Sep-10 Mar-11 Sep-11 Mar-12 Sep-12
POM Lae
Goroka Rabaul
Per cent Per cent
0
5
10
15
20
25
0
10
20
30
Sep-08 Sep-09 Sep-10 Sep-11 Sep-12
POM Lae
Goroka Madang
Rabaul
Per cent Per cent
Source: Department of Treasury and NSO
Inflation Outlook
With continued moderation of inflation in the domestic economy, Treasury has revised its annual headline inflation projection for 2012 to be around 4.1 per cent, a significant downward revision from the 2012 Budget estimate of 7.6 per cent and Mid-Year Economic and Fiscal Outlook (MYEFO) estimate of 8.0 per cent (Figure 28). The downward revision is attributed mainly to lower than expected inflation outcome in the September quarter, driven by lower import costs, the expansion of the Government’s Tariff Reduction Program (TRP) in 2012 and the Government’s Tuition Fee Free Education Policy.
Figure 28: Actual and Projected Inflation: 2001 – 2 013
0
3
6
9
12
15
18
0
3
6
9
12
15
18
2001 2003 2005 2007 2009 2011 2013
Per cent Per cent
Forecast
Source: NSO, Bank of PNG and Department of Treasury
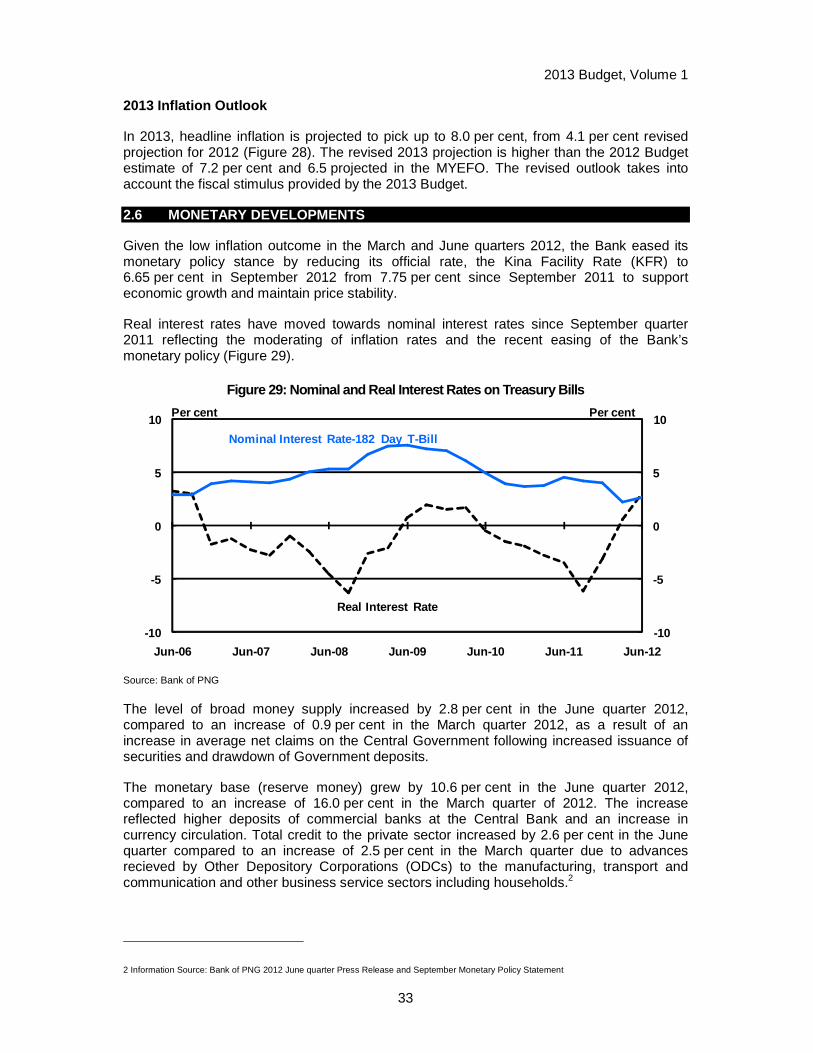
2013 Budget, Volume 1
33
2013 Inflation Outlook
In 2013, headline inflation is projected to pick up to 8.0 per cent, from 4.1 per cent revised projection for 2012 (Figure 28). The revised 2013 projection is higher than the 2012 Budget estimate of 7.2 per cent and 6.5 projected in the MYEFO. The revised outlook takes into account the fiscal stimulus provided by the 2013 Budget.
2.6 MONETARY DEVELOPMENTS
Given the low inflation outcome in the March and June quarters 2012, the Bank eased its monetary policy stance by reducing its official rate, the Kina Facility Rate (KFR) to 6.65 per cent in September 2012 from 7.75 per cent since September 2011 to support economic growth and maintain price stability.
Real interest rates have moved towards nominal interest rates since September quarter 2011 reflecting the moderating of inflation rates and the recent easing of the Bank’s monetary policy (Figure 29).
Figure 29: Nominal and Real Interest Rates on Treas ury Bills
-10
-5
0
5
10
-10
-5
0
5
10
Jun-06 Jun-07 Jun-08 Jun-09 Jun-10 Jun-11 Jun-12
Per cent Per cent
Nominal Interest Rate-182 Day T-Bill
Real Interest Rate
Source: Bank of PNG
The level of broad money supply increased by 2.8 per cent in the June quarter 2012, compared to an increase of 0.9 per cent in the March quarter 2012, as a result of an increase in average net claims on the Central Government following increased issuance of securities and drawdown of Government deposits.
The monetary base (reserve money) grew by 10.6 per cent in the June quarter 2012, compared to an increase of 16.0 per cent in the March quarter of 2012. The increase reflected higher deposits of commercial banks at the Central Bank and an increase in currency circulation. Total credit to the private sector increased by 2.6 per cent in the June quarter compared to an increase of 2.5 per cent in the March quarter due to advances recieved by Other Depository Corporations (ODCs) to the manufacturing, transport and communication and other business service sectors including households.2
2 Information Source: Bank of PNG 2012 June quarter Press Release and September Monetary Policy Statement
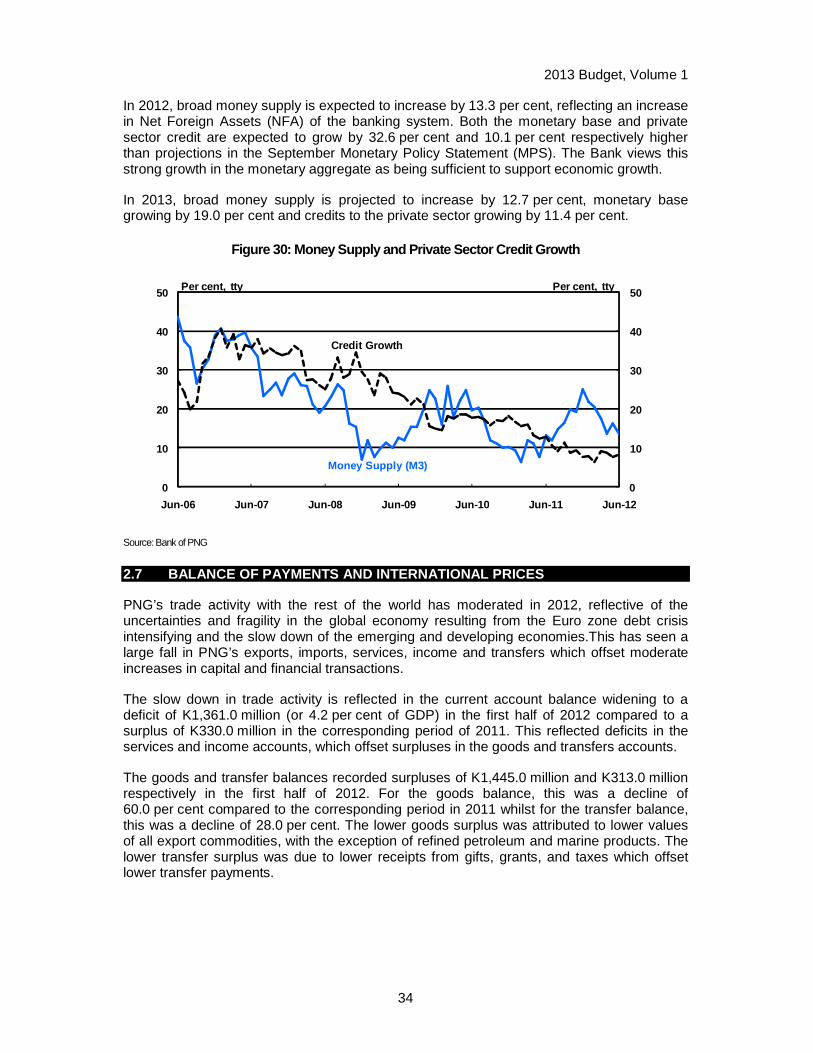
2013 Budget, Volume 1
34
In 2012, broad money supply is expected to increase by 13.3 per cent, reflecting an increase in Net Foreign Assets (NFA) of the banking system. Both the monetary base and private sector credit are expected to grow by 32.6 per cent and 10.1 per cent respectively higher than projections in the September Monetary Policy Statement (MPS). The Bank views this strong growth in the monetary aggregate as being sufficient to support economic growth.
In 2013, broad money supply is projected to increase by 12.7 per cent, monetary base growing by 19.0 per cent and credits to the private sector growing by 11.4 per cent.
Figure 30: Money Supply and Private Sector Credit G rowth
0
10
20
30
40
50
0
10
20
30
40
50
Jun -06 Jun -07 Jun -08 Jun -09 Jun -10 Jun -11 Jun -12
Money Supply (M3)
Credit Growth
Per cent, tty Per cent, tty
Source: Bank of PNG
2.7 BALANCE OF PAYMENTS AND INTERNATIONAL PRICES
PNG’s trade activity with the rest of the world has moderated in 2012, reflective of the uncertainties and fragility in the global economy resulting from the Euro zone debt crisis intensifying and the slow down of the emerging and developing economies.This has seen a large fall in PNG’s exports, imports, services, income and transfers which offset moderate increases in capital and financial transactions.
The slow down in trade activity is reflected in the current account balance widening to a deficit of K1,361.0 million (or 4.2 per cent of GDP) in the first half of 2012 compared to a surplus of K330.0 million in the corresponding period of 2011. This reflected deficits in the services and income accounts, which offset surpluses in the goods and transfers accounts.
The goods and transfer balances recorded surpluses of K1,445.0 million and K313.0 million respectively in the first half of 2012. For the goods balance, this was a decline of 60.0 per cent compared to the corresponding period in 2011 whilst for the transfer balance, this was a decline of 28.0 per cent. The lower goods surplus was attributed to lower values of all export commodities, with the exception of refined petroleum and marine products. The lower transfer surplus was due to lower receipts from gifts, grants, and taxes which offset lower transfer payments.
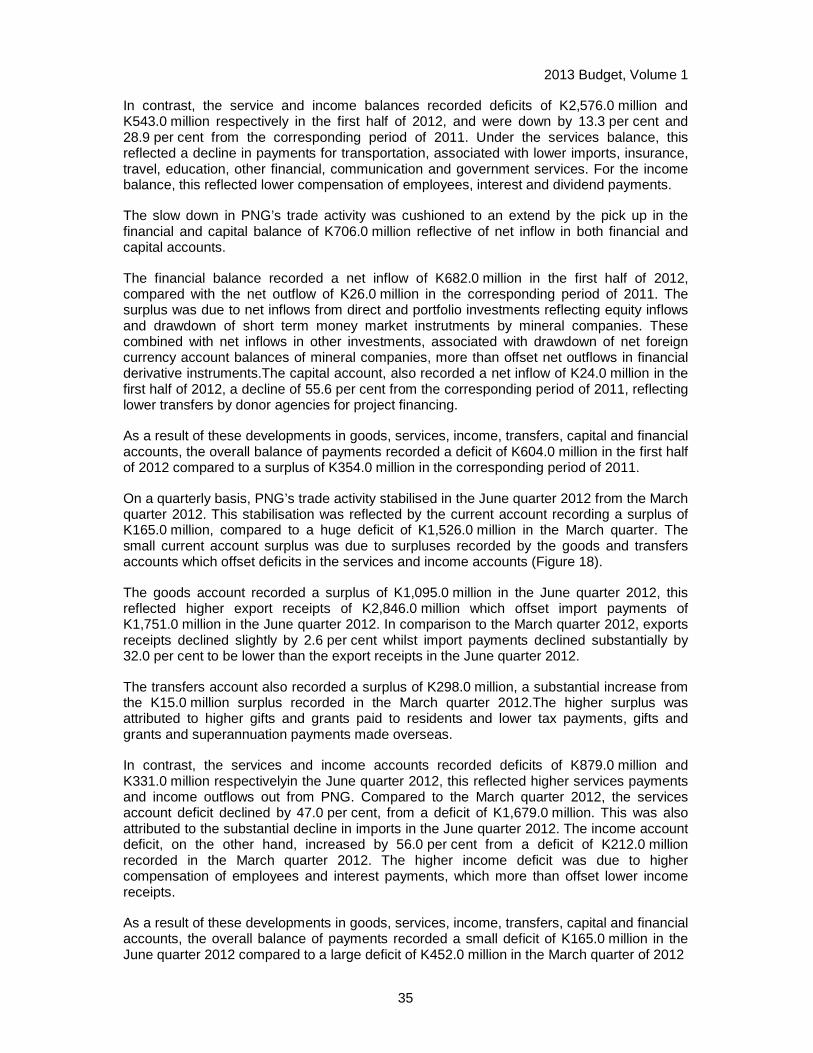
2013 Budget, Volume 1
35
In contrast, the service and income balances recorded deficits of K2,576.0 million and K543.0 million respectively in the first half of 2012, and were down by 13.3 per cent and 28.9 per cent from the corresponding period of 2011. Under the services balance, this reflected a decline in payments for transportation, associated with lower imports, insurance, travel, education, other financial, communication and government services. For the income balance, this reflected lower compensation of employees, interest and dividend payments.
The slow down in PNG’s trade activity was cushioned to an extend by the pick up in the financial and capital balance of K706.0 million reflective of net inflow in both financial and capital accounts.
The financial balance recorded a net inflow of K682.0 million in the first half of 2012, compared with the net outflow of K26.0 million in the corresponding period of 2011. The surplus was due to net inflows from direct and portfolio investments reflecting equity inflows and drawdown of short term money market instrutments by mineral companies. These combined with net inflows in other investments, associated with drawdown of net foreign currency account balances of mineral companies, more than offset net outflows in financial derivative instruments.The capital account, also recorded a net inflow of K24.0 million in the first half of 2012, a decline of 55.6 per cent from the corresponding period of 2011, reflecting lower transfers by donor agencies for project financing.
As a result of these developments in goods, services, income, transfers, capital and financial accounts, the overall balance of payments recorded a deficit of K604.0 million in the first half of 2012 compared to a surplus of K354.0 million in the corresponding period of 2011.
On a quarterly basis, PNG’s trade activity stabilised in the June quarter 2012 from the March quarter 2012. This stabilisation was reflected by the current account recording a surplus of K165.0 million, compared to a huge deficit of K1,526.0 million in the March quarter. The small current account surplus was due to surpluses recorded by the goods and transfers accounts which offset deficits in the services and income accounts (Figure 18).
The goods account recorded a surplus of K1,095.0 million in the June quarter 2012, this reflected higher export receipts of K2,846.0 million which offset import payments of K1,751.0 million in the June quarter 2012. In comparison to the March quarter 2012, exports receipts declined slightly by 2.6 per cent whilst import payments declined substantially by 32.0 per cent to be lower than the export receipts in the June quarter 2012.
The transfers account also recorded a surplus of K298.0 million, a substantial increase from the K15.0 million surplus recorded in the March quarter 2012.The higher surplus was attributed to higher gifts and grants paid to residents and lower tax payments, gifts and grants and superannuation payments made overseas.
In contrast, the services and income accounts recorded deficits of K879.0 million and K331.0 million respectivelyin the June quarter 2012, this reflected higher services payments and income outflows out from PNG. Compared to the March quarter 2012, the services account deficit declined by 47.0 per cent, from a deficit of K1,679.0 million. This was also attributed to the substantial decline in imports in the June quarter 2012. The income account deficit, on the other hand, increased by 56.0 per cent from a deficit of K212.0 million recorded in the March quarter 2012. The higher income deficit was due to higher compensation of employees and interest payments, which more than offset lower income receipts.
As a result of these developments in goods, services, income, transfers, capital and financial accounts, the overall balance of payments recorded a small deficit of K165.0 million in the June quarter 2012 compared to a large deficit of K452.0 million in the March quarter of 2012
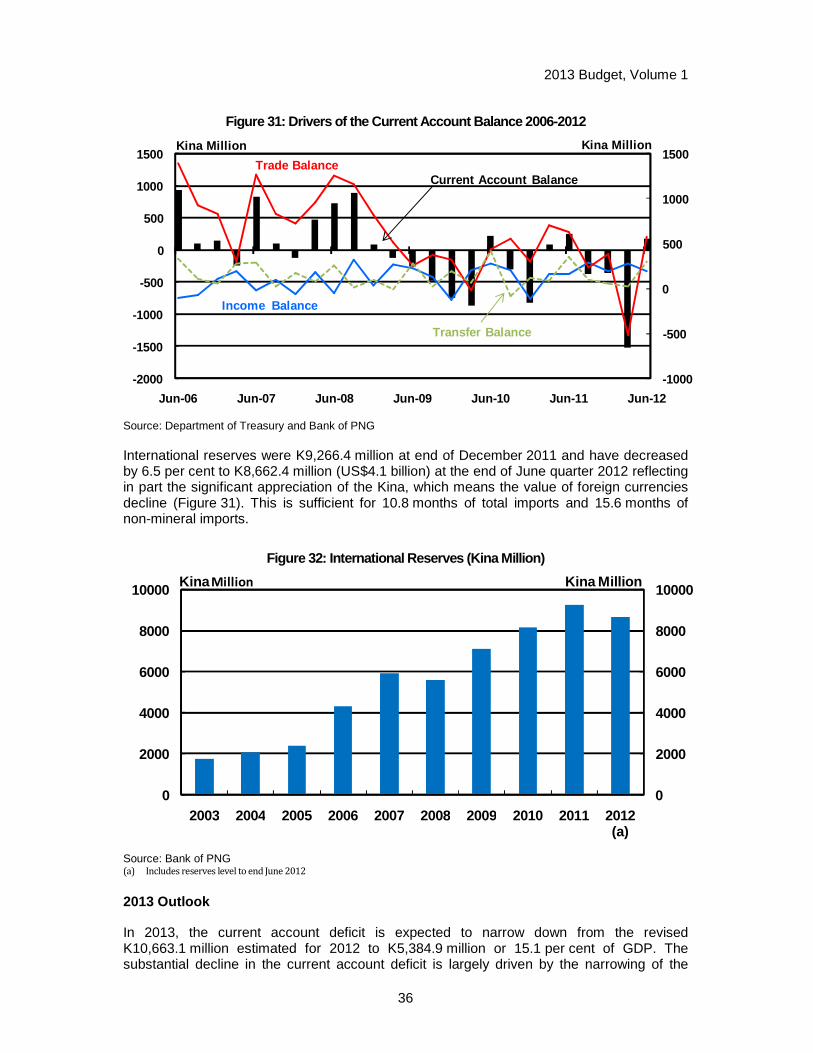
2013 Budget, Volume 1
36
Figure 31: Drivers of the Current Account Balance 2 006-2012
-1000
-500
0
500
1000
1500
-2000
-1500
-1000
-500
0
500
1000
1500
Jun-06 Jun-07 Jun-08 Jun-09 Jun-10 Jun-11 Jun-12
Kina Million Kina Million
Trade BalanceCurrent Account Balance
Transfer Balance
Income Balance
Source: Department of Treasury and Bank of PNG
International reserves were K9,266.4 million at end of December 2011 and have decreased by 6.5 per cent to K8,662.4 million (US$4.1 billion) at the end of June quarter 2012 reflecting in part the significant appreciation of the Kina, which means the value of foreign currencies decline (Figure 31). This is sufficient for 10.8 months of total imports and 15.6 months of non-mineral imports.
Figure 32: International Reserves (Kina Million)
0
2000
4000
6000
8000
10000
0
2000
4000
6000
8000
10000
2003 2004 2005 2006 2007 2008 2009 2010 2011 2012 (a)
Kina Million Kina Million
Source: Bank of PNG (a) Includes reserves level to end June 2012
2013 Outlook
In 2013, the current account deficit is expected to narrow down from the revised K10,663.1 million estimated for 2012 to K5,384.9 million or 15.1 per cent of GDP. The substantial decline in the current account deficit is largely driven by the narrowing of the
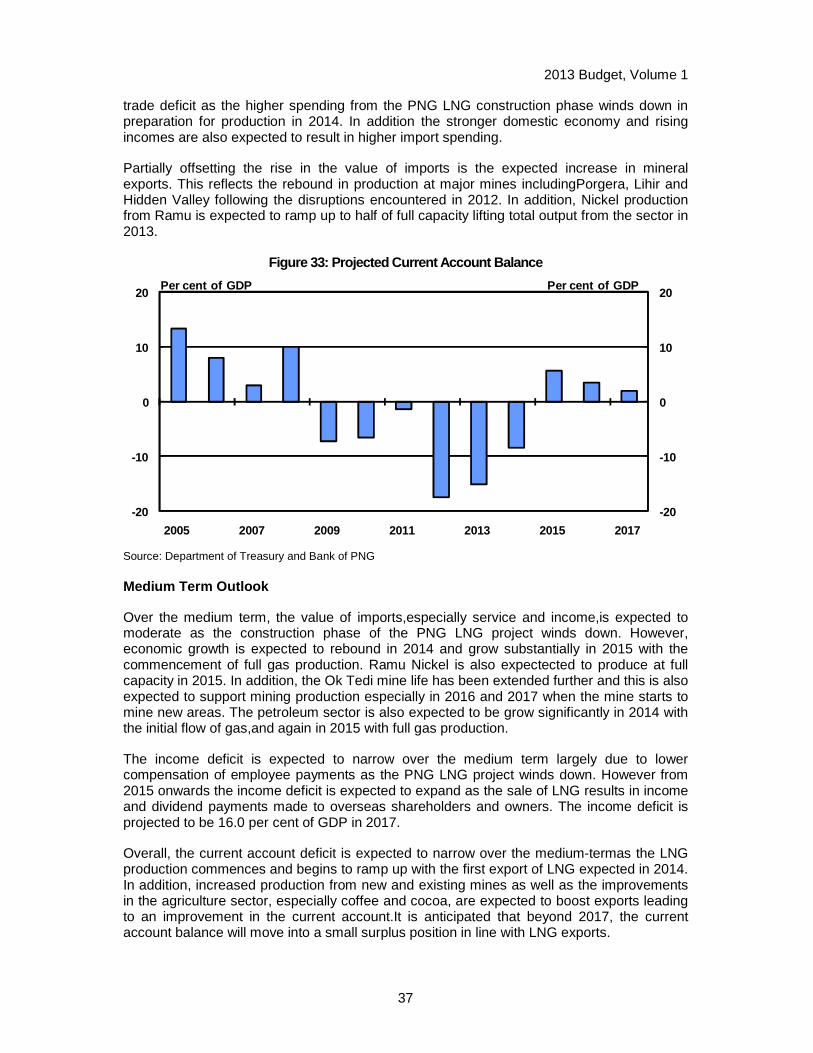
2013 Budget, Volume 1
37
trade deficit as the higher spending from the PNG LNG construction phase winds down in preparation for production in 2014. In addition the stronger domestic economy and rising incomes are also expected to result in higher import spending.
Partially offsetting the rise in the value of imports is the expected increase in mineral exports. This reflects the rebound in production at major mines includingPorgera, Lihir and Hidden Valley following the disruptions encountered in 2012. In addition, Nickel production from Ramu is expected to ramp up to half of full capacity lifting total output from the sector in 2013.
Figure 33: Projected Current Account Balance
-20
-10
0
10
20
-20
-10
0
10
20
2005 2007 2009 2011 2013 2015 2017
Per cent of GDP Per cent of GDP
Source: Department of Treasury and Bank of PNG Medium Term Outlook
Over the medium term, the value of imports,especially service and income,is expected to moderate as the construction phase of the PNG LNG project winds down. However, economic growth is expected to rebound in 2014 and grow substantially in 2015 with the commencement of full gas production. Ramu Nickel is also expectected to produce at full capacity in 2015. In addition, the Ok Tedi mine life has been extended further and this is also expected to support mining production especially in 2016 and 2017 when the mine starts to mine new areas. The petroleum sector is also expected to be grow significantly in 2014 with the initial flow of gas,and again in 2015 with full gas production.
The income deficit is expected to narrow over the medium term largely due to lower compensation of employee payments as the PNG LNG project winds down. However from 2015 onwards the income deficit is expected to expand as the sale of LNG results in income and dividend payments made to overseas shareholders and owners. The income deficit is projected to be 16.0 per cent of GDP in 2017.
Overall, the current account deficit is expected to narrow over the medium-termas the LNG production commences and begins to ramp up with the first export of LNG expected in 2014. In addition, increased production from new and existing mines as well as the improvements in the agriculture sector, especially coffee and cocoa, are expected to boost exports leading to an improvement in the current account.It is anticipated that beyond 2017, the current account balance will move into a small surplus position in line with LNG exports.
2013 Budget, Volume 1
38
2.7 RISKS TO THE ECONOMIC AND FISCAL OUTLOOK
On balance, the risks to the PNG economy are modest as the internal drivers for growth continue to dominate the external factors. However, the risks to the Government’s fiscal position have intensified. These risks include:
� Uncertainty in global economic recovery and commodity price volatility;
� Loss of fiscal discipline due to low revenues, with increased additional expenditure pressures;
� Inability to raise sufficient debt; and
� Disruptions to the PNG LNG project construction progress and other major mines.
The Government received information on the construction phase of the PNG LNG project following the completion of Budget decisions. This information suggests that there may be an upside to the GDP and revenue forecasts for 2013 and additional downside to GDP growth in 2014. This information will be incorporated in the 2013 MYEFO.
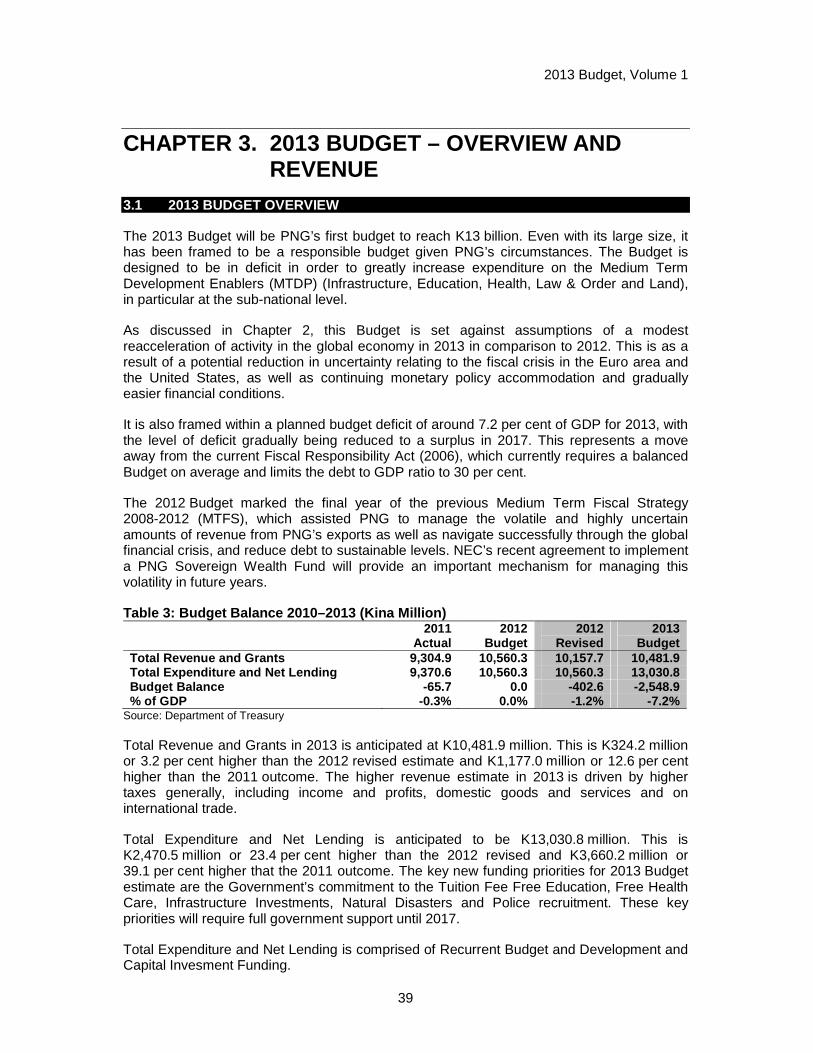
2013 Budget, Volume 1
39
CHAPTER 3. 2013 BUDGET – OVERVIEW AND REVENUE
3.1 2013 BUDGET OVERVIEW
The 2013 Budget will be PNG’s first budget to reach K13 billion. Even with its large size, it has been framed to be a responsible budget given PNG’s circumstances. The Budget is designed to be in deficit in order to greatly increase expenditure on the Medium Term Development Enablers (MTDP) (Infrastructure, Education, Health, Law & Order and Land), in particular at the sub-national level.
As discussed in Chapter 2, this Budget is set against assumptions of a modest reacceleration of activity in the global economy in 2013 in comparison to 2012. This is as a result of a potential reduction in uncertainty relating to the fiscal crisis in the Euro area and the United States, as well as continuing monetary policy accommodation and gradually easier financial conditions.
It is also framed within a planned budget deficit of around 7.2 per cent of GDP for 2013, with the level of deficit gradually being reduced to a surplus in 2017. This represents a move away from the current Fiscal Responsibility Act (2006), which currently requires a balanced Budget on average and limits the debt to GDP ratio to 30 per cent.
The 2012 Budget marked the final year of the previous Medium Term Fiscal Strategy 2008-2012 (MTFS), which assisted PNG to manage the volatile and highly uncertain amounts of revenue from PNG’s exports as well as navigate successfully through the global financial crisis, and reduce debt to sustainable levels. NEC’s recent agreement to implement a PNG Sovereign Wealth Fund will provide an important mechanism for managing this volatility in future years.
Table 3: Budget Balance 2010–2013 (Kina Million) 2011
Actual 2012
Budget 2012
Revised 2013
Budget Total Revenue and Grants 9,304.9 10,560.3 10,157.7 10,481.9 Total Expenditu re and Net Lending 9,370.6 10,560.3 10,560.3 13,030.8 Budget Balance -65.7 0.0 -402.6 -2,548.9 % of GDP -0.3% 0.0% -1.2% -7.2%
Source: Department of Treasury
Total Revenue and Grants in 2013 is anticipated at K10,481.9 million. This is K324.2 million or 3.2 per cent higher than the 2012 revised estimate and K1,177.0 million or 12.6 per cent higher than the 2011 outcome. The higher revenue estimate in 2013 is driven by higher taxes generally, including income and profits, domestic goods and services and on international trade.
Total Expenditure and Net Lending is anticipated to be K13,030.8 million. This is K2,470.5 million or 23.4 per cent higher than the 2012 revised and K3,660.2 million or 39.1 per cent higher that the 2011 outcome. The key new funding priorities for 2013 Budget estimate are the Government’s commitment to the Tuition Fee Free Education, Free Health Care, Infrastructure Investments, Natural Disasters and Police recruitment. These key priorities will require full government support until 2017.
Total Expenditure and Net Lending is comprised of Recurrent Budget and Development and Capital Invesment Funding.
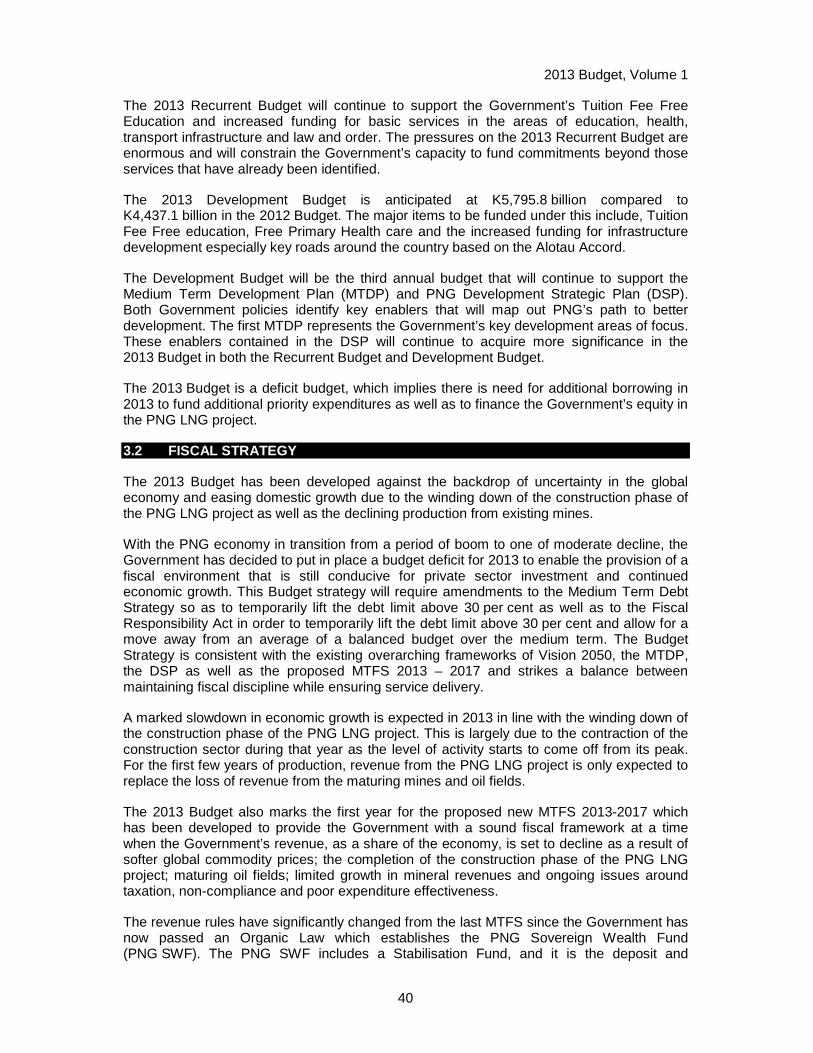
2013 Budget, Volume 1
40
The 2013 Recurrent Budget will continue to support the Government’s Tuition Fee Free Education and increased funding for basic services in the areas of education, health, transport infrastructure and law and order. The pressures on the 2013 Recurrent Budget are enormous and will constrain the Government’s capacity to fund commitments beyond those services that have already been identified.
The 2013 Development Budget is anticipated at K5,795.8 billion compared to K4,437.1 billion in the 2012 Budget. The major items to be funded under this include, Tuition Fee Free education, Free Primary Health care and the increased funding for infrastructure development especially key roads around the country based on the Alotau Accord.
The Development Budget will be the third annual budget that will continue to support the Medium Term Development Plan (MTDP) and PNG Development Strategic Plan (DSP). Both Government policies identify key enablers that will map out PNG’s path to better development. The first MTDP represents the Government’s key development areas of focus. These enablers contained in the DSP will continue to acquire more significance in the 2013 Budget in both the Recurrent Budget and Development Budget.
The 2013 Budget is a deficit budget, which implies there is need for additional borrowing in 2013 to fund additional priority expenditures as well as to finance the Government’s equity in the PNG LNG project.
3.2 FISCAL STRATEGY
The 2013 Budget has been developed against the backdrop of uncertainty in the global economy and easing domestic growth due to the winding down of the construction phase of the PNG LNG project as well as the declining production from existing mines.
With the PNG economy in transition from a period of boom to one of moderate decline, the Government has decided to put in place a budget deficit for 2013 to enable the provision of a fiscal environment that is still conducive for private sector investment and continued economic growth. This Budget strategy will require amendments to the Medium Term Debt Strategy so as to temporarily lift the debt limit above 30 per cent as well as to the Fiscal Responsibility Act in order to temporarily lift the debt limit above 30 per cent and allow for a move away from an average of a balanced budget over the medium term. The Budget Strategy is consistent with the existing overarching frameworks of Vision 2050, the MTDP, the DSP as well as the proposed MTFS 2013 – 2017 and strikes a balance between maintaining fiscal discipline while ensuring service delivery.
A marked slowdown in economic growth is expected in 2013 in line with the winding down of the construction phase of the PNG LNG project. This is largely due to the contraction of the construction sector during that year as the level of activity starts to come off from its peak. For the first few years of production, revenue from the PNG LNG project is only expected to replace the loss of revenue from the maturing mines and oil fields.
The 2013 Budget also marks the first year for the proposed new MTFS 2013-2017 which has been developed to provide the Government with a sound fiscal framework at a time when the Government’s revenue, as a share of the economy, is set to decline as a result of softer global commodity prices; the completion of the construction phase of the PNG LNG project; maturing oil fields; limited growth in mineral revenues and ongoing issues around taxation, non-compliance and poor expenditure effectiveness.
The revenue rules have significantly changed from the last MTFS since the Government has now passed an Organic Law which establishes the PNG Sovereign Wealth Fund (PNG SWF). The PNG SWF includes a Stabilisation Fund, and it is the deposit and
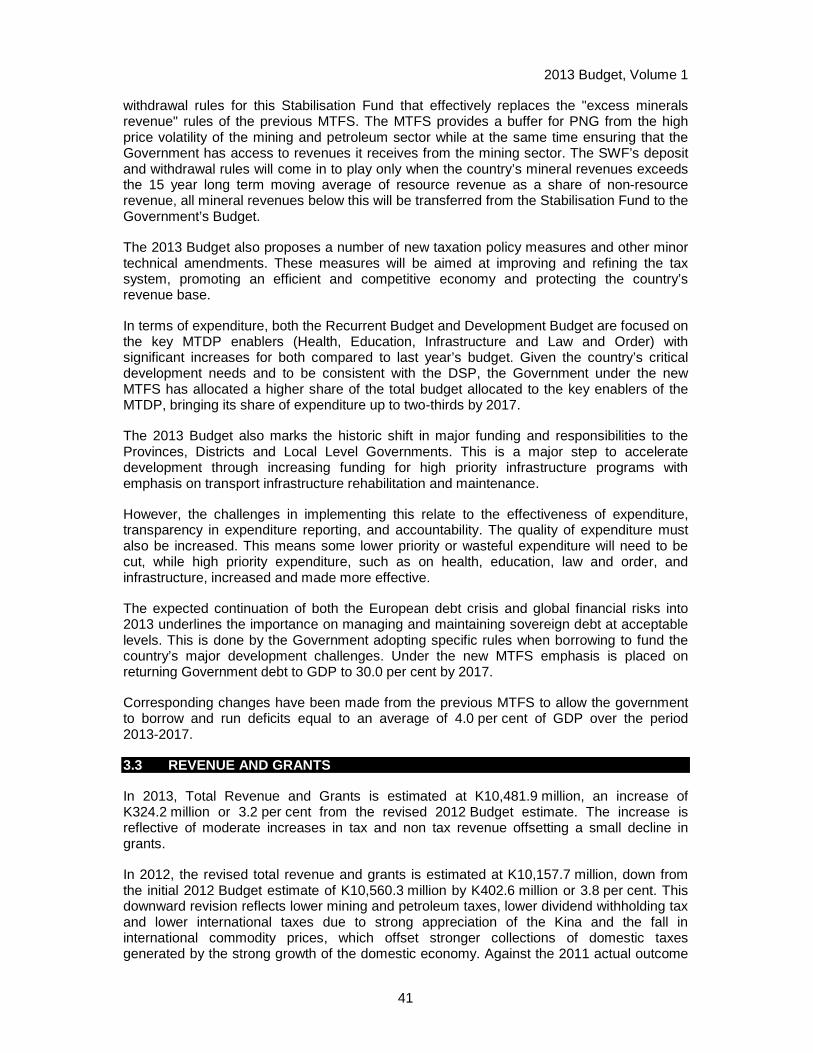
2013 Budget, Volume 1
41
withdrawal rules for this Stabilisation Fund that effectively replaces the "excess minerals revenue" rules of the previous MTFS. The MTFS provides a buffer for PNG from the high price volatility of the mining and petroleum sector while at the same time ensuring that the Government has access to revenues it receives from the mining sector. The SWF’s deposit and withdrawal rules will come in to play only when the country’s mineral revenues exceeds the 15 year long term moving average of resource revenue as a share of non-resource revenue, all mineral revenues below this will be transferred from the Stabilisation Fund to the Government’s Budget.
The 2013 Budget also proposes a number of new taxation policy measures and other minor technical amendments. These measures will be aimed at improving and refining the tax system, promoting an efficient and competitive economy and protecting the country’s revenue base.
In terms of expenditure, both the Recurrent Budget and Development Budget are focused on the key MTDP enablers (Health, Education, Infrastructure and Law and Order) with significant increases for both compared to last year’s budget. Given the country’s critical development needs and to be consistent with the DSP, the Government under the new MTFS has allocated a higher share of the total budget allocated to the key enablers of the MTDP, bringing its share of expenditure up to two-thirds by 2017.
The 2013 Budget also marks the historic shift in major funding and responsibilities to the Provinces, Districts and Local Level Governments. This is a major step to accelerate development through increasing funding for high priority infrastructure programs with emphasis on transport infrastructure rehabilitation and maintenance.
However, the challenges in implementing this relate to the effectiveness of expenditure, transparency in expenditure reporting, and accountability. The quality of expenditure must also be increased. This means some lower priority or wasteful expenditure will need to be cut, while high priority expenditure, such as on health, education, law and order, and infrastructure, increased and made more effective.
The expected continuation of both the European debt crisis and global financial risks into 2013 underlines the importance on managing and maintaining sovereign debt at acceptable levels. This is done by the Government adopting specific rules when borrowing to fund the country’s major development challenges. Under the new MTFS emphasis is placed on returning Government debt to GDP to 30.0 per cent by 2017.
Corresponding changes have been made from the previous MTFS to allow the government to borrow and run deficits equal to an average of 4.0 per cent of GDP over the period 2013-2017.
3.3 REVENUE AND GRANTS
In 2013, Total Revenue and Grants is estimated at K10,481.9 million, an increase of K324.2 million or 3.2 per cent from the revised 2012 Budget estimate. The increase is reflective of moderate increases in tax and non tax revenue offsetting a small decline in grants.
In 2012, the revised total revenue and grants is estimated at K10,157.7 million, down from the initial 2012 Budget estimate of K10,560.3 million by K402.6 million or 3.8 per cent. This downward revision reflects lower mining and petroleum taxes, lower dividend withholding tax and lower international taxes due to strong appreciation of the Kina and the fall in international commodity prices, which offset stronger collections of domestic taxes generated by the strong growth of the domestic economy. Against the 2011 actual outcome
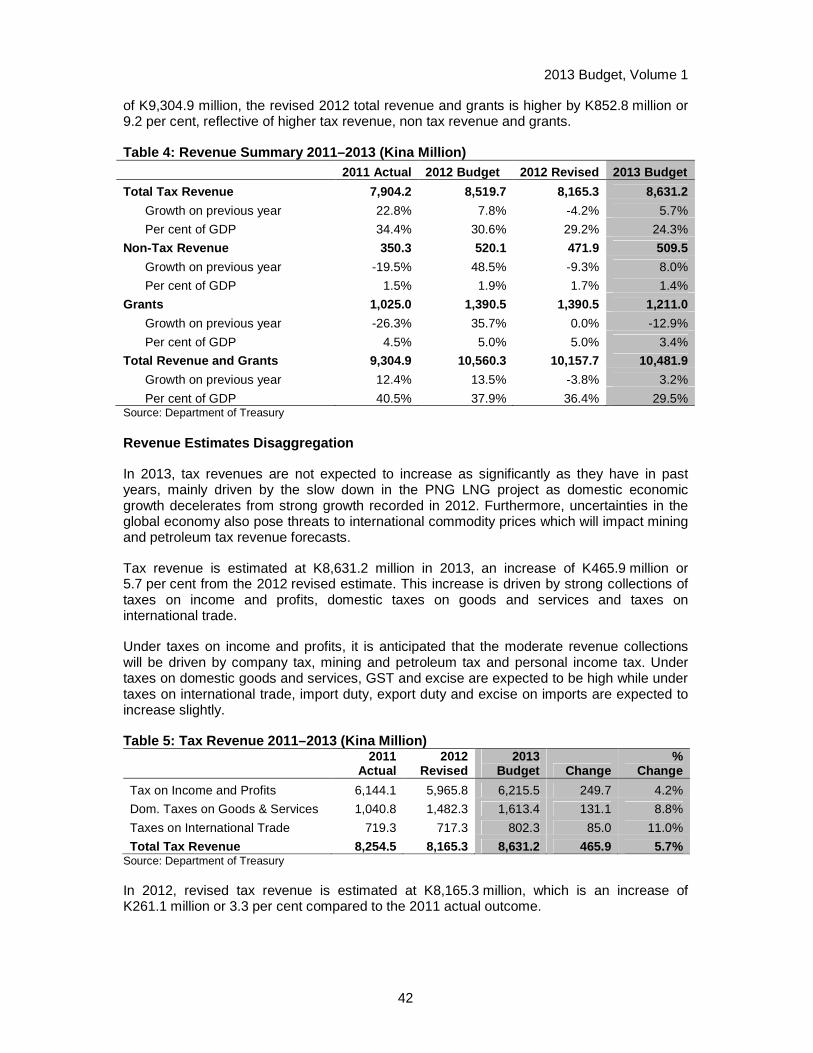
2013 Budget, Volume 1
42
of K9,304.9 million, the revised 2012 total revenue and grants is higher by K852.8 million or 9.2 per cent, reflective of higher tax revenue, non tax revenue and grants.
Table 4: Revenue Summary 2011–2013 (Kina Million) 2011 Actual 2012 Budget 2012 Revised 2013 Budget
Total Tax Revenue 7,904.2 8,519.7 8,165.3 8,631.2
Growth on previous year 22.8% 7.8% -4.2% 5.7%
Per cent of GDP 34.4% 30.6% 29.2% 24.3%
Non-Tax Revenue 350.3 520.1 471.9 509.5
Growth on previous year -19.5% 48.5% -9.3% 8.0%
Per cent of GDP 1.5% 1.9% 1.7% 1.4%
Grants 1,025.0 1,390.5 1,390.5 1,211.0
Growth on previous year -26.3% 35.7% 0.0% -12.9%
Per cent of GDP 4.5% 5.0% 5.0% 3.4%
Total Revenue and Grants 9,304.9 10,560.3 10,157.7 10,481.9
Growth on previous year 12.4% 13.5% -3.8% 3.2%
Per cent of GDP 40.5% 37.9% 36.4% 29.5% Source: Department of Treasury
Revenue Estimates Disaggregation
In 2013, tax revenues are not expected to increase as significantly as they have in past years, mainly driven by the slow down in the PNG LNG project as domestic economic growth decelerates from strong growth recorded in 2012. Furthermore, uncertainties in the global economy also pose threats to international commodity prices which will impact mining and petroleum tax revenue forecasts.
Tax revenue is estimated at K8,631.2 million in 2013, an increase of K465.9 million or 5.7 per cent from the 2012 revised estimate. This increase is driven by strong collections of taxes on income and profits, domestic taxes on goods and services and taxes on international trade.
Under taxes on income and profits, it is anticipated that the moderate revenue collections will be driven by company tax, mining and petroleum tax and personal income tax. Under taxes on domestic goods and services, GST and excise are expected to be high while under taxes on international trade, import duty, export duty and excise on imports are expected to increase slightly.
Table 5: Tax Revenue 2011–2013 (Kina Million)
2011
Actual 2012
Revised 2013
Budget Change %
Change
Tax on Income and Profits 6,144.1 5,965.8 6,215.5 249.7 4.2%
Dom. Taxes on Goods & Services 1,040.8 1,482.3 1,613.4 131.1 8.8%
Taxes on International Trade 719.3 717.3 802.3 85.0 11.0%
Total Tax Revenue 8,254.5 8,165.3 8,631.2 465.9 5.7% Source: Department of Treasury
In 2012, revised tax revenue is estimated at K8,165.3 million, which is an increase of K261.1 million or 3.3 per cent compared to the 2011 actual outcome.

2013 Budget, Volume 1
43
The expected tax revenue for 2012 has been revised downwards by K354.4 million. This is largely driven by a decrease in tax on income and profits, partly offset by an increase in taxes on goods and services.
Table 6: Tax Revenue 2011–2012 (Kina Million)
2011
Actual 2012
Budget 2012
Revised Change %
Change
Tax on Income and Profits 6,144.1 6,543.0 5,965.8 -577.2 -8.8%
Dom. Taxes on Goods & Services 1,040.8 1,256.4 1,482.3 225.9 18.0%
Taxes on International Trade 719.3 720.3 717.3 -3.0 -0.4%
Total Tax Revenue 7,904.2 8,519.7 8,165.3 -354.4 -4.2% Source: Department of Treasury
Taxes on Income and Profits
Taxes on income and profits is estimated at K6,215.5 million in 2013. This is an increase of K249.7 million or 4.2 per cent compared to the revised estimate for 2012. The increase is mainly driven by company tax, mining and petroleum tax and personal income tax while growth in nominal non-mining GDP drives GST, excise, import duty and excise duty on imports are slightly higher as well. Table 7: Taxes on Income and Profits 2011–2013 (Kin a Million)
2011
Actual 2012
Revised 2013
Budget Change %
Change
Personal Income Tax 2,158.8 2,538.4 2,608.0 69.6 2.7%
Company Tax 1,543.4 1,811.2 1,891.5 80.3 4.4%
Dividend Withholding Tax 290.7 188.7 197.3 8.6 4.6%
Interest Withholding Tax 40.4 45.1 45.1 0.0 0.0%
Mining and Petroleum Taxes 1,903.2 1,136.5 1,207.5 71.0 6.2%
Gaming Tax 111.3 133.3 146.5 13.2 9.9%
Other: Direct 96.3 112.7 119.5 6.8 6.0%
Taxes on Income and Profits 6,144.1 5,965.8 6,215.5 249.7 4.2% Source: Department of Treasury
In 2012, taxes on income and profits is expected to be K5,965.8 million, which is a decrease of K178.3 million or 2.9 per cent compared to the 2011 actual outcome. The decline is reflective of lower mining and petroleum tax and dividend withholding tax attributed mainly to lower commodity prices and the strong appreciation in the Kina. This more than offset the increases in personal income tax, company tax and other direct taxes.
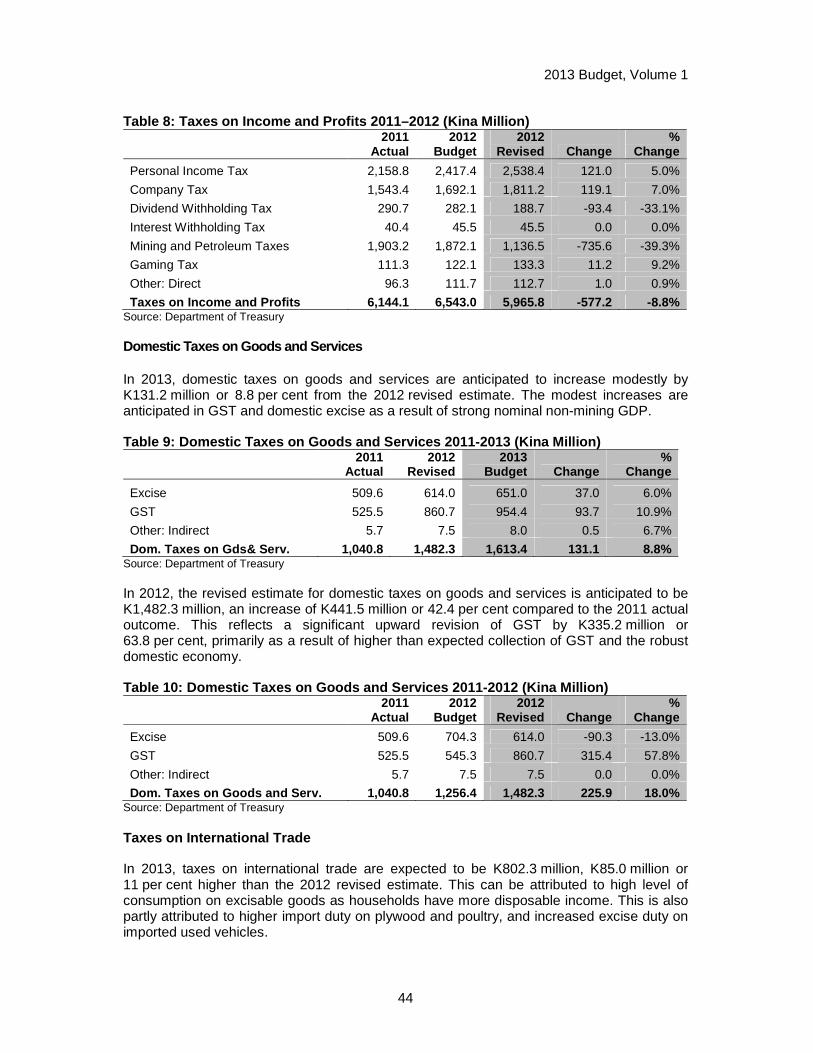
2013 Budget, Volume 1
44
Table 8: Taxes on Income and Profits 2011–2012 (Kin a Million)
2011
Actual 2012
Budget 2012
Revised Change %
Change
Personal Income Tax 2,158.8 2,417.4 2,538.4 121.0 5.0%
Company Tax 1,543.4 1,692.1 1,811.2 119.1 7.0%
Dividend Withholding Tax 290.7 282.1 188.7 -93.4 -33.1%
Interest Withholding Tax 40.4 45.5 45.5 0.0 0.0%
Mining and Petroleum Taxes 1,903.2 1,872.1 1,136.5 -735.6 -39.3%
Gaming Tax 111.3 122.1 133.3 11.2 9.2%
Other: Direct 96.3 111.7 112.7 1.0 0.9%
Taxes on Income and Profits 6,144.1 6,543.0 5,965.8 -577.2 -8.8% Source: Department of Treasury
Domestic Taxes on Goods and Services
In 2013, domestic taxes on goods and services are anticipated to increase modestly by K131.2 million or 8.8 per cent from the 2012 revised estimate. The modest increases are anticipated in GST and domestic excise as a result of strong nominal non-mining GDP.
Table 9: Domestic Taxes on Goods and Services 2011- 2013 (Kina Million)
2011
Actual 2012
Revised 2013
Budget Change %
Change
Excise 509.6 614.0 651.0 37.0 6.0%
GST 525.5 860.7 954.4 93.7 10.9%
Other: Indirect 5.7 7.5 8.0 0.5 6.7%
Dom. Taxes on Gds& Serv. 1,040.8 1,482.3 1,613.4 131.1 8.8% Source: Department of Treasury
In 2012, the revised estimate for domestic taxes on goods and services is anticipated to be K1,482.3 million, an increase of K441.5 million or 42.4 per cent compared to the 2011 actual outcome. This reflects a significant upward revision of GST by K335.2 million or 63.8 per cent, primarily as a result of higher than expected collection of GST and the robust domestic economy.
Table 10: Domestic Taxes on Goods and Services 2011 -2012 (Kina Million)
2011
Actual 2012
Budget 2012
Revised Change %
Change
Excise 509.6 704.3 614.0 -90.3 -13.0%
GST 525.5 545.3 860.7 315.4 57.8%
Other: Indirect 5.7 7.5 7.5 0.0 0.0%
Dom. Taxes on Goods and Serv. 1,040.8 1,256.4 1,482.3 225.9 18.0% Source: Department of Treasury Taxes on International Trade
In 2013, taxes on international trade are expected to be K802.3 million, K85.0 million or 11 per cent higher than the 2012 revised estimate. This can be attributed to high level of consumption on excisable goods as households have more disposable income. This is also partly attributed to higher import duty on plywood and poultry, and increased excise duty on imported used vehicles.
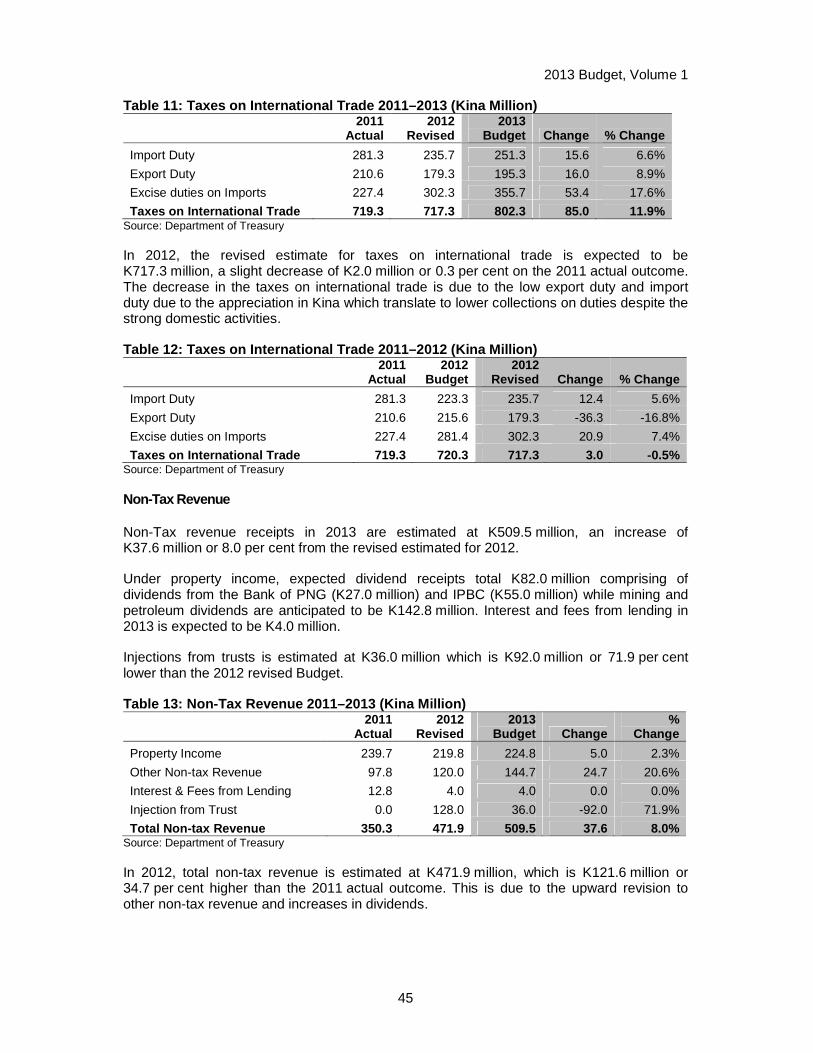
2013 Budget, Volume 1
45
Table 11: Taxes on International Trade 2011–2013 (K ina Million)
2011
Actual 2012
Revised 2013
Budget Change % Change
Import Duty 281.3 235.7 251.3 15.6 6.6%
Export Duty 210.6 179.3 195.3 16.0 8.9%
Excise duties on Imports 227.4 302.3 355.7 53.4 17.6%
Taxes on International Trade 719.3 717.3 802.3 85.0 11.9% Source: Department of Treasury
In 2012, the revised estimate for taxes on international trade is expected to be K717.3 million, a slight decrease of K2.0 million or 0.3 per cent on the 2011 actual outcome. The decrease in the taxes on international trade is due to the low export duty and import duty due to the appreciation in Kina which translate to lower collections on duties despite the strong domestic activities.
Table 12: Taxes on International Trade 2011–2012 (K ina Million)
2011
Actual 2012
Budget 2012
Revised Change % Change
Import Duty 281.3 223.3 235.7 12.4 5.6%
Export Duty 210.6 215.6 179.3 -36.3 -16.8%
Excise duties on Imports 227.4 281.4 302.3 20.9 7.4%
Taxes on International Trade 719.3 720.3 717.3 3.0 -0.5% Source: Department of Treasury
Non-Tax Revenue
Non-Tax revenue receipts in 2013 are estimated at K509.5 million, an increase of K37.6 million or 8.0 per cent from the revised estimated for 2012.
Under property income, expected dividend receipts total K82.0 million comprising of dividends from the Bank of PNG (K27.0 million) and IPBC (K55.0 million) while mining and petroleum dividends are anticipated to be K142.8 million. Interest and fees from lending in 2013 is expected to be K4.0 million.
Injections from trusts is estimated at K36.0 million which is K92.0 million or 71.9 per cent lower than the 2012 revised Budget.
Table 13: Non-Tax Revenue 2011–2013 (Kina Million)
2011
Actual 2012
Revised 2013
Budget Change %
Change
Property Income 239.7 219.8 224.8 5.0 2.3%
Other Non-tax Revenue 97.8 120.0 144.7 24.7 20.6%
Interest & Fees from Lending 12.8 4.0 4.0 0.0 0.0%
Injection from Trust 0.0 128.0 36.0 -92.0 71.9%
Total Non-tax Revenue 350.3 471.9 509.5 37.6 8.0% Source: Department of Treasury
In 2012, total non-tax revenue is estimated at K471.9 million, which is K121.6 million or 34.7 per cent higher than the 2011 actual outcome. This is due to the upward revision to other non-tax revenue and increases in dividends.
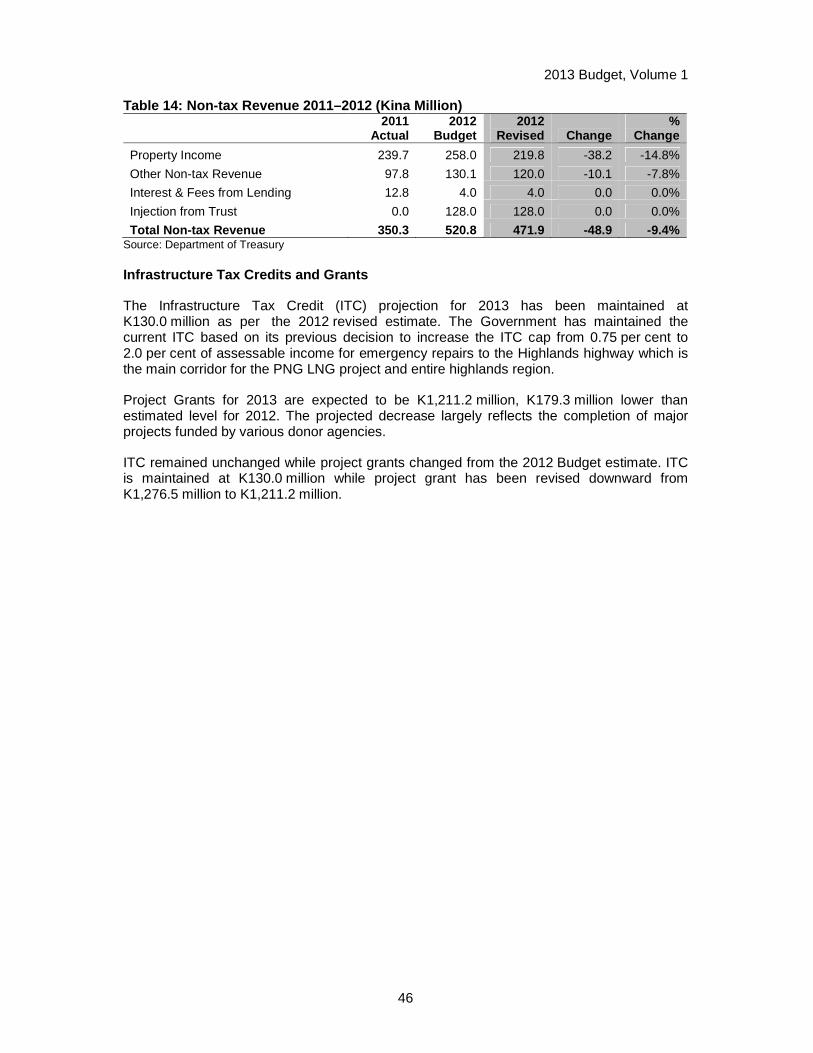
2013 Budget, Volume 1
46
Table 14: Non-tax Revenue 2011–2012 (Kina Million)
2011
Actual 2012
Budget 2012
Revised Change %
Change
Property Income 239.7 258.0 219.8 -38.2 -14.8%
Other Non-tax Revenue 97.8 130.1 120.0 -10.1 -7.8%
Interest & Fees from Lending 12.8 4.0 4.0 0.0 0.0%
Injection from Trust 0.0 128.0 128.0 0.0 0.0%
Total Non-tax Revenue 350.3 520.8 471.9 -48.9 -9.4% Source: Department of Treasury Infrastructure Tax Credits and Grants
The Infrastructure Tax Credit (ITC) projection for 2013 has been maintained at K130.0 million as per the 2012 revised estimate. The Government has maintained the current ITC based on its previous decision to increase the ITC cap from 0.75 per cent to 2.0 per cent of assessable income for emergency repairs to the Highlands highway which is the main corridor for the PNG LNG project and entire highlands region.
Project Grants for 2013 are expected to be K1,211.2 million, K179.3 million lower than estimated level for 2012. The projected decrease largely reflects the completion of major projects funded by various donor agencies.
ITC remained unchanged while project grants changed from the 2012 Budget estimate. ITC is maintained at K130.0 million while project grant has been revised downward from K1,276.5 million to K1,211.2 million.
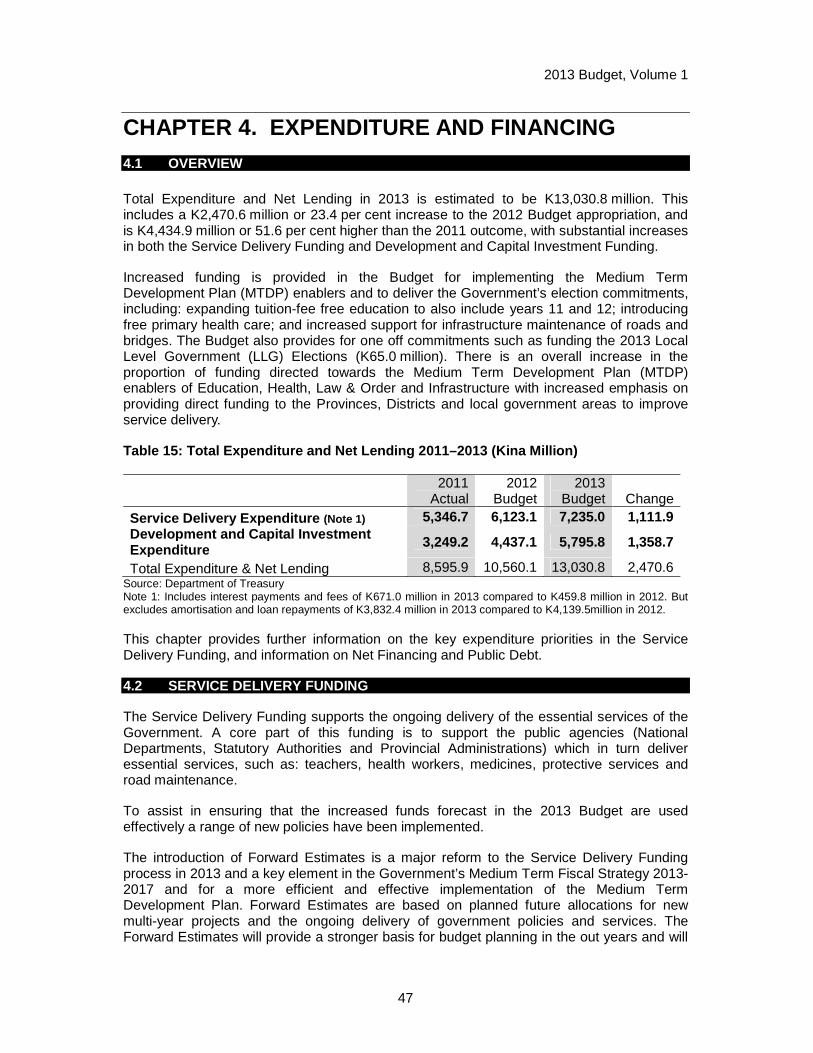
2013 Budget, Volume 1
47
CHAPTER 4. EXPENDITURE AND FINANCING 4.1 OVERVIEW Total Expenditure and Net Lending in 2013 is estimated to be K13,030.8 million. This includes a K2,470.6 million or 23.4 per cent increase to the 2012 Budget appropriation, and is K4,434.9 million or 51.6 per cent higher than the 2011 outcome, with substantial increases in both the Service Delivery Funding and Development and Capital Investment Funding.
Increased funding is provided in the Budget for implementing the Medium Term Development Plan (MTDP) enablers and to deliver the Government’s election commitments, including: expanding tuition-fee free education to also include years 11 and 12; introducing free primary health care; and increased support for infrastructure maintenance of roads and bridges. The Budget also provides for one off commitments such as funding the 2013 Local Level Government (LLG) Elections (K65.0 million). There is an overall increase in the proportion of funding directed towards the Medium Term Development Plan (MTDP) enablers of Education, Health, Law & Order and Infrastructure with increased emphasis on providing direct funding to the Provinces, Districts and local government areas to improve service delivery.
Table 15: Total Expenditure and Net Lending 2011–20 13 (Kina Million)
2011
Actual 2012
Budget 2013
Budget Change Service Delivery Expenditure (Note 1) 5,346.7 6,123.1 7,235.0 1,111.9 Development and Capital Investment Expenditure 3,249.2 4,437.1 5,795.8 1,358.7
Total Expenditure & Net Lending 8,595.9 10,560.1 13,030.8 2,470.6 Source: Department of Treasury Note 1: Includes interest payments and fees of K671.0 million in 2013 compared to K459.8 million in 2012. But excludes amortisation and loan repayments of K3,832.4 million in 2013 compared to K4,139.5million in 2012.
This chapter provides further information on the key expenditure priorities in the Service Delivery Funding, and information on Net Financing and Public Debt.
4.2 SERVICE DELIVERY FUNDING
The Service Delivery Funding supports the ongoing delivery of the essential services of the Government. A core part of this funding is to support the public agencies (National Departments, Statutory Authorities and Provincial Administrations) which in turn deliver essential services, such as: teachers, health workers, medicines, protective services and road maintenance.
To assist in ensuring that the increased funds forecast in the 2013 Budget are used effectively a range of new policies have been implemented.
The introduction of Forward Estimates is a major reform to the Service Delivery Funding process in 2013 and a key element in the Government’s Medium Term Fiscal Strategy 2013-2017 and for a more efficient and effective implementation of the Medium Term Development Plan. Forward Estimates are based on planned future allocations for new multi-year projects and the ongoing delivery of government policies and services. The Forward Estimates will provide a stronger basis for budget planning in the out years and will
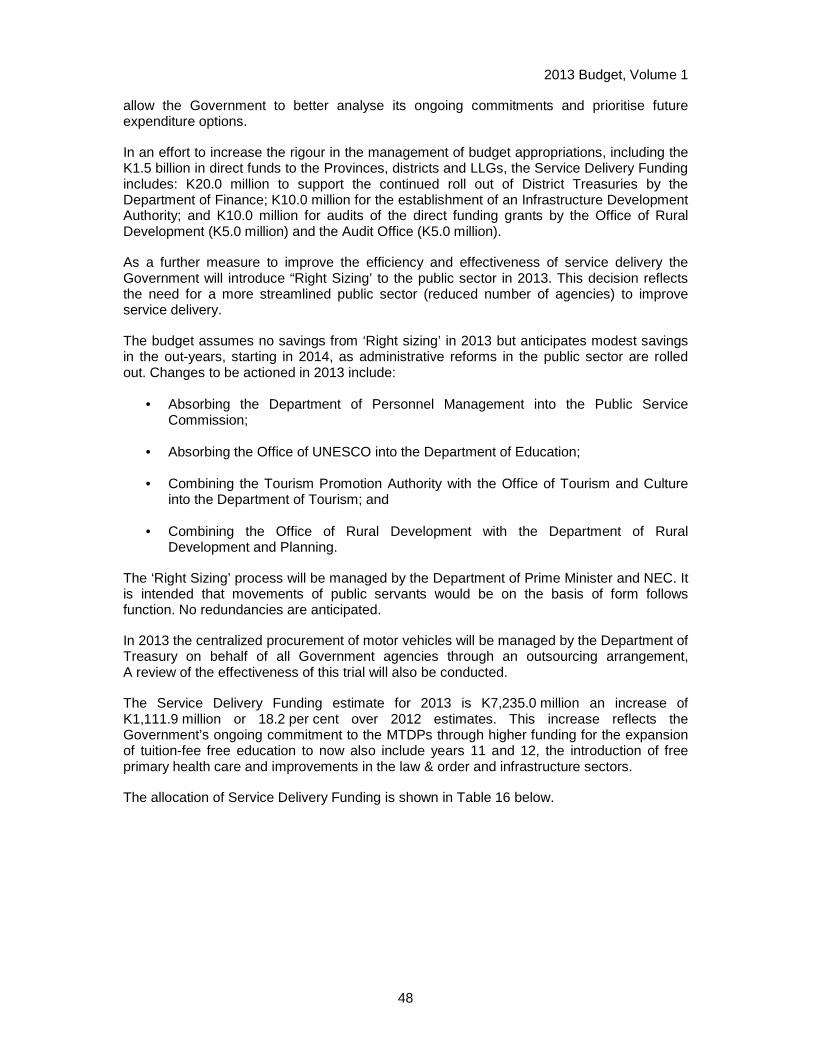
2013 Budget, Volume 1
48
allow the Government to better analyse its ongoing commitments and prioritise future expenditure options.
In an effort to increase the rigour in the management of budget appropriations, including the K1.5 billion in direct funds to the Provinces, districts and LLGs, the Service Delivery Funding includes: K20.0 million to support the continued roll out of District Treasuries by the Department of Finance; K10.0 million for the establishment of an Infrastructure Development Authority; and K10.0 million for audits of the direct funding grants by the Office of Rural Development (K5.0 million) and the Audit Office (K5.0 million).
As a further measure to improve the efficiency and effectiveness of service delivery the Government will introduce “Right Sizing’ to the public sector in 2013. This decision reflects the need for a more streamlined public sector (reduced number of agencies) to improve service delivery.
The budget assumes no savings from ‘Right sizing’ in 2013 but anticipates modest savings in the out-years, starting in 2014, as administrative reforms in the public sector are rolled out. Changes to be actioned in 2013 include:
• Absorbing the Department of Personnel Management into the Public Service Commission;
• Absorbing the Office of UNESCO into the Department of Education;
• Combining the Tourism Promotion Authority with the Office of Tourism and Culture into the Department of Tourism; and
• Combining the Office of Rural Development with the Department of Rural Development and Planning.
The ‘Right Sizing’ process will be managed by the Department of Prime Minister and NEC. It is intended that movements of public servants would be on the basis of form follows function. No redundancies are anticipated.
In 2013 the centralized procurement of motor vehicles will be managed by the Department of Treasury on behalf of all Government agencies through an outsourcing arrangement, A review of the effectiveness of this trial will also be conducted.
The Service Delivery Funding estimate for 2013 is K7,235.0 million an increase of K1,111.9 million or 18.2 per cent over 2012 estimates. This increase reflects the Government’s ongoing commitment to the MTDPs through higher funding for the expansion of tuition-fee free education to now also include years 11 and 12, the introduction of free primary health care and improvements in the law & order and infrastructure sectors.
The allocation of Service Delivery Funding is shown in Table 16 below.

2013 Budget, Volume 1
49
Table 16: Service Delivery Funding by Agency Type ( Kina Million)
2012 Budget
2013 Personnel
Emoluments
2013 Goods and
Services
2013 Total
National Departments 3,998.3 1,667.0 3,014.9 4,681.9 Statutory Authorities 360.7 264.8 115.8 380.6 Others (Debt Servicing) 459.8 0.0 671.0 671.0 Provinces 1,304.3 1,081.3 420.2 1,501.5 Total Service Delivery Funding 6,123.1 3,013.1 4,221.9 7,235.0
Source: Department of Treasury
Major Policy Initiatives – 2013 Service Delivery Funding
The Government will provide funding through the 2013 Budget for the following major national initiatives.
“Sustaining the Education Sector into the Future”
Funding for all Agencies, Provinces and items in Division 207 under Education will receive funding of K1,844.6 million an increase of K483.5 million. Tuition-fee free education will receive K682.0 million in 2013 an increase of K30.0 million to include its extension to Grades 11 and 12 and a further K11.0 million to fund the national school exams.
Funding of K10.5 million in Division 207 in the key MTDP enabler of Education is included for independence scholarships (K7.0 million) and outstanding utility bills to UPNG (K3.5 million).
Provinces will receive K797.9 million for education an increase of K92.6 million or 13.1 per cent. This includes K721.3 million for Personnel Emoluments 3,132 new teachers will be recruited to work in provincial schools, a total of 51,457 primary and secondary teachers. In addition, the Basic Education Function Grant to Provinces is K76.6 million under Goods and Services an increase of K17.1 million or 28.8 per cent.
In 2013 the Government will provide additional funding of K2.5 million or 2.1 per cent to Universities increasing total funding to K120.7 million.
The Office of Higher Education (OHE) will receive K51.6 million, an increase of K2.4 million or 4.8 per cent. This funding includes: K6.5 million to continue the National Scholarship Scheme that sponsors over 10,200 students with K600 each per year; and K38.2 million for the existing Tertiary Education Scholarship and Assistance Scheme (TESAS).

2013 Budget, Volume 1
50
Table 17: Education (Kina Million)
2012 Revised
Appropriation
2013 Personnel
Emoluments (K Millions)
2013 Goods and Services
(K Millions)
2013 Total
Education Department 482.2 117.9 740.0 857.9 Office of Higher Education 49.2 2.8 48.8 51.6 Universities 118.3 105.9 14.9 120.7 Other Agencies 5.9 4.2 1.8 6.0 Subtotal 655.5 230.8 805.5 1,036.2 Teacher Salary and Leave Fares (Provinces) 607.4 679.1 0.0 679.1 Teacher Salary and Leave Fares (ABG) 38.4 42.2 0.0 42.2 Provinces Education Function Grant 59.5 0.0 76.6 76.6 Subtotal Provinces 705.3 721.3 76.6 797.9 Independence Scholarships 0.0 0.0 7.0 7.0 Outstanding Utilities (UPNG) 0.0 0.0 3.5 3.5 Subtotal Division 207 0.0 0.0 10.5 10.5 Total 1,361.1 952.6 892.6 1,844.6
Source: Department of Treasury. Note: Differences in total due to rounding.
“Ongoing Commitment to the Health Sector”
In 2013 total funding for all agencies in the Health sector including Provinces and Health related expenditure in Division 207 will be K888.1 million an increase of K177.6 million.
This increase is driven by funding in Division 207 of (i) K75.0 million for various health workers awards/allowances and (ii) K20.0 million for free primary health care.
The implementation of free primary health care will have two elements. The first is the additional K20.0 million to offset the fees previously collected by hospitals. The second component is increased infrastructure funding for hospitals, including K300.0 million over four years, K50.0 million in 2013, for the redevelopment of POM General Hospital.
For Personnel Emoluments, health sector agencies will have an increase of K66.7 million or 20.3 per cent bringing total funding to K395.2 million. Hospital Management Services (HMS) will have the highest increase of K50.6 million or 19.3 per cent bringing total funding for HMS to K427.6 million in 2013. The increase is to cater for the current health workers agreement with the Government and the recruitment of 949 additional staff.
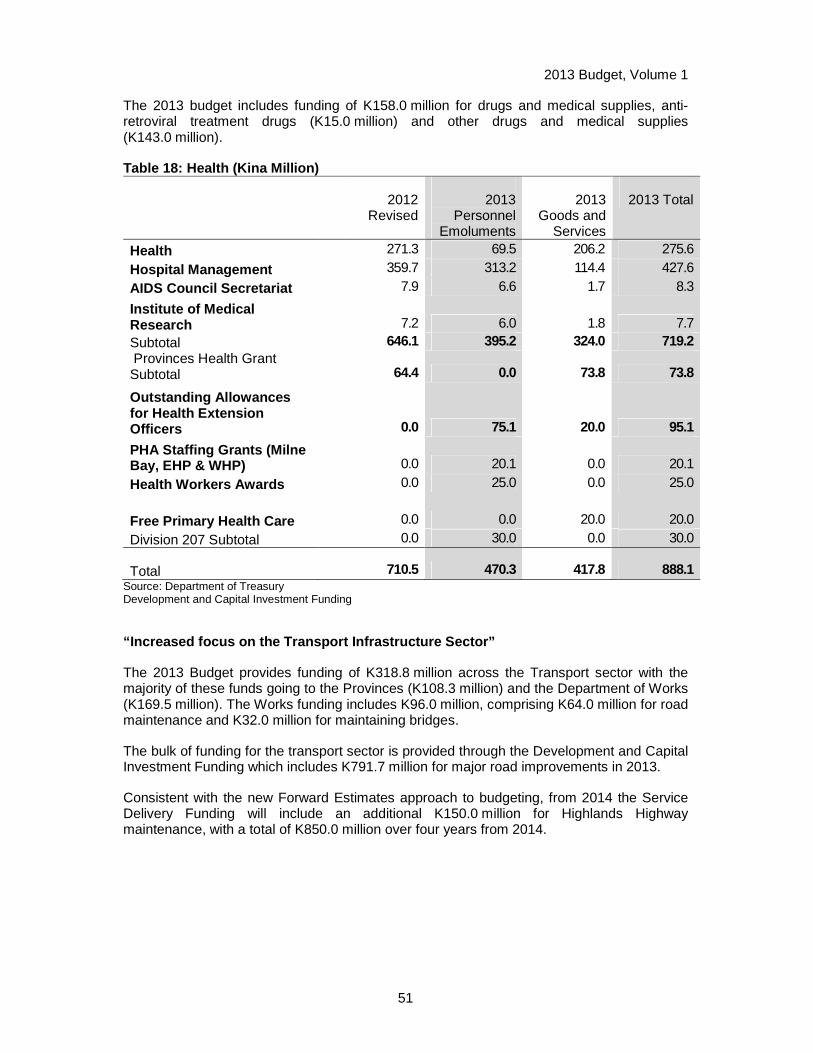
2013 Budget, Volume 1
51
The 2013 budget includes funding of K158.0 million for drugs and medical supplies, anti-retroviral treatment drugs (K15.0 million) and other drugs and medical supplies (K143.0 million).
Table 18: Health (Kina Million)
2012 Revised
2013 Personnel
Emoluments
2013 Goods and
Services
2013 Total
Health 271.3 69.5 206.2 275.6
Hospital Management 359.7 313.2 114.4 427.6
AIDS Council Secretariat 7.9 6.6 1.7 8.3
Institute of Medical Research 7.2 6.0 1.8 7.7 Subtotal 646.1 395.2 324.0 719.2 Provinces Health Grant Subtotal 64.4 0.0 73.8 73.8
Outstanding Allowances for Health Extension Officers 0.0 75.1 20.0 95.1
PHA Staffing Grants (Milne Bay, EHP & WHP) 0.0 20.1 0.0 20.1
Health Workers Awards 0.0 25.0 0.0 25.0
Free Primary Health Care 0.0 0.0 20.0 20.0
Division 207 Subtotal 0.0 30.0 0.0 30.0
Total 710.5 470.3 417.8 888.1 Source: Department of Treasury Development and Capital Investment Funding
“Increased focus on the Transport Infrastructure Se ctor”
The 2013 Budget provides funding of K318.8 million across the Transport sector with the majority of these funds going to the Provinces (K108.3 million) and the Department of Works (K169.5 million). The Works funding includes K96.0 million, comprising K64.0 million for road maintenance and K32.0 million for maintaining bridges.
The bulk of funding for the transport sector is provided through the Development and Capital Investment Funding which includes K791.7 million for major road improvements in 2013.
Consistent with the new Forward Estimates approach to budgeting, from 2014 the Service Delivery Funding will include an additional K150.0 million for Highlands Highway maintenance, with a total of K850.0 million over four years from 2014.
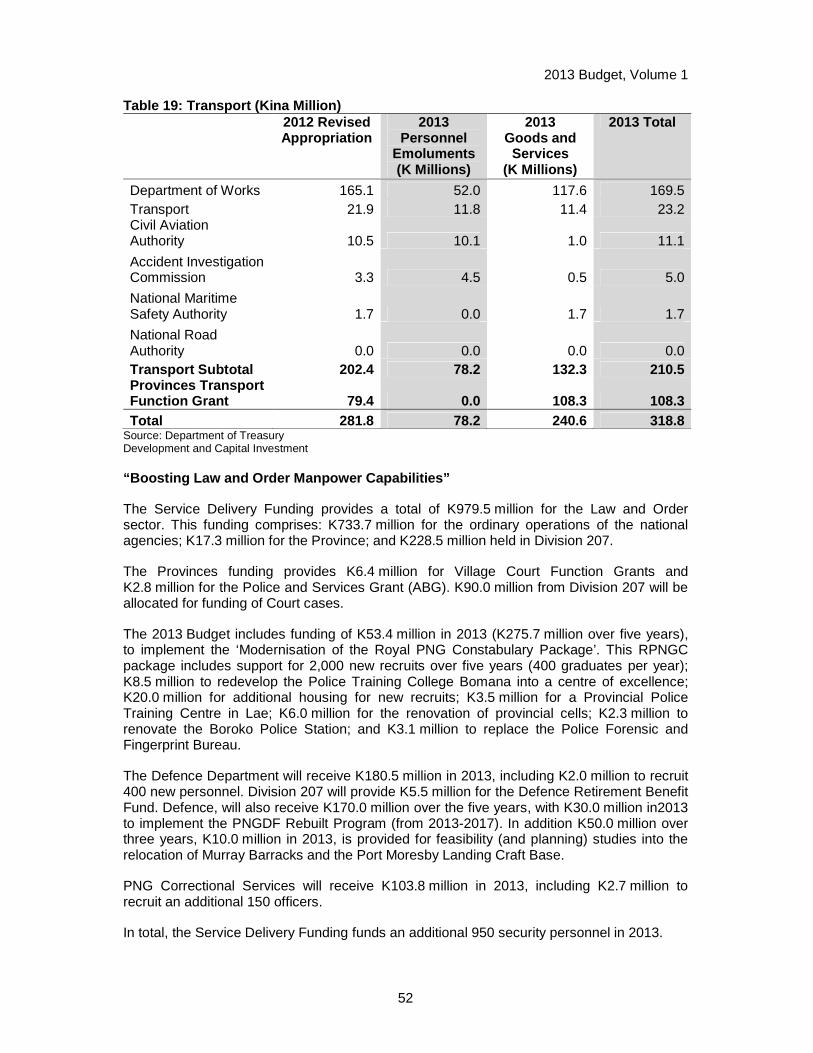
2013 Budget, Volume 1
52
Table 19: Transport (Kina Million)
2012 Revised Appropriation
2013 Personnel
Emoluments (K Millions)
2013 Goods and Services
(K Millions)
2013 Total
Department of Works 165.1 52.0 117.6 169.5 Transport 21.9 11.8 11.4 23.2 Civil Aviation Authority 10.5 10.1 1.0 11.1
Accident Investigation Commission 3.3 4.5 0.5 5.0
National Maritime Safety Authority 1.7 0.0 1.7 1.7
National Road Authority 0.0 0.0 0.0 0.0 Transport Subtotal 202.4 78.2 132.3 210.5 Provinces Transport Function Grant 79.4 0.0 108.3 108.3 Total 281.8 78.2 240.6 318.8
Source: Department of Treasury Development and Capital Investment
“Boosting Law and Order Manpower Capabilities”
The Service Delivery Funding provides a total of K979.5 million for the Law and Order sector. This funding comprises: K733.7 million for the ordinary operations of the national agencies; K17.3 million for the Province; and K228.5 million held in Division 207.
The Provinces funding provides K6.4 million for Village Court Function Grants and K2.8 million for the Police and Services Grant (ABG). K90.0 million from Division 207 will be allocated for funding of Court cases.
The 2013 Budget includes funding of K53.4 million in 2013 (K275.7 million over five years), to implement the ‘Modernisation of the Royal PNG Constabulary Package’. This RPNGC package includes support for 2,000 new recruits over five years (400 graduates per year); K8.5 million to redevelop the Police Training College Bomana into a centre of excellence; K20.0 million for additional housing for new recruits; K3.5 million for a Provincial Police Training Centre in Lae; K6.0 million for the renovation of provincial cells; K2.3 million to renovate the Boroko Police Station; and K3.1 million to replace the Police Forensic and Fingerprint Bureau.
The Defence Department will receive K180.5 million in 2013, including K2.0 million to recruit 400 new personnel. Division 207 will provide K5.5 million for the Defence Retirement Benefit Fund. Defence, will also receive K170.0 million over the five years, with K30.0 million in2013 to implement the PNGDF Rebuilt Program (from 2013-2017). In addition K50.0 million over three years, K10.0 million in 2013, is provided for feasibility (and planning) studies into the relocation of Murray Barracks and the Port Moresby Landing Craft Base.
PNG Correctional Services will receive K103.8 million in 2013, including K2.7 million to recruit an additional 150 officers.
In total, the Service Delivery Funding funds an additional 950 security personnel in 2013.
2013 Budget, Volume 1
53
Table 20: Law and Order (Kina Million) 2012
Revised 2013 Personnel Emoluments
2013 Goods and Services
2013 Total
Judiciary Services 73.8 0.0 75.1 75.1
Magisterial Services 34.8 28.2 9.4 37.6
Correctional Institutions 107.0 62.8 41.0 103.8
Police 378.1 169.7 90.5 260.3
Defence 201.6 101.7 78.7 180.5
Others 72.4 42.6 33.8 76.4
Subtotal 870.5 405.1 328.6 733.7 Village Court Allowances/Function Grant 3.6 8.1 6.4 14.5 Police and Services Grant (ABG) 2.8 0.0 2.8 2.8 Provinces Law and Order Grant 6.4 8.1 9.2 17.3 Defence Retirement Benefit Fund 0.0 5.5 0.0 5.5
Court Cases 0.0 0.0 90.0 90.0
PNG LNG Support - Police 0.0 0.0 15.0 15.0 LLG Elections - Security Operations
0.0 0.0 15.0 15.0
Modernisation of the RPNG (includes 400 recruits per annum)
0.0 0.0
53.0 53.0 Legal Brief Out (Attorney General)
0.0 0.0 10.0 10.0
PNGDF Rebuilt Programs 0.0 0.0 30.0 30.0 Feasibility Study for Murray Barracks & Relocating Landing Craft Base (PNGDF)
0.0 0.0
10.0 10.0
Division 207 0.0 5.5 223.0 228.5
Total 874.1 418.7 560.8 979.5 Source: Department of Treasury
Agriculture and Small Business
The Service Delivery Funding will provide K231.8 million to fund Agriculture and Small Business Enterprises in 2013. Funds are allocated in Division 207 for the National Development Bank, subject to the agreement of new operational guidelines for funding small and medium enterprises (including those in tourism) and a requirement for 30 per cent of NDB funds to be allocated for women.
K5.0 million is also allocated for the development of a national SME policy and K3.0 million to develop an integrated agriculture policy.
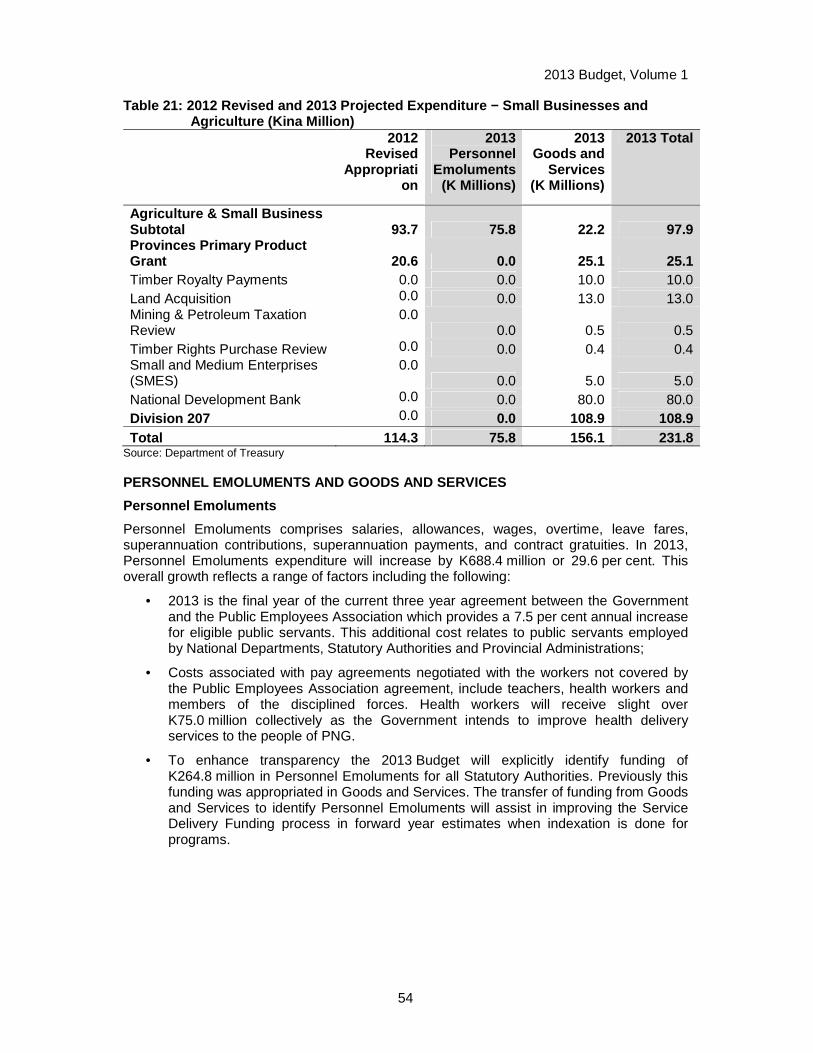
2013 Budget, Volume 1
54
Table 21: 2012 Revised and 2013 Projected Expenditu re − Small Businesses and Agriculture (Kina Million)
2012 Revised
Appropriation
2013 Personnel
Emoluments (K Millions)
2013 Goods and
Services (K Millions)
2013 Total
Agriculture & Small Business Subtotal 93.7 75.8 22.2 97.9 Provinces Primary Product Grant 20.6 0.0 25.1 25.1 Timber Royalty Payments 0.0 0.0 10.0 10.0 Land Acquisition 0.0 0.0 13.0 13.0 Mining & Petroleum Taxation Review
0.0 0.0 0.5 0.5
Timber Rights Purchase Review 0.0 0.0 0.4 0.4 Small and Medium Enterprises (SMES)
0.0 0.0 5.0 5.0
National Development Bank 0.0 0.0 80.0 80.0 Division 207 0.0 0.0 108.9 108.9 Total 114.3 75.8 156.1 231.8
Source: Department of Treasury
PERSONNEL EMOLUMENTS AND GOODS AND SERVICES
Personnel Emoluments
Personnel Emoluments comprises salaries, allowances, wages, overtime, leave fares, superannuation contributions, superannuation payments, and contract gratuities. In 2013, Personnel Emoluments expenditure will increase by K688.4 million or 29.6 per cent. This overall growth reflects a range of factors including the following:
• 2013 is the final year of the current three year agreement between the Government and the Public Employees Association which provides a 7.5 per cent annual increase for eligible public servants. This additional cost relates to public servants employed by National Departments, Statutory Authorities and Provincial Administrations;
• Costs associated with pay agreements negotiated with the workers not covered by the Public Employees Association agreement, include teachers, health workers and members of the disciplined forces. Health workers will receive slight over K75.0 million collectively as the Government intends to improve health delivery services to the people of PNG.
• To enhance transparency the 2013 Budget will explicitly identify funding of K264.8 million in Personnel Emoluments for all Statutory Authorities. Previously this funding was appropriated in Goods and Services. The transfer of funding from Goods and Services to identify Personnel Emoluments will assist in improving the Service Delivery Funding process in forward year estimates when indexation is done for programs.

2013 Budget, Volume 1
55
Table 22: Personnel Emoluments (Kina Millions) 2011Actuals 2012 Revised 2013
2013
Change (%)
National Departments 1,308.9 1,354.1 1,667.0 23.1% Statutory Authorities(1) 0.0 0.0 264.8 Provinces 1,044.4 970.5 1,081.2 11.4% Total 2,353.3 2,324.6 3,013.0 29.6%
Source: Department of Treasury (1) This represents a transfer of funding from Goods and Services to Personnel Emoluments in the 2013 Budget for Statutory Authorities.
Personnel Emoluments – National Departments
In 2013 Personnel Emoluments for National Departments will increase by K312.9 million or 23.1 per cent. Apart from meeting the cost of existing wage agreements, major drivers of this Personnel Emoluments growth include;
• K20.1 million held in Division 207 for outstanding allowances for health extension workers;
• K25.0 million held in Division 207 for Provincial Health Authority staff grants for Milne Bay, Eastern Highlands and Western Highlands;
• K30.0 million Division 207 for allowances health worker employed by the Hospital Management Service;
• K50.0 million for the recruitment of 994 additional health workers by the Hospital Management Service;
• K18.7 million for the Department of Defence for the recruitment and training of new personnel; and
• K14.1 million for the Royal PNG Constabulary including funding for the recruitment of 400 new officers.
• K12.9 million for the Department of Education for the recruitment and training of new staff and teachers.
Table 23: Personnel Emoluments Top Five Increases ( Kina Millions)
2012 Revised
Appropriation Personnel Emoluments
(K Millions)
2013 Personnel
Emoluments (K Millions)
Change (K Millions)
% Change
Treasury & Finance Misc. 222.0 343.8 121.8 54.9%
Hospital Management Services 262.5 313.2 50.6 19.3% Defence 83.0 101.7 18.7 22.6% Police 155.6 169.7 14.1 9.1% Education 105.0 117.9 12.9 12.3%
828.1 1,046.3 218.3 26.4%
Personnel Emoluments – Commercial and Statutory Aut horities
In 2013, all Statutory Authorities will receive direct appropriations for Personnel Emoluments rather than this funding being included as part of the Agency’s goods and services
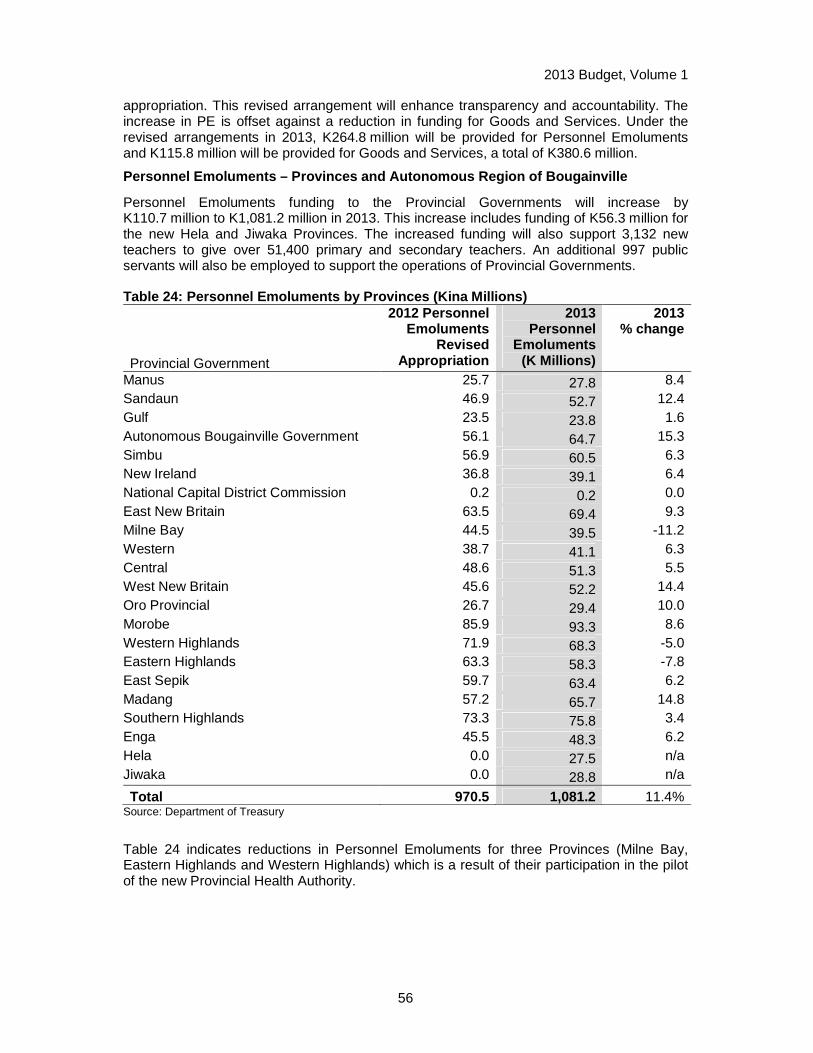
2013 Budget, Volume 1
56
appropriation. This revised arrangement will enhance transparency and accountability. The increase in PE is offset against a reduction in funding for Goods and Services. Under the revised arrangements in 2013, K264.8 million will be provided for Personnel Emoluments and K115.8 million will be provided for Goods and Services, a total of K380.6 million.
Personnel Emoluments – Provinces and Autonomous Reg ion of Bougainville
Personnel Emoluments funding to the Provincial Governments will increase by K110.7 million to K1,081.2 million in 2013. This increase includes funding of K56.3 million for the new Hela and Jiwaka Provinces. The increased funding will also support 3,132 new teachers to give over 51,400 primary and secondary teachers. An additional 997 public servants will also be employed to support the operations of Provincial Governments.
Table 24: Personnel Emoluments by Provinces (Kina M illions)
Provincial Government
2012 Personnel Emoluments
Revised Appropriation
2013 Personnel
Emoluments (K Millions)
2013 % change
Manus 25.7 27.8 8.4 Sandaun 46.9 52.7 12.4 Gulf 23.5 23.8 1.6 Autonomous Bougainville Government 56.1 64.7 15.3 Simbu 56.9 60.5 6.3 New Ireland 36.8 39.1 6.4 National Capital District Commission 0.2 0.2 0.0 East New Britain 63.5 69.4 9.3 Milne Bay 44.5 39.5 -11.2 Western 38.7 41.1 6.3 Central 48.6 51.3 5.5 West New Britain 45.6 52.2 14.4 Oro Provincial 26.7 29.4 10.0 Morobe 85.9 93.3 8.6 Western Highlands 71.9 68.3 -5.0 Eastern Highlands 63.3 58.3 -7.8 East Sepik 59.7 63.4 6.2 Madang 57.2 65.7 14.8 Southern Highlands 73.3 75.8 3.4 Enga 45.5 48.3 6.2 Hela 0.0 27.5 n/a Jiwaka 0.0 28.8 n/a
Total 970.5 1,081.2 11.4% Source: Department of Treasury
Table 24 indicates reductions in Personnel Emoluments for three Provinces (Milne Bay, Eastern Highlands and Western Highlands) which is a result of their participation in the pilot of the new Provincial Health Authority.
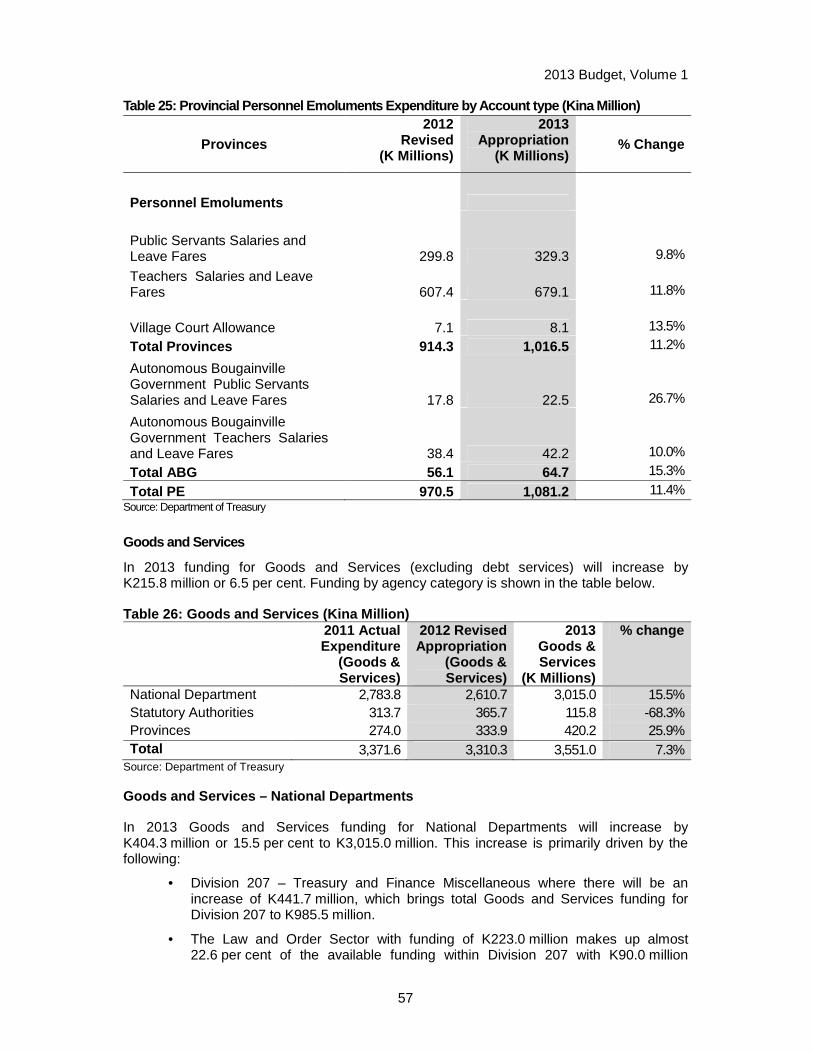
2013 Budget, Volume 1
57
Table 25: Provincial Personnel Emoluments Expenditu re by Account type (Kina Million)
Provinces 2012
Revised (K Millions)
2013 Appropriation
(K Millions) % Change
Personnel Emoluments
Public Servants Salaries and Leave Fares 299.8 329.3 9.8%
Teachers Salaries and Leave Fares 607.4 679.1 11.8%
Village Court Allowance 7.1 8.1 13.5%
Total Provinces 914.3 1,016.5 11.2%
Autonomous Bougainville Government Public Servants Salaries and Leave Fares 17.8 22.5 26.7%
Autonomous Bougainville Government Teachers Salaries and Leave Fares 38.4 42.2 10.0%
Total ABG 56.1 64.7 15.3%
Total PE 970.5 1,081.2 11.4% Source: Department of Treasury
Goods and Services
In 2013 funding for Goods and Services (excluding debt services) will increase by K215.8 million or 6.5 per cent. Funding by agency category is shown in the table below.
Table 26: Goods and Services (Kina Million)
2011 Actual Expenditure
(Goods & Services)
2012 Revised Appropriation
(Goods & Services)
2013 Goods & Services
(K Millions)
% chan ge
National Department 2,783.8 2,610.7 3,015.0 15.5% Statutory Authorities 313.7 365.7 115.8 -68.3% Provinces 274.0 333.9 420.2 25.9% Total 3,371.6 3,310.3 3,551.0 7.3%
Source: Department of Treasury
Goods and Services – National Departments
In 2013 Goods and Services funding for National Departments will increase by K404.3 million or 15.5 per cent to K3,015.0 million. This increase is primarily driven by the following:
• Division 207 – Treasury and Finance Miscellaneous where there will be an increase of K441.7 million, which brings total Goods and Services funding for Division 207 to K985.5 million.
• The Law and Order Sector with funding of K223.0 million makes up almost 22.6 per cent of the available funding within Division 207 with K90.0 million
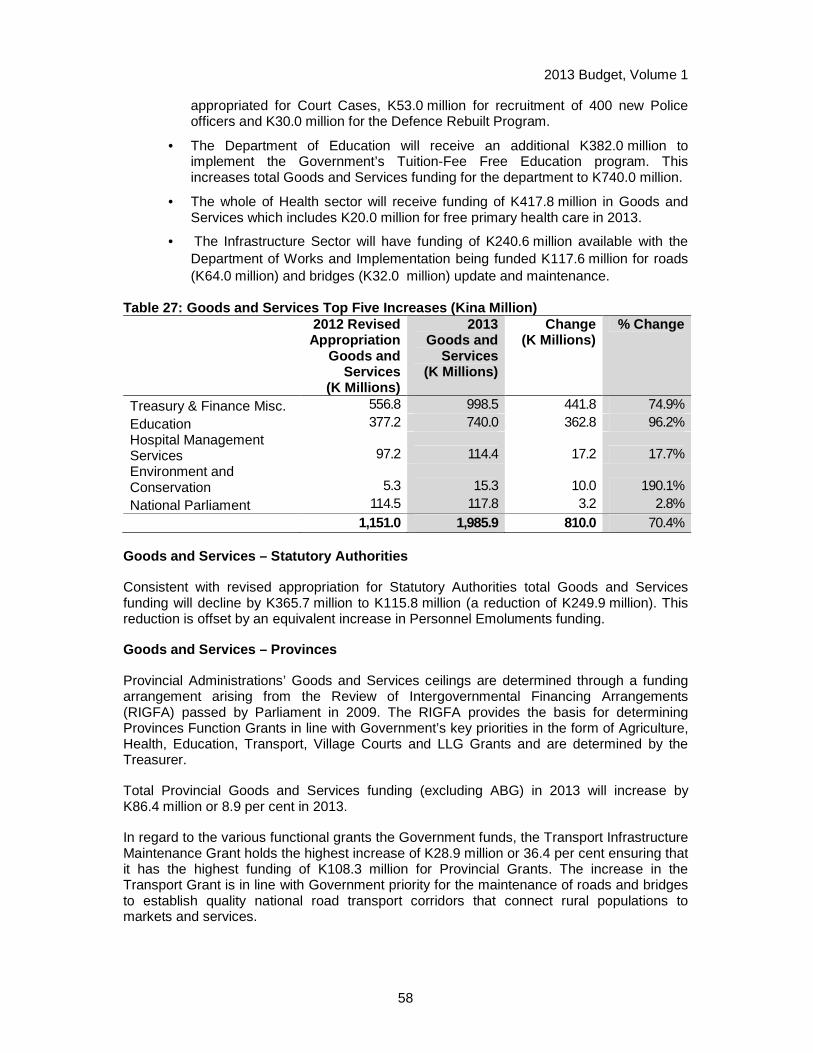
2013 Budget, Volume 1
58
appropriated for Court Cases, K53.0 million for recruitment of 400 new Police officers and K30.0 million for the Defence Rebuilt Program.
• The Department of Education will receive an additional K382.0 million to implement the Government’s Tuition-Fee Free Education program. This increases total Goods and Services funding for the department to K740.0 million.
• The whole of Health sector will receive funding of K417.8 million in Goods and Services which includes K20.0 million for free primary health care in 2013.
• The Infrastructure Sector will have funding of K240.6 million available with the Department of Works and Implementation being funded K117.6 million for roads (K64.0 million) and bridges (K32.0 million) update and maintenance.
Table 27: Goods and Services Top Five Increases (Ki na Million)
2012 Revised Appropriation
Goods and Services
(K Millions)
2013 Goods and
Services (K Millions)
Change (K Millions)
% Change
Treasury & Finance Misc. 556.8 998.5 441.8 74.9% Education 377.2 740.0 362.8 96.2% Hospital Management Services 97.2 114.4 17.2 17.7% Environment and Conservation 5.3 15.3 10.0 190.1% National Parliament 114.5 117.8 3.2 2.8%
1,151.0 1,985.9 810.0 70.4%
Goods and Services – Statutory Authorities
Consistent with revised appropriation for Statutory Authorities total Goods and Services funding will decline by K365.7 million to K115.8 million (a reduction of K249.9 million). This reduction is offset by an equivalent increase in Personnel Emoluments funding.
Goods and Services – Provinces
Provincial Administrations’ Goods and Services ceilings are determined through a funding arrangement arising from the Review of Intergovernmental Financing Arrangements (RIGFA) passed by Parliament in 2009. The RIGFA provides the basis for determining Provinces Function Grants in line with Government’s key priorities in the form of Agriculture, Health, Education, Transport, Village Courts and LLG Grants and are determined by the Treasurer.
Total Provincial Goods and Services funding (excluding ABG) in 2013 will increase by K86.4 million or 8.9 per cent in 2013.
In regard to the various functional grants the Government funds, the Transport Infrastructure Maintenance Grant holds the highest increase of K28.9 million or 36.4 per cent ensuring that it has the highest funding of K108.3 million for Provincial Grants. The increase in the Transport Grant is in line with Government priority for the maintenance of roads and bridges to establish quality national road transport corridors that connect rural populations to markets and services.

2013 Budget, Volume 1
59
Table 28: Provincial Goods and Services Grants (exc l. ABG) (Kina Million)
2011 Actual
Expenses
2012 Revised Appropriation
2013 Goods
and Services
Change
% Change
Administration Grant 16.7 10.7 11.7 1.0 9.3
Other Service Delivery Function Grant 46.0 23.2
41.5 18.3 79.1
Primary Production Function Grant 51.3 20.6
25.1 4.5 21.7
Health Grant 2.6 64.4
73.8 9.4 14.6
Education Grant
2.3 59.5
76.6 17.1 28.7
Transport/Infrastructure Maintenance Grant 9.0 79.4
108.3 28.9 36.4
Village Court Function Grant -0.0 3.6
6.4 2.8 0.0
LLG Grant 43.5 50.4 54.5 4.1 8.2
Total 170.6 311.8 398.0 86.2 27.6%
Table -29 ABG Functional Grants
2011 Actual
Expenses
2012 Revised Appropriation
2013 Goods
and Services
Change
% Change
Police and Services Grant - ABG 2.6 2.8 2.8 0.0 0.0 National Functions and Powers Grant - ABG
2.3 0.3 0.3 0.0 0.0
Recurrent Goods & Services Grant ABG 19.7 19.1 19.1 0.0 0.0 Total 24.6 22.3 22.3 0.0 0.0
Source for Table 12 and 12.1: Department of Treasury, NEFC
4.3 NON-FINANCIAL INSTRUCTIONS
To improve agency performance, accountability and transparency, the Government is again issuing a number of non-financial instructions in the budget context for implementation in 2013 and beyond. Progress with implementing these recommendations will be considered in determining 2014 Budget allocations. The Government has noted non-compliance with several instructions from the 2012 Budget with concern.
The instructions are intended to improve the performance of agencies and provincial administrations receiving government funding and continuing failure to implement these instructions will not be accepted in 2013 and will result in amended delegations or resourcing for non-complying agencies and administrations. Progress in implementing the instructions will be monitored during quarterly Budget reviews and agency reports to Budget Steering Committee.
2013 Budget, Volume 1
60
The directions include:
Trust Fund Management – The Government requires all agencies to report in the Budget process on public monies held in Trust accounts managed or controlled by GoPNG entities, including statutory authorities, provincial administrations and departments. In preparing these reports agencies must:
• Identify the balance of the Trust account as at 30 August 2013;
• Identify and reconcile movements in the Trust account balance up to 30 August 2013;
• Project movements in the Trust account balance for the remainder of the 2013 year;
• Provide a detailed Budget describing how the funds held in trust have been spent in 2012 and those that are to be expended in 2013;
• Provide details of interest earned on trust accounts; and
• Identify the legal authority for the creation and continuing operation of the Trust account.
Off -Budget Income – All agencies and provincial administrations receiving funding from the Service Delivery Funding must report their full operating budget including income or revenue earned through providing government services (e.g. immigration permits, work permits, licences, fees for services and the like) or royalties. Affected agencies are required to submit to the Treasury, for the consideration of the Budget Screening Committee, complete budgets for 2014 identifying their projected:
• Service Delivery Funding revenue;
• Development and Capital Investment Funding revenue;
• Any funds rolled over into 2013; and
• Non-Budget funded revenues.
Recruitment without financial resourcing - The Department of Personnel Management is required to report to Budget Screening Committee (BSC) after investigating instances of agencies recruiting new staff without first securing the financial resources necessary to meet the personnel emoluments costs of the new appointees. In the event that there is evidence that the head of agency, or their delegate, has exceeded their powers, those devolved powers are to be withdrawn and appropriate sanctions applied to individual officers in charge.
Organisational Reviews – The Government has noted that agencies are undertaking regular costly and time consuming organisational reviews. In future all such reviews intended for consideration by the Department of Personnel Management (DPM) must be submitted to DPM by 31 March in the year they are to be considered. DPM will implement this decision initially by issue of a circular.
Retrenchment and Retirement - The Government is concerned at the significant costs of current retrenchment provisions, the waste involved in maintaining unattached and effectively unemployed officers on payroll pending provision of funds for their retrenchment or retirement, and the variation in approaches by agencies and provincial governments to redundancy and retirement action. The Government believes that agencies and Provinces should be required to apply current funds or savings to meet the costs of genuine retrenchments and retirements before seeking Budget funding and should make greater use
2013 Budget, Volume 1
61
of existing disciplinary provisions in the case of underperforming or offending officers and that this policy should be applied nationally. The Department of Personnel Management is tasked with developing guidelines for this scheme and ensuring its enforcement from 2014.
In 2013 funding for retrenchment and retirement is to be allocated to DPM and managed in accordance within existing arrangements. In addition DPM is to provide the 2014 Budget Steering Committee with an estimate of the redundancy and retrenchment costs for all agencies in 2014.
Manpower – An element of the advice to Government required above is a review of manpower across all agencies to record total staff on strength, total vacancies and unattached numbers. This review is to be undertaken by DPM in conjunction with Treasury and Finance and provided to NEC with recommendations by June 2013.
Abolish ‘one-line’ appropriations – To increase transparency and accountability for the use of Government funding, ‘one-line’ budget appropriations, as used for Commercial and Statutory Authorities, will cease and be replaced by multi-line budgets and appropriations providing detailed splits under the categories of Personnel Emoluments and Goods and Services. Agencies which have failed to provide the required information for their 2013 Budgets estimates are required to do so for 2014. Treasury will inform the affected agencies during 2013.
Consolidated Revenue – The Government will establish a review of existing arrangements for the hypothecation of revenues to agencies (including departments and statutory authorities), with a view to returning these revenues to Consolidated Revenue for annual allocation in the Budget process. This review will be led by the Treasury in consultation with the Departments of the Prime Minister and NEC, Finance and DPM, and will also be required to advise on appropriate changes to the recurrent funding levels for affected agencies in lieu of existing hypothecation arrangements and be completed by mid 2013.
Transfers between Appropriation Items - All transfers between appropriation items during 2013 are to be reported in agency Budget submissions and in budget review quarterly reports. This includes transfers within PBS and IFMS approved by the Secretary of Treasury.
Provincial Governments’ Payroll Management - The Government notes with concern a consistent trend among Provincial Governments to over expend on salaries paid through the national Alesco payroll system. The Government has identified the worst offenders and has directed the Department of Personnel Management (DPM) to withdraw personnel delegations from the offending Provincial Administrations pending removal of ineligible individuals from the National payroll by the Provincial Administrations and the Department of Finance. The performance of other provinces and agencies is to be reviewed by DPM in 2013 and similar sanctions applied where there are significant breaches.
Compliance with the Public Finances (Management) Act 1995 (PFMA): the Department Heads for Finance and Treasury and DPM will work to operationalise the sanctions available under the Public Finances (Management) Act (PFMA) to ‘surcharge’ agency heads who breach the provisions of the PFMA. The results of their efforts are to be reported to NEC by mid 2013.
Public Service Housing - The continuing trend of agencies to seek to enter into ad hoc housing arrangements is inconsistent with Public Service employment conditions. The Government has suspended further all ad hoc arrangements until a Whole of Government housing policy is developed. This policy is to be consistent with any Public Service employment conditions that may be developed. The Departments of Treasury, Personnel
2013 Budget, Volume 1
62
Management and Housing will report back to Government in 2013 with costed options for the development and implementation of any new housing policy.
Agency Payroll Debts to the Department of Finance - Finance and Treasury will report to Budget Screening Committee in the context of the 2014 Budget on options to resolve the issue of outstanding payroll debts administered by the Finance Department for agencies and statutory bodies. Affected agencies will be consulted in developing options to resolve these outstanding debts, with due consideration of their capacity to repay the debts. In addition, appropriate options should be developed for enforcing penalties for non-repayment.
Consultants and Professional Service Providers - The Government commends agencies that have taken steps to reduce their reliance on consultants but remains of the view that there are still too many consultants and Professional Service Providers involved in the long term management of Government agencies. The Government is concerned at the long term nature and cost of many of these consultancy arrangements and has decided that agencies will continue to report in the Budget Process, identifying any consultancy exceeding six months or worth K150,000 or more total value (including all fees, allowances and gratuities);
Details of the specific task and timeframe the consultant is expected to undertake; Why the task cannot be undertaken by agency staff; Details of steps taken by the agency to address any skills gap and to reduce the reliance on external consultants; and Details (including duration and cost) of all consultancy or professional service contracts, entered into by the agency commencing 2010 and 2011.
In addition the Government has decided that Agencies' engagement of consultants in 2013 and beyond will be managed by Central Supply and Tenders Board through a public tender process and that consultants are not to be engaged for periods exceeding 6 months.
Special Appropriation Institutions – Currently special appropriation institutions such as the National Parliament and Judiciary Services are separately appropriated. Separate appropriation does not however exempt these institutions from scrutiny of their estimates or inclusion in the Budget process. All Special Appropriation Institutions must provide detail of their 2014 estimates to Budget Screening Committee in 2013.
Department of Works – All approved infrastructure projects are to be undertaken in consultation with the Department of Works. Agencies may only seek private sector implementation or supervision involvement where the Department of Works agrees it has capacity constraints and is unable to assist.
Commercial Statutory Agencies – Commercial statutory agencies (CSAs) are established to give them a measure of independence from government and the capacity to compete on an equal footing with the private sector. They are also given the capacity to be self-funding from their own revenue and expected to meet all normal outgoings (e.g. for legal costs). Portfolio agencies are not to provide additional funds to CSA’s to meet emergent circumstances without NEC approval and are to ensure CSA’s within the portfolio to meet the requirements of the Public Finances (Management) Act 1995, including the provision of quarterly reports to Treasury.
AGENCY SPECIFIC INSTRUCTIONS:
In addition to the above decisions which affect the Whole of Government, the Government has made a range of recommendations in relation to specific agencies. These include:
Utilities (Department of Environment) - The Government is concerned about the difficulties some agencies continue to have in effectively managing the cost of utilities. The
2013 Budget, Volume 1
63
Department of Environment and the Office of Climate Change are charged with the responsibility of providing advice and education to agencies on options to manage their resource consumption and reduce costs and report on its success to the Budget Screening Committee. No additional budget allocation will be provided.
National AIDS Council Secretariat (NACS) - The Council and Secretariat are not performing their co-ordination function and have no effective programs. The Department of Health is to arrange for an urgent review of the AIDS Council Secretariat with a view to having the NACS incorporated in the Department of Health by mid 2013 and arranging for amendment of the legislation setting up the National AIDS Council as necessary.
Department of Agriculture and Livestock – In view of persistent over-expenditure by the Department of Agriculture and Livestock (DAL) its Minister is requested to direct that the powers of the Secretary of DAL under Section 31 of the PFMA are no longer exercised pending investigation of the over expenditure and that a freeze on recruitment to DAL is commenced from 2012.
Membership of International Organisations (Departme nt of Foreign Affairs and Trade) PNG is a member of a variety of international and regional organisations, often at a substantial cost in terms of membership fees and travel associated with meeting participation. The membership of all such organisations is to be reviewed urgently by an independent Government Committee chaired by the Department of Foreign Affairs and Trade with a view to identifying those organisations where PNG participation had achieved specific, quantifiable outcomes of demonstrated value to PNG and the cessation of membership of organisations which fail to meet this test and a report and recommendations provided to the NEC by mid-2013.
Office of Tourism, Arts and Culture – There appears to be significant overlap in the functions of the Office of Tourism, Arts and Culture (OTAC), the Tourism Promotion Authority, the National Museum and Art Gallery and the National Cultural Commission. The functions of these agencies are to be reviewed by the Chief Secretary with assistance from appropriate central agencies with a view to rationalising their activities by 2014.
NASFUND - The financial health and strong financial position of NASFUND indicates there may no longer be a need to provide ongoing support to NASFUND. The Department of Treasury will discuss with NASFUND options and mechanisms for withdrawing GoPNG funding support for the entity, with financial allocations in support of NASFUND to cease by the end of 2013.
National Tripartite Consultative Council Secretaria t – the role and function of the National Tripartite Consultative Council is to be reviewed by the Department of Industrial Relations with a view to incorporating its Secretariat within the Department in 2013.
Central Supply and Tender Board (CSTB) – CSTB is required to provide NEC by early 2013 with a set of clear guidelines for Departments and agencies seeking approval for centrally co-ordinated tender processes and appropriate formal undertakings to specify the maximum length of time it will need for its deliberations at each stage of the tender process. These guidelines are to be workshopped with affected agencies. The CSTB compliance with these service obligations are to be reported quarterly to NEC through the Chief Secretary’s office.
National Museum and Art Gallery - The Museum is staffed significantly in excess of its approved establishment. In order to improve good governance and accountability to the NM&AG, its annual funding has been shifted from a one line agency to multi line item
2013 Budget, Volume 1
64
agency – commencing in 2013. Strict control over warrant releases will be undertaken in 2013.
Defence – the Government notes an increasing number of agencies are becoming involved in various elements of border security. To ensure that these activities are properly co-ordinated the Government has instructed that a co-ordinating committee be established, chaired by the Department of Defence. Other participating agencies should include Police, NIO, and the BDA.
Universities (All Government funded Universities) – Maintenance of facilities at all four government funded universities is inadequate and the level of requests for additional maintenance funds submitted is substantial. The Government has requested the four universities to provide to the Budget Screening Committee their fully costed maintenance plans for the next five years with appropriate approvals by university management commencing immediately. Plans should rely on existing resources only.
Legal Training Institute - The Institute, the Department of Justice and Attorney General, together with the Department of Treasury, the PNG Law Society, the Judiciary, the University of PNG and other relevant stakeholders, will examine and provide fully costed options to the 2012 Budget Screening Committee to increase the number of legal practitioners admitted to practice each year. The LTI will co-ordinate this task and report to the BSC in 2013.
Department of Defence - The Department of Defence and the Department of Treasury will jointly report back to the Budget Screening Committee in the 2014 Budget context with a detailed and fully costed Defence White Paper:
The options to be presented are to include high, medium and low cost options; the cost of the options presented are to contain estimates of costs for the period 2012-2016 from Defence; and the Department of Treasury is to be consulted in the development and costing of the options to be presented to Government.
National Volunteer Service – The Government remains concerned that the NVS lacks direction. Its achievements and structure are to be reviewed by the Department of Personnel Management with a view to its functions being transferred to the Department for Community Development by mid-2013.
Universities’ Tax Liabilities – Department of Treasury is to liaise with the Internal Revenue Commission to work out a schedule for the universities to retire the tax liability they have incurred and arrange for all universities to reduce the liability progressively. IRC is to ensure that universities meet their obligations to settle income tax in future. Universities are also to ensure that superannuation contributions to Nambawan Superannuation are made in a timely manner.
National Narcotics Bureau - The Government recognises the importance of the function of the National Narcotics Bureau (NNB). However, this function is not being effectively delivered and the National Narcotics Bureau is to immediately request the Department of Personnel Management to review the operations and functions of the NNB, and make recommendations to assist the Bureau to deliver on its objectives.
The Bureau should immediately submit a comprehensive corporate/annual plan for consideration by the responsible Minister including how its current appropriation will be used to produce measurable outcomes.

2013 Budget, Volume 1
65
National Youth Commission – The Department for Community Development is to arrange for a review of the National Youth Commission (NYC) with the view of having NYC incorporated in the Department for Community Development by the end of 2013 and amending the Act setting up the National Youth Commission.
Police, Correctional Services and Defence – All elements of the disciplined services appear to have difficulty in controlling expenditure on utilities, particularly in staff housing under their control. These agencies are to undertake a review of control measures (such as installing prepaid meters on housing) and report on measures taken to BSC in the context of the 2014 Budget.
Department of Health – The Health Department is currently paying for accommodation for its executive management at head office but accommodation allowances are already included within their contracts. DPM needs to immediately review all executive management positions' allowances and report to BSC in the context of the 2014 Budget.
In 2013 the National Department of Health needs to provide Treasury with a comprehensive list of awards for all cadres of health workers, providing information on MOA requirements indicating outstanding awards for previous and current employees.
PNG Fire Services - The Government is concerned that the PNG Fire Services is incapable of adequately containing fires that may occur at high rise buildings and require new specialist fire fighting equipment to attend to emergencies in these buildings. The Government instructed the Fire Services to expedite its current review of the options for funding such purchases without drawing down on the Budget, in particular the imposition of a Fire Services Levy on the insurance premiums payable by high rise building owners or a property tax levy targeted at higher rise buildings.
Solicitor General - Ineffective management of claims by agencies is a continuing problem and exposes the state to significant financial risk. The Office of the Solicitor General will immediately develop and implement in 2013 a program to better educate agencies on options and strategies for managing current and future claims, and report to BSC in the context of 2014 budget.
Independence Scholarships - The Government noted that the Independence Scholarships program had not been critically assessed for many years and that funds provided for a review last year had been redirected to fund scholarships. The effectiveness and value of the program is to be immediately reviewed by the Departments of Labour and Education, and report to BSC in the context of 2014 budget.
Attorney-General – The provinces’ Village Court system provides a very valuable first response means of resolving disputes but its officials are extremely poorly compensated for their often considerable efforts. The Attorney-General’s Department is to undertake an urgent review of Village Court Allowances and introducing substantial improvements in 2014 after full costs are reported to NEC.
National Road Authority (NRA) - The Government ceased NRA’s recurrent funding from 2011 as the agency receives significant off-Budget revenue from road user charges and should use these funds to meet its costs. The road user charge of 4 toea per litre diesel levy collected on behalf of the NRA by the IRC is held in an off-budget account. The road levy generates approximately K16.0 million annually, but the Government is concerned that more can be raised by applying the levy to diesel that is exported. NRA will report in a detailed 2014 Budget submission outlining its expenditure and revenue, with the view to appropriating NRA funding for road maintenance through the annual national budget, in lieu

2013 Budget, Volume 1
66
of collections received through IRC. In the interim IRC, in consultation with Customs is to expedite collection of the levy and pass on any outstanding payments to NRA.
Tourism Promotion Authority (TPA) - The TPA has developed the Tourism Master Plan 2007 – 2017. TPA is to work with Treasury department in developing this plan by costing out its implementation and prioritising work commencing in 2014.
National Gaming Control Board - The PNG National Gaming Control Board (NGCB) does not appear to be contributing to the income of the PNG National Sports Foundation as required. The NGCB is to submit in the context of 2014 budget, its Community Service Obligation (CSO) component, in detail, including any costs associated. In addition, the Auditor General is to be asked, through the Ministers for Treasury and Finance, to arrange for examination of the accounts of the PNG National Gaming Control Board and the Community Benefit Fund Trust Account and make appropriate recommendations to ensure compliance with relevant legislation and the Trust Deed.
Border Development Authority - The BSC noted that the Border Development Authority is seeking to establish a commercial shipping arm, PNG Maritime Ltd, and is proposing its rapid expansion through recurrent funding requests. The Government agreed that no government funds, either by way of appropriation or loan guarantee, should be considered for the commercial operation until a full feasibility study of PNG Maritime Ltd has been provided to Government, including the feasibility of alternative means of improving sea transport services and documenting consultations with the PNG Maritime Safety Authority. Internal Revenue Commission – There are problems in collecting revenue (e.g. fuel levy) from imported fuel (especially diesel) where that fuel has been imported for use by the importing company itself. The Internal Revenue Commission is to investigate the matter urgently and propose appropriate solutions to Treasury, if necessary including legislative changes.
4.4 FINANCING
The estimated budget deficit is expected to be K2,706.0million in 2013. This will require additional debt borrowing to fund the State’s cash needs.
The State’s financing methods for 2012 included:
• foreign currency denominated loans from our development partners for specific projects; and
• issuance of Kina denominated Inscribed Stock and Treasury Bills via tender for general funding and the funding of the PNG LNG equity shortfall.
For 2013 additional methods will be required to supplement those used in 2012 in order to achieve the financing task and to diversify the State’s funding sources by entering into new markets or means of issuance. The additional issuance methods for 2013 may comprise:
• direct placements of Inscribed Stock or Treasury Bills with investors (including Superannuation Funds);
• direct placements and public offerings of Infrastructure Bonds;
• loans from Superannuation Funds and/or Banks; and
• US dollar bond issued primarily to foreign investors.
The Government will prioritise funding from domestic financing sources that diversifies the State’s funding base whilst not affecting its traditional funding base. The Government will
2013 Budget, Volume 1
67
also seek to undertake some of this financing from major Superannuation Funds in PNG to assist in enriching these funds for the benefit of Papua New Guineans.
Foreign currency denominated loans from development partners
The Government will continue to drawdown on concessional loans with international financial institutions to assist with its development objectives. The Government intends to undertake net financing of K475.94 million (comprised of expected gross borrowings of K644.7 million and repayment (amortisation) of K168.8 million).
Inscribed Stock issued via tender
Net issuance of Inscribed Stock via tender is estimated to be K677.7 million, comprised of gross borrowings of K816.0 million (34 per cent increase in issuance from 2012) and maturities of K138.3 million.
In 2012, issuance was undertaken on a monthly basis from February to December into four lines of Inscribed Stock. For 2013, issuance will commence on a monthly basis in January and more than four Inscribed Stock lines may be issued into during the year. Based on investor preferences issuance may be conducted on a fortnightly basis if required.
Treasury Bills issued via tender
Net issuance of Treasury Bills via tender is estimated to be K312.4 million, comprised of gross borrowings of K3,642.6 million (a 2 per cent increase in issuance from 2012) and maturities of K3,330.2 million. Treasury Bill issuance will be mainly applied to rolling over existing stock.
Treasury Bills will be issued most weeks of the year with maturities of 182 and/or 364 days offered.
In 2012 Treasury Bills on issue are expected to comprise 45.9 per cent of the domestic debt portfolio, compared to the Medium Term Debt Strategy’s target range of 15.0 to 30.0 per cent to manage refinancing risk (the risk of being unable to roll over the debt when it matures). The greater issuance of Inscribed Stock to Treasury Bills will assist in reducing Treasury Bills on issue towards the target range.
Additional methods
Net issuance of Government debt by additional methods is estimated at K1,240.0 million.
This debt will be issued for terms of 5 years or more and preference will be given to financing options to fund the debt domestically, that increase the State’s investor base and that do not affect issuance of Inscribed Stock and Treasury Bills via tender.
This issuance will be undertaken in the first half of 2013 to lock in the State’s funding.
However, a US dollar issuance might be undertaken if required.
The performance of the borrowing program and all funding sources will be reviewed throughout the year and necessary adjustments to the program will be made as required.
4.5 PUBLIC DEBT
Total public debt is projected to increase from K8,653.2million in 2012 to K11,359.2 million at the end of 2013 as a result of the projected budget deficit for 2013. Similarly, debt as a
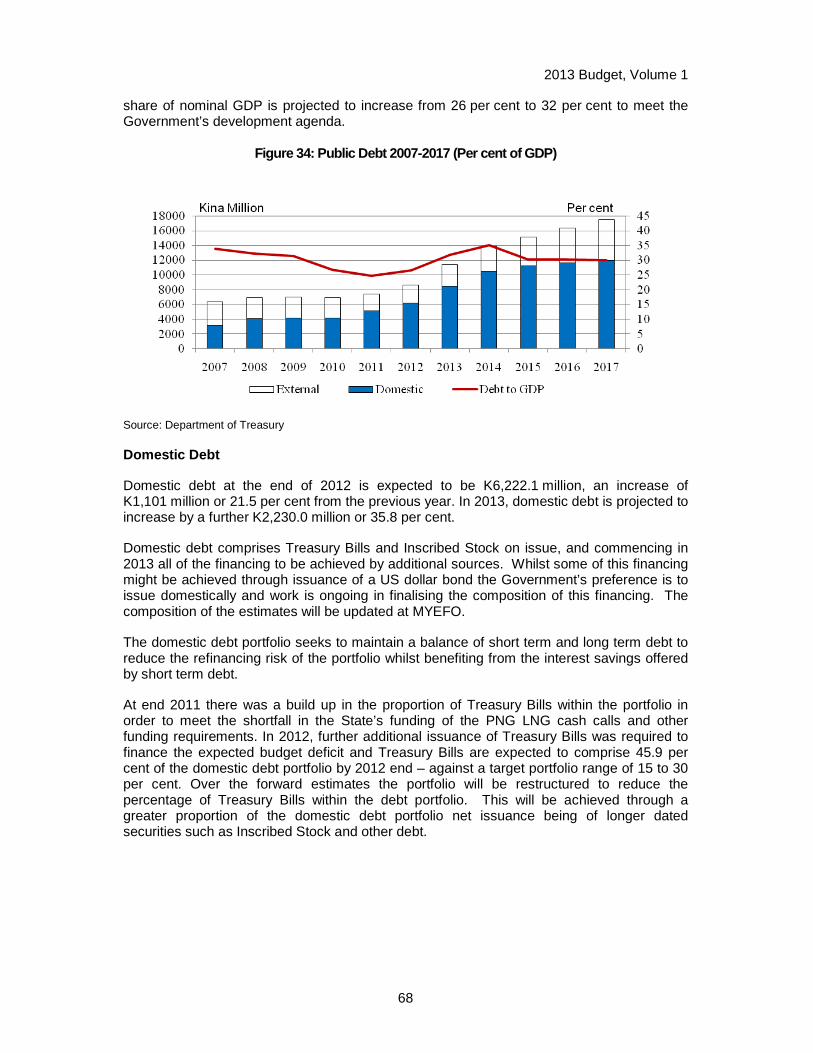
2013 Budget, Volume 1
68
share of nominal GDP is projected to increase from 26 per cent to 32 per cent to meet the Government’s development agenda.
Figure 34: Public Debt 2007-2017 (Per cent of GDP)
Source: Department of Treasury
Domestic Debt
Domestic debt at the end of 2012 is expected to be K6,222.1 million, an increase of K1,101 million or 21.5 per cent from the previous year. In 2013, domestic debt is projected to increase by a further K2,230.0 million or 35.8 per cent.
Domestic debt comprises Treasury Bills and Inscribed Stock on issue, and commencing in 2013 all of the financing to be achieved by additional sources. Whilst some of this financing might be achieved through issuance of a US dollar bond the Government’s preference is to issue domestically and work is ongoing in finalising the composition of this financing. The composition of the estimates will be updated at MYEFO.
The domestic debt portfolio seeks to maintain a balance of short term and long term debt to reduce the refinancing risk of the portfolio whilst benefiting from the interest savings offered by short term debt.
At end 2011 there was a build up in the proportion of Treasury Bills within the portfolio in order to meet the shortfall in the State’s funding of the PNG LNG cash calls and other funding requirements. In 2012, further additional issuance of Treasury Bills was required to finance the expected budget deficit and Treasury Bills are expected to comprise 45.9 per cent of the domestic debt portfolio by 2012 end – against a target portfolio range of 15 to 30 per cent. Over the forward estimates the portfolio will be restructured to reduce the percentage of Treasury Bills within the debt portfolio. This will be achieved through a greater proportion of the domestic debt portfolio net issuance being of longer dated securities such as Inscribed Stock and other debt.
2013 Budget, Volume 1
69
External Debt
External debt at the end of 2012 is expected to be K2,431.1 million, an increase of K140.3 million or 6.1 per cent from the previous year. In 2013, external debt is projected to increase by a further K475.9 million or 19.6 per cent.
The proposed Chinese Exim Bank loan is still being negotiated and is not included in the estimates for external financing. The Chinese Exim Bank loan is expected to be available from 2014.
External debt continues to be dominated by debts to international agencies (multilateral and bilateral creditors) who account for 98.7 per cent of external debt as at year-end 2012, with commercial loans accounting for the remaining 1.3 per cent.
International agencies provide project finance for many of our development projects, as capital works progresses on infrastructure projects the level of this borrowing will increase. The loans terms usually provide for a grace period of at least five years for principal repayments and repayment of principal by instalments over a 20 year period.
State Guaranteed Debt and Other Liabilities
Guarantees involve significant financial risk and Treasury is currently working towards producing a policy to guide all future guaranteesand willput this forward for endorsement once finalised in 2013.
As such, State guarantees are only given in exceptional circumstances. This includes the completion guarantee that the Government issued for the State’s share of the PNG LNG project debt of around US$2.5 billion (K5.4 billion). This guarantee will be in place until the project reaches the production phase.
Other significant liabilities of the State in addition to public debt and guaranteed debt include the IPBC’s borrowing to fund the State’s share of the LNG project of AU$1.7 billion (K3.8 billion) and unfunded superannuation liabilities of around K2.1 billion.
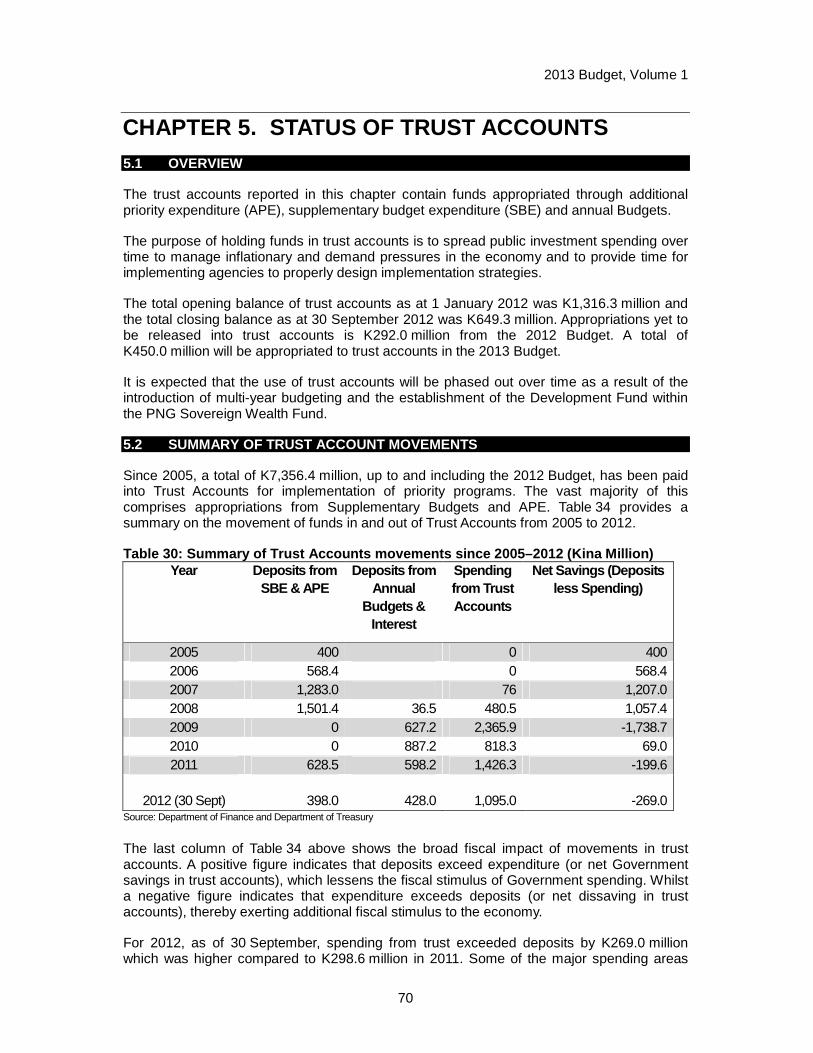
2013 Budget, Volume 1
70
CHAPTER 5. STATUS OF TRUST ACCOUNTS 5.1 OVERVIEW
The trust accounts reported in this chapter contain funds appropriated through additional priority expenditure (APE), supplementary budget expenditure (SBE) and annual Budgets.
The purpose of holding funds in trust accounts is to spread public investment spending over time to manage inflationary and demand pressures in the economy and to provide time for implementing agencies to properly design implementation strategies.
The total opening balance of trust accounts as at 1 January 2012 was K1,316.3 million and the total closing balance as at 30 September 2012 was K649.3 million. Appropriations yet to be released into trust accounts is K292.0 million from the 2012 Budget. A total of K450.0 million will be appropriated to trust accounts in the 2013 Budget.
It is expected that the use of trust accounts will be phased out over time as a result of the introduction of multi-year budgeting and the establishment of the Development Fund within the PNG Sovereign Wealth Fund.
5.2 SUMMARY OF TRUST ACCOUNT MOVEMENTS
Since 2005, a total of K7,356.4 million, up to and including the 2012 Budget, has been paid into Trust Accounts for implementation of priority programs. The vast majority of this comprises appropriations from Supplementary Budgets and APE. Table 34 provides a summary on the movement of funds in and out of Trust Accounts from 2005 to 2012.
Table 30: Summary of Trust Accounts movements since 2005–2012 (Kina Million) Year Deposits from
SBE & APE Deposits from
Annual Budgets &
Interest
Spending from Trust Accounts
Net Savings (Deposits less Spending)
2005 400 0 400 2006 568.4 0 568.4 2007 1,283.0 76 1,207.0 2008 1,501.4 36.5 480.5 1,057.4 2009 0 627.2 2,365.9 -1,738.7 2010 0 887.2 818.3 69.0 2011 628.5 598.2 1,426.3 -199.6
2012 (30 Sept) 398.0 428.0 1,095.0 -269.0
Source: Department of Finance and Department of Treasury
The last column of Table 34 above shows the broad fiscal impact of movements in trust accounts. A positive figure indicates that deposits exceed expenditure (or net Government savings in trust accounts), which lessens the fiscal stimulus of Government spending. Whilst a negative figure indicates that expenditure exceeds deposits (or net dissaving in trust accounts), thereby exerting additional fiscal stimulus to the economy.
For 2012, as of 30 September, spending from trust exceeded deposits by K269.0 million which was higher compared to K298.6 million in 2011. Some of the major spending areas
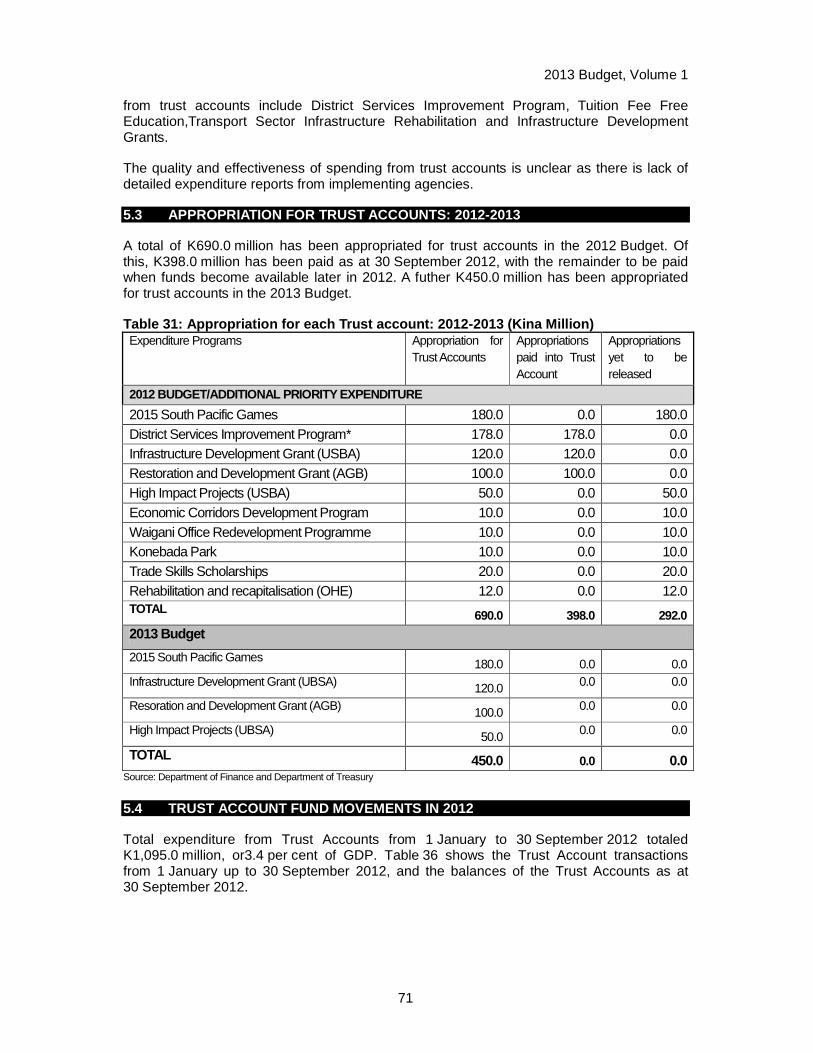
2013 Budget, Volume 1
71
from trust accounts include District Services Improvement Program, Tuition Fee Free Education,Transport Sector Infrastructure Rehabilitation and Infrastructure Development Grants.
The quality and effectiveness of spending from trust accounts is unclear as there is lack of detailed expenditure reports from implementing agencies.
5.3 APPROPRIATION FOR TRUST ACCOUNTS: 2012-2013
A total of K690.0 million has been appropriated for trust accounts in the 2012 Budget. Of this, K398.0 million has been paid as at 30 September 2012, with the remainder to be paid when funds become available later in 2012. A futher K450.0 million has been appropriated for trust accounts in the 2013 Budget.
Table 31: Appropriation for each Trust account: 201 2-2013 (Kina Million) Expenditure Programs Appropriation for
Trust Accounts Appropriations paid into Trust Account
Appropriations yet to be released
2012 BUDGET/ADDITIONAL PRIORITY EXPENDITURE
2015 South Pacific Games 180.0 0.0 180.0 District Services Improvement Program* 178.0 178.0 0.0 Infrastructure Development Grant (USBA) 120.0 120.0 0.0 Restoration and Development Grant (AGB) 100.0 100.0 0.0 High Impact Projects (USBA) 50.0 0.0 50.0 Economic Corridors Development Program 10.0 0.0 10.0 Waigani Office Redevelopment Programme 10.0 0.0 10.0 Konebada Park 10.0 0.0 10.0 Trade Skills Scholarships 20.0 0.0 20.0 Rehabilitation and recapitalisation (OHE) 12.0 0.0 12.0 TOTAL 690.0 398.0 292.0
2013 Budget
2015 South Pacific Games 180.0 0.0 0.0 Infrastructure Development Grant (UBSA) 120.0 0.0 0.0
Resoration and Development Grant (AGB) 100.0 0.0 0.0
High Impact Projects (UBSA) 50.0 0.0 0.0
TOTAL 450.0 0.0 0.0 Source: Department of Finance and Department of Treasury
5.4 TRUST ACCOUNT FUND MOVEMENTS IN 2012
Total expenditure from Trust Accounts from 1 January to 30 September 2012 totaled K1,095.0 million, or3.4 per cent of GDP. Table 36 shows the Trust Account transactions from 1 January up to 30 September 2012, and the balances of the Trust Accounts as at 30 September 2012.
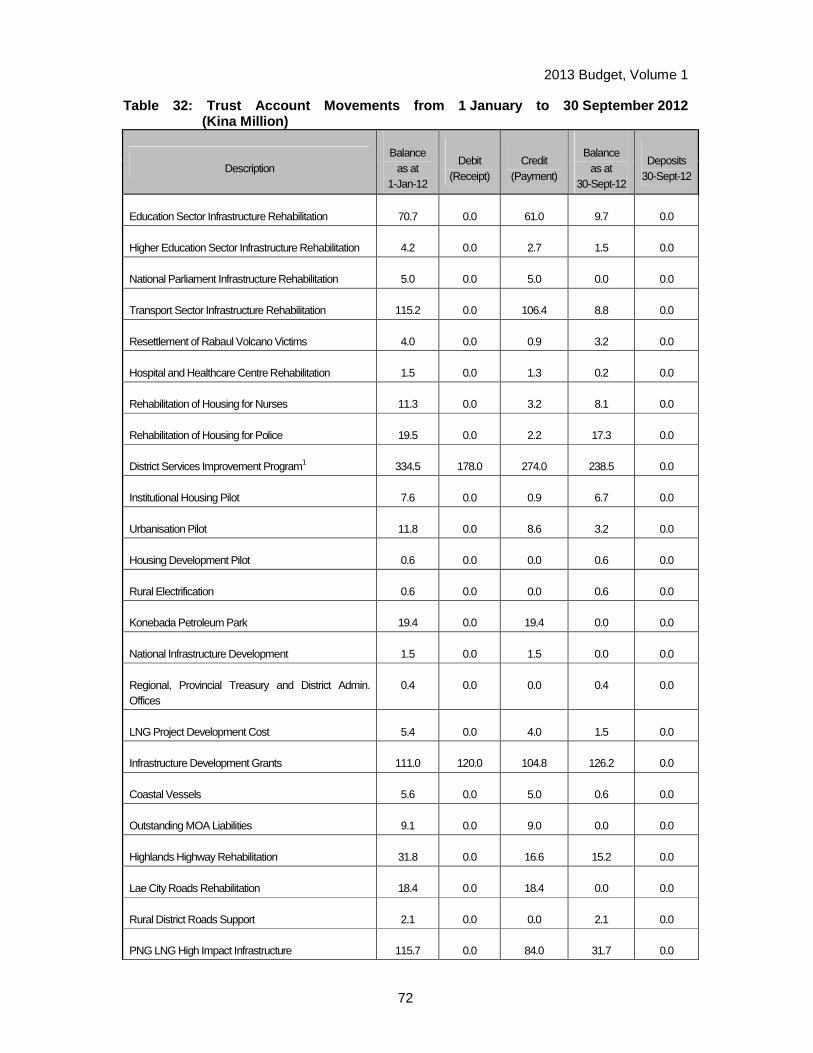
2013 Budget, Volume 1
72
Table 32: Trust Account Movements from 1 January to 30 September 2012 (Kina Million)
Description Balance
as at 1-Jan-12
Debit (Receipt)
Credit (Payment)
Balance as at
30-Sept-12
Deposits 30-Sept-12
Education Sector Infrastructure Rehabilitation 70.7 0.0 61.0 9.7 0.0
Higher Education Sector Infrastructure Rehabilitation 4.2 0.0 2.7 1.5 0.0
National Parliament Infrastructure Rehabilitation 5.0 0.0 5.0 0.0 0.0
Transport Sector Infrastructure Rehabilitation 115.2 0.0 106.4 8.8 0.0
Resettlement of Rabaul Volcano Victims 4.0 0.0 0.9 3.2 0.0
Hospital and Healthcare Centre Rehabilitation 1.5 0.0 1.3 0.2 0.0
Rehabilitation of Housing for Nurses 11.3 0.0 3.2 8.1 0.0
Rehabilitation of Housing for Police 19.5 0.0 2.2 17.3 0.0
District Services Improvement Program1 334.5 178.0 274.0 238.5 0.0
Institutional Housing Pilot 7.6 0.0 0.9 6.7 0.0
Urbanisation Pilot 11.8 0.0 8.6 3.2 0.0
Housing Development Pilot 0.6 0.0 0.0 0.6 0.0
Rural Electrification 0.6 0.0 0.0 0.6 0.0
Konebada Petroleum Park 19.4 0.0 19.4 0.0 0.0
National Infrastructure Development 1.5 0.0 1.5 0.0 0.0
Regional, Provincial Treasury and District Admin. Offices
0.4 0.0 0.0 0.4 0.0
LNG Project Development Cost 5.4 0.0 4.0 1.5 0.0
Infrastructure Development Grants 111.0 120.0 104.8 126.2 0.0
Coastal Vessels 5.6 0.0 5.0 0.6 0.0
Outstanding MOA Liabilities 9.1 0.0 9.0 0.0 0.0
Highlands Highway Rehabilitation 31.8 0.0 16.6 15.2 0.0
Lae City Roads Rehabilitation 18.4 0.0 18.4 0.0 0.0
Rural District Roads Support 2.1 0.0 0.0 2.1 0.0
PNG LNG High Impact Infrastructure 115.7 0.0 84.0 31.7 0.0
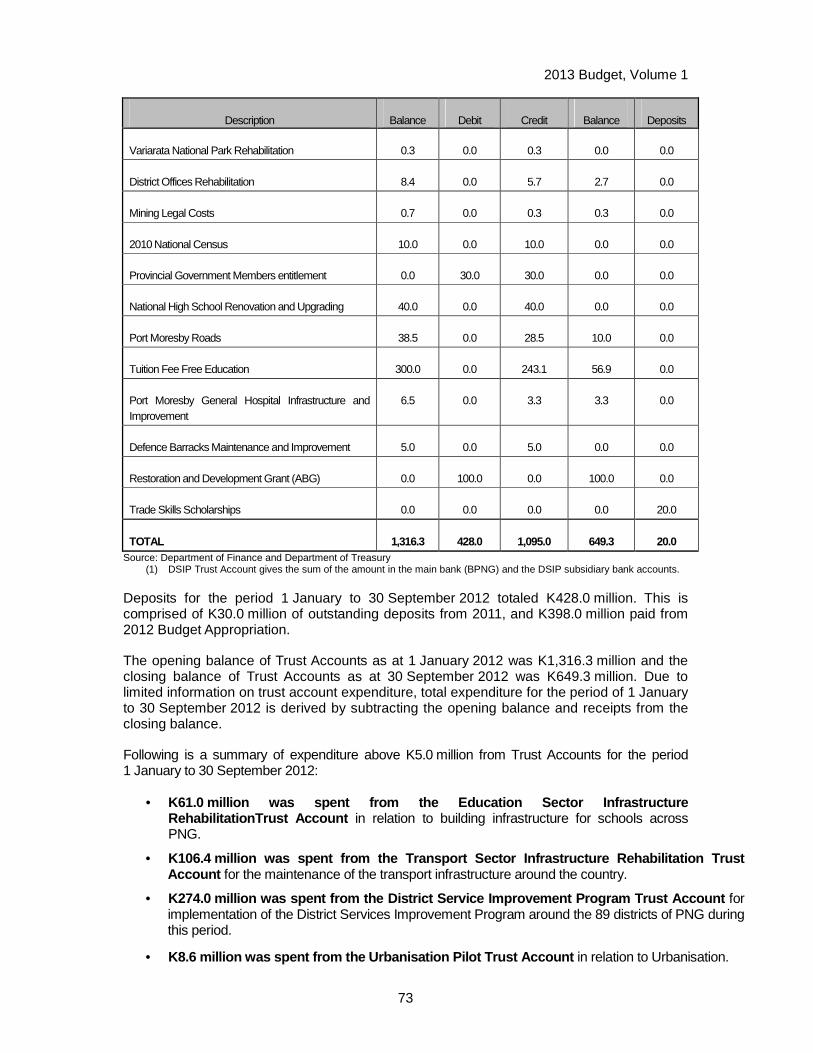
2013 Budget, Volume 1
73
Description Balance Debit Credit Balance Deposits
Variarata National Park Rehabilitation 0.3 0.0 0.3 0.0 0.0
District Offices Rehabilitation 8.4 0.0 5.7 2.7 0.0
Mining Legal Costs 0.7 0.0 0.3 0.3 0.0
2010 National Census 10.0 0.0 10.0 0.0 0.0
Provincial Government Members entitlement 0.0 30.0 30.0 0.0 0.0
National High School Renovation and Upgrading 40.0 0.0 40.0 0.0 0.0
Port Moresby Roads 38.5 0.0 28.5 10.0 0.0
Tuition Fee Free Education 300.0 0.0 243.1 56.9 0.0
Port Moresby General Hospital Infrastructure and Improvement
6.5 0.0 3.3 3.3 0.0
Defence Barracks Maintenance and Improvement 5.0 0.0 5.0 0.0 0.0
Restoration and Development Grant (ABG) 0.0 100.0 0.0 100.0 0.0
Trade Skills Scholarships 0.0 0.0 0.0 0.0 20.0
TOTAL 1,316.3 428.0 1,095.0 649.3 20.0 Source: Department of Finance and Department of Treasury
(1) DSIP Trust Account gives the sum of the amount in the main bank (BPNG) and the DSIP subsidiary bank accounts.
Deposits for the period 1 January to 30 September 2012 totaled K428.0 million. This is comprised of K30.0 million of outstanding deposits from 2011, and K398.0 million paid from 2012 Budget Appropriation.
The opening balance of Trust Accounts as at 1 January 2012 was K1,316.3 million and the closing balance of Trust Accounts as at 30 September 2012 was K649.3 million. Due to limited information on trust account expenditure, total expenditure for the period of 1 January to 30 September 2012 is derived by subtracting the opening balance and receipts from the closing balance.
Following is a summary of expenditure above K5.0 million from Trust Accounts for the period 1 January to 30 September 2012:
• K61.0 million was spent from the Education Sector I nfrastructure RehabilitationTrust Account in relation to building infrastructure for schools across PNG.
• K106.4 million was spent from the Transport Sector Infrastructure Rehabilitation Trust Account for the maintenance of the transport infrastructure around the country.
• K274.0 million was spent from the District Service Improvement Program Trust Account for implementation of the District Services Improvement Program around the 89 districts of PNG during this period.
• K8.6 million was spent from the Urbanisation Pilot Trust Account in relation to Urbanisation.
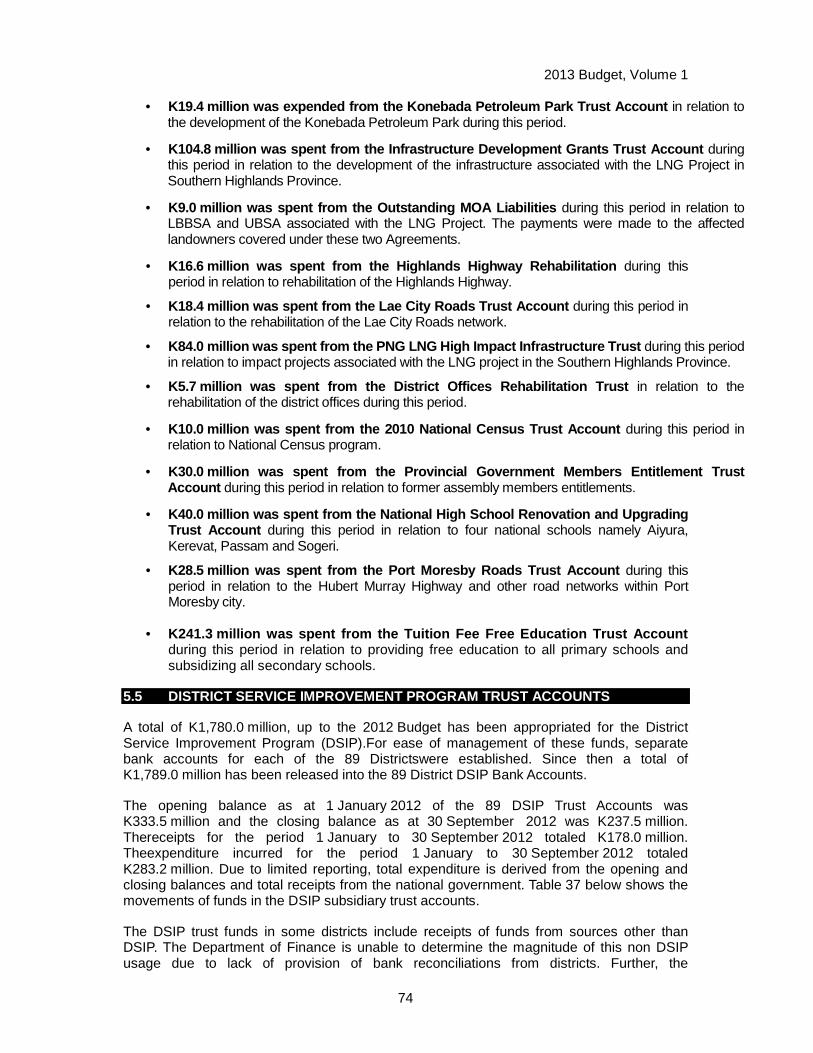
2013 Budget, Volume 1
74
• K19.4 million was expended from the Konebada Petrol eum Park Trust Account in relation to the development of the Konebada Petroleum Park during this period.
• K104.8 million was spent from the Infrastructure De velopment Grants Trust Account during this period in relation to the development of the infrastructure associated with the LNG Project in Southern Highlands Province.
• K9.0 million was spent from the Outstanding MOA Lia bilities during this period in relation to LBBSA and UBSA associated with the LNG Project. The payments were made to the affected landowners covered under these two Agreements.
• K16.6 million was spent from the Highlands Highway Rehabilitation during this period in relation to rehabilitation of the Highlands Highway.
• K18.4 million was spent from the Lae City Roads Tru st Account during this period in relation to the rehabilitation of the Lae City Roads network.
• K84.0 million was spent from the PNG LNG High Impac t Infrastructure Trust during this period in relation to impact projects associated with the LNG project in the Southern Highlands Province.
• K5.7 million was spent from the District Offices Re habilitation Trust in relation to the rehabilitation of the district offices during this period.
• K10.0 million was spent from the 2010 National Cens us Trust Account during this period in relation to National Census program.
• K30.0 million was spent from the Provincial Governm ent Members Entitlement Trust Account during this period in relation to former assembly members entitlements.
• K40.0 million was spent from the National High Scho ol Renovation and Upgrading Trust Account during this period in relation to four national schools namely Aiyura, Kerevat, Passam and Sogeri.
• K28.5 million was spent from the Port Moresby Roads Trust Account during this period in relation to the Hubert Murray Highway and other road networks within Port Moresby city.
• K241.3 million was spent from the Tuition Fee Free Education Trust Account during this period in relation to providing free education to all primary schools and subsidizing all secondary schools.
5.5 DISTRICT SERVICE IMPROVEMENT PROGRAM TRUST ACCOUNTS
A total of K1,780.0 million, up to the 2012 Budget has been appropriated for the District Service Improvement Program (DSIP).For ease of management of these funds, separate bank accounts for each of the 89 Districtswere established. Since then a total of K1,789.0 million has been released into the 89 District DSIP Bank Accounts.
The opening balance as at 1 January 2012 of the 89 DSIP Trust Accounts was K333.5 million and the closing balance as at 30 September 2012 was K237.5 million. Thereceipts for the period 1 January to 30 September 2012 totaled K178.0 million. Theexpenditure incurred for the period 1 January to 30 September 2012 totaled K283.2 million. Due to limited reporting, total expenditure is derived from the opening and closing balances and total receipts from the national government. Table 37 below shows the movements of funds in the DSIP subsidiary trust accounts.
The DSIP trust funds in some districts include receipts of funds from sources other than DSIP. The Department of Finance is unable to determine the magnitude of this non DSIP usage due to lack of provision of bank reconciliations from districts. Further, the
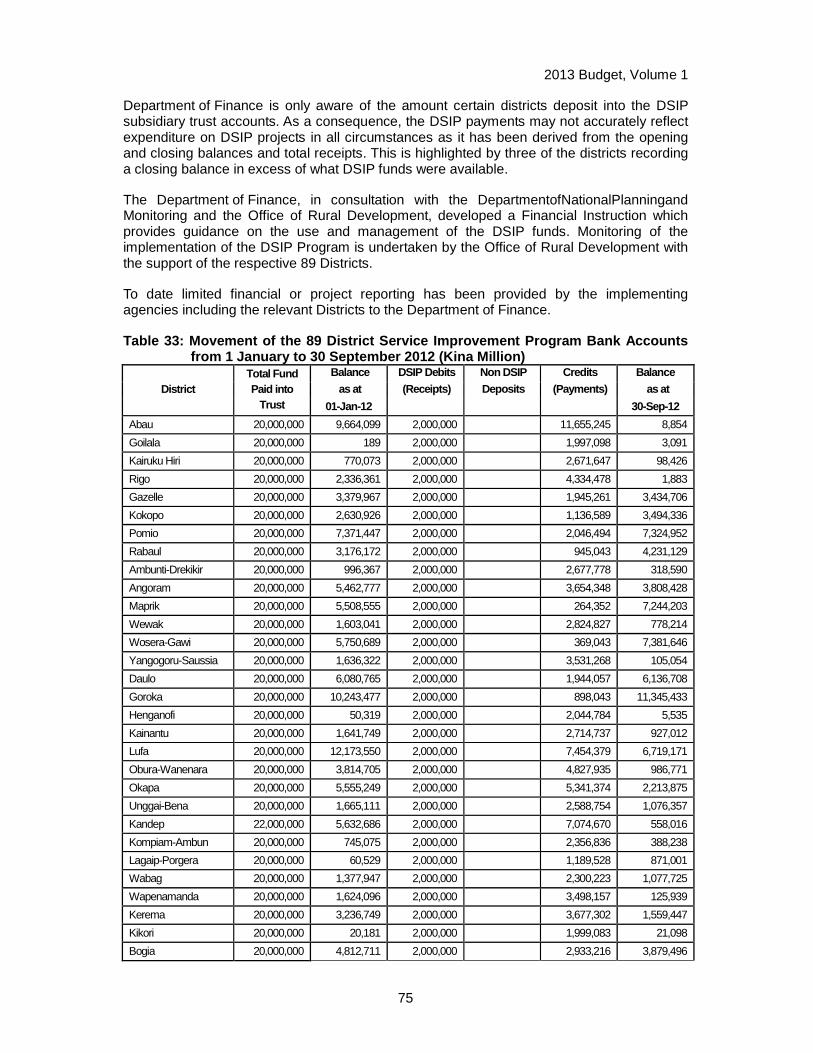
2013 Budget, Volume 1
75
Department of Finance is only aware of the amount certain districts deposit into the DSIP subsidiary trust accounts. As a consequence, the DSIP payments may not accurately reflect expenditure on DSIP projects in all circumstances as it has been derived from the opening and closing balances and total receipts. This is highlighted by three of the districts recording a closing balance in excess of what DSIP funds were available.
The Department of Finance, in consultation with the DepartmentofNationalPlanningand Monitoring and the Office of Rural Development, developed a Financial Instruction which provides guidance on the use and management of the DSIP funds. Monitoring of the implementation of the DSIP Program is undertaken by the Office of Rural Development with the support of the respective 89 Districts.
To date limited financial or project reporting has been provided by the implementing agencies including the relevant Districts to the Department of Finance.
Table 33: Movement of the 89 District Service Impro vement Program Bank Accounts from 1 January to 30 September 2012 (Kina Million)
District Total Fund Paid into
Trust
Balance DSIP Debits Non DSIP Credits Balance as at (Receipts) Deposits (Payments) as a t
01-Jan-12 30-Sep-12
Abau 20,000,000 9,664,099 2,000,000 11,655,245 8,854
Goilala 20,000,000 189 2,000,000 1,997,098 3,091
Kairuku Hiri 20,000,000 770,073 2,000,000 2,671,647 98,426
Rigo 20,000,000 2,336,361 2,000,000 4,334,478 1,883
Gazelle 20,000,000 3,379,967 2,000,000 1,945,261 3,434,706
Kokopo 20,000,000 2,630,926 2,000,000 1,136,589 3,494,336
Pomio 20,000,000 7,371,447 2,000,000 2,046,494 7,324,952
Rabaul 20,000,000 3,176,172 2,000,000 945,043 4,231,129
Ambunti-Drekikir 20,000,000 996,367 2,000,000 2,677,778 318,590
Angoram 20,000,000 5,462,777 2,000,000 3,654,348 3,808,428
Maprik 20,000,000 5,508,555 2,000,000 264,352 7,244,203
Wewak 20,000,000 1,603,041 2,000,000 2,824,827 778,214
Wosera-Gawi 20,000,000 5,750,689 2,000,000 369,043 7,381,646
Yangogoru-Saussia 20,000,000 1,636,322 2,000,000 3,531,268 105,054
Daulo 20,000,000 6,080,765 2,000,000 1,944,057 6,136,708
Goroka 20,000,000 10,243,477 2,000,000 898,043 11,345,433
Henganofi 20,000,000 50,319 2,000,000 2,044,784 5,535
Kainantu 20,000,000 1,641,749 2,000,000 2,714,737 927,012
Lufa 20,000,000 12,173,550 2,000,000 7,454,379 6,719,171
Obura-Wanenara 20,000,000 3,814,705 2,000,000 4,827,935 986,771
Okapa 20,000,000 5,555,249 2,000,000 5,341,374 2,213,875
Unggai-Bena 20,000,000 1,665,111 2,000,000 2,588,754 1,076,357
Kandep 22,000,000 5,632,686 2,000,000 7,074,670 558,016
Kompiam-Ambun 20,000,000 745,075 2,000,000 2,356,836 388,238
Lagaip-Porgera 20,000,000 60,529 2,000,000 1,189,528 871,001
Wabag 20,000,000 1,377,947 2,000,000 2,300,223 1,077,725
Wapenamanda 20,000,000 1,624,096 2,000,000 3,498,157 125,939
Kerema 20,000,000 3,236,749 2,000,000 3,677,302 1,559,447
Kikori 20,000,000 20,181 2,000,000 1,999,083 21,098
Bogia 20,000,000 4,812,711 2,000,000 2,933,216 3,879,496
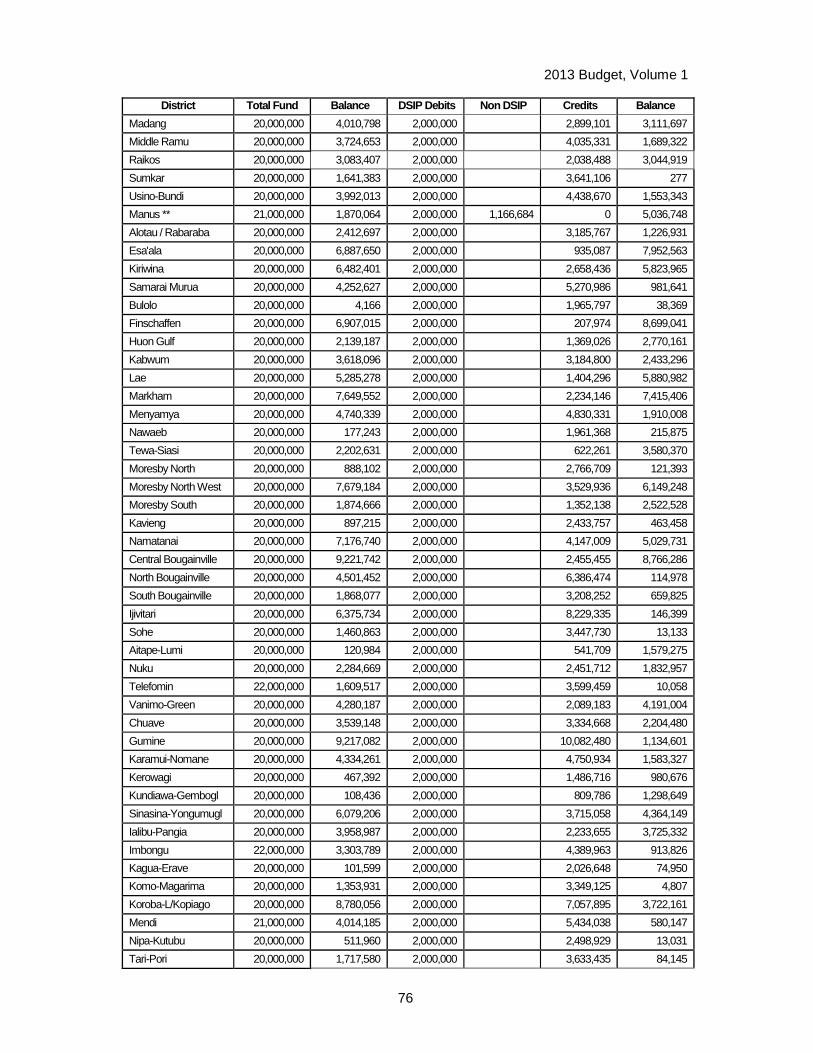
2013 Budget, Volume 1
76
District Total Fund Balance DSIP Debits Non DSIP Credits Balance
Madang 20,000,000 4,010,798 2,000,000 2,899,101 3,111,697
Middle Ramu 20,000,000 3,724,653 2,000,000 4,035,331 1,689,322
Raikos 20,000,000 3,083,407 2,000,000 2,038,488 3,044,919
Sumkar 20,000,000 1,641,383 2,000,000 3,641,106 277
Usino-Bundi 20,000,000 3,992,013 2,000,000 4,438,670 1,553,343
Manus ** 21,000,000 1,870,064 2,000,000 1,166,684 0 5,036,748
Alotau / Rabaraba 20,000,000 2,412,697 2,000,000 3,185,767 1,226,931
Esa'ala 20,000,000 6,887,650 2,000,000 935,087 7,952,563
Kiriwina 20,000,000 6,482,401 2,000,000 2,658,436 5,823,965
Samarai Murua 20,000,000 4,252,627 2,000,000 5,270,986 981,641
Bulolo 20,000,000 4,166 2,000,000 1,965,797 38,369
Finschaffen 20,000,000 6,907,015 2,000,000 207,974 8,699,041
Huon Gulf 20,000,000 2,139,187 2,000,000 1,369,026 2,770,161
Kabwum 20,000,000 3,618,096 2,000,000 3,184,800 2,433,296
Lae 20,000,000 5,285,278 2,000,000 1,404,296 5,880,982
Markham 20,000,000 7,649,552 2,000,000 2,234,146 7,415,406
Menyamya 20,000,000 4,740,339 2,000,000 4,830,331 1,910,008
Nawaeb 20,000,000 177,243 2,000,000 1,961,368 215,875
Tewa-Siasi 20,000,000 2,202,631 2,000,000 622,261 3,580,370
Moresby North 20,000,000 888,102 2,000,000 2,766,709 121,393
Moresby North West 20,000,000 7,679,184 2,000,000 3,529,936 6,149,248
Moresby South 20,000,000 1,874,666 2,000,000 1,352,138 2,522,528
Kavieng 20,000,000 897,215 2,000,000 2,433,757 463,458
Namatanai 20,000,000 7,176,740 2,000,000 4,147,009 5,029,731
Central Bougainville 20,000,000 9,221,742 2,000,000 2,455,455 8,766,286
North Bougainville 20,000,000 4,501,452 2,000,000 6,386,474 114,978
South Bougainville 20,000,000 1,868,077 2,000,000 3,208,252 659,825
Ijivitari 20,000,000 6,375,734 2,000,000 8,229,335 146,399
Sohe 20,000,000 1,460,863 2,000,000 3,447,730 13,133
Aitape-Lumi 20,000,000 120,984 2,000,000 541,709 1,579,275
Nuku 20,000,000 2,284,669 2,000,000 2,451,712 1,832,957
Telefomin 22,000,000 1,609,517 2,000,000 3,599,459 10,058
Vanimo-Green 20,000,000 4,280,187 2,000,000 2,089,183 4,191,004
Chuave 20,000,000 3,539,148 2,000,000 3,334,668 2,204,480
Gumine 20,000,000 9,217,082 2,000,000 10,082,480 1,134,601
Karamui-Nomane 20,000,000 4,334,261 2,000,000 4,750,934 1,583,327
Kerowagi 20,000,000 467,392 2,000,000 1,486,716 980,676
Kundiawa-Gembogl 20,000,000 108,436 2,000,000 809,786 1,298,649
Sinasina-Yongumugl 20,000,000 6,079,206 2,000,000 3,715,058 4,364,149
Ialibu-Pangia 20,000,000 3,958,987 2,000,000 2,233,655 3,725,332
Imbongu 22,000,000 3,303,789 2,000,000 4,389,963 913,826
Kagua-Erave 20,000,000 101,599 2,000,000 2,026,648 74,950
Komo-Magarima 20,000,000 1,353,931 2,000,000 3,349,125 4,807
Koroba-L/Kopiago 20,000,000 8,780,056 2,000,000 7,057,895 3,722,161
Mendi 21,000,000 4,014,185 2,000,000 5,434,038 580,147
Nipa-Kutubu 20,000,000 511,960 2,000,000 2,498,929 13,031
Tari-Pori 20,000,000 1,717,580 2,000,000 3,633,435 84,145
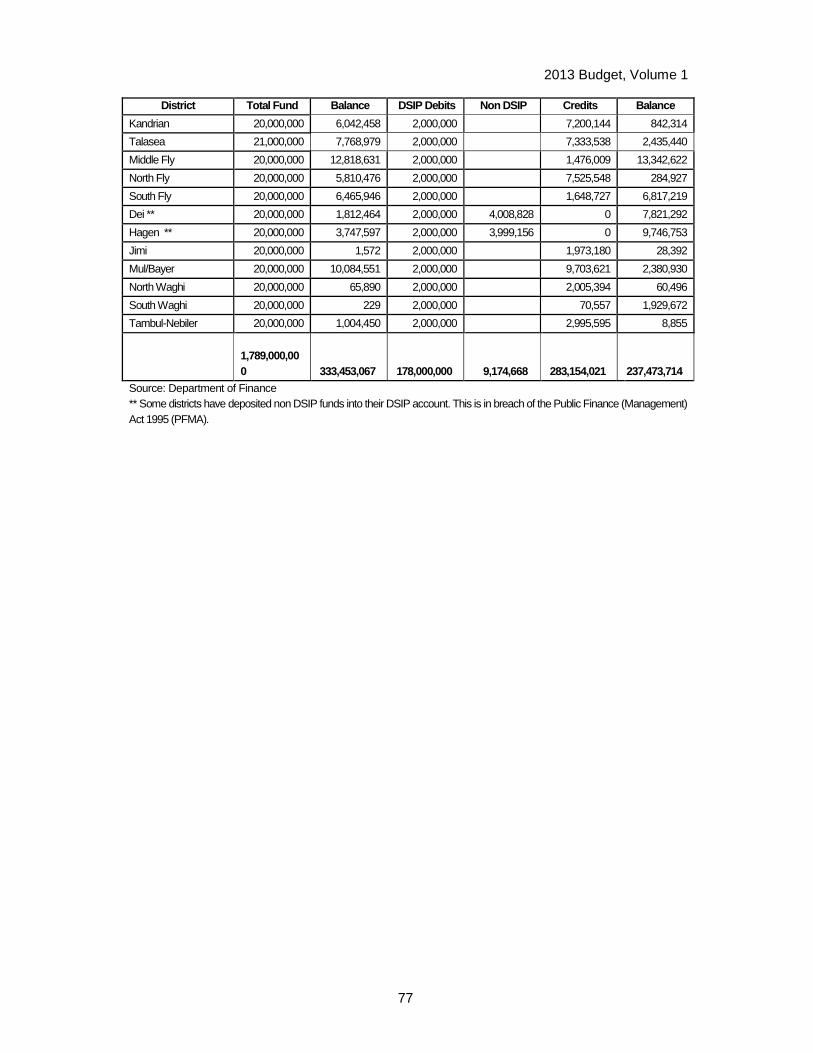
2013 Budget, Volume 1
77
District Total Fund Balance DSIP Debits Non DSIP Credits Balance
Kandrian 20,000,000 6,042,458 2,000,000 7,200,144 842,314
Talasea 21,000,000 7,768,979 2,000,000 7,333,538 2,435,440
Middle Fly 20,000,000 12,818,631 2,000,000 1,476,009 13,342,622
North Fly 20,000,000 5,810,476 2,000,000 7,525,548 284,927
South Fly 20,000,000 6,465,946 2,000,000 1,648,727 6,817,219
Dei ** 20,000,000 1,812,464 2,000,000 4,008,828 0 7,821,292
Hagen ** 20,000,000 3,747,597 2,000,000 3,999,156 0 9,746,753
Jimi 20,000,000 1,572 2,000,000 1,973,180 28,392
Mul/Bayer 20,000,000 10,084,551 2,000,000 9,703,621 2,380,930
North Waghi 20,000,000 65,890 2,000,000 2,005,394 60,496
South Waghi 20,000,000 229 2,000,000 70,557 1,929,672
Tambul-Nebiler 20,000,000 1,004,450 2,000,000 2,995,595 8,855
1,789,000,000 333,453,067 178,000,000 9,174,668 283,154,021 237,473,714
Source: Department of Finance ** Some districts have deposited non DSIP funds into their DSIP account. This is in breach of the Public Finance (Management) Act 1995 (PFMA).
2013 Budget, Volume 1
78
CHAPTER 6. TAXATION MEASURES
6.1 OVERVIEW
The 2013 Budget introduces a number of taxation policy measures and other minor technical amendments as part of the Government’s ongoing effort to improve and refine the tax system.
In this Budget, the Government will increase import tariff for poultry from K2.00 per kilogram to K2.20 per kilogramand plywood from 35 per cent to 50 per cent. This measure will provide short term support to these two industries. Treasury will undertake a review of the tariff rates and costs of doing business in PNG in 2013, to advise the Government on reforms in these areas going forward.
The Government will also increase excise duty on tobacco by 10 per cent in this Budget to discourage smoking and minimise health costs imposed on the Government. Excise duty on pre-used motor vehicles will also be increased to address concerns regarding undervaluation and to minimise road congestion.
As announced in previous budgets, the Government will also amend the Income Tax Act 1959 to recognise a Nil Assessment as an assessment to give taxpayers greater certainty and fairness that their tax affairs are finalised following an appropriate review period, while balancing the need to ensure that Internal Revenue Commission (IRC) has the necessary time to review taxpayers assessments.
The Government will also seek to ensure that tax policy does not add to inflation, is economically efficient and does not distort markets by forfeiting provinces 60 per cent share of Goods and Services Tax (GST) in the event that they introduce sales and services tax on top of GST.
The Government further embarks on extending the Thin Capitalisation rules (which currently exist for extractive industries) to all companies, other than approved finance companies, with the aim of minimising the ability for multinational companies to shift their profits offshore through excessive debt financing. This will ensure that PNG receives its fair share of taxation for profits earned in the country.
Other minor tax policies include:
• amending the Gaming Control Act 2007 to address two conflicting laws regarding the distribution of the Bookmakers Turnover Tax. The amendment will ensure that Bookmakers turnover tax is distributed to the provinces consistent with the intent of the reforms in the Inter-Government Funding Arrangement.
• amending the Regulations 10I of the Income Tax Regulations 1959 to ensure that gas oil ratio is based on resources sold. The current law determines the gas oil ratio on the basis of petroleum resource that is extracted and does not require any gas or oil to be sold. The proposed law will correct the legislation by applying the gas oil ratio on the gas and oil resources for sale and not on the basis of the petroleum resource extracted.
This Budget also introduces a number of minor technical amendments to correct technical errors to clarify the law and administrative procedures to increase administrative efficiency.
2013 Budget, Volume 1
79
6.2 TAX POLICY AMENDMENTS
6.2.1 Increase Import Duty on Poultry and Plywood
Given the high cost of conducting businesses related to infrastructure, law and order and utilities such as water and electricity, this Government will provide short-term assistance to domestic industries involved in producing plywood and poultry.
In this Budget, the Government will increase the import tariffs for poultry and plywood to provide interim support to these industries that have been exposed to stiff competition by the recent Tariff Reduction Program (TRP) and other business costs while Treasury undertakes a review of tariff rates and costs of doing business in PNG in 2013, to advise the Government on reforms in these areas going forward. The review undertaken in 2013 will determine the future direction of the TRP.
The import tariff of poultry will increase from K2.00 per kilogram to K2.20 per kilogram while the import tariff on plywood will increase from 35 per cent 50 per cent.
The policy change is expected to increase tax revenue by K1.0 million.
6.2.2 Increase Excise Duty on Tobacco products by 1 0 per cent
In the 2012 Budget, the Government increased the excise duty on tobacco products by 15 per cent. Inflation over the past few years has reduced the real value of excise rates (as current indexation rates are capped at 5 per cent per annum). An increase in excise rates of around 15 per cent in the 2012 Budget,restored the real excise rates to 2008 levels.
Worldwide, governments have recognised the linkage between tobacco and increased health risks, and as such apply excise duties on smokers to help cover the higher health costs that may eventuate.
The Government will provide free primary health care3 care to individuals in this Budget. Those that choose to smoke will incur higher health costs for the Government. The Government is seeking to recover part of these costs through an additional increase in the excise duty on tobacco products.
The Government will increase the excise duty on tobacco products by a further 10 per cent in 2013.This policy change is expected to increase tax revenue by K10 million in 2013.
6.2.3 Increase Excise Duty on Pre-used Motor Vehicl es
The current value of excise duties ranges from 10 per cent to 110 per cent of the vehicles import value, depending on the size of the engine capacity and the type of vehicle. The excise duty is levied on total landed cost (vehicle cost, insurance and freight) regardless of whether it is brand new or pre-used motor vehicles.
However, there are concerns regarding undervaluation of pre-used vehicle imports. For instance, there are cases where buyers conduct two separate telegraphic transfers and launch returns for taxing purposes with the lower cost to reduce their tax liabilities.
3The Government has allocated K20.0 million to replace the fees previously collected by hospitals and health service providers.

2013 Budget, Volume 1
80
Setting a minimum threshold value for pre-used vehicles will address some of this tax avoidance.
In recent years, congestion on roads in PNG has increased significantly. To limit future congestion, the Government is increasing excise duties on pre-used imported motor vehicles.
Excise rates will be increased by 10 per cent for pre-used motor vehicles in the category 1 and 4 and 20 per cent for those in categories 2 and 3 as shown in table 38. Further, all pre-used motor vehicles landed cost will be subject to minimum value threshold for tax purposes that will range from US$3,000 to US$10,000 depending on engine capacity or vehicle type.
The measure will increase revenue by K30 million in 2013.
Table 34: Excise Rate Increase for Pre-used Motor V ehicles
Broad Vehicle Description Category Current Excise Rates
New Excise Rates to be applied starting 2013
1. Trucks & special purpose motor vehicles, Tractors above 4 litres, Motorcycles, PMVs, Security Vans, Chassis with motor
10% 20%
2. Open-backed, double cab vehicles 40% 60%
3. Small-medium cars(engine between 1.5 – 2.7 litres) 60% 80%
4. Large cars(engine size above 2.7 litres) 110% 120%
Department of Treasury and PNG Customs Services
6.2.4 Nil Assessments
To encourage business growth, it is important to provide sufficient certainty and fairness to taxpayers regarding their tax obligations. In particular, taxpayers who have properly sought to comply with the tax system should be afforded certainty at some point in time that they have fulfilled their legal obligations, regardless of whether an error has been made.
The current legislation recognises tax payers with a taxable income and tax payable as an assessment.
The 2013 Budget introduces an amendment to the legislation within the Income Tax Act 1959 recognising a Nil Assessment as an assessment. This will ensure that taxpayers with Nil Assessments are afforded the same certainty and fairness as those with positive assessments.
Under the new amendment, a Nil Assessment will be a statement from the IRC which states that notax is payable. However, a Nil Assessment will not be an assessment of how many losses a taxpayer can take forward. This means losses will be reviewed when claimed as a deduction by the taxpayer against future income, and the IRC will have 3 or 6 years to review the losses from this point in time.
2013 Budget, Volume 1
81
This change is not expected to have a revenue effect in 2013, but is expected to reduce revenue by a small amount over the medium to long term.
The changes are prospective in nature relating to tax assessments made after 1 January 2013 relating to the income year commencing on or after 1 January 2012. These amendments do not affect the law before this date of commencement.
6.2.5 GST Distribution to the Provinces
The Goods and Services Tax (GST) replaced inefficient and administratively burdensome provincial sales taxes over a decade ago, with the inland GST revenue shared between the provinces (60 per cent) and the National Government (40 per cent). While provinces retained the legal right to impose their own sales or services taxes, any province that did this would forfeit their share of the GST revenue. This effectively stopped provinces from introducing overlapping sales and services taxes on top of the GST which would have had detrimental cascading effects through the supply chain.
Following a review of the inter-governmental financing system by the National Economic and Fiscal Commission in 2008, changes were made to GST distributions between the provinces, and the Goods and Services Tax Revenue Distribution Act was repealed and merged with a new Act called the Inter-governmental Relations (Functions and Funding) Act 2009.
As part of these changes, the provision that caused provinces to forfeit their share of the GST Revenue if they imposed a sales or services tax was inadvertently abolished. As a result, a number of provinces are now introducing sales and services taxes on top of the GST.
However, the imposition of sales and services tax over and above GST hasserious economic, administrative and long run revenue implications.
It is a key objective of tax policy to ensure a level playing field across all industries and sectors of the economy. The introduction of provincial sales and services taxes over and above the GST is administratively complex and burdensome for business and is economically inefficient. Further, an imposition of additional taxes on top of GST adds to inflation and reduces living standards for Papua New Guineans.
Differential tax treatments on the provision of various goods and services in different provinces will lead to behavioural changes and market distortions. Given the lack of provincial border controls, goods and services offered in the next province with no sales and services tax will attract consumers from neighbouring provinces to buy there. This will also encourage business to shift to places that attract no sales and services tax.
The introduction of provincial sales and services taxes will lead to lower economic growth and therefore lower tax revenues for these provinces in the long run.
The provincial governments are implementing or intending to implement these taxes to meet short term funding needs. However, this will lead to less revenue in the long run as such taxes change both consumer and business behaviour and distorts the market.
This Government recognises the funding needs of the provinces and has improved the funding available to the provinces in the 2013 Budget. The 2013 Budget will provide to the provinces an additional K445 million in direct funding. This additional funding should remove the need for provinces to implement the inefficient taxes to meet their funding needs.
2013 Budget, Volume 1
82
Based on the economic,administrative, long-run revenue implications and the increased funding to provinces,the 2013 Budget introduces an amendment to the Inter-governmental (Functions and Funding) Act 2009 to restore the provision in the law that causes provinces that impose a sales or services tax to forfeit their share of the GST revenue. This provision will not affect Bougainville owing to guarantees on GST payments under the Peace Agreement. There will be no financial implications for the National Government as a result of this amendment.
6.2.6 Extension of Thin Capitalisation Rules to non Extractive Industries (other than finance entities)
This measure aims to ensure that PNG receives a fair share of tax from entities operating in PNG through ensuring that only a fair share of interest payments are deductible against income earned in PNG.
Currently, entities, other than those in the extractive industries (mining, oil and gas), can structure their capital such that it is significantly biased towards debt rather than equity, known as thin capitalisation.
In practice, mostcompanies are limited in their ability to do this by the need to balance their capital to manage solvency risks required by financiers and shareholders.
However, where the financier and shareholder are related parties, the financial position of the whole (multinational) group can be managed on a groupbasis, rather than at the subsidiary (local) level. In these situations, multinational groups are able to set up local PNG subsidiaries with minimal capital and high levels of debt. This provides the PNG subsidiary with the ability to claim significant interest deductions in PNG, thus minimising profits and therefore tax paid in PNG, and shifting the profits off shore. Such an outcome means that the PNG subsidiary does not pay a fair share of tax on the income earned and activity undertaken in PNG.
Currently thin capitalisation laws apply only to extractive industries under Division 10, section 155H of the Income Tax Act 1959 which disallows interest deductions on levels of debt which exceed a 3 to 1 debt to equity ratio.
However, other industries not covered by thin capitalisation laws have heavily debt loaded balance sheets with a small amount of equity. In these instances PNG is not receiving its fair share of tax from these entities.
The 2013 Budget will extend the thin capitalisation laws applying to extractive industriesto include all foreign controlled taxpayers, except for approved finance institutions.These entities will be unable to deduct interest payments on debt which is over and above a 2 to 1 debt to equity ratio. The extension will take effect from 1 January 2013 and is expected to increase revenue by K10.0 million in 2013 and K24.0 million in 2014.
6.2.7 BookmakersTurnover Tax to Provinces
The Governmentintroduced reforms in 2009 through the Inter-Government Funding Arrangement (IGFA) which were legislated in the Inter-Governmental Relations (Functions and Funding) Act 2009. One of the reforms undertaken was to abolish the Bookmakers Act 1974 and redirect 100 per cent of the Bookmakers Turnover Tax to the Provinces.
Previously, the Bookmakers Act 1974 cross-referenced that the distribution of Bookmakers Turnover Tax be made in accordance with the Gaming Control Act 2007. The Gaming
2013 Budget, Volume 1
83
Control Act 2007 stated that 100 per cent of the Bookmakers Turnover Tax be paid into the Consolidated Revenue Fund.
While the Bookmakers Act 1974 was abolished as part of the reforms in 2009 via Inter-Government Funding Arrangement, no amendment was made to the cross-reference in the Gaming Control Act 2007.This created a legal anomaly between the new Inter-Governmental Relations (Functions and Funding) Act 2009 and the Gaming Control Act 2007.
The repeal of section 211(b) in the Gaming Control Act 2007 will correct this legal anomaly. This will allow the Inter-Governmental Relations (Functions and Funding) Act 2009 to take precedence in the distribution of the Bookmakers Turnover Tax, consistent with the intent of the reforms in the Inter-Government Funding Arrangement.
Due to the existence of two conflicting laws, the Internal Revenue Commission (IRC) has not yet distributed the revenues to the provinces. IRC transferred Bookmakers Turnover Tax collections for the first 6 months of 2009 (K3,286,827.29) to Waigani Public Account. Since this time, IRC has retained Bookmakers Turnover Tax collections in the IRC administration account.
This Budget includes expenditure to reimburse the portion of Bookmakers Turnover Tax money’s already remitted to Waigani Public Account back to IRC. IRC will then be responsible for correctly administering the Bookmakers Turnover Tax consistentwith the Inter-Governmental Relations (Functions and Funding) Act 2009.This amendment will have no revenue implications.
6.2.8 Amend Regulation 10I of the Income Tax Regulations 1959 to clarify that gas oil ratio is based on resources sold
Regulation 10I of the Income Tax Regulations 1959 outlines the conditions for determining when a petroleum project or part of a petroleum project exceeds the prescribed ratio of gas production to oil production, for the purposes of conversion to a designated gas project. Under this regulation, the gas oil ratio focuses on the petroleum resource that is extracted and does not require any gas or oil to be sold. The petroleum resource is considered a designated gas project where a field has an aggregate average produced gas oil ratio of at least five thousand cubic feet of gas per stock tank barrels of oil produced at standard conditions.
The tax regime associated with designated gas projects and oil projects is significantly different. In particular, the income tax rate applying to designated gas projects is 30 per cent while oil projects are taxed at 45 per cent. However, designated gas projects with a lower income tax rate as opposed to petroleum projects are also subject to the additional profits tax while petroleum projects are not.
Under the current drafting, a petroleum project could become a designated gas project without selling any gas produced. However, this undermines the broad intent for the different tax regimes associated with income associated from oil sales and gas sales. The policy intent is for these differing tax regimes to relate to the production and sale of oil and the production and sale of gas. It is not the intention of the law to allow a field which only sells petroleum to be taxed as if it was selling gas (or vice versa).
This amendment is intended to correct the law by applying the gas oil ratio on the gas and oil resources for sale. This is to ensure that the petroleum and gas resources produced for sale are used as the basis of applying the correct income tax regime. This amendment is
2013 Budget, Volume 1
84
expected to be revenue neutral in 2013, but will raise additional revenue over the longer term.
6.3 MINOR TECHNICAL AMENDMENTS
The 2013 Budget also introduces minor technical amendments to correct drafting errors in the relevant legislations administered by the Commissioner General of IRC or Commissioner for PNG Customs Services.
I. The Income Tax Act1959 will be amended to correct drafting errors to:
• substitute all reference to “Division III.9C ” in Section 6D of the Income Tax, Dividend Withholding Tax, Interest Withholding Tax (Rates) Act 1984 to “Division III.9B ” as there is no Division III.9C in the Income Tax Act 1959. Section 6D of Income Tax, Dividend Withholding Tax, Interest Withholding Tax (Rates) Act 1984 provides for the relevant tax rate to be applied to the qualifying taxpayers for the tourism accommodation incentive. This incentive is contained in Division III.9B of the Income Tax Act 1959.
• repeal the reference to “46CA(5)” as it appears in definition of “eligible taxpayer” under subsection 46CA(1) of the Income Tax Act 1959 to “46CA(4)”.
• add the words “in accordance with Section 25A of this Act ” after the words “Commissioner General ” as they appear first in Subsection 69E(1) of the Income Tax Act 1959.
• to repeal the words “other than money ” after the words “money or property ” as they appear first in Subsection 69E(1) of the Income Tax Act 1959.
II. Since the demerger of Customs from the Internal Revenue Commissioner, the PNG Customs Service has been responsible for the collection and administration of the functions provided under Section 30 of the National Roads Authority Act 2003. Therefore the amendment is a consequential amendment to reflect the reality of affairs as it exists right now. The National Roads Act will be amended to correct drafting error to:
• substitute all references to the “Internal Revenue Commission” as it appears in Subsections 30(1B) and 30(1C) of the National Roads Act with the words “Papua New Guinea Customs Services.”
• substitute the reference to the words “Commissioner General of Internal Revenue” in Subsection 30(1C) of the National Roads Authority Act with “Commissioner for Customs”.
III. In addition, the PNG Customs Services also responsible for the collection of the log export development levy imposed under Section 121A of the Forestry Act 1991. Therefore, references to “Commissioner General” under that provision be substituted with “Commissioner of Customs”. The Forestry Act 1991 will be amended to correct a drafting error so as to:
• substitute the reference to “Commissioner General” in Subsection 121A(3) of the Forestry Act 1991 with “Commissioner for Customs”.
2013 Budget, Volume 1
85
6.4 RESTATING EXISTING TAX POLICY REGARDING ADDITIO NAL PROFITS TAX
There appears to be some confusion in the general community on the application of the Additional Profits Tax.
In May 2008, the definition of resource project has been amended to mean “a designated Gas Project” whereby it extends to include the application of Additional Profits Tax to all gas projects including the PNG LNG Gas Project.Prior to this amendment, the application of Additional Profits Tax was previously restricted tothe PNG Gas to Queensland Project consistent with the definition of “resource project” in the Income Tax Act 1959.
The Government is not amending the law with respect to Additional Profits Tax.
6.5 AREAS OF POLICY DEVELOPMENT IN 2013
REVIEW OF THE MINING AND PETROLEUM TAXATION REGIME
In early 2000’s, the tax provisions applying to the Mining, Gas and Petroleum projects underwent major amendments. The aim of these reforms was to make the resource taxation regime more attractive to investors in order to arrest the decline in the investment in the resource sector at that time.
Over recent years, PNG has seen significant investment in the resource sector which is partly also due to the strong demand for resources driven by growth in China and India.
Mining and Petroleum activity has been an important but volatile source of revenue for PNG. Growth in revenue from the resource sector has been strong recently. The strong growth is likely to continue over the medium term in light of continuing exploration activities and continued strong demand internationally in the forward years.
It is therefore important that the PNG Government and its people receive an appropriate share of profits fromthese non-renewable resources.
The Department of Treasury with technical assistance from International Monetary Fund will be conducting a review into the mining and petroleum taxation regime in 2013. The purpose of the review is to determine the appropriateness of the mining and petroleum taxation arrangements compared to similar resource rich countries.
The implementation of any review recommendations will be subject to approval by the Government.
2013 Budget, Volume 1
86
CHAPTER 7. BUILDING THE ECONOMY THROUGH SUSTAINED REFORMS
7.1 OVERVIEW
Papua New Guinea continues to benefit from past reform. These reforms have contributed to sustained economic growth that shielded the economy from external shocks and has provided a conducive environment for investment as evidenced by the PNG LNG Project. They have also contributed to lower prices and better services such as with mobile phones, air transport and banking services. They have also freed up fiscal space for the Government to concentrate on what it does best – providing essential services in areas such as education and health.
Developing and promoting a competitive private sectoralso continues to be a priority of the Government. The Government recognises that developing and promoting this sector will continue to boost productivity that will generate more employment, income earning opportunities, improve service delivery thus stimulating the country’s economic growth. The Government will continue to pursue the following strategies to support greater private sector activity in 2013:
• Promoting and Enhancing Competition;
• Improving Economic Regulation;
• Developing More Effective and Efficient Competitive Markets; and
• Reducing Impediments to Business Development and Investment Climate.
The reforms are designed to embark on the development polices and strategies, including those existing and any new reforms in 2013.This will be closely aligned with key objects of the Vision 2050 and PNG Development Strategic Plan 2010 – 2030 (DSP) and the Medium Term Development Plan (MTDP). This will also improve the Government’s reform efforts on addressing the underlying issues that negatively impact on public sector service delivery and private sector led market development.
The new Government will remain committed to public sector reform. These reforms will enhance the efficiency and effectiveness of the public sector. The Government is also expected to empower its longstanding Public Expenditure Review and Rationalisation (PERR) program in 2013.
The Government will also continue to support the development of a competitive and dynamic private sector. In 2013, the Government will strengthen existing reforms to make sure that they achieve their objectives and explore areas for further reforms. In addition, the Government’s commitment to removing impediments to doing business and investment in PNG will remain a priority to provide a stable investment climate that promotes a competitive and dynamic private sector in the long term.
7.2 PUBLIC SECTOR REFORM
7.2.1 The Papua New Guinea Vision 2050
During 2012, the Office of PNG Vision 2050 continued to hold consultations with the different sectors and agencies of government to ensure that their sector plans and corporate plans are aligned to the PNG Vision 2050 as well as the PNG DSP and the MTDP. This is a very
2013 Budget, Volume 1
87
important exercise because it will ensure that Agencies are focussed on government priorities and that these priorities are properly addressed. A distinct characteristic of the PNG Vision 2050 is its ‘whole of government’ approach in pursuing the country’s vision. This involves overseeing policy development, coordination of other broader issues such as good governance, public sector reforms and the socio-economic performance of the country.
In 2011, the Office of PNG Vision 2050 released a reporting template to be used by all government agencies including the Provincial Government. This template will be used as part of the process of monitoring and evaluation. The focus of monitoring and evaluation through PNG Vision 2050 is to track agencies’ performances in the implementation of their plans and assess the results and impacts of key priority areas at each level of implementation against each agency’s targets. All monitoring and evaluation reports shall follow this standard reporting format. Monitoring and evaluation shall become an integral function of the Office of PNG Vision 2050 in providing annual review reports which will highlight Agencies’ performances in the implementation of their Plans. All sectoral performance indicators shall be produced annually. The key elements for monitoring sectoral performances will include Agencies’ planned outcomes, indicators, baseline data and targets.
7.2.2 Public Sector Reform Programs in 2013
The Government announced new initiatives for public sector reforms which will take place in the first 18 months in office. This will include reviews and amendments to a number of very important legislations. In addition, the Government will overhaul the public service in order to improve efficiency and accountability. A performance based outcome oriented policy will be undertaken for all levels in the public service.
The Government will also review the current arrangement relating to the Department of Personnel Management and the Public Service Commission. A review of this arrangement will result in the restructure of the Public Service Commission and a smaller Office of Personnel Management that will focus on deployment of public servants and their ongoing in-service training. Part of this reform will include the transfer of powers for appointing Provincial Administrators to the Provincial Executive Council (PEC) while the National Executive Council (NEC) will have the power to hire and fire Departmental Heads.
The reforms will also see the Department of Prime Minister & NEC assuming the responsibility for monitoring the implementation of the Government’s Development Program while the Department of National Planning and District Development will be restructured. With regards to development funds, these will be appropriated and disbursed to the relevant agencies, provincial governments and districts.
7.2.2.1 Service Improvement Program (SIP)
The Service Improvement Program (SIP) is a reform program that is aimed at improving service processes and procedures in agencies in order to better perform their functions. So far, a total of 12 Provinces and 5 National Departments and Agencies have directly benefited from this program while SIP rollout to Districts and LLGs is limited. During 2012, reviews were undertaken in the provinces where SIP programs have been implemented. While some of the provinces have been successful in implementing their programs using SIP related techniques, other provinces will need to undertake further training in order to build capacity.
7.2.2.2 Rightsizing Initiative
Under Public Sector Reforms, the Government continues to be concerned about the high cost of the public sector and the need to greatly improve service delivery and achieve cost
2013 Budget, Volume 1
88
savings. The Government will continue to pursue reforms that will lead to internal rationalisation and streamlining to get departments and agencies to perform their core functions. Reform Programs such as Functional Expenditure Reviews (FER) of departments and agencies and Manpower and Payroll Audits of Provincial Administrations will continue to be conducted in 2013.
7.2.2.3 Functional Expenditure Reviews
Functional Expenditure Review is the process which seeks to improve the efficiency and effectiveness of a department or agency in order to improve service delivery while at the same time maximising revenue collection and containing increased costs. A total of twenty-three FERs have been undertaken involving national departments and agencies. The implementation of the various recommendations of the FERs resulted in significant cost savings and hence improved general performance of these organisations. New FERs for Public Sector Agencies will continue to be conducted in 2013 taking into account recent changes announced by the new Government in relation to overall public sector reforms.
7.2.3 Manpower & Payroll Audits of Provincial Admin istrations.
During 2012, Manpower & Payroll Audits were conducted in four provincial administrations, namely New Ireland, East Sepik, Southern Highlands and Oro. These Audits will continue to be conducted in 2013 because the Government is very concerned about salary over-runs in many provinces. In addition, significant funds are being wasted annually by provincial administrations due to continued breaches and non compliance in the administration of salaries and allowances.
7.2.4 Equitable Resource Allocations to Provincial Governments
The reforms to the Organic Law on Provincial Governments and Local Level Governments and the Intergovernmental Relations (Functions and Funding) Act 2009 have changed the system of intergovernmental financing since 2009. This change in the new system sets a minimum level of funding for the assigned service delivery functions and responsibilities of provincial and local-level governments. It is intended to provide greater certainty for provincial and local-level governments as grants are aligned to Net National Revenue (NNR) and it ensures that the system will remain affordable. The NNR amount is the total tax revenue received by the National Government excluding mining and petroleum tax revenues.
A formula based on a percentage is then applied to the Net National Revenue to derive at an amount called the equalisation amount, which is then divided between individual provincial and local-level governments.
For 2013 the equalisation amount is K394.3 million, an increase of K86.4 million from 2012. This was arrived at by applying the prescribed percentage of 6.6 per cent to the 2011 actual net national revenue amount of K6,001.0 million.
Of the K394.3 million, K263.6 million is to be distributed amongst provinces and LLGs based on a needs basis whilst K130.6 million is to meet the transitional guarantee.
7.2.5 District Treasury Roll-out Program
The District Treasury roll out program has started in 2004. Since its inception, 57 District Tresuries have been fully commissioned and made functional. Of the remaining 32 District Treasuries, 10 commissioned in late 2012 fiscal year and the rest are planned to be
2013 Budget, Volume 1
89
commissioned in 2013. The Government is committed and will continue to make funds available to fully fund the District Treasury Rollout Program in 2013.
The Government has also established cash offices in the districts where mineral exploitation is taking place. There are three cash offices being built in Gembogl District in Chimbu Province, Porgera District in Enga Province and Komo District in the Southern Highlands Province.
Major service changes in 2012 include:
• Establishment of Finance Regional Office (Chimbu–Highlands Region, Madang-Momase Region, Rabaul–New Guinea Islands Region and Central-Southern Region),
• Installation of VSaTs in other District Treasury Offices to improve communication; and
• Arrangement for the coordination and management of BSP Bank Agencies in the District Treasuries by BSP Limited.
7.2.6 Public Service Pay Fixation Agreement 2011 to 2013
All the Pay Fixation Agreement for the three year period from 2011 to 2013 were all approved and implemented in early 2011.This has increased the public service individual base salary by 7.5 per cent in 2011 and 2012 and will continue to increase by 7.5 per cent in 2013. The current Pay Fixation Agreement expires in 2013.
The Public Employees’ Association (PEA) negotiated salary increase of 7.5 per cent does not apply to those agencies whose terms and conditions of employment are determined by the Salaries Condition and Monitoring Committee (SCMC) and other agencies whose salary increases are provided through a separate agreement or other legal instrument. The pay increase for agencies not covered by PEA and qualified the SCMC normal negotiation process have been determined and given approval for implementation. This has allowed sufficient time to phase out by way of spreading the cost overtime through the normal budgetary process.
7.2.7 Superannuation Liabilities
In accordance with Sections 4 and 76 of the Superannuation (General Provisions) Act 2000, the State is obliged to make a mandatory superannuation contribution (State’s superannuation contribution) of an agreed 8.4 per cent of the base salary, individually, for all its employees to the Nambawan Super Limited.
Since 1990, due to constrained fiscal resource envelopes, the State had allocated little or no budgetary allocations for the State’s superannuation contribution over the past fiscal years. Consequently, the State has incurred a substantial level of superannuation liabilities, which needs to be valued accordingly.
Considering the rapid growth of the superannuation liabilities, the State increased budgetary funding especially from the recent supplementary budgets to reduce the level of liabilities. Additionally, the option to make available full budget allocations for State’s superannuation contribution was considered in 2010.
In 2012, the State adopted the Automation of State’s superannuation contribution mechanism; whereby the State’s superannuation contribution of 8.4 per cent is remitted through the Government’s Payroll Systems to the Nambawan Super Limited on a fortnightly basis.
2013 Budget, Volume 1
90
Both the notion to make available full budget allocation and adoption of the Automation Mechanism have significantly reduced the rate of growth of the superannuation liabilities.
However, there is a need for the State to quantify the stock of superannuation liabilities and then devise appropriate settlement framework for the liabilities.
Thus, in 2012, a Joint Working Group, comprised of senior technical officers from the Departments of Treasury, Finance and Personnel Management and Nambawan Super Limited, was formed to:
• quantify the stock of superannuation liabilities by employing all the variables accordingly; and
• thereafter, settlement framework will be devised and adopted. The settlement framework will ensure that the superannuation liabilities are settled over time thus, ensuring that it is fiscally responsible and also would strongly drive the Investment Strategy of the Nambawan Super Limited.
The Joint Working Group will continue its delegated functions in 2013 and thus, will provide a Report to the Government for its consideration.
7.2.8 Integrated Human Resource Payroll System
A major concern of the Government is the lack of control over personnel emoluments expenditures through PNG Government Accounting System (PGAS), which are uncontrolled through the payroll. In particular, the number of “off line” transactions and multiple position occupancies in breach of payroll business rules, thus avoiding establishment controls, appears to be a major problem to maintain budgetary discipline.
The Government’s Payroll System (Alesco or Concept) is not standalone software but it is comprised of many functions of the Human Resource (HR) module as an enabler to processing accurate public servants personnel emoluments.
The Alesco or Concept Payroll rollout to transfer payroll functions to provincial hospitals was introduced by the National Department of Health (NDoH) as a pilot project in late 2009. This project was established to reduce the annual budget constraints on hospital staff travelling to Port Moresby (NDOH HQ) for payroll data entry and cleansing purposes. The Concept Payroll system has been effective especially in processing staff payments in the provinces and creating confidence in hospital management to make timely decisions in relation to their payroll and HR issues. The project has also helped reduce the annual personnel emolument expenditure in the health sector.
The integrated Payroll HR Module Project aims to provide online access to HR managers and their staff using technology already proven successful in the Department of Health, through the hospitals online project. The hospitals that already have online payroll access are: Mt Hagen Provincial Health Authority, Mendi General Hospital, Port Moresby General Hospital, Angau Memorial Hospital, Alotau Provincial Health Authority, Goroka Provincial Health Authority, Popondetta General Hospital, Modilon General Hospital, Kundiawa General Hospital and Nonga General Hospital. The general hospitals which are ready to come online are; Vanimo General Hospital, Kimbe General Hospital, Enga General Hospital and Buka General Hospital and the other remaining general hospitals will have the HR module rolled out in 2013.
The Payroll HR Module Project has also been rolled out to the provinces. The provinces that have online access to the concept payroll system are; East New Britain, Morobe, New Ireland, Eastern Highlands, Enga and West Sepik provinces. The Madang Province is ready

2013 Budget, Volume 1
91
to come online in early 2013. The Payroll HR Module Project is generating positive impacts to hospitals and provinces which have online access.The National Department of Health in collaboration with Central Agencies, particularly Departments of Personnel Management, Finance and Treasury are running this project.
7.2.9 Overall Strategy to Improve Budgetary Control Over the Public Sector Payroll Overruns on Personnel Emoluments.
Personnel Emoluments are comprised of salaries and allowances, wages, overtime, leave fares, retirement benefits, pensions and contract gratuities. The 2012 Budget Personnel Emoluments was set at K2,326.5 million compared to previous years. This reflects costs associated with new wages fixation agreements for public servants.
In previous years inadequate control over the payroll system has been identified as a cause of overspending by agencies. To address this Government has agreed to a number of remedial actions. However, sufficient corrective action has not been taken by the responsible agencies.
A key factor contributing to the excessive growth in staff numbers and cost has been lack of pressure on departments to keep within their budget appropriation for payroll. Control over payroll is a problem in the public sector, and if not attended to, could pose a serious threat to budget management and fiscal sustainability over the long term.
It is estimated that several thousands of the Government’s 89,000 plus employees are employed illegally, including: non-existent employees, one person with multiple salaries, long retrenched or retired staff, those recruited outside of their agencies’ budget appropriation; unattached officers and officers who are routinely absent for long periods without leave.
Total recurrent personnel emolument expenditure overspend of K120.7 million is anticipated in 2012. Historically the rate or expenditure on personnel emolument tends to rise over the course of the year. Significant changes in behavior or the introduction of robust expenditure controls will be required to stop agencies spending in excess of their personnel emolument appropriation.
In recognition of the need to address the problem faced in the expenditure of public monies within the Public Service and in particular the current 2012 Personnel Emoluments over-expenditure trend, the Departmental heads responsible for Department of Personnel Management, Department of Treasury and Department of Finance have decided to seek ways to protect the interest of the people of Papua New Guinea. This will be done by ensuring that the Public Service takes a proactive approach to ensure expenditure in personnel emoluments in the Public Service is kept within budget and that over-expenditure is prevented from happening. This is done with the objective of restoring integrity into the budget planning, implementation and monitoring processes in relation to Personnel Emoluments.
The three Secretaries agreed through resolutions reached for Government funded agencies to improve and strengthen the following activities; Accountability, Data Cleansing, Savings, Data Integrity, Demarcation of Responsibilities, Reviews, Collaboration Partnership, Capacity Enhancement, Resourcing, Business Processes, Sanction, PGAS, Audits and Reporting. The manpower and payroll audits for public servants and teachers in the provinces has started with the provinces which are expected to have higher overrun in 2012 personnel emoluments expenditure.
2013 Budget, Volume 1
92
7.3 A COMPETITIVE AND DYNAMIC PRIVATE SECTOR
Developing and promoting a competitive private sector continues to be a priority of the Government. The Government recognises that developing and promoting this sector will continue to boost productivity that will generate more employment, income earning opportunities, improve service delivery, reliability and affordability,thusstimulating the country’s economic growth. Like in 2012, the Government will continue to pursue the following strategies to support greater private sector activity in 2013:
• Promoting and Enhancing Competition;
• Improving Economic Regulation;
• Developing More Effective and Efficient Competitive Markets; and
• Reducing Impediments to Business Development and Investment Climate.
7.3.1 Enhancing Competition
The Government values the importance of competition. Since the adoption of the competition policy the Government established the Independent Consumer and Competition Commission (ICCC) in 2002 to regulate competition of markets/industries. In 2009, the Government further created a separate entity to regulate competition in the Information and Communication Technology (ICT) sector, known as the National Information and Communication Technology Authority (NICTA). With competition, it is anticipated that quality goods and services would be accessible to the public at affordable prices.
The Government believes that more can be achieved in 2013 as reforms are undertaken to improve institutional and regulatory arrangements in other sectors to encourage competition. In 2013, competition reforms will continue in the telecommunication, electricity and financial sectors.
7.3.1.1 Telecommunication (ICT)
The Government will continue to support enhanced competition in the ICT sector in 2013. The NICTA, through the NICTA (Operator-Licensing) Regulation 2010 and NICTA (Radio-Spectrum) Regulation 2010, has started the issuance of operator licences, allocate and manage radio spectrums, and conduct price regulation. Under this regulatory framework, additional competition has been introduced in the data services segment, for example, the introduction of additional Internet Service Providers (ISPs).
In 2013, the Government through the Department of Information and Communications and NICTA will continue its plans to provide additional ICT services to remote parts of PNG. That is, NICTA will implement this program through its Universal Services Fund branch, which will coordinate the roll-out of telecommunications infrastructure by Operators via a bidding process to bridge the “digital divide” and provide reliable and affordable telecommunications services to remote rural communities.
7.3.1.2 Electricity
In 2013, the Government will implement key Electricity Industry Policy (EIP) activities. These include establishment of Electricity Trust Fund (ETF); establishment of Electricity Management Committee (EMC) and its Secretariat; development of National Electricity Roll - Out Plan (NEROP), and; re-delegation of the Technical Regulatory role from PNG Power to Department of Petroleum and Energy.
2013 Budget, Volume 1
93
Through this policy initiative of Government, electricity will become more accessible, reliable and affordable to most areas of the country thus increasing productivity levels of businesses, households and individuals that depend on it to sustain their operations and livelihood. Through the EIP, the Government is encouraging more private sector participation to make electricity services more accessible, reliable and affordable by having incentives to enhance electricity services to rural areas, and improved regulatory arrangements.
The Government, through the ICCC will develop a “third-party access” code to encourage greater private sector participation in power generation. The EIP recommendations for the ICCC to start working towards cost reflective pricing in electricity price regulation similar to PNG Ports. The Government will continue to strengthen the position of PNG Power as a commercially-oriented business as well as strengthen the Department of Petroleum and Energy to ensure that there is strong Government oversight of the long-term development of the electricity industry through establishing an Electricity Management Committee.
7.3.2 Improved Economic Regulation
To meet its economic regulation responsibilities in 2013, the ICCC will continue to implement the recommendations of the current price control arrangements covering ten industry sectors. This includes Pricing Reviews for services offered by State Owned Enterprises (SoEs) such as electricity, water, postal and ports prices, and for specific regulated products like rice, sugar, flour, and petroleum.
The ICCC also undertakes Industry Reviews which make recommendations to reduce barriers to entry and improve competition for the benefit of consumers. All these reviews are conducted transparently and often seek comments from the public throughout the review process. These reviews adopt a whole of government approach to ensure that all relevant government agencies and stakeholders are consulted and involved.
Currently, the ICCC is undertaking several regulatory and industry reviews, some of which will be completed in 2012 and recommendations will be implemented in 2013 such as for sugar and PMV and Taxi fares, while other reviews will continue and be finalised in 2013, including the stevedoring and handling pricing review.
7.3.2.1 Postal Services Regulatory Contract Review
The ICCC regulates prices for the domestic and international standard 50 grams or less mail stamps and rental of postal boxes by Post PNG Ltd, and is covered through the Postal Services Regulatory Contract. The new regulatory contract will commence on (and from) 1 January 2013. The contract will have the new Post PNG’s price path, capital expenditure requirements and the minimum service standards, amongst other things for its regulated services, as determined by the ICCC.
7.3.2.2 CTP Motor Vehicles Insurance Regulatory Contract Re view
The premiums that Motor Vehicles Insurance Limited (MVIL) charges vehicle owners are regulated by the ICCC through the CTP Motor Vehicles Insurance Regulatory Contract. The new regulatory contract will commence on 1 January 2013 with new MVIL’s price path, capital expenditure requirements and the minimum service standards, amongst other things, determined by the ICCC.
7.3.2.3 Electricity Regulatory Contract Review
The ICCC regulates the prices that PNG Power Ltd (PNG Power) may charge for the Supply and Sale of electricity, the Scheduled Services and the Excluded Services under an
2013 Budget, Volume 1
94
Electricity Regulatory Contract (ERC) which is akin to a general tariff order formerly established under the provision of the ICCC Act 2002 and took effect from July 2002. The new contract issued will also commence on 1 January 2013 the new price path for PNG Power for the next five year regulatory period, as set and determined by the ICCC. This new contract will assist PNG Power to utilise its capital spending plan to improve on network reliability, efficiency and service standards performance.
7.3.2.4 Sugar Prices Review
The prior price control arrangements for sugar products were defined in the Sundry Declared Goods Pricing Review dated 16 August 2007. One outcome of this review was the monitoring of factory gate prices for Ramu sugar. The price monitoring arrangement for the prices of Ramu sugar will end on 31 December 2012. As such, the ICCC completed and determined a new pricing arrangement, which will commence in 2013 and over the next new pricing period.
7.3.2.5 Water & Sewerage Services: Mid-Term Capital Expendi ture Review
The ICCC undertook a review into the pricing arrangement of water and sewerage services and released a Final Report in 2009. The principal determination in that Report is that the ICCC will set the maximum charges for water and sewerage services provided by Eda Ranu and Water PNG for a period of five years commencing 1 January 2010 and ending 31 December 2014.
One of the other determinations is the mid-term review of the capital expenditure of the two water entities. This review allows for the ICCC to examine whether the two entities have undertaken the capital expenditure as forecasted and captured in their pricing formula. The ICCC will review the Capital Expenditure and amend the current pricing formulation in 2013 as soon as it receives the submission from the two entities. Such review is important so that the ICCC can protect consumers from paying unnecessarily high prices for capital expenditure not incurred on projects identified by the water companies.
7.3.2.6 PMV & Taxi Fare and Industry Review
The last PMV & Taxi Fare Review was completed on 7 November 2007. This report defined the price control arrangements for the fares for PMVs over the major routes and for taxis in the major markets within Papua New Guinea. The price control period for setting the fares for PMVs and Taxis ends on 31 December 2012 and a new period with new determination on the fares arrangements by the ICCC will commence in 2013.
7.3.2.7 Agricultural Commodity Pricing Reviews
The ICCC completed a review into the pricing formula used for agricultural commodities such as oil palm, cocoa, coffee, copra and vanilla. The main objectives of the review are to: (i) ensure that growers get a good price in the production of these commodities; (ii) ensure that the prices reflect the sharing of risks between the growers, millers and exporters in relation to the international prices available for refined and unrefined products; and (iii) ensure that such pricing formula comply with the provisions of the ICCC Act.
A new pricing arrangement and structure was determined by the ICCC, which reflecting the above objectives will commence in 2013.
7.3.2.8 Regulation for Consumer Protection
The ICCC has some specific, but limited, responsibilities for consumer protection. It aims to increase and expand its enforcement and compliance activities to empower consumers

2013 Budget, Volume 1
95
across the entire country. This will include efforts to take on businesses that market unsafe goods or engage in misleading or deceptive promotions.
In 2012, it embarked on improving the product safety and it will, in 2013 and onwards, use its powers to impose interim bans on products that are hazardous or unsafe to consumers.
Also during 2012, the ICCC made substantial progress towards resolving a matter involving health and safety in relation to misleading labelling of alcohol content and hopes to complete the resolution in 2013.
The ICCC also carries out other important functions such as inspection and calibration of taxi meters and weighing equipment. As part of its efforts to ensure that taxi and PMV fares are correctly charged, it participates in joint road-block operations with Police and Department of Transport Officers. This will continue in 2013 and years to come.
7.3.2.9 Competition and Fair Trading Complaints
One of the ICCC’s key roles is to promote competition. It actively monitors the market place for anti-competitive behaviour and takes action to prevent this. However, in some circumstances anti competitive behaviour can have an offsetting benefit to the community and the ICCC allows exemption the rule in such circumstances.
The ICCC plans to expand its education and consultation program during 2013. As a consequence of its educative work, the ICCC expects an increase in complaints regarding unfair and anti competitive practices and expects further requests for exemptions on public benefit grounds flowing from continued strong economic activity in 2013.
7.3.3 Developing More Effective and Efficient Marke ts
The optimal allocation of scarce economic resources indicates a well functioning market. In 2013, the Government will focus its reforms on market development relating to land, housing and finance access (via Microfinance and Secured lending).
7.3.3.1 National Land Development Program
The National Land Development Program (NLDP) focuses around improving land administration, developing viable land dispute resolution and creating acceptable means to accessing land under customary ownership. Since its inception in 2005, NLDP has achieved significant legislative and administrative reform milestones. In 2013, the NLDP will continue to focus on coordinating its activities underneath the framework set out in the NLDP Phase I Implementation Plan 2011-2015. It is intended that an NLDP office will be established to oversee the implementation of this work. The NLDP Office proposal is awaiting the National Executive Council’s decision.
7.3.3.2 Housing Policy
In January 2010, the ICCC released the Final Report of its review into the Housing and Real Estate industry in PNG. The report recognised that high prices and lack of affordability are only symptoms of broader failures, particularly in relation to an insufficient supply of land.
The report recommended that a holistic approach be undertaken to address PNG’s housing scarcity problems and noted that coordination within the National Government agencies and the relevant arms of the Provincial and Local Level Governments could be improved to increase residential and industrial constructions.

2013 Budget, Volume 1
96
Whilst the implementation of these recommendations has been delayed, a Housing Policy Implementation Taskforce (HPIT) to be chaired by the Department of Treasury has been established. The Secretariat is the National Research Institute. This Taskforce will concentrate on implementing the recommendations of the Report.
7.3.3.3 Microfinance
Microfinance is the provision of a broad range of financial services such as deposits, loans, payment services, money transfers, and insurance to rural and low-income households and their micro-enterprises.
Phase II of the Microfinance Expansion project (MEP) will continue in 2013. These include strengthening the regulatory capacity of the Bank of Papua New Guinea, as well as implementing the“risk-share” facility to encourage capable microfinance institutions to increase micro-lending to genuine business proposals. ADB will continue to provide technical and financial assistance for the project.
7.3.3.4 Secured Lending
The Government developed a legal framework to identify ways of providing greater confidence to lenders in order to encourage more secured lending arrangements. This legal framework, known as Personal Property Security (PPS) Act 2012 was developed and enacted by Parliament in 2011. A key recommendation of this Act is to establish a single “asset registry” so that information can be made available to lending institutions regarding the collateral offered by prospective borrowers.
The Governments believes that this PPS Act will provide a consistent, modern, up-to-date legal framework for all loans that are secured by personal property.
The Government is currently implementing key recommendations under this Act. One of which is the establishment of the registry, and the appointment of the PPS Registrar. The Government appointed the Credit and Data Bureau (CDB) Managing Director as the PPS Registrar and CDB itself as the administrator of the registry.
7.3.4 Reducing Impediments to Business and Improvin g Investment (SME sector)
In an international survey recently released by the World Bank (Doing Business Report 2013), PNG was ranked 104 out of 185 countries in terms of the costs of doing business. Reducing impediments to business and investment is a key priority of government because this reduces costs for businesses, in particular the small and medium enterprises (SME), and promotes private sector development and growth. As part of the government’s ongoing effort in addressing private sector issues, the Government will have a focus on encouraging the growth of and creating opportunities for the SME sector, which will including undertaking the following initiatives as priorities in 2013.
7.3.4.1 Review of the Companies Act 1997
The Investment Promotion Authority (IPA) is continuing to pursue legal reforms to improve the efficiency of its overall operations. This includes a full review of the Companies Act 1997. The aim of this review will be to identify impediments potential investors face in setting up a business in PNG. The recommendations of the review are expected to be implemented in 2013.
7.3.4.2 Reviewing of Other Legislations
2013 Budget, Volume 1
97
The Government always considers having legal practises that does meet the current pressing demands and the practical standards and requirements. An effective robust competitive legal framework will mobilise good policy direction and future handling of competitive issues effectively and appropriately. As an adjunct to this, the Government intends to consider options for improving the business regulatory environment to make it more efficient and effective.
The Government is looking at reviewing the ICCC Act in 2013 as one of its core focus to improve legislations that governs competition. The Act was established in 2002, eventually creating the Commission (ICCC). Since then, no review was undertaken to ensure its competitiveness and current legal standards. The aim of undertaking review is to: ensure that this Act is up to date with the current economic environment surrounding competition, and; to mend loop holes and uncertainty in the processes and procedures created by competition issues currently being faced.
Also the Government is planning to undertake special review into the Coffee Industry Corporation (CIC) Act in 2013. Similar to ICCC, the Act has not been reviewed since its enactment. Coffee is one export earning product that PNG is relying on. The Act is silent on resolving some important issues. Reviewing the Act will greatly benefit the coffee industries, producers, coffee growers associations and relevant stakeholders in addressing key issues surrounding coffee at this current state of economic activity.
7.3.4.3 Government commitment to further examine the implem entation of the Extractive Industries Transparency Initiative (EITI )
The EITI is a means of addressing the “resource curse” that has damaged many mineral and petroleum rich countries. EITI aims to strengthen governance by improving transparency and accountability in receipt and payments of revenue streams associated with extraction of oil, gas, and other mineral resources.
The Government recognises the need for improved transparency, accountability and governance in dealing with the country’s resource rents. The Government has therefore committed to further examine the implementation of the EITI in PNG.
The Government has approved the engagement of a State Working Group (SWG), chaired by the Department of Treasury, to work with World Bank (WB) Technical Assistance in developing a detailed implementation plan for the EITI concept in PNG. This detailed implementation plan will be presented to the NEC for consideration.
EITI implementation could send a signal to grass root Papua New Guineans that they should have faith in the payments, receipts, and spending from extractive industry revenues. It could also make it easier to detect corruption by providing information on revenue and payments available to public. EITI will also assist in managing corporate risks, especially to extractive industry companies, and thus, improve investor confidence in PNG. This could also assist the Government improve its sovereign credit rating (potentially leading to lower costs of borrowing).
An NEC submission for the Government to make a public announcement and implement EITI in the country has been submitted and is awaiting an NEC decision on it.

2013 Budget, Volume 1
98
CHAPTER 8. IMPROVING PUBLIC ENTERPRISE AND COMMERCIAL INVESTMENT PERFORMANCE
8.1 OVERVIEW
Public enterprises and State investments in commercial businesses are an important part of the PNG economy.
Public enterpriseshave a major role in providing power, telecommunications and other services that are essential for a growing economy.Good public policy will help ensure that public enterprisesare run in a way that helps ensure that these critical services are available broadly within PNG, are reliable, and are provided as efficiently as possible.
The State also has commercial investments in large businesses, including the Bank of South Pacific, the PNG LNG project and the Ok Tedi mine. Good commercial performance of these investments and of public enterprises helps ensure that the people of PNG receive an appropriate return on the significant investment they have made in these businesses.
Over the last eighteen months, the Government has announced that it would take a new approach to increase the level of transparency and accountability to improve of public enterprises, which should improve their performance. The inclusion of a thischapter on these reforms in the 2012 Budget signaled the start of this new approach. This chapter provides an update on public enterprise performance and reforms, and outlines further reforms planned for 2013.
8.2 POLICY DIALOGUE AND PUBLIC ENTERPRISE PERFORMAN CE
Public enterprises and commercial investments are a large part of the economy in terms of the volume of their asset value. The total value of these assets was estimated to be K7.8 billion, as at end 2011. That is equivalent to about K1,100 per person in PNG (based on a population of 7 million).
Public enterprises and commercial investments cover a range of sectors. The extractive industries sector is the biggest part of the portfolio in terms of asset value (K4,909.5 million), accounting for nearly two-thirds of the State’s portfolio. This included the State’s shares in Oil Search, Ok Tedi Mining Ltd, Mineral Resource Development Corporation (MRDC), Petromin and others. The next key area is transport services and utilities (K1,711.7 million) – which includes shares Telikom PNG, PNG Power, PNG Ports, Water PNG, Eda Ranu and Air Niugini – and accounts for about 22 per cent of the portfolio. Financial services are another big part of the portfolio and this sector includes investments in Bank of South Pacific, Motor Vehicle Insurance Ltd, and the National Development Bank. The State’s interests in these businesses had a combined value of K955.1 million in 2011.
The majority of the public enterprises and State investments (K6,624.3 million or about 85 per cent of the portfolio) are held in trust and managed by the Independent Public Business Corporation (IPBC). The remainder is managed directly by government agencies.
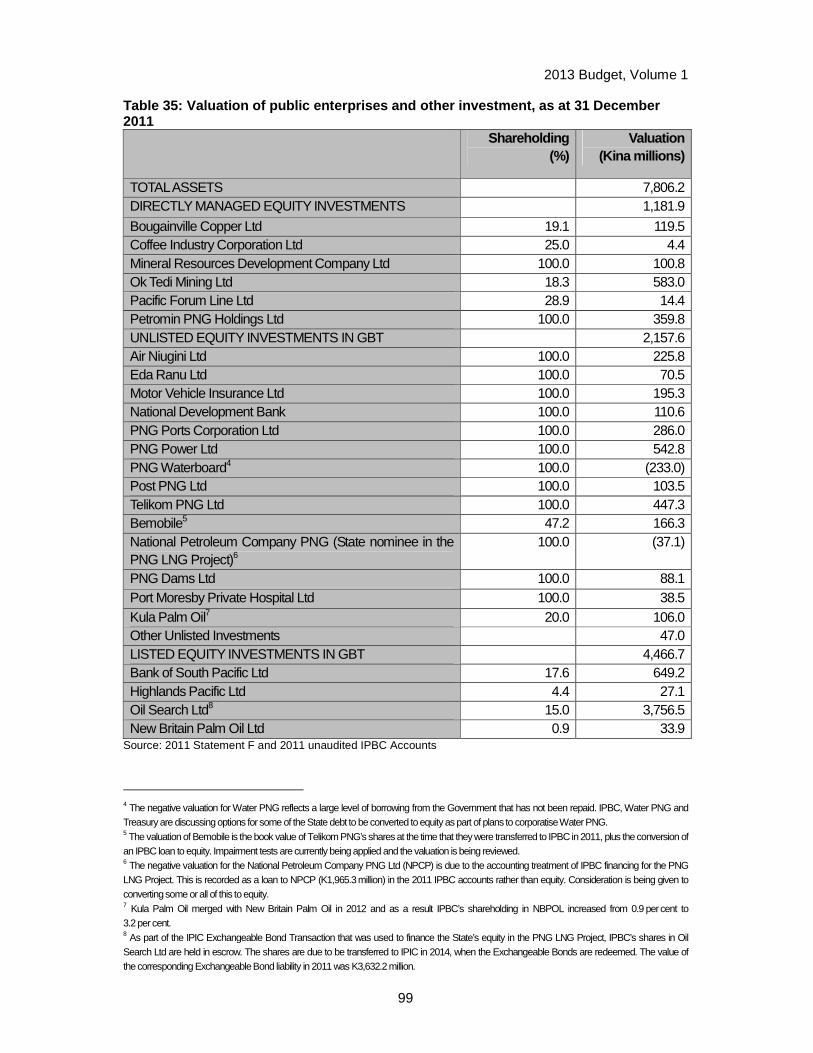
2013 Budget, Volume 1
99
Table 35: Valuation of public enterprises and other investment, as at 31 December 2011 Shareholding
(%) Valuation
(Kina millions)
TOTAL ASSETS 7,806.2 DIRECTLY MANAGED EQUITY INVESTMENTS 1,181.9
Bougainville Copper Ltd 19.1 119.5 Coffee Industry Corporation Ltd 25.0 4.4 Mineral Resources Development Company Ltd 100.0 100.8 Ok Tedi Mining Ltd 18.3 583.0 Pacific Forum Line Ltd 28.9 14.4 Petromin PNG Holdings Ltd 100.0 359.8 UNLISTED EQUITY INVESTMENTS IN GBT 2,157.6 Air Niugini Ltd 100.0 225.8 Eda Ranu Ltd 100.0 70.5 Motor Vehicle Insurance Ltd 100.0 195.3 National Development Bank 100.0 110.6 PNG Ports Corporation Ltd 100.0 286.0 PNG Power Ltd 100.0 542.8 PNG Waterboard4 100.0 (233.0) Post PNG Ltd 100.0 103.5 Telikom PNG Ltd 100.0 447.3 Bemobile5 47.2 166.3 National Petroleum Company PNG (State nominee in the PNG LNG Project)6
100.0 (37.1)
PNG Dams Ltd 100.0 88.1 Port Moresby Private Hospital Ltd 100.0 38.5 Kula Palm Oil7 20.0 106.0 Other Unlisted Investments 47.0 LISTED EQUITY INVESTMENTS IN GBT 4,466.7 Bank of South Pacific Ltd 17.6 649.2 Highlands Pacific Ltd 4.4 27.1 Oil Search Ltd8 15.0 3,756.5 New Britain Palm Oil Ltd 0.9 33.9
Source: 2011 Statement F and 2011 unaudited IPBC Accounts
4 The negative valuation for Water PNG reflects a large level of borrowing from the Government that has not been repaid. IPBC, Water PNG and Treasury are discussing options for some of the State debt to be converted to equity as part of plans to corporatise Water PNG. 5 The valuation of Bemobile is the book value of Telikom PNG’s shares at the time that they were transferred to IPBC in 2011, plus the conversion of an IPBC loan to equity. Impairment tests are currently being applied and the valuation is being reviewed. 6 The negative valuation for the National Petroleum Company PNG Ltd (NPCP) is due to the accounting treatment of IPBC financing for the PNG LNG Project. This is recorded as a loan to NPCP (K1,965.3 million) in the 2011 IPBC accounts rather than equity. Consideration is being given to converting some or all of this to equity. 7 Kula Palm Oil merged with New Britain Palm Oil in 2012 and as a result IPBC’s shareholding in NBPOL increased from 0.9 per cent to 3.2 per cent. 8 As part of the IPIC Exchangeable Bond Transaction that was used to finance the State’s equity in the PNG LNG Project, IPBC’s shares in Oil Search Ltd are held in escrow. The shares are due to be transferred to IPIC in 2014, when the Exchangeable Bonds are redeemed. The value of the corresponding Exchangeable Bond liability in 2011 was K3,632.2 million.

2013 Budget, Volume 1
100
During 2012, the Governmentrequested the Asian Development Bank to conduct a study of the performance of public enterprises, compared to similar business in six other Pacific countries, in order to inform the reform process and contribute to the increased transparency in the sector.
The findings of the study reveal that while PNG’s SOEs have produced net profits that are in the upper range of the public enterprises portfolios in the six Pacific countries benchmarked, they have done so at a substantial cost in terms of ongoing fiscal transfers and other subsidies, to the detriment of the poorer segments of the population due to the generally poor quality of the services provided and limited range of delivery. By absorbing large amounts of scarce capital stock on which they provide very low returns, crowding out the private sector, and diverting public funds that could otherwise be invested in such high-yielding social sectors as health and education, public enterprises act as a drag on economic growth.
The study noted two major failings of the current legislative framework. First, the legislative framework is poorly designed and second, the legislative framework has not been adequately enforced. The study states that:
‘It is clear that successive changes to the IPBC Act since it was first introduced have lacked coherence and are inadequate to support robust [public enterprise] governance and accountability. Moreover, where the governance, accountability and reporting requirements of the IPBC Act have been strengthened, often the new provisions have been ignored. The consequences of this lack of clarity and enforcement can be seen in the performance of the portfolio over the [2002-2011 financial years]. Good performance – where it exists – seems to be more a function of good luck than the application of a robust legislative framework.’
The poor enforcement of the current legislative framework can be seen in the lack of publication of annual plans of the IPBC and public enterprises, a key accountability mechanism (2012 has seen the first ever preparations of these plans).The study concludes that for much of the last 9 years, the IPBC board has not been fully or properly constituted.
This kind of feedback is welcome and a reflection of the more open policy debate that is now taking place on public enterprise policy.
To address these key failings identified in the study, the Government has directed the IPBC to develop and submit a policy paper on the management of public enterprises, the extent to which boards should be permitted to operate in a commercial manner independent of Government, and improved monitoring mechanisms. The Government recognizes that ten key principles identified during following a policy forum organised by the National Research Institute (NRI) in early October 2012 provide a useful framework in developing this policy paper. The ten key principles are:
1. Public enterprises to maximise profits subject to three constraints – meeting minimum regulatory delivery standards, a hard budget constraint and operating within a competitive framework.
2. The State, as the major shareholder, will support competition within the marketplace, and particularly in industries with market power.
3. The State will facilitate unbundling of services so as to increase competition and improve quality and safety, whilst improving access to services.
4. Any exceptions to the above principles will be clearly articulated and justified on the grounds of economic efficiency. (This principle protects against rent-seeking and ensures transparency and accountability.)
2013 Budget, Volume 1
101
5. The State will over time, and wherever possible, divest its majority stake in public enterprises.
6. The State to support mobilisation of savings for investment in private enterprises within the natural resources sector, with public equity, and all else equal, such encouragement will favour citizens.
7. Appointments to public enterprise and State Investment boards will be conducted transparently and on merit basis so that capable and committed members of the public who will be appointed to govern these investments.
8. Each enterprise will meet the same disclosure requirements as for publicly listed companies on the international stock exchange.
9. Introduce competency in the management of public enterprises and State Investments.
10. Financing for public enterprises and State Investments has to be diversified, both across stakeholders and between short and long term debt.
Following receipt of this policy paper, the Government will prepare a strategic framework that aims to improve the coherence of the IPBC Act, so that roles and responsibilities are appropriately allocated, reporting is improved, and appropriate accountability and governance arrangements (including funding arrangements) are implemented. The Government’s strategic framework will also seek to improve its oversight function to ensure IPBC compliance with current and future provisions of the IPBC Act.
In addition to improving the coherence of the IPBC Act, the Government’s strategic framework will progress other elements of the public enterprises framework, including the development of a dividend policy, guidelines for the delivery of community service obligations (CSOs) by public enterprises, and a public–private partnership policy; increased transparency of public enterprises performance; and strengthened governance implementation ofan on-lending policy and guarantee policy. Taken together, these reforms will allow the public enterprises to operate as commercial entities, improve service delivery, and be held accountable for results.
The remainder of this chapter discusses some of the policy settings for public enterprises, continuing reforms to the IPBC, and the State’s commercial investments in extractive industries.
8.3 POLICY SETTINGS FOR PUBLIC ENTERPRISES
Like any shareholder, the Government expects a commercial return on its investments. To avoid confusion, it is critical that the Government clearly communicates its expectations of, and clarifies the policy settings for, the public enterprises and commercial investments.
A key aspect of the policy settings involves communicating that the Government expects public enterprises to operate as commercial and professionally-managed businesses. Consistent with this principal objective, they should be as profitable as a comparable business not owned by the State.
The Government will reflect this desire that public enterprises operate with a commercial focus via the finalisation of Dividend, Community Service Obligation (CSO), Public Private Partnership (PPP), On-lending and Guarantee policies.
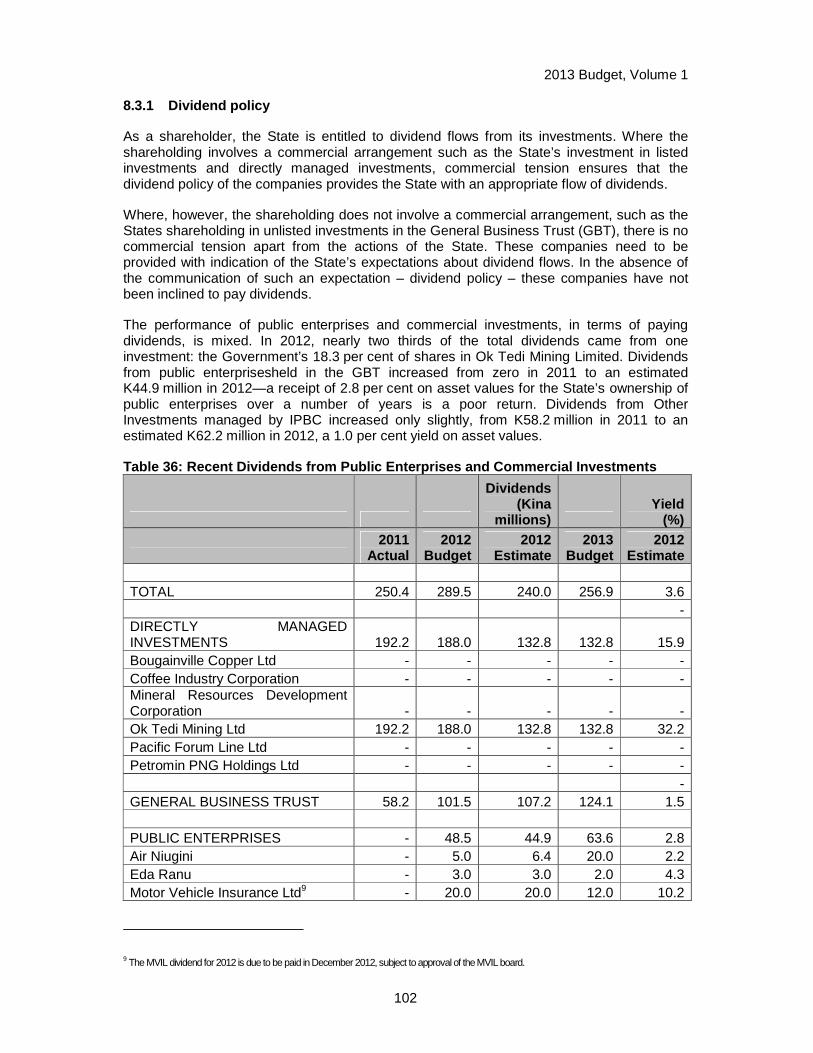
2013 Budget, Volume 1
102
8.3.1 Dividend policy
As a shareholder, the State is entitled to dividend flows from its investments. Where the shareholding involves a commercial arrangement such as the State’s investment in listed investments and directly managed investments, commercial tension ensures that the dividend policy of the companies provides the State with an appropriate flow of dividends.
Where, however, the shareholding does not involve a commercial arrangement, such as the States shareholding in unlisted investments in the General Business Trust (GBT), there is no commercial tension apart from the actions of the State. These companies need to be provided with indication of the State’s expectations about dividend flows. In the absence of the communication of such an expectation – dividend policy – these companies have not been inclined to pay dividends.
The performance of public enterprises and commercial investments, in terms of paying dividends, is mixed. In 2012, nearly two thirds of the total dividends came from one investment: the Government’s 18.3 per cent of shares in Ok Tedi Mining Limited. Dividends from public enterprisesheld in the GBT increased from zero in 2011 to an estimated K44.9 million in 2012—a receipt of 2.8 per cent on asset values for the State’s ownership of public enterprises over a number of years is a poor return. Dividends from Other Investments managed by IPBC increased only slightly, from K58.2 million in 2011 to an estimated K62.2 million in 2012, a 1.0 per cent yield on asset values.
Table 36: Recent Dividends from Public Enterprises and Commercial Investments
Dividends (Kina
millions) Yield
(%)
2011
Actual 2012
Budget 2012
Estimate 2013
Budget 2012
Estimate TOTAL 250.4 289.5 240.0 256.9 3.6 - DIRECTLY MANAGED INVESTMENTS 192.2 188.0 132.8 132.8 15.9 Bougainville Copper Ltd - - - - - Coffee Industry Corporation - - - - - Mineral Resources Development Corporation - - - - - Ok Tedi Mining Ltd 192.2 188.0 132.8 132.8 32.2 Pacific Forum Line Ltd - - - - - Petromin PNG Holdings Ltd - - - - - - GENERAL BUSINESS TRUST 58.2 101.5 107.2 124.1 1.5 PUBLIC ENTERPRISES - 48.5 44.9 63.6 2.8 Air Niugini - 5.0 6.4 20.0 2.2 Eda Ranu - 3.0 3.0 2.0 4.3 Motor Vehicle Insurance Ltd9 - 20.0 20.0 12.0 10.2
9 The MVIL dividend for 2012 is due to be paid in December 2012, subject to approval of the MVIL board.

2013 Budget, Volume 1
103
Dividends (Kina
millions) Yield
(%)
2011
Actual 2012
Budget 2012
Estimate 2013
Budget 2012
Estimate National Development Bank Ltd - - - - - National Petroleum Company PNG Ltd(State nominee in the PNG LNG Project) - - - 5.0 - PNG Ports Corporation Ltd - 20.0 15.0 22.0 7.0 PNG Power Ltd - - - 2.0 - Post PNG Ltd - - - - - Telikom PNG Ltd - - - - - Water PNG - 0.5 0.5 0.6 (0.2) OTHER INVESTMENTS 58.2 53.0 62.2 60.5 1.0 Bank South Pacific 39.4 29.5 45.5 40.0 4.5 Bemobile - - - - - Kula Palm Oil Ltd - - - - - NBPOL 0.5 4.5 0.9 2.5 13.3 Oil Search Ltd 18.3 19.0 15.9 18.0 0.5 PNG Forest Products Ltd - - - - - Other - - - - -
Source: IPBC, Annual Reports and Treasury
In 2013, the Government intends to finalise its dividend policy. This policy will be consistent with commercial principles that support shareholders’ expectation of dividends in a normal commercial setting. This will ensure that the dividends from public enterprises will be determined in a manner that is similar to those applying to the State’s other investments. In essence, the policy will involve an expectation that retained earnings will be returned to the State via a dividend payment if the public enterprises cannot demonstrate that it can make a return on these retained earning that exceeds the cost of capital (i.e. the social return to the State’s use of those funds in its fiscal and development strategy).
The principle likely to underpin this policy is that public enterprises will develop, and be held accountable for, specific dividend targets. These targets will be developed by public enterprises –guided by the IPBC as trustee of the GBT –and take into account the recapitalisation requirements for each business and ability to generate sustainable profits.
A final key aspect of the dividend policy will be to ensure appropriate flows from the public enterprises and IPBC to the Consolidated Revenue Fund for Budget prioritisation.The dividend policy will also take into account the management fees that are charged by the IPBC as trustee of the GBT. Under the IPBC Act, the IPBC as trustee of the GBT is entitled to retain GBT income to fund its operational costs. This retained income is to be agreed with Treasury and is legislatively required to be included in a business plan that is approved by NEC. In 2011 and 2012, the actual and estimated GBT revenue and total administrative costs of the IPBC are as follows, which represents a GBT income to management expense ratio of 25.3 per cent and 121.0 per cent respectively. Much of the IPBC expenses reflects ‘project-related costs’ which are yet another means by which public enterprise businesses have been supported by the State.
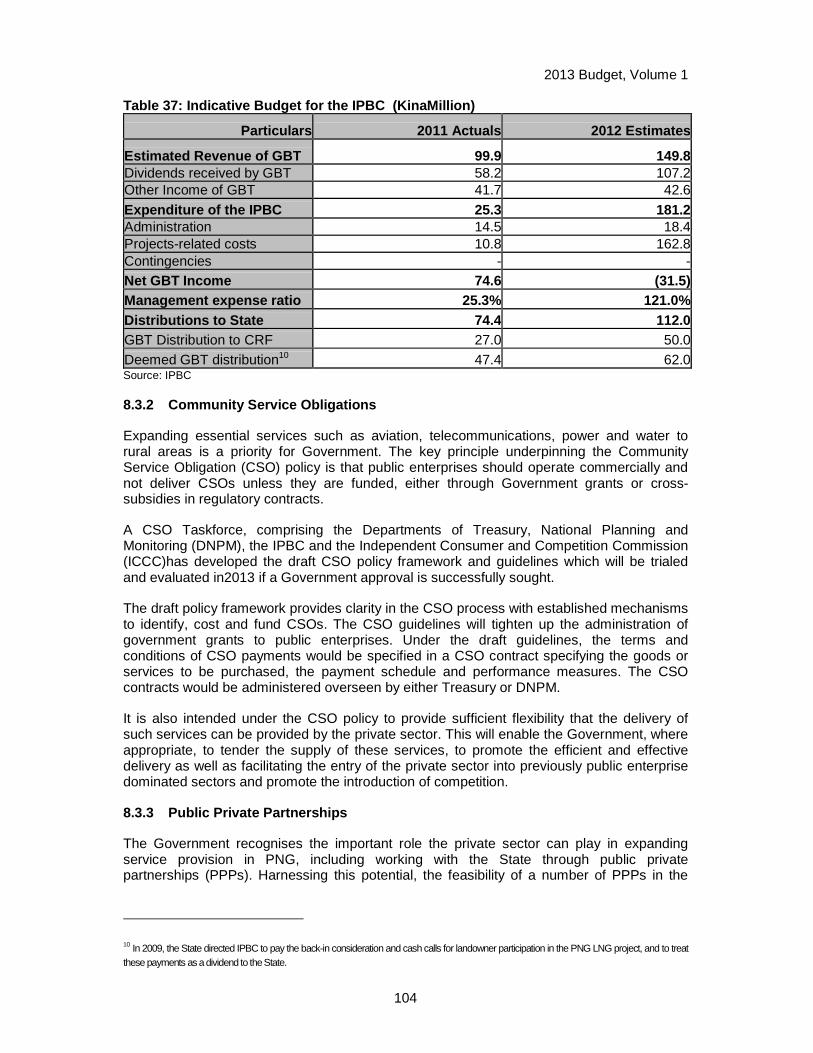
2013 Budget, Volume 1
104
Table 37: Indicative Budget for the IPBC (KinaMill ion)
Particulars 2011 Actuals 2012 Estimates
Estimated Revenue of GBT 99.9 149.8Dividends received by GBT 58.2 107.2Other Income of GBT 41.7 42.6Expenditure of the IPBC 25.3 181.2Administration 14.5 18.4Projects-related costs 10.8 162.8Contingencies - -Net GBT Income 74.6 (31.5)Management expense ratio 25.3% 121.0%Distributions to State 74.4 112.0GBT Distribution to CRF 27.0 50.0Deemed GBT distribution10 47.4 62.0Source: IPBC
8.3.2 Community Service Obligations
Expanding essential services such as aviation, telecommunications, power and water to rural areas is a priority for Government. The key principle underpinning the Community Service Obligation (CSO) policy is that public enterprises should operate commercially and not deliver CSOs unless they are funded, either through Government grants or cross-subsidies in regulatory contracts.
A CSO Taskforce, comprising the Departments of Treasury, National Planning and Monitoring (DNPM), the IPBC and the Independent Consumer and Competition Commission (ICCC)has developed the draft CSO policy framework and guidelines which will be trialed and evaluated in2013 if a Government approval is successfully sought.
The draft policy framework provides clarity in the CSO process with established mechanisms to identify, cost and fund CSOs. The CSO guidelines will tighten up the administration of government grants to public enterprises. Under the draft guidelines, the terms and conditions of CSO payments would be specified in a CSO contract specifying the goods or services to be purchased, the payment schedule and performance measures. The CSO contracts would be administered overseen by either Treasury or DNPM.
It is also intended under the CSO policy to provide sufficient flexibility that the delivery of such services can be provided by the private sector. This will enable the Government, where appropriate, to tender the supply of these services, to promote the efficient and effective delivery as well as facilitating the entry of the private sector into previously public enterprise dominated sectors and promote the introduction of competition.
8.3.3 Public Private Partnerships
The Government recognises the important role the private sector can play in expanding service provision in PNG, including working with the State through public private partnerships (PPPs). Harnessing this potential, the feasibility of a number of PPPs in the
10 In 2009, the State directed IPBC to pay the back-in consideration and cash calls for landowner participation in the PNG LNG project, and to treat these payments as a dividend to the State.
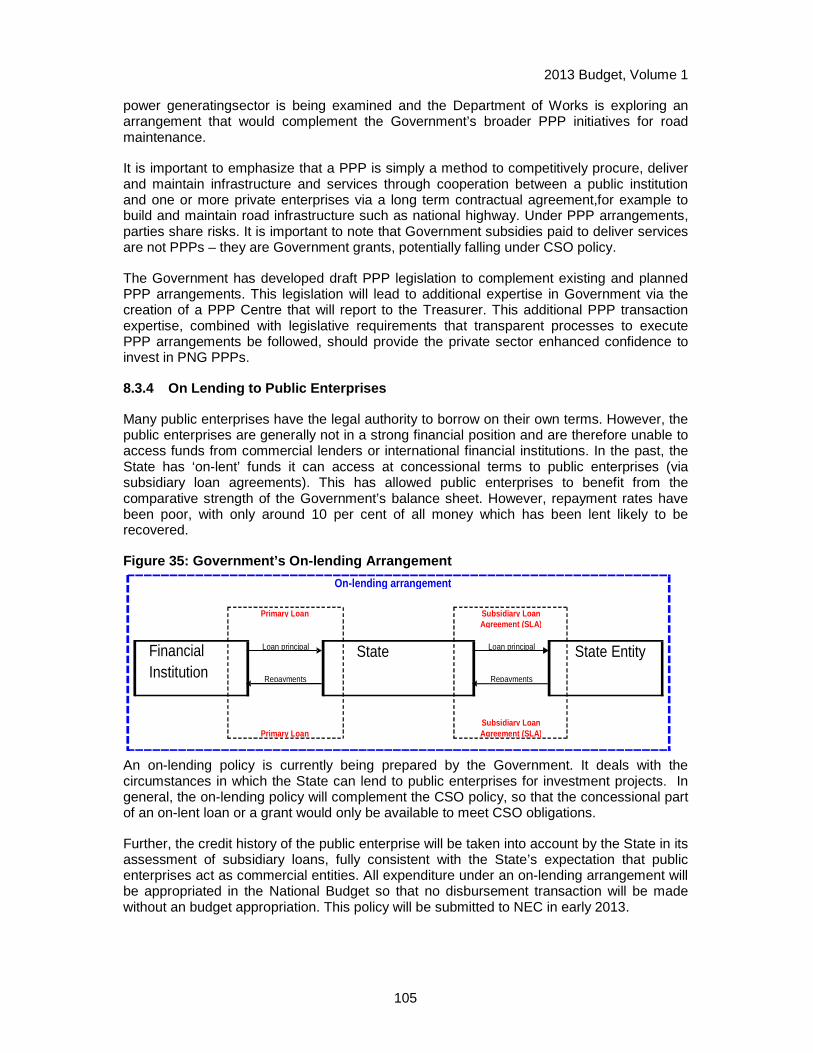
2013 Budget, Volume 1
105
power generatingsector is being examined and the Department of Works is exploring an arrangement that would complement the Government’s broader PPP initiatives for road maintenance.
It is important to emphasize that a PPP is simply a method to competitively procure, deliver and maintain infrastructure and services through cooperation between a public institution and one or more private enterprises via a long term contractual agreement,for example to build and maintain road infrastructure such as national highway. Under PPP arrangements, parties share risks. It is important to note that Government subsidies paid to deliver services are not PPPs – they are Government grants, potentially falling under CSO policy.
The Government has developed draft PPP legislation to complement existing and planned PPP arrangements. This legislation will lead to additional expertise in Government via the creation of a PPP Centre that will report to the Treasurer. This additional PPP transaction expertise, combined with legislative requirements that transparent processes to execute PPP arrangements be followed, should provide the private sector enhanced confidence to invest in PNG PPPs.
8.3.4 On Lending to Public Enterprises
Many public enterprises have the legal authority to borrow on their own terms. However, the public enterprises are generally not in a strong financial position and are therefore unable to access funds from commercial lenders or international financial institutions. In the past, the State has ‘on-lent’ funds it can access at concessional terms to public enterprises (via subsidiary loan agreements). This has allowed public enterprises to benefit from the comparative strength of the Government’s balance sheet. However, repayment rates have been poor, with only around 10 per cent of all money which has been lent likely to be recovered.
Figure 35: Government’s On-lending Arrangement
An on-lending policy is currently being prepared by the Government. It deals with the circumstances in which the State can lend to public enterprises for investment projects. In general, the on-lending policy will complement the CSO policy, so that the concessional part of an on-lent loan or a grant would only be available to meet CSO obligations.
Further, the credit history of the public enterprise will be taken into account by the State in its assessment of subsidiary loans, fully consistent with the State’s expectation that public enterprises act as commercial entities. All expenditure under an on-lending arrangement will be appropriated in the National Budget so that no disbursement transaction will be made without an budget appropriation. This policy will be submitted to NEC in early 2013.
On-lending arrangement
Financial Institution
State
State Entity Loan principal Loan principal
Repayments Repayments
Primary Loan Subsidiary Loan
Primary Loan Agreement (SLA)
Agreement (SLA)
Subsidiary Loan
2013 Budget, Volume 1
106
8.3.5 Guarantee Policy
As already mentioned, public enterprises are generally not in a strong financial position and are therefore unable to access funds from commercial lenders or international financial institutions. Another way for the State to use its comparatively stronger balance sheet to assist public enterprises to raise finance is to provide a guarantee to the public enterprise.
However, the guarantee exposes the State to risks in the event of the public enterprise defaulting on the loan – in essence, a guarantee represents a transfer of value from the State to the public enterprise.
The Government is currently formulating a guarantee policy that balances the benefit of financing flexibility that guarantees provide, while ensuring that the State’s exposure to these contingent liabilities is taken into account transparently and in a way that recognizes the cost to the State of providing the guarantee.
8.4 STRENTHENING POLICY FORMULATION
Efficient and effective operation of public enterprises requires clear policies and directions from Government. The policies and principles outline above highlight some of the areas where this clarity is being provided. And the process of developing these policies has identified institutional weaknesses that are being addressed.
In 2012, the Government recognised that duplication of policy responsibilities among Department of Treasury, Department of National Pplanning Monitoring and the Department of Public Enterprises was impeding policy formulation. In order to streamline the organisation arrangements, the Department of Public Enterprises was abolished. NEC has directed that the Department of Treasury will lead on publicenterprise policy with support from the Department of National Planning and Monitoring and in close consultation with IPBC. Although these arrangements have unblocked the policy process, they have also left a gap in terms of policy support to the Minister for Public Enterprises and State Investments. The Government has therefore decided to establish an Office of State Enterprises to support the Minister. The establishment of the office will be done in close consultation with Treasury.
8.5 CONTINUING REFORMS TO THE INDEPENDENT PUBLIC B USINESS CORPORATION
The Independent Public Business Corporation (IPBC) as trustee of the GBT exercises the State’s shareholder rights on behalf of the State. The IPBC also has a role in providing services to Government and SOEs. The Independent Public Business Corporation Act provides important safeguards to ensure that the public benefits from public enterprises and State investments. This includes trustee arrangements, independent directors nominated by civil society, and rules on transparency and accountability. The important role of the IPBC is a key consideration in improving the coherence of the Independent Public Business Corporation Act.
IPBC is required to submit a business plan to Government for approval. The IPBC is currently in the process of preparing a business plan for 2013 to the Government for approval. The business plan will be published on the IPBC’s website, www.ipbc.com.pg.
8.6 STATE INVESTMENT IN EXTRACTIVE INDUSTRIES
State investments in extractive industries account for nearly two thirds of the State’s total portfolio. Some of these investments are managed by the IPBC, notably the State’s interest

2013 Budget, Volume 1
107
in the PNG LNG project, but others are managed by Treasury (e.g. Ok Tedi Mining Ltd) and Petromin Holdings Ltd.
8.6.1 PNG LNG Project
NPCP holds the State’s 19.4 per cent equity interest in the PNG LNG Project, and the NPCP itself is held by the GBT. The IPBC monitors the $A1.6 billion IPIC Exchangeable Bonds facility that underwrites the state equity and ensure that the appropriate financing remains in place at all times and make cash call payments in line with the project’s financing plan.
IPBC will meet the State’s 18.2 per cent share of cost in 2013 including the free carry for landowners of Hides, Angore and Juha (about K1.3 billion).
IPBC faces a contingent liability if the security for the Exchangeable Bonds is insufficient to redeem the bonds in 2014. Based on the current value of the security, that contingent liability is $A200 million based on the current Oil Search share value on the Australian Stock Exchange. This liability however is likely to be reduced over the next 17 months before the 5 March 2014 maturity date and the transfer of Oil Search shares to IPIC.
8.6.2 OK Tedi Mining Ltd
The State holds 36.6 per cent of the shares in Ok Tedi Mining Ltd (OTML), of which 18.3 per cent of this is held in trust for the Western Provincial Government and people of the Province. PNG Sustainable Development Ltd, a non-government organisation, owns the remaining 63.4 per cent OTML.
Over the last decade, OTML has generated almost K15 billion in benefits for the people of PNG. OTML has paid K9.5 billion in taxes and dividends to the Government, Western Provincial Government and the people of the Province. A further K5 billion has been paid in dividends to PNG Sustainable Development Program Ltd (PNGSDP)

2013 Budget, Volume 1
108
Figure 36: Benefits from OK Tedi Mining Limited
Following the OTML buy back of Inmet’s 18.3 per cent shareholding in 2011 for US$335 million (K877.0 million), OTML is now operating to provide 100 per cent of the benefits to PNG. OTML’s current focus is on Mine Life Extension (MLE), which has involved a significant amount of consultation with the affected communities. Development of new deposits should ensure that OTML continues to make an important economic contribution to the Western Province and Papua New Guinea beyond the current planned closure of the mine in 2015, including K3.5 billion of additional revenue for the Government.
8.6.3 Petromin PNG Holdings Ltd
Petromin PNG Holdings Ltd is an independent company created by the State of Papua New Guinea in 2007 to hold the State's assets and maximise Papua New Guinean ownership and revenue gains in the mineral and petroleum sectors. The company is empowered as the vehicle to better leverage the State's equity holdings and encourage more production and downstream processing of oil, gas and minerals in PNG through proactive investment strategies either wholly or in partnership with resource developers.
Petromin is regulated by a trust deed and is independent from the State but is 100 per cent owned by the State. The trust deed is managed by three independently appointed individual trustee managers, comprising the State Solicitor, the President of the PNG Law Society or his/her nominee and the President of the Certified Practicing Accountants (PNG) or his/her nominee. The trustee managers may veto any investment and operational decisions from the trustee shareholder (the Prime Minister) or the Board of Petromin if such decisions are not within the parameters of the trust deed and Petromin's constitution. These powers extend to independently vetting the removal or appointment of all Directors as well. The trustee shareholder, therefore cannot exercise any of his/her shareholder powers without the prior unanimous resolution of the individual trust managers, acting as the trust manager.
2013 Budget, Volume 1
109
8.6.4 Mineral Resources Development Corporation Ltd
Mineral Resources Development Corporation Ltd is 100 per cent owned by the State. It was initially established as the State nominee to acquire the State and landowner equity interests in mining and petroleum projects and to manage the equity funds for landowner companies from the major resource development areas of PNG. However, the State’s equity has since been transferred to Petromin PNG Holdings Ltd, so the focus of MRDC is now the management of the landowner equity interests in both mining and petroleum projects.
2013 Budget, Volume 1
110
CHAPTER 9. DEVELOPMENT STRATEGY 9.1 2012 DEVELOPMENT BUDGET STRATEGY
9.1.1 Overview
The O’Neill-Dion Government is aiming to establish an investment platform with at least a five year outlook to support the major development programmes required to support future growth. The formulation of the Development Budget reflects the Government’s commitment to achieving growth and prosperity by implementing the Alotau Accord key priorities, consistent with the Medium Term Development Plan (MTDP 2011-2015), the Development Strategic Plan (DSP 2010-2030) and the Millennium Development Goals.
The 2013 Development Budget Strategy aims to empower Provinces, Districts and LLGs for effective participation in inclusive and sustainable growth to diversify our economy and expand our productive base, and therefore improve livelihoods. This strategy is supported by high impact and productive investments in the 2013 Development Budget , providing access and opportunities to the rural majority through roads infrastructure to lay the foundations for sustainable growth. The 2013 Development Budget is structured around the following principles:
1. Directing resources to the Provinces, Districts and LLGs 2. Delivering a policy-driven Budget in line with the Alotau Accord and MTDP; 3. The appropriation of funding across all sectors of the economy, with particular focus
on the eight MTDP Key Enablers so as to maximise social and economic returns; 4. Redirection of expenditure towards the MTDP enablers and away from lower priority
and ineffective programs, so as to guarantee tangible outcomes and clear, measurable impacts;
5. Close alignment with the Recurrent Budget as well as funds held in Trust Accounts so as to minimize duplication of resources and ensure the sustainability of investments made; and
6. An effective and aligned relationship between Government, National Agencies, Sub National Agencies and our development partners.
There are high demands on the Development Budget , particularly since it has grown to be 44 per cent of the Total 2013 Budget. This increase is due to the K1.492 billion being allocated as direct funding to the Provinces, Districts and LLGs, as well as massive investments in key infrastructure to fill the resource gap to fulfil the achievements of the MTDP goals which in line with the PNGDSP 2030. The Budget includes important fixed commitments, particularly the Government’s K115 million commitment to the Autonomous Bougainville Government, the K120 million commitments to the LNG Project Umbrella Benefit Sharing Agreement and the K50 million commitment to High Impact Infrastructure Projects. The Development Budget strategy targets the remainder of Government direct financing across all sectors of the economy, with particular emphasis on transport infrastructure to support the seven other Key Enablers.
9.1.2 MTDP 2011-2015 and budget alignment
The 2013 Development Budget is the third annual budget of the PNGDSP and MTDP. This Budget fully incorporates the principles of the Alotau Accord Platform for Action of the new O’Neill-Dion Government. The PNGDSP details the Government’s deliverables required to achieve middle income country status by 2030. Each MTDP, in successive stages plans how
2013 Budget, Volume 1
111
PNG’s resource envelope is to be invested to ensure it is meeting its targets to achieve the PNGDSP objectives. Within the MTDP, the detailed deliverables are supported by:
• Five year specific targets and indicators for each sector, including nationally tailored Millennium Development Goals (MDG) indicators and targets;
• A specific outcomes oriented focus on the implementation of the MTDPs in terms of physical outputs such as the number of roads, schools, hospitals built and the effects of their impacts to grow our future
• Targets for the remaining three MTDPs to ensure we ‘stay on track’; • Identification of risks and assumptions to ensure sectors coordinate and link with
each other; • Demarcation of respective agencies’ responsibilities; and • Projected estimated resource requirements to implement the plan.
To deliver the expected tangible outcomes and impacts under the MTDP, a significant proportion of the Budget must be allocated to the MTDP enablers, and crucially to the enablers’ policies. The enablers are: unlocking land for development, improving law, order and justice, establishing an extensive national transport network to connect all of Papua New Guinea’s populations to markets and services, higher, technical education and training, primary and secondary education, provision of key public utilities and improving health outcomes. Under the 2012 Development Budget , 76 per cent of Government expenditure (direct financing, tax credit and loans) was allocated on MTDP related interventions. Of this percentage, 71 per cent was allocated to the MTDP enablers. Non-MTDP expenditure includes payment of constitutional grants, development grants and other crucial administrative services across Government, National Agencies and lower levels of Government.
In 2013, 84 per cent of Government expenditure has been allocated to MTDP interventions, demonstrating the O’Neill-Dion Government’s firm commitment to having an outcome oriented Budget Strategy across the five year outlook. Over the medium term, the Government will strive to increase the proportion of the Budget allocated to MTDP policy objectives and the Alotau Accord key priorities. To achieve this, the Government will closely align the Recurrent and Development Budget , as well as lower level government and development partner plans, policies and investments and reduce the funding of expenditure items which are not detailed in the MTDP. The Government will ensure that the Budget is driven by policy and respective sector strategies.
Progress across the five year investment plan towards achieving the targets and deliverables under the MTDP can also be met through financing projects delivered by the private sector, the churches and NGOs who may have a comparative advantage in the delivery of particular services. The PNG Church-State Partnership Policy and CSO-State Partnership Policy are examples of such initiatives to deliver infrastructure and basic services more efficiently and cost-effectively. Effective collaboration, coordination and alignment between the national, sub national, sector agency, development partner and non-state actors is critical as well as Government’s strong commitment to ensuring that it continues to fund these entities as partners to PNG’s overall inclusive and sustainable growth.
Whilst a high level of funding was frontloaded to agencies and Provincial Governments in the first half of 2012, overall implementation remains slow. A number of issues continue to affect the effective implementation of the Development Budget . These include:
• Slow or no submission or annual work plans, cash flows and monitoring reports by implementing agencies to the Department of National Planning and Monitoring, delaying the release of funds;
2013 Budget, Volume 1
112
• Untimely release of funds by the Department of National Planning and Monitoring and Treasury on a monthly basis;
• Delay in the preparation of trust instruments; • Poor capacity within agencies to design, scope and manage the implementation of
projects effectively; • Poor monitoring by the Department of National Planning and Monitoring and
Treasury; • Inception of Supplementary Budgets stretching agencies’ capacity; • Lengthy procurement processes; and • Funding of unbudgeted items.
To ensure the efficient, effective and timely usage of Development Budget funding, a large portion of the 2013 Development Budget and future budgets in our multi-year financing plan will target resources at the Provincial, District and Local Level Government level. Direct financing to lower levels of government will enhance effective service delivery to target severe gaps across health, education, infrastructure, law and justice, the economic sector and administration to further ensure the real achievement of the 2011-2015 MTDP goals and the PNGDSP deliverables.
In 2010 NEC directed all agencies and institutions of government to align their plans, strategies and programs to the MTDP, and significant work has taken place in 2011 to implement this. Following alignment, funding under the Public Investment Program will be based on implementing agencies and Provincial Governments submitting aligned programs to achieve the desired deliverables detailed in the MTDP. An increase in direct funding will require the alignment of coherent and coordinated strategies for investment across lower levels of government in ensuring they meet the MTDP and PNGDSP targets and deliverables. Achieving the goals determined in the MTDPs will require a whole of government approach, as well as the full alignment, coordination and cooperation of our development partners to support the 2013 Development Budget and future Budgets in strategic investments to generate sustainable and inclusive growth. The Department of National Planning is also in the process of re-establishing supporting systems and processes for the Development Budget including:
• Re-institutionalisation of the DNPM Development Budget Management Committee;
• A comprehensive monitoring and evaluation framework to assess the outcomes and impacts of all National, sub-national and donor partner plans and policies, to then compare year on year within the five year outlook to ensure that we are on track to achieving our development goals.
• Re-establishment of Project Steering Committees; and
• Strengthening and implementation of the Project Cycle Process and PIP Guidelines, with supportive training provided to officers.
Under the MTDP, implementing agencies, sub-national Governments and development partners will be held accountable to achieve the desired targets. As such, the MTDP promotes results-based monitoring and a performance based culture throughout the public service.
2013 Budget, Volume 1
113
9.1.3 Balancing spending across the Alotau Accord K ey Priorities MTDP sectors
The successful delivery of goods and services, as envisioned under the MTDP, will in part depend on how well development expenditure is led by sector policy. Furthermore, guided by the Sequencing Principle outlined in the PNGDSP, the timing of expenditure in one area will take place prior to that in another. The Sequencing Principle considers:
1. Spending in areas with the greatest spillover effects on to other expenditure areas. For example, expenditure in transport rehabilitation and maintenance supports the delivery of basic goods and services and promotes income-earning opportunities;
2. Spending in areas to reduce future cost to Government and society. For example, investing in the law and justice sector now will reduce the accumulated cost to the economy, Government and society;
3. Spending in areas where there is a long lag between expenditure and outcomes . For example, achieving a highly skilled and educated workforce will take time and therefore requires investment now.
In the 2013 Budget, in line with the Sequencing Principle, the Government has allocated a significant proportion of the Budget towards the maintenance and rehabilitation of new road transport infrastructure to expand the network and provide a supporting environment to ensure the improvement of service delivery across the lower levels of government and ability to address the other seven key enablers. The 2013 Development Budget has also prioritized the provision of education, improving law, order and justice, improving health outcomes and expanding and diversifying Papua New Guinea’s productive base. Investment in the enablers will create a virtuous cycle of growth, thereby laying the foundations for sustainable and inclusive growth for PNG’s prosperity under the DSP.
9.1.4 Relationship between Government and Donor Exp enditure Fifty-five percent of the 2013 Development Budget is comprised of grant support, existing concessional loansby Development Partners and further foreign and domestic financing. The Government is committed to ensuring that the programs and expenditure of Development Partners are aligned to Government priorities detailed in the Alotau Accord and the MTDP. In 2011 a number of Development Partner’s Country Assistance Strategies and Programs were reviewed to align with the MTDP, including the PNG-Australia Partnership for Development schedules. In 2013, the Government is committed to advance the work and targets agreed upon under the PNG Commitment on Aid Effectiveness, signed in July 2008. In 2013, the MTDP will undergo review and a full costing, and our donor partner’s assistance will be reviewed to align more coherently to a new proposed Aid Policy. This commitment localised the Paris Declaration principles to improve aid effectiveness and included the following principles:
1. Government ownership; 2. Alignment of development partners’ programs and strategies to PNG’s development
policies; 3. Harmonisation of development partners’ country assistance strategies and
requirements that development partners use Government systems and processes; 4. Managing for development results; and 5. Mutual accountability.
The Government will continue to strengthen national and sectoral dialogues with Development Partners through its biannual donor forums and other consultative workshops, and the Development Assistance Database (DAD) to assist the management of donor assistance expenditure and projections. In 2013, with the re-institutionalisation and
2013 Budget, Volume 1
114
strengthening of the PIP guidelines and project cycle, all new Development Partners’ programs will be screened to ensure close alignment with the Government’s development priorities and the recurrent funding implications are considered prior to the funding of capital expenditure projects. Furthermore, the Government will re-introduce the Annual Aid Report, to improve the transparency and accountability of grant assistance.
The Government will also pay particular attention to the strategic use of technical advisers in capacity development programs, with the overall target of reducing the level of technical assistance as a percentage of total foreign aid. Over the next five years, the Government intends to reduce the total value of technical advisors in real terms to less than 50 per cent of total aid. Technical advisers will be strategically placed in appropriate sectors, subject to proper screening and consultation, and greater use of government recruitment processes will be employed.
9.2 DEVELOPMENT BUDGET 2013
9.2.1 Overview
The 2013 Development Budget will lay the foundation for sustainable and inclusive growth through a five year investment outlook that meets the targets of the MTDP and the deliverables of the PNGDSP. This Budget will increase the funding to Provinces, Districts and LLGs. The implementation of these funds will be guided through the ORD framework and the Key Enablers of the MTDP and the Alotau Accord. Tuition fee-free education and health care will be priority areas of focus. The budget will enhance decentralisation, build capacity and introduce systems and processes for Lower Level Governments to effectively deliver basic services to promote a better quality of life for Papua New Guineans.
The Development Budget package for this year is K5.8 billion or 44 per cent of the Total 2013 Budget for Papua New Guinea. The Government is committing to priority infrastructures that connect all of Papua New Guinea to a supportive road network. To invest in our future, the Development Budget has grown to finance these targeted investments that accelerate growth.
Domestic and foreign loans will be used to finance the expenditure over and above the ceiling. The table 38 shows the distribution of the 2013 Development Budget outlining expenditure area.
Tax credits will remain the same from the 2012 funding level while loans will increase by 34 per cent. Notably grants financing will decrease by 13 per cent.
9.2.2 2012 Development Budget scenario
In 2012 the total Development Budget was the second budget to implement the MTDP 2011- 2015. The budget was used to fund 355 programs from a total budget of K4,437.1 million. This budget was made up of 68.7 per cent from government sources (direct financing, tax credits and loans) and 31.3 per cent from donors grants The grants allocation was lower than in 2011 due to appreciation of the Kina against the US dollar, reduction of JICA and World Bank funding and completion of an ADB grant project. Tax credits and loans increased because of the introduction of a special tax credit rate of 1.25 per cent for emergency repair works along the Highlands Highway, high loan draw-down estimates.
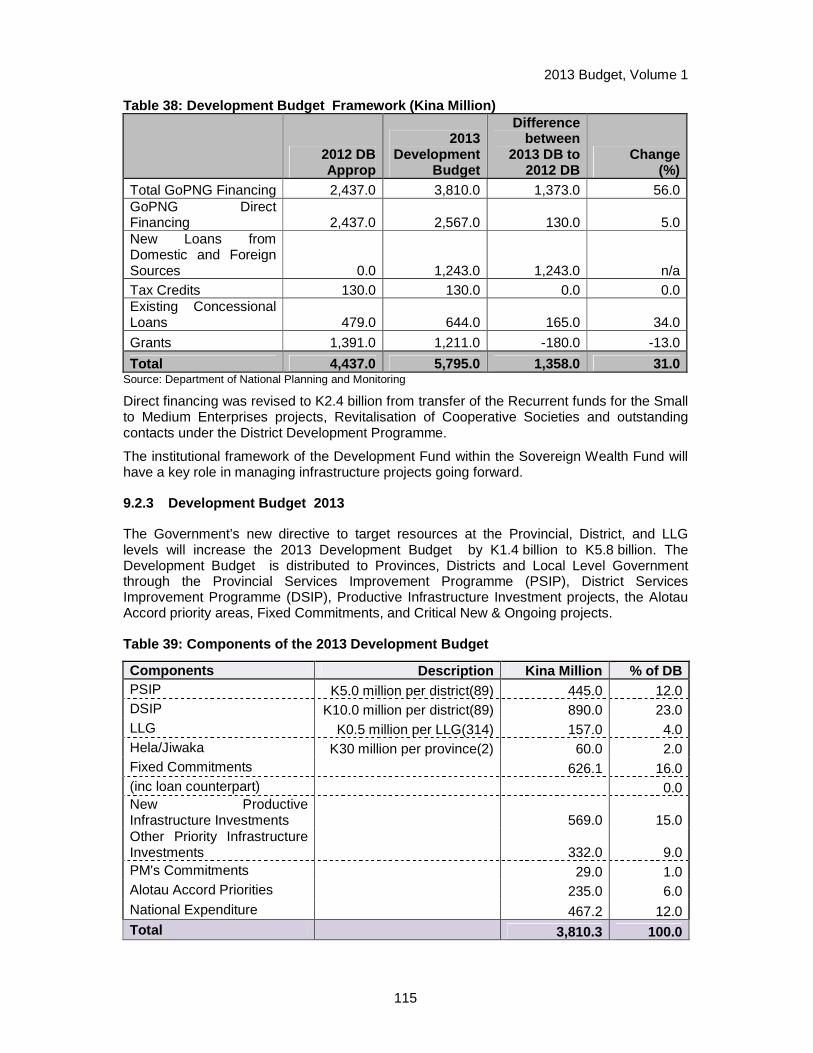
2013 Budget, Volume 1
115
Table 38: Development Budget Framework (Kina Milli on)
2012 DB Approp
2013 Development
Budget
Difference between
2013 DB to 2012 DB
Change (%)
Total GoPNG Financing 2,437.0 3,810.0 1,373.0 56.0 GoPNG Direct Financing 2,437.0 2,567.0 130.0 5.0 New Loans from Domestic and Foreign Sources 0.0 1,243.0 1,243.0 n/a Tax Credits 130.0 130.0 0.0 0.0 Existing Concessional Loans 479.0 644.0 165.0 34.0
Grants 1,391.0 1,211.0 -180.0 -13.0
Total 4,437.0 5,795.0 1,358.0 31.0 Source: Department of National Planning and Monitoring
Direct financing was revised to K2.4 billion from transfer of the Recurrent funds for the Small to Medium Enterprises projects, Revitalisation of Cooperative Societies and outstanding contacts under the District Development Programme.
The institutional framework of the Development Fund within the Sovereign Wealth Fund will have a key role in managing infrastructure projects going forward.
9.2.3 Development Budget 2013
The Government’s new directive to target resources at the Provincial, District, and LLG levels will increase the 2013 Development Budget by K1.4 billion to K5.8 billion. The Development Budget is distributed to Provinces, Districts and Local Level Government through the Provincial Services Improvement Programme (PSIP), District Services Improvement Programme (DSIP), Productive Infrastructure Investment projects, the Alotau Accord priority areas, Fixed Commitments, and Critical New & Ongoing projects.
Table 39: Components of the 2013 Development Budget
Components Description Kina Million % of DB PSIP K5.0 million per district(89) 445.0 12.0 DSIP K10.0 million per district(89) 890.0 23.0 LLG K0.5 million per LLG(314) 157.0 4.0 Hela/Jiwaka K30 million per province(2) 60.0 2.0 Fixed Commitments 626.1 16.0 (inc loan counterpart) 0.0 New Productive Infrastructure Investments 569.0 15.0 Other Priority Infrastructure Investments 332.0 9.0 PM's Commitments 29.0 1.0 Alotau Accord Priorities 235.0 6.0 National Expenditure 467.2 12.0 Total
3,810.3 100.0

2013 Budget, Volume 1
116
Through the ORD allocation guidelines for the DSIP, PSIP and LLG support, direct funding will be distributed accordingly: 30.0 per cent will be allocated to infrastructural investments, 20.0 per cent to health, 20.0 per cent to education, 10.0 per cent to law and order, 10.0 per cent to the economic sector and 10.0 per cent to the administrative sector. Provinces with a good transport network will be more cost effective as compared to provinces with poor transport networks. According to the recently published ‘2012 Budget Fiscal Report’ by the National Economic and Fiscal Commission, increasing funds to provinces over the years has increased the provinces’ ability to improve service delivery, particularly those that are unable to generate adequate internal revenue. The O’Neill-Dion Government is committing to better quality and access of key basic services throughout the Provinces, Districts and LLGs through this direct funding initiative.
9.2.4 Provincial Support Improvement Programme (PSI P)
The Provincial Support Improvement Programme, PSIP, is K445.0 million or 12.0 per cent of the Total Development Budget for 2013. The program addresses the eight key enablers and the priority expenditure areas outlined in the Alotau Accord. With the guidance of each provincial project technical committees these funds are to be used in accordance with respective Provincial Development Action Plans. Through funding the provincial- wide PSIP, the Government plans to improve infrastructure, empower and amass the capacity of civil servants and enable the people to participate in the development process. Provinces must use this programme to assemble, maintain and rehabilitate infrastructure, regulate staff development by financing appropriate training programmes, and support new administrative and financial structures and management systems. The PSIP funds will be disbursed to provincial treasuries operating accounts and disbursed depending on the number of districts in a provinces, where each district with an allocation of K5.0 million. The table below depicts the allocation of PSIP.
Table 40: Provincial Services Improvement Programme (PSIP) Allocation in the 2013 Development Budget to Provincial Treasuries Operat ing Accounts (Kina Million) Provincial Administration
PSIP total Provincial Administration
PSIP total
Western/Fly River 15.0 Eastern Highlands 40.0 Gulf 10.0 Morobe 45.0 Central 20.0 Madang 30.0 NCD 15.0 East Sepik 30.0 Milne Bay 20.0 Sandaun 20.0 Oro 10.0 Manus 5.0 Southern Highlands 40.0 New Ireland 10.0 Enga 25.0 East New Britain 20.0 Western Highlands 35.0 West New Britain 10.0 Simbu 30.0 Autonomous
Bougainville Region 15.0
Total 445.0 Source: Department of National Planning & Monitoring
ABG will receive K115.0 million in the 2013 Development Budget . These funds represent K100.0 million as Government Commitment to the overall development of the Region and K15.0 million restoration development grant. In addition to this funding commitment, ABG will receive an additional K15.0 million in PSIP funding. This funding will come directly under the control of the Regional Member for ABG.

2013 Budget, Volume 1
117
9.2.5 District Services Improvement Programme (DSIP )
The DSIP funds will be disbursed to district treasuries’ operating accounts. Administration of these funds will be guided by the NEC endorsed ORD guidelines (2012). A total of K890.0 million or 23 per cent of direct financing will be disbursed at K10.0 million per district. Table 41 shows the total DSIP funds to be distributed to districts within each province. Table 41: District Services Improvement (DSIP) Allo cation in the 2013 Development Budget to District Treasuries Operating Accounts ( Kina Million) Province DSIP total Province DSIP total Western/Fly River 30.0 Eastern Highlands 80.0
Gulf 20.0 Morobe 90.0 Central 40.0 Madang 60.0 NCD 30.0 East Sepik 60.0 Milne Bay 40.0 Sandaun 40.0 Oro 20.0 Manus 10.0 Southern Highlands 80.0 New Ireland 20.0 Enga 50.0 East New Britain 40.0 Western Highlands 70.0 West New Britain 20.0 Simbu 60.0 Autonomous
Bougainville Region 30.0
Total 890.0 Source: Department of National Planning & Monitoring
9.2.6 LLG funding support
The objective of the Local Level Government (LLG) support programme is to assist LLGs improve minimum priority activities of provinces in order to deliver the services to the people and as such should link to the directive of the Government envisioned in the MTDP, Alotau Accord, be in accordance with respective Provincial Development Action Plans, District Development Plans and channelled through the Minimum Priority Activities (MPA) for Provinces to specialise in improving health, education, infrastructure, primary production, and village court functions of an LLG.
Table 42: Local Level Government Support (Kina Mill ion) Province LLG total Province DSIP total
Western/Fly River 7.0 Eastern Highlands 12.0 Gulf 5.0 Morobe 16.5 Central 6.5 Madang 9.5 NCD 0.5 East Sepik 13.0 Milne Bay 8.0 Sandaun 8.5 Oro 4.5 Manus 6.0 Southern Highlands 10.0 New Ireland 4.5 Enga 7.5 East New Britain 9.0 Western Highlands 4.5 West New Britain 5.5 Simbu 10.0 Autonomous Bougainville Region 0.0 Hela 3.0 Jiwaka 6.0 K157 million
Source: Department of National Planning & Monitoring

2013 Budget, Volume 1
118
9.2.7 Infrastructure Investment Projects
About 15 per cent or K569.0 million of the 2013 Budget is allocated to Productive Infrastructure Investments. The Government envisions large scale infrastructure investments will pave the way to achieving sustainable growth of the country. The objective is to expand and diversify the economy through these projects that are in line with and committed to the 5 year outlook of the first MTDP 2011-2015.
Upgrading road works in Port Moresby City is a project identified. The budget has allocation K100.0 million for this project. Constructing a 4-Lane road to the Lae-Nadzab portion of the Highlands Highway is another such project as well as road works on specific sections of the Highlands Highway, the prominent Lae City Roads among others. The following lists projects to be implemented in this infrastructure category.
Table 43: Infrastructure Investment Projects (Kina Million)
POM City Roads 100.0
1st Stage Highlands Highway Lae-Nadzab (4 Lane)
150.0
Highlands Highway 80.0
Lae City Roads 100.0
PNG LNG Fibre Cable 55.0
POM General Hospital 50.0
Jackson Airport Upgrade and Rehabilitation 50.0
1st Highlands Highway (Lae-Nadzab Road-4 lane)
150.0
Port Moresby Grid Development 4.0 Source: Department of National Planning & Monitoring
Other Priority Infrastructure Investments projects to be funded in the 2013 Development Budget for K332.0 million are listed before.
Table 44: Other Priority Infrastructure Investments (Kina Million) Kapal Haus (Administration building) project
50.0
Fiji and Solomon Islands chanceries rehabilitation, refurbishment and maintenance project
25.0
Koroba- Lake Kopiago road 10.0 Minjung Bridge projects 8.0 Missing Links (Baiyer- Madang road) 10.0 Goroka Town Roads- Design project 10.0 Hagen Kunjip and Hagen Toguba Rd 10.0 Vanimo Highway 10.0 Malalaua- Kotidanga road project 10.0 Kulupuga Road project 10.0 Special Infrastructure Grant to Gulf, Oro and Manus provinces (K10 million each)
30.0
Madang Town Roads upgrading 10.0 East-West New Britain Highway 10.0 Gulf-Southern Highlands Highway 10.0 Hiritano Highway 10.0
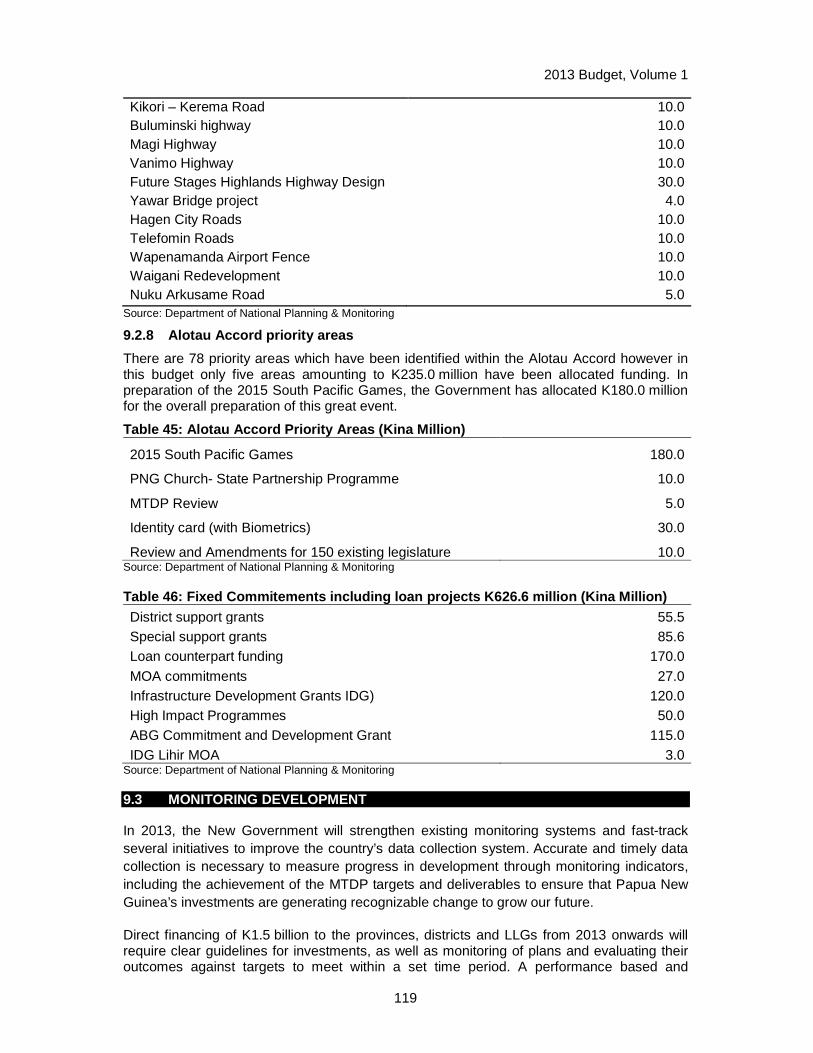
2013 Budget, Volume 1
119
Kikori – Kerema Road 10.0 Buluminski highway 10.0 Magi Highway 10.0 Vanimo Highway 10.0 Future Stages Highlands Highway Design 30.0 Yawar Bridge project 4.0 Hagen City Roads 10.0 Telefomin Roads 10.0 Wapenamanda Airport Fence 10.0 Waigani Redevelopment 10.0 Nuku Arkusame Road 5.0
Source: Department of National Planning & Monitoring
9.2.8 Alotau Accord priority areas
There are 78 priority areas which have been identified within the Alotau Accord however in this budget only five areas amounting to K235.0 million have been allocated funding. In preparation of the 2015 South Pacific Games, the Government has allocated K180.0 million for the overall preparation of this great event.
Table 45: Alotau Accord Priority Areas (Kina Millio n)
2015 South Pacific Games 180.0
PNG Church- State Partnership Programme 10.0
MTDP Review 5.0
Identity card (with Biometrics) 30.0
Review and Amendments for 150 existing legislature 10.0 Source: Department of National Planning & Monitoring
Table 46: Fixed Commitements including loan project s K626.6 million (Kina Million) District support grants 55.5 Special support grants 85.6 Loan counterpart funding 170.0 MOA commitments 27.0 Infrastructure Development Grants IDG) 120.0 High Impact Programmes 50.0 ABG Commitment and Development Grant 115.0 IDG Lihir MOA 3.0
Source: Department of National Planning & Monitoring
9.3 MONITORING DEVELOPMENT
In 2013, the New Government will strengthen existing monitoring systems and fast-track several initiatives to improve the country’s data collection system. Accurate and timely data collection is necessary to measure progress in development through monitoring indicators, including the achievement of the MTDP targets and deliverables to ensure that Papua New Guinea’s investments are generating recognizable change to grow our future.
Direct financing of K1.5 billion to the provinces, districts and LLGs from 2013 onwards will require clear guidelines for investments, as well as monitoring of plans and evaluating their outcomes against targets to meet within a set time period. A performance based and
2013 Budget, Volume 1
120
outcome oriented policy is required not only for the administering of the 2013 Budget, but consequently for all levels of Public Service from Waigani right down to the Local Level Governments.
The National Statistical Office (NSO) is the agency mandated to collect, collate and analyse data of national importance. The NSO collects data through a number of surveys including the House Income Expenditure Survey (HIES) held in 2012, the Demographic and Health Survey (DHS) held in 2006 and the National Census that was completed and launched in 2012. Data obtained from the Census is being used to determine the overall development trends of the country. This will provide a clear indication of what level of progression PNG has made in implementing the first MTDP 2011-2015 to date. To support the collection, analysis and publication of development data, NSO, in collaboration with the Department of National Planning and Monitoring, is also drafting the National Strategy for Development Statistics (NSDS). The NSDS once finalised will be the country’s road map for statistics. To support the framework, the Department is working on a Results Monitoring Framework (RMF) to replace the MTDS Performance Management Framework (PMF). The RMF will monitor and evaluate progress under the Government’s policies and plans including the PNGDSP and MTDP. In addition to the RMF, the Department will continue to use the PNGinfo database to track progress towards the nationally tailored MDG targets and indicators. Training will continue throughout 2012 in selected provinces to roll out the PNGinfo system across the country. Effective monitoring is dependent on collaboration across Government and with key stakeholders. To support collaboration, the Department of National Planning has reactivated Project Steering Committees to ensure a regular flow of information on the progress of programs under the Development Budget . In addition, existing monitoring activities will be strengthened in 2013. These include:
• Regular consultation with stakeholders; • Budget quarterly reviews; • Project site monitoring reviews; • Monitoring of monthly cash flows; • Compiling annual reports and work plans; and • Program and project evaluations.
9.4 FUTURE DEVELOPMENT BUDGET S AND STRATEGIES
From 2013 to 2017, the costings and allocation of resources for targeted investments will be guided by the Government’s Medium Term Development Plan (MTDP) and the Alotau Accord. The MTDP 2011-2015 is aligned to the PNGDSP 2010-2030 and the Vision 2050. It is the first of four medium term plans under the DSP period. The Government’s MTDP provides a clear strategy for a five year outlook on spending priorities across successive budgets to secure the targets in the MTDPs that ensure the tangible deliverables outlined in the PNGDSP.
Future Budgets will support lower levels of government to deliver services to where the majority of the population is located, for whom key infrastructure will provide the foundation to grow our future. With an emphasis on opening up all areas of Papua New Guinea to contribute to and

2013 Budget, Volume 1
121
benefit from growth, the Government will continue to invest in the key enablers and priority areas stipulated in the Alotau Accord.
9.4.1 Alignment of the five year investment strateg y of the Government to the MTDP (2011 2015), PNGDSP 2030 and the Alotau Accords
The outcomes of the Alotau Accord meeting in 2012 highlighted a number of hard lessons to be learned from the existing planning and budgeting system of Government. This includes the failure to align national and sub-national planning, failure of national agencies to effectively deliver positive development outcomes to Papua New Guineans, their objectives being too broad, lack of specific performance indicators or targets and lack of reliable data to understand development outcomes and evaluate their impacts. Furthermore, the Alotau Accord re-established the need to forge a consistent and comprehensive strategy for planning investments and budgetary decisions across the longer term rather than focusing on budget priorities on a year to year basis. These plans would have to undergo extensive monitoring and evaluation to ensure they are meeting the targets and deliverables set out in each MTDP and the DSP.
In the course of implementing the Alotau Accord Key Priorities and enhancing the Key Enablers, the Government will continue to ensure that all sector agencies, Provinces, Districts, Local Level Governments, Civil Society Organizations (CSOs), Faith-based Organizations (FBOs) and Development Partners (DPs) align their plans and programs to so that basic service delivery is effective, efficient and reliable. The alignment process and direct spending not only promotes ownership and accountability but fosters both sector and lower level government co-ordination and collaboration. Effective implementation is also dependent on the timely and efficient release of funds to implementing agencies, Provincial, District and Local Level Governments.
The allocation of funds for the 2013 Development Budget and across the five-year investment outlook will be guided by an understanding that the continual and sustained improvement in the quality of people’s lives will have to be achieved through the increased capacity of lower levels of government to address the needs of their people. Longer term strategic planning amongst the programmes chosen for funding and allocation within the Provinces, Districts and LLGs will establish rolling plans for improvement over a set time period to limit the misuse and misallocation in bringing key basic services and economic opportunities to all Papua New Guineans.
2013 Budget, Volume 1
122
CHAPTER 10. SECTORAL POLICIES 10.1 MEDIUM TERM DEVELOPMENT PLAN ENABLERS
10.1.1 Law and Order
The Medium Term Development Plan (MTDP 2011-2015) sets the foundation for the achievement of the sector goals identified in the PNG Development Strategic Plan (DSP 2030). Improving law, order and justice is one of the seven key enablers in the MTDP 2011-2015. Over the next five years and by 2015, the government is prioritising its funding to enhance the performance of the sector to reduce the crime rates by 8.3 per cent. The sector can achieve these targets by improving the accessibility to law and justice services, enhance skills and provide attractive incentives of key personnel. Moreover, effective use of restorative justice and resolving disputes early are way forward to achieving the targets. Crime prevention is another vital strategy to minimise the incidence and seriousness of crimes committed.
The 2007 White Paper and the National Law and Justice Policy and Plan of Action 2000 provide the overarching policy to guide the sector. These policies are realised through the Law and Justice Sector Strategy Framework (LJSSF) which specifies the key action areas for each of the agencies.
Although the LJSSF seeks to address the rising levels of crime and violence, issues of deteriorating facilities in the correctional services, police housing/barracks and the rural lock-ups still remain to be addressed. Other critical areas for the sector include the provision of legal aid at the provincial level, addressing juvenile justice and training of key personnel. In addition, in line with the Alotau Accord the Government’s focus for the sector is to restructure the Police Force by establishing the Office of the Secretary for Police to improve the administration and administration of the force, review the process of appointing the Commissioner and his Deputies, and embark on a rigorous training program to increase the number of personnel. The Government takes note of these issues and will continue to focus the 2013 expenditure on infrastructure rehabilitation with a new focus on modernising the Royal PNG Constabulary by training 400 recruits per annum and providing increased support to the Independent Commission Against Corruption (ICAC) and Taskforce Sweep.
Table 47 details the level of Government and Donor support to the sector. In 2013, the Government is committing K36.0 million in direct financing to fund the priority areas of the law and justice sector, whilst K77.6 million is funded by the donor partners through grants. Thus, a total of K113.6 million is committed to support the law and justice sector programs in 2013.
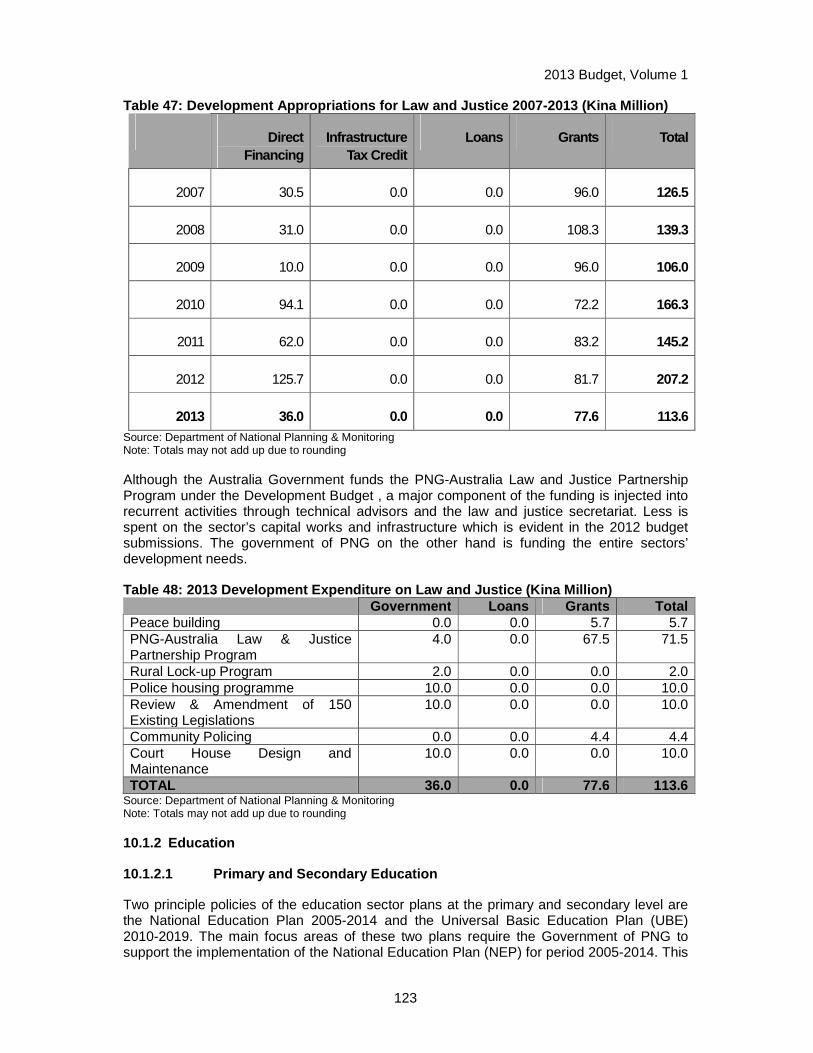
2013 Budget, Volume 1
123
Table 47: Development Appropriations for Law and Ju stice 2007-2013 (Kina Million)
Direct Financing
Infrastructure Tax Credit
Loans Grants Total
2007 30.5 0.0 0.0 96.0 126.5
2008 31.0 0.0 0.0 108.3 139.3
2009 10.0 0.0 0.0 96.0 106.0
2010 94.1 0.0 0.0 72.2 166.3
2011 62.0 0.0 0.0 83.2 145.2
2012 125.7 0.0 0.0 81.7 207.2
2013 36.0 0.0 0.0 77.6 113.6 Source: Department of National Planning & Monitoring Note: Totals may not add up due to rounding
Although the Australia Government funds the PNG-Australia Law and Justice Partnership Program under the Development Budget , a major component of the funding is injected into recurrent activities through technical advisors and the law and justice secretariat. Less is spent on the sector’s capital works and infrastructure which is evident in the 2012 budget submissions. The government of PNG on the other hand is funding the entire sectors’ development needs.
Table 48: 2013 Development Expenditure on Law and J ustice (Kina Million) Government Loans Grants Total Peace building 0.0 0.0 5.7 5.7 PNG-Australia Law & Justice Partnership Program
4.0 0.0 67.5 71.5
Rural Lock-up Program 2.0 0.0 0.0 2.0 Police housing programme 10.0 0.0 0.0 10.0 Review & Amendment of 150 Existing Legislations
10.0 0.0 0.0 10.0
Community Policing 0.0 0.0 4.4 4.4 Court House Design and Maintenance
10.0 0.0 0.0 10.0
TOTAL 36.0 0.0 77.6 113.6 Source: Department of National Planning & Monitoring Note: Totals may not add up due to rounding
10.1.2 Education
10.1.2.1 Primary and Secondary Education
Two principle policies of the education sector plans at the primary and secondary level are the National Education Plan 2005-2014 and the Universal Basic Education Plan (UBE) 2010-2019. The main focus areas of these two plans require the Government of PNG to support the implementation of the National Education Plan (NEP) for period 2005-2014. This

2013 Budget, Volume 1
124
is to ensure the continuous implementation of the education reforms to improve service delivery, strengthen and adequately coordinate partnerships with stakeholders at all levels, enhancing universal access to basic education, and ensuring effective distribution of education materials and supplies. Under the UBE plan or fee free education, the O’Neill-Dion Government aims to provide the opportunity for all children of school age to enrol in school and complete eight years of basic education and learn skill, knowledge and values covered in the basic education curriculum. According to the Alotau Accord, the new Government’s policy direction for the sector is to expand the subsidy free education to grade 12, increase teacher housing in the rural areas, improve teacher training, provide IT infrastructure to rural schools, and promote sports at schools.
The Government is also focused on achieving MDG Goal 2 to Achieve Universal Primary Education. Therefore the National MDG targets and indicators for Goal 2 have been integrated into the MTDP 2011-2015 in order to accelerate the achievement of these targets. These targets include achieving a gross enrolment ratio of 74.3 per cent, a cohort retention ratio between grade one and six of 40 per cent and youth literacy rate of 70 per cent.
The National Department of Education (NODE) will focus on three major areas to effectively oversee the implementation of the National Education Plan (NEP) and the Universal Basic Education Plan. These major areas include:
1. access; 2. quality: and 3. improved management of the different levels of education.
Compounding these considerable challenges associated with the expansion of the education sector since 1995, high population growth has also put additional pressure on the limited resources in the education sector. Both the capital cost of additional school facilities and the recurrent costs of additional teachers and school materials will be significant in 2013. Additionally, the management of an expanded education system, in particular at lower levels of government, requires an increase in the capacity of the relevant authorities. In sufficient teachers in the rural districts and communities remain an issue, in particular, making progress towards higher enrolment rates, and ensuring that children in very remote areas of the country are able to access a quality education system remains a critical challenge. There are also challenges in the enrolment rates in the provinces which have a very low rating. Despite improvements in gross enrolment rates, retention rates remain low, which is often due to affordability, but also lack of infrastructure and poor quality teaching.
As can be seen in Table 49 below, the Government has increased funding to primary and secondary education in 2012 through the fee-free education policy of Government and this will continue in 2013.
Table 49: Development Appropriations for Primary an d Secondary Education 2007-2013 (Kina Million)
Direct Financing
Infrastructure Tax Credit
Loans Grants Total
2007 11.2 0.0 5.1 51.5 67.8
2008 17.8 0.0 0.4 46.0 64.2
2009 43.6 0.0 0.0 50.0 93.6
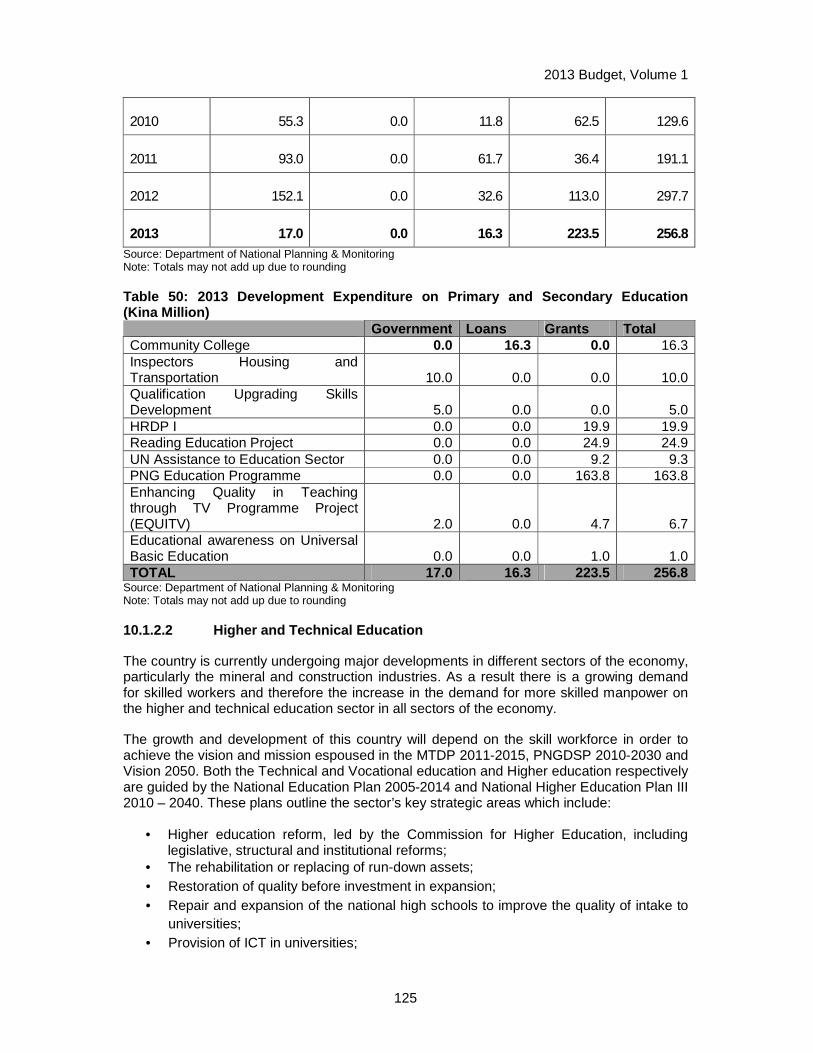
2013 Budget, Volume 1
125
2010 55.3 0.0 11.8 62.5 129.6
2011 93.0 0.0 61.7 36.4 191.1
2012 152.1 0.0 32.6 113.0 297.7
2013 17.0 0.0 16.3 223.5 256.8 Source: Department of National Planning & Monitoring Note: Totals may not add up due to rounding
Table 50: 2013 Development Expenditure on Primary a nd Secondary Education (Kina Million) Government Loans Grants Total Community College 0.0 16.3 0.0 16.3 Inspectors Housing and Transportation 10.0 0.0 0.0 10.0 Qualification Upgrading Skills Development 5.0 0.0 0.0 5.0 HRDP I 0.0 0.0 19.9 19.9 Reading Education Project 0.0 0.0 24.9 24.9 UN Assistance to Education Sector 0.0 0.0 9.2 9.3 PNG Education Programme 0.0 0.0 163.8 163.8 Enhancing Quality in Teaching through TV Programme Project (EQUITV) 2.0 0.0 4.7 6.7 Educational awareness on Universal Basic Education 0.0 0.0 1.0 1.0 TOTAL 17.0 16.3 223.5 256.8
Source: Department of National Planning & Monitoring Note: Totals may not add up due to rounding
10.1.2.2 Higher and Technical Education
The country is currently undergoing major developments in different sectors of the economy, particularly the mineral and construction industries. As a result there is a growing demand for skilled workers and therefore the increase in the demand for more skilled manpower on the higher and technical education sector in all sectors of the economy.
The growth and development of this country will depend on the skill workforce in order to achieve the vision and mission espoused in the MTDP 2011-2015, PNGDSP 2010-2030 and Vision 2050. Both the Technical and Vocational education and Higher education respectively are guided by the National Education Plan 2005-2014 and National Higher Education Plan III 2010 – 2040. These plans outline the sector’s key strategic areas which include:
• Higher education reform, led by the Commission for Higher Education, including legislative, structural and institutional reforms;
• The rehabilitation or replacing of run-down assets; • Restoration of quality before investment in expansion; • Repair and expansion of the national high schools to improve the quality of intake to
universities; • Provision of ICT in universities;
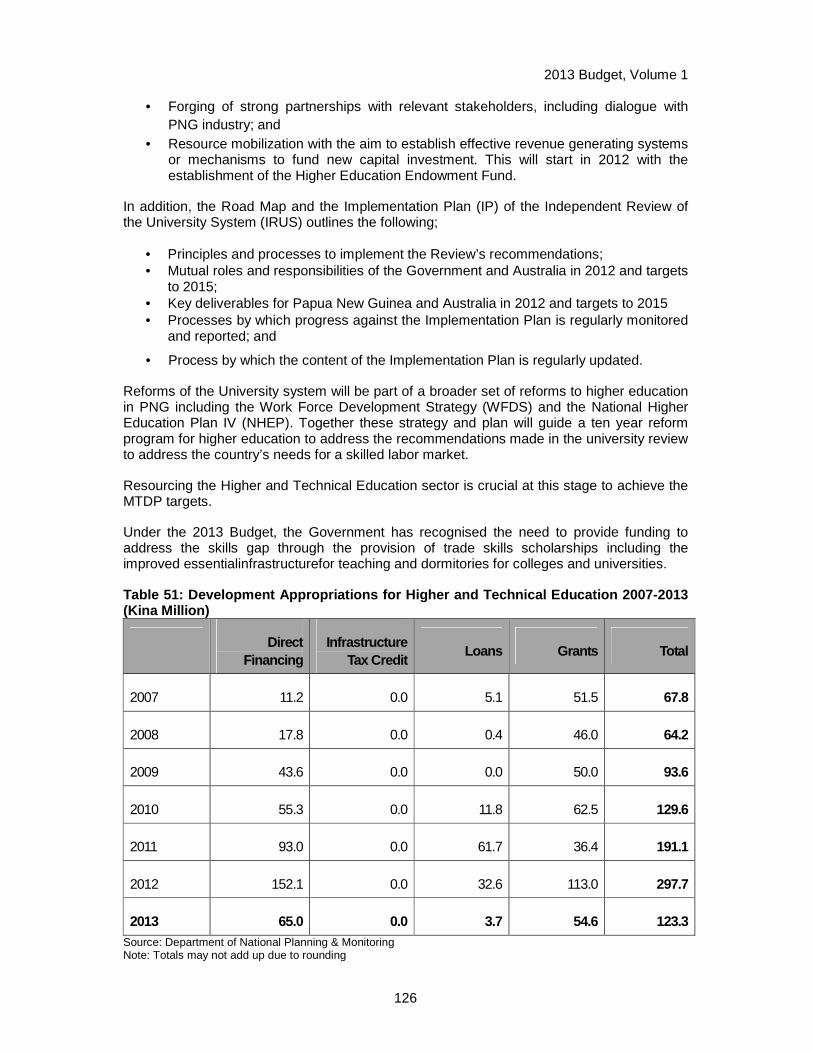
2013 Budget, Volume 1
126
• Forging of strong partnerships with relevant stakeholders, including dialogue with PNG industry; and
• Resource mobilization with the aim to establish effective revenue generating systems or mechanisms to fund new capital investment. This will start in 2012 with the establishment of the Higher Education Endowment Fund.
In addition, the Road Map and the Implementation Plan (IP) of the Independent Review of the University System (IRUS) outlines the following;
• Principles and processes to implement the Review’s recommendations; • Mutual roles and responsibilities of the Government and Australia in 2012 and targets
to 2015; • Key deliverables for Papua New Guinea and Australia in 2012 and targets to 2015 • Processes by which progress against the Implementation Plan is regularly monitored
and reported; and
• Process by which the content of the Implementation Plan is regularly updated.
Reforms of the University system will be part of a broader set of reforms to higher education in PNG including the Work Force Development Strategy (WFDS) and the National Higher Education Plan IV (NHEP). Together these strategy and plan will guide a ten year reform program for higher education to address the recommendations made in the university review to address the country’s needs for a skilled labor market.
Resourcing the Higher and Technical Education sector is crucial at this stage to achieve the MTDP targets.
Under the 2013 Budget, the Government has recognised the need to provide funding to address the skills gap through the provision of trade skills scholarships including the improved essentialinfrastructurefor teaching and dormitories for colleges and universities.
Table 51: Development Appropriations for Higher and Technical Education 2007-2013 (Kina Million)
Direct
Financing Infrastructure
Tax Credit Loans Grants Total
2007 11.2 0.0 5.1 51.5 67.8
2008 17.8 0.0 0.4 46.0 64.2
2009 43.6 0.0 0.0 50.0 93.6
2010 55.3 0.0 11.8 62.5 129.6
2011 93.0 0.0 61.7 36.4 191.1
2012 152.1 0.0 32.6 113.0 297.7
2013 65.0 0.0 3.7 54.6 123.3 Source: Department of National Planning & Monitoring Note: Totals may not add up due to rounding
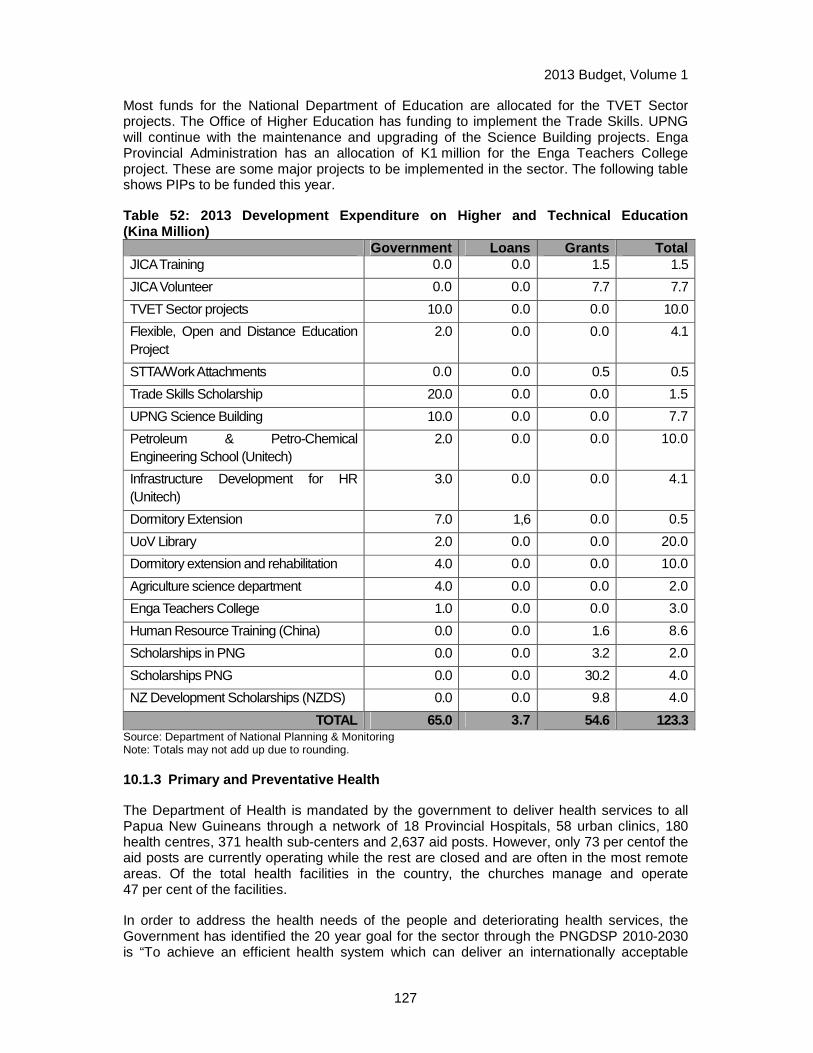
2013 Budget, Volume 1
127
Most funds for the National Department of Education are allocated for the TVET Sector projects. The Office of Higher Education has funding to implement the Trade Skills. UPNG will continue with the maintenance and upgrading of the Science Building projects. Enga Provincial Administration has an allocation of K1 million for the Enga Teachers College project. These are some major projects to be implemented in the sector. The following table shows PIPs to be funded this year.
Table 52: 2013 Development Expenditure on Higher an d Technical Education (Kina Million) Government Loans Grants Total JICA Training 0.0 0.0 1.5 1.5
JICA Volunteer 0.0 0.0 7.7 7.7
TVET Sector projects 10.0 0.0 0.0 10.0
Flexible, Open and Distance Education Project
2.0 0.0 0.0 4.1
STTA/Work Attachments 0.0 0.0 0.5 0.5
Trade Skills Scholarship 20.0 0.0 0.0 1.5
UPNG Science Building 10.0 0.0 0.0 7.7
Petroleum & Petro-Chemical Engineering School (Unitech)
2.0 0.0 0.0 10.0
Infrastructure Development for HR (Unitech)
3.0 0.0 0.0 4.1
Dormitory Extension 7.0 1,6 0.0 0.5
UoV Library 2.0 0.0 0.0 20.0
Dormitory extension and rehabilitation 4.0 0.0 0.0 10.0
Agriculture science department 4.0 0.0 0.0 2.0
Enga Teachers College 1.0 0.0 0.0 3.0
Human Resource Training (China) 0.0 0.0 1.6 8.6
Scholarships in PNG 0.0 0.0 3.2 2.0
Scholarships PNG 0.0 0.0 30.2 4.0
NZ Development Scholarships (NZDS) 0.0 0.0 9.8 4.0
TOTAL 65.0 3.7 54.6 123.3 Source: Department of National Planning & Monitoring Note: Totals may not add up due to rounding.
10.1.3 Primary and Preventative Health
The Department of Health is mandated by the government to deliver health services to all Papua New Guineans through a network of 18 Provincial Hospitals, 58 urban clinics, 180 health centres, 371 health sub-centers and 2,637 aid posts. However, only 73 per centof the aid posts are currently operating while the rest are closed and are often in the most remote areas. Of the total health facilities in the country, the churches manage and operate 47 per cent of the facilities.
In order to address the health needs of the people and deteriorating health services, the Government has identified the 20 year goal for the sector through the PNGDSP 2010-2030 is “To achieve an efficient health system which can deliver an internationally acceptable
2013 Budget, Volume 1
128
standard of health services”. In addition to the MTDP strategies to improve service delivery systems, improve stakeholder partnerships, and promoting healthier lifestyles the Alotau Accord has also identified the following policy directions for the health sector: provide fee free primary health care and subsidized health care; develop a national health insurance policy in partnership with private health care providers; create more training places for health care workers; re-open aid posts by providing staff; improve management of health supplies and drug distribution; encourage community based insurance policies such as funeral cost cover; review the National Population Policy; and, give special attention to TB, non-communicable diseases and reduction in maternal and infant mortality, including cancers in women.
To implement these priorities for the health sector, the National Health Plan (NHP) 2011-2020 provides the overall Government policy and planning directives. Its goal is to strengthen primary health care for all, and improve service delivery to the marginalised populations such as the rural majority. The health sector Medium Term Expenditure Framework (MTEF) guides this approach by specifying the overall budget requirements and resource envelope available to the sector to help the portion of resources to the key result areas. The current MTEF 2011-2014 tries to re-profit the costing of the new NHP 2011-2020 into a three-year time frame.
As part of addressing the health issues of the country, the, the Department of Health has developed the Health Sector Medium Term Development Plan (HMTDP) 2011-2015as a “program-of-projects” that captures all health infrastructures needs for the country. This acts as a key investment proposal for Public Investment Program (PIP) funding together with the targets outlined in the MTDP 2011-2015. The programs include projects like the redevelopment and rehabilitation of various provincial hospitals namely Kerema, Popondetta, Mt. Hagen, Modilon, Vanimo, and Port Moresby General Hospital, with new Nonga and Enga hospitals and, rehabilitation of area medical stores. The Department is also embarking on other important priorities including the Medical Supplies Reform Program, the implementation of the Provincial Health Authorities Program, support the Church Health Service for better terms and conditions for their staff, improving the governance processes of managing health sector finances whilst not losing focus on its priority programs to deliver clinical and public health programs.
The causes for the deteriorating health indicators are complex and systemic, including the limited capacity of health facilities at the Provincial, District and Local Level Government level due to deteriorating health infrastructure, insufficient medical supplies, limited funding at these levels, and an aging and depleting health workforce. In 2013, expenditure in the health sector will continue to be focused on the rehabilitation of existing infrastructure, training of community health workers and the effective management of drugs and medical supplies for rural area procurement of vital medical equipment, especially in the rural areas.
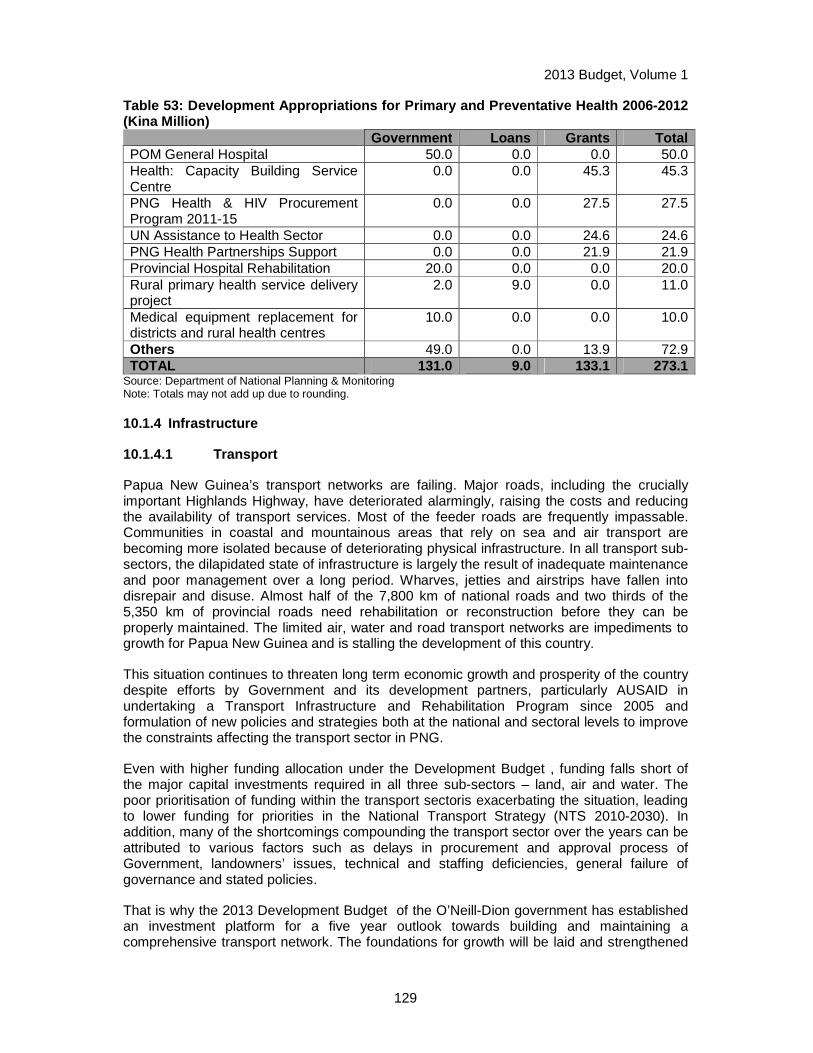
2013 Budget, Volume 1
129
Table 53: Development Appropriations for Primary an d Preventative Health 2006-2012 (Kina Million) Government Loans Grants Total POM General Hospital 50.0 0.0 0.0 50.0 Health: Capacity Building Service Centre
0.0 0.0 45.3 45.3
PNG Health & HIV Procurement Program 2011-15
0.0 0.0 27.5 27.5
UN Assistance to Health Sector 0.0 0.0 24.6 24.6 PNG Health Partnerships Support 0.0 0.0 21.9 21.9 Provincial Hospital Rehabilitation 20.0 0.0 0.0 20.0 Rural primary health service delivery project
2.0 9.0 0.0 11.0
Medical equipment replacement for districts and rural health centres
10.0 0.0 0.0 10.0
Others 49.0 0.0 13.9 72.9 TOTAL 131.0 9.0 133.1 273.1
Source: Department of National Planning & Monitoring Note: Totals may not add up due to rounding.
10.1.4 Infrastructure
10.1.4.1 Transport
Papua New Guinea’s transport networks are failing. Major roads, including the crucially important Highlands Highway, have deteriorated alarmingly, raising the costs and reducing the availability of transport services. Most of the feeder roads are frequently impassable. Communities in coastal and mountainous areas that rely on sea and air transport are becoming more isolated because of deteriorating physical infrastructure. In all transport sub-sectors, the dilapidated state of infrastructure is largely the result of inadequate maintenance and poor management over a long period. Wharves, jetties and airstrips have fallen into disrepair and disuse. Almost half of the 7,800 km of national roads and two thirds of the 5,350 km of provincial roads need rehabilitation or reconstruction before they can be properly maintained. The limited air, water and road transport networks are impediments to growth for Papua New Guinea and is stalling the development of this country.
This situation continues to threaten long term economic growth and prosperity of the country despite efforts by Government and its development partners, particularly AUSAID in undertaking a Transport Infrastructure and Rehabilitation Program since 2005 and formulation of new policies and strategies both at the national and sectoral levels to improve the constraints affecting the transport sector in PNG.
Even with higher funding allocation under the Development Budget , funding falls short of the major capital investments required in all three sub-sectors – land, air and water. The poor prioritisation of funding within the transport sectoris exacerbating the situation, leading to lower funding for priorities in the National Transport Strategy (NTS 2010-2030). In addition, many of the shortcomings compounding the transport sector over the years can be attributed to various factors such as delays in procurement and approval process of Government, landowners’ issues, technical and staffing deficiencies, general failure of governance and stated policies.
That is why the 2013 Development Budget of the O’Neill-Dion government has established an investment platform for a five year outlook towards building and maintaining a comprehensive transport network. The foundations for growth will be laid and strengthened
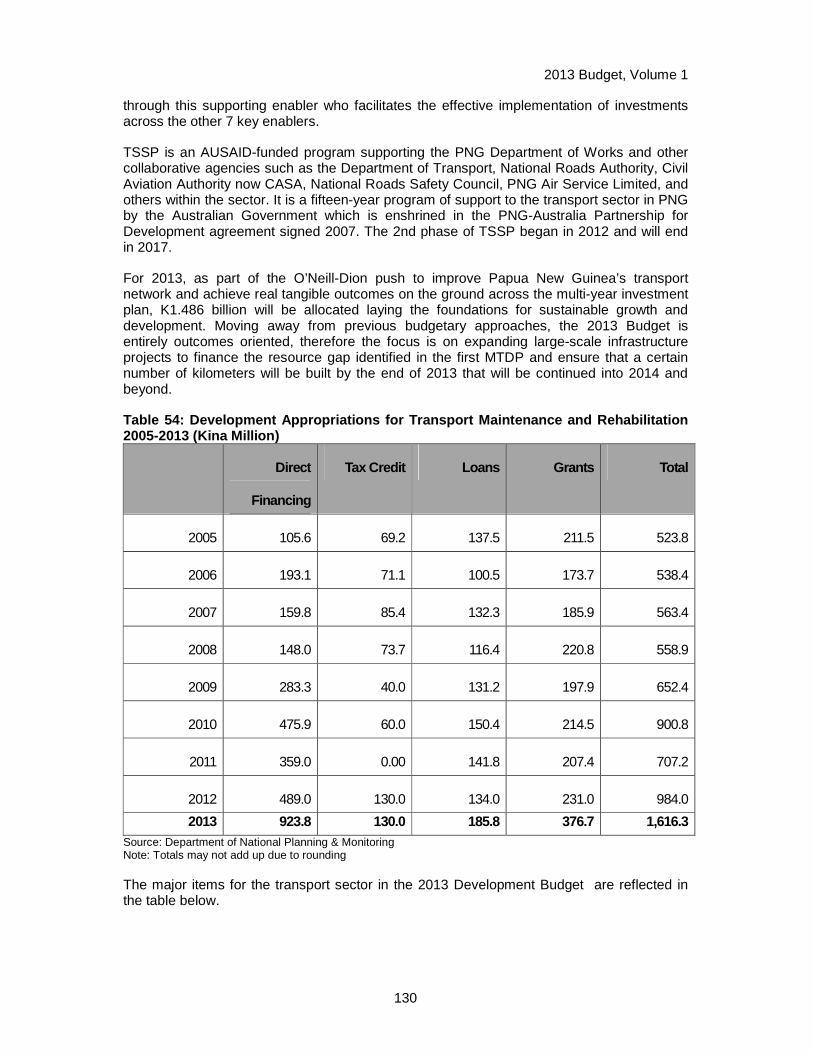
2013 Budget, Volume 1
130
through this supporting enabler who facilitates the effective implementation of investments across the other 7 key enablers.
TSSP is an AUSAID-funded program supporting the PNG Department of Works and other collaborative agencies such as the Department of Transport, National Roads Authority, Civil Aviation Authority now CASA, National Roads Safety Council, PNG Air Service Limited, and others within the sector. It is a fifteen-year program of support to the transport sector in PNG by the Australian Government which is enshrined in the PNG-Australia Partnership for Development agreement signed 2007. The 2nd phase of TSSP began in 2012 and will end in 2017.
For 2013, as part of the O’Neill-Dion push to improve Papua New Guinea’s transport network and achieve real tangible outcomes on the ground across the multi-year investment plan, K1.486 billion will be allocated laying the foundations for sustainable growth and development. Moving away from previous budgetary approaches, the 2013 Budget is entirely outcomes oriented, therefore the focus is on expanding large-scale infrastructure projects to finance the resource gap identified in the first MTDP and ensure that a certain number of kilometers will be built by the end of 2013 that will be continued into 2014 and beyond.
Table 54: Development Appropriations for Transport Maintenance and Rehabilitation 2005-2013 (Kina Million)
Direct
Financing
Tax Credit Loans Grants Total
2005 105.6 69.2 137.5 211.5 523.8
2006 193.1 71.1 100.5 173.7 538.4
2007 159.8 85.4 132.3 185.9 563.4
2008 148.0 73.7 116.4 220.8 558.9
2009 283.3 40.0 131.2 197.9 652.4
2010 475.9 60.0 150.4 214.5 900.8
2011 359.0 0.00 141.8 207.4 707.2
2012 489.0 130.0 134.0 231.0 984.0
2013 923.8 130.0 185.8 376.7 1,616.3 Source: Department of National Planning & Monitoring Note: Totals may not add up due to rounding
The major items for the transport sector in the 2013 Development Budget are reflected in the table below.
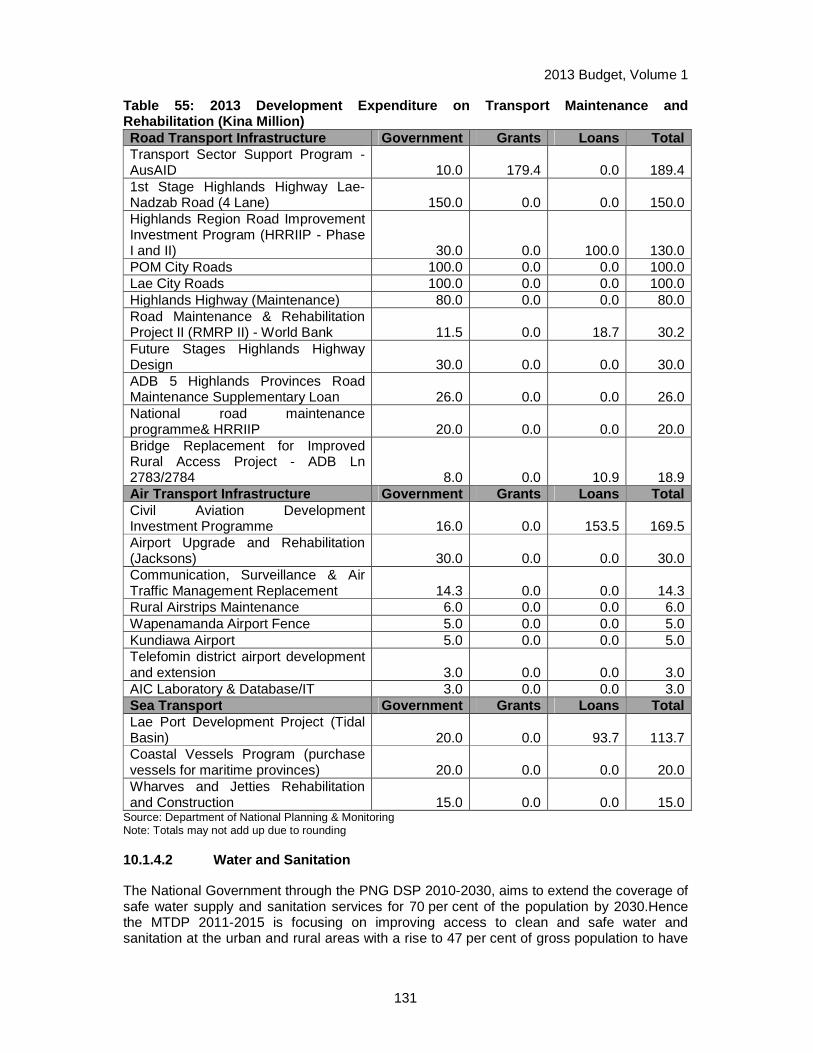
2013 Budget, Volume 1
131
Table 55: 2013 Development Expenditure on Transport Maintenance and Rehabilitation (Kina Million) Road Transport Infrastructure Government Grants Loans Total Transport Sector Support Program - AusAID 10.0 179.4 0.0 189.4 1st Stage Highlands Highway Lae-Nadzab Road (4 Lane) 150.0 0.0 0.0 150.0 Highlands Region Road Improvement Investment Program (HRRIIP - Phase I and II) 30.0 0.0 100.0 130.0 POM City Roads 100.0 0.0 0.0 100.0 Lae City Roads 100.0 0.0 0.0 100.0 Highlands Highway (Maintenance) 80.0 0.0 0.0 80.0 Road Maintenance & Rehabilitation Project II (RMRP II) - World Bank 11.5 0.0 18.7 30.2 Future Stages Highlands Highway Design 30.0 0.0 0.0 30.0 ADB 5 Highlands Provinces Road Maintenance Supplementary Loan 26.0 0.0 0.0 26.0 National road maintenance programme& HRRIIP 20.0 0.0 0.0 20.0 Bridge Replacement for Improved Rural Access Project - ADB Ln 2783/2784 8.0 0.0 10.9 18.9 Air Transport Infrastructure Government Grants Loans Total Civil Aviation Development Investment Programme 16.0 0.0 153.5 169.5 Airport Upgrade and Rehabilitation (Jacksons) 30.0 0.0 0.0 30.0 Communication, Surveillance & Air Traffic Management Replacement 14.3 0.0 0.0 14.3 Rural Airstrips Maintenance 6.0 0.0 0.0 6.0 Wapenamanda Airport Fence 5.0 0.0 0.0 5.0 Kundiawa Airport 5.0 0.0 0.0 5.0 Telefomin district airport development and extension 3.0 0.0 0.0 3.0 AIC Laboratory & Database/IT 3.0 0.0 0.0 3.0 Sea Transport Government Grants Loans Total Lae Port Development Project (Tidal Basin) 20.0 0.0 93.7 113.7 Coastal Vessels Program (purchase vessels for maritime provinces) 20.0 0.0 0.0 20.0 Wharves and Jetties Rehabilitation and Construction 15.0 0.0 0.0 15.0
Source: Department of National Planning & Monitoring Note: Totals may not add up due to rounding
10.1.4.2 Water and Sanitation
The National Government through the PNG DSP 2010-2030, aims to extend the coverage of safe water supply and sanitation services for 70 per cent of the population by 2030.Hence the MTDP 2011-2015 is focusing on improving access to clean and safe water and sanitation at the urban and rural areas with a rise to 47 per cent of gross population to have
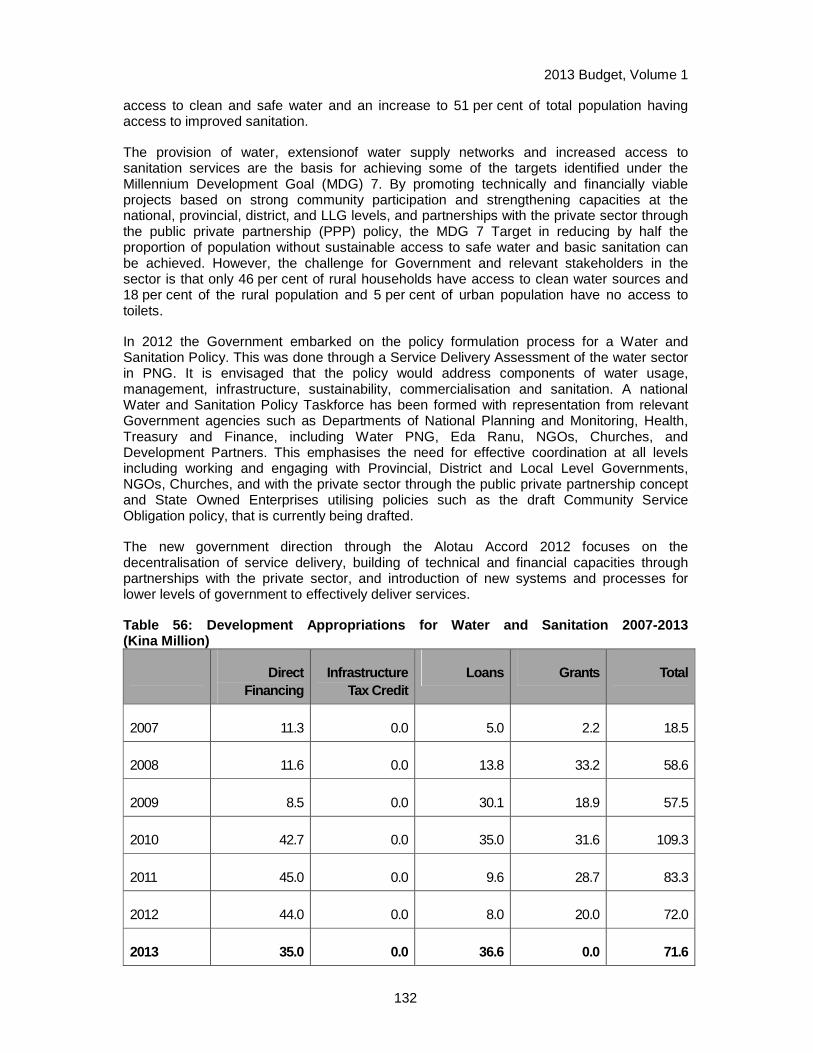
2013 Budget, Volume 1
132
access to clean and safe water and an increase to 51 per cent of total population having access to improved sanitation.
The provision of water, extensionof water supply networks and increased access to sanitation services are the basis for achieving some of the targets identified under the Millennium Development Goal (MDG) 7. By promoting technically and financially viable projects based on strong community participation and strengthening capacities at the national, provincial, district, and LLG levels, and partnerships with the private sector through the public private partnership (PPP) policy, the MDG 7 Target in reducing by half the proportion of population without sustainable access to safe water and basic sanitation can be achieved. However, the challenge for Government and relevant stakeholders in the sector is that only 46 per cent of rural households have access to clean water sources and 18 per cent of the rural population and 5 per cent of urban population have no access to toilets.
In 2012 the Government embarked on the policy formulation process for a Water and Sanitation Policy. This was done through a Service Delivery Assessment of the water sector in PNG. It is envisaged that the policy would address components of water usage, management, infrastructure, sustainability, commercialisation and sanitation. A national Water and Sanitation Policy Taskforce has been formed with representation from relevant Government agencies such as Departments of National Planning and Monitoring, Health, Treasury and Finance, including Water PNG, Eda Ranu, NGOs, Churches, and Development Partners. This emphasises the need for effective coordination at all levels including working and engaging with Provincial, District and Local Level Governments, NGOs, Churches, and with the private sector through the public private partnership concept and State Owned Enterprises utilising policies such as the draft Community Service Obligation policy, that is currently being drafted.
The new government direction through the Alotau Accord 2012 focuses on the decentralisation of service delivery, building of technical and financial capacities through partnerships with the private sector, and introduction of new systems and processes for lower levels of government to effectively deliver services.
Table 56: Development Appropriations for Water and Sanitation 2007-2013 (Kina Million)
Direct Financing
Infrastructure Tax Credit
Loans Grants Total
2007 11.3 0.0 5.0 2.2 18.5
2008 11.6 0.0 13.8 33.2 58.6
2009 8.5 0.0 30.1 18.9 57.5
2010 42.7 0.0 35.0 31.6 109.3
2011 45.0 0.0 9.6 28.7 83.3
2012 44.0 0.0 8.0 20.0 72.0
2013 35.0 0.0 36.6 0.0 71.6
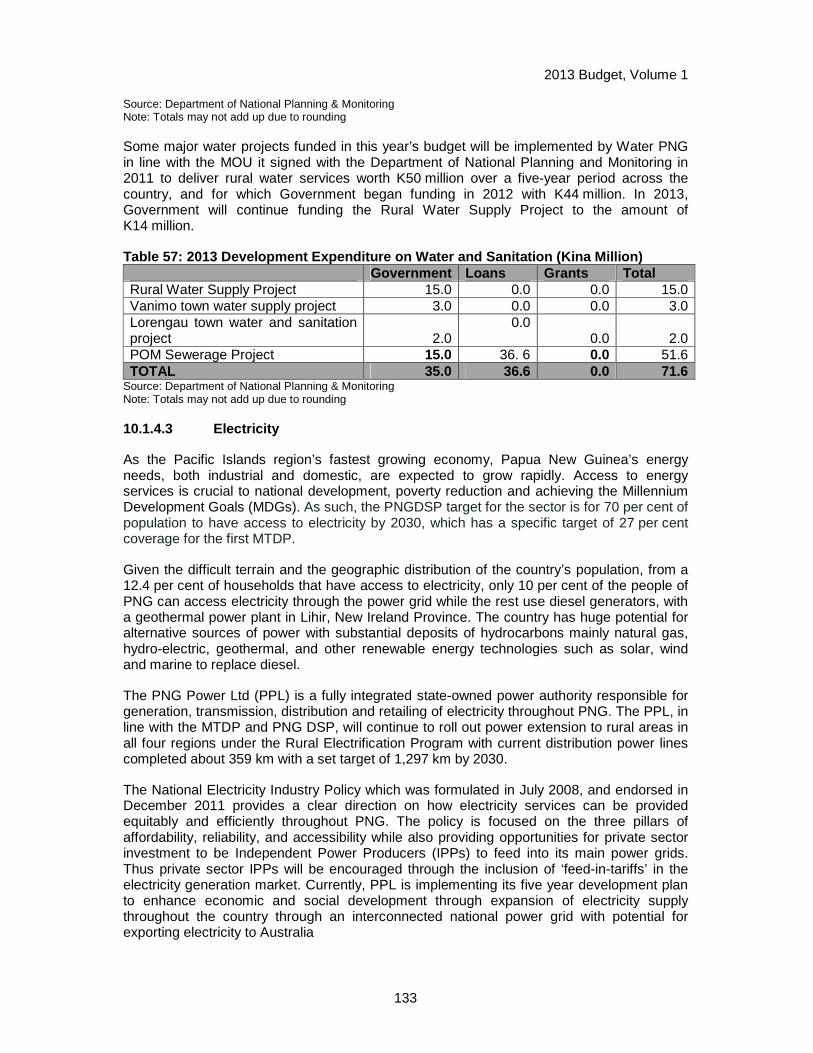
2013 Budget, Volume 1
133
Source: Department of National Planning & Monitoring Note: Totals may not add up due to rounding
Some major water projects funded in this year’s budget will be implemented by Water PNG in line with the MOU it signed with the Department of National Planning and Monitoring in 2011 to deliver rural water services worth K50 million over a five-year period across the country, and for which Government began funding in 2012 with K44 million. In 2013, Government will continue funding the Rural Water Supply Project to the amount of K14 million.
Table 57: 2013 Development Expenditure on Water and Sanitation (Kina Million) Government Loans Grants Total Rural Water Supply Project 15.0 0.0 0.0 15.0 Vanimo town water supply project 3.0 0.0 0.0 3.0 Lorengau town water and sanitation project 2.0
0.0 0.0 2.0
POM Sewerage Project 15.0 36. 6 0.0 51.6 TOTAL 35.0 36.6 0.0 71.6
Source: Department of National Planning & Monitoring Note: Totals may not add up due to rounding
10.1.4.3 Electricity
As the Pacific Islands region’s fastest growing economy, Papua New Guinea’s energy needs, both industrial and domestic, are expected to grow rapidly. Access to energy services is crucial to national development, poverty reduction and achieving the Millennium Development Goals (MDGs). As such, the PNGDSP target for the sector is for 70 per cent of population to have access to electricity by 2030, which has a specific target of 27 per cent coverage for the first MTDP.
Given the difficult terrain and the geographic distribution of the country’s population, from a 12.4 per cent of households that have access to electricity, only 10 per cent of the people of PNG can access electricity through the power grid while the rest use diesel generators, with a geothermal power plant in Lihir, New Ireland Province. The country has huge potential for alternative sources of power with substantial deposits of hydrocarbons mainly natural gas, hydro-electric, geothermal, and other renewable energy technologies such as solar, wind and marine to replace diesel.
The PNG Power Ltd (PPL) is a fully integrated state-owned power authority responsible for generation, transmission, distribution and retailing of electricity throughout PNG. The PPL, in line with the MTDP and PNG DSP, will continue to roll out power extension to rural areas in all four regions under the Rural Electrification Program with current distribution power lines completed about 359 km with a set target of 1,297 km by 2030.
The National Electricity Industry Policy which was formulated in July 2008, and endorsed in December 2011 provides a clear direction on how electricity services can be provided equitably and efficiently throughout PNG. The policy is focused on the three pillars of affordability, reliability, and accessibility while also providing opportunities for private sector investment to be Independent Power Producers (IPPs) to feed into its main power grids. Thus private sector IPPs will be encouraged through the inclusion of ‘feed-in-tariffs’ in the electricity generation market. Currently, PPL is implementing its five year development plan to enhance economic and social development through expansion of electricity supply throughout the country through an interconnected national power grid with potential for exporting electricity to Australia
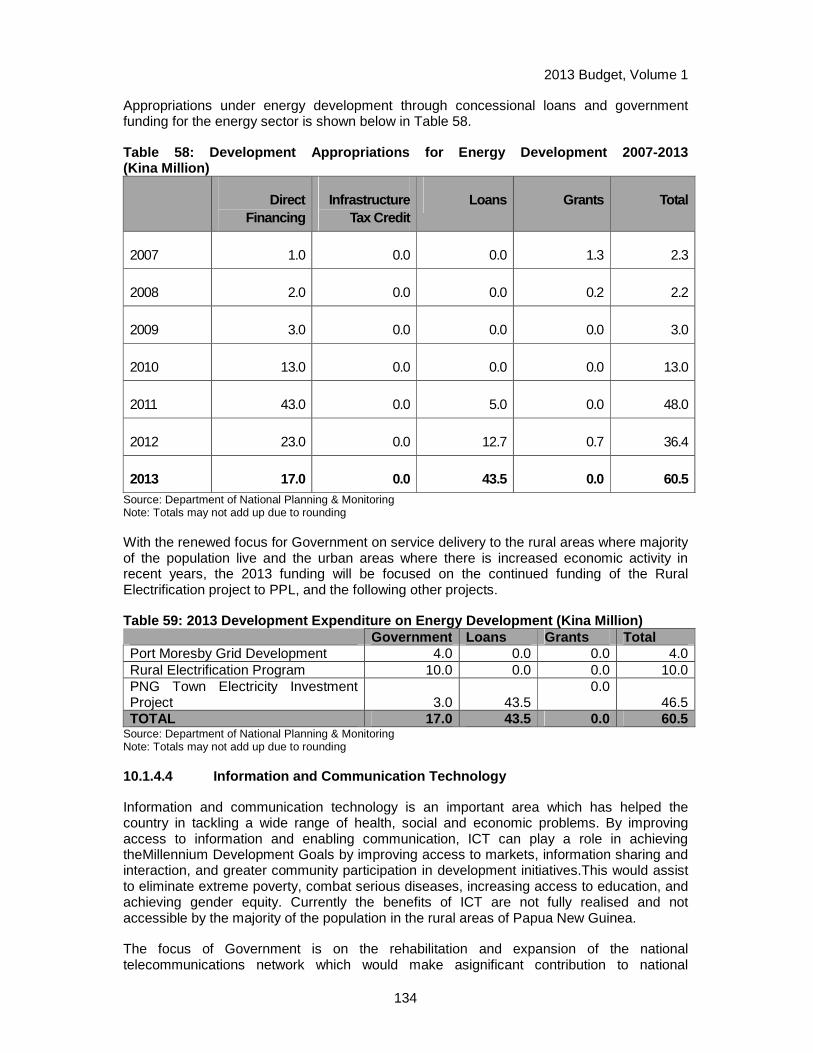
2013 Budget, Volume 1
134
Appropriations under energy development through concessional loans and government funding for the energy sector is shown below in Table 58.
Table 58: Development Appropriations for Energy Dev elopment 2007-2013 (Kina Million)
Direct Financing
Infrastructure Tax Credit
Loans Grants Total
2007 1.0 0.0 0.0 1.3 2.3
2008 2.0 0.0 0.0 0.2 2.2
2009 3.0 0.0 0.0 0.0 3.0
2010 13.0 0.0 0.0 0.0 13.0
2011 43.0 0.0 5.0 0.0 48.0
2012 23.0 0.0 12.7 0.7 36.4
2013 17.0 0.0 43.5 0.0 60.5 Source: Department of National Planning & Monitoring Note: Totals may not add up due to rounding
With the renewed focus for Government on service delivery to the rural areas where majority of the population live and the urban areas where there is increased economic activity in recent years, the 2013 funding will be focused on the continued funding of the Rural Electrification project to PPL, and the following other projects.
Table 59: 2013 Development Expenditure on Energy De velopment (Kina Million) Government Loans Grants Total Port Moresby Grid Development 4.0 0.0 0.0 4.0 Rural Electrification Program 10.0 0.0 0.0 10.0 PNG Town Electricity Investment Project 3.0 43.5
0.0 46.5
TOTAL 17.0 43.5 0.0 60.5 Source: Department of National Planning & Monitoring Note: Totals may not add up due to rounding
10.1.4.4 Information and Communication Technology
Information and communication technology is an important area which has helped the country in tackling a wide range of health, social and economic problems. By improving access to information and enabling communication, ICT can play a role in achieving theMillennium Development Goals by improving access to markets, information sharing and interaction, and greater community participation in development initiatives.This would assist to eliminate extreme poverty, combat serious diseases, increasing access to education, and achieving gender equity. Currently the benefits of ICT are not fully realised and not accessible by the majority of the population in the rural areas of Papua New Guinea.
The focus of Government is on the rehabilitation and expansion of the national telecommunications network which would make asignificant contribution to national
2013 Budget, Volume 1
135
economic development and to improved delivery of services, especially to rural and often remote areas.
The Integrated Government Information System (IGIS) project is aimed at spearheading the Government’s ICT initiative and provides the means to achieve the PNGDSP goal of “A modern and affordable information and communications technology that reaches all parts of the country” by 2030. Under the MTDP, the IGIS project is an initiative that would drive the country forward as the enabler for the MTDP strategy of “Expanding government service to rural communities, using Internet technologies” from 2011 to 2015.
Table 60 indicates the level of funding towards ICT over the last seven years. This sector has seen increased funding since 2005, in line with Government’s policy to promote rural transformation and empowerment.
Table 60: Development Appropriations for ICT 2007-2 013 (Kina Million)
Direct Financing
Infrastructure Tax Credit
Loans Grants Total
2007 0.0 0.0 0.0 0.0 0.0
2008 0.8 0.0 0.0 0.0 0.8
2009 7.0 0.0 0.0 0.0 7.0
2010 0.5 0.0 0.0 0.0 0.5
2011 43.5 0.0 45.4 3.9 92.8
2012 26.0 0.0 63.8 2.5 92.3
2013 74.0 0.0 43.4 8.6 126.0
Source: Department of National Planning & Monitoring Note: Totals may not add up due to rounding
The major programs in the 2013 Development Budget targeting ICT as a key enabler are shown below.
Table 61: 2013 Development Expenditure on ICT (Kina Million) Government Loans Grants Total IGIS 6.0 32.6 0.0 38.6 Rural Communication Project 3.0 10.8 0.0 13.8 PNG LNG Fibre Cable 55.0 0.0 0.0 55.0 PNG Media Program 0.0 0.0 8.6 8.6 Rural Communication Project 10.0 0.0 0.0 10.0 TOTAL 74.0 43.4 43.4 126.0
Source: Department of National Planning & Monitoring Note: Totals may not add up due to rounding
10.1.5 Land Development Sector
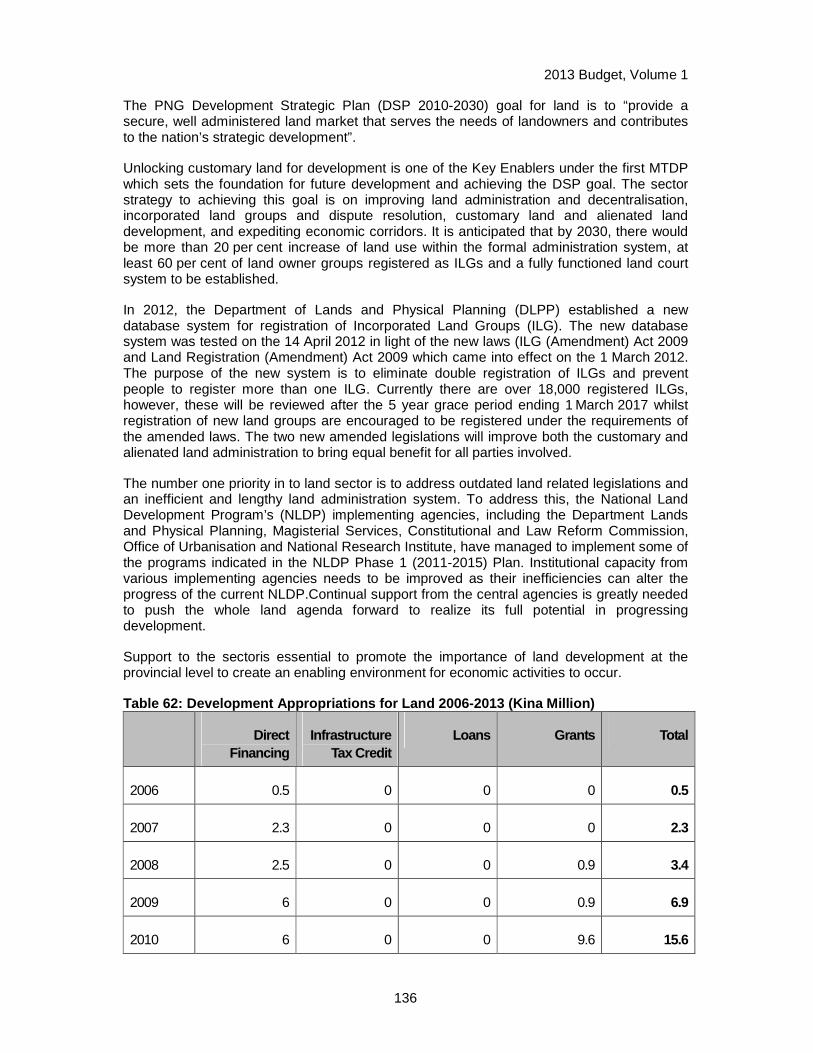
2013 Budget, Volume 1
136
The PNG Development Strategic Plan (DSP 2010-2030) goal for land is to “provide a secure, well administered land market that serves the needs of landowners and contributes to the nation’s strategic development”.
Unlocking customary land for development is one of the Key Enablers under the first MTDP which sets the foundation for future development and achieving the DSP goal. The sector strategy to achieving this goal is on improving land administration and decentralisation, incorporated land groups and dispute resolution, customary land and alienated land development, and expediting economic corridors. It is anticipated that by 2030, there would be more than 20 per cent increase of land use within the formal administration system, at least 60 per cent of land owner groups registered as ILGs and a fully functioned land court system to be established.
In 2012, the Department of Lands and Physical Planning (DLPP) established a new database system for registration of Incorporated Land Groups (ILG). The new database system was tested on the 14 April 2012 in light of the new laws (ILG (Amendment) Act 2009 and Land Registration (Amendment) Act 2009 which came into effect on the 1 March 2012. The purpose of the new system is to eliminate double registration of ILGs and prevent people to register more than one ILG. Currently there are over 18,000 registered ILGs, however, these will be reviewed after the 5 year grace period ending 1 March 2017 whilst registration of new land groups are encouraged to be registered under the requirements of the amended laws. The two new amended legislations will improve both the customary and alienated land administration to bring equal benefit for all parties involved.
The number one priority in to land sector is to address outdated land related legislations and an inefficient and lengthy land administration system. To address this, the National Land Development Program’s (NLDP) implementing agencies, including the Department Lands and Physical Planning, Magisterial Services, Constitutional and Law Reform Commission, Office of Urbanisation and National Research Institute, have managed to implement some of the programs indicated in the NLDP Phase 1 (2011-2015) Plan. Institutional capacity from various implementing agencies needs to be improved as their inefficiencies can alter the progress of the current NLDP.Continual support from the central agencies is greatly needed to push the whole land agenda forward to realize its full potential in progressing development.
Support to the sectoris essential to promote the importance of land development at the provincial level to create an enabling environment for economic activities to occur.
Table 62: Development Appropriations for Land 2006- 2013 (Kina Million)
Direct Financing
Infrastructure Tax Credit
Loans Grants Total
2006 0.5 0 0 0 0.5
2007 2.3 0 0 0 2.3
2008 2.5 0 0 0.9 3.4
2009 6 0 0 0.9 6.9
2010 6 0 0 9.6 15.6

2013 Budget, Volume 1
137
2011 6.4 0 0 5.7 12.1
2012 10.1 0 0 0 10.1
2013 14.0 0 0 0 14.0 Sources: Department of National Planning & Monitoring, 2012 Budget for the NLDP and Manus Provincial land Development Programme Note: Totals may not add up due to rounding
A total of K12 million was allocated for NLDP in the 2013 budget showing continued Government support to effectively manage land for development and address issues surrounding customary land-ownership. Therefore in 2013 the Government will continue to support DLPP through the NLDP to unlock land for development.
Table 63: 2013 Development Expenditure on Land (Kin a Million)
Government Grants Total
National Land Development Program 12.0 0.0 12.0
Land Mobilisation Program 2.0 0.0 2.0
TOTAL 14.0 0.0 14.0 Source: Department of National Planning & Monitoring Note: Totals may not add up due to rounding
10.2 ECONOMIC SECTORS
10.2.1 Agriculture
The agriculture sector plays an important role in PNG, sustaining the livelihoods of around 85 per cent of the population residing in rural areas. It is dominated by subsistence production and accounts for 32.2 per cent of PNG’s gross domestic product (GDP).
The PNG Development Strategic Development Plan 2010-2030 (PNG DSP) goal for the sector is for PNG to have “a world class agriculture sector that is responsive to international and domestic markets for a diverse range of products and provides the best available income and job opportunities”. The National Agriculture Development Plan (NADP) 2007 – 2016 provides an overall policy and planning directive for the agriculture sector. The NADP aims to sustainably transform the country’s agriculture sector into a vibrant and productive economic sector that contributes effectively to economic growth, social wellbeing, national food security and poverty alleviation.
In 2011, the Department of Agriculture and Livestock in consultation with the stakeholders developed a new sector strategy entitled “Aligning Agriculture Sector to Higher National Development Plans (PNGDSP 2010-2030, MTDP 2011-2015). The strategy refocuses the NADP into the following priority areas, namely: Enhanced productivity and scale of production; Research and extension for development; Food and nutrition security; Agro-processing and marketing; Information management and communication; Policy Analysis, advocacy and enabling policies; Institutional Capacity Strengthening; and, Resourcing Management and Coordination.
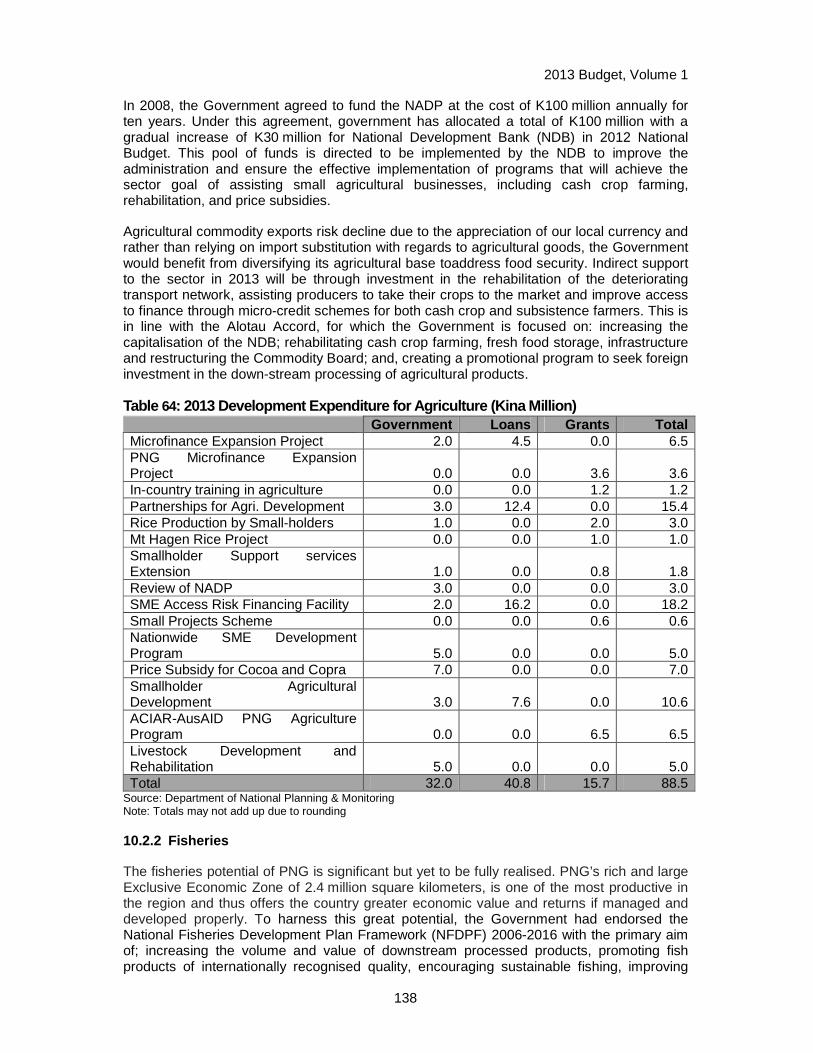
2013 Budget, Volume 1
138
In 2008, the Government agreed to fund the NADP at the cost of K100 million annually for ten years. Under this agreement, government has allocated a total of K100 million with a gradual increase of K30 million for National Development Bank (NDB) in 2012 National Budget. This pool of funds is directed to be implemented by the NDB to improve the administration and ensure the effective implementation of programs that will achieve the sector goal of assisting small agricultural businesses, including cash crop farming, rehabilitation, and price subsidies.
Agricultural commodity exports risk decline due to the appreciation of our local currency and rather than relying on import substitution with regards to agricultural goods, the Government would benefit from diversifying its agricultural base toaddress food security. Indirect support to the sector in 2013 will be through investment in the rehabilitation of the deteriorating transport network, assisting producers to take their crops to the market and improve access to finance through micro-credit schemes for both cash crop and subsistence farmers. This is in line with the Alotau Accord, for which the Government is focused on: increasing the capitalisation of the NDB; rehabilitating cash crop farming, fresh food storage, infrastructure and restructuring the Commodity Board; and, creating a promotional program to seek foreign investment in the down-stream processing of agricultural products.
Table 64: 2013 Development Expenditure for Agriculture (Kin a Million) Government Loans Grants Total Microfinance Expansion Project 2.0 4.5 0.0 6.5 PNG Microfinance Expansion Project 0.0 0.0 3.6 3.6 In-country training in agriculture 0.0 0.0 1.2 1.2 Partnerships for Agri. Development 3.0 12.4 0.0 15.4 Rice Production by Small-holders 1.0 0.0 2.0 3.0 Mt Hagen Rice Project 0.0 0.0 1.0 1.0 Smallholder Support services Extension 1.0 0.0 0.8 1.8 Review of NADP 3.0 0.0 0.0 3.0 SME Access Risk Financing Facility 2.0 16.2 0.0 18.2 Small Projects Scheme 0.0 0.0 0.6 0.6 Nationwide SME Development Program 5.0 0.0 0.0 5.0 Price Subsidy for Cocoa and Copra 7.0 0.0 0.0 7.0 Smallholder Agricultural Development 3.0 7.6 0.0 10.6 ACIAR-AusAID PNG Agriculture Program 0.0 0.0 6.5 6.5 Livestock Development and Rehabilitation 5.0 0.0 0.0 5.0 Total 32.0 40.8 15.7 88.5
Source: Department of National Planning & Monitoring Note: Totals may not add up due to rounding
10.2.2 Fisheries
The fisheries potential of PNG is significant but yet to be fully realised. PNG’s rich and large Exclusive Economic Zone of 2.4 million square kilometers, is one of the most productive in the region and thus offers the country greater economic value and returns if managed and developed properly. To harness this great potential, the Government had endorsed the National Fisheries Development Plan Framework (NFDPF) 2006-2016 with the primary aim of; increasing the volume and value of downstream processed products, promoting fish products of internationally recognised quality, encouraging sustainable fishing, improving
2013 Budget, Volume 1
139
fishing communities’ access to markets, and encouraging the vertical and horizontal linkages between supportive markets among others. The Government’s commitment to increase processed fisheries’ exports from K189 million to K450 milllion, increase in the quantity share of catch caught by PNG vessels from 1 per cent to 5 per cent, and the license fees generated from tuna fisheries from K70 million to K100 million over the MTDP period (2011-2015) will be realized through the implementation of NFDPF
The PNGDSP 2010 – 2030 fisheries sector target is for PNG to become the tuna processing capital of world. Massive investment will continue to be undertaken by the Government in this sector over the medium term to provide the competitive edge over other countries to achieve this end. The Pacific Marine Industrial Zone in Vidar, Madang Province is a fine example of the government’s commitment to encourage onshore processing of tuna resources and create economies of scale, reduce post-harvest losses via the construction of an integrated modern port complex. This project is a first of a kind in the Pacific Region and is primed to promote private sector participation, self-reliance, poverty alleviation and job creation. The PMIZ is expected to host 10 large scale tuna plants and provide for more than 40,000 skilled and semi-skilled workforce, and thus easily boosting PNG’s production capacity to more than 2,000 tonnes per day, and improve export earnings and spin-off business opportunities for the locals.
Despite the abundance of tuna in PNG waters, only 20 per cent of the fish caught is processed onshore while 80 per cent of the stock is exported unprocessed. The National Fisheries Authority is upgrading to an e-licensing system and expects to increase the collection of license fees from the current K70 million to K100 million annually. According to the Government’s domestication policy, the NFA aims to increase the percentage of catch processed locally from 20 per cent to 40 per cent in the medium term and 100 per cent by 2030.
10.2.3 Forestry
The forestry sector has contributed about 2.6 per cent of the total export earnings in the first quarter of 2012 from the export of logs and other forest commodities. Given the sector’s significance to the economy, the Government is now committed to ensuring PNG’s forest resources are managed so as to derive maximum sustainable benefits while minimising any detrimental impact to the environment and society at large. The sector goal according to the PNGDSP 2010-2030 is to ‘build a forestry sector that is sustainable and highly profitable’. Given the key strategies outlined in the PNGDSP, that is: to increase processed log exports;decrease the share of logs from natural forest; and increase plantation forest, PNG will capture a much greater benefit for current and future generations. Implementing these strategies would also position PNG to market its unique forests to tourists, and will meet international demand for carbon storage or for other environmental services.
One of the major issues in the forestry sector is the increasing incidence of illegal logging operations. The acquisition of land for forestry is also another issue the sector is facing due to the current land tenure system. Land is needed in order to increase the forest plantation area as most of the processed logs will be coming from it as outlined in the PNGDSP. Therefore, with the amendment of the new ILG Act and Land Registration Act 2009 in 2012, people can easily convert their land for commercial activities such as forest plantations and reap more socio-economic benefits however this can also result in unsustainable harvesting.
In 2013, the PNG Forest Authority will continue improving the forest policy and relevant regulations as it establishes a strong foundation to implement its sector strategies. A strong regulatory and policy framework is critical for the Government, through the forestry sector, to achieve the overall goal of building a forestry sector that is highly profitable as well as sustainable for future generations.

2013 Budget, Volume 1
140
10.2.4 Tourism
Tourism is an important contributor to the economy of Papua New Guinea (PNG) and with its advantage in cultural and natural diversity, it has the potential to expand to achieve the goal of building a strong, vibrant, world class tourism sector and be a key source for sustainable development and globalisation.
The 2011/2012 Business and Investment Guide on PNG reports that there were significant increases in visitor arrivals to PNG on business and for holiday makers which grew by 12.8 per cent in 2011 compared to arrivals in 2010.About 46 per cent of visitors were from Australia with increasing visitors from Asia and Europe. In addition, PNG has seen an increase in cruise ship visits with more than 1,000 tourists visiting aboard four cruise ships in early 2012. According to the PNGTPA, cruise ships account for 90 per cent of the revenue earned by PNG’s coastal tourism operators.
Over the medium term, the industry will work towards increasing the tourism demand by raising market awareness of PNG as a destination and increasing product information and distribution; encourage investment in new and existing tourism products that meet market needs by increasing sector competitiveness and industry standards and profitability; improve competitiveness and standards of transport and infrastructure to increase market demand and improve visitor satisfaction levels; facilitate training and quality education programs to meet industry needs, improve skill levels and create awareness of the benefits of tourism and develop institutional structures and capacity within the public and private sector to facilitate tourism development at a national and provincial level.
The government will continue its support to the tourism sector in 2013 with the implementation of key areas in Papua New Guinea’s MTDP and the Tourism Master Plan. This will aim to address areas such as product development and investment, marketing the destination, transport and infrastructure, human resource development, and institution and industry partnership geared towards improving the competiveness of the sector. In addition, to strengthen access to credit facility, create better awareness of investment opportunities and the promotion of PNG as a tourist destination.
10.2.5 Oil and Gas
The oil and gas sector is one of the largest contributors to GDP from export revenue in PNG. The country is changing petroleum activities from a predominantly gas fields to exporting condensate and wet gas and processed petroleum.
The oil and gas industry have attracted international interest as signified by the number of exploration activity. There are 71 PPLs with applications pending approval for projects located many parts of the country. If investor confidence is maintained, PNG will observe several oil and gas projects develop in the next five years.
The Government is paying Special Support Grants (SSG), Infrastructure Development Grants (IDG) and high impact projects to mining/petroleum provincial governments, special purpose authorities (SPA), landowner companies. The IDG is paid under the Umbrella Benefit Sharing Agreement (UBSA) to the land owner companies as fixed grants, while the SSG is paid as a percentage of production. In 2012, K120 million IDG was paid to landowner companies, and K50 million was paid for high impact projects.
Blockages, equipment sabotage, planting the gorgor, ambush and assault on mine staff and compounds, and trespassing of company property are somemeasures disgruntled landowners opt for to force stop work. Deviation from project agreement by the developers is another issue which has risen from lack of devotion to the UBSA.
2013 Budget, Volume 1
141
The 2013 Budget will be funding the Petroleum License Database Management System Project so that Department of Petroleum and Energy will be able to improve the efficiency in administration to provide for reliable data and information for planning purposes, and inject more funds to cater for outstanding commitments under the various MOAs.
10.2.6 Mining
The mining sector continues to dominate the export market over the years contributing more than two-thirds of the total export earnings. Despite being the dominant sector in the economy, its adverse effect is very detrimental to the environment and people’s welfare in terms of pollution and land degradation. The issue is one of the agenda the government is trying to address through PNGDSP 2010-2030. Under the PNGDSP 2010-2030, the goal for the sector is to ‘double mineral exports, whilst minimizing the adverse impact on the environment’. To achieve the goal, the Government hopes to increase the number of exploration licenses to 250 and operational mine sites to 12 over the first MTDP period whilst addressing the impact on the environment.
Several Mineral Policies and Legislations were reviewed between 2009 and 2011. These include: the Mining Act 1992 (per 2006 draft), Mining (Safety) Act 1977 (per 2006 draft), Mineral Policy (per 2004 version) and Offshore Mineral Policy (per 1999 green paper). The review was done to improve and accommodate the general provisions that would provide for the conduct of offshore mineral exploration and mining. Other regulations were also developed to cater for specific areas that can be regulated by Government. The reviews were specifically focused on these components, namely: Tenement Administration; Compliance Requirements; Policy Requirements; National Government Revenue Streams; and Provincial Government and Land Owners. Currently there is work in progress to develop future mining policies. It is anticipated that by 2015, PNG should have these following mining-related policies: Downstream Processing Development Policy; Mine Waste Management Policy; Involuntary Relocation Policy; and Mine Closure & Sustainable Development Policy. These new policies will set out the parameters within which a developer should conduct its business in PNG.
Though there is an increased growth in the expansion of the mining sector in PNG, there is need for the improvement of Government agencies’ capacity to effectively implement their mandated roles and responsibilities including the enforcement of the relevant legislations and policies. It is very crucial that the agencies involved in the mining sector are adequately resourced to implement the policies and have the required technical expertise to better coordinate the Government’s position when negotiating mining projects with the developers.
Landowner disputes between different clan groups is an ongoing concern. It is the Government’s responsibility to ensure that the Environmental Impact Assessment is technically sound to protect the environment, the communities in the impacted areas, and also itself from the risk of compensation payments from environmental damages. Comprehensive mine closure plans are required for all mining operations in the country to protect the interests of the landowners, their environment, and ensure that benefit streams continue for their future generations in the longer term, after the developer leaves.
In 2013, the MRA and the DMPGM will continue to administer the operation of the mining sector to meet the targets set in the first MTDP period and address the sectors’ challenges. As such the DMPGM is reviewing the Mining Act 1992, drafting an Off-shore Mining Policy, including the Geothermal Policy. These are in line with the Alotau Accord which recommends for the review of the mining legislation, in full consultation with stakeholders, to increase the level of benefits going to resource owners, Local-level Government, and Provincial Government.These new mining policies will be developed to increase the benefits to PNG in terms of increased revenue through taxes and increased economic activities from
2013 Budget, Volume 1
142
spin-off business activities. The benefits will also mean favorable outcomes in the lives of the people in the impacted communities in terms of the provision of basic services such as health, education and infrastructure to access markets, apart from the royalties that they receive.
10.2.7 Manufacturing
The manufacturing sector has developed mainly on PNG’s comparative advantage in agricultural and resource based industries with processing industries for canned tuna, furniture, bio-fuel, refined petroleum, refined palm oil, canned meat, fabricated metal projects, and plywood and veneer. About 70 per cent of the sector is located in Port Moresby, Lae and Madang, which constitute a domestic market in the Pacific region with certain economies of scales. This provides opportunities to export products to smaller markets in the region.
According to the PNGDSP 2010-2030, the sector’s goal is “to achieve a competitive manufacturing sector through the development of higher value chains and appropriate technologies to manufacturing that will lead to the generation of higher income and employment”. In order to promote and increase the volume of exports in the manufacturing sector to facilitate growth and diversification of the economy, supply-side constraints across transport and energy infrastructure needs to be addressed. This includes transforming the sector from light manufacturing to higher value production and adapting appropriate technologies. In accordance with the Government’s MTDP, the strategies for the Government to achieve the sector’s goal are to: promote export orientation in manufacturing industries; for PNG to be a world tuna capital and leader in related marine based products; attract foreign investment in PNG manufacturing; remove inefficiencies in regulation and otherwise ensure low business costs in PNG; and, facilitate the expansion of a strong industrial base through an integrated manufacturing industry. This strategy is in line with the Alotau Accord key priorities, particularly to grow the economy sustainably and diversify PNG’s productive base beyond natural resources and the extractive industries.
The Small and Medium Enterprise (SME) Policy that is currently under review aims to promote the development of small to medium enterprises in PNG with the transfer and adoption of appropriate technology, development of entrepreneurial skills, and increasing access to micro-finance, in addition to encouraging and strengthening the linkages between SMEs and support institutions to ensure their long-term sustainability. The SME policy will be complemented by the Manufacturing Sector Policy for PNG which is in the process of formulation in collaboration with other stakeholders.
With a wide variety of products produced in PNG, the country’s economic future will equally depend on the expansion of a broad-based and diversified manufacturing sector. Government will provide a conducive investment environment by addressing the impediments to doing business in the country. This includes, law and order issues causing high costs and regulatory constraints to export-oriented businesses, lack of entrepreneurial skills, limited access to micro-finance, climate change affecting production, and subsidies to reduce the effects of global price fluctuations on local and PNG-based manufacturing companies.
10.3 CROSS-CUTTING
10.3.1 Environment
There is a lack of effective implementation of relevant legislations, policies and programmes to safeguard the environment in Papua New Guinea. With the emerging demand for both renewable and non-renewable natural resources, this poses major challenges for the

2013 Budget, Volume 1
143
Government of Papua New Guinea (GoPNG) to invest effectively in the sustainable extraction and usage of these resources. The Department of Environment and Conservation (DEC) currently administers six different legislations and fourteen International Conventions and Agreements with the Environment Act 2000 and the fourth goal of the National Constitutional components for the environment sector. In order to strengthen the environmental regulatory functions as opposed to the conservation policy and program functions which would be under the Department, it was proposed that in future an Environment Protection Authority (EPA) will be established to strengthen environmental regulation in PNG.
The Government’s commitment to MDG 7 to ensure environmental sustainability by integrating the principles of sustainable development into country policies and programs aims to reverse the loss of environmental resources by 2015. Increasing pressure has been exerted on the DEC and its sister department (OCCD) to ensure the environment is sustainably used and that disturbances to natural systems are limited. The lack of reliable environmental data to assess the achievement of the indictors against the MTDP and PNGDSP and the MDG 7 is lacking. Nonetheless, the Government will work towards achieving the targets it has set itself to ensure environmental and climate issues are addressed in a sustainable manner.
The interest for direct investments in the resource sector by external organizations is mounting and the DEC has ensured that foreign direct investors will comply to existing government legislations, policies and programmes to safeguard the environment from over-exploitation. The Government is increasingly recognizing the importance of sustainable development.
The Kokoda Track Initiative continues to be funded in 2013 with K2.0 million, and the Government has identified this area as being of national interest and the resource use issue will require continued attention. This issue is to secure the NCD’s future power and water supplies that would be sourced from the Brown River Catchment. A major investigation of the issues surrounding the potential development of a major mine within the Brown River Catchment found out that the development would pose major environmental risks to the catchment and surrounding regions. It was observed that the loss of potential revenue to landowners can be compensated through a range of development options for communities around the area. The Owen Stanley and Kokoda Track also have significant historical value and are proposed World Heritage Sites. Other major projects include the Coral Triangle Initiative (K1.0 million), Rabaul Volcanological Observatory Houses Project (K3.0 million), and Landslides Hazard Mapping of Highlands Highway (K1.5 million).
10.3.2 HIV/AIDS
The last six years have seen significant improvements in PNG’s national surveillance system. The number of HIV Counselling and testing sites has grown exponentially, exceeding 200 to date. This is a remarkable achievement for a developing country like PNG which has shown its commitment to address this development issue. It has responded to the Central Agencies Coordinating Committee (CACC) directive to focus on ‘rural’ areas considering the high prevalence rate in recent years. Thus the focus on rural areas has meant the increased budget allocation to the Provincial AIDS Committees in the 2013 Budget.
The Government’s support is aligned to the PNG DSP (2010- 2020) and the MTDP 2011-2015 with the Goal to have “a healthy population free from sexually transmissible infections and HIV/AIDS threats”. The strategies identified to combat the HIV/AIDS epidemic is to: have a policy framework based on PNG ways, to prevent and reduce the transmission

2013 Budget, Volume 1
144
of HIV and STIs in PNG; a policy framework that is based on PNG ways to provide counselling, testing, treatment, care and support; and, focus on systems strengthening through better coordination, data collection, and analysis.
The formulation of the 2013 Development Budget has considered the need to ensure the continuous implementation of these key strategies while also responding to the major recommendations of the Independent Review Group.
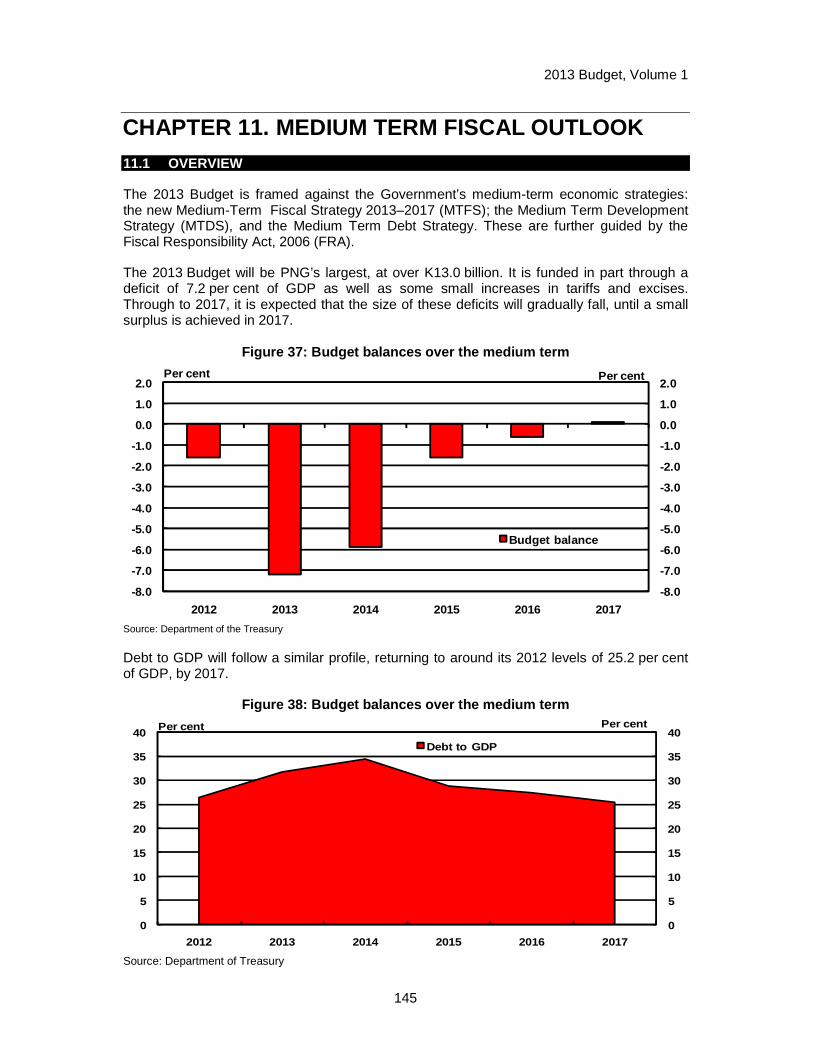
2013 Budget, Volume 1
145
CHAPTER 11. MEDIUM TERM FISCAL OUTLOOK 11.1 OVERVIEW
The 2013 Budget is framed against the Government’s medium-term economic strategies: the new Medium-Term Fiscal Strategy 2013–2017 (MTFS); the Medium Term Development Strategy (MTDS), and the Medium Term Debt Strategy. These are further guided by the Fiscal Responsibility Act, 2006 (FRA).
The 2013 Budget will be PNG’s largest, at over K13.0 billion. It is funded in part through a deficit of 7.2 per cent of GDP as well as some small increases in tariffs and excises. Through to 2017, it is expected that the size of these deficits will gradually fall, until a small surplus is achieved in 2017.
Figure 37: Budget balances over the medium term
-8.0
-7.0
-6.0
-5.0
-4.0
-3.0
-2.0
-1.0
0.0
1.0
2.0
-8.0
-7.0
-6.0
-5.0
-4.0
-3.0
-2.0
-1.0
0.0
1.0
2.0
2012 2013 2014 2015 2016 2017
Budget balance
Per cent Per cent
Source: Department of the Treasury
Debt to GDP will follow a similar profile, returning to around its 2012 levels of 25.2 per cent of GDP, by 2017.
Figure 38: Budget balances over the medium term
0
5
10
15
20
25
30
35
40
0
5
10
15
20
25
30
35
40
2012 2013 2014 2015 2016 2017
Debt to GDP
Per cent Per cent
Source: Department of Treasury
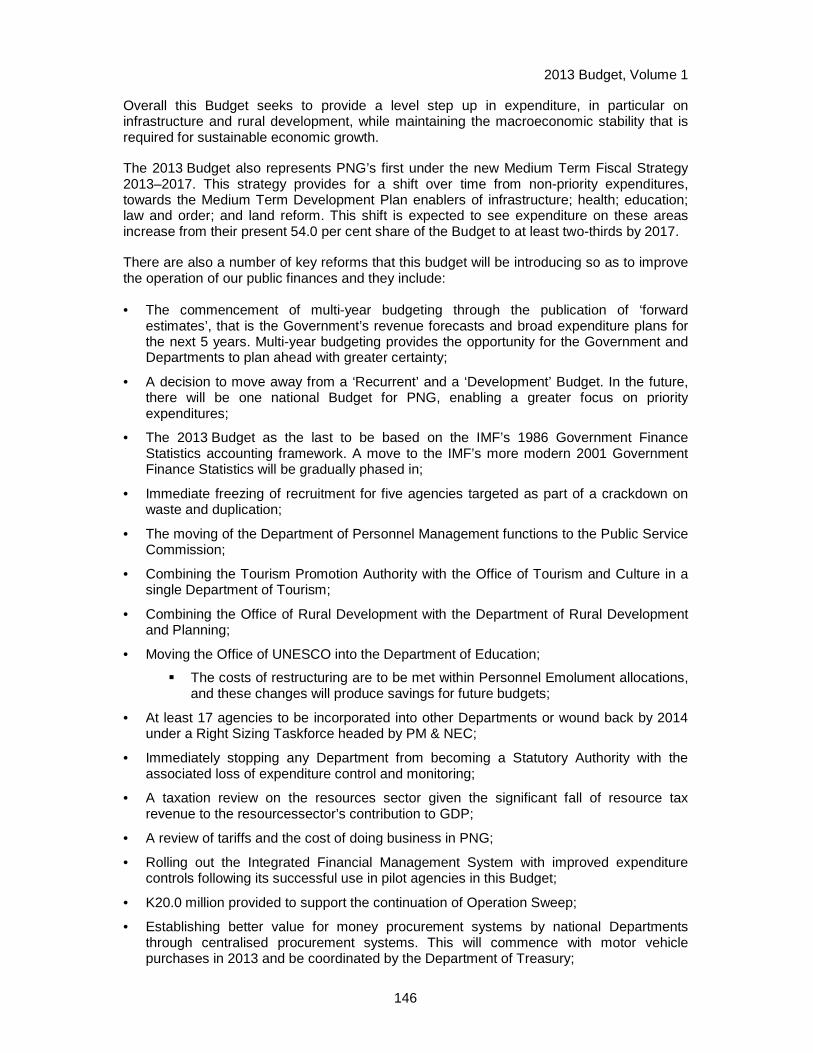
2013 Budget, Volume 1
146
Overall this Budget seeks to provide a level step up in expenditure, in particular on infrastructure and rural development, while maintaining the macroeconomic stability that is required for sustainable economic growth.
The 2013 Budget also represents PNG’s first under the new Medium Term Fiscal Strategy 2013–2017. This strategy provides for a shift over time from non-priority expenditures, towards the Medium Term Development Plan enablers of infrastructure; health; education; law and order; and land reform. This shift is expected to see expenditure on these areas increase from their present 54.0 per cent share of the Budget to at least two-thirds by 2017.
There are also a number of key reforms that this budget will be introducing so as to improve the operation of our public finances and they include:
• The commencement of multi-year budgeting through the publication of ‘forward estimates’, that is the Government’s revenue forecasts and broad expenditure plans for the next 5 years. Multi-year budgeting provides the opportunity for the Government and Departments to plan ahead with greater certainty;
• A decision to move away from a ‘Recurrent’ and a ‘Development’ Budget. In the future, there will be one national Budget for PNG, enabling a greater focus on priority expenditures;
• The 2013 Budget as the last to be based on the IMF’s 1986 Government Finance Statistics accounting framework. A move to the IMF’s more modern 2001 Government Finance Statistics will be gradually phased in;
• Immediate freezing of recruitment for five agencies targeted as part of a crackdown on waste and duplication;
• The moving of the Department of Personnel Management functions to the Public Service Commission;
• Combining the Tourism Promotion Authority with the Office of Tourism and Culture in a single Department of Tourism;
• Combining the Office of Rural Development with the Department of Rural Development and Planning;
• Moving the Office of UNESCO into the Department of Education;
� The costs of restructuring are to be met within Personnel Emolument allocations, and these changes will produce savings for future budgets;
• At least 17 agencies to be incorporated into other Departments or wound back by 2014 under a Right Sizing Taskforce headed by PM & NEC;
• Immediately stopping any Department from becoming a Statutory Authority with the associated loss of expenditure control and monitoring;
• A taxation review on the resources sector given the significant fall of resource tax revenue to the resourcessector’s contribution to GDP;
• A review of tariffs and the cost of doing business in PNG;
• Rolling out the Integrated Financial Management System with improved expenditure controls following its successful use in pilot agencies in this Budget;
• K20.0 million provided to support the continuation of Operation Sweep;
• Establishing better value for money procurement systems by national Departments through centralised procurement systems. This will commence with motor vehicle purchases in 2013 and be coordinated by the Department of Treasury;

2013 Budget, Volume 1
147
• Determining that any previous NEC decisions prior to the formation of the new Government which have not been implemented or funded to date have effectively lapsed, thereby reducing spending pressures. Any unimplemented measures considered to still have merit can be brought forward to Treasury for costing and considered as part of the 2014 Budget process;
• Greater transparency through release of information on public expenditure, including transfers of funds between key areas;
• Initiating a major review and updating of the Public Finance Management Act to bring it into line with the needs of a more modern and larger PNG, including updated procurement guidelines;
• Strengthening economic governance through creating a new area within the Department of Treasury consisting of national and international academic, business and community economic experts to provide advice on ways PNG can best achieve its potential;
• Establishing the Sovereign Wealth Fund by the end of 2013 to help stabilise and manage expenditure;
• Taxation reforms will also be undertaken to support a return to surplus in 2017;
• The immediate introduction of charging for funds on-lent to commercially viable projects (such as Jacksons Airport and the Fibre Optic cable) funded as part of this Budget;
• Increased funding for the Internal Revenue Commission and PNG Customs Services to support their functions of collecting revenue;
• Reviewing existing arrangements for the hypothecation of revenues to agencies with a view to returning these revenues to Consolidated Revenue - the review will be led by Treasury in consultation with PM & NEC and Finance; and
• Action to improve compliance including through an expanded auditing function.
Further actions are outlined in the Non-Financial Instructions set out in Chapter 4.3.
11.2 REVENUE AND GRANTS
Total Revenue and Grants is expected to increase moderately from K10,157.7 million in 2012 to K10,481.9 million in 2013. However, for 2014 to 2017 revenue is expected to pick up considerably from K11,299.0 million in 2014 to K15,659.0 million in 2017. This is in line with the start of production of the PNG LNG project and reflects stronger economic growth.
From 2014 onwards mineral revenue is expected to decline. This reflects a decline in commodity prices, the strong Kina and the winding down of other mines. Although, mineral revenue is expected to increase after the PNG LNG project production begins in 2014, this increase does not reflect PNG’s true mineral revenue raising potential. A factor includes the granting of tax concessions to the PNG LNG project (due to its special status as a pioneer project) and a number of other mines with tax concessions and exemptions that are not in line with standard tax law.
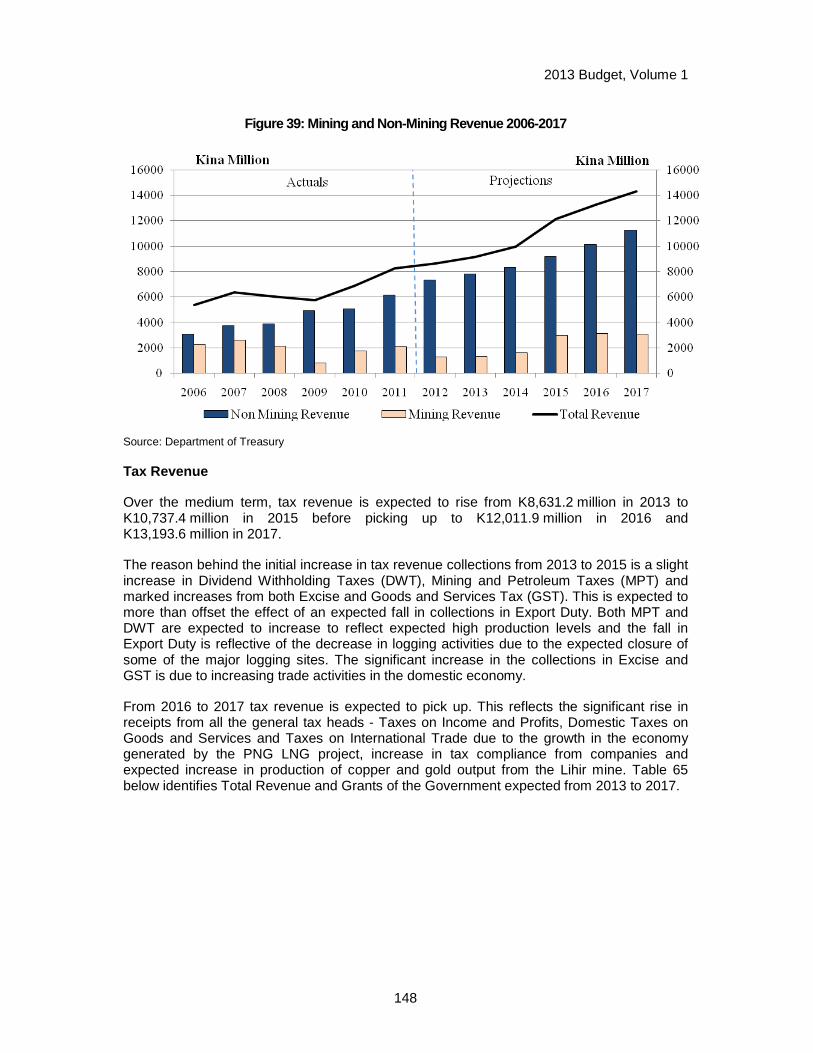
2013 Budget, Volume 1
148
Figure 39: Mining and Non-Mining Revenue 2006-2017
Source: Department of Treasury
Tax Revenue
Over the medium term, tax revenue is expected to rise from K8,631.2 million in 2013 to K10,737.4 million in 2015 before picking up to K12,011.9 million in 2016 and K13,193.6 million in 2017.
The reason behind the initial increase in tax revenue collections from 2013 to 2015 is a slight increase in Dividend Withholding Taxes (DWT), Mining and Petroleum Taxes (MPT) and marked increases from both Excise and Goods and Services Tax (GST). This is expected to more than offset the effect of an expected fall in collections in Export Duty. Both MPT and DWT are expected to increase to reflect expected high production levels and the fall in Export Duty is reflective of the decrease in logging activities due to the expected closure of some of the major logging sites. The significant increase in the collections in Excise and GST is due to increasing trade activities in the domestic economy.
From 2016 to 2017 tax revenue is expected to pick up. This reflects the significant rise in receipts from all the general tax heads - Taxes on Income and Profits, Domestic Taxes on Goods and Services and Taxes on International Trade due to the growth in the economy generated by the PNG LNG project, increase in tax compliance from companies and expected increase in production of copper and gold output from the Lihir mine. Table 65 below identifies Total Revenue and Grants of the Government expected from 2013 to 2017.
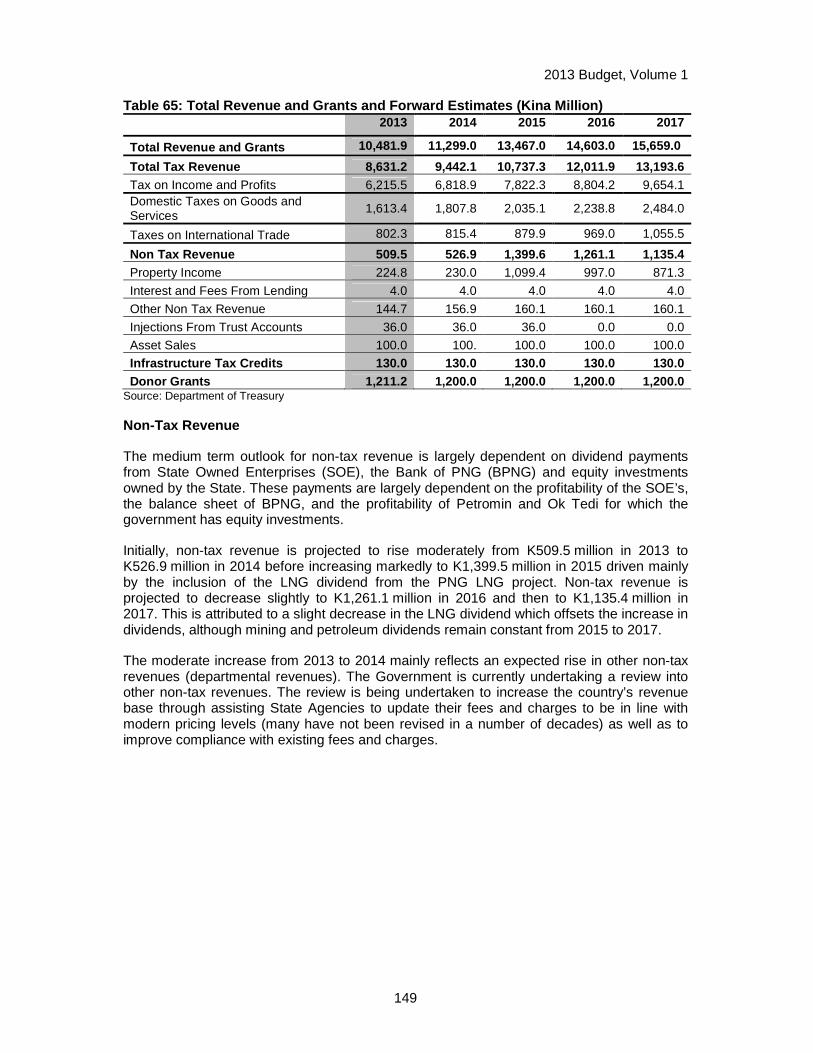
2013 Budget, Volume 1
149
Table 65: Total Revenue and Grants and Forward Esti mates (Kina Million)
2013 2014 2015 2016 2017
Total Revenue and Grants 10,481.9 11,299.0 13,467.0 14,603.0 15,659.0
Total Tax Revenue 8,631.2 9,442.1 10,737.3 12,011.9 13,193.6 Tax on Income and Profits 6,215.5 6,818.9 7,822.3 8,804.2 9,654.1 Domestic Taxes on Goods and Services
1,613.4 1,807.8 2,035.1 2,238.8 2,484.0
Taxes on International Trade 802.3 815.4 879.9 969.0 1,055.5
Non Tax Revenue 509.5 526.9 1,399.6 1,261.1 1,135.4 Property Income 224.8 230.0 1,099.4 997.0 871.3
Interest and Fees From Lending 4.0 4.0 4.0 4.0 4.0
Other Non Tax Revenue 144.7 156.9 160.1 160.1 160.1
Injections From Trust Accounts 36.0 36.0 36.0 0.0 0.0
Asset Sales 100.0 100. 100.0 100.0 100.0
Infrastructure Tax Credits 130.0 130.0 130.0 130.0 130.0 Donor Grants 1,211.2 1,200.0 1,200.0 1,200.0 1,200.0
Source: Department of Treasury
Non-Tax Revenue
The medium term outlook for non-tax revenue is largely dependent on dividend payments from State Owned Enterprises (SOE), the Bank of PNG (BPNG) and equity investments owned by the State. These payments are largely dependent on the profitability of the SOE’s, the balance sheet of BPNG, and the profitability of Petromin and Ok Tedi for which the government has equity investments.
Initially, non-tax revenue is projected to rise moderately from K509.5 million in 2013 to K526.9 million in 2014 before increasing markedly to K1,399.5 million in 2015 driven mainly by the inclusion of the LNG dividend from the PNG LNG project. Non-tax revenue is projected to decrease slightly to K1,261.1 million in 2016 and then to K1,135.4 million in 2017. This is attributed to a slight decrease in the LNG dividend which offsets the increase in dividends, although mining and petroleum dividends remain constant from 2015 to 2017.
The moderate increase from 2013 to 2014 mainly reflects an expected rise in other non-tax revenues (departmental revenues). The Government is currently undertaking a review into other non-tax revenues. The review is being undertaken to increase the country’s revenue base through assisting State Agencies to update their fees and charges to be in line with modern pricing levels (many have not been revised in a number of decades) as well as to improve compliance with existing fees and charges.
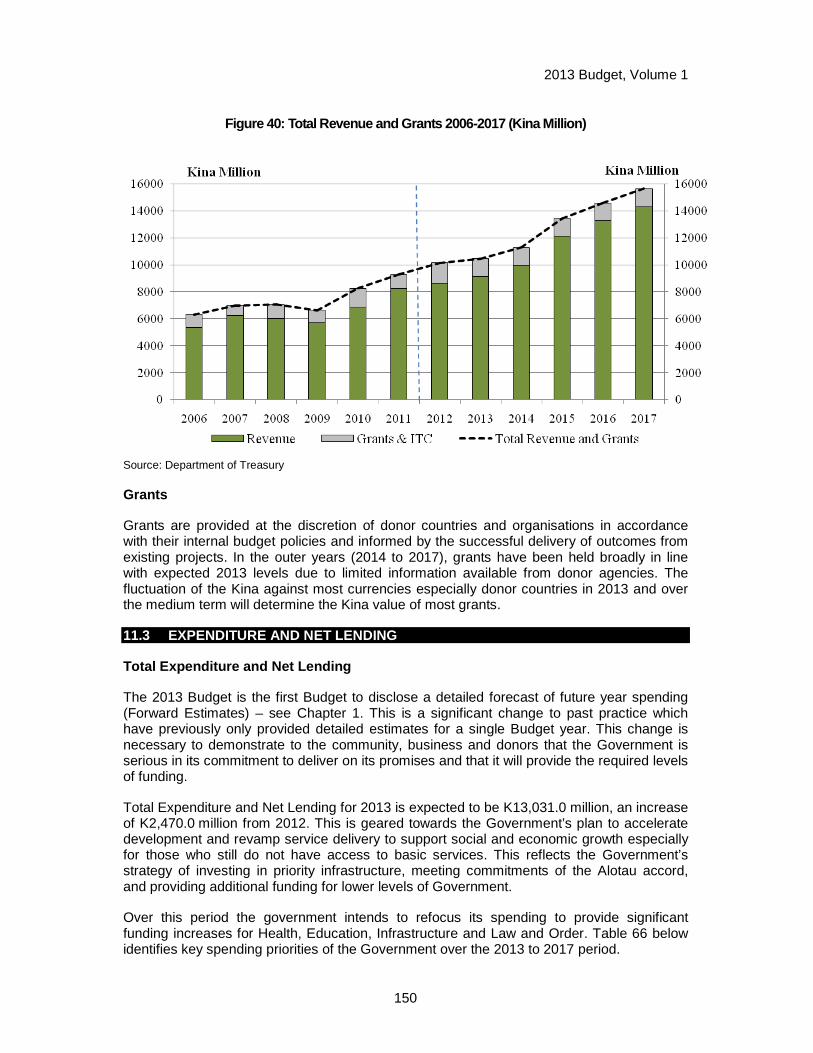
2013 Budget, Volume 1
150
Figure 40: Total Revenue and Grants 2006-2017 (Kina Million)
Source: Department of Treasury
Grants
Grants are provided at the discretion of donor countries and organisations in accordance with their internal budget policies and informed by the successful delivery of outcomes from existing projects. In the outer years (2014 to 2017), grants have been held broadly in line with expected 2013 levels due to limited information available from donor agencies. The fluctuation of the Kina against most currencies especially donor countries in 2013 and over the medium term will determine the Kina value of most grants.
11.3 EXPENDITURE AND NET LENDING
Total Expenditure and Net Lending
The 2013 Budget is the first Budget to disclose a detailed forecast of future year spending (Forward Estimates) – see Chapter 1. This is a significant change to past practice which have previously only provided detailed estimates for a single Budget year. This change is necessary to demonstrate to the community, business and donors that the Government is serious in its commitment to deliver on its promises and that it will provide the required levels of funding.
Total Expenditure and Net Lending for 2013 is expected to be K13,031.0 million, an increase of K2,470.0 million from 2012. This is geared towards the Government’s plan to accelerate development and revamp service delivery to support social and economic growth especially for those who still do not have access to basic services. This reflects the Government’s strategy of investing in priority infrastructure, meeting commitments of the Alotau accord, and providing additional funding for lower levels of Government.
Over this period the government intends to refocus its spending to provide significant funding increases for Health, Education, Infrastructure and Law and Order. Table 66 below identifies key spending priorities of the Government over the 2013 to 2017 period.
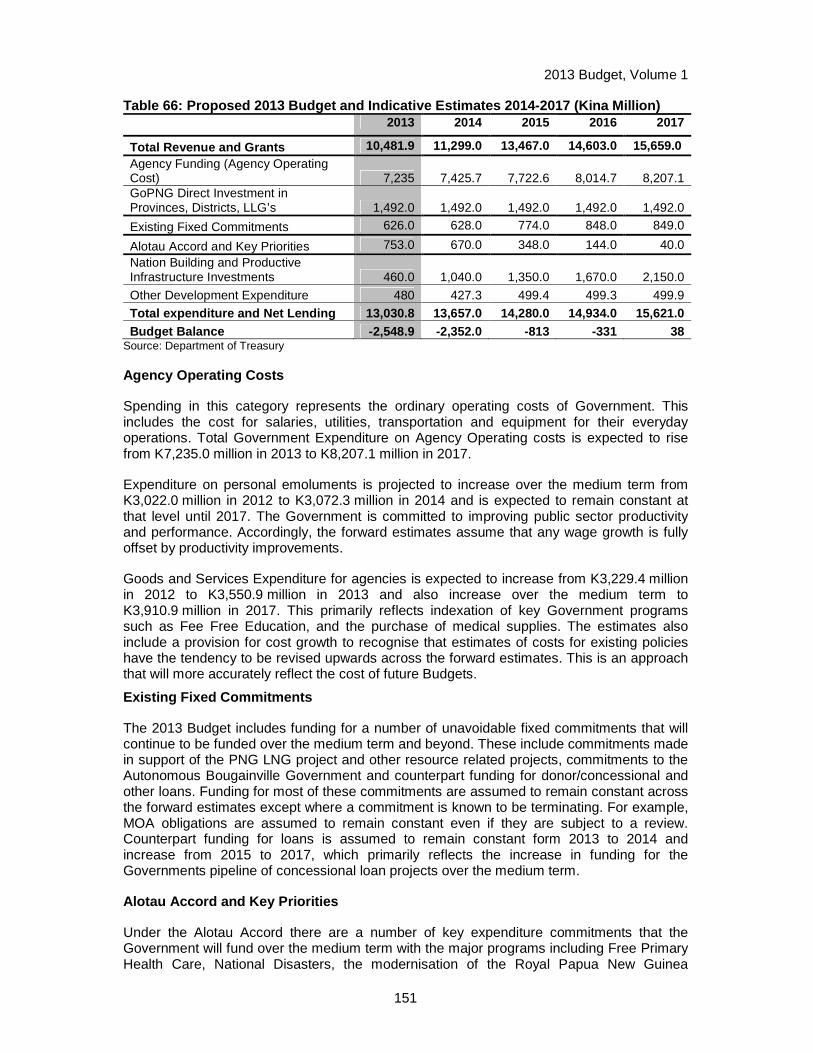
2013 Budget, Volume 1
151
Table 66: Proposed 2013 Budget and Indicative Estim ates 2014-2017 (Kina Million)
2013 2014 2015 2016 2017
Total Revenue and Grants 10,481.9 11,299.0 13,467.0 14,603.0 15,659.0 Agency Funding (Agency Operating Cost) 7,235 7,425.7 7,722.6 8,014.7 8,207.1 GoPNG Direct Investment in Provinces, Districts, LLG’s 1,492.0 1,492.0 1,492.0 1,492.0 1,492.0
Existing Fixed Commitments 626.0 628.0 774.0 848.0 849.0
Alotau Accord and Key Priorities 753.0 670.0 348.0 144.0 40.0 Nation Building and Productive Infrastructure Investments 460.0 1,040.0 1,350.0 1,670.0 2,150.0
Other Development Expenditure 480 427.3 499.4 499.3 499.9
Total expenditure and Net Lending 13,030.8 13,657.0 14,280.0 14,934.0 15,621.0 Budget Balance -2,548.9 -2,352.0 -813 -331 38
Source: Department of Treasury
Agency Operating Costs
Spending in this category represents the ordinary operating costs of Government. This includes the cost for salaries, utilities, transportation and equipment for their everyday operations. Total Government Expenditure on Agency Operating costs is expected to rise from K7,235.0 million in 2013 to K8,207.1 million in 2017.
Expenditure on personal emoluments is projected to increase over the medium term from K3,022.0 million in 2012 to K3,072.3 million in 2014 and is expected to remain constant at that level until 2017. The Government is committed to improving public sector productivity and performance. Accordingly, the forward estimates assume that any wage growth is fully offset by productivity improvements.
Goods and Services Expenditure for agencies is expected to increase from K3,229.4 million in 2012 to K3,550.9 million in 2013 and also increase over the medium term to K3,910.9 million in 2017. This primarily reflects indexation of key Government programs such as Fee Free Education, and the purchase of medical supplies. The estimates also include a provision for cost growth to recognise that estimates of costs for existing policies have the tendency to be revised upwards across the forward estimates. This is an approach that will more accurately reflect the cost of future Budgets.
Existing Fixed Commitments
The 2013 Budget includes funding for a number of unavoidable fixed commitments that will continue to be funded over the medium term and beyond. These include commitments made in support of the PNG LNG project and other resource related projects, commitments to the Autonomous Bougainville Government and counterpart funding for donor/concessional and other loans. Funding for most of these commitments are assumed to remain constant across the forward estimates except where a commitment is known to be terminating. For example, MOA obligations are assumed to remain constant even if they are subject to a review. Counterpart funding for loans is assumed to remain constant form 2013 to 2014 and increase from 2015 to 2017, which primarily reflects the increase in funding for the Governments pipeline of concessional loan projects over the medium term.
Alotau Accord and Key Priorities
Under the Alotau Accord there are a number of key expenditure commitments that the Government will fund over the medium term with the major programs including Free Primary Health Care, National Disasters, the modernisation of the Royal Papua New Guinea
2013 Budget, Volume 1
152
Constabulary (RPNGC) and the Papua New Guinea Defence Force (PNGDF) Rebuild Programs. The cost of implementing these programs under the 2013 Budget is K753.0 million.
Nation Building Productive infrastructure
The Government will introduce a Nation building Infrastructure Program targeted at known infrastructure bottlenecks which are limiting National Development. In 2013 the Government will provide K460.0 million for these activities and is expected to increase funding to around K2,150.0 million in 2017, an increase of around K1,690.0 million.
Funding in the 2013 Budget and the medium term is geared toward a number of major infrastructure projects. These comprise providing new and upgrading existing infrastructure especially key infrastructures such as the Highlands Highway, Lae City roads, Port Moresby City roads and the Highlands Highway Lae- Nadzab road and additional priority infrastructure. This will improve access to basic services and markets, thereby improving income earning opportunities and improving the standard of living for Papua New Guineans.
Increased funding for provinces Districts and Local Level Governments
Total funding for sub-national Governments is expected to increase from K1,913.0 million in 2012 to K3,590.0 million in 2013, an increase of 87.0 per cent.
This reflects the Government’s shifting of major funding and responsibilities away from the central Government to the Provinces, Districts and Local Level Governments. This has been done to focus development in the rural areas and asa major step to accelerate development through increasing funding for high priority infrastructure programs with emphasis on infrastructure rehabilitation and maintenance.
Other Development Expenditure
Other Development Expenditure includes ongoing projects from previous years that will continue to be funded. This is to ensure that they are completed as per schedule and deliver on their objectives.
Interest Fees and Charges
Interest Payments and Fees on debt are projected to increase slightly from K459.8 million in 2012 to K671.0 million in 2013 and continue to grow over the forward estimates to K1,224.0 million by 2017. This increase reflects increased borrowing to fund the Government’s investment decisions. Interest payments and charges will vary across the forward estimates due to exchange rate fluctuations.
11.4 FINANCING
The forward years’ estimates are anticipating mainly budget deficits to meet the Government’s development agenda. These deficits and the financing of additional equity contributions required from the PNG LNG Project cost escalation comprise the financing task. The financing task is significant in 2013 and 2014 and then moderates from 2015 onwards. To achieve the financing task, additional issuance methods and/or products are required in addition to the issuance of Treasury Bills/Inscribed Stock and loans from external sources (development partners).
The financing task for 2013 and 2014 will be mainly financed through domestic debt issuance and additional issuance methods. From 2015 to 2017, new borrowing of funds from external sources for concessional loans progressively undertakes more of the net financing
2013 Budget, Volume 1
153
task, until in 2016 net external financing provides all of the Government’s net financing needs. Domestic issuance will be maintained in these years to support the Government securities market, recognising the important role it plays in the capital market for PNG.
The main focus of the debt management is on funding the government’s development agenda whilst seeking to control the risk and cost of a large increase in the stock of debt on issue.
In addition, borrowing by State owned agencies which are not included in the budget process or Public debt total are around 32.0 per cent of GDP. In addition, the Government has around K2.1 billion in unfunded superannuation liabilities.
Although gross Government debt to GDP is only expected to hit 31.7 per cent in 2013, including superannuation and other Government liabilities brings the gross liabilities rate up to 64.6 per cent of GDP (including the PNG LNG guarantee). Due to the high level of State liabilities, maintaining debt at prudent levels and managing financial risks remain important objectives of the Debt Strategy. The recent experience with high sovereign debt in Europe, particularly in Greece and Italy, highlights the major macroeconomic and fiscal risks that can emerge from excessive Government debt.
PNG experienced serious debt problems only one decade ago when it needed to go to the IMF and other donors for a bail-out. The fiscal austerity then experienced was one that PNG would not wish to repeat. The countries with the lowest levels of Government debt demonstrated the greatest capacity to deal with the Great Recession of 2008-09 and the subsequent recovery.
Risks which include, foreign currency risks, interest rates risks, refinancing risks and operational risks are expected to be managed in line with the Medium Term Debt Strategy.
2013 Budget, Volume 1
154
CHAPTER 12. MEDIUM TERM DEBT STRATEGY 12.1 OVERVIEW
Objective and Context
The objective of the Medium Term Debt Strategy 2013–2017 (the Debt Strategy) is to minimise the cost of debt consistent with the Government’s tolerance for financial risk. There are three major strategies: (i) maintain debt at sustainable levels; (ii) maintain financial risk at prudent levels; and (iii) develop the domestic debt market.
The Debt Strategy covers debt issued by the State and secured by a claim against consolidated revenue (Public Debt). It does not cover the management of the debt of State Owned Enterprises and other contingent exposures. However, these general State liabilities were considered in the formulation of this strategy.
Over the last five years, the Government has made excellent progress in implementing the current and prior Debt Strategy by reducing Public Debt, particularly foreign currency debt, to prudent levels. However, this has been offset by an increase in off-balance sheet foreign currency liabilities. That is, borrowing by State owned agencies which are not included in the budget process or general Government debt. Due to the high level of State liabilities, maintaining debt at prudent levels and managing financial risks remain important objectives of this Strategy. Furthermore, circumvention of budget and debt controls by proponents of public-sector capital expenditure funded by debt remains a threat to this strategy.
12.2 MAINTAINING DEBT AT SUSTAINABLE LEVELS
PNG’s debt sustainability will be improved through four major means: (i) the growth in the economy; (ii) improvements in public-sector management and governance; (iii) prudent management of public debt, other liabilities and assets; and (iv) reducing reliance on high-risk, complex debt and increasing reliance on low-risk, simple debt securities.
Credit rating
The most widely accepted and used measure of debt sustainability for a state is its sovereign credit rating. The State has a foreign-currency debt rating of B plus with a stable outlook from Standard and Poor (S&P). The outlook was recently revised upward from negative to stable in October 2012. The change to a stable outlook reflects S&P’s assessment of the political settings in the country which normalized after the July 2012 elections. However, the vulnerabilities associated with the country’s fragmented political structure, public policy development and governance, and service delivery, continue to constrain PNG’s credit rating.
Some of the other factors that have traditionally prevented an improvement in PNG’s credit rating are the use of off-budget borrowing and expenditure undermining fiscal policy and the economy’s high exposure to commodity price changes due to a dependence on the resource sector.
A rating of B means that the rating agencies believe PNG is vulnerable to adverse business, financial and economic conditions but currently has the capacity to meet its financial commitments.
Other liabilities

2013 Budget, Volume 1
155
All State liabilities will impact on the sustainability of the Government’s debt, and are considered in the preparation of the debt strategy.
Major State liabilities in addition to Public Debt include the Independent Public Business Corporation’s borrowing to fund the State’s share of the PNG LNG project of AUD$1.7 billion (K3.8 billion) and the State’s share of the PNG LNG project debt which is guaranteed by the State until the project construction reaches completion (up to K5.4 billion). Through these liabilities, the State’s finances are heavily exposed to the success of the PNG LNG project.
In addition, the State has unfunded public service superannuation liabilities of around K2.1 billion.
Treasury’s analysis indicates that due to the high level of State liabilities, further significant increases in debt need to be undertaken with care and actively managed.
For the 2011 Budget the Government amended the Fiscal Responsibility Act 2006 to prohibit General Government debt exceeding 30.0 per cent of GDP.
Due to the Government’s development agenda this limit will need to be increased over the medium term and elements of the debt strategy may need to be temporarily exceeded in order to finance this important work.
12.3 REDUCING FINANCIAL RISKS
Treasury aims to minimise the cost of debt and keep the risk of debt at tolerable levels through:
• the competitive auction of simple financial securities denominated in Kina; and
• borrowing limited amounts of concessional debt from international financial institutions or other development partners.
Treasury’s analysis indicates that complex financial instruments and opaque off-balance sheet structures are inappropriate for PNG due to lack of skills, technology and systems. The international financial crisis has also provided strong support for a “keep it simple strategy” with large international financial institutions failing to manage the risks of complex financial instruments and off-balance sheet structures.
Foreign Currency Risk
Foreign currency risk is the risk that the value of debt denominated in foreign currency and the debt service cost of this debt varies in accordance with exchange rates. These changes can be positive or negative.
The Government aims to limit foreign currency debt to around 40.0 per cent of the total Public Debt portfolio by restricting the amount of new foreign currency loans it enters into.
Unless a specific foreign currency loan is required by the Government, new foreign currency loans are considered if:
(i) The loan is highly concessional and in a low risk currency. The criteria for considering concessional financing shall be a grant element of 35.0 per cent or more11. This
11The grant element is the difference between the face value and the market value of a loan expressed as a percentage of the face value of the loan.
2013 Budget, Volume 1
156
is in line with international debt management practice and as recommended by the IMF and the World Bank;
(ii) A project is high priority under the Medium Term Development Plan and will not significantly increase the level of external debt above 40.0 per cent of the total debt portfolio or increase the level of Public Debt above the limit specified in the Fiscal Responsibility Act 2006;
(iii) The lender’s policies do not preclude awarding of contracts to PNG firms and/or awarding of contracts via international competitive bidding; and
(iv) There is a genuine advantage to funding the project from foreign currency loans such as the need to import foreign expertise and/or foreign materials.
In addition, where it is appropriate on a risk/return basis, the Government may borrow domestic funds to retire foreign-currency debt.
Table 67:Estimated Percentage of Foreign Currency D ebt in Public Debt Portfolio Target range
2012 2013 2014 2015 2016 2017
Up to 40 per cent
30.7% 27.1% 25.7% 28.4% 32.4% 38.4%
Source: Department of Treasury
Interest Rate Risk
Interest rate risk is the risk that debt servicing cost outcomes vary due to changes in interest rate.
Domestic debt currently issued is all fixed interest rate debt. For this debt, interest rate risk arises when Treasury seeks to refinance it when it matures. At this time there is a risk that debt servicing costs will change due to the interest rate on the new debt being higher or lower than the maturing debt. As shorter term debt is required to be refinanced more often it exposes the portfolio to increased levels of interest rate risk.
Shorter term debt however is less expensive than longer term debt and therefore there is a balance between cost and risk in the amount of short-term debt to long-term debt maintained within the portfolio.
The Debt Strategy seeks to manage interest rate risk through the structure of the domestic debt portfolio. A target mix of 15 to 30 per cent of the domestic portfolio in Treasury Bills is used to structure the portfolio over the medium term.
The 2012 end level of Treasury Bills is around 43.0 per cent of the portfolio. The build-up in Treasury Bills has resulted from the State’s deficits and cash financing needs for 2011 and 2012.
Table 68:Estimated Percentage of Treasury Bills in Domestic Debt Portfolio Target range 2012 2013 2014 2015 2016 2017 15 to 30 per cent
43.0% 34.2% 31.0% 26.7% 22.9% 12.5%
Source: Department of Treasury
Refinancing Risk
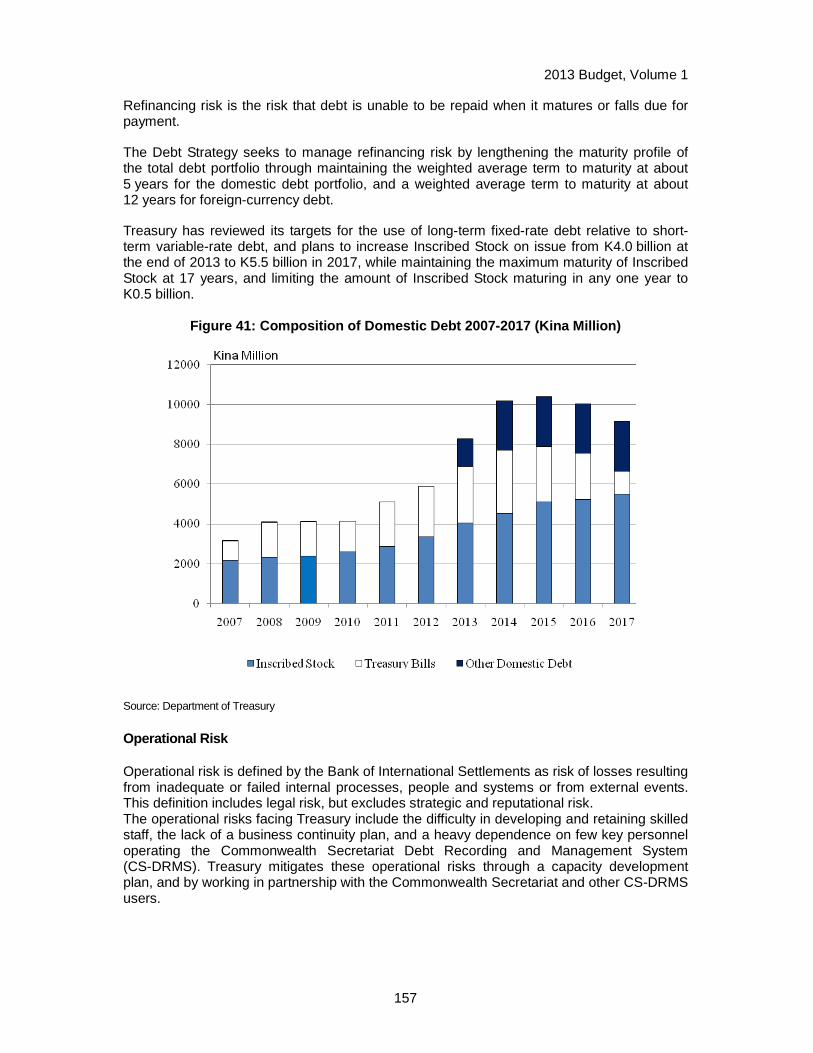
2013 Budget, Volume 1
157
Refinancing risk is the risk that debt is unable to be repaid when it matures or falls due for payment.
The Debt Strategy seeks to manage refinancing risk by lengthening the maturity profile of the total debt portfolio through maintaining the weighted average term to maturity at about 5 years for the domestic debt portfolio, and a weighted average term to maturity at about 12 years for foreign-currency debt.
Treasury has reviewed its targets for the use of long-term fixed-rate debt relative to short-term variable-rate debt, and plans to increase Inscribed Stock on issue from K4.0 billion at the end of 2013 to K5.5 billion in 2017, while maintaining the maximum maturity of Inscribed Stock at 17 years, and limiting the amount of Inscribed Stock maturing in any one year to K0.5 billion.
Figure 41: Composition of Domestic Debt 2007-2017 ( Kina Million)
Source: Department of Treasury Operational Risk
Operational risk is defined by the Bank of International Settlements as risk of losses resulting from inadequate or failed internal processes, people and systems or from external events. This definition includes legal risk, but excludes strategic and reputational risk. The operational risks facing Treasury include the difficulty in developing and retaining skilled staff, the lack of a business continuity plan, and a heavy dependence on few key personnel operating the Commonwealth Secretariat Debt Recording and Management System (CS-DRMS). Treasury mitigates these operational risks through a capacity development plan, and by working in partnership with the Commonwealth Secretariat and other CS-DRMS users.
2013 Budget, Volume 1
158
12.4 DEVELOPING DOMESTIC DEBT MARKET
Developing the domestic debt market is one of Government’s medium to long-term objectives as PNG currently has a small domestic investor base and lack of foreign investors in Kina-denominated securities.
In 2011, with the assistance of an Asian Development Bank Technical Assistance (ADB TA) on developing bond markets, Treasury was able to produce a road-map to develop the domestic debt market from 2012 onward. The road-map focuses on ensuring that PNG’s domestic financial market adequately meets the Institutional, Regulatory, Taxation and Legal requirements to facilitate domestic debt market development within the medium term. Treasury will shortly invite stakeholders to form a Bond Market Development Committee to progress bond market development.
12.5 LONGER-TERM CHALLENGES
Treasury will also continue with incremental improvements in monitoring and reviewing the Debt Strategy. Where necessary the Debt Strategy will be updated to reflect international and domestic developments relevant to PNG. Significant challenges for improving debt sustainability and management of financial risks still remain. These include:
• increases in contingent liabilities such as the IPBC’s borrowing to invest in the PNG LNG Joint Venture;
• lack of coordinated management of the State’s financial assets and liabilities;
• the impact that the PNG LNG Project will have on the size of the economy, the exchange rate and domestic financial markets; and
• a small domestic investor base and lack of foreign investors in Kina denominated securities.
Treasury has commenced reporting on significant contingent liabilities in the Debt Strategy. Furthermore, amendments to the Fiscal Responsibility Act 2006 made in 2010 require that the Government have regard to its other liabilities in considering a suitable level of debt. Treasury will continue to develop systems to monitor and report on other Government liabilities and assets.
2013 Budget, Volume 1
159
CHAPTER 13. MEDIUM TERM FISCAL STRATEGY 2013-2017
13.1 OVERVIEW
This Medium Term Fiscal Strategy (MTFS) 2013-17 has been developed at a time when the medium term outlook for the Government’s revenue remains uncertain, driven in part by the potential impact on commodity prices of ongoing turmoil in Europe and a sluggish US recovery. Domestically, there is also scope to increase taxpayer compliance to ensure a level playing field for all.
On the upside the PNG LNG project is due to commence full production in 2015, providing a significant boost to revenue, though the full benefits are not expected for a number of years.
Despite these challenges, this MTFS seeks to increase overall expenditure levels. This reflects the benefit of the work done over the last decade in reducing Government debt. The pattern is a quick "step-up" in expenditure in the first year, followed by much more moderate expenditure growth rates so as to return the budget to surplus by 2017. Expenditure quality must also be increased. This means some lower priority or wasteful expenditure will need to be cut, while high priority expenditure such as on health, education, law and order, and infrastructure, increased and made more effective. It is essential that the PNG people receive the best possible value for money for the funds that are available.
This MTFS indicates that with fiscal discipline in non-priority areas, there is scope to double nominal expenditure on health, education, infrastructure and law and order by 2017, including for key priorities such as expanding tuition fee-free education, rebuilding the Highlands Highway, expanding the police force and improving health provision. This MTFS provides a strategy for having the funds available for the priorities chosen by the Government, while maintaining macroeconomic stability. The challenge will remain ensuring other policies support growth to attain such a level of resources, as well as ensuring the funds are well spent.
To maintain the macroeconomic stability that is required for economic and social development to continue, it will be necessary to adopt specific rules to govern the Government’s fiscal decisions. The rules, set out below, are designed to be consistent with the MTFS’s Guiding Principles:
13.1.1 Expenditure
1. Increase the share of the total budget allocated to the key enablers of the Medium Term Development Plan to two thirds by 2017.
2. Improve spending agencies’ focus on expenditure effectiveness and transparency in expenditure reporting and public accountability.
13.1.2 Revenue
1. Maintain equitable taxation regimes with a focus on compliance.
2. Restrict taxation exemptions and special arrangements.
2013 Budget, Volume 1
160
13.1.3 Debt
1. Maintain a gross Government debt12 to GDP ratio of less than 30.0 per cent, apart from in 2013 and 2014, when it will not exceed 35.0 per cent.
2. Limit gross Government liabilities13 to less than 60.0 per cent of GDP.
3. Greatly increase the Government’s average debt maturity profile14.
13.1.4 Deficits
1. Ensure a return to surplus by the end of the MTFS period in 2017.
13.2 REPORTING
Government performance against each of these rules will be reported on in the Annual Budget and associated documents.
13.3 GUIDING PRINCIPLES
The guiding principles for PNG’s MTFS 2013-2017 are as follows:
• Maintain macroeconomic stability by providing stable and prudent fiscal arrangements, which are critical for sustained job creation and development;
• Support an increase in the share of public expenditure going to the key Medium Term Development Plan enablers, including education, health, infrastructure, and law and order;
• Provide a framework to help address the development needs of Papua New Guinea through a better and more sustainable provision of services and strong broad based economic growth; and
• Ensure that revenue collection is maintained to support development and macroeconomic stability objectives.
Consistent with these principles, this MTFS adapts to the significant changes that have occurred over the last decade, as well as responds to future challenges.
13.4 KEY CHALLENGES FOR THE 2013-2017 MTFS
Implementing an appropriate fiscal policy which maintains macroeconomic stability as well as supports broad based economic growth is a considerable challenge during a period of sluggish revenue growth and global economic uncertainty.
12 Includes all Government debts apart from Superannuation. Excludes contingent liabilities such as guarantees.
13 Gross Government liabilities include gross Government debt, superannuation as well as explicit Government guarantees, including for the SOE sector, though excludes the PNG LNG guarantee due to its near completion.
14 That is, reduce the portion of the debt that is required to be refinanced in any given year.
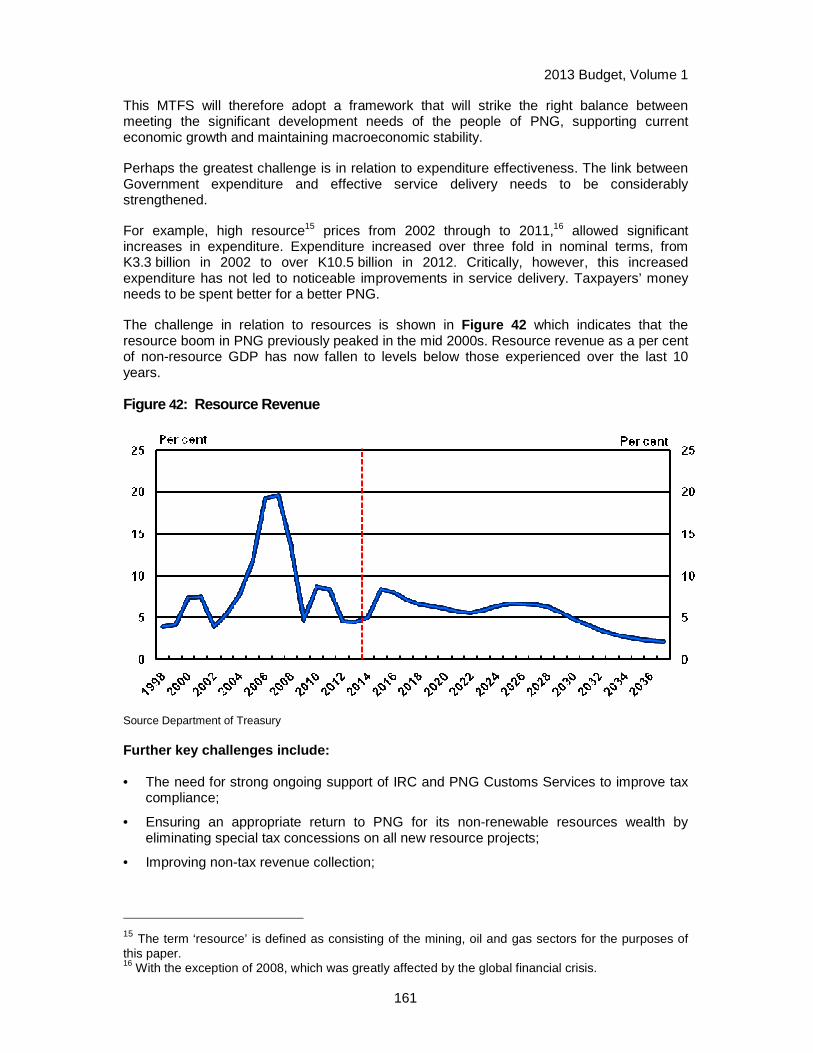
2013 Budget, Volume 1
161
This MTFS will therefore adopt a framework that will strike the right balance between meeting the significant development needs of the people of PNG, supporting current economic growth and maintaining macroeconomic stability.
Perhaps the greatest challenge is in relation to expenditure effectiveness. The link between Government expenditure and effective service delivery needs to be considerably strengthened.
For example, high resource15 prices from 2002 through to 2011,16 allowed significant increases in expenditure. Expenditure increased over three fold in nominal terms, from K3.3 billion in 2002 to over K10.5 billion in 2012. Critically, however, this increased expenditure has not led to noticeable improvements in service delivery. Taxpayers’ money needs to be spent better for a better PNG.
The challenge in relation to resources is shown in Figure 42 which indicates that the resource boom in PNG previously peaked in the mid 2000s. Resource revenue as a per cent of non-resource GDP has now fallen to levels below those experienced over the last 10 years.
Figure 42: Resource Revenue
Source Department of Treasury
Further key challenges include:
• The need for strong ongoing support of IRC and PNG Customs Services to improve tax compliance;
• Ensuring an appropriate return to PNG for its non-renewable resources wealth by eliminating special tax concessions on all new resource projects;
• Improving non-tax revenue collection;
15 The term ‘resource’ is defined as consisting of the mining, oil and gas sectors for the purposes of this paper. 16 With the exception of 2008, which was greatly affected by the global financial crisis.

2013 Budget, Volume 1
162
• Establishing and strengthening expenditure control measures to improve spending effectiveness;
• Providing greater certainty of funding and improved transparency by adopting multi-year budgeting;
• Modernising Budget reporting by adopting modern Government Finance Statistics (GFS 2001); and
• Integrating the Recurrent and Development Budget s into a single National Budget.
BOX 2: PREVIOUS MEDIUM TERM FISCAL STRATEGIES
The first Medium Term Fiscal Strategy 2002-2007 was designed to help end a serious economic and financial crisis. This crisis was caused by very large budget deficits; high and unsustainable levels of public debt; high inflation; and poor expenditure effectiveness.
The first MTFS provided a fiscal consolidation framework that progressively reduced the large budget deficit and moved the budget into a sustainable position and consequently reduced debt significantly thereby greatly improving macroeconomic stability within the economy (see Figure 43).
Figure 43: Government Fiscal Performance: 2000 - 2011
Source: Department of Treasury
The second Medium Term Fiscal Strategy 2008-2012, was framed amid expectations of high revenue as a result of unusually high commodity prices. It provided a sound framework for fiscal and macroeconomic stability over this period by managing the highly volatile resources revenue, while allowing for significant increases in development expenditure.
Notably, the MTFS 2008-2012 was critical in allowing PNG to successfully navigate the global financial crisis and the subsequent volatility in the international economy, through a significant reduction in debt levels. Without the creation of the ‘fiscal space’ that this debt reduction created, PNG could have suffered the same ongoing financial and social turmoil that has affected many countries in Europe and elsewhere.
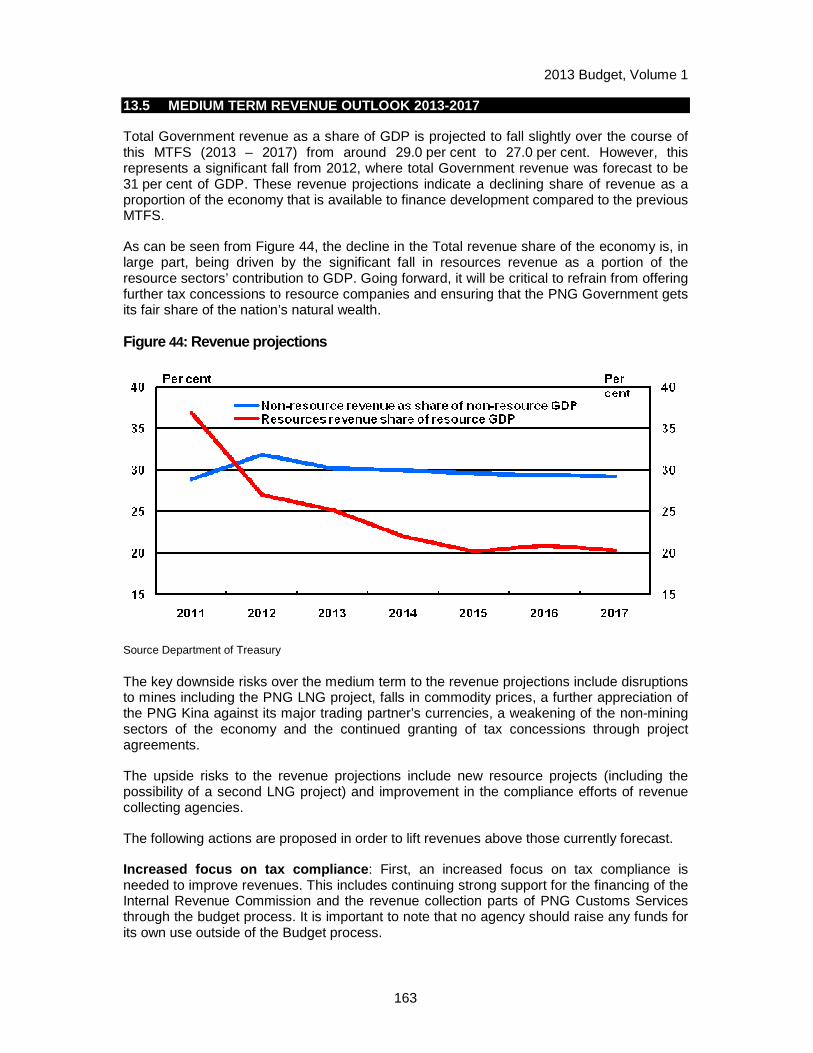
2013 Budget, Volume 1
163
13.5 MEDIUM TERM REVENUE OUTLOOK 2013-2017
Total Government revenue as a share of GDP is projected to fall slightly over the course of this MTFS (2013 – 2017) from around 29.0 per cent to 27.0 per cent. However, this represents a significant fall from 2012, where total Government revenue was forecast to be 31 per cent of GDP. These revenue projections indicate a declining share of revenue as a proportion of the economy that is available to finance development compared to the previous MTFS.
As can be seen from Figure 44, the decline in the Total revenue share of the economy is, in large part, being driven by the significant fall in resources revenue as a portion of the resource sectors’ contribution to GDP. Going forward, it will be critical to refrain from offering further tax concessions to resource companies and ensuring that the PNG Government gets its fair share of the nation’s natural wealth.
Figure 44: Revenue projections
Source Department of Treasury
The key downside risks over the medium term to the revenue projections include disruptions to mines including the PNG LNG project, falls in commodity prices, a further appreciation of the PNG Kina against its major trading partner’s currencies, a weakening of the non-mining sectors of the economy and the continued granting of tax concessions through project agreements.
The upside risks to the revenue projections include new resource projects (including the possibility of a second LNG project) and improvement in the compliance efforts of revenue collecting agencies.
The following actions are proposed in order to lift revenues above those currently forecast.
Increased focus on tax compliance : First, an increased focus on tax compliance is needed to improve revenues. This includes continuing strong support for the financing of the Internal Revenue Commission and the revenue collection parts of PNG Customs Services through the budget process. It is important to note that no agency should raise any funds for its own use outside of the Budget process.
2013 Budget, Volume 1
164
Review of Taxation: Second, a review of PNG's tax system is overdue. Funding is being provided in the 2013 Budget for the first stage of the review which will focus on the appropriateness of current resource tax arrangements.
Review non-tax fees and charges : Third, the current review of non-tax fees and charges in order to update them in line with modern charging structure and pricing levels is greatly needed, as many have not been revised in a number of decades. Improved compliance with existing fees and charges is also a key objective of the overall review process.
Improve the integrity of the tax base : Fourth, improving the integrity of the tax base is needed to reverse the fall in resource revenues, as shown in Figure 44. The tax system is severely compromised when concessions are provided to specific projects or taxpayers:
• The use of project agreements to create special tax arrangements for individual projects has encouraged a wide range of investors to seek a growing list of additional tax concessions, even when forms of tax relief are already provided by tax law for investors in the type of business involved;
• Project agreements containing project specific tax concessions have created an uneven playing field on which businesses have to operate;
• The PNG LNG project concessions were based on a first mover basis for this particular industry and should not be used as a benchmark for future projects; and
• Often the concessions sought are difficult to cost, but in many cases they have the effect of depriving the Government of significant amounts of revenue.
It is current Government policy that entities should access generic tax concessions available to industries or companies, rather than providing individual exemptions for each company. Standard project documentation will be used to help achieve this and a template for oil and gas has nearly been completed. This would ensure equitable treatment of projects in each sector, and transparency in tax policy. The assurance of equitable treatment for all investors would encourage further investment in the country.
Our tax system needs to remain robust with regard to the mining industry so to avoid depriving our economy of significant amounts of revenue.
13.5.1 Revenue rules:
1. Maintain equitable taxation regimes with a focus on compliance.
2. Restrict taxation exemptions and special arrangements.
13.6 MACROECONOMIC STABILITY
Macroeconomic stability is a necessary requirement for ongoing economic growth and the achievement of economic development outcomes. Countries with a stable economy give businesses the confidence to make long term investments and thereby create the jobs that help lift people out of poverty. It also provides Government with the steady revenue base it needs to fund the services that improve development outcomes.
A lack of macroeconomic stability – often caused by excessive Government debt and deficits – leads to job losses, a decline in standards of living and a collapse in Government tax revenue and services. PNG experienced a similar situation in the 1990’s and early 2000’s
2013 Budget, Volume 1
165
when excessive Government borrowing over a number of years led to an economic crisis that left PNG much poorer and with a debt burden that took a decade to substantially reduce. The need to repay this debt and the very high associated interest payments meant that much needed Government development expenditure was not available.
To avoid a repeat of this situation it will be important to keep debt at prudent levels over the medium-term and to keep inflation at moderate levels.
The Central Bank’s maintenance of stable, low inflation will also continue to play a critical role in anchoring low inflationary expectations going forward and in underpinning private sector investment.
High inflation must be curtailed as it undermines people’s standard of living as well as creating damaging macroeconomic instability. A failure to control inflation potentially undermines confidence in the entire country’s economic future.
13.6.1 Debt
The PNG Government must manage debt responsibly. This means controlling the level of Government debt, its maturity profile, and the risks of different sources of debt (such as exchange rate risk for foreign debt). Control of debt must also take account of possible calls on the PNG people to repay non-debt obligations, such as guarantees made by government to private or government companies. Fundamental to avoiding a debt crisis is ensuring that the Government has pro-growth policies that recognise the fundamental importance of the private sector in helping grow the economy.
The MTFS proposes anchoring Government debt to GDP at the current rate of 30.0 per cent contained in the Papua New Guinea Fiscal Responsibility Act 2006. Although initially it will exceed this level given the planned "step-up" in development expenditure, it will only be on a temporary basis (for 2013 and 2014). Keeping Government debt at a sustainable level is in line with obligations to consider the interests of future generations, whom should not be left with high levels of debt, as well as continued investor confidence in the PNG economy, which is important for broad based growth.
On current estimates, the proposed Government debt to GDP in 2014 is expected to drop significantly in 2015 to back under the usual 30.0 per cent limit. This is driven by strong revenue growth from the resource sector, planned restraint in Government expenditure, and the impact of a substantially higher GDP base with the commencement of the PNG LNG project. This debt level is expected to reduce further as a share of GDP so that by 2017, it will return to almost the same rate as 2012.
It should be noted, though, that this debt limit does not include the money the Government owes in superannuation payments (K2.1 billion) or contingent liabilities, such as Government guarantees. To account for these other types of debts and liabilities and the significant risks that come with them, the MTFS also places a maximum limit on total liabilities of 60 per cent of GDP.
These two debt rules will require modifications to the Papua New Guinea Fiscal Responsibility Act 2006.
2013 Budget, Volume 1
166
It will also be important to lengthen the Government’s debt maturity profile so as to reduce ‘roll over’ risk17 should a recession or other adverse shock occur in the future.
13.6.2 Debt rules:
1. Maintain a gross Government debt to GDP ratio of less than 30.0 per cent, apart from in 2013 and 2014, when it will not exceed 35.0 per cent.
2. Limit gross Government liabilities to less than 60.0 per cent of GDP.
3. Greatly increase the Government’s average debt maturity profile.
BOX 3: Sovereign Wealth Fund
A significant change from the previous MTFS is that PNG has now passed an Organic Law which establishes the PNG Sovereign Wealth Fund (PNG SWF). The PNG SWF includes a Stabilisation Fund, the deposit and withdrawal rules for which, effectively replace the "excess minerals revenue" rules of the last MTFS. The PNG SWF is consistent with international best practice as it will be on-shore managed, with investments made offshore to minimise "Dutch Disease" impacts. All funds (including earnings) will be on-shore spent.
Its overall design intention is to buffer PNG from the high price volatility experienced in the mining sector, in particular the impact of this volatility on the exchange rate and Government budgets. It also ensures that over time the Government has the access it needs to the revenues it is receiving from the mining sector.
It will do this by having all mining revenues deposited into the Stabilisation Fund. This Stabilisation Fund will then transfer to the Government’s annual Budget an amount not exceeding the 15 year moving average of resources revenue as a share of non-resources revenue.
This means that in any given year if commodity prices and associated revenues are exceptionally high, the PNG SWF will accumulate funds. If they are below the 15 year moving average rule, then all the mining revenue for that year, as well as potentially some of the saved balances from previous years, will be paid into the Budget. On average, there will be no overall accumulation of funds within the Stabilisation Fund. Any funds accumulated in years of very strong resource revenues are expected to be fully disbursed in years of low resource revenues.
As the SWF will commence at a time of relatively low resource revenues, no funds are expected to accumulate until after the end of this MTFS 2013-2017 based on current estimates. However, even a slight increase in prices or volumes would probably lead to some initial accumulations as early as 2015 and 2016, with possible withdrawals in 2017
A second component of the PNG SWF will be the Development Fund. It will accumulate revenues allocated out of the Budget, equal at a minimum to the expected average PNG LNG dividends. The Budget will also allocate how the Development Fund is spent each year. The Priority Nation Building Infrastructure package in the 2013 Budget exceeds the expected minimum contributions required.
17 ‘Roll over risk’ occurs when refinancing is temporarily unavailable to refinance existing stocks of debt. This could occur if there problems in wholesale funding market, perhaps as a result of some future domestic or global banking sector difficulties.
2013 Budget, Volume 1
167
The PNG SWF drawdown rules have been developed to support both the Government’s development and external investment objectives. Given the importance of ensuring that mining and petroleum corporate taxes (including dividends) are accounted for in a transparent and coordinated manner, the net revenues will be reported in the Budget, with the allocation of drawdowns from the PNG SWF being considered by the Government in the Budget process.
13.6.3 Expenditure
There are clear and substantial pressures on the PNG Government to provide improved facilities, infrastructure and services.
The MTFS allows for an increased ability to deliver the Medium Term Development Plan (MTDP) 2011-2015 and the PNG Development Strategy Plan 2030. The MTDP focuses on the following key priority development enablers:
• Unlocking land for development;
• Improving law, order and justice;
• Establishing quality national transport corridors that connect rural population to markets and services;
• Higher and technical education to redress the severe skills shortage within PNG’s labour force;
• Universal access to quality primary and secondary education;
• Improving health outcomes; and
• Provision of key utilities such as electricity, clean water and sanitation and communications.
In recent years, the share of the overall budget allocated to these MTDP enablers has fallen to just over half the budget. The MTFS targets an improvement in the allocative efficiency of the budget by lifting the share going to the MTDP enablers to reach two-thirds by 2017.
The increased share of the budget going to the MTDP enablers provides a large resource envelope for meeting new commitments in areas such as education, health, infrastructure and law and order. This should provide sufficient funds to meet the new Government's key priority commitments in these areas (see Box 4 and Figure 45 below).
However, changing the focus of the Budget towards the MTDP enablers has significant implications for other parts of the Budget. Non-MTDP enabler elements of the Budget will face significant spending limits - in aggregate, essentially maintaining current nominal levels of expenditure which represent cuts in real terms.
Rather than simply applying uniform cuts to all non-MTDP enabler expenditure, there will be a need to examine which areas should continue to receive support, and those areas for which support should be reduced.
The Government should also ensure that private sector capacity developed over a decade of growth is used, where appropriate, to supply public services to further enhance the effectiveness of Government expenditure.

2013 Budget, Volume 1
168
13.6.4 Expenditure rules :
1. Increase the share of the total budget allocated to the key enablers of the Medium-Term Development Plan to two thirds by 2017. 2. Improve spending agencies’ focus on expenditure effectiveness and transparency in
expenditure reporting and public accountability.
BOX 4: Implications of the Expenditure Rules
The expenditure rules will allow for a very significant increase in funding for the key MTDP enablers of health, education, infrastructure and law and order. These are estimated to be able to double between 2012 and 2017, from around K5.0 billion to around K10.0 billion.
This large increase in expenditure in these key areas should provide scope to fund the Government's key priorities. The planned increase in expenditure is shown as the growth in the green (top) part of Chart 4. By 2017, an extra K5.0 billion will be available annually for the MTDP enablers. This extra funding, over and above existing expenditure levels, is expected to be sufficient to cover expanding tuition fee-free education, building the Highlands Highway, expanding the police force and improving health provision by 2017.
Along with this planned significant increase in funding for the key MTDP enabler areas is the need to support effective expenditure which actually leads to better service delivery. There is also a need to improve transparency of this expenditure and stronger systems of public accountability.
Figure 45: Increased Funding to MTDP Enablers
This growth in MTDP enablers expenditure is also only possible if other lower priority areas of expenditure are strongly controlled. The non-MTDP enablers will have declining nominal growth between 2012 and 2017. This is shown by the declining size of the red (bottom) part of Figure 45 . This will require strong leadership decisions to reduce wastage and

2013 Budget, Volume 1
169
duplication. At the same time, some of the non-MTDP areas will require funding increases (such as the IRC and PNG Customs Services as part of the approach in this MTFS to improve revenue compliance). Overall, it will be a green 'go' for the enablers, and red 'stop' for the non-MTDP enablers.
13.6.5 Deficits
The determination of an appropriate budget balance requires several judgements. This involves balancing the urgency of development needs with potential risks to inflation and other elements of macroeconomic stability. Key considerations include the quality of the expenditure, the availability of financing at reasonable rates, and the impact on debt sustainability. A short period of significant deficits with a clear and credible strategy to return to surplus can help minimise any risk arising from deficits.
Additionally, the overall impact of any future deficits will depend strongly on the rate of economic growth and what available spare capacity exists in the economy. A period of lower growth, for example in 2013 and 2014, may allow for larger deficits, without causing significant impacts such as an excessive increase in inflation.
As noted above, an important consideration for judging the economic impact of a deficit is the type and quality of the expenditure. Higher quality expenditure on infrastructure, while initially increasing inflation, may place downward pressure on inflation in the medium term once projects are completed. Deficit financed expenditure on public sector wages without corresponding productivity increases, or payments to special interest groups, would both be expected to place strong upward pressure on inflation.
The 2013 Budget sets out a medium term fiscal approach of taking a large "step-up" in providing funding for key areas such as education, health, infrastructure and law and order. Expenditure in these areas is expected to increase by 50.0 per cent between 2012 and 2013 and more than double from K5.0 billion in 2012 to K10.0 billion in 2017.
Combined with the expected slow-down in revenues in 2013 and 2014, such a multi-year fiscal approach entails a significant deficit of around 7.0 per cent of GDP in 2013, but then returning to surplus by 2017. Maintaining high levels of growth as in 2013, or in continuing large deficits on an on-going basis, is recognised as being unsustainable.
For example, if deficits continued at 7.0 per cent for the next five years, the Government Debt to GDP ratio would climb to be close to 50.0 per cent of GDP, inflationary expectations would continue to build, the share of the budget simply going into repaying debt would continue to increase, interest costs would be expected to increase, the balance of payments would be adversely affected by the strong drawing in of imports, and there could be downward pressure on the Kina.
With the historic shift to sub-national Governments already undertaken in 2013, and rapidly growing funding already set aside for major investments in key infrastructure activities, and the key Government commitments of Alotau being covered including the extension of tuition fee free education and free basic health care, there is the opportunity to maintain the new higher level of expenditure without further significant growth.
If revenue forecasts prove stronger than expected at the time of launching of this MTFS, there may be the opportunity to lift expenditure further. However, on balance, with funding for key parts of the Government's agenda already put in place, it is responsible to return to a surplus by 2017. Continued real growth in the areas of education, health, infrastructure, law and order and unlocking land will then be supported by the MTFS rule to lift the share of these key areas to at least two-thirds of Government expenditure by 2017.
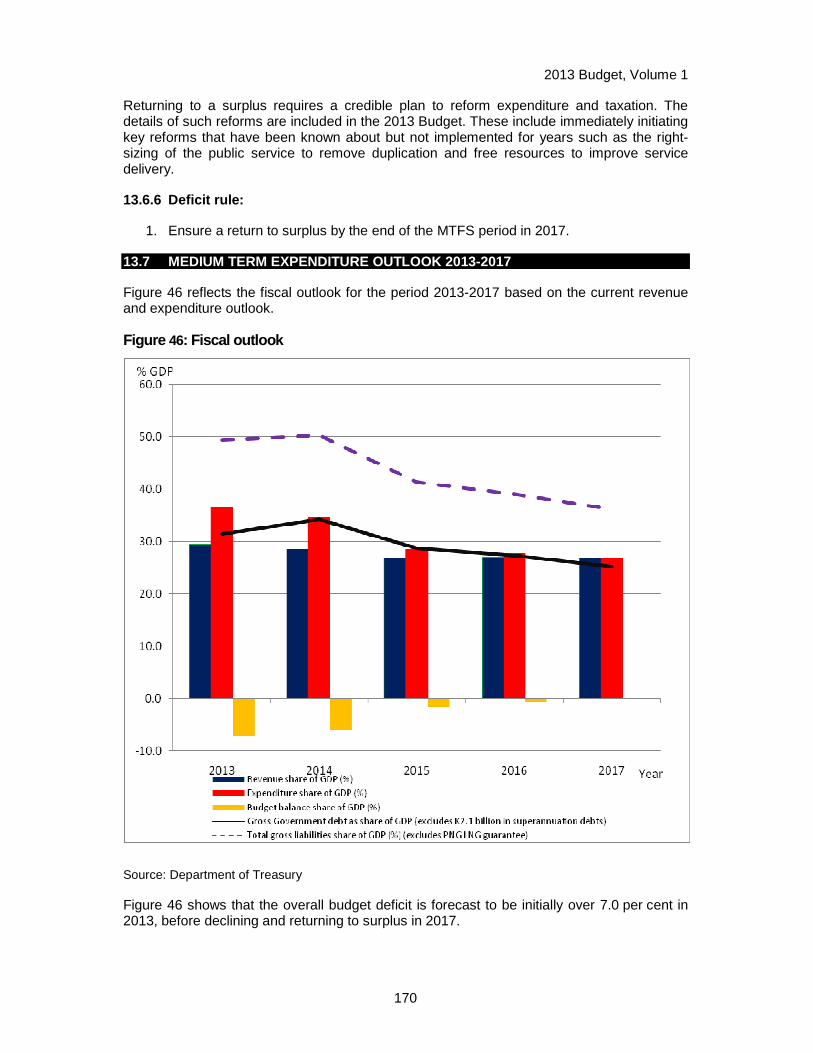
2013 Budget, Volume 1
170
Returning to a surplus requires a credible plan to reform expenditure and taxation. The details of such reforms are included in the 2013 Budget. These include immediately initiating key reforms that have been known about but not implemented for years such as the right-sizing of the public service to remove duplication and free resources to improve service delivery.
13.6.6 Deficit rule:
1. Ensure a return to surplus by the end of the MTFS period in 2017.
13.7 MEDIUM TERM EXPENDITURE OUTLOOK 2013-2017
Figure 46 reflects the fiscal outlook for the period 2013-2017 based on the current revenue and expenditure outlook.
Figure 46: Fiscal outlook
Source: Department of Treasury
Figure 46 shows that the overall budget deficit is forecast to be initially over 7.0 per cent in 2013, before declining and returning to surplus in 2017.
2013 Budget, Volume 1
171
13.8 HIGH PRIORITY REFORMS
To support the principles outlined earlier, and to improve the effectiveness of public expenditure and accountability, three other high priority reforms are incorporated into this MTFS.
13.8.1 Multi-year Budgeting
The implementation of multi-year budgeting during the course of this MTFS will be important to enhance the ability of the Government and its agencies to plan expenditure over time as well as to give individual departments the ability to better manage their budget allocations from year to year.
A key example of where multi-year budgeting will lead to better expenditure decisions is in the case of infrastructure construction projects that take longer than a year to implement. In this case the Government will be able to clearly see the cost over a number of years of each project as well as the associated ongoing maintenance cost. It allows for the proper design, costing and then provision of funding to priority projects.
A move to multi-year budgeting can also help deal with the annual end-of-year surge in expenditure where agencies simply spend money to avoid losing it. Options such as a modest level of carry-over will be considered to help to create better incentives for effective spending.
13.8.2 Adopting the 2001 Government Financial Stati stics (GFS)
Currently, the Government uses the guidelines of the 1986 Government Finance Statistics Manual in the compilation of statistics on the finances of the Government.
The 2001 GFS system replaces the 1986 GFS system. The 2001 GFS system is designed to provide statistics which best enable policymakers and Government to analyse government operations and their effect on the economy, to implement appropriate fiscal policies, and to compare PNG’s performance with other countries. As well as improving PNG’s ability to implement fiscal policy, adoption of the 2001 GFS system is required by all members of the International Monetary Fund.
The shift to the 2001 GFS during the course of this MTFS will lead to some changes in how the Government reports expenditure. Currently, funds are considered spent simply if it is placed in a trust account. Going forward, the funds will only be counted for expenditure purposes when they are actually used for the agreed purpose. This will improve public accountability as reporting should be more closely aligned with actual delivery of services.
13.8.3 Integration of the Recurrent and Development Budget s
One of the original purposes behind the establishment of separate Recurrent and Development Budget was to try and ensure that a greater share of expenditure went into sectors deemed to be of the most benefit for development.
The reality has been that both the Recurrent and the Development Budget s devote money to the Medium Term Development Plan enablers:– health; education; infrastructure; law and order; and land reform. Indeed, in 2012, and estimated two-thirds (or 66.0 per cent) of GoPNG expenditure in these key areas were made through the "Recurrent" Budget.
The integration of the Recurrent and Development Budget s will allow the Government to see more accurately how much money is going to the MTDP enablers – and therefore

2013 Budget, Volume 1
172
increase this where required. It will also better identify areas of wasteful or lower priority expenditure which could be reallocated and permit the full costs of projects (capital and recurrent) to be seen more clearly
Budget processes for approving new expenditure or cutting underperforming areas will also be much smoother and integration will allow a greater ability for the Government to compare the performance of existing programs or different bids for new expenditure.
During 2013, action will be taken to fully integrate the two budgets so that the Government's 2014 Budget will be the country's first fully integrated National Budget.

2013 Budget, Volume 1
173
CHAPTER 14. IMPLEMENTATION OF PNG SOVEREIGN WEALTH FUND
14.1 OVERVIEW
Although Papua New Guinea (PNG) continues to enjoy solid economic growth, there are a number of long term risks that the Government wishes to guard against. One important risk is that caused by the impact that the great variation in revenue from mining, oil and gas has on the economy and on Government revenue. Without a stabilisation mechanism, this variation in revenue would lead to a reduced ability for the Government to maintain stable program expenditures.
A further risk is that posed by the impact that the PNG Liquefied Natural Gas (LNG) project may have on the exchange rate, and therefore, on domestic exporters or import competing industries. This phenomenon, known as ‘Dutch disease’, occurs when a very large amount of exports in one industry, places upward pressure on the exchange rate. The higher exchange rate, in turn, makes other exporters less competitive, as the amount a foreign buyer must pay goes up. A higher exchange rate also makes imports cheaper making it harder for domestic producers of that same good to compete.
The Government is also mindful of the risk that any sudden large increases in expenditure, driven by expectations of future revenue from the PNG LNG project, is likely to have on domestic inflation and therefore PNG’s macroeconomic stability.
To mitigate these risks, the Government has begun the establishment of an offshore Sovereign Wealth Fund (PNG SWF). The Sovereign Wealth Fund Organic Law, which sets out the PNG SWF governance and drawdown arrangements, was enacted by Parliament in February 2012. Further elements of the PNG SWF operation will be contained in forthcoming subordinate legislations.
14.2 KEY FEATURES OF PNG SWF
The PNG SWF is designed to manage mining and petroleum revenues and dividends, including revenues from the PNG LNG project. The overall objectives of the PNG SWF are to support:
i) macroeconomic stabilisation;
ii) the development objectives of the Government including long-term economic and social development; and
iii) asset management in relation to financial assets accrued from natural resource revenue and dividends.
The PNG SWF consists of a Stabilisation Fund and a Development Fund. The purpose of the Stabilisation Fund is to manage the impact of fluctuating mineral and petroleum revenues on the PNG Economy and on the Budget, while the purpose of the Development Fund is to provide a definite and ongoing funding source for the provision of development in key economic and social priorities in accordance with the Budget.
The key features of the PNG SWF can be summarised as:
• A single governance framework to manage the Development Fund and the Stabilisation Fund.
• Onshore management, offshore investment and onshore expenditure of the funds.
2013 Budget, Volume 1
174
• Full integration with the budget and fiscal framework.
• Governance, transparency, disclosure, accountability and asset management rules based on international best practice and the PNG SWF's own internal principles and practices.
• Deposit and withdrawal rules to ensure prudent macroeconomic management.
• Deposit to and withdrawals from the funds are in compliance with the Organic Law.
• Oversight by an independent board located within Papua New Guinea mandated to act in the best interests of the PNG SWF.
• Investments policies and guidelines that achieve an acceptable risk return trade-off and are consistent with the objectives and investment mandate provided by the Government.
• Investment primarily in foreign assets and restrictions on purchasing Papua New Guinea Government debt or investing or direct lending domestically.
One key features of PNG SWF is that while investments are undertaken by an independent Board the State will retain ownership of its assets. Lessons learnt from past experience have led to the PNG SWF being fully integrated into the budget to manage government spending and the economy. This is to ensure that all revenues (including dividends) from the PNG LNG project, as well as from other mineral and petroleum projects, and the timing of all expenditures can be most effectively used to advance PNG’s social and economic development. These processes can also help ensure funds are acquited and managed in a transparent and coordinated manner.
Any investment carries risk, therefore mechanisms have been put in place in the Organic Law to minimise this. Firstly, the members of the independent Board will be selected for their skill and experience in investments or corporate governance. The Government will provide the Board with an Investment Mandate specifying the acceptable risk profile for the Board’s investments. Under the Organic Law, the Board may make its investments through external fund managers. Finally, the establishment of an Independent Probity Auditor will provide an added layer of transparency and oversight to the PNG SWF.
The PNG SWF aims to ensure PNG’s natural resource revenues are well managed and support the economy and future development of our nation as envisaged in the PNG development strategies: the PNG Vision 2050; the 2010 – 2030 PNG Development Strategic Plan; and the current Medium Term Development Plan. Nearly 40 nations around the world have Sovereign Wealth Funds and it is time for Papua New Guinea to also benefit from this well established practice of managing resource wealth.
14.2.1 Expected revenue flows to PNG SWF
The PNG LNG project is a major development for PNG. Many people have described it as transformative. However, the expected level of gains from the PNG LNG must be placed in perspective. The impact on the rest of the economy from simply turning on the gas pipeline is much more limited. Relatively few on-going jobs will be created. The main positive impact on the rest of the economy will be through the taxation of the project and the dividend stream that the Government and landowners will receive. Over the next five years much of this revenue will simply replace expected declines from other mines such as Ok Tedi as well as declining production in the Kutubu oil fields.
Figure 47 Shows the forecast nominal revenue accrui ng to the Government as a result of the PNG LNG project .
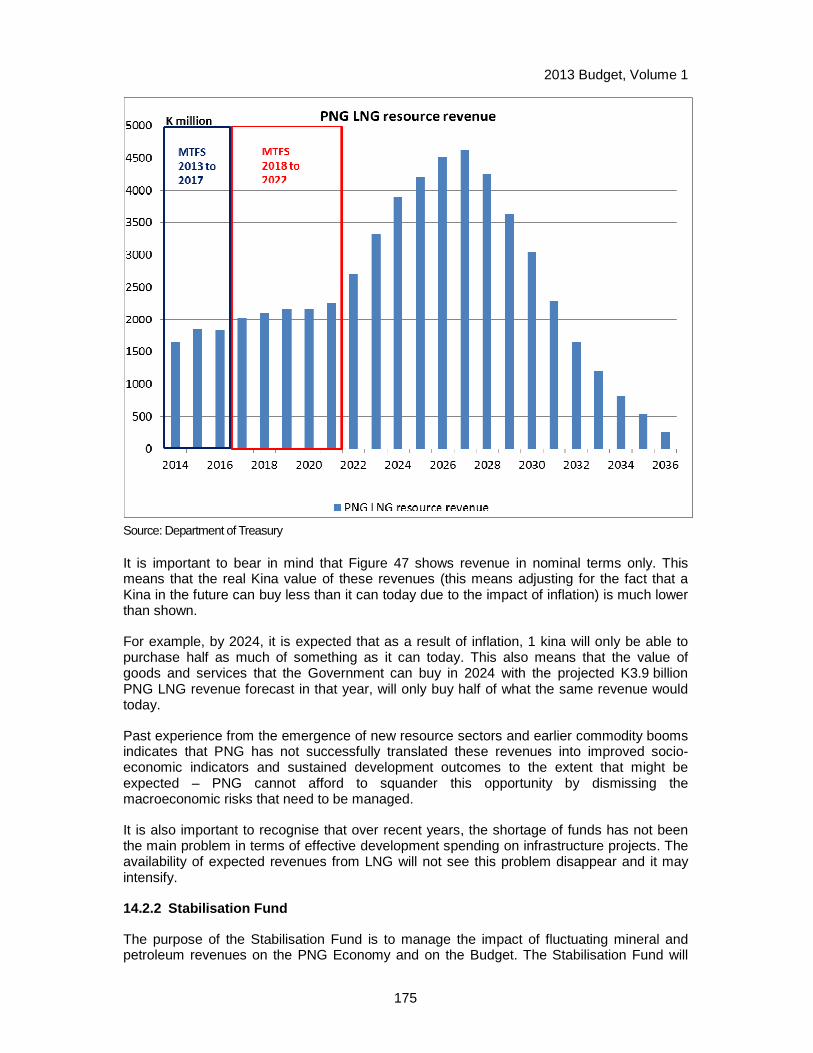
2013 Budget, Volume 1
175
Source: Department of Treasury
It is important to bear in mind that Figure 47 shows revenue in nominal terms only. This means that the real Kina value of these revenues (this means adjusting for the fact that a Kina in the future can buy less than it can today due to the impact of inflation) is much lower than shown.
For example, by 2024, it is expected that as a result of inflation, 1 kina will only be able to purchase half as much of something as it can today. This also means that the value of goods and services that the Government can buy in 2024 with the projected K3.9 billion PNG LNG revenue forecast in that year, will only buy half of what the same revenue would today.
Past experience from the emergence of new resource sectors and earlier commodity booms indicates that PNG has not successfully translated these revenues into improved socio-economic indicators and sustained development outcomes to the extent that might be expected – PNG cannot afford to squander this opportunity by dismissing the macroeconomic risks that need to be managed.
It is also important to recognise that over recent years, the shortage of funds has not been the main problem in terms of effective development spending on infrastructure projects. The availability of expected revenues from LNG will not see this problem disappear and it may intensify.
14.2.2 Stabilisation Fund
The purpose of the Stabilisation Fund is to manage the impact of fluctuating mineral and petroleum revenues on the PNG Economy and on the Budget. The Stabilisation Fund will
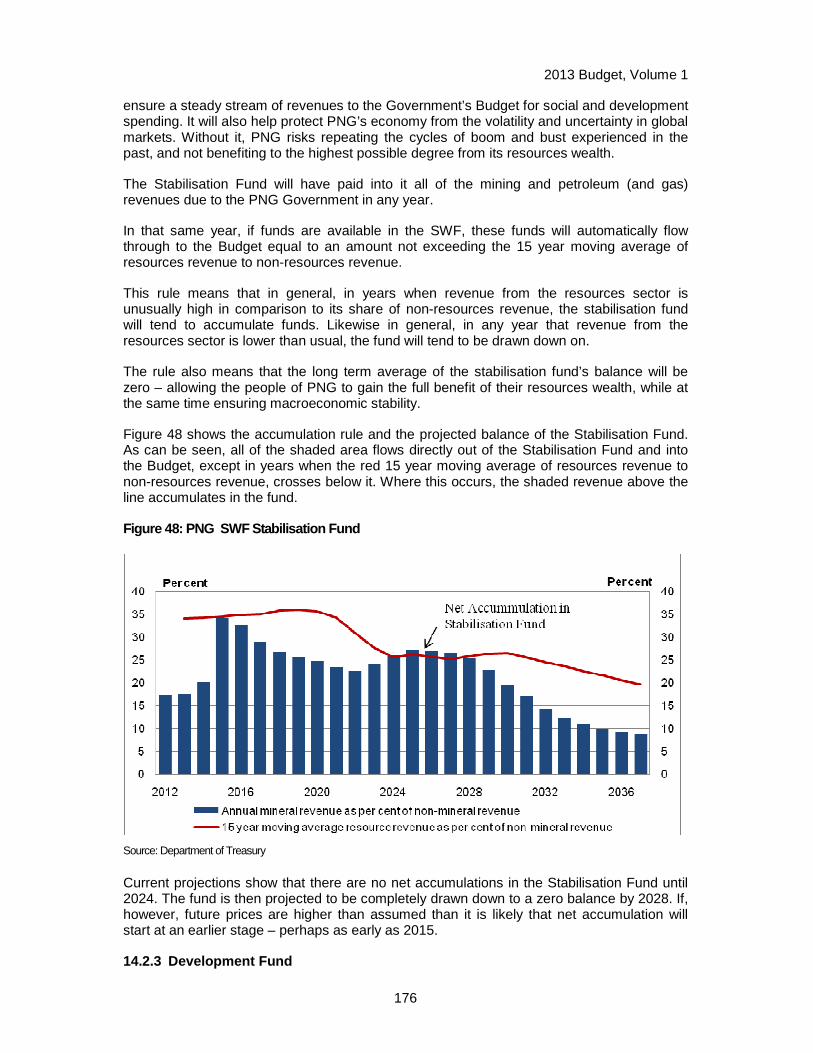
2013 Budget, Volume 1
176
ensure a steady stream of revenues to the Government’s Budget for social and development spending. It will also help protect PNG’s economy from the volatility and uncertainty in global markets. Without it, PNG risks repeating the cycles of boom and bust experienced in the past, and not benefiting to the highest possible degree from its resources wealth.
The Stabilisation Fund will have paid into it all of the mining and petroleum (and gas) revenues due to the PNG Government in any year.
In that same year, if funds are available in the SWF, these funds will automatically flow through to the Budget equal to an amount not exceeding the 15 year moving average of resources revenue to non-resources revenue.
This rule means that in general, in years when revenue from the resources sector is unusually high in comparison to its share of non-resources revenue, the stabilisation fund will tend to accumulate funds. Likewise in general, in any year that revenue from the resources sector is lower than usual, the fund will tend to be drawn down on.
The rule also means that the long term average of the stabilisation fund’s balance will be zero – allowing the people of PNG to gain the full benefit of their resources wealth, while at the same time ensuring macroeconomic stability.
Figure 48 shows the accumulation rule and the projected balance of the Stabilisation Fund. As can be seen, all of the shaded area flows directly out of the Stabilisation Fund and into the Budget, except in years when the red 15 year moving average of resources revenue to non-resources revenue, crosses below it. Where this occurs, the shaded revenue above the line accumulates in the fund.
Figure 48: PNG SWF Stabilisation Fund
Source: Department of Treasury
Current projections show that there are no net accumulations in the Stabilisation Fund until 2024. The fund is then projected to be completely drawn down to a zero balance by 2028. If, however, future prices are higher than assumed than it is likely that net accumulation will start at an earlier stage – perhaps as early as 2015.
14.2.3 Development Fund
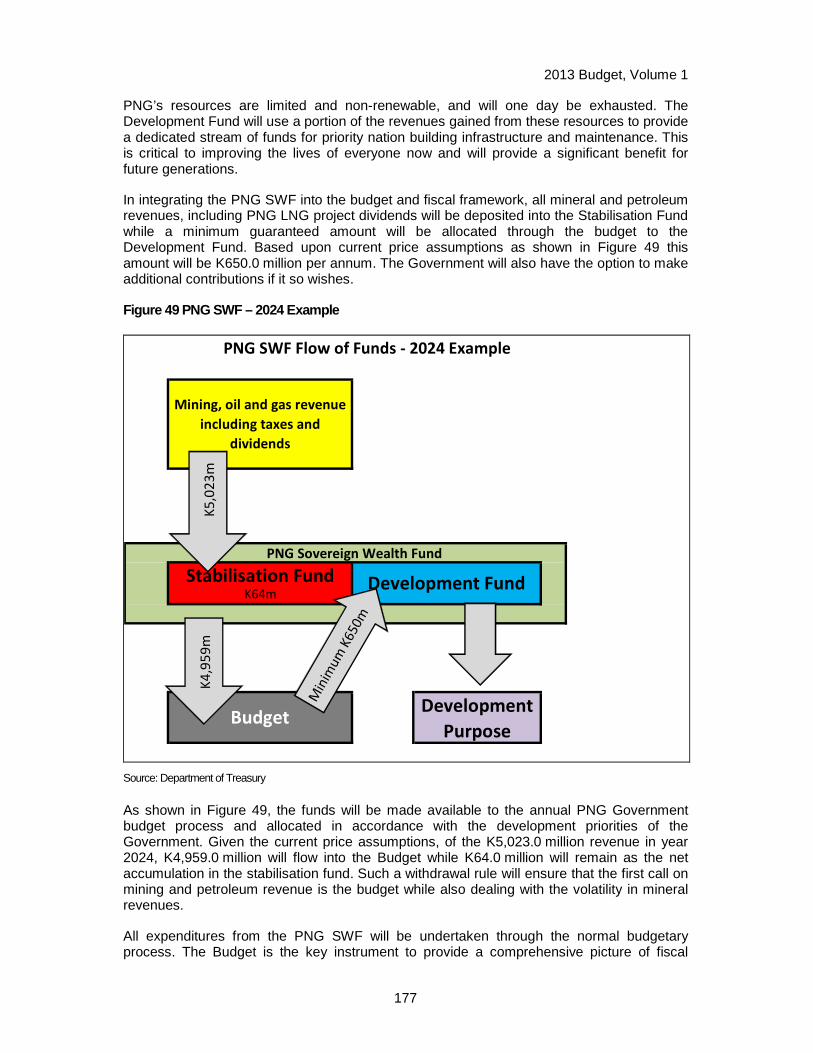
2013 Budget, Volume 1
177
PNG’s resources are limited and non-renewable, and will one day be exhausted. The Development Fund will use a portion of the revenues gained from these resources to provide a dedicated stream of funds for priority nation building infrastructure and maintenance. This is critical to improving the lives of everyone now and will provide a significant benefit for future generations.
In integrating the PNG SWF into the budget and fiscal framework, all mineral and petroleum revenues, including PNG LNG project dividends will be deposited into the Stabilisation Fund while a minimum guaranteed amount will be allocated through the budget to the Development Fund. Based upon current price assumptions as shown in Figure 49 this amount will be K650.0 million per annum. The Government will also have the option to make additional contributions if it so wishes.
Figure 49 PNG SWF – 2024 Example
Development Fund
PNG Sovereign Wealth Fund
Development
PurposeBudget
Stabilisation Fund K64m
Mining, oil and gas revenue
including taxes and
dividends
PNG SWF Flow of Funds - 2024 Example
K5
,02
3m
K4
,95
9m
Source: Department of Treasury
As shown in Figure 49, the funds will be made available to the annual PNG Government budget process and allocated in accordance with the development priorities of the Government. Given the current price assumptions, of the K5,023.0 million revenue in year 2024, K4,959.0 million will flow into the Budget while K64.0 million will remain as the net accumulation in the stabilisation fund. Such a withdrawal rule will ensure that the first call on mining and petroleum revenue is the budget while also dealing with the volatility in mineral revenues.
All expenditures from the PNG SWF will be undertaken through the normal budgetary process. The Budget is the key instrument to provide a comprehensive picture of fiscal
2013 Budget, Volume 1
178
activities and ensure that all competing demands are taken into account in deciding government spending allocations.
The Organic Law has made provisions for investments that the PNG SWF must not be used for:
• Purchasing Government Debt - The PNG SWF Board is restricted from purchasing PNG government debt or investing or lending directly domestically.
• Providing Government Guarantees or used as Collateral - The assets (including future income streams) of the PNG SWF will not be pledged as collateral against any borrowings by the Government.
14.3 MAINTAINING FISCAL DISCIPLINE
14.3.1 Integration into the Budget and Fiscal Frame work
One of the key features of PNG SWF is that while investments are undertaken by an independent Board the State will retain ownership of its assets. Lessons learned from past experience have led to the PNG SWF being fully integrated into the budget to manage government spending and the economy. This is to ensure that all revenues (including dividends) from the PNG LNG project, as well as from other mineral and petroleum projects, and the timing of all expenditures can be most effectively used to advance PNG’s social and economic development. These processes can also help ensure funds are accounted for and managed in a transparent and coordinated manner.
14.3.2 Aligning SWF with Medium Term Fiscal Strateg y (MTFS)
Since its inception, the current MTFS (2008-2012) has assisted the Government in achieving the National Goals in the Constitution and its development objectives by providing a framework to handle highly volatile and uncertain amounts of revenue from PNG’s mining and petroleum exports.
The new MTFS (2013-2017) aims to improve the quality of expenditure and maintain macroeconomic stability. It complements the PNG SWF framework. The MTFS is designed to be consistent or closely aligned to the fiscal rules in the PNG SWF.
14.3.3 Experiences from Mineral Resource Stabilisat ion Fund
The Mineral Resource Stabilisation Fund (MRSF) was established by legislation in 1974 as a stabilisation fund. The fund was domestically held and invested, with the maximum drawdowns that the Government and Parliament could make being subject to rules which changed over time.
The effectiveness of the MRSF was mixed. A key limitation of the MRSF was that its funds were invested onshore rather than offshore. There was a high opportunity cost associated with this approach – through low domestic interest earned and limited scope of growing the value of the fund in a small financial market. Other deficiencies included the cost and difficulty in managing monetary policy, weak governance arrangements and the poor integration with the budget and operation of fiscal policy.
The MRSF rules on deposits and withdrawals were changed over time in the face of budgetary pressures, leading to large fiscal deficits and public debt. Moreover, the assets were used as collateral for new borrowing and to repay debt, with a subsequent fund closure in 2001.
2013 Budget, Volume 1
179
Learning from this experience, the operational rules of the PNG SWF are fully integrated into the budget and fiscal framework and are aligned with the new MTFS for economic management.
14.4 THE IMPLEMENTATION PHASE
The SWF Secretaries Committee was established under National Executive Council (NEC) Decision 196/2010 and reaffirmed in NEC Decision 69/2011 to oversee the implementation of the PNG SWF with the support of the Inter-departmental SWF Working Group. As directed by NEC, this work is advancing in the areas such as drafting legislation required by the Organic Law.
An ‘Implementation Plan of the PNG SWF has been established and endorsed by the Secretaries Committee with the aim of PNG SWF becoming operational in mid-2013. The Secretaries Committee has also established a full-time Implementation Secretariat with members seconded from various government bodies involved in the development of PNG SWF policy and legal framework.
2013 Budget, Volume 1
1
APPENDIX 1: REVENUE TABLES
Table 1.1: Summary of Infrastructure Tax Credit Scheme (Kina Million)
Table 1.2: Incentives Under the Income Tax Act Resulting in Permanent Loss of Revenue (Kina)
Table 1.3: Incentives Under the Income Tax Act Involving Deferral of Income Tax (Kina)
Table 1.4: Exemptions Under the Stamp Duties Act (Kina)
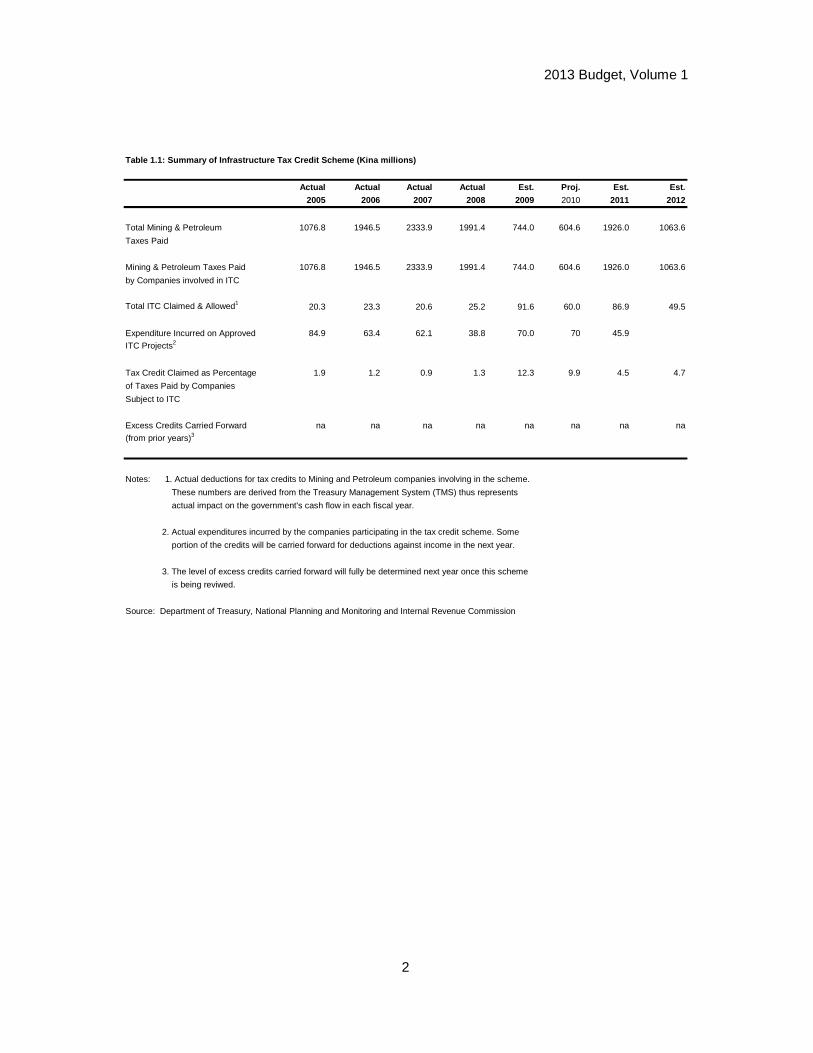
2013 Budget, Volume 1
2
Table 1.1: Summary of Infrastructure Tax Credit Sch eme (Kina millions)
Actual Actual Actual Actual Est. Proj. Est. Est.
2005 2006 2007 2008 2009 2010 2011 2012
Total Mining & Petroleum 1076.8 1946.5 2333.9 1991.4 744.0 604.6 1926.0 1063.6
Taxes Paid
Mining & Petroleum Taxes Paid 1076.8 1946.5 2333.9 1991.4 744.0 604.6 1926.0 1063.6
by Companies involved in ITC
Total ITC Claimed & Allowed1 20.3 23.3 20.6 25.2 91.6 60.0 86.9 49.5
Expenditure Incurred on Approved 84.9 63.4 62.1 38.8 70.0 70 45.9
ITC Projects2
Tax Credit Claimed as Percentage 1.9 1.2 0.9 1.3 12.3 9.9 4.5 4.7
of Taxes Paid by Companies
Subject to ITC
Excess Credits Carried Forward na na na na na na na na
(from prior years)3
Notes: 1. Actual deductions for tax credits to Mining and Petroleum companies involving in the scheme.
These numbers are derived from the Treasury Management System (TMS) thus represents
actual impact on the government's cash flow in each fiscal year.
2. Actual expenditures incurred by the companies participating in the tax credit scheme. Some
portion of the credits will be carried forward for deductions against income in the next year.
3. The level of excess credits carried forward will fully be determined next year once this scheme
is being reviwed.
Source: Department of Treasury, National Planning and Monitoring and Internal Revenue Commission
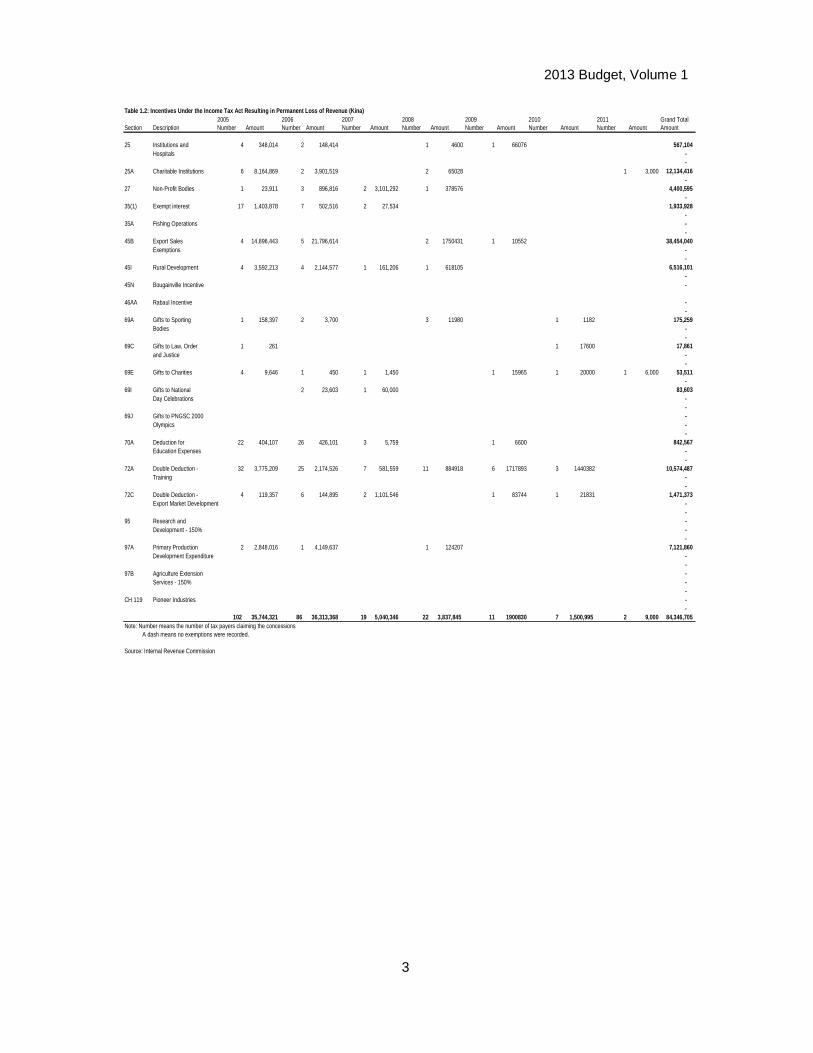
2013 Budget, Volume 1
3
2005 2006 2007 2008 2009 2010 2011 Grand TotalSection Description Number Amount Number Amount Number Amount Number Amount Number Amount Number Amount Number Amount Amount
25 Institutions and 4 348,014 2 148,414 1 4600 1 66076 567,104 Hospitals -
- 25A Charitable Institutions 6 8,164,869 2 3,901,519 2 65028 1 3,000 12,134,416
- 27 Non-Profit Bodies 1 23,911 3 896,816 2 3,101,292 1 378576 4,400,595
- 35(1) Exempt interest 17 1,403,878 7 502,516 2 27,534 1,933,928
- 35A Fishing Operations -
- 45B Export Sales 4 14,896,443 5 21,796,614 2 1750431 1 10552 38,454,040
Exemptions - -
45I Rural Development 4 3,592,213 4 2,144,577 1 161,206 1 618105 6,516,101 -
45N Bougainville Incentive -
46AA Rabaul Incentive - -
69A Gifts to Sporting 1 158,397 2 3,700 3 11980 1 1182 175,259 Bodies -
- 69C Gifts to Law, Order 1 261 1 17600 17,861
and Justice - -
69E Gifts to Charities 4 9,646 1 450 1 1,450 1 15965 1 20000 1 6,000 53,511 -
69I Gifts to National 2 23,603 1 60,000 83,603 Day Celebrations -
- 69J Gifts to PNGSC 2000 -
Olympics - -
70A Deduction for 22 404,107 26 426,101 3 5,759 1 6600 842,567 Education Expenses -
- 72A Double Deduction - 32 3,775,209 25 2,174,526 7 581,559 11 884918 6 1717893 3 1440382 10,574,487
Training - -
72C Double Deduction - 4 119,357 6 144,895 2 1,101,546 1 83744 1 21831 1,471,373 Export Market Development -
- 95 Research and -
Development - 150% - -
97A Primary Production 2 2,848,016 1 4,149,637 1 124207 7,121,860 Development Expenditure -
- 97B Agriculture Extension -
Services - 150% - -
CH 119 Pioneer Industries - -
102 35,744,321 86 36,313,368 19 5,040,346 22 3,837,845 11 1900830 7 1,500,995 2 9,000 84,346,705 Note: Number means the number of tax payers claiming the concessions A dash means no exemptions were recorded.
Source: Internal Revenue Commission
Table 1.2: Incentives Under the Income Tax Act Resu lting in Permanent Loss of Revenue (Kina)
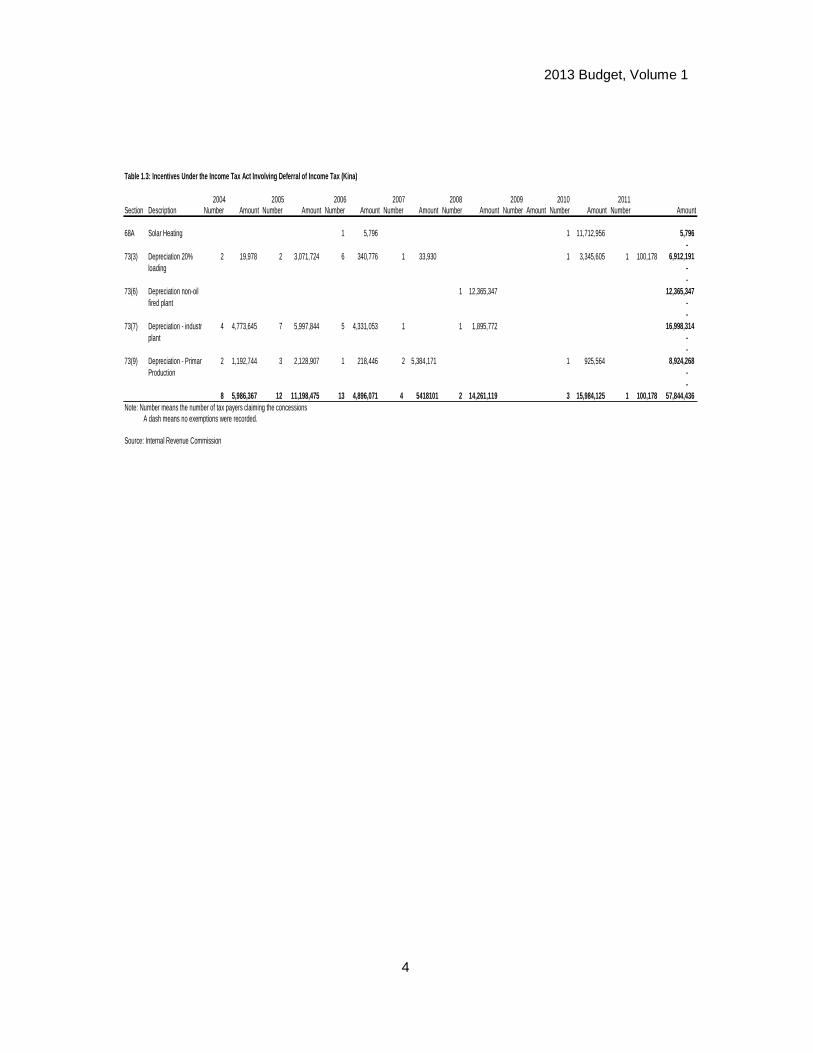
2013 Budget, Volume 1
4
2004 2005 2006 2007 2008 2009 2010 2011Section Description Number Amount Number Amount Number Amount Number Amount Number Amount Number Amount Number Amount Number Amount
68A Solar Heating 1 5,796 1 11,712,956 5,796 -
73(3) Depreciation 20% 2 19,978 2 3,071,724 6 340,776 1 33,930 1 3,345,605 1 100,178 6,912,191 loading -
- 73(6) Depreciation non-oil 1 12,365,347 12,365,347
fired plant - -
73(7) Depreciation - industrial 4 4,773,645 7 5,997,844 5 4,331,053 1 1 1,895,772 16,998,314 plant -
- 73(9) Depreciation - Primary 2 1,192,744 3 2,128,907 1 218,446 2 5,384,171 1 925,564 8,924,268
Production - -
8 5,986,367 12 11,198,475 13 4,896,071 4 5418101 2 14,261,119 3 15,984,125 1 100,178 57,844,436 Note: Number means the number of tax payers claiming the concessions A dash means no exemptions were recorded.
Source: Internal Revenue Commission
Table 1.3: Incentives Under the Income Tax Act Invo lving Deferral of Income Tax (Kina)

2013 Budget, Volume 1
5
Descriptions of 2010 2011 2012
Schedule 1 Exemptions Number Amount Number Amount Number A mount
Item 5 First Time Home 635 1,389,746.06 254 818,185.26 377 1,760,219.00
Buyers Exemption
Item 5 Charities 5 110,030.00 3 1,222,510.00 4 101,476.00
Item 8 Wills 4 107,530.00 10 188,135 6 111,918
Item 16A Transfers of Marketable _ _ _ _ _ _
Securities
Section 6 Purchase of Property by 6 283,580.00 4 338,450.00 7 923,450.00
State & Instrumentalities
of state
650 1,783,356.06 271 2,567,280.26 394 2,897,063
Note: Number means number of transactions
2010 Figures are from January to December
2011 Figures are from January to September
2012 Figures are from January to July
_ means no exemptions were granted
Source: Internal Revenue Commission
Table 1.4: Exemptions under Stamp Duties Act
2013 Budget, Volume 1
6
APPENDIX 2: GRANTS AND TRANSFERS TO PROVINCES
Table 2.1: National Governments Grants to Provincial and Local Level Governments (Kina Thousand)
Table 2.2: Grants, Transfers and other resources of the Provinces (Kina Thousand)
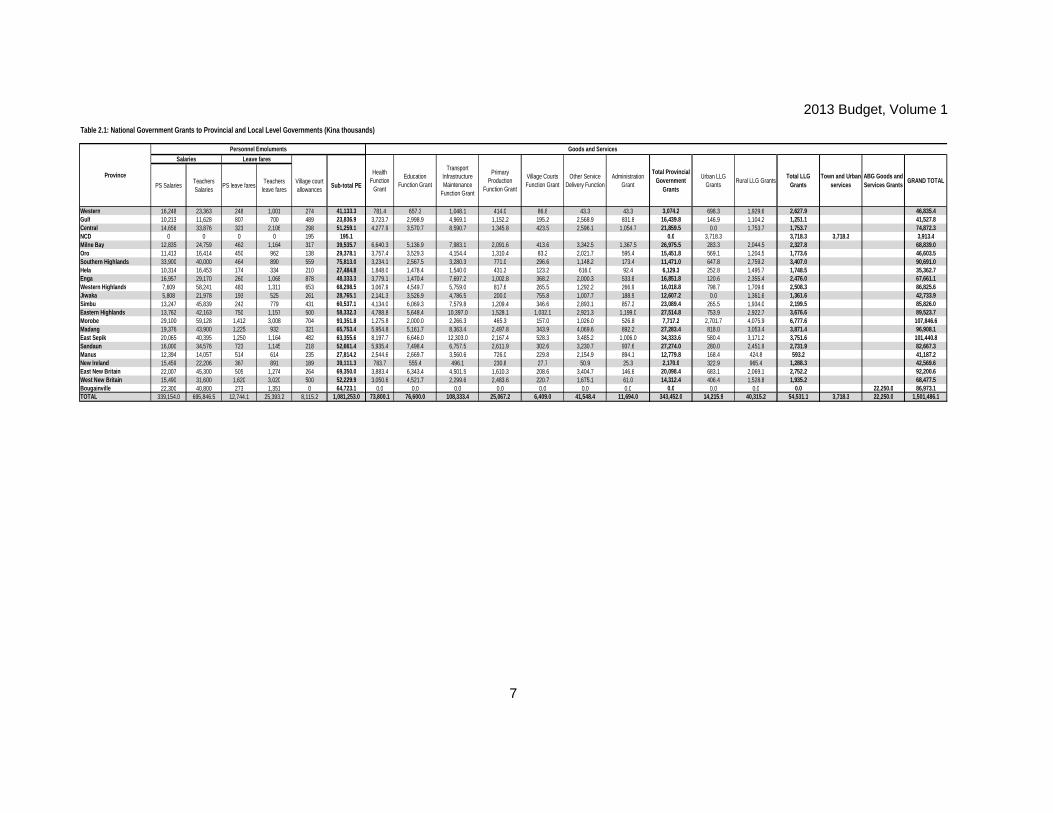
2013 Budget, Volume 1
7
Table 2.1: National Government Grants to Provincial and Local Level Governments (Kina thousands)
PS SalariesTeachers Salaries
PS leave faresTeachers
leave faresVillage court allowances
Sub-total PE
Western 16,248 23,363 248 1,001 274 41,133.3 781.4 657.3 1,048.1 414.0 86.8 43.3 43.3 3,074.2 698.3 1,929.6 2,627.9 46,835.4Gulf 10,213 11,628 807 700 489 23,836.9 3,723.7 2,998.9 4,969.1 1,152.2 195.2 2,568.9 831.8 16,439.8 146.9 1,104.2 1,251.1 41,527.8Central 14,656 33,876 323 2,106 298 51,259.1 4,277.9 3,570.7 8,590.7 1,345.8 423.5 2,596.1 1,054.7 21,859.5 0.0 1,753.7 1,753.7 74,872.3NCD 0 0 0 0 195 195.1 0.0 3,718.3 3,718.3 3,718.3 3,913.4Milne Bay 12,835 24,759 462 1,164 317 39,535.7 6,640.3 5,136.9 7,983.1 2,091.6 413.6 3,342.5 1,367.5 26,975.5 283.3 2,044.5 2,327.8 68,839.0Oro 11,413 16,414 450 962 138 29,378.1 3,757.4 3,529.3 4,154.4 1,310.4 83.2 2,021.7 595.4 15,451.8 569.1 1,204.5 1,773.6 46,603.5Southern Highlands 33,900 40,000 464 890 559 75,813.0 3,234.1 2,567.5 3,280.3 771.0 296.6 1,148.2 173.4 11,471.0 647.8 2,759.2 3,407.0 90,691.0Hela 10,314 16,453 174 334 210 27,484.8 1,848.0 1,478.4 1,540.0 431.2 123.2 616.0 92.4 6,129.3 252.8 1,495.7 1,748.5 35,362.7Enga 16,957 29,170 260 1,068 878 48,333.3 3,779.1 1,470.4 7,697.2 1,002.8 368.2 2,000.3 533.8 16,851.8 120.6 2,355.4 2,476.0 67,661.1Western Highlands 7,609 58,241 483 1,311 653 68,298.5 3,067.9 4,549.7 5,759.0 817.6 265.5 1,292.2 266.9 16,018.8 798.7 1,709.6 2,508.3 86,825.6Jiwaka 5,808 21,978 193 525 261 28,765.1 2,141.3 3,526.9 4,786.5 200.0 755.8 1,007.7 188.9 12,607.2 0.0 1,361.6 1,361.6 42,733.9Simbu 13,247 45,839 242 779 431 60,537.1 4,134.0 6,069.3 7,579.8 1,209.4 346.6 2,893.1 857.2 23,089.4 265.5 1,934.0 2,199.5 85,826.0Eastern Highlands 13,762 42,163 750 1,157 500 58,332.3 4,788.8 5,648.4 10,397.0 1,528.1 1,032.1 2,921.3 1,199.0 27,514.8 753.9 2,922.7 3,676.6 89,523.7Morobe 29,100 59,128 1,412 3,008 704 93,351.8 1,275.8 2,000.0 2,266.3 465.3 157.0 1,026.0 526.8 7,717.2 2,701.7 4,075.9 6,777.6 107,846.6Madang 19,376 43,900 1,225 932 321 65,753.4 5,954.8 5,161.7 8,363.4 2,497.8 343.9 4,069.6 892.2 27,283.4 818.0 3,053.4 3,871.4 96,908.1East Sepik 20,065 40,395 1,250 1,164 482 63,355.6 8,197.7 6,646.0 12,303.0 2,167.4 528.3 3,485.2 1,006.0 34,333.6 580.4 3,171.2 3,751.6 101,440.8Sandaun 16,000 34,576 723 1,145 218 52,661.4 5,935.4 7,498.4 6,757.5 2,611.9 302.6 3,230.7 937.6 27,274.0 280.0 2,451.9 2,731.9 82,667.3Manus 12,394 14,057 514 614 235 27,814.2 2,544.6 2,669.7 3,560.6 726.0 229.8 2,154.9 894.1 12,779.8 168.4 424.8 593.2 41,187.2New Ireland 15,459 22,206 367 891 189 39,111.3 783.7 555.4 496.1 230.8 27.7 50.9 25.3 2,170.0 322.9 965.4 1,288.3 42,569.6East New Britain 22,007 45,300 505 1,274 264 69,350.0 3,883.4 6,343.4 4,501.5 1,610.3 208.6 3,404.7 146.6 20,098.4 683.1 2,069.1 2,752.2 92,200.6West New Britain 15,490 31,600 1,620 3,020 500 52,229.9 3,050.6 4,521.7 2,299.6 2,483.6 220.7 1,675.1 61.0 14,312.4 406.4 1,528.8 1,935.2 68,477.5Bougainville 22,300 40,800 273 1,351 0 64,723.1 0.0 0.0 0.0 0.0 0.0 0.0 0.0 0.0 0.0 0.0 0.0 22,250.0 86,973.1TOTAL 339,154.0 695,846.5 12,744.1 25,393.2 8,115.2 1,081,253.0 73,800.1 76,600.0 108,333.4 25,067.2 6,409.0 41,548.4 11,694.0 343,452.0 14,215.9 40,315.2 54,531.1 3,718.3 22,250.0 1,501,486.1
ProvinceTransport
Infrastructure Maintenance
Function Grant
Personnel Emoluments Goods and ServicesSalaries Leave fares
Health Function
Grant
Education Function Grant
Village Courts Function Grant
Primary Production
Function Grant
Town and Urban services
ABG Goods and Services Grants
GRAND TOTALOther Service
Delivery FunctionAdministration
Grant
Total Provincial Government
Grants
Urban LLG Grants
Rural LLG GrantsTotal LLG
Grants
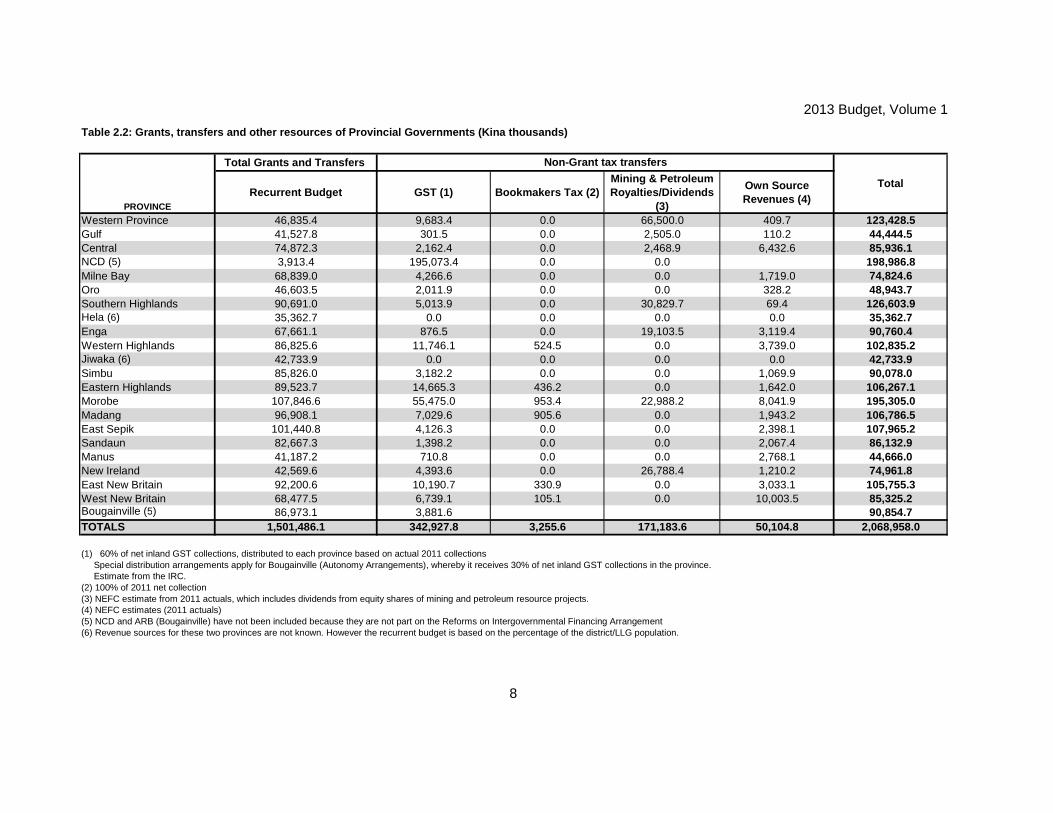
2013 Budget, Volume 1
8
Table 2.2: Grants, transfers and other resources of Provincial Governments (Kina thousands)
Total Grants and Transfers
Recurrent Budget GST (1) Bookmakers Tax (2)Mining & Petroleum Royalties/Dividends
(3)
Own Source Revenues (4)
Western Province 46,835.4 9,683.4 0.0 66,500.0 409.7 123,428.5Gulf 41,527.8 301.5 0.0 2,505.0 110.2 44,444.5Central 74,872.3 2,162.4 0.0 2,468.9 6,432.6 85,936.1NCD (5) 3,913.4 195,073.4 0.0 0.0 198,986.8Milne Bay 68,839.0 4,266.6 0.0 0.0 1,719.0 74,824.6Oro 46,603.5 2,011.9 0.0 0.0 328.2 48,943.7Southern Highlands 90,691.0 5,013.9 0.0 30,829.7 69.4 126,603.9Hela (6) 35,362.7 0.0 0.0 0.0 0.0 35,362.7Enga 67,661.1 876.5 0.0 19,103.5 3,119.4 90,760.4Western Highlands 86,825.6 11,746.1 524.5 0.0 3,739.0 102,835.2Jiwaka (6) 42,733.9 0.0 0.0 0.0 0.0 42,733.9Simbu 85,826.0 3,182.2 0.0 0.0 1,069.9 90,078.0Eastern Highlands 89,523.7 14,665.3 436.2 0.0 1,642.0 106,267.1Morobe 107,846.6 55,475.0 953.4 22,988.2 8,041.9 195,305.0Madang 96,908.1 7,029.6 905.6 0.0 1,943.2 106,786.5East Sepik 101,440.8 4,126.3 0.0 0.0 2,398.1 107,965.2Sandaun 82,667.3 1,398.2 0.0 0.0 2,067.4 86,132.9Manus 41,187.2 710.8 0.0 0.0 2,768.1 44,666.0New Ireland 42,569.6 4,393.6 0.0 26,788.4 1,210.2 74,961.8East New Britain 92,200.6 10,190.7 330.9 0.0 3,033.1 105,755.3West New Britain 68,477.5 6,739.1 105.1 0.0 10,003.5 85,325.2Bougainville (5) 86,973.1 3,881.6 90,854.7TOTALS 1,501,486.1 342,927.8 3,255.6 171,183.6 50,104.8 2,068,958.0
(1) 60% of net inland GST collections, distributed to each province based on actual 2011 collections Special distribution arrangements apply for Bougainville (Autonomy Arrangements), whereby it receives 30% of net inland GST collections in the province. Estimate from the IRC.(2) 100% of 2011 net collection(3) NEFC estimate from 2011 actuals, which includes dividends from equity shares of mining and petroleum resource projects. (4) NEFC estimates (2011 actuals)(5) NCD and ARB (Bougainville) have not been included because they are not part on the Reforms on Intergovernmental Financing Arrangement(6) Revenue sources for these two provinces are not known. However the recurrent budget is based on the percentage of the district/LLG population.
Non-Grant tax transfers
Total
PROVINCE
2013 Budget, Volume 1
9
APPENDIX 3: ECONOMIC AND FISCAL DATA
TABLES
Table 3.1 Gross Domestic Product by Economic Activity at Current and Constant Prices
Table 3.2 Contributions to Growth in Real Gross Domestic Product
Table 3.3 Prices of Main Export Commodities
Table 3.4 Volume of Main Export Commodities
Table 3.5 Value of Main Export Commodities
Table 3.6 Summary of Balance of Payments
Table 3.7 Employment Classified by Industry
Table 3.8 Central Government Revenue and Grants
Table 3.9 Central Government Expenditure and Net Lending
Table 3.10 Central Government Financing
Table 3.11 Monetary Aggregates
Table 3.12 Public Debt
Table 3.13 Major Assumptions Underlying the Budget

2013 Budget, Volume 1
10
TABLE 1: GROSS DOMESTIC PRODUCT BY ECONOMIC ACTIVIT Y AT CURRENT AND CONSTANT PRICES (Kina Million)2011 2012 2013 2014 2015 2016 2017
Actual Est Proj Proj Proj Proj Proj
Agriculture, Forestry and Fishingnominal 9376.5 9327.4 9966.9 10845.3 11744.5 12743.6 13982.6deflator 231.1 229.4 238.3 250.6 262.2 273.4 284.2real 4056.5 4066.2 4181.9 4328.5 4479.3 4660.6 4920.8rate of real growth 8.1 0.2 2.8 3.5 3.5 4.0 5.6
Oil and Gas Extractionnominal 1862.6 1269.6 1280.9 2817.4 10533.9 10663.8 10676.9deflator 892.5 727.5 780.5 422.2 331.7 334.6 338.6real 208.7 174.5 164.1 667.2 3175.9 3186.9 3153.4rate of real growth -17.5 -16.4 -6.0 306.6 376.0 0.3 -1.0
Mining and Quarryingnominal 3806.3 3464.1 4083.3 4566.6 4211.1 4317.4 4403.5deflator 581.9 499.4 499.8 472.9 444.9 439.9 443.9real 654.1 693.7 817.0 965.6 946.5 981.5 992.1rate of real growth -9.8 6.0 17.8 18.2 -2.0 3.7 1.1
Manufacturingnominal 1978.0 2264.4 2446.7 2696.8 3030.7 3404.6 3824.7deflator 201.6 209.8 220.3 233.5 247.6 262.4 278.1real 981.0 1079.1 1110.4 1154.8 1224.1 1297.5 1375.4rate of real growth 13.0 10.0 2.9 4.0 6.0 6.0 6.0
Electricity, gas and waternominal 639.2 745.0 837.1 931.5 1046.8 1176.0 1321.1deflator 330.5 344.0 361.2 382.8 405.8 430.1 455.8real 193.4 216.6 231.8 243.3 257.9 273.4 289.8rate of real growth 9.5 12.0 7.0 5.0 6.0 6.0 6.0
Constructionnominal 4965.3 6407.5 7024.4 6811.7 7510.6 8278.2 9124.2deflator 204.9 213.2 223.9 237.3 251.5 266.6 282.5real 2423.8 3005.5 3137.7 2871.0 2985.8 3105.3 3229.5rate of real growth 26.0 24.0 4.4 -8.5 4.0 4.0 4.0
Wholesale and retail tradenominal 2489.9 2979.9 3285.6 3656.2 4108.9 4615.9 5185.4deflator 233.0 242.5 254.6 269.8 286.1 303.2 321.3real 1068.7 1229.0 1290.5 1355.0 1436.3 1522.5 1613.8rate of real growth 18.0 15.0 5.0 5.0 6.0 6.0 6.0
Transport, storage and communicationnominal 971.9 1173.3 1264.0 1406.6 1580.8 1775.8 1995.0deflator 117.6 122.3 128.5 136.2 144.4 153.0 162.1real 826.7 959.0 983.9 1033.1 1095.1 1160.8 1230.4rate of real growth 16.0 16.0 2.6 5.0 6.0 6.0 6.0
Finance, real estate and business servicesnominal 1411.6 1615.9 1722.3 1971.3 2194.5 2442.0 2717.5deflator 229.3 238.7 250.6 265.6 281.6 298.5 316.3real 615.5 677.0 687.2 742.1 779.3 818.2 859.1rate of real growth 20.0 10.0 1.5 8.0 5.0 5.0 5.0
Community, social and personal servicesnominal 2519.3 2779.2 3020.5 3297.1 3600.5 3930.3 4290.3deflator 181.4 188.8 198.2 210.1 222.7 236.0 250.1real 1389.0 1472.4 1523.9 1569.6 1616.7 1665.2 1715.2rate of real growth 5.0 6.0 3.5 3.0 3.0 3.0 3.0
TOTAL GDP*nominal 30618.4 32666.1 35571.4 39640.4 50201.9 53987.4 58161.0rate of nominal growth 15.9 6.7 8.9 11.4 26.6 7.5 7.7deflator 239.2 233.7 244.8 258.5 272.8 283.0 294.0real 12802.8 13976.4 14531.8 15333.8 18400.4 19075.4 19783.0rate of real growth 11.1 9.2 4.0 5.5 20.0 3.7 3.7
Total non-mining GDPnominal 24949.4 27932.4 30207.2 32256.4 35456.9 39006.1 43080.6rate of nominal growth 21.7 12.0 8.1 6.8 9.9 10.0 10.4deflator 209.0 213.1 222.9 235.4 248.3 261.7 275.5real 11940.0 13108.2 13550.7 13701.0 14278.0 14907.0 15637.5rate of real growth 13.2 9.8 3.4 1.1 4.2 4.4 4.9
*Sum of industries less imputed bank service charge, plus import duties, less subsidies.Source : Actual data for 1994 to 2006: National Statistical Office. 2007-2011 incl Estimates and projections: Dept. of Treasury
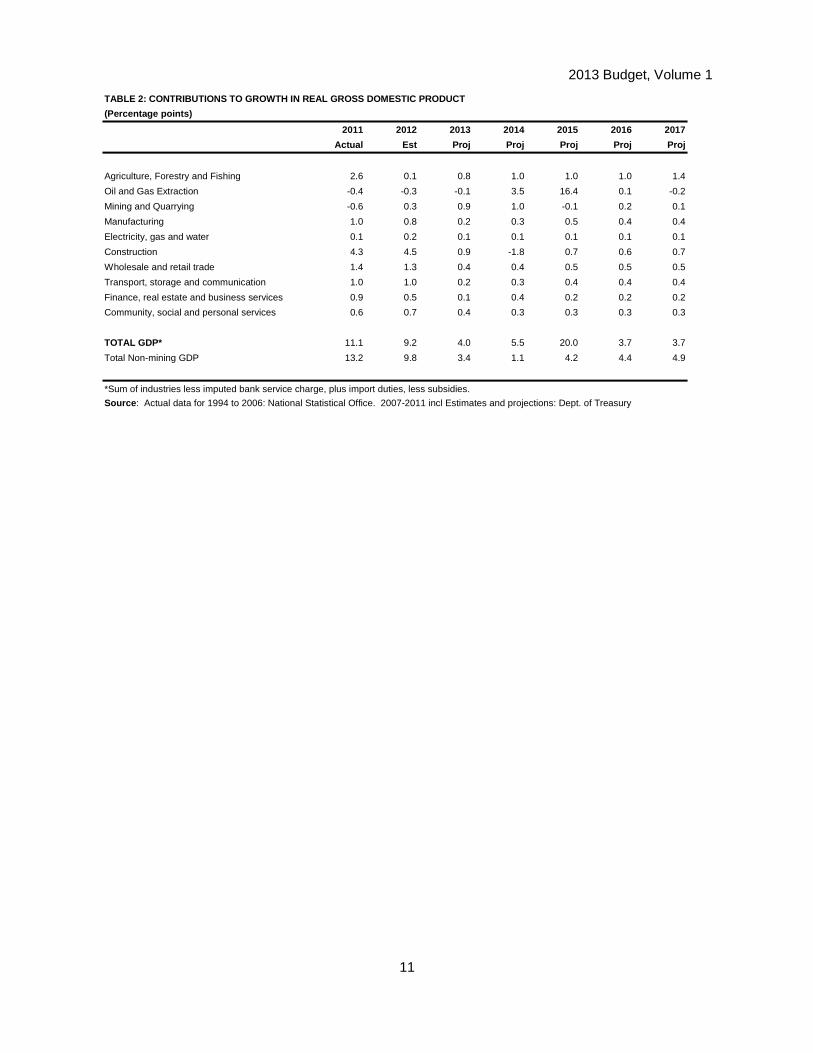
2013 Budget, Volume 1
11
TABLE 2: CONTRIBUTIONS TO GROWTH IN REAL GROSS DOME STIC PRODUCT
(Percentage points)
2011 2012 2013 2014 2015 2016 2017
Actual Est Proj Proj Proj Proj Proj
Agriculture, Forestry and Fishing 2.6 0.1 0.8 1.0 1.0 1.0 1.4
Oil and Gas Extraction -0.4 -0.3 -0.1 3.5 16.4 0.1 -0.2
Mining and Quarrying -0.6 0.3 0.9 1.0 -0.1 0.2 0.1
Manufacturing 1.0 0.8 0.2 0.3 0.5 0.4 0.4
Electricity, gas and water 0.1 0.2 0.1 0.1 0.1 0.1 0.1
Construction 4.3 4.5 0.9 -1.8 0.7 0.6 0.7
Wholesale and retail trade 1.4 1.3 0.4 0.4 0.5 0.5 0.5
Transport, storage and communication 1.0 1.0 0.2 0.3 0.4 0.4 0.4
Finance, real estate and business services 0.9 0.5 0.1 0.4 0.2 0.2 0.2
Community, social and personal services 0.6 0.7 0.4 0.3 0.3 0.3 0.3
TOTAL GDP* 11.1 9.2 4.0 5.5 20.0 3.7 3.7
Total Non-mining GDP 13.2 9.8 3.4 1.1 4.2 4.4 4.9
*Sum of industries less imputed bank service charge, plus import duties, less subsidies.
Source : Actual data for 1994 to 2006: National Statistical Office. 2007-2011 incl Estimates and projections: Dept. of Treasury
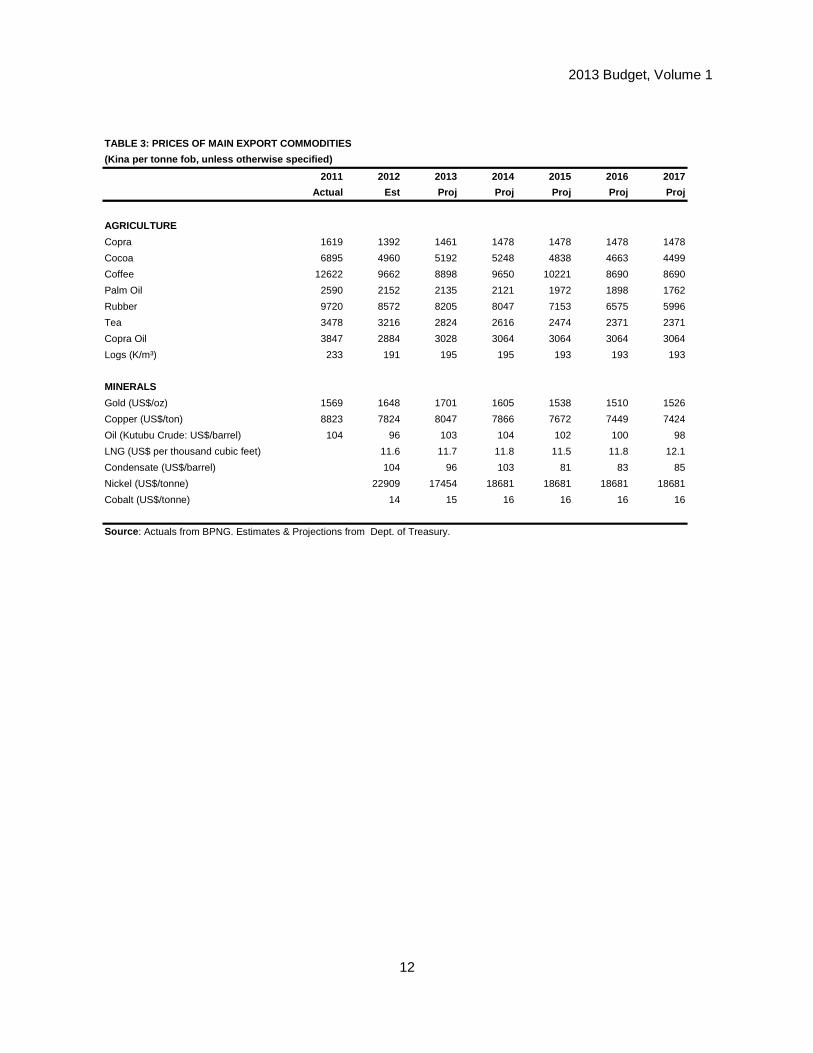
2013 Budget, Volume 1
12
TABLE 3: PRICES OF MAIN EXPORT COMMODITIES
(Kina per tonne fob, unless otherwise specified)
2011 2012 2013 2014 2015 2016 2017
Actual Est Proj Proj Proj Proj Proj
AGRICULTURE
Copra 1619 1392 1461 1478 1478 1478 1478
Cocoa 6895 4960 5192 5248 4838 4663 4499
Coffee 12622 9662 8898 9650 10221 8690 8690
Palm Oil 2590 2152 2135 2121 1972 1898 1762
Rubber 9720 8572 8205 8047 7153 6575 5996
Tea 3478 3216 2824 2616 2474 2371 2371
Copra Oil 3847 2884 3028 3064 3064 3064 3064
Logs (K/m³) 233 191 195 195 193 193 193
MINERALS
Gold (US$/oz) 1569 1648 1701 1605 1538 1510 1526
Copper (US$/ton) 8823 7824 8047 7866 7672 7449 7424
Oil (Kutubu Crude: US$/barrel) 104 96 103 104 102 100 98
LNG (US$ per thousand cubic feet) 11.6 11.7 11.8 11.5 11.8 12.1
Condensate (US$/barrel) 104 96 103 81 83 85
Nickel (US$/tonne) 22909 17454 18681 18681 18681 18681
Cobalt (US$/tonne) 14 15 16 16 16 16
Source : Actuals from BPNG. Estimates & Projections from Dept. of Treasury.
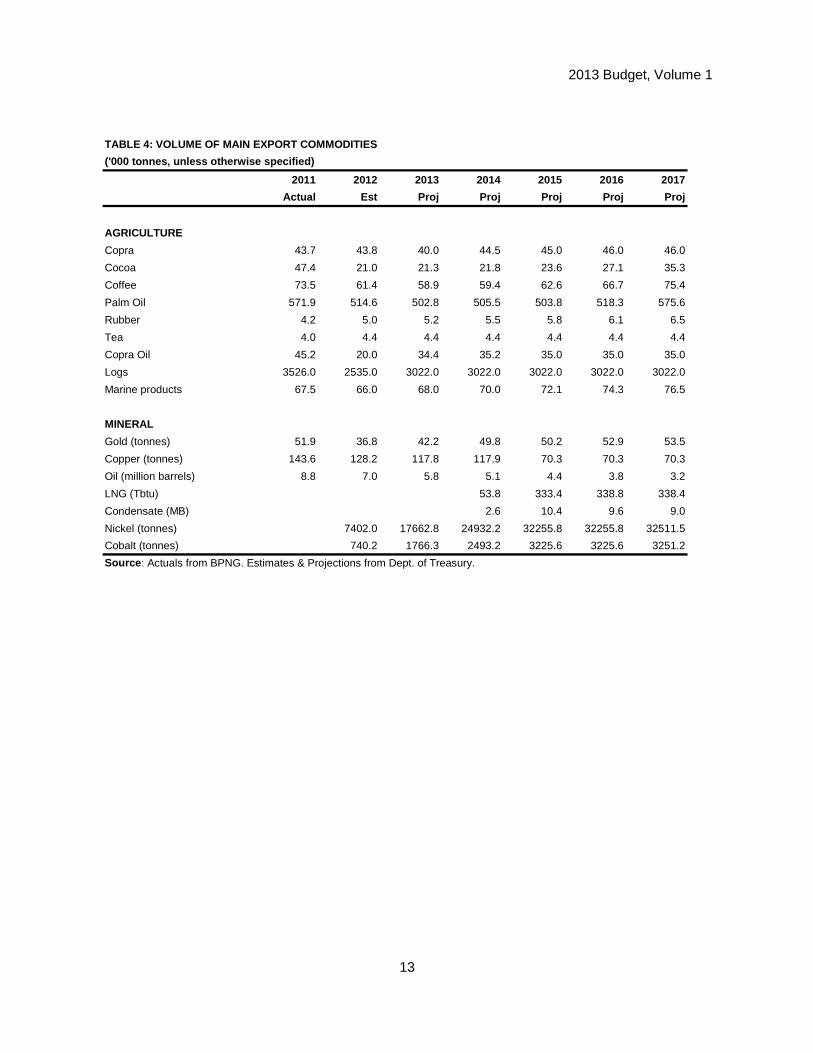
2013 Budget, Volume 1
13
TABLE 4: VOLUME OF MAIN EXPORT COMMODITIES
('000 tonnes, unless otherwise specified)
2011 2012 2013 2014 2015 2016 2017
Actual Est Proj Proj Proj Proj Proj
AGRICULTURE
Copra 43.7 43.8 40.0 44.5 45.0 46.0 46.0
Cocoa 47.4 21.0 21.3 21.8 23.6 27.1 35.3
Coffee 73.5 61.4 58.9 59.4 62.6 66.7 75.4
Palm Oil 571.9 514.6 502.8 505.5 503.8 518.3 575.6
Rubber 4.2 5.0 5.2 5.5 5.8 6.1 6.5
Tea 4.0 4.4 4.4 4.4 4.4 4.4 4.4
Copra Oil 45.2 20.0 34.4 35.2 35.0 35.0 35.0
Logs 3526.0 2535.0 3022.0 3022.0 3022.0 3022.0 3022.0
Marine products 67.5 66.0 68.0 70.0 72.1 74.3 76.5
MINERAL
Gold (tonnes) 51.9 36.8 42.2 49.8 50.2 52.9 53.5
Copper (tonnes) 143.6 128.2 117.8 117.9 70.3 70.3 70.3
Oil (million barrels) 8.8 7.0 5.8 5.1 4.4 3.8 3.2
LNG (Tbtu) 53.8 333.4 338.8 338.4
Condensate (MB) 2.6 10.4 9.6 9.0
Nickel (tonnes) 7402.0 17662.8 24932.2 32255.8 32255.8 32511.5
Cobalt (tonnes) 740.2 1766.3 2493.2 3225.6 3225.6 3251.2
Source : Actuals from BPNG. Estimates & Projections from Dept. of Treasury.
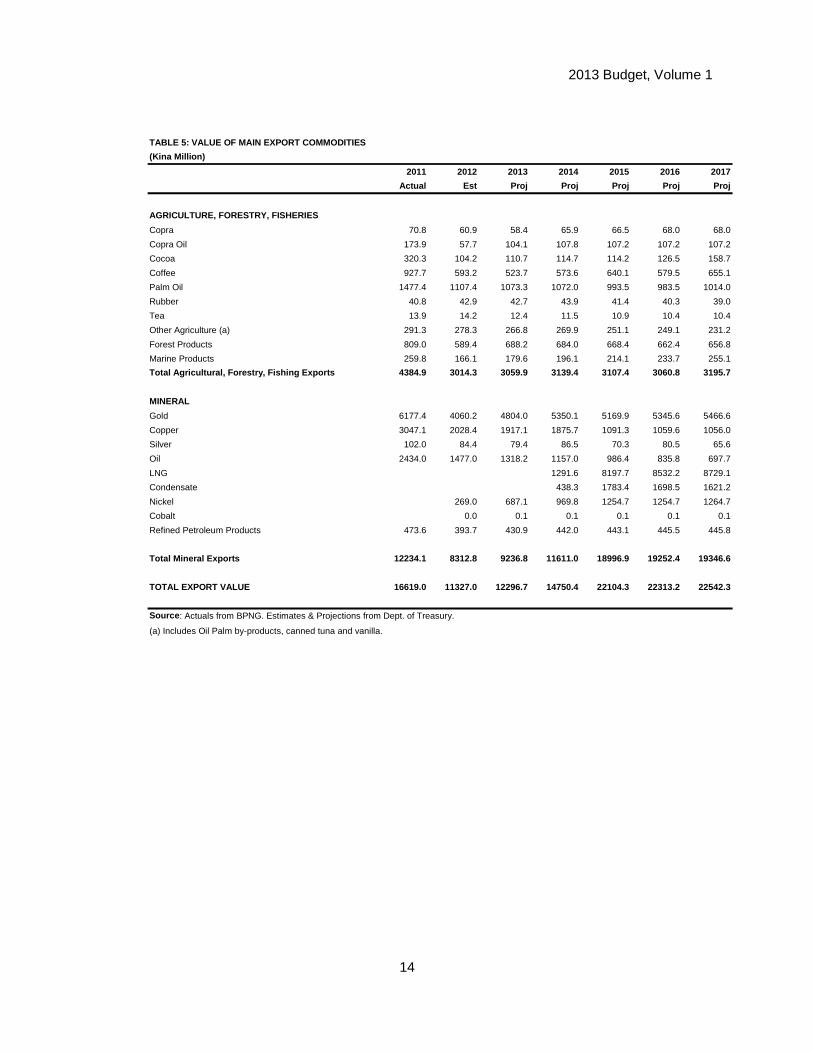
2013 Budget, Volume 1
14
TABLE 5: VALUE OF MAIN EXPORT COMMODITIES
(Kina Million)
2011 2012 2013 2014 2015 2016 2017
Actual Est Proj Proj Proj Proj Proj
AGRICULTURE, FORESTRY, FISHERIES
Copra 70.8 60.9 58.4 65.9 66.5 68.0 68.0
Copra Oil 173.9 57.7 104.1 107.8 107.2 107.2 107.2
Cocoa 320.3 104.2 110.7 114.7 114.2 126.5 158.7
Coffee 927.7 593.2 523.7 573.6 640.1 579.5 655.1
Palm Oil 1477.4 1107.4 1073.3 1072.0 993.5 983.5 1014.0
Rubber 40.8 42.9 42.7 43.9 41.4 40.3 39.0
Tea 13.9 14.2 12.4 11.5 10.9 10.4 10.4
Other Agriculture (a) 291.3 278.3 266.8 269.9 251.1 249.1 231.2
Forest Products 809.0 589.4 688.2 684.0 668.4 662.4 656.8
Marine Products 259.8 166.1 179.6 196.1 214.1 233.7 255.1
Total Agricultural, Forestry, Fishing Exports 4384.9 3014.3 3059.9 3139.4 3107.4 3060.8 3195.7
MINERAL
Gold 6177.4 4060.2 4804.0 5350.1 5169.9 5345.6 5466.6
Copper 3047.1 2028.4 1917.1 1875.7 1091.3 1059.6 1056.0
Silver 102.0 84.4 79.4 86.5 70.3 80.5 65.6
Oil 2434.0 1477.0 1318.2 1157.0 986.4 835.8 697.7
LNG 1291.6 8197.7 8532.2 8729.1
Condensate 438.3 1783.4 1698.5 1621.2
Nickel 269.0 687.1 969.8 1254.7 1254.7 1264.7
Cobalt 0.0 0.1 0.1 0.1 0.1 0.1
Refined Petroleum Products 473.6 393.7 430.9 442.0 443.1 445.5 445.8
Total Mineral Exports 12234.1 8312.8 9236.8 11611.0 18996.9 19252.4 19346.6
TOTAL EXPORT VALUE 16619.0 11327.0 12296.7 14750.4 22104.3 22313.2 22542.3
Source : Actuals from BPNG. Estimates & Projections from Dept. of Treasury.
(a) Includes Oil Palm by-products, canned tuna and vanilla.
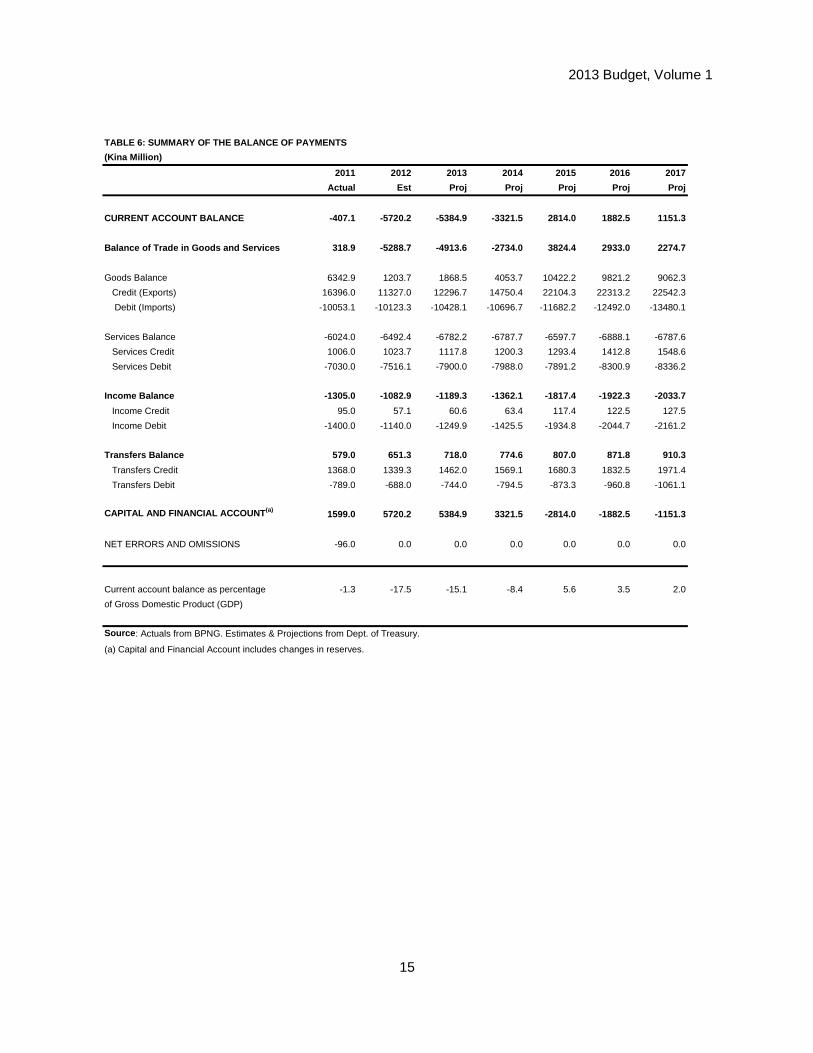
2013 Budget, Volume 1
15
TABLE 6: SUMMARY OF THE BALANCE OF PAYMENTS
(Kina Million)
2011 2012 2013 2014 2015 2016 2017
Actual Est Proj Proj Proj Proj Proj
CURRENT ACCOUNT BALANCE -407.1 -5720.2 -5384.9 -3321.5 2 814.0 1882.5 1151.3
Balance of Trade in Goods and Services 318.9 -5288.7 - 4913.6 -2734.0 3824.4 2933.0 2274.7
Goods Balance 6342.9 1203.7 1868.5 4053.7 10422.2 9821.2 9062.3
Credit (Exports) 16396.0 11327.0 12296.7 14750.4 22104.3 22313.2 22542.3
Debit (Imports) -10053.1 -10123.3 -10428.1 -10696.7 -11682.2 -12492.0 -13480.1
Services Balance -6024.0 -6492.4 -6782.2 -6787.7 -6597.7 -6888.1 -6787.6
Services Credit 1006.0 1023.7 1117.8 1200.3 1293.4 1412.8 1548.6
Services Debit -7030.0 -7516.1 -7900.0 -7988.0 -7891.2 -8300.9 -8336.2
Income Balance -1305.0 -1082.9 -1189.3 -1362.1 -1817.4 -1922.3 -2033.7
Income Credit 95.0 57.1 60.6 63.4 117.4 122.5 127.5
Income Debit -1400.0 -1140.0 -1249.9 -1425.5 -1934.8 -2044.7 -2161.2
Transfers Balance 579.0 651.3 718.0 774.6 807.0 871.8 910.3
Transfers Credit 1368.0 1339.3 1462.0 1569.1 1680.3 1832.5 1971.4
Transfers Debit -789.0 -688.0 -744.0 -794.5 -873.3 -960.8 -1061.1
CAPITAL AND FINANCIAL ACCOUNT (a) 1599.0 5720.2 5384.9 3321.5 -2814.0 -1882.5 -1151.3
NET ERRORS AND OMISSIONS -96.0 0.0 0.0 0.0 0.0 0.0 0.0
Current account balance as percentage -1.3 -17.5 -15.1 -8.4 5.6 3.5 2.0
of Gross Domestic Product (GDP)
Source : Actuals from BPNG. Estimates & Projections from Dept. of Treasury.
(a) Capital and Financial Account includes changes in reserves.
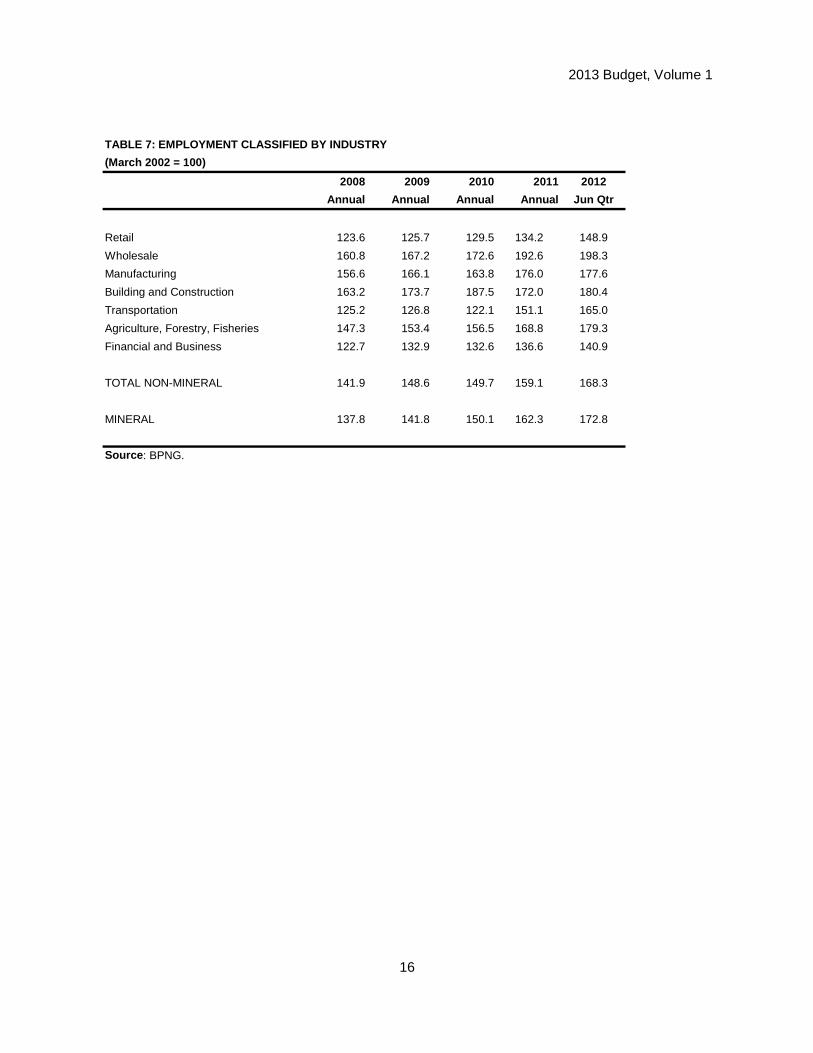
2013 Budget, Volume 1
16
TABLE 7: EMPLOYMENT CLASSIFIED BY INDUSTRY
(March 2002 = 100)
2008 2009 2010 2011 2012
Annual Annual Annual Annual Jun Qtr
Retail 123.6 125.7 129.5 134.2 148.9
Wholesale 160.8 167.2 172.6 192.6 198.3
Manufacturing 156.6 166.1 163.8 176.0 177.6
Building and Construction 163.2 173.7 187.5 172.0 180.4
Transportation 125.2 126.8 122.1 151.1 165.0
Agriculture, Forestry, Fisheries 147.3 153.4 156.5 168.8 179.3
Financial and Business 122.7 132.9 132.6 136.6 140.9
TOTAL NON-MINERAL 141.9 148.6 149.7 159.1 168.3
MINERAL 137.8 141.8 150.1 162.3 172.8
Source : BPNG.
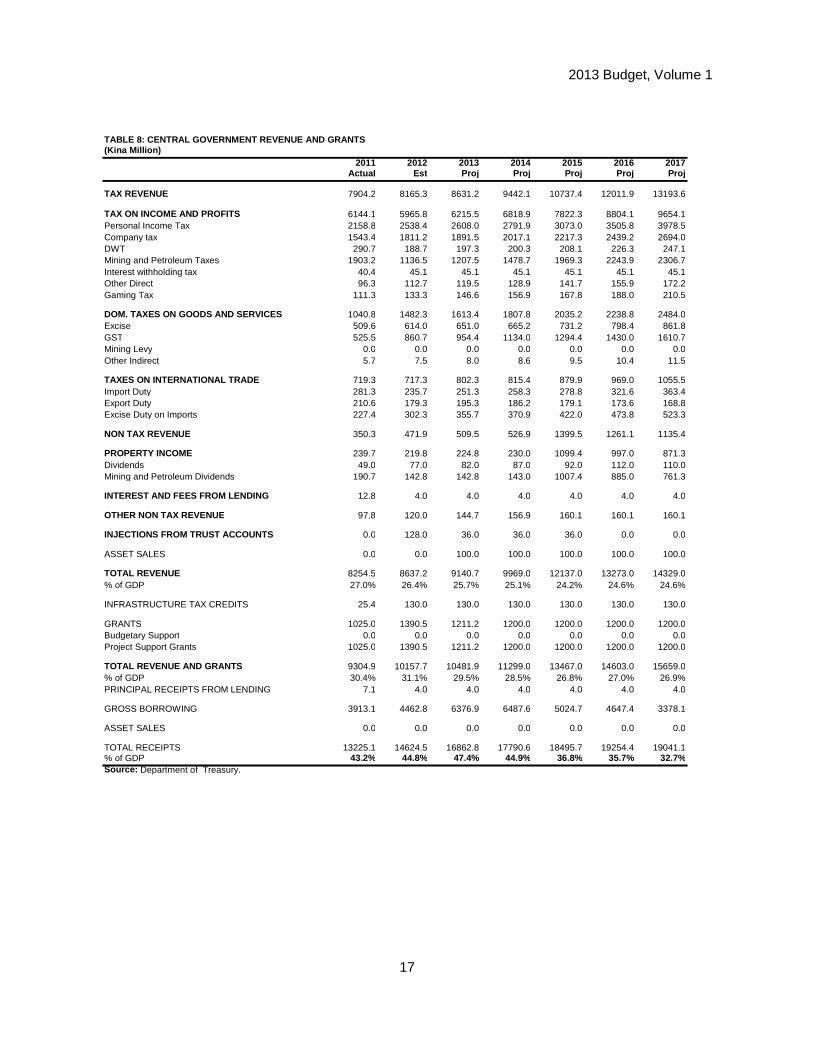
2013 Budget, Volume 1
17
TABLE 8: CENTRAL GOVERNMENT REVENUE AND GRANTS(Kina Million)
2011 2012 2013 2014 2015 2016 2017Actual Est Proj Proj Proj Proj Proj
TAX REVENUE 7904.2 8165.3 8631.2 9442.1 10737.4 12011.9 13193.6
TAX ON INCOME AND PROFITS 6144.1 5965.8 6215.5 6818.9 7822.3 8804.1 9654.1Personal Income Tax 2158.8 2538.4 2608.0 2791.9 3073.0 3505.8 3978.5Company tax 1543.4 1811.2 1891.5 2017.1 2217.3 2439.2 2694.0DWT 290.7 188.7 197.3 200.3 208.1 226.3 247.1Mining and Petroleum Taxes 1903.2 1136.5 1207.5 1478.7 1969.3 2243.9 2306.7Interest withholding tax 40.4 45.1 45.1 45.1 45.1 45.1 45.1Other Direct 96.3 112.7 119.5 128.9 141.7 155.9 172.2Gaming Tax 111.3 133.3 146.6 156.9 167.8 188.0 210.5
DOM. TAXES ON GOODS AND SERVICES 1040.8 1482.3 1613.4 1807.8 2035.2 2238.8 2484.0Excise 509.6 614.0 651.0 665.2 731.2 798.4 861.8GST 525.5 860.7 954.4 1134.0 1294.4 1430.0 1610.7Mining Levy 0.0 0.0 0.0 0.0 0.0 0.0 0.0Other Indirect 5.7 7.5 8.0 8.6 9.5 10.4 11.5
TAXES ON INTERNATIONAL TRADE 719.3 717.3 802.3 815.4 879.9 969.0 1055.5Import Duty 281.3 235.7 251.3 258.3 278.8 321.6 363.4Export Duty 210.6 179.3 195.3 186.2 179.1 173.6 168.8Excise Duty on Imports 227.4 302.3 355.7 370.9 422.0 473.8 523.3
NON TAX REVENUE 350.3 471.9 509.5 526.9 1399.5 1261.1 1135.4
PROPERTY INCOME 239.7 219.8 224.8 230.0 1099.4 997.0 871.3Dividends 49.0 77.0 82.0 87.0 92.0 112.0 110.0Mining and Petroleum Dividends 190.7 142.8 142.8 143.0 1007.4 885.0 761.3
INTEREST AND FEES FROM LENDING 12.8 4.0 4.0 4.0 4.0 4.0 4.0
OTHER NON TAX REVENUE 97.8 120.0 144.7 156.9 160.1 160.1 160.1
INJECTIONS FROM TRUST ACCOUNTS 0.0 128.0 36.0 36.0 36.0 0.0 0.0
ASSET SALES 0.0 0.0 100.0 100.0 100.0 100.0 100.0
TOTAL REVENUE 8254.5 8637.2 9140.7 9969.0 12137.0 13273.0 14329.0% of GDP 27.0% 26.4% 25.7% 25.1% 24.2% 24.6% 24.6%
INFRASTRUCTURE TAX CREDITS 25.4 130.0 130.0 130.0 130.0 130.0 130.0
GRANTS 1025.0 1390.5 1211.2 1200.0 1200.0 1200.0 1200.0Budgetary Support 0.0 0.0 0.0 0.0 0.0 0.0 0.0Project Support Grants 1025.0 1390.5 1211.2 1200.0 1200.0 1200.0 1200.0
TOTAL REVENUE AND GRANTS 9304.9 10157.7 10481.9 11299.0 13467.0 14603.0 15659.0% of GDP 30.4% 31.1% 29.5% 28.5% 26.8% 27.0% 26.9%PRINCIPAL RECEIPTS FROM LENDING 7.1 4.0 4.0 4.0 4.0 4.0 4.0
GROSS BORROWING 3913.1 4462.8 6376.9 6487.6 5024.7 4647.4 3378.1
ASSET SALES 0.0 0.0 0.0 0.0 0.0 0.0 0.0
TOTAL RECEIPTS 13225.1 14624.5 16862.8 17790.6 18495.7 19254.4 19041.1% of GDP 43.2% 44.8% 47.4% 44.9% 36.8% 35.7% 32.7%Source: Department of Treasury.
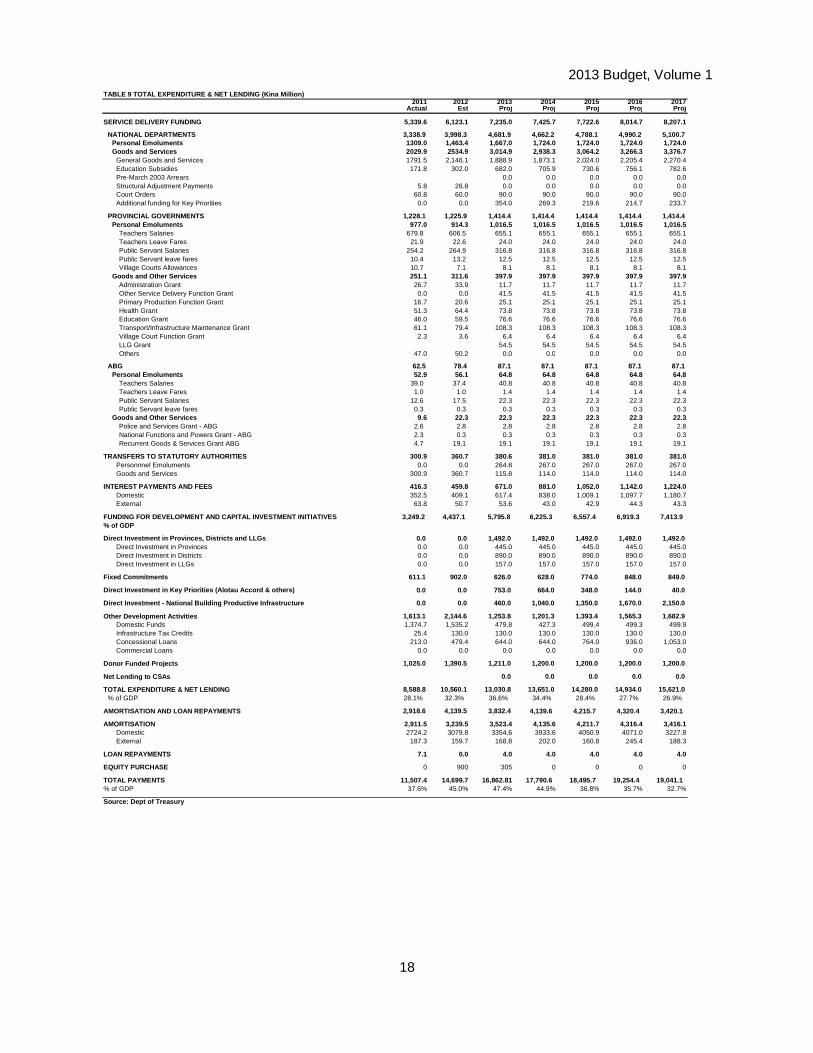
2013 Budget, Volume 1
18
TABLE 9 TOTAL EXPENDITURE & NET LENDING (Kina Milli on)2011 2012 2013 2014 2015 2016 2017
Actual Est Proj Proj Proj Proj Proj
SERVICE DELIVERY FUNDING 5,339.6 6,123.1 7,235.0 7,425.7 7,722.6 8,014.7 8,207.1
NATIONAL DEPARTMENTS 3,338.9 3,998.3 4,681.9 4,662.2 4,788.1 4,990.2 5,100.7Personal Emoluments 1309.0 1,463.4 1,667.0 1,724.0 1,724.0 1,724.0 1,724.0Goods and Services 2029.9 2534.9 3,014.9 2,938.3 3,064.2 3,266.3 3,376.7
General Goods and Services 1791.5 2,146.1 1,888.9 1,873.1 2,024.0 2,205.4 2,270.4Education Subsidies 171.8 302.0 682.0 705.9 730.6 756.1 782.6Pre-March 2003 Arrears 0.0 0.0 0.0 0.0 0.0Structural Adjustment Payments 5.8 26.8 0.0 0.0 0.0 0.0 0.0Court Orders 60.8 60.0 90.0 90.0 90.0 90.0 90.0Additional funding for Key Priorities 0.0 0.0 354.0 269.3 219.6 214.7 233.7
PROVINCIAL GOVERNMENTS 1,228.1 1,225.9 1,414.4 1,414.4 1,414.4 1,414.4 1,414.4Personal Emoluments 977.0 914.3 1,016.5 1,016.5 1,016.5 1,016.5 1,016.5
Teachers Salaries 679.8 606.5 655.1 655.1 655.1 655.1 655.1 Teachers Leave Fares 21.9 22.6 24.0 24.0 24.0 24.0 24.0 Public Servant Salaries 254.2 264.9 316.8 316.8 316.8 316.8 316.8 Public Servant leave fares 10.4 13.2 12.5 12.5 12.5 12.5 12.5 Village Courts Allowances 10.7 7.1 8.1 8.1 8.1 8.1 8.1
Goods and Other Services 251.1 311.6 397.9 397.9 397.9 397.9 397.9 Administration Grant 26.7 33.9 11.7 11.7 11.7 11.7 11.7 Other Service Delivery Function Grant 0.0 0.0 41.5 41.5 41.5 41.5 41.5 Primary Production Function Grant 16.7 20.6 25.1 25.1 25.1 25.1 25.1 Health Grant 51.3 64.4 73.8 73.8 73.8 73.8 73.8 Education Grant 46.0 59.5 76.6 76.6 76.6 76.6 76.6 Transport/Infrastructure Maintenance Grant 61.1 79.4 108.3 108.3 108.3 108.3 108.3 Village Court Function Grant 2.3 3.6 6.4 6.4 6.4 6.4 6.4 LLG Grant 54.5 54.5 54.5 54.5 54.5 Others 47.0 50.2 0.0 0.0 0.0 0.0 0.0
ABG 62.5 78.4 87.1 87.1 87.1 87.1 87.1Personal Emoluments 52.9 56.1 64.8 64.8 64.8 64.8 64.8
Teachers Salaries 39.0 37.4 40.8 40.8 40.8 40.8 40.8 Teachers Leave Fares 1.0 1.0 1.4 1.4 1.4 1.4 1.4 Public Servant Salaries 12.6 17.5 22.3 22.3 22.3 22.3 22.3 Public Servant leave fares 0.3 0.3 0.3 0.3 0.3 0.3 0.3
Goods and Other Services 9.6 22.3 22.3 22.3 22.3 22.3 22.3 Police and Services Grant - ABG 2.6 2.8 2.8 2.8 2.8 2.8 2.8 National Functions and Powers Grant - ABG 2.3 0.3 0.3 0.3 0.3 0.3 0.3 Recurrent Goods & Services Grant ABG 4.7 19.1 19.1 19.1 19.1 19.1 19.1
TRANSFERS TO STATUTORY AUTHORITIES 300.9 360.7 380.6 381.0 381.0 381.0 381.0Personnnel Emoluments 0.0 0.0 264.8 267.0 267.0 267.0 267.0Goods and Services 300.9 360.7 115.8 114.0 114.0 114.0 114.0
INTEREST PAYMENTS AND FEES 416.3 459.8 671.0 881.0 1,052.0 1,142.0 1,224.0Domestic 352.5 409.1 617.4 838.0 1,009.1 1,097.7 1,180.7External 63.8 50.7 53.6 43.0 42.9 44.3 43.3
FUNDING FOR DEVELOPMENT AND CAPITAL INVESTMENT INIT IATIVES 3,249.2 4,437.1 5,795.8 6,225.3 6,557.4 6,919.3 7,413.9 % of GDP
Direct Investment in Provinces, Districts and LLGs 0.0 0.0 1,492.0 1,492.0 1,492.0 1,492.0 1,492.0Direct Investment in Provinces 0.0 0.0 445.0 445.0 445.0 445.0 445.0Direct Investment in Districts 0.0 0.0 890.0 890.0 890.0 890.0 890.0Direct Investment in LLGs 0.0 0.0 157.0 157.0 157.0 157.0 157.0
Fixed Commitments 611.1 902.0 626.0 628.0 774.0 848.0 849.0
Direct Investment in Key Priorities (Alotau Accord & others) 0.0 0.0 753.0 664.0 348.0 144.0 40.0
Direct Investment - National Building Productive In frastructure 0.0 0.0 460.0 1,040.0 1,350.0 1,670.0 2,150.0
Other Development Activities 1,613.1 2,144.6 1,253.8 1,201.3 1,393.4 1,565.3 1,682.9Domestic Funds 1,374.7 1,535.2 479.8 427.3 499.4 499.3 499.9Infrastructure Tax Credits 25.4 130.0 130.0 130.0 130.0 130.0 130.0Concessional Loans 213.0 479.4 644.0 644.0 764.0 936.0 1,053.0Commercial Loans 0.0 0.0 0.0 0.0 0.0 0.0 0.0
Donor Funded Projects 1,025.0 1,390.5 1,211.0 1,200.0 1,200.0 1,200.0 1,200.0
Net Lending to CSAs 0.0 0.0 0.0 0.0 0.0
TOTAL EXPENDITURE & NET LENDING 8,588.8 10,560.1 13,030.8 13,651.0 14,280.0 14,934.0 15,621.0% of GDP 28.1% 32.3% 36.6% 34.4% 28.4% 27.7% 26.9%
AMORTISATION AND LOAN REPAYMENTS 2,918.6 4,139.5 3,832.4 4,139.6 4,215.7 4,320.4 3,420.1
AMORTISATION 2,911.5 3,239.5 3,523.4 4,135.6 4,211.7 4,316.4 3,416.1Domestic 2724.2 3079.8 3354.6 3933.6 4050.9 4071.0 3227.8External 187.3 159.7 168.8 202.0 160.8 245.4 188.3
LOAN REPAYMENTS 7.1 0.0 4.0 4.0 4.0 4.0 4.0
EQUITY PURCHASE 0 900 305 0 0 0 0
TOTAL PAYMENTS 11,507.4 14,699.7 16,862.81 17,790.6 18,495.7 19,254.4 19,041.1 % of GDP 37.6% 45.0% 47.4% 44.9% 36.8% 35.7% 32.7%
Source: Dept of Treasury
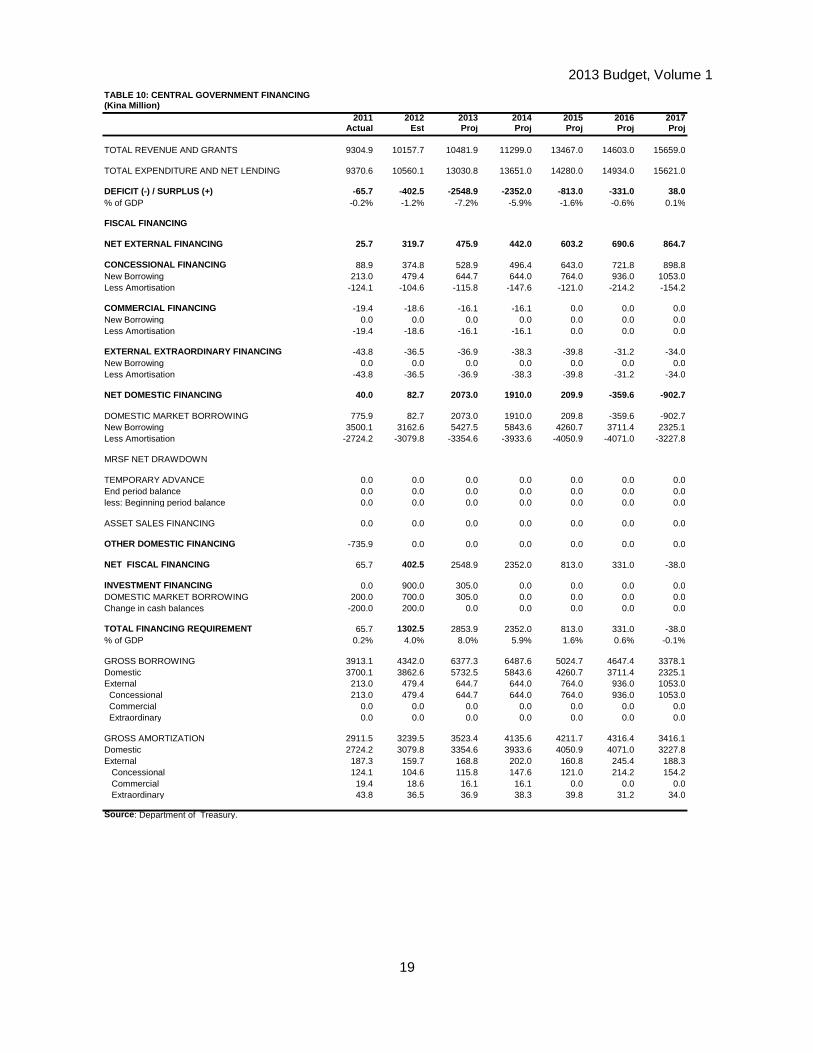
2013 Budget, Volume 1
19
TABLE 10: CENTRAL GOVERNMENT FINANCING(Kina Million)
2011 2012 2013 2014 2015 2016 2017Actual Est Proj Proj Proj Proj Proj
TOTAL REVENUE AND GRANTS 9304.9 10157.7 10481.9 11299.0 13467.0 14603.0 15659.0
TOTAL EXPENDITURE AND NET LENDING 9370.6 10560.1 13030.8 13651.0 14280.0 14934.0 15621.0
DEFICIT (-) / SURPLUS (+) -65.7 -402.5 -2548.9 -2352.0 -813.0 -331.0 38.0% of GDP -0.2% -1.2% -7.2% -5.9% -1.6% -0.6% 0.1%
FISCAL FINANCING
NET EXTERNAL FINANCING 25.7 319.7 475.9 442.0 603.2 690.6 864.7
CONCESSIONAL FINANCING 88.9 374.8 528.9 496.4 643.0 721.8 898.8New Borrowing 213.0 479.4 644.7 644.0 764.0 936.0 1053.0Less Amortisation -124.1 -104.6 -115.8 -147.6 -121.0 -214.2 -154.2
COMMERCIAL FINANCING -19.4 -18.6 -16.1 -16.1 0.0 0.0 0.0New Borrowing 0.0 0.0 0.0 0.0 0.0 0.0 0.0Less Amortisation -19.4 -18.6 -16.1 -16.1 0.0 0.0 0.0
EXTERNAL EXTRAORDINARY FINANCING -43.8 -36.5 -36.9 -38.3 -39.8 -31.2 -34.0New Borrowing 0.0 0.0 0.0 0.0 0.0 0.0 0.0Less Amortisation -43.8 -36.5 -36.9 -38.3 -39.8 -31.2 -34.0
NET DOMESTIC FINANCING 40.0 82.7 2073.0 1910.0 209.9 -359.6 -902.7
DOMESTIC MARKET BORROWING 775.9 82.7 2073.0 1910.0 209.8 -359.6 -902.7New Borrowing 3500.1 3162.6 5427.5 5843.6 4260.7 3711.4 2325.1Less Amortisation -2724.2 -3079.8 -3354.6 -3933.6 -4050.9 -4071.0 -3227.8
MRSF NET DRAWDOWN
TEMPORARY ADVANCE 0.0 0.0 0.0 0.0 0.0 0.0 0.0End period balance 0.0 0.0 0.0 0.0 0.0 0.0 0.0less: Beginning period balance 0.0 0.0 0.0 0.0 0.0 0.0 0.0
ASSET SALES FINANCING 0.0 0.0 0.0 0.0 0.0 0.0 0.0
OTHER DOMESTIC FINANCING -735.9 0.0 0.0 0.0 0.0 0.0 0.0
NET FISCAL FINANCING 65.7 402.5 2548.9 2352.0 813.0 331.0 -38.0
INVESTMENT FINANCING 0.0 900.0 305.0 0.0 0.0 0.0 0.0DOMESTIC MARKET BORROWING 200.0 700.0 305.0 0.0 0.0 0.0 0.0Change in cash balances -200.0 200.0 0.0 0.0 0.0 0.0 0.0
TOTAL FINANCING REQUIREMENT 65.7 1302.5 2853.9 2352.0 813.0 331.0 -38.0% of GDP 0.2% 4.0% 8.0% 5.9% 1.6% 0.6% -0.1%
GROSS BORROWING 3913.1 4342.0 6377.3 6487.6 5024.7 4647.4 3378.1Domestic 3700.1 3862.6 5732.5 5843.6 4260.7 3711.4 2325.1External 213.0 479.4 644.7 644.0 764.0 936.0 1053.0 Concessional 213.0 479.4 644.7 644.0 764.0 936.0 1053.0 Commercial 0.0 0.0 0.0 0.0 0.0 0.0 0.0 Extraordinary 0.0 0.0 0.0 0.0 0.0 0.0 0.0
GROSS AMORTIZATION 2911.5 3239.5 3523.4 4135.6 4211.7 4316.4 3416.1Domestic 2724.2 3079.8 3354.6 3933.6 4050.9 4071.0 3227.8External 187.3 159.7 168.8 202.0 160.8 245.4 188.3
Concessional 124.1 104.6 115.8 147.6 121.0 214.2 154.2Commercial 19.4 18.6 16.1 16.1 0.0 0.0 0.0Extraordinary 43.8 36.5 36.9 38.3 39.8 31.2 34.0
Source : Department of Treasury.
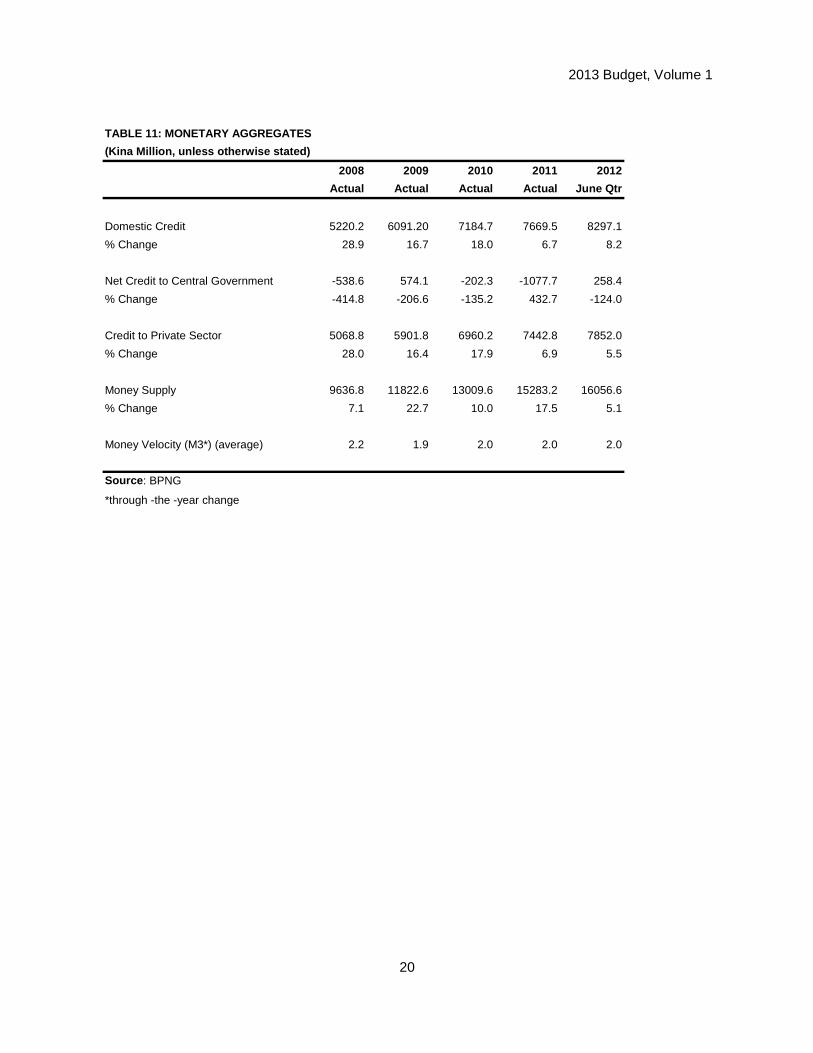
2013 Budget, Volume 1
20
TABLE 11: MONETARY AGGREGATES
(Kina Million, unless otherwise stated)
2008 2009 2010 2011 2012
Actual Actual Actual Actual June Qtr
Domestic Credit 5220.2 6091.20 7184.7 7669.5 8297.1
% Change 28.9 16.7 18.0 6.7 8.2
Net Credit to Central Government -538.6 574.1 -202.3 -1077.7 258.4
% Change -414.8 -206.6 -135.2 432.7 -124.0
Credit to Private Sector 5068.8 5901.8 6960.2 7442.8 7852.0
% Change 28.0 16.4 17.9 6.9 5.5
Money Supply 9636.8 11822.6 13009.6 15283.2 16056.6
% Change 7.1 22.7 10.0 17.5 5.1
Money Velocity (M3*) (average) 2.2 1.9 2.0 2.0 2.0
Source : BPNG
*through -the -year change
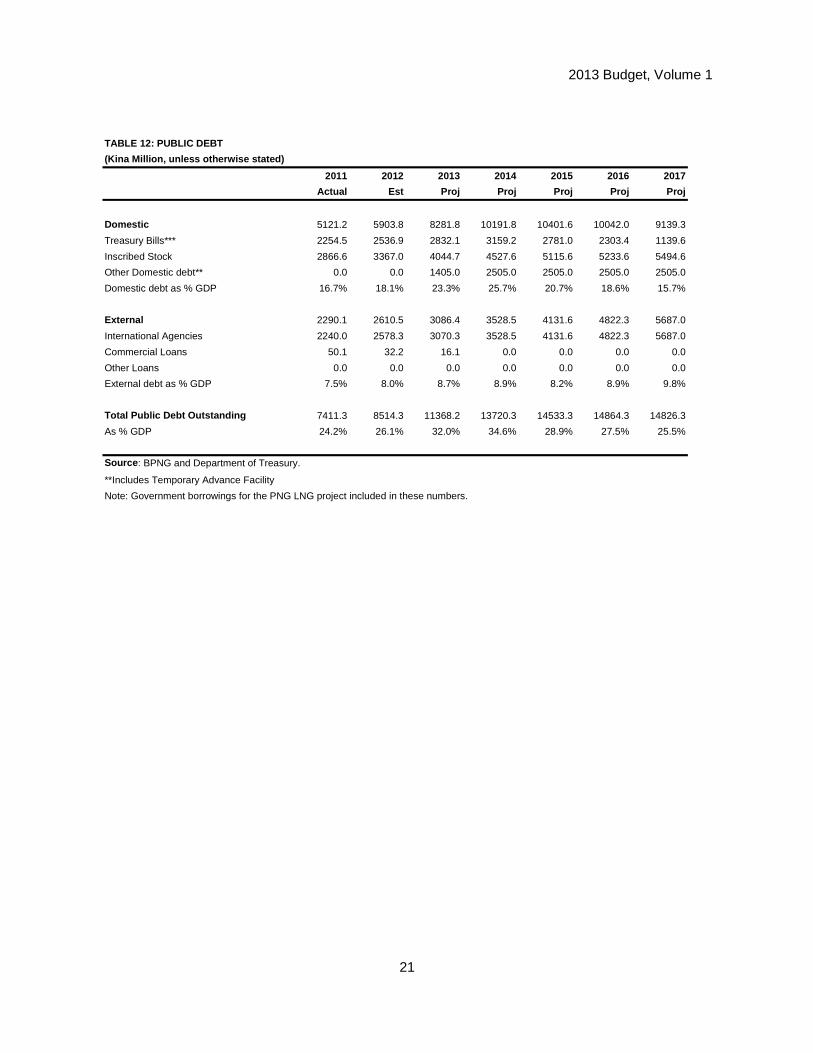
2013 Budget, Volume 1
21
TABLE 12: PUBLIC DEBT
(Kina Million, unless otherwise stated)
2011 2012 2013 2014 2015 2016 2017
Actual Est Proj Proj Proj Proj Proj
Domestic 5121.2 5903.8 8281.8 10191.8 10401.6 10042.0 9139.3
Treasury Bills*** 2254.5 2536.9 2832.1 3159.2 2781.0 2303.4 1139.6
Inscribed Stock 2866.6 3367.0 4044.7 4527.6 5115.6 5233.6 5494.6
Other Domestic debt** 0.0 0.0 1405.0 2505.0 2505.0 2505.0 2505.0
Domestic debt as % GDP 16.7% 18.1% 23.3% 25.7% 20.7% 18.6% 15.7%
External 2290.1 2610.5 3086.4 3528.5 4131.6 4822.3 5687.0
International Agencies 2240.0 2578.3 3070.3 3528.5 4131.6 4822.3 5687.0
Commercial Loans 50.1 32.2 16.1 0.0 0.0 0.0 0.0
Other Loans 0.0 0.0 0.0 0.0 0.0 0.0 0.0
External debt as % GDP 7.5% 8.0% 8.7% 8.9% 8.2% 8.9% 9.8%
Total Public Debt Outstanding 7411.3 8514.3 11368.2 13720.3 14533.3 14864.3 14826.3
As % GDP 24.2% 26.1% 32.0% 34.6% 28.9% 27.5% 25.5%
Source : BPNG and Department of Treasury.
**Includes Temporary Advance Facility
Note: Government borrowings for the PNG LNG project included in these numbers.
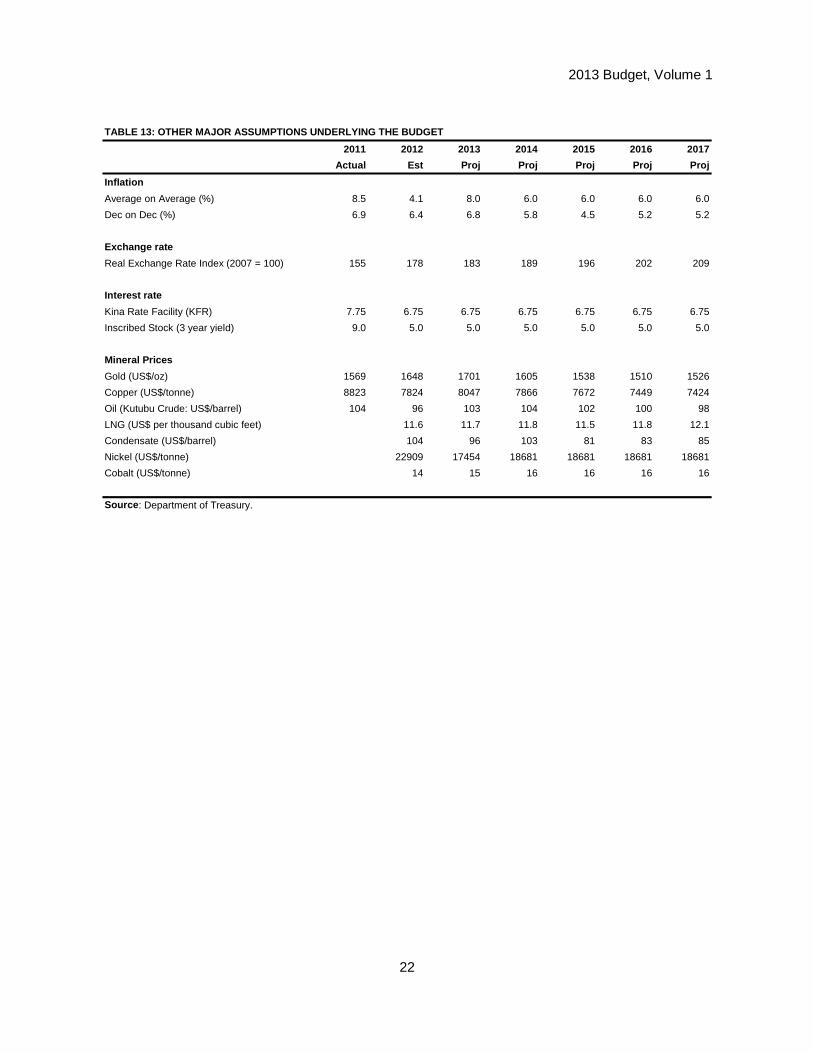
2013 Budget, Volume 1
22
TABLE 13: OTHER MAJOR ASSUMPTIONS UNDERLYING THE BU DGET
2011 2012 2013 2014 2015 2016 2017
Actual Est Proj Proj Proj Proj Proj
Inflation
Average on Average (%) 8.5 4.1 8.0 6.0 6.0 6.0 6.0
Dec on Dec (%) 6.9 6.4 6.8 5.8 4.5 5.2 5.2
Exchange rate
Real Exchange Rate Index (2007 = 100) 155 178 183 189 196 202 209
Interest rate
Kina Rate Facility (KFR) 7.75 6.75 6.75 6.75 6.75 6.75 6.75
Inscribed Stock (3 year yield) 9.0 5.0 5.0 5.0 5.0 5.0 5.0
Mineral Prices
Gold (US$/oz) 1569 1648 1701 1605 1538 1510 1526
Copper (US$/tonne) 8823 7824 8047 7866 7672 7449 7424
Oil (Kutubu Crude: US$/barrel) 104 96 103 104 102 100 98
LNG (US$ per thousand cubic feet) 11.6 11.7 11.8 11.5 11.8 12.1
Condensate (US$/barrel) 104 96 103 81 83 85
Nickel (US$/tonne) 22909 17454 18681 18681 18681 18681
Cobalt (US$/tonne) 14 15 16 16 16 16
Source : Department of Treasury.