2013 lança et al. - clear-water scour at comparatively large cylindrical piers
TRANSCRIPT

Clear-Water Scour at Comparatively Large Cylindrical PiersRui M. Lança1; Cristina S. Fael2; Rodrigo J. Maia3; João P. Pêgo4; and António H. Cardoso5
Abstract: New long-duration clear-water scour data were collected at single cylindrical piers with the objective of investigating the effect ofsediment coarseness, Dp=D50 (Dp = pier diameter; D50 = median grain size) on the equilibrium scour depth and improving the scour depthtime evolution modeling by making use of the exponential function suggested in the literature. Experiments were carried out for the flowintensity close to the threshold condition of initiation of sediment motion, imposing wide changes of sediment coarseness and flow shallow-ness, d=Dp (d = approach flow depth). The effect of sediment coarseness on the equilibrium scour depth was identified; existing predictorswere modified to incorporate this effect for U=Uc ≈ 1.0; Dp=D50 > ≈60 and d=Dp ≥ 0.5; the complete characterization of a known scourdepth time evolution model was achieved for U=Uc ≈ 1.0, 60 < Dp=D50 < 500 and 0.5 ≤ d=Dp ≤ 5.0. DOI: 10.1061/(ASCE)HY.1943-7900.0000788. © 2013 American Society of Civil Engineers.
CE Database subject headings: Bridges; Piers; Sediment; Scour.
Author keywords: Bridges; Cylindrical pier; Flow shallowness; Sediment coarseness; Local scour equilibrium depth; Local scour timeevolution.
Introduction
It is widely recognized that local scour at bridge foundations is acommon cause of bridges failure. In spite of the research efforts onthis topic during the last five or six decades, the time evolution ofscour depth and its ultimate equilibrium value remains a subject ofconcern for hydraulic engineers and researchers.
Research on local scouring has been made mostly throughexperimentation. The duration of most of the reported experimentswas too short to guarantee equilibrium; also, most of them coveredsmall sediment coarseness ratios, Dp=D50 (Dp = pier diameter;D50 = median grain size). These time and coarseness limitationsof experimental studies may be among the causes of reporteddiscrepancies between field observations and predictions obtainedthrough formulations derived from experimentation. That is re-ported, e.g., in National Cooperative Highway Research Program(NCHRP) (2011) or by Lee and Sturm (2009).
Time plays an important role in scour. It is well established that,under live-bed conditions, scour depth tends to equilibrium veryquickly, while under clear-water conditions scour evolves much
slower. Ettema (1980) identified three phases of the scouring pro-cess: the initial phase, the principal phase, and the equilibriumphase, assumed to occur when the scour depth practically doesnot increase anymore. In clear-water scour, the principal phase lastsfor a long time and the equilibrium scour depth is approachedasymptotically.
Many researchers attempted to develop equations to predictlocal scour time evolution. Franzetti et al. (1982) proposed an ex-ponential function that involves the equilibrium scour depth, dse,and two coefficients, a1 and a2. Melville and Chiew (1999) intro-duced a time factor in their scour predictor that includes the timeneeded to attain equilibrium, i.e., time to equilibrium. This timefactor was recently modified by Melville and Sheppard as reportedin NCHRP (2011). Oliveto and Hager (2002, 2005) developed apredictor that was not aimed to be valid up to the equilibrium phase.More recently, Kothyari et al. (2007) kept the structure of Olivetoand Hager’s model but included a criterion for an ultimate scourdepth which occurs at time to equilibrium.
The equilibrium concept is rather subjective and different au-thors present different approaches to cope with it. Some argue thatequilibrium is reached in a finite time (Melville and Chiew 1999;Kothyari et al. 2007). Others state that equilibrium scour cannot beachieved in a finite time (Franzetti et al. 1982) or implicitly discardthat scour depth values are upper bounded.
In this work, it is assumed that equilibrium scour is achievedin infinite time. The question of how long should experimentslast to sufficiently approach equilibrium emerges. According toLança et al. (2010), the extrapolation to infinite time of at leastseven-day-long scour depth records, adjusted by a six-parameterpolynomial function, renders robust values of the equilibriumscour-depth at single cylindrical piers characterized by Dp in therange 63 mm <Dp < 80 mm, d=Dp ≈ 2.0 and 49 <Dp=D50 < 93.Simarro et al. (2011) performed a comparative study of differentcontributions and concluded that the exponential function ofFranzetti et al. (1982) describes scour-depth time evolution witha noticeable precision, with the advantage of using only twocoefficients (a1 and a2) and the equilibrium scour depth, dse. Inthis study, coefficients a1 and a2, as well as dse, are postulatedto depend on the parameters that control scouring.
1Assistant Professor, Departamento de Engenharia Civil, InstitutoSuperior de Engenharia, Universidade do Algarve, Campus da Penha, Faro8005-139, Portugal (corresponding author). E-mail: [email protected]
2Assistant Professor, Departamento de Engenharia Civil e Arquitetura,Faculdade de Engenharia, Universidade da Beira Interior, Calçada Fonte doLameiro, Covilhã 6200-358, Portugal. E-mail: [email protected]
3Associate Professor, Departamento de Engenharia Civil, Faculdadede Engenharia, Universidade do Porto, Rua Dr. Roberto Frias, s/n, Porto4200-465, Portugal. E-mail: [email protected]
4Assistant Professor, Departamento de Engenharia Civil, Faculdadede Engenharia, Universidade do Porto, Rua Dr. Roberto Frias, s/n, Porto4200-465, Portugal. E-mail: [email protected]
5Full Professor, Departamento de Engenharia Civil, Instituto SuperiorTécnico, Universidade de Lisboa, Av. Rovisco Pais, 1, Lisbon 1049-001,Portugal. E-mail: [email protected]
Note. This manuscript was submitted on October 1, 2012; approved onJune 4, 2013; published online on June 6, 2013. Discussion period open untilApril 1, 2014; separate discussions must be submitted for individual papers.This paper is part of the Journal of Hydraulic Engineering, Vol. 139, No. 11,November 1, 2013. © ASCE, ISSN 0733-9429/2013/11-1117-1125/$25.00.
JOURNAL OF HYDRAULIC ENGINEERING © ASCE / NOVEMBER 2013 / 1117
J. Hydraul. Eng. 2013.139:1117-1125.
Dow
nloa
ded
from
asc
elib
rary
.org
by
Uni
vers
idad
de
los
And
es o
n 10
/16/
13. C
opyr
ight
ASC
E. F
or p
erso
nal u
se o
nly;
all
righ
ts r
eser
ved.

The practical use of the exponential function requires a prioriknowledge of the equilibrium scour depth (Franzetti et al. 1982).Important studies on scouring (e.g., Ettema 1980; Melville andChiew 1999) have successively assumed that the normalized equilib-rium scour depth, dse=Dp, does not depend on the sediment coarse-ness ratio,Dp=D50, forDp=D50 > ∼50. This view has been disputedin the last decade by, e.g., Sheppard et al. (1995, 1999, 2004) and Leeand Sturm (2009). According to those studies, dse=Dp decreaseswith increasing sediment coarseness ratio, for Dp=D50 > ∼50.
In spite of those recent contributions, there is still lack of infor-mation on scouring for comparatively high sediment coarsenessratios. The explanation is as follows: for clear water scour, closeto the condition of initiation of motion, bed sediment must be suchthatD50 > ∼0.6 mm to avoid ripples; consequently, large sedimentcoarseness ratios require large values of the pier diameter, Dp, andof the approach flow depth, d, in order to satisfy the simultaneousneed to simulate realistic values of flow shallowness, d=Dp. Also,in order to avoid wall and contraction effects—for large pier diam-eter and flow depth—wide facilities and flow discharges, that donot exist in most laboratories, are needed.
In this study, the availability of two comparatively large flumesrendered possible to generate additional scour data for valuesof sediment coarseness ratio in the range 58 ≤ Dp=D50 ≤ 465,while covering flow shallowness values, d=Dp, in the range0.5 ≤ d=Dp ≤ 5.0, for flow intensity,U=Uc (U = average approachflow velocity; Uc = critical average velocity for the beginning ofsediment motion), close to the condition of initiation of motion(U=Uc ≈ 1). A total of 38 tests lasting between 7 and 14 days wererun for this purpose.
The data of this study were obtained with the specific objectivesof (1) revisiting the influence of sediment coarseness on the equi-librium scour depth and (2) improving scour depth time evolutionmodeling by making use of the exponential function suggested byFranzetti et al. (1982).
Framework for Analysis
Pier scour depth at a given instant, t, can be described by the fol-lowing set of independent variables:
ds ¼ φ
� flowðd; Se; gÞ; fluidðρ; νÞ; bed materialðD50;σD; ρsÞ;pierðDp;Kθ;KsÞ; channelðB; S0;KgÞ; timeðtÞ
�
ð1Þwhere apart from the variables already defined, ds = scour depth atinstant t; Se = slope of the energy line; g = acceleration of gravity;ρ and ν = fluid density and kinematic viscosity, respectively; σD =gradation coefficient of the bed material; ρs = sediment density; Kθand Ks = coefficients expressing pier alignment and shape, respec-tively; B = channel width; S0 = channel bed slope; and Kg =coefficient describing the geometry of the channel cross section.
For uniform flows in wide rectangular channels, Se ¼ S0,Kg ¼ 1, and B does not influence scour. In this context, wide chan-nels are those where the effects of flow contraction due to the pres-ence of piers as well as wall effects are negligible. For clear-waterflat bed flows, Se can be replaced by both the friction velocity,u� ¼ ðgdSeÞ0.5, or the average approach flow velocity, U. If thebed material is composed of uniform, non-ripple-forming sand,which implies D50 > ∼0.6 mm, σD < 1.5 and ρs≈ constant, thenσD and ρs can be eliminated from Eq. (1). For cylindrical piers,Ks ¼ 1 and Kθ ¼ 1. In the case of fully developed flow on a flatbed, where the relation u�=u�c ¼ U=Uc (u�c = critical bed shearvelocity for sediment entrainment) holds, and keeping in mind
Shields’ diagram as well as assuming that within the scour holethe flow is fully rough irrespective of the approach flow regime,it can be assumed that the kinematic viscosity, ν, no longer influ-ences the scouring process.
Under these assumptions, Eq. (1) can be transformed into (Fael2007)
dsDp
¼ φ
�dDp
;UUc
;Dp
D50
;UtDp
�ð2Þ
ForU=Uc = constant (usually U=Uc ≈ 1.0 in laboratory conditionsso as to maximize the scour depth), nondimensional equilibriumscour depth reads
dseDp
¼ φ1
�dDp
;Dp
D50
�ð3Þ
since t no longer interferes.The first objective of this study aims, in practice, at the im-
proved characterization of Eq. (3). The second objective consistsof further specifying the model suggested by Franzetti et al.(1982), in the sequence of the findings of Simarro et al. (2011).The model reads
dsdse
¼ 1 − exp
�−a1
�UtDp
�a2�
ð4Þ
According to the original reference, a2 should be constant(a2 ≈ 1=3), while a1 is rather small and varies in the range0.021 < a1 < 0.042. By comparing Eqs. (2) and (4), it becomes ob-vious that the model suggested by Franzetti et al. (1982) may becompleted by relating a1 and a2 with the parameters that do notexplicitly appear in Eq. (4), i.e., the flow shallowness, d=Dp,and the sediment coarseness ratio, Dp=D50. For U=Uc = constant,it seems reasonable to assume, a priori, that
a1 ¼ φ2
�dDp
;Dp
D50
�ð5Þ
a2 ¼ φ3
�dDp
;Dp
D50
�ð6Þ
The experiments reported herein were designed so as to contrib-ute to the definition of the functional relations φ1, φ2, and φ3 ofEqs. (3), (5), and (6), respectively.
Experimental Setup and Procedure
Two flumes were used in the experimental study. One, located atthe University of Beira Interior, is 28.00 m long, 2.00 m wide, and1.00 m deep. Discharge was measured by an electromagnetic flowmeter with an accuracy of �0.5% of full scale. At the entrance ofthe flume, two honeycomb diffusers aligned with the flow directionsmoothed the flow trajectories and guaranteed a uniform transver-sal flow distribution. Immediately downstream from the diffusers, a5.00-m-long bed reach was covered with small gravel to provideproper roughness and guarantee fully developed flow. The centralreach of the flume, starting at 14.00 m from the entrance, includes a3.00-m-long, 2.00-m-wide, and 0.60-m-deep recess box in thechannel bed. At the downstream end of the flume, a tailgate allowsthe regulation of the water depth.
Single vertical cylindrical piers were simulated by PVC pipeswith diameters Dp ¼ ½50,75,110,160,200,250,315,350,400mm�,placed at ∼1.0 m from the upstream boundary of the bed recess box.
1118 / JOURNAL OF HYDRAULIC ENGINEERING © ASCE / NOVEMBER 2013
J. Hydraul. Eng. 2013.139:1117-1125.
Dow
nloa
ded
from
asc
elib
rary
.org
by
Uni
vers
idad
de
los
And
es o
n 10
/16/
13. C
opyr
ight
ASC
E. F
or p
erso
nal u
se o
nly;
all
righ
ts r
eser
ved.
The second flume, located at the University of Porto, is 33.15 mlong, 1.00 m wide, and 1.0 m deep; its central reach starts at16.00 m from the entrance. Provisions similar to the ones describedabove for the 2.0-m-wide flume (honeycomb and floor roughness)were installed to guarantee similar working conditions for the flowrecirculation circuit on this flume. The recess box is 3.20 m long,1.0 m wide and 0.35 m deep. The maximum pier diameter was200 mm, so as to minimize contraction effects.
A uniform quartz sand (ρs ¼ 2,650 kg m−3; D50 ¼ 0.86 mm;σD ¼ 1.36) was used to fill each of the recess boxes of the twochannels. Prior to each experiment, the sand bed was perfectlyleveled. The area located around the pier was covered with a thinmetallic plate to avoid uncontrolled scour at the beginning of eachexperiment. The flumes were filled gradually, imposing a highwater depth and low flow velocity. The discharge correspondingto the chosen approach flow velocity was then adjusted to passthrough the flumes. The flow depth was regulated by adjustingthe downstream tailgates. Once the discharge and flow depth wereestablished, the metallic plates were removed and the experimentsstarted.
Scour immediately initiated and the depth of scour hole wasmeasured, to an accuracy of �1 mm, with adapted point gauges,approximately every 5 minutes during the first hour. Afterwards,the interval between measurements increased and, after the first
day, only a few measurements were carried out each day. Whenthe scour rate was less than approximately 2 mm (≈2D50) in24 hours and at least 7 days had passed, the experiments werestopped. The sand bed approach reach located upstream of the piersstayed undisturbed through the entire duration of the experiments;this long-term stability ensured that the scour depth was not sup-plemented by upstream bed degradation.
Results and Discussion
Data Characterization
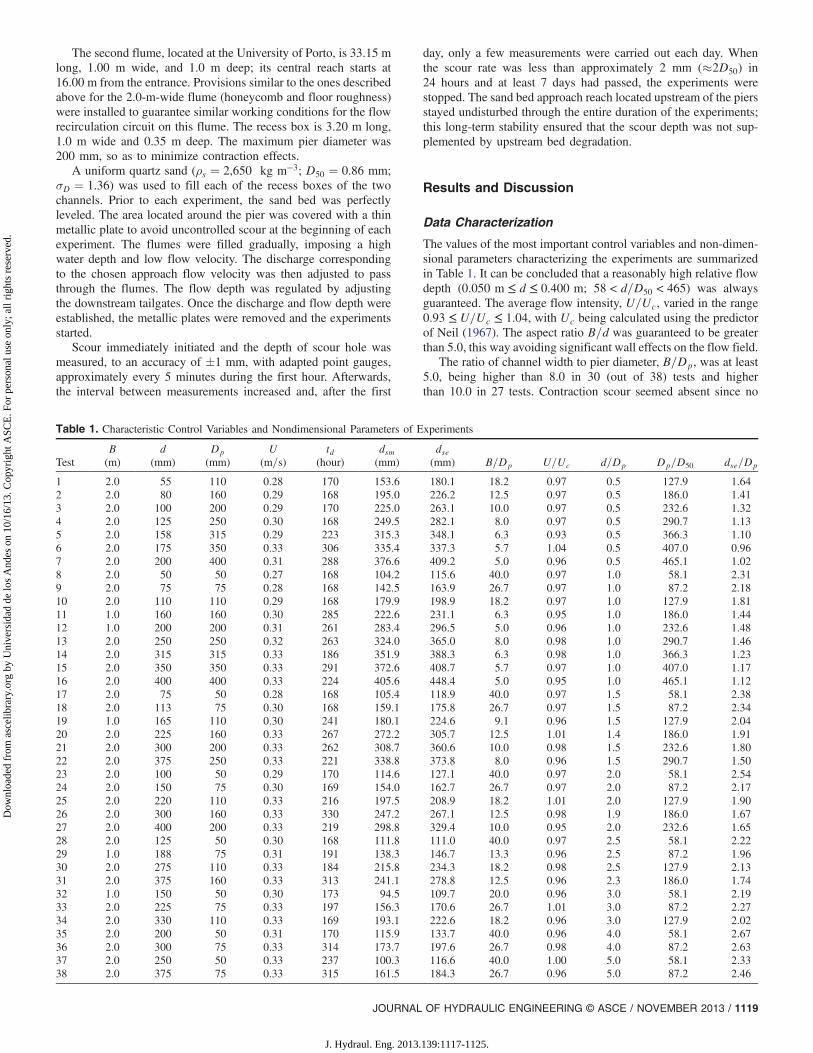
The values of the most important control variables and non-dimen-sional parameters characterizing the experiments are summarizedin Table 1. It can be concluded that a reasonably high relative flowdepth (0.050 m ≤ d ≤ 0.400 m; 58 < d=D50 < 465) was alwaysguaranteed. The average flow intensity, U=Uc, varied in the range0.93 ≤ U=Uc ≤ 1.04, with Uc being calculated using the predictorof Neil (1967). The aspect ratio B=d was guaranteed to be greaterthan 5.0, this way avoiding significant wall effects on the flow field.
The ratio of channel width to pier diameter, B=Dp, was at least5.0, being higher than 8.0 in 30 (out of 38) tests and higherthan 10.0 in 27 tests. Contraction scour seemed absent since no
Table 1. Characteristic Control Variables and Nondimensional Parameters of Experiments
TestB(m)
d(mm)
Dp(mm)
U(m=s)
td(hour)
dsm(mm)
dse(mm) B=Dp U=Uc d=Dp Dp=D50 dse=Dp
1 2.0 55 110 0.28 170 153.6 180.1 18.2 0.97 0.5 127.9 1.642 2.0 80 160 0.29 168 195.0 226.2 12.5 0.97 0.5 186.0 1.413 2.0 100 200 0.29 170 225.0 263.1 10.0 0.97 0.5 232.6 1.324 2.0 125 250 0.30 168 249.5 282.1 8.0 0.97 0.5 290.7 1.135 2.0 158 315 0.29 223 315.3 348.1 6.3 0.93 0.5 366.3 1.106 2.0 175 350 0.33 306 335.4 337.3 5.7 1.04 0.5 407.0 0.967 2.0 200 400 0.31 288 376.6 409.2 5.0 0.96 0.5 465.1 1.028 2.0 50 50 0.27 168 104.2 115.6 40.0 0.97 1.0 58.1 2.319 2.0 75 75 0.28 168 142.5 163.9 26.7 0.97 1.0 87.2 2.1810 2.0 110 110 0.29 168 179.9 198.9 18.2 0.97 1.0 127.9 1.8111 1.0 160 160 0.30 285 222.6 231.1 6.3 0.95 1.0 186.0 1.4412 1.0 200 200 0.31 261 283.4 296.5 5.0 0.96 1.0 232.6 1.4813 2.0 250 250 0.32 263 324.0 365.0 8.0 0.98 1.0 290.7 1.4614 2.0 315 315 0.33 186 351.9 388.3 6.3 0.98 1.0 366.3 1.2315 2.0 350 350 0.33 291 372.6 408.7 5.7 0.97 1.0 407.0 1.1716 2.0 400 400 0.33 224 405.6 448.4 5.0 0.95 1.0 465.1 1.1217 2.0 75 50 0.28 168 105.4 118.9 40.0 0.97 1.5 58.1 2.3818 2.0 113 75 0.30 168 159.1 175.8 26.7 0.97 1.5 87.2 2.3419 1.0 165 110 0.30 241 180.1 224.6 9.1 0.96 1.5 127.9 2.0420 2.0 225 160 0.33 267 272.2 305.7 12.5 1.01 1.4 186.0 1.9121 2.0 300 200 0.33 262 308.7 360.6 10.0 0.98 1.5 232.6 1.8022 2.0 375 250 0.33 221 338.8 373.8 8.0 0.96 1.5 290.7 1.5023 2.0 100 50 0.29 170 114.6 127.1 40.0 0.97 2.0 58.1 2.5424 2.0 150 75 0.30 169 154.0 162.7 26.7 0.97 2.0 87.2 2.1725 2.0 220 110 0.33 216 197.5 208.9 18.2 1.01 2.0 127.9 1.9026 2.0 300 160 0.33 330 247.2 267.1 12.5 0.98 1.9 186.0 1.6727 2.0 400 200 0.33 219 298.8 329.4 10.0 0.95 2.0 232.6 1.6528 2.0 125 50 0.30 168 111.8 111.0 40.0 0.97 2.5 58.1 2.2229 1.0 188 75 0.31 191 138.3 146.7 13.3 0.96 2.5 87.2 1.9630 2.0 275 110 0.33 184 215.8 234.3 18.2 0.98 2.5 127.9 2.1331 2.0 375 160 0.33 313 241.1 278.8 12.5 0.96 2.3 186.0 1.7432 1.0 150 50 0.30 173 94.5 109.7 20.0 0.96 3.0 58.1 2.1933 2.0 225 75 0.33 197 156.3 170.6 26.7 1.01 3.0 87.2 2.2734 2.0 330 110 0.33 169 193.1 222.6 18.2 0.96 3.0 127.9 2.0235 2.0 200 50 0.31 170 115.9 133.7 40.0 0.96 4.0 58.1 2.6736 2.0 300 75 0.33 314 173.7 197.6 26.7 0.98 4.0 87.2 2.6337 2.0 250 50 0.33 237 100.3 116.6 40.0 1.00 5.0 58.1 2.3338 2.0 375 75 0.33 315 161.5 184.3 26.7 0.96 5.0 87.2 2.46
JOURNAL OF HYDRAULIC ENGINEERING © ASCE / NOVEMBER 2013 / 1119
J. Hydraul. Eng. 2013.139:1117-1125.
Dow
nloa
ded
from
asc
elib
rary
.org
by
Uni
vers
idad
de
los
And
es o
n 10
/16/
13. C
opyr
ight
ASC
E. F
or p
erso
nal u
se o
nly;
all
righ
ts r
eser
ved.

bed degradation was observed over the contracted cross sections.With one exception (test 19), values of B=Dp < 10 corresponded toflow shallowness d=Dp ¼ ½0.50; 1.00�. According to Ballio et al.(2009), for such a range of values of d=Dp, significant increasesof scour depth ascribable to contraction effects may be observedonly for B=Dp < 3. Ballio et al. (2009) also pointed out that con-traction manifests itself mostly at early stages of the scour process.Breusers and Raudkivi (1991) suggested that contraction scour isnegligible for values of B=Dp as low as 2.0 to 2.5. Cardoso andBettess (1999) have shown that, shortly after the beginning ofthe scouring process, the flow field remains practically unaffectedover the flat bed out of the scour hole since the intercepted dis-charge tends to be conveyed through the scour holes. Thus, it seemssafe to conclude that, if eventually present, contraction effects wereminor in the present study.
The pier Reynolds number, Rp ¼ UDp=ν, varied between13,625 (test 8) and 13,2000 (test 16). According to the literature,it may be assumed that viscous effects are negligible. In fact, theconditions suggested by Oliveto and Hager (2002)—D50 >0.8 mm—or quoted by Franzetti et al. (1994)—Rp ¼ UDp=ν >7,000—are both satisfied. However, the effect of viscosity onscouring seems to be a topic for further research since none ofthe reported conditions guarantees that the approach flow is roughturbulent.
On average (see http://w3.ualg.pt/∼rlanca/largepierstime.pdf),the duration of the experiments was 2.51 times longer than the timeto equilibrium given by the criterion suggested by Melville andChiew (1999): Δds < 0.05Dp, Δds = increment of scour depthin 24 hours. Also, that duration was 2.52 times longer than the timeto equilibrium implicitly adopted by Ettema (1980): Δds < 1 mmin 4 hours.
The approach flow depth values were adjusted in accordancewith the different pier diameters tested in order to achieve the rangeof flow shallowness values, d=Dp≈ [0.5, 1.0, 1.5, 2.0, 2.5, 3.0, 4.0,5.0]. Sediment coarseness, Dp=D50, took nine values in the range58.1 ≤ Dp=D50 ≤ 465.1, covering comparatively high values ofthis parameter, enabling an enhanced characterization of the sedi-ment coarseness effect on the scour depth.
After screening, NCHRP (2011) identified 233 and 210 validtests published to date, respectively, on clear-water and live-bedscour at single piers. Those numbers reduce to 109 tests fallingin the range 0.90 ≤ U=Uc ≤ 1.10. The vast majority of these testswere rather short: only 12 lasted td ≥ 4 days (td = test duration).For the range of sediment coarseness covered by the present exper-imental campaign, i.e, for Dp=D50 > ∼60, only 9 tests correspondto td ≥ 4 days and an even smaller number, 6, correspond totd ≥ 7 days. These numbers only marginally increase to 13, fortd ≥ 4 days, and to 9, for td ≥ 7 days, if 0.85 ≤ U=Uc ≤ 1.20. Itis clear that a distinctive contribution of the present study is thelong duration data of careful clear-water scour experiments forcomparatively wide piers.
Time records of the scour depths are available at http://w3.ualg.pt/∼rlanca/largepierstime.pdf. The tests 1 to 7, corresponding tod=Dp ¼ 0.5, are plotted in Fig. 1(a) in the coordinates suggestedby Oliveto and Hager (2002, 2005), i.e.,
Zσ0.5D
F1.5d
and T ¼ ttR
ð7Þ
where
Z ¼ dszR
zR ¼ ðD2pdÞ1=3
Fd ¼U
ðΔgD50Þ1=2tR ¼ zR
σ1=3D ðΔgD50Þ1=2
ð8Þ
Here, the gradation coefficient is defined as σD ¼ ðD84=D16Þ0.5and Δ ¼ ðρs − ρÞ=ρ. Fig. 1(a) also plots the predictor of Olivetoand Hager (2005), as a solid line, by assuming a shape factor of1 (cylindrical pier), as well as the�25% band around the predictor.Similar plots were produced for the other seven d=Dp groups; theydo not substantially differ from Fig. 1(a). The inspection of thisfigure reveals that the predictor proposed by Oliveto and Hager(2005) does not match the data. The plots do not either displayany horizontal plateau, a denoting factor of the equilibrium phaseas proposed by Cardoso and Bettess (1999) for vertical wall abut-ments. The applicability of the time-factor model of Melville andSheppard as quoted at NCHRP (2011) was also not supported bythe data [see Fig. 1(b)], particularly in the early stages of the scourprocess. The reasons for these discrepancies probably derive fromthe difficulty to fully characterize the functional relation of Eq. (1).
According to Franzetti et al. (1994), half of the experimentsshould have reached equilibrium since Utd=Dp exceeded 2 × 10⁶.However, equilibrium scour does not seem to have been unambig-uously reached in any of the present experiments. Yet, it is postu-lated here that finite equilibrium scour depth must exist. It isrecognized that the probability of occurrence of a sufficiently
Fig. 1. Time evolution of scour depth measurements versus the pre-dictors of (a) Oliveto and Hager (2005) and (b) Melville and Sheppardas quoted at NCHRP (2011), for d=Dp ¼ 0.5
1120 / JOURNAL OF HYDRAULIC ENGINEERING © ASCE / NOVEMBER 2013
J. Hydraul. Eng. 2013.139:1117-1125.
Dow
nloa
ded
from
asc
elib
rary
.org
by
Uni
vers
idad
de
los
And
es o
n 10
/16/
13. C
opyr
ight
ASC
E. F
or p
erso
nal u
se o
nly;
all
righ
ts r
eser
ved.

strong turbulent event capable of entraining sediment grains fromthe scour hole will never be null though this probability decreasesas scour develops, tending asymptotically to zero. Thus, it is alsoassumed that the time needed to achieve finite equilibrium scourmay be rather large, conceptually infinite. For this reason, scourdepth records were fitted by using regression with the followingpolynomial function:
ds ¼ p1
�1 − 1
1þ p1p2t
�þ p3
�1 − 1
1þ p3p4t
�
þ p5
�1 − 1
1þ p5p6t
�ð9Þ
so as to obtain the equilibrium scour depth, dse, as suggested byLança et al. (2010). In the above polynomial equation, parametersp1;p2; : : : ;p6 have no physical meaning; however, it is obviousthat, for t ¼ ∞, ds ¼ dse ¼ p1 þ p3 þ p5. The equilibrium scourdepths obtained through the fitting procedure are included inTable 1, together with the scour depth, dsm, measured at end ofthe experiment.
The equilibrium scour depths, dse, obtained through extrapola-tion are, on average, 10% higher than dsm. Defining dseE = scourdepth at time to equilibrium implicitly adopted by Ettema (1980)
and dseM = scour depth at time to equilibrium defined according toMelville and Chiew (1999), it can be concluded that dseE=dsm ≈dseM=dsm ¼ 0.91� 0.04; dseE=dse ¼ 0.82� 0.06; dseM=dse ¼0.82� 0.05 (see again http://w3.ualg.pt/∼rlanca/largepierstime.pdf). From the 233 clear-water experiments retained by NCHRP(2011), 184 include information on td; among these, ≈80% wereperformed at the School of Auckland and are likely to have adoptedthe equilibrium criteria of Ettema (1980) or Melville and Chiew(1999). It seems that such experiments, though the closest to equi-librium to date, produced scour depths between ≈80% and ≈90%
of the true equilibrium scour depth.
Equilibrium Scour Depth
The values of dse=Dp are plotted against Dp=D50 in Fig. 2. Data ofsix long duration clear-water experiments (td ≥ 6 days) by Shep-pard et al. (2004) for Dp=D50 > 500 and U=Uc sufficiently closeto 1.0 (0.85 to 1.21) are also included in the figure for complete-ness. It should be mentioned here that these original data were usedinstead of those retained by NCHRP (2011) since both sets do notexactly coincide, particularly, in terms of the duration of tests.These literature data are characterized in Table 2 as identifiedby the prefix Sh. Fig. 2 separates the data—those of this studyas well as those of Sheppard et al. (2004)—into six classes ofd=Dp. Due to experimental limitations of the present study thefigure includes few values for d=Dp > 3.0. It is clear that theparameter Dp=D50 influences dse=Dp, leading to decreasing nor-malized scour depth as Dp=D50 increases in the range of the study.This conclusion qualitatively corroborates the findings of Sheppardet al. (1995, 1999, 2004) and Lee and Sturm (2009). According toSheppard (2004), pressure gradients in the proximity of small sizepiers are larger than near larger ones, inducing larger forces on thesediment grains around the former. For a given sediment size, somelocal scour mechanisms diminish in magnitude with increasing pierwidth. Ettema et al. (2006) investigated the scale of the turbulencein the wake region for different pier sizes and related the differenceswith the decreasing dependence of scour on increasing pier width.Lee and Sturm (2009) related the decrease of the relative scourdepth with different large scale unsteadiness of the horseshoevortex for different pier sizes and sediment coarseness. Theseexplanations remain unproven and deserve to be checked againstdetailed measurements of flow field around different-scale piers.
In spite of the scatter, Fig. 3, which includes the envelopcurves of the equilibrium scour data, shows that dse=Dp increases
Fig. 2. Functional dependence of dse=Dp on Dp=D50
Table 2. Characteristic Control Variables and Nondimensional Parameters of Long-Duration Tests Selected from Literature
TestB(m)
D(m)
Dp(m)
D50
(mm)U
(m=s)td
(day)dsm(m)
dse(m) U=Uc B=Dp d=Dp Dp=D50 dse=Dp
Sh2 6.10 1.19 0.31 0.22 0.31 6.8 0.26 0.41 0.97 19.7 3.90 1386 1.32Sh3 6.10 1.27 0.91 0.80 0.47 15.0 1.11 1.15 0.85 6.7 1.39 1143 1.26Sh4 6.10 0.87 0.91 0.80 0.39 6.0 0.69 0.99 0.87 6.7 0.95 1143 1.09Sh12 6.10 1.22 0.31 0.22 0.40 10.7 0.38 0.39 1.21 19.7 4.00 1386 1.26Sh13 6.10 0.18 0.31 0.22 0.30 9.0 0.30 0.30 1.11 19.7 0.59 1386 0.97Sh14 6.10 1.81 0.91 0.22 0.30 24.2 0.79 1.00 0.94 6.7 1.98 4155 1.10Eta — 0.60 0.15 0.80 0.43 13.1 0.315 0.315 0.96 — 4.00 187 2.10
— 0.60 0.15 0.84 0.44 12.4 0.339 0.339 1.00 — 4.00 179 2.26— 0.60 0.15 0.84 0.44 13.1 0.314 0.314 0.95 — 4.00 179 2.09— 0.60 0.10 0.80 0.43 8.1 0.226 0.226 0.96 — 5.91 127 2.23— 0.60 0.10 0.84 0.44 4.9 0.225 0.225 1.00 — 5.91 121 2.21— 0.60 0.10 0.84 0.44 10.0 0.226 0.226 0.95 — 5.91 121 2.23
Gfa — 0.23 0.15 2.10 0.66 4.4 0.259 0.259 0.93 — 1.55 71 1.73
Note: Sh = Sheppard et al. (2004); Et = Ettema (1980); Gf = Graf (1995).aAs reported in NCHRP (2011).
JOURNAL OF HYDRAULIC ENGINEERING © ASCE / NOVEMBER 2013 / 1121
J. Hydraul. Eng. 2013.139:1117-1125.
Dow
nloa
ded
from
asc
elib
rary
.org
by
Uni
vers
idad
de
los
And
es o
n 10
/16/
13. C
opyr
ight
ASC
E. F
or p
erso
nal u
se o
nly;
all
righ
ts r
eser
ved.

with d=Dp for a given class of Dp=D50, within the range 0.5 ≤d=Dp ≤ 5.0.
The double dependence of dse=Dp on flow shallowness, d=Dp,and sediment coarseness, Dp=D50, is captured by the followingregression equations:
dseDp
¼8<:
7.3�Dp
D50
�−0.29� dDp
�0:12
for 60 ≤ Dp
D50≤ 500
1.2�
dDp
�0:12
for Dp
D50> 500
ð10Þ
In the range Dp=D50 ≤ 500, the determination coefficient isr2 ¼ 0.90 and the root mean square error is RMSE ¼ 0.12, for0.5 ≤ d=Dp ≤ 2.0, while RMSE ¼ 0.22, for 2.0 < d=Dp ≤ 5.0.According to Eq. (10), the effect of Dp=D50 is constant forDp=D50 > ≈500. This result corroborates the finding of Lee andSturm (2009) who stated that, for Dp=D50 > 400, dse=Dp≈1.3. It is also clear that the classical upper bound defined bydse=Dp ≈ 2.4 for narrow piers was exceeded for sediment coarse-ness Dp=D50 ¼ ½58.1 − 87.2�. This result is in line with the find-ings of Sheppard et al. (2004) and Lee and Sturm (2009), these lastreferring to field data where dse=Dp largely exceeds 2.4. Sincethese data correspond to different values of U=Uc, piers’ shapeand piers’ alignment, they were back corrected to the standardcylindrical pier and may inherently convey uncertainties. Likewise,the values of dse=Dp obtained in the present study cannot be ex-cluded to reflect the assessment of the equilibrium scour depth asoccurring at t ¼ ∞. Thus, for prudence, the curves included inFig. 3 do not completely envelop all the data and, for practical ap-plications, the following upper-bound scour predictor is suggested:
dseDp
¼ KdKD50 ð11Þ
where Kd is the predictor of Melville (1997) modified to read
Kd ¼8<:
2.3�
dDp
�1=3
0.50 ≤ dDp
≤ 1.45
2.6 dDp
> 1:45ð12Þ
and KD50 is given by
KD50 ¼
8>><>>:
1.0 60 < Dp
D50≤ 100
5.8�Dp
D50
�−0.38100 < Dp
D50≤ 500
0.55 500 < Dp
D50
ð13Þ
Eq. (13) constitutes the envelope curve of the KD50 data plottedin Fig. 4. The values of KD50 were back calculated from the valuesof dse=Dp reported in Table 1 by assuming Kd to be given by themodified predictor of Melville (1997), Eq. (12).
In practice the use of Eqs. (11)–(13) for safe upper bound scourdepth prediction requires the use of appropriate multiplying factorsto take into account the effects of flow intensity, pier shape, pieralignment, gradation coefficient of bed the material, flow contrac-tion, cross-section shape, and time. The upper bound value ofdse=Dp, occurring for values of Dp=D50 < 100, is not critical forsand bed (D50 < 2 mm) since the predicted equilibrium scourdepths will be similar irrespective of the tuning of the upper boundpredictor. The importance of the present contribution arises forDp=D50 > 100 by reinforcing the proposals by Sheppard et al.(2004) and Lee and Sturm (2009).
Time Evolution of Scour Depth
Since the value of dse is known for each experiment (Table 1),Eq. (4) could be fitted to each scour depth time record and theoutput of the fitting process were the values of a1 and a2. The as-sociated determination coefficients, r2, were always higher than0.97. The values of a1 and a2 are included in Table 3 and plottedagainst Dp=D50 in Fig. 5.
From Table 3, it can be concluded that a1 varies in the range0.005 ≤ a1 ≤ 0.080, with an average value of 0.031, while a2 varieswithin the range 0.212 ≤ a2 ≤ 0.458, with an average value of0.311. These intervals of a1 and a2 contain the proposals ofFranzetti et al. (1982), i.e., a1 ¼ 0.028 and a2 ¼ 1=3. From Fig. 5,it is clear that a1 displays a clear dependence on the sedimentcoarseness, Dp=D50. The dependence of a2 on the same parameteris also clear. No obvious variation of a1 or a2 with d=Dp was iden-tified. The coefficients a1 and a2 relate with Dp=D50 as follows:
a1 ¼ 1.22
�Dp
D50
�−0.764ð14Þ
a2 ¼ 0.09
�Dp
D50
�0.244
ð15Þ
Fig. 3. Envelope curve for the functional dependence of dse=Dp
on d=Dp
Fig. 4. Functional dependence of KD50 on Dp=D50
1122 / JOURNAL OF HYDRAULIC ENGINEERING © ASCE / NOVEMBER 2013
J. Hydraul. Eng. 2013.139:1117-1125.
Dow
nloa
ded
from
asc
elib
rary
.org
by
Uni
vers
idad
de
los
And
es o
n 10
/16/
13. C
opyr
ight
ASC
E. F
or p
erso
nal u
se o
nly;
all
righ
ts r
eser
ved.

The determination coefficients are r2 ¼ 0.76 and 0.77, respec-tively. From the above, the use of the model of Franzetti et al.(1982) for the prediction of scour depth time evolution, Eq. (4),is suggested. The new contribution of this study is the specificationof coefficients a1 and a2 through Eqs. (14) and (15). It is worthstressing that this contribution only applies to cylindrical piersinserted in uniform, fully developed turbulent flows, in widerectangular channels with a flat bed composed of uniform, non-ripple-forming sand, close to the condition of beginning of sedi-ment motion (U=Uc ≈ 1.0).
Validation of the New Predictors
Excluding the data of Sheppard et al. (2004)—which was used toderive Eqs. (10)–(13)—only data of Ettema (1980) and Graf (1995)are found in NCHRP (2011) for tests’ duration td ≥ 4 days and0.9 ≤ U=Uc ≤ 1.1. It is assumed here that such data correspondto tests that sufficiently approached the equilibrium. It must be re-tained here that, in the present experimental study, ds4=dse ¼0.82� 0.06 (ds4 = scour depth measure at t ¼ 4 days). Those data
Table 3. Values of a1 and a2
Test a1 a2 Test a1 a2
1 0.037 0.275 20 0.018 0.3282 0.024 0.319 21 0.025 0.3013 0.020 0.334 22 0.011 0.3884 0.012 0.381 23 0.064 0.2335 0.006 0.438 24 0.034 0.2976 0.013 0.410 25 0.029 0.3107 0.005 0.458 26 0.020 0.3298 0.070 0.232 27 0.015 0.3529 0.046 0.249 28 0.041 0.31410 0.034 0.292 29 0.042 0.28111 0.019 0.360 30 0.037 0.27712 0.017 0.356 31 0.017 0.32113 0.019 0.340 32 0.070 0.22414 0.017 0.366 33 0.041 0.26815 0.018 0.358 34 0.031 0.28216 0.015 0.374 35 0.057 0.22917 0.080 0.212 36 0.027 0.27518 0.053 0.249 37 0.025 0.27719 0.036 0.257 38 0.032 0.266
Fig. 5. Functional dependence of (a) a1 onDp=D50; (b) a2 onDp=D50
Fig. 6. Predicted versus observed scour depth: (a) central predictionsby Eq. (10); (b) upper-bound predictions by Eqs. (11)–(13)
JOURNAL OF HYDRAULIC ENGINEERING © ASCE / NOVEMBER 2013 / 1123
J. Hydraul. Eng. 2013.139:1117-1125.
Dow
nloa
ded
from
asc
elib
rary
.org
by
Uni
vers
idad
de
los
And
es o
n 10
/16/
13. C
opyr
ight
ASC
E. F
or p
erso
nal u
se o
nly;
all
righ
ts r
eser
ved.

are characterized in Table 2; they were used for validation of thesuggested equilibrium scour depth predictors. Fig. 6(a) shows that,with one exception, Eq. (10) predicts the observed equilibriumscour depths within deviations of �25% around the line of perfectagreement, while Fig. 6(b) indicates that Eqs. (11)–(13) constitute areasonable upper-bound predictor of equilibrium scour depth. Theexceptions on Fig. 6 correspond to the experiment of Graf (1995),where td ¼ 4 days, which highlights the crucial importance of thetime effect on the equilibrium scour depth.
Simarro et al. (2011) have published five long-duration experi-ments on scouring at cylindrical piers that respect the restrictionsof the present study. The data from these experiments, as well asfrom seven additional tests carried out in this study, were used forvalidation of the suggested scour time evolution model. Threeexperiments from Grimaldi (2005) were also included in the analy-sis. The control variables of these data sources are summarized inTable 4. Their scour depth time records are also included in http://w3.ualg.pt/∼rlanca/largepierstime.pdf. Other time evolution datasources identified in the literature (see, e.g., NCHRP 2011) werenot assessed since they are published in graphical form only and theexperimental conditions are not known.
Eq. (4) was used to predict the scour depth time evolution.The outputs are compared with measurements in Fig. 7, where theresults obtained in this study are included in Fig. 7(a) while theexperiments of Simarro et al. (2011) and Grimaldi (2005) are usedin Fig. 7(b).
The inspection of Fig. 7 reveals that the suggested predictordescribes the scour depth time evolution for independent datasets within deviations of �25% around the line of perfectagreement.
Conclusions
The most important conclusions of this study are as follows:1. The equilibrium scour depth decreases with Dp=D50, for
Dp=D50 > ∼100, corroborating the findings of Sheppardet al. (1995, 1999, 2004) and Lee and Sturm (2009), whichimplies refuting the classical assumption according to whichthe equilibrium scour depth would not depend on Dp=D50 forDp=D50 > ∼25. The sediment size factor, KD50, may beobtained through Eq. (13).
Table 4. Characteristic Variables and Nondimensional Parameters of Tests Used to Validate the Suggested Scour Time Evolution Model
TestB(m)
d(mm)
Dp(mm)
D50
(mm) σD
U(m=s)
td(day)
dsm(m)
dse(m) U=Uc B=Dp d=Dp Dp=D50 dse=Dp
R1 2.00 50 110 0.86 1.36 0.27 7.0 0.154 0.157 0.97 18.2 0.45 127.9 1.43R2 2.00 80 75 0.86 1.36 0.29 7.0 0.144 0.160 0.97 26.7 1.07 87.2 2.13R3 2.00 110 75 0.86 1.36 0.29 7.0 0.142 0.155 0.97 26.7 1.47 87.2 2.07R4 2.00 113 250 0.86 1.36 0.30 7.0 0.249 0.282 0.97 8.0 0.45 290.7 1.13R5 2.00 75 160 0.86 1.36 0.28 7.0 0.201 0.240 0.97 12.5 0.47 186.0 1.50R6 2.00 200 100 0.86 1.36 0.31 7.0 0.199 0.218 0.96 20.0 2.00 116.3 2.18R7 2.00 200 150 0.86 1.36 0.31 7.0 0.228 0.252 0.96 13.3 1.33 174.4 1.68Si1 0.82 160 75 0.86 1.36 0.27 34.9 0.168 0.173 0.88 10.9 2.13 87.2 2.31Si2 0.82 160 80 0.86 1.36 0.30 45.6 0.196 0.210 0.94 10.3 2.00 93.0 2.63Si3 0.82 160 80 1.28 1.46 0.34 29.7 0.130 0.130 0.93 10.3 2.00 62.5 1.62Si4 0.82 150 75 1.28 1.46 0.34 24.9 0.139 0.140 0.93 10.9 2.00 58.6 1.87Si5 0.82 130 63 1.28 1.46 0.34 29.0 0.129 0.128 0.93 13.0 2.06 49.2 2.04Gr1 0.80 150 75 1.28 1.46 0.40 4.0 0.121 0.126 1.00 10.7 2.00 58.6 1.68Gr2 2.00 250 90 0.86 1.36 0.34 6.2 0.179 0.193 1.00 22.2 2.78 104.7 2.14Gr3 2.00 250 120 0.86 1.36 0.34 6.1 0.225 0.244 1.00 16.7 2.08 139.5 2.03
Note: R = Reference test; Si = Simarro et al. (2011); Gr = Grimaldi (2005).
Fig. 7. Predicted versus observed scour depth time evolution: (a) dataof the present study; (b) data of Simarro et al. (2011) and Grimaldi(2005)
1124 / JOURNAL OF HYDRAULIC ENGINEERING © ASCE / NOVEMBER 2013
J. Hydraul. Eng. 2013.139:1117-1125.
Dow
nloa
ded
from
asc
elib
rary
.org
by
Uni
vers
idad
de
los
And
es o
n 10
/16/
13. C
opyr
ight
ASC
E. F
or p
erso
nal u
se o
nly;
all
righ
ts r
eser
ved.

2. Safe upper-bound predictions of the equilibrium scourdepth may be obtained through Eq. (11), valid for cylindricalpiers inserted in uniform, fully-developed turbulent flowsin wide rectangular channels with flat bed composed of uni-form, non-ripple-forming sand, flow intensity U=Uc ≈ 1.0,Dp=D50 > ≈60 and d=Dp ≥ 0.5.
3. The exponential model of Franzetti et al. (1982), Eq. (4), prop-erly describes the time evolution of scour depth as soon as itscoefficients a1 and a2 are specified through Eqs. (14) and (15),respectively. This contribution applies for U=Uc≈1.0, 60 <Dp=D50 < 500 and 0.5 ≤ d=Dp ≤ 5.0.
Acknowledgments
The authors wish to acknowledge the financial support of thePortuguese Foundation for Science and Technology through theresearch project PTDC/ECM/101353/2008.
Notation
The following symbols are used in this paper:a1, a2 = model coefficients;
B = channel width;Dp = pier diameter;D50 = median grain size;d = approach flow depth;ds = scour depth at instant t;dse = equilibrium scour depth;dseE = equilibrium scour depth according to Ettema (1980);dseM = equilibrium scour depth according to Melville and
Chiew (1999);g = acceleration of gravity;
KD50 = sediment coarseness factor;Kd = flow shallowness factor;Kg = coefficient describing the geometry of the channel
cross-section;Ks = pier shape coefficient;Kθ = coefficient describing the alignment of the pier;Se = slope of the energy line;S0 = channel bottom slope;T = non-dimensional time;t = time;td = test duration;teE = time to equilibrium according to Ettema (1980);teM = time to equilibrium according to Melville and
Chiew (1999);U = average approach flow velocity;Uc = critical average velocity for the beginning of sediment
motion;u� = approach flow friction velocity;u�c = critical bed shear velocity for sediment entrainment;ν = kinematic viscosity;ρ = fluid density;ρs = sediment density; andσD = gradation coefficient of the bed material.
References
Ballio, F., Teruzzi, A., and Radice, A. (2009). “Constriction effects in clear-water scour at abutments.” J. Hydraul Eng., 135(2), 140–145.
Breusers, H. N. C., and Raudkivi, A. (1991). Scouring, hydraulic structuresdesign manual, A. A. Balkema, Rotterdam, The Netherlands.
Cardoso, A. H., and Bettess, R. (1999). “Effects of time and channel geom-etry on scour at bridge abutments.” J. Hydraul. Eng., 125(4), 388–399.
Ettema, R. (1980). “Scour at bridge piers.” Rep. No. 216, Univ. ofAuckland, Auckland, New Zealand.
Ettema, R., Kirkil, G., and Mostafa, E. A. (2006). “Similitude of large-scaleturbulence in experiments on local scour at cylinders.” J. Hydraul. Eng.,132(1), 33–40.
Fael, C. M. S. (2007). “Erosões localizadas junto de encontros de pontes erespectivas medidas de protecção.” Ph.D. thesis, Univ. of Beira Interior,Covilhã, Portugal (in Portugese).
Franzetti, S., Larcan, E., and Mignosa, P. (1982). “Influence of tests dura-tion on the evaluation of ultimate scour around circular piers.” Proc.,Int. Conf. on the Hydraulic Modeling of Civil Engineering Structures,BHRA Fluid Engineering, Coventry, England, 381–396.
Franzetti, S., Malavasi, S., and Piccinin, C. (1994). “Sull’erosione alla basedelle pile di ponte in acque chiare.” Proc., XXIV Convegno di Idraulicae Costruzioni Idrauliche, Vol. 2, GNDCI-CNR, Italy, 13–24 (in Italian).
Graf, W. H. (1995). “Load scour around piers.” Annual Rep., Laboratoire deRecherches Hydrauliques, École Polytechnique Fédérale de Lausanne,Lausanne, Switzerland.
Grimaldi, C. (2005). “Non-conventional countermeasures against localscouring at bridge piers.” Ph.D. thesis, Universita’ della Calabria,Cosenza, Italy.
Kothyari, U. C., Hager, W. H., and Oliveto, G. (2007). “Generalized ap-proach for clear-water scour at bridge foundation elements.” J. Hydraul.Eng., 133(11), 1229–1240.
Lança, R., Fael, C., and Cardoso, A. (2010). “Assessing equilibrium clear-water scour around single cylindrical piers.” River Flow 2010, A.Dittrich, et al., eds., Bundesanstalt für Wasserbau, Germany, 1207–1213.
Lee, S. O., and Sturm, T. W. (2009). “Effect of sediment size scalingon physical modeling of bridge scour.” J. Hydraul. Eng., 135(10),793–802.
Melville, B. W. (1997). “Pier and abutment scour: integrated approach.”J. Hydraul. Eng., 123(2), 125–136.
Melville, B. W., and Chiew, Y. M. (1999). “Time scale for local scour atbridge piers.” Journal of Hydraulic Engineering, 125(1), 59–65.
National Cooperative Highway Research Program (NCHRP). (2011).“Scour at wide piers and long skewed piers.” Rep. 682, TransportationResearch Board, Washington, DC.
Neil, C. R. (1967). “Mean velocity criterion for scour of coarse uniformbed-material.” Proc., 12th IAHR Congress, IAHR, Forth Collins,CO, Vol. 3(C6), 46–54.
Oliveto, G., and Hager, W. H. (2002). “Temporal evolution of clear-waterpier and abutment scour.” J. Hydraul. Eng., 128(9), 811–820.
Oliveto, G., and Hager, W. H. (2005). “Further results to time-dependentlocal scour at bridge elements.” J. Hydraul. Eng., 131(2), 97–105.
Sheppard, D. M. (2004). “Overlooked local scour mechanism.” Transpor-tation Research Record 1890, Transportation Research Board,Washington, DC, 107–111.
Sheppard, D. M., Odeh, M., and Glasser, T. (2004). “Large scaleClearwater local pier scour experiments.” J. Hydraul. Eng., 130(10),957–963.
Sheppard, D. M., Ontowirjo, B., and Zhao, G. (1995). “Local scour nearsingle piles in steady currents.” Proc., 1st Hydraulics EngineeringConf., ASCE, Reston, VA, 371–376.
Sheppard, D. M., Ontowirjo, B., and Zhao, G. (1999). “Local scour nearsingle piles in steady currents.” Stream Stability and Scour at HighwayBridges, Compendium of papers, ASCE Water Resources Conferen-ces1991–1998, E. V. Richardson and P. F. Lagasse, eds., ASCE, Reston,VA, 1809–1813.
Simarro, G., Fael, C., and Cardoso, A. (2011). “Estimating equilibriumscour depth at cylindrical piers in experimental studies.” J. Hydraul.Eng., 137(9), 1089–1093.
JOURNAL OF HYDRAULIC ENGINEERING © ASCE / NOVEMBER 2013 / 1125
J. Hydraul. Eng. 2013.139:1117-1125.
Dow
nloa
ded
from
asc
elib
rary
.org
by
Uni
vers
idad
de
los
And
es o
n 10
/16/
13. C
opyr
ight
ASC
E. F
or p
erso
nal u
se o
nly;
all
righ
ts r
eser
ved.