2013 kaiser family foundation survey · pdf filesurv ethods employer health bene ts 2013...
TRANSCRIPT
57%$16,3
51
$5,8
84
2013-and-
T H E K A I S E R F A M I L Y F O U N D A T I O N
- A N D -
H E A L T H R E S E A R C H &
E D U C A T I O N A L T R U S T
2 0 1 3A n n u a l S u r v e y
EmployerHeal th
Benef i t s

57%$16,3
51
$5,8
84
2013
Employer Health Benefits2 0 1 3 A N N U A L S U R V E Y
Survey Designand
Methods

Survey Design and M
ethodsEmployer Health Benefits 2 0 1 3 An n u a l S u r vey
T H E K A I S E R FA M I LY F O U N D AT I O N - A N D - H E A LT H R E S E A R C H & E D U C AT I O N A L T R U S T
2
Survey Design and Methods
The Kaiser Family Foundation and the Health Research & Educational Trust (Kaiser/HRET) conduct this annual survey of employer-sponsored health benefits. HRET, a nonprofit research organization, is an affiliate of the American Hospital Association. The Kaiser Family Foundation designs, analyzes, and conducts this survey in partnership with HRET, and also pays for the cost of the survey. KFF contracts with researchers at NORC at the University of Chicago (NORC) to work with Foundation and HRET researchers in conducting the study. Kaiser/HRET retained National Research, LLC (NR), a Washington, D.C.-based survey research firm, to conduct telephone interviews with human resource and benefits managers using the Kaiser/HRET survey instrument. From January to May 2013, NR completed full interviews with 2,067 firms. Survey Topics As in past years, Kaiser/HRET asked each participating firm as many as 400 questions about its largest health maintenance organization (HMO), preferred provider organization (PPO), point-of-service (POS) plan, and high-deductible health plan with a savings option (HDHP/SO).1 We treat EPOs and HMOs as one plan type and report the information under the banner of “HMO”; if an employer sponsors both an HMO and an EPO, they are asked about the attributes of the plan with the larger enrollment. Similarly, in 2013, plan information for conventional (or indemnity) plans was collected within the PPO battery following a similar approach. Less than one percent of firms which completed the PPO section had more enrollment in a conventional plan than a PPO plan. As in past years, the survey includes questions on the cost of health insurance, health benefit offer rates, coverage, eligibility, enrollment patterns, premiums,2 employee cost sharing, prescription drug benefits, retiree health benefits, wellness benefits, and employer opinions. Response Rate After determining the required sample from U.S. Census Bureau data, Kaiser/HRET drew its sample from a Survey Sampling Incorporated list (based on an original Dun and Bradstreet list) of the nation’s private employers and from the Census Bureau’s Census of Governments list of public employers with three or more workers. To increase precision, Kaiser/HRET stratified the sample by ten industry categories and six size categories. Kaiser/HRET attempted to repeat interviews with prior years’ survey respondents (with at least ten employees) who participated in either the 2011 or the 2012 survey, or both. As a result, 1,622 of the 2,067 firms that completed the full survey 1 HDHP/SO includes high-deductible health plans offered with either a Health Reimbursement Arrangement (HRA) or a Health Savings Account (HSA). Although HRAs can be offered along with a health plan that is not an HDHP, the survey collected information only on HRAs that are offered along with HDHPs. For specific definitions of HDHPs, HRAs, and HSAs, see the introduction to Section 8. 2 HDHP/SO premium estimates do not include contributions made by the employer to Health Savings Accounts or Health Reimbursement Arrangements.

Employer Health Benefits 2 0 1 3 An n u a l S u r vey
T H E K A I S E R FA M I LY F O U N D AT I O N - A N D - H E A LT H R E S E A R C H & E D U C AT I O N A L T R U S T
3
Survey Design and M
ethods
also participated in either the 2011 or 2012 surveys, or both.3 The overall response rate is 49%.4 The vast majority of questions are asked only of firms that offer health benefits. A total of 1,865 of the 2,067 responding firms indicated that they offered health benefits. The response rate for firms that offer health benefits is 50%. We asked one question of all firms in the study that we made phone contact with but the firm declined to participate. The question was, “Does your company offer a health insurance program as a benefit to any of your employees?” A total of 2,948 firms responded to this question (including 2,067 who responded to the full survey and 881 who responded to this one question). These responses are included in our estimates of the percentage of firms offering health benefits.5 The response rate for this question is 70%. In 2012 the calculation of the response rates was adjusted to be slightly more conservative than previous years. Firm Size Categories and Key Definitions Throughout the report, exhibits categorize data by size of firm, region, and industry. Firm size definitions are as follows: small firms: 3 to 199 workers; and large firms: 200 or more workers. Exhibit M.1 shows selected characteristics of the survey sample. A firm's primary industry classification is determined from SSI's designation on the sampling frame. A firm's ownership category and other firm characteristics used in exhibits such as 3.2 and 6.19 are based on respondents' answers. Exhibit M.2 displays the distribution of the nation’s firms, workers, and covered workers (employees receiving coverage from their employer). Among the over three million firms nationally, approximately 60.8% are firms employing 3 to 9 workers; such firms employ 8.2% of workers, and 3.6% of workers covered by health insurance. In contrast, less than one percent of firms employ 1,000 or more workers; these firms employ 48% of workers and 53% of covered workers. Therefore, the smallest firms dominate any statistics weighted by the number of employers. For this reason, most statistics about firms are broken out by size categories. In contrast, firms with 1,000 or more workers are the most important employer group in calculating statistics regarding covered workers, since they employ the largest percentage of the nation’s workforce. Throughout this report, we use the term “in-network” to refer to services received from a preferred provider. Family coverage is defined as health coverage for a family of four. Each year, the survey asks firms for the percentage of their employees who earn less than a specified amount in order to identify the portion of a firm’s workforce that has
3 In total, 163 firms participated in 2011 and 2013, 359 firms participated in 2012 and 2013, and 1,100 firms participated in 2011, 2012, and 2013. 4 Response rate estimates are calculated by dividing the number of completes over the number of refusals and the fraction of the firms with unknown eligibility to participate estimated to be eligible. Firms determined to be ineligible to complete the survey are not included in the response rate calculation. 5 Estimates presented in Exhibits 2.1, 2.2 and 2.3 are based on the sample of both firms that completed the entire survey and those that answered just one question about whether they offer health benefits.

Survey Design and M
ethodsEmployer Health Benefits 2 0 1 3 An n u a l S u r vey
T H E K A I S E R FA M I LY F O U N D AT I O N - A N D - H E A LT H R E S E A R C H & E D U C AT I O N A L T R U S T
4
relatively low wages. This year, the income threshold is $23,000 per year for low-wage workers and $56,000 for high-wage workers. These thresholds are based on the 25th and 75th percentile of workers’ earnings as reported by the Bureau of Labor Statistics using data from the Occupational Employment Statistics (OES) (2011)6. The cutoffs were inflation adjusted and rounded to the nearest thousand. In previous years wage cuts offs were calculated using the now eliminated National Compensation Survey. Rounding and Imputation Some exhibits in the report do not sum to totals due to rounding effects. In a few cases, numbers from distribution exhibits may not add to the numbers referenced in the text due to rounding. Although overall totals and totals for size and industry are statistically valid, some breakdowns may not be available due to limited sample sizes. Where the unweighted sample size is fewer than 30 observations, exhibits include the notation “NSD” (Not Sufficient Data). To control for item nonresponse bias, Kaiser/HRET imputes values that are missing for most variables in the survey. On average, 3% of observations are imputed. All variables are imputed following a hotdeck approach. In 2013, there were 14 variables where the imputation rate exceeded 20%. For these cases, the unimputed variable is compared with the imputed variable. There are a few variables that Kaiser/HRET has decided not to impute; these are typically variables where “don’t know” is considered a valid response option (for example, firms’ opinions about effectiveness of various strategies to control health insurance costs). In addition, there are several variables in which missing data is calculated based on respondents’ answers to other questions (for example, when missing employer contributions to premiums are calculated from the respondent’s premium and the ratio of contributions to premiums). In 2012 the method to calculate missing premiums and contributions was revised; if a firm provides a premium for single coverage or family coverage, or a worker contribution for single coverage or family coverage, that information was used in the imputation. For example, if a firm provided a worker contribution for family coverage but no premium information, a ratio between the family premium and family contribution was imputed and then the family premium was calculated. In addition, in cases where premiums or contributions for both family and single coverage were missing, the hotdeck procedure was revised to draw all four responses from a single firm. The change in the imputation method did not make a significant impact on the premium or contribution estimates. Sample Design We determined the sample requirements based on the universe of firms obtained from the U.S. Census. Prior to the 2010 survey, the sample requirements were based on the total counts provided by Survey Sampling Incorporated (SSI) (which obtains data from Dun and Bradstreet). Over the years, we found the Dun and Bradstreet frequency counts to be volatile due to duplicate listings of firms, or firms that are no longer in business. These inaccuracies vary by firm size and industry. In 2003, we began using the more consistent and accurate counts provided by the Census Bureau’s Statistics of 6 General information on the OES can be found at : http://www.bls.gov/oes/oes_emp.htm#scope. A comparison between the OES and the NCS is available at: http://www.bls.gov/oes/oes_ques.htm

Employer Health Benefits 2 0 1 3 An n u a l S u r vey
T H E K A I S E R FA M I LY F O U N D AT I O N - A N D - H E A LT H R E S E A R C H & E D U C AT I O N A L T R U S T
5
Survey Design and M
ethods
U.S. Businesses and the Census of Governments as the basis for post-stratification, although the sample was still drawn from a Dun and Bradstreet list. In order to further address this concern at the time of sampling, starting in 2009 we use Census data as the basis for the sample. Starting in 2010, we also defined Education as a separate sampling category, rather than as a subgroup of the Service category. In the past, Education firms were a disproportionately large share of Service firms. Education is controlled for during post-stratification, and adjusting the sampling frame to also control for Education allows for a more accurate representation of both the Education and Service industries. In past years, both private and government firms were sampled from the Dun and Bradstreet database. Beginning in 2009, Government firms were sampled from the 2007 Census of Governments. This change was made to eliminate the overlap of state agencies that were frequently sampled from the Dun and Bradstreet database. The sample of private firms is screened for firms that are related to state/local governments, and if these firms are identified in the Census of Governments, they are reclassified as government firms and a private firm is randomly drawn to replace the reclassified firm. The federal government is not included in the sample frame. Finally, the data used to determine the 2013 Employer Health Benefits sample frame include the U.S. Census’ 2009 Statistics of U.S. Businesses and the 2007 Census of Governments. At the time of the sample design (December 2012), these data represented the most current information on the number of public and private firms nationwide with three or more workers. As in the past, the post-stratification is based on the most up-to-date Census data available (the 2010 update to the Census of U.S. Businesses was purchased during the survey field period). The Census of Governments is conducted every five years; this is the fifth year the data from the 2007 Census of Governments has been available for use. In 2012, the method for calculating the size of the sample was adjusted. Rather than using a combined response rate for panel and non-panel firms, separate response rates were used to calculate the number of firms to be selected in each strata. In addition, the Mining stratum was collapsed into the Agriculture and Construction industry grouping. In sum, changes to the sampling method required more firms to be included and may have reduced the response rate in order to provide more balanced power within each strata. Weighting and Statistical Significance Because Kaiser/HRET selects firms randomly, it is possible through the use of statistical weights to extrapolate the results to national (as well as firm size, geography, regional, and industry) averages. These weights allow Kaiser/HRET to present findings based on the number of workers covered by health plans, the number of total workers, and the number of firms. In general, findings in dollar amounts (such as premiums, worker contributions, and cost sharing) are weighted by covered workers. Other estimates, such as the offer rate, are weighted by firms. Specific weights were created to analyze the HDHP/SO plans that are offered with an HRA or that are HSA-qualified. These weights represent the proportion of employees enrolled in each of these arrangements. Calculation of the weights follows a common approach. First, the basic weight is determined, followed by a nonresponse adjustment. As part of this nonresponse

Survey Design and M
ethodsEmployer Health Benefits 2 0 1 3 An n u a l S u r vey
T H E K A I S E R FA M I LY F O U N D AT I O N - A N D - H E A LT H R E S E A R C H & E D U C AT I O N A L T R U S T
6
adjustment, Kaiser/HRET conducted a small follow-up survey of those firms with 3 to 49 workers that refused to participate in the full survey. Just as in years passed, Kaiser/HRET conducted a McNemar test to verify that the results of the follow-up survey are comparable to the results from the original survey. Next, we trimmed the weights in order to reduce the influence of weight outliers. First, we identified common groups of observations. Within each group, we identified the median and the interquartile range of the weights and calculated the trimming cut point as the median plus six times the interquartile range (M + [6 * IQR]). Weight values larger than this cut point are trimmed to the cut point. In all instances, less than one percent of the weight values were trimmed. Finally, we calibrated the weights to U.S. Census Bureau’s 2009 Statistics of U.S. Businesses for firms in the private sector, and the 2007 Census of Governments as the basis for calibration / post-stratification for public sector firms. Historic employer weighted statistics were updated in 2011. Between 2006 and 2012 only limited information was collected on conventional plans. Starting in 2013, information on conventional plans was collected under the PPO section and therefore the covered worker weight was representative of all plan types. The survey contains a few questions on employee cost sharing that are asked only of firms that indicate in a previous question that they have a certain cost-sharing provision. For example, the copayment amount for prescription drugs is asked only of those that report they have copayments for prescription drugs. Because the composite variables (using data from across all plan types) are reflective of only those plans with the provision, separate weights for the relevant variables were created in order to account for the fact that not all covered workers have such provisions. To account for design effects, the statistical computing package R and the library package "survey" were used to calculate standard errors.7,8 All statistical tests are performed at the .05 confidence level, unless otherwise noted. For figures with multiple years, statistical tests are conducted for each year against the previous year shown, unless otherwise noted. No statistical tests are conducted for years prior to 1999. In 2012 the method to test the difference between distributions across years was changed to use a Wald test which accounts for the complex survey design. In general this method was more conservative than the approach used in prior years. Exhibits such as 7.9, 7.10, 7.16 etc. are affected by the change. Statistical tests for a given subgroup (firms with 25-49 workers, for instance) are tested against all other firm sizes not included in that subgroup (all firm sizes NOT including firms with 25-49 workers, in this example). Tests are done similarly for region and industry; for example, Northeast is compared to all firms NOT in the Northeast (an aggregate of firms in the Midwest, South, and West). However, statistical tests for estimates compared across plan types (for example, average premiums in PPOs) are tested against the “All Plans” estimate. In some cases, we also test plan-specific estimates against similar estimates for other plan types (for example, single and family
7 Analysis of the 2011 survey data using both R and SUDAAN (the statistical package used prior to 2012) produced the same estimates and standard errors. Research Triangle Institute (2008). SUDAAN Software for the Statistical Analysis of Correlated Data, Release 10.0, Research Triangle Park, NC: Research Triangle Institute. 8 A supplement with standard errors for select estimates can be found online at Technical Supplement: Standard Error Tables for Selected Estimates, http://www.kff.org/insurance/8345.cfm.
Employer Health Benefits 2 0 1 3 An n u a l S u r vey
T H E K A I S E R FA M I LY F O U N D AT I O N - A N D - H E A LT H R E S E A R C H & E D U C AT I O N A L T R U S T
7
Survey Design and M
ethods
premiums for HDHP/SOs against single and family premiums for HMO, PPO, and POS plans); these are noted specifically in the text. The two types of statistical tests performed are the t-test and the Wald test. The small number of observations for some variables resulted in large variability around the point estimates. These observations sometimes carry large weights, primarily for small firms. The reader should be cautioned that these influential weights may result in large movements in point estimates from year to year; however, often these movements are not statistically significant. Additional Notes on the 2013 Survey In 2012, average coinsurance rates for prescription drugs, primary care office visits, specialty office visits, and emergency room visits include firms that have a minimum and/or maximum attached to the rate. In years prior to 2012, we did not ask firms the structure of their coinsurance rate. For most prescription drug tiers, and most services, the average coinsurance rate is not statistically different depending on whether the plan has a minimum or maximum. Historical Data Data in this report focus primarily on findings from surveys jointly authored by the Kaiser Family Foundation and the Health Research & Educational Trust, which have been conducted since 1999. Prior to 1999, the survey was conducted by the Health Insurance Association of America (HIAA) and KPMG using a similar survey instrument, but data are not available for all the intervening years. Following the survey’s introduction in 1987, the HIAA conducted the survey through 1990, but some data are not available for analysis. KPMG conducted the survey from 1991-1998. However, in 1991, 1992, 1994, and 1997, only larger firms were sampled. In 1993, 1995, 1996, and 1998, KPMG interviewed both large and small firms. In 1998, KPMG divested itself of its Compensation and Benefits Practice, and part of that divestiture included donating the annual survey of health benefits to HRET. This report uses historical data from the 1993, 1996, and 1998 KPMG Surveys of Employer-Sponsored Health Benefits and the 1999-2013 Kaiser/HRET Survey of Employer-Sponsored Health Benefits. For a longer-term perspective, we also use the 1988 survey of the nation’s employers conducted by the HIAA, on which the KPMG and Kaiser/HRET surveys are based. The survey designs for the three surveys are similar.

Survey Design and M
ethodsEmployer Health Benefits 2 0 1 3 An n u a l S u r vey
T H E K A I S E R FA M I LY F O U N D AT I O N - A N D - H E A LT H R E S E A R C H & E D U C AT I O N A L T R U S T
8
Sample SizeSample
Distribution After Weighting
Percentage of Total for
Weighted Sample
FIRM SIZE3-9 Workers 123 1,893,836 60.8%10-24 Workers 192 749,099 24.125-49 Workers 166 247,976 8.050-199 Workers 301 172,925 5.6200-999 Workers 476 39,393 1.31,000-4,999 Workers 475 7,454 0.25,000 or More Workers 334 1,965 0.1
ALL FIRM SIZES 2,067 3,112,648 100%REGION
Northeast 420 616,941 19.8%Midwest 592 708,965 22.8South 681 1,065,628 34.2West 374 721,114 23.2
ALL REGIONS 2,067 3,112,648 100%INDUSTRY
Agriculture/Mining/Construction 96 325,969 10.5%Manufacturing 200 180,515 5.8Transportation/Communications/Utilities 128 114,923 3.7Wholesale 100 172,139 5.5Retail 181 380,592 12.2Finance 124 202,706 6.5Service 762 1,275,926 41State/Local Government 150 50,587 1.6Health Care 326 409,292 13.1
ALL INDUSTRIES 2,067 3,112,648 100%
Exhibit M.1
Source: Kaiser/HRET Survey of Employer-Sponsored Health Benefits, 2013.
Selected Characteristics of Firms in the Survey Sample, 2013

Employer Health Benefits 2 0 1 3 An n u a l S u r vey
T H E K A I S E R FA M I LY F O U N D AT I O N - A N D - H E A LT H R E S E A R C H & E D U C AT I O N A L T R U S T
9
Survey Design and M
ethods
NOTES: Data are based on a special data request to the U.S. Census Bureau for their most recent (2010) Statistics of U.S. Businesses data on private sector firms. State and local government data are from the Census Bureau’s 2007 Census of Governments.
SOURCES: Kaiser/HRET Survey of Employer-Sponsored Health Benefits, 2013.
60.8%
8.2%3.6%
24.1%
9.5%7.8%
8.0%
7.3%
6.9%
5.6%
13.6%
13.8%
1.3%
13.3%
15.2%
0.2%
13.0%15.7%
0.1%
35.0% 36.8%
0%
10%
20%
30%
40%
50%
60%
70%
80%
90%
100%
Employers Workers Covered Workers
3-9 Workers
10-24 Workers
25-49 Workers
50-199 Workers
200-999 Workers
1,000-4,999 Workers
5,000 or More Workers
Exhibit M.2Distribution of Employers, Workers, and Workers Covered by Health Benefits, by Firm Size, 2013

Survey Design and M
ethodsEmployer Health Benefits 2 0 1 3 An n u a l S u r vey
T H E K A I S E R FA M I LY F O U N D AT I O N - A N D - H E A LT H R E S E A R C H & E D U C AT I O N A L T R U S T
10
Northeast Midwest South WestConnecticut Illinois Delaware Arizona
Maine Indiana District of Columbia ColoradoMassachusetts Michigan Florida IdahoNew Hampshire Ohio Georgia Montana
Vermont Wisconsin Maryland Nevada Rhode Island Iowa North Carolina New MexicoNew Jersey Kansas South Carolina UtahNew York Minnesota Virginia Wyoming
Pennsylvania Missouri West Virginia AlaskaNebraska Alabama California
North Dakota Kentucky HawaiiSouth Dakota Mississippi Oregon
Tennessee Washington LouisianaOklahoma
TexasArkansas
Exhibit M.3States by Region, 2013
Source: Kaiser/HRET Survey of Employer-Sponsored Health Benefits, 2013. From U.S. Department of Commerce, Economics and Statistics Administration, U.S. Census Bureau, available at http://www.census.gov/geo/www/us_regdiv.pdf.

57%$16,3
51
$5,8
84
2013
Employer Health Benefits2 0 1 3 A N N U A L S U R V E Y
sect ion
Cost of Health
Insurance
1
section
on
eC
ost of Health Insurance
Employer Health Benefits 2 0 1 3 An n u a l S u r vey
T H E K A I S E R FA M I LY F O U N D AT I O N - A N D - H E A LT H R E S E A R C H & E D U C AT I O N A L T R U S T
1
12
Section One: Cost of Health Insurance
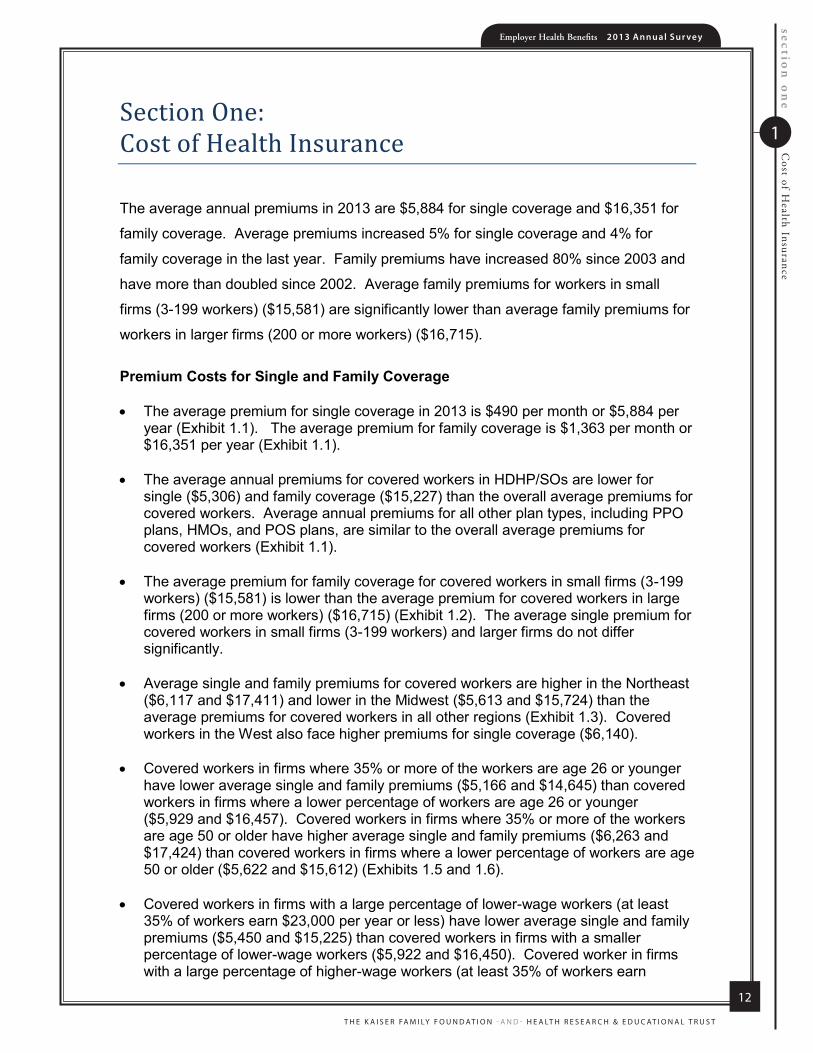
The average annual premiums in 2013 are $5,884 for single coverage and $16,351 for
family coverage. Average premiums increased 5% for single coverage and 4% for
family coverage in the last year. Family premiums have increased 80% since 2003 and
have more than doubled since 2002. Average family premiums for workers in small
firms (3-199 workers) ($15,581) are significantly lower than average family premiums for
workers in larger firms (200 or more workers) ($16,715).
Premium Costs for Single and Family Coverage
The average premium for single coverage in 2013 is $490 per month or $5,884 per year (Exhibit 1.1). The average premium for family coverage is $1,363 per month or $16,351 per year (Exhibit 1.1).
The average annual premiums for covered workers in HDHP/SOs are lower for single ($5,306) and family coverage ($15,227) than the overall average premiums for covered workers. Average annual premiums for all other plan types, including PPO plans, HMOs, and POS plans, are similar to the overall average premiums for covered workers (Exhibit 1.1).
The average premium for family coverage for covered workers in small firms (3-199 workers) ($15,581) is lower than the average premium for covered workers in large firms (200 or more workers) ($16,715) (Exhibit 1.2). The average single premium for covered workers in small firms (3-199 workers) and larger firms do not differ significantly.
Average single and family premiums for covered workers are higher in the Northeast ($6,117 and $17,411) and lower in the Midwest ($5,613 and $15,724) than the average premiums for covered workers in all other regions (Exhibit 1.3). Covered workers in the West also face higher premiums for single coverage ($6,140).
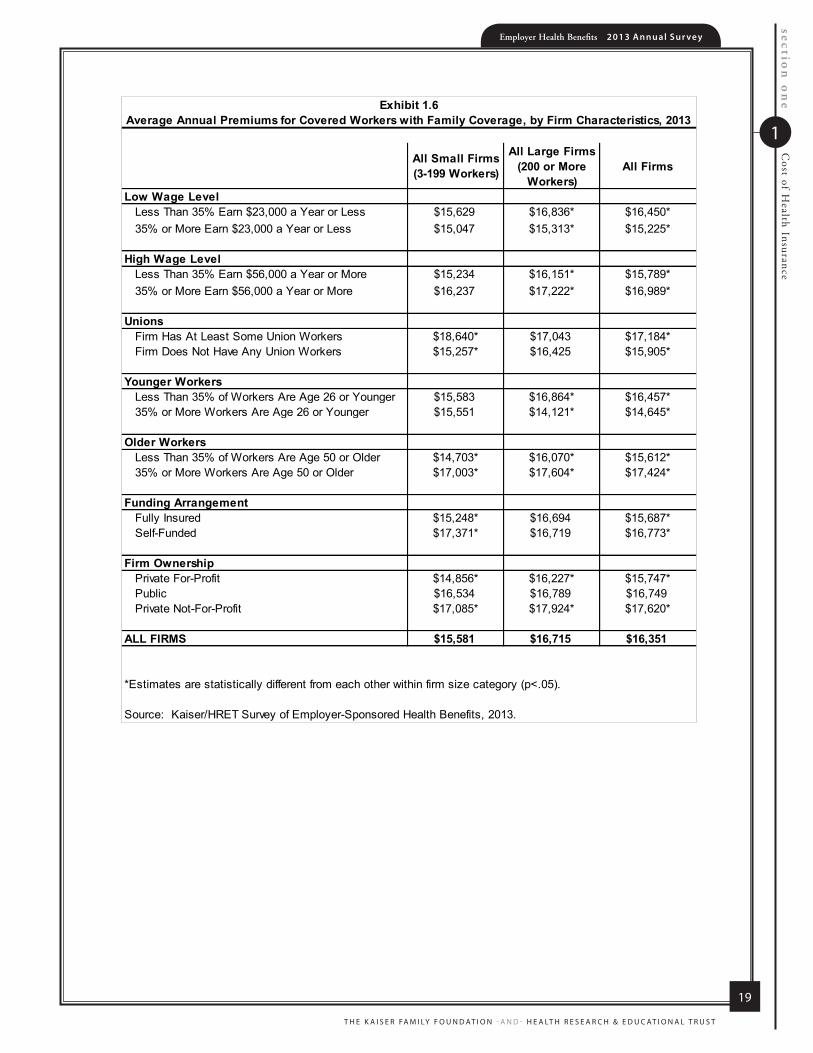
Covered workers in firms where 35% or more of the workers are age 26 or younger have lower average single and family premiums ($5,166 and $14,645) than covered workers in firms where a lower percentage of workers are age 26 or younger ($5,929 and $16,457). Covered workers in firms where 35% or more of the workers are age 50 or older have higher average single and family premiums ($6,263 and$17,424) than covered workers in firms where a lower percentage of workers are age 50 or older ($5,622 and $15,612) (Exhibits 1.5 and 1.6).
Covered workers in firms with a large percentage of lower-wage workers (at least 35% of workers earn $23,000 per year or less) have lower average single and family premiums ($5,450 and $15,225) than covered workers in firms with a smaller percentage of lower-wage workers ($5,922 and $16,450). Covered worker in firms with a large percentage of higher-wage workers (at least 35% of workers earn

section
on
eC
ost of Health Insurance
Employer Health Benefits 2 0 1 3 An n u a l S u r vey
T H E K A I S E R FA M I LY F O U N D AT I O N - A N D - H E A LT H R E S E A R C H & E D U C AT I O N A L T R U S T
1
13
$56,000 per year or more) have higher average single and family premiums ($6,025and $16,989) than covered workers in firms with a smaller percentage of higher-wage workers ($5,760 and $15,789) (Exhibits 1.5 and 1.6).
There is considerable variation in premiums for both single and family coverage.
o Twenty-one percent of covered workers are employed by firms that have a single premium at least 20% higher than the average single premium, while 22% of covered workers are in firms that have a single premium less than 80% of the average single premium (Exhibit 1.7 and 1.8).
o For family coverage, 21% of covered workers are employed in a firm that has a family premium at least 20% higher than the average family premium, and another 21% of covered workers are in firms that have a family premium less than 80% of the average family premium (Exhibit 1.7 and 1.8).
Premium Changes Over Time
The average annual single premium ($5,884) in 2013 is 5% higher than the average annual single premium in 2012 ($5,615), and the average annual family premium ($16,351) is 4% higher than the average annual family premium last year ($15,745) (Exhibit 1.11).
o The $16,351 average annual family premium in 2013 is 29% higher than the average family premium in 2008 and 80% higher than the average family premium in 2003 (Exhibit 1.11).
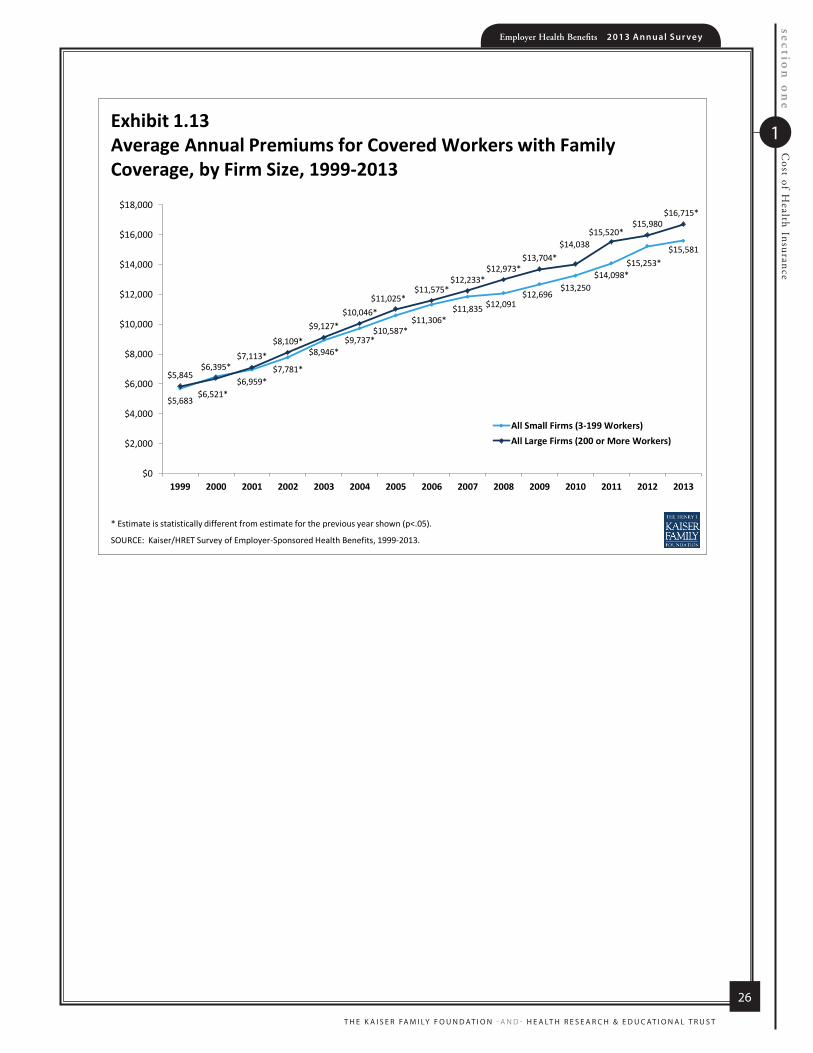
o Premiums for both small and large firms have seen a similar increase since 2008 (29%). For small firms (3 to 199 workers), the average family premium rose from $12,091 in 2008 to $15,581 in 2013. For large firms (200 or more workers), the average family premium rose from $12,973 in 2008 to $16,715 in 2013 (Exhibit 1.13).
o Since 2003, premiums for small firms (3 to 199 workers) have increased 74% ($15,581 in 2013 vs. $8,946 in 2003). The premiums for large firms have increased 83% ($16,715 in 2013 vs. $9,127 in 2003) (Exhibit 1.13).
For large firms (200 or more workers), the average family premium for covered workers in firms that are fully insured has grown at a similar rate to premiums for workers in fully or partially self-funded firms from 2008 to 2013 (28% in fully insured firms vs. 29% in self-funded firms) and from 2003 to 2013 (84% in fully insured firms vs. 83% in self-funded firms) (Exhibit 1.14).

section
on
eC
ost of Health Insurance
Employer Health Benefits 2 0 1 3 An n u a l S u r vey
T H E K A I S E R FA M I LY F O U N D AT I O N - A N D - H E A LT H R E S E A R C H & E D U C AT I O N A L T R U S T
1
14
Monthly AnnualHMO
Single Coverage $502 $6,029Family Coverage $1,379 $16,543
PPOSingle Coverage $503 $6,031Family Coverage $1,389 $16,671
POSSingle Coverage $498 $5,972Family Coverage $1,369 $16,429
HDHP/SOSingle Coverage $442* $5,306*Family Coverage $1,269* $15,227*
ALL PLAN TYPESSingle Coverage $490 $5,884Family Coverage $1,363 $16,351
Exhibit 1.1Average Monthly and Annual Premiums for Covered Workers, Single
and Family Coverage, by Plan Type, 2013
Source: Kaiser/HRET Survey of Employer-Sponsored Health Benefits, 2013.
* Estimate is statistically different from All Plans estimate (p<.05).

section
on
eC
ost of Health Insurance
Employer Health Benefits 2 0 1 3 An n u a l S u r vey
T H E K A I S E R FA M I LY F O U N D AT I O N - A N D - H E A LT H R E S E A R C H & E D U C AT I O N A L T R U S T
1
15
Single Coverage
Family Coverage
Single Coverage
Family Coverage
HMO All Small Firms (3-199 Workers) $503 $1,319 $6,032 $15,826All Large Firms (200 or More Workers) 502 1,410 6,027 16,923
ALL FIRM SIZES $502 $1,379 $6,029 $16,543PPO
All Small Firms (3-199 Workers) $484 $1,347 $5,809 $16,163All Large Firms (200 or More Workers) 509 1,405 6,112 16,854
ALL FIRM SIZES $503 $1,389 $6,031 $16,671POS
All Small Firms (3-199 Workers) $491 $1,336 $5,896 $16,027All Large Firms (200 or More Workers) 507 1,419 6,085 17,024
ALL FIRM SIZES $498 $1,369 $5,972 $16,429HDHP/SO
All Small Firms (3-199 Workers) $427 $1,144* $5,122 $13,732*All Large Firms (200 or More Workers) 450 1,335* 5,404 16,015*
ALL FIRM SIZES $442 $1,269 $5,306 $15,227ALL PLANS
All Small Firms (3-199 Workers) $476 $1,298* $5,711 $15,581*All Large Firms (200 or More Workers) 497 1,393* 5,967 16,715*
ALL FIRM SIZES $490 $1,363 $5,884 $16,351
Source: Kaiser/HRET Survey of Employer-Sponsored Health Benefits, 2013.
Exhibit 1.2
* Estimates are statistically different within plan and coverage types between All Small Firms and All Large Firms (p<.05).
Average Monthly and Annual Premiums for Covered Workers, by Plan Type and Firm Size, 2013
Monthly Annual

section
on
eC
ost of Health Insurance
Employer Health Benefits 2 0 1 3 An n u a l S u r vey
T H E K A I S E R FA M I LY F O U N D AT I O N - A N D - H E A LT H R E S E A R C H & E D U C AT I O N A L T R U S T
1
16
Single Coverage
Family Coverage
Single Coverage
Family Coverage
HMO Northeast $537 $1,473* $6,444 $17,670*Midwest 495 1,334 5,936 16,012South 498 1,441 5,982 17,294West 491 1,306* 5,893 15,668*
ALL REGIONS $502 $1,379 $6,029 $16,543PPO
Northeast $537* $1,516* $6,445* $18,194*Midwest 494 1,388 5,931 16,659South 482* 1,317* 5,790* 15,799*West 526 1,438 6,306 17,252
ALL REGIONS $503 $1,389 $6,031 $16,671POS
Northeast $519 $1,515* $6,228 $18,177*Midwest 422 1,157 5,069 13,890South 513 1,387 6,157 16,639West 540 1,423 6,478 17,081
ALL REGIONS $498 $1,369 $5,972 $16,429HDHP/SO
Northeast $411* $1,222 $4,929* $14,670Midwest 422 1,200 5,066 14,396South 450 1,310 5,402 15,721West 490 1,356 5,874 16,277
ALL REGIONS $442 $1,269 $5,306 $15,227ALL PLANS
Northeast $510* $1,451* $6,117* $17,411*Midwest 468* 1,310* 5,613* 15,724*South 481 1,333 5,772 16,001West 512* 1,389 6,140* 16,670
ALL REGIONS $490 $1,363 $5,884 $16,351
Average Monthly and Annual Premiums for Covered Workers, by Plan Type and Region, 2013
Exhibit 1.3
* Estimate is statistically different within plan and coverage types from estimate for all firms not in the indicated region (p<.05).
Source: Kaiser/HRET Survey of Employer-Sponsored Health Benefits, 2013.
Monthly Annual

section
on
eC
ost of Health Insurance
Employer Health Benefits 2 0 1 3 An n u a l S u r vey
T H E K A I S E R FA M I LY F O U N D AT I O N - A N D - H E A LT H R E S E A R C H & E D U C AT I O N A L T R U S T
1
17
Single Coverage Family Coverage Single Coverage Family CoverageHMO
Agriculture/Mining/Construction NSD NSD NSD NSDManufacturing $431* $1,291 $5,170* $15,496Transportation/Communications/Utilities 532 1,506 6,385 18,069Wholesale NSD NSD NSD NSDRetail 420* 1,268 5,040* 15,216Finance 491 1,436 5,889 17,236Service 513 1,335 6,154 16,023State/Local Government 563* 1,520* 6,758* 18,243*Health Care 490 1,332 5,877 15,981
ALL INDUSTRIES $502 $1,379 $6,029 $16,543PPO
Agriculture/Mining/Construction $480 $1,353 $5,761 $16,239Manufacturing 440* 1,281* 5,281* 15,369*Transportation/Communications/Utilities 528 1,474 6,338 17,691Wholesale 445* 1,316 5,340* 15,789Retail 428* 1,238* 5,137* 14,852*Finance 495 1,440 5,945 17,283Service 521 1,412 6,253 16,940State/Local Government 517 1,316 6,205 15,798Health Care 553* 1,504* 6,633* 18,044*
ALL INDUSTRIES $503 $1,389 $6,031 $16,671POS
Agriculture/Mining/Construction NSD NSD NSD NSDManufacturing NSD NSD NSD NSDTransportation/Communications/Utilities NSD NSD NSD NSDWholesale NSD NSD NSD NSDRetail NSD NSD NSD NSDFinance NSD NSD NSD NSDService $534 $1,418 $6,414 $17,019State/Local Government NSD NSD NSD NSDHealth Care 534 1,418 6,405 17,015
ALL INDUSTRIES $498 $1,369 $5,972 $16,429HDHP/SO
Agriculture/Mining/Construction NSD NSD NSD NSDManufacturing $424 $1,292 $5,088 $15,502Transportation/Communications/Utilities 489 1,486 5,864 17,832Wholesale 442 1,240 5,303 14,880Retail 403 1,007* 4,842 12,079*Finance 373* 1,103* 4,473* 13,235*Service 470 1,310 5,637 15,724State/Local Government 446 1,260 5,348 15,120Health Care 455 1,334 5,454 16,003
ALL INDUSTRIES $442 $1,269 $5,306 $15,227ALL PLANS
Agriculture/Mining/Construction $460 $1,284 $5,517 $15,410Manufacturing 427* 1,257* 5,125* 15,082*Transportation/Communications/Utilities 520 1,476* 6,237 17,709*Wholesale 453* 1,334 5,435* 16,008Retail 428* 1,222* 5,139* 14,667*Finance 462 1,354 5,545 16,253Service 510* 1,379 6,117* 16,546State/Local Government 531* 1,375 6,366* 16,501Health Care 524* 1,438* 6,292* 17,258*
ALL INDUSTRIES $490 $1,363 $5,884 $16,351
NSD: Not Sufficient Data.
Source: Kaiser/HRET Survey of Employer-Sponsored Health Benefits, 2013.
* Estimate is statistically different within plan type from estimate for all firms not in the indicated industry (p<.05).
Exhibit 1.4
Monthly Annual
Average Monthly and Annual Premiums for Covered Workers, by Plan Type and Industry, 2013

section
on
eC
ost of Health Insurance
Employer Health Benefits 2 0 1 3 An n u a l S u r vey
T H E K A I S E R FA M I LY F O U N D AT I O N - A N D - H E A LT H R E S E A R C H & E D U C AT I O N A L T R U S T
1
18
All Small Firms (3-199 Workers)
All Large Firms (200 or More
Workers)All Firms
Low Wage LevelLess Than 35% Earn $23,000 a Year or Less $5,735 $6,011* $5,922*35% or More Earn $23,000 a Year or Less $5,448 $5,452* $5,450*
High Wage LevelLess Than 35% Earn $56,000 a Year or More $5,622 $5,851 $5,760*35% or More Earn $56,000 a Year or More $5,881 $6,070 $6,025*
UnionsFirm Has At Least Some Union Workers $6,646* $6,104 $6,151*Firm Does Not Have Any Union Workers $5,614* $5,845 $5,742*
Younger WorkersLess Than 35% of Workers Are Age 26 or Younger $5,728 $6,023* $5,929*35% or More Workers Are Age 26 or Younger $5,480 $4,984* $5,166*
Older WorkersLess Than 35% of Workers Are Age 50 or Older $5,470* $5,698* $5,622*35% or More Workers Are Age 50 or Older $6,096* $6,336* $6,263*
Funding ArrangementFully Insured $5,572* $6,008 $5,703*Self-Funded $6,456* $5,958 $5,999*
Firm OwnershipPrivate For-Profit $5,319* $5,583* $5,490*Public $6,669* $6,602* $6,612*Private Not-For-Profit $6,401* $6,371* $6,382*
ALL FIRMS $5,711 $5,967 $5,884
Source: Kaiser/HRET Survey of Employer-Sponsored Health Benefits, 2013.
Average Annual Premiums for Covered Workers with Single Coverage, by Firm Characteristics, 2013Exhibit 1.5
*Estimates are statistically different from each other within firm size category (p<.05).
section
on
eC
ost of Health Insurance
Employer Health Benefits 2 0 1 3 An n u a l S u r vey
T H E K A I S E R FA M I LY F O U N D AT I O N - A N D - H E A LT H R E S E A R C H & E D U C AT I O N A L T R U S T
1
19
All Small Firms (3-199 Workers)
All Large Firms (200 or More
Workers)All Firms
Low Wage LevelLess Than 35% Earn $23,000 a Year or Less $15,629 $16,836* $16,450*35% or More Earn $23,000 a Year or Less $15,047 $15,313* $15,225*
High Wage LevelLess Than 35% Earn $56,000 a Year or More $15,234 $16,151* $15,789*35% or More Earn $56,000 a Year or More $16,237 $17,222* $16,989*
UnionsFirm Has At Least Some Union Workers $18,640* $17,043 $17,184*Firm Does Not Have Any Union Workers $15,257* $16,425 $15,905*
Younger WorkersLess Than 35% of Workers Are Age 26 or Younger $15,583 $16,864* $16,457*35% or More Workers Are Age 26 or Younger $15,551 $14,121* $14,645*
Older WorkersLess Than 35% of Workers Are Age 50 or Older $14,703* $16,070* $15,612*35% or More Workers Are Age 50 or Older $17,003* $17,604* $17,424*
Funding ArrangementFully Insured $15,248* $16,694 $15,687*Self-Funded $17,371* $16,719 $16,773*
Firm OwnershipPrivate For-Profit $14,856* $16,227* $15,747*Public $16,534 $16,789 $16,749Private Not-For-Profit $17,085* $17,924* $17,620*
ALL FIRMS $15,581 $16,715 $16,351
Source: Kaiser/HRET Survey of Employer-Sponsored Health Benefits, 2013.
Average Annual Premiums for Covered Workers with Family Coverage, by Firm Characteristics, 2013Exhibit 1.6
*Estimates are statistically different from each other within firm size category (p<.05).

section
on
eC
ost of Health Insurance
Employer Health Benefits 2 0 1 3 An n u a l S u r vey
T H E K A I S E R FA M I LY F O U N D AT I O N - A N D - H E A LT H R E S E A R C H & E D U C AT I O N A L T R U S T
1
20
15%
18%
15%
15%
21%
22%
17%
12%
11%
11%
21%
21%
NOTE: The average annual premium is $5,884 for single coverage and $16,351 for family coverage. The premium distribution is relative to the average single or family premium. For example, $4,707 is 80% of the average single premium, $5,296 is 90% of the average single premium, $6,473 is 110% of the average single premium, and $7,061 is 120% of the average single premium. The same break points relative to the average are used for the distribution for family coverage.
SOURCE: Kaiser/HRET Survey of Employer-Sponsored Health Benefits, 2013.
Exhibit 1.7 Distribution of Annual Premiums for Single and Family Coverage Relative to the Average Annual Single or Family Premium, 2013
$16,351
$5,884<$4,707 >=$7,061
<$13,081 >=$19,622
Less than 80%
80% to Less Than 90%
90% to Less Than Average
Average to Less Than 110%
110% to Less Than 120%
120% or More
Single Coverage
Family Coverage

section oneCost of Health InsuranceEm
ployer Health B
enefits 20
13
An
nu
al S
urve
y
TH
E K
AIS
ER
FAM
ILY F
OU
ND
AT
ION
-AN
D- H
EA
LTH
RE
SE
AR
CH
& E
DU
CA
TIO
NA
L T
RU
ST
1
21
Premium Range, Relative to Average Premium
Premium Range, Dollar Amount
Percentage of Covered Workers in Range
Premium Range, Dollar Amount
Percentage of Covered Workers in Range
Less than 80% Less Than $4,707 22% Less Than $13,081 21%80% to Less Than 90% $4,707 to <$5,296 15% $13,081 to <$14,716 15%90% to Less Than Average $5,296 to <$5,884 18% $14,716 to <$16,351 15%Average to Less Than 110% $5,884 to <$6,473 12% $16,351 to <$17,986 17%110% to Less Than 120% $6,473 to <$7,061 11% $17,986 to <$19,622 11%120% or More $7,061 or More 21% $19,622 or More 21%
Source: Kaiser/HRET Survey of Employer-Sponsored Health Benefits, 2013.
Single Coverage Family Coverage
Distribution of Premiums for Single and Family Coverage Relative to the Average Annual Single or Family Premium, 2013Exhibit 1.8
Note: The average annual premium is $5,884 for single coverage and $16,351 for family coverage. The premium distribution is relative to the average single or family premium. For example, $4,707 is 80% of the average single premium, $5,296 is 90% of the average single premium, $6,473 is 110% of the average single premium, and $7,061 is 120% of the average single premium. The same break points relative to the average are used for the distribution for family coverage.

section
on
eC
ost of Health Insurance
Employer Health Benefits 2 0 1 3 An n u a l S u r vey
T H E K A I S E R FA M I LY F O U N D AT I O N - A N D - H E A LT H R E S E A R C H & E D U C AT I O N A L T R U S T
1
22
1% 2%
8%
19%
28%
20%
9% 8%
4%
0%
10%
20%
30%
40%
50%
Less than$1,999
$2,000-$2,999
$3,000 -$3,999
$4,000 -$4,999
$5,000 -$5,999
$6,000 -$6,999
$7,000 -$7,999
$8,000 -$8,999
$9,000or More
SOURCE: Kaiser/HRET Survey of Employer-Sponsored Health Benefits, 2013.
Exhibit 1.9Distribution of Annual Premiums for Covered Workers with Single Coverage, 2013
Average: $5,884
Percentage of Covered Workers:
4%6%
11%
17% 18% 19%
13%
6% 7%
0%
10%
20%
30%
40%
50%
Less Than$9,000
$9,000 -$10,999
$11,000-$12,999
$13,000-$14,999
$15,000-$16,999
$17,000-$18,999
$19,000-$20,999
$21,000-$22,999
$23,000or More
SOURCE: Kaiser/HRET Survey of Employer-Sponsored Health Benefits, 2013.
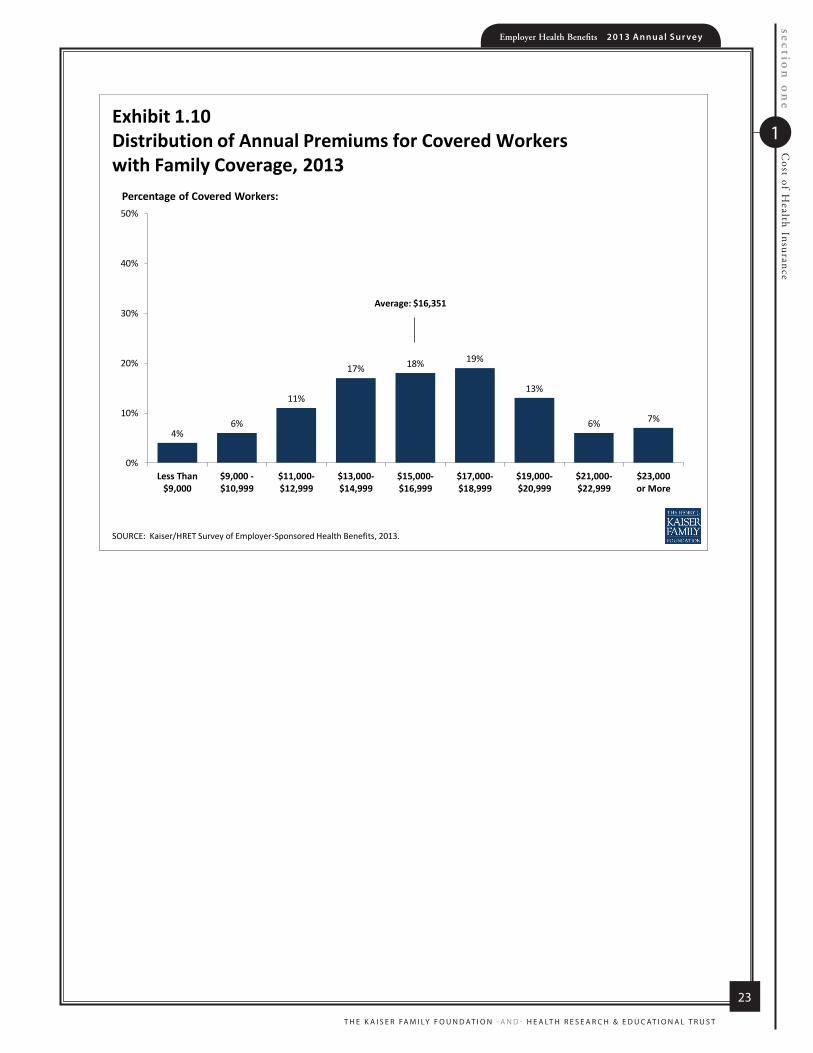
Exhibit 1.10 Distribution of Annual Premiums for Covered Workers with Family Coverage, 2013
Average: $16,351
Percentage of Covered Workers:
section
on
eC
ost of Health Insurance
Employer Health Benefits 2 0 1 3 An n u a l S u r vey
T H E K A I S E R FA M I LY F O U N D AT I O N - A N D - H E A LT H R E S E A R C H & E D U C AT I O N A L T R U S T
1
23
4%6%
11%
17% 18% 19%
13%
6% 7%
0%
10%
20%
30%
40%
50%
Less Than$9,000
$9,000 -$10,999
$11,000-$12,999
$13,000-$14,999
$15,000-$16,999
$17,000-$18,999
$19,000-$20,999
$21,000-$22,999
$23,000or More
SOURCE: Kaiser/HRET Survey of Employer-Sponsored Health Benefits, 2013.
Exhibit 1.10 Distribution of Annual Premiums for Covered Workers with Family Coverage, 2013
Average: $16,351
Percentage of Covered Workers:

section
on
eC
ost of Health Insurance
Employer Health Benefits 2 0 1 3 An n u a l S u r vey
T H E K A I S E R FA M I LY F O U N D AT I O N - A N D - H E A LT H R E S E A R C H & E D U C AT I O N A L T R U S T
1
24
* Estimate is statistically different from estimate for the previous year shown (p<.05).
SOURCE: Kaiser/HRET Survey of Employer-Sponsored Health Benefits, 1999-2013.
Exhibit 1.11 Average Annual Premiums for Single and Family Coverage, 1999-2013
$16,351*
$15,745*
$15,073*
$13,770*
$13,375*
$12,680*
$12,106*
$11,480*
$10,880*
$9,950*
$9,068*
$8,003*
$7,061*
$6,438*
$5,791
$5,884*
$5,615*
$5,429*
$5,049*
$4,824
$4,704*
$4,479*
$4,242*
$4,024*
$3,695*
$3,383*
$3,083*
$2,689*
$2,471*
$2,196
$0 $2,000 $4,000 $6,000 $8,000 $10,000 $12,000 $14,000 $16,000 $18,000
2013
2012
2011
2010
2009
2008
2007
2006
2005
2004
2003
2002
2001
2000
1999Single Coverage
Family Coverage

section
on
eC
ost of Health Insurance
Employer Health Benefits 2 0 1 3 An n u a l S u r vey
T H E K A I S E R FA M I LY F O U N D AT I O N - A N D - H E A LT H R E S E A R C H & E D U C AT I O N A L T R U S T
1
25
All Small Firms (3-199 Workers)
All Large Firms (200 or More Workers)
1999- $5,683 $5,8452000- $6,521 $6,3952001- $6,959 $7,1132002* $7,781 $8,1092003- $8,946 $9,1272004- $9,737 $10,0462005* $10,587 $11,0252006- $11,306 $11,5752007- $11,835 $12,2332008* $12,091 $12,9732009* $12,696 $13,7042010* $13,250 $14,0382011* $14,098 $15,5202012* $15,253 $15,9802013* $15,581 $16,715
Source: Kaiser/HRET Survey of Employer-Sponsored Health Benefits, 1999-2013.
Exhibit 1.12Average Annual Premiums for Covered Workers with Family Coverage, by
Firm Size, 1999-2013
* Estimate is statistically different between All Small Firms and All Large Firms within year (p<.05).
section
on
eC
ost of Health Insurance
Employer Health Benefits 2 0 1 3 An n u a l S u r vey
T H E K A I S E R FA M I LY F O U N D AT I O N - A N D - H E A LT H R E S E A R C H & E D U C AT I O N A L T R U S T
1
26
$5,683$6,521*
$6,959*$7,781*
$8,946*$9,737*
$10,587*$11,306*
$11,835 $12,091$12,696
$13,250$14,098*
$15,253*$15,581
$5,845$6,395*
$7,113*
$8,109*
$9,127*$10,046*
$11,025*$11,575*
$12,233*$12,973*
$13,704*$14,038
$15,520*$15,980
$16,715*
$0
$2,000
$4,000
$6,000
$8,000
$10,000
$12,000
$14,000
$16,000
$18,000
1999 2000 2001 2002 2003 2004 2005 2006 2007 2008 2009 2010 2011 2012 2013
All Small Firms (3-199 Workers)All Large Firms (200 or More Workers)
* Estimate is statistically different from estimate for the previous year shown (p<.05).
SOURCE: Kaiser/HRET Survey of Employer-Sponsored Health Benefits, 1999-2013.
Exhibit 1.13Average Annual Premiums for Covered Workers with Family Coverage, by Firm Size, 1999-2013

section
on
eC
ost of Health Insurance
Employer Health Benefits 2 0 1 3 An n u a l S u r vey
T H E K A I S E R FA M I LY F O U N D AT I O N - A N D - H E A LT H R E S E A R C H & E D U C AT I O N A L T R U S T
1
27
Funding Arrangement Fully Insured Self-Funded1999 $5,769 $5,8962000 $6,315* $6,430*2001 $7,169* $7,086*2002 $7,950* $8,192*2003 $9,070* $9,149*2004 $10,217* $9,984*2005 $10,870* $11,077*2006 $11,222 $11,673*2007 $11,968* $12,315*2008 $13,029* $12,956*2009 $13,870* $13,655*2010 $14,678* $13,9032011 $15,533* $15,517*2012 $16,292* $15,9072013 $16,694 $16,719*
Exhibit 1.14
Source: Kaiser/HRET Survey of Employer-Sponsored Health Benefits, 1999-2013.
Among Workers in Large Firms (200 or More Workers), Average Annual Health Insurance Premiums for Family Coverage, by Funding
Arrangement, 1999-2013
* Estimate is statistically different from estimate for the previous year shown (p<.05).
Note: For definitions of Self-Funded and Fully Insured Plans, see the introduction to Section 10. Due to a change in the survey questionnaire, funding status was not asked of firms with conventional plans in 2006. Therefore, conventional plan funding status is not included in the averages shown in this exhibit for 2006.

57%$16,3
51
$5,8
84
2013
Employer Health Benefits2 0 1 3 A N N U A L S U R V E Y
sect ion
HealthBenefits
Offer Rates
2

Employer Health Benefits 2 0 1 3 An n u a l S u r vey
T H E K A I S E R FA M I LY F O U N D AT I O N - A N D - H E A LT H R E S E A R C H & E D U C AT I O N A L T R U S T
29
section
two
Health B
enefits Offer R
ates
2Section Two: Health Benefits Offer Rates While nearly all large firms (200 or more workers) offer health benefits, small firms (3-
199 workers) are significantly less likely to do so. The percentage of all firms offering
health benefits in 2013 (57%) is statistically unchanged from 2012 and 2011 (61% and
60%).
In 2013, 57% of firms offer health benefits, statistically unchanged from the 61%reported in 2012 (Exhibit 2.1).
o Similar to 2012, 99% of large firms (200 or more workers) offer health benefits to at least some of their workers (Exhibit 2.2). In contrast, only 57% of small firms (3-199 workers) offer health benefits in 2013.
o Between 1999 and 2013, the offer rate for large firms (200 or more workers) has consistently remained at or above 97%. Since most firms in the country are small, variation in the overall offer rate is driven primarily by changes in the percentages of the smallest firms (3-9 workers) offering health benefits.
Offer rates vary across different types of firms.
o Smaller firms are less likely to offer health insurance: 45% of firms with 3 to 9 workers offer coverage, compared to 68% of firms with 10 to 24 workers, 85% of firms with 25 to 49 workers, and 91% of firms with 50 to 199 employees (Exhibit 2.3).
o Offering rates throughout different firm size categories in 2013 remained similar to those in 2012 (Exhibit 2.2).
o Firms with fewer lower-wage workers (less than 35% of workers earn $23,000 or
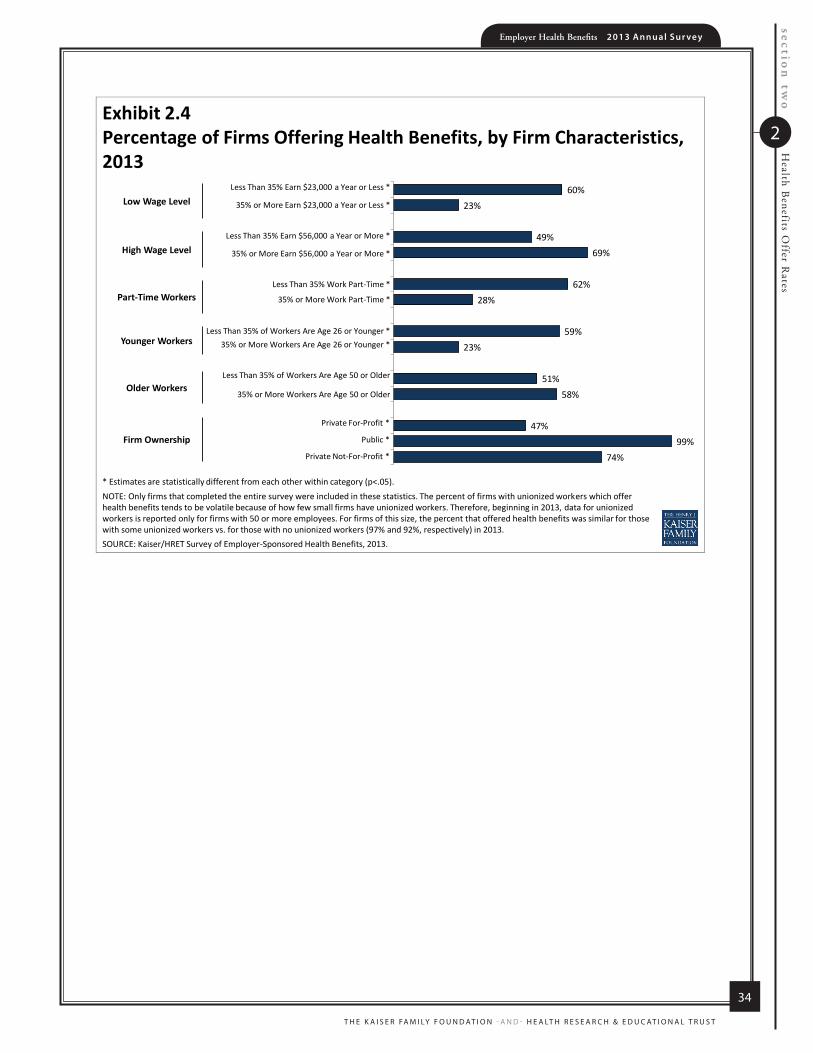
less annually) are significantly more likely to offer health insurance than firms with many lower-wage workers (35% or more of workers earn $23,000 or less annually) (60% vs. 23%) (Exhibit 2.4). The offer rate for firms with many lower-wage workers is not significantly different from the 28% reported in 2012. We observe a similar pattern among firms with many higher-wage workers (35% or more of workers earn $56,000 or more annually) (Exhibit 2.4).
o The age of the workforce significantly affects the probability of a firm offering health benefits. Firms where 35% or more of its workers are age 26 or younger are less likely to offer health benefits than firms where less than 35% of workers are age 26 or younger (23% and 59%, respectively) (Exhibit 2.4).
Among firms offering health benefits, relatively few offer benefits to their part-time and temporary workers.

section
two
Health B
enefits Offer R
atesEmployer Health Benefits 2 0 1 3 An n u a l S u r vey
T H E K A I S E R FA M I LY F O U N D AT I O N - A N D - H E A LT H R E S E A R C H & E D U C AT I O N A L T R U S T
2
30
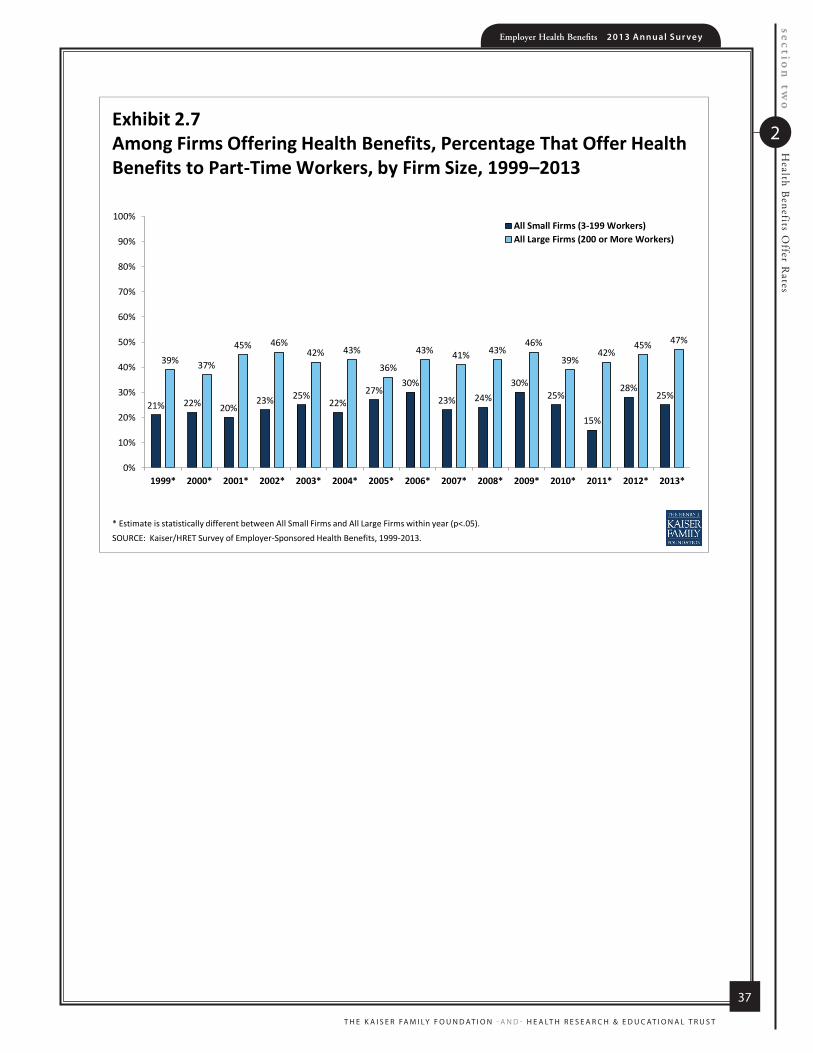
o In 2013, 25% of all firms that offer health benefits offer them to part-time workers,similar to the 28% reported in 2012 (Exhibit 2.5). Offering firms with 200 or more workers are more likely to offer health benefits to part-time employees than firms with 3 to 199 workers (47% vs. 25%) (Exhibit 2.7).
o Consistently, a very small percentage (3% in 2013) of firms offering health benefits have offered them to temporary workers (Exhibit 2.6). The percentage of firms offering temporary workers benefits is similar for small firms (3-199 workers) and large firms (200 or more workers) (3% vs. 6%) (Exhibit 2.8). The percentage of firms offering health benefits to temporary workers has been stable over time.
Firms Not Offering Health Benefits
The survey asks firms that do not offer health benefits if they have offered insurance or shopped for insurance in the recent past, and about their most important reasons for not offering. Because such a small percentage of large firms report not offering health benefits, we present responses for smaller firms (3 to 199 workers) that do not offer health benefits.
o The cost of health insurance remains the primary reason cited by firms for not offering health benefits. Among small firms (3-199 workers) not offering health benefits, 50% cite high cost as “the most important reason” for not doing so, followed by: “firm is too small” (16%) and “employees are generally covered under another plan” (15%) (Exhibit 2.9).
Many non-offering, small firms have either offered health benefits in the past five years, or shopped for alternative coverage options recently.
o Seventeen percent of non-offering, small firms (3-199 workers) have offered health benefits in the past five years, while 18% have shopped for coverage in the past year (Exhibit 2.10).
Among non-offering, small firms (3-199 workers), 10% report that they provide funds to their employees to purchase health insurance through the individual (non-group) market (Exhibit 2.11).
* Estimate is statistically different from estimate for the previous year shown (p<.05). NOTE: As noted in the Survey Design and Methods section, estimates presented in this exhibit are based on the sample of both firms that completed the entire survey and those that answered just one question about whether they offer health benefits. SOURCE: Kaiser/HRET Survey of Employer-Sponsored Health Benefits, 1999-2013.
Exhibit 2.1Percentage of Firms Offering Health Benefits, 1999–2013
66%68% 68% 66% 66%
63%60% 61% 59%
63%59%
69%*
60%* 61%57%
0%
10%
20%
30%
40%
50%
60%
70%
80%
90%
100%
1999 2000 2001 2002 2003 2004 2005 2006 2007 2008 2009 2010 2011 2012 2013

Employer Health Benefits 2 0 1 3 An n u a l S u r vey
T H E K A I S E R FA M I LY F O U N D AT I O N - A N D - H E A LT H R E S E A R C H & E D U C AT I O N A L T R U S T
31
section
two
Health B
enefits Offer R
ates
2
* Estimate is statistically different from estimate for the previous year shown (p<.05). NOTE: As noted in the Survey Design and Methods section, estimates presented in this exhibit are based on the sample of both firms that completed the entire survey and those that answered just one question about whether they offer health benefits. SOURCE: Kaiser/HRET Survey of Employer-Sponsored Health Benefits, 1999-2013.
Exhibit 2.1Percentage of Firms Offering Health Benefits, 1999–2013
66%68% 68% 66% 66%
63%60% 61% 59%
63%59%
69%*
60%* 61%57%
0%
10%
20%
30%
40%
50%
60%
70%
80%
90%
100%
1999 2000 2001 2002 2003 2004 2005 2006 2007 2008 2009 2010 2011 2012 2013

section twoHealth Benefits Offer RatesEm
ployer Health B
enefits 20
13
An
nu
al S
urve
y
TH
E K
AIS
ER
FAM
ILY F
OU
ND
AT
ION
-AN
D- H
EA
LTH
RE
SE
AR
CH
& E
DU
CA
TIO
NA
L T
RU
ST
2
32
1999 2000 2001 2002 2003 2004 2005 2006 2007 2008 2009 2010 2011 2012 2013FIRM SIZE
3-9 Workers 55% 57% 58% 58% 55% 52% 47% 49% 45% 50% 47% 59%* 48%* 50% 45%10-24 Workers 74 80 77 70* 76 74 72 73 76 78 72 76 71 73 6825-49 Workers 88 91 90 87 84 87 87 87 83 90* 87 92 85* 87 8550-199 Workers 97 97 96 95 95 92 93 92 94 94 95 95 93 94 91
All Small Firms (3-199 Workers) 65% 68% 67% 65% 65% 62% 59% 60% 59% 62% 59% 68%* 59%* 61% 57%All Large Firms (200 or More Workers) 99% 99% 99% 98% 97% 98% 97% 98% 99% 99% 98% 99% 99% 98% 99%
ALL FIRMS 66% 68% 68% 66% 66% 63% 60% 61% 59% 63% 59% 69%* 60%* 61% 57%
Note: As noted in the Survey Design and Methods section, estimates presented in this exhibit are based on the sample of both firms that completed the entire survey and those that answered just one question about whether they offer health benefits.
Source: Kaiser/HRET Survey of Employer-Sponsored Health Benefits, 1999-2013.
Exhibit 2.2 Percentage of Firms Offering Health Benefits, by Firm Size, 1999-2013
* Estimate is statistically different from estimate for the previous year shown (p<.05).
Percentage of Firm
s O
ffering Health B
enefitsFIRM
SIZE3-9 W
orkers45%
*10-24 W
orkers68*
25-49 Workers
85*50-199 W
orkers91*
200-999 Workers
98*1,000-4,999 W
orkers100*
5,000 or More W
orkers99*
All Small Firm
s (3-199 Workers)
57%*
All Large Firms (200 or M
ore Workers)
99%*
REGIO
NN
ortheast59%
Midw
est57
South
56W
est57
INDUSTRYA
griculture/Mining/C
onstruction60%
Manufacturing
72Transportation/C
omm
unications/Utilities
62W
holesale54
Retail
29*Finance
49S
ervice65*
State/Local G
overnment
100*H
ealth Care
51ALL FIRM
S57%
Exhibit 2.3 Percentage of Firm
s Offering Health Benefits, by Firm
Size, Region, and Industry, 2013
Source: K
aiser/HR
ET S
urvey of Em
ployer-Sponsored H
ealth Benefits, 2013.
Note: A
s noted in the Survey D
esign and Methods section, estim
ates presented in this exhibit are based on the sam
ple of both firms that com
pleted the entire survey and those that answ
ered just one question about whether they offer health benefits.
* Estim
ate is statistically different from estim
ate for all other firms not in the
indicated size, region, or industry category (p<.05).

Employer Health Benefits 2 0 1 3 An n u a l S u r vey
T H E K A I S E R FA M I LY F O U N D AT I O N - A N D - H E A LT H R E S E A R C H & E D U C AT I O N A L T R U S T
33
section
two
Health B
enefits Offer R
ates
2
Percentage of Firms Offering Health Benefits
FIRM SIZE3-9 Workers 45%*10-24 Workers 68*25-49 Workers 85*50-199 Workers 91*200-999 Workers 98*1,000-4,999 Workers 100*5,000 or More Workers 99*
All Small Firms (3-199 Workers) 57%*All Large Firms (200 or More Workers) 99%*
REGIONNortheast 59%Midwest 57South 56West 57
INDUSTRYAgriculture/Mining/Construction 60%Manufacturing 72Transportation/Communications/Utilities 62Wholesale 54Retail 29*Finance 49Service 65*State/Local Government 100*Health Care 51
ALL FIRMS 57%
Exhibit 2.3 Percentage of Firms Offering Health Benefits, by Firm Size, Region, and
Industry, 2013
Source: Kaiser/HRET Survey of Employer-Sponsored Health Benefits, 2013.
Note: As noted in the Survey Design and Methods section, estimates presented in this exhibit are based on the sample of both firms that completed the entire survey and those that answered just one question about whether they offer health benefits.
* Estimate is statistically different from estimate for all other firms not in the indicated size, region, or industry category (p<.05).
section
two
Health B
enefits Offer R
atesEmployer Health Benefits 2 0 1 3 An n u a l S u r vey
T H E K A I S E R FA M I LY F O U N D AT I O N - A N D - H E A LT H R E S E A R C H & E D U C AT I O N A L T R U S T
2
34
60%23%
49%69%
62%28%
59%23%
51%58%
47%99%
74%
* Estimates are statistically different from each other within category (p<.05). NOTE: Only firms that completed the entire survey were included in these statistics. The percent of firms with unionized workers which offer health benefits tends to be volatile because of how few small firms have unionized workers. Therefore, beginning in 2013, data for unionized workers is reported only for firms with 50 or more employees. For firms of this size, the percent that offered health benefits was similar for those with some unionized workers vs. for those with no unionized workers (97% and 92%, respectively) in 2013.SOURCE: Kaiser/HRET Survey of Employer-Sponsored Health Benefits, 2013.
Exhibit 2.4 Percentage of Firms Offering Health Benefits, by Firm Characteristics, 2013
Low Wage LevelLess Than 35% Earn $23,000 a Year or Less *
35% or More Earn $23,000 a Year or Less *
High Wage LevelLess Than 35% Earn $56,000 a Year or More *
35% or More Earn $56,000 a Year or More *
Part-Time WorkersLess Than 35% Work Part-Time *
35% or More Work Part-Time *
Younger WorkersLess Than 35% of Workers Are Age 26 or Younger *
35% or More Workers Are Age 26 or Younger *
Older WorkersLess Than 35% of Workers Are Age 50 or Older
35% or More Workers Are Age 50 or Older
Firm Ownership
Private For-Profit *
Public *
Private Not-For-Profit *

Employer H
ealth Benefits 2
01
3 A
nn
ua
l Su
rvey
TH
E K
AIS
ER
FAM
ILY F
OU
ND
AT
ION
-AN
D- H
EA
LTH
RE
SE
AR
CH
& E
DU
CA
TIO
NA
L T
RU
ST
35
section twoHealth Benefits Offer Rates
2
1999 2000 2001 2002 2003 2004 2005 2006 2007 2008 2009 2010 2011 2012 2013FIRM SIZE
3-24 Workers 20% 21% 17% 22% 24% 20% 27% 31% 23% 22% 31% 24% 12% 27%* 24% 25-199 Workers 25 24 31 29 29 29 28 28 25 30 27 28 26 30 28200-999 Workers 35 34 42 43 38 41 33 40* 38 40 44 35* 40 41 451,000-4,999 Workers 52 48 55 60 57 51 46 55* 54 53 55 55 50 61* 555,000 or More Workers 61 52 60 58 57 60 61 63 63 67 60 61 59 66 68
All Small Firms (3-199 Workers) 21% 22% 20% 23% 25% 22% 27% 30% 23% 24% 30% 25% 15% 28%* 25% All Large Firms (200 or More Workers) 39% 37% 45% 46% 42% 43% 36%* 43%* 41% 43% 46% 39%* 42% 45% 47% ALL FIRMS 21% 22% 20% 24% 26% 23% 27% 31% 24% 25% 31% 25% 16% 28%* 25%
* Estimate is statistically different from estimate for the previous year shown (p<.05).
Source: Kaiser/HRET Survey of Employer-Sponsored Health Benefits, 1999-2013.
Among Firms Offering Health Benefits, Percentage that Offer Health Benefits to Part-Time Workers, by Firm Size, 1999-2013Exhibit 2.5

section twoHealth Benefits Offer RatesEm
ployer Health B
enefits 20
13
An
nu
al S
urve
y
TH
E K
AIS
ER
FAM
ILY F
OU
ND
AT
ION
-AN
D- H
EA
LTH
RE
SE
AR
CH
& E
DU
CA
TIO
NA
L T
RU
ST
2
36
1999 2000 2001 2002 2003 2004 2005 2006 2007 2008 2009 2010 2011 2012 2013FIRM SIZE
3-24 Workers 5% 2% 4% 3% 1% 4% 2% 3% 2% 3% 4% 1% 4% 2% 2% 25-199 Workers 3 7 3 4 4 3 5 4 4 3 3 4 4 2 5200-999 Workers 3 9 6 5 9 8 5 5 7 4 4 6 6 6 61,000-4,999 Workers 7 8 9 8 7 6 5 9 9 7 7 8 5 5 55,000 or More Workers 9 8 8 7 10 7 9 11 6* 8 9 8 4 8 8
All Small Firms (3-199 Workers) 4% 3% 4% 3% 2% 3% 3% 3% 2% 3% 3% 1% 4% 2% 3% All Large Firms (200 or More Workers) 4% 9% 7% 6% 9% 8% 5% 6% 7% 5% 5% 6% 6% 6% 6% ALL FIRMS 4% 3% 4% 3% 2% 4% 3% 3% 2% 3% 3% 1% 4% 2% 3%
* Estimate is statistically different from estimate for the previous year shown (p<.05).
Source: Kaiser/HRET Survey of Employer-Sponsored Health Benefits, 1999-2013.
Among Firms Offering Health Benefits, Percentage that Offer Health Benefits to Temporary Workers, by Firm Size, 1999-2013Exhibit 2.6
* Estimate is statistically different betw
een All Small Firm
s and All Large Firms w
ithin year (p<.05). SO
URCE: Kaiser/HRET Survey of Em
ployer-Sponsored Health Benefits, 1999-2013.
Exhibit 2.7Am
ong Firms O
ffering Health Benefits, Percentage That Offer Health
Benefits to Part-Time W
orkers, by Firm Size, 1999–2013
21%22%
20%23%
25%22%
27%30%
23%24%
30%25%
15%
28%25%
39%37%
45%46%
42%43%
36%
43%41%
43%46%
39%42%
45%47%
0%
10%
20%
30%
40%
50%
60%
70%
80%
90%
100%
1999*2000*
2001*2002*
2003*2004*
2005*2006*
2007*2008*
2009*2010*
2011*2012*
2013*
All Small Firm
s (3-199 Workers)
All Large Firms (200 or M
ore Workers)
Employer Health Benefits 2 0 1 3 An n u a l S u r vey
T H E K A I S E R FA M I LY F O U N D AT I O N - A N D - H E A LT H R E S E A R C H & E D U C AT I O N A L T R U S T
37
section
two
Health B
enefits Offer R
ates
2
* Estimate is statistically different between All Small Firms and All Large Firms within year (p<.05). SOURCE: Kaiser/HRET Survey of Employer-Sponsored Health Benefits, 1999-2013.
Exhibit 2.7Among Firms Offering Health Benefits, Percentage That Offer Health Benefits to Part-Time Workers, by Firm Size, 1999–2013
21% 22% 20%23% 25%
22%27%
30%
23% 24%30%
25%
15%
28%25%
39% 37%
45% 46%42% 43%
36%
43% 41% 43%46%
39%42%
45% 47%
0%
10%
20%
30%
40%
50%
60%
70%
80%
90%
100%
1999* 2000* 2001* 2002* 2003* 2004* 2005* 2006* 2007* 2008* 2009* 2010* 2011* 2012* 2013*
All Small Firms (3-199 Workers)All Large Firms (200 or More Workers)

section
two
Health B
enefits Offer R
atesEmployer Health Benefits 2 0 1 3 An n u a l S u r vey
T H E K A I S E R FA M I LY F O U N D AT I O N - A N D - H E A LT H R E S E A R C H & E D U C AT I O N A L T R U S T
2
38
* Estimate is statistically different between All Small Firms and All Large Firms within year (p<.05).SOURCE: Kaiser/HRET Survey of Employer-Sponsored Health Benefits, 1999-2013.
Exhibit 2.8Among Firms Offering Health Benefits, Percentage That Offer Health Benefits to Temporary Workers, by Firm Size, 1999–2013
4%3%
4%3%
2%3% 3% 3%
2%3% 3%
1%
4%
2%3%
4%
9%
7%6%
9%8%
5%6%
7%
5% 5%6% 6% 6% 6%
0%
5%
10%
15%
20%
25%
1999 2000* 2001* 2002* 2003* 2004 2005 2006 2007* 2008 2009 2010* 2011 2012* 2013
All Small Firms (3-199 Workers)All Large Firms (200 or More Workers)

Employer Health Benefits 2 0 1 3 An n u a l S u r vey
T H E K A I S E R FA M I LY F O U N D AT I O N - A N D - H E A LT H R E S E A R C H & E D U C AT I O N A L T R U S T
39
section
two
Health B
enefits Offer R
ates
2
Most Important Reason
Cost of health insurance is too high 50%The firm is too small 16Employees are generally covered under another plan 15Employee turnover is too great 1No interest/Employees don't want it 5Most employees are part-time or temporary workers 8Other 5Don't know 1
Among Small Firms (3-199 Workers) Not Offering Health Benefits, the Most Important Reason for Not Offering, 2013
Source: Kaiser/HRET Survey of Employer-Sponsored Health Benefits, 2013.
Exhibit 2.9

section
two
Health B
enefits Offer R
atesEmployer Health Benefits 2 0 1 3 An n u a l S u r vey
T H E K A I S E R FA M I LY F O U N D AT I O N - A N D - H E A LT H R E S E A R C H & E D U C AT I O N A L T R U S T
2
40
* Estimate is statistically different from estimate for the previous year shown (p<.05). SOURCE: Kaiser/HRET Survey of Employer-Sponsored Health Benefits, 2007-2013.
Exhibit 2.10Among Small Firms (3-199 Workers) Not Offering Health Benefits, Percentage That Report the Following Activities Regarding Health Benefits, 2007-2013
23%
39%
18%
33%
27%30%
15%
29%
16% 15%*17% 18%
0%
5%
10%
15%
20%
25%
30%
35%
40%
45%
50%
Offered Health Insurance Within the Past Five Years Shopped for Health Insurance Within the Past Year
2007
2009
2010
2011
2012
2013
FIRM SIZE3-9 Workers 8%10-199 Workers 16
All Small Firms (3-199 Workers) 10%
Exhibit 2.11Among Small Firms (3-199 Workers) Not Offering Health Benefits,
Percentage That Provide Employees Funds to Purchase Non-Group Insurance, 2013
Source: Kaiser/HRET Survey of Employer-Sponsored Health Benefits, 2013.
Note: Tests found no statistical difference from estimate for all firms not in the indicated size category (p<.05).

Employer Health Benefits 2 0 1 3 An n u a l S u r vey
T H E K A I S E R FA M I LY F O U N D AT I O N - A N D - H E A LT H R E S E A R C H & E D U C AT I O N A L T R U S T
41
section
two
Health B
enefits Offer R
ates
2
FIRM SIZE3-9 Workers 8%10-199 Workers 16
All Small Firms (3-199 Workers) 10%
Exhibit 2.11Among Small Firms (3-199 Workers) Not Offering Health Benefits,
Percentage That Provide Employees Funds to Purchase Non-Group Insurance, 2013
Source: Kaiser/HRET Survey of Employer-Sponsored Health Benefits, 2013.
Note: Tests found no statistical difference from estimate for all firms not in the indicated size category (p<.05).

57%$16,3
51
$5,8
84
2013
Employer Health Benefits2 0 1 3 A N N U A L S U R V E Y
sect ion
Employee Coverage,
Eligibility, and Participation
3

Employer Health Benefits 2 0 1 3 An n u a l S u r vey
T H E K A I S E R FA M I LY F O U N D AT I O N - A N D - H E A LT H R E S E A R C H & E D U C AT I O N A L T R U S T
43
section
three
Em
ployee Coverage, E
ligibility, and Participation
3Section Three: Employee Coverage, Eligibility, and Participation
Employers are the principal source of health insurance in the United States, providing
health benefits for about 149 million nonelderly people in America.1 Most workers are
offered health coverage at work, and the majority of workers who are offered coverage
take it. Workers may not be covered by their own employer for several reasons: their
employer may not offer coverage, they may be ineligible for benefits offered by their firm,
they may choose to elect coverage through their spouse’s employer, or they may refuse
coverage from their firm.
Among firms offering health benefits, 62% percent of workers are covered by health benefits through their own employer (Exhibit 3.2). When considering both firms that offer health benefits and those that don’t, 56% of workers are covered under their employer’s plan (Exhibit 3.1). This coverage rate has remained stable over time.
Eligibility
Not all employees are eligible for the health benefits offered by their firm, and not all eligible employees take up the offer of coverage. The share of workers covered in a firm is a product of both the percentage of workers who are eligible for the firm’s health insurance and the percentage who choose to “take up” (i.e., elect to participate in) the benefit.
o Seventy-seven percent of workers in firms offering health benefits are eligible for the coverage offered by their employer (Exhibit 3.2).
o Eligibility varies considerably by wage level. Employees in firms with a lower proportion of lower-wage workers (less than 35% of workers earn $23,000 or less annually) are more likely to be eligible for health benefits than employees in firms with a higher proportion of lower-wage workers (80% vs. 61%). We observe a similar pattern among firms with many higher-wage workers (35% or more of workers earn $56,000 or more annually) (84% vs. 73%) (Exhibit 3.3).
o Eligibility also varies by the age of the workforce. Those in firms with fewer younger workers (less than 35% of workers are age 26 or younger) are more likely to be eligible for health benefits than are workers in firms with many younger workers, at 78% versus 63% (Exhibit 3.3).
1 Kaiser Family Foundation, Kaiser Commission on Medicaid and the Uninsured, The Uninsured: A Primer: Key Facts About Americans Without Health Insurance, October 2012. http://www.kff.org/uninsured/issue-brief/the-uninsured-a-primer/. 56% of the non-elderly American population receives insurance coverage through an employer-sponsored plan.

section
three
Em
ployee Coverage, E
ligibility, and ParticipationEmployer Health Benefits 2 0 1 3 An n u a l S u r vey
T H E K A I S E R FA M I LY F O U N D AT I O N - A N D - H E A LT H R E S E A R C H & E D U C AT I O N A L T R U S T
3
44
Take-up Rate
Employees who are offered health benefits generally elect to take up the coverage. In 2013, 80% of eligible workers take up coverage when it is offered to them, which is similar to the 81% reported last year (Exhibit 3.2).2
o The likelihood of a worker accepting a firm’s offer of coverage also varies by workforce wage level. Eligible employees in firms with a lower proportion of lower-wage workers are more likely to take up coverage (81%) than eligible employees in firms with a higher proportion of lower-wage workers (35% or more of workers earn $23,000 or less annually) (68%) (Exhibit 3.4). Similar patterns are seen in firms with a higher proportion of younger workers, with workers in these firms being less likely to take up coverage than those in firms with a smaller share of younger workers (70% vs. 81%).
o Almost nine out of ten workers at public employers who offer health benefits take up coverage (89%). However, workers at private for-profit employers are significantly less likely to do so – only 77% of these workers take up coverage (Exhibit 3.4).
Coverage
There is significant variation by industry in the coverage rate among workers in firms offering health benefits. For example, only 37% of workers in retail firms offering health benefits are covered by the health benefits offered by their firm, compared to 74% of workers in finance, and 74% of workers in the transportation/communications/utilities industry category (Exhibit 3.2).
Among workers in firms offering health benefits, those in firms with relatively few part-time workers (less than 35% of workers are part-time) are much more likely to be covered by their own firm than workers in firms with a greater percentage of part-time workers (68% vs. 38%) (Exhibit 3.5).
Among workers in firms offering health benefits, those in firms with fewer lower-wage workers (less than 35% of workers earn $23,000 or less annually) are more likely to be covered by their own firm than workers in firms with many lower-wage workers (65% vs. 41%) (Exhibit 3.5). A comparable pattern exists in firms with a larger proportion of higher wage workers (35% or more earn $56,000 or more annually) offering health benefits.
Among workers in firms offering health benefits, those in firms with fewer younger workers (less than 35% of workers are age 26 or younger) are more likely to be covered by their own firm than workers in firms with many younger workers (63% vs. 44%) (Exhibit 3.5).
2 In 2009, Kaiser/HRET began weighting the percentage of workers that take up coverage by the number of workers eligible for coverage. The historical take up estimates have also been updated. See the Survey Design and Methods section for more information.

Employer Health Benefits 2 0 1 3 An n u a l S u r vey
T H E K A I S E R FA M I LY F O U N D AT I O N - A N D - H E A LT H R E S E A R C H & E D U C AT I O N A L T R U S T
45
section
three
Em
ployee Coverage, E
ligibility, and Participation
3
Average Waiting Periods
Seventy-seven percent of covered workers face a waiting period before coverage is available. Covered workers in small firms (3-199 workers) are more likely than those in large firms to have a waiting period, at 83% versus 74% (Exhibit 3.7). Workers in the Northeast are less likely to face a wait for coverage than all other regions (70%).
The average waiting period among covered workers who face a waiting period is 1.8 months (Exhibit 3.7). While 30% of covered workers face a waiting period of 3 months or more, only 9% face a waiting period of 4 months or more. Workers in small firms (3-199 workers) generally have longer waiting periods than workers in larger firms (Exhibit 3.8).
Ninety-one percent of covered workers at firms with many lower wage workers (firms where more than 35% of the workforce makes $23,000 or less) compared to 76% at firms with few lower-wage workers face a waiting period before coverage is available.

section threeEmployee Coverage, Eligibility, and ParticipationEm
ployer Health B
enefits 20
13
An
nu
al S
urve
y
TH
E K
AIS
ER
FAM
ILY F
OU
ND
AT
ION
-AN
D- H
EA
LTH
RE
SE
AR
CH
& E
DU
CA
TIO
NA
L T
RU
ST
3
46
1999 2000 2001 2002 2003 2004 2005 2006 2007 2008 2009 2010 2011 2012 2013FIRM SIZE
3-24 Workers 50% 50% 49% 45% 44% 43% 41% 45% 42% 43% 39% 44% 38% 36% 36%25-49 Workers 56 63 62 57 59 56 55 55 51 57 54 59 49 54 5350-199 Workers 61 62 67 64 61 56 59 62 59 60 59 60 59 58 57200-999 Workers 69 69 71 69 68 69 65 66 65 67 63 61 63 61 631,000-4,999 Workers 68 68 69 70 69 68 69 68 69 69 67 66 66 66 675,000 or More Workers 64 66 69 68 68 67 66 60 63 64 65 63 64 61 58
All Small Firms (3-199 Workers) 55% 57% 58% 54% 53% 50% 50% 53% 50% 52% 49% 52% 48%* 47% 46%All Large Firms (200 or More Workers) 66% 67% 69% 69% 68% 68% 66% 63% 65% 66% 65% 63% 64% 62% 61%
ALL FIRMS 62% 63% 65% 63% 62% 61% 60% 59% 59% 60% 59% 59% 58% 56% 56%
*Estimates are significantly different from estimate for the previous year shown (p<.05).
Source: Kaiser/HRET Survey of Employer-Sponsored Health Benefits, 1999-2013.
Percentage of All Workers Covered by Their Employers’ Health Benefits, in Firms Both Offering and Not Offering Health Benefits, by Firm Size, 1999-2013
Exhibit 3.1
Percentage of
Workers E
ligible For H
ealth B
enefits Offered
By Their
Em
ployer
Percentage of
Eligible W
orkers W
ho Participate
in Their E
mployers’ P
lan (Take-U
p Rate)
Percentage of
Workers C
overed by Their
Em
ployers’ H
ealth Benefits
FIRM SIZE
3-24 Workers
84%*
75%*
63%25-49 W
orkers81
7763
50-199 Workers
7780
61200-999 W
orkers79
8264
1,000-4,999 Workers
8183*
67*5,000 or M
ore Workers
7380
59All Sm
all Firms (3-199 W
orkers)80%
*77%
*62%
All Large Firms (200 or M
ore Workers)
76%*
81%*
62%REG
ION
Northeast
75%77%
*58%
Midw
est75
78*58
South
7882
64W
est80%
82%65%
INDUSTRYA
griculture/Mining/C
onstruction77%
78%60%
Manufacturing
89*82
73*Transportation/C
omm
unications/Utilities
8488*
74*W
holesale90*
7871*
Retail
56*67*
37*Finance
88*84*
74*S
ervice75
78*58*
State/Local G
overnment
8091*
73H
ealth Care
78%80%
62%ALL FIRM
S77%
80%62%
Exhibit 3.2
Source: K
aiser/HR
ET S
urvey of Em
ployer-Sponsored H
ealth Benefits, 2013.
* Estim
ate for eligibility, take-up rate, or coverage is statistically different from all other firm
s not in the indicated size, region, or industry category (p<.05).
Eligibility, Take-Up Rate, and Coverage in Firms O
ffering Health Benefits, by Firm Size,
Region, and Industry, 2013

Employer Health Benefits 2 0 1 3 An n u a l S u r vey
T H E K A I S E R FA M I LY F O U N D AT I O N - A N D - H E A LT H R E S E A R C H & E D U C AT I O N A L T R U S T
47
section
three
Em
ployee Coverage, E
ligibility, and Participation
3
Percentage of Workers Eligible
For Health Benefits Offered
By Their Employer
Percentage of Eligible Workers Who Participate
in Their Employers’ Plan (Take-Up Rate)
Percentage of Workers Covered
by Their Employers’
Health Benefits
FIRM SIZE3-24 Workers 84%* 75%* 63%25-49 Workers 81 77 6350-199 Workers 77 80 61200-999 Workers 79 82 641,000-4,999 Workers 81 83* 67*5,000 or More Workers 73 80 59
All Small Firms (3-199 Workers) 80%* 77%* 62%All Large Firms (200 or More Workers) 76%* 81%* 62%
REGIONNortheast 75% 77%* 58%Midwest 75 78* 58South 78 82 64West 80% 82% 65%
INDUSTRYAgriculture/Mining/Construction 77% 78% 60%Manufacturing 89* 82 73*Transportation/Communications/Utilities 84 88* 74*Wholesale 90* 78 71*Retail 56* 67* 37*Finance 88* 84* 74*Service 75 78* 58*State/Local Government 80 91* 73Health Care 78% 80% 62%
ALL FIRMS 77% 80% 62%
Exhibit 3.2
Source: Kaiser/HRET Survey of Employer-Sponsored Health Benefits, 2013.
* Estimate for eligibility, take-up rate, or coverage is statistically different from all other firms not in the indicated size, region, or industry category (p<.05).
Eligibility, Take-Up Rate, and Coverage in Firms Offering Health Benefits, by Firm Size, Region, and Industry, 2013

section
three
Em
ployee Coverage, E
ligibility, and ParticipationEmployer Health Benefits 2 0 1 3 An n u a l S u r vey
T H E K A I S E R FA M I LY F O U N D AT I O N - A N D - H E A LT H R E S E A R C H & E D U C AT I O N A L T R U S T
3
48
80%61%
73%84%
84%52%
74%79%
78%63%
77%77%
76%81%
77%
* Estimates are statistically different from each other within category (p<.05). SOURCE: Kaiser/HRET Survey of Employer-Sponsored Health Benefits, 2013.
Exhibit 3.3Among Workers in Firms Offering Health Benefits, Percentage of Workers Eligible for Health Benefits Offered by Their Firm, by Firm Characteristics, 2013
Low Wage LevelLess Than 35% Earn $23,000 a Year or Less *
35% or More Earn $23,000 a Year or Less *
High Wage LevelLess Than 35% Earn $56,000 a Year or More *
35% or More Earn $56,000 a Year or More *
Part-Time WorkersLess Than 35% Work Part-Time *
35% or More Work Part-Time *
UnionsFirm Has At Least Some Union Workers
Firm Does Not Have Any Union Workers
Younger WorkersLess Than 35% of Workers Are Age 26 or Younger *
35% or More Workers Are Age 26 or Younger *
Older WorkersLess Than 35% of Workers Are Age 50 or Older
35% or More Workers Are Age 50 or Older
Private For-ProfitFirm Ownership Public
Private Not-For-Profit
81%68%
76%84%
81%72%
83%78%
81%70%
79%82%
77%89%
81%
* Estimates are statistically different from each other within category (p<.05). SOURCE: Kaiser/HRET Survey of Employer-Sponsored Health Benefits, 2013.
Exhibit 3.4Among Workers in Firms Offering Health Benefits, Percentage of Eligible Workers Who Take Up Health Benefits Offered by Their Firm, by Firm Characteristics, 2013
Low Wage LevelLess Than 35% Earn $23,000 a Year or Less *
35% or More Earn $23,000 a Year or Less *
High Wage LevelLess Than 35% Earn $56,000 a Year or More *
35% or More Earn $56,000 a Year or More *
Part-Time WorkersLess Than 35% Work Part-Time *
35% or More Work Part-Time *
UnionsFirm Has At Least Some Union Workers
Firm Does Not Have Any Union Workers
Younger WorkersLess Than 35% of Workers Are Age 26 or Younger *
35% or More Workers Are Age 26 or Younger *
Older WorkersLess Than 35% of Workers Are Age 50 or Older
35% or More Workers Are Age 50 or Older
Private For-Profit *Firm Ownership Public *
Private Not-For-Profit

Employer Health Benefits 2 0 1 3 An n u a l S u r vey
T H E K A I S E R FA M I LY F O U N D AT I O N - A N D - H E A LT H R E S E A R C H & E D U C AT I O N A L T R U S T
49
section
three
Em
ployee Coverage, E
ligibility, and Participation
3
81%68%
76%84%
81%72%
83%78%
81%70%
79%82%
77%89%
81%
* Estimates are statistically different from each other within category (p<.05). SOURCE: Kaiser/HRET Survey of Employer-Sponsored Health Benefits, 2013.
Exhibit 3.4Among Workers in Firms Offering Health Benefits, Percentage of Eligible Workers Who Take Up Health Benefits Offered by Their Firm, by Firm Characteristics, 2013
Low Wage LevelLess Than 35% Earn $23,000 a Year or Less *
35% or More Earn $23,000 a Year or Less *
High Wage LevelLess Than 35% Earn $56,000 a Year or More *
35% or More Earn $56,000 a Year or More *
Part-Time WorkersLess Than 35% Work Part-Time *
35% or More Work Part-Time *
UnionsFirm Has At Least Some Union Workers
Firm Does Not Have Any Union Workers
Younger WorkersLess Than 35% of Workers Are Age 26 or Younger *
35% or More Workers Are Age 26 or Younger *
Older WorkersLess Than 35% of Workers Are Age 50 or Older
35% or More Workers Are Age 50 or Older
Private For-Profit *Firm Ownership Public *
Private Not-For-Profit

section
three
Em
ployee Coverage, E
ligibility, and ParticipationEmployer Health Benefits 2 0 1 3 An n u a l S u r vey
T H E K A I S E R FA M I LY F O U N D AT I O N - A N D - H E A LT H R E S E A R C H & E D U C AT I O N A L T R U S T
3
50
65%41%
55%71%
68%38%
62%62%
63%44%
61%63%
59%72%
63%
* Estimates are statistically different from each other within category (p<.05). SOURCE: Kaiser/HRET Survey of Employer-Sponsored Health Benefits, 2013.
Exhibit 3.5Among Workers in Firms Offering Health Benefits, Percentage of Workers Covered by Health Benefits Offered by Their Firm, by Firm Characteristics, 2013
Low Wage LevelLess Than 35% Earn $23,000 a Year or Less *
35% or More Earn $23,000 a Year or Less *
High Wage LevelLess Than 35% Earn $56,000 a Year or More *
35% or More Earn $56,000 a Year or More *
Part-Time WorkersLess Than 35% Work Part-Time *
35% or More Work Part-Time *
UnionsFirm Has At Least Some Union Workers
Firm Does Not Have Any Union Workers
Younger WorkersLess Than 35% of Workers Are Age 26 or Younger *
35% or More Workers Are Age 26 or Younger *
Older WorkersLess Than 35% of Workers Are Age 50 or Older
35% or More Workers Are Age 50 or Older
Private For-Profit *Firm Ownership Public *
Private Not-For-Profit
1999
2000
2001
2002
2003
2004
2005
2006
2007
2008
2009
2010
2011
2012
2013
Perc
enta
ge E
ligib
leA
ll S
mal
l Firm
s (3
-199
Wor
kers
)81
%82
%85
%82
%*
84%
80%
81%
83%
80%
81%
81%
82%
83%
78%
*80
%A
ll La
rge
Firm
s (2
00 o
r Mor
e W
orke
rs)
7880
8280
8081
7976
7879
7977
7876
76AL
L FI
RMS
79%
81%
83%
81%
*81
%80
%80
%78
%79
%80
%79
%79
%79
%77
%77
%Pe
rcen
tage
of E
ligib
le T
hat T
ake
UpA
ll S
mal
l Firm
s (3
-199
Wor
kers
)83
%83
%83
%82
%81
%80
%81
%81
%80
%80
%79
%77
%78
%78
%77
%A
ll La
rge
Firm
s (2
00 o
r Mor
e W
orke
rs)
8684
8586
8584
8584
8484
8282
8382
81AL
L FI
RMS
85%
84%
84%
85%
84%
83%
83%
83%
82%
82%
81%
80%
81%
81%
80%
Perc
enta
ge C
over
edA
ll S
mal
l Firm
s (3
-199
Wor
kers
)67
%68
%71
%67
%*
68%
64%
65%
67%
64%
65%
64%
63%
65%
61%
62%
All
Larg
e Fi
rms
(200
or M
ore
Wor
kers
)66
6769
6968
6867
6365
6665
6365
6262
ALL
FIRM
S66
%68
%70
%68
%68
%67
%66
%65
%65
%65
%65
%63
%65
%62
%62
%
* E
stim
ate
is s
tatis
tical
ly d
iffer
ent f
rom
est
imat
e fo
r the
pre
vious
yea
r sho
wn
(p<.
05).
Sou
rce:
Kai
ser/H
RE
T S
urve
y of
Em
ploy
er-S
pons
ored
Hea
lth B
enef
its, 1
999-
2013
.
Elig
ibili
ty, T
ake-
Up R
ate,
and
Cov
erag
e fo
r Wor
kers
in F
irms
Offe
ring
Heal
th B
enef
its, b
y Fi
rm S
ize,
199
9-20
13Ex
hibi
t 3.6
Not
e: In
200
9, K
aise
r/HR
ET
bega
n w
eigh
ting
the
perc
enta
ge o
f wor
kers
that
take
up
cove
rage
by
the
num
ber o
f wor
kers
elig
ible
for c
over
age.
The
hi
stor
ical
take
-up
estim
ates
hav
e al
so b
een
upda
ted.
See
the
Sur
vey
Des
ign
and
Met
hods
sec
tion
for m
ore
info
rmat
ion.

Employer H
ealth Benefits 2
01
3 A
nn
ua
l Su
rvey
TH
E K
AIS
ER
FAM
ILY F
OU
ND
AT
ION
-AN
D- H
EA
LTH
RE
SE
AR
CH
& E
DU
CA
TIO
NA
L T
RU
ST
51
section threeEmployee Coverage, Eligibility, and Participation
3
1999 2000 2001 2002 2003 2004 2005 2006 2007 2008 2009 2010 2011 2012 2013Percentage Eligible
All Small Firms (3-199 Workers) 81% 82% 85% 82%* 84% 80% 81% 83% 80% 81% 81% 82% 83% 78%* 80%All Large Firms (200 or More Workers) 78 80 82 80 80 81 79 76 78 79 79 77 78 76 76
ALL FIRMS 79% 81% 83% 81%* 81% 80% 80% 78% 79% 80% 79% 79% 79% 77% 77%Percentage of Eligible That Take Up
All Small Firms (3-199 Workers) 83% 83% 83% 82% 81% 80% 81% 81% 80% 80% 79% 77% 78% 78% 77%All Large Firms (200 or More Workers) 86 84 85 86 85 84 85 84 84 84 82 82 83 82 81
ALL FIRMS 85% 84% 84% 85% 84% 83% 83% 83% 82% 82% 81% 80% 81% 81% 80%Percentage Covered
All Small Firms (3-199 Workers) 67% 68% 71% 67%* 68% 64% 65% 67% 64% 65% 64% 63% 65% 61% 62%All Large Firms (200 or More Workers) 66 67 69 69 68 68 67 63 65 66 65 63 65 62 62
ALL FIRMS 66% 68% 70% 68% 68% 67% 66% 65% 65% 65% 65% 63% 65% 62% 62%
* Estimate is statistically different from estimate for the previous year shown (p<.05).
Source: Kaiser/HRET Survey of Employer-Sponsored Health Benefits, 1999-2013.
Eligibility, Take-Up Rate, and Coverage for Workers in Firms Offering Health Benefits, by Firm Size, 1999-2013Exhibit 3.6
Note: In 2009, Kaiser/HRET began weighting the percentage of workers that take up coverage by the number of workers eligible for coverage. The historical take-up estimates have also been updated. See the Survey Design and Methods section for more information.

section
three
Em
ployee Coverage, E
ligibility, and ParticipationEmployer Health Benefits 2 0 1 3 An n u a l S u r vey
T H E K A I S E R FA M I LY F O U N D AT I O N - A N D - H E A LT H R E S E A R C H & E D U C AT I O N A L T R U S T
3
52
Percentage of Covered Workers in Firms with a Waiting
Period
Among Covered Workers with a Waiting Period,
Average Waiting Period (Months)
FIRM SIZEAll Small Firms (3-199 Workers) 83%* 2.1*All Large Firms (200 or More Workers) 74%* 1.6*
REGIONNortheast 70%* 1.8Midwest 80 1.6South 78 1.7West 78 2.0
INDUSTRYAgriculture/Mining/Construction 84% 2.3*Manufacturing 75 1.5Transportation/Communications/Utilities 64 1.1*Wholesale 85 1.9Retail 94* 3.8Finance 72 1.3*Service 76 1.7State/Local Government 54* 1.0*Health Care 89* 1.9
ALL FIRMS 77% 1.8
Source: Kaiser/HRET Survey of Employer-Sponsored Health Benefits, 2013.
Exhibit 3.7Percentage of Covered Workers in Firms with a Waiting Period for Coverage and
Average Waiting Period in Months, by Firm Size, Region, and Industry, 2013
* Estimate is statistically different from estimate for all other firms not in the indicated size, region, or industry category (p<.05).
23%
26%
17%
28%
31%
23%
19%
20%
16%
21%
15%
32%
9%
8%
11%
All Firms
Large Firms(200 or more workers)*
Small Firms(3-199 workers)*
No Waiting Period
1 Month
2 Months
3 Months
4 or More Months
* Distributions are statistically different between All Large Firms and All Small Firms (p<.05). SOURCE: Kaiser/HRET Survey of Employer-Sponsored Health Benefits, 2013.
Exhibit 3.8Distribution of Covered Workers with the Following Waiting Periods for Coverage, 2013

Employer Health Benefits 2 0 1 3 An n u a l S u r vey
T H E K A I S E R FA M I LY F O U N D AT I O N - A N D - H E A LT H R E S E A R C H & E D U C AT I O N A L T R U S T
53
section
three
Em
ployee Coverage, E
ligibility, and Participation
3
Percentage of Covered Workers in Firms with a Waiting
Period
Among Covered Workers with a Waiting Period,
Average Waiting Period (Months)
FIRM SIZEAll Small Firms (3-199 Workers) 83%* 2.1*All Large Firms (200 or More Workers) 74%* 1.6*
REGIONNortheast 70%* 1.8Midwest 80 1.6South 78 1.7West 78 2.0
INDUSTRYAgriculture/Mining/Construction 84% 2.3*Manufacturing 75 1.5Transportation/Communications/Utilities 64 1.1*Wholesale 85 1.9Retail 94* 3.8Finance 72 1.3*Service 76 1.7State/Local Government 54* 1.0*Health Care 89* 1.9
ALL FIRMS 77% 1.8
Source: Kaiser/HRET Survey of Employer-Sponsored Health Benefits, 2013.
Exhibit 3.7Percentage of Covered Workers in Firms with a Waiting Period for Coverage and
Average Waiting Period in Months, by Firm Size, Region, and Industry, 2013
* Estimate is statistically different from estimate for all other firms not in the indicated size, region, or industry category (p<.05).
23%
26%
17%
28%
31%
23%
19%
20%
16%
21%
15%
32%
9%
8%
11%
All Firms
Large Firms(200 or more workers)*
Small Firms(3-199 workers)*
No Waiting Period
1 Month
2 Months
3 Months
4 or More Months
* Distributions are statistically different between All Large Firms and All Small Firms (p<.05). SOURCE: Kaiser/HRET Survey of Employer-Sponsored Health Benefits, 2013.
Exhibit 3.8Distribution of Covered Workers with the Following Waiting Periods for Coverage, 2013

57%$16,3
51
$5,8
84
2013
Employer Health Benefits2 0 1 3 A N N U A L S U R V E Y
sect ion
Types ofPlans
Offered
4

Employer Health Benefits 2 0 1 3 An n u a l S u r vey
T H E K A I S E R FA M I LY F O U N D AT I O N - A N D - H E A LT H R E S E A R C H & E D U C AT I O N A L T R U S T
55
4
section
fou
rTypes of Plans O
ffered
Section Four: Types of Plans Offered Most firms that offer health benefits offer only one type of health plan (87%) (See Text
Box). Large firms (200 or more workers) are more likely to offer more than one type of
health plan than smaller firms. Employers are most likely to offer their workers a PPO or
HDHP/SO plan and are least likely to offer a conventional
plan.
Eighty-seven percent of firms offering health benefits
in 2013 offer only one type of health plan. Large firms (200 or more workers) are more likely to offer more than one plan type than small firms (3-199 workers): 46% vs. 12%.
Over half (52%) of covered workers are employed in a firm that offers more than one health plan type. Sixty-five percent of covered workers in large firms (200 or more workers) are employed by a firm that offers more than one plan type, compared to 22% in small firms (3-199 workers).
Three quarters (76%) of covered workers in firms offering health benefits work in a
firm that offers one or more PPO plans; 43% work in firms that offer one or more HDHP/SOs; 34% work in firms that offer one or more HMO plans; 13% work in firms that offer one or more POS plans; and 4% work in firms that offer one or more conventional plans (Exhibit 4.4).1
1 Starting in 2010 we included firms that said they offer a plan type even if there are no covered workers in that plan type.
The survey collects information on a firm’s plan with the largest enrollment in each of the plan types. While we know the number of plan types a firm has, we do not know the total number of plans a firm offers. In addition, firms may offer different types of plans to different workers. For example, some workers might be offered one type of plan at one location, while workers at another location are offered a different type of plan.
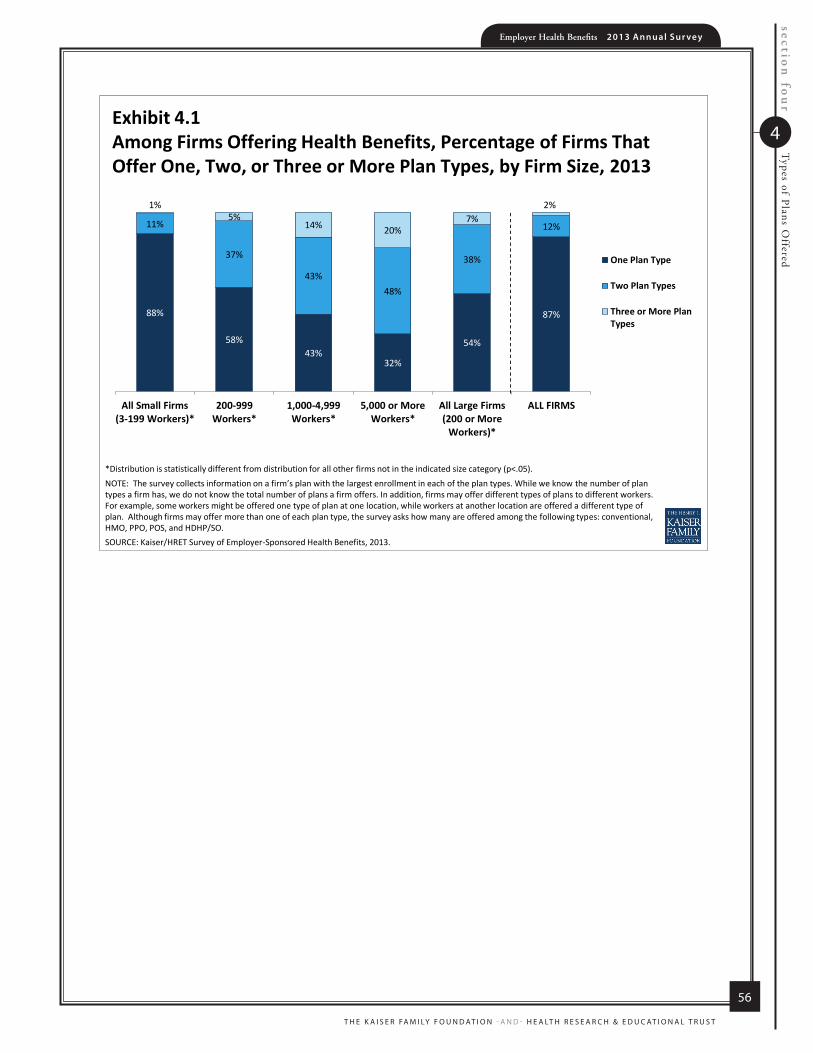
section
fou
rTypes of Plans O
fferedEmployer Health Benefits 2 0 1 3 An n u a l S u r vey
T H E K A I S E R FA M I LY F O U N D AT I O N - A N D - H E A LT H R E S E A R C H & E D U C AT I O N A L T R U S T
4
56
88%
58%43%
32%
54%
87%
11%
37%
43%48%
38%
12%
1%5%
14% 20%7%
2%
All Small Firms(3-199 Workers)*
200-999Workers*
1,000-4,999Workers*
5,000 or MoreWorkers*
All Large Firms(200 or More
Workers)*
ALL FIRMS
One Plan Type
Two Plan Types
Three or More PlanTypes
*Distribution is statistically different from distribution for all other firms not in the indicated size category (p<.05).NOTE: The survey collects information on a firm’s plan with the largest enrollment in each of the plan types. While we know the number of plan types a firm has, we do not know the total number of plans a firm offers. In addition, firms may offer different types of plans to different workers. For example, some workers might be offered one type of plan at one location, while workers at another location are offered a different type of plan. Although firms may offer more than one of each plan type, the survey asks how many are offered among the following types: conventional, HMO, PPO, POS, and HDHP/SO.SOURCE: Kaiser/HRET Survey of Employer-Sponsored Health Benefits, 2013.
Exhibit 4.1Among Firms Offering Health Benefits, Percentage of Firms That Offer One, Two, or Three or More Plan Types, by Firm Size, 2013
78%
53%39%
25%35%
49%
18%
41%
43%
45%
44%
36%
4% 5%18%
30%22% 16%
All Small Firms(3-199 Workers)*
200-999Workers*
1,000-4,999Workers*
5,000 or MoreWorkers*
All Large Firms(200 or More
Workers)*
ALL FIRMS
One Plan Type
Two Plan Types
Three or More PlanTypes
*Distribution is statistically different from distribution for all other firms not in the indicated size category (p<.05).NOTE: The survey collects information on a firm’s plan with the largest enrollment in each of the plan types. While we know the number of plan types a firm has, we do not know the total number of plans a firm offers. In addition, firms may offer different types of plans to different workers. For example, some workers might be offered one type of plan at one location, while workers at another location are offered a different type of plan. Although firms may offer more than one of each plan type, the survey asks how many are offered among the following types: conventional, HMO, PPO, POS, and HDHP/SO.SOURCE: Kaiser/HRET Survey of Employer-Sponsored Health Benefits, 2013.
Exhibit 4.2Percentage of Covered Workers in Firms Offering One, Two, or Three or More Plan Types, by Firm Size, 2013

Employer Health Benefits 2 0 1 3 An n u a l S u r vey
T H E K A I S E R FA M I LY F O U N D AT I O N - A N D - H E A LT H R E S E A R C H & E D U C AT I O N A L T R U S T
57
4
section
fou
rTypes of Plans O
ffered
78%
53%39%
25%35%
49%
18%
41%
43%
45%
44%
36%
4% 5%18%
30%22% 16%
All Small Firms(3-199 Workers)*
200-999Workers*
1,000-4,999Workers*
5,000 or MoreWorkers*
All Large Firms(200 or More
Workers)*
ALL FIRMS
One Plan Type
Two Plan Types
Three or More PlanTypes
*Distribution is statistically different from distribution for all other firms not in the indicated size category (p<.05).NOTE: The survey collects information on a firm’s plan with the largest enrollment in each of the plan types. While we know the number of plan types a firm has, we do not know the total number of plans a firm offers. In addition, firms may offer different types of plans to different workers. For example, some workers might be offered one type of plan at one location, while workers at another location are offered a different type of plan. Although firms may offer more than one of each plan type, the survey asks how many are offered among the following types: conventional, HMO, PPO, POS, and HDHP/SO.SOURCE: Kaiser/HRET Survey of Employer-Sponsored Health Benefits, 2013.
Exhibit 4.2Percentage of Covered Workers in Firms Offering One, Two, or Three or More Plan Types, by Firm Size, 2013

section fourTypes of Plans OfferedEm
ployer Health B
enefits 20
13
An
nu
al S
urve
y
TH
E K
AIS
ER
FAM
ILY F
OU
ND
AT
ION
-AN
D- H
EA
LTH
RE
SE
AR
CH
& E
DU
CA
TIO
NA
L T
RU
ST
4
58
FIRM SIZES Conventional HMO PPO POS HDHP/SO3-24 Workers 2% 15% 48% 25% 20%*25-199 Workers 2 24 53 19 30*200-999 Workers <1 23 72* 14* 39*1,000-4,999 Workers 2 30* 86* 11* 41*5,000 or More Workers 7 39* 86* 8* 51*
All Small Firms (3-199 Workers) 2% 17%* 49%* 24%* 22%*All Large Firms (200 or More Workers) 1% 25%* 75%* 13%* 40%*
ALL FIRMS 2% 17% 50% 23% 23%
Exhibit 4.3
* Estimate is statistically different within plan type from estimate for all other firms not in the indicated size category (p<.05).
Source: Kaiser/HRET Survey of Employer-Sponsored Health Benefits, 2013.
Among Firms Offering Health Benefits, Percentage of Firms That Offer the Following Plan Types, by Firm Size, 2013
Note: The survey collects information on a firm’s plan with the largest enrollment in each of the plan types. While we know the number of plan types a firm has, we do not know the total number of plans a firm offers. In addition, firms may offer different types of plans to different workers. For example, some workers might be offered one type of plan at one location, while workers at another location are offered a different type of plan.

Employer H
ealth Benefits 2
01
3 A
nn
ua
l Su
rvey
TH
E K
AIS
ER
FAM
ILY F
OU
ND
AT
ION
-AN
D- H
EA
LTH
RE
SE
AR
CH
& E
DU
CA
TIO
NA
L T
RU
ST
59
4
section fourTypes of Plans Offered
FIRM SIZES Conventional HMO PPO POS HDHP/SO3-24 Workers 2% 15% 48% 25% 20%*25-199 Workers 2 24 53 19 30*200-999 Workers <1 23 72* 14* 39*1,000-4,999 Workers 2 30* 86* 11* 41*5,000 or More Workers 7 39* 86* 8* 51*
All Small Firms (3-199 Workers) 2% 17%* 49%* 24%* 22%*All Large Firms (200 or More Workers) 1% 25%* 75%* 13%* 40%*
ALL FIRMS 2% 17% 50% 23% 23%
Exhibit 4.3
* Estimate is statistically different within plan type from estimate for all other firms not in the indicated size category (p<.05).
Source: Kaiser/HRET Survey of Employer-Sponsored Health Benefits, 2013.
Among Firms Offering Health Benefits, Percentage of Firms That Offer the Following Plan Types, by Firm Size, 2013
Note: The survey collects information on a firm’s plan with the largest enrollment in each of the plan types. While we know the number of plan types a firm has, we do not know the total number of plans a firm offers. In addition, firms may offer different types of plans to different workers. For example, some workers might be offered one type of plan at one location, while workers at another location are offered a different type of plan.
FIRM SIZES Conventional HMO PPO POS HDHP/SO3-199 Workers 2% 21%* 55%* 19%* 29%*200-999 Workers <1* 24* 79 11 391,000-4,999 Workers 2 33 87* 13 445,000 or More Workers 9* 49* 89* 7* 57*
All Small Firms (3-199 Workers) 2% 21%* 55%* 19%* 29%*All Large Firms (200 or More Workers) 5% 40%* 86%* 9%* 50%*
ALL FIRMS 4% 34% 76% 13% 43%
Source: Kaiser/HRET Survey of Employer-Sponsored Health Benefits, 2013.
Among Firms Offering Health Benefits, Percentage of Covered Workers in Firms That Offer the Following Plan Types, by Firm Size, 2013
Exhibit 4.4
* Estimate is statistically different within plan type from estimate for all other firms not in the indicated size category (p<.05).
Note: The survey collects information on a firm’s plan with the largest enrollment in each of the plan types. While we know the number of plan types a firm has, we do not know the total number of plans a firm offers. In addition, firms may offer different types of plans to different workers. For example, some workers might be offered one type of plan at one location, while workers at another location are offered a different type of plan.

section fourTypes of Plans OfferedEm
ployer Health B
enefits 20
13
An
nu
al S
urve
y
TH
E K
AIS
ER
FAM
ILY F
OU
ND
AT
ION
-AN
D- H
EA
LTH
RE
SE
AR
CH
& E
DU
CA
TIO
NA
L T
RU
ST
4
60
FIRM SIZES Conventional HMO PPO POS HDHP/SOAll Small Firms (3-199 Workers) 1%* 10%* 49%* 17%* 22%All Large Firms (200 or More Workers) 0%* 3%* 72%* 6%* 18%
ALL FIRMS <1% 7% 60% 12% 20%
Exhibit 4.5Among Firms Offering Only One Type of Health Plan, Percentage of Covered Workers in Firms That
Offer the Following Plan Type, by Firm Size, 2013
* Estimate is statistically different within plan type from estimate for all other firms not in the indicated size category (p<.05).
Note: The survey collects information on a firm’s plan with the largest enrollment in each of the plan types. While we know the number of plan types a firm has, we do not know the total number of plans a firm offers. In addition, firms may offer different types of plans to different workers. For example, some workers might be offered one type of plan at one location, while workers at another location are offered a different type of plan.
Source: Kaiser/HRET Survey of Employer-Sponsored Health Benefits, 2013.

57%$16,3
51
$5,8
84
2013
Employer Health Benefits2 0 1 3 A N N U A L S U R V E Y
sect ion
MarketShares of
Health Plans
5

section
fiveM
arket Shares of Health Plans
Employer Health Benefits 2 0 1 3 An n u a l S u r vey
T H E K A I S E R FA M I LY F O U N D AT I O N - A N D - H E A LT H R E S E A R C H & E D U C AT I O N A L T R U S T
5
62
Section Five: Market Shares of Health Plans
Enrollment remains highest in PPO plans, covering more than half of covered workers,
followed by HDHP/SOs, HMO plans, POS plans, and conventional plans. Enrollment
distribution varies by firm size, for example, PPOs are relatively more popular for covered
workers at large firms (200 or more workers) than smaller firms (62% vs. 47%) and POS
plans are relatively more popular among smaller firms than large firms (16% vs. 5%).
Fifty-seven percent of covered workers are enrolled in PPOs, followed by HDHP/SOs (20%), HMOs (14%), POS plans (9%), and conventional plans (<1%) (Exhibit 5.1).
After years of significant annual increases in the percentage of covered workers enrolled in HDHP/SO plans (8% in 2009, 13% in 2010, and 17% in 2011), there hasbeen a similar level of enrollment over the past two years (19% in 2012 and 20% in 2013) (Exhibit 5.1).
Enrollment in HMO plans is similar to 2012, but has declined significantly since 2011.
Plan enrollment patterns vary by firm size. Workers in large firms (200 or more workers) are more likely than workers in small firms (3-199 workers) to enroll in PPOs (62% vs. 47%). Workers in small firms are more likely than workers in large firms to enroll in POS plans (16% vs. 5%) (Exhibit 5.3).
Plan enrollment patterns also differ across regions.
o HMO enrollment is significantly higher in the West (25%) and significantly lower in the South (10%) and Midwest (7%) (Exhibit 5.3).
o Workers in the South (66%) are more likely to be enrolled in PPO plans than workers in other regions; workers in the West (49%) are less likely to be enrolled in a PPO (Exhibit 5.3).
o Enrollment in HDHP/SOs is higher among workers in the Midwest (27%) than in other regions (Exhibit 5.3).

Employer H
ealth Benefits 2
01
3 A
nn
ua
l Su
rvey
TH
E K
AIS
ER
FAM
ILY F
OU
ND
AT
ION
-AN
D- H
EA
LTH
RE
SE
AR
CH
& E
DU
CA
TIO
NA
L T
RU
ST
63
5
section fiveMarket Shares of Health Plans
<1%
<1%
1%
1%
1%
2%
3%
3%
3%
5%
5%
4%
7%
8%
10%
27%
46%
73%
14%
16%
17%
19%
20%
20%
21%
20%
21%
25%
24%
27%
24%
29%
28%
31%
21%
16%
57%
56%
55%
58%
60%
58%
57%
60%
61%
55%
54%
52%
46%
42%
39%
28%
26%
11%
9%
9%
10%
8%
10%
12%
13%
13%
15%
15%
17%
18%
23%
21%
24%
14%
7%
20%
19%
17%
13%
8%
8%
5%
4%
201320122011201020092008200720062005200420032002200120001999199619931988
Conventional HMO PPO POS HDHP/SO
NOTE: Information was not obtained for POS plans in 1988. A portion of the change in plan type enrollment for 2005 is likely attributable to incorporating more recent Census Bureau estimates of the number of state and local government workers and removing federal workers from the weights. See the Survey Design and Methods section from the 2005 Kaiser/HRET Survey of Employer-Sponsored Health Benefits for additional information.SOURCE: Kaiser/HRET Survey of Employer-Sponsored Health Benefits, 1999-2013; KPMG Survey of Employer-Sponsored Health Benefits, 1993, 1996; The Health Insurance Association of America (HIAA), 1988.
Exhibit 5.1Distribution of Health Plan Enrollment for Covered Workers, by Plan Type, 1988-2013

section
fiveM
arket Shares of Health Plans
Employer Health Benefits 2 0 1 3 An n u a l S u r vey
T H E K A I S E R FA M I LY F O U N D AT I O N - A N D - H E A LT H R E S E A R C H & E D U C AT I O N A L T R U S T
5
64
14%
15%
13%
57%
47%
62%
9%
16%
5%
20%
21%
19%
All Firms
Small Firms(3-199 workers)
Large Firms(200 or more workers)
Conventional HMO PPO* POS* HDHP/SO
*Enrollment in plan type is statistically different between Large and Small Employers (p<.05).NOTE: HMO is health maintenance organization. PPO is preferred provider organization. POS is point-of-service plan. HDHP/SO is high-deductible health plan with a savings option, such as health reimbursement arrangements (HRAs) and health savings accounts (HSAs). Less than 1% of covered workers in Large Firms and All Firms are enrolled in a conventional plan. SOURCE: Kaiser/HRET Survey of Employer-Sponsored Health Benefits, 2013.
Exhibit 5.2 Distribution of Health Plan Enrollment for Covered Workers, by Plan Type and Firm Size, 2013
1%
<1%
<1%
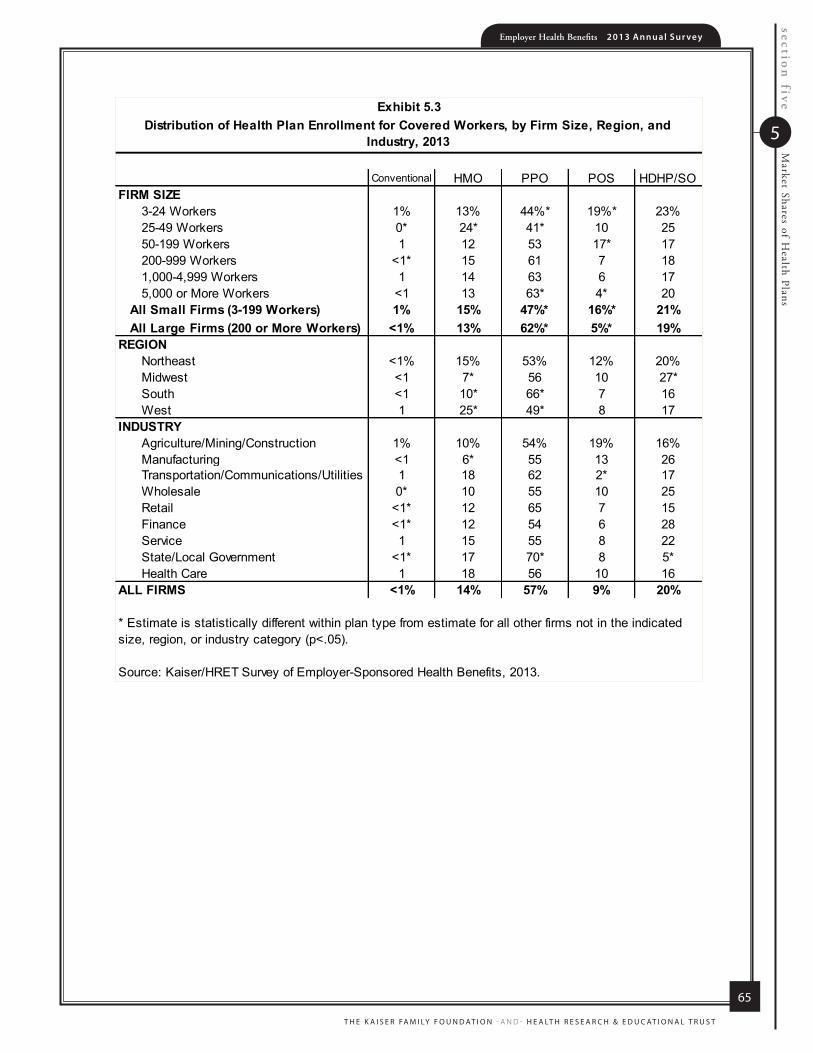
Employer Health Benefits 2 0 1 3 An n u a l S u r vey
T H E K A I S E R FA M I LY F O U N D AT I O N - A N D - H E A LT H R E S E A R C H & E D U C AT I O N A L T R U S T
65
5
section
fiveM
arket Shares of Health Plans
Conventional HMO PPO POS HDHP/SOFIRM SIZE
3-24 Workers 1% 13% 44%* 19%* 23%25-49 Workers 0* 24* 41* 10 2550-199 Workers 1 12 53 17* 17200-999 Workers <1* 15 61 7 181,000-4,999 Workers 1 14 63 6 175,000 or More Workers <1 13 63* 4* 20
All Small Firms (3-199 Workers) 1% 15% 47%* 16%* 21%All Large Firms (200 or More Workers) <1% 13% 62%* 5%* 19%
REGIONNortheast <1% 15% 53% 12% 20%Midwest <1 7* 56 10 27*South <1 10* 66* 7 16West 1 25* 49* 8 17
INDUSTRYAgriculture/Mining/Construction 1% 10% 54% 19% 16%Manufacturing <1 6* 55 13 26Transportation/Communications/Utilities 1 18 62 2* 17Wholesale 0* 10 55 10 25Retail <1* 12 65 7 15Finance <1* 12 54 6 28Service 1 15 55 8 22State/Local Government <1* 17 70* 8 5*Health Care 1 18 56 10 16
ALL FIRMS <1% 14% 57% 9% 20%
Source: Kaiser/HRET Survey of Employer-Sponsored Health Benefits, 2013.
Distribution of Health Plan Enrollment for Covered Workers, by Firm Size, Region, and Industry, 2013
Exhibit 5.3
* Estimate is statistically different within plan type from estimate for all other firms not in the indicated size, region, or industry category (p<.05).

57%$16,3
51
$5,8
84
2013
Employer Health Benefits2 0 1 3 A N N U A L S U R V E Y
sect ion
Worker and Employer
Contributions for Premiums
6

Employer Health Benefits 2 0 1 3 An n u a l S u r vey
T H E K A I S E R FA M I LY F O U N D AT I O N - A N D - H E A LT H R E S E A R C H & E D U C AT I O N A L T R U S T
67
6
section
sixW
orker and Em
ployer Contributions for Prem
iums
Section Six: Worker and Employer Contributions for Premiums
Premium contributions by covered workers average 18% for single coverage and 29%
for family coverage.1 The average monthly worker contributions are $83 for single
coverage ($999 annually) and $380 for family coverage ($4,565 annually). These
percentage and dollar values are similar to the values reported in 2012.
In 2013, covered workers on average contribute 18% of the premium for single coverage and 29% of the premium for family coverage, similar to the contribution percentages reported for 2012 (Exhibit 6.1). The premium contributions have remained stable over the last three years for both single and family coverage.
On average, workers with single coverage contribute $83 per month ($999 annually),and workers with family coverage contribute $380 per month ($4,565 annually), towards their health insurance premiums, similar to the amounts reported in 2012 (Exhibit 6.2, Exhibit 6.3, and Exhibit 6.4).
o Worker contributions in HDHP/SOs are lower than the overall average worker contributions for family coverage ($3,649 vs. $4,565) (Exhibit 6.5). Similarly, covered workers enrolled in HDHP/SO plans contribute less on average for family coverage than covered workers enrolled in other plan types ($3,649 vs. $4,787).
o Worker contributions in POS plans are higher for family coverage ($5,590)compared to the overall worker contribution for family coverage (Exhibit 6.5).
In addition to differences between plan types, there are differences in worker contributions by type of firm. As in previous years, workers in small firms (3-199workers) contribute a lower amount annually for single coverage than workers in large firms (200 or more workers), $862 vs. $1,065. In contrast, workers in small firms with family coverage contribute significantly more annually than workers with family coverage in large firms ($5,284 vs. $4,226) (Exhibit 6.8).
There is a great deal of variation in worker contributions to premiums.
o Twenty-seven percent of covered workers contribute $1,399 or more annually (140% or more of the average worker contribution) for single coverage, while 15% of covered workers have an annual worker contribution of less than $600(less than 60% of the average worker contribution) (Exhibit 6.14).
1 Estimates for premiums, worker contributions to premiums, and employer contributions to premiums presented in Section 6 do not include contributions made by the employer to Health Savings Accounts (HSAs) or Health Reimbursement Arrangements (HRAs). See Section 8 for estimates of employer contributions to HSAs and HRAs.

section
sixW
orker and Em
ployer Contributions for Prem
iums
Employer Health Benefits 2 0 1 3 An n u a l S u r vey
T H E K A I S E R FA M I LY F O U N D AT I O N - A N D - H E A LT H R E S E A R C H & E D U C AT I O N A L T R U S T
6
68
o For family coverage, 21% of covered workers contribute $6,392 or more annually (140% or more of the average worker contribution), while 20% of covered workers have an annual worker contribution of less than $2,739 (less than 60%of the average worker contribution) (Exhibit 6.14).
The majority of covered workers are employed by a firm that contributes at least half of the premium for single and family coverage.
o Fourteen percent of covered workers with single coverage and 5% of covered workers with family coverage work for a firm that pays 100% of the premium (Exhibit 6.15).
o Covered workers in small firms (3-199 workers) are more likely to work for a firm that pays 100% of the premium for single coverage than workers in large firms (200 or more workers). Thirty-two percent of covered workers in small firms have an employer that pays the full premium for single coverage, compared to 6% of covered workers in large firms (Exhibit 6.16). For family coverage, 14% percent of covered workers in small firms have an employer that pays the full premium, compared to 2% of covered workers in large firms (Exhibit 6.17).
o Four percent of covered workers in small firms (3-199 workers) contribute more than 50% of the premium for single coverage, compared to less than one percent of covered workers in large firms (200 or more workers) (Exhibit 6.16). For family coverage, 31% of covered workers in small firms work in a firm where they must contribute more than 50% of the premium, compared to 6% of covered workers in large firms (Exhibit 6.17).
The percentage of the premium paid by covered workers varies by several firm characteristics.
o For family coverage, covered workers in firms with many lower-wage workers (35% or more earn $23,000 or less annually) contribute a greater percentage of the premium than those in firms with fewer lower-wage workers (39% vs. 29%).
o Covered workers with family coverage in firms that have at least some union workers contribute a significantly lower percentage of the premium than those in firms without any unionized workers (23% vs. 33%) (Exhibit 6.20).
o For workers with family coverage in large firms (200 or more workers), the average percentage contribution for workers in firms that are partially or completely self-funded is lower than the average percentage contributions for workers in firms that are fully insured (25% vs. 32%)2 (Exhibit 6.20).
Among firms offering health benefits with fewer than 20 employees, 41% contribute different dollar amounts toward premiums for different employees (Exhibit 6.25).Employer may contribute different amounts to different employees based for a variety of reasons, including workers' age, smoking status, seniority, job title or location.
2 For definitions of Self-Funded and Fully Insured plans, see the introduction to Section 10.

Employer Health Benefits 2 0 1 3 An n u a l S u r vey
T H E K A I S E R FA M I LY F O U N D AT I O N - A N D - H E A LT H R E S E A R C H & E D U C AT I O N A L T R U S T
69
6
section
sixW
orker and Em
ployer Contributions for Prem
iums
Changes over Time
The amount which workers contribute to single coverage premiums has increased 97 percent since 2003 and 39% since 2008. Covered workers’ contributions to family coverage have increased 89% since 2003 and 36% since 2008.

section
sixW
orker and Em
ployer Contributions for Prem
iums
Employer Health Benefits 2 0 1 3 An n u a l S u r vey
T H E K A I S E R FA M I LY F O U N D AT I O N - A N D - H E A LT H R E S E A R C H & E D U C AT I O N A L T R U S T
6
70
Exhibit 6.1Average Percentage of Premium Paid by Covered Workers for Single and Family Coverage, 1999-2013
* Estimate is statistically different from estimate for the previous year shown (p<.05).
SOURCE: Kaiser/HRET Survey of Employer-Sponsored Health Benefits, 1999-2013.
14% 14% 14%16% 16% 16% 16% 16% 16% 16% 17%
19%* 18% 18% 18%
27% 26% 26%28% 27% 28%
26% 27% 28% 27% 27%30%*
28% 28% 29%
0%
5%
10%
15%
20%
25%
30%
35%
40%
45%
50%
1999 2000 2001 2002 2003 2004 2005 2006 2007 2008 2009 2010 2011 2012 2013
Single Coverage
Family Coverage
Exhibit 6.2Average Monthly Worker Premium Contributions Paid by Covered Workers for Single and Family Coverage, 1999-2013
* Estimate is statistically different from estimate for the previous year shown (p<.05).
SOURCE: Kaiser/HRET Survey of Employer-Sponsored Health Benefits, 1999-2013.
$27 $28 $30 $39* $42 $47 $51 $52 $58* $60 $65 $75* $77 $79 $83
$129 $135 $149*
$178* $201*
$222* $226 $248*
$273* $280 $293
$333* $344
$360 $380
$0
$50
$100
$150
$200
$250
$300
$350
$400
1999 2000 2001 2002 2003 2004 2005 2006 2007 2008 2009 2010 2011 2012 2013
Single Coverage
Family Coverage
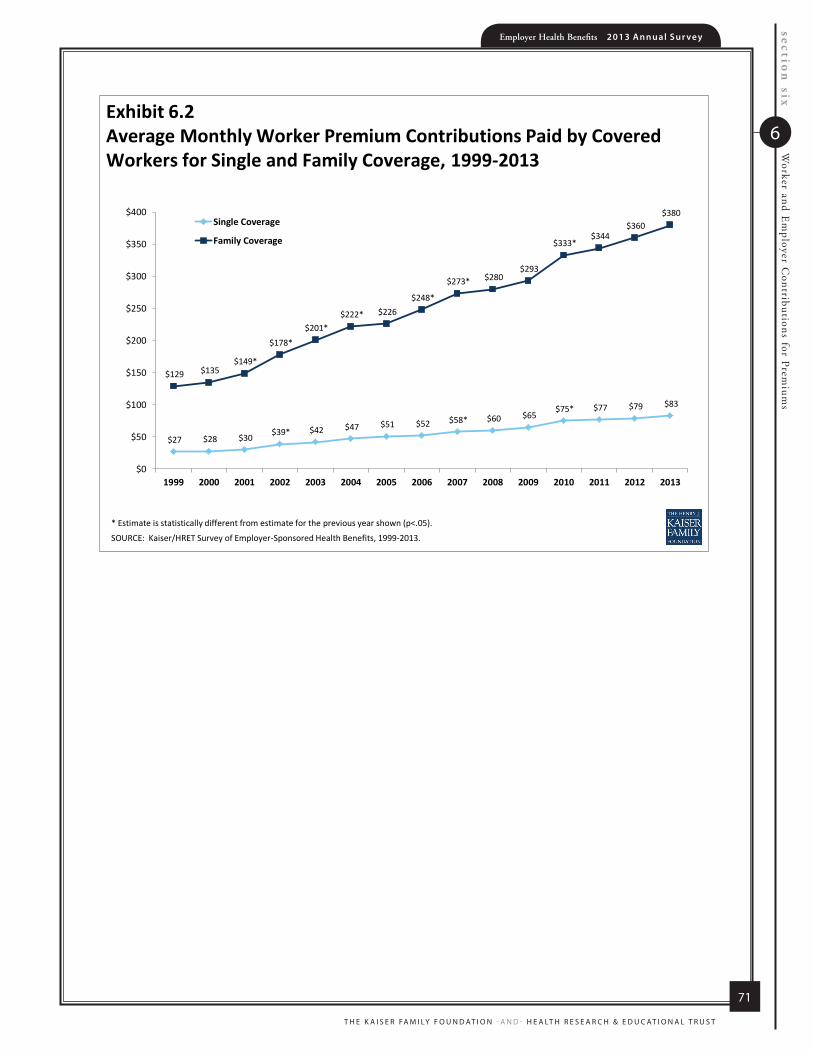
Employer Health Benefits 2 0 1 3 An n u a l S u r vey
T H E K A I S E R FA M I LY F O U N D AT I O N - A N D - H E A LT H R E S E A R C H & E D U C AT I O N A L T R U S T
71
6
section
sixW
orker and Em
ployer Contributions for Prem
iums
Exhibit 6.2Average Monthly Worker Premium Contributions Paid by Covered Workers for Single and Family Coverage, 1999-2013
* Estimate is statistically different from estimate for the previous year shown (p<.05).
SOURCE: Kaiser/HRET Survey of Employer-Sponsored Health Benefits, 1999-2013.
$27 $28 $30 $39* $42 $47 $51 $52 $58* $60 $65 $75* $77 $79 $83
$129 $135 $149*
$178* $201*
$222* $226 $248*
$273* $280 $293
$333* $344
$360 $380
$0
$50
$100
$150
$200
$250
$300
$350
$400
1999 2000 2001 2002 2003 2004 2005 2006 2007 2008 2009 2010 2011 2012 2013
Single Coverage
Family Coverage

section
sixW
orker and Em
ployer Contributions for Prem
iums
Employer Health Benefits 2 0 1 3 An n u a l S u r vey
T H E K A I S E R FA M I LY F O U N D AT I O N - A N D - H E A LT H R E S E A R C H & E D U C AT I O N A L T R U S T
6
72
* Estimate is statistically different from estimate for the previous year shown (p<.05). SOURCE: Kaiser/HRET Survey of Employer-Sponsored Health Benefits, 1999-2013.
Exhibit 6.3Average Annual Worker and Employer Contributions to Premiums and Total Premiums for Single Coverage, 1999-2013
$999
$951
$921
$899*
$779
$721
$694*
$627
$610
$558
$508
$466*
$355
$334
$318
$4,885*
$4,664
$4,508*
$4,150
$4,045
$3,983
$3,785
$3,615*
$3,413*
$3,136*
$2,875*
$2,617*
$2,334*
$2,137*
$1,878
2013
2012
2011
2010
2009
2008
2007
2006
2005
2004
2003
2002
2001
2000
1999Worker Contribution
Employer Contribution
$2,196
$2,471*
$2,689*
$3,083*
$3,383*
$3,695*
$4,024*
$4,242*
$4,479*
$4,704*
$4,824
$5,049*
$5,429*
$5,615*
$5,884* $4,565
$4,316
$4,129
$3,997*
$3,515
$3,354
$3,281*
$2,973*
$2,713
$2,661*
$2,412*
$2,137*
$1,787*
$1,619
$1,543
$11,786
$11,429*
$10,944*
$9,773
$9,860*
$9,325*
$8,824
$8,508*
$8,167*
$7,289*
$6,657*
$5,866*
$5,274*
$4,819*
$4,247
2013
2012
2011
2010
2009
2008
2007
2006
2005
2004
2003
2002
2001
2000
1999Worker Contribution
Employer Contribution
Exhibit 6.4Average Annual Worker and Employer Contributions to Premiums and Total Premiums for Family Coverage, 1999-2013
* Estimate is statistically different from estimate for the previous year shown (p<.05).
SOURCE: Kaiser/HRET Survey of Employer-Sponsored Health Benefits, 1999-2013.
$5,791
$6,438*
$7,061*
$8,003*
$9,068*
$9,950*
$10,880*
$11,480*
$12,106*
$12,680*
$13,375*
$13,770*
$15,073*
$15,745*
$16,351*

Employer Health Benefits 2 0 1 3 An n u a l S u r vey
T H E K A I S E R FA M I LY F O U N D AT I O N - A N D - H E A LT H R E S E A R C H & E D U C AT I O N A L T R U S T
73
6
section
sixW
orker and Em
ployer Contributions for Prem
iums
$4,565
$4,316
$4,129
$3,997*
$3,515
$3,354
$3,281*
$2,973*
$2,713
$2,661*
$2,412*
$2,137*
$1,787*
$1,619
$1,543
$11,786
$11,429*
$10,944*
$9,773
$9,860*
$9,325*
$8,824
$8,508*
$8,167*
$7,289*
$6,657*
$5,866*
$5,274*
$4,819*
$4,247
2013
2012
2011
2010
2009
2008
2007
2006
2005
2004
2003
2002
2001
2000
1999Worker Contribution
Employer Contribution
Exhibit 6.4Average Annual Worker and Employer Contributions to Premiums and Total Premiums for Family Coverage, 1999-2013
* Estimate is statistically different from estimate for the previous year shown (p<.05).
SOURCE: Kaiser/HRET Survey of Employer-Sponsored Health Benefits, 1999-2013.
$5,791
$6,438*
$7,061*
$8,003*
$9,068*
$9,950*
$10,880*
$11,480*
$12,106*
$12,680*
$13,375*
$13,770*
$15,073*
$15,745*
$16,351*

section
sixW
orker and Em
ployer Contributions for Prem
iums
Employer Health Benefits 2 0 1 3 An n u a l S u r vey
T H E K A I S E R FA M I LY F O U N D AT I O N - A N D - H E A LT H R E S E A R C H & E D U C AT I O N A L T R U S T
6
74
Exhibit 6.5 Average Annual Firm and Worker Premium Contributions and Total Premiums for Covered Workers for Single and Family Coverage, by Plan Type, 2013
* Estimate is statistically different from All Plans estimate by coverage type (p<.05).
SOURCE: Kaiser/HRET Survey of Employer-Sponsored Health Benefits, 2013.
$1,081
$5,124
$1,024
$4,587
$957
$5,590*
$887
$3,649*
$999
$4,565
$4,948
$11,419
$5,008
$12,084
$5,014
$10,840
$4,419*
$11,578
$4,885
$11,786
HMO - Single
HMO - Family
PPO - Single
PPO - Family
POS - Single
POS - Family
HDHP/SO - Single
HDHP/SO - Family
All Plan Types - Single
All Plan Types - Family
Worker Contribution Employer Contribution
$6,029$16,543
$6,031
$16,671
$5,972
$16,429
$5,306*
$15,227*
$5,884
$16,351
Exhibit 6.6Average Annual Worker Contributions for Covered Workers with Single Coverage, by Firm Size, 1999-2013
* Estimate is statistically different from estimate for the previous year shown (p<.05).
SOURCE: Kaiser/HRET Survey of Employer-Sponsored Health Benefits, 1999-2013.
$286 $280 $306
$406* $450
$513 $556
$515 $561
$624 $625
$865*
$762
$848 $862
$334 $363 $380
$495* $536
$578 $638*
$689 $759* $769
$854* $917
$996 $1,001 $1,065
$0
$200
$400
$600
$800
$1,000
$1,200
1999 2000 2001 2002 2003 2004 2005 2006 2007 2008 2009 2010 2011 2012 2013
All Small Firms (3-199 Workers)
All Large Firms (200 or More Workers)
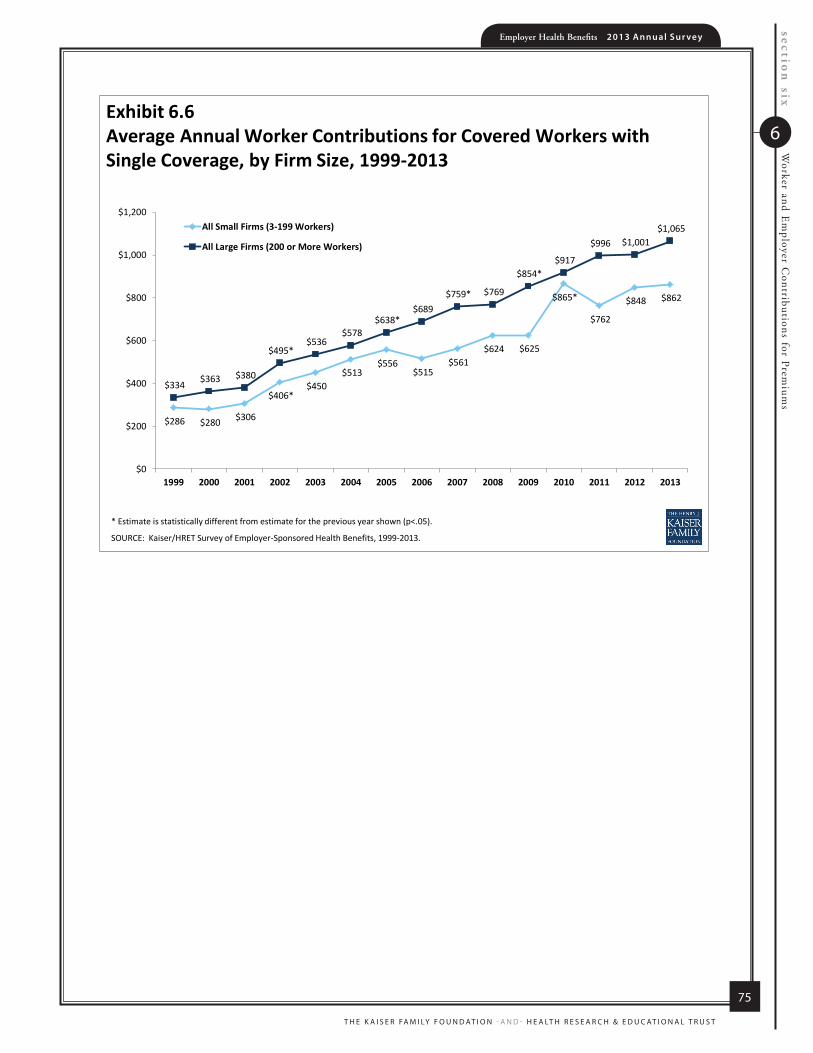
Employer Health Benefits 2 0 1 3 An n u a l S u r vey
T H E K A I S E R FA M I LY F O U N D AT I O N - A N D - H E A LT H R E S E A R C H & E D U C AT I O N A L T R U S T
75
6
section
sixW
orker and Em
ployer Contributions for Prem
iums
Exhibit 6.6Average Annual Worker Contributions for Covered Workers with Single Coverage, by Firm Size, 1999-2013
* Estimate is statistically different from estimate for the previous year shown (p<.05).
SOURCE: Kaiser/HRET Survey of Employer-Sponsored Health Benefits, 1999-2013.
$286 $280 $306
$406* $450
$513 $556
$515 $561
$624 $625
$865*
$762
$848 $862
$334 $363 $380
$495* $536
$578 $638*
$689 $759* $769
$854* $917
$996 $1,001 $1,065
$0
$200
$400
$600
$800
$1,000
$1,200
1999 2000 2001 2002 2003 2004 2005 2006 2007 2008 2009 2010 2011 2012 2013
All Small Firms (3-199 Workers)
All Large Firms (200 or More Workers)

section
sixW
orker and Em
ployer Contributions for Prem
iums
Employer Health Benefits 2 0 1 3 An n u a l S u r vey
T H E K A I S E R FA M I LY F O U N D AT I O N - A N D - H E A LT H R E S E A R C H & E D U C AT I O N A L T R U S T
6
76
Exhibit 6.7Average Annual Worker Contributions for Covered Workers with Family Coverage, by Firm Size, 1999-2013
* Estimate is statistically different from estimate for the previous year shown (p<.05).
SOURCE: Kaiser/HRET Survey of Employer-Sponsored Health Benefits, 1999-2013.
$1,831 $1,940 $2,254*
$2,647* $2,970
$3,382* $3,170
$3,550
$4,236* $4,101 $4,204
$4,665 $4,946
$5,134 $5,284
$1,398 $1,453 $1,551 $1,893*
$2,146* $2,340* $2,487
$2,658 $2,831
$2,982 $3,182
$3,652* $3,755 $3,926
$4,226*
$0
$1,000
$2,000
$3,000
$4,000
$5,000
$6,000
1999 2000 2001 2002 2003 2004 2005 2006 2007 2008 2009 2010 2011 2012 2013
All Small Firms (3-199 Workers)
All Large Firms (200 or More Workers)
All Small Firms (3-199 Workers)
All Large Firms (200 or More Workers)
All Small Firms (3-199 Workers)
All Large Firms (200 or More Workers)
1999 $286 $334 $1,831* $1,398*2000 $280* $363* $1,940* $1,453*2001 $306* $380* $2,254* $1,551*2002 $406* $495* $2,647* $1,893*2003 $450 $536 $2,970* $2,146*2004 $513 $578 $3,382* $2,340*2005 $556 $638 $3,170* $2,487*2006 $515* $689* $3,550* $2,658*2007 $561* $759* $4,236* $2,831*2008 $624* $769* $4,101* $2,982*2009 $625* $854* $4,204* $3,182*2010 $865 $917 $4,665* $3,652*2011 $762* $996* $4,946* $3,755*2012 $848* $1,001* $5,134* $3,926*2013 $862* $1,065* $5,284* $4,226*
* Estimate is statistically different between All Small Firms and All Large Firms within year (p<.05).
Source: Kaiser/HRET Survey of Employer-Sponsored Health Benefits, 1999-2013.
Average Annual Worker Premium Contributions Paid by Covered Workers for Single and Family Coverage, by Firm Size, 1999-2013
Exhibit 6.8
Single Coverage Family Coverage

Employer Health Benefits 2 0 1 3 An n u a l S u r vey
T H E K A I S E R FA M I LY F O U N D AT I O N - A N D - H E A LT H R E S E A R C H & E D U C AT I O N A L T R U S T
77
6
section
sixW
orker and Em
ployer Contributions for Prem
iums
All Small Firms (3-199 Workers)
All Large Firms (200 or More Workers)
All Small Firms (3-199 Workers)
All Large Firms (200 or More Workers)
1999 $286 $334 $1,831* $1,398*2000 $280* $363* $1,940* $1,453*2001 $306* $380* $2,254* $1,551*2002 $406* $495* $2,647* $1,893*2003 $450 $536 $2,970* $2,146*2004 $513 $578 $3,382* $2,340*2005 $556 $638 $3,170* $2,487*2006 $515* $689* $3,550* $2,658*2007 $561* $759* $4,236* $2,831*2008 $624* $769* $4,101* $2,982*2009 $625* $854* $4,204* $3,182*2010 $865 $917 $4,665* $3,652*2011 $762* $996* $4,946* $3,755*2012 $848* $1,001* $5,134* $3,926*2013 $862* $1,065* $5,284* $4,226*
* Estimate is statistically different between All Small Firms and All Large Firms within year (p<.05).
Source: Kaiser/HRET Survey of Employer-Sponsored Health Benefits, 1999-2013.
Average Annual Worker Premium Contributions Paid by Covered Workers for Single and Family Coverage, by Firm Size, 1999-2013
Exhibit 6.8
Single Coverage Family Coverage
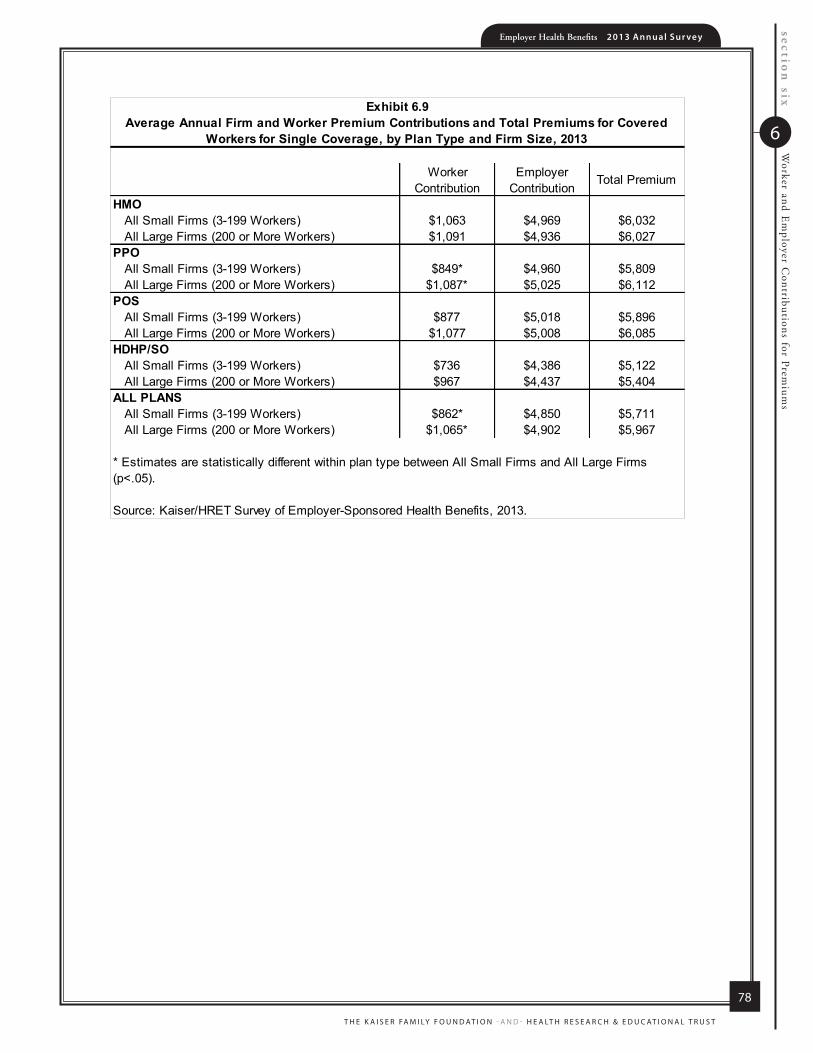
section
sixW
orker and Em
ployer Contributions for Prem
iums
Employer Health Benefits 2 0 1 3 An n u a l S u r vey
T H E K A I S E R FA M I LY F O U N D AT I O N - A N D - H E A LT H R E S E A R C H & E D U C AT I O N A L T R U S T
6
78
Worker Contribution
Employer Contribution
Total Premium
HMOAll Small Firms (3-199 Workers) $1,063 $4,969 $6,032All Large Firms (200 or More Workers) $1,091 $4,936 $6,027
PPOAll Small Firms (3-199 Workers) $849* $4,960 $5,809All Large Firms (200 or More Workers) $1,087* $5,025 $6,112
POSAll Small Firms (3-199 Workers) $877 $5,018 $5,896All Large Firms (200 or More Workers) $1,077 $5,008 $6,085
HDHP/SOAll Small Firms (3-199 Workers) $736 $4,386 $5,122All Large Firms (200 or More Workers) $967 $4,437 $5,404
ALL PLANSAll Small Firms (3-199 Workers) $862* $4,850 $5,711All Large Firms (200 or More Workers) $1,065* $4,902 $5,967
Source: Kaiser/HRET Survey of Employer-Sponsored Health Benefits, 2013.
* Estimates are statistically different within plan type between All Small Firms and All Large Firms (p<.05).
Average Annual Firm and Worker Premium Contributions and Total Premiums for Covered Workers for Single Coverage, by Plan Type and Firm Size, 2013
Exhibit 6.9
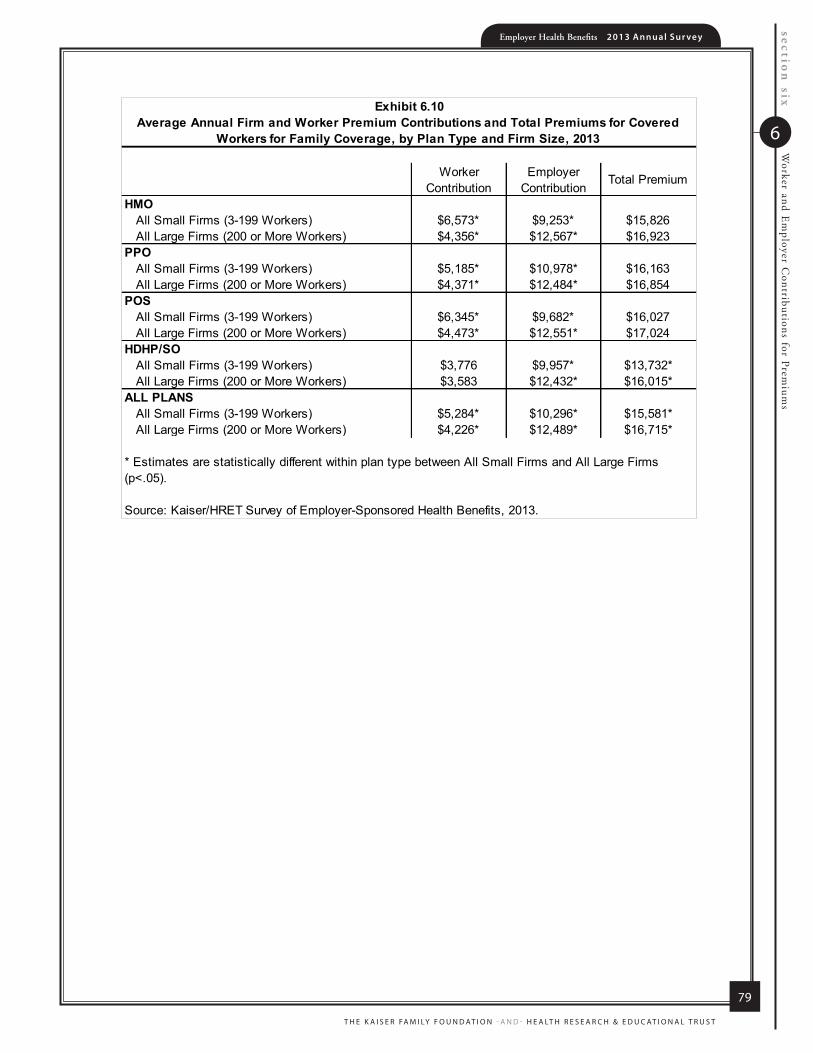
Employer Health Benefits 2 0 1 3 An n u a l S u r vey
T H E K A I S E R FA M I LY F O U N D AT I O N - A N D - H E A LT H R E S E A R C H & E D U C AT I O N A L T R U S T
79
6
section
sixW
orker and Em
ployer Contributions for Prem
iums
Worker Contribution
Employer Contribution
Total Premium
HMOAll Small Firms (3-199 Workers) $6,573* $9,253* $15,826All Large Firms (200 or More Workers) $4,356* $12,567* $16,923
PPOAll Small Firms (3-199 Workers) $5,185* $10,978* $16,163All Large Firms (200 or More Workers) $4,371* $12,484* $16,854
POSAll Small Firms (3-199 Workers) $6,345* $9,682* $16,027All Large Firms (200 or More Workers) $4,473* $12,551* $17,024
HDHP/SOAll Small Firms (3-199 Workers) $3,776 $9,957* $13,732*All Large Firms (200 or More Workers) $3,583 $12,432* $16,015*
ALL PLANSAll Small Firms (3-199 Workers) $5,284* $10,296* $15,581*All Large Firms (200 or More Workers) $4,226* $12,489* $16,715*
Average Annual Firm and Worker Premium Contributions and Total Premiums for Covered Workers for Family Coverage, by Plan Type and Firm Size, 2013
* Estimates are statistically different within plan type between All Small Firms and All Large Firms (p<.05).
Source: Kaiser/HRET Survey of Employer-Sponsored Health Benefits, 2013.
Exhibit 6.10
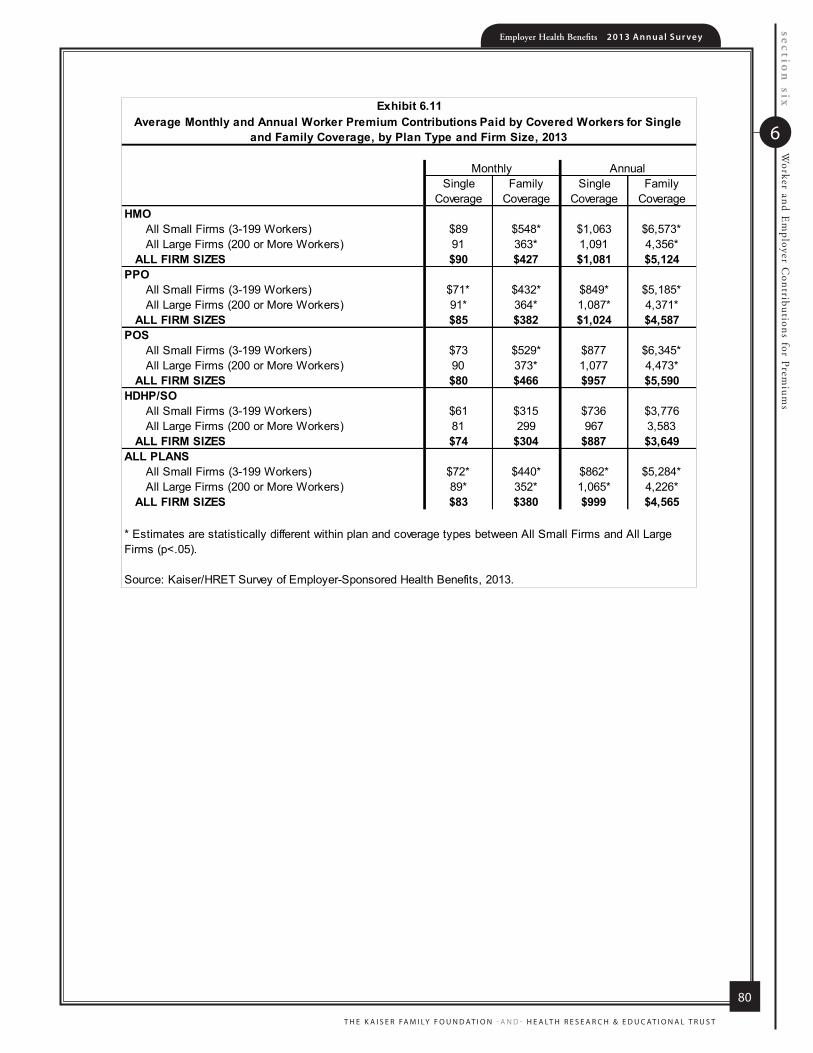
section
sixW
orker and Em
ployer Contributions for Prem
iums
Employer Health Benefits 2 0 1 3 An n u a l S u r vey
T H E K A I S E R FA M I LY F O U N D AT I O N - A N D - H E A LT H R E S E A R C H & E D U C AT I O N A L T R U S T
6
80
Single Coverage
Family Coverage
Single Coverage
Family Coverage
HMO All Small Firms (3-199 Workers) $89 $548* $1,063 $6,573*All Large Firms (200 or More Workers) 91 363* 1,091 4,356*
ALL FIRM SIZES $90 $427 $1,081 $5,124 PPO
All Small Firms (3-199 Workers) $71* $432* $849* $5,185*All Large Firms (200 or More Workers) 91* 364* 1,087* 4,371*
ALL FIRM SIZES $85 $382 $1,024 $4,587 POS
All Small Firms (3-199 Workers) $73 $529* $877 $6,345*All Large Firms (200 or More Workers) 90 373* 1,077 4,473*
ALL FIRM SIZES $80 $466 $957 $5,590 HDHP/SO
All Small Firms (3-199 Workers) $61 $315 $736 $3,776 All Large Firms (200 or More Workers) 81 299 967 3,583
ALL FIRM SIZES $74 $304 $887 $3,649 ALL PLANS
All Small Firms (3-199 Workers) $72* $440* $862* $5,284*All Large Firms (200 or More Workers) 89* 352* 1,065* 4,226*
ALL FIRM SIZES $83 $380 $999 $4,565
Exhibit 6.11
Source: Kaiser/HRET Survey of Employer-Sponsored Health Benefits, 2013.
Monthly Annual
Average Monthly and Annual Worker Premium Contributions Paid by Covered Workers for Single and Family Coverage, by Plan Type and Firm Size, 2013
* Estimates are statistically different within plan and coverage types between All Small Firms and All Large Firms (p<.05).

Employer Health Benefits 2 0 1 3 An n u a l S u r vey
T H E K A I S E R FA M I LY F O U N D AT I O N - A N D - H E A LT H R E S E A R C H & E D U C AT I O N A L T R U S T
81
6
section
sixW
orker and Em
ployer Contributions for Prem
iums
Single Coverage
Family Coverage
Single Coverage
Family Coverage
HMONortheast $111* $442 $1,329* $5,308Midwest 88 286* 1,056 3,434*South 95 461 1,143 5,531West 78* 436 933* 5,232
ALL REGIONS $90 $427 $1,081 $5,124PPO
Northeast $105* $344* $1,266* $4,134*Midwest 99* 384 1,183* 4,611South 79* 414* 951* 4,968*West 67* 344 798* 4,127
ALL REGIONS $85 $382 $1,024 $4,587POS
Northeast $66 $423 $794 $5,073Midwest 63 421 756 5,057South 94 548 1,125 6,571West 97 456 1,166 5,477
ALL REGIONS $80 $466 $957 $5,590HDHP/SO
Northeast $77 $318 $929 $3,818Midwest 69 260* 832 3,125*South 89 360* 1,069 4,324*West 54* 270 649* 3,240
ALL REGIONS $74 $304 $887 $3,649ALL PLANS
Northeast $96* $363 $1,151* $4,353Midwest 86 347* 1,037 4,165*South 84 419* 1,002 5,031*West 70* 364 836* 4,366
ALL REGIONS $83 $380 $999 $4,565
Exhibit 6.12
Source: Kaiser/HRET Survey of Employer-Sponsored Health Benefits, 2013.
Monthly Annual
Average Monthly and Annual Worker Premium Contributions Paid by Covered Workers for Single and Family Coverage, by Plan Type and Region, 2013
* Estimate is statistically different within plan and coverage type from estimate for all other firms not in the indicated region (p<.05).

section sixWorker and Employer Contributions for PremiumsEm
ployer Health B
enefits 20
13
An
nu
al S
urve
y
TH
E K
AIS
ER
FAM
ILY F
OU
ND
AT
ION
-AN
D- H
EA
LTH
RE
SE
AR
CH
& E
DU
CA
TIO
NA
L T
RU
ST
6
82
1999 2000 2001 2002 2003 2004 2005 2006 2007 2008 2009 2010 2011 2012 2013Single Coverage
HMO $29 $26 $32 $38 $42 $46 $47 $49 $59 $59 $68 $86* $78 $93* $90PPO $26 $28 $29 $39* $44 $48 $50 $53 $60* $61 $67* $75* $84* $84 $85POS $26 $28 $29 $40* $41 $45 $61* $53 $52 $72* $62 $81 $65 $62 $80 HDHP/SO ^ ^ ^ ^ ^ ^ ^ $47 $43 $39 $45 $53 $60 $64 $74
ALL PLANS $27 $28 $30 $39* $42 $47 $51 $52 $58* $60 $65 $75* $77 $79 $83Family Coverage
HMO $124 $132 $150 $164 $179 $223* $217 $257* $276 $282 $307 $363* $346 $380 $427PPO $125 $142 $153 $188* $210* $224 $220 $243* $270* $279 $289 $319* $339 $367 $382POS $137 $137 $143 $180* $206 $218 $271* $269 $305 $311 $346 $433* $444 $381 $466HDHP/SO ^ ^ ^ ^ ^ ^ ^ $187 $238 $234 $223 $294* $303 $310 $304
ALL PLANS $129 $135 $149* $178* $201* $222* $226 $248* $273* $280 $293 $333* $344 $360 $380
* Estimate is statistically different from estimate for the previous year shown (p<.05).
Information was not obtained for HDHP/SOs prior to 2006.
Source: Kaiser/HRET Survey of Employer-Sponsored Health Benefits, 1999-2013.
Average Monthly Worker Premium Contributions Paid by Covered Workers for Single and Family Coverage, by Plan Type, 1999-2013
Exhibit 6.13

Employer H
ealth Benefits 2
01
3 A
nn
ua
l Su
rvey
TH
E K
AIS
ER
FAM
ILY F
OU
ND
AT
ION
-AN
D- H
EA
LTH
RE
SE
AR
CH
& E
DU
CA
TIO
NA
L T
RU
ST
83
6
section sixWorker and Employer Contributions for Premiums
Premium Contribution Range, Relative to Average Premium
Contribution
Premium Contribution Range, Dollar Amount
Percentage of Covered Workers in Range
Premium Contribution Range, Dollar Amount
Percentage of Covered Workers in Range
Less than 60% Less than $600 15% Less than $2,739 20%60% to Less than 80% $600 to <$799 13% $2,739 to < $3,652 17%80% to Less than Average $799 to < $999 15% $3,652 to < $4,565 18%Average to Less than 120% $999 to <$1,199 16% $4,565 to < $5,479 15%120% to Less than 140% $1,199 to <$1,399 13% $5,479 to <$6,392 9%140% or More $1,399 or More 27% $6,392 or More 21%
Exhibit 6.14
Source: Kaiser/HRET Survey of Employer-Sponsored Health Benefits, 2013.
Family CoverageSingle Coverage
Note: The average annual worker contribution is $999 for single coverage and $4,565 for family coverage. The worker contribution distribution is relative to the average single or family worker contribution. For example, $799 is 80% of the average single worker contribution and $1,199 is 120% of the average single worker contribution. The same break points relative to the average are used for the distribution for family coverage.
Distribution of Worker Premium Contributions for Single and Family Coverage Relative to the Average Annual Worker Premium Contribution, 2013

section sixWorker and Employer Contributions for PremiumsEm
ployer Health B
enefits 20
13
An
nu
al S
urve
y
TH
E K
AIS
ER
FAM
ILY F
OU
ND
AT
ION
-AN
D- H
EA
LTH
RE
SE
AR
CH
& E
DU
CA
TIO
NA
L T
RU
ST
6
84
24%24%
21%21%
23%20%20%
18%16%16%16%
14%
9%8%
7%9%9%
6%7%
6%5%6%6%
5%
58%57%
56%57%
56%56%
59%58%
56%59%61%
62%
46%47%
44%46%
42%47%46%48%
43%47%
43%42%
13%17%
21%19%
18%21%
19%22%
24%22%
22%22%
29%31%
36%32%
37%31%33%
33%35%
32%37%
38%
5%3%2%
3%2%2%2%
1%
4%3%2%2%
16%14%13%13%12%
15%14%
12%16%15%14%14%
20022003*2004200520062007200820092010*201120122013
200220032004200520062007*200820092010201120122013
0%Greater Than 0%, Less Than Or Equal To 25%Greater Than 25%, Less Than Or Equal To 50%Greater Than 50%
Exhibit 6.15Distribution of Percentage of Premium Paid by Covered Workers for Single and Family Coverage, 2002-2013
* Distribution is statistically different within coverage type from distribution for the previous year shown (p<.05).SOURCE: Kaiser/HRET Survey of Employer-Sponsored Health Benefits, 2002-2013.
Single Coverage
Family Coverage

Employer H
ealth Benefits 2
01
3 A
nn
ua
l Su
rvey
TH
E K
AIS
ER
FAM
ILY F
OU
ND
AT
ION
-AN
D- H
EA
LTH
RE
SE
AR
CH
& E
DU
CA
TIO
NA
L T
RU
ST
85
6
section sixWorker and Employer Contributions for Premiums
45%45%
42%41%
43%44%
40%39%
35%35%36%
32%
14%14%
11%12%13%
9%10%
8%6%7%
6%6%
35%35%
35%36%
38%36%
40%40%
39%42%40%
44%
69%67%
65%67%66%
66%68%
67%65%
68%71%71%
13%14%
17%18%
14%16%
16%19%
18%19%
18%20%
14%18%
23%20%20%
23%20%
24%27%
23%23%
23%
8%6%5%
6%4%4%
5%3%
8%4%
5%4%
4%1%1%1%
1%
2%1%
1%1%2%
1%<1%
200220032004200520062007200820092010*201120122013
20022003*2004200520062007200820092010201120122013
0%Greater Than 0%, Less Than Or Equal To 25%Greater Than 25%, Less Than Or Equal To 50%Greater Than 50%
Exhibit 6.16Distribution of Percentage of Premium Paid by Covered Workers for Single Coverage, by Firm Size, 2002-2013
* Distribution is statistically different within firm size from distribution for the previous year shown (p<.05).SOURCE: Kaiser/HRET Survey of Employer-Sponsored Health Benefits, 2002-2013.
All Small Firms
(3-199 Workers)
All Large Firms
(200 or More Workers)

section sixWorker and Employer Contributions for PremiumsEm
ployer Health B
enefits 20
13
An
nu
al S
urve
y
TH
E K
AIS
ER
FAM
ILY F
OU
ND
AT
ION
-AN
D- H
EA
LTH
RE
SE
AR
CH
& E
DU
CA
TIO
NA
L T
RU
ST
6
86
18%15%15%
18%17%
13%13%14%
13%14%
16%14%
5%4%4%5%5%
3%4%
2%1%2%2%2%
23%28%
17%22%
20%25%27%
28%30%28%
28%27%
57%57%
56%57%
54%58%56%
58%50%
56%50%
49%
28%26%
39%37%
38%25%
31%28%
25%26%
26%28%
29%33%
34%30%
36%34%
34%36%
40%35%
42%43%
31%31%
28%23%
24%37%
30%30%
32%32%
30%31%
9%6%6%
7%5%5%
6%4%
8%7%6%6%
200220032004*200520062007*200820092010201120122013
200220032004200520062007200820092010*201120122013
0%Greater Than 0%, Less Than Or Equal To 25%Greater Than 25%, Less Than Or Equal To 50%Greater Than 50%
Exhibit 6.17Distribution of Percentage of Premium Paid by Covered Workers for Family Coverage, by Firm Size, 2002-2013
* Distribution is statistically different within firm size from distribution for the previous year shown (p<.05).SOURCE: Kaiser/HRET Survey of Employer-Sponsored Health Benefits, 2002-2013.
All Small Firms
(3-199 Workers)
All Large Firms
(200 or More Workers)
1%2%2%1%14%
23%
20%
8%
21%
36%
26%
18%
36%
56%
40%
35%
62%
58%
58%
66%
44%
19%
35%
50%
15%
4%
13%
15%
6%
1%
5%
6%
0%20%
40%60%
80%100%
0%Greater Than 0%, Less Than O
r Equal To 25%Greater Than 25%
, Less Than Or Equal To 50%
Greater Than 50%
Exhibit 6.18Distribution of the Percentage of Total Prem
ium Paid by Covered
Workers for Single and Fam
ily Coverage, by Wage Level, 2013
* Distributions for High-Wage and Low
-Wage Firm
s are statistically different w
ithin coverage type (p<.05).
SOU
RCE: Kaiser/HRET Survey of Employer-Sponsored Health Benefits,
2013.
FAMILY CO
VERAGE
Lower W
age Workers*
Less Than 35% Earn $23,000 a Year or Less
35% or M
ore Earn $23,000 a Year or Less
Higher W
age Workers*
Less Than 35% Earn $56,000 a Year or M
ore
35% or M
ore Earn $56,000 a Year or More
SING
LE COVERAGE
Lower W
age Workers*
Less Than 35% Earn $23,000 a Year or Less
35% or M
ore Earn $23,000 a Year or Less
Higher W
age Workers*
Less Than 35% Earn $56,000 a Year or M
ore
35% or M
ore Earn $56,000 a Year or More

Employer Health Benefits 2 0 1 3 An n u a l S u r vey
T H E K A I S E R FA M I LY F O U N D AT I O N - A N D - H E A LT H R E S E A R C H & E D U C AT I O N A L T R U S T
87
6
section
sixW
orker and Em
ployer Contributions for Prem
iums
1%
2%
2%1%
14%
23%
20%
8%
21%
36%
26%
18%
36%
56%
40%
35%
62%
58%
58%
66%
44%
19%
35%
50%
15%
4%
13%
15%
6%
1%
5%
6%
0% 20% 40% 60% 80% 100%
0%Greater Than 0%, Less Than Or Equal To 25%Greater Than 25%, Less Than Or Equal To 50%Greater Than 50%
Exhibit 6.18Distribution of the Percentage of Total Premium Paid by Covered Workers for Single and Family Coverage, by Wage Level, 2013
* Distributions for High-Wage and Low-Wage Firms are statistically different within coverage type (p<.05).
SOURCE: Kaiser/HRET Survey of Employer-Sponsored Health Benefits, 2013.
FAMILY COVERAGE
Lower Wage Workers*
Less Than 35% Earn $23,000 a Year or Less
35% or More Earn $23,000 a Year or Less
Higher Wage Workers*
Less Than 35% Earn $56,000 a Year or More
35% or More Earn $56,000 a Year or More
SINGLE COVERAGE
Lower Wage Workers*
Less Than 35% Earn $23,000 a Year or Less
35% or More Earn $23,000 a Year or Less
Higher Wage Workers*
Less Than 35% Earn $56,000 a Year or More
35% or More Earn $56,000 a Year or More

section
sixW
orker and Em
ployer Contributions for Prem
iums
Employer Health Benefits 2 0 1 3 An n u a l S u r vey
T H E K A I S E R FA M I LY F O U N D AT I O N - A N D - H E A LT H R E S E A R C H & E D U C AT I O N A L T R U S T
6
88
All Small Firms (3-199 Workers)
All Large Firms (200 or More
Workers)All Firms
Lower Wage LevelLess Than 35% Earn $23,000 a Year or Less 16%* 18%* 17%*35% or More Earn $23,000 a Year or Less 22%* 24%* 23%*
Higher Wage LevelLess Than 35% Earn $56,000 a Year or More 18%* 20% 19%*35% or More Earn $56,000 a Year or More 12%* 18% 16%*
UnionsFirm Has At Least Some Union Workers 11% 18% 17%Firm Does Not Have Any Union Workers 17% 19% 18%
Younger WorkersLess Than 35% of Workers Are Age 26 or Younger 16% 18%* 18%35% or More Workers Are Age 26 or Younger 13% 23%* 19%
Older WorkersLess Than 35% of Workers Are Age 50 or Older 15% 19% 18%35% or More Workers Are Age 50 or Older 17% 18% 18%
Funding ArrangementFully Insured 16% 17% 17%Self-Funded 15% 19% 19%
Firm OwnershipPrivate For-Profit 19%* 21%* 20%*Public 9%* 13%* 12%*Private Not-For-Profit 12%* 16%* 15%*
ALL FIRMS 16% 19% 18%
Source: Kaiser/HRET Survey of Employer-Sponsored Health Benefits, 2013.
Average Percentage of Premium Paid by Covered Workers for Single Coverage, by Firm Characteristics and Size, 2013
Exhibit 6.19
*Estimates are statistically different from each other within firm size category (p<.05).

Employer Health Benefits 2 0 1 3 An n u a l S u r vey
T H E K A I S E R FA M I LY F O U N D AT I O N - A N D - H E A LT H R E S E A R C H & E D U C AT I O N A L T R U S T
89
6
section
sixW
orker and Em
ployer Contributions for Prem
iums
All Small Firms (3-199 Workers)
All Large Firms (200 or More
Workers)All Firms
Lower Wage LevelLess Than 35% Earn $23,000 a Year or Less 35%* 26%* 29%*35% or More Earn $23,000 a Year or Less 47%* 34%* 39%*
Higher Wage LevelLess Than 35% Earn $56,000 a Year or More 40%* 29%* 33%*35% or More Earn $56,000 a Year or More 28%* 24%* 25%*
UnionsFirm Has At Least Some Union Workers 26% 22%* 23%*Firm Does Not Have Any Union Workers 37% 30%* 33%*
Younger WorkersLess Than 35% of Workers Are Age 26 or Younger 36% 26% 29%35% or More Workers Are Age 26 or Younger 41% 29% 33%
Older WorkersLess Than 35% of Workers Are Age 50 or Older 39%* 28%* 32%*35% or More Workers Are Age 50 or Older 31%* 23%* 26%*
Funding ArrangementFully Insured 37%* 32%* 36%*Self-Funded 28%* 25%* 25%*
Firm OwnershipPrivate For-Profit 37% 27% 31%*Public 23%* 26% 26%Private Not-For-Profit 37% 24%* 29%
ALL FIRMS 36% 26% 29%
Source: Kaiser/HRET Survey of Employer-Sponsored Health Benefits, 2013.
Average Percentage of Premium Paid by Covered Workers for Family Coverage, by Firm Characteristics and Size, 2013
Exhibit 6.20
*Estimates are statistically different from each other within firm size category (p<.05).

section
sixW
orker and Em
ployer Contributions for Prem
iums
Employer Health Benefits 2 0 1 3 An n u a l S u r vey
T H E K A I S E R FA M I LY F O U N D AT I O N - A N D - H E A LT H R E S E A R C H & E D U C AT I O N A L T R U S T
6
90
Single Coverage Family CoverageHMO
All Small Firms (3-199 Workers) 19% 42%*All Large Firms (200 or More Workers) 19% 26%*
ALL FIRM SIZES 19% 31%PPO
All Small Firms (3-199 Workers) 16% 35%*All Large Firms (200 or More Workers) 19% 27%*
ALL FIRM SIZES 18% 29%POS
All Small Firms (3-199 Workers) 16% 42%All Large Firms (200 or More Workers) 18% 31%
ALL FIRM SIZES 17% 37%HDHP/SO
All Small Firms (3-199 Workers) 15% 29%*All Large Firms (200 or More Workers) 18% 23%*
ALL FIRM SIZES 17% 25%ALL PLANS
All Small Firms (3-199 Workers) 16%* 36%*All Large Firms (200 or More Workers) 19%* 26%*
ALL FIRM SIZES 18% 29%
Exhibit 6.21
Source: Kaiser/HRET Survey of Employer-Sponsored Health Benefits, 2013.
Average Percentage of Premium Paid by Covered Workers for Single and Family Coverage, by Plan Type and Firm Size, 2013
* Estimates are statistically different within plan and coverage types between All Small Firms and All Large Firms (p<.05).

Employer H
ealth Benefits 2
01
3 A
nn
ua
l Su
rvey
TH
E K
AIS
ER
FAM
ILY F
OU
ND
AT
ION
-AN
D- H
EA
LTH
RE
SE
AR
CH
& E
DU
CA
TIO
NA
L T
RU
ST
91
6
section sixWorker and Employer Contributions for Premiums
1999 2000 2001 2002 2003 2004 2005 2006 2007 2008 2009 2010 2011 2012 2013Single Coverage
HMO 16% 14% 18% 16% 17% 16% 16% 15% 17% 16% 18% 21%* 18% 21% 19%PPO 13 14 13 16* 16 16 15 15 17 16 17 19 19 18 18POS 15 15 13 16* 16 16 19 16 14 18 16 19 14 14 17HDHP/SO ^ ^ ^ ^ ^ ^ ^ 17 15 11 14 14 15 16 17
ALL PLANS 14% 14% 14% 16% 16% 16% 16% 16% 16% 16% 17% 19%* 18% 18% 18%Family Coverage
HMO 28% 26% 29% 27% 26% 29% 26% 28% 28% 26% 28% 31% 28% 30% 31%PPO 26 27 26 29* 28 27 25 26 27 27 26 28 28 28 29POS 28 26 25 28 28 28 31 30 32 31 32 39 36 29 37*HDHP/SO ^ ^ ^ ^ ^ ^ ^ 25 27 29 25 28 27 27 25
ALL PLANS 27% 26% 26% 28% 27% 28% 26% 27% 28% 27% 27% 30%* 28% 28% 29%
Source: Kaiser/HRET Survey of Employer-Sponsored Health Benefits, 1999-2013.
* Estimate is statistically different from estimate for the previous year shown (p<.05).
Information was not obtained for HDHP/SOs prior to 2006.
Average Percentage of Premium Paid by Covered Workers for Single and Family Coverage, by Plan Type, 1999-2013Exhibit 6.22

section
sixW
orker and Em
ployer Contributions for Prem
iums
Employer Health Benefits 2 0 1 3 An n u a l S u r vey
T H E K A I S E R FA M I LY F O U N D AT I O N - A N D - H E A LT H R E S E A R C H & E D U C AT I O N A L T R U S T
6
92
Single Coverage Family CoverageHMO
Northeast 21% 30%Midwest 19 22*South 19 31West 18 35
ALL REGIONS 19% 31%PPO
Northeast 21%* 24%*Midwest 21* 29South 17 33*West 14* 27
ALL REGIONS 18% 29%POS
Northeast 15% 30%Midwest 13 45South 21 41West 18 33
ALL REGIONS 17% 37%HDHP/SO
Northeast 20% 28%Midwest 17 22*South 19 28*West 12* 21
ALL REGIONS 17% 25%ALL PLANS
Northeast 20%* 26%*Midwest 19 28South 18 33*West 15* 28
ALL REGIONS 18% 29%
Source: Kaiser/HRET Survey of Employer-Sponsored Health Benefits, 2013.
Average Percentage of Premium Paid by Covered Workers for Single and Family Coverage, by Plan Type and Region, 2013
* Estimate is statistically different within plan and coverage type from estimate for all other firms not in the indicated region (p<.05).
Exhibit 6.23

Employer Health Benefits 2 0 1 3 An n u a l S u r vey
T H E K A I S E R FA M I LY F O U N D AT I O N - A N D - H E A LT H R E S E A R C H & E D U C AT I O N A L T R U S T
93
6
section
sixW
orker and Em
ployer Contributions for Prem
iums
Single Coverage Family CoverageHMO
Agriculture/Mining/Construction NSD NSDManufacturing 25% 29%Transportation/Communications/Utilities 12* 18*Wholesale NSD NSDRetail 29* 35Finance 21 32Service 19 37*State/Local Government 16 20*Health Care 16 32
ALL INDUSTRIES 19% 31%PPO
Agriculture/Mining/Construction 18% 32%Manufacturing 20 26Transportation/Communications/Utilities 17 23*Wholesale 20 36*Retail 23 30Finance 22* 31Service 17 33*State/Local Government 12* 27Health Care 17 26*
ALL INDUSTRIES 18% 29%POS
Agriculture/Mining/Construction NSD NSDManufacturing NSD NSDTransportation/Communications/Utilities NSD NSDWholesale NSD NSDRetail NSD NSDFinance NSD NSDService 18% 36%State/Local Government NSD NSDHealth Care 14 34
ALL INDUSTRIES 17% 37%HDHP/SO
Agriculture/Mining/Construction NSD NSDManufacturing 19% 21%Transportation/Communications/Utilities 15 20Wholesale 14 28Retail 20 29Finance 14 22Service 19 27*State/Local Government 11* 16*Health Care 17 31*
ALL INDUSTRIES 17% 25%ALL PLANS
Agriculture/Mining/Construction 17% 30%Manufacturing 19 28Transportation/Communications/Utilities 16 22*Wholesale 18 34*Retail 23* 30Finance 19 29Service 18 32*State/Local Government 13* 24Health Care 16 29
ALL INDUSTRIES 18% 29%
NSD: Not Sufficient Data.
Source: Kaiser/HRET Survey of Employer-Sponsored Health Benefits, 2013.
Average Percentage of Premium Paid by Covered Workers, by Plan Type and Industry, 2013
* Estimate is statistically different within plan and coverage type from estimate for all other firms not in the indicated industry (p<.05).
Exhibit 6.24

section
sixW
orker and Em
ployer Contributions for Prem
iums
Employer Health Benefits 2 0 1 3 An n u a l S u r vey
T H E K A I S E R FA M I LY F O U N D AT I O N - A N D - H E A LT H R E S E A R C H & E D U C AT I O N A L T R U S T
6
94
48%
52%
Same premium for each employee
Different premiums for different employees
Exhibit 6.25Among Firms Offering Health Benefits with Fewer Than 20 Employees, Variations in Premiums and Firm Premium Contributions for Single Coverage, 2013
*Among firms that receive a bill itemizing the per employee cost. Eighty-six percent of firms with fewer than 20 employees have at least one plan that provides a bill itemizing per employee premium costs.SOURCE: Kaiser/HRET Survey of Employer-Sponsored Health Benefits, 2013.
56%
41%
4%
Firm contributes the same dollar amount for all employees
Firm contributes more for some employees than others
Don't Know
Firm is charged the same or different premiums for single coverage*:
Firm contributes the same or different dollar amounts for single coverage premium:

57%$16,3
51
$5,8
84
2013
Employer Health Benefits2 0 1 3 A N N U A L S U R V E Y
sect ion
EmployeeCost Sharing
7

section
sevenE
mployee C
ost SharingEmployer Health Benefits 2 0 1 3 An n u a l S u r vey
T H E K A I S E R FA M I LY F O U N D AT I O N - A N D - H E A LT H R E S E A R C H & E D U C AT I O N A L T R U S T
7
96
Section Seven: Employee Cost Sharing In addition to any required premium contributions, most covered workers face cost sharing for
the medical services they use. Cost sharing for medical services can take a variety of forms,
including deductibles (an amount that must be paid before some or all services are covered by
the plan), copayments (fixed dollar amounts), and/or coinsurance (a percentage of the charge
for services). The type and level of cost sharing often vary by the type of plan in which the
worker is enrolled. Cost sharing may also vary by the type of service, such as office visits,
hospitalizations, or prescription drugs.
The cost-sharing amounts reported here are for covered workers using services provided in-
network by participating providers. Plan enrollees receiving services from providers that do not
participate in plan networks often face higher cost sharing and may be responsible for charges
that exceed plan allowable amounts. The framework of this survey does not allow us to capture
all of the complex cost-sharing requirements in modern plans, particularly for ancillary services
(such as durable medical equipment or physical therapy) or cost-sharing arrangements that vary
across different settings (such as tiered networks). Therefore, we do not collect information on
all plan provisions and limits that affect enrollee out-of-pocket liability.
General Annual Deductibles
A general annual deductible is an amount that must be paid by the enrollee before most services are covered by their health plan. Some plans require enrollees to meet a service specific deductible such as on prescription drugs or hospital admissions in lieu of or in addition to a general deductible. Federal law requires that some services such as preventative care are covered by some plans without cost sharing.
o Seventy-eight percent of covered workers are enrolled in a plan with a general annual
deductible for single coverage. More covered workers are enrolled in a plan with a general annual deductible in 2013 than in 2012 (78% vs. 72%) (Exhibit 7.2). Since 2006, the percent of covered workers with a general annual deductible has increased from 55% to 78%.
o The percent of covered workers enrolled in a plan with a general annual deductible is
similar for small (3-199 workers) and larger firms (77% and 78%) (Exhibit 7.2).
o The likelihood of having a deductible varies by plan type. Workers in HMOs are less likely to have a general annual deductible for single coverage compared to workers in other plan types. Fifty-nine percent of workers in HMOs do not have a general annual

Employer Health Benefits 2 0 1 3 An n u a l S u r vey
T H E K A I S E R FA M I LY F O U N D AT I O N - A N D - H E A LT H R E S E A R C H & E D U C AT I O N A L T R U S T
97
7
section
sevenE
mployee C
ost Sharing
deductible, compared to 34% of workers in POS plans and 19% of workers in PPOs (Exhibit 7.1).
o Workers without a general annual plan deductible often have other forms of cost sharing
for medical services. For workers without a general annual deductible for single coverage, 81% in HMOs, 83% in PPOs, and 73% in POS plans are in plans that require cost sharing for hospital admissions. The percentages are similar for family coverage (Exhibit 7.4).
The dollars amounts of general annual deductibles vary greatly by plan type and firm size.
o The average annual deductible is $1,135. There are differences in the average general
annual deductible by plan type. The average annual deductibles among those covered workers with a deductible for single coverage are $729 for HMOs, $799 for PPOs, $1,314 for POS plans, and $2,003 for HDHP/SOs (Exhibit 7.5). Overall, the average general annual deductible for all covered workers is $1,135.
o There is no statistically significant change in deductible amounts from 2012 to 2013 for
any plan type (Exhibit 7.7).
o Deductibles are generally higher for covered workers in small firms (3-199 workers) than for covered workers in large firms (200 or more workers) across plan types (Exhibit 7.5). For covered workers in PPOs, deductibles in small firms are more than twice as large as deductibles in large firms ($1,488 vs. $563). On average, covered workers at small firms face higher general annual deductibles than covered workers at large firms ($1,715 vs. $884) (Exhibit 7.5).
For family coverage, the majority of workers with general annual deductibles have an
aggregate deductible, meaning all family members’ out-of-pocket expenses count toward meeting the deductible amount. Among those with a general annual deductible for family coverage, the percentage of covered workers with an average aggregate general annual deductible is 56% for workers in HMOs, 58% for workers in PPOs, 77% for workers in POS plans and 84% for workers in HDHP/SOs (Exhibit 7.13).
o The average amounts for workers with an aggregate deductible for family coverage are
$1,743 for HMOs, $1,854 for PPOs, $2,821 for POS plans, and $4,079 for HDHP/SOs (Exhibit 7.14).
o The average aggregate deductible amounts for family coverage are similar to last year
for each plan type (Exhibit 7.15). The other type of family deductible, a separate per-person deductible, requires each family
member to meet a separate per-person deductible amount before the plan covers expenses for that member. Most plans with separate per-person family deductibles consider the deductible met for all family members if a prescribed number of family members each reach their separate deductible amounts. Plans may also require each family member to meet a separate per-person deductible until the family's combined spending reaches a specified dollar amount.
o For covered workers in health plans that have separate per-person general annual
deductible amounts for family coverage, the average plan deductible amounts are $609

section
sevenE
mployee C
ost SharingEmployer Health Benefits 2 0 1 3 An n u a l S u r vey
T H E K A I S E R FA M I LY F O U N D AT I O N - A N D - H E A LT H R E S E A R C H & E D U C AT I O N A L T R U S T
7
98
for HMOs, $782 for PPOs, $1,080 for POS plans, and $2,033 for HDHP/SOs (Exhibit 7.14).
o Most covered workers in plans with a separate per-person general annual deductible for
family coverage have a limit to the number of family members required to meet the separate deductible amounts (Exhibit 7.18).1 Among those workers in plans with a limit on the number of family members, the most frequent number of family members required to meet the separate deductible amounts is three for HMO and PPO plans, and two for POS plans (Exhibit 7.19).
Thirty-eight percent of covered workers are in plans with a deductible of $1000 or more for single coverage, similar to the percentage (34%) in 2012 (Exhibit 7.9). o Over the last five years, the percentage of covered workers with a deductible of $1,000
or more for single coverage has increased from 18% to 38% (Exhibit 7.9). Workers in small firms (3-199 workers) are more likely to have a general annual deductible of $1,000 or more for single coverage than workers in large firms (200 or more workers) (58% vs. 28%) (Exhibit 7.8). The percent of covered workers at small firms (3-199 workers) who have a deductible of a $1,000 or more increased from 49% in 2012 to 58% in 2013 (Exhibit 7.9).
o Fifteen percent of covered workers are enrolled in a plan with a deductible of $2,000 or
more. Thirty-one percent of covered workers at small firms (3-199 workers) have a general annual deductible of $2,000 or more (Exhibit 7.8).
The majority of covered workers with a deductible are in plans where the deductible does
not have to be met before certain services, such as physician office visits or prescription drugs, are covered.
o Large majorities of covered workers (77% in HMOs, 78% in PPOs, and 72% in POS
plans) with general plan deductibles are enrolled in plans where the deductible does not have to be met before physician office visits for primary care are covered (Exhibit 7.21).
o Similarly, among workers with a general annual deductible, large shares of covered
workers in HMOs (95%), PPOs (91%), and POS plans (87%) are enrolled in plans where the general annual deductible does not have to be met before prescription drugs are covered (Exhibit 7.21).
Hospital and Outpatient Surgery Cost Sharing
In order to better capture the prevalence of combinations of cost sharing for inpatient hospital stays and outpatient surgery, the survey was changed to ask a series of yes or no questions beginning in 2009. The new format allowed respondents to indicate more than one type of cost sharing for these services, if applicable. Previously, the questions asked respondents to select just one response from a list of types of cost sharing, such as
1 Some workers with separate per-person deductibles or out-of-pocket maximums for family coverage do not have a specific number of family members that are required to meet the deductible amount and instead have another type of limit, such as a per-person amount with a total dollar amount limit. These responses are included in the averages and distributions for separate family deductibles and out-of-pocket maximums.

Employer Health Benefits 2 0 1 3 An n u a l S u r vey
T H E K A I S E R FA M I LY F O U N D AT I O N - A N D - H E A LT H R E S E A R C H & E D U C AT I O N A L T R U S T
99
7
section
sevenE
mployee C
ost Sharing
separate deductibles, copayments, coinsurance, and per diem payments (for hospitalization only). Due to the change in question format, the distribution of workers with types of cost sharing does not equal 100% as workers may face a combination of types of cost sharing. In addition, the average copayment and coinsurance rates for hospital admissions include workers who may have a combination of these types of cost sharing.
Whether or not a worker has a general annual deductible, most workers face additional
types of cost sharing when admitted to a hospital or having outpatient surgery (such as a copayment, coinsurance, or a per diem charge).
o For hospital admissions, 61% of covered workers have coinsurance and 16% have
copayments. Lower percentages of workers have per day (per diem) payments (7%), a separate hospital deductible (3%), or both copayments and coinsurance (8%), while 17% have no additional cost sharing for hospital admissions after any general annual deductible has been met (Exhibit 7.22). For covered workers in HMO plans, copayments are more common (37%) and coinsurance (26%) is less common than in other plan types.
o The percent of covered workers in a plan which requires coinsurance for hospital
admission has increased from 53% in 2010 to 61% in 2013.
o The average coinsurance rate is 18%; the average copayment is $278 per hospital admission; the average per diem charge is $264; and the average separate annual hospital deductible is $436 (Exhibit 7.24).
o The cost-sharing provisions for outpatient surgery are similar to those for hospital
admissions, as most workers have coinsurance or copayments. Sixty-two percent of covered workers have coinsurance and 18% have copayments for an outpatient surgery episode. In addition, 2% have a separate annual deductible for outpatient surgery, and 5% have both copayments and coinsurance, while 19% have no additional cost sharing after any general annual deductible has been met (Exhibit 7.23).
o For covered workers with cost sharing, the average coinsurance is 18%, the average
copayment is $140, and the average separate annual outpatient surgery deductible is $726 (Exhibit 7.24).
Cost Sharing for Physician Office Visits The majority of covered workers are enrolled in health plans that require cost sharing for an
in-network physician office visit, in addition to any general annual deductible.2
2 Starting in 2010, the survey asked about the prevalence and cost of physician office visits separately for primary care and specialty care. Prior to the 2010 survey if the respondent indicated the plan had a copayment for office visits, we assumed the plan had a copayment for both primary and specialty care visits. The survey did not allow for a respondent to report that a plan had a copayment for primary care visits and coinsurance for visits with a specialist physician. The changes made in 2010 allow for variations in the type of cost sharing for primary care and specialty care. This year the survey includes cost sharing for in-network services only. See the 2007 survey for information on out-of-network office visit cost sharing.

section
sevenE
mployee C
ost SharingEmployer Health Benefits 2 0 1 3 An n u a l S u r vey
T H E K A I S E R FA M I LY F O U N D AT I O N - A N D - H E A LT H R E S E A R C H & E D U C AT I O N A L T R U S T
7
100
o The most common form of physician office visit cost sharing for in-network services is copayments. Seventy-four percent of covered workers have a copayment for a primary care physician office visit and 20% have coinsurance. For office visits with a specialty physician, 72% of covered workers have copayments and 20% have coinsurance. Workers in HMOs, PPOs, and POS plans are much more likely to have copayments than workers in HDHP/SOs for both primary care and specialty care physician office visits. For example, the majority of workers in HDHP/SOs have coinsurance (55%) or no cost sharing after the general annual plan deductible is met (22%) for primary care physician office visits (Exhibit 7.25).
o Among covered workers with a copayment for in-network physician office visits, the average copayment is $23 for primary care and $35 for specialty physicians (Exhibit 7.26), similar to $23 and $33 reported in 2012.
o Among workers with coinsurance for in-network physician office visits, the average
coinsurance rates are 18% for a visit with a primary care physician and 19% for a visit with a specialist (Exhibit 7.26).
Out-Of-Pocket Maximum Amounts
Most covered workers are in a plan that partially or totally limits the cost sharing that a plan enrollee must pay in a year. These limits are generally referred to as out-of-pocket maximum amounts. Enrollee cost sharing, such as deductibles, office visit cost sharing, or spending on prescription drugs, may or may not apply to the out-of-pocket maximum. Therefore, the survey asks what types of out-of-pocket expenses count when determining whether a covered worker has met the plan out-of-pocket maximum. When a plan does not count certain types of spending, it effectively increases the amount a worker may pay out-of-pocket.
Twelve percent of covered workers are in a plan that does not limit the amount of cost sharing enrollees have to pay for either single or family coverage (Exhibit 7.31).
o Covered workers with single or family coverage in HMOs (25%) are more likely to be
enrolled in a plan that does not limit the amount of cost sharing than workers in PPOs (11%) (Exhibit 7.31).
o Covered workers without an out-of-pocket maximum, however, may not have large cost-
sharing responsibilities. For example, 76% of covered workers in HMOs with no out-of-pocket maximum for single coverage have no general annual deductible, only 2% have coinsurance for a hospital admission and less than 1% have coinsurance for outpatient surgery episodes.
o HSA-qualified HDHPs are required by law to have an out-of-pocket maximum of no more
than $6,250 for single coverage and $12,500 for family coverage in 2013. HDHP/HRAs have no such requirement, and among workers enrolled in these plans, 9% have no out-of-pocket maximum for single or family coverage.
For covered workers with out-of-pocket maximums, there is wide variation in spending limits.
o Twenty-nine percent of covered workers with an out-of-pocket maximum for single coverage have an out-of-pocket maximum of less than $2,000, while 12% have an out-

Employer Health Benefits 2 0 1 3 An n u a l S u r vey
T H E K A I S E R FA M I LY F O U N D AT I O N - A N D - H E A LT H R E S E A R C H & E D U C AT I O N A L T R U S T
101
7
section
sevenE
mployee C
ost Sharing
of-pocket maximum of $5,000 or more (Exhibit 7.33). Covered workers with an out-of-pocket maximum in small firms (3 to 199 workers) are more likely than such workers in larger firms to be covered by a plan with an out-of-pocket maximum of $3,000 or more (52% vs. 39%).
o Like deductibles, some plans have an aggregate out-of-pocket maximum amount for
family coverage that applies to cost sharing for all family members, while others have a per-person out-of-pocket maximum that limits the amount of cost sharing that the family must pay on behalf of each family member. Sixty-three percent of covered workers in a plan with an out-of-pocket maximum are in a plan with an aggregate limit (Exhibit 7.34).
o For covered workers with an aggregate out-of-pocket maximum for family coverage,
29% have an out-of-pocket maximum of less than $4,000 and 24% have an out-of-pocket maximum of $8,000 or more (Exhibit 7.35). Among workers with separate per-person out-of-pocket limits for family coverage, 85% have out-of-pocket maximums of less than $4,000 (Exhibit 7.36).
As noted above, covered workers with an out-of-pocket maximum may be enrolled in a plan
where not all spending counts toward the out-of-pocket maximum, potentially exposing workers to higher out-of-pocket spending. o Among workers enrolled in PPO plans with an out-of-pocket maximum for single or
family coverage, 34% are in plans that do not count spending for the general annual plan deductible toward the out-of-pocket limit (Exhibit 7.32).
o It is more common for covered workers to be in plans that do not count prescription drug
cost sharing toward the out-of-pocket limit. Eighty-four percent of workers enrolled in PPO plans and 71% enrolled in HMO plans with an out-of-pocket maximum for single or family coverage are in plans that do not count prescription drug spending towards the out-of-pocket maximum (Exhibit 7.32). In 2014 some plans will need to change these plan provisions because the ACA requires that all non-grandfathered plans have an OOP maximum that counts all cost-sharing towards the limit.

section
sevenE
mployee C
ost SharingEmployer Health Benefits 2 0 1 3 An n u a l S u r vey
T H E K A I S E R FA M I LY F O U N D AT I O N - A N D - H E A LT H R E S E A R C H & E D U C AT I O N A L T R U S T
7
102
Single Coverage
Family Coverage
HMO200-999 Workers 64% 64%1,000-4,999 Workers 70 705,000 or More Workers 54 54All Small Firms (3-199 Workers) 56% 55%All Large Firms (200 or More Workers) 60% 60%
ALL FIRM SIZES 59% 59%PPO
200-999 Workers 14% 14%1,000-4,999 Workers 17 175,000 or More Workers 19 19All Small Firms (3-199 Workers) 22% 23%All Large Firms (200 or More Workers) 18% 18%
ALL FIRM SIZES 19% 19%POS
200-999 Workers 30% 30%1,000-4,999 Workers 59 595,000 or More Workers NSD NSDAll Small Firms (3-199 Workers) 22% 23%All Large Firms (200 or More Workers) 51% 51%
ALL FIRM SIZES 34% 34%
Exhibit 7.1
Note: HDHP/SOs are not shown because all covered workers in these plans face a minimum deductible. In HDHP/HRA plans, as defined by the survey, the minimum deductible is $1,000 for single coverage and $2,000 for family coverage. In HSA-qualified HDHPs, the legal minimum deductible for 2013 is $1,250 for single coverage and $2,500 for family coverage. Average general annual health plan deductibles for PPO and POS plans are for in-network services. Tests found no statistical differences within plan and coverage type from estimate for all other firms not in the indicated size category (p<.05).
Source: Kaiser/HRET Survey of Employer-Sponsored Health Benefits, 2013.
Percent of Covered Workers with No General Annual Health Plan Deductible for Single and Family Coverage, by Plan Type and Firm
Size, 2013
NSD: Not Sufficient Data.
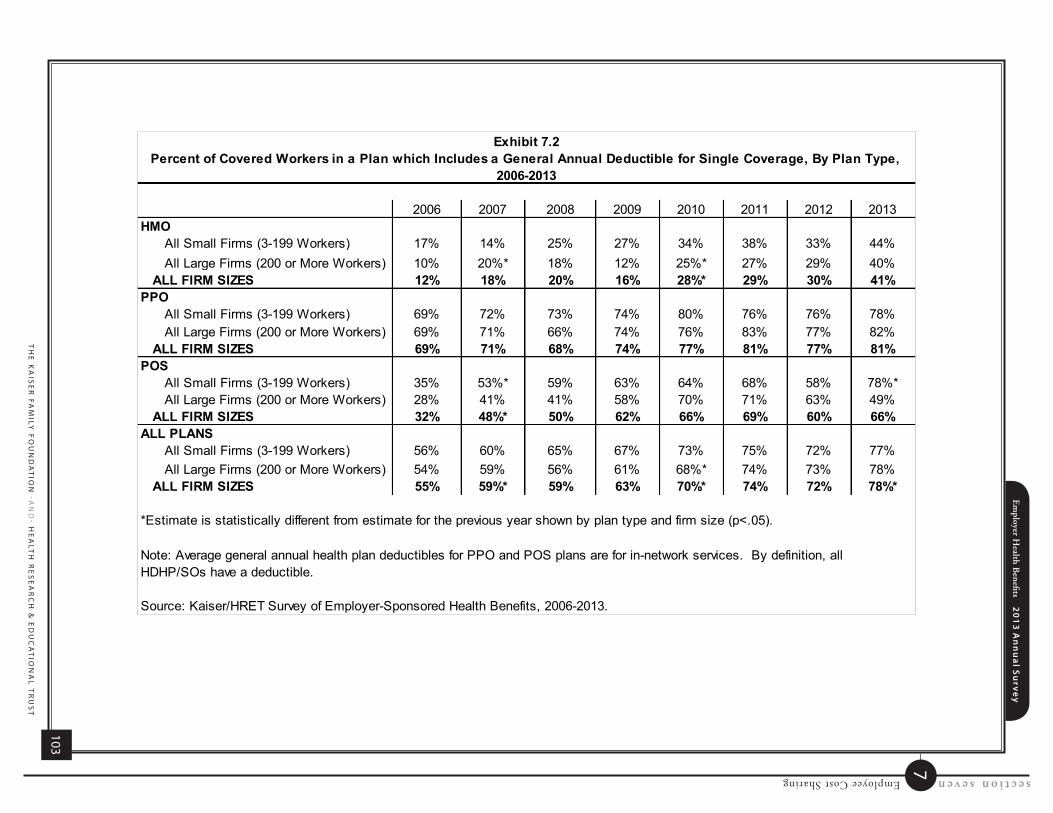
Employer H
ealth Benefits 2
01
3 A
nn
ua
l Su
rvey
TH
E K
AIS
ER
FAM
ILY F
OU
ND
AT
ION
-AN
D- H
EA
LTH
RE
SE
AR
CH
& E
DU
CA
TIO
NA
L T
RU
ST
103
7
section sevenEmployee Cost Sharing
2006 2007 2008 2009 2010 2011 2012 2013HMO
All Small Firms (3-199 Workers) 17% 14% 25% 27% 34% 38% 33% 44%All Large Firms (200 or More Workers) 10% 20%* 18% 12% 25%* 27% 29% 40%
ALL FIRM SIZES 12% 18% 20% 16% 28%* 29% 30% 41%PPO
All Small Firms (3-199 Workers) 69% 72% 73% 74% 80% 76% 76% 78%All Large Firms (200 or More Workers) 69% 71% 66% 74% 76% 83% 77% 82%
ALL FIRM SIZES 69% 71% 68% 74% 77% 81% 77% 81%POS
All Small Firms (3-199 Workers) 35% 53%* 59% 63% 64% 68% 58% 78%*All Large Firms (200 or More Workers) 28% 41% 41% 58% 70% 71% 63% 49%
ALL FIRM SIZES 32% 48%* 50% 62% 66% 69% 60% 66%ALL PLANS
All Small Firms (3-199 Workers) 56% 60% 65% 67% 73% 75% 72% 77%All Large Firms (200 or More Workers) 54% 59% 56% 61% 68%* 74% 73% 78%
ALL FIRM SIZES 55% 59%* 59% 63% 70%* 74% 72% 78%*
Exhibit 7.2Percent of Covered Workers in a Plan which Includes a General Annual Deductible for Single Coverage, By Plan Type,
2006-2013
*Estimate is statistically different from estimate for the previous year shown by plan type and firm size (p<.05).
Note: Average general annual health plan deductibles for PPO and POS plans are for in-network services. By definition, all HDHP/SOs have a deductible.
Source: Kaiser/HRET Survey of Employer-Sponsored Health Benefits, 2006-2013.

section
sevenE
mployee C
ost SharingEmployer Health Benefits 2 0 1 3 An n u a l S u r vey
T H E K A I S E R FA M I LY F O U N D AT I O N - A N D - H E A LT H R E S E A R C H & E D U C AT I O N A L T R U S T
7
104
Percent of Covered Workers in a Plan which Includes a
General Annual Deductible
Among Covered Workers with a General Annual Health Plan
Deductible for Single Coverage, Average Deductible
Low Wage LevelLess Than 35% Earn $23,000 a Year or Less 78% $1,12835% or More Earn $23,000 a Year or Less 82% $1,213
High Wage LevelLess Than 35% Earn $56,000 a Year or More 80% $1,216*35% or More Earn $56,000 a Year or More 76% $1,041*
UnionsFirm Has At Least Some Union Workers 76% $776*Firm Does Not Have Any Union Workers 79% $1,326*
Younger WorkersLess Than 35% of Workers Are Age 26 or Younger 78% $1,13635% or More Workers Are Age 26 or Younger 77% $1,115
Older WorkersLess Than 35% of Workers Are Age 50 or Older 79% $1,17835% or More Workers Are Age 50 or Older 76% $1,072
Firm OwnershipPrivate For-Profit 82%* $1,269*Public 71% $740*Private Not-For-Profit 72%* $1,038
ALL FIRMS 78% $1,135
Exhibit 7.3Percent of Covered Workers in a Plan which Includes a General Annual Deductible and Average Deductible, By
Firm Characteristics, 2013
*Estimates are statistically different from each other within firm characteristic (p<.05).
Source: Kaiser/HRET Survey of Employer-Sponsored Health Benefits, 2013.

Employer Health Benefits 2 0 1 3 An n u a l S u r vey
T H E K A I S E R FA M I LY F O U N D AT I O N - A N D - H E A LT H R E S E A R C H & E D U C AT I O N A L T R U S T
105
7
section
sevenE
mployee C
ost Sharing
Single Coverage Family CoverageSeparate Cost Sharing for a Hospital Admission‡
HMO 81% 81%PPO 83 83POS 73 73
Separate Cost Sharing for an Outpatient Surgery Episode
HMO 78% 78%PPO 78 78POS 61 61
Source: Kaiser/HRET Survey of Employer-Sponsored Health Benefits, 2013.
Exhibit 7.4
‡ Separate cost sharing for each hospital admission includes the following types: separate annual deductible, copayment, coinsurance, and/or a charge per day (per diem). Cost sharing for each outpatient surgery episode includes the following types: separate annual deductible, copayment, and/or coinsurance.
Note: HDHP/SOs are not shown because all covered workers in these plans face a deductible. In HDHP/HRA plans, as defined by the survey, the minimum deductible is $1,000 for single coverage and $2,000 for family coverage. In HSA-qualified HDHPs, the legal minimum deductible for 2013 is $1,250 for single coverage and $2,500 for family coverage. Average general annual health plan deductibles for PPO and POS plans are for in-network services.
Among Covered Workers with No General Annual Health Plan Deductible for Single and Family Coverage, Percent Who Have the Following Types of Cost
Sharing, by Plan Type, 2013
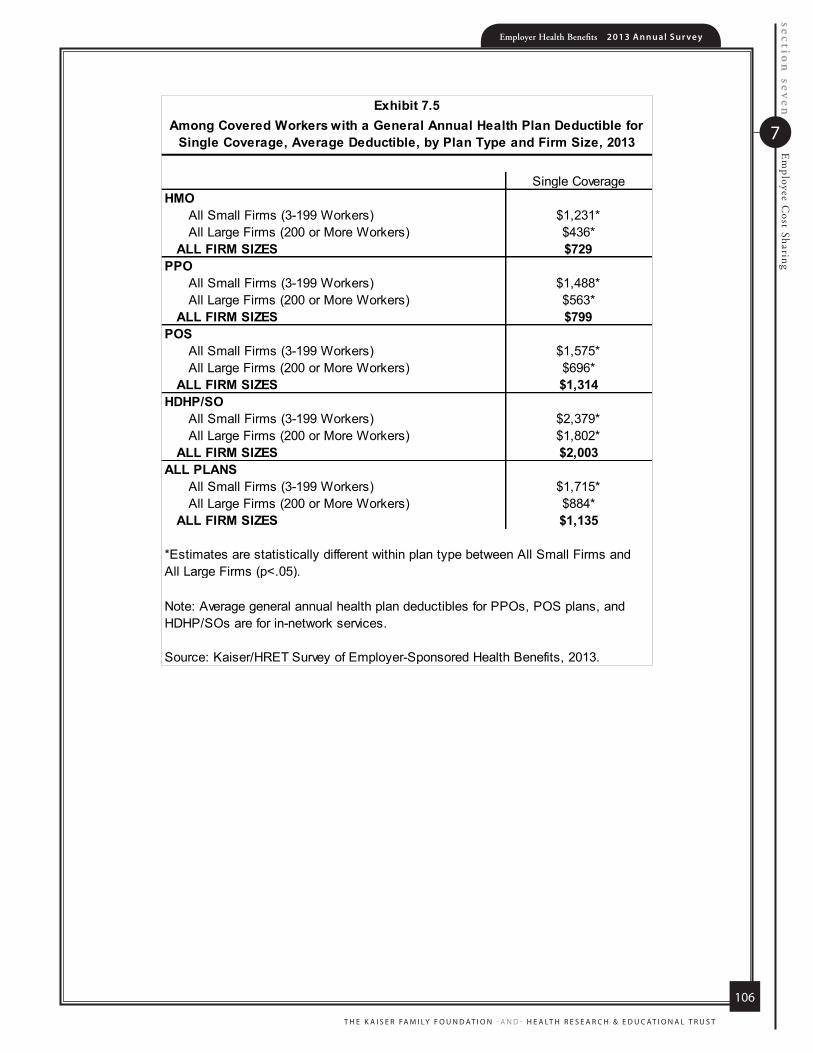
section
sevenE
mployee C
ost SharingEmployer Health Benefits 2 0 1 3 An n u a l S u r vey
T H E K A I S E R FA M I LY F O U N D AT I O N - A N D - H E A LT H R E S E A R C H & E D U C AT I O N A L T R U S T
7
106
Single CoverageHMO
All Small Firms (3-199 Workers) $1,231*All Large Firms (200 or More Workers) $436*
ALL FIRM SIZES $729PPO
All Small Firms (3-199 Workers) $1,488*All Large Firms (200 or More Workers) $563*
ALL FIRM SIZES $799POS
All Small Firms (3-199 Workers) $1,575*All Large Firms (200 or More Workers) $696*
ALL FIRM SIZES $1,314HDHP/SO
All Small Firms (3-199 Workers) $2,379*All Large Firms (200 or More Workers) $1,802*
ALL FIRM SIZES $2,003ALL PLANS
All Small Firms (3-199 Workers) $1,715*All Large Firms (200 or More Workers) $884*
ALL FIRM SIZES $1,135
Note: Average general annual health plan deductibles for PPOs, POS plans, and HDHP/SOs are for in-network services.
Source: Kaiser/HRET Survey of Employer-Sponsored Health Benefits, 2013.
Among Covered Workers with a General Annual Health Plan Deductible for Single Coverage, Average Deductible, by Plan Type and Firm Size, 2013
Exhibit 7.5
*Estimates are statistically different within plan type between All Small Firms and All Large Firms (p<.05).

Employer Health Benefits 2 0 1 3 An n u a l S u r vey
T H E K A I S E R FA M I LY F O U N D AT I O N - A N D - H E A LT H R E S E A R C H & E D U C AT I O N A L T R U S T
107
7
section
sevenE
mployee C
ost Sharing
Single CoverageHMO
Northeast $739Midwest $571South $821West NSD
ALL REGIONS $729PPO
Northeast $572*Midwest $810South $840West $862
ALL REGIONS $799POS
Northeast NSDMidwest $1,535South $1,253West NSD
ALL REGIONS $1,314HDHP/SO
Northeast $1,823Midwest $2,222*South $1,881West $2,026
ALL REGIONS $2,003All Plans
Northeast $1,020Midwest $1,282*South $1,104West $1,107
ALL REGIONS $1,135
Exhibit 7.6
Source: Kaiser/HRET Survey of Employer-Sponsored Health Benefits, 2013.
* Estimate is statistically different within plan type from estimate for all other firms not in the indicated region (p<.05).
NSD: Not Sufficient Data.
Note: Average general annual health plan deductibles for PPOs, POS plans, and HDHP/SOs are for in-network services.
Among Covered Workers with a General Annual Health Plan Deductible for Single Coverage, Average Deductible, by Plan Type
and Region, 2013

section sevenEmployee Cost SharingEm
ployer Health B
enefits 20
13
An
nu
al S
urve
y
TH
E K
AIS
ER
FAM
ILY F
OU
ND
AT
ION
-AN
D- H
EA
LTH
RE
SE
AR
CH
& E
DU
CA
TIO
NA
L T
RU
ST
7
108
2006 2007 2008 2009 2010 2011 2012 2013HMO $352 $401 $503 $699* $601 $911 $691 $729 PPO $473 $461 $560* $634* $675 $675 $733 $799 POS $553 $621 $752 $1,061 $1,048 $928 $1,014 $1,314 HDHP/SO $1,715 $1,729 $1,812 $1,838 $1,903 $1,908 $2,086 $2,003 ALL PLANS $584 $616 $735* $826* $917* $991 $1,097* $1,135
Source: Kaiser/HRET Survey of Employer-Sponsored Health Benefits, 2006-2013.
Note: Average general annual health plan deductibles for PPOs, POS plans, and HDHP/SOs are for in-network services.
*Estimate is statistically different from estimate for the previous year shown by plan type (p<.05).
Among Covered Workers with a General Annual Health Plan Deductible for Single Coverage, Average Deductible, by Plan Type, 2006-2013
Exhibit 7.7

Employer Health Benefits 2 0 1 3 An n u a l S u r vey
T H E K A I S E R FA M I LY F O U N D AT I O N - A N D - H E A LT H R E S E A R C H & E D U C AT I O N A L T R U S T
109
7
section
sevenE
mployee C
ost Sharing
58%
31%28%
8%
38%
15%
0%
20%
40%
60%
80%
100%
Percentage of Covered Workers with aDeductible of $1,000 or More*
Percentage of Covered Workers with aDeductible of $2,000 or More*
All Small Firms (3-199 Workers)
All Large Firms (200 or More Workers)
All Firms
* Estimate is statistically different between All Small Firms and All Large Firms within category (p<.05).NOTE: These estimates include workers enrolled in HDHP/SO and other plan types. Because we do not collect information on the attributes of conventional plans, to be conservative, we assumed that workers in conventional plans do not have a deductible of $1,000 or more. Because of the low enrollment in conventional plans, the impact of this assumption is minimal. Average general annual health plan deductibles for PPOs, POS plans, and HDHP/SOs are for in-network services. SOURCE: Kaiser/HRET Survey of Employer-Sponsored Health Benefits, 2013.
Exhibit 7.8Percentage of Covered Workers Enrolled in a Plan with a High General Annual Deductible for Single Coverage, By Firm Size, 2013
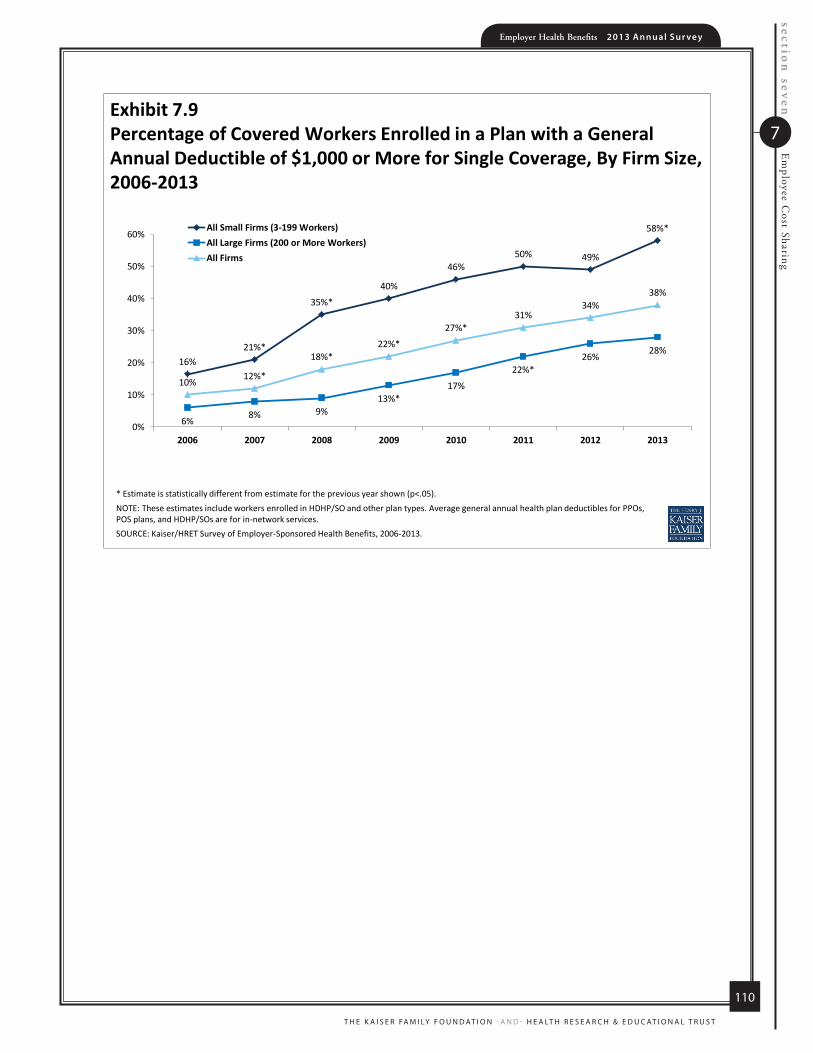
section
sevenE
mployee C
ost SharingEmployer Health Benefits 2 0 1 3 An n u a l S u r vey
T H E K A I S E R FA M I LY F O U N D AT I O N - A N D - H E A LT H R E S E A R C H & E D U C AT I O N A L T R U S T
7
110
16%21%*
35%*40%
46%50% 49%
58%*
6%8% 9%
13%*17%
22%*26%
28%
10% 12%*
18%*22%*
27%*31%
34%38%
0%
10%
20%
30%
40%
50%
60%
2006 2007 2008 2009 2010 2011 2012 2013
All Small Firms (3-199 Workers)All Large Firms (200 or More Workers)All Firms
* Estimate is statistically different from estimate for the previous year shown (p<.05). NOTE: These estimates include workers enrolled in HDHP/SO and other plan types. Average general annual health plan deductibles for PPOs, POS plans, and HDHP/SOs are for in-network services. SOURCE: Kaiser/HRET Survey of Employer-Sponsored Health Benefits, 2006-2013.
Exhibit 7.9Percentage of Covered Workers Enrolled in a Plan with a General Annual Deductible of $1,000 or More for Single Coverage, By Firm Size, 2006-2013

Employer Health Benefits 2 0 1 3 An n u a l S u r vey
T H E K A I S E R FA M I LY F O U N D AT I O N - A N D - H E A LT H R E S E A R C H & E D U C AT I O N A L T R U S T
111
7
section
sevenE
mployee C
ost Sharing
6%
7%
12%*
16%
20%
28%* 27%
31%
1% 1% 2% 3%* 4% 5% 7% 8%3%
3%5%*
7%*10%
12%*14% 15%
0%
10%
20%
30%
40%
50%
2006 2007 2008 2009 2010 2011 2012 2013
All Small Firms (3-199 Workers)
All Large Firms (200 or More Workers)
All Firms
* Estimate is statistically different from estimate for the previous year shown (p<.05). Note: These estimates include workers enrolled in HDHP/SO and other plan types. Average general annual health plan deductibles for PPOs, POS plans, and HDHP/SOs are for in-network services.SOURCE: Kaiser/HRET Survey of Employer-Sponsored Health Benefits, 2006-2013.
Exhibit 7.10Percentage of Covered Workers Enrolled in a Plan with a General Annual Deductible of $2,000 or More for Single Coverage, By Firm Size, 2006-2013
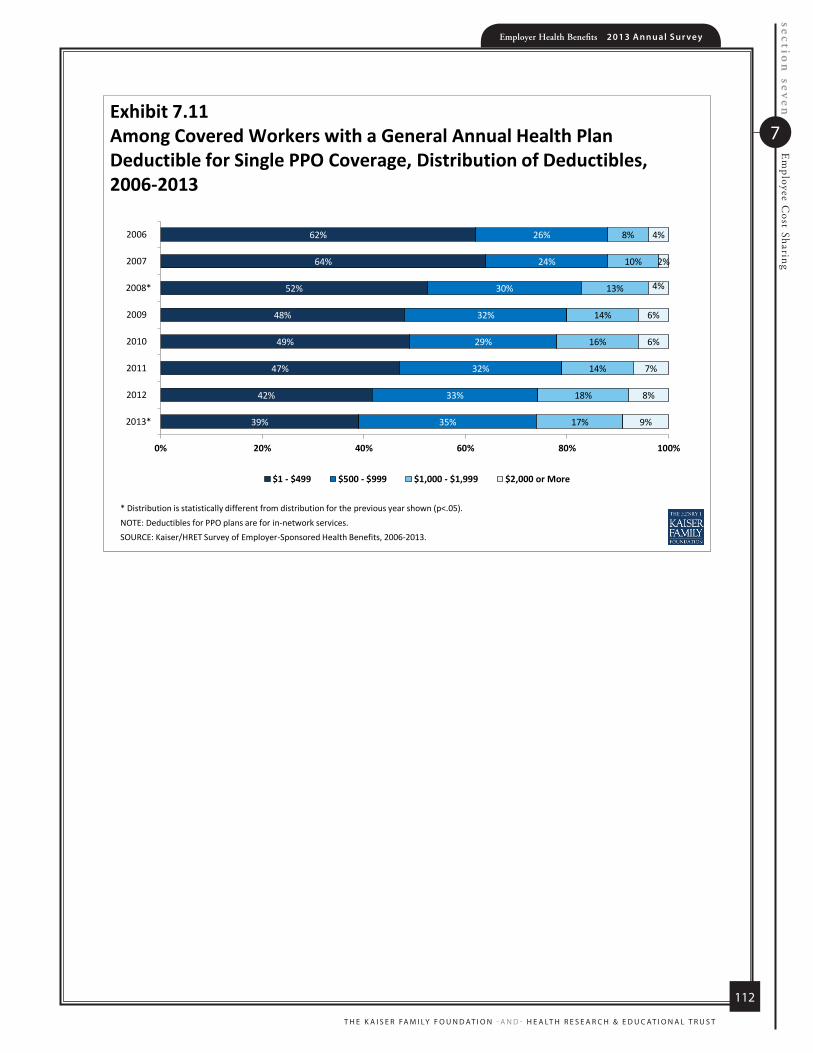
section
sevenE
mployee C
ost SharingEmployer Health Benefits 2 0 1 3 An n u a l S u r vey
T H E K A I S E R FA M I LY F O U N D AT I O N - A N D - H E A LT H R E S E A R C H & E D U C AT I O N A L T R U S T
7
112
39%
42%
47%
49%
48%
52%
64%
62%
35%
33%
32%
29%
32%
30%
24%
26%
17%
18%
14%
16%
14%
13%
10%
8%
9%
8%
7%
6%
6%
4%
2%
4%
0% 20% 40% 60% 80% 100%
2013*
2012
2011
2010
2009
2008*
2007
2006
$1 - $499 $500 - $999 $1,000 - $1,999 $2,000 or More
* Distribution is statistically different from distribution for the previous year shown (p<.05). NOTE: Deductibles for PPO plans are for in-network services. SOURCE: Kaiser/HRET Survey of Employer-Sponsored Health Benefits, 2006-2013.
Exhibit 7.11Among Covered Workers with a General Annual Health Plan Deductible for Single PPO Coverage, Distribution of Deductibles, 2006-2013

Employer Health Benefits 2 0 1 3 An n u a l S u r vey
T H E K A I S E R FA M I LY F O U N D AT I O N - A N D - H E A LT H R E S E A R C H & E D U C AT I O N A L T R U S T
113
7
section
sevenE
mployee C
ost Sharing
Exhibit 7.12Among Covered Workers With a General Annual Health Plan Deductible for Single POS Coverage, Distribution of Deductibles, 2006-2013
* Distribution is statistically different from distribution for the previous year shown (p<.05). NOTE: Deductibles for POS plans are for in-network services. SOURCE: Kaiser/HRET Survey of Employer-Sponsored Health Benefits, 2006-2013.
15%
25%
37%
16%
29%
33%
50%
38%
19%
30%
24%
35%
24%
32%
26%
44%
40%
30%
27%
31%
29%
25%
19%
16%
26%
15%
12%
17%
18%
10%
5%
1%
0% 10% 20% 30% 40% 50% 60% 70% 80% 90% 100%
2013*
2012
2011
2010
2009
2008
2007*
2006
$1 - $499 $500 - $999 $1,000 - $1,999 $2,000 or More

section
sevenE
mployee C
ost SharingEmployer Health Benefits 2 0 1 3 An n u a l S u r vey
T H E K A I S E R FA M I LY F O U N D AT I O N - A N D - H E A LT H R E S E A R C H & E D U C AT I O N A L T R U S T
7
114
No Deductible
Aggregate Amount
Separate Amount per
PersonHMO
All Small Firms (3-199 Workers) 55% 27% 17%All Large Firms (200 or More Workers) 60 21 19
ALL FIRM SIZES 59% 23% 18%PPO
All Small Firms (3-199 Workers) 23% 49% 28%All Large Firms (200 or More Workers) 18 46 36
ALL FIRM SIZES 19% 47% 34%POS
All Small Firms (3-199 Workers) 23%* 59% 19%All Large Firms (200 or More Workers) 51* 40 9
ALL FIRM SIZES 34% 51% 15%HDHP/SO
All Small Firms (3-199 Workers) NA 85% 15%All Large Firms (200 or More Workers) NA 83 17
ALL FIRM SIZES NA 84% 16%
Source: Kaiser/HRET Survey of Employer-Sponsored Health Benefits, 2013.
Distribution of Type of General Annual Deductible for Covered Workers with Family Coverage, by Plan Type and Firm Size, 2013
Exhibit 7.13
NA: Not Applicable. All covered workers in HDHP/SOs face a general annual deductible. In HDHP/HRA plans, as defined by the survey, the minimum deductible is $1,000 for single coverage and $2,000 for family coverage. In HSA-qualified HDHPs, the legal minimum deductible for 2013 is $1,250 for single coverage and $2,500 for family coverage.
Note: The survey distinguished between plans that have an aggregate deductible amount in which all family members’ out-of-pocket expenses count toward the deductible and plans that have a separate amount for each family member, typically with a limit on the number of family members required to reach that amount. Among workers with a general annual family deductible, 56% of workers in HMOs, 58% in PPOs, and 77% in POS plans have an aggregate deductible. Average general annual health plan deductibles for PPOs, POS plans, and HDHP/SOs are for in-network services.
* Estimates are statistically different from within plan type between All Small Firms and All Large Firms (p<0.05).

Employer Health Benefits 2 0 1 3 An n u a l S u r vey
T H E K A I S E R FA M I LY F O U N D AT I O N - A N D - H E A LT H R E S E A R C H & E D U C AT I O N A L T R U S T
115
7
section
sevenE
mployee C
ost Sharing
Aggregate Amount Separate Amount per Person
HMOAll Small Firms (3-199 Workers) NSD NSDAll Large Firms (200 or More Workers) $1,043 $392
ALL FIRM SIZES $1,743 $609PPO
All Small Firms (3-199 Workers) $3,393* $1,414*All Large Firms (200 or More Workers) $1,264* $605*
ALL FIRM SIZES $1,854 $782POS
All Small Firms (3-199 Workers) $3,359* NSDAll Large Firms (200 or More Workers) $1,650* NSD
ALL FIRM SIZES $2,821 $1,080HDHP/SO
All Small Firms (3-199 Workers) $4,706* NSDAll Large Firms (200 or More Workers) $3,740* $1,759
ALL FIRM SIZES $4,079 $2,033
Source: Kaiser/HRET Survey of Employer-Sponsored Health Benefits, 2013.
Note: Average general annual health plan deductibles for PPOs, POS plans, and HDHP/SOs are for in-network services. The survey distinguished between plans that have an aggregate deductible amount in which all family members’ out-of-pocket expenses count toward the deductible and plans that have a separate amount for each family member, typically with a limit on the number of family members required to reach that amount.
Among Covered Workers with a General Annual Health Plan Deductible, Average Deductibles for Family Coverage, by Deductible Type, Plan Type, and Firm Size, 2013
Exhibit 7.14
* Estimates are statistically different within plan and deductible type between All Small Firms and All Large Firms (p<.05).
NSD: Not Sufficient Data.

section sevenEmployee Cost SharingEm
ployer Health B
enefits 20
13
An
nu
al S
urve
y
TH
E K
AIS
ER
FAM
ILY F
OU
ND
AT
ION
-AN
D- H
EA
LTH
RE
SE
AR
CH
& E
DU
CA
TIO
NA
L T
RU
ST
7
116
2006 2007 2008 2009 2010 2011 2012 2013HMO $751 $759 $1,053 $1,524* $1,321 $1,487 $1,329 $1,743 PPO $1,034 $1,040 $1,344* $1,488 $1,518 $1,521 $1,770 $1,854 POS $1,227 $1,359 $1,860 $2,191 $2,253 $1,769 $2,163 $2,821 HDHP/SO $3,511 $3,596 $3,559 $3,626 $3,780 $3,666 $3,924 $4,079
Source: Kaiser/HRET Survey of Employer-Sponsored Health Benefits, 2006-2013.
* Estimate is statistically different from estimate for the previous year shown by plan type (p<.05).
Among Covered Workers with an Aggregate General Annual Health Plan Deductible for Family Coverage, Average Deductibles, by Plan Type, 2006-2013
Exhibit 7.15
Note: Average general annual health plan deductibles for PPOs, POS plans, and HDHP/SOs are for in-network services.
21%
37%
49%
15%
36%
25%
47%
43%
19%
23%
53%
21%
8%
2%
0%10%
20%30%
40%50%
60%70%
80%90%
100%
HDHP/SO
POS
PPO
HMO
$1-$499$500-$999
$1,000-$1,999$2,000 or M
ore
NO
TE: Average general annual health plan deductibles for PPOs, PO
S plans, and HDHP/SOs are for in-netw
ork services. The survey distinguished betw
een plans that have an aggregate deductible amount in w
hich all family m
embers’ out-of-pocket expenses count tow
ard the deductible and plans that have a separate am
ount for each family m
ember, typically w
ith a limit on the num
ber of family m
embers required to
reach that amount.
SOU
RCE: Kaiser/HRET Survey of Employer-Sponsored Health Benefits, 2013.
Exhibit 7.16Am
ong Covered Workers w
ith a Separate Per Person General Annual Health Plan Deductible for Fam
ily Coverage, Distribution of Deductibles, by Plan Type, 2013

Employer Health Benefits 2 0 1 3 An n u a l S u r vey
T H E K A I S E R FA M I LY F O U N D AT I O N - A N D - H E A LT H R E S E A R C H & E D U C AT I O N A L T R U S T
117
7
section
sevenE
mployee C
ost Sharing
2006
2007
2008
2009
2010
2011
2012
2013
HMO
$751
$759
$1
,053
$1
,524
*$1
,321
$1
,487
$1
,329
$1
,743
PP
O$1
,034
$1,0
40
$1,3
44*
$1,4
88
$1,5
18
$1,5
21
$1,7
70
$1,8
54
POS
$1,2
27$1
,359
$1
,860
$2
,191
$2
,253
$1
,769
$2
,163
$2
,821
HD
HP/S
O$3
,511
$3,5
96
$3,5
59
$3,6
26
$3,7
80
$3,6
66
$3,9
24
$4,0
79
Sou
rce:
Kai
ser/H
RE
T S
urve
y of
Em
ploy
er-S
pons
ored
Hea
lth B
enef
its, 2
006-
2013
.
* E
stim
ate
is s
tatis
tical
ly d
iffer
ent f
rom
est
imat
e fo
r the
pre
vious
yea
r sho
wn
by p
lan
type
(p<.
05).
Amon
g Co
vere
d W
orke
rs w
ith a
n Ag
greg
ate
Gen
eral
Ann
ual H
ealth
Pla
n De
duct
ible
for F
amily
Cov
erag
e,
Aver
age
Dedu
ctib
les,
by
Plan
Typ
e, 2
006-
2013
Exhi
bit 7
.15
Not
e: A
vera
ge g
ener
al a
nnua
l hea
lth p
lan
dedu
ctib
les
for P
PO
s, P
OS
pla
ns, a
nd H
DH
P/S
Os
are
for i
n-ne
twor
k se
rvic
es.
21%
37%
49%
15%
36%
25%
47%
43%
19%
23%
53%
21%
8%
2%
0% 10% 20% 30% 40% 50% 60% 70% 80% 90% 100%
HDHP/SO
POS
PPO
HMO
$1-$499 $500-$999 $1,000-$1,999 $2,000 or More
NOTE: Average general annual health plan deductibles for PPOs, POS plans, and HDHP/SOs are for in-network services. The survey distinguished between plans that have an aggregate deductible amount in which all family members’ out-of-pocket expenses count toward the deductible and plans that have a separate amount for each family member, typically with a limit on the number of family members required to reach that amount.
SOURCE: Kaiser/HRET Survey of Employer-Sponsored Health Benefits, 2013.
Exhibit 7.16Among Covered Workers with a Separate Per Person General Annual Health Plan Deductible for Family Coverage, Distribution of Deductibles, by Plan Type, 2013

section
sevenE
mployee C
ost SharingEmployer Health Benefits 2 0 1 3 An n u a l S u r vey
T H E K A I S E R FA M I LY F O U N D AT I O N - A N D - H E A LT H R E S E A R C H & E D U C AT I O N A L T R U S T
7
118
5%
13%
11%
9%
25%
21%
21%
33%
27%
100%
65%
29%
41%
0% 10% 20% 30% 40% 50% 60% 70% 80% 90% 100%
HDHP/SO‡
POS
PPO
HMO
$1-$499 $500-$999 $1,000-$1,999 $2,000 or More
‡ By definition, 100% of covered workers in HDHP/SOs with an aggregate deductible have a family deductible of $2,000 or more.
NOTE: Average general annual health plan deductibles for PPOs, POS plans, and HDHP/SOs are for in-network services. The survey distinguished between plans that have an aggregate deductible amount in which all family members’ out-of-pocket expenses count toward the deductible and plans that have a separate amount for each family member, typically with a limit on the number of family members required to reach that amount.
SOURCE: Kaiser/HRET Survey of Employer-Sponsored Health Benefits, 2013.
Exhibit 7.17Among Covered Workers with an Aggregate General Annual Health Plan Deductible for Family Coverage, Distribution of Deductibles, By Plan Type, 2013

Employer Health Benefits 2 0 1 3 An n u a l S u r vey
T H E K A I S E R FA M I LY F O U N D AT I O N - A N D - H E A LT H R E S E A R C H & E D U C AT I O N A L T R U S T
119
7
section
sevenE
mployee C
ost Sharing
68%
33%
74%
73%
64%
28%
65%
13%
23%
35%
3%
2%
12%
3%
1%
1%
1%
2%
1%
<1%
0% 10% 20% 30% 40% 50% 60% 70% 80% 90% 100%
ALL PLANS
HDHP/SO
POS
PPO
HMO
Number of Family Members Number and Total No Limits Other
NOTE: Average general annual health plan deductibles for PPOs, POS plans, and HDHP/SOs are for in-network services. The survey distinguishes between plans that have an aggregate family deductible that applies to spending by any covered person in the family or a separate family deductible that applies to spending by each family member or a limited number of family members. Beginning in 2012, the survey’s skip logic was edited so that firms who selected a separate family deductible were asked if they had a combined limit or if the limit was consider met when a specified number of family members reached their separate per-person limit. The “other” category refers to workers that have another type of limit on per-person deductibles, such as a per-person amount with a total dollar cap.
SOURCE: Kaiser/HRET Survey of Employer-Sponsored Health Benefits, 2013.
Exhibit 7.18Among Covered Workers With a Separate Per Person General Annual Health Plan Deductible for Family Coverage, Structure of Deductible Limits, By Plan Type, 2013

section
sevenE
mployee C
ost SharingEmployer Health Benefits 2 0 1 3 An n u a l S u r vey
T H E K A I S E R FA M I LY F O U N D AT I O N - A N D - H E A LT H R E S E A R C H & E D U C AT I O N A L T R U S T
7
120
34%
21%
62%
34%
24%
33%
12%
11%
38%
39%
1%
1%
1%
28%
65%
13%
23%
35%
3%
2%
12%
3%
1%
1%
1%
2%
1%
<1%
0% 10% 20% 30% 40% 50% 60% 70% 80% 90% 100%
All Plans
HDHP/SO
POS
PPO
HMO
Two People Three People Four or More People (with Specified Limit) Total Family Spending No Limit Other
NOTE: Average general annual health plan deductibles for PPOs, POS plans, and HDHP/SOs are for in-network services. The survey distinguishes between plans that have an aggregate family deductible that applies to spending by any covered person in the family or a separate family deductible that applies to spending by each family member or a limited number of family members. Beginning in 2012, the survey’s skip logic was edited so that firms who selected a separate family deductible were asked if they had a combined limit or if the limit was consider met when a specified number of family members reached their separate per-person limit. The “other” category refers to workers that have another type of limit on per-person deductibles, such as a per-person amount with a total dollar cap.
SOURCE: Kaiser/HRET Survey of Employer-Sponsored Health Benefits, 2013.
Exhibit 7.19Among Covered Workers With a Separate Per Person General Annual Health Plan Deductible for Family Coverage, Distribution of Maximum Number of Family Members Required to Meet the Deductible, by Plan Type, 2013

Employer Health Benefits 2 0 1 3 An n u a l S u r vey
T H E K A I S E R FA M I LY F O U N D AT I O N - A N D - H E A LT H R E S E A R C H & E D U C AT I O N A L T R U S T
121
7
section
sevenE
mployee C
ost Sharing
$1-$499 $500-$999 $1,000-$1,999 $2,000 or MoreHMO
2006 27% 42% 23% 7%2007 22 48 23 82008 31 26 20 232009 7 22 33 382010 28 9 36 272011 35 14 28 232012 18 35 25 222013* 11 21 27 41
PPO2006 20% 42% 27% 12%2007 14 49 25 122008* 11 38 32 192009 12 30 35 232010 7 33 35 242011 12 28 36 242012 10 27 31 332013* 13 25 33 29
POS2006 12% 26% 45% 18%2007 32 13 29 252008 23 14 24 392009 3 18 30 492010 7 9 21 632011 6 26 36 332012 11 10 36 422013* 5 9 21 65
Source: Kaiser/HRET Survey of Employer-Sponsored Health Benefits, 2006-2013.
Exhibit 7.20Among Covered Workers With an Aggregate General Annual Health Plan
Deductible for Family Coverage, Distribution of Aggregate Deductibles, by Plan Type, 2006-2013
Note: By definition, 100% of covered workers in HDHP/SOs with an aggregate deductible have a family deductible of $2,000 or more. Average general annual health plan deductibles for PPOs and POS plans are for in-network services. The survey distinguished between plans that have an aggregate deductible amount in which all family members’ out-of-pocket expenses count toward the deductible and plans that have a separate amount for each family member, typically with a limit on the number of family members required to reach that amount.
* Distribution is statistically different from distribution for the previous year shown (p<.05).

section
sevenE
mployee C
ost SharingEmployer Health Benefits 2 0 1 3 An n u a l S u r vey
T H E K A I S E R FA M I LY F O U N D AT I O N - A N D - H E A LT H R E S E A R C H & E D U C AT I O N A L T R U S T
7
122
HMO PPO POS HDHP/HRA§
Physician Office Visits For Primary Care 77% 78% 72% 56%Prescription Drugs 95% 91% 87% 74%
Among Covered Workers with a General Annual Health Plan Deductible, Percentage with Coverage for the Following Services Without Having to First Meet the Deductible, by Plan
Type, 2013
Exhibit 7.21
Source: Kaiser/HRET Survey of Employer-Sponsored Health Benefits, 2013.
§ By definition, HSA-qualified HDHPs are required by law to apply the plan deductible to nearly all services.
Note: These questions are asked of firms with a deductible for single or family coverage. Average general annual health plan deductibles for PPOs, POS plans, and HDHP/SOs are for in-network services.
Sepa
rate
Cos
t Sha
ring
for a
Hos
pita
l Adm
issi
onH
MO
PP
OP
OS
HD
HP
/SO
§AL
L PL
ANS
Sep
arat
e A
nnua
l Ded
uctib
le fo
r Hos
pita
lizat
ions
3%
4%
6%
0%*
3%C
opay
men
t and
/or C
oins
uran
ceC
opay
men
t 37
*14
31*
3*16
Coi
nsur
ance
26
*69
*42
*68
61B
oth
Cop
aym
ent a
nd C
oins
uran
ce‡
510
92*
8C
harg
e P
er D
ay20
*4
152*
7N
one
1913
1628
*17
Sou
rce:
Kai
ser/H
RE
T S
urve
y of
Em
ploy
er-S
pons
ored
Hea
lth B
enef
its, 2
013.
* E
stim
ate
is s
tatis
tical
ly d
iffer
ent f
rom
All
Pla
ns e
stim
ate
(p<.
05).
Dist
ribut
ion
of C
over
ed W
orke
rs W
ith S
epar
ate
Cost
Sha
ring
for a
Hos
pita
l Adm
issi
on in
Add
ition
to
Any
Gen
eral
Ann
ual D
educ
tible
, by
Plan
Typ
e, 2
013
Exhi
bit 7
.22
‡ Thi
s in
clud
es e
nrol
lees
who
are
requ
ired
to p
ay th
e hi
gher
am
ount
of e
ither
the
copa
ymen
t or c
oins
uran
ce
unde
r the
pla
n.
§ In
form
atio
n on
sep
arat
e de
duct
ible
s fo
r hos
pita
l adm
issi
ons
was
col
lect
ed o
nly
for H
DH
P/H
RA
s be
caus
e fe
dera
l reg
ulat
ions
for H
SA
-qua
lifie
d H
DH
Ps
mak
e it
unlik
ely
thes
e pl
ans
wou
ld h
ave
a se
para
te d
educ
tible
for
spec
ific
serv
ices
.
Not
e: A
s in
pas
t yea
rs, w
e co
llect
ed in
form
atio
n on
the
cost
-sha
ring
prov
isio
ns fo
r hos
pita
l adm
issi
ons
that
ar
e in
add
ition
to a
ny g
ener
al a
nnua
l pla
n de
duct
ible
. H
owev
er, b
egin
ning
with
the
2009
sur
vey,
in o
rder
to
bette
r cap
ture
the
prev
alen
ce o
f com
bina
tions
of c
ost s
harin
g, th
e su
rvey
was
cha
nged
to a
sk a
ser
ies
of y
es
or n
o qu
estio
ns.
Pre
vious
ly, t
he q
uest
ion
aske
d re
spon
dent
s to
sel
ect o
ne re
spon
se fr
om a
list
of t
ypes
of
cost
sha
ring,
suc
h as
sep
arat
e de
duct
ible
s, c
opay
men
ts, c
oins
uran
ce, a
nd p
er d
iem
pay
men
ts (f
or
hosp
italiz
atio
n on
ly).
Due
to th
e ch
ange
in q
uest
ion
form
at, t
he d
istri
butio
n of
wor
kers
with
type
s of
cos
t sh
arin
g do
es n
ot e
qual
100
% a
s w
orke
rs m
ay fa
ce a
com
bina
tion
of ty
pes
of c
ost s
harin
g. Z
ero
perc
ent o
f co
vere
d w
orke
rs h
ave
an "
othe
r" ty
pe o
f cos
t sha
ring
for a
hos
pita
l adm
issi
on.
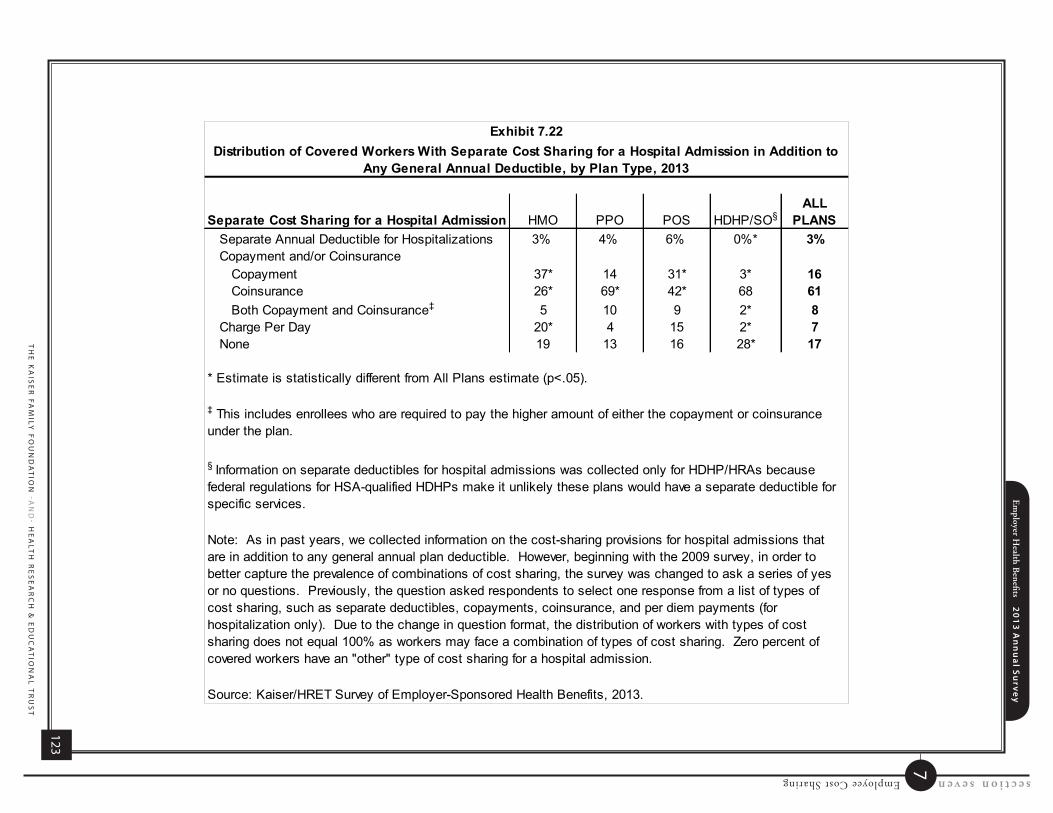
Employer H
ealth Benefits 2
01
3 A
nn
ua
l Su
rvey
TH
E K
AIS
ER
FAM
ILY F
OU
ND
AT
ION
-AN
D- H
EA
LTH
RE
SE
AR
CH
& E
DU
CA
TIO
NA
L T
RU
ST
123
7
section sevenEmployee Cost Sharing
Separate Cost Sharing for a Hospital Admission HMO PPO POS HDHP/SO§ALL
PLANSSeparate Annual Deductible for Hospitalizations 3% 4% 6% 0%* 3%Copayment and/or Coinsurance
Copayment 37* 14 31* 3* 16Coinsurance 26* 69* 42* 68 61Both Copayment and Coinsurance‡ 5 10 9 2* 8
Charge Per Day 20* 4 15 2* 7None 19 13 16 28* 17
Source: Kaiser/HRET Survey of Employer-Sponsored Health Benefits, 2013.
* Estimate is statistically different from All Plans estimate (p<.05).
Distribution of Covered Workers With Separate Cost Sharing for a Hospital Admission in Addition to Any General Annual Deductible, by Plan Type, 2013
Exhibit 7.22
‡ This includes enrollees who are required to pay the higher amount of either the copayment or coinsurance under the plan.
§ Information on separate deductibles for hospital admissions was collected only for HDHP/HRAs because federal regulations for HSA-qualified HDHPs make it unlikely these plans would have a separate deductible for specific services.
Note: As in past years, we collected information on the cost-sharing provisions for hospital admissions that are in addition to any general annual plan deductible. However, beginning with the 2009 survey, in order to better capture the prevalence of combinations of cost sharing, the survey was changed to ask a series of yes or no questions. Previously, the question asked respondents to select one response from a list of types of cost sharing, such as separate deductibles, copayments, coinsurance, and per diem payments (for hospitalization only). Due to the change in question format, the distribution of workers with types of cost sharing does not equal 100% as workers may face a combination of types of cost sharing. Zero percent of covered workers have an "other" type of cost sharing for a hospital admission.

section sevenEmployee Cost SharingEm
ployer Health B
enefits 20
13
An
nu
al S
urve
y
TH
E K
AIS
ER
FAM
ILY F
OU
ND
AT
ION
-AN
D- H
EA
LTH
RE
SE
AR
CH
& E
DU
CA
TIO
NA
L T
RU
ST
7
124
Separate Cost Sharing for an Outpatient Surgery Episode HMO PPO POS HDHP/SO§
ALL PLANS
Separate Annual Deductible for Outpatient Surgery 1% 3% 5% 0%* 2%Copayment and/or Coinsurance
Copayment 49* 12* 35* 4* 18Coinsurance 28* 71* 37* 69 62Both Copayment and Coinsurance‡ 5 7 6 1* 5
None 21 15 26 27* 19
Source: Kaiser/HRET Survey of Employer-Sponsored Health Benefits, 2013.
Note: As in past years, we collected information on the cost-sharing provisions for outpatient surgery that are in addition to any general annual plan deductible. However, beginning with the 2009 survey, in order to better capture the prevalence of combinations of cost sharing, the survey was changed to ask a series of yes or no questions. Previously, the question asked respondents to select one response from a list of types of cost sharing, such as separate deductibles, copayments, coinsurance, and per diem payments (for hospitalization only). Due to the change in question format, the distribution of workers with types of cost sharing does not equal 100% as workers may face a combination of types of cost sharing. Less than 1% of covered workers have an "other" type of cost sharing for an outpatient surgery.
§ Information on separate deductibles for outpatient surgery was collected only for HDHP/HRAs because federal regulations for HSA-qualified HDHPs make it unlikely these plans would have a separate deductible for specific services.
Distribution of Covered Workers with Separate Cost Sharing for an Outpatient Surgery Episode in Addition to Any General Annual Deductible, by Plan Type, 2013
Exhibit 7.23
‡ This includes enrollees who are required to pay the higher amount of either the copayment or coinsurance under the plan.
* Estimate is statistically different from All Plans estimate (p<.05).
Average
Copaym
entA
verage C
oinsuranceC
harge Per
Day
Separate Cost Sharing for a Hospital Adm
issionH
MO
$34819%
$276P
PO
25518
178*P
OS
24621*
350*H
DH
P/S
ON
SD
18N
SD
ALL PLANS$278
18%$264
Separate Cost Sharing for an O
utpatient Surgery EpisodeH
MO
$14819%
NA
PP
O119
18N
AP
OS
17720*
NA
HD
HP
/SO
NS
D19
NA
ALL PLANS$140
18%NA
Source: K
aiser/HR
ET S
urvey of Em
ployer-Sponsored H
ealth Benefits, 2013.
Note: The average separate annual deductible for hospital adm
ission is $436 and the average separate annual deductible for outpatient surgery is $726. In m
ost cases there w
ere too few observations to present the average estim
ates by plan type. The average am
ounts include workers w
ho may have a com
bination of types of cost sharing. A
ll Plans estim
ates are weighted by w
orkers in firms that
reported cost sharing. See the S
urvey Design and M
ethods section for more
information on w
eighting.
Among Covered W
orkers with Separate Cost Sharing for a Hospital
Admission or O
utpatient Surgery Episode in Addition to Any General
Annual Deductible, Average Cost Sharing, by Plan Type, 2013
Exhibit 7.24
* Estim
ate is statistically different from A
ll Plans estim
ate (p<.05).
NS
D: N
ot Sufficient D
ata.
NA
: Not A
pplicable. The survey did not offer “Charge P
er Day” (per diem
) as a response option for questions about separate cost sharing for each outpatient surgery episode.

Employer Health Benefits 2 0 1 3 An n u a l S u r vey
T H E K A I S E R FA M I LY F O U N D AT I O N - A N D - H E A LT H R E S E A R C H & E D U C AT I O N A L T R U S T
125
7
section
sevenE
mployee C
ost Sharing
Average Copayment
Average Coinsurance
Charge Per Day
Separate Cost Sharing for a Hospital Admission
HMO $348 19% $276PPO 255 18 178*POS 246 21* 350*HDHP/SO NSD 18 NSD
ALL PLANS $278 18% $264Separate Cost Sharing for an Outpatient Surgery Episode
HMO $148 19% NAPPO 119 18 NAPOS 177 20* NAHDHP/SO NSD 19 NA
ALL PLANS $140 18% NA
Source: Kaiser/HRET Survey of Employer-Sponsored Health Benefits, 2013.
Note: The average separate annual deductible for hospital admission is $436 and the average separate annual deductible for outpatient surgery is $726. In most cases there were too few observations to present the average estimates by plan type. The average amounts include workers who may have a combination of types of cost sharing. All Plans estimates are weighted by workers in firms that reported cost sharing. See the Survey Design and Methods section for more information on weighting.
Among Covered Workers with Separate Cost Sharing for a Hospital Admission or Outpatient Surgery Episode in Addition to Any General
Annual Deductible, Average Cost Sharing, by Plan Type, 2013
Exhibit 7.24
* Estimate is statistically different from All Plans estimate (p<.05).
NSD: Not Sufficient Data.
NA: Not Applicable. The survey did not offer “Charge Per Day” (per diem) as a response option for questions about separate cost sharing for each outpatient surgery episode.

section
sevenE
mployee C
ost SharingEmployer Health Benefits 2 0 1 3 An n u a l S u r vey
T H E K A I S E R FA M I LY F O U N D AT I O N - A N D - H E A LT H R E S E A R C H & E D U C AT I O N A L T R U S T
7
126
Copay Only Coinsurance Only
No Cost Sharing Other Type of Cost Sharing
Primary CareHMO 96%* 3%* 1%* 1%PPO 82* 15 2* 1POS 89* 4* 4 3HDHP/SO 22* 55* 22* 0
ALL PLANS 74% 20% 6% 1%Specialty Care
HMO 94%* 4%* 0%* 2%PPO 80* 15 2* 2POS 90* 5* 3 2HDHP/SO 18* 56* 22* 5
ALL PLANS 72% 20% 6% 2%
Exhibit 7.25
Note: In 2013, the survey includes questions on cost sharing for in-network services only. See the 2007 survey for information on out-of-network office visit cost sharing. Starting in 2010, the survey asked about the prevalence and cost of physician office visits separately for primary care and specialty care. Prior to the 2010 survey, if the respondent indicated the plan had a copayment for office visits, we assumed the plan had a copayment for both primary and specialty care visits. The survey did not allow for a respondent to report that a plan had a copayment for primary care visits and a coinsurance for visits with a specialist physician. The changes made in 2010 allowed for variations in the type of cost sharing for primary care and specialty care.
Source: Kaiser/HRET Survey of Employer-Sponsored Health Benefits, 2013.
In Addition to Any General Annual Plan Deductible, Percentage of Covered Workers with the Following Types of Cost Sharing for Physician Office Visits, by
Plan Type, 2013
* Estimate is statistically different from All Plans estimate (p<.05).

Employer Health Benefits 2 0 1 3 An n u a l S u r vey
T H E K A I S E R FA M I LY F O U N D AT I O N - A N D - H E A LT H R E S E A R C H & E D U C AT I O N A L T R U S T
127
7
section
sevenE
mployee C
ost Sharing
In-Network Office Visits HMO PPO POS HDHP/SO ALL PLANS
Primary Care Office VisitAverage Copay $22* $23 $24 $24 $23Average Coinsurance ‡ NSD 19% NSD 18% 18%
Specialty Care Office VisitAverage Copay $32* $35 $38 $36 $35Average Coinsurance‡ NSD 19% NSD 18% 19%
Note: The survey asks respondents if the plan has cost sharing for in-network office visits. In 2010, the survey asked about the prevalence and cost of physician office visits separately for primary care and specialty care. Prior to the 2010 survey if the respondent indicated the plan had a copayment for office visits, we assumed the plan had a copayment for both primary and specialty care visits. The survey did not allow for a respondent to report that a plan had a copayment for primary care visits and a coinsurance for visits with a specialist physician. The changes made in 2010 allowed for variations in the type of cost sharing for primary care and specialty care.
Among Covered Workers with Copayments and/or Coinsurance for In-Network Physician Office Visits, Average Copayments and Coinsurance, by Plan Type, 2013
Exhibit 7.26
Source: Kaiser/HRET Survey of Employer-Sponsored Health Benefits, 2013.
NSD: Not Sufficient Data.
* Estimate is statistically different from All Plans estimates (p<.05).
‡ In the 2012 survey, the structure of cost-sharing questions was revised to include coinsurance rates with a minimum or maximum dollar amount. For most plan types, the average coinsurance rate is not significantly different depending on whether it included a minimum, maximum, or neither. See the Survey Design and Methods section for more information.

section
sevenE
mployee C
ost SharingEmployer Health Benefits 2 0 1 3 An n u a l S u r vey
T H E K A I S E R FA M I LY F O U N D AT I O N - A N D - H E A LT H R E S E A R C H & E D U C AT I O N A L T R U S T
7
128
6%
4%
7%
6%
7%
12%
5%
14%
12%
15%
29%
28%
22%
27%
36%
27%
41%
22%
29%
21%
18%
18%
23%
18%
16%
8%
4%
12%
8%
5%
0% 10% 20% 30% 40% 50% 60% 70% 80% 90% 100%
All Plans
HDHP/SO
POS
PPO
HMO
$5 to less than $10 $10 to less than $15 $15 to less than $20 $20 to less than $25 $25 to less than $30 $30 or more
NOTE: Copayments for PPOs, POS plans, and HDHP/SOs are for in-network providers.
SOURCE: Kaiser/HRET Survey of Employer-Sponsored Health Benefits, 2013.
Exhibit 7.27Among Covered Workers with Copayments for a Physician Office Visit with a Primary Care Physician, Distribution of Copayments, by Plan Type, 2013

Employer Health Benefits 2 0 1 3 An n u a l S u r vey
T H E K A I S E R FA M I LY F O U N D AT I O N - A N D - H E A LT H R E S E A R C H & E D U C AT I O N A L T R U S T
129
7
section
sevenE
mployee C
ost Sharing
6%
2%
6%
6%
10%
27%
25%
16%
29%
23%
26%
32%
30%
23%
34%
21%
18%
20%
23%
18%
14%
17%
19%
13%
15%
6%
6%
8%
7%
1%
0% 10% 20% 30% 40% 50% 60% 70% 80% 90% 100%
All Plans
HDHP/SO
POS
PPO
HMO
$5 to less than $15 $15 to less than $25 $25 to less than $35 $35 to less than $45 $45 to less than $55 $55 or more
NOTE: Copayments for PPOs, POS plans, and HDHP/SOs are for in-network providers.
SOURCE: Kaiser/HRET Survey of Employer-Sponsored Health Benefits, 2013.
Exhibit 7.28Among Covered Workers with Copayments for a Physician Office Visit with a Specialty Care Physician, Distribution of Copayments, by Plan Type, 2013

section
sevenE
mployee C
ost SharingEmployer Health Benefits 2 0 1 3 An n u a l S u r vey
T H E K A I S E R FA M I LY F O U N D AT I O N - A N D - H E A LT H R E S E A R C H & E D U C AT I O N A L T R U S T
7
130
1%
1%
1%
2%
3%
3%
2%
22%
22%
23%
29%
36%
40%
43%
49%
55%
55%
57%
52%
51%
48%
47%
42%
21%
20%
17%
16%
10%
8%
6%
7%
2%
2%
2%
3%
1%
1%
1%
1%
0% 10% 20% 30% 40% 50% 60% 70% 80% 90% 100%
2013
2012
2011
2010*
2009
2008
2007
2006
$0 to Less than $10 $10 to Less than $20 $20 to Less than $30 $30 to Less than $40 $40 or More
* Distribution is statistically different from distribution for the previous year shown (p<.05).
SOURCE: Kaiser/HRET Survey of Employer-Sponsored Health Benefits, 2006-2013.
Exhibit 7.29Among Covered Workers with Copayments for a Physician Office Visit with a Primary Care Physician, Distribution of Copayments, 2006-2013

Employer Health Benefits 2 0 1 3 An n u a l S u r vey
T H E K A I S E R FA M I LY F O U N D AT I O N - A N D - H E A LT H R E S E A R C H & E D U C AT I O N A L T R U S T
131
7
section
sevenE
mployee C
ost Sharing
3%
3%
5%
5%
9%
10%
12%
14%
30%
33%
37%
39%
45%
52%
57%
58%
43%
43%
40%
42%
37%
31%
27%
25%
19%
17%
15%
11%
8%
6%
3%
4%
5%
3%
3%
3%
1%
0% 10% 20% 30% 40% 50% 60% 70% 80% 90% 100%
2013
2012
2011
2010*
2009*
2008*
2007
2006
$0 to Less than $15 $15 to Less than $30 $30 to Less than $45 $45 to Less than $60 $60 or More
* Distribution is statistically different from distribution for the previous year shown (p<.05).
SOURCE: Kaiser/HRET Survey of Employer-Sponsored Health Benefits, 2006-2013.
Exhibit 7.30Among Covered Workers with Copayments for a Physician Office Visit with a Specialty Care Physician, Distribution of Copayments, 2006-2013

section
sevenE
mployee C
ost SharingEmployer Health Benefits 2 0 1 3 An n u a l S u r vey
T H E K A I S E R FA M I LY F O U N D AT I O N - A N D - H E A LT H R E S E A R C H & E D U C AT I O N A L T R U S T
7
132
Single Coverage Family CoverageHMO 25%* 25%*PPO 11 11POS 15 16
ALL PLANS 12% 12%
Exhibit 7.31
Note: HSA-qualified HDHPs are required to have an annual maximum out-of-pocket liability of no more than $6,250 for single coverage and $12,500 for family coverage in 2013. HDHP/HRAs have no such requirement, and the percentages of covered workers in HDHP/HRAs with “No Limit” for annual out-of-pocket maximum for both single and family coverage are 9%.
Source: Kaiser/HRET Survey of Employer-Sponsored Health Benefits, 2013.
* Estimate is statistically different from All Plans estimate within coverage type (p<.05).
Percentage of Covered Workers without an Annual Out-of-Pocket Maximum for Single and Family Coverage, by Plan Type, 2013

Employer Health Benefits 2 0 1 3 An n u a l S u r vey
T H E K A I S E R FA M I LY F O U N D AT I O N - A N D - H E A LT H R E S E A R C H & E D U C AT I O N A L T R U S T
133
7
section
sevenE
mployee C
ost Sharing
HMO PPO POS HDHP/SO‡
General Annual Plan Deductible 45% 34% 16% 17%Any Additional Plan Deductibles NSD 68 NSD NSDPhysician Office Visit Copayments 44 76 47 88Physician Office Visit Coinsurance NSD 3 NSD <1Prescription Drug Cost Sharing 71 84 66 60
‡ Among HDHP/SO plans, questions other than “overall plan deductible” were asked only of HDHP/HRAs and not of HSA-qualified HDHPs. HSA-qualified HDHPs are required to apply most cost sharing to the out-of-pocket maximum. When HDHP/HRAs are considered exclusively, among covered workers with an annual out-of-pocket maximum, the percentage whose out-of-pocket maximum does not include certain services is as follows: any additional plan deductibles is NSD, office visit copayments is 88%, office visit coinsurance is <1%, and prescription drug cost sharing is 60%.
Note: This series of questions is asked if the plan has an out-of-pocket maximum for single or family coverage.
Source: Kaiser/HRET Survey of Employer-Sponsored Health Benefits, 2013.
Exhibit 7.32Among Covered Workers with an Annual Out-of-Pocket Maximum,
Percentage Whose Spending on Various Services Does Not Count Towards the Out-of-Pocket Maximum, by Plan Type, 2013
NSD: Not Sufficient Data.

section
sevenE
mployee C
ost SharingEmployer Health Benefits 2 0 1 3 An n u a l S u r vey
T H E K A I S E R FA M I LY F O U N D AT I O N - A N D - H E A LT H R E S E A R C H & E D U C AT I O N A L T R U S T
7
134
43%
33%
35%
6%
29%
26%
30%
34%
19%
27%
22%
19%
14%
28%
21%
4%
8%
4%
23%
10%
4%
6%
7%
18%
8%
1%
3%
5%
5%
4%
0% 10% 20% 30% 40% 50% 60% 70% 80% 90% 100%
HMO
PPO
POS
HDHP/SO
ALL PLANS
$1,999 or Less $2,000 - $2,999 $3,000 - $3,999 $4,000 - $4,999 $5,000 - $5,999 $6,000 or More
SOURCE: Kaiser/HRET Survey of Employer-Sponsored Health Benefits, 2013.
Exhibit 7.33Among Covered Workers with an Out-of-Pocket Maximum for Single Coverage, Distribution of Out-of-Pocket Maximums, by Plan Type, 2013

Employer Health Benefits 2 0 1 3 An n u a l S u r vey
T H E K A I S E R FA M I LY F O U N D AT I O N - A N D - H E A LT H R E S E A R C H & E D U C AT I O N A L T R U S T
135
7
section
sevenE
mployee C
ost Sharing
No LimitAggregate Amount
Separate Amount per Person
HMOAll Small Firms (3-199 Workers) 22% 65% 13%All Large Firms (200 or More Workers) 27 51 22
ALL FIRM SIZES 25% 56% 19%PPO
All Small Firms (3-199 Workers)* 17% 63% 20%All Large Firms (200 or More Workers)* 9 58 32
ALL FIRM SIZES 11% 60% 29%POS
All Small Firms (3-199 Workers) 10% 71% 20%All Large Firms (200 or More Workers) 24 64 11
ALL FIRM SIZES 16% 68% 16%HDHP/SO‡
All Small Firms (3-199 Workers)* 7% 86% 7%All Large Firms (200 or More Workers)* 3 78 19
ALL FIRM SIZES 4% 81% 15%ALL FIRMS
All Small Firms (3-199 Workers)* 14% 70% 16%All Large Firms (200 or More Workers)* 11 60 28
ALL FIRM SIZES 12% 63% 24%
‡ HSA-qualified HDHPs are required by law to have an annual maximum out-of-pocket liability of no more than $6,250 for single coverage and $12,500 for family coverage in 2013. When they are excluded from the calculation, the distribution of type of out-of-pocket maximum for HDHP/HRAs only is as follows: All Small Firms – 18% No Limit, 73% Aggregate Amount, and 9% Separate Amount per Person; All Large Firms – 5% No Limit, 70% Aggregate Amount, and 25% Separate Amount per Person; All Firm Sizes – 9% No Limit, 71% Aggregate Amount, and 20% Separate Amount per Person.
Note: The survey distinguished between plans that have a family aggregate out-of-pocket maximum that applies to spending by any covered person in the family or a separate per person out-of-pocket maximum that applies to spending by each family member or a limited number of family members. Among workers with an out-of-pocket maximum for family coverage, 75% of workers in HMOs, 67% in PPOs, 81% in POS plans, and 72% in All Plans have an aggregate out-of-pocket maximum.
Source: Kaiser/HRET Survey of Employer-Sponsored Health Benefits, 2013.
Exhibit 7.34Distribution of Type of Out-of-Pocket Maximum for Covered Workers with Family Coverage,
by Plan Type and Firm Size, 2013
* Distributions are statistically different beween All Small Firms and All Large Firms within plan type (p<.05).

section
sevenE
mployee C
ost SharingEmployer Health Benefits 2 0 1 3 An n u a l S u r vey
T H E K A I S E R FA M I LY F O U N D AT I O N - A N D - H E A LT H R E S E A R C H & E D U C AT I O N A L T R U S T
7
136
12%
1%
13%
14%
18%
17%
6%
24%
19%
27%
21%
18%
33%
21%
22%
16%
20%
11%
17%
16%
14%
19%
6%
14%
9%
4%
4%
1%
5%
4%
15%
32%
11%
10%
4%
0% 20% 40% 60% 80% 100%
All Plans
HDHP/SO*
POS
PPO
HMO
$1 to $2,499
$2,500 to $3,999
$4,000 to $5,499
$5,500 to $6,999
$7,000 to $8,499
$8,500 to $9,999
$10,000 or more
* Distribution is statistically different from All Plans distribution (p<.05). NOTE: Distributions are among covered workers facing a specified limit for out-of-pocket maximum amounts. HSA-qualified HDHPs are required by law to have an out-of-pocket maximum of no more than $6,250 for single coverage and $12,500 for family coverage in 2013. The survey distinguished between plans that have a family aggregate out-of-pocket maximum that applies to spending by any covered person in the family or a separate per person out-of-pocket maximum that applies to spending by each family member or a limited number of family members. SOURCE: Kaiser/HRET Survey of Employer-Sponsored Health Benefits, 2013.
Exhibit 7.35Among Covered Workers with an Aggregate Out-of-Pocket Maximum for Family Coverage, Distribution of Out-of-Pocket Maximums, by Plan Type, 2013

Employer Health Benefits 2 0 1 3 An n u a l S u r vey
T H E K A I S E R FA M I LY F O U N D AT I O N - A N D - H E A LT H R E S E A R C H & E D U C AT I O N A L T R U S T
137
7
section
sevenE
mployee C
ost Sharing
27%
6%
31%
30%
35%
34%
22%
35%
36%
33%
24%
44%
24%
21%
19%
6%
7%
8%
6%
7%
6%
14%
2%
5%
7%
3%
7%
3%
<1%
0% 20% 40% 60% 80% 100%
ALL PLANS
HDHP/SO
POS
PPO
HMO
$1,999 or Less $2,000-$2,999 $3,000-$3,999 $4,000-$4,999 $5,000-$5,999 $6,000 or More (with a Specified Limit)
NOTE: Distributions were not statistically different from the All Plans distribution. Distributions are among covered workers facing a specified limit for out-of-pocket maximum amounts. The survey distinguished between plans that have a family aggregate out-of-pocket maximum that applies to spending by any covered person in the family or a separate per person out-of-pocket maximum that applies to spending by each family member or a limited number of family members. SOURCE: Kaiser/HRET Survey of Employer-Sponsored Health Benefits, 2013.
Exhibit 7.36Among Covered Workers with a Separate Per Person Out-of-Pocket Maximum for Family Coverage, Distribution of Out-of-Pocket Maximums, by Plan Type, 2013

section
sevenE
mployee C
ost SharingEmployer Health Benefits 2 0 1 3 An n u a l S u r vey
T H E K A I S E R FA M I LY F O U N D AT I O N - A N D - H E A LT H R E S E A R C H & E D U C AT I O N A L T R U S T
7
138
46%
45%
59%
44%
42%
24%
11%
4%
29%
21%
23%
41%
12%
20%
29%
5%
22%
5%
7%
2%
2%
3%
2%
2%
0% 20% 40% 60% 80% 100%
All PLANS
HDHP/SO
POS
PPO
HMO
Two Three Total Family Spending No Maximum Number Other
NOTE: The survey distinguishes between plans that have a family aggregate out-of-pocket maximum that applies to spending by any covered person in the family or a separate out-of-pocket maximum that applies to spending by each family member or a limited number of family members. In 2012, the survey’s skip logic was edited so that firms who selected a separate out-of-pocket maximum were asked if they had a combined limit or if the limit was considered met when a specified number of family members reached their separate per-person limit. SOURCE: Kaiser/HRET Survey of Employer-Sponsored Health Benefits, 2013.
Exhibit 7.37Among Covered Workers with a Separate Per Person Out-of-Pocket Maximum for Family Coverage, Distribution of Number of Family Members Required to Meet the Maximum, by Plan Type, 2013

57%$16,3
51
$5,8
84
2013
Employer Health Benefits2 0 1 3 A N N U A L S U R V E Y
sect ion
High-Deductible Health Plans with Savings
Option
8
section
eigh
tH
igh-Deductible H
ealth Plans with Savings O
ptionEmployer Health Benefits 2 0 1 3 An n u a l S u r vey
T H E K A I S E R FA M I LY F O U N D AT I O N - A N D - H E A LT H R E S E A R C H & E D U C AT I O N A L T R U S T
8
140
Section Eight: High-Deductible Health Plans with Savings Option
Changes in law over the past few years have permitted the establishment of new types
of savings arrangements for health care. The two most common are health
reimbursement arrangements (HRAs) and health savings accounts (HSAs). HRAs and
HSAs are both financial accounts that workers or their family members can use to pay
for health care services. These savings arrangements are often (or, in the case of
HSAs, always) paired with health plans with high deductibles. The survey treats high-
deductible plans that can be paired with a savings option as a distinct plan type – High-
Deductible Health Plan with Savings Option (HDHP/SO) – even if the plan would
otherwise be considered a PPO, HMO, POS plan, or conventional health plan.
Specifically for the survey, HDHP/SOs are defined as (1) health plans with a deductible
of at least $1,000 for single coverage and $2,000 for family coverage1 offered with an
HRA (referred to as HDHP/HRAs); or (2) high-deductible health plans that meet the
federal legal requirements to permit an enrollee to establish and contribute to an HSA
(referred to as HSA-qualified HDHPs).2
Percentage of Firms Offering HDHP/HRAs and HSA-Qualified HDHPs, and Enrollment
Twenty-three percent of firms offering health benefits offer an HDHP/HRA or anHSA-qualified HDHP. Among firms offering health benefits, 6% offer an HDHP/HRA and 17% offer an HSA-qualified HDHP (Exhibit 8.1).
o Firms with 5,000 or more workers are significantly more likely to offer an
HDHP/SO than smaller firms. Forty-three percent of firms with 1,000 or more
1 There is no legal requirement for the minimum deductible in a plan offered with an HRA. The survey defines a high-deductible HRA plan as a plan with a deductible of at least $1,000 for single coverage and $2,000 for family coverage. Federal law requires a deductible of at least $1,250 for single coverage and $2,500 for family coverage for HSA-qualified HDHPs in 2013.See the Text Box for more information on HDHP/HRAs and HSA-qualified HDHPs. 2 The definitions of HDHP/SOs do not include other consumer-driven plan options, such as arrangements that combine an HRA with a lower-deductible health plan or arrangements in which an insurer (rather than the employer as in the case of HRAs or the enrollee as in the case of HSAs) establishes an account for each enrollee. Other arrangements may be included in future surveys as the market evolves.

Employer Health Benefits 2 0 1 3 An n u a l S u r vey
T H E K A I S E R FA M I LY F O U N D AT I O N - A N D - H E A LT H R E S E A R C H & E D U C AT I O N A L T R U S T
141
8
section
eigh
tH
igh-Deductible H
ealth Plans with Savings O
ption
workers offer an HDHP/SO, compared to 22% of firms with 3 to 199 workers, 39% of firms with 200-999 workers (Exhibit 8.2).
Twenty percent of covered workers are enrolled in an HDHP/SO in 2013, similar to the 19% enrolled last year (Exhibit 8.5). Enrollment in HDHP/SOs had increased significantly in previous years (17% in 2011; 13% in 2010; 8% in 2009).
o Nine percent of covered workers are enrolled in HDHP/HRAs in 2013, and 11%percent of covered workers are enrolled in HSA-qualified HDHPs (Exhibit 8.5).
Plan Deductibles
As expected, workers enrolled in HDHP/SOs have higher deductibles than workers enrolled in HMOs, PPOs, or POS plans.
Health Reimbursement Arrangements (HRAs) are medical care reimbursement plans established by employers that can be used by employees to pay for health care. HRAs are funded solely by employers. Employers typically commit to make a specified amount of money available in the HRA for premiums and medical expenses incurred by employees or their dependents. HRAs are accounting devices, and employers are not required to expend funds until an employee incurs expenses that would be covered by the HRA. Unspent funds in the HRA usually can be carried over to the next year (sometimes with a limit). Employees cannot take their HRA balances with them if they leave their job, although an employer can choose to make the remaining balance available to former employees to pay for health care.
HRAs often are offered along with a high-deductible health plan (HDHP). In such cases, the employee pays for health care first from his or her HRA and then out-of-pocket until the health plan deductible is met. Sometimes certain preventive services or other services such as prescription drugs are paid for by the plan before the employee meets the deductible.
Health Savings Accounts (HSAs) are savings accounts created by individuals to pay for health care. An individual may establish an HSA if he or she is covered by a “qualified health plan” which is a plan with a high deductible (i.e., a deductible of at least $1,250 for single coverage and $2,500 for family coverage in 2013) that also meets other requirements.1
Employers can encourage their employees to create HSAs by offering an HDHP that meets the federal requirements. Employers in some cases also may assist their employees by identifying HSA options, facilitating applications, or negotiating favorable fees from HSA vendors.
Both employers and employees can contribute to an HSA, up to the statutory cap of $3,250 for single coverage and $6,450 for family coverage in 2013. Employee contributions to the HSA are made on a pre-income tax basis, and some employers arrange for their employees to fund their HSAs through payroll deductions. Employers are not required to contribute to HSAs established by their employees but, if they elect to do so, their contributions are not taxable to the employee. Interest and other earnings on amounts in an HSA are not taxable. Withdrawals from the HSA by the account owner to pay for qualified health care expenses are not taxed. The savings account is owned by the individual who creates the account, so employees retain their HSA balances if they leave their job.
1 See U.S. Department of the Treasury, Health Savings Accounts, available at http://www.irs.gov/pub/irs-drop/rp-12-26.pdf

section
eigh
tH
igh-Deductible H
ealth Plans with Savings O
ptionEmployer Health Benefits 2 0 1 3 An n u a l S u r vey
T H E K A I S E R FA M I LY F O U N D AT I O N - A N D - H E A LT H R E S E A R C H & E D U C AT I O N A L T R U S T
8
142
o The average general annual deductible for single coverage is $1,854 for HDHP/HRAs and $2,098 for HSA-qualified HDHPs (Exhibit 8.7). These averages are similar to the amounts reported in recent years. There is wide variation around these averages (Exhibit 8.9). Eighteen percent of covered workers are enrolled in a HDHP/SO with a deductible of $3,000 or more.
Since 2006, the survey has collected information on two types of family deductibles. The survey asks employers whether the family deductible amount is (1) an aggregate amount (i.e., the out-of-pocket expenses of all family members are counted until the deductible is satisfied), or (2) a per-person amount that applies to each family member (typically with a limit on the number of family members that would be required to meet the deductible amount).
o The average aggregate deductibles for workers with family coverage are $4,059 for HDHP/HRAs and $4,037 for HSA-qualified HDHPs (Exhibit 8.7). There is wide variation around these average amounts for family coverage (Exhibit 8.1).Almost a third of covered workers enrolled in HDHP/So plans have an aggregate family deductible of $5,000 dollars or more.
Out-of-Pocket Maximum Amounts
HSA-qualified HDHPs are legally required to have a maximum annual out-of-pocket liability of no more than $6,250 for single coverage and $12,500 for family coverage in 2013. HDHP/HRAs have no similar requirement.
o The average annual out-of-pocket maximum for single coverage is $4,093 for HDHP/HRAs3 and $3,509 for HSA-qualified HDHPs (Exhibit 8.7).
o As with deductibles, the survey asks employers whether the family out-of-pocket maximum liability is (1) an aggregate amount that applies to spending by any covered person in the family, or (2) a separate per person amount that applies to spending by each family member or a limited number of family members. The survey also asks whether spending by enrollees on various services counts towards meeting the plan out-of-pocket maximum.
o Among covered workers with family coverage whose out-of-pocket maximum is an aggregate amount that applies to spending by any covered person in the family, the average annual out-of-pocket maximums are $8,886 for HDHP/HRAs and $7,077 for HSA-qualified HDHPs (Exhibit 8.7).
Premiums
In 2013, the average annual premiums for HDHP/HRAs are $5,655 for single coverage and $16,477 for family coverage (Exhibit 8.8).
3 The average out-of-pocket maximum for HDHP/HRAs is calculated for plans with an out-of-pocket maximum. About 9% of covered workers in HDHP/HRAs with single coverage or family coverage are in plans that reported having no limit on out-of-pocket expenses.

Employer Health Benefits 2 0 1 3 An n u a l S u r vey
T H E K A I S E R FA M I LY F O U N D AT I O N - A N D - H E A LT H R E S E A R C H & E D U C AT I O N A L T R U S T
143
8
section
eigh
tH
igh-Deductible H
ealth Plans with Savings O
ption
The average annual premium for workers in HSA-qualified HDHPs is $5,006 for single coverage and $14,155 for family coverage. These amounts are lower than the average single and family premium for workers in plans that are not HDHP/SOs (Exhibit 8.7).
Worker Contributions to Premiums
The average annual worker contributions to premiums for workers enrolled in HDHP/HRAs are $1,058 for single coverage and $4,087 for family coverage (Exhibit 8.8).
The average annual worker contributions to premiums for workers in HSA-qualified HDHPs are $726 for single coverage and $3,241 for family coverage (Exhibit 8.8). The average contribution for single coverage for workers in HSA-qualified HDHPs is significantly less than the average premium contribution made by covered workers in plans that are not HDHP/SOs (Exhibit 8.7).
Employer Contributions to Premiums and Savings Options
Employers contribute to HDHP/SOs in two ways: through their contributions toward the premium for the health plan and through their contributions (if any, in the case of HSAs) to the savings account option (i.e., the HRAs or HSAs themselves).
o Looking just at the annual employer contributions to premiums, covered workers in HDHP/HRAs on average receive employer contributions of $4,597 for single coverage and $12,390 for family coverage. The average employer contribution for single coverage in HDHP/HRAs is significantly less than the average employer premium contribution for plans that are not HDHP/SOs (Exhibit 8.8).
o The average annual employer contributions to premiums for workers in HSA-qualified HDHPs are $4,280 for single coverage and $10,914 for family coverage. These amounts are lower than the average contributions for single or family coverage for workers in plans that are not HDHP/SOs (Exhibit 8.8).
When looking at employer contributions to the savings option, workers enrolled in HDHP/HRAs receive, on average, an annual employer contribution to their HRA of $947 for single coverage and $1,800 for family coverage (Exhibit 8.8).
o HRAs are generally structured in such a way that employers may not actually spend the whole amount that they make available to their employees’ HRAs.4Amounts committed to an employee’s HRA that are not used by the employee generally roll over and can be used in future years, but any balance may revert back to the employer if the employee leaves his or her job. Thus, the employer
4 In the survey, we ask, “Up to what dollar amount does your firm promise to contribute each year to an employee’s HRA or health reimbursement arrangement for single coverage?” We refer to the amount that the employer commits to make available to an HRA as a contribution for ease of discussion. As discussed, HRAs are notional accounts, and employers are not required to actually transfer funds until an employee incurs expenses. Thus, employers may not expend the entire amount that they commit to make available to their employees through an HRA.
section
eigh
tH
igh-Deductible H
ealth Plans with Savings O
ptionEmployer Health Benefits 2 0 1 3 An n u a l S u r vey
T H E K A I S E R FA M I LY F O U N D AT I O N - A N D - H E A LT H R E S E A R C H & E D U C AT I O N A L T R U S T
8
144
contribution amounts to HRAs that we capture in the survey may exceed the amount that employers will actually spend.
Workers enrolled in HSA-qualified HDHPs on average receive an annual employer contribution to their HSA of $653 for single coverage and $1,150 for family coverage (Exhibit 8.8).
o In some cases, employers that sponsor HSA-qualified HDHP/SOs do not make contributions to HSAs established by their employees. Fifty-one percent of employers offering single coverage and fifty percent offering family coverage through HSA-qualified HDHPs do not make contributions towards the HSAs that their workers establish (Exhibit 8.8). Thirty-one percent of workers with single coverage and thirty-two percent of workers with family coverage in an HSA-qualified HDHP do not receive an account contribution from their employer (Exhibit 8.14 and Exhibit 8.15).
o The percent of covered workers enrolled in a plan where the employer makes no HSA contribution for single coverage is similar to 34% last year and 26% five years ago.
o The average HSA contributions reported above include the portion of covered workers whose employer contribution to the HSA is zero. When those firms that do not contribute to the HSA are excluded from the calculation, the average employer contribution for covered workers is $950 for single coverage and $1,680 for family coverage (Exhibit 8.7).
Employer contributions to savings account options (i.e., the HRAs and HSAs themselves) for their employees can be added to their health plan premium contributions to calculate total employer contributions toward HDHP/SOs.
o For HDHP/HRAs, the average annual total employer contribution for covered workers is $5,544 for single coverage and $14,190 for family coverage. The average total employer contribution amounts for single and family coverage in HDHP/HRAs are higher than the average amount that employers contribute towards single and family coverage in health plans that are not HDHP/SOs (Exhibit 8.8).
o For HSA-qualified HDHPs, the average annual total employer contribution for covered workers is $4,931 for single coverage and $12,065 for workers with family coverage. The total amounts contributed for workers in HSA-qualified HDHPs for single and family coverage are similar to the amounts contributed for workers not in HDHP/SOs (Exhibit 8.8).

Employer Health Benefits 2 0 1 3 An n u a l S u r vey
T H E K A I S E R FA M I LY F O U N D AT I O N - A N D - H E A LT H R E S E A R C H & E D U C AT I O N A L T R U S T
145
8
section
eigh
tH
igh-Deductible H
ealth Plans with Savings O
ption
* Estimate is statistically different from estimate for the previous year shown (p<.05).‡ The 2013 estimate includes 1.0% of all firms offering health benefits that offer both an HDHP/HRA and an HSA-qualified HDHP. The comparable percentages for previous years are: 2005 [0.3%], 2006 [0.4%], 2007 [0.2%], 2008 [0.3%], 2009 [<0.1%], 2010 [0.3%], 2011[1.8%], and 2012[0.6%]. SOURCE: Kaiser/HRET Survey of Employer-Sponsored Health Benefits, 2005-2013.
Exhibit 8.1Among Firms Offering Health Benefits, Percentage That Offer an HDHP/HRA and/or an HSA-Qualified HDHP, 2005-2013
2% 2%4%
1%
6%* 7%3%
7%10%
3%
10%13%
2%
10% 11%
4%
12%15%
7%
18%
23%
5%
26%
31%
6%
17%
23%
0%
5%
10%
15%
20%
25%
30%
35%
40%
45%
50%
HDHP/HRA HSA-Qualified HDHP Either HDHP/HRA or HSA- Qualified HDHP‡
2005 2006 2007 2008 2009 2010 2011 2012 2013

section
eigh
tH
igh-Deductible H
ealth Plans with Savings O
ptionEmployer Health Benefits 2 0 1 3 An n u a l S u r vey
T H E K A I S E R FA M I LY F O U N D AT I O N - A N D - H E A LT H R E S E A R C H & E D U C AT I O N A L T R U S T
8
146
22%
39%
43%
23%
0%
5%
10%
15%
20%
25%
30%
35%
40%
45%
50%
3-199 Workers* 200-999 Workers* 1,000 or More Workers* All Firms
* Estimates are statistically different from all other firms not in the indicated size category (p<.05).NOTE: The 2013 estimate includes 1.0% of all firms offering health benefits that offer both an HDHP/HRA and an HSA-qualified HDHP. SOURCE: Kaiser/HRET Survey of Employer-Sponsored Health Benefits, 2013.
Exhibit 8.2Among Firms Offering Health Benefits, Percentage That Offer an HDHP/SO, by Firm Size, 2013

Employer Health Benefits 2 0 1 3 An n u a l S u r vey
T H E K A I S E R FA M I LY F O U N D AT I O N - A N D - H E A LT H R E S E A R C H & E D U C AT I O N A L T R U S T
147
8
section
eigh
tH
igh-Deductible H
ealth Plans with Savings O
ption
4% 4%
8%7%5%
16%*
10%13%*
18%
13%15%
21%
11%
18%
26%*
15%
21%
32%
23%26%
41%*
31%33%
40%
22%
39%
43%
0%
5%
10%
15%
20%
25%
30%
35%
40%
45%
50%
3-199 Workers 200-999 Workers 1,000 or More Workers
2005 2006 2007 2008 2009 2010 2011 2012 2013
* Estimate is statistically different from estimate for the previous year shown (p<.05).NOTE: The 2013 estimate includes 1.0% of all firms offering health benefits that offer both an HDHP/HRA and an HSA-qualified HDHP. The comparable percentages for previous years are: 2005 [0.3%], 2006 [0.4%], 2007 [0.2%], 2008 [0.3%], 2009 [<0.1%], 2010 [0.3%], 2011[1.8%], and 2012[0.6%]. SOURCE: Kaiser/HRET Survey of Employer-Sponsored Health Benefits, 2005-2013.
Exhibit 8.3Among Firms Offering Health Benefits, Percentage That Offer an HDHP/SO, by Firm Size, 2005-2013

section eightHigh-Deductible Health Plans with Savings OptionEm
ployer Health B
enefits 20
13
An
nu
al S
urve
y
TH
E K
AIS
ER
FAM
ILY F
OU
ND
AT
ION
-AN
D- H
EA
LTH
RE
SE
AR
CH
& E
DU
CA
TIO
NA
L T
RU
ST
8
148
2006 2007 2008 2009 2010 2011 2012 2013FIRM SIZE
3-24 Workers 6% 6% 11% 9% 16% 24% 25% 23%25-199 Workers 4 9* 14 15 16 23 23 20200-999 Workers 2 4* 5 7 10 14 19 181,000-4,999 Workers 3 5 5 8 10 14 14 175,000 or More Workers 4 4 4 5 13* 16 17 20
All Small Firms (3-199 Workers) 5% 8% 13%* 13% 16% 23%* 24% 21%All Large Firms (200 or More Workers) 3% 4% 5% 6% 12%* 15% 17% 19%
ALL FIRMS 4% 5% 8%* 8% 13%* 17%* 19% 20%
Source: Kaiser/HRET Survey of Employer-Sponsored Health Benefits, 2006-2013.
Exhibit 8.4Percentage of Covered Workers Enrolled in an HDHP/SO, 2006-2013
* Estimate is statistically different from estimate for the previous year shown (p<.05).

Employer Health Benefits 2 0 1 3 An n u a l S u r vey
T H E K A I S E R FA M I LY F O U N D AT I O N - A N D - H E A LT H R E S E A R C H & E D U C AT I O N A L T R U S T
149
8
section
eigh
tH
igh-Deductible H
ealth Plans with Savings O
ption2% 2%
4%3% 3%
5%
3%4%*
8%*
3%
6%
8%7%*
6%
13%*
8%9%*
17%*
8%
11%
19%
9%
11%
20%
0%
5%
10%
15%
20%
25%
HDHP/HRA HSA-Qualified HDHP HDHP/SO
2006 2007 2008 2009 2010 2011 2012 2013
* Estimate is statistically different from estimate for the previous year shown (p<.05). SOURCE: Kaiser/HRET Survey of Employer-Sponsored Health Benefits, 2006-2013.
Exhibit 8.5Percentage of Covered Workers Enrolled in an HDHP/HRA or HSA-Qualified HDHP, 2006-2013

section
eigh
tH
igh-Deductible H
ealth Plans with Savings O
ptionEmployer Health Benefits 2 0 1 3 An n u a l S u r vey
T H E K A I S E R FA M I LY F O U N D AT I O N - A N D - H E A LT H R E S E A R C H & E D U C AT I O N A L T R U S T
8
150
9%
12%
21%
9%10%
19%
9%
11%
20%
0%
5%
10%
15%
20%
25%
HDHP/HRA HSA-Qualified HDHP HDHP/SO
All Small Firms (3-199 Workers) All Large Firms (200 or More Workers) All Firms
* Estimates are statistically different between All Small Firms and All Large Firms within each category (p<.05). SOURCE: Kaiser/HRET Survey of Employer-Sponsored Health Benefits, 2013.
Exhibit 8.6Percentage of Covered Workers Enrolled in an HDHP/HRA or HSA-Qualified HDHP, by Firm Size, 2013

Employer Health Benefits 2 0 1 3 An n u a l S u r vey
T H E K A I S E R FA M I LY F O U N D AT I O N - A N D - H E A LT H R E S E A R C H & E D U C AT I O N A L T R U S T
151
8
section
eigh
tH
igh-Deductible H
ealth Plans with Savings O
ption
Annual Plan Averages for: Single Family Single FamilyPremium $5,655 $16,477 $5,006 $14,155 Worker Contribution to Premium $1,058 $4,087 $726 $3,241 General Annual Deductible‡ $1,854 $4,059 $2,098 $4,037 Out-of-Pocket Maximum Liability‡ $4,093 $8,886 $3,509 $7,077 Firm Contribution to the HRA or HSA§ $947 $1,800 $653 $1,150
Exhibit 8.7
Source: Kaiser/HRET Survey of Employer-Sponsored Health Benefits, 2013.
HDHP/HRA and HSA-Qualified HDHP Features for Covered Workers, 2013
‡ Nine percent of workers enrolled in HDHP/HRAs have employers that reported no out-of-pocket maximum for single coverage and family coverage. These workers are excluded from the HDHP/HRA out-of-pocket maximum liability calculation. The deductible and out-of-pocket maximum averages shown for both HDHP/HRAs and HSA-qualified HDHPs for family coverage are for covered workers whose firms report that they face an aggregate amount. Among covered workers in HDHP/HRAs, 20% are in plans whose family deductible is a separate per person amount and 20% are in a plan where the family out-of-pocket maximum is a separate per person amount. Among covered workers in HSA-qualified HDHPs, the percentages are 14% for deductibles and 12% for out-of-pocket maximums.
HDHP/HRA HSA-Qualified HDHP
§ When those firms that do not contribute to the HSA (51% for single coverage and 50% for family) are excluded from the calculation, the average firm contribution to the HSA for covered workers is $950 for single coverage and $1,680 for family coverage. For HDHP/HRAs, we refer to the amount that the employer commits to make available to an HRA as a contribution for ease of discussion. HRAs are notional accounts, and employers are not required to actually transfer funds until an employee incurs expenses. Thus, employers may not expend the entire amount that they commit to make available to their employees through an HRA. Therefore, the employer contribution amounts to HRAs that we capture in the survey may exceed the amount that employers will actually spend.
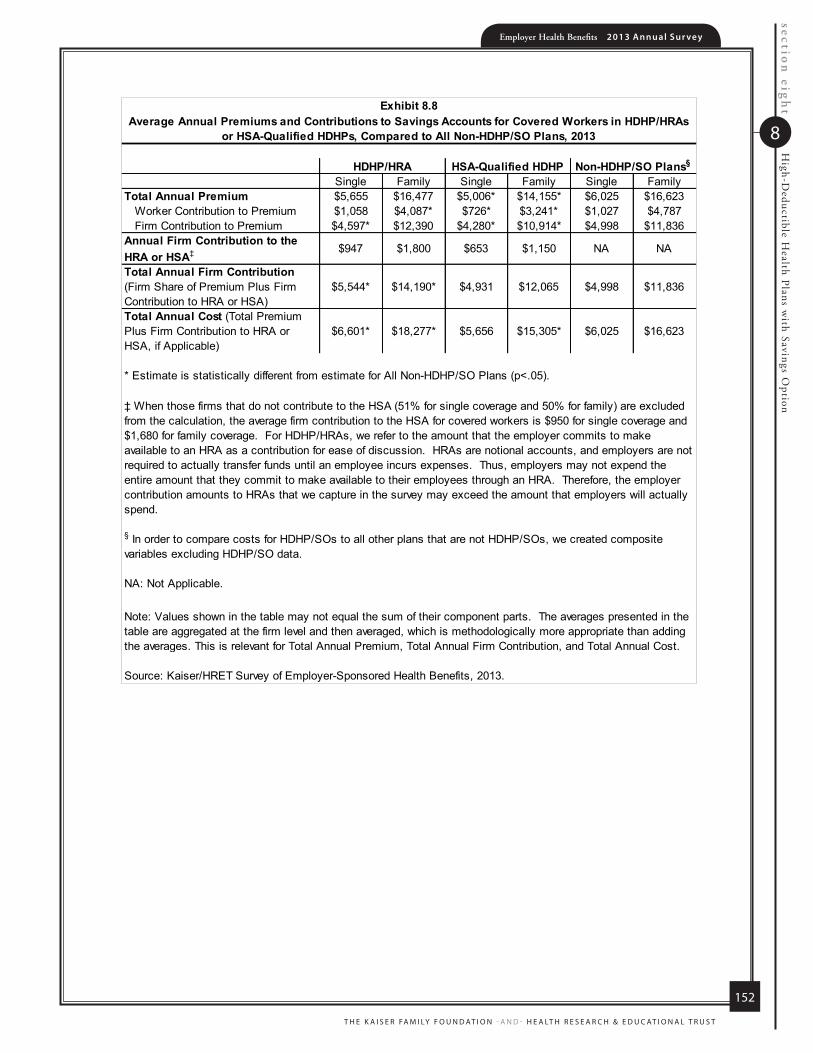
section
eigh
tH
igh-Deductible H
ealth Plans with Savings O
ptionEmployer Health Benefits 2 0 1 3 An n u a l S u r vey
T H E K A I S E R FA M I LY F O U N D AT I O N - A N D - H E A LT H R E S E A R C H & E D U C AT I O N A L T R U S T
8
152
Single Family Single Family Single FamilyTotal Annual Premium $5,655 $16,477 $5,006* $14,155* $6,025 $16,623
Worker Contribution to Premium $1,058 $4,087* $726* $3,241* $1,027 $4,787Firm Contribution to Premium $4,597* $12,390 $4,280* $10,914* $4,998 $11,836
Annual Firm Contribution to the HRA or HSA‡ $947 $1,800 $653 $1,150 NA NA
Total Annual Firm Contribution (Firm Share of Premium Plus Firm Contribution to HRA or HSA)
$5,544* $14,190* $4,931 $12,065 $4,998 $11,836
Total Annual Cost (Total Premium Plus Firm Contribution to HRA or HSA, if Applicable)
$6,601* $18,277* $5,656 $15,305* $6,025 $16,623
Source: Kaiser/HRET Survey of Employer-Sponsored Health Benefits, 2013.
§ In order to compare costs for HDHP/SOs to all other plans that are not HDHP/SOs, we created composite variables excluding HDHP/SO data.
Note: Values shown in the table may not equal the sum of their component parts. The averages presented in the table are aggregated at the firm level and then averaged, which is methodologically more appropriate than adding the averages. This is relevant for Total Annual Premium, Total Annual Firm Contribution, and Total Annual Cost.
NA: Not Applicable.
‡ When those firms that do not contribute to the HSA (51% for single coverage and 50% for family) are excluded from the calculation, the average firm contribution to the HSA for covered workers is $950 for single coverage and $1,680 for family coverage. For HDHP/HRAs, we refer to the amount that the employer commits to make available to an HRA as a contribution for ease of discussion. HRAs are notional accounts, and employers are not required to actually transfer funds until an employee incurs expenses. Thus, employers may not expend the entire amount that they commit to make available to their employees through an HRA. Therefore, the employer contribution amounts to HRAs that we capture in the survey may exceed the amount that employers will actually spend.
* Estimate is statistically different from estimate for All Non-HDHP/SO Plans (p<.05).
HDHP/HRA HSA-Qualified HDHP
Exhibit 8.8
Non-HDHP/SO Plans§
Average Annual Premiums and Contributions to Savings Accounts for Covered Workers in HDHP/HRAs or HSA-Qualified HDHPs, Compared to All Non-HDHP/SO Plans, 2013

Employer Health Benefits 2 0 1 3 An n u a l S u r vey
T H E K A I S E R FA M I LY F O U N D AT I O N - A N D - H E A LT H R E S E A R C H & E D U C AT I O N A L T R U S T
153
8
section
eigh
tH
igh-Deductible H
ealth Plans with Savings O
ption
NOTE: The minimum annual single deductible for workers enrolled in HSA-qualified HDHPs is $1,250 in 2013 according to federal regulation. Therefore, the distribution for HSA-qualified HDHPs starts at $1,250. SOURCE: Kaiser/HRET Survey of Employer-Sponsored Health Benefits, 2013.
Exhibit 8.9Distribution of Covered Workers with the Following General Annual Deductible Amounts for Single Coverage, HSA-Qualified HDHPs and HDHP/HRAs, 2013
17%
23%
20%
30%
24%
27%
38%
34%
35%
15%
19%
18%
0% 10% 20% 30% 40% 50% 60% 70% 80% 90% 100%
HDHP/HRA
HSA-Qualified HDHP
HDHP/SO
$1,000-$1,499 $1,500-$1,999 $2,000-$2,999 $3,000 or More
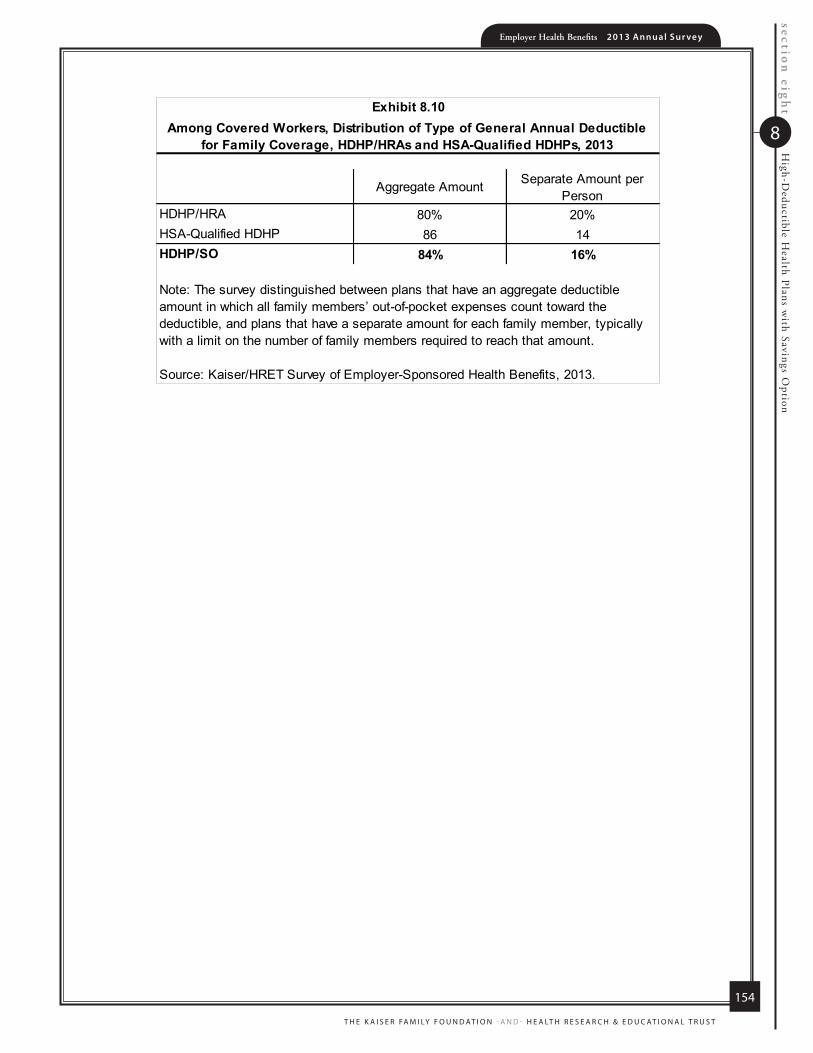
section
eigh
tH
igh-Deductible H
ealth Plans with Savings O
ptionEmployer Health Benefits 2 0 1 3 An n u a l S u r vey
T H E K A I S E R FA M I LY F O U N D AT I O N - A N D - H E A LT H R E S E A R C H & E D U C AT I O N A L T R U S T
8
154
Aggregate Amount Separate Amount per Person
HDHP/HRA 80% 20%HSA-Qualified HDHP 86 14HDHP/SO 84% 16%
Note: The survey distinguished between plans that have an aggregate deductible amount in which all family members’ out-of-pocket expenses count toward the deductible, and plans that have a separate amount for each family member, typically with a limit on the number of family members required to reach that amount.
Source: Kaiser/HRET Survey of Employer-Sponsored Health Benefits, 2013.
Among Covered Workers, Distribution of Type of General Annual Deductible for Family Coverage, HDHP/HRAs and HSA-Qualified HDHPs, 2013
Exhibit 8.10

Employer Health Benefits 2 0 1 3 An n u a l S u r vey
T H E K A I S E R FA M I LY F O U N D AT I O N - A N D - H E A LT H R E S E A R C H & E D U C AT I O N A L T R U S T
155
8
section
eigh
tH
igh-Deductible H
ealth Plans with Savings O
ption
10%
4%
8%
21%
16%
35%
32%
33%
15%
17%
17%
31%
30%
31%
0% 10% 20% 30% 40% 50% 60% 70% 80% 90% 100%
HDHP/HRA
HSA-Qualified HDHP
HDHP/SO
$2,000-$2,499 $2,500-$2,999 $3,000-$3,999 $4,000-$4,999 $5,000 or More
NOTE: The survey distinguished between family deductibles that are an aggregate amount in which all family members’ out-of-pocket expenses count toward the deductible, and plans that have a separate amount for each family member, typically with a limit on the number of family members required to reach that amount. The minimum annual family deductible for workers enrolled in HSA-qualified HDHP is $2,500 in 2013 according to federal regulation. Therefore, the distribution for HSA-qualified HDHPs starts at $2,500.SOURCE: Kaiser/HRET Survey of Employer-Sponsored Health Benefits, 2013.
Exhibit 8.11Distribution of Covered Workers with the Following Aggregate Family Deductible Amounts, HDHP/HRAs and HSA-Qualified HDHPs, 2013

section
eigh
tH
igh-Deductible H
ealth Plans with Savings O
ptionEmployer Health Benefits 2 0 1 3 An n u a l S u r vey
T H E K A I S E R FA M I LY F O U N D AT I O N - A N D - H E A LT H R E S E A R C H & E D U C AT I O N A L T R U S T
8
156
Physician Office Visits for Primary
CarePrescription Drugs
All Small Firms (3-199 Workers) 72% 77% All Large Firms (200 or More Workers) 49% 73%ALL FIRMS 56% 74%
Exhibit 8.12Percentage of Covered Workers with Coverage for the Following Services Without
Having to First Meet the Deductible, HDHP/HRAs, by Firm Size, 2013
Note: Only firms with HDHP/HRAs were asked about physician office visits for primary care or prescription drugs. HSA-qualified HDHPs are required by law to apply the plan deductible to nearly all services.
Source: Kaiser/HRET Survey of Employer-Sponsored Health Benefits, 2013.

Employer Health Benefits 2 0 1 3 An n u a l S u r vey
T H E K A I S E R FA M I LY F O U N D AT I O N - A N D - H E A LT H R E S E A R C H & E D U C AT I O N A L T R U S T
157
8
section
eigh
tH
igh-Deductible H
ealth Plans with Savings O
ption
69%
55%
62%
0%
10%
20%
30%
40%
50%
60%
70%
80%
90%
100%
HDHP/HRA HSA-Qualified HDHP HDHP/SO
NOTE: For definitions of Self-Funded and Fully Insured Plans, see the introduction to Section 10.SOURCE: Kaiser/HRET Survey of Employer-Sponsored Health Benefits, 2013.
Exhibit 8.13Percentage of Covered Workers in Partially or Fully Self-Funded HDHP/HRAs and HSA-Qualified HDHPs, 2013

section
eigh
tH
igh-Deductible H
ealth Plans with Savings O
ptionEmployer Health Benefits 2 0 1 3 An n u a l S u r vey
T H E K A I S E R FA M I LY F O U N D AT I O N - A N D - H E A LT H R E S E A R C H & E D U C AT I O N A L T R U S T
8
158
31% 14%
20%
22%
22%
11%
16%
4%
20%
9%
7%
10%
15%
0% 10% 20% 30% 40% 50% 60% 70% 80% 90% 100%
HSA-Qualified HDHP
HDHP/HRA
$0 $1-$399 $400-$699 $700-$999 $1,000-$1,199 $1,200 to $1,599 $1,600 or More
NOTE: For single coverage, 51% of employers offering HSA-qualified HDHPs (covering 31% of workers enrolled in these plans) do not make contributions towards the HSAs that their workers establish.SOURCE: Kaiser/HRET Survey of Employer-Sponsored Health Benefits, 2013.
Exhibit 8.14Distribution of Covered Workers with the Following Annual Employer Contributions to their HRA or HSA, for Single Coverage, 2013

Employer Health Benefits 2 0 1 3 An n u a l S u r vey
T H E K A I S E R FA M I LY F O U N D AT I O N - A N D - H E A LT H R E S E A R C H & E D U C AT I O N A L T R U S T
159
8
section
eigh
tH
igh-Deductible H
ealth Plans with Savings O
ption
32% 13%
23%
28%
22%
13%
36%
4%
4%
10%
15%
0% 10% 20% 30% 40% 50% 60% 70% 80% 90% 100%
HSA-Qualified HDHP
HDHP/HRA
$0 $1-$749 $750-$1,499 $1,500-$2,249 $2,250-$2,999 $3,000 or More
NOTE: For family coverage, 50% of employers offering HSA-qualified HDHPs (covering 32% of workers enrolled in these plans) do not make contributions towards the HSAs that their workers establish. SOURCE: Kaiser/HRET Survey of Employer-Sponsored Health Benefits, 2013.
Exhibit 8.15Distribution of Covered Workers with the Following Annual Employer Contributions to their HRA or HSA, for Family Coverage, 2013

section
eigh
tH
igh-Deductible H
ealth Plans with Savings O
ptionEmployer Health Benefits 2 0 1 3 An n u a l S u r vey
T H E K A I S E R FA M I LY F O U N D AT I O N - A N D - H E A LT H R E S E A R C H & E D U C AT I O N A L T R U S T
8
160
Contribution Range, Relative to Average HRA Contribution
Contribution Range, Dollar Amount
Percentage of Covered
Workers in Range
Contribution Range, Dollar Amount
Percentage of Covered
Workers in Range
Less than 80% Less than $757 52% Less than $1,440 45%80% to Less Than Average $757 to <$947 5% $1,440 to <$1,800 16%Average to Less Than 120% $947 to <$1,136 20% $1,800 to <$2,160 19%120% or More $1,136 or more 23% $2,160 or More 21%
Source: Kaiser/HRET Survey of Employer-Sponsored Health Benefits, 2013.
Family CoverageSingle Coverage
Distribution of Firm Contributions to the HRA for Single and Family Coverage Relative to the Average Annual Firm Contribution to the HRA, 2013
Exhibit 8.16
Note: The average annual firm contribution to the HRA is $947 for single coverage and $1,800 for family coverage. The HRA account contribution distribution is relative to the average single or family account contribution. For example, $757 is 80% of the average single HRA account contribution and $1,136 is 120% of the average single HRA account contribution. The same break points relative to the average are used for the distribution for family coverage.

Employer Health Benefits 2 0 1 3 An n u a l S u r vey
T H E K A I S E R FA M I LY F O U N D AT I O N - A N D - H E A LT H R E S E A R C H & E D U C AT I O N A L T R U S T
161
8
section
eigh
tH
igh-Deductible H
ealth Plans with Savings O
ption
Contribution Range, Relative to Average HSA Contribution
Contribution Range, Dollar Amount
Percentage of Covered
Workers in Range
Contribution Range, Dollar Amount
Percentage of Covered
Workers in Range
Less than 80% Less than $526 57% Less than $923 50%80% to Less Than Average $526 to <$658 8% $923 to <$1,154 10%Average to Less Than 120% $658 to <$790 5% $1,154 to <$1,385 12%120% or More $790 or More 30% $1,385 or More 29%
Exhibit 8.17
Family CoverageSingle Coverage
Note: The average annual firm contribution to the HSA is $658 for single coverage and $1,154 for family coverage. The distribution includes workers in firms who do not make any contribution. The HSA account contribution distribution is relative to the average single or family account contribution. For example, $526 is 80% of the average single HSA account contribution and $790 is 120% of the average single HSA account contribution. The same break points relative to the average are used for the distribution for family coverage.
Source: Kaiser/HRET Survey of Employer-Sponsored Health Benefits, 2013.
Distribution of Firm Contributions to the HSA for Single and Family Coverage Relative to the Average Annual Firm Contribution to the HSA, 2013
The average annual firm contrbution to an HSA, for covered workers at firms who make a contribution is $951 for single coverage and $1,675 for family coverage.

section
eigh
tH
igh-Deductible H
ealth Plans with Savings O
ptionEmployer Health Benefits 2 0 1 3 An n u a l S u r vey
T H E K A I S E R FA M I LY F O U N D AT I O N - A N D - H E A LT H R E S E A R C H & E D U C AT I O N A L T R U S T
8
162
Separate Cost Sharing for a Hospital Admission HDHP/HRA HSA-Qualified
HDHP HDHP/SO§
Separate Annual Deductible 0% NA 0%Copayment and/or Coinsurance
Copayment 3 2% 3Coinsurance 74 64 68Both Copay and Coinsurance‡ 3 <1 2
Charge Per Day 1 2 2None 22 33 28
Separate Cost Sharing for an Outpatient Surgery Episode
Separate Annual Deductible <1% NA <1%Copayment and/or Coinsurance
Copayment 4 3% 4Coinsurance 76 65 69Both Copay and Coinsurance‡ 2 <1 1
None 20 32 27Separate Cost Sharing for Primary Care Physician Office Visits
Copayment 44% 5% 22%Coinsurance 48 62 55None 7 33 22Other 1 <1 <1
Separate Cost Sharing for Specialty Care Physician Office Visits
Copayment 33% 5% 18%Coinsurance 49 62 56None 7 33 22Other 11 <1 5
NA: Not Applicable. Information on separate annual deductibles for hospital admissions or outpatient surgery was not collected for HSA-qualified HDHPs because federal regulations make it unlikely the plan would have a separate deductible for specific services.
Source: Kaiser/HRET Survey of Employer-Sponsored Health Benefits, 2013.
Distribution of Covered Workers in HDHP/HRAs and HSA-Qualified HDHPs with the Following Types of Cost Sharing in Addition to the General Annual Deductible, 2013
Exhibit 8.18
‡ This includes enrollees who are required to pay the higher amount of either the copayment or coinsurance under the plan.
§ Information on separate deductibles for hospital admissions or outpatient surgery was collected for HDHP/HRAs only.
Note: The distribution of workers with types of cost sharing does not equal 100% as workers may face a combination of types of cost sharing. Beginning in 2012, the questions on primary care office visits and specialty office visits cost sharing were revised to ensure that firms that had a coinsurance with a minimum or maximum dollar amount were included in the coinsurance category. The survey asks firms about the chararestics of either their largest HRA or HSA Qualfied HDHP. The HDHP/SO category is the aggregrate of both the HRA and HSA plans; for more information see the methods section.
57%$16,3
51
$5,8
84
2013
Employer Health Benefits2 0 1 3 A N N U A L S U R V E Y
sect ion
Prescription Drug Benefits
9

section
nin
ePrescription D
rug Benefits
Employer Health Benefits 2 0 1 3 An n u a l S u r vey
T H E K A I S E R FA M I LY F O U N D AT I O N - A N D - H E A LT H R E S E A R C H & E D U C AT I O N A L T R U S T
9
164
Section Nine: Prescription Drug Benefits Almost all covered workers have coverage for prescription drugs. More than three in
four covered workers are in plans with three or more cost-sharing tiers for prescription
drugs. Copayments, rather than coinsurance, continue to be the preferred form of cost
sharing in most drug tiers.
As in prior years, nearly all (98%) covered workers in employer-sponsored plans
have a prescription drug benefit.
A large majority of covered workers (92%) in 2013 have a tiered cost-sharing formula for prescription drugs (Exhibit 9.1). Cost-sharing tiers generally refer to a health plan placing a drug on a formulary or preferred drug list, which classifies drugs as generic, preferred, or non-preferred. Over the past years, an increasing number of plans have created a fourth or even higher tier of drug cost sharing, which may be used for lifestyle drugs or expensive biologics. Employers often place various drugs in generic, preferred, or non-preferred tiers to encourage enrollees to select cheaper alternatives or to pass on to enrollees the higher costs of more expensive drugs.
Eighty-one percent of covered workers are enrolled in plans with three, four, or more tiers of cost sharing for prescription drugs, similar to 77% of covered workers in 2012 (Exhibit 9.1). The percentage of covered workers enrolled in a plan with four or more tiers for prescription drugs has increased from 14% in 2012 to 23% in 2013.
o HDHP/SOs have different cost-sharing patterns for prescription drugs than other
plan types. Only 45% of covered workers in HDHP/SOs are in a plan with three or more tiers of cost sharing for prescription drugs; 12% are in plans that pay 100% of prescription costs once the plan deductible is met (Exhibit 9.2).
Twenty-three percent of covered workers are in a plan that has four or more tiers of
cost sharing for prescription drugs (Exhibit 9.1). Among workers covered by plans with three or more tiers of cost sharing for prescription drugs, copayments are far more common than coinsurance in the first three tiers (Exhibit 9.3). For covered workers in plans with three or more cost-sharing tiers, 39% face a copayment for fourth-tier drugs and 48% face coinsurance (Exhibit 9.3).
o For covered workers in plans with three, four, or more tiers of cost sharing for
prescription drugs, the average drug copayments for first-tier drugs ($10), second-tier drugs ($29), third-tier drugs ($52), and fourth-tier ($80) are comparable to the amounts reported in 2012 ($10, $29, $51, and $79, respectively) (Exhibit 9.4).
o For covered workers in plans with three, four, or more tiers of cost sharing for prescription drugs who face coinsurance rather than copayments, coinsurance

Employer Health Benefits 2 0 1 3 An n u a l S u r vey
T H E K A I S E R FA M I LY F O U N D AT I O N - A N D - H E A LT H R E S E A R C H & E D U C AT I O N A L T R U S T
165
9
section
nin
ePrescription D
rug Benefits
levels average 16% for first-tier drugs, 25% for second-tier drugs, 38% for third-tier drugs, and 32% for fourth-tier drugs. All of the estimates are similar to last year except for the average coinsurance for first-tier drugs (16%) which is statistically different from 2012 (20%) (Exhibit 9.4).
Ten percent of covered workers are in a plan that has two tiers for prescription drug
cost sharing (Exhibit 9.1). Similar to workers in plans with more cost-sharing tiers, copayments are more common than coinsurance for workers in plans with two tiers (Exhibit 9.5). The average copayment for the first tier is $11, and the average copayment for the second tier is $31. The average coinsurance rate for the second tier is 30% (Exhibit 9.6).
Five percent of covered workers are covered by plans in which cost sharing is the same regardless of the type of drug chosen (Exhibit 9.1). Among these covered workers, 19% have copayments and 81% have coinsurance (Exhibit 9.7).
For those workers with the same cost sharing regardless of the type of drug, the
average copayment is $12 and the average coinsurance is 22% (Exhibit 9.8). Coinsurance rates for prescription drugs often have maximum or minimum dollar
amounts associated with the coinsurance rate. Twenty-three percent of workers with a coinsurance rate have a maximum dollar amount attached to the coinsurance rate, 6% have a minimum, and 17% have both for first-tier drugs (Exhibit 9.9).
Generic drugs: Drugs product that are no longer covered by patent protection and thus may be produced and/or distributed by multiple drug companies. Preferred drugs: Drugs included on a formulary or preferred drug list; for example, a brand-name drug without a generic substitute. Nonpreferred drugs: Drugs not included on a formulary or preferred drug list; for example, a brand-name drug with a generic substitute. Fourth-tier drugs: New types of cost-sharing arrangements that typically build additional layers of higher copayments or coinsurance for specifically identified types of drugs, such as lifestyle drugs or biologics. Brand-name drugs: Generally, a drug product that is covered by a patent and is thus manufactured and sold exclusively by one firm. Cross-licensing occasionally occurs, allowing an additional firm to market the drug. After the patent expires, multiple firms can produce the drug product, but the brand name or trademark remains with the original manufacturer’s product.

section ninePrescription Drug BenefitsEm
ployer Health B
enefits 20
13
An
nu
al S
urve
y
TH
E K
AIS
ER
FAM
ILY F
OU
ND
AT
ION
-AN
D- H
EA
LTH
RE
SE
AR
CH
& E
DU
CA
TIO
NA
L T
RU
ST
9
166
* Distribution is statistically different from distribution for the previous year shown (p<.05). ‡ No statistical tests are conducted between 2003 and 2004 or between 2006 and 2007 due to the addition of a new category. NOTE: Fourth-tier drug cost-sharing information was not obtained prior to 2004.SOURCE: Kaiser/HRET Survey of Employer-Sponsored Health Benefits, 2000-2013.
Exhibit 9.1Distribution of Covered Workers Facing Different Cost-Sharing Formulas for Prescription Drug Benefits, 2000-2013
23%
14%
14%
13%
11%
7%
7%
5%
4%
3%
59%
63%
63%
65%
67%
70%
68%
69%
70%
65%
63%
55%
41%
27%
10%
10%
11%
11%
12%
15%
16%
16%
15%
20%
23%
30%
41%
49%
5%
6%
7%
5%
5%
4%
6%
8%
8%
10%
13%
13%
18%
22%
3%
5%
3%
4%
3%
3%
2%
1%
1%
1%
1%
3%
1%1%
2%2%
1%
2%1%
1%
2%
0% 10% 20% 30% 40% 50% 60% 70% 80% 90% 100%
2013*
2012
2011
2010
2009
2008
2007‡
2006
2005
2004‡
2003*
2002*
2001*
2000
Four or More TiersThree TiersTwo TiersPayment is the same regardless of type of drugNo cost sharing after deductible is metOther

Employer Health Benefits 2 0 1 3 An n u a l S u r vey
T H E K A I S E R FA M I LY F O U N D AT I O N - A N D - H E A LT H R E S E A R C H & E D U C AT I O N A L T R U S T
167
9
section
nin
ePrescription D
rug Benefits
23%
16%
17%
24%
25%
59%
45%
65%
64%
51%
10%
7%
10%
8%
19%
5%
18%
6%
3%
4%
3%
12%
<1%
1%
<1%
1%
2%
2%
<1%
<1%
0% 10% 20% 30% 40% 50% 60% 70% 80% 90% 100%
ALL PLANS
HDHP/SO*
POS*
PPO*
HMO*
Four or More TiersThree TiersTwo TiersPayment is the same regardless of type of drugNo cost sharing after deductible is metOther
*Distribution is statistically different from All Plans distribution (p<.05).
SOURCE: Kaiser/HRET Survey of Employer-Sponsored Health Benefits, 2013.
Exhibit 9.2Distribution of Covered Workers Facing Different Cost-Sharing Formulas for Prescription Drug Benefits, by Plan Type, 2013

section
nin
ePrescription D
rug Benefits
Employer Health Benefits 2 0 1 3 An n u a l S u r vey
T H E K A I S E R FA M I LY F O U N D AT I O N - A N D - H E A LT H R E S E A R C H & E D U C AT I O N A L T R U S T
9
168
First-Tier Drugs, Often Called Generic Drugs Copay Coinsurance‡
Plan Pays Entire Cost After Any
Deductibles Are Met
Some Other Amount
HMO 95% 3% 2% 0%PPO 89 9 1 <1POS 93 4 2 1HDHP/SO 83 13 3 1
ALL PLANS 89% 9% 2% <1%
Second-Tier Drugs, Often Called Preferred Drugs
Copay or Coinsurance Plus Any Difference§
HMO 88% 11% <1% 1%PPO 75 22 1 1POS 89 4 5 2HDHP/SO 67 29 <1 3
ALL PLANS 76% 21% 1% 1%
Third-Tier Drugs, Often Called Nonpreferred Drugs
HMO 82% 17% <1% 1%PPO 70 27 1 1POS 87 9 3 2HDHP/SO 65 31 1 4
ALL PLANS 71% 25% 2% 2%Fourth-Tier Drugs
HMO 44% 42% 0% 14%PPO 40 49 2 9POS 39 52 0 9HDHP/SO 41 44 0 16
ALL PLANS 39% 48% 1% 11%
Exhibit 9.3
Note: Tests found no statistical difference from All Plans distribution within drug type (p<.05). These distributions do not include the 1% of covered workers whose employers report “none of the above” to the survey question about the type of prescription drug cost-sharing formula. For definitions of Generic, Preferred, Nonpreferred, and Fourth-Tier Drugs, see the Text Box in the introduction to Section 9.
Source: Kaiser/HRET Survey of Employer-Sponsored Health Benefits, 2013.
Among Workers with Three, Four, or More Tiers of Cost Sharing, Distribution of Covered Workers with the Following Types of Cost Sharing for Prescription Drugs, by Drug Tier and Plan Type,
2013
§ Category includes workers who pay a copayment or coinsurance plus the difference between the cost of the prescription and the cost of a comparable generic drug.
‡ Beginning with the 2012 survey, the structure of cost-sharing questions was revised to include coinsurance rates with a minimum or maximum dollar amount. For most tiers, and most plan types, the average coinsurance rate is not significantly different depending on whether it included a minimum, maximum, both, or neither. See the 2012 Survey Design and Methods section for more information.

Employer H
ealth Benefits 2
01
3 A
nn
ua
l Su
rvey
TH
E K
AIS
ER
FAM
ILY F
OU
ND
AT
ION
-AN
D- H
EA
LTH
RE
SE
AR
CH
& E
DU
CA
TIO
NA
L T
RU
ST
169
9
section ninePrescription Drug Benefits
2000 2001 2002 2003 2004 2005 2006 2007 2008 2009 2010 2011 2012 2013Average Copayments
First-Tier Drugs, Often Called Generic $8 $8 $9 $9* $10* $10 $11* $11 $10 $10 $11 $10 $10 $10Second-Tier Drugs, Often Called Preferred $15 $16* $18* $20* $22* $23* $25* $25 $26 $27 $28* $29 $29 $29Third-Tier Drugs, Often Called Nonpreferred $29 $28 $32* $35* $38* $40* $43* $43 $46* $46 $49* $49 $51 $52Fourth-Tier Drugs ^ ^ ^ ^ $59 $74 $59 $71* $75 $85 $89 $91 $79 $80
Average CoinsuranceFirst-Tier Drugs, Often Called Generic 18% 18% 18% 18% 18% 19% 19% 21% 21% 20% 17% 18% 20%* 16%*Second-Tier Drugs, Often Called Preferred NSD 23% 24% 23% 25% 27% 26% 26% 25% 26% 25% 25% 26% 25%Third-Tier Drugs, Often Called Nonpreferred 28% 33% 40% 34%* 34% 38% 38% 40% 38% 37% 38% 39% 39% 38%Fourth-Tier Drugs ^ ^ ^ ^ 30% 43%* 42% 36% 28% 31% 36% 29% 32% 32%
Exhibit 9.4
Source: Kaiser/HRET Survey of Employer-Sponsored Health Benefits, 2000-2013.
* Estimate is statistically different from estimate for the previous year shown (p<.05).
Fourth-tier drug copayment or coinsurance information was not obtained prior to 2004.
NSD: Not Sufficient Data.
Among Covered Workers with Three, Four, or More Tiers of Prescription Cost Sharing, Average Copayments and Average Coinsurance by Drug Type, 2000-2013
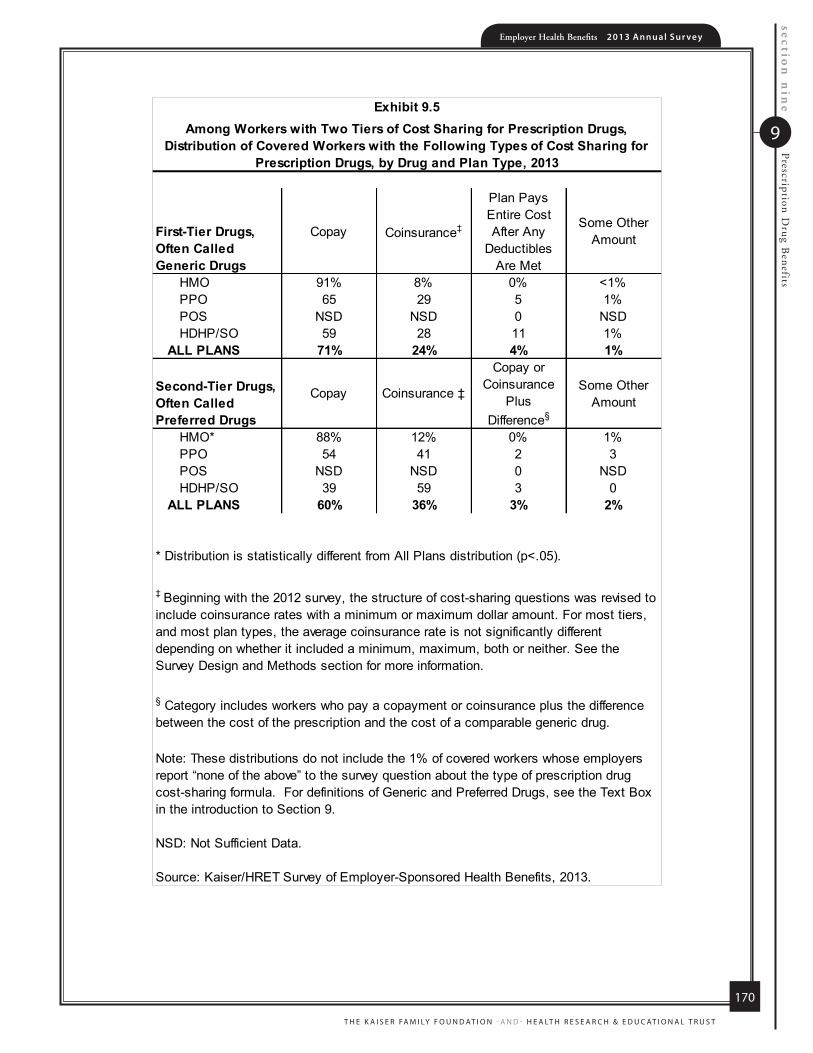
section
nin
ePrescription D
rug Benefits
Employer Health Benefits 2 0 1 3 An n u a l S u r vey
T H E K A I S E R FA M I LY F O U N D AT I O N - A N D - H E A LT H R E S E A R C H & E D U C AT I O N A L T R U S T
9
170
First-Tier Drugs, Often Called Generic Drugs
Copay Coinsurance‡
Plan Pays Entire Cost After Any
Deductibles Are Met
Some Other Amount
HMO 91% 8% 0% <1%PPO 65 29 5 1%POS NSD NSD 0 NSDHDHP/SO 59 28 11 1%
ALL PLANS 71% 24% 4% 1%
Second-Tier Drugs, Often Called Preferred Drugs
Copay Coinsurance ‡
Copay or Coinsurance
Plus Difference§
Some Other Amount
HMO* 88% 12% 0% 1%PPO 54 41 2 3POS NSD NSD 0 NSDHDHP/SO 39 59 3 0
ALL PLANS 60% 36% 3% 2%
Exhibit 9.5Among Workers with Two Tiers of Cost Sharing for Prescription Drugs,
Distribution of Covered Workers with the Following Types of Cost Sharing for Prescription Drugs, by Drug and Plan Type, 2013
Source: Kaiser/HRET Survey of Employer-Sponsored Health Benefits, 2013.
Note: These distributions do not include the 1% of covered workers whose employers report “none of the above” to the survey question about the type of prescription drug cost-sharing formula. For definitions of Generic and Preferred Drugs, see the Text Box in the introduction to Section 9.
§ Category includes workers who pay a copayment or coinsurance plus the difference between the cost of the prescription and the cost of a comparable generic drug.
‡ Beginning with the 2012 survey, the structure of cost-sharing questions was revised to include coinsurance rates with a minimum or maximum dollar amount. For most tiers, and most plan types, the average coinsurance rate is not significantly different depending on whether it included a minimum, maximum, both or neither. See the Survey Design and Methods section for more information.
* Distribution is statistically different from All Plans distribution (p<.05).
NSD: Not Sufficient Data.
2000
2001
2002
2003
2004
2005
2006
2007
2008
2009
2010
2011
2012
2013
Aver
age
Copa
ymen
tsFi
rst-T
ier D
rugs
, Ofte
n C
alle
d G
ener
ic$7
$8*
$9*
$9$1
0$1
0$1
1$1
0$1
1$1
0$1
0$1
1$1
1$1
1S
econ
d-Ti
er D
rugs
, Ofte
n C
alle
d P
refe
rred
$14
$15*
$18*
$20*
$22*
$22
$23
$23
$24
$26
$28
$28
$29
$31
Aver
age
Coin
sura
nce
Firs
t-Tie
r Dru
gs, O
ften
Cal
led
Gen
eric
19%
17%
20%
21%
17%
16%
22%
21%
19%
NS
DN
SD
NS
DN
SD
NS
DS
econ
d-Ti
er D
rugs
, Ofte
n C
alle
d P
refe
rred
28%
25%
25%
28%
25%
24%
27%
28%
32%
28%
27%
30%
27%
30%
* E
stim
ate
is s
tatis
tical
ly d
iffer
ent f
rom
est
imat
e fo
r the
pre
vious
yea
r sho
wn
(p<.
05).
NS
D: N
ot S
uffic
ient
Dat
a.
Sou
rce:
Kai
ser/H
RE
T S
urve
y of
Em
ploy
er-S
pons
ored
Hea
lth B
enef
its, 2
000-
2013
.
Amon
g Co
vere
d W
orke
rs w
ith T
wo
Tier
s of
Pre
scrip
tion
Cost
Sha
ring,
Ave
rage
Cop
aym
ents
and
Ave
rage
Coi
nsur
ance
, by
Drug
Typ
e,
2000
-201
3
Exhi
bit 9
.6

Employer H
ealth Benefits 2
01
3 A
nn
ua
l Su
rvey
TH
E K
AIS
ER
FAM
ILY F
OU
ND
AT
ION
-AN
D- H
EA
LTH
RE
SE
AR
CH
& E
DU
CA
TIO
NA
L T
RU
ST
171
9
section ninePrescription Drug Benefits
2000 2001 2002 2003 2004 2005 2006 2007 2008 2009 2010 2011 2012 2013Average Copayments
First-Tier Drugs, Often Called Generic $7 $8* $9* $9 $10 $10 $11 $10 $11 $10 $10 $11 $11 $11Second-Tier Drugs, Often Called Preferred $14 $15* $18* $20* $22* $22 $23 $23 $24 $26 $28 $28 $29 $31
Average CoinsuranceFirst-Tier Drugs, Often Called Generic 19% 17% 20% 21% 17% 16% 22% 21% 19% NSD NSD NSD NSD NSDSecond-Tier Drugs, Often Called Preferred 28% 25% 25% 28% 25% 24% 27% 28% 32% 28% 27% 30% 27% 30%
* Estimate is statistically different from estimate for the previous year shown (p<.05).
NSD: Not Sufficient Data.
Source: Kaiser/HRET Survey of Employer-Sponsored Health Benefits, 2000-2013.
Among Covered Workers with Two Tiers of Prescription Cost Sharing, Average Copayments and Average Coinsurance, by Drug Type, 2000-2013
Exhibit 9.6

section
nin
ePrescription D
rug Benefits
Employer Health Benefits 2 0 1 3 An n u a l S u r vey
T H E K A I S E R FA M I LY F O U N D AT I O N - A N D - H E A LT H R E S E A R C H & E D U C AT I O N A L T R U S T
9
172
Copay Coinsurance‡ Some Other Amount
HMO NSD NSD NSDPPO 23% 77% 0%POS NSD NSD NSDHDHP/SO* 6 94 <1
ALL PLANS 19% 81% <1%
Exhibit 9.7
‡ Beginning with the 2012 survey, the structure of cost-sharing questions was revised to include coinsurance rates with a minimum or maximum dollar amount. For most tiers, and most plan types, the average coinsurance rate is not significantly different depending on whether it included a minimum, maximum, both or neither. See the Survey Design and Methods section for more information.
Source: Kaiser/HRET Survey of Employer-Sponsored Health Benefits, 2013.
Note: These distributions do not include the 2% of covered workers whose employers report “none of the above” to the survey question about the type of prescription drug cost-sharing formula.
Among Workers with the Same Cost Sharing Regardless of Type of Drug, Distribution of Covered Workers with the Following Types of Cost
Sharing for Prescription Drugs, by Plan Type, 2013
NSD: Not Sufficient Data.
* Distribution is statistically different from All Plans distribution (p<.05).

Employer H
ealth Benefits 2
01
3 A
nn
ua
l Su
rvey
TH
E K
AIS
ER
FAM
ILY F
OU
ND
AT
ION
-AN
D- H
EA
LTH
RE
SE
AR
CH
& E
DU
CA
TIO
NA
L T
RU
ST
173
9
section ninePrescription Drug Benefits
2000 2001 2002 2003 2004 2005 2006 2007 2008 2009 2010 2011 2012 2013Average Copayments $8 $10* $10 $10 $14* $10* $13* $13 $15 $15 $13 $14 $13 $12
Average Coinsurance 22% 20% 23% 22% 25% 23% 23% 22% 24% 22% 24% 23% 22% 22%
* Estimate is statistically different from estimate for the previous year shown (p<.05).
Source: Kaiser/HRET Survey of Employer-Sponsored Health Benefits, 2000-2013.
Among Covered Workers with the Same Cost Sharing Regardless of Type of Drug, Average Copayments and Average Coinsurance, 2000-2013
Exhibit 9.8

section
nin
ePrescription D
rug Benefits
Employer Health Benefits 2 0 1 3 An n u a l S u r vey
T H E K A I S E R FA M I LY F O U N D AT I O N - A N D - H E A LT H R E S E A R C H & E D U C AT I O N A L T R U S T
9
174
39%
19%
19%
23%
2%
9%
8%
6%
30%
50%
43%
17%
28%
21%
30%
53%
1%
<1%
<1%
0% 20% 40% 60% 80% 100%
Fourth-Tier Drugs
Third-Tier Drugs, OftenCalled Nonpreferred
Drugs
Second-Tier Drugs, OftenCalled Preferred Drugs
First-Tier Drugs, OftenCalled Generics
A Maximum Dollar Amount A Minimum Dollar Amount Both a Maximum and Minimum Dollar Amount Neither Other
NOTE: In 2013 we asked firms that indicated they had a coinsurance for prescription drugs if the coinsurance included any minimum or maximum.SOURCE: Kaiser/HRET Survey of Employer-Sponsored Health Benefits, 2013.
Exhibit 9.9Distribution of Coinsurance Structures for Covered Workers Facing a Coinsurance for Prescription Drugs, by Drug Tier, 2013

57%$16,3
51
$5,8
84
2013
Employer Health Benefits2 0 1 3 A N N U A L S U R V E Y
sect ion
Plan Funding
10

section
tenPlan Funding
Employer Health Benefits 2 0 1 3 An n u a l S u r vey
T H E K A I S E R FA M I LY F O U N D AT I O N - A N D - H E A LT H R E S E A R C H & E D U C AT I O N A L T R U S T
10
176
Self-Funded Plan: An insurance arrangement in which the employer assumes direct financial responsibility for the costs of enrollees’ medical claims. Employers sponsoring self-funded plans typically contract with a third-party administrator or insurer to provide administrative services for the self-funded plan. In some cases, the employer may buy stop-loss coverage from an insurer to protect the employer against very large claims.
Fully Insured Plan: An insurance arrangement in which the employer contracts with a health plan that assumes financial responsibility for the costs of enrollees’ medical claims.
Section Ten: Plan Funding
Federal law (the Employee Retirement Income Security Act of 1974, or ERISA) exempts
self-funded plans from state insurance laws, including reserve requirements, mandated
benefits, premium taxes, and consumer protection regulations. Three in five covered
workers are in a self-funded health plan. Self-funding is common among larger firms
because they can spread the risk of costly claims over a large number of employees and
dependents. Many self-funded plans use insurance, often called stoploss coverage, to
limit the plan sponsor’s liability for very large claims. Almost three in five covered workers
in self-funded plans are in plans with stoploss protection.
Sixty-one percent of covered workers are in a self-funded plan, similar to the percentage reported in 2012 (Exhibit 10.1). The percentage of covered workers who are in a plan that is completely or partially self-funded has increased over time from 49% in 2000 to54% in 2005 and to 59% in 2010.
o The percentage of covered workers differs by plan type: 70% of covered workers in PPOs, 62% in HDHP/SOs, 31% in HMOs, and 31% in POS plans are in a self-funded plan (Exhibit 10.5).
o As expected, covered workers in large firms (200 or more workers) are significantly more likely to be in a self-funded plan than covered workers in small firms (3-199 workers) (83% vs. 16%)(Exhibit 10.4). The percentage of covered workers in self-funded plans increases as the number of employees in a firm increases. Seventy-nine percent of covered workers in firms with 1,000 to 4,999 workers and 94% of covered workers in firms with 5,000 or more workers are in self-funded plans in 2013 (Exhibit 10.4).
Fifty-nine percent of workers in self-funded health plans are in plans that have stoploss insurance (Exhibit 10.10). Stoploss coverage limits the amount that a plan sponsor has to pay in claims. Stoploss coverage may limit the amount of claims that must be paid for each employee or may limit the total amount the plan sponsor must pay for all claims over the plan year.

Employer Health Benefits 2 0 1 3 An n u a l S u r vey
T H E K A I S E R FA M I LY F O U N D AT I O N - A N D - H E A LT H R E S E A R C H & E D U C AT I O N A L T R U S T
177
10
section
tenPlan Funding
o Eighty-eight percent of covered workers in self-funded plans that have stoploss protection are in plans where the stoploss insurance limits the amount that the plan must spend on each employee (Exhibit 10.11).1
o Firms with per enrollee stoploss coverage were asked for the dollar amount where the stoploss coverage would start to pay for most or all of the claim (called an attachment point). The average attachment point in small firms (50-199 workers) is about $96,000. For larger firms (200 or more workers), the average attachment point is about $317,000 (Exhibit 10.11).
In anticipation of major provisions of the Affordable Care Act (ACA) going into effect in 2014, firms offering health benefits were asked whether they plan to self-insure. Self-funded plans are not required to comply with the medical loss ratio or the essential health benefits rules that apply to some fully insured plans.
o Six percent of firms offering fully-insured plans reported they plan to self-insure, 83% reported that they did not plan to self-insure, and 11% did not know (Exhibit 10.13). There were no significant differences between small and large firms.
1 This includes stoploss insurance plans that limit a firm's per employee spending as well as plans that limit both a firm's overall spending and per employee spending.
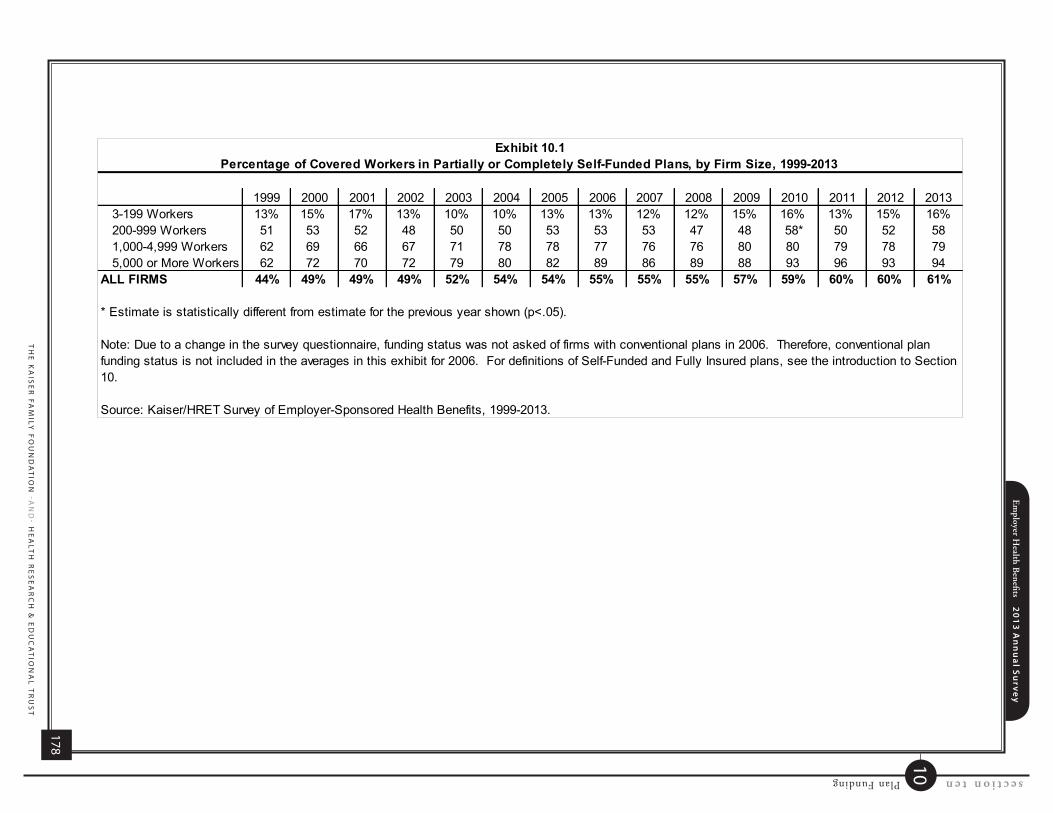
section tenPlan FundingEm
ployer Health B
enefits 20
13
An
nu
al S
urve
y
TH
E K
AIS
ER
FAM
ILY F
OU
ND
AT
ION
-AN
D- H
EA
LTH
RE
SE
AR
CH
& E
DU
CA
TIO
NA
L T
RU
ST
10
178
1999 2000 2001 2002 2003 2004 2005 2006 2007 2008 2009 2010 2011 2012 20133-199 Workers 13% 15% 17% 13% 10% 10% 13% 13% 12% 12% 15% 16% 13% 15% 16%200-999 Workers 51 53 52 48 50 50 53 53 53 47 48 58* 50 52 581,000-4,999 Workers 62 69 66 67 71 78 78 77 76 76 80 80 79 78 795,000 or More Workers 62 72 70 72 79 80 82 89 86 89 88 93 96 93 94
ALL FIRMS 44% 49% 49% 49% 52% 54% 54% 55% 55% 55% 57% 59% 60% 60% 61%
* Estimate is statistically different from estimate for the previous year shown (p<.05).
Source: Kaiser/HRET Survey of Employer-Sponsored Health Benefits, 1999-2013.
Percentage of Covered Workers in Partially or Completely Self-Funded Plans, by Firm Size, 1999-2013Exhibit 10.1
Note: Due to a change in the survey questionnaire, funding status was not asked of firms with conventional plans in 2006. Therefore, conventional plan funding status is not included in the averages in this exhibit for 2006. For definitions of Self-Funded and Fully Insured plans, see the introduction to Section 10.

Employer Health Benefits 2 0 1 3 An n u a l S u r vey
T H E K A I S E R FA M I LY F O U N D AT I O N - A N D - H E A LT H R E S E A R C H & E D U C AT I O N A L T R U S T
179
10
section
tenPlan Funding
Exhibit 10.2Percentage of Covered Workers in Partially or Completely Self-Funded Plans, by Firm Size, 1999-2013
13% 15% 17%13%
10% 10%13% 13% 12% 12%
15% 16%13% 15% 16%
60%
67%* 66% 66%72% 73% 75%
78% 77% 77% 77%83%* 82% 81% 83%
0%
10%
20%
30%
40%
50%
60%
70%
80%
90%
100%
1999 2000 2001 2002 2003 2004 2005 2006 2007 2008 2009 2010 2011 2012 2013
All Small Firms (3-199 Workers) All Large Firms (200 or more)
* Estimate is statistically different from estimate for the previous year shown (p<.05).NOTE: Sixty-one percent of covered workers are in a partially or completely self-funded plan in 2013. Due to a change in the survey questionnaire, funding status was not asked of firms with conventional plans in 2006. Therefore, conventional plan funding status is not included in the averages in this exhibit for 2006. For definitions of Self-Funded and Fully Insured plans, see the introduction to Section 10. SOURCE: Kaiser/HRET Survey of Employer-Sponsored Health Benefits, 1999-2013.
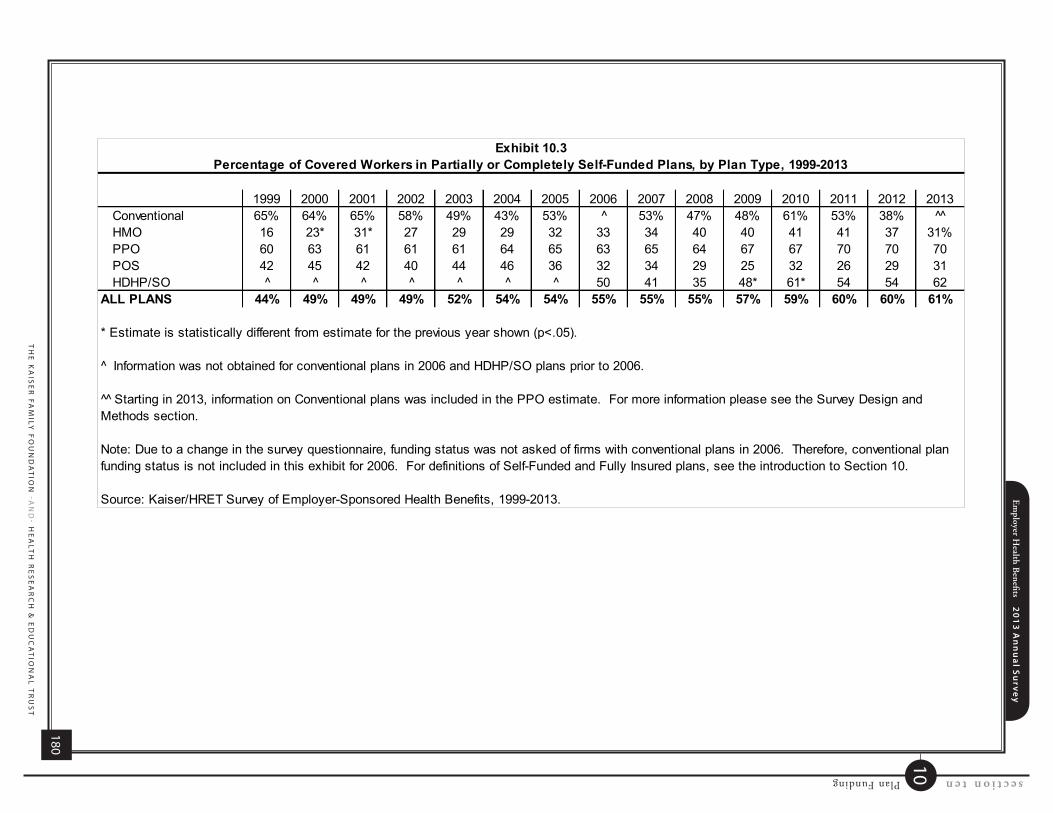
section tenPlan FundingEm
ployer Health B
enefits 20
13
An
nu
al S
urve
y
TH
E K
AIS
ER
FAM
ILY F
OU
ND
AT
ION
-AN
D- H
EA
LTH
RE
SE
AR
CH
& E
DU
CA
TIO
NA
L T
RU
ST
10
180
1999 2000 2001 2002 2003 2004 2005 2006 2007 2008 2009 2010 2011 2012 2013Conventional 65% 64% 65% 58% 49% 43% 53% ^ 53% 47% 48% 61% 53% 38% ^HMO 16 23* 31* 27 29 29 32 33 34 40 40 41 41 37 31%PPO 60 63 61 61 61 64 65 63 65 64 67 67 70 70 70POS 42 45 42 40 44 46 36 32 34 29 25 32 26 29 31HDHP/SO ^ ^ ^ ^ ^ ^ ^ 50 41 35 48* 61* 54 54 62
ALL PLANS 44% 49% 49% 49% 52% 54% 54% 55% 55% 55% 57% 59% 60% 60% 61%
Exhibit 10.3
Source: Kaiser/HRET Survey of Employer-Sponsored Health Benefits, 1999-2013.
* Estimate is statistically different from estimate for the previous year shown (p<.05).
Information was not obtained for conventional plans in 2006 and HDHP/SO plans prior to 2006.
Percentage of Covered Workers in Partially or Completely Self-Funded Plans, by Plan Type, 1999-2013
^ Starting in 2013, information on Conventional plans was included in the PPO estimate. For more information please see the Survey Design and Methods section.
Note: Due to a change in the survey questionnaire, funding status was not asked of firms with conventional plans in 2006. Therefore, conventional plan funding status is not included in this exhibit for 2006. For definitions of Self-Funded and Fully Insured plans, see the introduction to Section 10.

Employer Health Benefits 2 0 1 3 An n u a l S u r vey
T H E K A I S E R FA M I LY F O U N D AT I O N - A N D - H E A LT H R E S E A R C H & E D U C AT I O N A L T R U S T
181
10
section
tenPlan Funding
Self-Funded (Employer Bears Some or All of Financial Risk)
FIRM SIZE200-999 Workers 58%1,000-4,999 Workers 79*5,000 or More Workers 94*
All Small Firms (3-199 Workers) 16%*All Large Firms (200 or More Workers) 83%*REGION
Northeast 63%Midwest 64South 67*West 47*
INDUSTRYAgriculture/Mining/Construction 45%*Manufacturing 65Transportation/Communications/Utilities 82*Wholesale 39*Retail 78*Finance 69Service 46*State/Local Government 78*Health Care 69*
ALL FIRMS 61%
Exhibit 10.4
* Estimate is statistically different from estimate for all other firms not in the indicated size, region, or industry category (p<.05).
Note: For definitions of Self-Funded and Fully Insured plans, see the introduction to Section 10.
Source: Kaiser/HRET Survey of Employer-Sponsored Health Benefits, 2013.
Percentage of Covered Workers in Partially or Completely Self-Funded Plans, by Firm Size, Region, and Industry, 2013

section
tenPlan Funding
Employer Health Benefits 2 0 1 3 An n u a l S u r vey
T H E K A I S E R FA M I LY F O U N D AT I O N - A N D - H E A LT H R E S E A R C H & E D U C AT I O N A L T R U S T
10
182
HMO PPO POS HDHP/SO3-199 Workers 10%* 18%* 10%* 17%*200-999 Workers 12* 69 55 571,000-4,999 Workers 50* 87* 32 83*5,000 or More Workers 52* 98* NSD 97*
ALL FIRMS 31% 70% 31% 62%
Exhibit 10.5
Source: Kaiser/HRET Survey of Employer-Sponsored Health Benefits, 2013.
Percentage of Covered Workers in Partially or Completely Self-Funded Plans, by Plan Type and Firm Size, 2013
* Estimate is statistically different from estimate for all other firms not in the indicated size category within plan type (p<.05).
Note: For definitions of Self-Funded and Fully Insured plans, see the introduction to Section 10.
NSD: Not Sufficient Data.
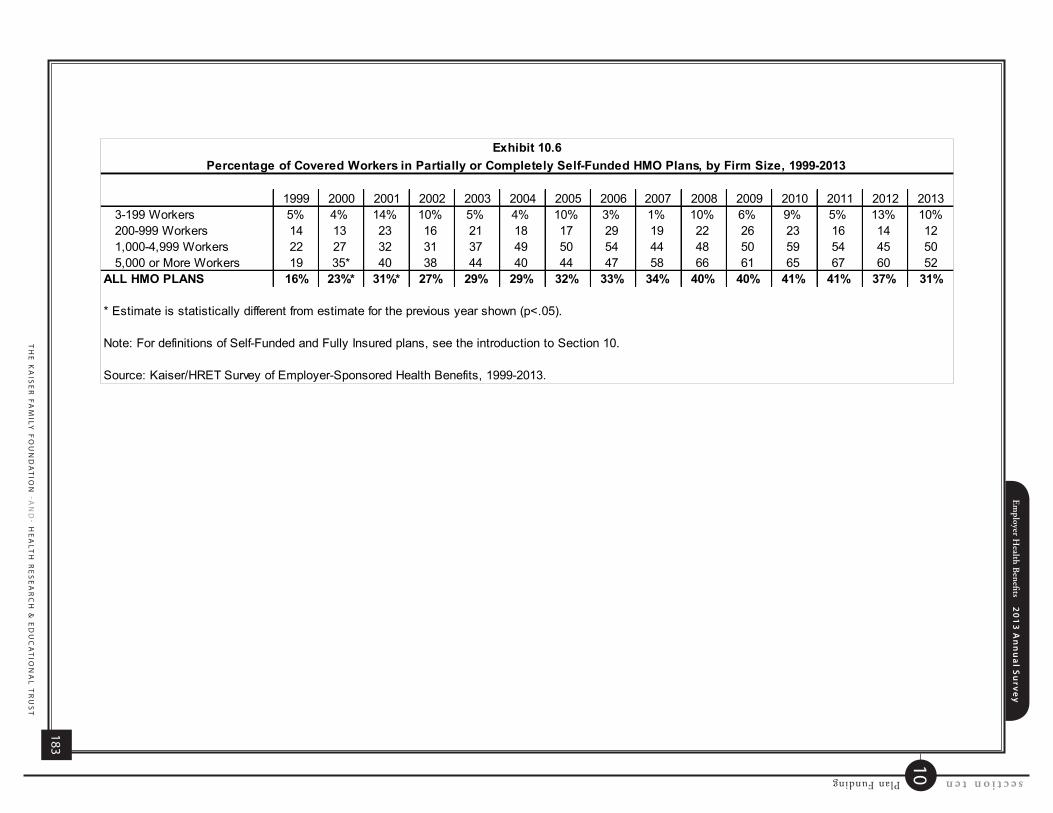
Employer H
ealth Benefits 2
01
3 A
nn
ua
l Su
rvey
TH
E K
AIS
ER
FAM
ILY F
OU
ND
AT
ION
-AN
D- H
EA
LTH
RE
SE
AR
CH
& E
DU
CA
TIO
NA
L T
RU
ST
183
10 section tenPlan Funding
1999 2000 2001 2002 2003 2004 2005 2006 2007 2008 2009 2010 2011 2012 20133-199 Workers 5% 4% 14% 10% 5% 4% 10% 3% 1% 10% 6% 9% 5% 13% 10%200-999 Workers 14 13 23 16 21 18 17 29 19 22 26 23 16 14 121,000-4,999 Workers 22 27 32 31 37 49 50 54 44 48 50 59 54 45 505,000 or More Workers 19 35* 40 38 44 40 44 47 58 66 61 65 67 60 52
ALL HMO PLANS 16% 23%* 31%* 27% 29% 29% 32% 33% 34% 40% 40% 41% 41% 37% 31%
* Estimate is statistically different from estimate for the previous year shown (p<.05).
Note: For definitions of Self-Funded and Fully Insured plans, see the introduction to Section 10.
Source: Kaiser/HRET Survey of Employer-Sponsored Health Benefits, 1999-2013.
Percentage of Covered Workers in Partially or Completely Self-Funded HMO Plans, by Firm Size, 1999-2013Exhibit 10.6

section tenPlan FundingEm
ployer Health B
enefits 20
13
An
nu
al S
urve
y
TH
E K
AIS
ER
FAM
ILY F
OU
ND
AT
ION
-AN
D- H
EA
LTH
RE
SE
AR
CH
& E
DU
CA
TIO
NA
L T
RU
ST
10
184
1999 2000 2001 2002 2003 2004 2005 2006 2007 2008 2009 2010 2011 2012 20133-199 Workers 19% 23% 23% 15% 13% 13% 18% 19% 17% 15% 21% 18% 19% 20% 18%200-999 Workers 69 72 66 63 60 63 67 61 65 55 55 69* 65 63 691,000-4,999 Workers 84 89 87 83 85 88 88 85 87 85 87 85 84 84 875,000 or More Workers 87 88 87 93 93 93 95 97 90* 94 93 96 98 97 98
ALL PPO PLANS 60% 63% 61% 61% 61% 64% 65% 63% 65% 64% 67% 67% 70% 70% 70%
* Estimate is statistically different from estimate for the previous year shown (p<.05).
Note: For definitions of Self-Funded and Fully Insured plans, see the introduction to Section 10.
Source: Kaiser/HRET Survey of Employer-Sponsored Health Benefits, 1999-2013.
Percentage of Covered Workers in Partially or Completely Self-Funded PPO Plans, by Firm Size, 1999-2013Exhibit 10.7
1999 2000 2001 2002 2003 2004 2005 2006 2007 2008 2009 2010 2011 2012 20133-199 Workers 10% 10% 10% 10% 8% 9% 9% 6% 14% 9% 5% 9% 6% 7% 10%200-999 Workers 35 39 40 21* 42* 42 31 36 33 20 39 53 39 56 551,000-4,999 Workers 62 71 60 67 73 63 48 62 47 52 53 60 40 50 325,000 or More Workers 75 77 76 67 71 77 74 80 89 65 76 85 NSD 91 86
ALL POS PLANS 42% 45% 42% 40% 44% 46% 36% 32% 34% 29% 25% 32% 26% 29% 31%
* Estimate is statistically different from estimate for the previous year shown (p<.05).
Note: For definitions of Self-Funded and Fully Insured plans, see the introduction to Section 10.
Source: Kaiser/HRET Survey of Employer-Sponsored Health Benefits, 1999-2013.
Percentage of Covered Workers in Partially or Completely Self-Funded POS Plans, by Firm Size, 1999-2013Exhibit 10.8
NSD: Not Sufficient Data.

Employer H
ealth Benefits 2
01
3 A
nn
ua
l Su
rvey
TH
E K
AIS
ER
FAM
ILY F
OU
ND
AT
ION
-AN
D- H
EA
LTH
RE
SE
AR
CH
& E
DU
CA
TIO
NA
L T
RU
ST
185
10 section tenPlan Funding
1999 2000 2001 2002 2003 2004 2005 2006 2007 2008 2009 2010 2011 2012 20133-199 Workers 10% 10% 10% 10% 8% 9% 9% 6% 14% 9% 5% 9% 6% 7% 10%200-999 Workers 35 39 40 21* 42* 42 31 36 33 20 39 53 39 56 551,000-4,999 Workers 62 71 60 67 73 63 48 62 47 52 53 60 40 50 325,000 or More Workers 75 77 76 67 71 77 74 80 89 65 76 85 NSD 91 86
ALL POS PLANS 42% 45% 42% 40% 44% 46% 36% 32% 34% 29% 25% 32% 26% 29% 31%
* Estimate is statistically different from estimate for the previous year shown (p<.05).
Note: For definitions of Self-Funded and Fully Insured plans, see the introduction to Section 10.
Source: Kaiser/HRET Survey of Employer-Sponsored Health Benefits, 1999-2013.
Percentage of Covered Workers in Partially or Completely Self-Funded POS Plans, by Firm Size, 1999-2013Exhibit 10.8
NSD: Not Sufficient Data.

section tenPlan FundingEm
ployer Health B
enefits 20
13
An
nu
al S
urve
y
TH
E K
AIS
ER
FAM
ILY F
OU
ND
AT
ION
-AN
D- H
EA
LTH
RE
SE
AR
CH
& E
DU
CA
TIO
NA
L T
RU
ST
10
186
2006 2007 2008 2009 2010 2011 2012 20133-199 Workers 7% 4% 7% 18% 24% 11% 14% 17%200-999 Workers 57 27 48 36 53 45 39 571,000-4,999 Workers 81 86 72 81 88 89 85 835,000 or More Workers 100 97 91 96 99 98 98 97
ALL HDHP/SOs 50% 41% 35% 48%* 61%* 54% 54% 62%
* Estimate is statistically different from estimate for the previous year shown (p<.05).
Source: Kaiser/HRET Survey of Employer-Sponsored Health Benefits, 2006-2013.
Percentage of Covered Workers in Partially or Completely Self-Funded HDHP/SOs, by Firm Size, 2006-2013Exhibit 10.9
Note: Information on funding status for HDHP/SOs was not collected prior to 2006. For definitions of Self-Funded and Fully Insured plans, see the introduction to Section 10.
Percentage of C
overed Workers in a
Self-Funded P
lan Covered by
Stoploss Insurance
FIRM SIZE
50-19973%
200-999 Workers
94*1,000-4,999 W
orkers85*
5,000 or More W
orkers40*
All Small Firm
s (3-199 Workers)
62%All Large Firm
s (200 or More W
orkers)59%
REGIO
NN
ortheast58%
Midw
est73*
South
55W
est52
INDUSTRYA
griculture/Mining/C
onstruction71%
Manufacturing
62Transportation/C
omm
unications/Utilities
41*W
holesale63
Retail
47Finance
64S
ervice73*
State/Local G
overnment
23*H
ealth Care
70ALL SELF-FUNDED FIRM
S59%
Exhibit 10.10Percentage of Covered W
orkers Enrolled in a Partially or Completely Self-Funded
Plan Covered by Stoploss Insurance, by Firm Size, Region, and Industry, 2013
* Estim
ate is statistically different from estim
ate for all other firms not in the indicated size,
region, or industry category (p<.05).
Note: For definitions of S
elf-Funded and Fully Insured plans, see the introduction to S
ection 10.
Source: K
aiser/HR
ET S
urvey of Em
ployer-Sponsored H
ealth Benefits, 2013.
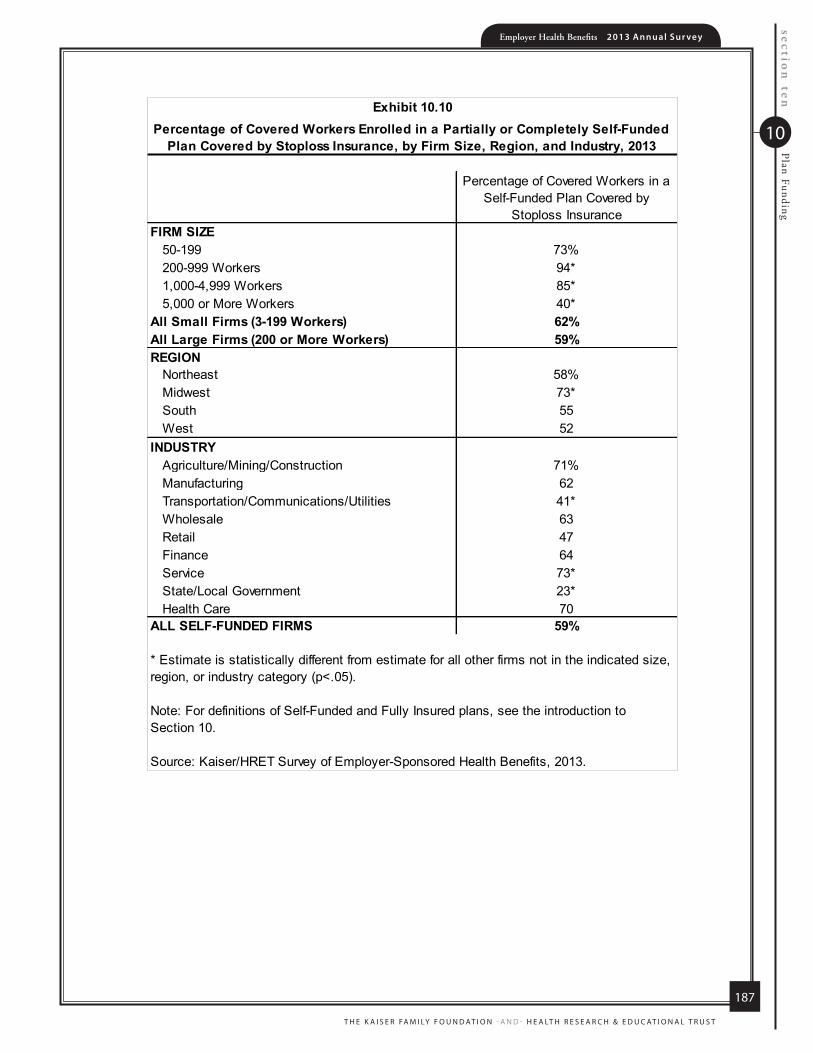
Employer Health Benefits 2 0 1 3 An n u a l S u r vey
T H E K A I S E R FA M I LY F O U N D AT I O N - A N D - H E A LT H R E S E A R C H & E D U C AT I O N A L T R U S T
187
10
section
tenPlan Funding
Percentage of Covered Workers in a Self-Funded Plan Covered by
Stoploss InsuranceFIRM SIZE
50-199 73%200-999 Workers 94*1,000-4,999 Workers 85*5,000 or More Workers 40*
All Small Firms (3-199 Workers) 62%All Large Firms (200 or More Workers) 59%REGION
Northeast 58%Midwest 73*South 55West 52
INDUSTRYAgriculture/Mining/Construction 71%Manufacturing 62Transportation/Communications/Utilities 41*Wholesale 63Retail 47Finance 64Service 73*State/Local Government 23*Health Care 70
ALL SELF-FUNDED FIRMS 59%
Exhibit 10.10Percentage of Covered Workers Enrolled in a Partially or Completely Self-Funded
Plan Covered by Stoploss Insurance, by Firm Size, Region, and Industry, 2013
* Estimate is statistically different from estimate for all other firms not in the indicated size, region, or industry category (p<.05).
Note: For definitions of Self-Funded and Fully Insured plans, see the introduction to Section 10.
Source: Kaiser/HRET Survey of Employer-Sponsored Health Benefits, 2013.

section
tenPlan Funding
Employer Health Benefits 2 0 1 3 An n u a l S u r vey
T H E K A I S E R FA M I LY F O U N D AT I O N - A N D - H E A LT H R E S E A R C H & E D U C AT I O N A L T R U S T
10
188
Percentage of Covered Workers
in Partially or Completely Self-
Funded Plans
Percentage of Covered Workers Enrolled in a Self-Funded Plan that
Purchased Stoploss Insurance
Percentage of Covered Workers Enrolled in a Self-Funded Plan that
Purchases Stoploss
Insurance which Includes a Limit
on Per Employee Spending‡
Average Per Employee Claims
Cost at which Stoploss
Insurance Pays Benefit
(Attachment Point)‡
FIRM SIZE50-199 Workers 26%* 73% 93% $80,850*200-999 Workers 58 94* 87 139,790*1,000-4,999 Workers 79* 85* 91 245,144*5,000 or More Workers 94* 40* 87 478,518*
All Large Firms (200 or More Workers) 83%* 59% 88% $316,988*REGION
Northeast 63% 58% 92% $267,528 Midwest 64 73* 89 325,701South 67* 55 86 311,571West 47* 52 87 253,579
ALL FIRMS 61% 59% 88% $298,256
Exhibit 10.11Prevalence and Average Attachment Points of Stoploss Insurance, by Firm Size and Region, 2013
* Estimate is statistically different from estimate for all other firms not in the indicated size or region category (p<.05).
Source: Kaiser/HRET Survey of Employer-Sponsored Health Benefits, 2013
‡ This includes stoploss insurance plans that limit a firm's per employee spending as well as plans that limit both a firm's overall spending and per employee spending.
Note: There was insufficient data to report estimates for firms with 3 to 50 employees. For definitions of Self-Funded and Fully Insured plans, see the introduction to Section 10. Attachment points refer to the dollar amount at which stoploss coverage begins to pay for most or all of a claim.
Stoploss Insurance Limits Per Employee Spending
Stoploss Insurance
Limits Total Spending
Stoploss Insurance
Limits both Per Employee
and Total Spending
Other
50-199 Workers 64% 4% 29% 3%200-999 Workers 57 10 31 31,000-4,999 Workers 71 7 20 25,000 or More Workers 79 5 9 8
All Small Firms (3-199 Workers) 60% 11% 24% 6%All Large Firms (200 or More Workers) 71% 7% 18% 5%ALL FIRMS 70% 7% 18% 5%
Note: There was insufficient data to report estimates for firms with 3 to 50 employees.
Source: Kaiser/HRET Survey of Employer-Sponsored Health Benefits, 2013.
Exhibit 10.12Percentage of Covered Workers Enrolled in Partially or Completely Self-Insured Plans which
Purchase Different Types of Stoploss Insurance, by Firm Size, 2013

Employer Health Benefits 2 0 1 3 An n u a l S u r vey
T H E K A I S E R FA M I LY F O U N D AT I O N - A N D - H E A LT H R E S E A R C H & E D U C AT I O N A L T R U S T
189
10
section
tenPlan Funding
Stoploss Insurance Limits Per Employee Spending
Stoploss Insurance
Limits Total Spending
Stoploss Insurance
Limits both Per Employee
and Total Spending
Other
50-199 Workers 64% 4% 29% 3%200-999 Workers 57 10 31 31,000-4,999 Workers 71 7 20 25,000 or More Workers 79 5 9 8
All Small Firms (3-199 Workers) 60% 11% 24% 6%All Large Firms (200 or More Workers) 71% 7% 18% 5%ALL FIRMS 70% 7% 18% 5%
Note: There was insufficient data to report estimates for firms with 3 to 50 employees.
Source: Kaiser/HRET Survey of Employer-Sponsored Health Benefits, 2013.
Exhibit 10.12Percentage of Covered Workers Enrolled in Partially or Completely Self-Insured Plans which
Purchase Different Types of Stoploss Insurance, by Firm Size, 2013

section
tenPlan Funding
Employer Health Benefits 2 0 1 3 An n u a l S u r vey
T H E K A I S E R FA M I LY F O U N D AT I O N - A N D - H E A LT H R E S E A R C H & E D U C AT I O N A L T R U S T
10
190
Yes, Planning to Self Insure Because of the
ACA
No, Not Planning to Self Insure Because
of the ACADon't Know
FIRM SIZE3-24 Workers 7% 81% 12%25-49 Workers 1 92 650-199 Workers 1 86 13200-999 Workers 1 85 141,000-4,999 Workers 6 74 205,000 or More Workers NSD NSD NSD
All Small Firms (3-199 Workers) 6% 83% 11%All Large Firms (200 or More Workers) 1% 84% 15%REGION
Northeast 6% 81% 14%Midwest <1 90 10South 12 79 9West 3 83 14
ALL FIRMS OFFERING FULLY-INSURED PLANS 6% 83% 11%
Among Firms which Purchase Insurance Underwritten By an Insurer, The Percentage of Firms which Plan to Self-Insure because of Any Provision of the Affordable Care Act, by Firm Size and Region, 2013
Exhibit 10.13
Source: Kaiser/HRET Survey of Employer-Sponsored Health Benefits, 2013.
57%$16,3
51
$5,8
84
2013
Employer Health Benefits2 0 1 3 A N N U A L S U R V E Y
sect ion
Retiree Health Benefits
11

section
elevenR
etiree Health B
enefitsEmployer Health Benefits 2 0 1 3 An n u a l S u r vey
T H E K A I S E R FA M I LY F O U N D AT I O N - A N D - H E A LT H R E S E A R C H & E D U C AT I O N A L T R U S T
11
192
Section Eleven: Retiree Health Benefits
Retiree health benefits are an important consideration for older workers making
decisions about their retirement. Health benefits for retirees provide an important
supplement to Medicare for retirees age 65 or older. Among firms offering health
benefits to their workers, large firms (200 or more workers) are much more likely than
small firms (3-199 workers) to offer retiree health benefits to at least some of their former
employees.
Twenty-eight percent of large firms (200 or more workers) that offer health benefits to their employees offer retiree coverage in 2013, similar to 25% in 2012. There has been a downward trend in the percentage of firms offering retirees coverage, from 34% in 2006 and 66% in 1988 (Exhibit 11.1).
The offering of retiree health benefits varies considerably by firm characteristics.
o Large firms are much more likely to offer retiree health benefits than small firms –28% vs. 5% (Exhibit 11.2).
o Among large firms that offer health benefits, state and local governments (78%)and firms in the finance (52%) industry are more likely than large firms in other industries to offer retiree health benefits. In contrast, large firms in the wholesale industry are less likely (6%) to offer retiree health benefits when compared to large firms in other industries (Exhibit 11.2).
o Large firms with fewer lower-wage workers (less than 35% of workers earn $23,000 or less annually) are more likely to offer retiree health benefits than large firms with many lower-wage workers (35% or more of workers earn $23,000 or less annually) (32% vs. 6%). A comparable pattern exists in firms with a larger proportion of higher-wage workers (35% or more earn $56,000 or more annually) (Exhibit 11.3).
o Large firms with union workers are more likely to offer retiree health benefits than large firms without union workers – 45% vs. 22% (Exhibit 11.3).
o Large, publicly owned employers are more likely to offer retiree benefits than large private for-profits firms or private not-for-profits employers. (61% vs. 24% and 20%, respectively) (Exhibit 11.3).
Among all large firms (200 or more workers) offering retiree health benefits, most firms offer them to early retirees under the age of 65 (90%). A lower percentage (67%) of large firms offering retiree health benefits offer them to Medicare-age

Employer Health Benefits 2 0 1 3 An n u a l S u r vey
T H E K A I S E R FA M I LY F O U N D AT I O N - A N D - H E A LT H R E S E A R C H & E D U C AT I O N A L T R U S T
193
11
section
elevenR
etiree Health B
enefits
retirees (Exhibit 11.4). These percentages are similar to 2012 and have remained stable over time.
Among all large firms (200 or more workers) offering retiree health benefits, 4% offer coverage which exclusively covers prescription drugs (Exhibit 11.6).

section
elevenR
etiree Health B
enefitsEmployer Health Benefits 2 0 1 3 An n u a l S u r vey
T H E K A I S E R FA M I LY F O U N D AT I O N - A N D - H E A LT H R E S E A R C H & E D U C AT I O N A L T R U S T
11
194
Exhibit 11.1Among All Large Firms (200 or More Workers) Offering Health Benefits to Active Workers, Percentage of Firms Offering Retiree Health Benefits, 1988-2013
66%
46%
36%40% 40% 40%
34%37% 35% 36% 35%
32% 34% 32%29% 28% 26% 26% 25%
28%
0%
10%
20%
30%
40%
50%
60%
70%
80%
90%
100%
1988 1991 1993 1995 1998 1999 2000 2001 2002 2003 2004 2005 2006 2007 2008 2009 2010 2011 2012 2013
NOTE: Tests found no statistical difference from estimate for the previous year shown (p<.05). No statistical tests are conducted for years prior to 1999. SOURCE: Kaiser/HRET Survey of Employer-Sponsored Health Benefits, 1999-2013; KPMG Survey of Employer-Sponsored Health Benefits, 1991, 1993, 1995, 1998; The Health Insurance Association of America (HIAA), 1988.

Employer Health Benefits 2 0 1 3 An n u a l S u r vey
T H E K A I S E R FA M I LY F O U N D AT I O N - A N D - H E A LT H R E S E A R C H & E D U C AT I O N A L T R U S T
195
11
section
elevenR
etiree Health B
enefits
All Small Firms All Large Firms (3-199 Workers) (200 or More Workers)
FIRM SIZE3-199 Workers 5% -200-999 Workers - 26%*1,000-4,999 Workers - 345,000 or More Workers - 48*
REGIONNortheast 9% 29%Midwest 5 32South 5 26West 2* 23
INDUSTRYAgriculture/Mining/Construction <1%* 29%Manufacturing 1* 22Transportation/Communications/Utilities NSD 46*Wholesale 4 6*Retail 1* 14Finance 5 52*Service 5 26State/Local Government NSD 78*Health Care 7 19*
ALL FIRMS 5% 28%
* Estimate is statistically different within Small or Large Firm category from estimate for all other firms not in the indicated size, region, or industry category (p<.05).
Source: Kaiser/HRET Survey of Employer-Sponsored Health Benefits, 2013.
Among Firms Offering Health Benefits to Active Workers, Percentage of Firms Offering Retiree Health Benefits, by Firm Size, Region, and Industry, 2013
Exhibit 11.2
NSD: Not Sufficient Data.
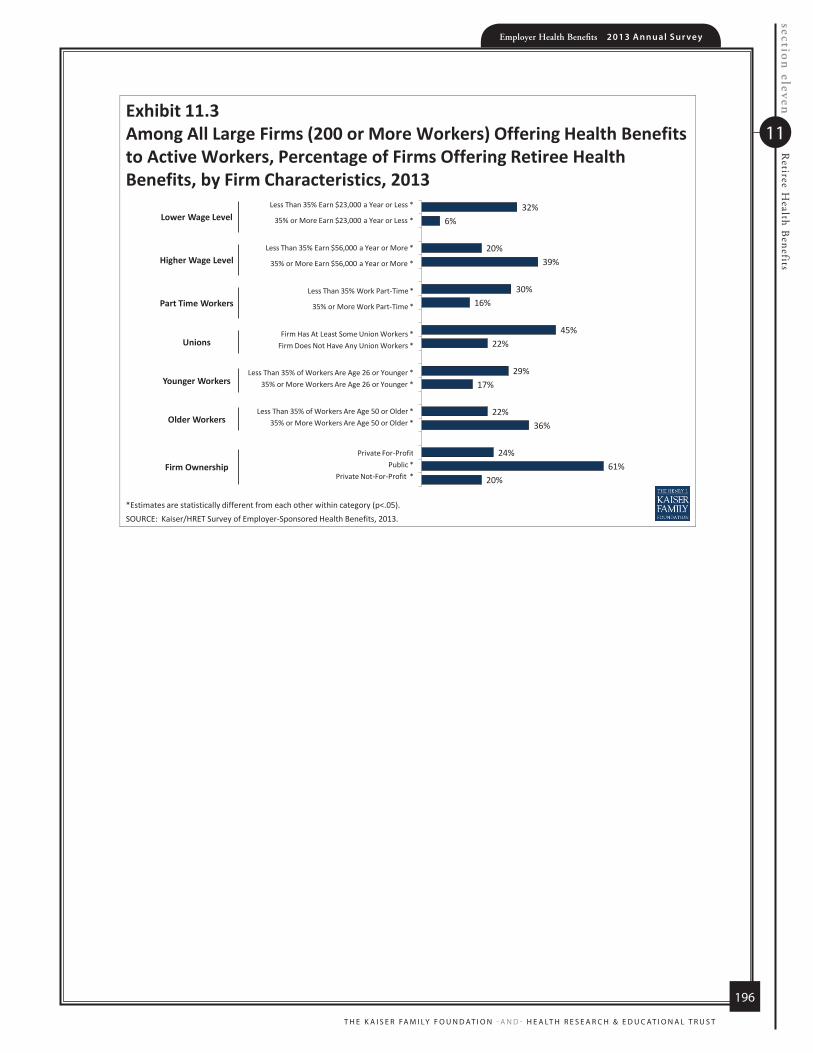
section
elevenR
etiree Health B
enefitsEmployer Health Benefits 2 0 1 3 An n u a l S u r vey
T H E K A I S E R FA M I LY F O U N D AT I O N - A N D - H E A LT H R E S E A R C H & E D U C AT I O N A L T R U S T
11
196
32%6%
20%39%
30%16%
45%22%
29%17%
22%36%
24%61%
20%
*Estimates are statistically different from each other within category (p<.05). SOURCE: Kaiser/HRET Survey of Employer-Sponsored Health Benefits, 2013.
Exhibit 11.3Among All Large Firms (200 or More Workers) Offering Health Benefits to Active Workers, Percentage of Firms Offering Retiree Health Benefits, by Firm Characteristics, 2013
Lower Wage LevelLess Than 35% Earn $23,000 a Year or Less *
35% or More Earn $23,000 a Year or Less *
Higher Wage LevelLess Than 35% Earn $56,000 a Year or More *
35% or More Earn $56,000 a Year or More *
Part Time WorkersLess Than 35% Work Part-Time *
35% or More Work Part-Time *
UnionsFirm Has At Least Some Union Workers *
Firm Does Not Have Any Union Workers *
Younger WorkersLess Than 35% of Workers Are Age 26 or Younger *
35% or More Workers Are Age 26 or Younger *
Older WorkersLess Than 35% of Workers Are Age 50 or Older *
35% or More Workers Are Age 50 or Older *
Firm OwnershipPrivate For-Profit
Public * Private Not-For-Profit *

Employer Health Benefits 2 0 1 3 An n u a l S u r vey
T H E K A I S E R FA M I LY F O U N D AT I O N - A N D - H E A LT H R E S E A R C H & E D U C AT I O N A L T R U S T
197
11
section
elevenR
etiree Health B
enefits
Exhibit 11.4Among All Large Firms (200 or More Workers) Offering Health Benefits to Active Workers and Offering Retiree Coverage, Percentage of Firms Offering Health Benefits to Early and Medicare-Age Retirees, 2000–2013
*Estimate is statistically different from estimate for the previous year shown (p<.05).NOTE: Early Retirees are workers retiring before the age of 65.SOURCE: Kaiser/HRET Survey of Employer-Sponsored Health Benefits, 2000-2013.
88%
98%* 96%92%
96% 94% 94% 92% 93% 90% 93% 91% 88% 90%
70% 71% 74% 76%73%
80%76%
69%74%
66%
74%71%
74%
67%
0%
10%
20%
30%
40%
50%
60%
70%
80%
90%
100%
2000 2001 2002 2003 2004 2005 2006 2007 2008 2009 2010 2011 2012 2013
Offer Health Benefits to Early Retirees
Offer Health Benefits to Medicare-Age Retirees

section
elevenR
etiree Health B
enefitsEmployer Health Benefits 2 0 1 3 An n u a l S u r vey
T H E K A I S E R FA M I LY F O U N D AT I O N - A N D - H E A LT H R E S E A R C H & E D U C AT I O N A L T R U S T
11
198
Percentage of Large Employers Offering
Retiree Health Benefits to Early Retirees
Percentage of Large Employers Offering
Retiree Health Benefits to Medicare-Age Retirees
FIRM SIZE200-999 Workers 89% 66%1,000-4,999 Workers 94 685,000 or More Workers 95 73
REGIONNortheast 85% 78%Midwest 94 53*South 91 68West 90 77
INDUSTRYAgriculture/Mining/Construction NSD NSDManufacturing 100%* 71%Transportation/Communications/Utilities 95 85*Wholesale NSD NSDRetail NSD NSDFinance 90 62Service 87 69State/Local Government 93 74Health Care 84 53
ALL LARGE FIRMS (200 or More Workers) 90% 67%
NSD: Not Sufficient Data.
Source: Kaiser/HRET Survey of Employer-Sponsored Health Benefits, 2013.
Among All Large Firms (200 or More Workers) Offering Health Benefits to Active Workers and Offering Retiree Coverage, Percentage of Firms Offering Retiree Health Benefits to
Early and Medicare-Age Retirees, by Firm Size, Region, and Industry, 2013
Exhibit 11.5
* Estimate is statistically different from estimate for all other large firms not in the indicated size, region, or industry category (p<.05).
Note: Early Retirees are workers retiring before age 65.

Employer Health Benefits 2 0 1 3 An n u a l S u r vey
T H E K A I S E R FA M I LY F O U N D AT I O N - A N D - H E A LT H R E S E A R C H & E D U C AT I O N A L T R U S T
199
11
section
elevenR
etiree Health B
enefits
Percentage of Large Employers Offering Retiree Health Benefits
That Exclusively Cover Prescription Drugs
FIRM SIZE200-999 Workers 4%1,000-4,999 Workers 65,000 or More Workers 6
REGIONNortheast 6%Midwest 4South 3West 4
INDUSTRYAgriculture/Mining/Construction NSDManufacturing 5%Transportation/Communications/Utilities 5Wholesale NSDRetail NSDFinance <1*Service 4State/Local Government 4Health Care 11
ALL LARGE FIRMS (200 or More Workers) 4%
Source: Kaiser/HRET Survey of Employer-Sponsored Health Benefits, 2013.
Exhibit 11.6Among All Large Firms (200 or More Workers) Offering Health Benefits to
Active Workers and Offering Retiree Coverage, Percentage of Firms Whose Retiree Health Benefits Cover Exclusively Prescription Drugs, by Firm Size,
Region, and Industry, 2013
* Estimate is statistically different from estimate for all other large firms not in the indicated size, region, or industry category (p<.05).
NSD: Not Sufficient Data.
57%$16,3
51
$5,8
84
2013
Employer Health Benefits2 0 1 3 A N N U A L S U R V E Y
sect ion
Wellness Programs and Health RiskAssessments
12

Employer Health Benefits 2 0 1 3 An n u a l S u r vey
T H E K A I S E R FA M I LY F O U N D AT I O N - A N D - H E A LT H R E S E A R C H & E D U C AT I O N A L T R U S T
201
12
section
twelve
Wellness Program
s and Health R
isk Assessm
ents
Section Twelve: Wellness Programs and Health Risk Assessments A majority of firms offering health benefits offers some type of wellness program, with
large firms (200 or more workers) being more likely than smaller firms (3-199 workers) to
do so. Thirty-six percent of large firms and 8% of small firms offering at least one
wellness benefit offer financial incentives to employees who participate in wellness
programs. Twenty-four percent of firms offer employees the opportunity to complete
health risk assessments, with some of these firms tying financial penalties or rewards to
employees who do so. Disease management programs remain common among firms
offering health benefits with over half of these firms and more than three-quarters of
large firms (200 or more workers) having at least one of the specified programs. Wellness Benefits For a variety of reasons, including efforts to improve health and lower costs, many
employers and health plans offer wellness programs. Wellness programs may range from classes in nutrition or healthy living to a wellness newsletter. o Seventy-seven percent of firms offering health benefits offer at least one of the
following wellness programs:
Weight loss programs Biometric screenings Gym membership discounts or on-site exercise facilities Smoking cessation program Lifestyle or behavioral coaching, classes in nutrition or healthy
living Web-based resources for healthy living Flu shot or vaccinations Employee assistance program (EAP) Wellness newsletter
o In the 2012 survey, offering firms were not asked if they offered an “EAP” or “flu
shots and vaccinations”. Excluding these two categories, 69% of all firms offering health benefits also offered one of the listed wellness programs in 2013, similar to the amount in 2012 (63%).
o Large firms (200 or more workers) offering health benefits are more likely to offer
each of the listed wellness programs than smaller firms. In addition, large firms (200 or more workers) offering health benefits are more likely to offer at least one of the listed wellness programs than smaller firms (99% vs. 76%) (Exhibit 12.2).

section
twelve
Wellness Program
s and Health R
isk Assessm
entsEmployer Health Benefits 2 0 1 3 An n u a l S u r vey
T H E K A I S E R FA M I LY F O U N D AT I O N - A N D - H E A LT H R E S E A R C H & E D U C AT I O N A L T R U S T
12
202
o About half of firms offering health benefits offer flu shots or vaccinations (54%), a wellness newsletter (48%) or web-based resources for healthy living (47%). The offer rate for each type of wellness benefit included in the survey is presented in Exhibit 12.1, Exhibit 12.2 and Exhibit 12.3.
o Forty-eight percent of firms offering health benefits and at least one wellness benefit offer wellness benefits to spouses or dependents. Large firms (200 or more workers) offering at least one wellness benefit are more likely than smaller firms to offer wellness benefits to spouses or dependents (65% vs. 47%) (Exhibit 12.4).
o Among firms offering health benefits and at least one wellness program, 80% report that most of the wellness benefits they offer are provided by the health plan (Exhibit 12.4).1 Small firms (3 to 199 workers) are more likely than larger firms to report that most wellness programs are provided by the health plan (81% vs. 56%) (Exhibit 12.4).
Incentives for Wellness benefits: In order to encourage participation in wellness programs, firms may offer financial
incentives to employees who participate.2
o Eight percent of firms offering health benefits and at least one of the listed wellness programs offer gift cards, travel, merchandise, or cash to workers who participate in wellness programs. Large firms (200 or more workers) are more likely to offer these incentives than smaller firms (26% vs. 7%) (Exhibit 12.5).
o A small percentage of firms offering health benefits and at least one of the listed
wellness programs offers lower worker premium contributions (3%) or cost sharing (such as lower deductibles) (1%) as an incentive to encourage employees to participate. Among firms that offer a high-deductible health plan paired with a HRA or HSA, one percent offers workers who participate in wellness programs higher HSA or HRA contributions (Exhibit 12.5).
Employers use a variety of strategies to promote wellness programs. Large
employers (200 or more employees) offering health benefits and at least one wellness program are more likely than smaller employers to use one of the following strategies to promote wellness (79% vs. 55%) (exhibit 12.11):
o Assigning an employee to promote wellness o Access to a benefits counselor o Incentives o Personalized communication o Team competitions o Social media tools
1 The survey asks firms offering at least one wellness program if most of the wellness benefits are provided by the health plan or by the firm. 2 Firms that offer only web-based resources or a wellness newsletter were not asked questions about any financial incentives provided.

Employer Health Benefits 2 0 1 3 An n u a l S u r vey
T H E K A I S E R FA M I LY F O U N D AT I O N - A N D - H E A LT H R E S E A R C H & E D U C AT I O N A L T R U S T
203
12
section
twelve
Wellness Program
s and Health R
isk Assessm
ents
Nearly half of large firms (200 or more workers) offering health benefits and at least one wellness program use personalized communication (49%) or assign an employee (45%) to promote wellness programs.
Employers use a range of strategies to evaluate wellness programs. Seventy-two
percent of large firms (200 or more workers) offering health benefits and at least one wellness program and 34% of smaller firms use at least one of the following evaluation methods (Exhibit 12.12):
o Return on investment o Health outcomes o Employee retention o Employee participation o Employee satisfaction
For large firms (200 or more workers) offering health benefits and at least one
wellness benefit, employee participation is the most common metric (65%) (Exhibit 12.12).
Health Risk Assessments Some firms give their employees the opportunity to complete a health risk
assessment to identify potential health issues. Health risk assessments generally include questions about medical history, health status, and lifestyle. o Overall, 24% of firms offering health benefits ask their employees to complete a
health risk assessment. Large firms (200 or more workers) are more likely than smaller firms to offer employees this option (55% vs. 23%) (Exhibit 12.6).
Some firms offer financial incentives to encourage employees to complete health risk
assessments.
o Fifty-four percent of large firms (200 or more workers) offering health benefits and health risk assessments give financial incentives to employees who complete a health risk assessment.
o Five percent of large firms (200 or more workers) who offer health benefits and
health risk assessments require employees to complete a health risk assessment in order to enroll in a health plan.
o Nine percent of large firms (200 or more workers) that offer health benefits and
provide employees the opportunity to complete a health risk assessment penalize employees with identified health risks factors who do not complete a wellness program (9%) (Exhibit 12.7).
Biometric Screening Biometric screening is a health examination that measures an employee's risk factors, such as cholesterol, blood pressure, stress, and nutrition. Biometric outcomes may include meeting a target body mass index (BMI) or cholesterol level. Twenty-six percent

section
twelve
Wellness Program
s and Health R
isk Assessm
entsEmployer Health Benefits 2 0 1 3 An n u a l S u r vey
T H E K A I S E R FA M I LY F O U N D AT I O N - A N D - H E A LT H R E S E A R C H & E D U C AT I O N A L T R U S T
12
204
of small firms (3 to 199 workers) and 55% of larger firms offering health benefits offer biometric screenings as a wellness benefit (Exhibit 12.1). Firms which offer their employees biometric screenings may include additional incentives for those employees who complete screenings. Among large firms (200 or more workers) offering health benefits and biometric screenings, eleven percent reward or penalize employees for meeting biometric outcomes and eleven percent require employees to complete biometric screenings in order to enroll in a health plan (Exhibit 12.14). Disease Management Disease management programs try to improve the health of and reduce the
associated costs of people with chronic illnesses by teaching patients about their disease, suggesting treatment options, and assessing the treatment process and outcomes. o Fifty-seven percent of firms offering health benefits offers one or more of the
following disease management programs in their largest plan3 (Exhibit 12.8):
Diabetes Asthma Hypertension High cholesterol Lower back pain Depression Obesity
o Large firms (200 or more workers) offering health benefits are more likely than smaller firms to have a disease management program (77% vs. 57%) (Exhibit 12.9). Seventy-three percent of large firms offering health benefits have a disease management program for diabetes.
o To encourage participation, two percent of firms offering health benefits and at least one of the specified disease management programs also offer financial incentives to employees who participate in these programs (Exhibit 12.10). Large, offering firms (200 or more workers) that offer disease management programs are more likely than smaller firms to have an incentive for participating in a disease management program (8% vs. 2%).
3 In 2013, firms were asked if they offer each of the specified disease management programs. In previous years, firms were asked if they offered a disease management program and then were accordingly asked about specified programs. For this reasons, the estimate of the number of firms offering a disease management program in 2013 is not comparable to the estimates from 2010 and 2008.
Gym
M
embe
rshi
p D
isco
unts
or
On-
Site
E
xerc
ise
Faci
litie
s
Sm
okin
g C
essa
tion
Pro
gram
Web
-bas
ed
Res
ourc
es fo
r H
ealth
y Li
ving
Wel
lnes
s N
ewsl
ette
r
Life
styl
e or
B
ehav
iora
l C
oach
ing
Bio
met
ric
Scr
eeni
ng^
Wei
ght L
oss
Pro
gram
s
FIRM
SIZ
E3-
24 W
orke
rs15
%*
36%
*41
%*
44%
*30
%*
24%
29%
*25
-199
Wor
kers
42*
49*
64*
59*
4033
3920
0-99
9 W
orke
rs67
*69
*76
*60
*54
*52
*56
*1,
000-
4,99
9 W
orke
rs75
*76
*87
*61
*69
*67
*67
*5,
000
or M
ore
Wor
kers
84*
91*
93*
66*
78*
77*
82*
All S
mal
l Firm
s (3
-199
Wor
kers
)21
%*
39%
*47
%*
47%
*33
%*
26%
*31
%*
All L
arge
Firm
s (2
00 o
r Mor
e W
orke
rs)
69%
*71
%*
78%
*60
%*
57%
*55
%*
58%
*RE
GIO
NN
orth
east
35%
*41
%44
%48
%37
%23
%42
%M
idw
est
2830
5158
3230
33S
outh
14*
3846
4033
2426
Wes
t17
5149
4832
3129
INDU
STRY
Agr
icul
ture
/Min
ing/
Con
stru
ctio
n17
%25
%31
%46
%25
%10
%*
23%
Man
ufac
turin
g20
3546
25*
2114
*21
Tran
spor
tatio
n/C
omm
unic
atio
ns/U
tiliti
es15
2541
75*
69*
2016
Who
lesa
le17
6862
3928
10*
56R
etai
l35
3059
5317
1650
Fina
nce
2261
86*
6353
77*
36S
ervic
e23
4048
4737
3233
Sta
te/L
ocal
Gov
ernm
ent
1835
2745
8*8*
14*
Hea
lth C
are
3044
3253
2521
32AL
L FI
RMS
22%
40%
47%
48%
33%
27%
32%
Bio
met
ric s
cree
ning
is a
hea
lth e
xam
inat
ion
that
mea
sure
s an
em
ploy
ee's
risk
fact
ors
such
as
chol
este
rol,
bloo
d pr
essu
re, s
tress
, and
nut
ritio
n.
Sou
rce:
Kai
ser/H
RE
T S
urve
y of
Em
ploy
er-S
pons
ored
Hea
lth B
enef
its, 2
013.
Not
e: T
he o
ffer r
ates
for a
dditi
onal
type
s of
wel
lnes
s pr
ogra
ms
are
pres
ente
d in
Exh
ibit
12.2
.
* E
stim
ate
is s
tatis
tical
ly d
iffer
ent w
ithin
type
of w
elln
ess
prog
ram
from
est
imat
e fo
r all
othe
r firm
s no
t in
the
indi
cate
d si
ze, r
egio
n, o
r ind
ustry
ca
tego
ry (p
<.05
).
Amon
g Fi
rms
Offe
ring
Heal
th B
enef
its, P
erce
ntag
e O
fferin
g a
Parti
cula
r Wel
lnes
s Pr
ogra
m to
The
ir Em
ploy
ees,
by
Firm
Siz
e, R
egio
n,
and
Indu
stry
, 201
3
Exhi
bit 1
2.1

Employer H
ealth Benefits 2
01
3 A
nn
ua
l Su
rvey
TH
E K
AIS
ER
FAM
ILY F
OU
ND
AT
ION
-AN
D- H
EA
LTH
RE
SE
AR
CH
& E
DU
CA
TIO
NA
L T
RU
ST
205
12 section twelveWellness Programs and Health Risk Assessments
Gym Membership Discounts or
On-Site Exercise Facilities
Smoking Cessation Program
Web-based Resources for Healthy Living
Wellness Newsletter
Lifestyle or Behavioral Coaching
Biometric Screening^
Weight Loss Programs
FIRM SIZE3-24 Workers 15%* 36%* 41%* 44%* 30%* 24% 29%*25-199 Workers 42* 49* 64* 59* 40 33 39200-999 Workers 67* 69* 76* 60* 54* 52* 56*1,000-4,999 Workers 75* 76* 87* 61* 69* 67* 67*5,000 or More Workers 84* 91* 93* 66* 78* 77* 82*
All Small Firms (3-199 Workers) 21%* 39%* 47%* 47%* 33%* 26%* 31%*All Large Firms (200 or More Workers) 69%* 71%* 78%* 60%* 57%* 55%* 58%*REGION
Northeast 35%* 41% 44% 48% 37% 23% 42%Midwest 28 30 51 58 32 30 33South 14* 38 46 40 33 24 26West 17 51 49 48 32 31 29
INDUSTRYAgriculture/Mining/Construction 17% 25% 31% 46% 25% 10%* 23%Manufacturing 20 35 46 25* 21 14* 21Transportation/Communications/Utilities 15 25 41 75* 69* 20 16Wholesale 17 68 62 39 28 10* 56Retail 35 30 59 53 17 16 50Finance 22 61 86* 63 53 77* 36Service 23 40 48 47 37 32 33State/Local Government 18 35 27 45 8* 8* 14*Health Care 30 44 32 53 25 21 32
ALL FIRMS 22% 40% 47% 48% 33% 27% 32%
Biometric screening is a health examination that measures an employee's risk factors such as cholesterol, blood pressure, stress, and nutrition.
Source: Kaiser/HRET Survey of Employer-Sponsored Health Benefits, 2013.
Note: The offer rates for additional types of wellness programs are presented in Exhibit 12.2.
* Estimate is statistically different within type of wellness program from estimate for all other firms not in the indicated size, region, or industry category (p<.05).
Among Firms Offering Health Benefits, Percentage Offering a Particular Wellness Program to Their Employees, by Firm Size, Region, and Industry, 2013
Exhibit 12.1
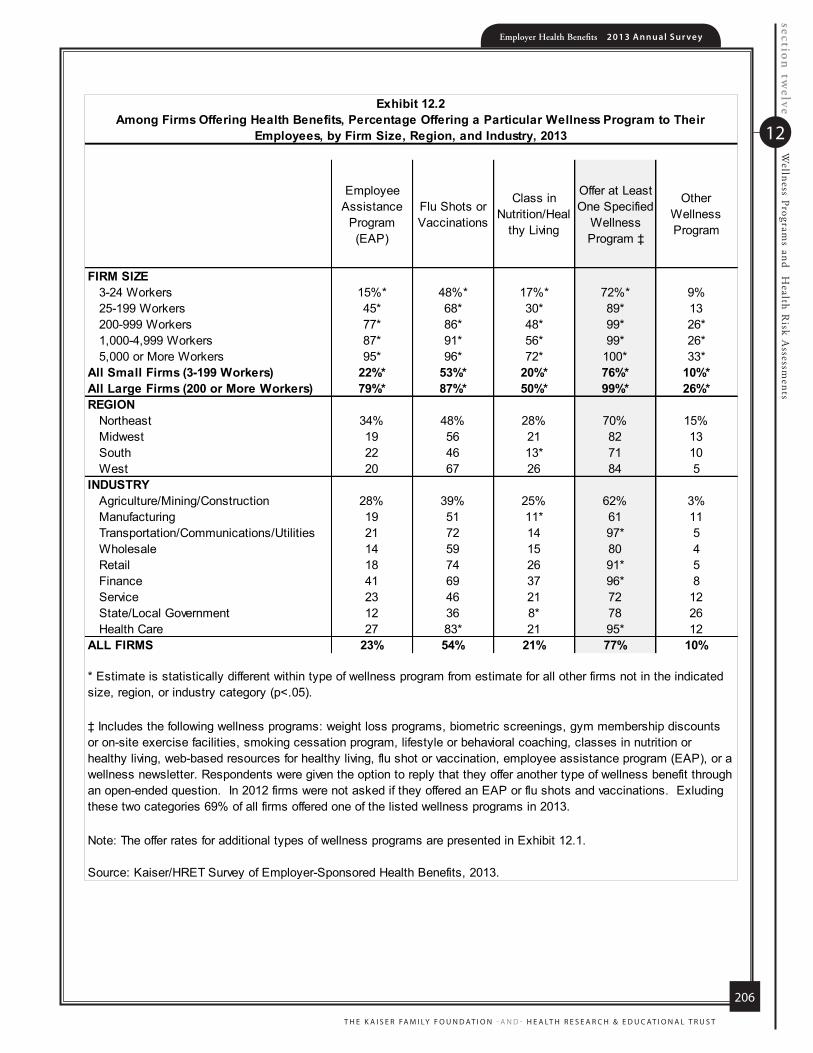
section
twelve
Wellness Program
s and Health R
isk Assessm
entsEmployer Health Benefits 2 0 1 3 An n u a l S u r vey
T H E K A I S E R FA M I LY F O U N D AT I O N - A N D - H E A LT H R E S E A R C H & E D U C AT I O N A L T R U S T
12
206
Employee Assistance
Program (EAP)
Flu Shots or Vaccinations
Class in Nutrition/Heal
thy Living
Offer at Least One Specified
Wellness Program ‡
Other Wellness Program
FIRM SIZE3-24 Workers 15%* 48%* 17%* 72%* 9%25-199 Workers 45* 68* 30* 89* 13200-999 Workers 77* 86* 48* 99* 26*1,000-4,999 Workers 87* 91* 56* 99* 26*5,000 or More Workers 95* 96* 72* 100* 33*
All Small Firms (3-199 Workers) 22%* 53%* 20%* 76%* 10%*All Large Firms (200 or More Workers) 79%* 87%* 50%* 99%* 26%*REGION
Northeast 34% 48% 28% 70% 15%Midwest 19 56 21 82 13South 22 46 13* 71 10West 20 67 26 84 5
INDUSTRYAgriculture/Mining/Construction 28% 39% 25% 62% 3%Manufacturing 19 51 11* 61 11Transportation/Communications/Utilities 21 72 14 97* 5Wholesale 14 59 15 80 4Retail 18 74 26 91* 5Finance 41 69 37 96* 8Service 23 46 21 72 12State/Local Government 12 36 8* 78 26Health Care 27 83* 21 95* 12
ALL FIRMS 23% 54% 21% 77% 10%
‡ Includes the following wellness programs: weight loss programs, biometric screenings, gym membership discounts or on-site exercise facilities, smoking cessation program, lifestyle or behavioral coaching, classes in nutrition or healthy living, web-based resources for healthy living, flu shot or vaccination, employee assistance program (EAP), or a wellness newsletter. Respondents were given the option to reply that they offer another type of wellness benefit through an open-ended question. In 2012 firms were not asked if they offered an EAP or flu shots and vaccinations. Exluding these two categories 69% of all firms offered one of the listed wellness programs in 2013.
* Estimate is statistically different within type of wellness program from estimate for all other firms not in the indicated size, region, or industry category (p<.05).
Source: Kaiser/HRET Survey of Employer-Sponsored Health Benefits, 2013.
Exhibit 12.2Among Firms Offering Health Benefits, Percentage Offering a Particular Wellness Program to Their
Employees, by Firm Size, Region, and Industry, 2013
Note: The offer rates for additional types of wellness programs are presented in Exhibit 12.1.
Exhibit 12.3Among Firms Offering Health Benefits, Percentage Offering a Particular Wellness Program to Their Employees, by Firm Size, 2013
* Estimate is statistically different between All Small Firms and All Large Firms within category (p<.05). ^ Biometric screening is a health examination that measures an employee's risk factors such as cholesterol, blood pressure, stress, and nutrition. SOURCE: Kaiser/HRET Survey of Employer-Sponsored Health Benefits, 2013.
10%
21%
39%
47%
47%
33%
26%
31%
22%
53%
20%
76%
26%
69%
71%
78%
60%
57%
55%
58%
79%
87%
50%
99%
0% 20% 40% 60% 80% 100%
Other Wellness Program*
Gym Membership Discounts orOn-Site Exercise Facilities*
Smoking Cessation Program*
Web-based Resources for HealthyLiving*
Wellness Newsletter*
Lifestyle or Behavioral Coaching*
Biometric Screening*^
Weight Loss Programs*
Employee Assistance Program (EAP)*
Flu Shot or Vaccinations*
Class in Nutrition/Healthy Living*
Offer at Least OneSpecified Wellness Program*
All Large Firms (200 orMore Workers)
All Small Firms (3-199Workers)
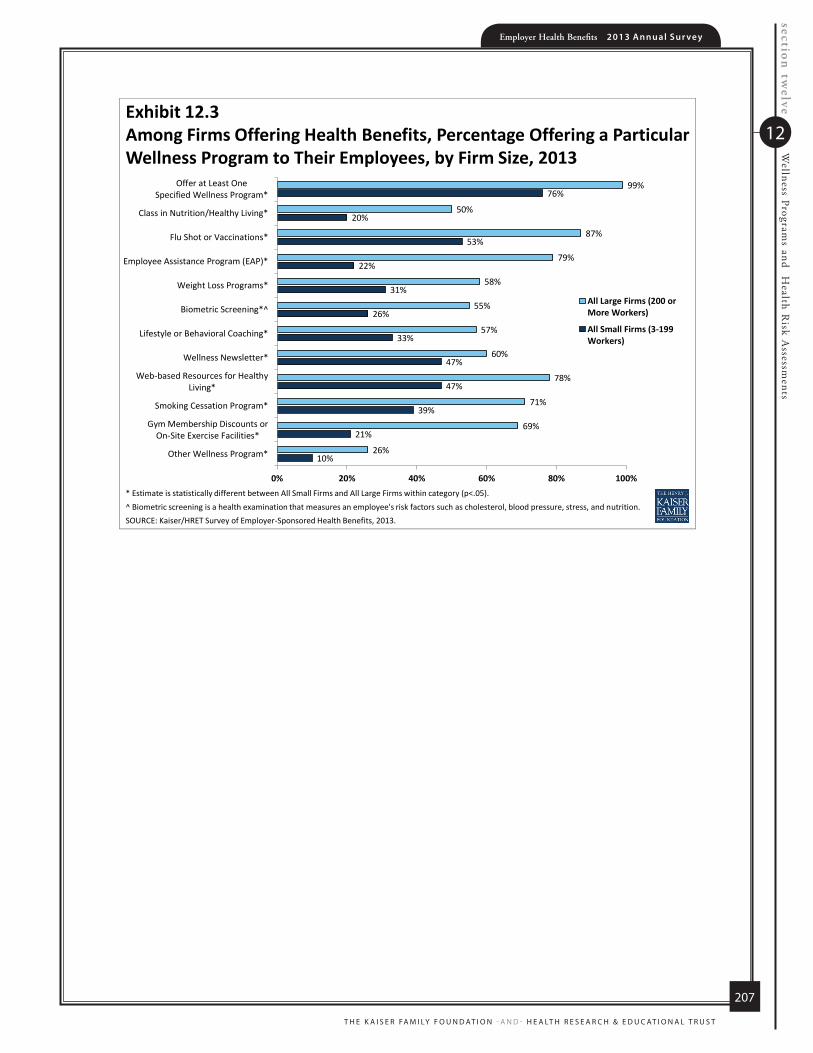
Employer Health Benefits 2 0 1 3 An n u a l S u r vey
T H E K A I S E R FA M I LY F O U N D AT I O N - A N D - H E A LT H R E S E A R C H & E D U C AT I O N A L T R U S T
207
12
section
twelve
Wellness Program
s and Health R
isk Assessm
ents
Exhibit 12.3Among Firms Offering Health Benefits, Percentage Offering a Particular Wellness Program to Their Employees, by Firm Size, 2013
* Estimate is statistically different between All Small Firms and All Large Firms within category (p<.05). ^ Biometric screening is a health examination that measures an employee's risk factors such as cholesterol, blood pressure, stress, and nutrition. SOURCE: Kaiser/HRET Survey of Employer-Sponsored Health Benefits, 2013.
10%
21%
39%
47%
47%
33%
26%
31%
22%
53%
20%
76%
26%
69%
71%
78%
60%
57%
55%
58%
79%
87%
50%
99%
0% 20% 40% 60% 80% 100%
Other Wellness Program*
Gym Membership Discounts orOn-Site Exercise Facilities*
Smoking Cessation Program*
Web-based Resources for HealthyLiving*
Wellness Newsletter*
Lifestyle or Behavioral Coaching*
Biometric Screening*^
Weight Loss Programs*
Employee Assistance Program (EAP)*
Flu Shot or Vaccinations*
Class in Nutrition/Healthy Living*
Offer at Least OneSpecified Wellness Program*
All Large Firms (200 orMore Workers)
All Small Firms (3-199Workers)

section
twelve
Wellness Program
s and Health R
isk Assessm
entsEmployer Health Benefits 2 0 1 3 An n u a l S u r vey
T H E K A I S E R FA M I LY F O U N D AT I O N - A N D - H E A LT H R E S E A R C H & E D U C AT I O N A L T R U S T
12
208
Wellness Benefits Offered to Spouses or Dependents
Most Wellness Benefits Are Provided By the
Health Plan instead of Firm
FIRM SIZE3-24 Workers 42%* 85%*25-199 Workers 61* 71*200-999 Workers 64* 59*1,000-4,999 Workers 65* 46*5,000 or More Workers 73* 44*
All Small Firms (3-199 Workers) 47%* 81%*All Large Firms (200 or More Workers) 65%* 56%*REGION
Northeast 59% 89%Midwest 67* 76South 35 74West 36 86
ALL FIRMS 48% 80%
Source: Kaiser/HRET Survey of Employer-Sponsored Health Benefits, 2013.
Exhibit 12.4Among Firms Offering Health Benefits and Wellness Programs, Percentage of Firms with
the Following Features of Wellness Benefits, by Firm Size and Region, 2013
* Estimate is statistically different from estimate for all other firms not in the indicated size or region (p<.05).
Note: The survey asked these questions to firms offering at least one of the following wellness programs: "weight loss programs", "gym membership discounts or on-site exercise facilities", "smoking cessation programs", "personal health coaching", "classes in nutrition or healthy living", "biometric screening", "flu shots or vaccinations", or "Employee Assistance Programs".
Workers Pay Smaller Percentage
of the Premium
Workers Have
Smaller Deductible
Receive Higher HRA
or HSA Contributions‡
Receive Gift Cards, Travel,
Merchandise, or Cash
Any Financial
Incentive to Participate in Wellness Program ~
FIRM SIZE3-24 Workers 2% <1% 0%* 4%* 5%*25-199 Workers 4 2 2 16* 19*200-999 Workers 10* 2* 5* 24* 32*1,000-4,999 Workers 22* 5* 19* 34* 53*5,000 or More Workers 27* 6* 26* 38* 64*
All Small Firms (3-199 Workers) 3%* 1%* 1%* 7%* 8%*All Large Firms (200 or More Workers) 12%* 3%* 8%* 26%* 36%*REGION
Northeast 2% <1%* 1% 10% 11%Midwest 8 1 2 15 19*South 1 1 1 3* 4*West 2 <1 <1 4 6
ALL FIRMS 3% 1% 1% 8% 10%
Source: Kaiser/HRET Survey of Employer-Sponsored Health Benefits, 2013.
Among Firms Offering Health and Wellness Benefits, Percentage of Firms That Offer Specific Incentives to Employees Who Participate in Wellness Programs, by Firm Size and Region, 2013
Exhibit 12.5
‡ Only firms that offer an HDHP/HRA or HSA-qualified HDHP were asked if participating employees receive higher HRA/HSA contributions as an incentive to participate in wellness programs.
* Estimate is statistically different within type of incentive from estimate for all other firms not in the indicated size or region (p<.05).
~ Any financial incentive indicates firms that offer employees who participate in wellness programs one of the following incentives: smaller premium contributions, smaller deductibles, higher HRA or HSA contributions, or gift cards, travel, merchandise, or cash.

Employer Health Benefits 2 0 1 3 An n u a l S u r vey
T H E K A I S E R FA M I LY F O U N D AT I O N - A N D - H E A LT H R E S E A R C H & E D U C AT I O N A L T R U S T
209
12
section
twelve
Wellness Program
s and Health R
isk Assessm
ents
Workers Pay Smaller Percentage
of the Premium
Workers Have
Smaller Deductible
Receive Higher HRA
or HSA Contributions‡
Receive Gift Cards, Travel,
Merchandise, or Cash
Any Financial
Incentive to Participate in Wellness Program ~
FIRM SIZE3-24 Workers 2% <1% 0%* 4%* 5%*25-199 Workers 4 2 2 16* 19*200-999 Workers 10* 2* 5* 24* 32*1,000-4,999 Workers 22* 5* 19* 34* 53*5,000 or More Workers 27* 6* 26* 38* 64*
All Small Firms (3-199 Workers) 3%* 1%* 1%* 7%* 8%*All Large Firms (200 or More Workers) 12%* 3%* 8%* 26%* 36%*REGION
Northeast 2% <1%* 1% 10% 11%Midwest 8 1 2 15 19*South 1 1 1 3* 4*West 2 <1 <1 4 6
ALL FIRMS 3% 1% 1% 8% 10%
Source: Kaiser/HRET Survey of Employer-Sponsored Health Benefits, 2013.
Among Firms Offering Health and Wellness Benefits, Percentage of Firms That Offer Specific Incentives to Employees Who Participate in Wellness Programs, by Firm Size and Region, 2013
Exhibit 12.5
‡ Only firms that offer an HDHP/HRA or HSA-qualified HDHP were asked if participating employees receive higher HRA/HSA contributions as an incentive to participate in wellness programs.
* Estimate is statistically different within type of incentive from estimate for all other firms not in the indicated size or region (p<.05).
~ Any financial incentive indicates firms that offer employees who participate in wellness programs one of the following incentives: smaller premium contributions, smaller deductibles, higher HRA or HSA contributions, or gift cards, travel, merchandise, or cash.

section
twelve
Wellness Program
s and Health R
isk Assessm
entsEmployer Health Benefits 2 0 1 3 An n u a l S u r vey
T H E K A I S E R FA M I LY F O U N D AT I O N - A N D - H E A LT H R E S E A R C H & E D U C AT I O N A L T R U S T
12
210
Offer Employees Opportunity to Complete Health Risk Assessment
FIRM SIZE3-24 Workers 21%*25-199 Workers 32*200-999 Workers 49*1,000-4,999 Workers 75*5,000 or More Workers 81*
All Small Firms (3-199 Workers) 23%*All Large Firms (200 or More Workers) 55%*REGION
Northeast 19%Midwest 28South 19West 33
INDUSTRYAgriculture/Mining/Construction 13%Manufacturing 30Transportation/Communications/Utilities 23Wholesale 37Retail 17Finance 48Service 21State/Local Government 8*Health Care 31
ALL FIRMS 24%
* Estimate is statistically different from all firms not in the indicated size, region or industry category (p<.05).
Note: A health risk assessment or appraisal includes questions on medical history, health status, and lifestyle and is designed to identify the health risks of the person being assessed.
Source: Kaiser/HRET Survey of Employer-Sponsored Health Benefits, 2013.
Among Firms Offering Health Benefits, Percentage of Firms That Offer Employees the Opportunity to Complete a Health Risk Assessment, by Firm Size, Region and
Industry, 2013
Exhibit 12.6

Employer Health Benefits 2 0 1 3 An n u a l S u r vey
T H E K A I S E R FA M I LY F O U N D AT I O N - A N D - H E A LT H R E S E A R C H & E D U C AT I O N A L T R U S T
211
12
section
twelve
Wellness Program
s and Health R
isk Assessm
ents
Exhibit 12.7Among Firms That Offer Health Benefits and Provide Employees the Opportunity to Complete a Health Risk Assessment, The Percentage of Firms who have Incentives and Penalties for Various Employee Actions, by Firm Size, 2013
18%
54%
5%9%
0%
20%
40%
60%
80%
100%
Financial Incentives for Employees thatComplete Health Risk Assessment*
Employees Required to Complete a HealthRisk Assessment to Enroll in Health Plan~
Employees with Identified Health RiskFactor Must Complete Wellness Program
or Face a Financial Penalty~
All Small Firms (3-199 Workers)
All Large Firms (200 or More Workers)
* Estimate is statistically different between All Small Firms and All Large Firms within category (p<.05). ~ All Small Firms are not shown due to large relative standard errors, indicating a high level of variability.NOTE: Twenty-four percent of firms which offer health benefits offer their employees the opportunity to complete a health risk assessment (See Exhibit 12.6).SOURCE: Kaiser/HRET Survey of Employer-Sponsored Health Benefits, 2013.

section twelveWellness Programs and Health Risk AssessmentsEm
ployer Health B
enefits 20
13
An
nu
al S
urve
y
TH
E K
AIS
ER
FAM
ILY F
OU
ND
AT
ION
-AN
D- H
EA
LTH
RE
SE
AR
CH
& E
DU
CA
TIO
NA
L T
RU
ST
12
212
Diabetes AsthmaHyper- tension
High Cholesterol
Lower Back Pain
Depression ObesityAny Disease Management
Program~
FIRM SIZE3-24 Workers 38%* 32%* 24%* 33% 24% 31% 28% 54%25-199 Workers 51 43 43* 41 26 37 37 65200-999 Workers 71* 58* 63* 59* 23 39 44* 75*1,000-4,999 Workers 81* 71* 73* 67* 31 45* 51* 84*5,000 or More Workers 88* 75* 77* 67* 46* 45* 54* 88*
All Small Firms (3-199 Workers) 41%* 35%* 29%* 35%* 25% 32% 30%* 57%*All Large Firms (200 or More Workers) 73%* 61%* 66%* 61%* 25% 40% 46%* 77%*REGION
Northeast 55% 32% 39% 40% 25% 33% 32% 70%Midwest 48 40 36 46 30 32 37 62South 33 33 16* 27 21 28 20* 49West 38 37 33 34 25 38 36 53
INDUSTRYAgriculture/Mining/Construction 40% 31% 17% 9%* 9%* 13%* 11%* 68%Manufacturing 22* 29 11* 21 32 18 22 40Transportation/Communications/Utilities 27 27 16 22 14 20 16 36Wholesale 49 63 62* 58 16 52 50 70Retail 54 49 58* 67* 34 59* 54 79*Finance 68 57 51 56 65* 55 74* 88*Service 41 33 26 37 22 31 27 54State/Local Government 49 48 44 50 35 47 22 60Health Care 48% 24% 34% 29% 22% 31% 34% 56%
ALL FIRMS 42% 36% 30% 36% 25% 32% 30% 57%
Source: Kaiser/HRET Survey of Employer-Sponsored Health Benefits, 2013.
Among Firms Offering Health Benefits, Percentage with a Particular Disease Management Program, by Firm Size, Region, and Industry, 2013
Exhibit 12.8
~ Includes firms which offer any of the listed disease management programs.
* Estimate is statistically different within type of disease management program from estimate for all other firms not in the indicated size, region, or industry category (p<.05).
Note: In 2013 firms were asked if they offered any of the listed disease management programs. In previous years, firms were asked if they offered a disease management program before being asked about particular programs.

Employer Health Benefits 2 0 1 3 An n u a l S u r vey
T H E K A I S E R FA M I LY F O U N D AT I O N - A N D - H E A LT H R E S E A R C H & E D U C AT I O N A L T R U S T
213
12
section
twelve
Wellness Program
s and Health R
isk Assessm
ents
Exhibit 12.9Among Firms Offering Health Benefits, Percentage of Firms with a Particular Disease Management Program, by Firm Size, 2013
* Estimate is statistically different between All Small Firms and All Large Firms within category (p<.05).~ Includes firms which offer any of the disease management programs indicated in this exhibit.SOURCE: Kaiser/HRET Survey of Employer-Sponsored Health Benefits, 2013.
57%
41%
35%
29%
35%
25%
32%
30%
77%
73%
61%
66%
61%
25%
40%
46%
0% 10% 20% 30% 40% 50% 60% 70% 80% 90%
Any DiseaseManagement Program*~
Diabetes*
Asthma*
Hypertension*
High Cholesterol*
Lower Back Pain
Depression
Obesity*
All Large Firms(200 or More Workers)
All Small Firms(3-199 Workers)

section
twelve
Wellness Program
s and Health R
isk Assessm
entsEmployer Health Benefits 2 0 1 3 An n u a l S u r vey
T H E K A I S E R FA M I LY F O U N D AT I O N - A N D - H E A LT H R E S E A R C H & E D U C AT I O N A L T R U S T
12
214
Firm Offers Financial Incentives to Participate in a Disease Management Program
FIRM SIZE200-999 Workers 5%1,000-4,999 Workers 17*5,000 or More Workers 27*
All Small Firms (3-199 Workers) 2%*All Large Firms (200 or More Workers) 8%*ALL FIRMS 2%
Exhibit 12.10Among Firms Offering Health Benefits and a Disease Management Program for Their Plan with the Largest Enrollment, The Percentage of these Firms Offering Financial
Incentives to Participate, by Firm Size, 2013
* Estimate is statistically different from all firms not in the indicated size category (p<.05).
Source: Kaiser/HRET Survey of Employer-Sponsored Health Benefits, 2013.
Note: The standard error for All Small Firms is 1.1% indicating considerable volatility around the estimate. See Exhibit 12.9 for information on the percent of firms offering a disease management program.
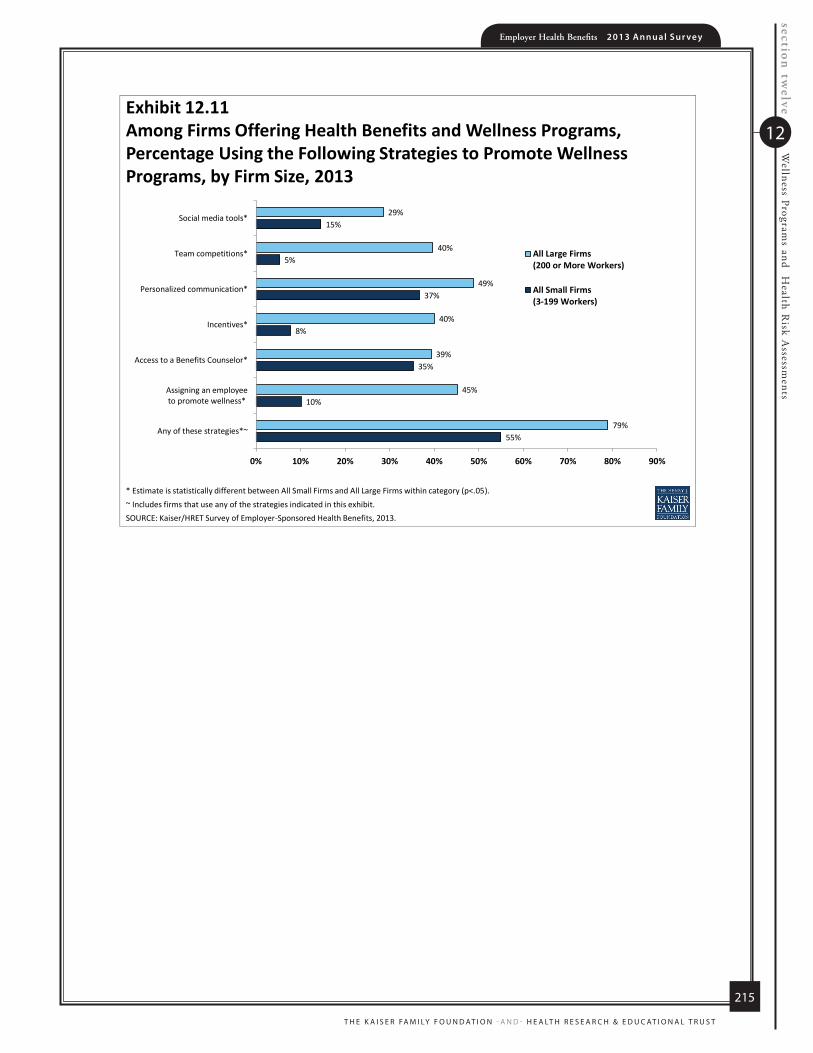
Employer Health Benefits 2 0 1 3 An n u a l S u r vey
T H E K A I S E R FA M I LY F O U N D AT I O N - A N D - H E A LT H R E S E A R C H & E D U C AT I O N A L T R U S T
215
12
section
twelve
Wellness Program
s and Health R
isk Assessm
ents
Exhibit 12.11Among Firms Offering Health Benefits and Wellness Programs, Percentage Using the Following Strategies to Promote Wellness Programs, by Firm Size, 2013
* Estimate is statistically different between All Small Firms and All Large Firms within category (p<.05).~ Includes firms that use any of the strategies indicated in this exhibit.SOURCE: Kaiser/HRET Survey of Employer-Sponsored Health Benefits, 2013.
55%
10%
35%
8%
37%
5%
15%
79%
45%
39%
40%
49%
40%
29%
0% 10% 20% 30% 40% 50% 60% 70% 80% 90%
Any of these strategies*~
Assigning an employeeto promote wellness*
Access to a Benefits Counselor*
Incentives*
Personalized communication*
Team competitions*
Social media tools*
All Large Firms(200 or More Workers)
All Small Firms(3-199 Workers)

section
twelve
Wellness Program
s and Health R
isk Assessm
entsEmployer Health Benefits 2 0 1 3 An n u a l S u r vey
T H E K A I S E R FA M I LY F O U N D AT I O N - A N D - H E A LT H R E S E A R C H & E D U C AT I O N A L T R U S T
12
216
Exhibit 12.12Among Firms Offering Health Benefits and Wellness Programs, Percentage of Firms Using the Following Methods to Evaluate Wellness Programs, By Firm Size, 2013
* Estimate is statistically different between All Small Firms and All Large Firms within category (p<.05).~ Includes firms that use any of the methods of evaluation indicated in this exhibit.SOURCE: Kaiser/HRET Survey of Employer-Sponsored Health Benefits, 2013.
34%
26%
19%
15%
9%
9%
72%
47%
65%
26%
34%
29%
0% 10% 20% 30% 40% 50% 60% 70% 80%
Any of These Methodsof Evaluation*~
Employee Satisfaction*
Employee Participation*
Employee Retention*
Health Outcomes*
Return on Investment*
All Large Firms(200 or More Workers)
All Small Firms(3-199 Workers)

Employer Health Benefits 2 0 1 3 An n u a l S u r vey
T H E K A I S E R FA M I LY F O U N D AT I O N - A N D - H E A LT H R E S E A R C H & E D U C AT I O N A L T R U S T
217
12
section
twelve
Wellness Program
s and Health R
isk Assessm
ents
Exhibit 12.13Among Firms Offering Health Benefits, Importance of Selecting a Plan that Includes a Wellness Program, by Firm Size and Whether Firm Offers Wellness Programs, 2013
21%
33%26%
19%
1%
43% 40%
9% 7%1%
0%
20%
40%
60%
80%
100%
VeryImportant
SomewhatImportant
Not TooImportant
Not at AllImportant
Don't Know
All Small Firms(3-199 Workers)
All Large Firms(200 or More Workers)
~ Firms offering at least one of the following wellness programs: "weight loss programs", "gym membership discounts or on-site exercise facilities", "smoking cessation programs", "personal health coaching", "classes in nutrition or healthy living", "biometric screening", "flu shots or vaccinations", or "Employee Assistance Programs".SOURCE: Kaiser/HRET Survey of Employer-Sponsored Health Benefits, 2013.
24%
37%
24%
15%
<1%
13%
23%
32% 30%
2%0%
20%
40%
60%
80%
100%
VeryImportant
SomewhatImportant
Not TooImportant
Not at AllImportant
Don't Know
Offers at least one Wellness Program~Does Not Offer at least one Wellness Program

section
twelve
Wellness Program
s and Health R
isk Assessm
entsEmployer Health Benefits 2 0 1 3 An n u a l S u r vey
T H E K A I S E R FA M I LY F O U N D AT I O N - A N D - H E A LT H R E S E A R C H & E D U C AT I O N A L T R U S T
12
218
Exhibit 12.14Among Large Firms (200 or More Workers) Offering Health Benefits and Biometric Screenings, the Use of Incentives or Penalties for Various Activities, by Firm Size, 2013
11% 11%
0%
10%
20%
30%
40%
Employees are Required to Complete BiometricScreening
Employees Rewarded or Penalized for MeetingBiometric Outcomes
All Large Firms (200 or More Workers)
NOTE: Biometric screening is a health examination that measures an employee's risk factors. Biometric outcomes could include meeting a target body mass index (or BMI) or cholesterol level but not goals related to smoking. Twenty-six percent of Small Firms and 55% of Large Firms offer biometric screening as a wellness benefit (Exhibit 12.1). The small firm estimates for the percent of firms which rewarded employees for meeting biometric outcomes has a standard error of 2.4% indicating a high level of variability. SOURCE: Kaiser/HRET Survey of Employer-Sponsored Health Benefits, 2013.

57%$16,3
51
$5,8
84
2013
Employer Health Benefits2 0 1 3 A N N U A L S U R V E Y
sect ion
Grandfathered Health Plans
13

section thirteenG
randfathered Health Plans
Employer Health Benefits 2 0 1 3 An n u a l S u r vey
T H E K A I S E R FA M I LY F O U N D AT I O N - A N D - H E A LT H R E S E A R C H & E D U C AT I O N A L T R U S T
13
220
Section Thirteen: Grandfathered Health Plans
The Affordable Care Act (ACA) is bringing about a number of meaningful changes for
the American health care system, including for the employer-sponsored health insurance
market. While many of the most significant provisions of the ACA will begin in 2014,
some are already in effect (for more information, see the health reform implementation
timeline at http://www.kff.org/interactive/implementation-timeline/). The ACA
exempts certain health plans that were in effect when the law was passed, referred to as
grandfathered plans, from some of the new standards in the law; these include
requirements to cover preventive benefits without cost sharing, have an external appeals
process, or comply with the new benefit and rating provisions in the small group market.
Overall, 54% of firms offering health benefits have at least one health plan that is a
grandfathered plan in 2013.
Although some important provisions of the ACA will become effective sometime in 2014,
we generally did not ask employers in the 2013 survey how they planned to respond to
the new requirements. In many cases, rules were not finalized until after the interview
process began, so employers did not have all the information necessary to formulate
proper responses. We will track employer responses to changes in the market in future
surveys.
Grandfathering For the employer-sponsored market, health plans that were in place when the ACA was enacted (March 2010) can be grandfathered health plans. Interim final rules released by the Department of Health and Human Services on June 17, 2010, and amended on November 17, 2010, stipulate that firms cannot significantly change cost sharing, benefits, employer contributions, or access to coverage in grandfathered plans.1 New employees can enroll in a grandfathered plan as long as the firm has maintained consecutive enrollment in the plan.
1 Federal Register. Vol. 75, No. 116, June 17, 2010, http://www.gpo.gov/fdsys/pkg/FR-2010-06-17/pdf/2010-14614.pdf, and No. 221, Nov. 17, 2010, http://edocket.access.gpo.gov/2010/pdf/2010-28861.pdf.

Employer Health Benefits 2 0 1 3 An n u a l S u r vey
T H E K A I S E R FA M I LY F O U N D AT I O N - A N D - H E A LT H R E S E A R C H & E D U C AT I O N A L T R U S T
221
13
section thirteenG
randfathered Health Plans
While grandfathered plans are exempted from many of the ACA’s new requirements, they must comply with many provisions as they become effective, including: (1) provide a uniform explanation of coverage, (2) report medical loss ratios and provide premium rebates if medical loss ratios are not met, (3) prohibit lifetime and annual limits on essential health benefits, (4) extend dependent coverage to age 26, (5) prohibit health plan rescissions, (6) prohibit waiting periods greater than 90 days, and (7) prohibit coverage exclusions for pre-existing health conditions.2 Firms must decide whether to grandfather their insurance plans, which limits the changes they can make to their plans, or whether to comply with the full set of new health reform requirements.
Fifty-four percent of firms offering health benefits have at least one health plan
that is a grandfathered plan in 2013 (Exhibit 13.1), similar to the 58% of offering firms with at least one grandfathered plan in 2012, but lower than the 64% in 2011.
Worker enrollment in grandfathered plans has decreased, with 36% of covered workers enrolled in a grandfathered health plan in 2013, down from 48% in 2012 and 56% in 2011 (Exhibit 13.3).
There are differences in the percentage of covered workers enrolled in
grandfathered plans by firm size and region.
o Fewer covered workers at large firms (200 or more workers) are enrolled in a grandfathered health plan than covered workers at smaller firms (30% vs. 49%).
o Fewer covered workers in the Northeast region (27%) are enrolled in
grandfathered health plans than covered workers in other regions.
2 United States. Congressional Research Service CRS. Open CRS. By Bernadette Fernandez. Grandfathered Health Plans Under the Patient Protection and Affordable Care Act (PPACA), Jan. 3, 2011. http://assets.opencrs.com/rpts/R41166_20110103.pdf.

section thirteenG
randfathered Health Plans
Employer Health Benefits 2 0 1 3 An n u a l S u r vey
T H E K A I S E R FA M I LY F O U N D AT I O N - A N D - H E A LT H R E S E A R C H & E D U C AT I O N A L T R U S T
13
222
Percentage of Firms with At Least One
Grandfathered PlanFIRM SIZE
3-24 Workers 56%25-49 Workers 5250-199 Workers 43*200-999 Workers 441,000-4,999 Workers 39*5,000 or More Workers 30*
All Small Firms (3-199 Workers) 54%*All Large Firms (200 or More Workers) 43%*REGION
Northeast 35%*Midwest 52South 63West 59
INDUSTRYAgriculture/Mining/Construction 36%Manufacturing 51Transportation/Communications/Utilities 73Wholesale 69Retail 19*Finance 58Service 57State/Local Government 49Health Care 58
ALL FIRMS 54%
Exhibit 13.1Percentage of Firms with At Least One Plan Grandfathered under the Affordable Care Act (ACA), by Size, Region and
Industry, 2013
* Estimate is statistically different from estimate for all other firms not in the indicated size, region, or industry (p<.05).
Source: Kaiser/HRET Survey of Employer-Sponsored Health Benefits, 2013.
Note: For definitions of grandfathered health plans, see the introduction to Section 13.

Employer Health Benefits 2 0 1 3 An n u a l S u r vey
T H E K A I S E R FA M I LY F O U N D AT I O N - A N D - H E A LT H R E S E A R C H & E D U C AT I O N A L T R U S T
223
13
section thirteenG
randfathered Health Plans
Percentage of Covered Workers in a
Grandfathered Health Plan
FIRM SIZE3-24 Workers 53%*25-49 Workers 52*50-199 Workers 44200-999 Workers 421,000-4,999 Workers 345,000 or More Workers 23*
All Small Firms (3-199 Workers) 49%*All Large Firms (200 or More Workers) 30%*REGION
Northeast 27%*Midwest 31South 40West 40
INDUSTRYAgriculture/Mining/Construction 41%Manufacturing 30Transportation/Communications/Utilities 38Wholesale 33Retail 26Finance 28Service 45*State/Local Government 33Health Care 29
ALL FIRMS 36%
Percentage of Covered Workers Enrolled in Plans Grandfathered under the Affordable Care Act (ACA), by Size,
Region, and Industry, 2013
Exhibit 13.2
* Estimate is statistically different from estimate for all other firms not in the indicated size, region, or industry (p<.05).
Source: Kaiser/HRET Survey of Employer-Sponsored Health Benefits, 2013.
Note: For definitions of grandfathered health plans, see the introduction to Section 13.

section thirteenG
randfathered Health Plans
Employer Health Benefits 2 0 1 3 An n u a l S u r vey
T H E K A I S E R FA M I LY F O U N D AT I O N - A N D - H E A LT H R E S E A R C H & E D U C AT I O N A L T R U S T
13
224
2011 2012 2013
FIRM SIZE3-24 Workers 69% 57% 53% 25-49 Workers 52 45 5250-199 Workers 63 55 44200-999 Workers 61 60 42*1,000-4,999 Workers 54 41* 345,000 or More Workers 49 42 23*
All Small Firms (3-199 Workers) 63% 54%* 49% All Large Firms (200 or More Workers) 53% 46% 30%*ALL FIRMS 56% 48%* 36%*
* Estimate is statistically different from estimate from the previous year shown (p<.05).
Percentage of Covered Workers Enrolled in Plans Grandfathered under the Affordable Care Act (ACA), by Firm Size, 2011 to 2013
Exhibit 13.3
Source: Kaiser/HRET Survey of Employer-Sponsored Health Benefits, 2011-2013.
Note: For definitions of grandfathered health plans, see the introduction to Section 13.

57%$16,3
51
$5,8
84
2013
Employer Health Benefits2 0 1 3 A N N U A L S U R V E Y
sect ion
Employer Opinions and Health Plan
Practices
14

section fourteenE
mployer O
pinions and Health Plan Practices
Employer Health Benefits 2 0 1 3 An n u a l S u r vey
T H E K A I S E R FA M I LY F O U N D AT I O N - A N D - H E A LT H R E S E A R C H & E D U C AT I O N A L T R U S T
14
226
Section Fourteen: Employer Opinions and Health Plan Practices
Employers play a significant role in health insurance coverage – so their opinions and
experiences are important factors in health policy discussions.
Employer Opinions on Cost Containment
Firms offering health benefits were asked to rate how effective several different strategies, such as wellness programs, tighter managed care restrictions, consumer-driven health plans, higher employee cost sharing, and disease management programs, would be in reducing the growth of health insurance costs.
Thirty-five percent of firms offering health benefits stated that wellness programs would be very effective at containing health insurance costs, more than any of the other strategies. There was no statistical difference in the distribution of opinions between small (3 to 199 workers) and larger firms towards the effectiveness of wellness programs (Exhibit 14.1).
Eight percent of firms offering health benefits stated that tighter managed care restrictions would be “very effective” at containing health insurance costs, fewer than any of the other strategies (Exhibit 14.1). Larger firms were more likely than smaller firms to state that tighter managed care restrictions were “very effective”.
Shopping for Health Coverage
More than one-half (54%) of firms offering health benefits reported shopping for a new health plan or a new insurance carrier in the past year, suggesting that the market is quite dynamic (Exhibit 14.2). Among firms that offer health benefits and shopped for a new plan or carrier, 18% changed insurance carriers and 15% reported changing the type of health plan provided to employees. A firm is considered to have changed health plan types when they switch between conventional, HMO, PPO, POS or HDHP/SO plans. There were no significant differences between small firms (3 to 199 workers) and larger firms on either these measures (Exhibit 14.3).
The majority of firms offering health benefits use a broker or consultant to assist in choosing a health plan (82%) (Exhibit 14.8). Large firms offering health benefits (200 or more workers) are more likely than smaller firms to use a broker or consultant (90% versus 82%).

Employer Health Benefits 2 0 1 3 An n u a l S u r vey
T H E K A I S E R FA M I LY F O U N D AT I O N - A N D - H E A LT H R E S E A R C H & E D U C AT I O N A L T R U S T
227
14
section fourteenE
mployer O
pinions and Health Plan Practices
Retail Clinics and Nurse Hotlines
Among firms offering health benefits, over half (56%) cover care received at retail clinics in their plan with the largest enrollment. Retail clinics treat minor illness and provide preventive care at locations such as retail stores, pharmacies, and supermarkets. Among these firms covering care at retail clinics, 17% offer financial incentives to receive care at a retail clinic location rather than at a physician’s office. There is no significant difference between small firms (3 to 199 workers) and larger firms covering care received at a retail clinic or for offering financial incentives to do so (Exhibit 14.5).
Among plans with the largest enrollment in firms offering health benefits, over half include a nurse hotline (55%). Large firms offering health benefits (200 or more workers) are more likely than smaller firms to have a nurse hotline (74% vs. 54%) (Exhibit 14.7).
Tiered Networks
A tiered or high performance network is one that groups providers into the network based on quality, cost, and/or the efficiency of the care they deliver. These networks encourage patients to visit more efficient doctors by either restricting networks to efficient providers, or by having different copayments or coinsurance for providers in different tiers in the network.
Twenty-three percent of firms that offer health benefits include a high performance or tiered provider network in the health plan with the largest enrollment (Exhibit 14.4). This is similar to the 20% reported in 2011 (the last time these questions were asked).
Offering Health Benefits through a Private Exchange
Recently, several large consulting firms have created private exchanges to offer health benefit options for mid-sized and larger employers. While models vary, the general idea is that the exchange contracts with different health plan vendors and offers a number of different health plan options to the employees of participating employers. This permits an employer to offer a larger variety of health plans to employees, and to structure contributions or other rules to encourage employees to choose more efficient plans.
Nine percent of large firms (200 or more workers) offering health benefits are considering offering benefits through a private exchange. Among offering firms with at least 5,000 workers, 29% are considering offering benefits through the exchange (Exhibit 14.6).

section fourteenE
mployer O
pinions and Health Plan Practices
Employer Health Benefits 2 0 1 3 An n u a l S u r vey
T H E K A I S E R FA M I LY F O U N D AT I O N - A N D - H E A LT H R E S E A R C H & E D U C AT I O N A L T R U S T
14
228
Very Effective
Somewhat Effective
Not Too Effective
Not At All Effective
Don’t Know
Wellness ProgramsAll Small Firms (3-199 Workers) 35% 32% 24% 9% 1%All Large Firms (200 or More Workers) 36 40 17 6 1
ALL FIRMS 35% 32% 24% 9% 1%Tighter Managed Care Restrictions*
All Small Firms (3-199 Workers) 7% 37% 27% 25% 5%All Large Firms (200 or More Workers) 15 40 28 14 3
ALL FIRMS 8% 37% 27% 24% 4%Consumer-Driven Health Plans (Ex: High-Deductible Plan Combined with a Health Savings Account)
All Small Firms (3-199 Workers) 20% 42% 21% 14% 4%All Large Firms (200 or More Workers) 31 37 19 11 2
ALL FIRMS 20% 41% 21% 14% 4%Higher Employee Cost Sharing
All Small Firms (3-199 Workers) 17% 33% 26% 21% 4%All Large Firms (200 or More Workers) 16 43 26 13 1
ALL FIRMS 17% 33% 26% 20% 4%Disease Management Programs*
All Small Firms (3-199 Workers) 22% 32% 29% 16% 2%All Large Firms (200 or More Workers) 36 38 18 5 2
ALL FIRMS 22% 32% 29% 15% 2%
Among Firms Offering Health Benefits, Distribution of Firms’ Opinions on the Effectiveness of the Following Strategies to Contain Health Insurance Costs, by Firm Size, 2013
* Distributions are statistically different between All Small Firms and All Large Firms within category (p<.05).
Source: Kaiser/HRET Survey of Employer-Sponsored Health Benefits, 2013.
Exhibit 14.1

Employer Health Benefits 2 0 1 3 An n u a l S u r vey
T H E K A I S E R FA M I LY F O U N D AT I O N - A N D - H E A LT H R E S E A R C H & E D U C AT I O N A L T R U S T
229
14
section fourteenE
mployer O
pinions and Health Plan Practices
Exhibit 14.2Among Firms Offering Health Benefits, Percentage of Firms That Shopped For a New Plan or Health Insurance Carrier in the Past Year, by Firm Size, 2013
* Estimate is statistically different within size category from estimate for firms not in the indicated size category (p<.05). SOURCE: Kaiser/HRET Survey of Employer-Sponsored Health Benefits, 2013.
55%51%
34%
23%
54%
0%
20%
40%
60%
80%
100%
3-199 Workers 200-999 Workers 1,000-4,999 Workers* 5,000 or More Workers* ALL FIRMS

section fourteenE
mployer O
pinions and Health Plan Practices
Employer Health Benefits 2 0 1 3 An n u a l S u r vey
T H E K A I S E R FA M I LY F O U N D AT I O N - A N D - H E A LT H R E S E A R C H & E D U C AT I O N A L T R U S T
14
230
Exhibit 14.3Among Firms Offering Health Benefits That Shopped for a New Plan or Insurance Carrier, Percentage Reporting That They Changed Insurance Carriers and Health Plan Type in the Past Year, by Firm Size, 2013
* Estimate is statistically different within category from estimate for firms not in the indicated size category (p<.05). NOTE: The survey considers a firm to have changed health plan types when the plan switches one of the following categories: Conventional, HMO, PPO, POS, HDHP/SO. Fifty-four percent of firms offering health benefits shopped for a new plan or carrier in the past year (Exhibit 14.2).SOURCE: Kaiser/HRET Survey of Employer-Sponsored Health Benefits, 2013.
18%15%
19%
12%
28%
13%
37%*
20%18%
15%
0%
10%
20%
30%
40%
50%
Changed Insurance Carrier Changed Health Plan Type
3-199 Workers200-999 Workers1,000-4,999 Workers5,000 or More WorkersALL FIRMS

Employer Health Benefits 2 0 1 3 An n u a l S u r vey
T H E K A I S E R FA M I LY F O U N D AT I O N - A N D - H E A LT H R E S E A R C H & E D U C AT I O N A L T R U S T
231
14
section fourteenE
mployer O
pinions and Health Plan Practices
Health Plan Includes High-Performance Network/Tiered Provider Network 2007 2010 2011 2013
FIRM SIZE200-999 Workers 9% 16% 17% 22%1,000-4,999 Workers 13 21 19 325,000 or More Workers 16 30* 24 33*
All Small Firms (3-199 Workers) 15% 16% 20% 23%All Large Firms (200 or More Workers) 10% 17% 18% 24%REGION
Northeast 15% 15% 19% 29%Midwest 13 17 12 15South 18 16 16 23West 13 18 33 25
ALL FIRMS 15% 16% 20% 23%
Source: Kaiser/HRET Survey of Employer-Sponsored Health Benefits, 2007, 2010, 2011, and 2013.
Exhibit 14.4Among Firms Offering Health Benefits, Percentage of Firms Whose Largest Plan Includes a High-Performance
Provider Network, by Firm Size and Region, 2007, 2010, 2011, and 2013
Note: The overall percentage of firms whose largest plan includes a high performance provider network is not significantly different between 2013 and previous years the question was included in the survey (2007, 2010, 2011) (p<.05). A high performance network is one that groups providers within the network based on quality, cost, and/or efficiency of care they deliver.
* Estimates are statistically different from estimate for all other firms not in the indicated size or region (p<.05).

section fourteenE
mployer O
pinions and Health Plan Practices
Employer Health Benefits 2 0 1 3 An n u a l S u r vey
T H E K A I S E R FA M I LY F O U N D AT I O N - A N D - H E A LT H R E S E A R C H & E D U C AT I O N A L T R U S T
14
232
Exhibit 14.5Percentage of Firms whose Largest Plan Covers Care Received at Retail Clinics and, of Those, Percentage of Firms who Offer a Financial Incentive to do so, by Firm Size, 2013
NOTE: Tests found no statistical difference between All Small Firms and All Large Firms within category. A retail clinic is a health care clinic located in retail stores, supermarkets and pharmacies that treats minor illnesses and provides preventive health care services, such as flu shots. SOURCE: Kaiser/HRET Survey of Employer-Sponsored Health Benefits, 2013.
56%
17%
61%
13%
56%
17%
0%
20%
40%
60%
80%
100%
Largest Plan Covers Care Received at a Retail Clinic Offers Financial Incentives for Choosing a Retail ClinicInstead of a Traditional Physician's Office
All Small Firms (3-199 Workers) All Large Firms (200 or More Workers) ALL FIRMS
Among Firms Offering Health Benefits: Among Offering Firms whose Largest Plan Includes Coverage at a Retail Clinic:

Employer Health Benefits 2 0 1 3 An n u a l S u r vey
T H E K A I S E R FA M I LY F O U N D AT I O N - A N D - H E A LT H R E S E A R C H & E D U C AT I O N A L T R U S T
233
14
section fourteenE
mployer O
pinions and Health Plan Practices
Yes No Don't Know
FIRM SIZE200-999 Workers 7% 91% 2%1,000-4,999 Workers 13 85 25,000 or More Workers 29 69 2
REGIONNortheast 12% 84% 4%Midwest 8 91 <1South 9 90 1West 8 88 4
INDUSTRYAgriculture/Mining/Construction 8% 92% 0%Manufacturing 15 84 1Transportation/Communications/Utilities 11 89 0Wholesale 6 91 3Retail 16 84 <1Finance 3 96 <1Service 9 87 4State/Local Government 5 85 10Health Care 9 91 <1
ALL LARGE FIRMS (200 or More Workers) 9% 89% 2%
Source: Kaiser/HRET Survey of Employer-Sponsored Health Benefits,
Note: A private exchange is created by a private company or consulting company where employers offer a defined contribution to their employees and the employees then choose among different health plan options from different health insurers selected by the exchange. The employee pays the difference between the defined contribution and the cost of the health insurance option they chose.
Among Large Firms (200 or More Employees) Offering Health Benefits, the Percentage of Firms Considering Offering Benefits Through a Private Exchange, by Firm Size, Region and Industry, 2013
Exhibit 14.6

section fourteenE
mployer O
pinions and Health Plan Practices
Employer Health Benefits 2 0 1 3 An n u a l S u r vey
T H E K A I S E R FA M I LY F O U N D AT I O N - A N D - H E A LT H R E S E A R C H & E D U C AT I O N A L T R U S T
14
234
Firm's Largest Plan Includes Nurse Hotline
FIRM SIZE3-24 Workers 49%*25-199 Workers 70*200-999 Workers 71*1,000-4,999 Workers 84*5,000 or More Workers 85*
All Small Firms (3-199 Workers) 54%*All Large Firms (200 or More Workers) 74%*REGION
Northeast 55%Midwest 62South 46West 59
INDUSTRYAgriculture/Mining/Construction 58%Manufacturing 26*Transportation/Communications/Utilities 46Wholesale 72Retail 75Finance 73Service 55State/Local Government 77Health Care 44
ALL FIRMS 55%
Source: Kaiser/HRET Survey of Employer-Sponsored Health Benefits, 2013.
Exhibit 14.7Among Firms Offering Health Benefits, Percentage of Firms Whose Largest
Plan Includes a Nurse Hotline, by Firm Size, Region and Industry, 2013
* Estimates are statistically different from estimate for all other firms not in the indicated size, region or industry (p<.05).

Employer Health Benefits 2 0 1 3 An n u a l S u r vey
T H E K A I S E R FA M I LY F O U N D AT I O N - A N D - H E A LT H R E S E A R C H & E D U C AT I O N A L T R U S T
235
14
section fourteenE
mployer O
pinions and Health Plan Practices
Exhibit 14.8Among Firms Offering Health Benefits, Percentage that Use a Broker or Consultant to Assist in Choosing a Health Plan, by Firm Size, 2013
* Estimate is statistically different within size category from estimate for firms not in the indicated size category (p<.05). SOURCE: Kaiser/HRET Survey of Employer-Sponsored Health Benefits, 2013.
81%86%
90% 92%
78%82%
0%
20%
40%
60%
80%
100%
3-24 Workers 25-199 Workers 200-999 Workers* 1,000-4,999Workers*
5,000 or MoreWorkers
ALL FIRMS