2013: impact of wetting film flow in pore scale displacement · impact of wetting film flow in pore...
TRANSCRIPT

SCA2013-016 1/12
Impact of Wetting Film Flow in Pore Scale Displacement
E. Unsal* and Emmanuel Moulet-Vargas
TOTAL Geoscience Research Centre, Aberdeen, UK
This paper was prepared for presentation at the International Symposium of the Society of Core
Analysts held in Napa Valley, California, USA, 16-19 September, 2013
ABSTRACT In flow through porous media, the wetting films may contribute many phenomena which
directly affect the oil recovery. While some of these phenomena might limit the overall
recovery process tremendously by trapping the non-wetting phase, the others may
provide means for certain molecular processes to occur. The latter has gained importance
over the last few decades and led some of the enhanced oil recovery processes (EOR) to
develop. Whether limiting or enhancing the recovery these films have an important
impact in scales larger than their own. Due to their very thin structure (a few micrometers
the most) experiments often get limited, and direct observation is not possible, especially
in a three-dimensional porous medium. The numerical simulations also struggle with
such small scales as it requires a very high resolution to capture the film flow physics and
a significant computational power is necessary to simulate flow on a sample with a
representative size within a reasonable time.
We present a summary on the wetting film flow and try to put them in perspective
regarding in which scale they occur and in what scale(s) their impacts are visible and
unavoidable. First a few experiments outline when/how the films form and provide visual
proof on their behavior during multi-phase flow. The findings of these experiments
clearly show the impact of, for example, snap-off events which provide an important
basis for the numerical methods. We then present a dynamic pore network model (PNM)
which accommodates the wetting film flow, coupled into the flow in network elements
without any sub-gridding. For both wetting and non-wetting phase, the flow equation is
solved and the wetting phase pressures calculated in the wetting films as well as each
network element. This way of coupling helps to upscale a nano/micro scale event to the
Darcy scale. But, regardless of the physics a PNM has, its prediction capacity is always
dependent on the quality of the network extraction process. Direct methods, free from the
extraction ambiguities, can provide a much more detailed physical representation of the
processes, but at a higher computational cost. Here, these two numerical approaches are
also compared in terms of their capability and way of handling the thin film flow, their
potential to simulate EOR processes and the computational efficiency.
INTRODUCTION For the simulation of multiphase flow in porous rock an accurate description of pore scale
displacement processes has recently gained more importance in particular in the context

SCA2013-016 2/12
of EOR. However, the multiscale nature of pore sizes in reservoir rock [1-4] and
displacement processes indicated in Figure 1 poses a substantial challenge for numerical
simulators and also experimentation. There are various physical processes at different
length scales with impact on the macroscale (= Darcy scale) displacement ranging from
few nanometers to centimeters.
Figure 1: Pore sizes of rock/fluids (top), length scales associated with processes in multiphase flow
simulation (middle), and simulation approaches for multiphase flow (bottom).
In many cases the actual processes occurring in rock are not well understood. Direct
observation is not always possible as current experimental technology is limited; the
numerical methods can provide some insight. A ‘one for all scales’ approach does not
currently exist and is also not in sight. Therefore a selection of the most appropriate
method should be made based on the criteria such as the scale in which the problem
originates and starts creating impact on the consecutive larger scales. Each method spans
a certain range in which phenomena or features are explicitly resolved. Direct methods
that are based on a discretization of the pore space aim to cover a representative
elementary volume (REV) typically use grid block sizes of few hundred nanometers, i.e.
orders of magnitude larger than the molecular scale on which properties like wettability
or surface tension is controlled. These sub-resolution features are then implemented using
Darcy flow
Direct simulation
PNM
Molecular dynamics
nm mm mm mlengthscale
feat
ure
s carbonate
sandstoneshale
wetting films
pro
cess
es
Haines jump
snap-off
diffusion
adsorption
ganglion dynamics
viscous fingering
corner flow
channeling
heterogeneity
laminalithofacies
fractures
SCA2013-016 3/12
effective medium properties like contact angle and interfacial tension which are also
experimentally accessible. Other methods like PNMs are also constrained by the same
resolution as the direct approach. However, they can span over a wider range of length
scales because the pore scale displacement is decomposed into a set of elementary
processes like thin wetting film flow (nm scale) which are then represented using,
numerically, very effective rule-based approach. They don’t require an additional, high
resolution sub-grid which may not be always possible.
In the following sections we focus on the modelling of imbibition processes which are of
particular interest for the recovery of oil and gas. In imbibition, snap-off disconnects the
non-wetting phase (typically oil or gas) which leads to trapping and irreducible oil
saturation reducing the recovery efficiency. In these snap-off processes, the advancement
of the wetting phase in thin film and corner flow plays a key role. These wetting films are
known to have thicknesses in orders of nm to µm [5] (Figure 1). What is less known is at
what size they can provide sufficient connectivity and affect the overall wetting phase
flow. To study such films a numerical method which represents the relevant physics in
the corresponding scale is required. Dynamic PNMs, for instance, have “infinite
resolution” for processes like thin film and corner flow but the question is whether
displacement rules are correct and the delicate balance of capillary and viscous processes
are correctly captured. Moreover these models are highly dependent on the quality of the
extraction process. For many direct methods, the extraction process is irrelevant and they
are not based on such balance rules. But the thin film flow may require further sub-
resolution, while the corner flow might be explicitly resolved.
Here, a dynamic PNM for imbibition is presented. First the model is analysed based on
its capability of handling the wetting film flow and snap-off during counter-current
imbition. Then a comparative study is presented using a direct Navier-Stokes flow
approach with respect to the handling of film flow. Lastly the relevance of film flow in
EOR applications is discussed, followed by a demonstration in which the PNM is coupled
with the geochemical software PHREEQC. This coupling extends the EOR capabilities of
PNM by allowing chemical interactions between the fluid and rock surface during flow.
Any adsorption and diffusion of a wettability altering agent affect local contact angle and
interfacial tension, consequently local capillary pressures and overall flow behavior.
WETTING FILMS AND SNAP-OFF In strongly water-wet rock space, the water phase wets the rock surface forming thin
wetting films in angular cavities providing full wetting phase connectivity, even at very
low saturations. Due to this connectivity, during imbibition, the injected wetting phase is
able to flow throughout the pore space via the wetting films ahead of the advancing
meniscus. While flowing, the wetting films may bridge across the waists of the pores at
various places ‘within the pore space’ and snap-off due to pore-scale capillary instability
(Figure 2a). This may result in trapped non-wetting phase as shown in the micromodel
experiment in (Figure 2b). This mechanism is believed to be the main cause of hysteresis

SCA2013-016 4/12
and entrapment. The effect is more significant if the flow regime is more capillary
dominated, i.e., highly-wetting, low injection rates.
Figure 2: (a) Wetting film snap-off ahead of advancing meniscus ‘within the pore space’. The model is
saturated with nonwetting-phase (same color as the micromodel), and the wetting phase is injected from
left (black). A few film snap-off is observed slightly ahead of the moving meniscus [6], (b) Further into
the experiments, a high number of wetting film snap-offs result in trapped non-wetting phase.
Snap-off occurring ‘within the pore space’ can immobilize and trap large amounts of
nonwetting-phase, but snap-off ‘at the open surface of the pore space’ causes the
recovering nonwetting-phase break into small mobile blobs (nonwetting phase bubbles).
The two phenomena are different but related as the corner films play an important role in
both. The underlying principle in the latter is that for a fixed volume, a sphere has less
surface area than a cylinder. For a perfectly wetting liquid lining the walls of a cylindrical
tube, the interface curvature is 1/R (where R is the tube radius), whereas if the same
volume of fluid is a slug spanning the tube, the curvature is 2/R and the latter has less
surface energy and so is more stable. One of the main implication of such snap-off is the
constantly changing outlet boundary pressure due to the changing bubble size. The effect
is also periodic because bubbles form consecutively.
The essence of this mechanism was studied in detail in a previous model experiment
where bubble snap-off during counter-current spontaneous imbibition was investigated
[7]. Three laterally interconnected capillaries of different sizes are connected to the
wetting-phase (oil) reservoir at one end (see Figure 3); the other side is closed to flow.
The wetting phase imbibes into each capillary, but advances further only into the two
smaller ones. This compresses the non-wetting phase (air), consequently the pressure
increases causing displacement at the meniscus location with the lowest capillary entry
pressure, i.e. the largest capillary and in the direction backwards into the wetting-phase
reservoir. Once the air-oil interface reaches to the end of capillary, a bubble starts to
form. As the air bubble grows into the reservoir its curvature changes which results a
visible drop in the back pressure in the non-wetting phase. But this growth eventually
comes to an end due to surface instability causing the bubble to snap off. The pressure
Moving meniscus
Snapped wetting phase
Trapped
nonwetting phase
Flow direction

SCA2013-016 5/12
recovers up to its original value again. The pressure recordings clearly show the bubble
formation and the snap-off point (Figure 3d).
Figure 3: Spontaneous counter-current imbibition experimental set-up [7], (a-b) capillary cross-sections,
(c) view from top: the capillaries are open to the reservoir on the right. Left side is closed to flow; here a
pressure transducer is connected and measures the oil pressure, (d) Nonwetting phase bubble formation
and snap-off in the oil reservoir.
NUMERICAL MODELING OF SNAP-OFF EVENTS
Pore Network Models (PNMs) In pore network models the geometry of the pore space is abstracted into simple
geometrical shapes like spheres, cubes and cylinders typically, with angular cross
sections. The number and coordination of these structures are completely dependent on
the extraction process, which introduces a lot of ambiguity to the network geometry as
various extraction algorithms may predict entirely different networks. On the more
positive side, for these simplified shapes the hydraulic conductivities can be analytically
approximated over a large saturation range which has the advantage that no sub-gridding
of pores or throats is required. However certain variants of PNMs do sub-discretize pores
into centers and corners [8]. The wetting films may exist throughout the whole network
Wetting films
c
Nonwetting phase
wetting phase
Wetting films
interface
retracts after
snap-off
d
capillary3 capillary1
capillary2
capillary1
capillary3 capillary2
Corners for
wetting films
b
t(s)
2nd bubble
snap-off

SCA2013-016 6/12
and they can be very thin (<<1μm) [5]. Instead of any fine gridding, these films are
coupled into the flow equations, i.e., each element of the network is assigned a film flow.
This way PNMs have “infinite” resolution for wetting films while solving flow equations
in Darcy scale (Figure 1) performing an efficient upscaling process. In a grid based
approach this would require a very fine grid size.
In dynamic PNMs, which is the case here, the balance of viscous and capillary forces is
considered by solving explicitly the phase pressures including the viscous pressure drop
in each element and the wetting films [8, 9]. The outlet boundary condition is, however,
significantly different. It is often assumed that the displacement happens in a co-current
manner, and both phases flow in the same direction from inlet towards the outlet. The
displaced phase is assumed to be connected to a relatively large reservoir of the same
phase at the exit, which generates a fixed (or no) resistance for the displaced phase to
leave the pore network. Here, the intention is to model a counter-current displacement;
only one face of the network is open to flow and it is connected to a reservoir filled with
the injected fluid (wetting) only. In order to exit the pore network the displaced
nonwetting phase has to overcome a much greater resistance, which will result in the
nonwetting phase breaking into small bubbles at the open face of the pore space.
Moreover because the size of the nonwetting phase bubble is continuously changing
during the displacement, a varying pressure (equal to capillary pressure of the bubble) is
generated as an outlet boundary condition. The wetting phase, on the other hand, is fully
connected via the wetting films; therefore there is no pressure for it to flow out the pore
space.
The experiment in Figure 3, the injected oil phase (wetting) has higher viscosity
compared to the displaced air phase. Air cannot generate a high viscous resistance to flow
and it is compressible. But would that be the case if the displaced fluid was more viscous
compared to the injected phase? If the same experimental set up is used for a two-phase
fluid system where the viscosities are similar, it would take perhaps significantly longer
as the displaced phase resist to flow due to its comparable viscosity to the injected phase.
In order to study the viscosity ratio effect (mobility number, M = μdisp/μinj) during
counter-current imbibition, three different fluid systems were simulated using the set-up
in Figure 3 (see Figure 4, Table 1). Three capillaries of different cross section are
represented by three rows of pores of different size which are interconnected via throats
(in the experiment the interconnection is continuous). The pore and throat elements have
square cross-sections with an inscribed radius shown in Figure 4 (far right). Each element
is assigned with thin films in its angular corners with a thickness of 0.001 times of its
inscribed radius. The network is open to flow only on the left side; the remaining three
sides are no-flow boundaries. The pore space is initially filled with the non-wetting phase
(oil, green), and it is connected to the wetting water phase (blue) which enters from the
left. Both fluids are assumed to be incompressible and only the final steps of the
simulations are shown. Maximum bubble radius is assumed to be 1.5 times of the
capillary (I) radius where it is emerging from. The bubble growth is tracked as the

SCA2013-016 7/12
nonwetting phase flows out of the network and when its radius reaches the maximum
value, it snaps off.
Figure 4: Network model for counter-current imbibition; in/outflow are possible only via left side. Green
is the non-wetting and blue is the wetting phase. The advancing interface is indicated with white
dashed line. The red arrows indicate where the possible moves are along the interface. The radii
of the capillaries are: largest (I) 100μm, smallest (II) 45 μm and medium (III) 50 μm. The
pore/throats have square cross-sections in the PNM.
Table 1. Fluid system parameters. Case μinj (Pas) μdisplaced (Pas) σ(N/m) Injection rate
(m3s-1)
Log(Ca)
I. Water-lighter oil 1E-3(water) 1E-1(oil) 0.02 1E-9 -3.4
II. Water-lighter oil 1E-3(water) 1E-1(oil) 0.02 1E-15 -9.4
III. Water-heavy oil 1E-3(water) 1 (oil) 0.02 1E-15 -9.4
In Case I the fluid system has a mobility ratio of M=100 and has the highest injection rate
(highest Ca) representing a forced injection process. Consequently, the viscous forces are
expected to be more significant (Figure 5a). Water is initially able imbibe into two
smaller capillaries; displaced oil starts forming a bubble. As the imbibition progresses the
oil pressure increases at the dead end (red zone on the right) and bubble continues to
grow reducing the opposing capillary pressure at the outlet (left). The net force (∆Pnet)
along the water-oil interface is a function of the local Pc, water and oil pressures (∆Pnet =
∆Pc –(Po – Pw)). The red arrows indicate where the next move may occur along the
interface and the size of the arrow shows the strength of ∆Pnet. The interface moves
towards where ∆Pnet is the highest at that particular time.
Advancing water front generates a high pressure in the oil phase on the right. The
pressure gradient in the oil declines towards the open end where the bubble constantly
grows and bubble ∆Pc decreases. At some point, the ∆Pnet is not large enough push the oil
towards left, and due to the reduced resistance at the outlet it becomes easier for water to
exit via the outlet. It then cuts the oil connection from the outlet and terminates the
bubble growth. After this stage the water is not able to mobilize the oil any longer, and
just flows out of the inlet. The progression of the bubble is shown in Figure 6a. Perhaps
water would advance further to the right if the oil wasn’t assumed to be incompressible.
in/o
ut f
low
no flow
no flow boundary
no flow boundary
Moving interface
De
ad e
nd
III III
Square cross-section
SCA2013-016 8/12
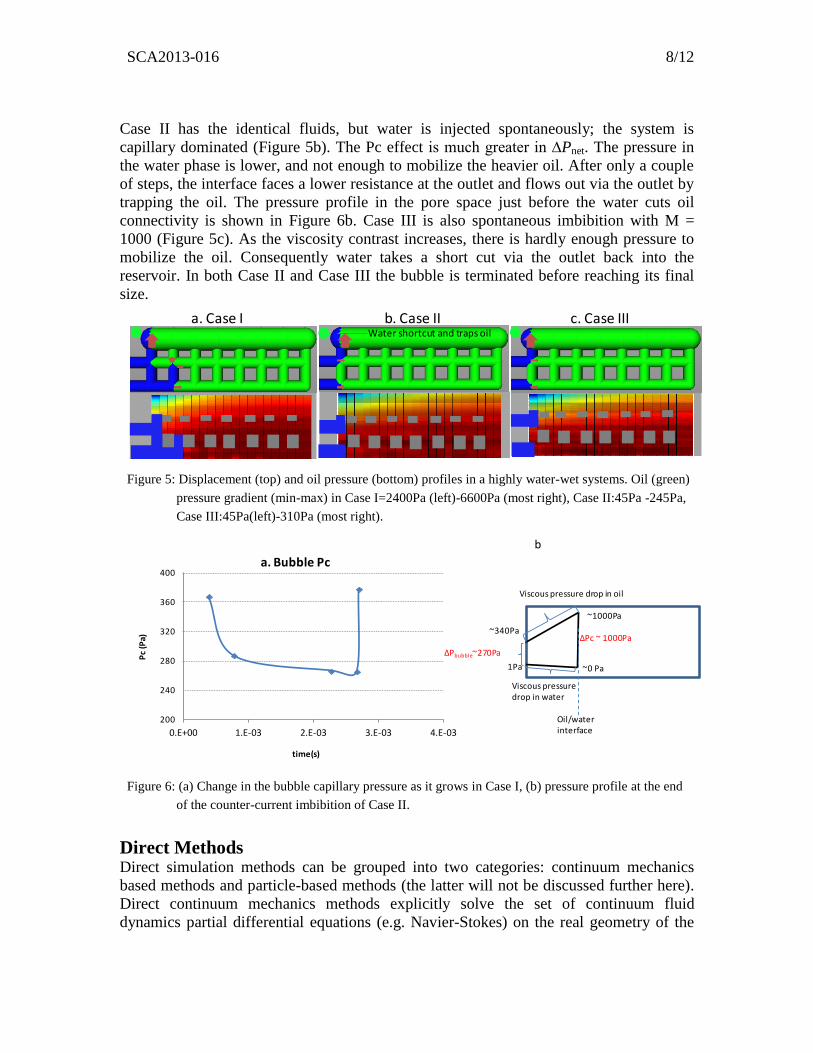
Case II has the identical fluids, but water is injected spontaneously; the system is
capillary dominated (Figure 5b). The Pc effect is much greater in ∆Pnet. The pressure in
the water phase is lower, and not enough to mobilize the heavier oil. After only a couple
of steps, the interface faces a lower resistance at the outlet and flows out via the outlet by
trapping the oil. The pressure profile in the pore space just before the water cuts oil
connectivity is shown in Figure 6b. Case III is also spontaneous imbibition with M =
1000 (Figure 5c). As the viscosity contrast increases, there is hardly enough pressure to
mobilize the oil. Consequently water takes a short cut via the outlet back into the
reservoir. In both Case II and Case III the bubble is terminated before reaching its final
size.
Figure 5: Displacement (top) and oil pressure (bottom) profiles in a highly water-wet systems. Oil (green)
pressure gradient (min-max) in Case I=2400Pa (left)-6600Pa (most right), Case II:45Pa -245Pa,
Case III:45Pa(left)-310Pa (most right).
Figure 6: (a) Change in the bubble capillary pressure as it grows in Case I, (b) pressure profile at the end
of the counter-current imbibition of Case II.
Direct Methods Direct simulation methods can be grouped into two categories: continuum mechanics
based methods and particle-based methods (the latter will not be discussed further here).
Direct continuum mechanics methods explicitly solve the set of continuum fluid
dynamics partial differential equations (e.g. Navier-Stokes) on the real geometry of the
a. Case I b. Case II c. Case IIIWater shortcut and traps oil
200
240
280
320
360
400
0.E+00 1.E-03 2.E-03 3.E-03 4.E-03
Pc
(Pa)
time(s)
a. Bubble Pc
1Pa
Viscous pressure drop in oil
∆Pc ~ 1000Pa
~0 Pa
~1000Pa
~340Pa
Viscous pressure drop in water
∆Pbubble~270Pa
b
Oil/water interface

SCA2013-016 9/12
pore space as a boundary condition and sub-discretize/ grid each individual pore. Typical
approaches use grid block sizes of 0.5-15 mm which allows (single-phase) REVs of
sandstone rock at a resolution where Haines jumps [10] and corner flow can be resolved
but not necessarily thin films. The main challenge is the treatment of the liquid-liquid
interfaces, which typically move during the displacement and undergo topological
changes during breakup and coalescence in ganglion flow. Direct Navier-Stokes
approaches typically track the fluid interfaces by Level-set (LS) or Volume-of-fluid
(VoF) methods. The liquid-solid boundaries are treated in an effective way using
concepts like surface energy and contact angles to describe the rock-fluid interaction.
In this particular example of a direct method displayed in Figure 7 (left), initially the
capillary is saturated with the nonwetting (oil, red) phase, no wetting films are present
[11]. The contact angle is set to zero. As the wetting phase (water, blue) is applied from
the left, the wetting films are gradually formed at the location of the interface; because
for such contact angle of representing a strongly water-wet condition, it is energetically
more favorable that water contacts the solid instead of oil. The actual snap-off process
traps the fraction of oil according to the temporal evolution of the pressure field. On the
right of Figure 7 the PNM representation of the event is shown: with the PNM the
wetting films have to pre-exist and snap-off occurs at a pre-defined threshold value of the
capillary pressure which is the phase pressure difference between the thin water film and
the oil in the element representing the throat. Often it is not possible to calculate a
detailed pressure distribution of the phases in each element with PNM. Pressure is usually
known at the center points or at the few discretized point of each element.
Figure 7: Imbibition modelled in a direct approach (showing only symmetry element, VoF method) [11]
and the PNM representation. Red is oil (nonwetting), blue is water (wetting).
SCA2013-016 10/12
In order to model the snap-off events ahead of the interface (Figure 2a) the thin wetting
films have to pre-exist everywhere. And solving Navier-Stokes, which involves second
order spatial derivatives, the minimum number of grid blocks to represent a mobile phase
is 4-5 for a no-slip boundary condition. At a resolution at 10 μm, for instance, the film
would be around 50 μm. If we want to a film thickness of 1 μm, then for a 3D system we
will require 503 times higher resolution. Subsequently, the computational cost will
increase in cubic order. With PNM, on the other hand, introducing thin films does not
introduce any additional cost; they “naturally” exist without any need for explicit
gridding. Table 2 provides a benchmarking of the current PNM and direct method on
simulation times for two-phase flow on similar physical size geometries.
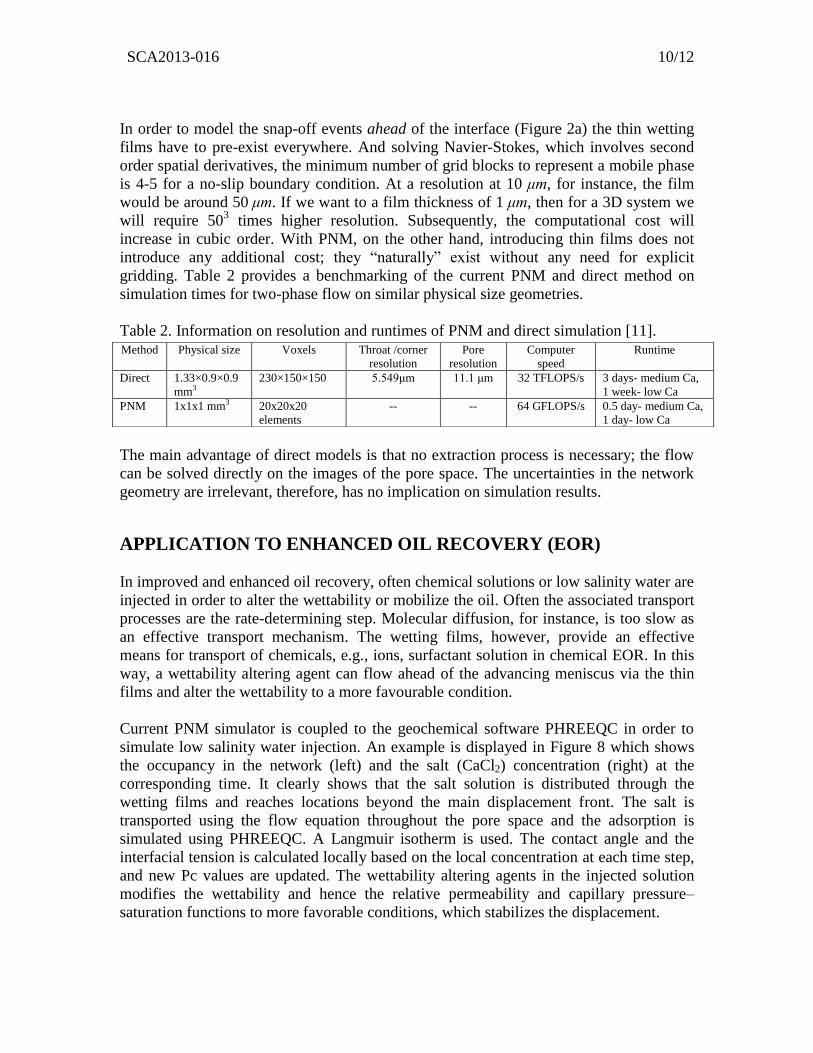
Table 2. Information on resolution and runtimes of PNM and direct simulation [11].
The main advantage of direct models is that no extraction process is necessary; the flow
can be solved directly on the images of the pore space. The uncertainties in the network
geometry are irrelevant, therefore, has no implication on simulation results.
APPLICATION TO ENHANCED OIL RECOVERY (EOR)
In improved and enhanced oil recovery, often chemical solutions or low salinity water are
injected in order to alter the wettability or mobilize the oil. Often the associated transport
processes are the rate-determining step. Molecular diffusion, for instance, is too slow as
an effective transport mechanism. The wetting films, however, provide an effective
means for transport of chemicals, e.g., ions, surfactant solution in chemical EOR. In this
way, a wettability altering agent can flow ahead of the advancing meniscus via the thin
films and alter the wettability to a more favourable condition.
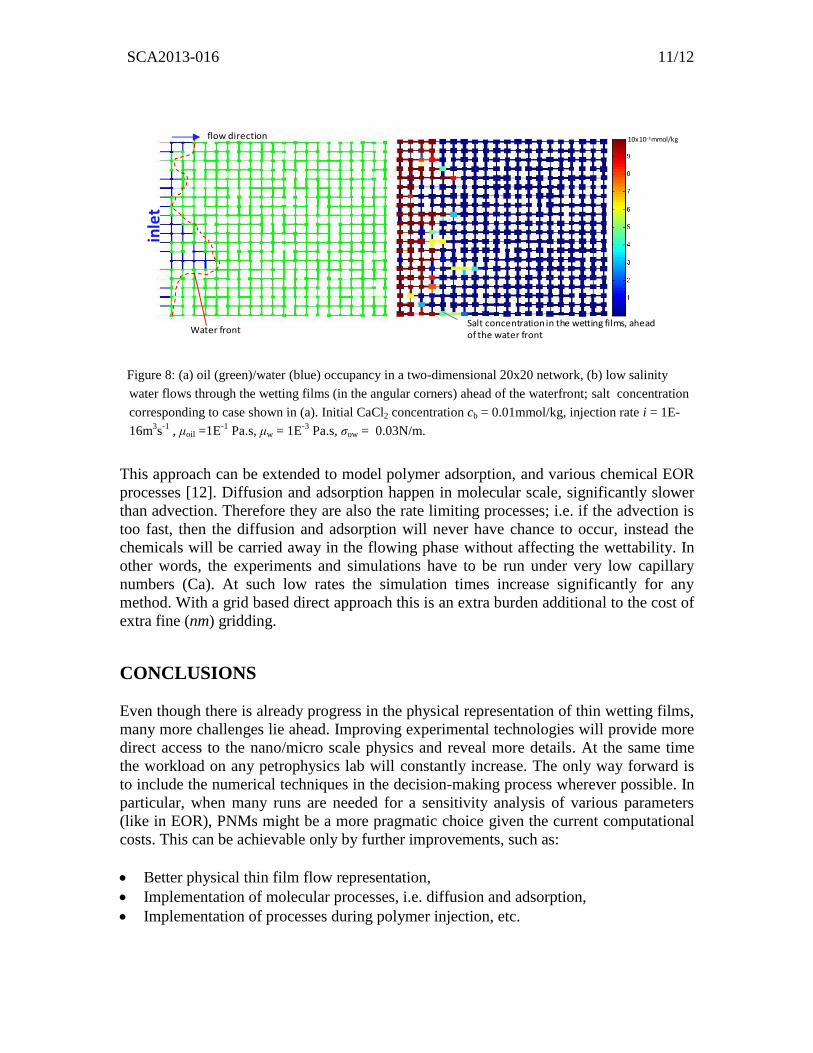
Current PNM simulator is coupled to the geochemical software PHREEQC in order to
simulate low salinity water injection. An example is displayed in Figure 8 which shows
the occupancy in the network (left) and the salt (CaCl2) concentration (right) at the
corresponding time. It clearly shows that the salt solution is distributed through the
wetting films and reaches locations beyond the main displacement front. The salt is
transported using the flow equation throughout the pore space and the adsorption is
simulated using PHREEQC. A Langmuir isotherm is used. The contact angle and the
interfacial tension is calculated locally based on the local concentration at each time step,
and new Pc values are updated. The wettability altering agents in the injected solution
modifies the wettability and hence the relative permeability and capillary pressure–
saturation functions to more favorable conditions, which stabilizes the displacement.
Method Physical size Voxels Throat /corner
resolution
Pore
resolution
Computer
speed
Runtime
Direct 1.33×0.9×0.9
mm3
230×150×150 5.549μm 11.1 μm 32 TFLOPS/s 3 days- medium Ca,
1 week- low Ca
PNM 1x1x1 mm3 20x20x20
elements
-- -- 64 GFLOPS/s 0.5 day- medium Ca,
1 day- low Ca
SCA2013-016 11/12
Figure 8: (a) oil (green)/water (blue) occupancy in a two-dimensional 20x20 network, (b) low salinity
water flows through the wetting films (in the angular corners) ahead of the waterfront; salt concentration
corresponding to case shown in (a). Initial CaCl2 concentration cb = 0.01mmol/kg, injection rate i = 1E-
16m3s
-1 , μoil =1E
-1 Pa.s, μw = 1E
-3 Pa.s, σow = 0.03N/m.
This approach can be extended to model polymer adsorption, and various chemical EOR
processes [12]. Diffusion and adsorption happen in molecular scale, significantly slower
than advection. Therefore they are also the rate limiting processes; i.e. if the advection is
too fast, then the diffusion and adsorption will never have chance to occur, instead the
chemicals will be carried away in the flowing phase without affecting the wettability. In
other words, the experiments and simulations have to be run under very low capillary
numbers (Ca). At such low rates the simulation times increase significantly for any
method. With a grid based direct approach this is an extra burden additional to the cost of
extra fine (nm) gridding.
CONCLUSIONS
Even though there is already progress in the physical representation of thin wetting films,
many more challenges lie ahead. Improving experimental technologies will provide more
direct access to the nano/micro scale physics and reveal more details. At the same time
the workload on any petrophysics lab will constantly increase. The only way forward is
to include the numerical techniques in the decision-making process wherever possible. In
particular, when many runs are needed for a sensitivity analysis of various parameters
(like in EOR), PNMs might be a more pragmatic choice given the current computational
costs. This can be achievable only by further improvements, such as:
Better physical thin film flow representation,
Implementation of molecular processes, i.e. diffusion and adsorption,
Implementation of processes during polymer injection, etc.
10x10-2mmol/kg
Salt concentration in the wetting films, ahead of the water front Water front
inle
tflow direction

SCA2013-016 12/12
However any new development in physics would be reliable only if the extracted network
is reliable. This is where the true challenge lies with PNMs.
ACKNOWLEDGMENTS Ali Raeini is acknowledged for providing the input for direct simulations.
REFERENCES * Corresponding author; E-mail address: [email protected]
1. Lucia, F.J., “Rock-fabric/petrophysical classification of carbonate pore space for
reservoir characterization”, AAPG Bulletin, (1995) 79, 1275-1300.
2. Anselmetti, F.S., S. Luthi, G.P. Eberli, “Quantiative characterization of carbonate
pore systems by digital image analysis”, AAPG Bulletin, (1998) 82, 1381-1405.
3. Al-Kharusi, A.S., M.J. Blunt, “Network extraction from sandstone and carbonate pore
space images”, J Petro. Sci. Eng, (2007) 56, 219-231.
4. Szymkiewicz, A., “Upscaling from Darcy scale to field scale”, Modelling Water Flow
in Unsaturated Porous Media, GeoPlanet, Heidelberg, (2013) 139-175.
5. Tuller, M. and D. Or, “Hydraulic conductivity of variably saturated porous media:
film and corner flow in angular pore space”, WRR, (2010) 37, 1257-1276.
6. Kim, E. and G.M. Whitesides, “Imbibition and Flow of Wetting Liquids in
Noncircular Capillaries”, J. Phys. Chem. B, (1997) 101, 855-863.
7. Unsal, E., G. Mason, N.R. Morrow and D. Ruth, “Bubble snap-off and capillary back
pressure during counter-current spontaneous imbibition into model pores”, Langmuir,
(2009) 25, 3387-3395.
8. Joeker-Niasar, V., S.M Hassanizadeh, and H.K Dahle, “Non-equilibrium effects in
capillarity and interfacial area in two-phase flow: dynamic pore-network modeling”, J
Fluid Mech., (2010) 655, 38-71.
9. Hammond, P., and E. Unsal, “A dynamic pore network model for oil displacement by
wettability-altering surfactant solution”, TIPM, (2012) 92, 789-817.
10. Berg, S., H. Ott, S.A. Klapp, A. Schwing, R. Neiteler, N. Brussee, A. Makurat, L.
Leu, F. Enzmann, O. Schwarz, M. Kersten, S. Irvine, and M. Stampanoni, “Real-time
3D imaging of Haines jumps in porous media flow”, PNAS, (2013) 110, 3755–3759.
11. Raeini, A.Q., M.J. Blunt and B. Bijeljic, “Modelling two-phase flow in porous media
at the pore scale using the volume-of-fluid-method”, J. Comp. Phys., (2012) 231,
5653-5668.
12. Unsal, E., P. Hammond, M. Schneider, “Effects of surfactant on wettability of oil
recovery in a pore network model”, 16th
European Symposium on Improved Oil
Recovery, Cambridge, UK, (2011), paper A09.