2013 energy sector program phase-2 project
TRANSCRIPT

2013 ENERGY SECTOR PROGRAM PHASE-2 PROJECT
EU IPA13/CS-02.a
Energy Market Development
GAS TARIFF TRAINING
Ankara, 7-9 January 2019

Training contents – Day 1
1. Basic economics of tariff and price regulation
2. Overview of the main international market models and related tariff regimes
3. The tariffs regulatory process in the U.S. and Europe
4. Revenue Requirement calculation
a. The asset base
b. The rate of return
c. Depreciation and operational costs
d. Excel Work: RAB calculation, WACC and depreciation
2
Training contents – Day 2
5. Tariff review and adjustment
a. North American approach
b. Revenue/Price Cap
c. Excel Work: Implementing tariff adjustment and a regulatory account
6. Transmission Tariff Design
a. Main approaches: Point-to Point, Postage Stamp, Entry-Exit
b. Issues in entry-exit tariff setting
c. The EU Tariff Network Code and practices
d. Excel Work: Transmission Tariff Design
3

Training contents – Day 3
7. LNG Regasification and Storage tariffs
8. Distribution tariff design and Benchmarking (Annex 2)
9. End user pricing
10. Discussion of current Turkish tariffs
11. Optional: Role Game on Transmission tariff regulatory
regimes and design
4

5
Part 1
PRICING AND REGULATION:
A BIT OF THEORY
6
ECONOMIES OF SCALE AND MONOPOLY
In most industries, unit production costs tend to decrease with production level, but increase beyond a certain level
However, in several network industries (railways, roads, power and gas transmission and distribution, water…), the larger the production, the lower the cost
Therefore, companies tend to concentrate (merge) to achieve lower cost, within the relevant marketMonopoly
Competition may be impossible, therefore price regulation is necessary
It often depends on market size: competition between gas transportation companies may be feasible in the USA, but not in Italy

ECONOMIES OF SCALE AND MONOPOLY
Unit cost
Unit cost
Quantity Quantity
COMPETITION MONOPOLY
Italy USA

8
WHY REGULATE PRICES? (THE ECONOMIC CASE / 1)
Suppliers and network operators may abuse market power
• If gas supply is bundled, supplier enjoys monopoly position oftransmission and/or distribution and requires regulation
• Gas network operators are almost always in a monopoly position atnational, local or intermediate level
• Even if the network is unbundled and regulated, the supplier mayhave a strong market power
• Competition from other fuels usually weak, except in early stage ofdevelopment
• Exception: Competition from coal for power generator often strongif coal fire power stations available

9
PRICING UNDER INTERFUEL COMPETITION (1)
Companies may have no rivals in gas supply but face substantial competition from other energy sources that can be used for the same purposes: coal, fuel oil, fuelwood, renewable energy, nuclear…)
Competition is stronger in power generation, cement, steel but weaker in other industries and in the residential & commercial sector
Monopolistic or dominant gas suppliers carefully study consumption patterns and related costs, so as to be able to get the highest price from consumers that are able to pay more (price discrimination)
Individual pricing is usually confidential

10
PRICING UNDER INTERFUEL COMPETITION (2)
Profits may be used to cross-subsidise other consumers, provided
they can pay at least the gas purchase price
From an economic analysis perspective, perfect price
discrimination is efficient, as it does not lead to sales restriction
But, price discrimination may be seen as unfair and exploitative
If the regulatory framework or moral feelings do not allow
individual pricing, the company may still choose imperfect
discrimination:
• Decreasing block tariffs, where larger consumers pay less
• Fixed and or capacity-related charges, whereby stable (high load)
consumers pay less
• Discrimination may also be achieved on a geographical basis

11
WHY REGULATE PRICES? THE SOCIAL / ENVIRONMENTAL CASE
Gas and/or goods produced with it are key universalservices or essential goods for economic development• Mostly electricity, food, fertilisers, cement, space heating
Gas is less polluting than other fossil fuels and it should be incentivized to lure consumers away from other fuels, fighting:• Harmful use of traditional fuels (fuelwood, charcoal, peat, solid
wastes) in less developed areas
• Urban air pollution in cities
• Regional pollution (acid rain, dust)
• Climate change
by substituting coal, oil derivatives and fuelwood in thermal uses and power generation

12
PM
Q
PS
Marginal
cost
Demand
CS
PR
Q
PS Demand
Marginal
cost
CS
HOW TO REGULATE PRICES: ECONOMIC ANALYSIS
• Golden rule: Price = Long Run Marginal Cost (PC), to be set below monopoly price PM
• If prices are “too high” or “too low”, social welfare (i.e. sum of Consumer and Producer Surplus) is not optimal (maximised)
• If regulated prices = average cost, CS may be higher than under P = LRMC, but social welfare (CS+PS) will be lower
• Political support for regulated price PR = AC < LRMC
• Monopoly price may be too high, but regulated price may be too low
• Too low prices would hamper development and trigger shortages
Averagecost
PC

13
Part 2
OVERVIEW OF GAS MARKET MODELS

14
THE GAS VALUE CHAIN: DRAWING THE LINE BETWEEN COMPETITION & MONOPOLY
EXPORTS
EXPLORATION
PRODUCTIONIMPORTS
LOW PRESSURE
DISTRIBUTION
LARGE CUSTOMERS
(POWER GENERATORS,
INDUSTRY)
HIGH PRESSURE PIPELINE SYSTEM
GAS
STORAGE
SMALL CUSTOMERS (HOUSEHOLDS, SMEs)

GAS PRICING WITHOUT REGULATION?
Gas industry often developed in competition with other energy sources (oil derivatives, coal, electricity)
Interfuel competition can be effective in the early stages of the industry and in new locations, hence price regulation not needed
Pipeline to pipeline (and LNG) competition may also be substantial in some regions (North America only?)
Unregulated natural gas pricing has prevailed in some countries (Germany, Italy, Netherlands…), notably for large customers
15

TARIFF REGULATION: WHY & WHERE (1)
If a monopolist sells gas, it could exploit consumers by settingprices well above average costs, achieving excess profits
In the traditional market model, gas is sold (in the wholesalemarket) by a monopolist (integrated company)
• Thus, the whole selling price should be regulated
• Transmission and distribution tariff are just parts of the integratedregulated price
In the liberalised market model, gas is sold at market pricesat least to some (eligible) customers
• Commercial flows tend to diverge from physical flows
• Tariff regulation in principle limited to networks (transmission,distribution) and essential facilities (storage? LNG terminals?)
16
17
THE TRADITIONAL MODEL
Integrated gas transportation and supply by amonopolist• Gas produced or purchased by long term contracts
Gas selling price (formally or informally) regulated• For large customers and power generation, competition by
alternative fuels (oil derivatives, coal…)
• Collective agreements or state/local govt. control often replaceformal regulation
No retail competition for smaller customers
Limited pipe to pipe competition
18
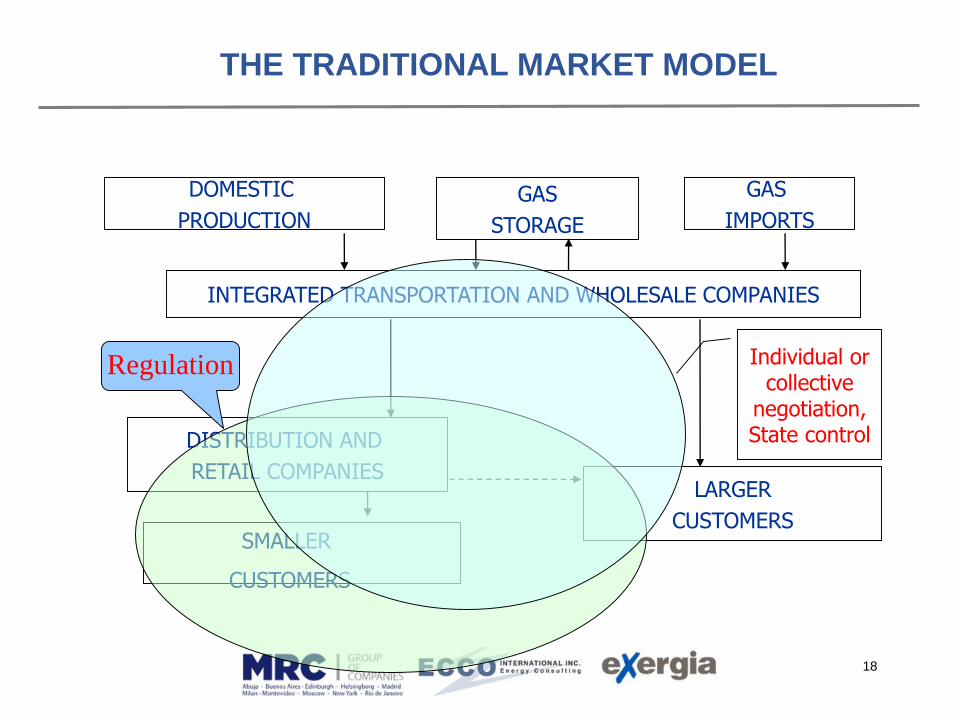
THE TRADITIONAL MARKET MODEL
DOMESTIC
PRODUCTION
GAS
IMPORTS
DISTRIBUTION AND
RETAIL COMPANIESLARGER
CUSTOMERS
INTEGRATED TRANSPORTATION AND WHOLESALE COMPANIES
GAS
STORAGE
SMALLER
CUSTOMERS
Individual or collective
negotiation, State control
Regulation

19
THE U.S. MARKET MODEL
Pipelines not allowed to trade in their own gas (unbundling)
No mandatory Third Party Access (private carriage)• Market based trading of transmission rights
Distance based, regulated transmission tariff• trading based on physical hubs
• relatively high returns allowed as quantity risk falls on pipelines
Limited or no retail competition• Distributors buy on the wholesale market, sell at regulated prices
Pipe-to-pipe as well as gas-to-gas competition
Market & infrastructure development led by private industry, rather than government or regulators

THE EU MARKET MODEL
Ownership unbundling (or tight regulatory control) oftransmission networks
Tariff regulation of transmission:• Entry-exit model
• Productivity incentives through “price caps”
• May also regulate storage and LNG regasification
• Temporary retail price control, notably for small customers
Detailed market rules, included in Network Codes Retail competition for all customers
• Liquidity promoted in the “virtual hub” created “on the grid”
• Measures for competition transparency and/or gas release
• Quality of service, consumer rights regulated
New infrastructure subject to govt./regulatory approval
20
21
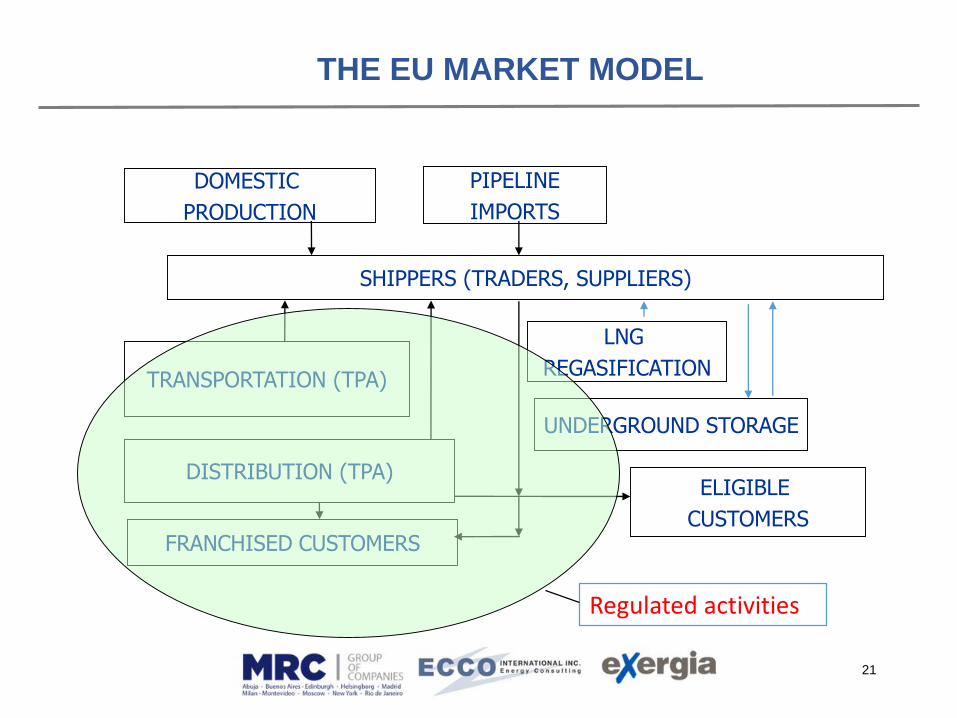
THE EU MARKET MODEL
DOMESTIC
PRODUCTION
PIPELINE
IMPORTS
DISTRIBUTION (TPA)ELIGIBLE
CUSTOMERS
SHIPPERS (TRADERS, SUPPLIERS)
UNDERGROUND STORAGE
TRANSPORTATION (TPA)
FRANCHISED CUSTOMERS
LNG
REGASIFICATION
Regulated activities

22
Question 1: Which gas market model is best for Turkey?
(Please give an opinion whatever the current market model)
1. Traditional: Monopoly with fully regulated tariffs and prices
2. Liberalised market US-style, unbundled transmission but no mandatory TPA, trading in physical hubs, retail competition for large customers and distributors
3. Liberalised market EU-style, unbundled transmission and mandatory TPA, trading in virtual hubs, retail competition for all customers
4. No regulation is necessary, because of inter-fuel competition

23
EU: THE “THIRD PACKAGE”
Strong unbundling
• ownership, or strengthened regulatory control (IndependentTransmission Operator), or ISO (TSO w/o assets
• regulatory checks on investments
European TSO co-ordination (ENTSO-G)
European Regulators’ Coordination Agency (ACER) born with limited powers • notably on cross border disputes, market monitoring
Security of Supply Regulation
Infrastructure Package
Part 3
THE TARIFF SETTING PROCESS

OBJECTIVES OF TARIFF SYSTEM (1)
Objectives of the “market liberalisation” wave, starting inthe 1980s:
• Provide consumers with a choice between suppliers, at least on thewholesale market
• Allow Third Party Access at least to the Transmission network(possibly, also to distribution and other services)
• Provide level playing field between suppliers, including theincumbent (network owner), with a view to encourage entry andinvestment by new suppliers
• Ensure that costs of transmission operators are covered, providedthey are efficient
• Incentivize network companies to become more efficient
25

OBJECTIVES OF TARIFF SYSTEM (2)
Other policy objectives that may affect network tariffs andgas pricing :
• Reduce energy cost for households
• Reduce energy cost for the poor
• Provide competitive advantages for national industry
• Fight inflation
• Raise tax revenue of the State and local government
• Reduce air pollution in cities
• Reduce carbon emissions
• Promote renewable gas and/or other renewable energy
GROUP WORK: WHICH OBJECTIVES FOR TURKEY’S GAS PRICING POLICIES?
26

COMMON KEY REGULATORY VALUES
Independence from regulated industry
Independence from elected governments
Transparency of decisions
Accountability towards Parliament, public opinion
Involvement of stakeholders, including weak ones
Fact based decision making process
Decisions subject to appeal
Notice: Achievement of such values is a long process!
27
Part 3.1
NORTH AMERICAN APPROACH: THE RATE CASE
(Based on information kindly provided byChristopher G. Lipscombe, Senior Attorney Advisor, District of Columbia Public Service Commission )

PUBLIC UTILITY COMMISSIONS (1)
Public Utility (or Public Service) Commissions in the U.S. areestablished in each State, plus D.C.
The Commissioners are appointed by Governor, subject toState Senate approval, staggered terms
Federal Energy Regulatory Commission (FERC), is in charge ofInterstate activities, and other issues of Federal relevance
• Appointed by President, subject to U.S. Senate approval, with
staggered terms
Canadian Provincial Regulatory Tribunals are similar to PUCs
29
PUBLIC UTILITY COMMISSIONS (2)
PUCs in the U.S. operate as Quasi Judicial Agencies
The Commissioners are the judges
All staff involved in formal cases are advisors to theCommissioners
The Budget of PUCs and FERC is raised through charges onthe sales of regulated companies
Special fees are charged for rate cases (not more than 0.25%of the company’s legal value)
30

THE STAKEHOLDERS
Private or Government owned regulated companies
Public Utility Customers
Office of the People’s Counsel (OPC) – Consumer Advocate
Other Government Agencies (e.g. FERC, other State orFederal Agencies / Departments)
Private Intervenors – e.g. Apartment & Office BuildingAssociation, Competitive Suppliers
31

RULEMAKING PROCESS STEPS
A stakeholder (normally the regulated company) ask theCommission for Rulemaking
The Commission issues a Notice of Proposed Rulemaking(sometimes preceded by Notice of Investigation)
Further Notice of Proposed Rulemaking (if necessary)
Notice of Final Rulemaking
Commission issues a Report and Order
Stakeholders may ask for Reconsideration
If granted a final Order is issued
32

RATE CASE PROCESS (1)
Most rate cases take 9-10 months to litigate
The utility company files an application for a rate increase,along with supporting documentation.
The Commission issues an Order, defining issues to beconsidered in the case.
The utility company files evidence on designated issues (e.g.proof of increased costs.
Other parties may file data requests, to which the utilitycompany responds.
Parties may file their own evidence
The Commission considers and discusses all evidence
33

RATE CASE PROCESS (2)
The Commission conducts a formal evidentiary hearingwherein the attorneys for each party cross-examine thewitnesses (experts) and the Commissioners ask questions
The Commission holds 3 community hearings in 3 differentwards of the District (State); one on a Saturday; one in theafternoon, and one during the evening.
Within 90 days of the close of the record, the Commissionissues a decisional order, after which parties have 30 days tofile an application for reconsideration.
34

RATE CASE PROCESS (3)
The utility is directed to file revised rate schedules, afterwhich the new rates go into effect.
After the Commission issues its Order, the parties can appealall or part of the decision to the relevant Court of Appeals.
In the U.S., rate cases are usually started by regulatedcompanies, but could be started by other stakeholders as well
It is a costly and long process, for PUC charges, legal costs,documentation preparation
Rate cases are usually undertaken only in case costs haveseriously increased
35

Part 3.2
EUROPEAN APPROACH:
REGULATED TARIFF SETTING
REGULATORY AUTHORITIES: EU LEGAL REQUIREMENTS (1)
Directive 2009/73, Article 39:
“Member States shall guarantee the independence of the regulatory authority and shall ensure that it exercises its powers impartially and transparently. For this purpose, Member States shall ensure that.. the regulatory authority:
(a) is legally distinct and functionally independent from any other public or private entity;
(b) ensures that its staff and the persons responsible for its management:
(i) act independently from any market interest; and
(ii) do not seek or take direct instructions from any government or other public or private entity when carrying out the regulatory tasks”.
37

REGULATORY AUTHORITIES: EU LEGAL REQUIREMENTS (2)
Directive 2009/73, Article 40 (Objectives):
• Promoting… a competitive, secure and environmentally sustainableinternal market in natural gas
• Effective market opening for all customers and suppliers
• Eliminating restrictions on trade between Member States
• Helping to achieve, in the most cost-effective way, the developmentof secure, reliable and efficient non-discriminatory systems that areconsumer oriented
• Promoting system adequacy and energy efficiency
• Grant appropriate incentives to increase efficiencies in systemperformance and foster market integration
• Promoting competition, protection of consumers (esp. vulnerable);
• Helping to achieve high standards of public service for natural gas,
• Facilitating customer switching.
38
REGULATORY AUTHORITIES: EU LEGAL REQUIREMENTS (3)
Directive 2009/73, Article 41 (Duties and powers):
• Fixing or approving, in accordance with transparent criteria,transmission or distribution tariffs or their methodologies;
• Ensuring compliance of transmission and distribution systemoperators… with the Directive and other relevant Communitylegislation
• Reporting annually on its activity and the fulfilment of its duties tothe relevant authorities of the Member States, the Agency and theCommission
• Ensuring that there are no cross-subsidies between transmission,distribution, storage, LNG and supply activities
• Issuing binding decisions on regulated companies and entities
• Investigating and accessing data
• Issuing penalties for non-compliance
39

ISSUING TARIFFS OR METHODOLOGIES?
Case 1. Regulator calculates and issues tariffs, after collectingnecessary data from companies
Case 2. Regulator issues a calculation methodology
• Sub-case 2.1. Company calculates tariffs, submits for check and
approval/rejection by Regulator (e.g. Italy)
• Sub-case 2.2. Company calculates and issues tariffs. Regulator checks
them (ex-post), may change them if found wrong (e.g. Austria,
Germany)
• Sub-case 2.3. Company calculates and issues tariffs. Regulator checks
them (ex-post), if wrong refers company to higher level body (e.g. UK)
40

REGULATORY AUTHORITIES: EU LEGAL REQUIREMENTS (4)
Directive 2009/73, Article 41 (Monitoring responsibilities):
• Investment plans of the transmission system operators, and assessinginvestment plans’ consistency with the Community-wide networkdevelopment plan
• Market transparency
• Effective market opening
• Restrictive commercial practices
• Access to storage and ancillary services
• Connection and disconnection services
• Supply prices (in relation to their cost reflectivity)
• Consumer consumption data
• Effectiveness of customer protection measures
• Implementation of market rules and obligations of system operators
41
DOMINANT EUROPEAN APPROACH: REGULATORY PERIODS
Fixed regulatory period are defined (3-8 years) Tariffs are updated each year after a rule (formula) set for
the whole regulatory period, considering:
• Inflation (RPI)
• Predetermined productivity improvement
• Special events and factors besides company control
At the beginning of each regulatory period, the Regulators will decide:
• The starting level of tariff (for 1st year of period)
• Rules of tariff update (for next years of period)
42

EUROPEAN TARIFF SETTING PROCESS: MAIN STEPS
1. Collection of costs and technical data
2. Preparation of proposals and internal discussion
3. (One to three) public consultation papers issued
4. Collection of stakeholders’ comments and answers to proposal
5. Final consultation paper and draft decision issued
6. Public hearings held, stakeholders invited
7. Decision and illustration of its reasons
8. Appeal and litigation (if any)
43

DATA COLLECTION & INTERNAL DISCUSSION
1. Regulatory staff to collect costs and technical data, as necessary for tariff calculation
• Preliminary data collection to start 18-24 month before period expiry
• Good mastering of data and technical issues by the regulator’s staff
increases mutual trust and underpins satisfactory decisions
• Further data collection may be needed close to period expiry
• New tariff is typically based on data from 2 years before new period
2. Staff discuss proposals for new regulatory period, present them to Board/Chair
• Including simulation of several scenario assumptions to facilitate
Board/Chair decision
44

FIRST PUBLIC CONSULTATION
3. Preliminary consultation paper issued, outlining broad proposals for the new regulatory period
• Underlines starting point, issues, relationship with other major
regulations (e.g. Network Code)
• Formulates questions for stakeholders (e.g. how long should the
period be? Should rates of return be calculated as WACC?)
• Plain language, may have technical annexes but no draft legal
decision at this stage
• Stakeholders encouraged to react by set deadline
4. Written answers are collected
• Staff may prepare a summary of collected answers for internal,
possibly external use
45
THE ISSUES AT STAKE: EXAMPLES
Calculation criteria for the asset base, operational costs, depreciation
Indices used for re-evaluation of asset values
Calculation criteria for the rate of return
X (productivity growth) factors
Special factors for tariff adjustments (e.g. incentives for quality of service)
Geographical segmentation (national, regional…)
Tariff structure and its drivers (e.g. blocks, fixed/variable charges)
…
46

THE STAKEHOLDERS
Private or Government owned regulated companies and their Associations
Shippers (suppliers, producers, traders...) and their Associations
Customers and their Associations (usually split into those representing households, commerce, industry, power generators, etc.)
Governmental Institutions may take part, but are more likely to raise their points separately
NGOs (e.g. environmental protection associations, representatives of minorities and of vulnerable customers)
47

FURTHER PUBLIC CONSULTATION
5. Second (and possibly more) consultation paper(s) issued, outlining detailed proposals for the new regulatory period
• Recalls preliminary proposals and summarises stakeholders’ reactions
and main points
• Explains Regulator’s position on issues, including those raised by
stakeholders (if important)
• Formulates detailed proposals
• May include detail questions for stakeholders (e.g. Should 10-year
Govt. bonds be the basis for WACC calculation?)
• Draft decision (legal specimen) may be attached
• Stakeholders are encouraged to react by set deadline
48
PUBLIC HEARINGS
6. Stakeholders are invited to one or more public hearings
• Main stakeholders are invited, consultation papers are attached
• Hearings advertised through website, official journals
• May be held in different parts of the country to facilitate participation
• Regulator may illustrate the main proposals in their introduction
• Stakeholders state their points, may ask questions but no legal
obligation to answer
• Hearings may be recorded and/or broadcasted online
49

DECISION
7. After hearings, Board or Chair issue a Decision – may take different forms according to country’s legal system
• A plain language decision document, supported by modifications of
the License (UK & common law countries)
• A legal regulation, with the form of a by-law (most Continental, civil
law countries)
• Decisions are justified in the premises of the by-law or by a separate
technical report
• A Regulatory Impact Assessment is required in some countries,
analysing economic, social, environmental impacts of decisions
50
APPEAL
8. Decisions may be appealed, though in different way pursuant to country’s legal system
• Before another authority (e.g. UK: the Competition Commission;
Austria: E-Control Commission)
• Only internally, before the Chairman (Czech Republic, except for
serious breach of law)
• Before special Administrative Courts (e.g. France, Italy)
• Before ordinary civil courts (e.g. Netherlands)
Regulatory litigation plays different role in various countries
Supporting documents (consultation, technical reports, impact assessment, data sets) may be important evidence for the appeal
51

THE EUROPEAN APPROACH: COMMENTS
Degree of transparency (including publication of data, detailed proposals, etc.) depends on country’s standards, usually increases over time
The tariff setting process is very long in most experienced countries (up to 2-3 years), but may be shorter at the start
In early stages, transparency helps Regulators’ independence
Stakeholders’ involvement to be actively sought in early stages of the Regulator’s activity, strengthen its role
Consumers and market newcomers are likely to benefit from the establishment of an independent and strong Authority
52
Part 4
TARIFF LEVEL

BASIC PRINCIPLES
Two-step approach:
• Set Allowed Revenue (AR), and hence the average tariff level
• Determine or approve tariff design (tariff structure), allocating costs
to network users
Cost of efficient companies to be covered
• Choice: actual vs. standard (efficient) costs
• Only costs of the regulated activities
• Only costs actually incurred by operators, net of subsidies
• Principle: Use market values if available, “simulate” if not
54
REGULATORY APPROACHES
Price cap (RPI-X) regulation: allowed revenue adjusted annually by pre-determined criteria
Revenue cap (RPI-X) regulation: unit tariffs adjusted annually by pre-determined criteria
Rate of return regulation: tariffs changed upon request after Authority’s inquiry (rate case)
Profit sharing (sliding scale): tariffs cut so that profits are partly returned to users
Regulation after market based prices
Competition for the market (Demsetz competition): tariffs set by a competitive process (e.g. gas distribution in Turkey)
Yardstick competition (related caps): tariffs set in line with industry’s average costs, after adjustments
55

56
Question 2: Which regulatory approach is currently used in Turkey for gas transmission?
1. U.S. style rate of return regulation, tariffs changed
upon request
2. Revenue cap: allowed revenue adjusted annually by
pre-determined criteria
3. Price cap: unit tariffs adjusted annually by pre-
determined criteria
4. Annual setting of tariffs by Authority, no link with
previous/following years

www.kahoot.it
57

APPROACHES OTHER THAN REVENUE/PRICE CAP (1)
Rate of Return (Cost plus) : P = Total cost x (1+RoR)
• Case by case analysis of costs
• Allow a regulated, normal profit margin (see below)
• Do not change tariffs; If productivity growth > inflation rate,
companies may earn more Improvement incentive
Rate of Return regulation: Problems
• Under high inflation, companies must ask frequent tariff hikes
• Incentives depend upon external factors (inflation)
• Companies may inflate cost base, colluding with input suppliers, in
order to increase profits (Averch-Johnson effect)
• To (partly) avoid this problem, regulators need strong staff to
analyse costs – never enough!
58
APPROACHES OTHER THAN REVENUE/PRICE CAP (2)
Profit sharing (sliding scale)• A share (e.g.50%) of profits to be transferred to customers/users, by
reducing prices/tariffs
• Only partly addresses problem of excess profits
• Used sometimes in combination with other approaches
• Useful for the transition between regulatory periods, where excess profitsmay appear (see below)
Market based tariffs for monopolies?
• May use tariffs of similar services used in competitive situations
• Rarely used in Europe, for TSO that compete in transit
Benchmarking Approaches
• Particularly useful for distribution, where several comparable companies/district exist
• See Annex 2
59

THE ALLOWED REVENUE (AR)
Also known as Revenue Requirement Calculation methods may apply to both European
(Revenue/Price Cap) and American (Rate of Return) approaches
AR = RAB * RoR + DEPR + OPEX
Where:
• RAB = Regulated Asset Base (capital)
= GRAB (Gross RAB or carrying value) – cumulated depreciation
• DEPR = annual depreciation
• OPEX = operating cost from company accounts
• RoR (rate of return), usually defined as WACC (weighted average cost
of capital)
60

PREFERRED EUROPEAN REGULATORY APPROACH: REVENUE CAP (1)
Fixed regulatory period (3-8 years)
Every year, AR is adjusted to allow for:
• Cost inflation (RPI)
• Predetermined productivity improvement (X)
• Factors besides company control (Y)
• Errors in tariff drivers’ estimation (E)
Tariffs are adjusted every year according to revised AR and tariff parameters (e.g. capacity, volume,…)
Tariff change is largely predictable
61

PREFERRED EUROPEAN REGULATORY APPROACH: REVENUE CAP (2)
Formally:
ARt = ARt-1 (1+RPIt-X+Yt+Et)
ARt = Ti Di
• Di are tariff drivers (capacity, volume, energy, …), to be discussed in
Part 4
• Yt are special incentives and penalties (e.g. for quality of service)
• Et are factors beyond control of the companies (e.g. fuel costs)
All revenues must be included in the revenue calculation, including connection charges, imbalance charges, etc...
Revenue adjustment may be applied to parts of the AR only (e.g. OPEX only)
62

REGULATORY ASSET BASE (RAB): VALUATION (1)
General principle: all subsidies, grants, connection charges etc. received from customers, government, donors etc., should be subtracted from RAB
Preliminary unbundling of accounts is always necessary Commonly used valuation criteria:
• Book value: Use the value of assets included in the latest official
balance sheet
• Ad-hoc appraisal of assets
• Stock market value of regulated company
• Re-evaluated historical investment cost (Current cost)
• Modern equivalent Asset Value
63
REGULATORY ASSET BASE (RAB): VALUATION (2)
Official balance sheet (Book Value)
• Use the value of assets included in the latest official balance sheet
• May not reflect actual economic value, due to (e.g.) accelerated
depreciation, subsidies…
• In some cases, the Book Value better reflects the cost that has been
actually paid by investors
• Customers should not pay for the network investment cost “twice” –
once as taxpayers, once as gas consumers
• In some countries, the Book Value is re-evaluated so that it is close
to current cost
• In some countries, use of the Book Value is mandatory
64

REGULATORY ASSET BASE (RAB): VALUATION (3)
Ad-hoc appraisal• Regulated companies often hire external auditor to evaluate assets
• The appraisal may be biased if done by companies, cumbersome if doneby regulator, and is always quite costly
• Auditors may end up using the same methodologies (Current cost, MEAV)so that their assessment is not really different
Stock exchange value • Logical circularity with tariff setting process, as the market value (as
assessed by financial analysts) usually depends on tariffs
• Deep fluctuations may occur, affected by regulation, market trends
• Stock market value may be available for an integrated company or Group
rather than the network or distribution system
• Therefore, regulators should look at market values but not use them,
except for companies that have been privatised before regulation
65

REGULATORY ASSET BASE (RAB): VALUATION (4)
Re-evaluated balance sheets (Current Cost method)
• Preferred European approach
• Requires long (often>20 yrs.), reliable investment data series
• If some data are missing, may use statistical estimate
• Results are affected by price index that is used for re-evaluation
Modern Equivalent Asset Value (MEAV)
• Uses value of equivalent modern assets
• Preferred if no long reliable investment data series available
• Uncertain impact of technical progress, as “modern” assets may be
cheaper than original ones – but cost of pipeline steel has lately
increased
May use Current Cost where data available, MEAV where not
66

67
Question 3: Which asset valuation methodology is mainly used in Turkey for gas transmission?
1. Book value
2. Current cost (re-evaluated historical value)
3. Modern Equivalent Asset Value (MEAV)
4. Other
CURRENT COST METHOD: RAB AND DEPRECIATION
68
kt k
t
k
t
kkt t
k
t
kt t
k
t
UL
PIDEPR
UL
tTPIRAB
PIGRAB
,
0
,
,
1
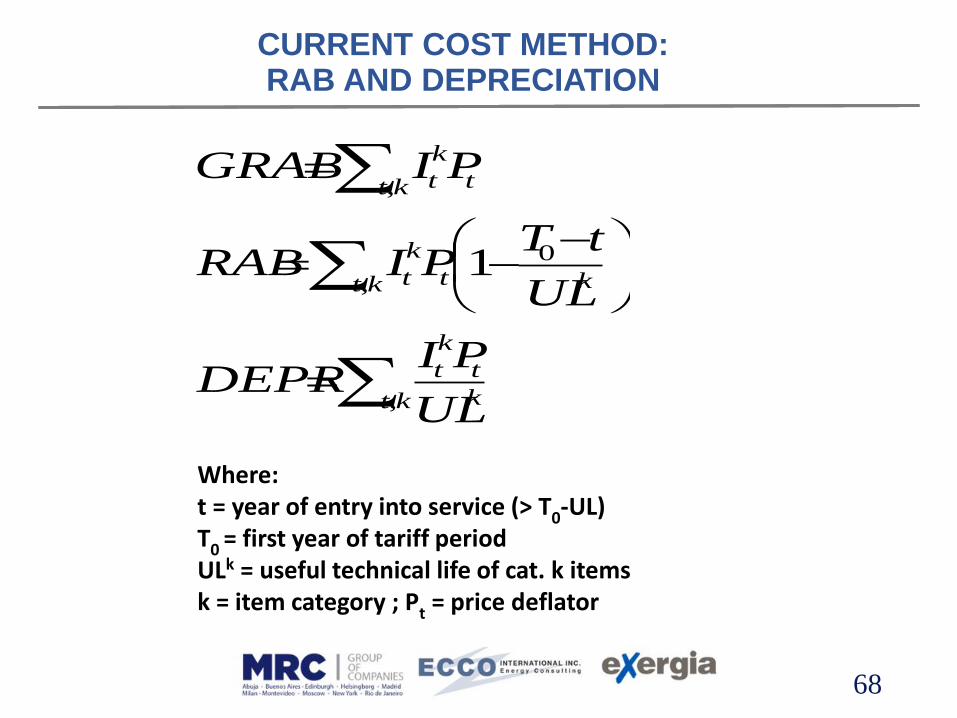
Where:t = year of entry into service (> T0-UL)T0 = first year of tariff periodULk = useful technical life of cat. k itemsk = item category ; Pt = price deflator

RAB UNDER OTHER VALUATION METHODS
Under MEAV, GRAB valuation differs but RAB valuation is the same as for “current cost” methodology
Under Stock Exchange Value RAB is defined, GRAB may be evaluated by reverse process, adding depreciated asset value
Appraisal would normally yield both GRAB and RAB
Not easy to compare methods, as accounting principles can lead to book values to be close to current in a few cases
Most likely, RAB valuation is:BV < MEAV <> CC < SEV
69

RAB : NEW INVESTMENTS
Normally regulators allow inclusion of new assets into RAB only after they enter into service
• However, EU regulation 347/2013 suggests early inclusion as a
possible way of fostering capacity and interconnection
enhancement, where appropriate
Higher returns on new investments also envisaged and welcome, implemented in a few countries (usually + 1 - 4%)
National regulators in Europe not fond of incentives as they lead to tariff increases
70

CURRENT COST METHOD: DEPRECIATION
71
Technical & linear depreciation preferred in EU
DEPR = GRAB / Useful Life (UL) (of each item)
Other depreciation methods may be used e.g. double declining
Typical useful life UL (years) by category of asset:
• Buildings 50-60
• Pipes 40-60
• Compressor stations 20-30
• Other fixed assets 10
If need use legal or fiscal useful lives, distortions may occur, corrections may be necessary

THE RATE OF RETURN
e
D
e
E
t
t
ED
DK
ED
E
t
KWACC
1
1
1
• KE = rf + β MRP is the cost of equity
• rf = “risk-free” rate
• MRP = Market Risk Premium
• KD = cost of debt
• t = debt tax shield
• te = corporate tax rate
Actual financial costs normally not used
Rate of return from Capital Asset Pricing Model (CAPM): weighted average cost of capital WACC
72

WACC: THE «RISK-FREE» RATE
Risk-free rates are normally those of Govt. Bonds
• It already includes country risk!
Must choose duration
• Normally long term (e.g. 10 years)
Latest values or moving averages?
• Preferable to use 3-5 years moving average to avoid possible short
term bond rate fluctuations
• Some regulators have adopted indexation of free-risk rates to
indicators of international rates
If tariffs are defined in the national currency, then should use rates of bonds denominated in national currency
If tariffs are defined in foreign currency may use currency-denominated bonds (if available)
73

WACC: THE MARKET RISK PREMIUM
Market Risk Premium should be national
• Long term average
In many emerging markets, data about long term market (equity yield) premiums with respect to government bonds are not available or very volatile
Therefore, international financial institutions and advisers suggest to use risk MRP from international markets, then add country risk, e.g.:
𝑀𝑅𝑃𝑍=𝑀𝑅𝑃AAA + Country Risk Premium
Likewise, for the debt premium, may use debt premium from international markets, then add country risk
For data, may look for: Damodaran
74

WACC: DEBT/EQUITY, BETA, TAXES
Debt/Equity ratio often set as target (e.g. = 1)
• Want to encourage more debt, to reduce financial costs
• Based on mature peers’
• Sometimes actual D/E is used
Risk index (beta) for transmission is usually taken from analysis of an international sample of peers
For both D/E and Beta, should carefully consider actual company values
• Unbundled TSOs can afford higher leverage than integrated companiesand have lower risk
Tax & shield rates must be related to national tax codes
Actual (real, pre-tax) WACC values in the EU lie in the 5.5% –9.1% range
75

WACC: NOMINAL VS. REAL
In the U.S. and in other countries, where tariffs are fixed and not adjusted for cost inflation (or are set for one year only), the calculated nominal WACC applies
In Europe, where multi-year regulatory periods are used and tariffs are protected from cost inflation through the RPI-X adjustment formula, regulators normally allow only the real rate (i.e. nominal rate minus expected inflation)
Compensation is foreseen in case actual inflation differs from expectations
76

THE RATE OF RETURN: DCF METHOD
“Discounted Cash Flow”, also known as DividendGrowth Model
Based on the idea that the cost of equity capital can berevealed by markets
Where:
• D are dividends per share,
• P is equity price and 𝐷 ̇is the time evolution rate of dividends
Rarely used outside the U.S., not popular in Europe
Less transparent than WACC
77
𝐾𝑒 =𝐷
𝑃+ 𝐷

OPERATIONAL COSTS (OPEX)
Evaluated after accounting unbundling, i.e. after checking for cross subsidies with other activities
Only costs of relevant activity to be allowed
• When unbundling, regulated companies tend to attribute common
costs to network rather than supply subsidiaries
Actual costs normally used as starting point for the calculation of the Allowed Revenue
• Peer-checked if possible (e.g. check OPEX/GRAB, OPEX/customer,
OPEX/Km, …)
• May use advanced benchmarking techniques (see Annex 2)
• If ratios found far from peers, X-factor may be used for gradual
adjustment
78

ALLOWED REVENUE & TARIFF STRUCTURE
79
May have to adjust values from the last available data to the starting year of the new regulatory regime
• Inflation
• Tariff drivers (volume, capacity, No. of connected users…)
• New investment?
Tariff structure defined to be consistent with AR
• ARt = Ti Di
• Consistency ensured by using expected values of tariff
parameters for the start of new tariffs
• Further discussion under Part 6 (Tariff Design)

THE INVESTMENT CYCLE
Network investments usually have a bumpy trend, due to bulky assets that are developed in relatively short time (compared to useful life)
• Examples: major interconnectors, compressor stations, SCADA systems,
primary pressure reduction stations, LNG terminals, storage sites
Companies would prefer fast depreciation
Regulators normally prefer stable tariffs
In any case, large investments’ entry into the asset base lead to tariff increases
Depreciation practice largely defines how tariffs are affected by investments
No simple rules to smooth investment impact on tariffs, it all depends on the time structure of past investments
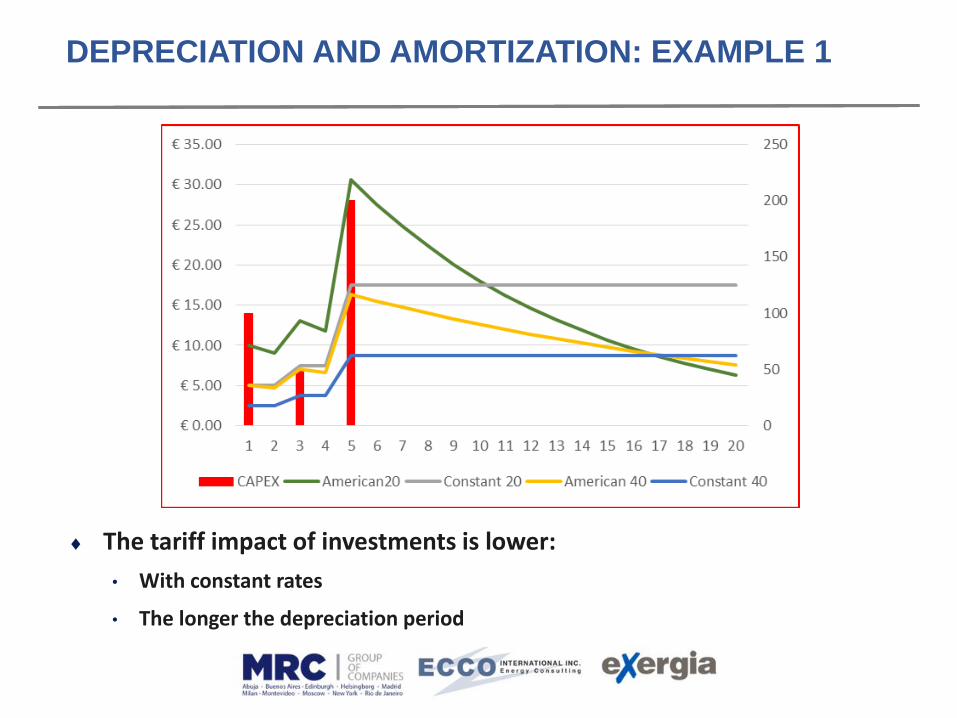
DEPRECIATION AND AMORTIZATION: EXAMPLE 1
The tariff impact of investments is lower:
• With constant rates
• The longer the depreciation period

DEPRECIATION AND AMORTIZATION: EXAMPLE 2
The relationship between allowed revenue and depreciation time (useful life) is neither obvious nor monotonic
• Example from an actual TSO pipeline database, with constant depreciation
• The relationship between AR and useful life depends on the rate of return
DEPRECIATION AND THE INVESTMENT CYCLE: CONCLUSIONS
No general rules about way of smoothing the impact of bulky investments
Regulators should keep a long-term database of companies’ investments
Longer depreciation lives reduce impact of recent investments but may increase the Asset Base, as depreciation of current assets is slower
If regulators can choose useful depreciation lives and depreciation method, they may be able to find an optimal balance

Part 5
TARIFF UPDATING
MAIN REGULATORY APPROACHES
North American: fixed tariffs (rates), to be reviewed whennecessary
European: regulatory period set in advance (3-8 years),tariffs updated yearly by rules that are issued as part of thetariff decisions
• For example by price cap: unit tariffs updated every year by the
inflation rate (RPI) minus expected productivity growth (X)
Widely spread practice: Tariffs defined on an annual basisor at regulators’ will, with no inter-temporal links
• Not recommended, as it triggers regulatory uncertainty,
jeopardizing investments and efficiency improvements
85
REVENUE CAP UPDATING
Annual adjustment (RPI – X +…) mostly applied to allowed revenue
in EU (75% of Member States):
ARt = ARt-1 (1+RPIt-X+Yt+Et)
X normally set through comparison with benchmarks, historical productivity growth (Total Factor Productivity model)
An error correction mechanism or regulatory account may be enforced to guarantee the AR, correcting when necessary
A threshold is often applied before adjusting the revenue, as differences between actual and allowed revenues may offset across time
Special provisions for variable cost are necessary, allowing pass-thru of fuel cost, which may be related to international fuel markets
81

PRICE CAP UPDATING
Under Price Cap, RPI-X+… is applied to unit tariffs for capacity, fixed commodity and/or commodity (price cap):
Tit = Ti
t-1 (1+RPIt-X+Yt+Et)
Under price cap, X must also consider volume increase
• Network cost (except variable cost, i.e. compression cost and leakages)is basically independent of the gas volume (throughput)
• If consumption increases and unit prices remain the same, actualrevenue would exceed the AR
• Expected growth rate
The allowed revenue is not necessarily met, revenue may be <> AR
Under price cap, volume risk is left upon the transport company, hence the WACC should be higher
82
REVENUE / PRICE CAP UPDATING: COMMON ISSUES
Under both Revenue- and Price-Cap, special provisions are necessary, allowing pass-thru of fuel cost,
Fuel costs may be indexed to international fuel markets
For special objectives (e.g. quality of service, a “sliding scale” mechanism may be envisaged, allowing higher margins if objectives are exceeded while penalties are applied if minimum objectives are not achieved
Components (+/-) are sometimes included for:
• Incentives for new investments, e.g. increased returns
• Revenues/Costs from compensation mechanisms from/to otherTSOs/DSOs
• Costs of social tariffs for subsidized consumers
• Environmental support schemes, e.g. for renewable gas
83

89
GUARANTEED TSO INCOME?
Most transmission costs are fixed (all except compression and leakages)
Unbundled TSOs do not control gas flows – they are up to shippers
Under Revenue cap , tariffs are adjusted to offset demand change that may lead to cost under-recovery (regulatory account)
Under price cap (or in the U.S.): no such adjustments, TSOs carry demand risk
Regulatory account
• If actual revenue diverges from allowed, tariffs will be adjusted
• Threshold usually introduced to avoid too frequent changes
• Example provided in Excel file

TRADITIONAL RATE OF RETURN REGULATION (COST PLUS: NORTH AMERICAN APPROACH)
In the traditional approach (Rate of Return regulation), prices are defined by adding a “fair” rate of return to the average cost
P* = AC (1+ROR)
Adjustment only at stakeholders’ (usually regulated companies’) request, followed by public inquiry
Ratio: avoid excess profit, only allow fair one
Calculation of capital costs, OPEX, Rate of Return is similar to what has been described for the AR approach
90
TRADITIONAL COST PLUS VS. REVENUE/PRICE CAP
Revenue / price caps offer more efficiency incentives and regulatory stability, but:
• companies can neutralise some of them by strategic behaviour (e.g.postponing improvements until after base year)
• Sharing of further productivity improvements after the end of theregulatory period may reduce this problem
• Choice of X factor may be questionable, but no serious disputes lately –often limited to OPEX
• If costs and tariffs diverge during the period, the company may increaseits profits in a way regulator may be embarrassed
• If cost inflation is high, RoR requires frequent, costly reviews
Recent EU evolution: towards longer regulatory periods or predetermined links between periods
91
COMMON PROBLEMS
Costs may be too high (inefficiency)
If high costs are related to past inefficiency (e.g. in purchase of long lasting inputs), regulation can hardly solve it
Regulation based on actual costs may trigger excess investments (gold plating) or “too high” quality of service
Hard to assess, as the regulator has never the same information as the company
Benchmarking provides limited help
In the first implementation (first year of first period) both EU and US approaches share the same problems
92

Part 6
TRANSMISSION TARIFF DESIGN
For information about actual tariffs in the EU: Market Monitoring Report 2017, www.acer.europa.eu/en/Electricity/Mar
ket%20monitoring/Pages/Current-edition.aspx

TARIFF DRIVERS
Transportation tariffs should be related to costs, hence to cost drivers:
• capacity
• distance
• shipped volume (energy)
• connection points
Different criteria may be used for primary (national) and secondary grid
94
TARIFF STRUCTURES: ALTERNATIVE METHODS
Point to point (P2P or distance-related)• traditional, preferred by integrated companies
Zonal tariff
• American simple version of P2P
National postage stamp
• Politically supported, hardly cost reflective
Entry – exit
• Recommended by regulators, EC
Capacity auctions
• OK for entries, but risky if market power
• May lead to cost under-recovery
• Adopted for entries in EU, but subject to minimum tariffs
95
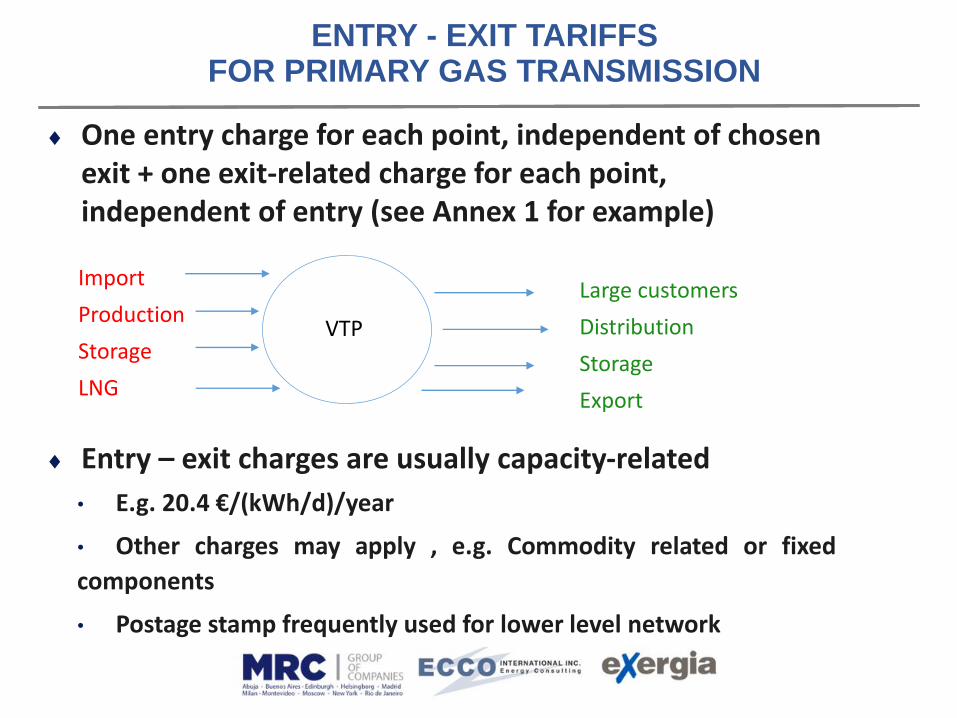
ENTRY - EXIT TARIFFS FOR PRIMARY GAS TRANSMISSION
One entry charge for each point, independent of chosen exit + one exit-related charge for each point, independent of entry (see Annex 1 for example)
Entry – exit charges are usually capacity-related
• E.g. 20.4 €/(kWh/d)/year
• Other charges may apply , e.g. Commodity related or fixed
components
• Postage stamp frequently used for lower level network
VTP
Import
Production
Storage
LNG
Large customers
Distribution
Storage
Export

ENTRY-EXIT METHODOLOGY: PROs & CONs
Intermediate solution between postage stamp and P2P
• Tariffs are closer to postage or P2P, depending on network topology
Good cost reflectivity, notably if gas arrives from several directions (but less than P2P)
Maximum flexibility for shippers, who can choose any exit from any entry even in short term
Creates a Virtual Trading Point located “on the grid” between all entries and all exits
• maximising liquidity for national markets
Lower capacity than P2P (for the same infrastructure) may be the price of flexibility
97

THE ENTRY-EXIT CAPACITY BURNING PROBLEM: QUESTION
A simple transmission network:
One import entry point A (Technical capacity 50 GWh/day)
Two export exit points B (15), C (10)
Domestic exit V (25, Virtual Trading Point)
If a simple entry-exit model is implemented in this network, shippers are in principle free to choose any exit point for gas entering at A.
Q: What max. capacity will the TSO offer for sale at A?
98
THE ENTRY-EXIT CAPACITY BURNING PROBLEM: ANSWER
If all shippers choose exit C, only 10 GWh/d can be transported through the system
The TSO would therefore offer only a firm capacity of 10GWh/d at entry point A, with any other capacity made available on an interruptible basis
However, if some capacity could be offered at A conditional upon delivery at (e.g.) export point B, then total capacity offered at A could be increased to 30 GWh/d, as the risk of all gas diverted to C would be void
In practice, TSOs may offer more than would be allowed by offering total flexibility, as the probability of all shippers choosing C is very low – in fact some gas will be necessary for demand at B & V
But, entry capacity offered at A on a totally flexible basis is probably less than 50 GWh/d (as it would occur under P2P)
99

100
ENTRY-EXIT TRANSMISSION TARIFFS: MAIN ISSUES
Choice of entry and exit points: actual points vs. zones
• Exit may be postalised, usually for domestic exit points
Cost basis: average vs. incremental cost
• Incremental cost preferred in case of congestion
Entry / Exit cost allocation criteria
• Avoiding discrimination between domestic and cross border
trade is the key objective of TAR Network Code
Tariffs for special services (Conditional, Interruptible,
Reverse flow, Shorter capacity products)
Capacity / commodity split

101
ENTRY-EXIT TRANSMISSION TARIFFS: ALTERNATIVE COST ALLOCATION CRITERIA (1)
Calculation of capacity charges TE, TU for the primary
grid can be done in several ways, still debated in the
EU:
1. Matrix. Solve min Σij (TEi + TXj - COSTij)2
Where:
• TEi is the entry charge for entry point I;
• TXj is the exit charge for exit point j;
• COSTij is the point-to-point cost of transport from entry point i to exit zone j)

102
ENTRY-EXIT TRANSMISSION TARIFFS: ALTERNATIVE COST ALLOCATION CRITERIA (2)
2. Calculated TEi as capacity weighted average distance of entry point ifrom all exit points, and TXj likewise:
𝑪𝑾𝑫𝒊 = 𝒆𝒙𝒊𝒕=𝒋=𝑿,𝒀,𝑯
𝒆𝒏𝒕𝒓𝒚=𝒊
𝑫𝒊𝒔𝒕𝒂𝒏𝒄𝒆𝒊𝒋𝑪𝒂𝒑𝒂𝒄𝒊𝒕𝒚𝒋
3. Define a physical or virtual point in the network where most gas converges and calculate TEi + TXj in relation to distance of each entry or exit from the virtual point
Capacity weighted distance is the preferred cost
allocation methodology against which all other must
be benchmarked in the EU

103
ENTRY-EXIT TRANSMISSION: SPECIAL SERVICES (1)
Conditional Capacity Products• Short-haul products, introduced to avoid by-pass of
short-distance transmission users; usually @ very low tariffs (5-10%)
• Wheeling: short distance transfers between interconnected pipeline systems; usually @ very low tariffs
• Products conditional upon choice of related entry and exit points, with no access to VTP; used mainly for transit, discounted (70-80%)
• Products conditional upon certain climatic(flow conditions, with interruptible access to VTP; slightly discounted (90-95%)
104
ENTRY-EXIT TRANSMISSION: SPECIAL SERVICES (1)
Interruptible services
• Interruption conditions must be clearly specified
• Discounts related to interruption probability (may be very low)
Virtual Reverse Flow (backhaul) services
• Special interruptible service to be offered at significant discount, but logical basis to define discount uncertain
• Various cases in EU, e.g. 20%, 50%,…
SHORT TERM PRODUCTS
In the EU and other liberalised systems, TSOs increasingly offer short term capacity products
In the EU, the CAM Network Code requires the offer of annual, quarterly, monthly, daily, and within-day products
Products are auctioned, but regulated reserve (minimum) tariffs are defined by NRAs
TSOs tend to request higher unit prices for short term capacity products, due to: • relatively higher administrative burden
• higher risk of loss of TSO revenue
Regulators support ST products as a tool for boosting competition
Ratios between ST and annual capacity tariffs (multipliers) are capped by the Tariff Network Code
105

CAPACITY – COMMODITY SPLIT
Pure cost structure reflectivity would require 95% capacity and fixed components (straight fixed variable approach)
Applied in most EU countries (and US)
Competition would lead to “commoditisation”
Regulatory decision: commodity component may be higher than variable cost, to share demand risk between transport companies and shippers (Britain, Italy, Poland…)
15/23 EU Member States have capacity components 90%
Availability of short term capacity products reduces relevance of capacity charges, as shippers can buy for the flows they need only
106

CONNECTION CHARGES
Connection charges are often regulated only for small customers, connected to distribution networks
Regulatory protection of large customers may be needed if TSO (or integrated suppliers) require them to pay for assets that they will not own (e.g. long and costly connecting pipelines)
Protection is achieved:
• By strict application of the principle that connection charges are
subtracted from the RAB
• By allowing customers to build and own their connections
• By requiring TSOs (or integrated suppliers) to tender the
construction of connection assets, so that lowest cost is achieved
107
Part 7
STORAGE & LNG REGASIFICATION
STORAGE TARIFF: IS REGULATION NECESSARY?
Underground storage is a crucial part of the value chain
The 2nd European Directive (2003/55/CE) required TPA to storage, administrative unbundling
TPA may be negotiated or regulated
Negotiated tariffs work better with STS competition (it assures no discrimination), or if other good flexibility tools are available
If substitutes are weak, tariff regulation may be necessary
Tendency towards auctions
Storage demand crisis, due to low winter-summer price spreads, may lead to re-regulation
10922

110
Regulated vs. negotiated TPA
Similar weight of both approaches but negotiated larger by capacity (67%)
Some “hybrids” and “N.A.”, actually mostly negotiated in CZ, IE, GB, regulated in HU, BG, SK

111
Regulatory regimes and main allocation rules
• Wide use of auctions
Country Access Main allocation procedure
AUSTRIA negotiated FCFS/Auction
BULGARIA regulated Merit order
CZECH REPUBLIC negotiated Auction
DENMARK negotiated FCFS/Auction
FRANCE negotiated Merit order
GERMANY negotiated FCFS/Auction
HUNGARY regulated Auction
ITALY regulated Auction
POLAND regulated Pro-rata
PORTUGAL regulated Auction
SPAIN regulated Auction
UNITED KINGDOM negotiated* Auction
*The study focuses only on facilities which are not exempt from the nTPA provisions.
STORAGE: REGULATED TARIFF CRITERIA
Valuation criteria as for transport
Cushion Gas valuation at opportunity cost
• often most difficult issue
Rate of return by same criteria as for transmission
• Higher value likely if demand risk borne by storage operator
RPI – X price or revenue updating
Cost attributed to tariff components:
• underground facilities and CG to space
• surface facilities to peak capacity
• energy (compression) costs to commodity
11222
113
The evolution of storage prices
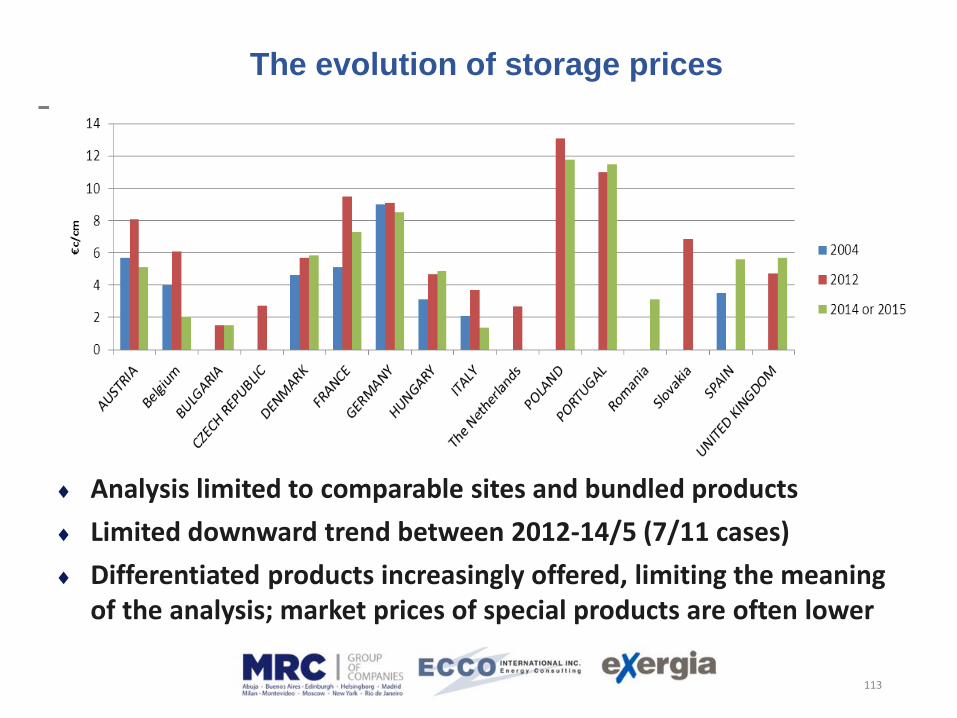
Analysis limited to comparable sites and bundled products
Limited downward trend between 2012-14/5 (7/11 cases)
Differentiated products increasingly offered, limiting the meaning of the analysis; market prices of special products are often lower
114
The composition of storage prices (2015)
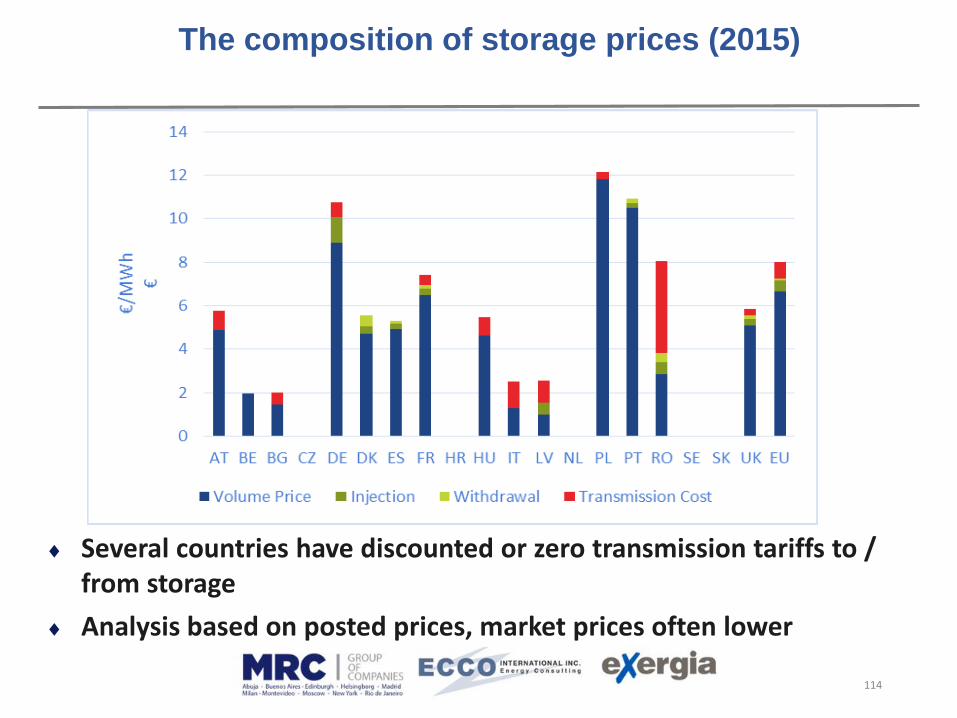
Several countries have discounted or zero transmission tariffs to / from storage
Analysis based on posted prices, market prices often lower

115
The determinants of storage prices
Faster facilities command higher prices

LNG REGASIFICATION TARIFF
Widespread tendency to limit regulation and award TPA exemptions
Allowed revenue and updating: same methodology as for transport
Higher rate of return due to higher risk
Tariff structure normally related to
• capacity booking
• actual use of terminals
• cost of technical gas used for regasification and losses
116

Part 8
DISTRIBUTION TARIFFS
Partly based on the European Commission’s Distribution Study by AF-Mercados, REF-E & Indra, 2014-15
For details: https://ec.europa.eu/energy/sites/ener/files/documents
/20150313%20Tariff%20report%20fina_revREF-E.PDF
118
Geographical outreach (City, Province, Country…)
Service tendering
Separate distribution and supply tariffs?
Case by case regulation vs. competition simulation by benchmarking
Main distribution tariff regulatory approaches in Europe
Tariff structures and levels across Europe
Connection charges
KEY ISSUES IN DISTRIBUTION TARIFF REGULATION

119
GEOGRAPHICAL OUTREACH
In Europe, gas distribution is mostly performed at localgovernment level (e.g. Germany) or intermediate (county, district, province, Land…)

120
Average gas DSOs size
Gas distribution is a national business only in Ireland, Slovakia
121
DISTRIBUTION SERVICE LICENSING
May be used for tariff setting, notably in new networks (Example: Turkey)
Risk that lower prices affect quality of service
Risk that winners ask for renegotiation
Hard to beat incumbent when licenses are up for renewal
Service tendering examples in Italy, Argentina, Turkey…
In most advanced countries, long or indefinite licenses are preferred
If DSOs are private, buyouts by more efficient suppliers are possible
121

122
Distribution tariffs: Turkey’s approach (1)
Distribution franchise in each province (81 in Turkey), with monopoly selling rights for 8 years
Franchise is awarded by auction to the bidder offering the lowest average distribution tariff (without gas cost)
The winning company must start works within 6 months and serve all requesting customers within five years
Wholesale gas cost is passed through to customers
Distributors cannot buy more than 50% of their gas from the same supplier
After 8 years, the market is opened and third party access is implemented
The distribution tariff may be revised by the National Regulatory Authority, based on company costs

123
Private companies bid very low tariffs, even negative ones!
Why?
• Companies hoped to become incumbent in the province and retain a fair
share of customers
• Companies hoped to increase distribution tariffs under a cost based
regulatory regime
• Suppliers tried to create a captive market
65 provinces awarded until 2014 (+6 already active in 2004)
All distribution companies are private or have been privatised (except Istanbul, run by the municipality)
For 23 of them, the monopoly 8-year period has expired, new regulated (cost based) tariffs have been approved
Distribution tariffs: Turkey’s approach (2)

124
Distribution investment: Turkey’s results
Invested 3.9 billion TL (~1 billion US$) until 2013 (+ 5.4 BTL invested in original 6 provinces)
Consumption has significantly increased in industry and the residential sector, beyond major urban areas
Source: ESMAP / World Bank, 2015

125
DISTRIBUTION: UNBUNDLING
In Europe, legal unbundling is between distribution and retail supply is mandatory
For companies with less than 100,000 end customers, only unbundling of accounts is required
Separate tariffs are defined for distribution and retail supply
Metering may also be seen as a separate activity but this is a rare choice in Europe (In gas, U.K. and France only)
125
126
SETTING THE ALLOWED REVENUE OF DISTRIBUTION COMPANIES
Tariffs can be individually set for each distributor, as for transmission
However, special approaches are sometimes used for distribution:
• Define tariff by tendering the distribution service: not used in Europe,but it partly happens in Italy (and other countries), as municipalitiestypically require a licensing fee or part of distribution profits
• Use benchmarking methods: allowed revenue calculated by means ofstandard costs, depending on objective parameters – see Annex 2
• Standard costs estimated by statistical or engineering techniques, asindustry average or “best practice” – see Annex 2 for furtherinformation
127
Actual costs vs. Benchmarking
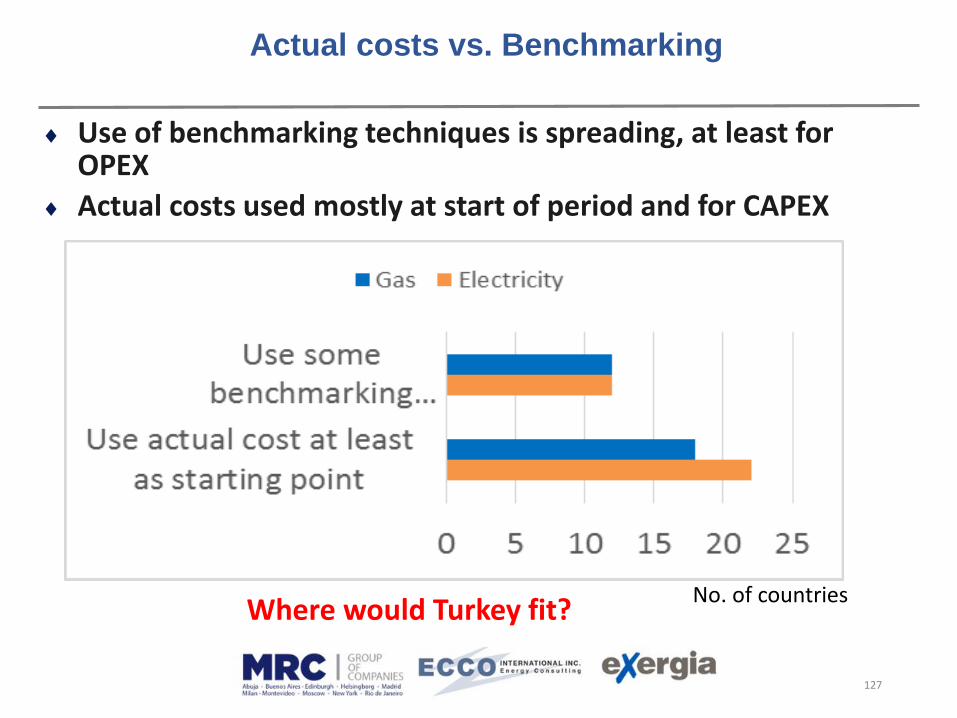
Use of benchmarking techniques is spreading, at least for OPEX
Actual costs used mostly at start of period and for CAPEX
No. of countriesWhere would Turkey fit?

128
Tariff regulatory model
Most EU Member States use incentive regulations, with some “passthrough” items
Where would Turkey fit?

129
Volume Risk on DSOs
Even in the few cases where some volume risk falls on DSO’s, exposure is limited
No Risk = if volumes fall, unit tariffs are increased so that the allowed revenue is achieved anyway
No. of countries
Where wouldTurkey fit?
130
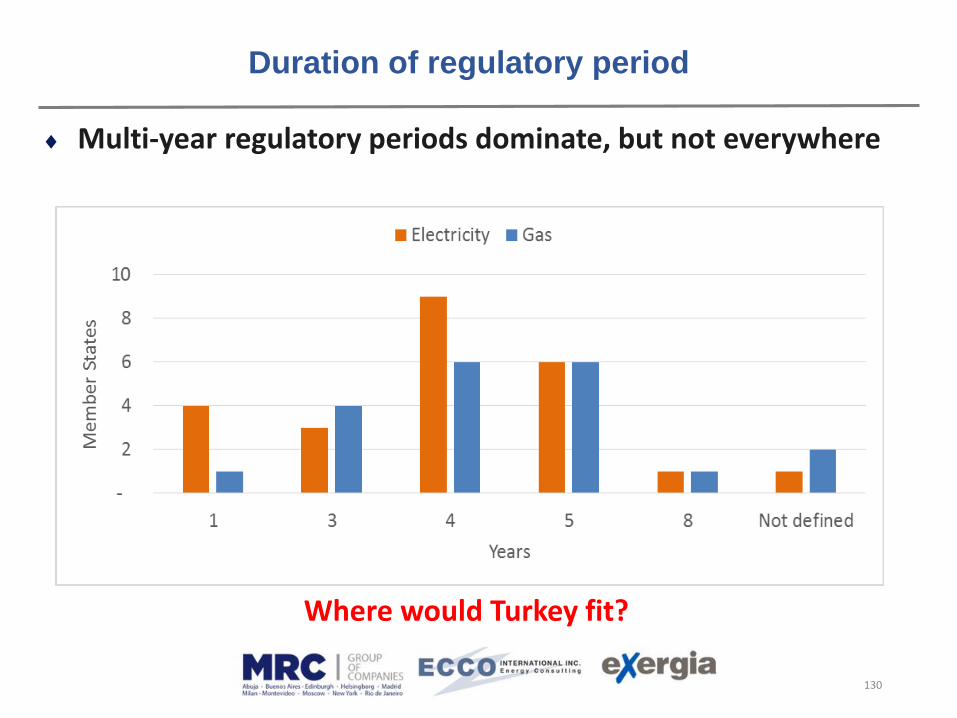
Duration of regulatory period
Multi-year regulatory periods dominate, but not everywhere
Where would Turkey fit?

131
DISTRIBUTION TARIFF STRUCTURE
Economic theory of optimal (Ramsey) pricing: less elastic demand sectors get higher tariff
Hence: should the tariff structure be proposed by distributors, who better know how demand react to prices in each sector?
Regulators often not at ease with Ramsey pricing, seen as “discriminatory”
Regulators usually prefer objective criteria like
• Consumption level
• Pressure class
• Type of consumer (e.g. households, commerce, industry…)
Capacity-related charges often used for large customers, endowed with hourly / daily meters

132
0
2
4
6
8
10
12
14
16
18
20
Pressure Level AnnualConsumption
Used Capacity Meter capabilities
Nu
mb
er
of
Me
mb
er
Stat
es
Variables used to define tariff structures
Tariff structure in Europe
In most countries the annual consumption (In Kwh/year or m3/year) is the key variable to define the tariff structure levels
The pressure level is used in combination with annual consumption in some countries like: AT, CZ, LU, ES, PT
In DE, HU, NL & PL the tariff are set according to annual consumption and used capacity
Only in AT, tariff blocks are also defined on the basis of metering capabilities
132
Where wouldTurkey fit?
133
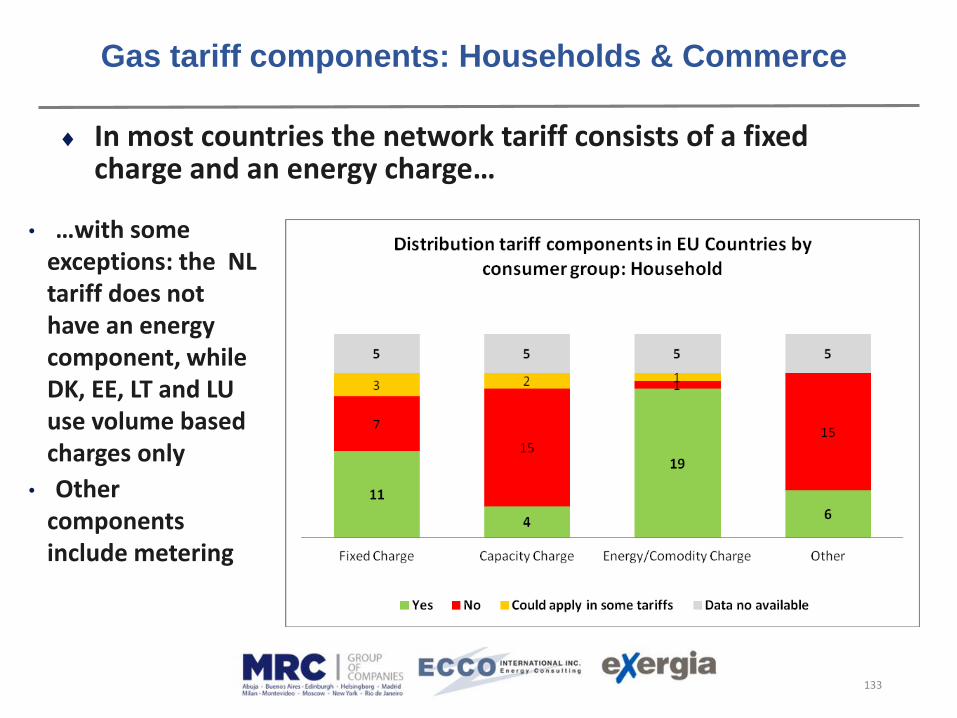
Gas tariff components: Households & Commerce
In most countries the network tariff consists of a fixed charge and an energy charge…
• …with some exceptions: the NL tariff does not have an energy component, while DK, EE, LT and LU use volume based charges only
• Other components include metering

134
Gas tariff components: Industry
In most countries the network tariff consists of a capacity charge and an energy charge
• Most countries apply a capacity charge (13) rather than a fixed charge (9)
• In all countries, except NL, there is a volumetric charge (€/KWh).
• Only PT has time of use differentiation.
913
19
5
117
1
15
1 1 1 1
5 5 5 5
Fixed Charge Capacity Charge Energy/Comodity Charge Other
Distribution tariff components in EU Countries by consumer group: Industrial
Yes No Could apply in some tariffs Data no available
134

135
29%
73%
0%
52%
0%0%16%
77%82%
15%
66%
0%
39%
71%
27%
100%
48%
100%100%84%
23%18%
85%
34%
100%
0%
61%
ATCZEEFRITLTLUPOSKSIESSENLAve.
15%
74%
0%
56%
0%0%18%
78%85%
14%
66%
0%
39%
85%
26%
100%
44%
100%100%82%
22%15%
86%
34%
100%
0%
61%
ATCZEEFRITLTLUPOSKSIESSENLAve.
12%35%
0%
53%35%
0%0%5%31%28%20%23%26%
88%65%
100%
47%65%
100%100%95%69%72%80%77%
0%
74%
ATCZEEFRITLTLUPOSKSIESSENLAve.
60%
2%
36%47%
30%
1%14%
47%
92%84%64%
87%
20%
66%80%
38%
100%
9%
46%
40%
98%
64%53%
70%
99%86%
53%
8%16%36%
13%
100%80%
34%20%
62%
91%
54%
ATCYCZFIFRDEELHUITLUPLPOROSKSIESSENLGBAve.
Fixed + Capacity components Energy component
Ho
us
eh
old
Ind
us
tria
l, 5
0 G
Wh
ind
us
tria
l, 5
0 G
Wh
• The active energycomponent recoversmore of the half ofnetwork allowed costs
• Household average:74%
• Industrial: 61%
• For household consumersthe energy charge hasmore relevance than forother consumercategories
Weight of tariff components
Ave. 74%
Ave.61%
Ave. 61%
Gas network allowed costs are mostly recovered though energy tariff components
135
136
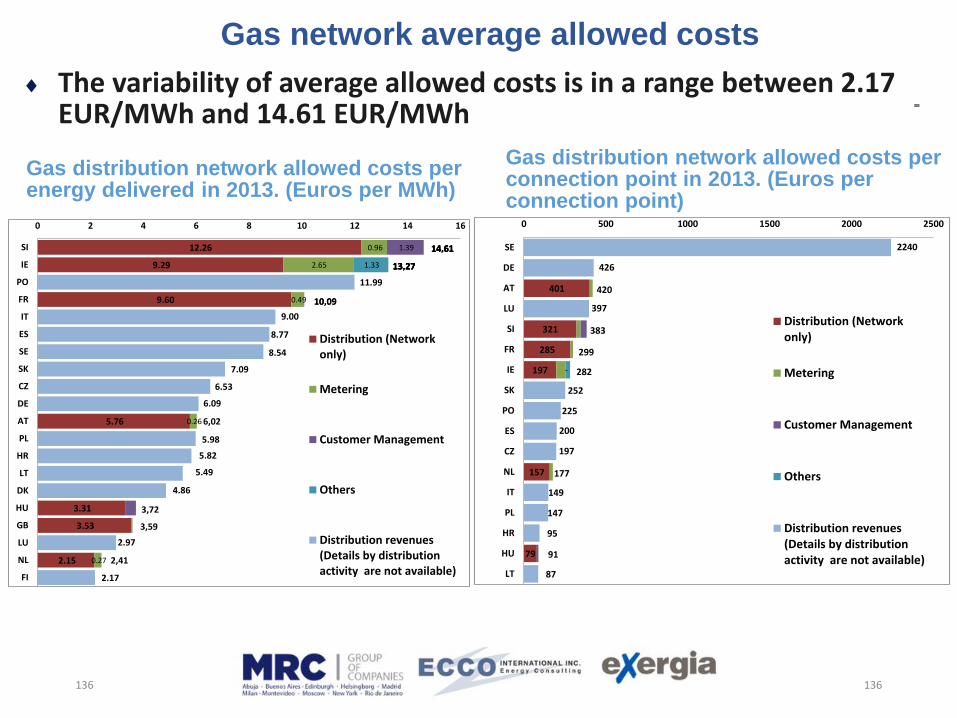
Gas network average allowed costs
The variability of average allowed costs is in a range between 2.17 EUR/MWh and 14.61 EUR/MWh
Gas distribution network allowed costs per energy delivered in 2013. (Euros per MWh)
Gas distribution network allowed costs per connection point in 2013. (Euros per connection point)
12.26
9.29
9.60
5.76
3.31
3.53
2.15
0.96
2.65
0.49
0.26
0.27
1.39
-
1.33
11.99
9.00
8.77
8.54
7.09
6.53
6.09
5.98
5.82
5.49
4.86
2.97
2.17
0 2 4 6 8 10 12 14 16
SI
IE
PO
FR
IT
ES
SE
SK
CZ
DE
AT
PL
HR
LT
DK
HU
GB
LU
NL
FI
Distribution (Networkonly)
Metering
Customer Management
Others
Distribution revenues(Details by distributionactivity are not available)
14.61
13.27
10.09
14.61
13.27
14.61
13.27
10,09
14,61
13,27
6,02
3,72
3,59
2,41
401
321
285
197
157
79
-
2240
426
397
252
225
200
197
149
147
95
87
0 500 1000 1500 2000 2500
SE
DE
AT
LU
SI
FR
IE
SK
PO
ES
CZ
NL
IT
PL
HR
HU
LT
Distribution (Networkonly)
Metering
Customer Management
Others
Distribution revenues(Details by distributionactivity are not available)
420
383
299
282
177
91
136

137
Gas total (€) and average distribution network charges (cent€/kWh) for households, 2013
Spain: average network tariff includes transmission cost.
3.59 3.572.69
1.73 1.55 1.52 1.37 1.14 1.01 0.97 0.82 0.74 0.68 0.33
539 536
403
259233 228
205171 151 145 123 111 102
50
SE PO ES AT Ave. FR SK SI CZ NL IT LU LT EE
cen€/KWh Total €/year
137

138
Gas total (€) and average distribution network charges (€c/kWh) for Industry (90 Gwh), 2013
Spain: average network tariff includes transmission cost.
2.17 0.45 0.43 0.41 0.34 0.33 0.32 0.31 0.26 0.23 0.20 0.15 0.04
1,953
401
390 365 304 299 287 283 234 203 183 133 40
SE SI Ave. LU LT EE ES PO SK AT CZ FR IT
cen€/KWh Total Thousands of €/year
138

139
OTHER TARIFF ISSUES
139
«Deep» connection charges include costs of network reinforcement; «shallow» only include costs of «last mile»: which is better?
Social tariffs could be applied to vulnerable customers (e.g. poor, elderly, disabled…)
Tariffs should be geographically uniform across the country or province
Tariffs should be related to time/day/season of gas consumption

140140
No. of countries
Other tariff issues: What does Europe do?

141
SUMMARY OF EU’S TARIFF REGULATORY SCHEMES
Allowed revenue, mostly defined on a multi-year basis, with price-cap or revenue-cap adjustment
Distributors typically do not bear volume risk and the risk that their investment turn out to be less useful than expected
Revenue setting mechanisms based on benchmarking or standard costs are often used where distribution sectors are fragmented
Tariff structures reflect limited availability of information on each consumer’s responsibility in causing distribution cost
141

142
RULES FOR MARKET OPENING
142
Market rules framework: common or individual network code
Capacity allocation a less serious problem than for transmission
Rucksack principle: capacity allocated to the supplier who wins the end customer
Switching issues:
• End customer switching procedures
• Market rules usually banning long term contracts that would hampercustomer switching
Metering problems of smaller customers, not endowed with daily/hourly meters
Complex load profiling methodologies developed, involving important distributors’ role
Part 9
END USER PRICES

144
WHY REGULATE END USER PRICES? (1)
In principle, gas supply is a competitive business if the market
is open and networks are regulated
Therefore, end user price regulation should not be necessary
But, even in open markets, competition may be weak, due to:
• Legacy contracts in upstream supply and/or retail
• Bottlenecks in the supply chain, e.g. in international transportation,LNG regasification, storage, production, treatment etc.
• Cartels or other collusive behaviour of suppliers
• Inadequate / ineffective consumer information, hampering consumerswitching to cheaper opportunities

145
WHY REGULATE END USER PRICES? (2)
Yet competition may be strong:
• Pipe to pipe competition in very large markets (North America)
• Gas to gas competition in unbundled supply in several EU MemberStates
• Interfuel competition in some markets
Social and/or environmental reasons may also justify end
user price controls (See part 1)
146
PRICING IN COMPETITIVE MARKETS: SOME EMPIRICAL RESULTS
Consumer representatives have often complained that retail prices tend to increase fast when wholesale prices rise but decrease slowly after wholesale markets crash (rocket-feather effect)
Evidence for this effect found in US, Australia, but mixed
Retail margin declined after liberalisation in Europe
Most academic comments point to inadequacies in the way liberalisation process was implemented rather than advocating return of price controls
Yet, many governments are not persuaded

147
PRICING: ITEMS & ISSUES (1)
Marginal cost means cost of the most expensive source (field or import) • conveying information about cost of further consumption
Supply price must include:• Infrastructure cost
• Exploration costs
• Natural gas scarcity value
Infrastructure cost• Includes: wells, upstream pipelines, treatment plants, long distance
pipelines, LNG liquefaction/shipping/regasification facilities
• Approach may be similar to networks:
Price = (Cost of “marginal” supply) / Quantity =
= RAB*Rate of Return+Depreciation+OPEX) / Quantity

148
HOW TO REGULATE GAS PRICES: KEY ISSUES (1)
The Retail Margin• Methodology (RAB/WACC) used for infrastructure pricing not suitable
for retail (trading) margin, as capital is very small
• May use empirically based margins
• In Italy and France, such margins have been recently assessed at 10-13%, including costs of the retailing companies
Rate Of Return• In producing countries, it is often hard to define market risk premium
or industry risk (beta factor)
• Must consider risk of oil&gas industry, far higher than networks’
• Typical (hard currency) rates of return for oil & gas productionbetween 12 and 16%
149
HOW TO REGULATE GAS PRICES: KEY ISSUES (2)
Gas Purchase Incentives
• If the gas purchase price is passed through to end users, suppliers mayhave an incentive to collude with producers and agree on higher thannecessary prices
• Therefore some EU & US regulators have linked the pass-thru to publicindexes, so that purchasers are incentivised to “bargain hard” and canretain the gains
• Profit sharing may also be used as an incentive, e.g. 50% of lower costw.r.t. benchmark retained by supplier

150
GAS PRICE CONTROLS: PROBLEMS OF PRODUCING COUNTRIES
In producing countries, regulators:• Tend to use average supply costs rather than marginal ones• Often neglect the scarcity value of gas and costs of unsuccessful
exploration• Sometimes prefer stable prices, neglecting market price swings• Want to keep gas price low, for social reasons and as support to
industry (including power generation)
As a consequence:• Prices are often too low to encourage new exploration and
development
• Consumption grows faster than under market-reflective pricing
• Domestic consumption uses up resources, reducing exports
These problems have occurred in many countries, e.g.:• US (1960s-70s); New Zealand (1995-2002)
• Egypt, UAE, Saudi Arabia, Algeria (to date)
• Argentina, India (after 2000)

151
• Several Middle Eastern & North African countries have lost self-sufficiency or reduced exports
Source: BP
Production & Consumption in some Middle East / North African countries
152
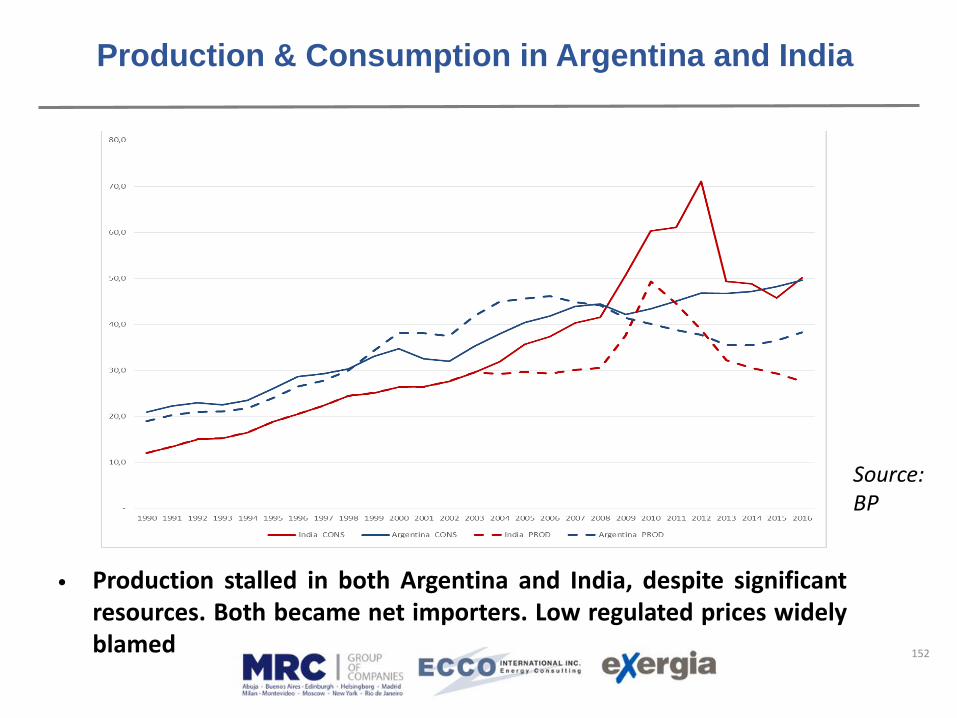
• Production stalled in both Argentina and India, despite significantresources. Both became net importers. Low regulated prices widelyblamed
Source: BP
Production & Consumption in Argentina and India

SUPPLY PRICING / REGULATION IN SELECTED COUNTRIES
153
Country Wellhead /
Wholesale
Residential &
Commercial
Industry Power
generation
US GOG HUB/RCS GOG GOG
Brazil RCS RCS RCS RSP
Argentina RBC RSP RSP RSP
Netherlands GOG GOG GOG GOG
France GOG HUB/RCS HUB/RCS GOG
Italy GOG HUB/RCS GOG GOG
Algeria RCS RSP RSP RSP
Egypt RCS RSP RSP RSP
Nigeria RCS RSP RSP RSP
Russian Federation GOG or RCS RBC RBC/GOG GOG
China RCS RPS NET NET
India RCS RCS RCS/GOG RCS/GOG
New Zealand GOG GOG GOG GOG
GOG = gas on gas competitionHUB = regulated after hub priceRCS = cost based regulationRSP = regulated after social criteriaRBC = regulated after but below costNET = netback from produced good
Source: NEWES Study for Israeli PUA, 2014
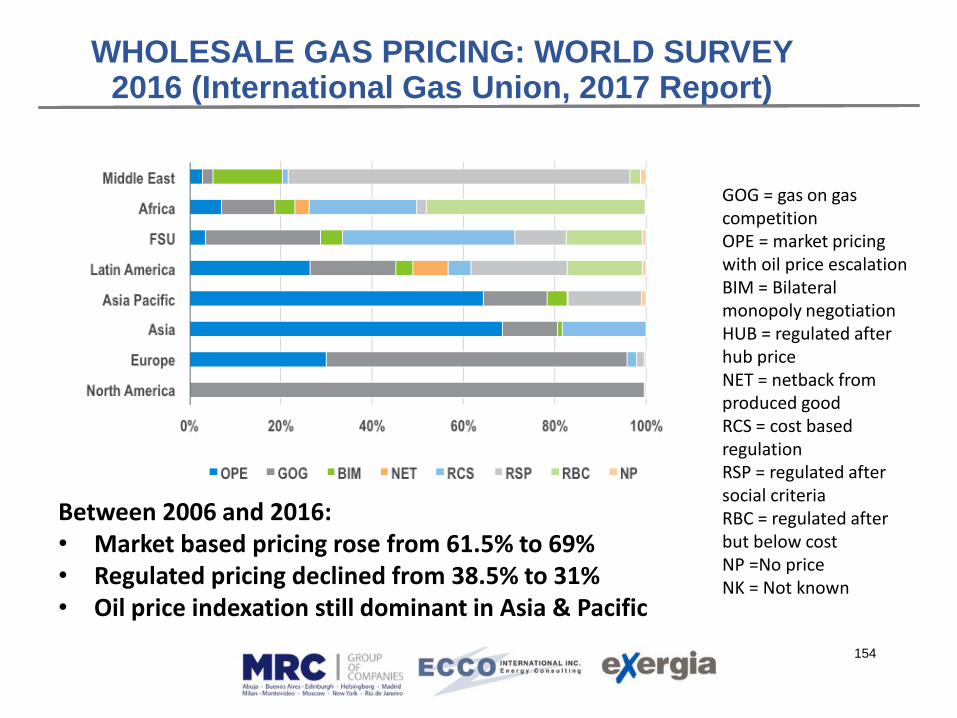
WHOLESALE GAS PRICING: WORLD SURVEY 2016 (International Gas Union, 2017 Report)
154
GOG = gas on gas competitionOPE = market pricing with oil price escalationBIM = Bilateral monopoly negotiationHUB = regulated after hub priceNET = netback from produced goodRCS = cost based regulationRSP = regulated after social criteriaRBC = regulated after but below costNP =No priceNK = Not known
Between 2006 and 2016:• Market based pricing rose from 61.5% to 69%• Regulated pricing declined from 38.5% to 31%• Oil price indexation still dominant in Asia & Pacific
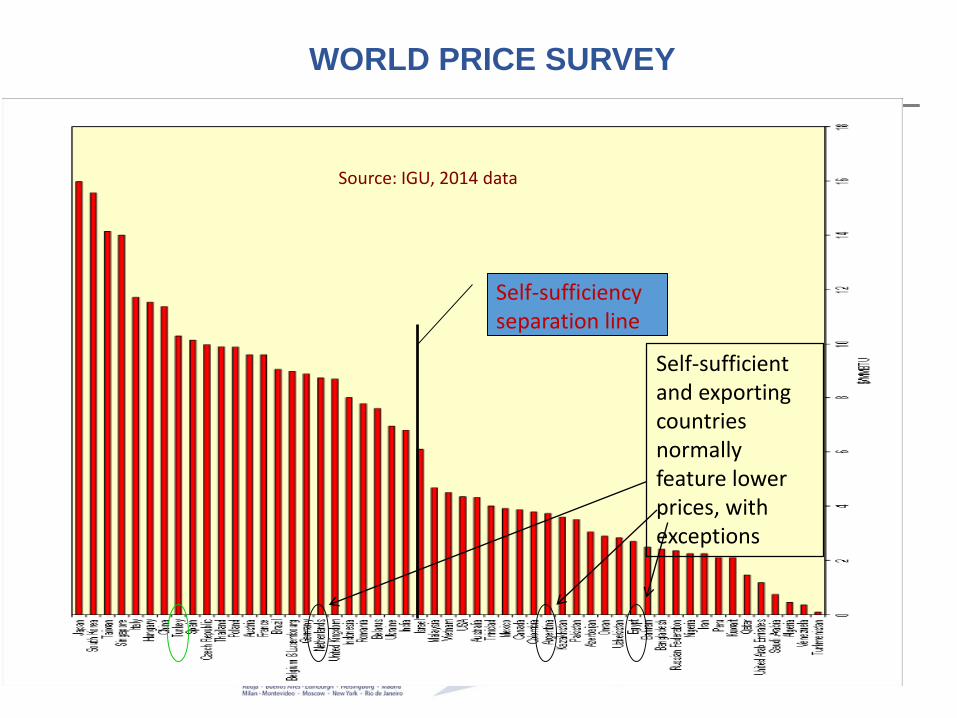
WORLD PRICE SURVEY
155
155
Self-sufficiency separation line
Self-sufficient and exporting countries normally feature lower prices, with exceptions
Source: IGU, 2014 data

WHOLESALE GAS PRICING: EUROPE(International Gas Union, 2016 Report)
156
GOG = gas on gas competitionOPE = market pricing with oil price escalationBIM = Bilateral monopoly negotiationHUB = regulated after hub priceNET = netback from produced goodRCS = cost based regulationRSP = regulated after social criteriaRBC = regulated after but below costNP =No priceNK = Not known
• Almost no wholesale price regulation in Europe• Gas on gas competition covers nearly 70%, oil
indexation @ 30% and decreasing• Short term (e.g. daily) supply contracts available
• But the past was – and retail is – quite different!

EUROPE: END USER PRICE REGULATION
157
Wholesale market price controls abolished almost everywhere
Political reluctance in several countries to phase out price controls for small customers, due to fears of technical complexities
Retail competition seen as satisfactory in Germany, Netherlands and other countries
Regulator (usually Ministry) has often rejected or cut price increases after wholesale markets (e.g. Bulgaria, France, Hungary, Poland, Spain…)
Some countries have rules for updating regulated prices, based on hubs (e.g. France, Italy)

EUROPE: OVERVIEW OF GAS PRICE REGULATION(Agency for Coordination of European Energy Regulators, 2015)
158
158
Price regulated for all end users
Bulgaria, Denmark, France, Greece, Hungary, Latvia, Poland
Price regulated for selectedend users (mostlyhouseholds, small customers)
Belgium, Croatia, Italy, Lithuania, Northern Ireland, Portugal, Romania, Slovakia, Spain
No regulation Austria, Czech Rep., Estonia, Finland, Germany, Netherlands, Norway,Slovenia, Great Britain

EUROPE: RETAIL MARKET
159
Under the current legal framework (Directive 2009/73, part of the “Third Package), price controls must be limited in scope and time, with clear provisions for phasing out
Limited consumers’ interest to switch (< 30%)
Suppliers compete on half of the gas bill paid by EU households

PRICE REGULATION: ITALIAN EXAMPLE
160
Rule for adjustment of gas cost component (1998-2013) of regulated prices based on 9-month moving average of equivalent energy prices of:
• 49% light fuel oil (Gasoil);
• 13% Brent (replaced in 2004 by a basket of eight crude oils);
• 38% low sulphur fuel oil (LSO).
No change if |Price-Index| < 2%
Since October 2013, gas cost is based on 3-month moving average of daily spot prices at TTF (Dutch hub) + transportation cost from Netherlands to Italy
Prices include other fixed and variable components, covering transmission, distribution and marketing costs

PRICE REGULATION: FRENCH EXAMPLE (1)
161
End user prices regulated by the Ministry of the Economy, in line with supply cost formula
Government has sometimes blocked price increases triggered by the formula, but the main Administrative Court (Conseil d’Etat) has confirmed the increases (with technical support from the Energy Regulator)
Price formula revised several times in line with changes in contractual conditions
Phasing out of price controls now envisaged but not implemented yet

PRICE REGULATION: FRENCH EXAMPLE (2)
162
Formula for adjustment of gas cost component (2016 update), applicable to sales by dominant operator (Engie)
Δm = ΔBRENT*0.07714+ ΔTTFQ*0.055 + ΔTTFM (*0.46196 +
ΔTTFA*0.03929 + ΔPEGNM*0.21999 + ΔUSDEUR*0.050279
Where:
BRENT: Brent crude quotation 8-month average, €/barrel; TTFQ€/MWh: Dutch TTF quarterly product , €/MWh; TTFM€/MWh: Dutch TTF monthly product, €/MWh; TTFA€/MWh: Dutch TTF monthly product, €/MWh; PEGNM€/MWh: French PEGN monthly product, €/MWh USDEUR: exchange rate €/$ 8-month average

PRICE REGULATION: GB EXAMPLE (1)
163
Transitional price control on the incumbent (British Gas), limited to small customers
Weighted Average Cost of Gas (WACOG) for incumbent used as a basis for regulation
Annual cost reduction of WACOG required by the regulation, but far exceeded by market competition
Over 2000s, competition led to six companies dominating the market
«Big 6» cartel feared
Companies retaining right to adjust prices, customers may switch but not many did

PRICE REGULATION: GB EXAMPLE (2)
164
Regulator (OFGEM) requesting suppliers to limit number and type of offers to increase transparency
Active information about cheapest supplies required
Competition & Markets Authority found that competition works but customers may ignore its benefits
Possible role for smart meters
Transitional price controls for “pre-payment” customers recently introduced by Government and supported by main opposition party, but industry is against

Question 5: After this lecture, what would you support for yourcountry/market?
165
1. No end user price regulation
2. Cost reflective end user price regulation for small customers only, linked to wholesale market price index
3. Cost reflective end user price regulation for all customers, linked to wholesale market price index
4. End user price regulation below cost, to foster higher gas consumption

GAS PRICE CONTROL: THE MARKET ALTERNATIVE
Private supply contracts normally refer price to international markets:
• Liquid gas hubs (more and more!)
• Oil crude, derivatives (traditional approach)
• Other substitute fuels, e.g. coal (if relevant in the destination market)
• related products like power’s or fertilizers’ (rarely, and only if priced inindependent markets)
S-curve approach:
• Min / Max prices (floor/ceiling)
• Price related to index
• Adjustment every 3-6 months
• Lag w.r.t. index: 1-9 months (usually 3-6)
166
Price
Index

GAS PRICE CONTROL: SOME FINAL SUGGESTIONS
167
In net importing countries, regulated prices should be
Price = infrastructure cost + wholesale market value
In isolated or exporting countries, it is tempting to ignore market value, but this risks scaring off private companies
In exporting countries, may follow a netback* approach:
Domestic price = Value in international liquid markets –transportation cost
Hot issues (for all):• Choice of reference markets – may be gas or oil
• Choice of indicators (gas or oil)
• Updating frequency (normally between 1 – 6 months)
(*) Not to be confused with “Netback from produced goods”
46

168
Part 11
A tariff regulation game

169
Reminder:
Market Pricing & Network Tariffs

GAS MARKET PRICING CRITERIA
Private supply contracts normally refer price to international markets:• Liquid gas hubs (more and more!)
• Oil crude and derivatives (traditional approach)
• Other substitute fuels, e.g. coal (if relevant in the destination market)
• Related products like power’s or fertilizers’ (rarely, and only if pricedin independent markets)
S-curve approach:• Min / Max prices (floor/ceiling)
• Price related to index
• Adjustment every 3-6 months
• Lag w.r.t. index: 1-9 months
• (usually 3-6)
170
Price
Index

171
Point to point (P2P) (distance related)• Traditional, preferred by integrated companies
A
BKm => € !
GAS TRANSMISSION TARIFF STRUCTURE: COST ALLOCATION CRITERIA (1)
Postage stamp: same tariff for the whole system
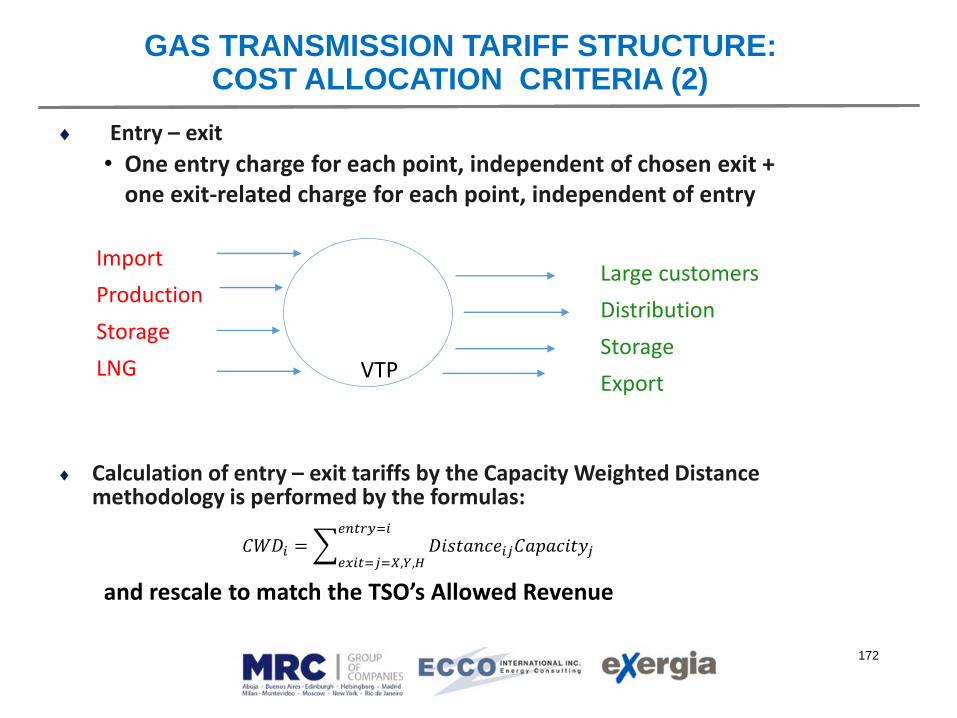
172
Entry – exit
• One entry charge for each point, independent of chosen exit + one exit-related charge for each point, independent of entry
Calculation of entry – exit tariffs by the Capacity Weighted Distance methodology is performed by the formulas:
𝐶𝑊𝐷𝑖 = 𝑒𝑥𝑖𝑡=𝑗=𝑋,𝑌,𝐻
𝑒𝑛𝑡𝑟𝑦=𝑖
𝐷𝑖𝑠𝑡𝑎𝑛𝑐𝑒𝑖𝑗𝐶𝑎𝑝𝑎𝑐𝑖𝑡𝑦𝑗
and rescale to match the TSO’s Allowed Revenue
VTP
Import
Production
Storage
LNG
Large customers
Distribution
Storage
Export
GAS TRANSMISSION TARIFF STRUCTURE: COST ALLOCATION CRITERIA (2)

173
Questions?
Now, let’s try to practice it!
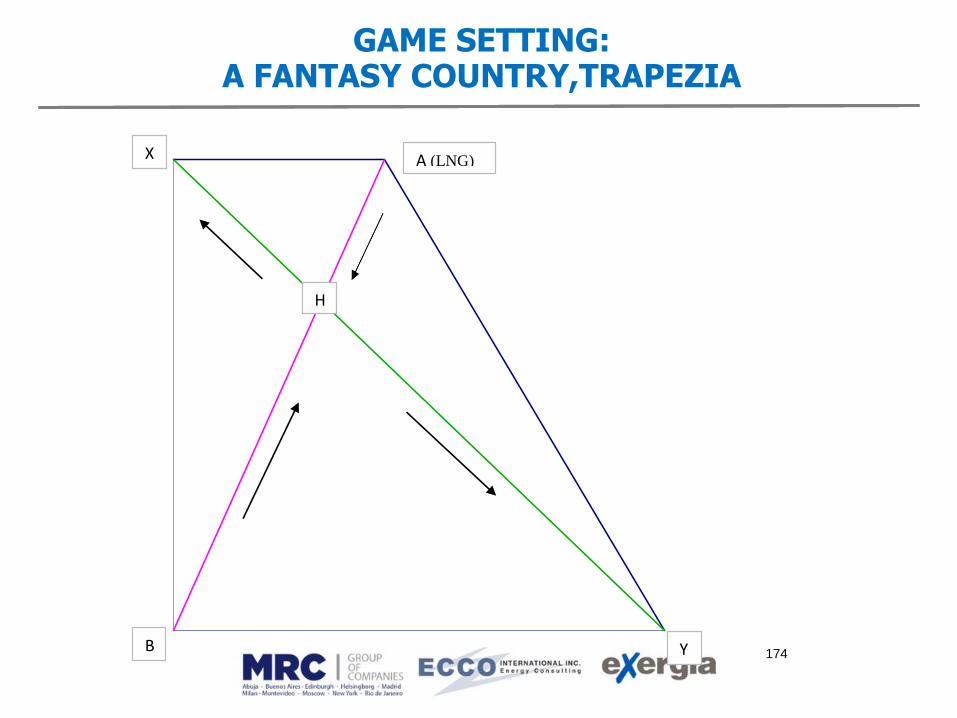
GAME SETTING: A FANTASY COUNTRY,TRAPEZIA
174
H
A (LNG) X
B Y

GAME SETTING: INFRASTRUCTURE
The transmission system consists of two pipelines, the Red and the Green (both 36” in diameter), which are interconnected at H
Total transmission pipeline length is ca. 2000 Km
There is no storage. Flexibility is provided by supply contracts or fuel switching for power generation
Limited spot supplies are available at swinging prices
175
H
A (LNG) X
B Y
In Trapezia, Gas is:
imported from A (as LNG)
Imported from B in the SW of the country
consumed in the area of the main city (H)
consumed in a peripheral, small region X
transported for export to country Y
Demand is growing at 2% / year, requiring a similar capacity reinforcements

GAME SETTING: INFRASTRUCTURE CAPACITY
The following Tables provides information about entry and exit capacities (in GWh/day) and distances (in Km):
176
Point
Technical
capacity Path Distance
A (entry) 20 AB 609.3
B (entry) 131 AH 182.8
X (exit) 10 HB 426.5
Y(exit) 40 HX 237.6
H (exit) 101 HY 554.4
The TSO’s Allowed Revenue for 2019 is € 502,200,000

GAME SETTING: TRANSMISSION COSTS
The following Tables provides information about TSO activity, costs and tariffs. The capacity-commodity split is 70-30.
177
Note: Actual data for 2017 Preliminary data for 2018; Forecasts for 2019-22
Expected inflation (CPI and OPEX) in Trapezia is 3% per year
Year Exp. Capacity Sa lesExp. Volume Investment OPEX DEPR CV RAB AR
GWh/d GWh/y M€ M€ M€ M€ M€ M€
2017 145 47632.5 60 200 110.7 5,535 1919 514.6
2018 148 48618.0 95 202.0 112.6 5,630 1903 519.7
2019 150.96 49590.4 75 204.0 114.1 5,705 1922 524.9
2020 153.9792 50582.2 50 206.1 115.1 5,755 1913 530.2
2021 157.1 51593.8 40 208.1 115.9 5,795 1893 535.5
2022 160.2 52625.7 40 210.2 116.7 5,835 1872 574.9
T ARIFFS Distance Based Post Stamp Entry-exit:
Capacity only Capacity Commodity X Y H A B
€cents/MWh/d/Km/yr €/MWh/d/year €/Mwh
2019 0.62 2.43 3.176 1.38 2.09 0.86 0.75 1.29
2020 0.63 2.41 3.144 1.37 2.07 0.85 0.75 1.28
2021 0.64 2.39 3.114 1.34 2.03 0.84 0.73 1.25
2022 0.68 2.51 3.277 1.38 2.10 0.86 0.76 1.29
€/MWh/d/year
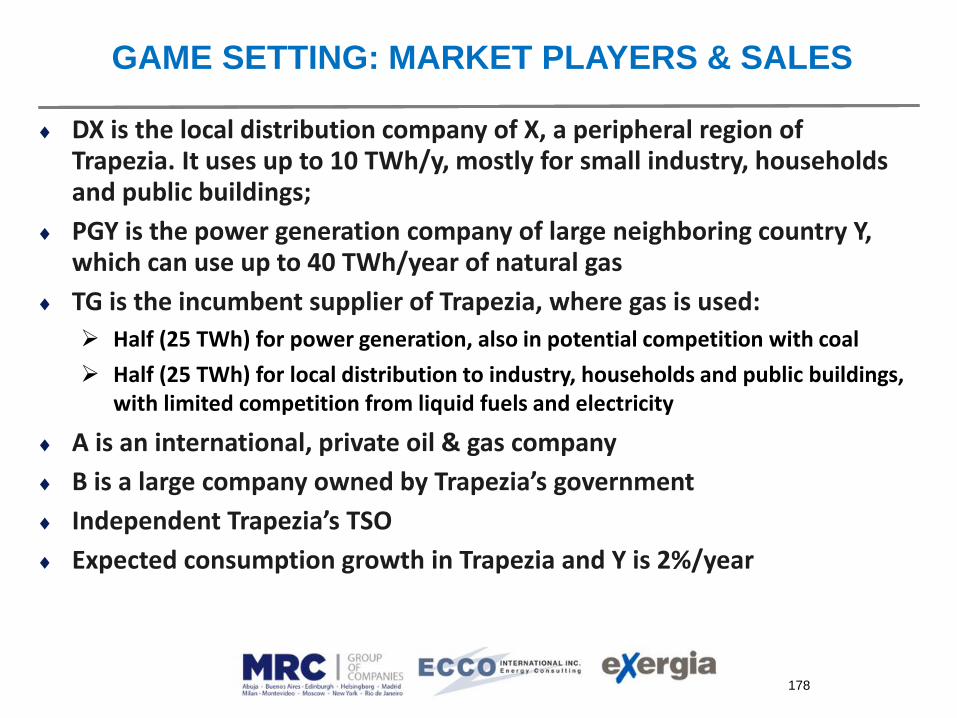
GAME SETTING: MARKET PLAYERS & SALES
DX is the local distribution company of X, a peripheral region of Trapezia. It uses up to 10 TWh/y, mostly for small industry, households and public buildings;
PGY is the power generation company of large neighboring country Y, which can use up to 40 TWh/year of natural gas
TG is the incumbent supplier of Trapezia, where gas is used:
Half (25 TWh) for power generation, also in potential competition with coal
Half (25 TWh) for local distribution to industry, households and public buildings, with limited competition from liquid fuels and electricity
A is an international, private oil & gas company
B is a large company owned by Trapezia’s government
Independent Trapezia’s TSO
Expected consumption growth in Trapezia and Y is 2%/year
178

GAME SETTING: SUPPLY & PRICES
TG, DX, and PGY buy from A & B at the border
Prices vary as they are set by reference with competing fuels and indexed to the Day-ahead price of TTF, the main European market hub
Long term contracts are subject to a 80% take or pay clause
Further supplies may be available on a spot basis, as necessary, at a price = TTF + 4
See next Table for long term contract details
179

GAME SETTING: LONG TERM CONTRACTS
180
Supplier Buyer End useMax volume
(TWh/y)
Price formula
€/MWh
A TG Mixed 10 TTF+3
B TG Mixed 400.2 (TTF+1) +
+ 0.8 (Brent/2.5) + 1
A DXIndustry /
Households10 TTF + 2
A PGY Power generation 100.2 TTF + 0.7
(Brent/2.5) + 2
B PGY Power generation 300.9 (Brent/2.5) + 1
TTF €/MWh Brent €/bbl2016 14.03 39.32014-16 18.25 55.22012-16 21.36 67.4Current 21.56 63.4
Historicalpriceguide

GAME SETTING: REGULATION
The market in Trapezia and its neighbor (Y) has been closed so far, but will be open since 1.4.2019
The Regulator has issued a consultation paper, proposing:
A. For tariff adjustment model, one of the three models:1. Annual tariff to be revised every year in line with TSO costs2. Fixed tariff, adjusted in line with costs at stakeholders’ request3. Revenue cap with 2% annual productivity improvement4. Price cap with 4% annual productivity improvement
B. For transmission tariff design, one of the three models:1. Postage stamp2. Distance based capacity tariff3. Entry-Exit tariff, calculated by the weighted average distance
approach
181

GAME PLAYERS
182
1. H: Trapezia’s incumbent gas company
2. A: international oil & gas company
3. B: state-owned company of producing country
4. DX: Local distribution company of country X
5. PGY: power generation utility of country Y
6. Trapezia’s (fully independent) TSO
7. Trapezia’s Regulator
Traders providing market liquidity Not played
Governments, International organisations, environmentalists, consumer associations
Not played

GAME DEVELOPMENT
1. Participants move to the group where they are allocated (5’)
2. Everybody studies the problem (45’). It is suggested to split company teams into sub-teams, each dealing with one main question
3. Teams may discuss, strike new deals
• Please do not disturb other players. May leave the room if you wish
4. Public regulatory session (hearing) starts
5. Given the market and regulatory perspective, each of the 5 company teams and the TSO outline (10’ each) their views:
i. Transmission tariff adjustment model
ii. Tariff design
6. The regulator meets and announces its decisions (20’)
7. Final discussion and conclusions (30’):
• Teams are invited to explain their commercial strategy, including any deals they have concluded, and may comment on the decisions

GAME RULES, HINTS & ISSUES
Market players may explain or hide their strategy, but should be ready to explain it in the final discussion
Players may discuss with each other and agree on contract reviews with volume or price changes, etc., but no cartels or collusive behavior is allowed
To understand the problem, players should in particular discuss:
• How would gas revenue and expenditure change for each company under different tariff arrangements
• It is advisable to set up different sub-teams to analyze contracts & tariffs, followed by common discussion
• Technical experts to focus on calculations, legal/policy experts to help, present proposals in the hearing
There is no need to calculate expected gas prices in details – forecast may be wrong! – better to focus on type of market and indexation
There is no “right solution”, but quantitative points are more persuasive!184

185
Thank you for your attention.
Not The End:
Now It’s Up to You!

186

Annex 1
TRANSMISSION TARIFF EXAMPLE (ITALY)
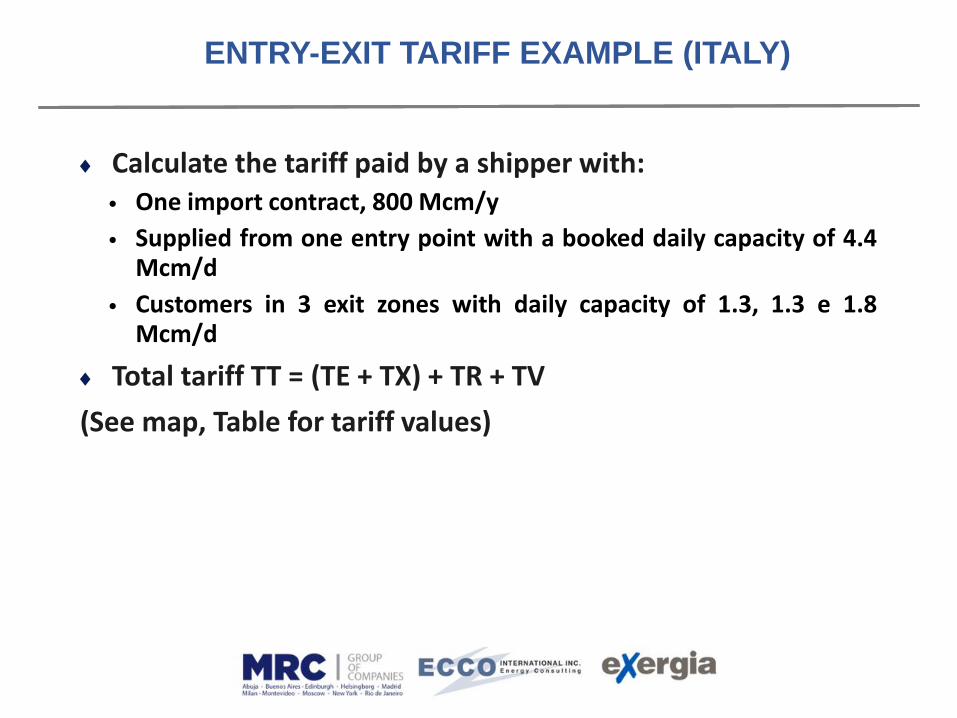
ENTRY-EXIT TARIFF EXAMPLE (ITALY)
Calculate the tariff paid by a shipper with:• One import contract, 800 Mcm/y
• Supplied from one entry point with a booked daily capacity of 4.4Mcm/d
• Customers in 3 exit zones with daily capacity of 1.3, 1.3 e 1.8Mcm/d
Total tariff TT = (TE + TX) + TR + TV
(See map, Table for tariff values)

ENTRY-EXIT TRANSPORT TARIFF: ITALIAN EXAMPLE
TTij = (TEi + TXj) + TR + TV
where:
TEi and TXj: capacity components related to capacity as booked for entry i (TEi) into and exit j (TXj) from primary grid
TR: capacity component related to daily capacity as booked for exit from secondary grid
TV: commodity component related to throughput (volume or energy)
Small fixed components may also be included
189

Exit zone E1
Exit zone Q
NTG Exit tariff
TU3 x 1.8
RTG exit tariff:
TR x 1.8
NTG Exit tariff
TX1 x 1.3
RTG exit tariff:
TR x 1.3
Entry point Passo Gries
Exit tariff from zone A
:TR2 x 1.3
RTG exit tariff: TR x 1.3
Exit zone. A
Booked capacity at entry 1 (Passo Gries)
4.4 mln Outlay: TE x 4.4
Commodity
tariff
TV x 800 Mcm
TOTAL
TARIFF = ?
Exit zone Q
Example: A
shipper enters
the system
through entry
point 1 and
delivers gas to
three customers,
located in exit
zones A, E1, and
Q
ENTRY-EXIT TRANSPORT TARIFF: ITALIAN EXAMPLE

191
ITALIAN GAS TRANSMISSION TARIFFS – 1st PERIOD (2001-5)
Entry points TE (€/m3/d)/y Exit point s TX (€/m3/d)/y
Mazara del Vallo 3,032460 Friuli - Venezia Giulia A 0,841763
Passo Gries 0,338364 Trentino-Alto Adige-Veneto B 0,986886Tarvisio 0,857216 Lombardia East C 1,076087
Panigaglia 0,613272 Lombardia West D 1,276102
North Western 0,077469 Nord Piemonte E1 1,535033
North Eastern 0,104647 Sud Piemonte & Liguria E2 1,276102
Rubicone 0,077469 Emilia & Liguria F 0,986886
Falconara - Fano 0,494016 Basso Veneto G 0,862372
Pineto 0,720943 Toscana e Lazio H 0,858547
San Salvo 0,559849 Romagna I 0,697670Candela 0,633425 Umbria & Marche L 0,569331
Monte Alpi 0,905488 Marche e Abruzzo M 0,524838
Crotone 2,026530 Lazio N 0,659117
Gagliano 2,174299 Basilicata e Puglia O 0,735951
Storage sites 0,174442 Campania P 0,521476
Calabria Q 0,446735
Sicilia R 0,157519
Commodity tariff Secondary grid tariff
TV (€/GJ) 0,176549 TR (€/m3/d)/y 1,312991

Annex 2
TARIFF REGULATION BY BENCHMARKING

BENCHMARKING: MAIN GOALS AND CHARACTERISTICS
A top class, technically advanced methodology
May be used by companies for internal purposes (efficiency improvement) as well as for regulation
Appropriate work force, company commitment needed
Results must be taken with care
193

194
YARDSTICK COMPETITION: BASIC IDEA
Schleifer (1985): To create an element of indirect competition between local or regional monopolies by comparing (“benchmarking”) their performances.
Tariffs are set to the average cost of the group
0
20
40
60
80
100
120
1 2 3 4

195
YARDSTICK COMPETITION AS INCENTIVE REGULATION
With identical operating conditions , assuming Average Cost Pricing:
Price = AVG (Other Benchmarked Firms)
Price is independent of individual cost
Higher cost firms are fostered to cut their costs, with very limited impact on price
For company’s internal use, may apply as company objectives for different distribution zones or cities
Direct use may be dangerous

196
YARDSTICK COMPETITION AS A TOOL FOR PRODUCTIVITY ENHANCEMENT
Sometimes the legal regime does not allow to set prices different from actual costs
In such case, may use benchmark to define speed of efficiency adjustment (X), allowing some time to adjust
0
20
40
60
80
100
120
1 2 3 4

197
YARDSTICK COMPETITION: SCOPE
By economic theory prices should be set equal to total cost and incentives should apply to
TOTAL COST = OPEX + CAPEX (TOTEX)
so that companies may adjust use of production inputs
However, CAPEX cannot be quickly adjusted as capital cost of distribution lives 20~60 years, only a small part can be modified in the short term
In Italy, Netherlands yardstick was applied to total cost, leading to problems – firms can argue that inefficiency as inherited in the capital stock is not their fault
Considering experienced difficulties it may be reasonable to start with OPEX only

198
COST NORMALIZATION
Yardstick Competition requires identical operating conditions for all firms
But “there are no identical twins”
Can correct for the heterogeneity. How?• Streamline accounting criteria
• Analyse cost determinants by regression analysis
• Define efficiency frontier

199
COST ACCOUNTING ISSUES
Different cost accounting criteria may hamper benchmarking (e.g. some maintenance costs may fall under OPEX in a firm and CAPEX in another one)
May use accounting data only after careful checks
In Italy, regulator issued a special questionnaire, asked a sample of firms to fill it, with homogeneous criteria
In the Netherlands, yardstick process became easier after regulatory accounting rules were issued
In the UK, limited benchmarking of electricity distributors requested substantial accounting re-allocation work
BENCHMARKING BY REGRESSION ANALYSIS
1. Calculate cost (allowed revenue) for each company
2. Identify main cost factors (drivers)
3. Define cost function by regression analysis
4. Define target cost for average companies by cost function (e.g. average cost of the sample)
5. Define time to achieve average level and calculate productivity improvement rate (X) accordingly
201
COST REGRESSION ANALYSIS
Good specialists needed
Should preferably use panel data (pooled time series of firms)
Must identify main likely cost factors (drivers)
Cost function may be Cobb-Douglas C=aXbYcZd
Determinants should include input prices by economic theory but hard to see their effect if no time series available
Generalised least squares or maximum likelihood estimation methods needed
Use estimated cost function to normalise costs among firms & set their average or efficient target
202
DATA ENVELOPMENT ANALYSIS (DEA)
Technically hard, good specialists needed
Advantage: non parametric technique (does not assume normal distribution of errors and shape of cost function)
Must identify main likely cost factors (drivers),
• may use regression analysis to identify significant cost drivers
Find efficiency frontier
Measure distance of companies from the frontier
Define time allowed to firms to approach the frontier and calculate X accordingly
Drawback: lack of economic theory and too many control variables may lead to all firms being “efficient”

DATA ENVELOPMENT ANALYSIS
NU
KM
A
B
C
D
E
FG
O
B’
ACE: efficiency frontier; BB’: efficiency gap for B
Output / unitcost:NU: # of usersKM: net length
204
ALTERNATIVE APPROACH: NETWORK REFERENCE MODEL
Strong and experienced engineering expertise needed
Based on a technical description of utility operations
Define how an optimal network should be built and operated for a given territory
Define how its inputs should be priced, by means of standard costs, benchmarks of limited cost components
Optimization techniques may be used, e.g. optimal investment level towards quality
Valid check for other benchmarking results
204