©2013 cliftonlarsonallen llp cliftonlarsonallen.com innovation and risk: bringing the future of...
TRANSCRIPT

©20
13 C
lifton
Lars
onAl
len
LLP
cliftonlarsonallen.com
Innovation and Risk:Bringing the Future of Payment
Reform into Focus
HFMA Idaho Chapter2014 Winter Conference
January 15-17, 2014

©20
13 C
lifton
Lars
onAl
len
LLP
2
Discussion Overview
• Payment Reform: A Market in Transition
• Innovation Payment Models
• Regulatory Environment & Transitioning Traditional Fee for Service to VBP

©20
13 C
lifton
Lars
onAl
len
LLP
©20
13 C
lifton
Lars
onAl
len
LLP
cliftonlarsonallen.com
Payment Reform: A Market in Transition
3
©20
13 C
lifton
Lars
onAl
len
LLP
4
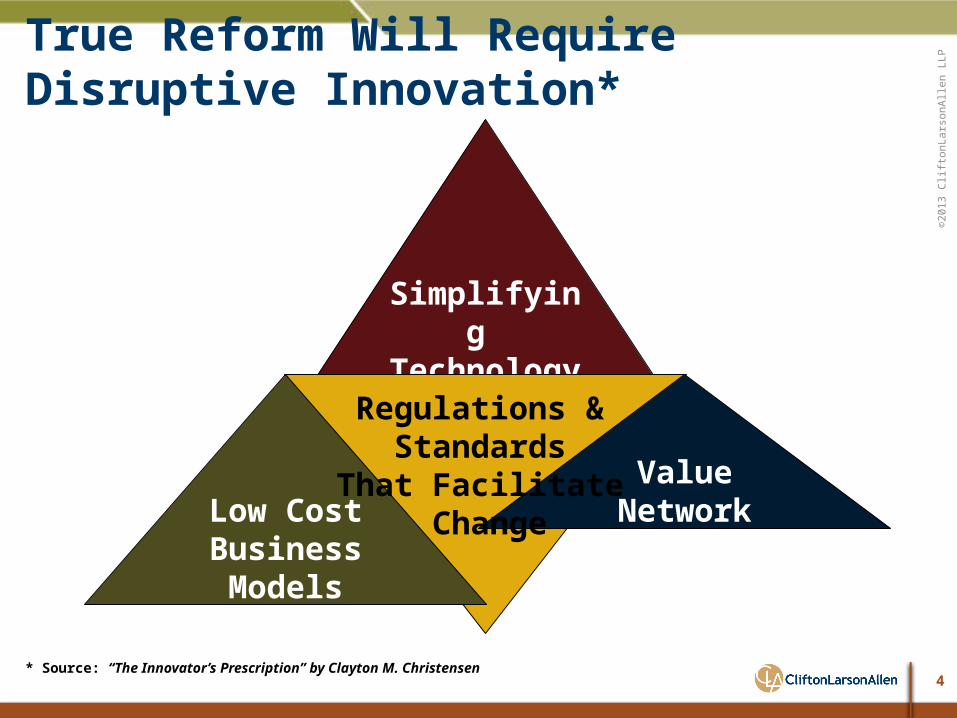
True Reform Will Require Disruptive Innovation*
Simplifying Technology
Low Cost Business Models
Value Network
* Source: “The Innovator’s Prescription” by Clayton M. Christensen
Regulations & Standards
That Facilitate Change

©20
13 C
lifton
Lars
onAl
len
LLP
5
Supreme Court Examines Constitutionality
Individual
Mandate -
ConstitutionalEntire
Affordable Care
Act- StandsMedicai
d Expansio
n-State Option
U.S. Supreme Court Ruling: June 28, 2012

©20
13 C
lifton
Lars
onAl
len
LLP
6
The Foundation: Value-Based Payment Value Based Payment: “a reform initiative whereby health care providers will receive payment for service based on their performance or the potential outcomes of the service”
Tying payment to performance is perhaps the most significant aspect of health care reform.The de facto definition of “value” in health care reform is the intersection of lower cost and improved quality.
Providers who can lower costs and deliver quality will be measured as “value-based providers”
Value
Lower Cost
Improved Quality

©20
13 C
lifton
Lars
onAl
len
LLP
7
Where Payment Reform is Happening*
* Source: Americas Health Insurance Plans (AHIP) accessed via web on 9/3/13 at: http://www.ahip.org/searchResults.aspx?searchtext=payment reform activity
©20
13 C
lifton
Lars
onAl
len
LLP
8
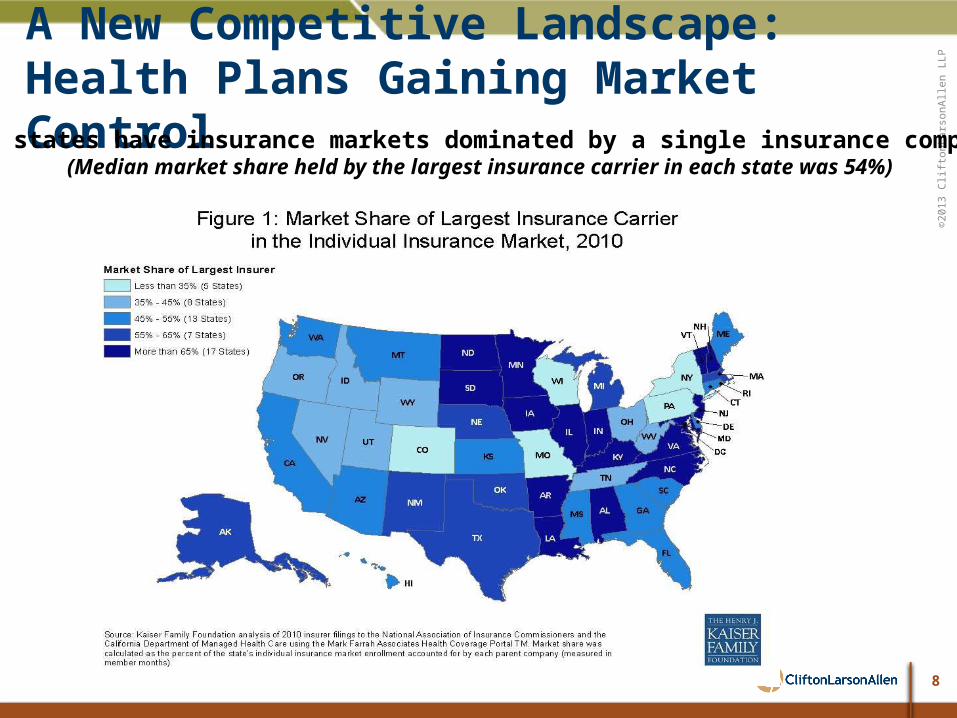
A New Competitive Landscape: Health Plans Gaining Market Control
30+ states have insurance markets dominated by a single insurance company(Median market share held by the largest insurance carrier in each state was 54%)

©20
13 C
lifton
Lars
onAl
len
LLP
9
A New Competitive Landscape:Increasing Control = Greater Contract Leverage• Increase in Average Annual Deductibles 2008 to 2011:
– In-Network Increase:◊ Individual Coverage: 17.2% to $587◊ Family Coverage: 12.4% to $1,317
– Out-of-Network Increase:◊ Individual Coverage: 27.5% to $1,084◊ Family Coverage: 30.9% to $2,591
• Increase in Average Annual Co-Insurance:– In-Network Remained Constant:
◊ Physicians $20◊ Hospitals 20%
– Out-of-Network Increased:◊ Physicians: From median of 30% to 40%◊ Hospitals: From 35% to 40%
• Paying at “Medicare like rates” vs. “usual and customary rates”
*Source: “Out-of-Network Care Adds to Health Expenses” by Michelle Andrews and Kaiser Health News dated April 16, 2012 summarizing data from HR consultant Mercer’s Annual Survey of Employer Sponsored Health Plans

©20
13 C
lifton
Lars
onAl
len
LLP
10
2014 Market Transitions to Monitor• Transitioning commercial contracting
– More “stiff arming” especially for smaller providers
• On-going provider operational challenges– Revenue cycle issues– Profitability continues to be squeezed– Charge capture issues
• Exchange related impacts– Glitch continuation?– Reimbursement implications– “Surprise” narrow networks ?– Increased demand for medical services– Reprieves from mandates – how long will they last?– Consumer impact – choice & out-of-pocket costs
• Escalation in ruthless competition– Formation of narrow networks impacting market share

©20
13 C
lifton
Lars
onAl
len
LLPTrading Price for Volume on the Public Exchanges
11
Expect Lower Provider Payment Rates, Less Patient Choice
Source: Mathews AW and Kamp J, “Another Big Step in Reshaping HealthCare,” Wall Street Journal, February 28, 2013, available at: www.online.wsj.com; Hancock J, “Aetna Cuts Predictions for Obamacare Enrollment,” Kaiser Health News, April 30, 2013, available at: www.capsules.kaiserhealthnews.org; Health Care Advisory Board interviews and analysis.
1) Pseudonym.
Anticipated Provider Reimbursement Rates for Exchange Plans
Catholic Health Initiatives Modest discounts from commercial rates
Tenet Healthcare Up to 10% below commercial rates Meriwether Hospital1
5% below commercial rates
WellPoint Inc.Between Medicare and Medicaid rates
Meyers Health1
10% above Medicare rates Case in Brief: Aetna Inc.
• Health insurer planning to sell narrow network exchange products in 14 states
• Searching for providers agreeing to lower rates in narrow network products
• Plans for rates to fall closer to Medicare than commercial reimbursement
Aetna’s Planned Reduction in Exchange Network Size
25%-50% reduction in exchange network size, compared to networks for typical commercial products
Millern Medical Center1
20% below commercial rates

©20
13 C
lifton
Lars
onAl
len
LLPWalmart Eying the Health Care Industry
12
Moving Beyond Basic Retail Clinics
Source: The Advisory Board Holmes TJ, “The Diffusion of Wal-Mart and Economics of Density,” May, 2006; Zimmerman A and Hudson K, “Managing Wal-Mart: How U.S.-Store Chief Hopes to Fix Wal-Mart,” The Wall Street Journal, April 17, 2006, available at: www.wsj.com; Aboraya A, “Wal-Mart Plans to Offer Primary Care in 5-7 Years,” Orlando Business Journal, January 11, 2013, available at: www.bizjournals.com/orlando; Aboraya A, “Exclusive: Wal-Mart Exploring Private Health Insurance Exchange for Small Biz,” Orlando Business Journal, January 11, 2013, available at: www.bizjournals.com/orlando; Health Care Advisory Board interviews and analysis.
Vice PresidentHealth and Wellness Payer
Relations
”
“That’s where we’re going now: full primary care services in five to seven years.”
Potential Evolution of Health Care Products
33%Estimated portion of the US
population that visits Walmart every week
4,600+Number of Walmart stores in
the United States
Median distance between a residence
and Walmart
4.2 miles
Basic Retail Clinic
Full Primary Care
Health Insurance Exchange
Scope of Services

©20
13 C
lifton
Lars
onAl
len
LLPBeyond Walmart
13
Walgreens Aims to Become the Premier Health Destination
Source: The Advisory Board Japsen B, “How Flu Shorts Became Big Sales Booster for Walgreen, CVS,” Forbes, February 8, 2013, available at: www.forbes.com; “Take Care Clinics at Select Walgreens Expand Service Offerings,” Reuters, May 31, 2012, available at: www.reuters.com; Murphy T, “Drugstore Clinics Expand Care into Chronic Illness,” The Salt Lake Tribune, April 4, 2013, available at: www.sltrib.com, Walgreens, “Company Overview,” available at: www.walgreens.com; Health Care Advisory Board interviews and analysis.
2009: Launches flu vaccine campaign
Simple Acute Services Vaccinations and Physicals
Chronic Disease Monitoring
Chronic Disease Diagnosis and Management
2013: Launches three ACOs; begins diagnosing and managing chronic disease
Case in Brief: Walgreen Co.
• Largest drug retail chain in the United States, with 372 Take Care Clinics
• In April 2013, became first retail clinic to offer diagnosis and treatment of chronic diseases
2007: Acquires Take Care Health Systems
2012: Offers three new chronic disease tests
Not Just a Drugstore
“Our vision is to become ‘My Walgreens’ for everyone in America by transforming the traditional drugstore into a health and daily living destination...”
Walgreen Co. Overview
”
©20
13 C
lifton
Lars
onAl
len
LLP
©20
13 C
lifton
Lars
onAl
len
LLP
cliftonlarsonallen.com
Innovation Payment Models
14

©20
13 C
lifton
Lars
onAl
len
LLP
15
Payment Reform Models Focus:Behavior-Intensive Diseases w/Deferred Consequences
Myopia
Hypothyroidism
Psoriasis
Allergies
Multiple Sclerosis
EpilepsyHIV
Depression
Infertility
Chronic Back Pain
GERD Crohn’s Disease
Celiac Disease
Ulcerative Colitis
Sickle Cell Anemia
Type I Diabetes
AsthmaCongestive HeartFailure
Type II DiabetesSchizophrenia
Alzheimer’s
Obesity
Addictions
Bipolar Disorder
Cerebrovascular Disease
Coronary Artery Disease
Parkinson
Cystic Fibrosis
Chronic Hepatitis B
Osteoporosis
HypertensionHyperlipidemia
Moti
vatio
n to
Com
ply
With
Be
st K
now
n Th
erap
y
Strong:ImmediateConsequences
Weak:DeferredConsequences
Degree to Which Behavior Change is Required
Diseases with deferred consequences
Beha
vior
dep
ende
nt d
isea
ses
Diseases with Immediate ConsequencesTe
chno
logy
Dep
ende
nt D
isea
ses
Source: “The Innovator’s Prescription” by Clayton M. Christensen
ExtensiveMinimal
Crushing costs of caring for chronically ill are in this quadrant: diabetes,
asthma, tobacco, obesity, CHF, affect tens of millions of people each.

©20
13 C
lifton
Lars
onAl
len
LLP
16
Chronic Conditions Drive Medicare Spending*
Beneficiaries Spending0%
10%
20%
30%
40%
50%
60%
70%
80%
90%
100%
14%
46%23%
28%
32%
19%32%
7%
6 or more conditions
6 or more conditions4 to 5 conditions
4 to 5 conditions
2 or 3 conditions
2 or 3 conditionsZero or 1 condition
Zero or 1 condition
* Source: MedPAC March 2013 Report to Congress Figure 1-5

©20
13 C
lifton
Lars
onAl
len
LLP
17
CMS Defined Innovation Models *• Accountable Care
– Medicare Shared Savings Program
– Medicare Advanced Payment ACO
– Pioneer ACO– Comprehensive ESRD Care
Initiative (LI/App.)
• Bundled Payment for Care Improvement– Models 1 through 4
* Arising as a result of Affordable Care Act (ACA), and excluding programs in effect prior to ACA.
• Primary Care Transformation– Comprehensive Primary Care
Initiative– FQHC Advance Primary Care
Practice Demonstration– Graduate Nurse Education
Demonstration– Independence at Home
Demonstration– Multi-Payer Advanced Primary
Care Practice

©20
13 C
lifton
Lars
onAl
len
LLP
18
CMS Defined Innovation Models *• Medicaid & CHIP Initiatives
– Emergency Psychiatric Demonstration
– Incentives for Prevention of Chronic Diseases Model
– Strong Start for Mothers & Newborns Initiative
◊ Reduce Early Elective Deliveries◊ Enhanced Prenatal Care Models
• Medicare-Medicaid Enrollees Initiatives– Financial Alignment Incentives– Reduce Avoidable
Hospitalizations Among Nursing Facility Residents
* Arising as a result of Affordable Care Act (ACA), and excluding programs in effect prior to ACA.
• Initiatives to Accelerate Testing & Development of New Models – Health Innovation Awards– State Innovation Models
• Initiatives to Speed Adoption of New Models– Community Based Care
Transitions Programs– Innovation Advisors Program– Million Hearts– Partnerships for Patients

©20
13 C
lifton
Lars
onAl
len
LLP
19
Medicare Accountable Care OrganizationsProviders eligible to form an ACO:
– ACO professionals in group practice
– Networks of individual practices of ACO professionals;
– Partnerships and joint ventures between hospitals and ACO Professionals;
– Hospitals employing ACO professionals
– Critical Access Hospitals under Method II
– Federally Qualified Health Centers
– Rural Health Centers
•Cannot include providers participating in other shared savings programs or demos or the Independence at Home pilot.
ACO professionals :• Physicians• Nurse Practitioners• Physician Assistants• Clinical Nurse Specialists
Other eligible ACO participants• Skilled Nursing Facilities• Home Health Care• Hospice• Comprehensive outpatient
rehabilitation facility

©20
13 C
lifton
Lars
onAl
len
LLP
20
ACOs Continue to Grow• On December 23rd CMS announced that 123 new organizations
will join the Medicare ACO program effective January 1, 2014
• ACO enrollment has evolved and continued to grow since it was launched in April 2012:– April 2012 initial: 27 organizations– July 2012: 89 additional organizations– January 2013: 106 additional organizations– December 2011: 32 Pioneer ACOs, w/~ 23 remaining
• Total ACO participation – Over 360 organizations– More than 5.3 million beneficiaries– More than 50% of ACOs led by physician groups, with < 10,000
beneficiaries

©20
13 C
lifton
Lars
onAl
len
LLP
21
ACO Results to Date *• Pioneer ACO First Year Results:
– Cost Reduction/Shared Savings:◊ Cost growth rate for 669,000 beneficiaries .3% vs. .8%◊ 13 participants generated gross savings of $87.6 million◊ 2 participants generated losses of approximately $4 million
– Quality Metrics◊ 100% successfully reported quality measures◊ Overall performed better for all 15 clinical quality measures
• 25 of 32 generated lower risk-adjusted readmissions rates• Median rate for blood pressure control for beneficiaries with diabetes was
69% vs. 55% • Median rate for LDL cholesterol control for patients with diabetes was
57% vs. 48%
• CMS expects MSSP results later in year
* Source: CMS “Pioneer Accountable Care Organizations succeed in improving care, lowering costs” July 16, 2013

©20
13 C
lifton
Lars
onAl
len
LLP
22
9 Pioneer ACOs departing the Program• Prime Care Medical Network Inc.: San Bernadino and
Riverside counties, CA
• University of Michigan Faculty Group Practice: southeastern Michigan
• Physician Health Partners LLC: Denver, CO
• Seton Health Alliance: Austin,TX and surrounding counties
• Plus : North Texas Specialty Physicians and Texas Health Resources
• Healthcare Partners Nevada ACO LLC: Clark and Nye counties
• Healthcare Partners California ACO LLC: Los Angeles and Orange counties
• JSA Care Partners LLC: Orlando, Tampa Bay and surrounding south Florida
• Presbyterian Healthcare Services: central New Mexico (opted out of all Medicare ACO models)
•Seven who achieved no savings are transitioning instead to the Medicare Shared Savings program
• Two are opting to discontinue the Medicare ACO model altogether.
©20
13 C
lifton
Lars
onAl
len
LLP
23
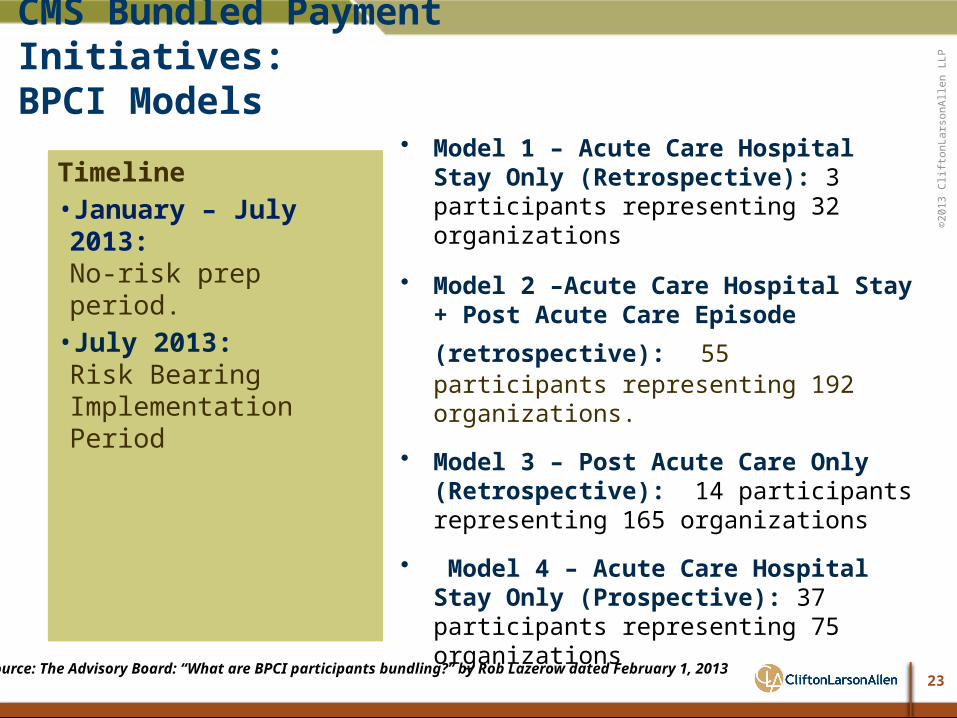
CMS Bundled Payment Initiatives: BPCI Models
• Model 1 – Acute Care Hospital Stay Only (Retrospective): 3 participants representing 32 organizations
• Model 2 –Acute Care Hospital Stay + Post
Acute Care Episode (retrospective): 55 participants representing 192 organizations.
• Model 3 – Post Acute Care Only (Retrospective): 14 participants representing 165 organizations
• Model 4 – Acute Care Hospital Stay Only (Prospective): 37 participants representing 75 organizations
Timeline• January – July 2013: No-risk prep period.
• July 2013: Risk Bearing Implementation Period
Source: The Advisory Board: “What are BPCI participants bundling?” by Rob Lazerow dated February 1, 2013

©20
13 C
lifton
Lars
onAl
len
LLP
24
Medicare’s Largest Payment Innovation Program
More than 450 Providers Participating in BPCI1
BPCI1 Participation by State

©20
13 C
lifton
Lars
onAl
len
LLP
25
BCPI Participants Favoring Longer Episodes
Participation by Model Type
Hospital Inpatient Services
Hospital and Physician
Inpatient and Post-Discharge
Services
Post-Discharge Services
Hospital and Physician Inpatient Services
Model 4Model 3Model 2Model 1
16%
36%
41%
7%
Source: Centers for Medicare and Medicaid Services; Health Care Advisory Board interviews and analysis.

©20
13 C
lifton
Lars
onAl
len
LLP
26
CMS Bundled Payments Initiatives: What is Being Bundled?
Source: The Advisory Board: “What are BPCI participants bundling?” by Rob Lazerow dated February 1, 2013

©20
13 C
lifton
Lars
onAl
len
LLP
27
Bundled Payments:Understanding Bundle Characteristics
Bundle Risk: Approximately 51% of total bundle costs occurred post-discharge!
Total Indexed Admissions 1,000
Total Admissions 1,327
Indexed Total Indexed Total Service Avg Cost Cost Avg Cost Cost
Hospital 12,040$ 12,040,359$ 8,662$ 8,661,981$
SNF 3,134 3,133,676 - -
HHA 2,169 2,168,509 - -
MD 3,535 3,535,248 1,975 1,975,175
All Other 654 653,696 - -
Total Costs 21,531$ 21,531,488$ 10,637$ 10,637,156$
Including Readmissions Indexed Admissions
CONFIDENTIAL: Subject to CMS Data Use Agreement #22626

©20
13 C
lifton
Lars
onAl
len
LLP
28
Bundled Payments:The Post Acute Care Path and Impact on Bundle
Avg Cost 30.0%
STAH $3,327SNF $12,608
20.0% HHA $1,675200 MD $1,928
All Other $843TOTAL $20,381
70.0%
Average SNF/HHA Cost per Episode $15,138
Avg Cost 21.0%
STAH $1,895SNF $839
18.0% HHA $4,150180 MD $1,531
All Other $897TOTAL $9,313
79.0%
Avg Cost 34.5%
STAH $3,826SNF $743
62.0% HHA $1,752620 MD $1,450
All Other $522TOTAL $8,293
65.5%
Community
Home Care
SNF
Readmit
NO Readmit
Readmit
NO Readmit
Readmit
NO Readmit
NO Readmit
NO ReadmitNO Readmit
Post AcuteCarePath
Acute Stay
Discharge
CONFIDENTIAL: Subject to CMS Data Use Agreement #22626

©20
13 C
lifton
Lars
onAl
len
LLP
29
• Payer: Walmart– Six Participating Providers:
◊ Virginia Mason Medical Center, Seattle, WA
◊ Mayo Clinic, Scottsdale, AZ , Rochester, MN & Jacksonville, FL
◊ Scott & White Memorial Hospital, Temple, TX
◊ Mercy Hospital, Springfield, MO◊ Cleveland Clinic, Cleveland, OH◊ Geisinger, Danville, PA
– Description: Beginning January 2013 1.1 million employees eligible for consultation and care for certain cardiac & Spine procedures at no additional cost. Walmart will cover cost of travel, lodging, and food for patient and one caregiver.
• Payer: PepsiCo– Participating Providers: John Hopkins,
Baltimore, MD– Description: Starting 12/11 began
waiving deductibles & co-insurance for employees who receive cardiac and complex joint replacement surgery at John Hopkins.
• Payer: Lowes– Participating Providers: Cleveland
Clinic, Cleveland, OH– Description: Contract for heart
surgery program; will waive $500 deductible, out-of-pocket costs, airfare, hotel and living expenses.
Commercial Insurance BPI Activity: Large EmployersCardiovascular & Spine Services Bundles
Source: The Advisory Board “Commercial Bundled Payment Tracker” accessed via web on 4/12/13 at:http://www.advisory.com/Research/Health-Care-Advisory-Board/Resources/2013/Commercial-Bundled-Payment-Tracker#lightbox/0/

©20
13 C
lifton
Lars
onAl
len
LLP
30
CMS Primary Care Transformation
• Comprehensive Primary Care Initiative– Multi-payer initiative fostering collaboration between public and private
health care payers.– 497 primary care practices covering 7 states
◊ Includes 2,347 providers serving an estimated 315,000 Medicare Beneficiaries
• Independence at Home Demonstration– Tests the effectiveness of delivering comprehensive primary care services to
Medicare beneficiaries with multiple chronic conditions at home. – Providers who succeed in reducing costs and meeting designated quality
measures will receive an incentive payment.– Participants announced in April 2012 and include 15 different practices in 12
different states

©20
13 C
lifton
Lars
onAl
len
LLP
31
CMS Primary Care Transformation• Multi-Payer Advanced Primary Care Practice
– CMS participating in 8 states with multi-payer reform initiatives already being conducted in states.
– Demonstration focuses in on if advanced primary care practice will reduce unjustified utilization and expenditures, improve safety, effectiveness and timeliness and efficiency of health care services.
– Monthly care management fee is paid to cover care coordination, improved access, patient education, and other services to support chronically ill patients.
• FQHC Advanced Primary Care Practice– A three-year demonstration program designed to evaluate the effect of advanced
primary care practice model (commonly referred to PCMH) in improving care, promoting health, and reducing cost of care to Medicare beneficiaries served by FQHCs.
– 493 participating FQHCs will be paid a monthly care management fee of $6.00 (paid quarterly) per eligible beneficiary attributed to their practice.
– Fee is in addition to the usual all-inclusive payment rate currently received.

©20
13 C
lifton
Lars
onAl
len
LLP
32
Patient Centered Medical Home – Demonstration Project Overview *• Project Objectives:
– Identify and eliminate “gaps” in care– Reduction of health risk factors and enhancement of quality of life
• Focused Clinical Conditions:– Asthma – Coronary Artery Disease– Hyperlipidemia– Hypertension– Adult/Adolescent/Childhood Immunizations– COPD– Diabetes– Anxiety/Depression– Breast/Cervical/Colorectal Cancer Screenings– Vital & Others
* Source: BCBSMT Presentation at MT HFMA on PCMH Demonstration Project Results Fall, 2011

©20
13 C
lifton
Lars
onAl
len
LLP
33
Patient Centered Medical Home: Demonstration Project Incentive Plan*• Structure Incentives Based on Outcomes
– Participation Amount– Quality Outcome Amount– Patient Satisfaction– TCOC Amount– Incentive s for Both Improving & Achieving Targets
• Additional Payment Incentives– $200 PMPY for Care Management of Chronic Conditions– $100 PMPY for Care Management of Preventive Conditions
• Potential Savings– Reduced ER visits– Preventable Admissions & Re-Admissions– Improved Health Status– Increased Productivity, Employee Morale & Reduced Absenteeism
* Source: BCBSMT Presentation at MT HFMA on PCMH Demonstration Project Results Fall, 2011

©20
13 C
lifton
Lars
onAl
len
LLP
34
Patient Centered Medical Home: Demonstration Project Outcomes*

©20
13 C
lifton
Lars
onAl
len
LLP
35
CMS Centers for Medicare & Medicaid Innovation (CMMI):
State Innovation Models Initiative• Provides up to $300 million to support the development and testing of state-
based delivery system transformation models for multi-payer payment and health care delivery system.
• Three types of awards:– Model Testing Awards:
◊ Six states received over $250 million to implement their State Health Care Innovation Plans.
– Model Pre-Testing Awards:◊ Three states received just over $4 million to continue developing State Health Care
Innovation Plans which will be submitted to CMS within six months from date of award.– Model Design Awards:
◊ 16 states received almost $32 million to be used to develop a State Health Care Innovation Plan, including application for an anticipated second round of Model Testing awards.
◊ States that received the Model Design Award have six months to submit their plan to CMS.

©20
13 C
lifton
Lars
onAl
len
LLP
36
State Innovation Model Initiatives

©20
13 C
lifton
Lars
onAl
len
LLP
37
CMS Centers for Medicare & Medicaid Innovation (CMMI):
State Innovation Models Initiative• Model Design Award Recipient: Idaho $3 million
– Project will result in a plan that will serve as the blueprint for integrating Idaho’s patient-centered medical homes and move the state towards an accountable care, integrated & sustainable delivery and payment system
– Multi-payer and multi-organizational◊ Medicaid, Blue Cross, Regence BlueShield, Idaho Primary Care Association, Idaho
Hospital Association, Idaho Legislature & Governor’s office; etc.
– Project will address needed resources to enhance communication and coordination of care across the health continuum
– Identify opportunities to improve patient care management through patient-centered medical homes
– Create mechanisms to link the local health care system through partnerships with hospitals, primary care providers and county health & social service agencies

©20
13 C
lifton
Lars
onAl
len
LLP
38
CMS Centers for Medicare & Medicaid Innovation (CMMI):
State Innovation Models Initiative• Model Testing Award Recipient: Oregon $45 million
– The Oregon Coordinated Care Model (CCM) is aimed at realigning health care payment and incentives so state employees, Medicare beneficiaries, and those purchasing coverage through Oregon Health Insurance Exchange have high quality, low cost sustainable coverage options.
– CCM will focus on integrating and coordinating physical, behavioral, and oral health care and align incentives across medical and long-term care.
– Testing will be driven through Oregon’s Coordinated Care Organizations (CCOs) which are risk-bearing, community based entities governed by a partnership among providers, community members and entities taking financial risk for the cost of health care.
– CCOs have flexibility to institute their own payment and delivery reforms aimed at achieving best possible outcomes and are accountable for the health care care of populations they serve.
– CCOs will transform payment to a fully-capitated payment model increasingly based on outcomes.

©20
13 C
lifton
Lars
onAl
len
LLP
3939
CMS Centers for Medicare & Medicaid Innovation (CMMI):
Idaho Innovation Activity• Health Care Innovation Awards:
– Intermountain Health Care◊ Geographic Reach: Idaho, Utah◊ Funding Amount: $9.7 Million◊ Est. 3 Year Savings: $67 Million◊ Project Summary: Test new care delivery & payment model using an IT-based simulation
of human physiology, clinical events, and health care systems to forecast which interventions will be most effective in reducing a persons risk, provide risk stratification metrics for individual patients, and project benefits for specific interventions.
– St. Luke’s Regional Medical Center, LTD◊ Geographic Reach: Idaho, Nevada, Oregon◊ Funding Amount: $11.8 Million◊ Est. 3 Year Savings: $12.6 Million◊ Project Summary: Establish remote ICU monitoring & care management in certain
portions of rural Idaho and eastern Oregon, with overall goal of early identification of patients with specialized needs, improved care coordination, standardized practices, increase access & reduce ICU days.

©20
13 C
lifton
Lars
onAl
len
LLP
4040
CMS Centers for Medicare & Medicaid Innovation (CMMI):
Idaho Innovation Activity• Health Care Innovation Awards (cont’d):
– Trustees of Dartmouth College◊ Geographic Reach: CA, CO, ID, IA, ME, MA, MI, MN, NW, NJ, NY, OR, TX, UT, VT, WA◊ Funding Amount: $26.2 Million◊ Est. 3 Year Savings: $64 Million◊ Project Summary: Collaboration with 15 large health systems across country to hire
Patient and Friendly Activators (PFAs) who are trained to work with patients with multiple chronic conditions to assist them with effective decision making in their care choices.
– University of North Texas Health Science Center◊ Geographic Reach: 35 states, including ID, CO, MV, OR, & WA in the west and PNW◊ Funding Amount: $7.3 Million◊ Est. 3 Year Savings: $9.7 Million◊ Project Summary: Through partnership with Brookdale Senior Living (BSL) will expand and
test BSL’s Transitions of Care Program which is based on an evidenced-based assessment tool called “Reduce Acute Care Transfers” for residents living in independent living, assisted living, and dementia specific facilities initially in Texas & Florida, but expanding to other states during the grant period.
©20
13 C
lifton
Lars
onAl
len
LLP
41
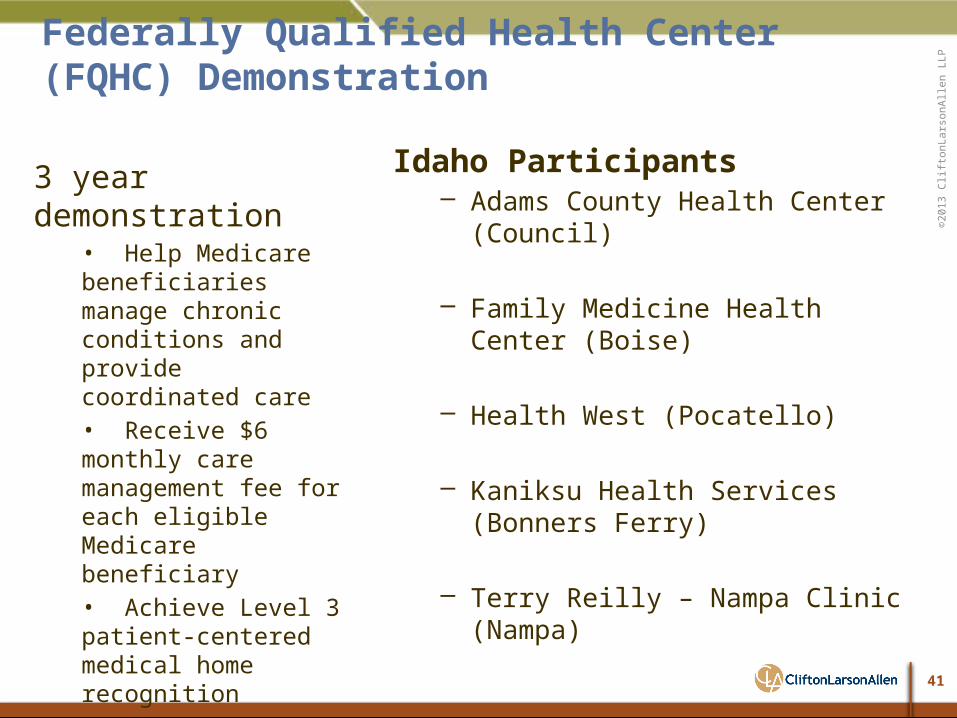
Federally Qualified Health Center (FQHC) Demonstration
Idaho Participants– Adams County Health Center (Council)
– Family Medicine Health Center (Boise)
– Health West (Pocatello)
– Kaniksu Health Services (Bonners Ferry)
– Terry Reilly – Nampa Clinic (Nampa)
3 year demonstration• Help Medicare beneficiaries manage chronic conditions and provide coordinated care• Receive $6 monthly care management fee for each eligible Medicare beneficiary• Achieve Level 3 patient-centered medical home recognition

©20
13 C
lifton
Lars
onAl
len
LLP
©20
13 C
lifton
Lars
onAl
len
LLP
cliftonlarsonallen.com
Regulatory Environment &Transitioning Traditional FFS Payment to VBP
42
©20
13 C
lifton
Lars
onAl
len
LLP
43
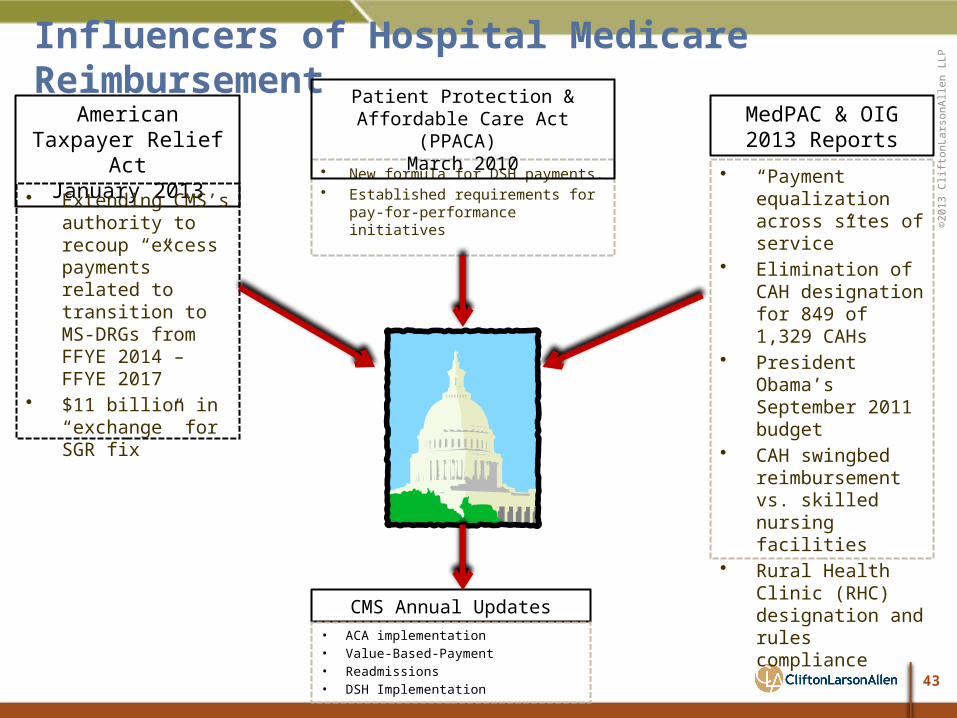
Influencers of Hospital Medicare Reimbursement
• New formula for DSH payments.• Established requirements for
pay-for-performance initiatives
Patient Protection & Affordable Care Act (PPACA) March 2010
American Taxpayer Relief Act
January 2013• Extending CMS’s
authority to recoup “excess payments” related to transition to MS-DRGs from FFYE 2014 – FFYE 2017
• $11 billion in “exchange” for SGR fix
CMS Annual Updates• ACA implementation• Value-Based-Payment• Readmissions• DSH Implementation
MedPAC & OIG2013 Reports
• “Payment equalization across sites of service”
• Elimination of CAH designation for 849 of 1,329 CAHs
• President Obama’s September 2011 budget
• CAH swingbed reimbursement vs. skilled nursing facilities
• Rural Health Clinic (RHC) designation and rules compliance

©20
13 C
lifton
Lars
onAl
len
LLP
44
MedPAC Pushing EqualizationPayment Pressures: “Good Ole Days” At Risk
“Last year we made a recommendation to equalize payment rates for office visits provided in hospital outpatient departments and physician offices. We will continue to analyze opportunities for applying this principle to other services and sectors, such as sectors that provide post-acute care.”
MedPAC 2013 Report to Congress
©20
13 C
lifton
Lars
onAl
len
LLP
45
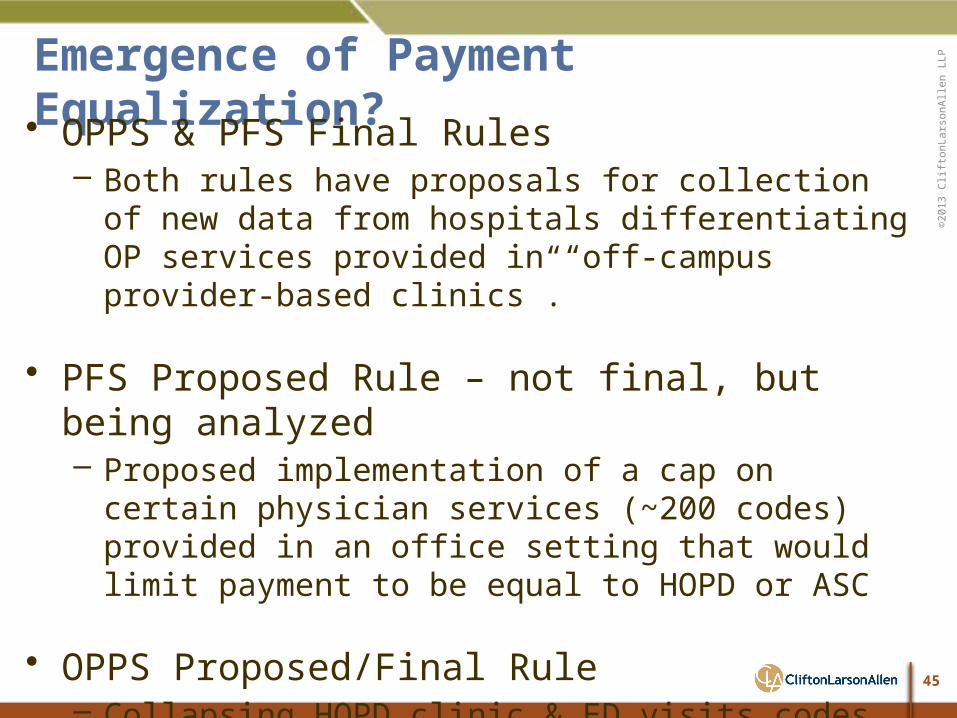
Emergence of Payment Equalization?• OPPS & PFS Final Rules
– Both rules have proposals for collection of new data from hospitals differentiating OP services provided in “off-campus provider-based clinics”.
• PFS Proposed Rule – not final, but being analyzed– Proposed implementation of a cap on certain physician
services (~200 codes) provided in an office setting that would limit payment to be equal to HOPD or ASC
• OPPS Proposed/Final Rule– Collapsing HOPD clinic & ED visits codes (ED change not
adopted)◊ One code for HOPD clinic visits◊ Type A & Type B for ED visits
©20
13 C
lifton
Lars
onAl
len
LLP
46
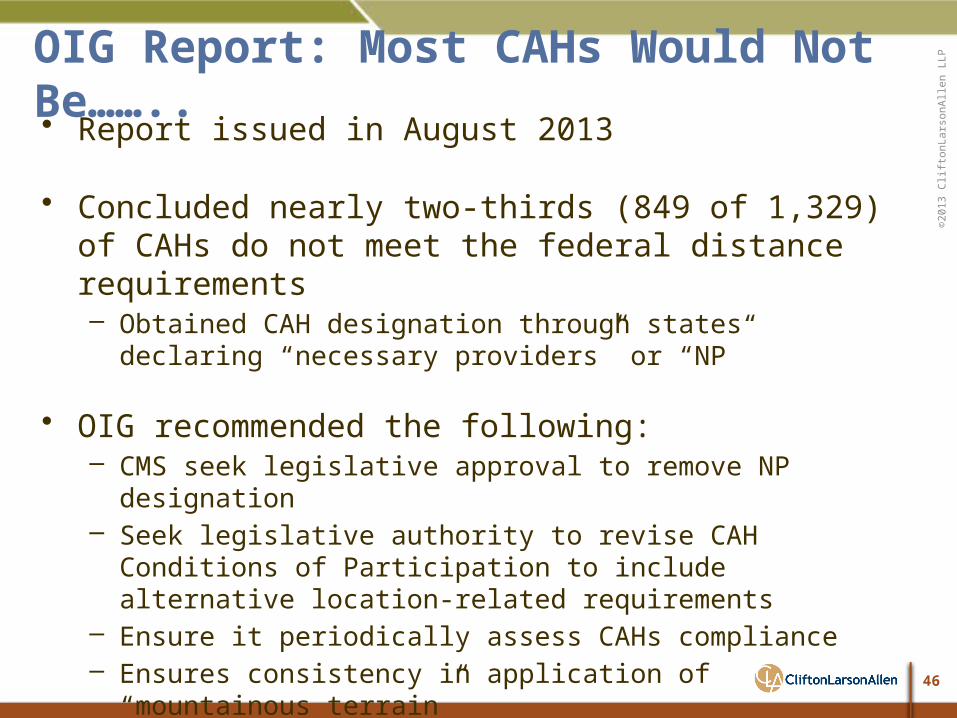
OIG Report: Most CAHs Would Not Be…….. • Report issued in August 2013
• Concluded nearly two-thirds (849 of 1,329) of CAHs do not meet the federal distance requirements– Obtained CAH designation through states declaring “necessary
providers” or “NP”
• OIG recommended the following:– CMS seek legislative approval to remove NP designation– Seek legislative authority to revise CAH Conditions of Participation to
include alternative location-related requirements– Ensure it periodically assess CAHs compliance– Ensures consistency in application of “mountainous terrain”
• OIG estimated, based on 2011 data, decertification would have save Medicare and beneficiaries $449 million
©20
13 C
lifton
Lars
onAl
len
LLP
47
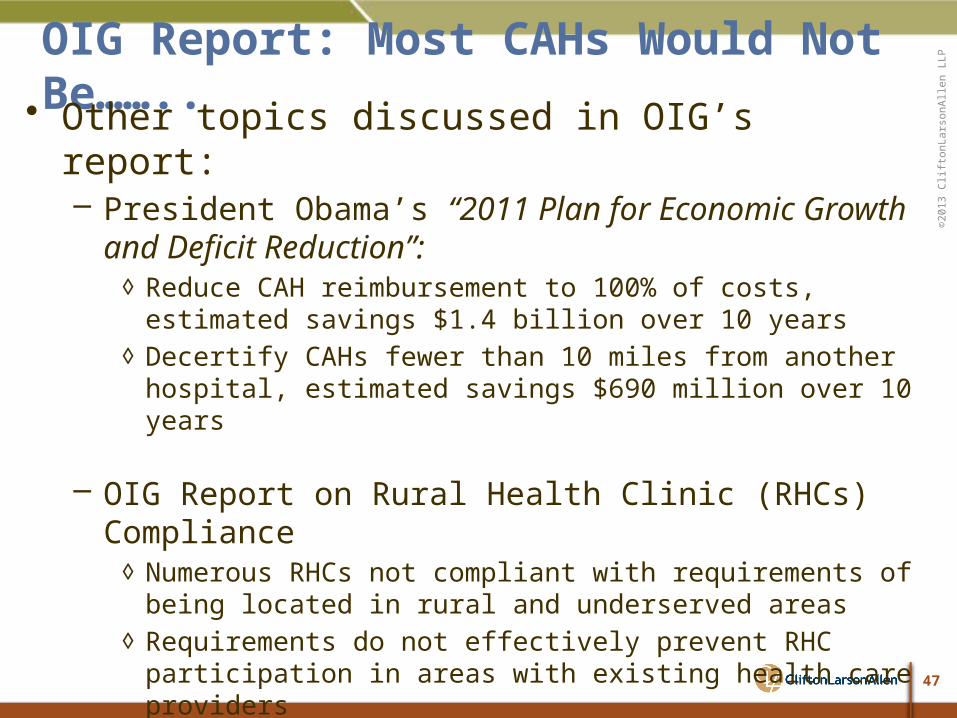
OIG Report: Most CAHs Would Not Be…….. • Other topics discussed in OIG’s report:
– President Obama’s “2011 Plan for Economic Growth and Deficit Reduction”:
◊ Reduce CAH reimbursement to 100% of costs, estimated savings $1.4 billion over 10 years
◊ Decertify CAHs fewer than 10 miles from another hospital, estimated savings $690 million over 10 years
– OIG Report on Rural Health Clinic (RHCs) Compliance◊ Numerous RHCs not compliant with requirements of being located in
rural and underserved areas◊ Requirements do not effectively prevent RHC participation in areas
with existing health care providers
– OIG conducting nationwide study of CAH swing-bed services◊ Comparing reimbursement for same level of care obtained in skilled
nursing facilities for 2005-2010

©20
13 C
lifton
Lars
onAl
len
LLP
48
Bipartisan Budget Act of 2013 & Pathway for SGR Reform Amendment
• Signed into law December 26, 2013
• Avoids a second round of sequestration cuts
• Medicaid provisions:– Officially recognizes Medicaid as “payer of last resort”
◊ Allows states to delay or avoid paying certain claims◊ Additional time to collect medical child support payments when health insurance
is available through a “non-custodial” parent– Extends Transitional Medical Assistance (TMA) program through 3/31/14
◊ Provides financial assistance to low-income families retain Medicaid coverage as they transition from welfare to work
– Repeals Medicaid DSH reductions for 2014 and delays 2015 cuts by one year◊ $500 million in 2014 – now repealed◊ $600 million in 2015 – deferred to 2016◊ Rebases 2023 Medicaid DSH allotment based on 2022 allotment

©20
13 C
lifton
Lars
onAl
len
LLP
49
Bipartisan Budget Act of 2013 & Pathway for SGR Reform Amendment• Temporarily avoids scheduled physician cuts
– Deferred until April 1, 2014– Instead of 20+% reduction, .5% increase
◊ Conversion factor will be $35.8228
• Extends other provisions of ACA & ATRA through March 31, 2014:– Physician work geographic adjustment floor of 1.0– Therapy caps on HOPD therapy services, as well as exceptions request
process to those caps– Ground ambulance add-on payments
◊ 2% for trips originating in urban areas◊ 3% for trip originating in rural areas◊ Increase over base rate of ~ 22.6% for trips originating in “super rural” areas
– Medicare IP hospital low volume adjustment (retro active to 10/1/13)– Medicare Dependent Hospital program (retro active to 10/1/13)
©20
13 C
lifton
Lars
onAl
len
LLP
50
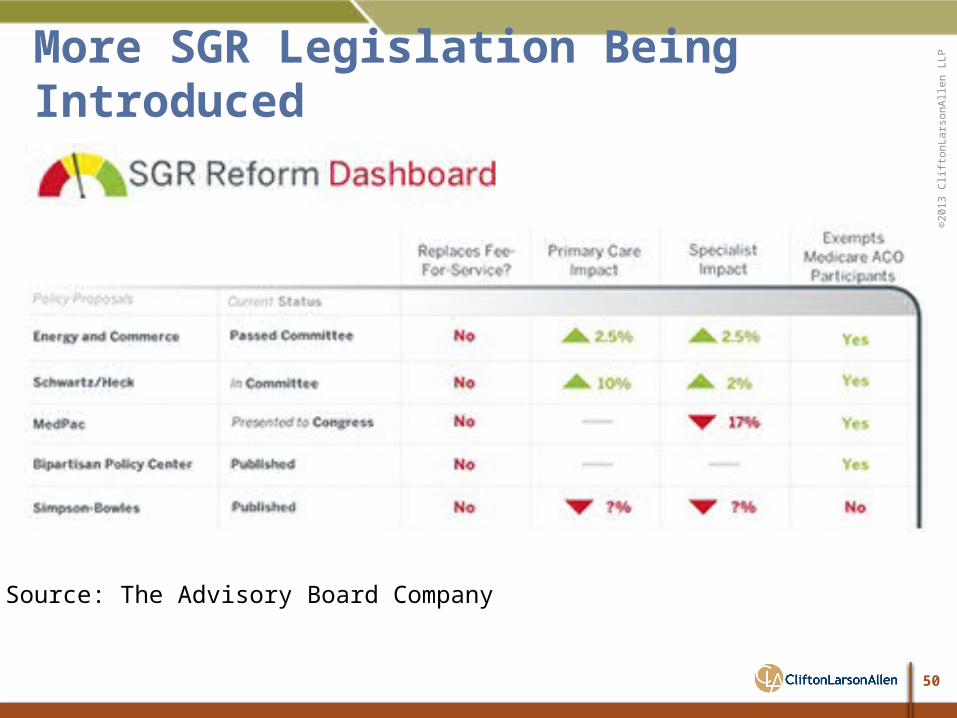
More SGR Legislation Being Introduced
Source: The Advisory Board Company
©20
13 C
lifton
Lars
onAl
len
LLP
51
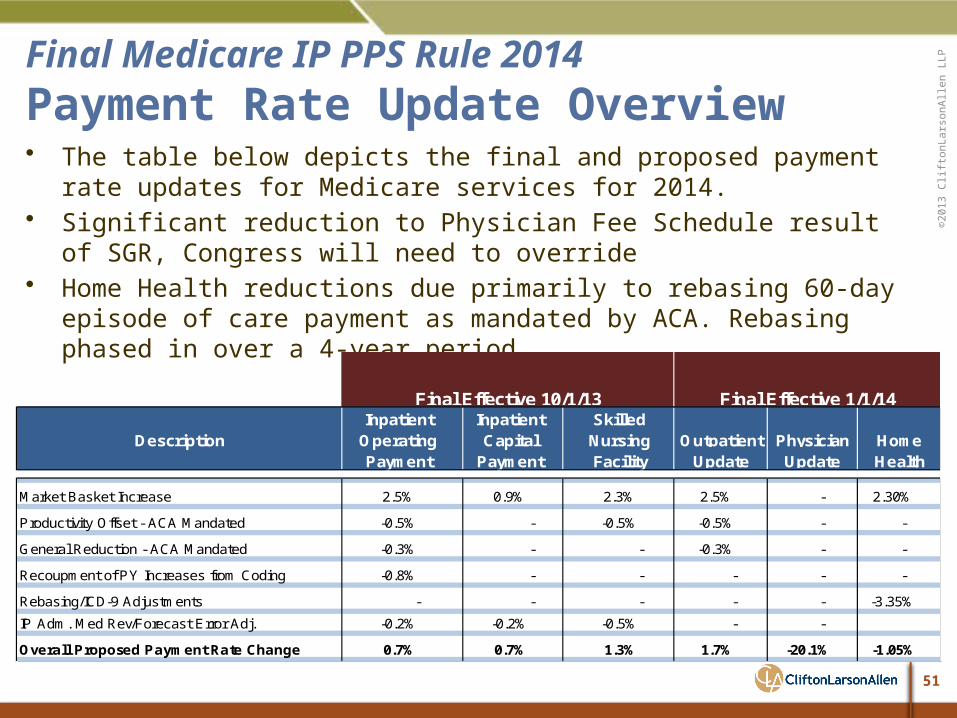
Final Medicare IP PPS Rule 2014Payment Rate Update Overview• The table below depicts the final and proposed payment rate updates for
Medicare services for 2014.• Significant reduction to Physician Fee Schedule result of SGR, Congress will need to
override• Home Health reductions due primarily to rebasing 60-day episode of care payment
as mandated by ACA. Rebasing phased in over a 4-year period.
Inpatient Inpatient SkilledDescription Operating Capital Nursing
Payment Payment Facility
Market Basket Increase 2.5% 0.9% 2.3% 2.5% - 2.30%
Productivity Offset - ACA Mandated -0.5% - -0.5% -0.5% - -
General Reduction - ACA Mandated -0.3% - - -0.3% - -
Recoupment of PY Increases from Coding -0.8% - - - - -
Rebasing/ICD-9 Adjustments - - - - - -3.35%
IP Adm. Med Rev/Forecast Error Adj. -0.2% -0.2% -0.5% - -
Overall Proposed Payment Rate Change 0.7% 0.7% 1.3% 1.7% -20.1% -1.05%
Final Effective 10/1/13 Final Effective 1/1/14
OutpatientUpdate
PhysicianUpdate Health
Home

©20
13 C
lifton
Lars
onAl
len
LLP
52
Final Medicare IP PPS Rule 2014Changes to Medicare DSH
• Mandated by Section 133 of ACA
• Change funding to pay 25% of normal DSH payment (i.e. “Empirically Justified Payment”)
• Remaining 75% (i.e. “Additional Uncompensated Care Payment”) redistributed based on certain factors, after reduction for change in uninsured population as estimated by CBO
• Total Medicare DSH reductions for FFYE 2014 estimated at approximately $550 million
• DSH eligible hospital will receive “empirically justified payment” and “additional uncompensated care payment” on a per discharge basis, with adjustment when FFYE 2014 cost report is settled

©20
13 C
lifton
Lars
onAl
len
LLP
53
Final Medicare IP PPS Rule 2014Walking Through DSH Payment Change
VARIABLE DESCRIPTION DSH POOL
CMS Offi ce of Actuary Estimated 2014 DSH Payments 12,772,000,000$
Less: 75% Reduction (DSH Pool Withheld to be used as Factor 1) (9,579,000,000)
Emirically Justified DSH Payments FFY 2014 for All Hospitals 3,193,000,000$
REMAINING DSH AMOUNT FOR FACTOR 1 9,579,000,000$
VARIABLE DESCRIPTION PERCENT
CBO Estimated Percent of Uninsured 2010 18%CBO Estimated Percent of Uninsured 2013 17%
CBO Estimated Percent Change in Unisured -5.6%Additional Reduction Per ACA -0.1%
TOTAL CHANGE IN UNINSURED PLUS ADD'L ACA REDUCTION -5.7%
FY 2014 Est. DSH Pool Withheld 9,579,000,000$ Percent Retained by CMS -5.7%
FFY 2014 Remaining DSH Pool Available for Redistribution 9,032,997,000$
FACTOR 1: POOL FOR ADDITIONAL DSH PAYMENTS
FACTOR 2: ESTIMATED CHANGE IN UNINSURED POPULATION

©20
13 C
lifton
Lars
onAl
len
LLP
54
Final Medicare IP PPS Rule 2014Walking Through DSH Payment Change
Factor 3 “Additional DSH Payment” determination will redistribute reimbursement across hospitals based on DPP share to total DPPs causing financial impact to vary.
VARIABLE DESCRIPTION SAMPLE HOSPITAL
2013 Hospital Specific DSH Payment (Estimate Provided by CMS) 4,846,286$
25% Payment of Historical DSH (Empirically Justified DSH Payment) a 1,211,571
FFY 2014 Remaining DSH Adjusment Avaible to Providers (Product of Factor 1 X Factor 2) 9,032,997,000Hospital Specific DSH Percent per CMS (Factor 3) 0.000488506
Hospital Specific Share of Additional DSH Payment from DSH Pool b 4,412,670$
2014 TOTAL ESTIMATED DSH PAYMENT a+b 5,624,241$
Estimated Percentage Change in DSH Payment vs. Prior Year 16.1%
SAMPLE HOSPITAL CALCULATION

©20
13 C
lifton
Lars
onAl
len
LLP
55
Final Medicare IP PPS Rule 2014DSH Settlement Implications
• CMS will settle DSH payments based on hospitals cost report
• Factor 3, DSH pool allocation, will not be a part of this settlement– This will be a fixed payment and for FFY 2014 will be based on and average
of the most recent three years MedPAR claims data◊ FFY 2010, 2011 and 2012
– CMS believes paying the Uncompensated Care Payments based on this estimate is within the scope of their authority based on how the law is written
• However, if the cost report reflects the hospital no longer qualified for the empirically justified DSH payments, ALL DSH payments received will need to be repaid to CMS– This includes the Empirically Justified AND Uncompensated Care payments

©20
13 C
lifton
Lars
onAl
len
LLP
56
Final Medicare IP PPS Rule 2014Connecting Performance to Reimbursement
Readmissions
VBP
HAC
2013 2014 2015 2016
Payment adjustment can no longer be affected
Data collection in process
Data collection not yet started
Performance Periods Currently In Progress For Fiscal Years
Source: CMS; Advisory Board Analysis

©20
13 C
lifton
Lars
onAl
len
LLP
57
• Penalty increases from 1% in FFYE 2013 to 1.25% in FFYE 2014
• Program remains budget neutral with estimated $1.1 billion available for VBP incentive payments
• Added new HAI to clinical processes of care domain– HAI postoperative urinary catheter removal
• Added new outcomes domain with following measures– AMI , HF & PN 30-day mortality rates
• FFYE 2014 and beyond domain weighting
Final Medicare IP PPS Rule 2014Value Based Purchasing Program

©20
13 C
lifton
Lars
onAl
len
LLP
58
Clinicl Process of Care
Patient Experience
Outcome Measures
Efficiency Care Measures -
45%
30%
25%
- 20%
30%
70%
30%
DomainFFY 2013
Final
25%30%
40%
25%
FFY 2014 Final
FFY 2015 Final
FFY 2016 Final
-
AND DOMAIN WEIGHTS FFY 2013 - FFY 2016
10%20%
Final Medicare IP PPS Rule 2014Value Based Purchasing Program
FY13 FY14 FY15 FY16 FY17
-1.00% -1.25% -1.50% -1.75% -2.00%
Payment Withhold By Fiscal Year
2013 2014 2015 2016
Total 20 24 26 25
New 20 4 3 4
Removed - - 1 5
Evolving & Changing Measures

©20
13 C
lifton
Lars
onAl
len
LLP
59
Final Medicare IP PPS Rule 2014FY2016 Performance Periods
2012 2013 2014
Outcomes: MortalityOct 1 June 30
Patient SatisfactionOct 15 June 30
January 2014
Clinical Process of Care
Patient Experience of Care
Efficiency Measures
Outcome: CAUT/CLABSI/SSI
Jan 1 Dec 31
Dec 31Jan 1
Jan 1
Jan 1
Dec 31
Dec 31
Finalized MeasuresSource: CMS; Advisory Board Analysis

©20
13 C
lifton
Lars
onAl
len
LLP
60
Final IP PPS Rule
• Hospital Acquired Conditions (HAC) Reduction Program– Hospitals ranked in lowest quartile of HAC performance will
receive a 1% reduction to Medicare inpatient payments– Penalty is not budget neutral and will be determined after
any adjustments applied for excessive readmissions or value-based purchasing
– Two domains for evaluating performance◊ Patient Safety Domain measures weighted at 35%◊ Healthcare Associated Infection (HAI) measures weighted at
65%– Program will continue to expand in future years

©20
13 C
lifton
Lars
onAl
len
LLP
61
Final IP PPS Rule• Hospital Readmissions Reduction Program
– Payment penalty increases from maximum of 1% in FFYE 2013 to 2% in FFYE 2014
– Program is not budget neutral– No new conditions for FFYE 2014, CMS will continue with current
conditions◊ AMI, HF, PN
– Program will expand in FFYE 2015 to include current conditions, plus:◊ COPD◊ Total Hip Arthroplasty & Total Knee Arthroplasty
• Part B Inpatient Billing– Allowing payment for Part B inpatient services if admission was
determined to be unnecessary or inappropriate post-discharge

©20
13 C
lifton
Lars
onAl
len
LLP
62
• Physician Value-Based Payment (VBP) Modifier– Mandated by Section 3007 of Affordable Care Act (ACA)– Intended to establish a value modifier that provides for differential payment
based on the quality of care provided compared to the cost of that care.
• VBP Modifier Rollout– January 1, 2015: VBP implemented for groups of 100 & > physicians– January 1, 2016: Expanded to groups of 10 to 99– January 1, 2017: Expanded to include all physicians
• Performance vs. Measurement Period– Two year lag on impact of performance
◊ CY 2013 performance measurement period for 2015 payment rates◊ CY 2014 performance measurement period for 2016 payment rates
Medicare 2014 Final PFS Rule Physician Value-Based Payment Modifier (VBP)

©20
13 C
lifton
Lars
onAl
len
LLP
63
Medicare 2014 Final PFS Rule VBP Rollout Process
Groups with 100 or more
Physicians
Upward or downward adjustment based on quality
& cost performance
Satisfactorily Report Group
PQRS
Elect Quality Tiering?
Excluded from VPM in CY 2015, included in CY 2017
-1.0% Penalty in CY 2015
0% Penalty in CY 2015 (No Adjustment)
No
No
No
Yes
Yes
Yes
* Source: Association of American Medical Colleges (AAMC) webinar July 31, 2012 accessed via web.

©20
13 C
lifton
Lars
onAl
len
LLP
64
Medicare 2014 Final PFS Rule VBP Domains & Application Methodology
Clinical Care
Patient Experience
Patient Safety
Care Coordination
Efficiency
Total Overall Costs
Total Cost w/Specific Conditions
Quality of Care Composite
Based on equal weighting of
scores for each of the 6 quality
domains
Cost Composite
Based on equal weighting of each
cost domain
Value-Based Modifier
Source: CMS PFS 2013 proposed rule, table 68 page 45007
©20
13 C
lifton
Lars
onAl
len
LLP
65
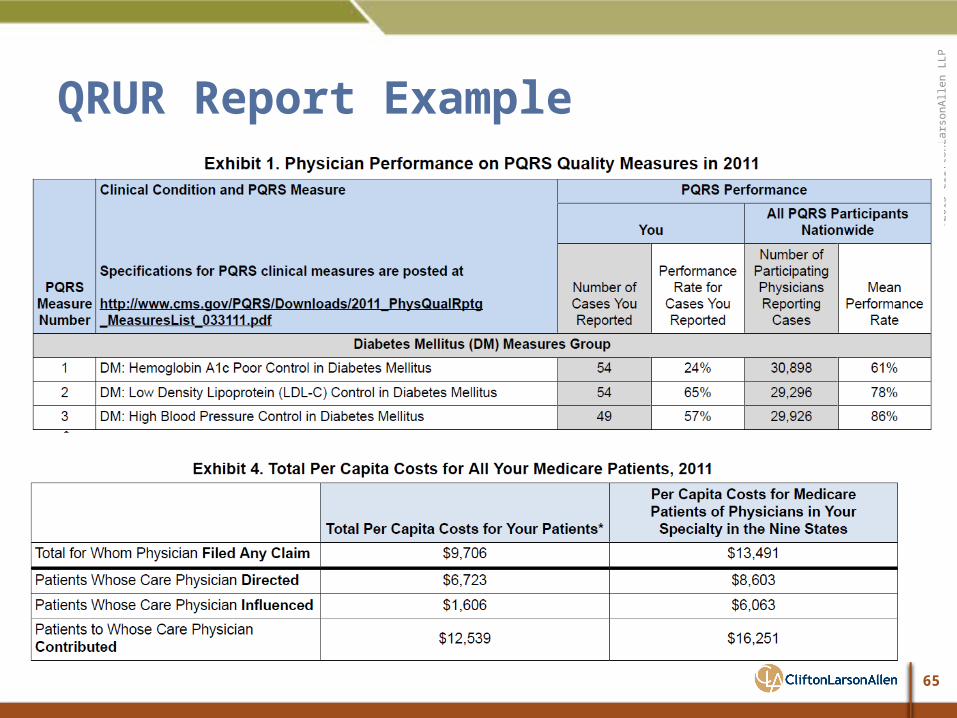
QRUR Report Example

©20
13 C
lifton
Lars
onAl
len
LLP
66
QRUR Performance Highlights Page*
Quality Composite Score
* Source: CMS
Cost compositee score
Beneficiaries average risk score
Quality tiering performance graph
Payment adjustment based on quality tiering
©20
13 C
lifton
Lars
onAl
len
LLP
67
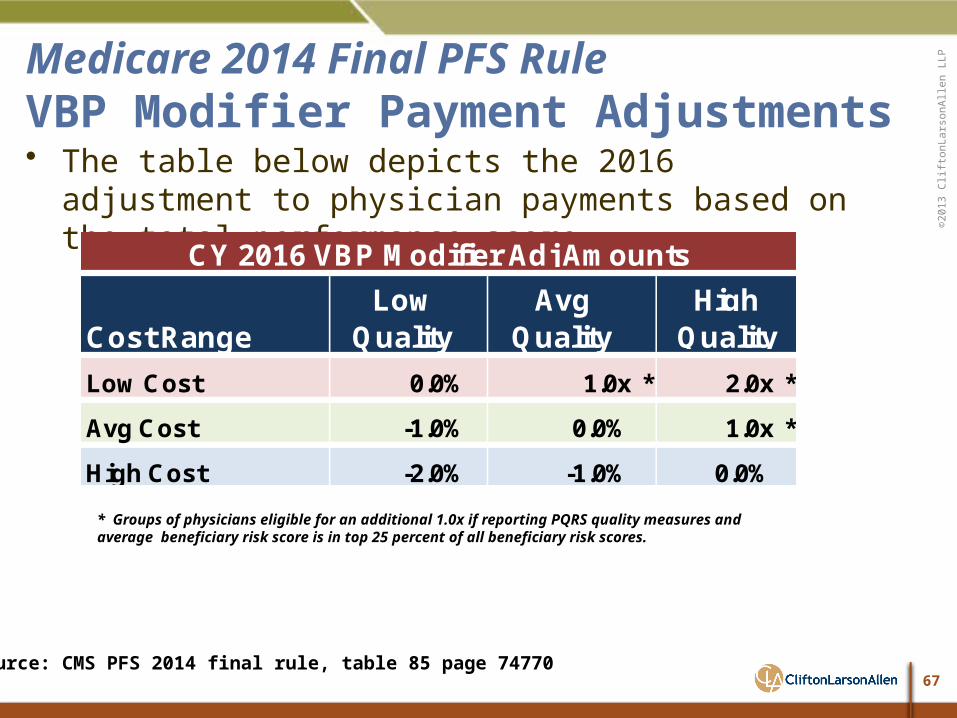
Medicare 2014 Final PFS Rule VBP Modifier Payment Adjustments• The table below depicts the 2016 adjustment to physician
payments based on the total performance score.
Source: CMS PFS 2014 final rule, table 85 page 74770
* Groups of physicians eligible for an additional 1.0x if reporting PQRS quality measures and average beneficiary risk score is in top 25 percent of all beneficiary risk scores.
Low AvgCost Range Quality Quality
Low Cost 0.0% 1.0x * 2.0x *
Avg Cost -1.0% 0.0% 1.0x *
High Cost -2.0% -1.0% 0.0%
HighQuality
CY 2016 VBP Modifier Adj Amounts

©20
13 C
lifton
Lars
onAl
len
LLP
68
Parting Comments• Health care payment system is being driven to “value based”
payments
• The transition in large part is market driven
• Many of the initiatives take aim at improving management, access, and quality of care provided to patients with chronic conditions
• Short-term outcomes show promise, but it will be years before we understand the true benefit of this transition
• During transition, CMS will continue to refine current payment systems to connect “value” to “reimbursement”
• Over time, CMS will expand & converge various quality programs, measures and reporting requirements

©20
13 C
lifton
Lars
onAl
len
LLP
69
Questions/Comments
THANK YOU!Rob Schile, CPA, PIC
Health Systems & [email protected]
For information on health care reform, go to
CliftonLarsonAllen’s Health Care Reform Center at:
http://www.cliftonlarsonallen.com/healthreform/