2013 annual report - panalpina€¦ · 2013 annual report. ... in productivity and secure our...
TRANSCRIPT

2013 Annual Report

the yeaR in bRief
Letter to the Shareholders 3
Facts and Figures 4
Information for Investors 6
GRoup RepoRt
Strategy and Results 9
Performance by Product 17
Performance by Region 19
Global Network 22
Industry Know-How 23
Compliance 26
Employees 27
Information Technology 29
Procurement 31
Security 32
Quality, Health, Safety and Environment 33
Social Commitments 37
CoRpoRate GoveRnanCe ⁄ CoMpensation RepoRt
Corporate Governance 39
Compensation Report 51
finanCial RepoRt
Consolidated Financial Statements 63
Annual Financial Statements 142
Contents

the yeAR
inbRief
contents
Letter to the Shareholders 3
Facts and Figures 4
Information for Investors 6
3Letter to the Shareholders
Panalpina Annual Report 2013
LetteR to the shARehoLdeRs
Dear shareholders,
In 2013, we were able to improve our result by CHF 80 million. Whilst this is a positive improvement over last year, we still have much to do to reach the targets we have set ourselves. We are therefore focusing our organization into converting more of our considerable gross profit into net profit, in which our shareholders participate.
At the 2013 Annual General Meeting, we bid farewell to our former corporate leader Monika Ribar, who had served our company for 22 years. Once again, we would like to give a special thanks to Ms. Ribar for her great service in developing Panalpina, and especially for succeeding in transforming the corporate culture into a professionally managed company. On the same day, Peter Ulber was welcomed to the company as our new CEO.
We have recently undertaken a review of our strategy and as a result consider it appropriate, fit for purpose, and concluded that we have no fundamental changes to make. However, we want to concentrate on sharpening our focus on the core elements of our business, specifically through Ebit conversion rate improvement, productivity gains and in the turnaround of lossmaking units. Our expertise in customized project business and in supporting global oil and gas companies will continue to contribute to our success.
The very direct implementation of these objectives has led us to make some consequential structural and staff changes. For example, hav ing created a new, fourth region, Middle East/Africa/CIS, we plan to capitalize far more in this attractive growth market. We are continuing to invest heavily in our IT and supporting systems to put us in a leading position in the industrialization of processes within the freight forwarding business which in turn leads to productivity gain and better ability to meet our customer needs. As a result, we have elevated the position of Chief Information Officer, held by Rod Angwin, to full membership of the Executive Board which reflects the strategic significance of information technology for our company.
Based on the results from the 2013 fiscal year and in view of our healthy balance sheet, the Board of Directors is proposing to the Annual General Meeting to pay out a dividend of CHF 2.20.
We aim to consistently pursue the course of actions initiated over the last year. In doing so, we intend to achieve sustainable profit through further increases in productivity and secure our position as one of the world’s top five companies in our markets.
We would like to thank all of our more than 16,000 staff around the world for their great dedication, our customers and suppliers for the excellent, trustbased cooperation, and our shareholders for their loyalty.
Peter Ulber Rudolf W. hugChief Executive Officer Chairman of the Board of Directors

4Facts and Figures
fActs And figURes
Key FiguresNet forwarding revenue of CHF 6,758 million Gross profit of CHF 1,561 million Adjusted EBIT of CHF 108 millionForwarding volumes: 825,000 tons in Air Freight (+3% year on year) 1,495,000 TEU in Ocean Freight (+ 7.7% year on year)
gross profit by product2013
40 %Air Freight
28 %Logistics
32 %Ocean Freight
gross profit by region2013
20 %APAC
30 %Americas
9 %MEAC
41 %Europe
energy balance by energy categoryGigajoule
280,000
240,000
200,000
160,000
120,000
80,000
40,000
0
Electricity
221,000
18,000
Heating
15,000
104,000
Owned vehicles
175,000
Indirect renewable energy Indirect energy Direct energy
co2 emission by scope and activityTons of CO2 equivalent
35,000
30,000
25,000
20,000
15,000
10,000
5,000
0
Indirect CO2 emission Direct CO2 emission
30,939
Electricity
5,998
2,338
Heating
12,675
Owned vehicles

5Facts and Figures
Panalpina Annual Report 2013
five-yeAR deveLoPment
gross profit Million CHF
1,900
1,750
1,600
1,450
1,300
1,150
1,000
10
1,480
11
1,477
12
1,465
13
1,561
09
1,377
net forwarding revenue Million CHF
7,500
6,250
5,000
3,750
2,500
1,250
0
10
7,164
11
6,500
12
6,617
13
6,758
09
5,958
ebit Million CHF
200
160
120
80
40
0
–40
–80
13
48
12
–40*
11
174
10
15
09
30
consolidated profit Million CHF
160
120
80
40
0
–40
–80
–120
13
11.7
12
–72*
11
127
10
–26
09
10
total equityMillion CHF
900
750
600
450
300
150
0
13
709
12
743*
11
928*
10
812
09
864
* Prior year’s figures have been restated due to the application of IAS 19 (as revised in 2011) retrospective)
five-yeAR deveLoPment

6
Panalpina Annual Report 2013
infoRmAtion foRinvestoRs
Good development – Panalpina shares performed well over the reporting period. The price quoted increased by 61.0%, from CHF 92.85 at the beginning of the year to CHF 149.50 on the last day of trading in the business year. The Swiss Performance Index (SPI) rose by 24.6% in the same period, so Panalpina performed significantly better than the Index as a whole, which includes more than 200 companies. The market capitalization at the end of the year amounted to CHF 3,551 million.
Share Symbol PWTN
Reuters PWTN.S
Bloomberg PWTN SW
Trading exchange SIX
Fiscal year ends December 31
ValorenNr. 000216808
ISIN CH0002168083
Share register SIS Aktienregister AG, Olten, Switzerland
Number of registered shares 23,750,000
share information
January 1 to December 31 Financial year
April 29 Firstquarter results
May 9 Annual General Meeting
July 22 Secondquarter results
October 21 Thirdquarter results
financial calender
share price development in comparison to sPi
Information for Investors
Panalpina World Transport Swiss Performance Index (SPI)
180%
170%
160%
150%
140%
130%
120%
110%
100%
90%
80%
dec 31 2012
mAR 1 mAy 1 JUL 1 seP 1 nov 1 dec 31 2013

7
Panalpina Annual Report 2013
IN MIO CHF 2013 2012 chAnge in %
Net forwarding revenue 6,758 6,617 +2.1
Gross profit 1,561 1,465 – 6.6
EBITDA 120 34 +249.6
EBIT 48 –40 u/a
Consolidated profit 12 –72 u/a
Earnings per share 0.5 –3.05 u/a
Key figures
2013 2012
Last day of trading previous year CHF 95.75 96.20
High CHF 151.80 109.50
Low CHF 82.40 78.90
Last day of trading current year CHF 149.50 92.85
Average trading volume CHF 33,306 40,917
Total shareholder return % 56.1 0.6
Market capitalization as per Dec 31 MIO CHF 3,551 2, 205
share price development
2013 2012
Amount MIO CHF 52.2 47,3
Per share CHF 2.20* 2.00
* Proposal to the Annual General Meeting.
ordinary gross dividend payments
Information for Investors

gRoUP RePoRt
contents
Strategy and Results 9
Performance by Product 17
Performance by Region 19
Global Network 22
Industry KnowHow 23
Compliance 26
Employees 27
Information Technology 29
Procurement 31
Security 32
Quality, Health, Safety and Environment 33
Social Commitments 37
9Strategy and Results
Panalpina Annual Report 2013
stRAtegy And ResULts
market developmentThe growth of the global eco nomy and world trade remained in low gear in the latest reporting year. The International Monetary Fund (IMF) estimates that both world output and global trade volumes rose around 3% in 2013 – approximately the same growth rate as in the previous year. However, growth dynamics are changing, with advanced economies gradually strengthening, supported by strong private demand in the United States and the Euro Area starting to crawl out of recession. At the same time, growth in emerging market economies has slowed, with particularly the once much hailed BRIC (Brazil, Russia, India, China) economies losing steam. The Chinese economy is estimated to have grown around 7.7% in 2013 and thus at the lowest rate since 1999, while the other three economies are estimated to have grown only between 1.5% (Russia) and 4.4% (India).Against this economic backdrop, freight markets continued to be plagued by overcapacities and significant rate volatility, which in turn can lead to increased volatility of forwarders’ unit yields. On the demand side, growth remained lackluster. The ocean freight market grew just about 3% and the air freight market – while still declining in the first quarter – was in stagnation during most of the year and only gained some traction towards year end, leading to a growth rate for the full year of just about 1%.
business strategyDuring the year under review, with the arrival of both a new CEO and CFO, Panalpina further sharpened its strategy and set out a range of strategic priorities with respect to the company’s product mix, geographic co ver age, cus tomers and growth model. The core competence in Air and Ocean Freight remains the foundation of Panalpina’s business and at the same time Logistics will be further developed as an important differentiator by focusing on the delivery of valueadded services to complement the endtoend solutions offering for international customers. Furthermore, the service offering includes the specialties Projects and Oil and Gas where the Group is widely recognized by its customers to have deep and unrivalled knowl edge and expertise. The focus on these specialties will enable Panalpi na to further differentiate its product offering from competition.Geographically, apart from strengthening its position in key European markets such as the UK, the Netherlands, France and Italy, the company also aims to expand its global footprint by increasing its market share on the IntraAsia and Asiaoutbound trade lanes as well as in the United States where management feels the market potential is currently not fully tapped. Moreover, the Group complemented its organizational structure by setting up a fourth region covering the Middle East, Africa and the CIS (MEAC), which will allow to better focus on the potential within these growing economies. In the period under review, the reporting structure has been adjusted accordingly: MEAC as well as Europe are reported as two separate operating segments (previously one operating segment). Panalpina will continue to leverage its expertise to serve customers in the Technology and Automotive sectors, and will increase its investment focus to attract additional business in the Oil and Gas, Healthcare, Consumer and Retail, Fashion and Manufacturing industry verticals.In the near future, the Group’s business growth is likely to remain organic. However, for the medium term, it is Panalpina’s objective to become fit for acquisitions as suitable opportunities arise and as a means to reach or retain its position among the global top 5 players in air and ocean freight forwarding. Along with the goal to further expand its business while gaining market share, the Group’s major focus is to improve its operating margin, measured as the conversion ratio of EBIT over gross profit.
To this end, the Group has launched a number of profitability improvement initiatives and has embarked on a comprehensive Operations Transformation Program (OTP) to significantly increase productivity in the years to come. The key cornerstones of OTP are the rollout of SAP Transportation Management (TM), which began in 2013 in the Ocean Freight segment with the replacement of the old system and the centralization of noncustomerfacing processes in four business service centers located in Asia, Central America and Eastern Europe.
Initiating the business transformation – In a continuously slow market environment, Panalpina gained market share and posted a considerable rise in profitability thanks to focusing on selective business growth and cost containment. The corporate strategy was sharpened and clear priorities have been set to secure sustainable growth above market while further improving operating margins. First milestones have been achieved in the journey to transform the Panalpina Group into the most customerfocused global provider of freight forwarding and logistics solutions.

10Strategy and Results
Panalpina Annual Report 2013
Furthermore, the Group’s financial transparency has been enhanced during the period under review by allocating all operating expenses down to the smallest organizational unit as well as to the product level (Air Freight, Ocean Freight, Logistics). As a result, a number of underperforming operations and business activities has been identified, and concrete plans have been put in place to eliminate these inefficiencies. At the same time, clear financial ownership has been assigned and directly linked to compensation such that the vast majority of managers within the Group is financially incentivized to focus on EBIT.To further facilitate the execution of the corporate strategy, the Group also simplified and aligned its organizational structure, with the following changes becoming effective on January 1, 2014: appointment of a regional CEO for the newly created region MEAC who is part of the Group’s Executive Committee; appointment of a Chief Commercial Officer on Executive Board level in order to further increase Panalpina’s customer focus and to drive the Group’s sales performance management; elevation of the Chief Information Officer function from Executive Committee to Executive Board level to underline the importance of IT for the company and the industry as a whole. Moreover, most country organizations within the Panalpina network will in the future report directly to one of the Group’s four regions, with the consequence that the previous area structure will be dissolved.
outlookThe IMF expects output in 2014 to slowly gain traction in most countries and growth of world trade to accelerate to 5% from 3% in the previous year. At the same time, management does not expect a significant pickup in growth in Panalpina’s core markets. However, regardless of the economic environment and in line with its strategy of sustainable, profitable growth above market across all regions and products, the Group remains committed to further increase its customer orientation and to improve productivity and operating margins in the years to come. To strengthen Panalpina’s global competitive position, selective investments in the business platform and industrial expertise will continue and will be balanced with strict cost control.
Management generally expects world trade and the outsourcing of logistics services to expand further in the years to come, although the dynamics of growth may vary by geography. With its global and assetlight network, coupled with the ability to react swiftly to changing customer needs and to offer its clients firstclass, tailormade, endtoend supply chain solutions, Panalpina is well prepared to take advantage of the growth opportunities ahead and to further enlarge its footprint in the global logistics market.

11Strategy and Results
Panalpina Annual Report 2013
net foRWARding RevenUe (nfR)
Net forwarding revenue in 2013 amounted to CHF 6,758 million, an increase of 2.1% compared to the CHF 6,617 million the year before. The translation of foreign currencies into the reporting currency (CHF) had a negative impact on the Group’s NFR in the amount of CHF 127 million or 2.0%, hence organic growth amounted to 4.1%. The Group did not undertake any acquisitions during the reporting year.
At regional level, net forwarding revenue in Europe – the Group’s largest region in terms of turnover – declined 1.9% from CHF 2,658 million in 2012 to CHF 2,608 million in 2013. In North, Central and South America (Americas), NFR increased by 1.0% from CHF 2,288 million to CHF 2,310 million. Compared to 2012, Panalpina’s NFR in 2013 in Asia Pacific (APAC) increased 2.3% from CHF 1,238 million to CHF 1,266 million. The region Middle East, Africa and CIS (MEAC) saw an increase in NFR of 32.6% from CHF 433 million to CHF 574 million.
In 2013, the Panalpina Group generated 39% of its net forwarding revenue in Europe, 34% in the Americas, 19% in APAC and 8% in MEAC.On a product level, net forwarding revenue in Air Freight declined 1.6% from CHF 3,106 million in 2012 to CHF 3,056 million in 2013. In contrast, in Ocean Freight, the Company increased its NFR by 6.3% from CHF 2,615 million to CHF 2,781 million. In Logistics, NFR saw an increase of 2.8% from CHF 896 million to CHF 921 million.
In 2013, the Panalpina Group generated 45% of its net forwarding revenue with Air Freight, 41% with Ocean Freight and 14% with Logistics.
net forwarding revenue by region 2013
19 %APAC
34%Americas
8 %MEAC
39 %Europe
net forwarding revenue by product 2013
45 %Air Freight
14 %Logistics
41 %Ocean Freight
net forwarding revenue by product Million CHF
3,500
3,000
2,500
2,000
1,500
1,000
500
0
2013 2012
Logistics
921 896
Ocean Freight
2,7812,615
Air Freight
3,056 3,106
net forwarding revenue by regionMillion CHF
3,500
3,000
2,500
2,000
1,500
1,000
500
0
Americas
2,310 2,288
APAC
1,266 1,238
MEAC
574433
Europe
2,608 2,658
2013 2012
12Strategy and Results
Panalpina Annual Report 2013
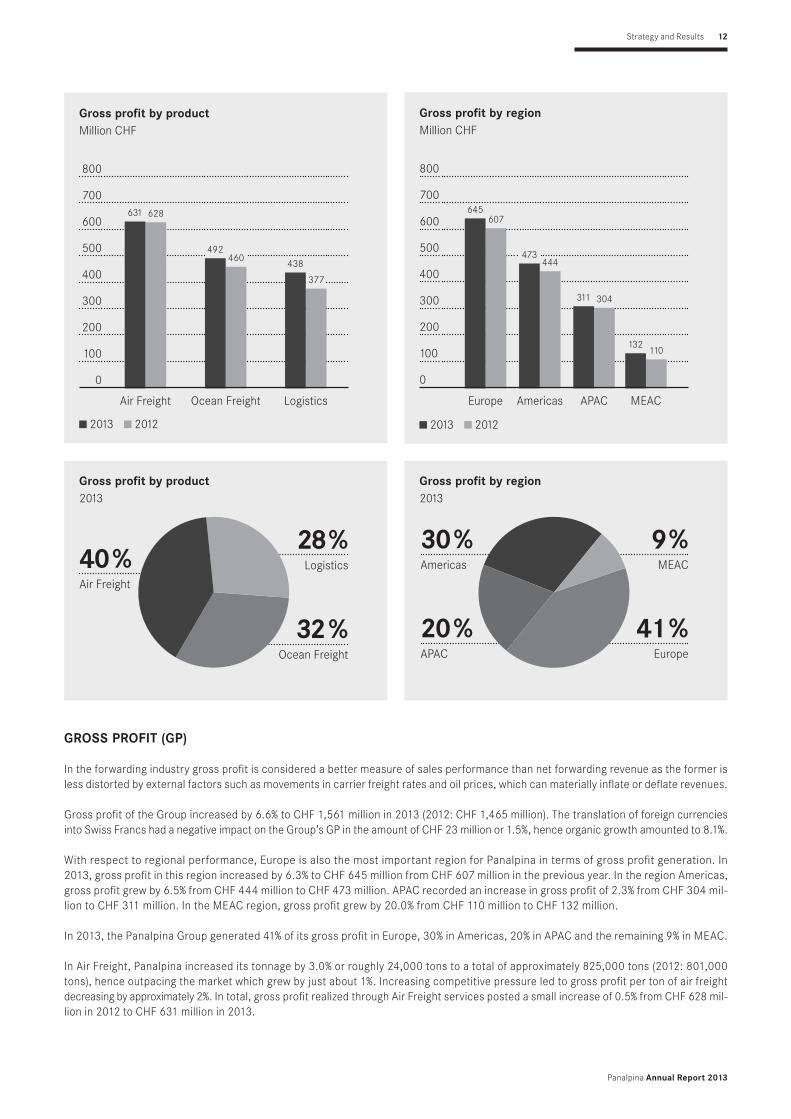
gRoss PRofit (gP)
In the forwarding industry gross profit is considered a better measure of sales performance than net forwarding revenue as the former is less distorted by external factors such as movements in carrier freight rates and oil prices, which can materially inflate or deflate revenues.
Gross profit of the Group increased by 6.6% to CHF 1,561 million in 2013 (2012: CHF 1,465 million). The translation of foreign currencies into Swiss Francs had a negative impact on the Group’s GP in the amount of CHF 23 million or 1.5%, hence organic growth amounted to 8.1%.
With respect to regional performance, Europe is also the most important region for Panalpina in terms of gross profit generation. In 2013, gross profit in this region increased by 6.3% to CHF 645 million from CHF 607 million in the previous year. In the region Americas, gross profit grew by 6.5% from CHF 444 million to CHF 473 million. APAC recorded an increase in gross profit of 2.3% from CHF 304 million to CHF 311 million. In the MEAC region, gross profit grew by 20.0% from CHF 110 million to CHF 132 million.
In 2013, the Panalpina Group generated 41% of its gross profit in Europe, 30% in Americas, 20% in APAC and the remaining 9% in MEAC.
In Air Freight, Panalpina increased its tonnage by 3.0% or roughly 24,000 tons to a total of approximately 825,000 tons (2012: 801,000 tons), hence outpacing the market which grew by just about 1%. Increasing competitive pressure led to gross profit per ton of air freight decreasing by approximately 2%. In total, gross profit realized through Air Freight services posted a small increase of 0.5% from CHF 628 million in 2012 to CHF 631 million in 2013.
gross profit by product2013
40 %Air Freight
28 %Logistics
32 %Ocean Freight
gross profit by region2013
20 %APAC
30 %Americas
9 %MEAC
41 %Europe
gross profit by product Million CHF
800
700
600
500
400
300
200
100
0
Air Freight
631 628
492460
Ocean Freight
438
377
Logistics
2013 2012
gross profit by region Million CHF
800
700
600
500
400
300
200
100
0
2013 2012
MEAC
132110
APAC
311 304
Americas
473444
Europe
645607

13Strategy and Results
Panalpina Annual Report 2013
In Ocean Freight, Panalpina’s volumes grew by 7.7% – well ahead of the market which grew by about 3% – to reach a new alltime high of approximately 1,495,000 twentyfoot equiv alent units or TEU (2012: 1,388,000 TEU). Gross profit per TEU came in just slightly below previous year’s level despite a very volatile freight rate environment during the year. In combination with the strong volume performance, gross profit generated through Ocean Freight services expanded by 7.0% from CHF 460 million in 2012 to CHF 492 million in 2013.
Gross profit in Logistics saw strong growth of 16.2% from CHF 377 million in 2012 to reach a total of CHF 438 million in 2013. The improved GP result was driven by a strong expansion across all subactivities such as Warehousing & Distribution, ValueAdded Logistics Services and Overland.
In 2013, the Panalpina Group generated 40% of its gross profit with Air Freight, 32% with Ocean Freight and 28% with Logistics.
eARnings befoRe inteRest And tAxes (ebit)
Management considers earnings before interest and taxes (EBIT) a key performance indicator for assessing the Group’s operating performance. The Group’s EBIT in 2013 was substantially hit by a provision of CHF 40.9 million (2012: CHF 59.2 million) which the Company recognized to cover fines and charges by various parties and government authorities for alleged antitrust violations related to isolated air freight surcharges on certain trade lanes during limited periods of time prior to 2008. Moreover, the Group incurred an impairment charge in the amount of CHF 19.1 million (2012: CHF 29.6 million) for writing off the remaining goodwill of an acquisition done in 2011.
The Group’s EBIT in 2013 amounted to CHF 48 million (2012: loss of CHF 40 million). The translation of foreign currencies into Swiss Francs had a negative impact on the Group’s EBIT in the amount of CHF 1.4 million.Excluding the extraordinary charges described above, Pan alpina achieved an adjusted EBIT of CHF 108 million in the reporting year (2012: CHF 49 million) and an adjusted EBIT/GP margin of 6.9% (2012: 3.4%).
The two main items included in operating expenses – personnel expenses and other operating expenses – developed as follows: Personnel expenses amounted to CHF 960 million in 2013 and thus were largely unchanged from previous year (2012: CHF 957 million). The small increase was mainly a result of more personnel being hired to support the continued growth of Logistics.
Other operating expenses amounted to CHF 440 million in 2013 and thus came in approximately 6% higher compared to the previous year (2012: CHF 414 million). Other operating expenses increased as the Group continued to invest particularly in a number of new Logistics facilities and the rollout of new IT solutions in both Logistics (Red Prairie) and Ocean Freight (SAP TM).
Depreciation and amortization charges changed from CHF 44 million in 2012 to CHF 53 million in 2013. The increase of CHF 9 million was mainly related to the beginning of the amortization of previously capitalized costs in connection with the SAP TM project.
overall developmentMillion CHF
120
100
80
60
40
20
0
–20
–40
–60
EBIT EBIT excl. nonrecurring items
2013
48
108
–40
49
2012
9.0%
7.5%
6.0%
4.5%
3.0%
1.5%
0.0%
–1.5%
–3.0%
–4.5%
EBIT/GP margin EBIT/GP margin excl. nonrecurring items
2013
3.1
6.9
–2.7
3.4
2012

14
With respect to regional EBIT performance, adjusted for the nonrecurring items mentioned above, EBIT in Europe improved from a loss of CHF 12 million in 2012 to a positive result of CHF 13 million in 2013. EBIT in the Americas turned from a loss of CHF 1 million in 2012 to a positive result of CHF 23 million in 2013. The largest contribution to Group EBIT was contributed by APAC which improved its EBIT from CHF 65 million in 2012 to CHF 71 million in 2013. In MEAC, EBIT improved from a loss of CHF 3 million in 2012 to a positive result of CHF 1 million in 2013.
In the products adjusted for the nonrecurring items mentioned above, Air Freight delivered the highest EBIT with CHF 119 million, a sharp increase compared to the CHF 79 million achieved in the previous year. In Ocean Freight, EBIT increased from CHF 9 million in 2012 to CHF 28 million in 2013. In Logistics, the EBIT result stayed unchanged at a loss of CHF 39 million in 2013 (2012: loss of CHF 39 million).
bALAnce sheet
current assetsPanalpina’s cash and cash equivalents amounted to CHF 337 million on December 31, 2013 and thus decreased by CHF 56 million from the year before (December 31, 2012: CHF 393 million). The cash reduction can mainly be attributed to dividends paid to shareholders (CHF 47 million) as well as an increase in net working capital.
Trade receivables and unbilled forwarding services increased by CHF 33 million, from CHF 1,118 million at the end of 2012 to CHF 1,151 million at the end of 2013. The increase can be mainly attributed to the increase of turnover. The net working capital intensity (defined as net working capital as a percentage of gross forwarding revenue) at the end of 2013 increased to 2.0%, compared to 1.7% a year earlier. The increase can mainly be attributed to pressure from customers for longer payment terms.
non-current assetsPanalpina’s noncurrent assets decreased by CHF 11 million and amounted to CHF 351 million on December 31, 2013 (December 31, 2012: CHF 362 million). The decrease can mainly be attributed to the decrease in intangible assets as a result of the aforementioned impairment charges recognized during the reporting year.
Strategy and Results
Panalpina Annual Report 2013
Adjusted ebit by product Million CHF
140
120
100
80
60
40
20
0
–20
–40
–60
Air Freight
119
79
28
9
Ocean Freight
–39 –39
Logistics
2013 2012
Adjusted ebit by region Million CHF
80
70
60
50
40
30
20
10
0
–10
–20
2013 2012
1
–3
MEAC
71
65
APAC
23
–1
AmericasEurope
13
–12

15Strategy and Results
Panalpina Annual Report 2013
trade payables and accrued cost of servicesPanalpina’s trade payables and accrued cost of services at yearend 2013 amounted to CHF 762 million compared to CHF 773 million at yearend 2012 and hence saw a slight reduction of CHF 11 million.
other liabilitiesPanalpina’s other liabilities increased by CHF 37 million from CHF 441 million at yearend 2012 to CHF 478 million at yearend 2013 and can be mainly attributed to an increase in provisions in connection with the extraordinary charges mentioned above.
total equityTotal equity decreased by CHF 34 million during the reporting period, from CHF 743 million on December 31, 2012, to CHF 709 million on December 31, 2013. The decrease in shareholders’ equity mainly reflects the payment of the dividend.
cAsh fLoW net cash from operating activitiesPanalpina’s net cash from operating activities in the reporting period amounted to CHF 42 million (2012: CHF 72 million). Major contributors to this development were the improvement of the net result for the period and the simultaneous increase in provisions and net working capital.
cash flow from investing activitiesExpenditures on property, plant and equipment decreased by CHF 22 million during the reporting year to CHF 29 million (2012: CHF 51 million) as the company postponed certain investments not deemed as business critical in an effort to preserve cash. Capital expenditures in 2013 amounted to 0.8% of net forwarding revenue (2012: 1.3%), a figure which is in line with the company’s longterm average.Also, in 2012 the cash flow from investing activities was inflated by two extraordinary cash inflows: the Group had received inflows of CHF 57 million due to the repayment of money market and time deposits and a further CHF 28 million mainly due to the sale of its investment of 12% of Luxair SA’s shares. In 2013 no such extraordinary transactions were recorded. Overall, the net cash outflow from investing activities increased from CHF 10 million in 2012 to CHF 48 million in 2013.
total assetsMillion CHF
2,000
1,800
1,600
1,400
1,200
1,000
800
600
400
200
0
Cash and cash equivalents Trade receivables and unbilled forwarding services Other current assets Noncurrent assets
2013 2012
337 393
1,151 1,118
110 84
351 362
total liabilities and equityMillion CHF
2,000
1,800
1,600
1,400
1,200
1,000
800
600
400
200
0
Trade payables and accrued cost of services Other liabilities Equity
762
478
709
773
441
743
2013 2012

16Strategy and Results
Panalpina Annual Report 2013
cash flow from financing activitiesWhereas the company paid an ordinary dividend amounting to CHF 47 million in both 2012 and 2013, in 2012 an additional payment to shareholders totalling CHF 45 million (2013: nil) took place via a reduction of the nominal value of the registered shares.The net cash used in financing activities thus decreased from CHF 96 million in 2012 to CHF 41 million in 2013.
net cash
IN MIO CHFdec 31
2013dec 31
2012 diffeRence %
Cash and cash equivalents 336.9 393.1 –56.2
Other current financial assets 5.5 0.0 5.5
Shortterm debt –3.1 –1.6 –1.5
Longterm debt – 0.2 – 0.2 – 0.0
Net cash 339.1 391.3 –52.2
Net cash decreased by CHF 52 million during the year under review to CHF 339 million on December 31, 2013 (December 31, 2012: 391 million).
17Performance by Product
Panalpina Annual Report 2013
PeRfoRmAnce by PRodUct
AiR fReight
market situationIn 2013, the macroeconomic environment has improved and slightly increased demand for international traffic. The air freight market has therefore returned to growth. Freight rates remained under pressure due to steadily increasing overcapacity. However, fuel prices only slightly increased in 2013. Further shift of production and increased demand from middleclass households led to volume growth on Asia (both in and outbound) and IntraAsia trade lanes. Emerging markets in the Middle East, Africa, CIS and Latin America also contributed to air freight growth.
Looking at industry verticals, technology, fashion and manufacturing companies were the key growth drivers whereas perishables absorbed evergrowing capacities. Increasing requirements from regulatory authorities raised the demand for qualified temperaturecontrolled services.
highlights Investment in own controlled network. Increased load factors in own controlled network. Official opening of Luxembourg Pharma & Healthcare Hub, an important milestone in Panalpina’s GDPcompliant service offering as a prerequisite to retain healthcare customers and grow market share.
First totally paperless flight in the air freight industry. Industry leading Global Sourcing Program. Business wins enabled Panalpina to grow at abovemarket rate.
outlookPanalpina is cautiously optimistic for the 2014 air freight market. Rates are expected to follow a sideways trend as new aircraft deliveries increase supply above demand, and passenger service demand grows nearly twice as much as cargo demand. The fuel risk will remain a major threat. Panalpina strives to catch up in perishables, consumer and retail, and fashion, while increasing activities in healthcare. Growth in emerging markets, such as the Middle East, Africa, CIS and Latin America, will be leveraged. Digitalization of air freight documentation will continue and improve productivity.
oceAn fReight
market situationMajor trade lane uncertainty continued unabated. The market showed extreme rate volatility due to a supplyanddemand imbalance from carriers. This was driven by a significant buildup of new tonnage in the Far East Westbound trade as well as the impact of the cascading effects in other Asiaoutboundrelated trade lanes. Nevertheless, the global demand for ocean freight grew by approximately 34 % against a net capacity increase of 6%.
highlights Further enhancement of global LCL network, Panalpina now operates more than 450 services globally. Ocean freight TEU growth was well above average market growth. The intraAsia trade lane developed extremely positively. Managed Solutions team was established and new order management based on the software MyPanalpina+ was rolled out. Panalpina made inroads into niche markets such as the transport of recycled materials.
Fully integrated door-to-door solutions – Panalpina combines the intercontinental transport of air and ocean freight with comprehensive valuegenerating logistics. Its three products end 2013 with strong results and further developments.

18Performance by Product
Panalpina Annual Report 2013
outlookGlobal market growth of 3–4 % is anticipated for ocean freight in 2014. Traditional trade lanes, like Far East Westbound and Transpacific Eastbound, will start to recover. The overcapacity and cascading effect will continue to cause rate volatility. Panalpina will focus on nontraditional trade lanes, such as intraAsia, AsiaLatam or AsiaMiddle East.
Logistics
market situationThe outsourced logistics market continues to grow. The nature of some customer’s supply chains is changing as they consider nearshoring and onshoring. This is not only driven by transport costs, but by the rise in manufacturing costs in previous lowcost labor markets and by government investments and incentives to stimulate local economic growth.
highlights ValueAdded Services in targeted industry verticals grew to 13% of Logistics business. Introduction of Logistics Manufacturing Services (LMS) as a distinct product; Panalpina undertakes the inventory planning, shop scheduling, final assembly, configuration and testing (FACT), and quality assurance of Technology Infrastructure Products.
20,000 sqm highfashion hub opened in New Jersey with semiactive RFID item tagging, coupled with origin consolidation, air freight forwarding and destination services in an endtoend solution.
New facilities opened in New Zealand, Austria, Australia, Singapore, Colombia, United States, Poland and Brazil. Accreditation from The Lean Enterprise Research Centre allowing PA Logistics to certify Lean practitioners. Research partnership established with Cardiff Business School for demanddriven inventory modelling. Continuation of Red Prairie rollout as Panalpina’s global platform for logistics operations.
outlookIn 2014, eliminating the legacy loss making businesses and further establishing VAS within Logistics will continue. For VAS, the focus is in the industry verticals Panalpina has gained most traction in, such as technology and fashion. As the manufacturing cycle decouples within certain sectors, positioning Panalpina as a logistics service provider in the location the customer requires, such as logistics manufacturing services close to enduser or fashion hubs offering endtoend VAS closer to the market, will be crucial.

19Performance by Region
Panalpina Annual Report 2013
PeRfoRmAnce by Region
AmeRicAs
market situationNorth America saw huge growth in industries such as oil and gas and automotive manufacturing. Crude oil production grew at a historic pace in the US, to over one million barrels per day. Automobile manufacturing increased in the US with the implementation of NAFTA (North American Free Trade Agreement) between neighboring countries, such as Mexico and Canada. As a result, US automotive factories exported over three times the amount of automobiles and light trucks from previous years. The air freight market was negatively impacted by increased volatility. The ocean freight market continued to outpace last year’s growth rate.The Canadian economy proved to be flat with high competition for Canadian business. The oil and gas industry in Canada has stayed strong with the production of tools and other machinery holding steady, much like in 2012. Substantial new business wins for Panalpina Canada resonated across 2013 for both the FCL and LCL Ocean product.
highlights Panalpina US capitalized its position in the North American oil and gas sector by strengthening core relationships and partnering with major players in the industry.
Panalpina celebrated the opening of a new coolchain facility in San Juan, Puerto Rico, to further leverage its strong position in the healthcare sector.
In September 2013, Panalpina Miami became the first USshared service center to officially become paperless.Upon implementing the early stages of the EFile program, Panalpina OSC Miami has centralized FCL import communications from ocean carriers to the business units electronically. This change in processing dramatically reduces the amount of time spent on each file with the added environmental benefit of eliminating paper consumption.
Panalpina implemented new LCL services, covering the main worldwide ports. Panalpina is supporting customers to prepare for mega events: the FIFA World Cup in a dozen different cities in 2014 and the 2016 Summer Olympics in Rio de Janeiro – both of which demand new infrastructure for telecommunication, transport and general market.
Panalpina Brazil consolidated its position in the aerospace sector, extended its Supply Chain Management Solutions and was honored as “Best Operational Service Supplier” and “Best Supplier of the Year”.
New temperature controlled services were implemented, anticipating the healthcare industry’s growing demands, which have seen an enormous surge in imported and internally manufactured pharmaceutical products.
Growth in Logistics, pushed by automobile spare parts and telecommunications operations in Brazil. A stateoftheart warehouse management system was implemented in all warehouses in Brazil, allowing us to deliver highquality and efficient services to our customers.
outlookGrowth of crude oil production outpacing the entire world market is expected to continue in 20142015. Automobile manufacturing should also keep its high growth rate leading to a substantial influx of reshoring or nearshoring activity. A further increase of volatility in the air freight market might impact mature markets such as the US. The United States continues with various port expansion projects to accommodate the introduction of super vessels. In turn this will most likely drive more demand towards the ocean freight forwarders.In Canada the proposed pipelines to the west and to the US could have a significant impact on shortterm infrastructure growth. Panalpina will take advantage from freight that originates from or is destined to the industry surrounding the oil sand exports. South America and its developing economies, which were the driving force in the past five years, are slowing down. Latin America's combined economies are expected to grow by 3.0 % in 2014, one of the lowest growth rates in recent years.
Moving ever closer to customers – The Panalpina Group has realigned its regional setup and introduced a fourth region consisting of the Middle East, Africa and the CIS (MEAC). Here is a look at the performance of this new region along with all the others in the world of Panalpina.

20Performance by Region
Panalpina Annual Report 2013
AsiA PAcific
market situationThere was slow market demand in Air Freight for the first eight months of the year, but much stronger demand towards the traditional yearend peak season. In terms of capacity, many carriers have adjusted to better reflect current market conditions. China continues to be the biggest market in Asia Pacific. Panalpina’s Logistics footprint is still relatively small. Panalpina will establish its business in niche markets to avoid competition with lowcost competitors. The global ocean trade forecast for 2013 was lowered from 4.5 to 3.8% in May 2013, primarily due to weaker Chinese trade growth, which in turn reduced figures across Asia.
highlights After two years of reduced volume, total air freight volumes (both imports and exports) grew by almost 8%, with strong growth from IntraAsia and AsiaLATAM trades.
Volumes and market share grew in traditionally weaker markets such as Thailand, Japan or Korea. Red Prairie was successfully implemented in Malaysia, marking its first use in Asia. Expansion of a logistics facility in Singapore, from 4000 sqm to 26,000 sqm. Solid ocean freight growth on IntraAsia trade lanes. Implementation of 26 new direct LessthanContainer Load (LCL) services in Asia.
outlook2014 is expected to remain highly volatile and uncertain in view of airlines undertaking massive capacity rationalization. Buy rates will remain unstable and unpredictable, characterized by multiple short term spikes. Carriers will also continue to rationalize and remove capacity in view of the losses they have sustained over the last few years. In terms of market outlook, IntraAsia is expected to remain stable, though Transpacific and FEWB are expected to remain volatile in view of the uncertain economic outlook in both markets. The need for innovation remains high, especially regarding valueadded services that enhance supply chains.
eURoPe
market situationIn the European Union, GDP stagnated in 2013 after a decline in 2012. Across the euro area, the economic situation has not improved and unemployment rate remains very high with the exception of Germany. Pressure on margins and rate volatility remained high in ocean freight and air freight. The generally poor economic situation, and a drop in consumption in SouthEuropean countries, led to negative development in freight volumes on European routes. Inbound trades from Asia saw high volatility and pressure on ocean and air freight rates. Volume has grown and Panalpina succeeded to counter the market trend. Export volumes have grown from Europe to Asia based on Panalpina’s strategy to invest in new market segments, e.g., secondary raw materials. Especially in the fields of oil and gas, healthcare and automotive where Panalpina could win market share.
highlights Luxemburg/Frankfurt gateway optimized transit times and pricing as well as the utilization of Panalpina’s own controlled air freight capacities.
Restructuring of overland business helped to counter the negative market trend in Europe. Very successful implementation of new business in Azerbaijan, Turkey and Middle East in oil and gas and other major industry verticals.
Restructuring of geographies and reduction of overhead cost led to steady improvement of bottom line. Strong growth in the ocean Far East westbound trade through focused sales approach. New logistics opportunities and end–toend business was acquired and implemented.
outlookMuch like in 2013, the Baltic States will yield the strongest growth in 2014. The main impact on the euro area’s recovery will be a combination of growth in Germany together with a modest return to growth in Italy and Spain. Outside the euro area, Sweden and Britain are expected to show promising GDP growth in 2014. A clear product organization, and focused marketing and sales teams, will facilitate the uplift in demand and help to market all products more effectively. The margin pressure and volatility will not change in the near future. The new regional organization is able to react faster to challenges in all markets and trade lanes.
21Performance by Region
Panalpina Annual Report 2013
middLe eAst, AfRicA And cis
market situationGeneral market conditions in the Middle East were mixed in 2013. A number of countries were severely impacted by the Syrian conflict, which also disrupted the overland services from Europe to the southern part of the Middle East. Other countries were impacted by domestic conflicts, including Egypt and Bahrain, or global trade embargos, as in the case of Iran and Syria. Some countries, including Saudi Arabia and Iraq, developed positively due to large investments in infrastructure to support the oil and gas and petrochemical industry. However, conditions remained very challenging even within these countries due to severe congestion at ports and airports. Overall the UAE developed positively due to growth in the domestic market as well as growth in the need for logistics hub services in Africa.
highlights Large growth in volumes, GP and EBIT. Turnaround in Turkey from loss in 2012 to positive EBIT in 2013. Established fully owned Panalpina operating entities in Iraq (Basra and Erbil). Obtained Saudi Arabian General Investment Authority (Sagia) approval to open two additional entities in Saudi Arabia (Jeddah and Riyadh).
Significant new business in Saudi Arabia and Iraq. Double digit growth in oil and gas business across the Middle East. Strong growth in ocean and air freight volumes out of Dubai to Europe and Africa.
outlookPanalpina will concentrate on growing its business in the Middle East and Turkey, where the company has a solid foundation and enjoys positive market conditions. The region will streamline its service and customer portfolio in West Africa, and invest in improving its service levels. Organic growth will be the subject in CIS, covering all industrial verticals, while Panalpina will concentrate on oil and gas, projects and telecom in Africa. From a product perspective Panalpina will focus on the development of Dubai as a gateway for air and ocean freight, serving Europe, CIS and Africa. The profitability of the Logistics facilities in Russia and Dubai will be improved by seeking the right customer mix. In Sub Saharan Africa market conditions are good for the oil and gas industry in almost all countries where Panalpina operates.

22Global Network
Panalpina Annual Report 2013
gLobAL netWoRK
Globally local – Panalpina operates a worldspanning network embracing some 500 branches. The comprehensive service is backed by the expertise of local teams who apply their uptotheminute insights on local conditions to deliver any time doortodoor solutions tailored to Panalpina’s customers.
Europe
5760
3974Net forwarding revenue in Million CHF
Fulltime equivalents
Middle EastAfrica
CIS 1631
770Net forwarding revenue in Million CHF
Fulltime equivalents
Americas
Fulltime equivalents4556Net forwarding revenue in Million CHF3114
Head Office
412Fulltime equivalents
AsiaPacific
3651
2789Net forwarding revenue in Million CHF
Fulltime equivalents

23Industry KnowHow
Panalpina Annual Report 2013
indUstRy KnoW-hoW
PAnPRoJects
Panprojects meets the project forwarding requirements of the energy and resources sector, which often involves the transportation of very heavy and oversized loads. It is an important part of Panalpina’s unique product range, together with the oil and gas industry vertical. Panprojects entered 2013 with a strong order book carried forward from 2012, which it added to throughout 2013, with noticeable successes in the liquid natural gas (LNG) and offshore project sectors. Mining stayed strong in Latin America but was less sustainable in other regions with some projects delayed. The Asia Pacific region remains the key growth area with major awards in South East Asia and Australia noted. Ongoing projects in the Middle East and contracts in the North Sea are other key areas of growth. Panalpina’s new Middle East, Africa and CIS region saw expansion in the Caspian sea area that will continue in 2014 and beyond. Africa is a key target for 2014 with some key awards in the pipeline at the end of 2013. Shale and crackingrelated projects in the US also drive business with domestic LNG plant construction awards in hand. Overall 2013 was a strong year for Panprojects.
oiL And gAs
For more than five decades, Panalpina has proven its commitment to the oil and gas industry with a focus on servicing the highly demanding upstream part of the business (exploration and production). Due to a stable oil price, investments in oilfield expansions, exploration and productions continue to be steady. Because of high capital expenditure requirements for tools and equipment, transport and logistics costs remained under pressure. Panalpina strengthened its position in the oilfield service sector, and continued to penetrate the drilling and deep water sector in 2013. The Panalpina’s oil and gas operations are setting the standard for compliance in the respective industry and are regularly consulted by major oil companies.
teLecom
The growing importance of highbandwidth mobile services, anytime and anywhere connections, video communication and mediadriven entertainment have caused significant investments in wireless telecommunications infrastructure – and this will only continue. There are increased market activities in telecom: emerging markets are expanding their networks while established economies upgrade to 4G technology. By 2107 there will be over one billion fast LTE (Long Term Evolution) connections in the world, representing approximately 12% of all mobile phone connections (around 8.3 billion connections). In the next two years, this segment will grow by 20% per annum, with overproportional growth in Asia and Latin America. Panalpina is well positioned to support that growth. In Latin America, for example, Panalpina has established light assembly (Semi Knock Down) infrastructure for an Asian network account for speedy reaction to market demands. This setup is a benchmark model that can easily be replicated elsewhere.
hi-tech
The PC market continues to decrease while tablet and smartphone use grows. For forwarders, this means smaller and lighter cargo, hence less profit. Clients are more and more interested in endtoend solutions with valueadded logistics. With IT spending for business solutions remaining flat and a growing trend to the bringyourown devices strategy, it is expected that IT spend in 2014 will grow by 4%, twice the amount in 2013. The hitech industry is still a very competitive environment where differentiation and reliable performance is king. To save money, air freight volumes are reduced and shifted to ocean freight. Panalpina continues to build relationships with small and mediumsized enterprise accounts, and it focuses its internal mindset on profitable business.
Comprehensive expertise and tailor-made solutions – Panalpina provides this knowhow to nine industry verticals, plus its special Panprojects product. In 2013 these ten verticals further strengthened their knowhow and gained new business. As of 2014, Oil and Gas and Panprojects will be managed as distinct products and no longer as industry verticals because of Panalpina’s marketleading knowhow in both fields.

24Industry KnowHow
Panalpina Annual Report 2013
heALthcARe
Healthcare remains one of the company’s fastest growing industry verticals. There is continual cost pressure on the pharmaceutical and medical device industry, due to governmental attempts to cut healthcare cost across the globe. The empty pipelines in pharma and higher generic competition increase the pressure on businesses. Pharmaceutical market growth has slowed in mature markets to 23% only, while “pharmerging” markets continue to show doubledigit growth, especially in China. Regulations are expanding everywhere and getting stronger, while GDP compliance must be guaranteed. Panalpina will continue to pursue GDP certification at its logistic hubs. As with hitech, healthcare companies are reducing their logistics spend by shifting from air to ocean freight. Meanwhile, the efficiency of logistics solutions are more and more in focus (visibility, control, innovations, quality, planning, cost). Network optimization is required now more than ever.
mAnUfActURing
Panalpina provides transportation and logistics services that make manufacturing companies’ supply chains leaner and more agile. In return, Panalpina’s customers achieve the necessary flexibility to effectively manage their clients’ complex supply and demand. Panalpina’s competition is very comfortable in this vertical because the big players are very open to new ideas and concepts. All the traditional manufacturing markets are strong and manufacturing has rampedup globally, with the focus on Asia Pacific and the Americas. Market conditions do not change very quickly in this segment, therefore the outlook will not change for years to come. Panalpina has noticed a strong tendency to source domestically, but that is a slow process. Manufacturing customers are attempting to mimic best practices from the automotive industry, which opens up attractive opportunities for Panalpina to use its expertise in the Automotive vertical. A global restructuring of resources in manufacturing as well as in automotive is ongoing. Indications for the agriculture segment show very positive development over the next few years, especially in emerging markets, such as Africa.
AUtomotive
Panalpina’s operations in the automobile industry include the shipment of production materials and finished products across the globe. The vast majority of such cargo is transported by sea, but the industry continues to rely on regular air freight services to handle special loads, spikes in demand or urgent shipments. In 2013, the conditions in the automotive industry improved on 2012 and growth is expected to continue through 2014. Certain regions developed quite differently; a weak economy in Europe, accompanied by high petrol prices and an ageing population, puts a heavy burden on all massmarket carmakers, while the automotive industry in America is booming. Growth in China remained strong and progress is expected to continue. Panalpina’s automotive business picked up globally but at a slow pace. The new management team focused on solution selling rather than transactional business.
chemicALs
In the chemicals business environment, customers require dependable, ontime delivery from their suppliers. The chemicalgoods supply chain is very complex, leading to increased logistics and transport spend due to tighter security controls, environmental aspects, and increasing regulatory requirements. Customers are generally price sensitive and only switch their focus onto solutions once low prices are secured. In general, chemicals are highly reactive to changes in the world’s regional GDP. Therefore, worldwide chemical production grew in 2013 but was weighed down by Europe with strongly declining freight volumes. Nevertheless, the chemicals market bears huge potential for Panalpina across all regions, especially in Asia. Flows of chemical products touch all major trade lanes. Panalpina’s managed solutions in ocean freight are well received by the chemical industry. As for air freight, the chemical industry depends on cargoaircraftonly (CAO) products because most of the cargo is not allowed on passenger flights, for security reasons. With its own controlled network, Panalpina is well positioned to meet these growing demands.
consUmeR And RetAiL
This industry vertical is in an exciting phase right now; in line with technical developments and tablet launches, ecommerce is booming and consumers are quickly finding new channels to meet their buying needs. This has a massive impact on supply chains in terms of visibility, reliability, operational excellence and consolidation to ensure commodity is properly spread between the different retailing

25Industry KnowHow
Panalpina Annual Report 2013
channels. To counter changing buying behaviors while supporting fastmoving consumer goods (FMCG) and helping retail companies to navigate the multichannel environment, Panalpina has developed better endtoend visibility and optimization tools to ensure efficient consolidation of cargo flows. Its investment in a new order management tool secured new business, predominantly with mediumsized retailers. Despite the slow market, Panalpina’s consumer and retail vertical performed well, with 10 % growth, outperforming the market. The achievement is the result of a focused sales approach towards global FMCG giants, plus some major furniture and big box retailers.
fAshion
Fashion brands are fighting for perception more than ever in a world with an everincreasing number of buying channels. In a multichannel retail environment, a new brand experience is just a click away. Additionally, the world’s buying power is rapidly increasing and by 2020 one billion additional middleclass people will populate these channels. In line with increasing global buying power, the fashion industry is growing rapidly – not least are luxury brands. Historically, fashion is a strong industry vertical for Panalpina. The company will develop fashion competence centers to leverage on its experience and meet future demands. The ambition is to build endtoend solutions for fashion customers that give a high degree of visibility, out and inbound logistics solutions, plus finalmile delivery. The current business environment is marked by a recession in many European countries, which has led to slow development in Asia. Even though the US is experiencing stronger growth, Panalpina had a weak year in the industry, mainly because of its high dependency on European fashion retailers. Eroding margins in air freight was another clear reason for slow growth.

26Compliance
Panalpina Annual Report 2013
comPLiAnce
Panalpina’s corporate culture evokes shared values, crosscultural understanding and ethical behavior based on fairness, respect and responsibility in all its dealings – both inside and outside the company. Its Code of Conduct is central to Panalpina’s business success and enhances its reputation as a company that takes ethics and compliance seriously.
Recognizing the importance of employees understanding how their actions contribute to the success of the company and the condition of their workplace, Panalpina expanded its Code of Conduct in 2012. The intention was to further emphasize the need for employees to show the highest standards of ethical conduct and acceptable behavior. This new Code of Conduct has been instrumental in supporting Panalpina’s goal to fully integrate its values across the company and influence the actions of its employees.
With an emphasis on committing to performance, integrity and professionalism, the Code focuses not only on laws and regulations but on expectations of personal conduct. The Code covers detailed information on fostering a positive work environment by valuing diversity, rejecting discrimination and harassment, ensuring fair employment practices, and upholding health and safety measures. Additional chapters of the Code provide guidance on avoiding conflicts of interest, conducting business with integrity (including information on anticorruption practices), ensuring financial integrity, managing the company assets and information and protecting the environment.
Available in 27 languages, the Code is accessible to all employees through the intranet and on Panalpina’s corporate website. Additionally, every employee is trained on the Code of Conduct through a facetoface session with their supervisor. Upon completion of this training, it is requested that each employee provide a signature to affirm their understanding of and commitment to adhere to the standards therein.
This structured training program started in 2012 and ran through 2013 to ensure all Panalpina employees were given adequate training on how to handle difficult situations. When such circumstances arise, employees are encouraged to report breaches of the Code of Conduct to their Human Resources managers or to the Corporate Ethics and Compliance Department. Alternatively, employees are free to report concerns to the Ethics and Compliance Hotline, which is a secure and confidential option for submitting reports at any time anywhere in the world, either by phone or online.
Adhering to strict corporate ethics is a cornerstone of Panalpina’s organizational structure. The Ethics and Compliance Officer reports right to the top, to the CEO and to the Ethics and Compliance Committee of the Board of Directors. Since 2008, Panalpina also conducts training on anticorruption, trade regulation and antitrust matters at various locations. And elearning modules are available as supplements for quick and easy referencing.
To ensure that training and materials make an impact, the Ethics and Compliance Department assessed Panalpina sites in 27 countries in 2013, resulting in visits to 53 offices and interviews with 282 staff. Approximately 13,000 people took comprehensive anticorruption training through elearning sessions, while onsite sessions for management also had 1,146 participants attending 93 sessions.
In addition, Panalpina strives to engage key suppliers in these matters. This effort to ensure honest practices throughout all aspects of its business is complemented by Panalpina’s involvement in the World Economic Forum Partnering Against Corruption Initiative (PACI) as a signatory member for the third consecutive year in 2013.
Performance, integrity and professionalism – Panalpina’s values reflect its strong and unique culture. Panalpina’s employees are proud to be a part of its mission and continually demonstrate their willingness to go above and beyond the call of duty for both the good of the company and its customers.

27Employees
Panalpina Annual Report 2013
emPLoyees
Panalpina’s four strategic human resource (HR) priorities remain at the core of the HR transformation strategy that was established in 2007. These are (1) to identify, attract and retain talented people, (2) to propagate a highperformance organization, (3) to develop leadership and other capability requirements and (4) to design, implement and optimize HR processes, policies, service delivery and resources to be “fit for the purpose”. These four priorities remain the organizing principles behind the ongoing efforts to make Panalpina’s HR team as efficient, effective and integral to its broader business success. A the end of 2013, Panalpina had 16,010 employees in over 70 countries. Its global human resources function is responsible for enabling organizational development so as to secure the high engagement and organizational effectiveness of Panalpina’s employees.
committed to hR transformationHR is committed to aligning its strategy and initiatives to assist the business effectively and efficiently, now and in the future. The transformation continued to focus on the “Business–HR partnership” in Panalpina through workshops and a HR effectiveness survey. In order to best deliver highquality HR services, we have ensured alignment between the HR strategy and business strategy. The HR structures have been adjusted to mirror the new matrix organizational structure of the business to facilitate efficient and effective partnership. HR processes are being continuously improved to effectively support the business and its line managers with the ultimate aim of HR to support attraction, development, engagement and retention of the right people, in the right parts of the company.
efficient human-resource managementIn 2012, the implementation of PanLink as the integrated humanresources information system solution continued extensive rollout in Panalpina. Other countries such as Switzerland, Italy, Austria, France, Turkey, China, Korea, Japan and Taiwan were added to the portfolio with over 6000 employees at the end of 2013 now using PanLink.The Panlink system supports all standard humanresource processes in the area of performance and talent management, and helps to align people to the Group’s strategy and goals. There are several other key elements to the PanLink system, such as the recruiting module that helps to quickly identify the best candidates for an open position, and the succession planning tool, which helps support the development and retention of Panalpina’s employees. In 2013 the recruiting and marketing platform and the learning management system was successfully piloted in USA and Canada. It is expected that by end of 2014 approximately 16,000 employees will be using the complete PanLink suite of tools with all employees having access to some modules.
creating new business leadersTalent management and succession planning to ensure that we have a robust pipeline of business leaders is crucial to our success. Over the past year, Panalpina has successfully attracted some really highprofile people from the competition. From being a company with a very basic HR department seven years ago and no core values, the organization now has a clear sense of its own identity and a concrete strategy for nurturing its employees and future leaders. As a result it has become an exciting and rewarding place to work that attracts some of the best in the business.The company continues to invest a great deal of time and resources in the development of its managers and leadership teams. In 2013, 36 more participants graduated from the “Navigating Our Future” program, Panalpina’s global talent program. This program is offered to highpotential employees in midsenior positions who are willing to pursue an international career. An additional 35 candidates were selected to participate in 2014. Over 225 department heads, team leaders and supervisors participated in three modules of the Steering Success global leadership and managerial skills program. This program is offered in Mandarin, German, French, Portuguese, Spanish, Italian, and English. The program has been strengthened with fresh content and a more refined focus to hone performance management skills.
Creating partnership with the business – Panalpina is committed to achieving its vision and engaging our employees to make this a reality is pivotal. By fostering a culture of transparent communications, customerfocused attitudes to collaborate across the boundaries, and a mindset of continuous improvement, the company will continue to recruit, retain and develop the best and most capable team of employees in the logistics industry.

28
Panalpina Annual Report 2013
In 2013, the four new learning and development programs covering communications, empowerment, performance management and skills were attended by over 500 employees. These programs have been designed globally for local distribution and have been very well received. In 2014, they will be offered in over 10 languages. These programs have created new opportunities to support the development of management and leadership capability within middle management. The sales academy is an important enabler to improve the sales performance across all layers with a focus on fastest and biggest impact. The academy will help identify and develop the right skills for the key sales positions. In 2013, the sales academy rolled out a robust set of programs – over 320 employees attended sessions led on consultative selling, value selling and recruitment of highperformance sales and pipeline management.
harnessing learning technologies to move forwardPanalpina is committed to using technology to ensure the ongoing and long term development of all of its employees. Eventually it is envisioned that we will implement a learning management module once PanLink is fully rolled out. Meanwhile, there are a variety of training opportunities in place for the staff, and all employees are encouraged to take advantage of these programs. In 2013, Pan Academy, Panalpina’s elearning platform, expanded to include 55 learning units offered in over 15 languages. These learning units cover subjects such as the company’s strategic environmental PanGreen initiative as well as operations, product competence, compliance, and refresher courses on code of conduct and anticorruption. Additionally 2013 saw the establishment of PanFilms, the company’s inhouse portal to disseminate key strategic messages and product information across the globe.
transforming the way we reward 2013 has been the year to educate and professionalize our HR people within the countries in the totalreward context, starting with grading all positions to the shop floor, positioning all positions by country, standardizing more and more the benchmarks we use, cascading further down bonus principles and finally looking at total reward including benefits. This process of education and professionalization of compensation and benefits in all countries is half way and will continue throughout 2014. We also prepared some standardization to ensure jobs are evaluated consistently across all countries at all levels and we prepared the rollout of the new country business organization.We also assessed in depth our mobility practices with some amendments to our policy towards operational efficiency of our mobility service, better assessing the need and the business case for our assignments and adapting the policy by assignment type and business needs. The amended policy will become effective early 2014.Further we assessed our reward principles for our top management (Executive Board and Executive Committee) looking at all reward compounds and principles and debated this in the Board of Director’s Compensation and Nomination Committee with an action plan as a consequence which will be rolled out in 2014 and 2015.
Employees

29Information Technology
Panalpina Annual Report 2013
infoRmAtion technoLogy
Panalpina’s IT team focuses on three core concepts: firstly, IT resources must be deployed strategically to support the customer value proposition, which ultimately drives customer loyalty. Secondly, IT must provide integrated tools that improve productivity and efficiency throughout the business. Finally, the IT organization and infrastructure setup must ensure efficient operation while enabling product and service innovation to drive future revenue growth and efficiency.
transforming the it organizationAs Panalpina continues to focus on delivering abovemarket growth and improved profitability, it is important that IT is organized to support that strategy. Furthermore, with the plan to increase the standardization of processes across the company, IT needs to adapt accordingly. As a result, Panalpina’s IT organization was restructured in 2013.
For each Panalpina region, a Head of Business Solutions was appointed to focus on understanding customer needs and defining appropriate solutions, as well as supporting the deployment of standard solutions across the region. To support this improvement in customerfacing capabilities, the position of Head of Customer Systems was created. This role delivers a scalable portfolio of solutions, ranging from locally configured standard products to highly customized solutions, which support everything from general industry verticals through to bespoke customer projects, while continuing to deliver global support for strategic customers.
To drive the increase in productivity required to improve profitability, the Head of TM IT Program supports the implementation of the new transportation management system, while the Head of Productivity Systems manages other critical productivityfocused initiatives.
To ensure the alignment of IT with overall business goals, the Head of IT Governance drives improved governance of IT investments through better financial management, formal IT procurement and enhanced IT processes.
The new position of Head of IT Service Delivery combines IT Operations and Applications Support under one management structure, focusing on improving the integrity of our infrastructure and driving up service levels, while delivering synergies that reduce likeforlike IT operating costs.
improving performance through radical simplificationThe IT team is implementing a backbone of core information systems that is both stateoftheart and robust. This will enable the highspeed flow of information through the organization, facilitating decisionmaking, innovation and revenue generation.
A key component is the ongoing implementation of the transportation management system, which is expected to be completed in 2016. By the end of 2013, the new system and business processes for ocean freight were rolled out to five countries, namely Switzerland, Germany, Italy, Mexico and Singapore, covering 20% of the total ocean freight business. Altogether, roll out activities have started in more than 50 countries and will continue throughout 2014.
In addition, Panalpina is investing to support the growth in its Logistics business through the deployment of advanced warehouse management systems. This project has made significant progress and continued global rollout is expected over the next few years.
hit the road with information securityInformation security is taken very seriously. In recent years, the IT infrastructure has been strengthened by replacing and upgrading security technology, and by updating the Panalpina Information Security Policy. A critical element is Panalpina employees who must adhere to security policy. Awareness campaigns and mandatory elearning modules support these efforts.Also, Panalpina has invested in the strategic upgrading of professional datacenter facilities to significantly improve resilience and disaster recovery capabilities.
IT is key – The ability to collect, process, analyze and present information quickly and accurately enables Panalpina to maximize revenue, reduce costs and, more importantly, provide a worldclass service to its customers.

30Information Technology
Panalpina Annual Report 2013
meeting customer expectationsAnother key element of Panalpina’s IT strategy is to meet information and datarelated customer needs by improving customerfacing systems. This effort will initially focus on specific segments but ultimately will extend throughout the business. With myPanalpina+, a new order management product is introduced that is designed to address the increasing complexity of supply chains, while providing reliability and consistency. Customers benefit from enhanced orderprocessing capabilities, improved visibility, automated exception management and alerts. myPanalpina+ complements the internally developed myPanalpina application, which has proved successful for more than a decade.
outlookIn 2014, Panalpina will continue to improve its IT systems to increase efficiency, support customer needs and drive innovation. The deployment of the transportation management system is key to this effort. Managing costs will remain a focus in the coming year to ensure that limited resources are deployed effectively and IT systems operate at maximum efficiency.

31Procurement
Panalpina Annual Report 2013
PRocURement
Panalpina’s strong relationships with its partners directly impact its ability to maintain the competitive advantages it enjoys and to provide the highest value to its customers. Therefore the selection and management of subcontractors is a carefully managed process, to ensure that these relationships reflect Panalpina’s own values, and will ultimately support the strategic objectives and growth of the company.
As subcontractors play a crucial role in Panalpina’s business, it is imperative that they represent Panalpina well and meet the company’s high expectations regarding quality and ethical business practices. Therefore finding trustworthy partners who are technically qualified to meet the needs of Panalpina’s customers in a costeffective manner is a high priority. Subcontractors must have a proven track record in their business and have exceptional reputations for service and quality. Panalpina assesses potential suppliers based on strict criteria that reflect the company’s expectations in the areas of ethics and compliance, credibility, pricing, quality of service, consistency and performance. Coupled with these distinct selection criteria, Panalpina also recognizes the right of subcontractors to be treated with complete fairness. To this end, the company conducts its selection practices such that all subcontractors are provided an equal opportunity to be awarded contracts, regardless of nationality. Panalpina also does not have a policy to preferentially hire suppliers that are local to its operations. Regardless of a supplier’s location, it’s expected that all the company’s rules and policies are adhered to so that they may remain compliant with all applicable laws and regulations.
Panalpina considers compliance with all applicable laws and regulations as nonnegotiable for itself and for those with whom it does business. This is especially relevant in terms of national and international laws and regulations related to anticorruption, environmental protection, and other legal conditions. Panalpina takes all necessary precautions to ensure full compliance with all laws, including conducting internal audits and compliance audits of subcontractors to ensure that there are no unknown legal risks or liabilities and that there are no actual or perceived violations of any laws or regulations where Panalpina does business.
Growing Business through Partnerships – In its global and assetlight network, partnerships with suppliers are a crucial element of the company’s overall success. Maintaining a collaborative, respectful relationship with its suppliers provides opportunities to find highquality solutions in an extremely dynamic industry.

32Security
Panalpina Annual Report 2013
secURity
To further support its employees, subcontractors, drivers and other key partners, in 2013 Panalpina developed a new online learning program, unique to the logistics industry, to raise the awareness of the dangers facing drivers during transport. The program, which is offered via the internet and in ten languages, highlights best security practices that manage and mitigate risks related to road transport, which are the highest among all modes of transportation.
Panalpina has partnered with Freight Watch International (FWI), a leading freight security services provider. Together, in 2013 Panalpina and FWI developed Standard Operating Procedures for the deployment of FWI’s specialized security devices for cargo shipments. These GPSenabled devices allow Panalpina to monitor the integrity, location and routing of highly vulnerable cargo, from a centralized station in Mexico.
Panalpina employs an integrated approach to security, which includes aligning with customer, government, and industry standards, as well as proactively identifying potential security gaps. If a security breach does occur, Panalpina also has a rapid and comprehensive incident management capability in place. For example, in late 2012 and early 2013, a potential security gap was discovered at a warehouse in Europe. The response to this discovery was robust, and included the direct involvement of the respective Regional Security Manager, cooperating with suppliers and local authorities, to swiftly implement security measures to mitigate this gap.
As we progress into 2014, new challenges will undoubtedly be seen as the security environment changes and new shipping trends evolve. For instance, customers are increasingly opting to ship highly vulnerable cargo by sea. This, in conjunction with new and expanding traffic lanes (which require implementation under tight timeframes), presents challenges. However, in both cases, Panalpina Security will work closely with our internal company partners and customers to address the risks, assess the lanes, and ensure the appropriate security requirements are properly implemented and complied with.
Securing logistics in a high-risk world – Panalpina’s participation in global supply chain requires careful and diligent risk management. A key element of managing risks is ensuring that all points along the supply chain network, including transportation assets and facilities, are properly secured to mitigate security issues and safeguard our customer’s products as they move to their destinations. In 2013, the Panalpina team continued to enhance its security position with the appointment of a Corporate Security Risk Manager, the development and automation of its Security Risk Assessment tool (to allow further qualitative and quantitative analyses to be conducted), and the continuous analysis of processes, procedures and best practices relevant to security management.

33Quality, Health, Safety and Environment
Panalpina Annual Report 2013
QUALity, heALth, sAfety And enviRonment
A team commitmentPanalpina’s Quality, Health, Safety and Environment Policy is based upon the principles of: Customers Management systems Responsibility Training and development Risk management Safe and sustainable transport Environment Awareness Improvement
Employees at all levels of the Panalpina Group are responsible for upholding the quality, health, safety and environmental policies, principles, and objectives of Panalpina and its clients. The Global Head Quality, Health, Safety and Environment – Panalpina’s global Quality, Health, Safety and Environment (QHSE) representative – ensures the implementation and maintenance of all processes needed for the QHSE system globally and reports the performance of the system to the Executive Board. Panalpina Management defines the overall goals of the HSE plan, appoints responsibilities, provides the authority and necessary resources for implementation, assesses performance against the goals, and takes corrective actions as appropriate.
certifications and standards Provide a guideInternationally accepted standards, certifications and sectorspecific guidelines provide a common framework for training, auditing and assessment, and facilitate communication across wide geographic regions and cultural differences. The company is globally certified according to the health and safety standard OHSAS 18001, and all offices worldwide are certified according to the environmental management standard ISO 14001 and quality standards ISO 9001. In addition to these standards, Panalpina is a signatory to or participant in a variety of frameworks and guidelines specific to the logistics industry. These include the CustomsTrade Partnership against Terrorism (CTPAT), GDP (Good Distribution Practice for pharmaceutical products), and CSI/AMS.
Strong Commitment – Quality, health, safety and environmental protection are matters of the utmost importance to Panalpina’s customers, employees, shareholders and management team. As an organization committed to continuous improvement and learning, Panalpina’s management, employees and subcontractors are ceaselessly focused on always improving and expanding upon efforts to ensure the quality of the products delivered, to the health and safety of its stakeholders and to the care and respect for the environment. These efforts, which extend throughout the organization, are coordinated through Panalpina’s Integrated Management System (IMS), where all relevant organizational and operational aspects of Panalpina are documented. The international standards of ISO 9001, ISO 14001 and OHSAS 18001 are all key elements to the integrated management approach, which enables the Quality, Health, Safety and Environment teams to identify risks, and measure and analyze performance to ensure the quality of the operational service delivered to customers.

34
Panalpina Annual Report 2013
Risk management is KeyPanalpina regularly submits to a variety of risk assessment processes, both internal and external, to identify areas where risks exist, and to plan appropriate mitigation measures. In 2013, 145 internal and external QHSE audits were performed at Panalpina facilities. This willingness to submit to rigorous assessments of our performance on an ongoing basis helps to keep all staff members constantly alert to quality, health, safety and environmental issues.
Based on the results of these audits, targeted programs are implemented to support healthy working conditions and hygienic workplaces, reduce risk exposure associated with the handling, storage and transportation of cargo, and enforce the use of personal protective equipment where conditions require it.
Panalpina operates Health and Safety programs in five key areas: Health control Safe transport Personal protective equipment (PPE) Permission to work Emergency response program (ERP)
Panalpina’s employees are the focal point of all quality, health, safety and environment initiatives. Therefore their training is central to the success of these programs. In 2013 a variety of new training initiatives were launched that focused on the health and wellbeing of Panalpina’s employees. These included courses on subjects such as physical health, stress management and nutrition. A course was also launched that provided refresher training for Panalpina employees regarding the corporate sustainability program, PanGreen.
safety is coreIn 2013, zero fatal accidents and 119 nonfatal accidents which required some sort of medical treatment were reported. Globally, there are more than 40 Health, Safety and Environment representatives in place at Panalpina, who provide guidance and assistance to the senior management on HSE issues. Internal audits are performed by more than 100 trained auditors and 2,327 onsite inspections were carried out in 2012.
Recognition for PerformancePanalpina’s high commitment to highquality service result is frequently recognized by awards given by various customer, trade and other organizations. For example, in 2013 Huawei presented Panalpina with its Golden Award noting its importance as a strategic partner for Warehousing and National Distribution. Embraer gave its Best Operational Service Supplier and Best Supplier of the Year award in 2013. Finally, on a more localized basis, VCP Airport in Brazil gave Panalpina recognition with the Best Freight Forwarder award last year.
Panalpina is particularly proud of the strong relationships it has with its workforce in the countries where it operates. For example, in 2013, Panalpina received the Good Labor Practices award in the category for Channels of Communication and Participation of workers in management of the company. This was a nationwide competition in Peru, organized by the Ministry of Labor, which recognized Panalpina’s efforts to solicit the input of the workforce into management processes, and develop mechanisms to enhance the interactions between workers and management.
Panalpina is also regularly recognized as a top producing agent by many of the world’s leading airlines. 2013 was no different, with the company being recognized for its efforts by Singapore Airlines, Gulf Air, Phillipines Airlines and Qatar Airways. The Panalpina team was particularly pleased to receive a merit award in Singapore recognizing the team’s efforts to support the 2013 Eco Action Day in Singapore. While Panalpina views its success primarily due to its effective teamwork, there were some individual recognitions given to Panalpina staffers in 2013, including America’s Young Freight Forwarder award and the Canadian Young Freight Forwarder award.
Quality, Health, Safety and Environment

35
Panalpina Annual Report 2013
environmental initiativesIn 2013, Panalpina continued the development of the PanGreen program, a global program for green solutions and an integral part of its strategy for sustainable growth. Each element of this program, including Modal Shift, Cargo Consolidation, HazMat, and EcoConsumption, is designed to minimize the impact from Panalpina’s operations, and importantly, the impacts of the services provided to customers. Panalpina’s customers are increasingly aware of and asking for data related to the impacts attributable to the transport of their goods by Panalpina. In 2013, several programs were launched to directly address these requests.
Panalpina has developed an integrated platform, based on the stateoftheart EcoTransIT tool, which calculates emissions for each shipment including pre and oncarriage movements based on distance, weight, transport mode, and the type of vessel or aircraft. All necessary shipment information is sent from Panalpina’s communication platform to EcoTransIT servers where sophisticated algorithms are applied to calculate CO2 emissions and other parameters according to the global reporting standard EN 16258. Starting in early 2014, Panalpina will automatically run reports on behalf of its customers, and provide this information to them so they can develop effective strategies to reduce the environmental impacts of their global transport chains.
In late 2013, Panalpina launched the first completely paperless round trip route for general air freight. An industry first, Panalpina uses its own 7478 freighter planes to now offer and operate several efreight porttoport services to Europe, Hong Kong and the US. More than 7,800 tons of paperwork is transported each year, simply to provide documentation for the cargo on board the aircraft. Much of this paperwork can now be replaced with standardized electronic messages, eliminating dependency on paper air waybills, invoices and packing lists. The company is expanding this program each month, and aims to eliminate 80% of the document pouches for all general air cargo on Panalpina controlled flights or on commercial aircraft by 2015.
environmental PerformanceIn 2013, Panalpina continued its regular collection, and analysis of energy, environment, waste generation and material usage data from across the organization. This is consistent with the integrated approach taken for Quality, Health, Safety and Environment management, and allows for course corrections and adjustments to the approaches taken when opportunities to improve present themselves.
Such data includes: Electricity consumption Fuel consumption Heating consumption Water consumption Business travel Paper consumption
A key element of PanGreen, Panalpina’s corporatewide sustainability program, is the commitment to collect, compile, and monitor progress against key environmental impact indicators in a harmonized manner across all countries where it operates. By collecting this baseline data in an ongoing manner, Panalpina can continuously identify ways in which its performance is consistent with the goals it has established, and also find areas where more attention and effort may be required.
In 2013, total electricity consumption decreased slightly, while heating energy increased significantly by 46%. The sharp increase in heating energy was primarily due to climatic conditions in several key locations where winter temperatures were far lower than usual. Vehicle fuel consumption increased slightly by 6%. Overall CO2 emissions also increased by 6%, with most of that increase attributable to increased heating energy and the corresponding 13% increase in direct (Scope 1) CO2 emissions. In addition to that, Scope 3 CO2 emissions from business travel increased by 19% as business travel increased as the global economic condition continued to improve. Scope 2 emissions from indirect energy usage remained essentially level between 2012 and 2013. In 2013, there were 4.0 tons of CO2 equivalent emissions per fulltime equivalent. Other environmental indicators collected include paper consumption which remained level between 2012 and 2013 despite increased business activities and water consumption which increased significantly, again primarily due to weather and climatic conditions in the areas of key Panalpina facilities. In general, the observed changes can be primarily attributed to fluctuations in weather patterns in the areas where Panalpina has significant operations, general improvement in the global economic situation and continuously improving data collection efforts.
Quality, Health, Safety and Environment

36
Panalpina Annual Report 2013
The table gives an overview of the environmental performance figures collected in 2013 across Panalpina’s global internal operations.
ACTIVITIES 1 PERFORMANCE INDICATOR UNIT 2013 2012
Energy and CO2
Electricity Consumption Terajoule 240 242
Heating Overall consumption Terajoule 119 81
District heating District heat Terajoule 15 9
Vehicle fuel Consumption (Panalpinaowned and lease vehicles only) Terajoule 176 166
CO2 emissions 2 Total emissions Tons 62,780 58 ,756
Direct (Scope 1) Tons 18,673 16, 510
Indirect (Scope 2) Tons 33,278 33 ,172
Indirect (Scope 3, business air travel) Tons 10,829 9 ,074
Relative emissions per FTE Tons/FTE 4.0 3.9
Materials
Paper Consumption Tons 1,048 1 ,048
Water Consumption m3/1000 435 366
1 For each indicator, data accuracy from many contributing countries was improved compared to the previous year. Several data gaps could be closed.2 CO2 emissions were calculated according to guidelines of the Greenhouse Gas Protocol. Emission factors for direct emissions were taken from IPCC, 2006. Emission factors for indirect emissions were taken from the International Energy Agency (IEA) and from the UK Department for Environment, Food and Rural Affairs (Defra).
Quality, Health, Safety and Environment
energy balance by energy categoryGigajoule
280,000
240,000
200,000
160,000
120,000
80,000
40,000
0
Electricity
221,000
18,000
Heating
15,000
104,000
Owned vehicles
175,000
Indirect renewable energy Indirect energy Direct energy
co2 emission by scope and activityTons of CO2 equivalent
35,000
30,000
25,000
20,000
15,000
10,000
5,000
0
Indirect CO2 emission Direct CO2 emission
30,939
Electricity
5,998
2,338
Heating
12,675
Owned vehicles

37Social Commitments
Panalpina Annual Report 2013
sociAL commitments
flights for UnicefPanalpina has used one of its Boeing 7478 freighters to fly desperately needed relief goods to the Central African Republic (CAR). The 100 ton load was organized in partnership with the United Nations Children’s Fund (UNICEF) and the donated charter flew from Luxembourg to Bangui, the nation’s capital, on December 18.
UNICEF had reminded the world that, with increasing numbers of people displaced by violence across the Central African Republic, the need for relief is growing constantly. According to UNICEF, the CAR is facing a dire humanitarian situation that affects the entire population of 4.6 million people. Gross human rights violations take place almost daily and include the destruction and looting of hospitals, schools, homes and churches.
UNICEF’s relief goods delivered to the CAR included hospital supplies and equipment, medicines, clothes, tents, sleeping mats, bed nets, blankets, water containers, soap and cooking sets. The idea for the Panalpina chartered flight came about when discussing the company’s traditional Christmas giftgiving for its customers and employees.
ten years of successful partnership with the Red crossPanalpina has been involved in a longterm partnership with the Swiss Red Cross since 2003 to combat povertyrelated blindness in Northern Ghana. The organizations provide patients with access to basic eye care treatment, which prevents blindness in many cases. Cataracts are endemic in Ghana and throughout the region of West Africa on the southern edge of the Sahara. Eye disorders are rife due to vitamin deficiencies, sandy desert wind and challenging hygienic conditions. Poverty, coupled with a shortage of eye care professionals, makes it difficult for sufferers to find suitable treatment locally.
“vision first”: transition to independencePanalpina’s annual contribution to the Vision First program runs to CHF 200,000, equivalent to a quarter of the project costs. Panalpina has been involved throughout its pilot and ontheground implementation phases. The project has now entered the stage of completion. The Swiss Red Cross handed over the facilities to the local organization in 2013.
Regional commitmentPanalpina and its employees seek to make a difference. Their social commitment ranges from participation in fundraising drives to volunteer work at social facilities. Panalpina Panama took part in a video competition on the early detection of breast cancer, creating the film “Passion for Hope.”
Responsibility towards society – Panalpina has a wide range of social commitments. In 2013, Panalpina flew UNICEF relief goods to the Central African Republic. Since 2003, the company has been supporting the Swiss Red Cross' “Vision First” program in Ghana, which fights preventable blindness and has now been completed. On top of this, Panalpina’s regional business units are involved in many local projects.

coRPoRAte goveRnAnce ⁄
comPensAtionRePoRt
contents
Corporate Governance 39–50
Compensation Report 51–61

Panalpina Annual Report 2013
39Corporate Governance
coRPoRAte goveRnAnce
Panalpina is committed to a transparent management structure that is governed by international principles. This Corporate Governance Report complies with the Directive of the SIX Swiss Exchange and therefore provides investors with the corresponding key information.
gRoUP mAnAgement stRUctURe
chief finAnciAL officeRRobeRt eRni
chief hUmAn ResoURces officeRAlAstAiR RobeRtson
chief LegAL officeR ChRistoph hess
chief infoRmAtion officeR Rod Angwin
chief commeRciAL officeRKARl weyeneth
boARd of diRectoRs
chief execUtive officeRpeteR UlbeR
inteRnAL AUditD. TREFZER
mARKeting & sALessven hoemmKen
eURoPevolKeR böhRingeR
AmeRicAsFeRdinAnd KURt
AsiA PAcificsteFAn KARlen
middLe eAst ⁄ AfRicA ⁄ cispeteR tRiebel
AiR fReightlUCAs KUehneR
oceAn fReightFRAnK heRCKsen
LogisticsmiKe wilson
PRoJectsChRis Kent
oiL & gAspeteR UlbeR A. i.
comPLiAnceM. HEYER
coRPoRAte deveLoPmentR. MECATTAF
commUnicAtionsR. WEIHOFEN
Executive Board
+ Executive Committee (ExCom)

Panalpina Annual Report 2013
40Corporate Governance
1 gRoUP stRUctURe And shARehoLdeRs 1.1 gRoUP stRUctURe 1.1.1 operational group structure
Panalpina’s business activities are primarily regionally oriented. As per Q4 2013 the operating structure is divided into the following four regional segments:
– Americas (North, Central and South America) – Asia Pacific – Europe – MEAC (Middle East, Africa and CIS)
Secondary, the business activities are subdivided into the following business segments: – Air Freight – Ocean Freight – Logistics (valueadded services, distribution solutions)
Supplementary information can be taken from the segmental reporting section of the Consolidated Financial Statements (pages 63–140).
1.1.2 Listed companies within the scope of consolidationPanalpina World Transport (Holding) Ltd. (PWT), the ultimate holding company of the Panalpina Group, is the only listed company within the scope of consolidation. PWT has its registered office in Basel, Switzerland. The PWT shares are exclusively listed on the SIX Swiss Exchange. The market capitalization on the closing date amounted to CHF 3.55 billion (23,750,000 registered shares at CHF 149.50 per share).
The PWT shares are traded under Valor no. 216808, ISIN CH0002168083, symbol PWTN.
1.1.3 nonlisted companies within the scope of consolidation The main subsidiaries and associated companies are disclosed in the Consolidated Financial Statements (pages 63–140) itemized by registered office, nominal capital, equity interest in percent, investment and method of consolidation.
1.2 significAnt shARehoLdeRs On December 31, 2013, the Ernst Göhner Foundation, Zug, Switzerland, is the main shareholder of PWT, with an equity participation of 45.9%.
Cevian Capital II Master Fund LP held a share capital of 12.3% on closing date. Other significant shareholders according to their most recent disclosure notices are Artisan Partners Limited Partnership (≥5%%) and Janus Capital Group (≥3%). During the reporting year the following disclosure notices (listed by shareholders and transaction date) were filed on the SIX online publication platform:
Artisan Partners4 Mar 2013 increase of share ownership to 10.00 %5 Mar 2013 decrease of share ownership to 9.99 %12 Mar 2013 increase of share ownership to 10.05%8 Aug 2013 decrease of share ownership to 9.99%10 Sep 2013 increase of share ownership to 10.08%20 Sep 2013 decrease of share ownership to 9.93%
Bestinver Gestion, S.A. SGIIC8 Aug 2013 decrease of share ownership to 4.90%1 Nov 2013 decrease of share ownership to below 3%
Janus Capital Group1 Nov 2013 increase of share ownership to 3.01%

Panalpina Annual Report 2013
41Corporate Governance
1.3 cRoss-shARehoLdings No crossshareholdings exist between PWT and any other company.
2 cAPitAL stRUctURe 2.1 cAPitAL
On the closing date, the ordinary share capital of PWT amounted to CHF 2,375,000 and is divided into 23,750,000 registered shares, with a nominal value of CHF 0.10 each.
2.2 AUthoRized And conditionAL shARe cAPitAL The extraordinary Shareholders’ Meeting of PWT held on August 23, 2005 agreed with the Board of Directors’ proposal to create an authorized share capital up to a maximum aggregate amount of CHF 6,000,000 by issuing a maximum of 3,000,000 registered shares with a nominal value of CHF 2.00 each. At the Shareholders’ Meeting of May 10, 2011 the authorized share capital was renewed at the same value until May 2013. At the Shareholders’ Meeting of May 8, 2012, the authorized share capital was reduced in conjunction with the reduction of the share capital (see section 2.3 below) to a maximum aggregate amount of CHF 300,000 by issuing a maximum of 3,000,000 registered shares with a nominal value of CHF 0.10 each. At the Shareholders’ Meeting of May 15, 2013, the authorized share capital was renewed at the same value until May 12, 2015.
The Board of Directors is authorized to exclude the preemptive rights of shareholders and to convey them to third parties, provided that such new shares are to be used for the takeover of entire enterprises, divisions or assets of enterprises or participations or for the financing of such transactions. The Board of Directors has not yet made use of this authorization.
No decision has been made regarding the creation of conditional capital.
2.3 chAnge in cAPitAL oveR the PAst thRee yeARs At the Annual General Meeting of May 8, 2012, the share capital was reduced from CHF 50,000,000 to CHF 2,375,000 by way of cancellation of the repurchased 1,250,000 shares and further reduction of the nominal value per share from CHF 2.00 to CHF 0.10 each. No changes were made during the reporting year.
2.4 shARes And PARticiPAtion ceRtificAtes On the closing date, 23,750,000 fully paidin PWT registered shares with a nominal value of CHF 0.10 each were issued. On this date, no participation certificates were issued.
2.5 dividend-Right ceRtificAtes On the closing date, no dividendright certificates had been issued.
2.6 LimitAtions on tRAnsfeRAbiLity And nominee RegistRAtions 2.6.1 Limitations on transferability for each share category; indication of statutory group
clauses and rules for granting exceptions Acquirers of PWT shares are entered into the share register as shareholders with voting rights upon provision of proof of the acquisition of the shares and provided that they expressly declare that they hold the shares in their own name and for their own account.
The Articles of PWT specify that any shareholder may exercise voting rights to a maximum of 5% of the total number of shares recorded in the commercial register. This limitation for registration in the share register shall also apply to persons who hold shares fully or in part through nominees within the meaning of the Articles. Furthermore, this limitation for registration in the share register also applies to registered shares that are acquired through the exercising of preemptive rights, warrants and conversion rights. The Board of Directors is empowered to allow exemptions from the limitation for registration in the share register in particular cases.
The Articles make provision for group clauses.
The limitations on transferability do not apply to the shares held by the Ernst Göhner Foundation because it held PWT shares prior to the implementation of the limitations (socalled grandfathering).

Panalpina Annual Report 2013
42Corporate Governance
2.6.2 Reasons for granting exceptions in the year under review No exceptions were granted during the reporting year.
2.6.3 Admissibility of nominee registrations; indication of any percent clauses and registration conditions The Articles of PWT specify that the Board of Directors may register nominees with voting rights in the share register up to a maximum of 2% of the share capital recorded in the commercial register. Nominees are persons who do not expressly declare in their application that they hold the shares for their own account and with whom the company has entered into an agreement to this effect.
The Board of Directors is empowered to register nominees with voting rights exceeding 2% of the share capital recorded in the commercial register as long as the respective nominees inform PWT of the names, addresses, nationalities (registered office in the case of legal entities) and the shareholdings of those persons for whose account they hold 2% or more of the share capital recorded in the commercial register.
The Articles make provision for group clauses.
2.6.4 Procedure and conditions for cancelling statutory privileges and limitations on transferability A resolution of the General Shareholders Meeting of PWT on which at least twothirds of the voting shares represented agree is required for any abolition or change of the provisions relating to transfer limitations.
2.7 conveRtibLe bonds, WARRAnts And oPtions There were no convertible bonds outstanding on the closing date.
The only issued options relate to the share and option participation program (Management Incentive Plan, MIP) are for currently 470 senior managers of Panalpina. As of 2009, the Board of Directors and the Executive Board have been excluded from participation in this program. As of 2011, the options under the MIP program have been replaced by a free share ratio scheme. Please refer to page 59 in the Annual Report.
3 boARd of diRectoRs 3.1 membeRs of the boARd of diRectoRs
At the Annual General Meeting of May 15, 2013, Ilias Läber was elected and Rudolf W. Hug, Beat Walti, Chris E. Muntwyler, Roger Schmid, HansPeter Strodel and Knud Elmholdt Stubkjær were reelected to the Board of Directors for a oneyear term, whereas Lars Förberg stepped down from the Board.
On the closing date, the Board was composed of seven persons.
Three members of the Board of Directors (Rudolf W. Hug, Roger Schmid and Beat Walti) are also members of the Board of Trustees (Stiftungsrat) of PWT’s main shareholder, the Ernst Göhner Foundation.
Ilias Läber is a member of the Board of Directors of Cevian Capital AG, the Swiss office of PWT’s secondlargest shareholder.
The biographies of the members are as follows:
Rudolf W. Hug, Chairman. Swiss citizen. Born in 1944. Reelected in 2013 (until 2014).
Rudolf W. Hug holds a PhD in law from the University of Zurich and an MBA from INSEAD, Fontainebleau (France). In 1985, he participated in the Executive Program of the Graduate School of Business at Stanford University. From 1977 to 1997, he worked in several positions for Schweizerische Kreditanstalt (today Credit Suisse). During the period from 1987 to 1997, he ran the international division and served as a member of the Executive Board of Credit Suisse and Credit Suisse First Boston. Since 1998, Rudolf W. Hug has been active as an independent management consultant.
Rudolf W. Hug has been a member of the Board of Directors since 2005 and was appointed Chairman of the Board of Directors on May 15, 2007, following the retirement of his predecessor.

Panalpina Annual Report 2013
43Corporate Governance
Beat Walti, Member of the Board of Directors since 2010. Swiss citizen. Born in 1968. Reelected in 2013 (until 2014).
Beat Walti holds a PhD in law from the University of Zurich. From 1998 to 2001 he was working as a consultant and engagement manager with McKinsey & company in Zurich. In 2001, he was a cofounder and project manager of a startup company in the healthcare sector. Since 2002, Beat Walti is a lawyer with Wenger & Vieli in Zurich specializing in corporate, commercial, contract, competition and antitrust law. He became partner with Wenger & Vieli in 2007 and is the firm’s managing partner since 2012.
Ilias Läber, Member of the Board of Directors since May 2013 (until 2014). Swiss citizen. Born in 1974.
Ilias Läber holds a Master of Science from ETH Zurich and a PhD in Finance from the University of Zurich. From 2001 to 2008, Ilias Läber worked at McKinsey & company, ultimately as an Associate Principal. During this time he was responsible for projects in the area of operational improvement and corporate finance for midsized and multinational companies in Europe, the US and South America. In 2008 he joined Cevian Capital AG. In his role as Partner and Managing Director he is responsible for Cevian’s Swiss office and investments in Switzerland and England.
Chris E. Muntwyler, Member of the Board of Directors since 2010. Swiss citizen. Born in 1952. Reelected in 2013 (until 2014).
Chris E. Muntwyler attended the School of Commerce in Zurich and completed various executive programs at Harvard University, IMD in Lausanne and at the Wharton University. From 1972 to 1999 he held several positions at Swissair, until 1981 in various leadership functions in the Marketing Division, in 1982 as General Manager Marketing and Sales Scandinavia and from 1986 for North America. In 1990, he took over the responsibility for the global Price and Distribution Policy and was then leading the development and introduction of the new Group IT strategy. Before leaving Swissair at the beginning of 1999, he was Vice President Global Distribution. From 1999 to 2008, Chris E. Muntwyler held several executive positions at DHL Express, in 1999 as Managing Director Switzerland, in 2002 as Managing Director Germany, in 2003 as Chief Executive Central Europe, and in 2005 as Chief Executive United Kingdom.
Today Chris E. Muntwyler is President and CEO of the management consulting company Conlogic AG.
Roger Schmid, Member of the Board of Directors since 2003. Swiss citizen. Born in 1959. Reelected in 2013 (until 2014).
Roger Schmid holds a university degree in law as well as a PhD in law from the University of Zurich. From 1991 to 1995, he was Legal Counsel and Director at Bank Leu (today Credit Suisse). Roger Schmid works as an Executive Director of the Ernst Göhner Foundation.
Hans-Peter Strodel, Member of the Board of Directors since 2010. Swiss citizen. Born in 1943. Reelected in 2013 (until 2014).
HansPeter Strodel holds a PhD in economics from the University of St. Gallen. From 1969 until 1974 he was an executive assistant at Maschinenfabrik Benninger und Heberlein AG. From 1975 until 1994, he held several positions at the OerlikonBührle Group, in 1975 as Head of Planning and Marketing in Italy, and from 1980 as Head of Finance at Werkzeugmaschinenfabrik OerlikonBührle AG and OerlikonContraves. From 1995 until 2008, HansPeter Strodel was CFO at Schweizerische Post.
Knud Elmholdt Stubkjær, Member of the Board of Directors since 2011. Danish citizen. Born in 1956. Reelected in 2013 (until 2014).
Knud Elmholdt Stubkjær holds a shipping degree from the Mærsk International Shipping Academy, supplemented with various executive programs, e.g., from IMD and INSEAD. From 1977 through 2007, he held various positions within the A.P. MøllerMærsk Group, including a number of postings in Asian and European countries. This included positions as Head of Mærsk Line United Kingdom, President of Mærsk K.K. Japan, CEO A.P. MøllerMærsk Singapore and Regional Manager A.P. Møller Group Asia/Oceania/Middle East. In 1999, he became Head of Mærsk container business worldwide, based in Copenhagen, and the same year became one of five partners in the A.P. MøllerMærsk Group. In 2008, he became partner in the E.R. Capital Holding Group in Hamburg, serving as CEO of one of its subsidiaries, E.R. Schiffahrt GmbH, a leading maritime service provider within container, bulk and offshore shipping. Since July 30, 2012, Knud Elmholdt Stubkjær is acting as CEO and CSO of Carrix Inc., Seattle, Washington.

Panalpina Annual Report 2013
44Corporate Governance
All the members of the Board are nonexecutive members and do not actively perform any managerial functions at PWT or any of the Group companies. Nor have they held any executive positions within the past three years prior to this reporting year. None of the members of the Board of Directors has a substantial business relationship with PWT or any of its group companies.
3.2 otheR Activities And vested inteRests Rudolf W. Hug, Member of the Board of Trustees (Stiftungsrat) of the Ernst Göhner Foundation, Zug (Switzerland), Vice Chairman of the Board of Directors of Deutsche Bank (Schweiz) AG, Geneva (Switzerland) and Member of the Board of Trustees of the Ernst von Siemens Musikstiftung, Zug (Switzerland).
Beat Walti, Chairman of the Board of Trustees of the Ernst Göhner Foundation, Zug (Switzerland).
Ilias Läber, Managing Director of Cevian Capital AG, Pfäffikon (Switzerland).
Chris E. Muntwyler, Member of the Board of Directors of Austrian Post in Vienna (Austria) and of National Express Group PLC, London (United Kingdom).
Roger Schmid, Member of the Board of Trustees and Executive Director of the Ernst Göhner Foundation, Zug (Switzerland).
Hans-Peter Strodel, Member of the Board of Directors of Skyguide, Meyrin (Switzerland).
Knud Elmholdt Stubkjær, Member of the Board of Directors of various Carrix, Inc.related entities.
Other than these, the members of the Board of Directors do not hold other material offices, nor do they carry out any other principal activities that affect the Group.
3.3 eLections And teRms of office 3.3.1 Principles of the election procedure and limitations on the terms of office
The Articles of PWT do not make provision for the general renewal of office for the Board of Directors. The members of the Board of Directors are elected at each General Meeting of Shareholders with a oneyear period of office. They may be reelected at any time. The Organizational Regulations of PWT specify an age limit of 72 years for the members of the Board of Directors.
3.3.2 the first election and remaining term of office for each member of the board of directors The timing of the first election and the remaining term of office for each member of the Board of Directors is specified under section 3.1.
3.4 inteRnAL oRgAnizAtionAL stRUctURe The Board of Directors is responsible for the ultimate management of the company and monitoring of the Executive Board. It represents the company externally and is responsible for all matters which have not been transferred to another executive body of the company by the Swiss Code of Obligations or the Articles. In line with the Articles, the Board of Directors has established Organizational Regulations that transfer certain management responsibilities to the Executive Board.
3.4.1 Allocation of tasks within the board of directors The Board of Directors selfconstitutes and appoints its Chairman and Vice Chairman. The Chairman (in his absence the Vice Chairman) directly supervises the business affairs and activities of the Executive Board and is entitled to regularly attend Executive Board meetings. The Corporate Auditor as well as the Corporate Secretary, in his capacity as secretary to the Board of Directors, are directly subordinated to the Chairman of the Board of Directors.
3.4.2 member list, tasks and areas of responsibility for each committee of the board of directors Three committees exist under the Board of Directors.
The Audit Committee consists of the following members of the Board of Directors: HansPeter Strodel (Chairman), Ilias Läber and Roger Schmid. The Audit Committee supports the Board of Directors with the review of the company’s financial statements, the supervision of the financial accounting standards and reporting, the review of the effectiveness of the Internal Control System and with the efficiency of external and internal audit procedures, including risk management. The Audit Committee reviews the consolidated annual financial statements as well as the published interim financial statements and submits an application to the
Panalpina Annual Report 2013
45Corporate Governance
Board of Directors for approval. It regularly maintains contact with the Group Auditors and the Corporate Auditor. On this basis, it adopts the detailed reports of the Group Auditors and semiannual reports of Corporate Audit. It is therefore in the position to audit the quality, effectiveness and interaction between the control systems, to determine the audit priorities, to introduce proposed measures and to monitor their implementation. The Audit Committee determines the organization of Corporate Audit, adopts the internal audit charter and approves the annual planning and scope of internal audit.
In the field of risk management, the Audit Committee approves the detailed and weighted risk map of the Executive Board, adopts the necessary measures for risk control and risk mitigation and reports the respective outcome to the Board of Directors on a yearly basis. The risk map itself covers any strategic, financial, operational, legal and compliance risks that could significantly impact the company’s ability to achieve its business goals and financial targets. Identified risks are weighted and prioritized by the Executive Board according to their significance and likelihood of occurrence. For each risk, specific risk mitigation measures – including their current status – are defined and responsibilities are allocated. The risk map, which is compiled by the Risk Review Committee, chaired by the Corporate Secretary, for review by the Executive Board and subsequent approval by the Audit Committee, contains risks identified and assessed by the respective corporate functions, regional management, Corporate Audit and the Group Auditors. The Group’s key risks are annually reported to the Board of Directors.
During the reporting year the Audit Committee held five halfday meetings. During Audit Committee meetings, direct discussions took place with representatives of the Group Auditors and Corporate Audit. Representatives from the Group Auditors were present at three of these meetings and the Corporate Auditor (being a permanent participant at the Audit Committee Meeting since August 2010) attended all of the abovementioned meetings. At these meetings, the Executive Board was regularly represented by the CEO, the CFO and the Corporate Secretary.
The Compensation and Nomination Committee consists of the following members of the Board of Directors: Rudolf W. Hug (Chairman), Chris E. Muntwyler and Knud Elmholdt Stubkjær. It monitors the selection process for members of the Board of Directors, the Executive Board and other selected senior management positions, determines the overall remuneration and terms of employment for members of the Board of Directors and the Executive Board as well as remuneration bands for highly compensated employees. Regarding the compensation of the members of the Executive Board, the Committee makes a decision subject to the final approval of the Board of Directors; applications for the compensation of the Board members are decided by the Committee and shared with the Board of Directors. Each year the Committee decides on the bonus compensation for the CEO and the other members of the Executive Board for the previous year, based on recommendations of the Chairman (for the CEO) and the CEO (for other Executive Board members). Furthermore, the Committee regularly reviews the Board Stock Award Plan, the Executive Board MidTerm and LongTerm Incentive plans and the Group’s Management Incentive Plan and submits proposals for final approval to the Board of Directors. Moreover, it approves concepts and policies for the Group’s management performance assessment, succession planning and expat programs.
During the reporting year, the Compensation and Nomination Committee held four meetings of approximately two hours each. The Executive Board was regularly represented at these meetings by the CEO, the Chief HR Officer and the Corporate Secretary.
The Ethics and Compliance Committee consists of the following members of the Board of Directors: Rudolf W. Hug (Chairman), Roger Schmid and Beat Walti. It oversees the company’s Business Ethics Program and monitors Panalpina’s adherence to both, the Deferred Prosecution Agreement (DPA) with the US Department of Justice (until its termination in December 2013) and the Administrative Agreement with the US Department of the Air Force. It further monitors the handling of major legal matters, including the pending antitrust investigations and related proceedings as well as the development of the company’s compliance policies and procedures.
During the reporting year, the Committee has held four meetings and three telephone conferences. The Executive Board was represented at these meetings by the CEO and the Corporate Secretary.
The Committees generally meet prior to Board of Directors meetings. The chairmen of the committees inform and update the Board of Directors on the topics discussed and decisions made during such meetings. They submit proposals for approval related to decisions that fall within the scope of the Board of Directors.
Objectives, organization, duties and the cooperation with the Board of Directors are defined in the Terms of Reference of the respective committees which are reviewed and adopted by the Board of Directors.
The overall responsibility of the Board of Directors is not affected by these committees.

Panalpina Annual Report 2013
46Corporate Governance
3.4.3 Working methods of the board of directors and its committees During the reporting year, the Board of Directors held six fullday meetings and two telephone conferences. The Executive Board was represented by all its members at these meetings. In urgent cases, telephone conferences are organized in order for decisions to be taken.
At every meeting, the Executive Board updates the Board of Directors on business and key financial developments and main regional and segment developments. On a quarterly basis, detailed consolidated financial statements on the Group, regional and business segment levels are reported to the Board of Directors in accordance with International Financial Reporting Standards (IFRS). The Board of Directors is furnished in time with an agenda, detailed meeting documentation related to topics on the agenda and minutes.
3.5 definition of AReAs of ResPonsibiLity In line with the law and the Articles, the Board of Directors has transferred the responsibility to develop and implement the Group strategy, as well as the responsibility to supervise business and financial development of the Group’s subsidiaries, to the Executive Board.
The Organizational Regulations adopted by the Board of Directors govern the cooperation between the Board of Directors, the Chairman and the Executive Board. They contain a detailed catalogue of duties and competencies which determine the financial thresholds within which the Board of Directors and the Executive Board can efficiently execute their daily business. The Organizational Regulations, which are accessible on Panalpina’s website, also outline the reporting duties of the Executive Board on Group and Holding level.
The main responsibilities of the Board of Directors on Group level include the determination of the business strategy on the basis of applications filed by the Executive Board, the approval of major Group policies and organizational structures, including topics related to Corporate Governance and Compliance, the approval of the annual operational and investment budgets, the approval of any extraordinary additional investment applications as well as financial planning. Further responsibilities include decisions regarding mergers and acquisitions and major management staff and remuneration decisions following recommendations and preparatory work of its Compensation and Nomination Committee.
3.6 infoRmAtion And contRoL instRUments vis-à-vis the senioR mAnAgement The Executive Board informs the Board of Directors in a written format on a monthly basis on the current course of business, covering the Group’s consolidated monthly and yeartodate income statements, including deviation to budget and preceding year, regional and product income statements, functional costs/FTE development, financial position, statements on cash flows and net working capital development.
A detailed update is provided at each Board of Directors meeting.
On a quarterly basis, the reporting covers the condensed consolidated interim financial statements including key developments, income statement, statement of comprehensive income, statement of financial position, statement of changes in equity, statement of cash flows and explanatory notes, IR presentations and media release.
Further information regarding personnel and organizational changes, extraordinary events and the activities of analysts, investors and competitors form part of the regular reporting. Moreover, the Board of Directors annually reviews and approves the Group’s targets for the individual regions and business segments and adopts the respective report of the Executive Board.
During the reporting year, the Chairman of the Board of Directors partly attended two Executive Board meetings and regularly received the minutes of the Executive Board meetings. The members of the Executive Board regularly joined meetings of the Board of Directors. In addition, individual senior executives attended specific topic discussions pertaining to their particular field of expertise. Furthermore, specific meetings of the Board of Directors were dedicated to a detailed review of major markets, business segments and the Group's strategy according to predefined schedule. For further details please refer to sections 3.4.2 and 3.4.3.
The Audit Committee of the Board of Directors monitors and assesses the activities of the Corporate Auditor as well as his cooperation with the Group Auditors.

Panalpina Annual Report 2013
47Corporate Governance
The Audit Committee receives the Corporate Auditor’s halfyear reports and also adopts the comprehensive annual risk map of the Executive Board. The Audit Committee approves the proposed risk control and risk mitigation measures as well as the annual planning and scope of the internal audit, which is also based on the risk map. For further details please refer to section 3.4.2.
4 execUtive boARd 4.1 membeRs of the execUtive boARd
On the closing date, the Executive Board was composed of five persons.
Peter Ulber, President and Chief Executive Officer since June 2013, German citizen. Born in 1960.
Following his studies at the International School of Logistics in Hamburg, Peter Ulber held various management positions from 1985 to 2011 at Kuehne + Nagel in Europe, as well as North and South America. During his tenure, Peter Ulber was responsible for both ocean freight and air freight, had overall responsibility for the global sales organization and joined the management board in 2008. As a result of a series of strategic acquisitions by Kuehne + Nagel, Peter Ulber was also heavily involved in the company’s expansion in Europe, Asia and America.
At the end of 2011 he cofounded Charleston Enterprise Group LLC, a strategic management consultancy that offers consulting, management and investment strategies for international logistics companies as well as private equity firms with a primary focus on mergers and acquisitions as well as growth strategies.
Robert Erni, Chief Financial Officer since January 2013, Swiss citizen. Born in 1966.
Robert Erni has worked in various finance positions at Kuehne + Nagel for more than 19 years. Most recently he was Head of Corporate Controlling (2009 to 2012) and Head of Corporate Accounting and Treasury (2004 to 2009), in both functions reporting to the Group CFO. Prior to the head office functions, he gained profound finance and managerial expertise through several senior postings in Asia Pacific (Hong Kong and India), in South America (Argentina) and in the USA. Robert Erni holds a degree in Economics and Business Administration of the University of Economics and Business Administration, Lucerne (Switzerland).
Christoph Hess, Chief Legal Officer and Corporate Secretary, Swiss citizen. Born in 1955. Member of the Executive Board since October 2006. Responsible for Corporate Legal Services and Insurance.
Christoph Hess joined the Group’s head office in 1994 as Secretary of the Board of Directors and the Executive Board. In this capacity he also manages both the Group’s Legal and Insurance departments. He also managed Corporate Communications until August 2008. Christoph Hess holds a degree in law from the University of Basel and has been admitted to the bar in Switzerland.
Alastair Robertson, Chief Human Resources Officer, British citizen. Born in 1960. Member of the Executive Board since April 2008. Responsible for Human Resources. Alastair Robertson joined the Group in 2007 as Head of Global Human Resources. Before joining Panalpina, he had been a Vice President at Tetra Pak since 1996, where he held various positions in the field of human resources: between 1999 and 2001 as Vice President Human Resources Americas and from 2002 to 2004 as Vice President Human Resources Europe and Africa. From 1992 to 1996, he worked for W.H. Smith in the field of personnel, development and training and between 1989 and 1992 he was with Graham Builders Merchants as Manager Human Resources Management, Training and Development. He previously served in the military, where he attained the rank of acting major and served in numerous countries. Alastair Robertson is a Fellow of the Chartered Institute of Personnel and Development, holds an MBA in Strategy and Marketing from the University of Huddersfield, Bradford (United Kingdom). He also attended the Royal School of Military Engineering and the Royal Military Academy in the United Kingdom.
Karl Weyeneth, Chief Operating Officer, Swiss citizen. Born in 1964. Member of the Executive Board since April 2008. Responsible for Air Freight, Ocean Freight, Logistics, Marketing and Sales, Quality and Operations Transformation.
Effective January 1, 2014, Karl Weyeneth has been appointed Chief Commercial Officer.
Karl Weyeneth joined the Group in 2007 as Regional CEO for North America, where he was responsible for the development and results of the subsidiaries in USA and Canada. He is a professional with profound leadership and management experience in logistics, including freight management, 3PL and contract logistics. Before joining Panalpina, he was President and CEO Americas

Panalpina Annual Report 2013
48Corporate Governance
of Hellmann Worldwide Logistics, Inc. (USA) and prior to this he was Executive Vice President and CFO of Danzas Management Latin America (USA), where he attained profound experience in all finance matters. He holds a Bachelor in Economics and Business Administration from the University of Berne, Switzerland.
Rod Angwin, Chief Information Officer, British Citizen. Born in 1959. Member of the Executive Board as of January 1, 2014. Responsible for Information Technology.
Rod Angwin joined Panalpina in 2012 as Chief Information Officer. He has extensive experience gained across a number of sectors and a broad range of international companies. His previous roles include five years as Group CIO for Wolseley plc, the international building materials distributor, and as IT Director on the Board of B&Q, part of the Kingfisher retail group. Other roles include ten years in various positions with Mars Inc., and as Group IT Director for Meyer plc, subsequently part of SaintGobain. Rod Angwin holds a degree in Marine and Freshwater Biology from Stirling University (Scotland).
4.2 otheR Activities And vested inteRestsPeter Ulber: Managing partner and cofounder of Charleston Enterprise Group LLC, Charleston, USA.
4.3 mAnAgement contRActs No management contracts exist with any third party outside the Group.
5 comPensAtion, shARehoLdings And LoAns For content and method of determining the compensation and the shareownership programs, please refer to the Compensation Report on page 5161.
6 shARehoLdeRs’ PARticiPAtion 6.1 voting Rights And RePResentAtion RestRictions
Each share carries one vote at the General Meeting of Shareholders. The Articles state that when exercising voting rights, no shareholder may directly or indirectly represent more than 5% of the total shares issued by the company for own and represented shares.
The Articles provide for group clauses.
The voting right restrictions are not applicable to representatives of the corporate body (Organvertreter) as well as the independent proxy holder of voting rights (unabhängiger Stimmrechtsvertreter). In order to facilitate the exercise of voting rights of deposited shares, the Board of Directors is entitled to enter into agreements with banks which deviate from the voting restrictions. The voting restrictions do not apply to the shares held by the Ernst Göhner Foundation, because it held PWT shares prior to the introduction of the voting restrictions (grandfathering). Any abolition or change of the provisions relating to the restrictions on voting rights requires a resolution of the General Meeting of Shareholders on which at least twothirds of the voting shares represented agree.
A written proxy entitles a shareholder to be represented at the General Meeting of Shareholders by his or her legal representative, or by another shareholder with the right to vote, or by the representative of the corporate body (Organvertreter), or by the independent proxy holder of voting rights (unabhängiger Stimmrechtsvertreter) or by the proxy holder of deposited shares (Depotvertreter).

Panalpina Annual Report 2013
49Corporate Governance
6.2 stAtUtoRy QUoRUms In principle, the legal rules on quorums apply. Supplementary to the quorums legally listed, a twothirds majority of the shares represented at the General Meeting of Shareholders is required for the following resolutions:
– any abolition or change of the provisions relating to transfer restrictions; – any abolition or change of the provisions relating to the restriction of voting rights; – the transformation of registered shares into bearer shares; – the dissolution of the company by way of liquidation; – the removal of two or more members of the Board of Directors; – the abolition of the respective provision in the Articles as well as the repeal or relief of the stated quorum. A resolution to increase the quorum as set forth in the Articles must be based on the consent of the increased quorum.
6.3 convocAtion of the geneRAL meeting of shARehoLdeRs There are no provisions deviating from the law.
6.4 AgendA Shareholders who individually or together with other shareholders represent shares in the nominal value of CHF 1 million may request that an item be placed on the agenda. Such a request must be made in writing to PWT at least 60 days prior to the General Meeting of Shareholders.
6.5 inscRiPtions into the shARe RegisteRRegistered shares can only be represented by shareholders (or nominees) who have been entered into the PWT share register. Shareholders (or registered nominees) who cannot personally attend the General Meeting of Shareholders are entitled to nominate a representative according to the provisions in the Articles, who represents them by written proxy.
For the purpose of determining voting rights, the share register is closed for registration from the date upon which the General Meeting of Shareholders has been called (date of invitation) until the day after the General Meeting of Shareholders has taken place.
7 chAnges of contRoL And defense meAsURes 7.1 dUty to mAKe An offeR
No optingout or optingup provisions exist.
7.2 cLAUses on chAnges of contRoL Neither the contracts of the members of the Board of Directors nor of the Executive Board have a changeofcontrol clause.
8 AUditoRs 8.1 dURAtion of the mAndAte And teRm of office of the LeAd AUditoR
The mandate to act as statutory and Group Auditors is assumed by KPMG, Zurich, on a yearly basis. The lead auditor, Regula Wallimann, took up office on May 6, 2008 for a sevenyear term.
8.2 AUditing fees According to financial accounting, invoices for auditing fees for the financial year amounted to CHF 2.9 million.
8.3 AdditionAL fees The KPMG auditors were compensated with an additional amount of CHF 0.5 million for further services rendered in the financial year.
8.4 infoRmAtionAL instRUments PeRtAining to the exteRnAL AUdit The Group Auditors are supervised and controlled by the Audit Committee. The Group Auditors report to the Audit Committee and periodically the lead auditor participates in the meetings. During these meetings, the Group Auditors present a detailed audit plan for the current year including riskbased audit priorities, the audit scope, proposals regarding audit fees, organization and

Panalpina Annual Report 2013
50Corporate Governance
timing as well as updates and status of the results of the Internal Control System. In subsequent meetings they present interim audit findings with respective statements and recommendations later followed by a detailed audit report. Presentations also contain references to upcoming changes in legislation and IFRS. The main criteria for the selection of Group Auditors include independence, network capabilities, industry and IT experience of the audit team, a riskbased audit approach, a central process management as well as the integration of Corporate Audit and risk management functions. The Audit Committee annually assesses the performance of the Group Auditors and determines the audit fees (refer to section 3.5).
9 infoRmAtion PoLicy Panalpina regularly updates its website at www.panalpina.com, informing the public of any major events, organizational changes and (quarterly) financial results. Press releases are accessible to all visitors to the website; alternatively, subscriptions can be made so that the latest press releases are automatically forwarded via email. Furthermore, all publications such as the Annual Report (including the Corporate Governance and Compensation Report), customer magazine and sales brochures are available online. The dates of the General Meeting of Shareholders as well as dates of publication of the quarterly financial results are published in the Annual Report and appear in the Financial Calendar on the website (under Investors). The minutes of shareholder meetings are available online.

Panalpina Annual Report 2013
51Compensation Report
comPensAtion RePoRt
comPensAtion goveRnAnce
compensation and nomination committeeThe Compensation and Nomination Committee consists of three members of the Board of Directors who are independent, insofar as they do not hold any executive position, nor act as consultant for the company and its subsidiaries. For 2013, the following members of the Board of Directors were members of the Compensation and Nomination Committee: Rudolf W. Hug (Chairman), Chris E. Muntwyler and Knud Elmholdt Stubkjær.
The Compensation and Nomination Committee monitors the selection process for members of the Board of Directors, the Executive Board and other selected senior management positions. The Committee also determines the overall remuneration and terms of employment for members of the Board of Directors and the Executive Board as well as remuneration bands for highly compensated employees, and submits the relevant proposals to the Board of Directors for final approval. Furthermore, the Committee regularly reviews the compensation policy, including the incentive plans such as the Board Stock Award Plan, the Executive Board MidTerm and LongTerm Incentive plans and the Group’s Management Incentive Plan and submits proposals for final approval to the Board of Directors.
Approval framework
item RecommendAtion fRom finAL APPRovAL fRom
Compensation principles including incentive and sharebased programs and pension provisions
Compensation and Nomination Committee Board of Directors
Remuneration of the Board of Directors Compensation and Nomination Committee Board of Directors
Remuneration (at target) for the CEO Chairman of the Board Board of Directors
Remuneration (at target) for the members of the Executive Board CEO Board of Directors
Incentive payouts for the CEO Chairman of the Board Compensation and Nomination Committee
Incentive payouts for the members of the Executive Board CEO Compensation and Nomination Committee
Nomination process for Executive Board and Board of Directors Compensation and Nomination Committee Board of Directors
External Board of Directors mandates for Executive Board and Board of Directors
Compensation and Nomination Committee
The compensation report describes the remuneration philosophy and principles, as well as the governance framework related to the compensation of the Board of Directors and the Executive Board of Panalpina. The report also provides details around the different compensation programs and the remuneration related to the 2013 performance year.The compensation report is written in accordance with the Articles 663b bis and 663c of the Swiss Code of Obligations, the Directive on Information Relating to Corporate Governance of the SIX Swiss Exchange and the Swiss Code of Best Practice for Corporate Governance of economiesuisse. It also takes into consideration the provisions of the Ordinance against excessive pay in listed companies (VegüV).

Panalpina Annual Report 2013
52Compensation Report
The Compensation and Nomination Committee holds its ordinary meetings normally one day before the meetings of the Board of Directors, typically four times a year: Typically in the December meeting, the individual objectives for the CEO and the other members of the Executive Board are defined for the following business year and their remuneration (at target) is reviewed. The Committee also reviews the compensation for the Board of Directors.
Typically in the February meeting, the Committee determines the achievement levels of the previous years’ objectives and the incentive payout for the CEO and the members of the Executive Board.
In the May and September meetings, the overall remuneration strategy and the individual compensation programs are reviewed.
The Chairman of the Committee may call for further meetings as necessary.
The Chairman of the Compensation and Nomination Committee regularly updates the Board of Directors on the activities and decisions made during the Compensation and Nomination Committee meetings.
During the reporting year, the Compensation and Nomination Committee held four meetings. The Executive Board was regularly represented at these meetings by the CEO, the Chief HR Officer and the Corporate Secretary. Members of the Executive Board do not attend discussions related to their own remuneration.
method of determination of compensationThe remuneration of the Executive Board members is reviewed yearly in order to ensure market competitiveness, internal equity and payforperformance. The remuneration of the Executive Board members is benchmarked using the Switzerland Executive Compensation Survey published by Mercer. This survey includes compensation data of multinational companies in the general industry sector in Switzerland. No specific peer group is created, however each Panalpina role is evaluated using the Mercer job evaluation methodology, in order to compare with the relevant benchmark, e.g. roles of comparable size, scope and level of responsibilities. The median of the benchmark data is considered relevant for measuring compensation competitiveness.
On the basis of the external benchmark information, combined with internal peer comparisons, the Compensation and Nomination Committee defines the level of remuneration (at target) and the mix between fixed and variable compensation (at target) for the CEO and for the other members of the Executive Board, and submits its proposal to the Board of Directors for final approval.
The compensation effectively paid out for a given business year depends on the effective company and individual performance. The performance is assessed through the annual performance management process, where individual objectives are determined and agreed upon at the beginning of the reporting year, and performance is assessed by February of the following year. The performance assessment includes the achievement of individual objectives as well as an evaluation of the individual’s behaviors, which are combined into an overall performance rating. The performance management process, including the determination of individual objectives at the beginning of the year, and the performance assessment at yearend, is conducted by the Chairman of the Board of Directors for the CEO and by the CEO for the other members of the Executive Board. Individual objectives and performance assessment for the CEO and the other members or the Executive Board are subject to the approval of the Compensation and Nomination Committee.

Panalpina Annual Report 2013
53Compensation Report
comPensAtion And benefits PRinciPLes And PoLicy
In the volatile economy and the challenging business context in which Panalpina operates, it is critical to recruit, retain and develop a ded icated and capable team of employees with excellent skills, integrity and high ethical standards.
The remuneration model at Panalpina supports this fundamental objective. It also ensures that employees are rewarded for achieving results in line with the business objectives and are encouraged to demonstrate behaviors that are consistent with Panalpina’s values.
Remuneration principles To provide a competitive remuneration package compared to the relevant talent market To create alignment to shareholders’ interests, especially in terms of longterm value creation for the company and its stake holders To drive a performanceoriented culture aligned with the achievement of the company’s strategic objectives To encourage behaviors that are consistent with Panalpina’s values and high ethical standards To be fair and transparent, and applied consistently throughout the company
The remuneration programs are designed to seek an appropriate balance between fixed and variable pay, as well as between shortterm, midterm and longterm rewards. They also provide a fair link between pay and performance from an operational perspective, from a shareholders’ value creation perspective and from an external and relative peer performance perspective.
In order to achieve the above, the remuneration system has been reviewed and redesigned in 2013. The first changes to the compensation programs will be implemented as of 1 January 2014 and further enhancements are being considered for future years. The nature of those changes is described further below and more detailed information will be provided in the 2014 Compensation Report.
PRinciPLes of RemUneRAtion of the boARd of diRectoRs
The members of the Board of Directors receive a fixed annual compensation, which consists of a Board membership fee of CHF 150,000 – which already includes Committee membership – , an attendance fee of CHF 500 per meeting and a potential grant of free shares of the company in the amount of CHF 50,000 based on a decision within the discretion of the Compensation and Nomination Committee evaluating the Group’s annual overall situation.
The Chairman of the Board of Directors receives a Board chairmanship fee of CHF 450,000, an attendance fee of CHF 500 per meeting and a grant of shares of CHF 50,000 under the same conditions as the other Board members as defined above. The Board membership/chairmanship fee and the attendance fee are paid out in cash in June and December for the compensation period from AGM to AGM. The shares are granted for the previous business year based on the share’s closing price on the SIX Swiss Exchange on April 30. The shares are blocked from trading during a restriction period of one year, except in case of change of control or liquidation, death or disability, where the shares are unblocked immediately. The shares remain blocked in all other instances.
The members of the Board of Directors do not participate in Panalpina’s employee benefit or incentive plans, except for social security where applicable.
Remuneration model for the board of directors
IN CHF chAiRmAn boARd membeR
Annual board membership fee (cash) 450,000 150,000
Annual grant of shares 50,000 50,000
Meeting fee (per meeting) 500 500

Panalpina Annual Report 2013
54Compensation Report
PRinciPLes of RemUneRAtion foR the execUtive boARd
The remuneration of the members of the Executive Board consists of the following elements: Fix compensation: annual base salary Variable compensation: annual bonus, midterm incentive and longterm incentive Benefits: pension, insurances and benefits in kind
Remuneration model for the executive board
PURPose instRUment
Fix compensationAnnual base salary
Recognize market value of role and individual skills, experience and performance
Monthly cash payments
Variable compensationAnnual bonus
Drive and reward shortterm performance over 1 year
Annual cash incentive
Midterm incentive (MTIP)
Align shortterm and longterm rewards through coinvestment
Compulsory deferral of 40% of annual bonus into blocked shares, with free matching shares (1:1) after a oneyear period
Longterm incentive (LTIP)Drive and reward longterm performance over 5 years
Deferred cash incentive
BenefitsPension benefits
Provide competitive retirement benefits and reward seniority and loyalty
Pension fund and insurances
PerquisitesProvide competitive and costeffective benefits by leveraging company’s size
Perquisites and benefits in kind
Every year, the remuneration of the Executive Board members is benchmarked against the market, with the objective to provide a level of remuneration that is approximately in line with the median of the relevant benchmark and to allow for abovemedian compensation for sustained superior performance.
Annual base salary The annual base salary takes into consideration the scope and responsibilities of the role, its market value and the skills, experience and performance of the individual in the role. The compensation policy is to pay annual base salaries that are in line with the median of the benchmark for a comparable role. The annual base salaries of the members of the Executive Board are reviewed every year, taking into consideration the company’s financial situation, the economic environment, the benchmark information and the individual performance.
Annual bonusThe annual bonus rewards company and individual performance over a period of one year. The company performance weights for 60% of the annual bonus and is measured by the group earnings before interest and tax (EBIT), weighted at 90%, the days of sales outstanding (DSO), weighted at 5%, and the days of payable outstanding (DPO), weighted at 5%. For each of those objectives, a minimum and a maximum level of performance are defined: the threshold, below which no bonus is paid out, and the ceiling, above which the bonus payout is capped at 150%. For the EBIT target, the threshold is set at 50% achievement and the ceiling at 150%. For the DSO and DPO objectives, the threshold is set at 90% achievement and the ceiling at 110% achievement. The payout curve is linear between the threshold and the target, and between the target and the ceiling.
The individual performance weights for 40% of the annual bonus and is assessed through the formal performance management process, whereas individual objectives are determined and agreed upon at the beginning of the reporting year, and individual performance is assessed after yearend. For 2013, the individual objectives include key performance indicators (KPIs) related to the operational business. The performance assessment includes the achievement of the individual objectives as well as an evaluation of the individual’s behaviors that are consistent with Panalpina’s values, which are combined into an overall performance rating, the PEAR (performance evaluation assessment review) rating. The PEAR rating translates into a payout percentage for the individual portion of the annual incentive, which can range from 0% to 120% of target.

Panalpina Annual Report 2013
55Compensation Report
overview of performance objectives, their weighting and levels of performance
Weight thReshoLd PeRfoRmAnce
mAx PeRfoRmAnce
mAx PAyoUt
Group objectives Group EBIT 54% 50% 150% 150%
Days of sales outstanding 3% 90% 110% 150%
Days of payables outstanding 3% 90% 110% 150%
Individual objectives Individual key performance indicators 40% rating rating 120%
The annual bonus target is expressed as a percentage of annual base salary and amounts to 100% for the CEO, and between 67% and 80% for the other members of the Executive Board depending on their function. The actual bonus payout may range from 0% to 138% for the members of the Executive Board, depending on the effective performance achievement. The annual bonus payout is subject to the approval of the Compensation and Nomination Committee.
mid-term incentive (mtiP)The midterm incentive plan (MTIP) was created in 2009 in order to encourage contributions to the longterm success and prosperity of the company through coinvestment into the company. In addition, the MTIP creates a strong alignment with shareholders interest and facilitates the retention of the executives. Under the MTIP, a portion of the Annual Bonus is converted into Panalpina (PWTN) shares with a oneyear restriction period. At the end of the restriction period and subject to continuous employment with the company, the deferred bonus shares are matched with additional free shares of the company. The free matching shares are subject to a vesting period of oneyear.
The applicable share price for determining the number of deferred bonus shares is defined for a threeyear cycle (from 2012 to 2014) as the PWTN closing price on April 30, 2012, which amounted to CHF 88.50. The intention of fixing the purchase price of the shares for a threeyear cycle was to reward the participants for a positive share price development, while a negative share price evolution reduces the value of the award.
For the members of the Executive Board, 60% of the annual bonus is payable in cash and 40% is converted into PWTN shares that are matched with one free matching share each at the end of the oneyear restriction period. The free matching shares are subject to a vesting period of one year. In case of voluntary resignation or termination for cause, the free matching shares will forfeit. The vesting may be accelerated in case of termination without cause, retirement, death and disability. In case of change of control or liquidation, the Compensation and Nomination Committee reserves the right to determine any appropriate measure with regard to the unvested free matching shares.
timeline of the mtiP
ANNUAL BONUS ANNUAL BONUS 40% IN SHARES
MTIP MATCHIN SHARES
ANNUAL BONUS 60% IN CASH
2013 2014 2015 2016

Panalpina Annual Report 2013
56Compensation Report
Long-term incentive (LtiP)The members of the Executive Board participate in a longterm incentive plan, which rewards longterm value creation to the company, measured by the realized economic profit. Economic profit for the purpose of the LTIP is defined as the earnings before income tax minus tax, minus the capital employed multiplied by the weighted average cost of capital.
The purpose of the LTIP is to motivate executives to contribute to the longterm success and prosperity of the company, and at the same time to facilitate the retention of the executives.
The performance period of the LTIP started on 1 January 2009 and ended on 31 December 2013. During the fiveyear performance period, a collective pool was created where each year, 5% of the year on year change in economic profit was added to the pool. When the economic profit change was negative, it was deducted from the pool.
At the end of the fiveyear performance period, each Executive Board member is entitled to be paid out an equal share of the pool in cash, prorated based on the period of employment, e.g. new entrants have an entitlement for their period of employment under the plan. The vesting of the plan is staggered from three to five years as follows: 25% after three years, a further 25% after four years and the remaining 50% after five years. The payout, however, is always after the fiveyear performance period and is based on the economic performance over the entire fiveyear period.
In the circumstances of retirement, disability and death, prorated vesting applies at the end of the plan performance period. The Compensation and Nomination Committee has the discretion to decide whether prorated vesting may apply in the event of termination without cause and to determine any appropriate measure with regard to the LTIP pool in the event of change of control or liquidation.
The above LTIP stopped as per 31/12/2013 and there was no payout as the accumulated value was negative.
In 2012, a second LTIP was created for Executive Board members who joined the company or became eligible to the LTIP during the year 2012 or after. The rules of the 2012 LTIP plan are similar to the 2009 LTIP, however the pool is individual, consists of annually 1% of the year on year change in economic profit, starts when the participant becomes eligible and ends five years later. In case of termination with early vesting rights, as defined above (retirement, death, disability, and, at the discretion of the Compensation and Nomination Committee, in case of termination without cause, change of control or liquidation), the individual LTIP pool is frozen at the end of the employment relationship and is paid out after the fiveyear plan period.
The second LTIP plan where performance periods are still running will be phased out and the values frozen at the end of 2013, while keeping the payout date at the end of the running 5year cycle. For the members who joined the plan for the period 1/1/2012 to 31/12/2013 the value was negative so there will be no payout. For the members who joined the plan for the period 1/1/2013 until 31/12/2013 there is a value created at 31/12/2013 which will be frozen and paid out at the end of the 5year cycle upon approval of the CNC.
Executive Board members only participate in one LTIP at the time, there is no cumulative participation in both plans.

Panalpina Annual Report 2013
57Compensation Report
overview of compensation schedule for the ceo and executive board members:
LONGTERM INCENTIVE(LTIP)
LTIP2009–2013
LTIP 2012
ANNUAL BONUS ANNUAL BONUS 40% IN SHARES
MTIP MATCHIN SHARES
ANNUAL BONUS 60% IN CASH
ANNUAL BASE SALARY
2013 2014 2015 2016 2017
benefitsExecutive Board members participate in the regular employee pension plans of the country where they have their employment contract. For Executive Board members employed in Switzerland, the company pension fund covers their annual base salary and the actual bonus up to an overall amount of CHF 842,400. Pension fund contributions are equally split between employer and employee for insured income up to CHF 400,000. In the supplemental scheme covering income between CHF 400,000 and CHF 842,400 (current maximum under Swiss law), contributions are paid by the company. The benefits provided under the pension fund exceed the legal requirements of the Swiss Federal Law on Occupational Retirement, Survivors and Disability Pension Plans (BVG) and are in line with typical market practice of other multinational companies in Switzerland.
Certain Executive Board members participate in a nonSwiss pension fund scheme whose benefits and contributions are equivalent to these of the Swiss pension plan.
Members of the Executive Board do not receive any executive benefits. They are entitled to a company car allowance and a general expense allowance, in accordance to the expense rules applicable to all employees at management levels in Switzerland.
employment contractsEmployment agreements with Executive Board members stipulate a notice period of twelve months. They do not contain any “golden parachutes” in case of a change of control, nor any severance provisions in case of termination of employment.

Panalpina Annual Report 2013
58Compensation Report
change in the compensation model for the executive board as of business year 2014The compensation model for the members of the Executive Board has been reviewed in 2013 and will be adjusted starting 2014, in order to be fully aligned with Panalpina’s strategy and the evolving business context in which the company operates. The changes aim to rebalance the remuneration elements as described in the graph below:
INDIVIDUAL PERFORMANCE COMPANY PERFORMANCE
SHORTTERM LONGTERM
RELATIVE COMPARISON ABSOLUTE COMPARISON
SHARE PRICE FINANCIAL MEASURES
The following changes are effective as of the business year 2014: Introduction of performance share units (PSU) instead of the deferred cash LTIP for the Executive Board members. The new plan provides for an annual grant of PSU with a threeyear cliff vesting. The vesting is conditional upon the relative total shareholder return (TSR) performance compared to a peer group of companies. As a consequence the previous LTIP will stop for the plan where the performance cycle ended in 2013. The second LTIP plan where performance periods are still running will be phased out and the values frozen at the end of 2013, while keeping the payout date at the end of the running 5year cycle.
Remix of company versus individual objectives in the annual bonus plan. company performance will account for 70% of the overall bonus, individual performance for 30%.
Increase of the threshold level of performance from 50% to 60% and decrease of the maximum level of performance from 150% to 140% on EBIT under the annual bonus plan. The payout range of 0% to 150% will not change. Further enhancements of the remuneration programs are being contemplated for 2015 and future years. The new compensation model will be presented in more details in the 2014 Compensation Report.
X X
X X
X X
X X

Panalpina Annual Report 2013
59Compensation Report
RemUneRAtion of the boARd of diRectoRs And the execUtive boARd foR 2013
board of directorsNo changes have been made to the structure of remuneration of the Board of Directors. However, the level of remuneration increased compared to 2012, as the restricted stock award was not applied for the business year 2012 and thus the Board of Directors did not receive any shares in 2013 for the business year 2012 but in 2014 for the business year 2013 a grant was given.
Annual base salariesAnnual base salaries of the members of the Executive Board have slightly increased/decreased between 2012 and 2013. The new CEO has been nominated during the performance year 2013, therefore no comparison can be made between 2013 and 2012 remuneration levels.
Annual bonus and mtiPThe annual bonus payout amounts to 72% on average for the members of the Executive Board and 100% for the CEO as per separate contractual agreement for 2013 considering that he was appointed during the 2013 performance year and was not eligible to participate in the MTIP and LTIP for that year. The financial and individual objectives have been achieved as follows:
2013 annual bonus outcomes
Measures Weight OutcOMes relative tO plan
Company performance 60% Threshold Target Maximum
Earnings before interest and tax 54%
Days sales outstanding 3%
Days payable outstanding 3%
Individual performance 40% Threshold Target Maximum
Key performance indicators 40%
overall outcome
Executive Board members received 40% of their annual bonus in company shares totaling 5150 shares with a restriction period of one year, based on the share’s closing price on April 30, 2012 of CHF 88.52. This number of shares will be matched by an equal number of shares by the company after the oneyear restriction period.
During the period under review, the Executive Board received matching shares totaling 5862 shares reflecting the 40% bonus paid in 2012 and related to the 2011 annual bonus. Those shares have a vesting period of 1 year.
LtiPThe carrying amount of the liability of the LTIP for the Executive Board members at December 31, 2013 amounts to CHF 377,000, which is also the intrinsic value.
The LTIP 2009–2013 did not pay out considering that the pool accumulated during the 5year plan period based on economic profit performance is negative. This means that the members of the Executive Board did not earn any payout under the LTIP since 2009.

Panalpina Annual Report 2013
60Compensation Report
otheR shARe-bAsed oR Long-teRm incentive comPensAtion PLAns foR senioR mAnAgement
top executives – mtiP, LtiP and PsUSome executives of the core business functions (8 executives in 2013), who are not a member of the Executive Board, do participate in a longterm incentive plan (LTIP) and the midterm incentive plan (MTIP) as described above for the Executive Board but with the following amendments:
mtiP: For these executives, 80% of the annual bonus is payable in cash and 20% is converted into PWTN shares that are matched with one free matching share each at the end of the oneyear restriction period. All other plan features are the same as for the Executive Board as described above.
LtiP: The pool is individual and consists of annually 0.5% of the yearonyear change in economic profit, starts when the participant becomes eligible and ends 5 years later. All other plan features are the same as for the Executive Board 2012 LTIP plan as described above.
PsU: Similar as for the Executive Board, and effective as of the business year 2014, performance share units (PSU) will be introduced replacing the deferred cash LTIP. The new plan provides for an annual grant of PSU with a 3year cliff vesting. The vesting is conditional upon the relative total shareholder return (TSR) performance compared to a peer group of companies. As a consequence the LTIP plan where performance periods are still running will be phased out and the values frozen at the end of 2013, while keeping the payout date at the end of the running 5year cycle.
senior management – miP (management incentive program)Within this plan the senior management had the option (voluntary) to invest part of their annual bonus in Panalpina shares with a discounted share price of 25% versus the moment of grant. These shares were blocked for 1 year. As a consequence Panalpina was matching these shares with stock options which had a vesting period of 3 years (1/3 after 1 year, 1/3 after 2 years and the last 1/3 after 3 years). The total duration of the options were 6 years from the date of grant. For senior management positions for the years 2008, 2009 and 2010 there are still outstanding stock options on December 31, 2013, as per the table below. All options from previous years are expired.
management incentive plan (option plan)
yeAR
nR. of PARti-ciPAnts discoUnt
nR. of shARes PURchAsed
oPtions gRAnted
exeRcise PRice
exeRcise PRice foR Us PARticiPAnts
oPtions vested bUt not exeR-cised yet
exPiRy dAte
2008 81 25 % 38,539 37,125 129.35 119.90 13,270 15.06.2014
2009 166 25 % 71,053 71,053 61.25 81.35 8,414 14.06.2015
2010 51 25 % 13,453 13,453 95.65 87.75 1,874 14.06.2016
This plan was changed in 2011 replacing the stock options with matching free shares. Within this plan the senior management had the option (voluntary) to invest part of their annual bonus in Panalpina shares with a discounted share price of 10% versus the moment of grant. These shares are blocked for 1 year. As a consequence Panalpina is matching these shares with free share grants based on a ratio of 1 free share matched for 4 shares bought by the participant. These free shares have a vesting period of 3 years (1/3 after 1 year, 1/3 after 2 years and the last 1/3 after 3 years). For senior management positions for the years 2011, 2012 and 2013 the grants are summarized on December 31, 2013, as per the table below.

Panalpina Annual Report 2013
61Compensation Report
management incentive plan (free share plan)
yeAR
nR. of PARti-ciPAnts discoUnt
nR. of shARes PURchAsed
fRee shARe RAtio
mAtching shARes gRAnted
vested fRee shARes
foRfeited fRee shARes
non-vested fRee shARe
2011 87 10% 28,444 1 to 4 7,124 5,017 701 1,406
2012 38 10% 11,242 1 to 4 2,816 976 213 1,627
2013 30 10% 6,768 1 to 4 1,698 0 0 1,698
End 2013 there were 470 people part of the senior management who were eligible to the MIP.
The members of the EB and the top executives who participate in the MTIP, LTIP or PSU plans, are not eligible for the MIP plan as described above to avoid overlaps.
credits, loans or other monetary allowancesNo contributions or other monetary allowances have been made to closely related parties of current or former members of the Board of Directors and Executive Board respectively.
Credits or loans in favor of members of the Board of Directors or Executive Board do not exist.
For 2013 and 2012 compensation details please refer to note 28 in the Consolidated Financial Statements.

CONSOLIDATED FINANCIAL
STATEMENTS
Consolidated Income Statement
Consolidated Statement of Comprehensive Income
Consolidated Statement of Financial Position
Consolidated Statement of Changes in Equity
Consolidated Statement of Cash Flows
Notes to the Consolidated Financial Statements
Report of the Statutory Auditor
Key Figures in CHF
Consolidated Statement of Financial Position in CHF (five-year review)
63
64
65
66
68
69
137
138
140
Panalpina Annual Report 2013
Consolidated Financial Statements 62
CONTENTS

IN THOUSAND CHF NOTES 2013 20121
Forwarding services 8,174,909 8,065,745
Customs, duties and taxes (1,417,277) (1,449,115)
Net forwarding revenue 5 6,757,632 6,616,630
Forwarding services from third parties 5 (5,196,607) (5,151,586)
Gross profit 5 1,561,025 1,465,044
Personnel expenses1 6 (960,032) (957,191)
Other operating expenses 9 (440,205) (414,319)
Fines (40,939) (59,232)
EBITDA 119,849 34,302
Depreciation of property, plant and equipment 13 (34,278) (31,151)
Amortization of intangible assets 14 (18,478) (13,094)
Goodwill and customer list impairment 14 (19,112) (29,634)
Operating result (EBIT) 47,981 (39,577)
Finance income 10 3,959 14,665
Finance costs 10 (16,468) (19,178)
Profit / (loss) before income tax (EBT) 35,472 (44,090)
Income tax expenses1 11 (23,777) (27,741)
Consolidated profit / (loss) 11,695 (71,831)
Consolidated profit / (loss) attributable to:
Owners of the parent 11,862 (72,102)
Non-controlling interests 23 (167) 271
Earnings per share (in CHF per share)
Basic 12 0.50 (3.05)
Diluted 12 0.50 (3.05)
1 Prior year's figures have been restated due to the application of IAS 19 (as revised in 2011) retrospectively. Please refer to note 3.
CONSOLIDATED INCOME STATEMENT for the years ended December 31, 2013 and 2012
Panalpina Annual Report 2013
Consolidated Financial Statements 63

IN THOUSAND CHF NOTES 2013 20121
Consolidated profit / (loss) 11,695 (71,831)
Other comprehensive income
Items that will not be reclassified to profit or loss:
Remeasurement of the net defined benefit asset / (liability) 7 26,293 (25,945)
Income taxes on these components of other comprehensive income 11 (6,349) 7,084
Subtotal, net of tax 19,944 (18,861)
Items that may be reclassified subsequently to profit or loss:
Available-for-sale financial assets 15 349 (478)
Exchange difference on translations of foreign operations (23,159) (2,773)
Income tax on these components of other comprehensive income 11 (116) (130)
Subtotal, net of tax (22,926) (3,381)
Other comprehensive income for the period, net of tax (2,982) (22,242)
Total comprehensive income for the period 8,713 (94,073)
Attributable to owners of the parent 9,051 (94,278)
Attributable to non-controlling interests 23 (338) 205
1 Prior year's figures have been restated due to the application of IAS 19 (as revised in 2011) retrospectively. Please refer to note 3.
CONSOLIDATED STATEMENT OF COMPREHENSIVE INCOMEfor the years ended December 31, 2013 and 2012
Panalpina Annual Report 2013
Consolidated Financial Statements 64

CONSOLIDATED STATEMENT OF FINANCIAL POSITIONas at December 31, 2013, 2012 and 2011
IN THOUSAND CHF NOTES 2013 20121 20111
ASSETSNon-current assets
Property, plant and equipment 13 118,908 130,209 113,180
Intangible assets 14 118,093 134,135 141,743
Investments 15 28,349 31,636 72,256
Derivative financial instruments 20 0 0 459
Post-employment benefit assets 7 19,905 0 0
Deferred income tax assets 26 65,457 65,792 62,313
Total non-current assets 350,712 361,772 389,951
Current assets
Other receivables and other current assets 18 102,671 81,052 84,997
Unbilled forwarding services 91,192 85,227 77,346
Trade receivables 19 1,059,582 1,032,995 984,404
Derivative financial instruments 20 2,905 2,948 5,045
Other current financial assets 15/21 5,472 0 20,000
Cash and cash equivalents 21 336,923 393,061 573,579
Total current assets 1,598,745 1,595,283 1,745,371
Total assets 1,949,457 1,957,055 2,135,322
EQUITY AND LIABILITIESEquity
Share capital 22 2,375 2,375 50,000
Treasury shares 22 (3,339) (10,018) (197,278)
Retained earnings and reserves 698,472 741,155 1,066,074
Total equity attributable to owners of the parent 697,508 733,512 918,796
Non-controlling interests 23 11,673 9,241 9,082
Total equity 709,181 742,753 927,878
Non-current liabilities
Borrowings 24 208 257 231
Provisions 25 77,617 73,081 85,032
Post-employment benefit liabilities1 7 49,674 58,987 29,948
Deferred income tax liabilities1 26 16,533 13,919 18,707
Total non-current liabilities 144,032 146,244 133,918
Current liabilities
Trade payables 577,205 572,825 588,104
Other payables and accruals 152,017 149,459 144,354
Accrued cost of services 184,479 200,226 184,519
Borrowings 24 3,053 1,611 7,296
Derivative financial instruments 20 1,710 1,256 4,648
Provisions and other liabilities 27 155,366 124,479 125,420
Current income tax liabilities 22,414 18,202 19,185
Total current liabilities 1,096,244 1,068,058 1,073,526
Total liabilities 1,240,276 1,214,302 1,207,444
Total equity and liabilities 1,949,457 1,957,055 2,135,322
1 Prior year's figures have been restated due to the application of IAS 19 (as revised in 2011) retrospectively. Please refer to note 3.
Panalpina Annual Report 2013
Consolidated Financial Statements 65
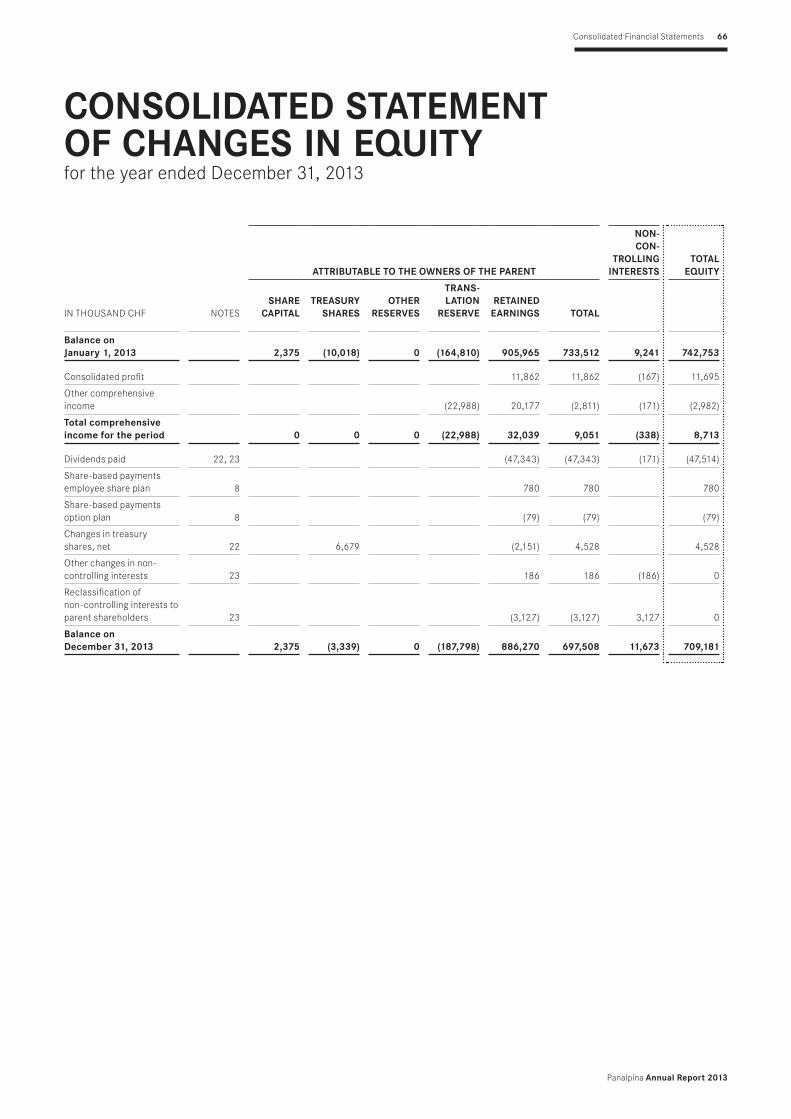
CONSOLIDATED STATEMENT OF CHANGES IN EQUITYfor the year ended December 31, 2013
ATTRIBUTABLE TO THE OWNERS OF THE PARENT
NON- CON-
TROLLING INTERESTS
TOTAL EQUITY
IN THOUSAND CHF NOTESSHARE
CAPITALTREASURY
SHARESOTHER
RESERVES
TRANS- LATION
RESERVERETAINED EARNINGS
TOTAL
Balance on January 1, 2013 2,375 (10,018) 0 (164,810) 905,965 733,512 9,241 742,753
Consolidated profit 11,862 11,862 (167) 11,695
Other comprehensive income (22,988) 20,177 (2,811) (171) (2,982)
Total comprehensive income for the period 0 0 0 (22,988) 32,039 9,051 (338) 8,713
Dividends paid 22, 23 (47,343) (47,343) (171) (47,514)
Share-based payments employee share plan 8 780 780 780
Share-based payments option plan 8 (79) (79) (79)
Changes in treasury shares, net 22 6,679 (2,151) 4,528 4,528
Other changes in non-controlling interests 23 186 186 (186) 0
Reclassification of non-controlling interests to parent shareholders 23 (3,127) (3,127) 3,127 0
Balance on December 31, 2013 2,375 (3,339) 0 (187,798) 886,270 697,508 11,673 709,181
Panalpina Annual Report 2013
Consolidated Financial Statements 66

CONSOLIDATED STATEMENT OF CHANGES IN EQUITYfor the year ended December 31, 2012
ATTRIBUTABLE TO THE OWNERS OF THE PARENT
NON- CON-
TROLLING INTERESTS
TOTAL EQUITY
IN THOUSAND CHF NOTESSHARE
CAPITALTREASURY
SHARESOTHER
RESERVES
TRANS- LATION
RESERVERETAINED EARNINGS
TOTAL
Balance on January 1, 2012 50,000 (197,278) (121,706) (162,103) 1,336,895 905,808 9,082 914,890
Reclassification of other reserves to retained earnings 121,706 (121,706) 0 0
Adjustment of DBO opening balance due to IAS 19R 3 17,203 17,203 17,203
Tax impact on effect of IAS 19R on DBO opening balance 3 (4,215) (4,215) (4,215)
Restated balance on January 1, 2012 50,000 (197,278) 0 (162,103) 1,228,177 918,796 9,082 927,878
Consolidated loss (restated) (72,102) (72,102) 271 (71,831)
Other comprehensive income (restated) (2,707) (19,469) (22,176) (66) (22,242)
Total comprehensive income for the period (restated) 0 0 0 (2,707) (91,571) (94,278) 205 (94,073)
Dividends paid 22, 23 (47,239) (47,239) (46) (47,285)
Capital repayment 22 (45,125) (45,125) (45,125)
Share-based payments employee share plan 8 1,946 1,946 1,946
Share-based payments option plan 8 264 264 264
Changes in treasury shares, net 22 2,299 (651) 1,648 1,648
Annihilation of shares repurchased 22 (2,500) 184,961 (184,961) (2,500) (2,500)
Balance on December 31, 2012 2,375 (10,018) 0 (164,810) 905,965 733,512 9,241 742,753
Prior year's figure have been restated due to the application of IAS 19 (as revised in 2011) retrospectively. Please refer to note 3.
Panalpina Annual Report 2013
Consolidated Financial Statements 67

CONSOLIDATED STATEMENT OF CASH FLOWS for the years ended December 31, 2013 and 2012
IN THOUSAND CHF NOTES 2013 20121
Consolidated profit / (loss) 11,695 (71,831)
Income tax expenses 11 23,777 27,741
Depreciation of property, plant and equipment 13 34,278 31,151
Amortization of intangible assets 14 18,478 13,094
Goodwill and customer list impairment 14 19,112 29,634
Impairment of financial assets 10 0 4,691
Finance income and dividend on available-for-sale financial assets 10 (3,205) (4,754)
Interest expenses 10 1,497 1,958
Exchange differences 10 10,584 7,380
Loss / (gain) on sales of property, plant and equipment 9 (980) 114
Gain on sales of financial assets 10 0 (9,890)
Share-based payment transactions 6 / 8 701 45
Other non-cash (income) and expenses (2,395) 2,356
113,542 31,689
Working capital adjustments:
(Increase) / decrease receivables and other current assets (121,615) (17,212)
Increase / (decrease) payables, accruals and deferred income 49,595 (33,847)
(Decrease) / increase long-term provisions 2,869 (3,643)
(Decrease) / increase short-term provisions and other liabilities 29,404 (16,631)
Cash generated from operations 73,795 (39,644)
Interest paid (1,497) (1,958)
Income taxes paid (29,831) (29,945)
Net cash from operating activities 42,467 (71,547)
Interest received 2,700 4,181
Dividends received 10 510 573
Proceeds from sales of property, plant and equipment 2,427 1,077
Proceeds from investments 2,685 27,937
Repayments of loans and long-term receivables 3,763 56,570
Repayments of other financial assets 952 798
Purchase of property, plant and equipment (28,618) (50,715)
Purchase of intangible assets and other assets (22,294) (34,291)
Purchase of investments (179) (9,275)
Purchase of other financial assets (9,914) (7,226)
Net cash used in investing activities (47,968) (10,371)
Free cash flow (5,501) (81,918)
Proceeds of short- and long-term borrowings 1,585 0
Repayment of short- and long-term borrowings 0 (2,120)
Dividends paid (47,343) (47,239)
Dividends paid to non-controlling interests 23 (171) (46)
Share capital paid back 22 0 (45,125)
Purchase of treasury shares 22 0 (3,981)
Sale of treasury shares 4,529 1,873
Net cash used in financing activities (41,400) (96,638)
Effect of exchange rate changes on cash and cash equivalents (9,237) (1,962)
Net increase (decrease) in cash and cash equivalents (56,138) (180,518)
Cash and cash equivalents at the beginning of the year 21 393,061 573,579
Cash and cash equivalents at the end of the year 21 336,923 393,061
1 Prior year's figures have been restated due to the application of IAS 19 (as revised in 2011) retrospectively. Please refer to note 3.
Panalpina Annual Report 2013
Consolidated Financial Statements 68

NOTES TO THE CONSOLIDATED FINANCIAL STATEMENTS
1 GENERAL INFORMATIONPanalpina World Transport (Holding) Ltd. (referred to hereafter as the Company) and its subsidiaries (collectively the “Group” and individually “Group Companies”) is one of the world’s leading providers of supply chain solutions. The company combines its core products of Air Freight, Ocean Freight and Logistics to deliver globally integrated, tailor-made end-to-end solutions. Drawing on in-depth industry knowledge and customized IT systems, Panalpina manages the needs of its customers’ supply chains, no matter how demanding they might be.
Panalpina World Transport (Holding) Ltd. is a limited company incorporated and domiciled in Basel. The registered address is Viadukt strasse 42, 4002 Basel, Switzerland. The Company shares are publicly traded and are listed on the SIX Swiss Exchange in Zurich.
The consolidated financial statements for the year ending December 31, 2013, were authorized for issuance in accordance with a resolution by the Board of Directors on February 28, 2014.
2 SUMMARY OF SIGNIFICANT ACCOUNTING POLICIESThe pricipal accounting policies applied in the preparation of these consolidated financial statements are set out below. These policies have been consistently applied to all the years presented, unless otherwise stated.
2.1 BASIS OF PREPARATION
2.2 STATEMENT OF COMPLIANCEThe consolidated financial statements are based on the accounts of the individual subsidiaries on December 31, which have been drawn up according to uniform Group accounting principles. The consolidated accounts have been prepared in accordance with International Financial Reporting Standards (IFRS) and comply with Swiss law.
2.3 BASIS OF MEASUREMENTThe consolidated financial statements have been prepared under the historical cost basis, except for available-for-sale financial assets, financial assets and financial liabilities (including derivative instruments) at fair value through profit and loss and liabilities for cash-settled share-based payment arrangements that have been measured at fair value. Net defined benefit liabilities (assets) are recognized at the net total of the plan assets and the present value of the defined benefit obligation.
A number of the Group’s accounting policies and disclosures require the measurement of fair values, for both financial and non- financial assets and liabilities. When measuring the fair value of an asset or a liability, the Group uses market observable data as far as possible. Fair values are categorised into different levels in a fair value hierarchy based on the inputs used in the valuation techniques as described in note 17. The Group recognises transfers between levels of the fair value hierarchy, if any, at the end of the reporting period during which the change has occurred. The methods used to measure fair values are discussed further in note 3. Further information about the assumptions made in measuring fair values is included in note 17.
2.4 PRESENTATION CURRENCYThe consolidated financial statements are presented in Swiss francs (CHF), which is the functional currency of the Company and all values are rounded to the nearest thousand except where otherwise indicated.
2.5 USE OF ESTIMATES AND JUDGMENTSThe preparation of the consolidated financial statements in conformity with IFRS requires management to make judgments, estimates and assumptions that affect application of accounting policies and the reported amounts of assets, liabilities, income and expenses. It requires management to exercise its judgments and assumptions in the process of applying the Group’s accounting policies. Actual results may differ from these estimates.
Estimates and underlying assumptions are reviewed on an ongoing basis. Deviations from estimates are recognized in the period in which the estimates are revised and in any future periods affected.
The areas involving a higher degree of judgment or complexity, or areas in which assumptions and estimates are significant to the consoli dated financial statements, are disclosed in note 4.
Panalpina Annual Report 2013
Consolidated Financial Statements 69
3 SIGNIFICANT ACCOUNTING POLICIESThe accounting policies set out below have been applied consistently to all periods presented in these consolidated financial statements and have been applied consistently by Group entities, unless otherwise stated. If necessary, comparative amounts have been reclassified to conform with the current year’s presentation.
The following new or revised standards, amendments to existing standards and interpretations have been adopted in 2013, effective from January 1, 2013: IFRS 10 “Consolidated Financial Statements”, IFRS 11 “Joint Arrangements”, IFRS 12 “Disclosure of Interests in Other Entities”, IFRS 13 “Fair Value Measurement” as well as IAS 1 (amended) “Presentation of Financial Statements – Presentation of Items of Other Comprehensive Income”, IAS 28 (amended) “Investments in Associates and Joint Ventures”, IFRS 7 (amended) “Financial Instruments – Disclosures – Offsetting of Financial Assets and Liabilities”, the amendments to IFRS 10, IFRS 11 and IFRS 12 “Consolidated Financial Statements, Joint Arrangements, Disclosure of Interests in Other Entities: Transition Guidance” and finally the amendments to IAS 19 “Employee benefits” (as revised in June 2011). Apart from IAS 19 revised, the adoption of the other revised standards, amendments to the standards and interpretations did not have any material impact on the consolidated financial statements of the Group. In addition the IASB issued annual improvements to its standards (IFRS 2009-2011 Cycle) primarily with a view to removing inconsistencies and clarifying the wording. In addition, the amendments to IAS 36 “Impairment of Assets – Recoverable Amount Disclosures for Non-Financial Assets”, IAS 19 “Defined Benefit Plans – Employee Contributions” and IAS 32 (amended) “Financial Instruments – Presentation – Offsetting Financial Assets and Financial Liabilities” have been early adopted in 2013.
The following new or revised standards, amendments to existing standards and interpretations have been issued, but are not yet ef-fective: Amendments to IFRS 10, IFRS 11, IAS 27 “Investment Entities” and IAS 39 “Novation of Derivatives and Continuation of Hedge Accounting” (effective date January 1, 2014), annual improvements to IFRS issued by IASB (IFRS 2010 – 2012 Cycle and IFRS 2011 – 2013 Cycle) (effective date July 1, 2014) and IFRS 9 “Financial Instruments” (effective date January 1, 2017 at the earliest). The Group has not yet analyzed in detail the changes to the accounting policies and the impact on the financial position of performance.
IAS 19 “Employee benefits”In the current year, the Group has applied IAS 19 (as revised in June 2011) “Employee Benefits” and the related consequential amendments. The Group has applied IAS 19 revised retrospectively and in accordance with the transitional provisions as set out in IAS 19.173 revised. These transitional provisions do not have an impact on future periods. The opening statement of financial position of January 1, 2012 has been restated.
The amendments to IAS 19 change the accounting for defined benefit plans and termination benefits. The most significant change relates to the accounting for changes in defined benefit obligations and plan assets. The amendments require the recognition of changes in defined benefit obligations and in fair value of plan assets when they occur and hence eliminate the “corridor approach” permitted under the previous version of IAS 19 and accelerate the recognition of past service costs. All actuarial gains and losses are recognized immediately through other comprehensive income in order for the net pension asset or liability recognized in the consolidated statement of financial position to reflect the full value of the plan deficit or surplus. Furthermore, the interest cost and expected return on plan assets used in the previous version of IAS 19 are replaced with a “net-interest” amount under IAS 19 revised, which is calculated by applying the discount rate to the net defined benefit liability or asset. IAS 19 revised introduces certain changes in the presentation of the defined benefit cost including more extensive disclosures. As the Group already eliminated the “corridor approach” prior to the application of IAS 19 revised and recognized all actuarial gains and losses in other comprehensive income (OCI) as they occurred and already recognized all past service cost, the main impact on Group level was the replacement of interest cost and the expected return on plan assets with the net- interest amount calculated by applying the discount rate to the net defined benefit liability / asset.
In addition, the amendments to IAS 19 “Defined Benefit Plans – Employee Contributions” issued in November 2013 have been early adopted in 2013 as foreseen in IAS 19.175. These amendments on risk sharing between employees and employer impact the defined benefit obligation and the allocation of service costs. The Group decided to apply the practical expedient and to recognize contributions from employees that are independent of the number of years of service (including those that are a fixed percentage of an employee’s salary and are dependent on an employee’s age) as a reduction of the service cost in the period in which the related service is rendered (IAS 19 paragraph 93 (b)). The opening statement of financial position of January 1, 2012 has been restated. If the Group had not early adopted these amendments or applied IAS 19 paragraph 93(a), the defined benefit obligation would have been lower by CHF 1.2 million as of January 1, 2012 and service costs would have been higher by CHF 0.5 million in the current period (2012: higher by CHF 0.6 million) and higher by CHF 0.6 million in the coming period, respectively.
Panalpina Annual Report 2013
Consolidated Financial Statements 70

Impact of application of IAS 19 (as revised in 2011 and amended in November 2013)
IAS 19 revised / amended has been adopted in accordance with IAS 8. Consequently, the Group has adjusted opening equity as of January 1, 2012 and the figures for 2012 have been restated as if IAS 19 revised / amended had always been applied. The ongoing impact for 2013 and beyond is expected to be of a similar magnitude.
IN THOUSAND CHF
POST- EMPLOY-
MENT BENEFIT
LIABILITIES
DEFERRED INCOME
TAX LIABILI-
TIES EQUITY
Balance as reported at January 1, 2012 47,151 14,492 914,890
Effect of application of IAS 19 (as revised in 2011 and amended in 2013) (17,203) 4,215 12,988
Restated balance at January 1, 2012 29,948 18,707 927,878
IN THOUSAND CHF
POST- EMPLOY-
MENT BENEFIT
LIABILITIES
DEFERRED INCOME
TAX LIABILI-
TIES EQUITY
Balance as reported at December 31, 2012 49,629 16,211 749,819
Effect of application of IAS 19 (as revised in 2011 and amended in 2013) on opening balance (17,203) 4,215 12,988
Effect on OCI for the year 24,381 (5,973) (18,408)
Effect on income statement for the year 2,180 (534) (1,646)
Restated balance at December 31, 2012 58,987 13,919 742,753
YEAR ENDED DECEMBER 31, 2012
IN THOUSAND CHF
AS ORIGI- NALLY
PUB-LISHED
APPLICA-TION
OF IAS 19 (REVISED) RESTATED
Gross profit 1,465,044 0 1,465,044
Personnel expenses (955,011) (2,180) (957,191)
EBITDA 36,482 (2,180) 34,302
Operating result (EBIT) (37,397) (2,180) (39,577)
Loss before income tax (EBT) (41,910) (2,180) (44,090)
Income tax expense (28,275) 534 (27,741)
Consolidated loss (70,185) (1,646) (71,831)
Consolidated loss attributable to:
Owners of the parent (70,456) (1,646) (72,102)
Non-controlling interests 271 0 271
Earnings per share (in CHF per share)
Basic (2.98) (0.07) (3.05)
Diluted (2.98) (0.07) (3.05)
Panalpina Annual Report 2013
Consolidated Financial Statements 71

Other changes in accounting policies
SubsidiariesAs a result of IFRS 10 (2011), the Group has changed its accounting policy for determining whether it has control over and consequently whether it consolidates its investees. IFRS 10 (2011) introduces a new control model that focuses on whether the Group has power over an investee, exposure or rights to variable returns from its involvement with the investee and ability to use its power to affect those returns. In accordance with the transitional provisions of IFRS 10 (2011), the Group reassessed the control conclusion for its investees at January 1, 2013, which did not result in any changes.
Fair value measurements (IFRS 13)IFRS 13 establishes a single framework for measuring fair value and making disclosures about fair value measurements when such measurements are required or permitted by other IFRSs. It unifies the definition of fair value as the price that would be received to sell an asset or paid to transfer a liability in an orderly transaction between market participants at the measurement date. It replaces and expands the disclosures requirements about fair value measurements in other IFRSs, including IFRS 7. As a result, the Group has included additional disclosures in this regard (see note 17).
Presentation of items of other comprehensive incomeAs a result of the amendments of IAS 1, the Group has modified the presentation of items of other comprehensive income (OCI) in its statement of comprehensive income, to present separately items that would be reclassified to profit or loss from those that would never be. Comparative information has been re-presented accordingly.
Offsetting of financial assets and financial liabilitiesAs a result of the amendments to IFRS 7, the Group has expanded its disclosures about the offsetting of financial assets and financial liabilities (see note 20).
3.1 BASIS OF CONSOLIDATION3.1.1 Consolidation policy
The subsidiaries are those companies controlled, directly or indirectly, by Panalpina World Transport (Holding) Ltd. The Group controls an entity when it is exposed to, or has rights to, variable returns from its involvement with the entity and has the ability to affect those returns through its power over the entity. This control is normally evidenced when the Group owns, either directly or indirectly, more than one half of the voting rights or currently exercisable potential voting rights of a company’s share capital. The existence and effect of potential voting rights that are currently exercisable or convertible are considered when assessing whether the Group controls another entity. The Group also assesses existence of control where it does not have more than 50 % of the voting power but is able to govern the financial and operating policies by de-facto control.
De-facto control may arise in circumstances where the size of the Group’s voting rights relative to the size and dispersion of holdings of other shareholders give the Group the power to govern the financial and operating policies.
Subsidiaries are fully consolidated from the date on which control is transferred to the Group and they are de-consolidated from the date that control ceases.
The Group applies the acquisition method of accounting to account for business combinations. The consideration transferred for the acquisition of a subsidiary is the fair value of the assets transferred, the liabilities incurred to the former owners of the acquiree and the equity interests issued by the Group. The consideration transferred includes the fair value of any asset or liability resulting from a contingent consideration arrangement. Identifiable assets acquired and liabilities and contingent liabilities assumed in a business combination are measured initially at fair values at the acquisition date. The Group recognizes any non-controlling interest in the acquiree on an acquisition-by-acquisition basis, at fair value of the recognized amounts of the acquiree’s identifiable net assets.
Acquisition-related costs are expensed as incurred.
If the business combination is achieved in stages, the acquisition date carrying value of the acquirer’s previously held equity interest in the acquiree is remeasured to fair value at the acquisition date, any gains or losses arising from such remeasurement are recognized in profit or loss.
Panalpina Annual Report 2013
Consolidated Financial Statements 72

Any contingent consideration to be transferred by the Group is recognized at fair value at the acquisition date. Subsequent changes to the fair value of the contingent consideration that is deemed to be an asset or liability is recognized in accordance with IAS 39 in profit or loss. Contingent consideration that is classified as equity is not remeasured and its subsequent settle-ment is accounted for within equity.
Goodwill is initially measured as the excess of the aggregate of the consideration transferred and the fair value of non-controlling interest over the net identifiable assets acquired and liabilities assumed. If this consideration is lower than the fair value of the net assets of the subsidiary acquired, the difference is recognized in profit or loss.
Intercompany transactions, balances, income and expenses on transactions between Group companies are eliminated. Profits and losses resulting from intercompany transactions that are recognized in assets are also eliminated.
Changes in ownership interest in subsidiaries without change of controlTransactions with non-controlling interests that do not result in loss of control are accounted for as equity transactions - that is, as transactions with the owners in their capacity as owners. The difference between fair value of any consideration paid and the relevant share acquired of the carrying value of net assets of the subsidiary is recorded in equity. Gains or losses on disposals to non-controlling interests are also recorded in equity.
Disposal of subsidiariesWhen the Group ceases to have control, any retained interest in the entity is remeasured to its fair value at the date when control is lost, with the change in carrying amount recognized in profit or loss. The fair value is the initial carrying amount for the purposes of subsequent accounting for the retained interest as an associate, joint venture or financial asset. In addition, any amounts previously recognized in other comprehensive income in respect of that entity are accounted for as if the Group had directly disposed of the related assets or liabilities. Amounts previously recognized in other comprehensive income are reclassified to profit or loss.
3.1.2 Operating segment informationManagement has determined the operating segments based on the reports reviewed by the Executive Board that are used to make strategic decisions. The Executive Board considers the business from a geographic perspective as the Group’s operations are predominately managed by geographical location. In the period under review, a new reporting structure became effective.Middle East / Africa / CIS and Europe are reported as two separate operating segments (previously one operating segment). Headquarter activities are no longer separately reported but included in the respective results of each segment in the segment information. The Executive Board assesses performance of the operating segments based on a measure of adjusted operating result (Segment EBIT). This measurement basis excludes the effects on non-recurring expenditure from the operating segments.
Transfer prices between operating segments are set out at arm’s-length basis. Operating assets and liabilities consist of property, plant and equipment, goodwill and intangible assets, trade receivables / payables, other assets and liabilities such as provisions and current income taxes, which can be reasonably attributed to the reported operating segments. Non-operating assets and liabilities mainly include deferred income tax balances, post-employment benefit assets / liabilities and financial assets / liabilities such as marketable securities and investments.
3.2 FOREIGN CURRENCY3.2.1 Functional currency
Most Group companies use their local currency as their functional currency. Certain Group companies use other currencies (such as US dollars or Euros) as their functional currency where this is the currency of the primary economic environment in which the entity or branch operates.
3.2.2 Transactions and balancesLocal transactions in other currencies are initially reported using the exchange rate at the date of the transaction or reporting date. Gains and losses from the settlement of such transactions and gains and losses on transactions of monetary assets and liabilities denominated in other currencies are included in the income statement, except when they arise on monetary items that, in substance, form part of the Group’s net investment in a foreign entity. In such cases, the gains and losses are deferred into other comprehensive income.
Panalpina Annual Report 2013
Consolidated Financial Statements 73

Non-monetary items that are measured in terms of historical cost in foreign currency are translated using the exchange rate as of the dates of the initial transaction. Non-monetary items measured at fair value in a foreign currency are translated using the exchange rates on the date on which the fair value is determined.
Changes in fair value of securities denominated in foreign currency classified as available-for-sale are split into components resulting from changes in the amortized cost of the security and other changes in the carrying amount of the security. Foreign exchange remeasurement differences related to changes in amortized cost are recognized in profit or loss, and other changes in the carrying amount are recognized in equity.
3.2.3 Presentation currencyOn consolidation, assets and liabilities of Group companies using functional currency other than Swiss francs are translated into Swiss francs using a year-end rate of exchange. Income, expenses and net income and cash flows are translated at the average rates of exchange for the year. Translation differences due to the changes in exchange rates between the beginning and the end of the year and the difference between net incomes translated at the average and year-end exchange rates are recognized as a separate component of other comprehensive income.
On disposal of a foreign entity, the identified cumulative currency translation differences within equity relating to that foreign entity are recognized in the income statement as part of the gain or loss on divestment.
Any goodwill arising on the acquisition is treated as assets and liabilities of the foreign operation and translated at the closing rate.
The most important exchange rates used in the reported financial statements are:
2013 2012
STATEMENT OF FINANCIAL
POSITION1 INCOME STATEMENT2
STATEMENT OF FINANCIAL POSITION1 INCOME STATEMENT2
EUR 1.22625 1.23048 EUR 1.20795 1.20525
USD 0.89014 0.92682 USD 0.91435 0.93821
HKD 0.11479 0.11949 HKD 0.11796 0.12095
CNY 0.14722 0.15074 CNY 0.14658 0.14869
CAD 0.83088 0.90004 CAD 0.91906 0.93851
GBP 1.46709 1.44952 GBP 1.47523 1.48651
BRL 0.38207 0.43150 BRL 0.44698 0.48190
1 Year-end rate2 Average rate
3.3 REVENUE RECOGNITIONNet forwarding revenue includes amounts received, receivables and unbilled services for forwarding and logistics services performed for customers after deducting trade discounts and volume rebates and excluding sales taxes and value-added taxes less charges for customs and duty.
Trade discounts and volume rebates are recorded on an accrual basis consistent with recognition of the related revenue recorded as a deduction for accounts receivable or as accrued liabilities. Such estimates are based on analyses of existing contractual obligations, historical trends and the Group’s experience.
Net forwarding revenue is recognized at the time the services are performed. Logistics projects with a longer period of delivery are recognized at the stage of completion of the services on the reporting date. The stage of completion is assessed with reference to completion of the specific transaction assessed on the basis of the actual service provided as a proportion of the total services to be provided. Where necessary, single transactions are split into separately identifiable components to reflect the substance of the transaction. Conversely, two or more transactions may be considered together for revenue recognition purposes, where the commercial effect cannot be understood without reference to the series of transactions as a whole.
Panalpina Annual Report 2013
Consolidated Financial Statements 74

Gross profit includes net forwarding revenue from services rendered less related expenses for services provided by third parties net of customs, duty and taxes.
Interest income is recognized as interest accrued using the effective interest method. Interest income is included in finance income in the income statement.
Dividends are recognized when the Group’s right to receive the payment is established.
3.4 FORWARDING SERVICES FROM THIRD PARTIESForwarding services from third parties include the corresponding direct services costs and related services costs rendered by a third party. Trade discounts and volume rebates are recorded on an accrual basis consistent with the recognition of the related services.
3.5 EMPLOYEE BENEFITS Wages, salaries, social security contributions, paid annual leave, sick leave and other benefits are paid or accrued undiscounted in the year in which the associated services are rendered by employees of the Group. Legal or constructive obligations such as bonus or profit-sharing plans are recognized for the amount expected to be paid in the year in which the services are provided.
Termination benefits are recognized as an expense when the Group is demonstrably committed, without realistic possibility of withdrawal, to a formal detailed plan to either terminate employment before the normal retirement date or to provide termination benefits as a result of an offer made to voluntary redundancy. Termination benefits for voluntary redundancies are recognized as expenses if the Group has made an offer of voluntary redundancy and it is probable that the offer will be accepted. If benefits are payable more than 12 months after the reporting date, then they are discounted to their present value.
3.5.1 Pension obligationGroup companies operate various pension schemes. The schemes are generally funded through payments to insurance companies or trustee-administered funds, determined by periodic actuarial calculations. The Group has both defined benefit and defined contribution plans. A defined contribution plan is a pension plan under which the Group pays fixed contributions into a separate entity. The Group has no legal or contractual obligations to pay further contributions if the fund does not hold sufficient assets to pay all employees the benefits relating to employee service in the current and prior periods. A defined benefit plan is a pension plan that is not a defined contribution plan.
Typically defined benefit plans define an amount of pension benefit that an employee will receive on retirement, usually dependent on one or more factors such as age, years of service and compensation.
The net defined benefit liability / asset recognized in the balance sheet in respect of defined benefit pension plans is the present value of the defined benefit obligation at the end of the reporting period less the fair value of plan assets. The defined benefit obligation is calculated annually by independent actuaries using the projected unit credit method. The present value of the defined benefit obligation is determined by discounting the estimated future cash outflows using interest rate of high- quality corporate bonds that are denominated in the currency in which the benefits will be paid and that have terms to maturity approximating to the terms of the related pension obligation. In countries where there is no deep market in such bonds, the market rates on government bonds are used.
Remeasurements of the net defined benefit liability / asset which comprise actuarial gains and losses arising from changes in ac-tuarial assumptions (both demographic and financial) and experience adjustments, the return of plan assets (excluding interest) and the effect of the asset ceiling (if any, excluding interest), are charged or credited immediately to equity in other comprehen-sive income. The Group determines the net interest expense on the net defined benefit liability / asset at the beginning of the an-nual period to the net defined benefit liability / asset, taking into account any changes in the net defined benefit liability / asset during the period as a result of contributions and benefit payments. Net interest expense and other expenses related to defined benefit plans are recognized in the income statement.
When the benefits of a defined benefit plan are changed or amended or when a defined benefit plan is curtailed, the resulting change in benefit that relates to past service or the gain or loss on curtailment is recognized immediately in the income statement. The Group recognizes gains and losses on the settlement of a defined benefit plan when the settlement occurs.
Panalpina Annual Report 2013
Consolidated Financial Statements 75

The Group applies the practical expedient and recognizes contributions from employees that are independent of the number of years of service (including those that are a fixed percentage of an employee’s salary and are dependent on an employee’s age) as a reduction of the service cost in the period in which the related service is rendered (IAS 19 paragraph 93 (b)).
For defined contribution plans, the Group pays contributions to publicly or privately administered pension insurance plans on a mandatory, contractual or voluntary basis. The Group has no further payment obligations once the contributions have been paid. The contributions are recognized as employee benefit expense when they are due. Prepaid contributions are recognized as an asset to the extent that a cash refund or a reduction in the future payments is available.
3.5.2 Other long-term employee benefitsNet obligation in regard to long-term employee benefits other than pension plans is the amount of future benefits that employ-ees have earned in return for their service in the current and / or prior periods. Benefits are discounted to determine their present value and the fair value of any related asset is deducted. The expected costs of these benefits are accrued over the period of employment using the same method of valuation that is used for defined benefit pension plans. Any actuarial gains or losses that consist of differences between assumptions and actual experiences and the effects of changes in actuarial assump-tions are recognized in the income statement in the period in which they arise.
3.5.3 Share-based compensationThe Group operates a number of equity-settled share-based compensation plans under which the entity receives services from employees as consideration for equity or equity instruments (options) of the Group. The fair value of the employee services received in exchange for the granting of the options and the discount on the shares granted is estimated at the grant date and recorded as an expense over the vesting period. The expense is recognized as other employee benefits in the income statement. For equity-settled plans, an increase in equity is recorded for this expense and any subsequent cash flows from exercises of vested awards are recorded as changes in equity. For cash-settled plans, a liability is recorded that is measured at fair value at each reporting date with any movements in fair value being recorded in the income statement. Any subsequent cash flows from exercise of vested awards are recorded as a reduction of the liability.
3.6 OTHER OPERATING EXPENSESOther operating expenses primarily include administrative expenses, communication expenses, rent and utilities expenses, travel and promotion expenses, insurance expenses and claims, changes in provisions from impairments of trade receivables and collection expenses, and other operating expenses necessary to render forwarding revenue to third parties. The expenses are recognized when the expenses recorded on an accrual basis have been incurred.
3.7 FINANCE INCOME AND COSTSFinance income comprises interest income on funds invested, dividend income from investments, cash discounts, gains on disposals of available-for-sale financial assets, changes in the fair value of financial assets at fair value through profit or loss, and gains on derivatives that are recognized in profit or loss. Interest income is recognized as it accrues in profit or loss using the effective interest method.
Finance costs comprise interest expense on borrowings, unwinding of the discount on provisions, cash discounts, changes in the fair value of financial assets at fair value through profit or loss, impairment losses recognized on financial assets, losses on hedging instruments that are recog nized in profit or loss, bank charges and bank guarantee fees. All borrowing costs are recognized in profit or loss using the effective interest method.
3.8 CURRENT AND DEFERRED INCOME TAX EXPENSESThe tax expense for the period comprises current and deferred tax. Tax is recognized in the income statement, except to the extent that it relates to items recognized in other comprehensive income or directly in equity. In this case, the tax is also recognized in other comprehensive income or directly in equity, respectively.
The current income tax charge is calculated on the basis of the tax laws enacted or substantively enacted at the balance sheet date in the countries where the Company and its subsidiaries operate and generate taxable income. Management periodically evaluates positions taken in tax returns with respect to situations in which applicable tax regulation is subject to interpretation. It establishes provisions where appropriate on the basis of amounts expected to be paid to the tax authorities.
Panalpina Annual Report 2013
Consolidated Financial Statements 76

Deferred income tax is recognized, using the liability method, on temporary differences arising between the tax bases of assets and liabilities and their carrying amounts in the consolidated financial statements. However, deferred tax liabilities are not recognized if they arise from the initial recognition of goodwill; deferred income tax is not accounted for if it arises from initial recognition of an asset or liability in a transaction other than a business combination that at the time of the transaction affects neither accounting nor taxable profit or loss. Deferred income tax is determined using tax rates that have been enacted or substantively enacted by the balance sheet date and are expected to apply when the related deferred income tax asset is real-ized or the deferred income tax liability is settled.
Deferred income tax assets are recognized only to the extent that it is probable that future taxable profit will be available against which the temporary differences can be utilized.
Deferred income tax is provided on temporary differences arising on investments in subsidiaries and associates, except for deferred income tax liability where the timing of the reversal of the temporary difference is controlled by the Group and it is probable that the temporary difference will not reverse in the foreseeable future.
Deferred income tax assets and liabilities are offset when the income taxes are levied by the same taxation authority and when there is a legally enforceable right to offset them. Deferred income tax is measured based on the currently enacted tax rates applicable in each tax jurisdiction where the Group operates.
3.9 PROPERTY, PLANT AND EQUIPMENTProperty, plant and equipment are measured at cost, net of accumulated depreciation and/or accumulated impairment losses, if any. Initially property, plant and equipment are recorded at cost of purchase or construction and include all costs directly attributable to bringing the asset to the location and condition necessary for it to be capable of operating in the manner intended by management. Interest and other borrowing costs for long-term construction projects are capitalized and included in the carrying value of the assets. All other repair and maintenance costs of the day-to-day servicing are recognized in the income statement as incurred. The present value of the expected cost for the decommissioning of the asset after its use is included in the cost of the respective asset if the recognition criteria for a provision are met. When components of an item of property, plant and equipment have different useful lives, they are accounted for as separate items of property, plant and equipment.
Gains and losses on a disposal of an item of property, plant and equipment are determined by comparing the proceeds from disposal with the carrying amount of property, plant and equipment, and are recognized net within gains or losses on sales of non-current assets in the income statement.
Land and buildings are carried at cost less depreciation and / or accumulated impairment losses.
Depreciation is recognized in the income statement on a straight-line basis over the estimated useful lives of each part of an item of property, plant and equipment. Leased assets are depreciated over the shorter of the lease term and their useful lives unless it is reasonably certain that the Group will obtain ownership by the end of the lease term. Land and construction in progress are not depreciated.
The estimated useful lives for the current and comparative periods are as follows:
YEARS
Warehouse and office buildings 25 – 40
Warehouse and transportation equipment 3 – 10
Office furnishings and equipment 5 – 10
EDP hardware 3
Trucks, trailers and special vehicles 3 – 10
Automobiles 3 – 5
The assets’ residual value and estimated useful lives are regularly reviewed and adjusted. If appropriate, the future depreciation charge is accelerated.
Panalpina Annual Report 2013
Consolidated Financial Statements 77

3.10 LEASESWhere the Group is the lessee, leases of property, plant and equipment where the Group has substantially all of the risks and rewards of ownership are classified as finance leases. Financial leases are capitalized at the start of the lease at fair value or the present value of the minimum lease payments, if lower. Assets acquired under finance leases are depreciated in accordance with the Group’s policy on property, plant and equipment. If there is no reasonable certainty that the Group will obtain ownership by the end of the lease term, the asset is depreciated over the shorter of the lease term and useful life. Leases where substantially all of the risks and rewards of ownership are not transferred to the Group are classified as operating leases. Payments made under operating leases are charged against the income statement on a straight-line basis over the period of the lease.
The corresponding leasing obligations, net of finance charges, are included in borrowings. The interest element of the finance cost is charged to the income statement over the lease period in order to produce a constant periodic rate of interest on the remaining balance of the liability for each period.
3.11 INTANGIBLE ASSETS3.11.1 Business combination and goodwill
Business combinations are accounted for using the acquisition method of accounting. The consideration transferred in a business combination is measured at fair value at the date of acquisition and includes the cash paid plus the fair value at the date of exchange of assets given, liabilities incurred or assumed and equity instruments issued by the Group. The fair value of the consideration transferred also includes contingent consideration arrangements at fair value. Directly attributable acquisition- related costs are expensed in the income statement. At the date of acquisition the Group recognizes the identifiable assets acquired and the liabilities assumed at fair value. Where the Group does not acquire 100 % ownership of the acquired business, non-controlling interests are recorded as the proportion of the fair value of the acquired net assets attributable to non- controlling interest. Goodwill is recorded as the surplus of the consideration transferred over the Group’s interest in the fair value of acquired net assets. Any goodwill and fair value adjustments are recorded as assets and liabilities of the acquired business in the functional currency of that business. If the initial accounting for a business combination is incomplete at the end of a reporting period, provisional amounts are used. During the measurement period, the provisional amounts are retrospec tively adjusted and additional assets and liabilities may be recognized, to reflect new information obtained about the amounts recognized at that date, had they been known. Goodwill is not amortized but assessed for possible impairment at each reporting date and is additionally tested annually for impairment. For the purpose of impairment testing, goodwill acquired in a business combination is allocated to each of the Group’s cash-generating units that are expected to benefit from the synergies of the combination, irrespective of whether other assets or liabilities of the acquiree are assigned to those units. Changes in ownership interest in subsidiaries are accounted for as equity transactions if they occur after control has already been obtained and if they do not result in a loss of control.
3.11.2 Trademarks and licensesSeparately acquired trademarks and licenses are shown at historical cost. Trademarks and licenses acquired in a business combination are recognized at fair value at the acquisition date. Trademarks and licenses have a finite useful life and are carried at cost less accumulated amortization and accumulated impairment losses. Amortization is calculated using the straight-line method to allocate the cost of trademarks and licenses over their estimated useful lives of five to ten years.
3.11.3 Customer relationshipsCustomer relationships acquired in a business combination are recognized at fair value at the acquisition date. Customer relations have a finite useful life and are carried at cost less accumulated amortization and / or accumulated impairment losses. Amortization is calculated using the straight-line method over the expected life of the customer relationship of three to five years.
3.11.4 Computer softwareDevelopment costs that are directly attributable to the design and testing of identifiable and unique software products controlled by the Group are recognized as intangible assets when the following criteria are met:
– it is technically feasible to complete the software product so that it will be available for use; – management intends to complete the software product and use or sell it; – there is an ability to use or sell the software product; – it can be demonstrated how the software product will generate probable future economic benefits;
Panalpina Annual Report 2013
Consolidated Financial Statements 78
– adequate technical, financial and other resources to complete the development and to use or sell the software product are available; and
– the expenditure attributable to the software product during its development can be reliably measured.
Directly attributable costs that are capitalized as part of the software product include software development costs, employee costs and an appropriate portion of relevant overhead costs. Other development expenditures that do not meet these criteria are recognized as an expense as incurred. Development costs previously recognized as expenses are not recognized as an asset in a subsequent period. Costs associated with maintaining computer software programs are recognized as an expense as incurred. Computer software development costs recognized as assets are amortized over their estimated useful life, which does not exceed three to eight years.
3.11.5 Other intangible assetsOther intangible assets that are acquired by the Group that have finite useful lives are measured at cost less accumulated amortization and accumulated impairment losses.
3.12 IMPAIRMENT OF PROPERTY, PLANT AND EQUIPMENT AND INTANGIBLE ASSETSAn impairment assessment is carried out when there is evidence that an asset may be impaired. In addition, intangible assets that are not yet available for use are tested for impairment annually. If any such indication exists, or when annual impairment testing for an asset is required, the Group makes an estimate of the asset’s recoverable amount. An asset’s recoverable amount is the higher of an asset’s or cash-generating unit’s fair value less costs to sell, and its value in use, and is determined for an individual asset, unless the asset does not generate cash inflows that are largely independent of those from other assets or asset groups. Where the carrying amount of an asset exceeds its recoverable amount, the asset is considered impaired and is written down to its recoverable amount. In assessing value in use, the estimated future cash flows are discounted to their present value using a pre-tax discount rate that reflects current market assessments of the time value of money and the risks specific to the asset. An appropriate valuation model is used to determine fair value less costs to sell. These calculations are corroborated by valuation multiples, quoted share prices for publicly traded subsidiaries or other available fair value indicators. Impairment losses are recognized in the income statement. When an impairment loss arises, the useful life of the asset in question is reviewed and, if necessary, the future depreciation / amortization charge is accelerated.
3.13 IMPAIRMENT OF GOODWILLGoodwill impairment reviews are undertaken annually or more frequently if events or changes in circumstance indicate a potential impairment. When the recoverable amount of the cash-generating units, being the higher of its fair value less costs to sell or its value in use, is less, then the carrying value of the goodwill is reduced to its recoverable amount. The reduction is reported in the income statement as an impairment loss. The methodology used in the impairment testing is further described in note 14.
3.14 FINANCIAL ASSETSFinancial assets, including cash and marketable securities, short- and long-term deposits, trade and other receivables, loans and other receivables, quoted and unquoted financial instruments and derivative financial instruments, are classified either as fair value through profit or loss, loans and receivables, available-for-sale, or in exceptional cases, as held to maturity. The classi- fication depends on the purpose for which the financial assets were acquired. Management determines the classification of its financial assets at initial recognition. All financial assets are initially recognized at fair value plus, in the case of investments not at fair value through profit or loss, directly attributable transaction costs. All purchases and sales are recognized on the settlement date.
3.14.1 Subsequent measurementFinancial assets at fair value through profit or lossFinancial assets at fair value through profit or loss include financial assets held for trading and financial assets designated on initial recognition at fair value through profit or loss. Financial assets are classified as held for trading if they are acquired for the purpose of selling in the near term. This category includes derivative financial instruments entered into by the Group that do not meet the hedge accounting criteria. Derivatives, including separately embedded derivatives, are also classified as held for trading unless they are designated as effective hedging instruments. Financial assets at fair value through profit or loss are carried on the statement of financial position at fair value with gains or losses recognized in the income statement.
Panalpina Annual Report 2013
Consolidated Financial Statements 79

Loans and receivablesLoans and receivables are non-derivative financial assets with fixed or determinable payments that are not quoted in an active market. Such financial assets are normally carried at amortized cost using the effective interest rate method. Gains and losses are recognized in the income statement when the loans and receivables are derecognized or impaired, as well as through the amortization process.
Trade receivables originated by the Group are financial assets that are created by providing money or services directly to the debtor. Such receivables are not quoted and are not originated with the intention to be sold immediately or in the near term. Receivables are presented in current assets for maturities up to 12 months (accounting treatment of trade receivables is outlined in more detail in the section: Trade receivables).
Held-to-maturity investmentsNon-derivative financial assets with fixed or determinable payments and fixed maturities are classified as held to maturity when the Group has the positive intention and ability to hold them until maturity. After initial measurement, held-to-maturity investments are measured at amortized cost using the effective interest method. This method uses an effective interest rate that exactly discounts estimated future cash receipts through the expected life of the financial asset to the net carrying amount of the financial asset. Gains and losses are recognized in the income statement when the investments are derecognized or impaired, as well as through the amortization process. The Group did not have any held-to-maturity investments during the periods under review.
Available-for-sale financial assetsAvailable-for-sale financial assets are non-derivative financial assets that are designated as available-for-sale or are not classified in any of the three preceding categories. After initial measurement, available-for-sale financial assets are measured at fair value with unrealized gains or losses recognized in comprehensive income until the investment is derecognized, at which time the cumulative gain or loss recorded in comprehensive income is recognized in the income statement, or determined to be impaired, at which time the cumulative loss recorded in comprehensive income is recognized in the income statement.
3.15 FAIR VALUE OF FINANCIAL INSTRUMENTSFair value is the amount for which a financial asset, liability or instrument could be exchanged between knowledgeable and willing parties in an arm’s-length transaction. It is determined by reference to quoted market prices or by the use of established valuation techniques such as option pricing models and the discounted cash flow method if quoted prices in an active market are not available. Valuation tech niques will incorporate observable market data about market conditions and other factors that are likely to affect the fair value of a financial instrument. Valuation techniques are typically used for derivative financial instruments. The fair values of financial assets and liabilities at the reporting date are not materially different to their reported carrying value unless specifically mentioned in the notes to the consolidated financial statements. Information on fair value hierarchy is included in note 17 on risk management.
3.16 AMORTIZED COST OF FINANCIAL INSTRUMENTSAmortized cost is computed using the effective interest method less any allowance for impairment and principal repayment or reduction. The calculation takes into account any premium or discount on acquisition and includes transaction costs that are an integral part of the effective interest rate.
3.17 IMPAIRMENT OF FINANCIAL ASSETSFinancial assets are individually assessed for possible impairment at each reporting date. An impairment charge is recorded where there is objective evidence of impairment, such as where the issuer is in bankruptcy, default or other significant financial difficulty. In addition, any available-for-sale equity securities that have a market value of more than 25 % below their original cost, net of any previous impairment, will be considered as impaired. Any available-for-sale equity securities that have a market value below their original cost, net of any previous impairment, for a sustained six-month period will also be considered as impaired. Any decreases in the market price of less than 25 % of original cost, net of any previous impairment, which are also for less than a sustained six-month period are not by themselves considered as objective evidence of impairment. Such movements in fair value are recorded in equity until there is objective evidence of impairment or until the asset is sold or otherwise disposed of. For financial assets carried at amortized cost, any impairment charge is the difference between the carrying value and the recoverable amount, calculated using estimated future cash flows discounted using the original effective interest rate. For available-for-sale financial assets, the original cost, net of any previous impairment charge, is the amount currently carried in equity for the difference between the original cost, net of any previous impairment, and at fair value. An impairment loss is
Panalpina Annual Report 2013
Consolidated Financial Statements 80

reversed if the reversal can be related objectively to an event occurring after the impairment loss was recognized. For debt securities measured at amortized cost that are available-for-sale, the reversal is recognized in income statement. For equity held available-for-sale, the reversal is recognized directly in equity.
3.18 DERECOGNITION OF FINANCIAL ASSETSA financial asset is derecognized when:
– the Group’s rights to receive cash flows from the asset have expired; or – the Group has transferred its rights to receive cash flows from the asset or has assumed an obligation to pay the received cash flows in full without material delay to a third party under a “pass-through” arrangement; and either (a) the Group has transferred substantially all the risks and rewards of the asset or (b) the Group has neither transferred nor retained substantially all the risks and rewards of the asset, but has transferred control of the asset.
3.19 DERIVATIVESThe Group holds derivative financial instruments to hedge its foreign currency and interest rate risk exposures. Derivative financial instruments are initially recognized and subsequently carried at fair value on the date a derivative contract is entered into. Apart from those derivatives designated as qualifying cash flow hedging instruments in the “hedging” policy below, all changes in fair value are recorded as financial income in the period in which they arise. Embedded derivatives are recognized separately if not closely related to the host contract and where the host contract is carried at amortized cost. Attributable transaction costs are recognized in the income statement when incurred.
Derivatives are carried as financial assets when the fair value is positive and as financial liabilities when the fair value is negative.
The fair value of forward currency contracts is the difference between the forward exchange rate and the contract rate. The forward exchange rate is referenced to current forward exchange rates for contracts with similar maturity profiles. The fair value of interest swap contracts is determined by reference to market value for similar instruments.
3.20 HEDGE ACCOUNTINGFor the purpose of hedge accounting, hedging relationships may be of three types. A fair value hedge is a hedge of the exposure to changes in fair value of a recognized asset or liability, or an unrecognized commitment, or an identified portion of such an asset, liability or commitment that is attributable to a particular risk and could affect profit or loss. A cash flow hedge is a hedge of the exposure to variability in cash flows that is attributable to a particular risk associated with a recognized asset or liability or a highly probable forecast transaction and could affect the income statement. A “hedge of a net investment in a foreign operation” is a hedge of the foreign currency exposure on a net investment in a foreign operation.
To qualify for hedge accounting, the hedging relationship must meet several strict conditions on documentation, probability of occurrence (for cash flow hedges), hedge effectiveness and reliability of measurement. If these conditions are not met, then the derivative instrument does not qualify for hedge accounting. In this case, the hedging instrument and the hedged item are valued independently of one another. The derivative hedging instrument is reported at fair value with the changes in fair value included in the income statement. Where the Group will hold a derivative as an economic hedge for a period beyond 12 months after the statement of financial position date, the derivative is classified as non-current consistent with the classification of the underlying item.
At the inception of a hedge relationship, the Group formally designates and documents the hedge relationship to which the Group wishes to apply hedge accounting and the risk management objective and strategy for undertaking the hedge. The documentation includes identification of the hedging instrument, the hedged item or transaction, the nature of the risk being hedged and how the entity will assess the hedging instrument’s effectiveness in offsetting the exposure to changes in the hedged item’s fair value or cash flow attributable to the hedged risk. Such hedges are expected to be highly effective in achieving offsetting changes in fair value or cash flows and are assessed on an ongoing basis to determine whether they actually have been highly effective throughout the financial reporting periods for which they were designated.
Hedges that meet the strict criteria for hedge accounting are accounted for as follows:
Fair value hedgesThe change in the fair value of hedging derivatives is recognized in the income statement. The change in the fair value of the hedged item attributable to the risk hedged is recorded as part of the carrying value of the hedged item and is also recognized in the income statement.
Panalpina Annual Report 2013
Consolidated Financial Statements 81

For fair value hedges relating to items carried at amortized cost, the adjustment to carrying value is amortized through the income statement over the remaining term to maturity. Amortization may begin as soon as an adjustment exists and shall begin no later than when the hedge item ceases to be adjusted for changes in its fair value attributable to the risk being hedged. If the hedge item is derecognized, the unamortized fair value is recognized immediately in the income statement.
When an unrecognized firm commitment is designated as a hedged item, subsequent cumulative change in the fair value of the firm commitment attributable to the hedged risk is recognized as an asset or liability with a corresponding gain or loss recognized in the income statement.
Cash flow hedgesThe effective portion of the gain or loss on the hedging instrument is recognized directly in equity, while any ineffective portion is recognized in the income statement. Amounts taken to equity are transferred to the income statement when the hedged transaction affects profit or loss, such as when the hedged financial income or financial expense is recognized or when a forecast sale occurs. Where the hedged item is the cost of a non-financial asset or non-financial liability, the amounts taken to equity are transferred to the initial carrying amount of the non-financial asset or liability.
If the forecast transaction or firm commitment is no longer expected to occur, amounts previously recognized in equity are transferred to the income statement. If the hedging instrument expires or is sold, terminated or exercised without replacement or rollover, or if its designation as a hedge is revoked, amounts previously recognized in equity remain in equity until the forecast transaction or firm commitment occurs.
Hedges of a net investmentHedges of a net investment in a foreign operation, including a hedge of a monetary item that is accounted for as part of the net investment, are accounted for in a manner similar to cash flow hedges. Gains or losses on the hedging instrument relating to the effective portion of the hedge are recognized directly in equity while any gains or losses relating to the ineffective portion are recognized in the income statement. On disposal of the foreign operation, the cumulative value of any such gains or losses recognized directly in equity is transferred to the income statement.
Hedging activities and derivative financial instrumentsThe Group uses foreign-currency-denominated borrowings and forward contracts to manage its transaction exposures. These currency forward contracts are not designated as cash flow, fair value or net investment hedges and are entered into for periods consistent with currency transaction exposure (generally one to six months). Such derivatives do not qualify for hedge accounting.
At year-end, the contract value is calculated on the total volume of individual contracts using the fair value at this time. The positive replacement value represents the theoretical profit if the open currency contracts were closed out as of December 31. Correspondingly, the negative replacement value represents the theoretical loss on closing the currency transactions open as of December 31.
3.21 TRADE RECEIVABLESTrade receivables are carried at the original invoice amount less valuation adjustments for impairment, trade discounts, volume rebates and similar allowances. Subsequently, accounts receivable are measured at amortized cost using the effective interest method. An allowance for doubtful accounts trade receivables is recorded when there is objective evidence that the Group will not be able to collect all amounts due according to the original terms of receivables. Significant financial difficulties of the debtor, probability that the debtor will enter bankruptcy or financial reorganization, and default or delinquency in payments (more than 30 days overdue) are considered indicators that the trade receivable is impaired. The amount of the provision is the difference between the asset’s carrying amount and the present value of estimated future cash flows. The carrying amount of the asset is reduced through the use of an allowance account, and the amount of the loss is recognized in the income statement within other operating expenses. When a trade receivable is uncollectible, it is written off against the allowance account for trade receivables. Subsequent recoveries of amounts previously written off or 100 % impaired are credited against operating expenses in the income statement. Trade discounts, volume rebates and similar allowances are recorded on an accrual basis consistent with the recognition of the related sales, using estimates based on existing contractual obligations, historical trends and the Group’s experience. Long-term accounts receivable are discounted to take into account the time value of money.
Panalpina Annual Report 2013
Consolidated Financial Statements 82

3.22 UNBILLED FORWARDING SERVICESUnbilled forwarding services represent the gross unbilled amount expected to be collected from customers for forwarding services in progress for which costs are incurred but not yet invoiced. For logistics projects and other services with a longer period of delivery, recognized profits are included.
3.23 CASH AND CASH EQUIVALENTS AND OTHER CURRENT FINANCIAL ASSETSCash and cash equivalents included in the statement of financial position and statement of cash flows represent cash on hand, bank and postal checks, bills of exchange net, current balance with banks and similar institutions less bank overdraft and time deposits and highly liquid money market papers with a maturity period of less than three months from the date of acquisition. Such balances are reported as cash only if they are readily convertible to known amounts of cash and are subject to insignificant risk of change in value.
Other current financial assets include time deposits and highly liquid money market papers with a maturity period of between three months and one year.
3.24 SHARE CAPITALOrdinary shares are classified as equity. Incremental costs directly attributable to the issue of new shares or options are recognized in equity as a deduction, net of tax effects, from the proceeds.
3.25 TREASURY SHARESWhen share capital recognized as equity is repurchased, the amount of the consideration paid, which includes directly attributable costs, is net of any tax effects and is recognized as a deduction from equity. Repurchased shares are classified as treasury shares and are presented as a deduction from total equity. Where such shares are subsequently reissued, any consideration received, net of any directly attributable incremental transaction costs and the related income tax effects, the resulting surplus or deficit on the transaction is transferred to retained earnings.
3.26 RETAINED EARNINGS AND OTHER RESERVESRetained earnings and other reserves contain legal reserves that are not distributable to the shareholders pursuant to Swiss law, cumulative translation adjustments of all foreign currency differences arising from the translation of the financial statements of foreign operations, cumulative actuarial gains and losses from defined benefit post-employment plans net of taxes and accumulated difference in available-for-sale assets.
3.27 FINANCIAL LIABILITIESFinancial liabilities are either classified as financial liabilities at fair value through profit or loss, financial liabilities at amortized cost or as derivatives designated as hedging instruments in an effective hedge as appropriate. The Group determines the classification of its financial liabilities at initial recognition. Financial liabilities are recognized initially at fair value and, in the case of loans and borrowings, directly attributable transaction costs. The Group’s financial liabilities include trade and other payables, loans and borrowings and derivative financial instruments.
3.27.1 Subsequent measurementFinancial liabilities at fair value through profit or loss include financial liabilities held for trading and financial liabilities designated on initial recognition as at fair value through profit or loss. This category includes derivative financial instruments entered into by the Group that do not meet the hedge accounting criteria. Gains or losses on liabilities at fair value through profit or loss are recognized in the income statement.
3.27.2 BorrowingsAfter initial recognition, interest-bearing loans and borrowings are subsequently measured at amortized cost. Any discount between the net proceeds received and the principal value due on redemption is amortized over the duration of the debt instruments and is recognized as part of financing costs using the effective interest rate method.
3.27.3 Derecognition of financial liabilitiesFinancial liabilities are derecognized when the obligation under the liability is discharged or cancelled or expired. Where a financial liability is replaced by another from the same lender on substantially different terms, or the terms of an existing liability are substantially modified, such an exchange or modification is treated as a derecognition of the original liability. The recognition of a new liability and the difference in the respective carrying amounts is recognized in the income statement.
Panalpina Annual Report 2013
Consolidated Financial Statements 83

3.28 PROVISIONSProvisions are recognized where a legal or constructive obligation has been incurred and if an outflow of resources is probable and can be estimated reliably. Provisions are recorded for the estimated ultimate liability that is expected to arise, taking into account foreign currency effects arising from their translation from their functional currency into Swiss francs and the time value of money where material, determined by discounting the expected future cash flows at a pre-tax rate that reflects current market assessments of the time value of money and the risks specific to the liability. The unwinding of the discount is recognized as finance cost. Provisions are established in particular for accrued costs of services, freight forwarding claims, short-term employee benef its, termination and other long-term employee benef its, post-employment benef it liabilities and decommissioning provisions. Provisions for restructuring are recognized only when the Group has approved a detailed and formal restructuring plan, and the restructuring either has commenced or has been announced publicly. Future operating costs are not provided for.
4 CRITICAL ACCOUNTING ESTIMATES AND JUDGMENTSEstimates and judgments are continually evaluated and are based on historical experience and other factors, including expectations of future events that are believed to be reasonable under the circumstances.
4.1 CRITICAL ACCOUNTING ESTIMATIONS AND ASSUMPTIONSThe Group makes estimates and assumptions concerning the future. The resulting accounting estimates will, by definition, seldom equal the related actual results. The estimates and assumptions that have a significant risk of causing a material adjust-ment to the carrying amounts of assets and liablilities within the next financial year are addressed below.
4.1.1 Impairment of goodwillThe Group tests periodically whether goodwill has suffered any impairment in accordance with the Group’s accounting policy and details are disclosed in note 14 – Intangible assets, section: Impairment test for goodwill. The recoverable amounts of cash- generating units (CGUs) have been determined based on value-in-use calculations. The underlying calculations require the use of estimates.
An impairment charge of CHF 19.1 million (2012: CHF 18.0 million) arose in the Norwegian CGU during the course of the year 2013, resulting in the goodwill position of the CGU being fully written down.
4.1.2 Pension and other post-employment benefitsThe expense of defined benefit pension plans and other post-employment medical benefits and the present value of the pension obligation are determined using actuarial valuations. The actuarial valuation involves making assumptions about discount rates, expected rates of return of assets, future salary increases, mortality rates and future pension increases. All assumptions are reviewed at each reporting date. When determining the appropriate discount rate, management considers the interest rates on high-quality corporate bonds (with an AAA or AA rating) in the respective country and appropriate duration. The mortality rate is based on publicly available mortality tables for the specific country. Future salary increases and pension increases are based on expected future inflation rates for the specific country. Such differences are recognized in full directly in other comprehensive income in the period in which they occur without affecting the income statement. At December 31, 2013 the Group had a surplus of the fair value of plan assets compared to the present value of funded obligations of CHF 15.6 million (2012: deficit of CHF 13.6 million) for funded plans and a negative present value of unfunded plans of CHF 45.4 million (2012: CHF 45.4 million). The actuarial assumptions used may differ materially from actual results due to changes in market and economic conditions, higher or lower withdrawal rates, longer or shorter life spans of participants and other changes in the factors assessed. These differences could impact the assets or liabilities recognized in the statement of financial position in future periods. Additional information is disclosed in note 7.
4.1.3 ProvisionsA number of subsidiaries are subject to litigation arising from the normal conduct of their businesses, as a result of which claims could be raised against them.
The Group has established a captive reinsurance company that insures a dedicated risk portion of its errors and omissions, transporter operator and commercial general liability programs. The exposure of its captive reinsurance company is limited by a third-party insurer that covers losses exceeding an amount of CHF 1 million on a single-case basis and a total aggregate limit of CHF 9 million annually for claims exceeding CHF 50,000 per incident. In a consolidated view, the Group, through its captive
Panalpina Annual Report 2013
Consolidated Financial Statements 84

reinsurance company, bears the risks insured with its captive reinsurance company up to the limit as if such risks were not insured at all. Furthermore, as third-party coverage is subject to a considerable deductible and a total aggregated limit per year, the Group, in effect, bears the risk of damages, losses and claims that are above such aggregated limits as well. The Group used for the above-mentioned provision an actuarial calculation method, which requires for the calculation of the “incurred but not reported reserves” (IBNR), among other estimations, the overall circumstances that may impact the future losses, such as the growth of business. At December 31, 2013 the recognized liability for claims amounts to CHF 40.0 million (2012: CHF 35.6 million). If the management decided to use the optimal actuarial calculation method, which takes into consideration only the linear loss development according to historical figures, the carrying amount of claim provisions would be approximately CHF 3.7 million lower (2012: CHF 5.1 million). Using a more conservative percentile, the carrying amount of claim provisions would be approximately CHF 4.1 million higher (2012: 1.9 million).
The Group is also subject to legal and regulatory proceedings and government investigations in various jurisdictions. These proceedings are related to the area of competition law. Such proceedings may result in criminal or civil sanctions, penalties or damages against the Company. Regulatory and legal proceedings, as well as government investigations, involve complex legal issues, the outcome of which is difficult to predict. Accordingly, management’s judgment is affected in determining whether it is more likely or not that such a proceeding will result in an outflow of resources and whether the amount of the obligation can be reliably estimated. These judgments are subject to change as new information becomes available. On resolution of any legal or regulatory proceeding or government investigation, the Group may incur a provision for such matters. It cannot be ruled out that the financial condition or results of operations of the Group will be materially affected. For additional information see note 30 – Additional information, section Pending legal claims. Related legal costs are recognized when incurred.
4.1.4 Deferred income tax assetsDeferred tax assets are recognized for unused tax losses to the extent that it is probable that taxable profit will be available against which the losses can be utilized. Significant management judgment is required to determine the amount of deferred tax assets that can be recognized, based on the likely timing and level of future taxable profits.
The carrying value of recognized tax loss carry-forwards amounts to CHF 92.6 million (2012: CHF 97.7 million) and unrecognized tax loss carry-forwards to CHF 212.4 million (2012: CHF 191.1 million). Further details are provided in note 26.
If the Group were able to recognize all unrecognized deferred tax assets, consolidated profit would increase by CHF 63.3 million (2012: CHF 59.3 million). If the Group failed to achieve the expected future taxable profits, the consolidated profit would decrease by CHF 29.8 million (2012 CHF 33.3 million), but the management believes that the full amount of the recognized deferred tax assets are recoverable in the foreseeable future.
4.1.5 Income taxesAt December 31, 2013, the net liability for current income taxes amounts to CHF 22.4 million (2012: CHF 18.2 million). As the Group is subject to income taxes in numerous jurisdictions, significant judgments are required in determining worldwide provisions for income taxes.
Some of these estimates are based on interpretations of existing tax laws or regulations. Management believes that the estimates are reasonable and that the recognized liabilities for income tax-related uncertainties are adequate. Various external factors may have favorable or unfavorable effects on income taxes. These factors include, but are not limited to, changes in tax law regulations and / or rates, changing interpretation of existing tax laws or regulations and changes in management estima-tions. Such changes that arise could affect the assets and liabilities recognized in the statement of financial position in future pe-riods.
Panalpina Annual Report 2013
Consolidated Financial Statements 85

5 OPERATING SEGMENT INFORMATION Management has determined the operating segments based on the reports reviewed by the Executive Board that are used to make strategic decisions. The Executive Board considers the business from a geographic perspective, as the Group’s operations are predominately managed by geographical location.
In the period under review, a new reporting structure became effective. Middle East / Africa / CIS and Europe are reported as two separate operating segments (previously one operating segment). Headquarter activities are no longer separately reported but included in the respective results of each segment in the segment information. For comparative analysis, the previous year’s segment information has been restated to conform to the current period’s presentation.
The Executive Board assesses performance of the operating segments based on a measure of adjusted operating result (Segment EBIT). This measurement basis excludes the effects on non-recurring expenditure from the operating segments.
2013 (IN THOUSAND CHF) EUROPE
MIDDLE EAST,
AFRICA, CIS AMERICAS
ASIA PACIFIC
ELIMI- NATIONS
TOTAL GROUP
External forwarding services 2,607,467 574,254 2,310,356 1,265,555 0 6,757,632
Intra-group forwarding services 1,366,641 195,591 803,404 1,523,575 (3,889,211) 0
Net forwarding revenue 3,974,108 769,845 3,113,760 2,789,130 (3,889,211) 6,757,632
Forwarding services from third parties (3,329,666) (637,374) (2,640,668) (2,478,110) 3,889,211 (5,196,607)
Gross profit 644,442 132,471 473,092 311,020 0 1,561,025
Personnel expenses (430,110) (82,444) (292,333) (155,145) 0 (960,032)
Other operating expenses (183,322) (41,377) (142,421) (73,085) 0 (440,205)
Adjusted EBITDA 31,010 8,650 38,338 82,790 0 160,788
Depreciation and amortization (18,216) (7,193) (15,278) (12,069) 0 (52,756)
Adjusted operating result (Segment EBIT) 12,794 1,457 23,060 70,721 0 108,032
Goodwill impairment (19,112) 0 0 0 0 (19,112)
Fines (40,939)
Reported operating result (EBIT) 47,981
Financial result
Finance income 3,959
Finance costs (16,468)
Profit before income tax (EBT) 35,472
Income tax expenses (23,777)
Consolidated profit 11,695
Information about segment assets and liabilities:
2013 (IN THOUSAND CHF) EUROPE
MIDDLE EAST,
AFRICA, CIS AMERICAS
ASIA PACIFIC
TOTAL OPERAT-
ING SEGMENT
NON- SEGMENT
ASSETS
NON- SEGMENT
LIABILITIESTOTAL
GROUP
Segment assets 557,081 211,786 429,536 324,866 1,523,269 426,188 1,949,457
Segment liabilities 379,807 106,253 316,842 239,045 1,041,947 198,329 1,240,276
Panalpina Annual Report 2013
Consolidated Financial Statements 86

Net forwarding revenue and segment assets from the country of domicile (Switzerland) and major countries within the segments:
2013 (IN THOUSAND CHF)SWITZER-
LAND GERMANY
UNITED STATES OF
AMERICA BRAZIL
REPUBLIC OF
CHINA
Net forwarding revenue 780,163 1,261,802 1,752,370 447,390 1,087,482
Segment assets 68,747 187,639 182,879 85,572 104,854
20121 (IN THOUSAND CHF) EUROPE
MIDDLE EAST,
AFRICA, CIS AMERICAS
ASIA PACIFIC
ELIMI- NATIONS
TOTAL GROUP
External forwarding services 2,658,088 433,226 2,287,734 1,237,582 0 6,616,630
Intra-group forwarding services 1,347,268 171,366 637,758 1,494,733 (3,651,125) 0
Net forwarding revenue 4,005,356 604,592 2,925,492 2,732,315 (3,651,125) 6,616,630
Forwarding services from third parties (3,398,586) (494,616) (2,481,743) (2,427,766) 3,651,125 (5,151,586)
Gross profit 606,770 109,976 443,749 304,549 0 1,465,044
Personnel expenses2 (427,885) (71,817) (295,658) (161,831) 0 (957,191)
Other operating expenses (173,603) (35,510) (136,781) (68,425) 0 (414,319)
Adjusted EBITDA 5,282 2,649 11,310 74,293 0 93,534
Depreciation and amortization (16,840) (6,003) (12,428) (8,974) 0 (44,245)
Adjusted operating result (Segment EBIT) (11,558) (3,354) (1,118) 65,319 0 49,289
Goodwill and Customer list impairment (29,634) 0 0 0 0 (29,634)
Fines (59,232)
Reported operating result (EBIT) (39,577)
Financial result
Finance income 14,665
Finance costs (19,178)
Loss before income tax (EBT) (44,090)
Income tax expenses2 (27,741)
Consolidated loss (71,831)
1 Prioryear’sfigureshavebeenrestated,asMiddleEast/Africa/CISandEuropearereportedastwoseparateoperatingsegmentsandheadquarteractivitiesare no longer seperately reported but included in the respective results of each segment in the segment information.
2 Prioryear’sfigureshavebeenrestatedduetotheapplicationofIAS19(asrevisedin2011)retrospectively.Pleaserefertonote3.
Information about segment assets and liabilities:
20121 (IN THOUSAND CHF) EUROPE
MIDDLE EAST,
AFRICA, CIS AMERICAS
ASIA PACIFIC
TOTAL OPERAT-
ING SEGMENT
NON- SEGMENT
ASSETS
NON- SEGMENT
LIABILITIESTOTAL
GROUP
Segment assets 557,896 165,510 480,433 342,874 1,546,713 410,342 1,957,055
Segment liabilities2 445,880 86,803 271,469 219,076 1,023,228 191,074 1,214,302
1 Prioryear’sfigureshavebeenrestated,asMiddleEast/Africa/CISandEuropearereportedastwoseparateoperatingsegmentsandheadquarteractivitiesare no longer seperately reported but included in the respective results of each segment in the segment information.
2 Prioryear’sfigureshavebeenrestatedduetotheapplicationofIAS19(asrevisedin2011)retrospectively.Pleaserefertonote3.
Panalpina Annual Report 2013
Consolidated Financial Statements 87
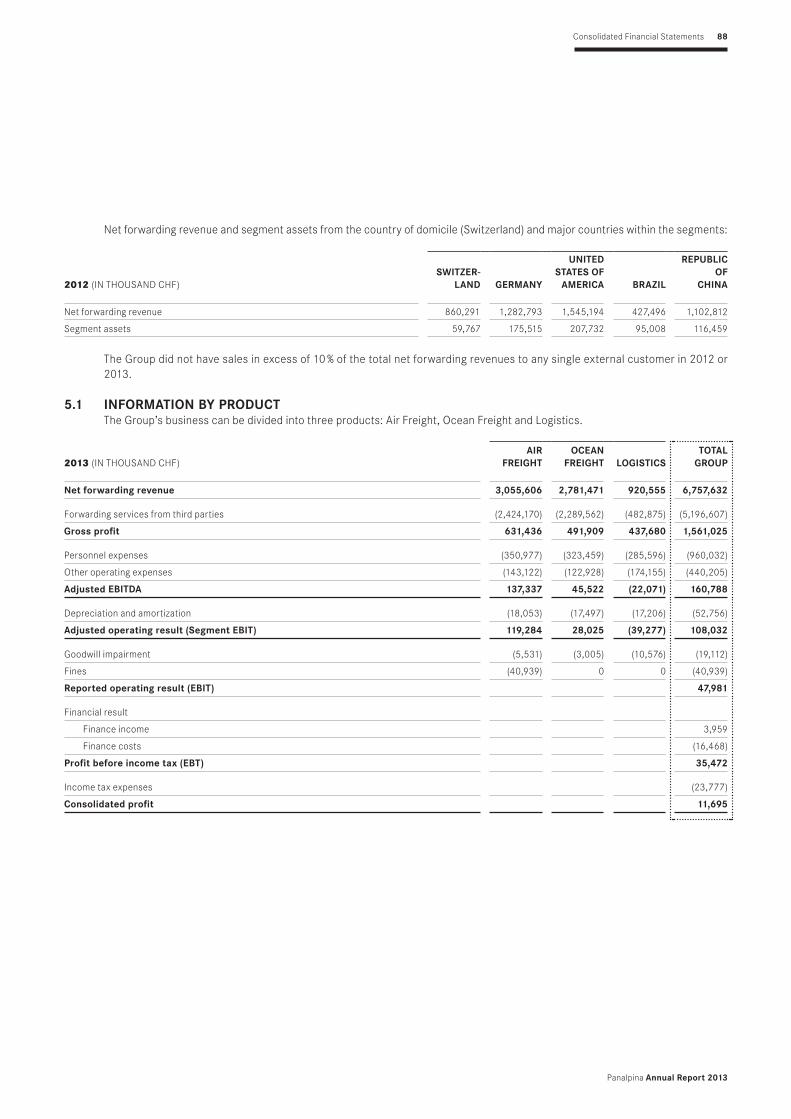
Net forwarding revenue and segment assets from the country of domicile (Switzerland) and major countries within the segments:
2012 (IN THOUSAND CHF)SWITZER-
LAND GERMANY
UNITED STATES OF
AMERICA BRAZIL
REPUBLIC OF
CHINA
Net forwarding revenue 860,291 1,282,793 1,545,194 427,496 1,102,812
Segment assets 59,767 175,515 207,732 95,008 116,459
The Group did not have sales in excess of 10 % of the total net forwarding revenues to any single external customer in 2012 or 2013.
5.1 INFORMATION BY PRODUCTThe Group’s business can be divided into three products: Air Freight, Ocean Freight and Logistics.
2013 (IN THOUSAND CHF) AIR
FREIGHTOCEAN
FREIGHT LOGISTICS TOTAL
GROUP
Net forwarding revenue 3,055,606 2,781,471 920,555 6,757,632
Forwarding services from third parties (2,424,170) (2,289,562) (482,875) (5,196,607)
Gross profit 631,436 491,909 437,680 1,561,025
Personnel expenses (350,977) (323,459) (285,596) (960,032)
Other operating expenses (143,122) (122,928) (174,155) (440,205)
Adjusted EBITDA 137,337 45,522 (22,071) 160,788
Depreciation and amortization (18,053) (17,497) (17,206) (52,756)
Adjusted operating result (Segment EBIT) 119,284 28,025 (39,277) 108,032
Goodwill impairment (5,531) (3,005) (10,576) (19,112)
Fines (40,939) 0 0 (40,939)
Reported operating result (EBIT) 47,981
Financial result
Finance income 3,959
Finance costs (16,468)
Profit before income tax (EBT) 35,472
Income tax expenses (23,777)
Consolidated profit 11,695
Panalpina Annual Report 2013
Consolidated Financial Statements 88

2012 (IN THOUSAND CHF) AIR
FREIGHTOCEAN
FREIGHT LOGISTICS TOTAL
GROUP
Net forwarding revenue 3,105,583 2,615,234 895,813 6,616,630
Forwarding services from third parties (2,477,490) (2,155,365) (518,731) (5,151,586)
Gross profit 628,093 459,869 377,082 1,465,044
Personnel expenses1 (377,671) (322,364) (257,156) (957,191)
Other operating expenses (155,633) (115,433) (143,253) (414,319)
Adjusted EBITDA 94,789 22,072 (23,327) 93,534
Depreciation and amortization (15,018) (13,127) (16,100) (44,245)
Adjusted operating result (Segment EBIT) 79,771 8,945 (39,427) 49,289
Goodwill and customer list impairment (7,574) (5,425) (16,635) (29,634)
Fines (59,232) 0 0 (59,232)
Reported operating result (EBIT) (39,577)
Financial result
Finance income 14,665
Finance costs (19,178)
Loss before income tax (EBT) (44,090)
Income tax expenses1 (27,741)
Consolidated loss (71,831)
1 Prioryear’sfigureshavebeenrestatedduetotheapplicationofIAS19(asrevisedin2011)retrospectively.Pleaserefertonote3.
Activities were reallocated within the different products during the period under review. Prior period information was realigned to ensure comparability.
6 PERSONNEL EXPENSES
IN THOUSAND CHF 2013 20121
Wages and salaries 748,411 739,268
Compulsory social security contributions 94,258 91,968
Contributionstodefinedcontributionplans 52,702 53,654
Expensesrelatedtodefinedbenefitplans(note7) 4,559 10,252
Staff training 7,339 9,446
Share-based compensation (note 8)
Equity-settled compensation plan 701 2,210
Cash-settled compensation plan 0 (2,165)
Other personnel-related expenses 52,062 52,558
Total personnel expenses 960,032 957,191
Number of employees (headcount on December 31) 16,010 15,224
thereof in Switzerland 754 759
1 Prioryear’sfigureshavebeenrestatedduetotheapplicationofIAS19(asrevisedin2011)retrospectively.Pleaserefertonote3.
Panalpina Annual Report 2013
Consolidated Financial Statements 89

7 POST-EMPLOYMENT BENEFIT OBLIGATIONSAs disclosed in Note 3, following the implementation of IAS 19 (revised) the Group has amended its accounting policy with respecttopost-employmentbenefitobligationsandrestatedtherelated2012comparativesanddisclosures.
Panalpina’sobjectiveistoprovideattractivepost-employmentbenefitstoemployees,whileatthesametimeensuringthatthevariousplansareappropriatelyfinanced,whilemanaginganypotentialimpactsontheGroup’slong-termfinancialposition.Thenatureofsuchplansvariesaccordingtolegalregulationsandfiscalrequirementsinthecountriesinwhichtheemployeesareemployed.Otherpost-employmentbenefitsconsistmostlyofpost-retirementschemes.Post-employmentbenefitplansareclassifiedforIFRSas“definedcontributionplans”iftheGrouppaysfixedcontributionsinaseparatefundortoathird-partyfinancialinstitutionandwillhavenofurtherlegalorconstructiveobligationtopayfurthercontributions.Allotherplansareclassifiedasdefinedbenefitplans.
7.1 DEFINED BENEFIT PLANS Currentandpastservicesandnetinterestexpensesarechargedtotheincomestatementaspersonnelexpenses.Remeasure-ments of the net defined benefit liability, which comprise actuarial gains and losses arising from changes in actuarial assumptions(bothdemographicandfinancial)andexperienceadjustments,thereturnofplanassets(excludinginterest)andtheeffect of the asset ceiling (if any, excluding interest), are charged or credited immediately to equity in other comprehensive income.TheGroupdeterminesthenetinterestexpenseonthenetdefinedbenefitliability((asset)atthebeginningoftheannualperiodtothenetdefinedbenefitliability/(asset),takingintoaccountanychangesinthenetdefinedbenefitliability/ (asset)duringtheperiodasaresultofcontributionsandbenefitpayments.Netinterestexpenseandotherexpensesrelatedtodefinedbenefitplansarerecognizedintheincomestatement.Therecognitionofpensionassetsislimitedtothetotalofthepresent value of any future refunds from the plans or reduction in future contributions to the plans. Adjustments arising from the limitontherecognitionofassetsfordefinedbenefitplansarerecordeddirectlyinothercomprehensiveincome.
Plans are usually established as trusts independent of the Group and are funded by payments from the Group and by employees. Insomecases,notablyforthedefinedbenefitplansinGermanyandJapan,theplansareunfundedandtheGrouppayspensionstoretiredemployeesdirectlyfromitsownfinancialresources.
Qualifiedindependentactuariescarryoutvaluationsonaregularbasisandformajorplansannuallyasatthereportingdate.Forfundedplans,whichareusuallytrustsindependentoftheGroup’sfinances,thenetdefinedpensionliability/(asset)recognizedintheGroup’sstatementoffinancialpositioncorrespondstotheover-/underfundingoftheplan.Forunfundedplans,wheretheGroupmeetsthepensionobligationsdirectlyfromitsownfinancialresources,aliabilityforthedefinedbenefitobligationisrecordedintheGroup’sstatementoffinancialposition.Pensionassetsandliabilitiesindifferentdefinedbenefitplansarenotoffset.
TheGroup’sdefinedbenefitplansarelocatedinSwitzerland,Germany,Japan,Taiwan,FranceandKorea.Thelargestplansarein Switzerland followed by Germany. The Swiss pension plans account for 99 % (2012: 99 %) of the Group’s total plan assets and 81%(2012:83%)ofitsdefinedbenefitobligation.
7.1.1 Pension plans in Switzerland PensionplansaregovernedbytheSwissFederalLawonOccupationalRetirement,Survivors’andDisabilityPensionPlans(“BVG”),whichstipulatesthatpensionplansaretobemanagedbyindependent,legallyautonomousunits.Pensionplansareoverseen by a regulator and by a state supervisory body. The pension plan’s most senior governing body (Board of Trustees) must be composed of equal numbers of employee and employer representatives.
Thedefinedbenefitobligationsarebasedonoldage,disabilityandsurvivorsbenefitsthatincludethelegallyrequiredbenefits.Thevariousbenefitsaregovernedinregulations,withtheBVGspecifyingtheminimumbenefitsthataretobeprovided.Theplaniscontribution-basedwithaguaranteedminimuminterestrateonoldagesavingsandamandatoryconversionratetodefinethelevel of the old age pension. The disability and survivors benefits are defined as a percentage of the insured salary. Both employer and employee pay contributions to the plan. Statutory minimum funding requirements exist. In case of underfunding, various measures can be taken such as the adjustment of the pension commitment by altering the conversion rate or increasing currentcontributions.Theemployercanalsomakeadditionalrestructuringcontributions.TheBVGprescribeshowemployeesand employer have to jointly fund potential restructurings. Actuarial risks include both demographic (primarily life expectancy
Panalpina Annual Report 2013
Consolidated Financial Statements 90

anddisability)andfinancialrisks(primarilydiscountrate,futureincreasesinsalariesandwages,andtheactualreturnonplanassets)andareregularlyassessedbytheBoardofTrustees.Theplansincludecertainfeaturesthatsharethebenefitsofasurplusorthecostofadeficitbetweentheemployerandtheemployees.
The Board of Trustees is responsible for the investment of the assets. It regularly defines and reassesses the investment strategyasdeemedappropriateandnecessary–especiallyinthecaseofsignificantmarketdevelopmentsorchangestothestructureoftheplanparticipants–andatleastannually.Whendefiningtheinvestmentstrategy,ittakesintoaccountthefund’sobjectives,benefitobligationsandriskcapacity.Theinvestmentstrategyisdefinedintheformofalong-termtargetassetstructure (investment policy). The Board of Trustees delegates the implementation of the investment policy – in accordance with the investment strategy as well as various principles and objectives – to an Investment Committee, which consists of members of the Board of Trustees.
7.2 MOVEMENT IN THE DEFINED BENEFIT OBLIGATION (DBO)
IN THOUSAND CHF 2013 2012
Changes in defined benefit obligation (DBO)
DBO at beginning of year (290,693) (241,473)
Included in profit or loss
Current service cost (9,802) (10,047)
Past service (costs) / gains 6,980 1,180
Interest expenses (5,805) (6,171)
(8,627) (15,038)
Included in OCI
Remeasurementloss(gain)
– Actuarial losses / (gains) from:
demographic assumptions 700 (18,074)
financialassumptions 9,642 (22,766)
experience adjustments 3,870 1,708
Currency impact (171) 469
14,041 (38,663)
Other
Employee contributions (6,365) (5,148)
Benefitspaid 18,109 9,629
11,744 4,481
DBO at end of year (273,535) (290,693)
Represented by
Swiss plans (222,041) (242,311)
Other plans (51,494) (48,382)
(273,535) (290,693)
Panalpina Annual Report 2013
Consolidated Financial Statements 91

7.3 MOVEMENT IN THE PLAN ASSETS
IN THOUSAND CHF 2013 2012
Changes in fair value of plan assets
Fair value of plan assets at beginning of year 231,706 211,525
Included in profit or loss
Interest income 4,068 4,786
4,068 4,786
Included in OCI
Remeasurementloss/(gain)
Returnonplanassets,excludingamountsincludedininterestexpense(income) 12,081 13,187
Currency impact (60) 4
12,021 13,191
Other
Employer contributions 6,971 6,018
Employee contributions 6,365 5,148
Benefitspaid (17,365) (8,962)
(4,029) 2,204
Fair value of plan assets at end of year 243,766 231,706
Represented by
Swiss plans 241,666 230,528
Other plans 2,100 1,178
243,766 231,706
7.4 MOVEMENT IN THE NET DEFINED BENEFIT (LIABILITY) / ASSET
IN THOUSAND CHF 2013 2012
Changes in net defined benefit (liability) / asset
Balance at beginning of year (58,987) (29,948)
Netimpactincludedinprofitorloss (4,559) (10,252)
Net impact included in OCI 26,062 (25,472)
Net impact other 7,715 6,685
Balance at end of year (29,769) (58,987)
Split into
Post-employmentbenefitassets 19,905 0
Post-employmentbenefitliabilities (49,674) (58,987)
(29,769) (58,987)
Panalpina Annual Report 2013
Consolidated Financial Statements 92

7.5 PLAN ASSETS
IN THOUSAND CHF 2013 2013 2012 2012
Major categories of plan assets
Cash and cash equivalents 2,119 0.87 % 1,186 0.51 %
Equity investments 84,026 34.47 % 80,941 34.93 %
Equities Switzerland 17,497 7.18 % 16,739 7.22 %
Equities Global 55,483 22.76 % 52,447 22.64 %
Equities Emerging Markets 11,046 4.53 % 11,755 5.07 %
Bonds 122,676 50.33 % 115,857 50.00 %
Swiss bonds (CHF) 47,388 19.44 % 40,426 17.45 %
Non-Swiss bonds (CHF) 39,041 16.02 % 41,454 17.89 %
Non-Swiss bonds (foreign currency) 36,247 14.87 % 33,977 14.66 %
Investment funds 0 0.00 % 0 0.00 %
Hedge funds and private equity 0 0.00 % 0 0.00 %
RealestatefundsSwitzerland 29,006 11.90 % 27,120 11.70 %
Others 5,939 2.44 % 6,602 2.85 %
Total 243,766 100.00 % 231,706 100.00 %
Equity investments, bonds and real estate funds have quoted market prices in active markets.
7.6 DEFINED BENEFIT OBLIGATION (DBO) 7.6.1 Actuarial assumptions
Actuarial assumptions are unbiased and mutually compatible estimates of variables that determine the ultimate cost of providingpastemploymentbenefits.Theyaresetonanannualbasisbylocalmanagementandactuariesandaresubjecttoapproval by corporate management. Actuarial assumptions consist of demographic assumptions on matters such as mortality andemployeeturnover,andfinancialassumptionsonmatterssuchassalaryandbenefitlevel,interestratesandreturnoninvestments.TheGroupoperatesdefinedbenefitplansinmanycountriesandtheactuarialassumptionsvarybasedonlocaleconomic and social conditions.
Demographic assumptionsThemostsignificantdemographicassumptionsrelatetomortalityrates.TheGroup’sactuariesusemortalitytablesthattakeintoaccount historic patterns and expected changes, such as further increases in longevity. The mortality tables used for the major
schemes are:
Switzerland BVG2010Generationtable
Germany tables2005GfromKlausHeubeck
France tableINSEETV/TD2008/2010
Ratesofemployeeturnover,disabilityandearlyretirementarebasedonhistoricalbehaviorwithintheGroupcompanies.
Panalpina Annual Report 2013
Consolidated Financial Statements 93

Financial assumptionsThese are based on market expectations for the period over which the obligations are to be settled. The assumptions used in the actuarial valuations with stable currencies and interest are shown below (expressed as weighted averages):
2013 2012
Discount rate 2.35 % 2.01 %
Future salary increase 1.92 % 1.75 %
Future pension increase 1.14 % 1.15 %
Discountrates,whichareusedtocalculatethediscountedpresentvalueofthedefinedbenefitobligation,aredeterminedwithreference to market yields on high-quality corporate bonds. Expected rates of salary increases, which are used to calculate the definedbenefitobligationandthecurrentservicecostincludedintheincomestatement,arebasedonthelatestexpectationand historical behavior within Group entities.
In 2013, the actual return on plan assets was CHF 16.2 million (2012: CHF 18.0 million). At December 31, 2013, the weighted average duration of the DBO was 13.6 years. The Group expects to pay CHF 7.0 million in contributions in 2014.
DBO relating to the Swiss plansAt December 31, 2013, the duration of the DBO of CHF 222.0 million (2012: CHF 242.3 million) was approximately 12.9 years (2012: approximately 11 years). 658 active members (2012: 721) and 198 pensioners (2012: 184) were included in the 2013 actuarial valuation of the DBO.
DBO relating to the German plansAt December 13, 2013, the duration of the DBO of CHF 43.8 million (2012: CHF 42.6 million) was approximately 18 years (2012: approximately 17 years) related to 811 (2012: 862) active members (DBO of CHF 18.7 million, 2012 CHF 19.0 million), to 457 (2012: 425) deferred members (DBO of CHF 8.7 million, 2012: CHF 8.5 million) and to 203 (2012: 195) pensioners (DBO of CHF 16.4 million, 2012: CHF 15.1 million).
7.6.2 Sensitivity analysisReasonablypossiblechangesatthereportingdatetotheoneoftherelevantactuarialassumptions,holdingotherassumptionsconstant,wouldhaveaffectedthedefinedbenefitobligationbytheamountsshownbelow:
2013 IN THOUSAND CHFINCREASE
OF DBO
DE-CREASE OF DBO
Discount rate (change of 0.3 %) 7,449 (7,101)
Future salary increase (change of 0.5 %) 1,776 (1,804)
Future pension increase (change of 0.25 %) 3,967 (3,801)
Panalpina Annual Report 2013
Consolidated Financial Statements 94

8 SHARE AND OPTION OWNERSHIP PROGRAMThe Group operates several share and option ownership programs. The members of the Board of Directors, the members of the Executive Board and selected preferential employees were able to voluntarily participate in the share and option ownership programintroducedin2005andcontinuedinamodifiedprograminthefollowingyears.
8.1 MANAGEMENT INCENTIVE PROGRAM III (MIP III)The remaining unexercized options expired during the period under review.
8.2 MANAGEMENT INCENTIVE PROGRAM IV (MIP IV)InJune2008,theGroupintroducedtheManagementIncentiveProgramIV.Participantsinthisprogramhadtherighttopurchaseshares at a discounted share price that equals 75 % of the closing price of one share at the SIX Swiss Exchange on April 30, 2008. The difference between the discounted share price on the grant date and the share price paid by the participants is recognized as personnel expenses on the date of the issue of the shares. The shares are subject to a one-year lock-up period. For every purchased share under this plan, the Group granted one option free of charge to the par ticipant. The options have a contractual term of six years and a vesting period of one to three years. Each option entitles the participant to obtain one share of Panalpina World Transport (Holding) Ltd. at a predetermined strike price (exercise price of option). The share options cannot be settled in cash.Theprogramisalsodividedintoan“InternationalManagementIncentivePlan”anda“UnitedStatesManagementIncentivePlan”.Beneficiariesofthe“UnitedStatesManagementIncentivePlan”areselectedpreferentialemployeesofthesubsidiary in the US and members of the Board of Directors with residence in the US. The conditions of this plan do not differ fromthoseofthe“InternationalManagementIncentivePlan”exceptfortheexerciseprice.Theexercisepriceofoptionsofthe“InternationalManagementIncentivePlan”isequaltotheclosingpriceofoneshareattheSIXSwissExchangeonApril30,2008.Theexercisepriceofoptionsofthe“UnitedStatesManagementIncentivePlan”isequaltothesharepriceattheSIXSwissExchangeonthegrantdate.Participantsinthe“InternationalManagementIncentivePlanIV”subscribedfor32,436op-tionswithastrikepriceofCHF129.35.Participantsinthe“UnitedStatesManagementIncentivePlanIV”subscribedfor4,689options with a strike price of CHF 119.90.
The following table lists the parameters based on which the option valuation of both plans was performed:
IN CHF
INTERNA-TIONAL
MANAGE-MENT
INCENTIVE PLAN IV
UNITED STATES
MANAGE-MENT
INCENTIVE PLAN IV
Market price of share 90.40 90.40
Exercise price of option 129.35 119.90
Expected volatility (in %) 28.11 28.11
Option life (in years) 5 5
Dividend yield (in %) 3.53 3.53
Risk-freeinterestratebasedonSwissgovernmentbonds(in%) 0.490 0.490
8.3 MANAGEMENT INCENTIVE PLAN 08 / 09 (MIP 08 / 09)In 2009, management introduced a new plan. The terms of this share and option program are identical to the Management IncentiveProgramIVasdescribedaboveapartfromthestrikepriceofthe“InternationalManagementIncentivePlan”,whichequals the closing price of the share on the cut-off day at the SIX Swiss Exchange. Under this program participants of the “InternationalManagementIncentivePlan”received65,921optionswithastrikepriceofCHF61.25andparticipantsofthe“UnitedStatesManagementIncentivePlan”received5,132optionswithastrikepriceofCHF81.35.
Panalpina Annual Report 2013
Consolidated Financial Statements 95

The following table lists the parameters based on which the option valuation of both plans was performed:
IN CHF
INTERNA-TIONAL
MANAGE-MENT
INCENTIVE PLAN
08/09
UNITED STATES
MANAGE-MENT
INCENTIVE PLAN
08/09
Market price of share 90.40 90.40
Exercise price of option 61.25 81.35
Expected volatility (in %) 28.11 28.11
Option life (in years) 5 5
Dividend yield (in %) 3.53 3.53
Risk-freeinterestratebasedonSwissgovernmentbonds(in%) 0.490 0.490
8.4 MANAGEMENT INCENTIVE PLAN 09 / 10 (MIP 09 / 10)In2010anadditionalmanagementincentiveplanwassetup.Apartfromthestrikepriceofthe“InternationalManagementIncentivePlan”,whichequalstheclosingpriceoftheshareonthecut-offdayattheSIXSwissExchange,thetermsofthisshareand option program are identical to the Management Incentive Program 08 / 09. Under this program participants of the “InternationalManagementIncentivePlan”received12,099optionswithastrikepriceofCHF95.65andparticipantsofthe“UnitedStatesManagementPlan”received1,354optionswithastrikepriceofCHF87.75.
The weighted average fair value of the share options granted during the reporting period is determined using the binominal valuationmodel,applyingthefollowingsignificantinputsintothemodel:
IN CHF
INTERNA-TIONAL
MANAGE-MENT
INCENTIVE PLAN 09/10
UNITED STATES
MANAGE-MENT
INCENTIVE PLAN 09/10
Market price of share 90.40 90.40
Exercise price of option 95.65 87.75
Expected volatility (in %) 28.11 28.11
Option life (in years) 5 5
Dividend yield (in %) 3.53 3.53
Risk-freeinterestratebasedonSwissgovernmentbonds(in%) 0.490 0.490
Panalpina Annual Report 2013
Consolidated Financial Statements 96

The following table summarizes the movements in the number of share options outstanding and their related average exercise prices:
2013 2012
AVERAGE EXERCISE
PRICE PER SHARE
(IN CHF)
OPTIONS
(NUMBER)
AVERAGE EXERCISE
PRICE PER SHARE
(IN CHF)
OPTIONS
(NUMBER)
OptionsoutstandingonJanuary1 126.74 97,650 119.80 148,452
Exercised 90.52 (41,248) 65.40 (14,621)
Forfeited 95.65 (45) 90.27 (1,844)
Expired 189.91 (32,799) 117.28 (34,337)
Options outstanding on December 31 102.27 23,558 126.74 97,650
Options exercisable on December 31 102.27 23,558 127.75 93,166
During the reporting year the following numbers of options were exercised with the respective exercise prices:
2013 2012
EXERCISE PRICE
OF OPTION (IN CHF)
NUMBER OF
EXERCISED OPTIONS
EXERCISE PRICE
OF OPTION (IN CHF)
NUMBER OF
EXERCISED OPTIONS
InternationalManagementIncentivePlanIV 129.35 12,956 0.00 0
UnitedStatesManagementIncentivePlanIV 119.90 726 0.00 0
International Management Incentive Plan 08 / 09 62.50 0 62.50 11,156
International Management Incentive Plan 08 / 09 61.25 18,222 61.25 1,974
United States Management Incentive Plan 08 / 09 83.05 0 83.05 476
United States Management Incentive Plan 08 / 09 81.35 2,231 0.00 0
International Management Incentive Plan 09 / 10 97.60 0 97.60 949
International Management Incentive Plan 09 / 10 95.65 6,217 0.00 0
United States Management Incentive Plan 09 / 10 89.55 0 89.55 66
United States Management Incentive Plan 09 / 10 87.75 896 0.00 0
Weighted average exercise price of options exercised during the year 90.52 65.40
The average exercise prices and the expiry date of the outstanding options at period-end are as follows:
2013
AVERAGE EXERCISE
PRICE PER SHARE
(IN CHF)
NUMBER OF
OPTIONS EXPIRING AT YEAR-
END
2014 126.74 13,270
2015 65.30 8,414
2016 95.02 1,874
Total 102.27 23,558
Panalpina Annual Report 2013
Consolidated Financial Statements 97

8.5 MANAGEMENT INCENTIVE PLAN 10 / 11 (MIP 10 / 11)In 2011 a new management incentive plan was set up. Participants in this program had the right to purchase shares with a discount of 10 % based on the share price equal to the closing price on the SIX Swiss Stock Exchange at the cut-off day. The difference between the discounted share price on the grant date and the share price paid by the participants is recognized as personnel expenses on the date of the issue of the shares. The shares are subject to a one-year lock-up period. For every purchasedshareunderthisplan,theGroupgrantedanumberoffreesharesaccordingtoa“FreeShareRatio”,whichissetannually by the Compensation and Nomination Committee. For the current year the ratio was set to 1:4 (one free share per four shares bought). The free shares have a vesting period of one to three years. On non-vested free shares, no dividends are paid and there is no entitlement for dividends. The shares cannot be settled in cash. The fair value of the free shares corresponds to the market price of the shares at the grant date.
2013 MANAGE-
MENT INCENTIVE
PLAN 10/11
2012 MANAGE-
MENT INCENTIVE
PLAN 10/11
Fair value of free share (in CHF) 119.30 119.30
OutstandingfreesharesonJanuary1 3,339 6,961
Granted free shares 0 0
Vestedfreeshares (1,649) (3,230)
Forfeited free shares (284) (392)
Free shares outstanding on December 31 1,406 3,339
8.6 MANAGEMENT INCENTIVE PLAN 11 / 12 (MIP 11 / 12)As in previous years an additional management incentive plan was set up in 2012. Participants in this program had the right to purchase shares with a discount of 10 % based on the share price equal to the closing price on the SIX Swiss Stock Exchange at the cut-off day. The difference between the discounted share price on the grant date and the share price paid by the participants is recognized as personnel expenses on the date of the issue of the shares. The shares are subject to a one-year lock-up period. Foreverypurchasedshareunderthisplan,theGroupgrantedanumberoffreesharesaccordingtoa“FreeShareRatio”,whichis set annually by the Compensation and Nomination Committee. For the current year the ratio was set to 1:4 (one free share per four shares bought). The free shares have a vesting period of one to three years. On non-vested free shares, no dividends are paid and there is no entitlement for dividends. The shares cannot be settled in cash. The fair value of the free shares corresponds to the market price of the shares at the grant date.
2013 MANAGE-
MENT INCENTIVE
PLAN 11/12
2012 MANAGE-
MENT INCENTIVE
PLAN 11/12
Fair value of free share (in CHF) 87.30 87.30
OutstandingfreesharesonJanuary1 2,562 0
Granted free shares 0 2,816
Vestedfreeshares (901) (75)
Forfeited free shares (34) (179)
Free shares outstanding on December 31 1,627 2,562
Panalpina Annual Report 2013
Consolidated Financial Statements 98

8.7 MANAGEMENT INCENTIVE PLAN 12 / 13 (MIP 12 / 13)As in previous years an additional management incentive plan was set up in 2013. Participants in this program had the right to purchase shares with a discount of 10 % based on the share price equal to the closing price on the SIX Swiss Stock Exchange at the cut-off day. The difference between the discounted share price on the grant date and the share price paid by the participants is recognized as personnel expenses on the date of the issue of the shares. The shares are subject to a one-year lock-up period. Foreverypurchasedshareunderthisplan,theGroupgrantedanumberoffreesharesaccordingtoa“FreeShareRatio”,whichis set annually by the Compensation and Nomination Committee. For the current year the ratio was set to 1:4 (one free share per four shares bought). The free shares have a vesting period of one to three years. On non-vested free shares, no dividends are paid and there is no entitlement for dividends. The shares cannot be settled in cash. The fair value of the free shares corresponds to the market price of the shares at the grant date.
2013 MANAGE-
MENT INCENTIVE
PLAN 12/13
Fair value of free share (in CHF) 98.05
Granted free shares 1,698
Vestedfreeshares 0
Forfeited free shares 0
Free shares outstanding on December 31 1,698
The Group holds its own shares in order to meet its obligations under the Management Incentive Programs. These own shares are deducted from equity (note 22).
The members of the Executive Board and the Boards of Directors did not participate in the above-mentioned incentive plans.
8.8 EXECUTIVE BOARD MID-TERM INCENTIVE PLANThe Mid-Term Incentive Plan has been set up such that only 60 % of the bonuses, which continue to be set by the achievement of annuallyreviewedGroupkeyperformanceindicators(KPIs)andindividualperformancetargets,arepaidoutincash,whittheremainder paid out in shares with a restriction period of one year. This number of shares will be matched by the Company after this restriction period. In addition, the members of the Executive Board will receive the corresponding number of shares, based on the share’s closing price on April 30 of CHF 90.50 (previous year: CHF 88.52). These shares will thereafter be subject to a further one-year restriction period. In the reporting period under review, Executive Board members received 40 % of the bonus in Company shares totaling 1,625 shares (previous year: 11,930 shares) with a restriction period of one year. This number of shares will, additionally, be matched by the Company after this restriction period. These additional shares are also subject to a further one-year restriction period.
Duringtheperiodunderreviewmanagementreceivedmatchedsharestotaling9,580(2012:13,528)shares,reflectingthe40%bonus paid in the previous year.
8.9 EXECUTIVE BOARD LONG-TERM INCENTIVE PLANTheLong-TermIncentivePlanrewardslong-termvaluecreationmeasuredbyeconomicprofit.Underthisplan,whichhasafive-yearcycle,theindividualExecutiveBoardmemberisentitledtoanequalshareoftherespectivepoolaftertheexpiryofthefive-year plan period. This plan can be cash-settled. The carrying amount of the liability at December 31, 2013 amounts to CHF 377 thousand (2012: CHF 363 thousand), which is also the intrinsic value.
Panalpina Annual Report 2013
Consolidated Financial Statements 99

8.10 BOARD OF DIRECTORS RESTRICTED STOCK AWARD PLANTheRestrictedStockAwardPlanfortheBoardofDirectorswasintroducedin2009.PartoftheremunerationofeachBoardmember is settled in free shares of the Company. The corresponding number of shares per member will be based on the share’s closing price at the assignment date. The shares have a one-year restriction period. During the period under review the Board of Directors did not receive any shares (2012: 3,948 shares).
8.11 COSTS OF SHARE-BASED COMPENSATIONRecognizedcostsofshare-basedcompensationwereasfollows:
IN CHF 2013 2012
Employee share plan 780,355 (217,945)
Option plan (78,752) 263,101
Total cost of share-based payments 701,603 45,156
9 OTHER OPERATING EXPENSES
IN THOUSAND CHF 2013 2012
Communication expenses 34,178 34,336
IT expenses 42,061 37,183
Facility and utilities expenses 150,012 141,589
Leased equipments 8,343 8,828
Maintenance and repair expenses 34,158 33,185
Cars and motor vehicles expenses 29,402 28,984
Travel and promotion expenses 38,784 37,336
Administrative expenses 62,208 51,267
Insurance expenses and claims 19,315 15,526
Bad-debt and collection expenses 8,044 10,082
Gains on sales of property, plant and equipment (2,265) (899)
Losses on sales of property, plant and equipment 1,285 1,013
Other 14,680 15,889
Total other operating expenses 440,205 414,319
Other operating expenses have been regrouped to provide more useful analysis and information. Prior year information has been realigned to ensure comparability. Bad-debt and collection expenses include CHF 1.0 million (2012: CHF 1.5 million) of credit insurance premiums.
Panalpina Annual Report 2013
Consolidated Financial Statements 100

10 FINANCE INCOME AND COSTS
IN THOUSAND CHF 2013 2012
Interest income
Interest income on current bank accounts 2,290 3,624
Interestincomeonfinancialassetsatfairvaluethroughprofitorloss 7 10
Interest differential on forwards and swaps 0 127
Interest income on loans 1 2
Cash discount income 397 418
Subtotal interest income 2,695 4,181
Guarantee fees income 0 21
Dividendonavailable-for-salefinancialassets 510 573
Fairvalueadjustmentsonfinancialassets 754 0
Gainonsaleoffinancialinvestments 0 9,890
Total finance income 3,959 14,665
Interest expenses
Interest expenses on loans (112) (78)
Interest expenses on current bank accounts (854) (750)
Interest differential on forwards and swaps 0 (566)
Interestexpensesonfinancialleasing (34) (68)
Cash discount expenses (497) (496)
Subtotal interest expenses (1,497) (1,958)
Bank charges (2,663) (2,703)
Exchange differences (10,584) (7,380)
Guarantee fees expenses (950) (852)
Otherfinancialexpenses (774) (422)
Impairmentonfinancialassets 0 (4,691)
Fairvalueadjustmentsonfinancialassets 0 (1,172)
Total finance costs (16,468) (19,178)
Net finance costs (12,509) (4,513)
In 2012, Panalpina sold its 12 % of Luxair SA’s shares to the state of Luxembourg with a gain on sale of assets of CHF 9.9 million.Duringthepreviousyear’speriodtheGroupassessedtherecoverableamountofanotherfinancialassetwiththeconclusionthatthe recoverability is no longer given. Therefore an impairment charge in the amount of CHF 4.7 million was recognized in the financialresultofthepreviousyear’speriod.
Panalpina Annual Report 2013
Consolidated Financial Statements 101

11 INCOME TAX EXPENSES
IN THOUSAND CHF 2013 20121
Current income taxes
Current period 32,384 30,521
Adjustments for prior periods (2,599) 252
Total income taxes 29,785 30,773
Deferred income taxes (note 26)
Origination and reversal of taxes on temporary differences and on tax loss carry forwards (4,307) (2,957)
Effect of changes in the tax rate on temporary differences 793 0
Utilization of non-recognized tax loss carry-forwards (2,494) (75)
Total deferred income taxes (6,008) (3,032)
Total income tax expenses 23,777 27,741
1 Prioryear’sfigureshavebeenrestatedduetotheapplicationofIAS19(asrevisedin2011)retrospectively.Pleaserefertonote3.
Management decided to calculate the applicable standard tax rate as in the previous year based on the standard tax rate in Basel, its headquarters’ domicile.
The Group’s effective tax rate can be reconciled to the Group’s average expected tax rate as follows:
IN THOUSAND CHF 2013 20121
(Loss)/profitbeforeincometax 35,472 (44,090)
Tax at the applicable tax rate of 22.48 % (2012: 22.48 %) 7,974 (9,911)
Effective national tax rates 8,284 5,404
Utilization of not yet recognized tax loss carry-forwards (2,494) (75)
Not yet recognized tax loss carry-forwards 8,123 28,365
Adjustment of previous year tax provision (2,599) 252
Effect of changes in the tax rate on temporary differences 793 (70)
Withholding tax on dividends received 341 2,657
Expenses not deductible for tax purposes and non-taxable income 259 690
Miscellaneous 3,096 429
Actual tax charge 23,777 27,741
1 Prioryear’sfigureshavebeenrestatedduetotheapplicationofIAS19(asrevisedin2011)retrospectively.Pleaserefertonote3.
Panalpina Annual Report 2013
Consolidated Financial Statements 102

The following table shows the reconciliation in %:
2013 20121
Tax at the applicable tax rate of 22.48 % (2012: 22.48 %) 22.48 % 22.48 %
Effective national tax rates 23.35 % 12.26 %
Utilization of not yet recognized tax loss carry-forwards (7.03 %) (0.17 %)
Not yet recognized tax loss carry-forwards 22.90 % 64.33 %
Adjustment of previous year tax provision (7.33 %) 0.57 %
Effect of changes in the tax rate on temporary differences 2.24 % (0.16 %)
Withholding tax on dividends received 0.96 % 6.03 %
Expenses not deductible for tax purposes and non-taxable income 0.73 % 1.56 %
Miscellaneous 8.73 % 0.97 %
Actual tax charge 67.03 % 62.92 %
1 Prioryear’sfigureshavebeenrestatedduetotheapplicationofIAS19(asrevisedin2011)retrospectively.Pleaserefertonote3.
Income tax recognized in other comprehensive income is as follows:
2013 20121
IN THOUSAND CHF
BEFORE TAX
TAX BENEFIT
(EXPENSE)
NET OF TAX
BEFORE TAX
TAX BENEFIT
(EXPENSE)
NET OF TAX
Remeasurementofthenetdefinedasset/liability 26,293 (6,349) 19,944 (25,945) 7,084 (18,861)
Available-for-salefinancialassets 349 (116) 233 (478) 0 (478)
Exchange differences on translation of foreign operations (23,159) 0 (23,159) (2,773) 0 (2,773)
Other taxes directly recognized in OCI 0 0 0 0 (130) (130)
Total 3,483 (6,465) (2,982) (29,196) 6,954 (22,242)
1 Prioryear’sfigureshavebeenrestatedduetotheapplicationofIAS19(asrevisedin2011)retrospectively.Pleaserefertonote3.
Panalpina Annual Report 2013
Consolidated Financial Statements 103
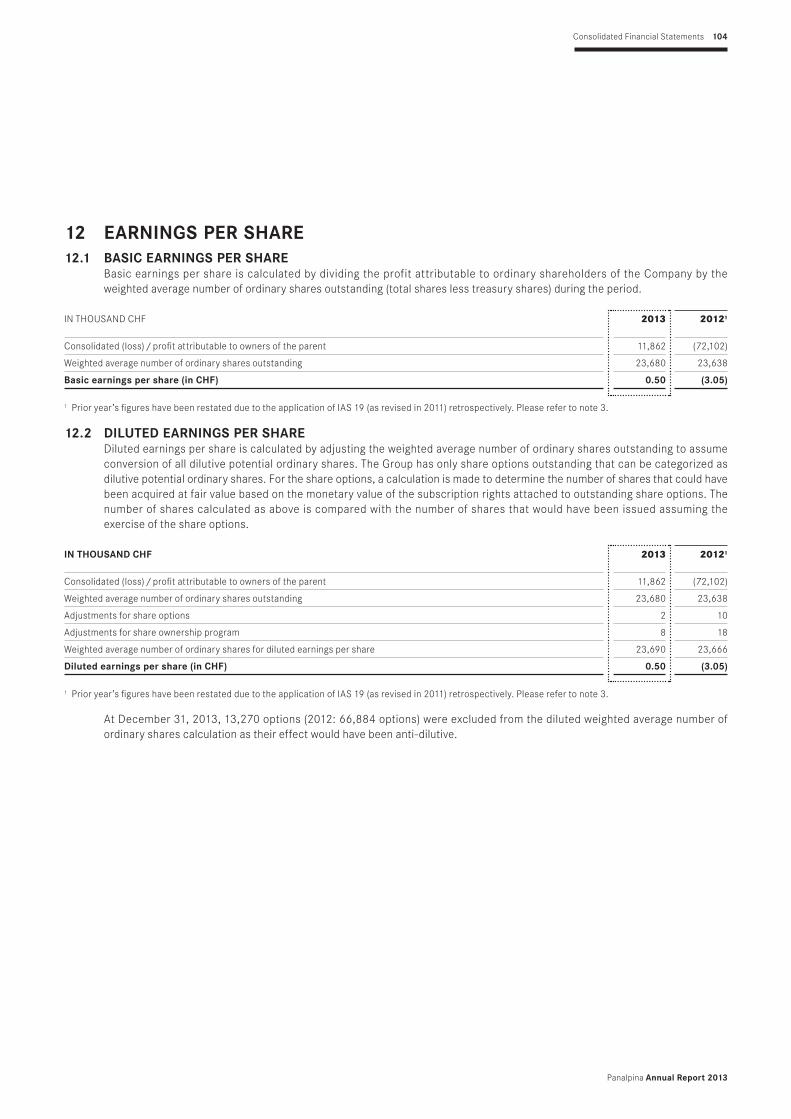
12 EARNINGS PER SHARE12.1 BASIC EARNINGS PER SHARE
Basic earnings per share is calculated by dividing the profit attributable to ordinary shareholders of the Company by the weighted average number of ordinary shares outstanding (total shares less treasury shares) during the period.
IN THOUSAND CHF 2013 20121
Consolidated (loss) / profit attributable to owners of the parent 11,862 (72,102)
Weighted average number of ordinary shares outstanding 23,680 23,638
Basic earnings per share (in CHF) 0.50 (3.05)
1 Prior year’s figures have been restated due to the application of IAS 19 (as revised in 2011) retrospectively. Please refer to note 3.
12.2 DILUTED EARNINGS PER SHAREDiluted earnings per share is calculated by adjusting the weighted average number of ordinary shares outstanding to assume conversion of all dilutive potential ordinary shares. The Group has only share options outstanding that can be categorized as dilutive potential ordinary shares. For the share options, a calculation is made to determine the number of shares that could have been acquired at fair value based on the monetary value of the subscription rights attached to outstanding share options. The number of shares calculated as above is com pared with the number of shares that would have been issued assuming the exercise of the share options.
IN THOUSAND CHF 2013 20121
Consolidated (loss) / profit attributable to owners of the parent 11,862 (72,102)
Weighted average number of ordinary shares outstanding 23,680 23,638
Adjustments for share options 2 10
Adjustments for share ownership program 8 18
Weighted average number of ordinary shares for diluted earnings per share 23,690 23,666
Diluted earnings per share (in CHF) 0.50 (3.05)
1 Prior year’s figures have been restated due to the application of IAS 19 (as revised in 2011) retrospectively. Please refer to note 3.
At December 31, 2013, 13,270 options (2012: 66,884 options) were excluded from the diluted weighted average number of ordinary shares calculation as their effect would have been anti-dilutive.
Panalpina Annual Report 2013
Consolidated Financial Statements 104

13 PROPERTY, PLANT AND EQUIPMENT
2013 (IN THOUSAND CHF)
LAND AND BUILDINGS
MACHI-NERY & EQUIP-MENT
VEHICLES
CON-STRUC- TION IN
PROGRESS
TOTAL
Acquisition costs
Balance on January 1 144,508 238,079 37,948 2,327 422,862
Translation differences (4,167) (6,790) (946) (217) (12,120)
Additions 5,439 17,062 3,545 1,615 27,661
Disposals (2,033) (14,948) (6,010) (228) (23,219)
Reclassifications 2,673 818 6 (3,497) 0
Balance on December 31 146,420 234,221 34,543 0 415,184
Accumulated depreciation
Balance on January 1 79,853 182,903 29,897 0 292,653
Translation differences (2,028) (6,039) (815) 0 (8,882)
Additions 7,760 23,306 3,212 0 34,278
Disposals (1,842) (14,645) (5,286) 0 (21,773)
Reclassifications (13) 12 1 0 0
Balance on December 31 83,730 185,537 27,009 0 296,276
Net book value on January 1 64,655 55,176 8,051 2,327 130,209
Net book value on December 31 62,690 48,684 7,534 0 118,908
Of which net book value of assets acquired under finance leases 191 13 550 0 754
2012 (IN THOUSAND CHF)
LAND AND BUILDINGS
MACHI-NERY & EQUIP-MENT
VEHICLES
CON-STRUC- TION IN
PROGRESS
TOTAL
Acquisition costs
Balance on January 1 134,660 230,286 36,309 37 401,292
Translation differences (1,009) (2,005) (442) 0 (3,456)
Additions 12,189 32,121 3,394 2,290 49,994
Disposals (1,519) (22,545) (904) 0 (24,968)
Reclassifications 187 222 (409) 0 0
Balance on December 31 144,508 238,079 37,948 2,327 422,862
Accumulated depreciation
Balance on January 1 74,592 184,967 28,553 0 288,112
Translation differences (649) (1,752) (432) 0 (2,833)
Additions 7,132 21,121 2,898 0 31,151
Disposals (1,409) (21,655) (713) 0 (23,777)
Reclassifications 187 222 (409) 0 0
Balance on December 31 79,853 182,903 29,897 0 292,653
Net book value on January 1 60,068 45,319 7,756 37 113,180
Net book value on December 31 64,655 55,176 8,051 2,327 130,209
Of which net book value of assets acquired under finance leases 2,101 36 838 230 3,205
Panalpina Annual Report 2013
Consolidated Financial Statements 105

14 INTANGIBLE ASSETS
2013 (IN THOUSAND CHF) GOODWILL SOFTWARE
BRANDS / CUSTOMER
LISTS
OTHER INTANGI-
BLE ASSETS
TOTAL
Acquisition costs
Balance on January 1 83,726 120,144 39,039 937 243,846
Translation differences (2,429) (1,339) (2,589) (101) (6,458)
Additions 0 22,141 0 18 22,159
Disposals 0 (1,720) 0 0 (1,720)
Balance on December 31 81,297 139,226 36,450 854 257,827
Accumulated amortization and impairment losses
Balance on January 1 19,925 51,947 37,086 753 109,711
Translation differences (2,047) (1,252) (2,453) (95) (5,847)
Additions 0 16,514 1,817 147 18,478
Impairment losses 19,112 0 0 0 19,112
Disposals 0 (1,720) 0 0 (1,720)
Balance on December 31 36,990 65,489 36,450 805 139,734
Net book value on January 1 63,801 68,197 1,953 184 134,135
Net book value on December 31 44,307 73,737 0 49 118,093
2012 (IN THOUSAND CHF) GOODWILL SOFTWARE
BRANDS / CUSTOMER
LISTS
OTHER INTANGI-
BLE ASSETS
TOTAL
Acquisition costs
Balance on January 1 82,717 88,919 37,518 708 209,862
Translation differences 1,009 (630) 1,521 (16) 1,884
Additions 0 33,900 0 260 34,160
Disposals 0 (2,045) 0 (15) (2,060)
Balance on December 31 83,726 120,144 39,039 937 243,846
Accumulated amortization and impairment losses
Balance on January 1 1,338 44,878 21,290 613 68,119
Translation differences 553 (557) 948 (20) 924
Additions 0 9,671 3,248 175 13,094
Impairment losses 18,034 0 11,600 0 29,634
Disposals 0 (2,045) 0 (15) (2,060)
Balance on December 31 19,925 51,947 37,086 753 109,711
Net book value on January 1 81,379 44,041 16,228 95 141,743
Net book value on December 31 63,801 68,197 1,953 184 134,135
The net book value of software comprises accumulated, internally generated, capitalized software development costs of CHF 49.2 million (2012: CHF 47.2 million). All intangible assets with estimable useful lives are amortized over the period of their respective estimated useful lives to their estimated residual values, and reviewed for impairment. In the fourth quarter of the period under review, management decided to discontinue certain activities in Norway. As a result, volume and profitability are
Panalpina Annual Report 2013
Consolidated Financial Statements 106

expected to significantly decrease in the future compared to current and former business plans. Therefore, in the period under review the Group recognized a goodwill impairment charge of CHF 19.1 million (2012: CHF 18.0 million) while in the previous year’s period, a further impairment of CHF 11.6 million on the customer lists acquired was posted.
14.1 IMPAIRMENT TEST FOR GOODWILLGoodwill is allocated to the Group’s cash-generating units (CGUs) identified according to the country of operation. The recoverable amount of a CGU is determined based on value-in-use calculations. These calculations use cash flow projections based on financial budgets ap proved by management covering a five-year period. Cash flows beyond the five-year period are extrapolated using the estimated growth rates stated below. The growth rate does not exceed the long-term average growth rate for the business in which the CGU operates.
A summary of the goodwill allocation per CGU is presented below:
IN THOUSAND CHF 2013 2012
Air Freight division (CGU Airfreight) 31,018 31,151
Grampian International Freight Aberdeen & Beverwijk (CGU Grampian) 6,456 6,492
Panalpina World Transport (Singapore) Pte. Ltd. (CGU Janco) 3,852 4,104
Panalpina World Transport (Pty) Ltd. (CGU Australia) 2,981 3,584
Grieg Logistics AS (CGU Norway) 0 18,470
Total goodwill 44,307 63,801
The following key assumptions have been used for the value-in-use calculations of each CGU:
2013CGU
NORWAY
CGU AUSTRA-
LIA
CGU AIR-
FREIGHT
CGU GRAM-
PIANCGU
JANCO
Growth rate1 4.13 % 4.80 % 3.25 % 4.23 % 3.90 %
Operating expenses in % of forwarding revenues2 100.50 % 87.92 % 81.85 % 87.63 % 81.08 %
WACC3 9.86 % 12.84 % 7.91 % 9.19 % 8.39 %
2012CGU
NORWAY
CGU AUSTRA-
LIA
CGU AIR-
FREIGHT
CGU GRAM-
PIANCGU
JANCO
Growth rate1 10.38 % 5.30 % 3.25 % 5.31 % 4.00 %
Operating expenses in % of forwarding revenues2 99.00 % 99.40 % 98.03 % 91.63 % 97.46 %
WACC3 7.76 % 11.32 % 8.15 % 9.72 % 8.59 %
1 Weighted average growth rate used to extrapolate cash flows beyond the one-year budgeting period2 Budgeted operating expenses in % of forwarding revenues3 Pre-tax discount rate applied to the cash flow projections
The management determined budgeted growth rates based on past performance and its expectations of market development. The operating expenses, as a percentage of forwarding revenues, are consistent with the forecasts and past experience. The weighted average cost of capital (WACC) used is pre-tax and reflects specific risks relating to the relevant CGUs. For the impairment testing procedure the planning assumptions of prior years were critically reviewed. The impairment testing procedure assumes that the CGU will achieve sales growth at market growth for the planning period. It is also assumed that the percentage of operating expenses as a percentage of forwarding revenue will remain stable.
Panalpina Annual Report 2013
Consolidated Financial Statements 107

For other CGUs, the carrying value of goodwill will exceed the recoverable amount only if the following changes in the key
assumptions gross profit growth or WACC occur:
CGU Airfreight
Gross profit growth rate – 57.0 percentage points
WACC + 32.7 percentage points
CGU Janco
Gross profit growth rate – 42.9 percentage points
WACC + 17.0 percentage points
CGU Grampian
Gross profit growth rate – 16.1 percentage points
WACC + 13.5 percentage points
CGU Australia
Gross profit growth rate – 31.9 percentage points
WACC + 24.8 percentage points
15 INVESTMENTS AND OTHER CURRENT FINANCIAL ASSETS
IN THOUSAND CHF 2013 2012
Available-for-sale investments 2,280 2,025
Fair value through profit or loss investments 1,040 8,574
Loans receivable 203 213
Long-term receivables 18,787 15,857
Other 6,039 4,967
Total investments 28,349 31,636
Fair value through profit or loss investments 5,472 0
Total other current financial assets 5,472 0
Long-term receivables primarily include rental and guarantee deposits.
15.1 AVAILABLE-FOR-SALE INVESTMENTS – UNQUOTED EQUITY SHARES
IN THOUSAND CHF 2013 2012
Balance on January 1 2,025 19,670
Translation differences (197) 115
Additions 103 94
Disposals 0 (17,840)
Fair value adjustments recognized in profit or loss (Impairment) 0 0
Fair value adjustments recognized in other comprehensive income 349 (14)
Balance on December 31 2,280 2,025
Less: non-current portion 2,280 2,025
Current portion 0 0
In 2012, disposals include an amount of CHF 464 thousand, which has been recycled from comprehensive income to the income statement due to the sale of Luxair SA shares.
Panalpina Annual Report 2013
Consolidated Financial Statements 108

15.2 FAIR VALUE THROUGH PROFIT OR LOSS INVESTMENTS
IN THOUSAND CHF 2013 2012
Balance on January 1 8,574 775
Translation differences (173) (3)
Additions 42 9,180
Disposals (2,685) (206)
Fair value adjustments recognized in profit or loss 754 (1,172)
Balance on December 31 6,512 8,574
Less: non-current portion 1,040 8,574
Current portion 5,472 0
In the fourth quarter of the period under review, the Group has decided to fully dispose of its equity stake in Dimerco, a company listed on the Taipeh Stock Exchange, within the next 12 months. Disposals of Dimerco shares amounted to CHF 2,674 thousand while the gain for fair value adjustments recognized in profit or loss was CHF 604 thousand during the period under review.
16 GROUP RISK MANAGEMENTIn the field of risk management, the Audit Committee approves the detailed and weighted risk map of the Executive Board. It adopts the necessary measures for risk control and risk mitigation and reports the respective outcome to the Board of Directors on an annual basis. The risk map itself covers any strategic, financial, operational, legal and compliance risks that could significantly impact the Company’s ability to achieve its business goals and financial targets. Identified risks are weighted and prioritized by the Executive Board according to their significance and likelihood of occurrence. For each risk, specific risk- mitigation measures – including their current status – are defined and responsibilities are allocated. The risk map, which is compiled by the Risk Review Committee, chaired by the Corporate Secretary, for review by the Executive Board and the Audit Committee and subsequently approved by the Audit Committee, contains risks iden tified and assessed by the respective corporate functions, selected country management, Corporate Audit and the Group auditors. The annual risk map also features risks that have increased or decreased in the course of the reporting year. Financial risk management specifically is described in further detail below.
17 FINANCIAL RISK MANAGEMENTThe Group’s principal financial liabilities, other than derivatives, comprise loans and borrowings, trade and other payables. The main purpose of these financial liabilities is to raise funds for Group operations. The Group has trade and other receivables, loans, cash, and short-term and long-term deposits that arise directly from its operations. The Group also holds available-for-sale investments and enters into derivative transactions.
The Group is exposed to market risk, credit risk, liquidity risk and capital risk. The Group’s senior management oversees the management of these risks. It is supported by a financial risk committee that advises on financial risks and the appropriate financial risk governance framework for the Group. The financial risk committee provides assurance to the Group’s senior management that the Group’s financial risk-taking activities are governed by appropriate policies and procedures and that financial risks are identified, measured and managed in accor dance with Group policies and Group risk appetite. All derivative activities for risk management purposes are carried out by specialist teams that have the appropriate skills, experience and supervision. It is the Group’s policy that no trading in derivatives for speculative purposes shall be undertaken.
Panalpina Annual Report 2013
Consolidated Financial Statements 109

The Board of Directors reviews and agrees on policies for managing each of these risks, which are summarized below.
17.1 FINANCIAL RISK FACTORSCarrying amount and fair value of financial assets by asset classes
2013 (IN THOUSAND CHF) CASH
AVAI-LABLE-
FOR-SALE
FAIR VALUE
THROUGH PROFIT OR
LOSS HELD FOR
TRADING
LOANS AND
RECEI- VABLES
CARRYING AMOUNT
TOTAL (FAIR
VALUE)
Trade receivables and other receivables 1,082,783 1,082,783 1,082,783
Unbilled forwarding services 91,192 91,192 91,192
Accrued interest income 32 32 32
Cash and cash equivalents 619 336,304 336,923 336,923
Derivative financial instruments 2,905 2,905 2,905
Investments:
Bonds and debentures 448 448 448
Shares 2,280 6,064 8,344 8,344
Third-party loans 203 203 203
Rental and guarantee deposits 18,787 18,787 18,787
Other 6,039 6,039 6,039
Total on December 31, 2013 619 2,280 9,417 1,535,340 1,547,656 1,547,656
2013 (IN THOUSAND CHF)
FINANCIAL LIABILITIES
AT FAIR VALUE
THROUGH PROFIT
OR LOSS
FINANCIAL LIABILITIES MEASURED
AT AMOR-TIZED COST
CARRYING AMOUNT
TOTAL (FAIR
VALUE)
Payables and accruals 913,701 913,701 913,701
Borrowings 2,834 2,834 2,834
Finance lease liabilities 427 427 427
Derivative financial instruments 1,710 1,710 1,710
Total on December 31, 2013 1,710 916,962 918,672 918,672
Panalpina Annual Report 2013
Consolidated Financial Statements 110

2012 (IN THOUSAND CHF) CASH
AVAI-LABLE-
FOR-SALE
FAIR VALUE
THROUGH PROFIT OR
LOSS HELD FOR
TRADING
LOANS AND
RECEI-VABLES
CARRYING AMOUNT
TOTAL (FAIR
VALUE)
Trade receivables and other receivables 1,044,487 1,044,487 1,044,487
Unbilled forwarding services 85,227 85,227 85,227
Accrued interest income 18 18 18
Cash and cash equivalents 1,081 391,980 393,061 393,061
Other current financial assets 0 0 0
Derivative financial instruments 2,948 2,948 2,948
Investments:
Bonds and debentures 398 398 398
Shares 2,025 8,176 10,201 10,201
Other investments 0 0 0
Third-party loans 237 237 237
Rental and guarantee deposits 15,857 15,857 15,857
Other 4,967 4,967 4,967
Total on December 31, 2012 1,081 2,025 11,522 1,542,773 1,557,401 1,557,401
2012 (IN THOUSAND CHF)
FINANCIAL LIABILITIES
AT FAIR VALUE
THROUGH PROFIT
OR LOSS
FINANCIAL LIABILITIES MEASURED
AT AMOR-TIZED COST
CARRYING AMOUNT
TOTAL (FAIR
VALUE)
Payables and accruals 922,510 922,510 922,510
Borrowings 1,395 1,395 1,395
Finance lease liabilities 473 473 473
Derivative financial instruments 1,256 1,256 1,256
Total on December 31, 2012 1,256 924,378 925,634 925,634
Panalpina Annual Report 2013
Consolidated Financial Statements 111
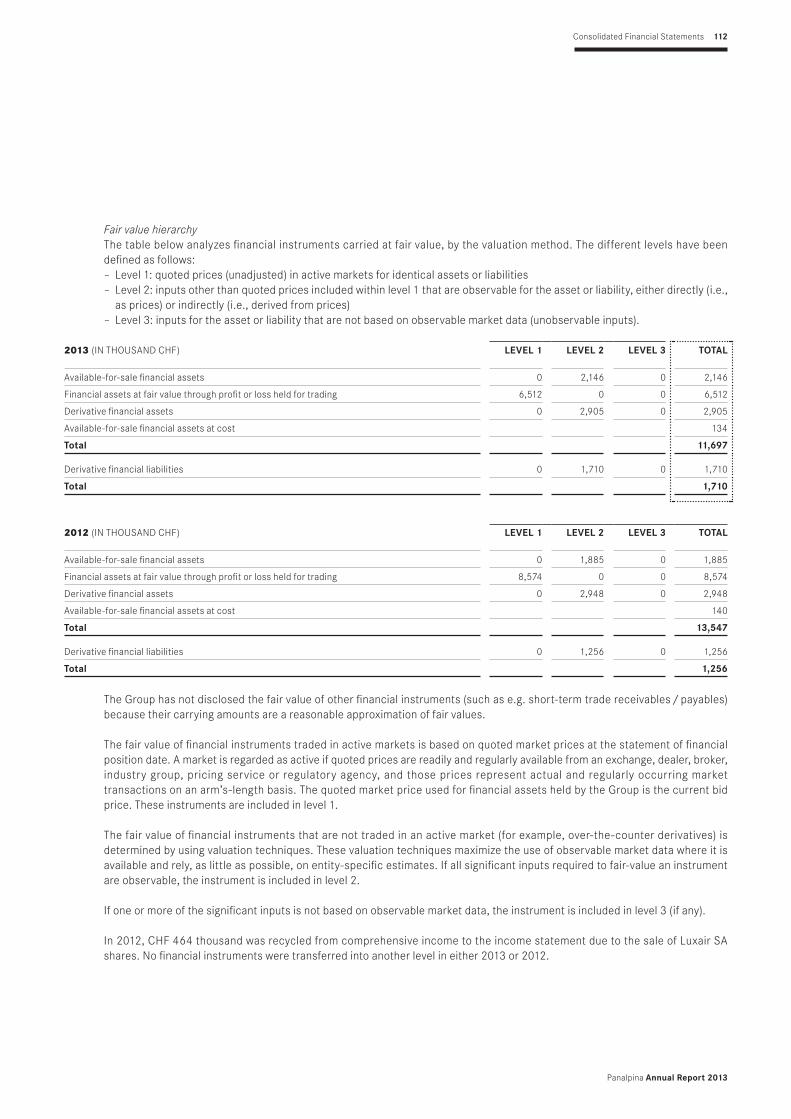
Fair value hierarchy The table below analyzes financial instruments carried at fair value, by the valuation method. The different levels have been defined as follows:
– Level 1: quoted prices (unadjusted) in active markets for identical assets or liabilities – Level 2: inputs other than quoted prices included within level 1 that are observable for the asset or liability, either directly (i.e., as prices) or indirectly (i.e., derived from prices)
– Level 3: inputs for the asset or liability that are not based on observable market data (unobservable inputs).
2013 (IN THOUSAND CHF) LEVEL 1 LEVEL 2 LEVEL 3 TOTAL
Available-for-sale financial assets 0 2,146 0 2,146
Financial assets at fair value through profit or loss held for trading 6,512 0 0 6,512
Derivative financial assets 0 2,905 0 2,905
Available-for-sale financial assets at cost 134
Total 11,697
Derivative financial liabilities 0 1,710 0 1,710
Total 1,710
2012 (IN THOUSAND CHF) LEVEL 1 LEVEL 2 LEVEL 3 TOTAL
Available-for-sale financial assets 0 1,885 0 1,885
Financial assets at fair value through profit or loss held for trading 8,574 0 0 8,574
Derivative financial assets 0 2,948 0 2,948
Available-for-sale financial assets at cost 140
Total 13,547
Derivative financial liabilities 0 1,256 0 1,256
Total 1,256
The Group has not disclosed the fair value of other financial instruments (such as e.g. short-term trade receivables / payables) because their carrying amounts are a reasonable approximation of fair values.
The fair value of financial instruments traded in active markets is based on quoted market prices at the statement of financial position date. A market is regarded as active if quoted prices are readily and regularly available from an exchange, dealer, broker, industry group, pricing service or regulatory agency, and those prices represent actual and regularly occurring market transactions on an arm’s-length basis. The quoted market price used for financial assets held by the Group is the current bid price. These instruments are included in level 1.
The fair value of financial instruments that are not traded in an active market (for example, over-the-counter derivatives) is determined by using valuation techniques. These valuation techniques maximize the use of observable market data where it is available and rely, as little as possible, on entity-specific estimates. If all significant inputs required to fair-value an instrument are observable, the instrument is included in level 2.
If one or more of the significant inputs is not based on observable market data, the instrument is included in level 3 (if any).
In 2012, CHF 464 thousand was recycled from comprehensive income to the income statement due to the sale of Luxair SA shares. No financial instruments were transferred into another level in either 2013 or 2012.
Panalpina Annual Report 2013
Consolidated Financial Statements 112

17.2 MARKET RISKMarket risk is the risk that the fair value of future cash flows of a financial instrument will fluctuate due to changes in market price. Market prices entail three types of risk: foreign currency risk, interest rate risk and other price risk such as equity risk.
The Group’s activities expose it primarily to financial risk due to changes in foreign currency exchange rates.
17.2.1 Foreign currency riskThe Group operates internationally and is exposed to foreign exchange risk arising from various currency exposures, primarily in regard to the US dollar, the Euro and the Hong Kong dollar. Foreign exchange risk arises from future commercial transactions, recognized assets and liabilities, and net investments in foreign operations.
Management has set up a policy that requires Group Companies to manage their foreign exchange risk against their functional currency. The Group companies are required to hedge their entire foreign exchange risk exposure with the Group Treasury, if possible. To manage foreign exchange risks arising from future commercial transactions or recognized assets and liabilities, entities in the Group use forward contracts. Foreign exchange risk arises when future commercial transactions or recognized assets and liabilities are denominated in a currency that is not the Group entity’s functional currency. The Group Treasury is responsible for managing the net position using external derivative contracts. For segment reporting purposes, each subsidiary designates contracts with the Group Treasury as fair value hedges. External foreign exchange contracts are designated at the Group level as hedges of foreign exchange risk on specific assets and liabilities on a gross basis.
At December 31, 2013, the Group’s net foreign currency risk exposure amounted to CHF 281.0 million (2012: CHF 161.9 million). The following table demonstrates the sensitivity to a reasonable possible change of 10 % in the USD, EUR and HKD exchange rate, with all other variables held constant, of the Group’s profit before income tax (due to changes in the fair value of monetary assets and liabilities).
PROFIT BEFORE INCOME TAX
EFFECT IN THOUSAND CHF 2013 2012
US dollar 45,493 23,871
Euro 4,322 (5,211)
Hong Kong dollar 1,582 (3,398)
Total effect 51,397 15,262
The movement in the pre-tax effect results from the change in the fair value of derivative financial instruments not designated in a hedging relationship and monetary assets and liabilities denominated in USD, EUR and HKD, in which the functional currency of the entity is a cur rency other than USD, EUR or HKD. Although the derivatives have not been designated in a hedge relationship, they act as a commercial hedge and will offset the underlying transactions should they occur. If the exchange rates of all currencies changed by 10 %, the total maximum net effect would amount to CHF 52.0 million (2012: CHF 16.2 million).
17.2.2 Interest rate riskThe Group has a clear funding policy that prohibits affiliates from borrowing in foreign currency and has a clear preference for intragroup financing. Affiliates are also required to repatriate their excess cash. Liquidity is mainly managed at the corporate level by using money market products. Derivative instruments are used to manage the duration of financial instruments in a prudent manner.
As the Group generally has no significant interest-bearing liabilities, and given their short-term nature, the Group has a limited exposure to interest rate risk. Consequently, the Group’s expense and operating cash flows are substantially independent of changes in market interest rates.
Panalpina Annual Report 2013
Consolidated Financial Statements 113

17.3 CREDIT RISKCredit risk is the risk that a counterparty will not meet its obligations under a financial instrument or customer contract, leading to a finan cial loss. The Group is exposed to credit risk from its operating activities (primarily for trade receivables) and from its financing activities, including deposits with banks and other financial institutions, foreign exchange transactions and other financial instruments.
Credit risk related to trade receivablesCustomer credit is managed by each business unit and subject to the Group’s established policy, procedures and control relating to cus tomer credit risk management. Credit limits are established for all customers based on external ratings or, if not available, according to internal rating criteria. The customer’s credit quality is assessed based on an extensive credit rating scorecard. Outstanding customer receivables are regularly monitored. The objective of the management of trade receivables is to sustain the growth and profitability of the Group by optimizing asset utilization while maintaining risks at an acceptable level. There is no significant concentration of counterparty credit risk due to the Group’s large number of customers and their wide geographical spread. Risk limits and exposures are continuously monitored by country and by the nature of counterparties. Additionally, the Group obtains credit insurance and similar enhancements when appropriate to protect the collection of trade receivables.
Credit risk related to financial instruments and cash deposit Credit risk from balances with banks and financial institutions is managed by the Group Treasury in accordance with the Group’s policy. Investments of surplus funds are made only with approved counterparties and with credit limits assigned to each counterparty with a minimum rating of A. Counterparty credit limits are reviewed by senior management on a regular basis. The limits are set to minimize the concentra tion of risks and therefore mitigate financial loss through potential counterparty failure.
The table below shows the Group’s maximum exposure to credit risk:
IN THOUSAND CHF 2013 2012
Cash and cash equivalents (without cash in hand) 336,305 391,980
Derivative financial instruments 2,905 2,948
Trade receivables and other receivables 1,206,666 1,169,404
Loans and other financial assets 31,565 29,635
Total financial assets shown in statement of financial position subject to credit risk 1,577,441 1,593,967
Guarantees 527,058 537,605
Total credit risk 2,104,499 2,131,572
17.4 LIQUIDITY RISKLiquidity risk is the risk that the Group will not be able to meet its financial obligations as they become due. The Group’s approach to managing liquidity is to ensure, to the extent possible, that it will always have sufficient liquidity to meet its liabilities when due, under both normal and stressed conditions, without incurring unacceptable losses or risking damage to the Group’s reputation.
The Group’s objective is to maintain a balance between continuity of funding and flexibility through the use of overdrafts, bank loans, de bentures, finance leases and hire purchase contracts. The Group’s liquidity is reported to the management on a monthly basis.
To secure liquidity, the Group holds a net cash position of CHF 339.1 million (2012: CHF 391.2 million) and credit lines with various finan cial institutions totaling CHF 535.1 million (2012: CHF 621.5 million). Of this total, CHF 209.8 million (2012: CHF 201.7 million) is allocated to bank guarantees and foreign exchange lines.
Panalpina Annual Report 2013
Consolidated Financial Statements 114

The table below summarizes the maturity profile of the Group’s financial liabilities at December 31 based on contractual un discounted payments.
2013 (IN THOUSAND CHF)
BETWEEN
1 AND 3 MONTHS
BETWEEN 3 MONTHS
AND 1 YEAR
BETWEEN
1 AND 5 YEARS
TOTAL RE-MAINING
CONTRAC-TUAL
PAYMENTS
Borrowings (note 24) 2,333 720 208 3,261
Trade and other payables 517,633 128,857 3,807 650,297
Accruals 217,229 16,891 29,285 263,405
Other liabilities 38,479 10,698 0 49,177
Foreign exchange contracts
Cash inflow 364,895 57,803 0 422,698
Cash outflow (233,429) (31,354) 0 (264,783)
Total 907,140 183,615 33,300 1,124,055
2012 (IN THOUSAND CHF)
BETWEEN 1 AND 3
MONTHS
BETWEEN 3 MONTHS
AND 1 YEAR
BETWEEN 1 AND 5
YEARS
TOTAL RE-MAINING
CONTRAC-TUAL
PAYMENTS
Borrowings (note 24) 1,442 169 257 1,868
Trade and other payables 465,441 188,941 0 654,382
Accruals 214,641 52,409 0 267,050
Provisions and other liabilities 6,656 26,569 0 33,225
Foreign exchange contracts
Cash inflow 314,945 9,854 0 324,799
Cash outflow (162,728) (5,496) 0 (168,224)
Total 840,397 272,446 257 1,113,100
17.5 CAPITAL RISK MANAGEMENTThe Group’s objectives when managing capital are to safeguard its ability to continue as a going concern in order to provide returns for shareholders and benefits for other stakeholders and to maintain an optimal capital structure to reduce the cost of capital. In order to maintain or adjust the capital structure, the Group may adjust the amount of dividends paid to shareholders, return capital to shareholders, issue new shares or sell assets to reduce debts. Capital is monitored on the basis of the equity ratio, which is calculated as equity (including non-controlling interests) as a percentage of total assets. This is reported to the management as part of the Group’s regular internal management reporting.
The Group’s capital and equity ratio is shown in the table below:
IN THOUSAND CHF 2013 20121
Capital and reserves attributable to Panalpina shareholders 697,508 733,512
Equity attributable to non-controlling interests 11,673 9,241
Total equity 709,181 742,753
Total assets 1,949,457 1,957,055
Equity ratio 36.4 % 38.0 %
1 Prior year’s figures have been restated due to the application of IAS 19 (as revised in 2011) retrospectively. Please refer to note 3.
The Group is not subject to regulatory capital adequacy requirements.Panalpina Annual Report 2013
Consolidated Financial Statements 115
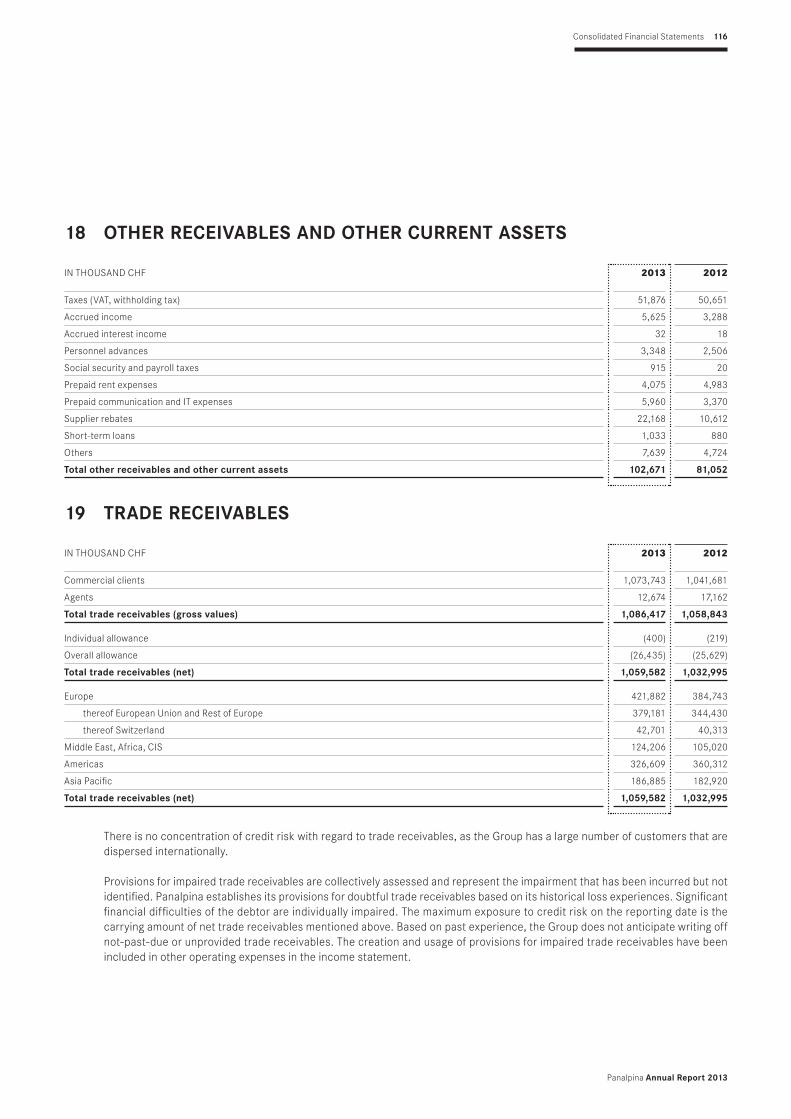
18 OTHER RECEIVABLES AND OTHER CURRENT ASSETS
IN THOUSAND CHF 2013 2012
Taxes (VAT, withholding tax) 51,876 50,651
Accrued income 5,625 3,288
Accrued interest income 32 18
Personnel advances 3,348 2,506
Social security and payroll taxes 915 20
Prepaid rent expenses 4,075 4,983
Prepaid communication and IT expenses 5,960 3,370
Supplier rebates 22,168 10,612
Short-term loans 1,033 880
Others 7,639 4,724
Total other receivables and other current assets 102,671 81,052
19 TRADE RECEIVABLES
IN THOUSAND CHF 2013 2012
Commercial clients 1,073,743 1,041,681
Agents 12,674 17,162
Total trade receivables (gross values) 1,086,417 1,058,843
Individual allowance (400) (219)
Overall allowance (26,435) (25,629)
Total trade receivables (net) 1,059,582 1,032,995
Europe 421,882 384,743
thereof European Union and Rest of Europe 379,181 344,430
thereof Switzerland 42,701 40,313
Middle East, Africa, CIS 124,206 105,020
Americas 326,609 360,312
Asia Pacific 186,885 182,920
Total trade receivables (net) 1,059,582 1,032,995
There is no concentration of credit risk with regard to trade receivables, as the Group has a large number of customers that are dispersed internationally.
Provisions for impaired trade receivables are collectively assessed and represent the impairment that has been incurred but not identified. Panalpina establishes its provisions for doubtful trade receivables based on its historical loss experiences. Significant financial difficulties of the debtor are individually impaired. The maximum exposure to credit risk on the reporting date is the carrying amount of net trade receivables mentioned above. Based on past experience, the Group does not anticipate writing off not-past-due or unprovided trade receivables. The creation and usage of provisions for impaired trade receivables have been included in other operating expenses in the income statement.
Panalpina Annual Report 2013
Consolidated Financial Statements 116

The following table summarizes the movement in the provision for impairment of trade receivables:
IN THOUSAND CHF 2013 2012
Balance as of January 1 25,848 24,119
Receivables written off during the year as uncollectible (5,107) (5,550)
Changes in provision for doubtful accounts 6,094 7,279
Balance as of December 31 26,835 25,848
The following table provides details about the aging of trade receivables that are not overdue, as the payment terms specified in the terms and conditions established with Panalpina customers have not been exceeded, and as an analysis of overdue amounts and related provisions for doubtful trade receivables:
IN THOUSAND CHF 2013 2012
Commercial clients 1,073,743 1,041,681
Agents 12,674 17,162
Total trade receivables (gross values) 1,086,417 1,058,843
Allowance for bad debt (26,835) (25,848)
Total trade receivables (net) 1,059,582 1,032,995
of which:
Not overdue 759,857 745,579
Past due not more than 30 days 194,805 201,118
Past due more than 30 days up to 180 days 117,559 102,776
Past due more than 180 days up to 360 days 16,417 16,525
Past due more than 360 days 12,105 6,903
Prepayment (14,326) (14,058)
Total trade receivables (gross) 1,086,417 1,058,843
Allowance for bad debt (26,835) (25,848)
Total trade receivables (net) 1,059,582 1,032,995
Panalpina Annual Report 2013
Consolidated Financial Statements 117

20 DERIVATIVE FINANCIAL INSTRUMENTS
CONTRACT VALUE
POSITIVE REPLACEMENT VALUE
NEGATIVE REPLACEMENT VALUE
IN THOUSAND CHF 2013 2012 2013 2012 2013 2012
Forward foreign exchange contracts 685,792 492,876 2,905 2,948 (1,710) (1,256)
Forward trading hedges 685,792 492,876 2,905 2,948 (1,710) (1,256)
CONTRACT VALUE
POSITIVE REPLACEMENT VALUE
NEGATIVE REPLACEMENT VALUE
IN THOUSAND CHF 2013 2012 2013 2012 2013 2012
Terms of the forward foreign exchange contracts 685,792 492,876 2,905 2,948 (1,710) (1,256)
0 – 3 months 597,384 492,876 2,420 2,948 (1,070) (1,256)
4 – 12 months 88,408 0 485 0 (640) 0
13 – 18 months 0 0 0 0 0 0
Derivative financial instruments are spread over the following currencies:
FORWARD FOREIGN EXCHANGE CONTRACTS
IN THOUSAND CHF 2013 2012
EUR 367,738 290,009
USD 95,642 21,286
HKD 41,920 45,242
CNY 35,355 36,810
CHF 30,413 19,950
MXN 25,707 19,024
SGD 12,142 8,972
VND 8,571 4,161
CAD 7,611 3,293
TRY 7,343 0
TWD 7,095 6,179
KRW 6,510 5,774
PHP 6,420 5,087
SEK 6,191 3,098
MYR 5,176 6,875
CZK 4,182 2,594
CLP 3,823 0
PEN 2,621 1,513
AUD 2,370 0
Other 8,962 13,009
Total 685,792 492,876
Panalpina Annual Report 2013
Consolidated Financial Statements 118

ISDA Master AgreementsThe Group enters into derivative transactions with several counterparties under International Swaps and Derivatives Association (ISDA) master agreements. The ISDA agreements do not meet the criteria for offsetting in the consolidated statement of financial position. This is because the Group does not have any currently legally enforceable right to offset recognised amounts, as the right to offset is enforceable only on the occurrence of triggering events in the future, e.g. when a credit event such as default occurs or in the event of bankruptcy of one party. In such a triggering event, all outstanding derivative transactions with one counterparty under such an agreement are terminated, the termination value is assessed and a single net amount is payable in settlement of all transactions.
The following table sets out the carrying amounts of recognised derivatives that are subject to the above agreements.
2013 (IN THOUSAND CHF)
GROSS AND NET
AMOUNTS PRESEN-
TED IN THE STATE-
MENT OF FINANCIAL POSITION
RELATED FINANCIAL
INSTRU-MENTS
THAT ARE NOT OFF-
SETNET
AMOUNT
Financial assets
Forward foreign exchange contracts 2,905 (1,134) 1,771
Total on December 31 2,905 (1,134) 1,771
Financial liabilities
Forward foreign exchange contracts (1,710) 1,134 (576)
Total on December 31 (1,710) 1,134 (576)
2012 (IN THOUSAND CHF)
GROSS AND NET
AMOUNTS PRESEN-
TED IN THE STATE-
MENT OF FINANCIAL POSITION
RELATED FINANCIAL
INSTRU-MENTS
THAT ARE NOT OFF-
SETNET
AMOUNT
Financial assets
Forward foreign exchange contracts 2,948 (987) 1,961
Total on December 31 2,948 (987) 1,961
Financial liabilities
Forward foreign exchange contracts (1,256) 987 (269)
Total on December 31 (1,256) 987 (269)
Panalpina Annual Report 2013
Consolidated Financial Statements 119

21 CASH AND CASH EQUIVALENTS
IN THOUSAND CHF 2013 2012
Cash on hand 619 1,081
Cash at bank 340,710 391,252
Checks and bills of exchange in transit (4,406) 728
Total cash and cash equivalents 336,923 393,061
Net cash (debt) is comprised as follows:
IN THOUSAND CHF 2013 2012
Cash and cash equivalents 336,923 393,061
Other current financial assets 5,472 0
Short-term borrowings (3,053) (1,611)
Long-term borrowings (208) (257)
Net cash 339,134 391,193
22 SHARE CAPITAL AND TREASURY SHARES
IN THOUSAND CHF
OUT-STANDING
NUMBER OF SHARES
(NUM-BERS)
ORDINARY SHARES
TREASURY SHARES TOTAL
Shares issued 23,750,000 2,375 2,375
Treasury shares held (100,398) (10,018) (10,018)
Balance on January 1, 2013 23,649,602 2,375 (10,018) (7,643)
Treasury shares
Purchased 0 0 0 0
Sold under employee share plan 12,864 0 1,284 1,284
Sold under employee option plan 41,248 0 4,116 4,116
Bonus settled with own shares 12,819 0 1,279 1,279
Movement 66,931 0 6,679 6,679
Shares issued 23,750,000 2,375 2,375
Treasury shares held (33,467) (3,339) (3,339)
Balance on December 31, 2013 23,716,533 2,375 (3,339) (964)
The share capital is presented by 23,750,000 issued shares of CHF 0.10 par value (2012: 23,750,000 of CHF 0.10 par value), fully paid in. On December 31, 2013, the number of outstanding shares amounted to 23,716,533 shares (2012: 23,649,602) and the number of treas ury shares to 33,467 (2012: 100,398). Treasury shares have been deducted from equity attributable to owners of the parent. All shares issued by the Company were fully paid in.
The Shareholders’ Meeting held on May 15, 2013 approved a dividend of CHF 2.00 per share that was distributed in respect of the business year 2012. The total dividend paid in 2013 amounted to CHF 47.3 million (2012: CHF 47.2 million). In addition to the dividend payment in the Annual Meeting of Shareholders held in 2012 the shareholders approved the cancellation of the
Panalpina Annual Report 2013
Consolidated Financial Statements 120
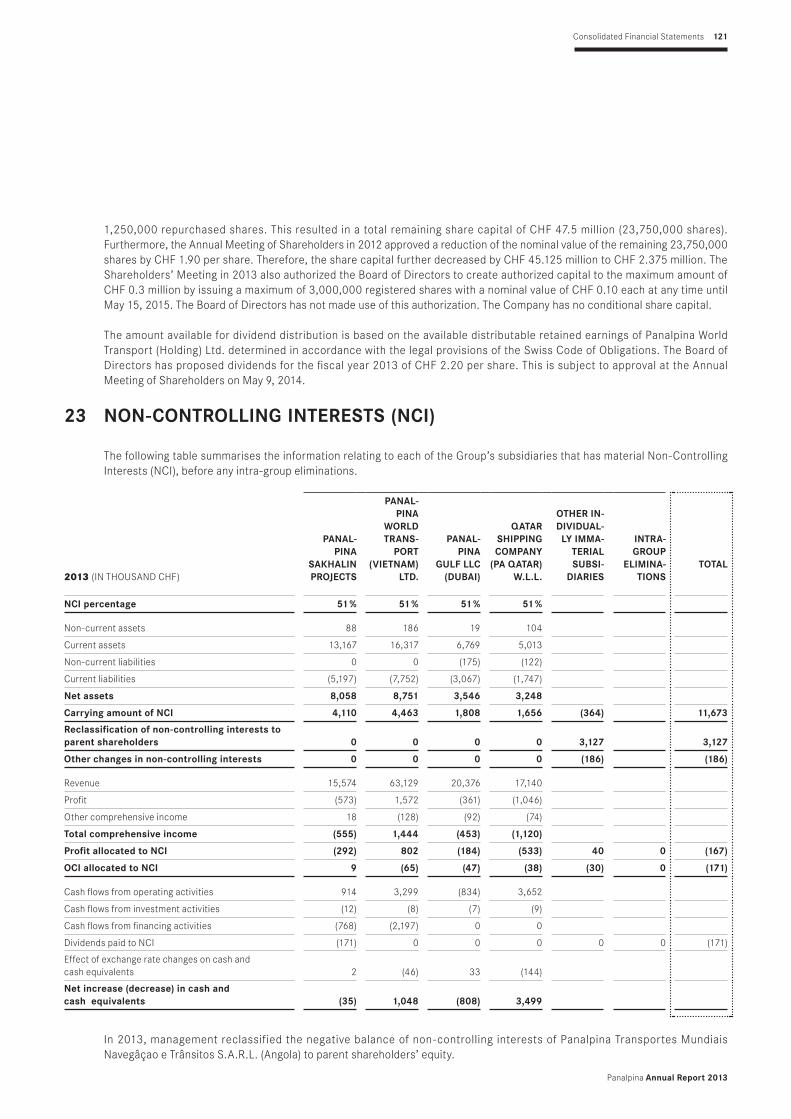
1,250,000 repurchased shares. This resulted in a total remaining share capital of CHF 47.5 million (23,750,000 shares). Furthermore, the Annual Meeting of Shareholders in 2012 approved a reduction of the nominal value of the remaining 23,750,000 shares by CHF 1.90 per share. Therefore, the share capital further decreased by CHF 45.125 million to CHF 2.375 million. The Shareholders’ Meeting in 2013 also authorized the Board of Directors to create authorized capital to the maximum amount of CHF 0.3 million by issuing a maximum of 3,000,000 registered shares with a nominal value of CHF 0.10 each at any time until May 15, 2015. The Board of Directors has not made use of this au thorization. The Company has no conditional share capital.
The amount available for dividend distribution is based on the available distributable retained earnings of Panalpina World Transport (Holding) Ltd. determined in accordance with the legal provisions of the Swiss Code of Obligations. The Board of Directors has proposed dividends for the fiscal year 2013 of CHF 2.20 per share. This is subject to approval at the Annual Meeting of Shareholders on May 9, 2014.
23 NON-CONTROLLING INTERESTS (NCI)
The following table summarises the information relating to each of the Group’s subsidiaries that has material Non-Controlling Interests (NCI), before any intra-group eliminations.
2013 (IN THOUSAND CHF)
PANAL- PINA
SAKHALIN PROJECTS
PANAL- PINA
WORLD TRANS-
PORT (VIETNAM)
LTD.
PANAL- PINA
GULF LLC (DUBAI)
QATAR SHIPPING COMPANY
(PA QATAR) W.L.L.
OTHER IN-DIVIDUAL-LY IMMA-
TERIAL SUBSI-
DIARIES
INTRA-GROUP
ELIMINA-TIONS
TOTAL
NCI percentage 51 % 51 % 51 % 51 %
Non-current assets 88 186 19 104
Current assets 13,167 16,317 6,769 5,013
Non-current liabilities 0 0 (175) (122)
Current liabilities (5,197) (7,752) (3,067) (1,747)
Net assets 8,058 8,751 3,546 3,248
Carrying amount of NCI 4,110 4,463 1,808 1,656 (364) 11,673
Reclassification of non-controlling interests to parent shareholders 0 0 0 0 3,127 3,127
Other changes in non-controlling interests 0 0 0 0 (186) (186)
Revenue 15,574 63,129 20,376 17,140
Profit (573) 1,572 (361) (1,046)
Other comprehensive income 18 (128) (92) (74)
Total comprehensive income (555) 1,444 (453) (1,120)
Profit allocated to NCI (292) 802 (184) (533) 40 0 (167)
OCI allocated to NCI 9 (65) (47) (38) (30) 0 (171)
Cash flows from operating activities 914 3,299 (834) 3,652
Cash flows from investment activities (12) (8) (7) (9)
Cash flows from financing activities (768) (2,197) 0 0
Dividends paid to NCI (171) 0 0 0 0 0 (171)
Effect of exchange rate changes on cash and cash equivalents 2 (46) 33 (144)
Net increase (decrease) in cash and cash equivalents (35) 1,048 (808) 3,499
In 2013, management reclassified the negative balance of non-controlling interests of Panalpina Transportes Mundiais Navegâçao e Trânsitos S.A.R.L. (Angola) to parent shareholders’ equity.
Panalpina Annual Report 2013
Consolidated Financial Statements 121

2012 (IN THOUSAND CHF)
PANAL- PINA
SAKHALIN PROJECTS
PANAL- PINA
WORLD TRANS-
PORT (VIETNAM)
LTD.
PANAL- PINA
GULF LLC (DUBAI)
QATAR SHIPPING COMPANY
(PA QATAR) W.L.L.
OTHER IN-DIVIDUAL-LY IMMA-
TERIAL SUBSI-
DIARIES
INTRA-GROUP
ELIMINA-TIONS
TOTAL
NCI percentage 51 % 51 % 51 % 51 %
Non-current assets 121 255 34 76
Current assets 11,015 11,879 7,610 6,948
Non-current liabilities 0 0 (140) (122)
Current liabilities (2,187) (4,827) (3,506) (2,533)
Net assets 8,949 7,307 3,998 4,369
Carrying amount of NCI 4,564 3,727 2,039 2,228 (3,317) 0 9,241
Revenue 12,430 46,714 21,882 22,136
Profit 138 1,569 393 (133)
Other comprehensive income 21 (81) (116) (128)
Total comprehensive income 159 1,488 277 (261)
Profit allocated to NCI 70 800 200 (68) (731) - 271
OCI allocated to NCI 11 (41) (59) (65) 88 - (66)
Cash flows from operating activities (411) (700) (2,787) (5,219)
Cash flows from investment activities (37) (48) 4,636 2,648
Cash flows from financing activities (327) (1,844) 0 (797)
Dividends paid to NCI (46) 0 0 0 0 0 (46)
Effect of exchange rate changes on cash and cash equivalents 61 (40) (59) 69
Net increase (decrease) in cash and cash equivalents (760) (2,632) 1,790 (3,299)
Panalpina Annual Report 2013
Consolidated Financial Statements 122

24 BORROWINGSThis note provides information about the contractual terms of the Group’s interest-bearing loans and borrowings, which are measured at amortized cost. For more information about the Group’s exposure to foreign currency and liquidity risk, see note 17.
IN THOUSAND CHF 2013 2012
Current liabilities
Overdraft 2,263 1,395
Current portion of secured bank loans 571 0
Current portion of finance lease liabilities 219 216
Total current liabilities 3,053 1,611
Non-current liabilities
Non-current portion of finance lease liabilities 208 257
Total non-current liabilities 208 257
24.1 TERMS AND REPAYMENT SCHEDULE
2013 2012
IN THOUSAND CHF CURRENCY
NOMINAL INTEREST
RATE YEAR OF
MATURITY CARRYING
AMOUNT FAIR
VALUE CARRYING
AMOUNT FAIR
VALUE
Current liabilities
Secured bank loan DZD 8.25 % 2014 571 571 0 0
Total current liabilities 571 571 0 0
24.2 FINANCE LEASE LIABILITIES
2013 2012
IN THOUSAND CHF
FUTURE MINIMUM
LEASE PAYMENTS INTEREST
PRESENT VALUE OF MINIMUM
LEASE PAYMENTS
FUTURE MINIMUM
LEASE PAYMENTS INTEREST
PRESENT VALUE OF MINIMUM
LEASE PAYMENTS
Less than 1 year 223 4 219 222 6 216
Between 1 and 5 years 209 1 208 263 6 257
Total interest-bearing liabilities 432 5 427 485 12 473
The weighted average interest rate of bank borrowings and other financing liabilities is 6.38 % (2012: 5.80 %). The carrying amounts of short-term bank borrowings approximate their fair value. The carrying amounts of the Group’s borrowings are denominated in the following currencies:
IN THOUSAND CHF 2013 2012
EUR 2,262 1,393
DZD 571 0
PLN 386 380
Others 42 95
Total 3,261 1,868
Panalpina Annual Report 2013
Consolidated Financial Statements 123

25 LONG-TERM PROVISIONS
2013 IN THOUSAND CHFEMPLOYEE BENEFITS
CLAIMS AND
OTHER PROVI-SIONS
TOTAL PROVI-SIONS
Balance on January 1 34,097 38,984 73,081
Translation differences (439) (1,148) (1,587)
Addition 3,669 9,531 13,200
Reversal of unused amount (3,492) (1,244) (4,736)
Charged in income statement 177 8,287 8,464
Utilization (1,780) (561) (2,341)
Balance on December 31 32,055 45,562 77,617
2012 IN THOUSAND CHFEMPLOYEE BENEFITS
CLAIMS AND
OTHER PROVI-SIONS
TOTAL PROVI-SIONS
Balance on January 1 37,869 47,163 85,032
Translation differences (316) 1,226 910
Addition 6,636 13,154 19,790
Reversal of unused amount (8,637) (4,231) (12,868)
Charged in income statement (2,001) 8,923 6,922
Utilization (1,455) (1,215) (2,670)
Transfers 0 (17,113) (17,113)
Balance on December 31 34,097 38,984 73,081
Employee provisions mostly relate to certain employee benefit obligations, such as “anniversary” benefits, termination payments and long service benefits, mainly in Switzerland, Germany, Austria, Italy, France and the USA. The timings of these cash outflows can be reasonably estimated based on past performance. In addition, employee provisions include the liability of CHF 363 thousand (2012: CHF 363 thousand) for the cash-settled compensation plan. Significant provisions are discounted by using the corresponding discount rate applicable in the respective countries where the obligation occurs.
The balance for claims represents a provision for certain claims brought forward against the Group by customers and forwarding agents. The balance as of December 31, 2013 is expected to be utilized within the next two to five years. Long-term claims include additional provisions for probable potential future payments in connection with transport damages of CHF 9.6 million (2012: CHF 5.3 million). In addition, in 2012, CHF 7.7 million was recognized for personnel tax exposures. Furthermore, in 2010, a long-term provision in the amount of CHF 38.0 million was recorded to cover fines, legal penalties and compliance consultancy fees relating to the settlement of the US Foreign Corrupt Practices Act (FCPA). In 2012, the current portion of CHF 17.1 million was reclassified to provisions and other liabilities as it was paid during the period under review. Management determined the provision based on past performance and its expectation of the funds needed for the future settlement of claims not yet reported (see also note 4 – Critical accounting estimates and judgments).
The current portion of employee benefits provisions and claims and other provisions are disclosed in note 27.
Panalpina Annual Report 2013
Consolidated Financial Statements 124

26 DEFERRED INCOME TAXESDeferred taxes are related to the following statement of financial position items:
2013 IN THOUSAND CHFRECEIV-
ABLESFIXED
ASSETSPROVI-SIONS
OTHER STATE-
MENT OF FINANCIAL POSITION CAPTIONS
DEDUCT-IBLE
LOSS CARRY-
FORWARDS TOTAL
Net deferred income tax balance at January 1 2,067 (11,763) 24,057 4,182 33,330 51,873
Recognized translation differences (130) (145) (765) (247) (1,321) (2,608)
Recognized in income statement (1,127) 1,556 6,992 750 (2,163) 6,008
Recognized in OCI 0 0 (6,349) 0 0 (6,349)
Net deferred income tax balance at December 31 810 (10,352) 23,935 4,685 29,846 48,924
Thereof deferred income tax assets at December 31 65,457
Thereof deferred income tax liabilities at December 31 (16,533)
20121 (IN THOUSAND CHF)RECEIV-
ABLESFIXED
ASSETSPROVI-SIONS
OTHER STATE-
MENT OF FINANCIAL POSITION CAPTIONS
DEDUCT-IBLE
LOSS CARRY-
FORWARDS TOTAL
Net deferred income tax balance at January 1 2,132 (8,518) 13,347 4,752 31,893 43,606
Recognized translation differences 15 2 120 32 204 373
Recognized in income statement (80) (3,247) 5,728 (602) 1,233 3,032
Recognized in OCI 0 0 4,862 0 0 4,862
Net deferred income tax balance at December 31 2,067 (11,763) 24,057 4,182 33,330 51,873
Thereof deferred income tax assets at December 31 65,792
Thereof deferred income tax liabilities at December 31 (13,919)
1 Prior year’s figures have been restated due to the application of IAS 19 (as revised in 2011) retrospectively. Please refer to note 3.
Panalpina Annual Report 2013
Consolidated Financial Statements 125

The net movement in the deferred income tax account is as follows:
IN THOUSAND CHF 2013 20121
Balance January 1 51,873 43,606
Translation differences (2,608) (1,849)
Income statement charge 6,008 3,032
Tax charged to equity due to IAS 19 (6,349) 7,084
Balance December 31 48,924 51,873
1 Prior year’s figures have been restated due to the application of IAS 19 (as revised in 2011) retrospectively. Please refer to note 3.
YEAR OF EXPIRY OF UNRECOGNIZED TAX LOSS CARRY-FORWARDS (IN THOUSAND CHF) 2013 2012
2013 0 13,499
2014 12,733 7,523
2015 5,856 15,709
2016 15,487 3,785
2017 0 0
2018 0 0
Later 178,347 150,534
Total unrecognized tax loss carry-forwards 212,423 191,050
The total increase of CHF 21.4 million (2012: increase of CHF 91.0 million) derived mainly from unrecognized tax loss carry- forwards in Austria and Germany. Unrecognized deferred taxes on tax loss carry-forwards of CHF 2.5 million (2012: CHF 0.2 million) were utilized mainly in Belgium and Turkey. Utilization of recognized tax loss carry-forwards amounts to CHF 15.8 million (mainly in the US, United Kingdom, Hungary and Chile).
Panalpina Annual Report 2013
Consolidated Financial Statements 126

27 PROVISIONS AND OTHER LIABILITIES
2013 (IN THOUSAND CHF)
EMPLOYEE BENEFITS
AND OTHERS
OUT-STANDING VACATION
ENTITLE-MENT CLAIMS
RESTRUC- TURING TOTAL
Balance on January 1 51,585 22,238 33,225 17,431 124,479
Translation differences (1,298) (996) 678 (396) (2,012)
Addition 65,107 4,694 41,425 4,903 116,129
Reversal of unused amounts (5,158) (1,086) (1,501) (740) (8,485)
Charged in income statement 59,949 3,608 39,924 4,163 107,644
Utilization (35,779) (1,815) (24,649) (12,502) (74,745)
Balance on December 31 74,457 23,035 49,178 8,696 155,366
2012 (IN THOUSAND CHF)
EMPLOYEE BENEFITS
AND OTHERS
OUT-STANDING VACATION
ENTITLE-MENT CLAIMS
RESTRUC- TURING
TOTAL
Balance on January 1 73,107 22,420 29,244 649 125,420
Translation differences (695) (404) (1,094) (7) (2,200)
Addition 65,864 2,260 70,692 23,352 162,168
Reversal of unused amounts (40,269) (922) (7,722) (1,836) (50,749)
Charged in income statement 25,595 1,338 62,970 21,516 111,419
Utilization (46,422) (1,116) (75,008) (4,727) (127,273)
Transfers 0 0 17,113 0 17,113
Balance on December 31 51,585 22,238 33,225 17,431 124,479
Apart from outstanding vacation entitlement and the current portions of provisions as disclosed in note 25, provisions and other liabilities include personnel profit participation and related social security costs and payroll taxes, as well as compliance consultancy fees. During the period under review, an additional provision of CHF 59.1 million for personnel profit participation was recognized, thereof CHF 4.8 million was reversed again in December. In 2013, CHF 34.1 million of personnel profit participation (2012: CHF 41.7 million) was paid out. As at December 31, 2013 a provision of CHF 51.3 million (2012: CHF 32.0 million) was held for personnel profit participation including related social security costs and payroll taxes.
As disclosed in notes 3 and 25, claim provisions include the current portion of certain claims brought forward against the Group by customers and forwarding agents. Additional provisions for claims made during the period under review mainly include an amount of USD 35 million recognized in the fourth quarter 2013 related to a preliminary agreement entered into to settle a U.S. class action lawsuit alleging anti-competitive industry practices regarding certain freight surcharges (2012: CHF 59.2 million related to additional provisions to settle the penalties from WEKO and EU anti-trust claims). The provision held on December 31, 2012 also included approximately CHF 17.1 million to cover the fines, legal penalties and compliance consultancy fees relating to the settlement of both the US Foreign Corrupt Practices Act (FCPA) and the US anti-trust investigations. Utilization of the claim provision during the period under review mainly included the payments of the WEKO claim (CHF 3.2 million) and the last portion of the FCPA settlement (CHF 17.1 million) made during 2013 (2012: mainly payments of CHF 56.0 million for the EU anti-trust claim and CHF 17.1 million for the FCPA settlement). The balance as of December 31 is expected to be utilized within one year.
Panalpina Annual Report 2013
Consolidated Financial Statements 127

The restructuring provision newly added in 2013 relates to headcount reductions in certain functions mainly in Germany, Norway and Angola. The additional provision recognized in 2012 concerns headcount reductions in all functions mainly in marketing and sales and in operations in various countries with the largest amount incurred in Europe and North America, as well as on a corporate level. The timings of these cash outflows are expected to occur within one year.
28 RELATED PARTIES28.1 KEY MANAGEMENT PERSONNEL COMPENSATION
Key management personnel consists of the Board of Directors and the Executive Board. The members of the Board of Directors receive a fixed annual compensation and participate in certain equity compensation plans (see note 8). In 2013, there were 7 (2012: 7) members of the Board of Directors.
The compensation of the Executive Board consists of a fixed portion and a variable portion, which depends on the course of busi-ness and the individual manager’s performance. In addition, members of the Executive Board receive indirect benefits and are able to participate in certain equity compensation plans (see note 8). In 2013, there were 5 (2012: 5) members of the Executive Board.
The following table shows the compensation of key management personnel:
2013 IN THOUSAND CHFANNUAL SALARY1 BONUS
TERMI- NATION
BENEFITSOTHER
BENEFITS2
SHARE- BASED
PAYMENT3
SOCIAL SECURITY
CONTRI- BUTION
TOTAL COMPEN-
SATION 2013
Board of Directors
Rudolf W. Hug, Chairman 456 50 52 558
Beat Walti, Vice Chairman 154 50 22 226
Ilias Läber, Member 79 50 11 140
Chris E. Muntwyler, Member 156 50 22 228
Roger Schmid, Member* 168 50 218
Hans-Peter Strodel, Member 156 50 17 223
Knud Elmholdt Stubkjær, Member 155 50 205
Board of Directors leaving
Lars Förberg, Member 77 11 88
Total remuneration of Board of Directors 1,401 0 0 0 350 135 1,886
Executive Board
Peter Ulber, Chief Executive Officer 595 594 17 71 1,277
Members of the Executive Board 2,208 684 252 965 469 4,578
Executive Management (Monika Ribar, former CEO) leaving4 1,475 44 360 139 2,018
Total remuneration of Executive Board 4,278 1,278 0 313 1,325 679 7,873
Total remuneration of key management personnel 5,679 1,278 0 313 1,675 814 9,759
1 Salaries incl. fixed remuneration, salary and discount on shares granted2 Other benefits incl. expense allowance and fringe benefits3 This disclosure item has been amended to reflect current year treatment to disclose benefits to the Board of Directors. Share-based payments are disclosed
on an accrual basis. This means that for the Board of Directors, the amount includes the shares to be granted in 2014 for the business year 2013. For the Executive Board, the disclosed amount includes the shares granted under the Mid-Term Incentive Plan (MTIP) and related to the 2013 annual bonus (grant in 2014) as well as the matching shares that will be transferred in 2014 related to the 2011 annual bonus / MTIP.
4 Including salary during the notice period* Remuneration and shares have been transferred to Ernst Göhner Stiftung (employer of respective board member)
Panalpina Annual Report 2013
Consolidated Financial Statements 128
04_PAN_GB_2013_Consolidated_Financial_en.indd 128 28.03.2014 16:14:20

2012 IN THOUSAND CHFANNUAL SALARY1 BONUS
TERMI- NATION
BENEFITSOTHER
BENEFITS2
SHARE- BASED
PAYMENT3
SOCIAL SECURITY
CONTRI- BUTION
TOTAL COMPEN-
SATION 2012
Board of Directors
Rudolf W. Hug, Chairman 453 60 513
Beat Walti, Vice Chairman 153 28 181
Lars Förberg, Member 154 25 179
Chris E. Muntwyler, Member 153 28 181
Roger Schmid, Member* 167 0 167
Hans-Peter Strodel, Member 155 24 179
Knud Elmholdt Stubkjær, Member 153 0 153
Total remuneration of Board of Directors 1,388 0 0 0 0 165 1,553
Executive Board
Monika Ribar, Chief Executive Officer 950 0 44 373 205 1,572
Members of the Executive Board 1,620 216 257 616 438 3,147
Executive Management leaving 325 0 21 204 95 645
Total remuneration of Executive Board 2,895 216 0 322 1,193 738 5,364
Total remuneration of key management personnel 4,283 216 0 322 1,193 903 6,917
1 Salaries incl. fixed remuneration, salary and discount on shares granted2 Other benefits incl. expense allowance and fringe benefits3 This disclosure item has been amended to reflect current year treatment to disclose benefits to the Board of Directors* Remuneration has been transferred to Ernst Göhner Stiftung (employer of respective board member)
Panalpina Welttransport GmbH in Germany leases two buildings from an affiliate of Ernst Göhner Stiftung one in Stuttgart and one in Nuremberg. The lease paid in the fiscal year 2013 amounts to CHF 4.9 million – including an extension of the facility in Stuttgart – (2012: CHF 3.6 million). There were no contributions or donations to close members of the families of the key management.
Panalpina Annual Report 2013
Consolidated Financial Statements 129
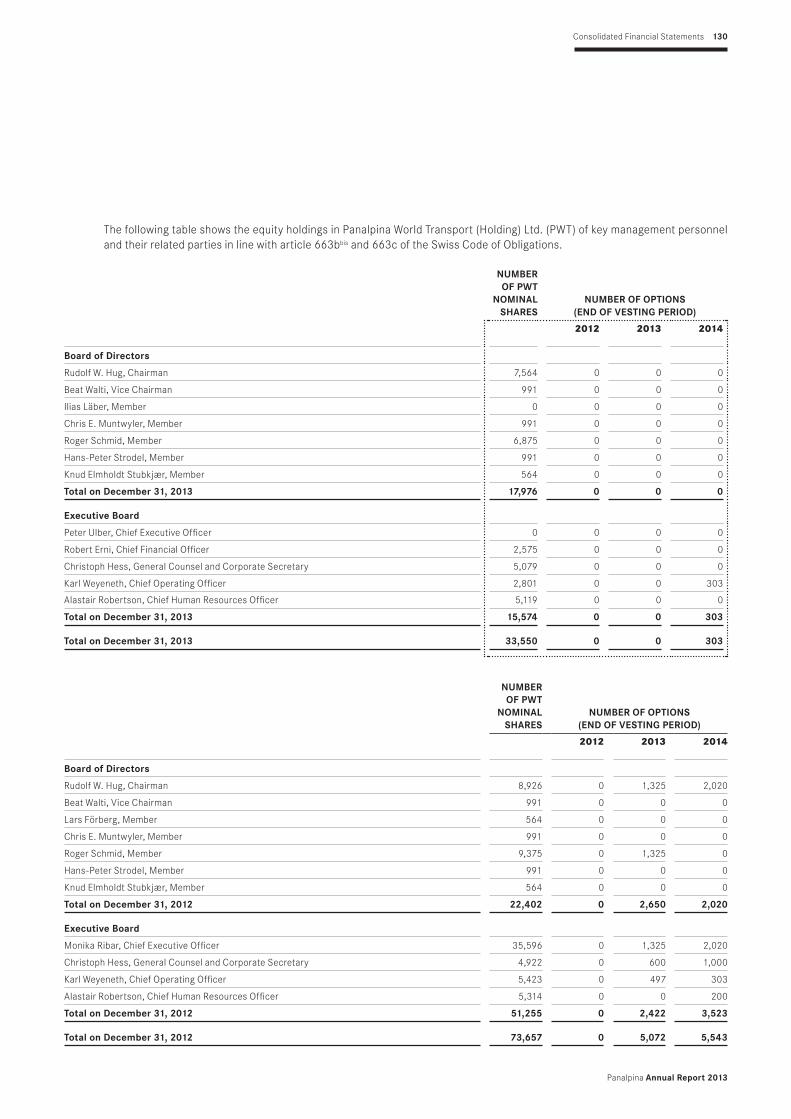
The following table shows the equity holdings in Panalpina World Transport (Holding) Ltd. (PWT) of key management personnel and their related parties in line with article 663bbis and 663c of the Swiss Code of Obligations.
NUMBER OF PWT
NOMINAL SHARES
NUMBER OF OPTIONS (END OF VESTING PERIOD)
2012 2013 2014
Board of Directors
Rudolf W. Hug, Chairman 7,564 0 0 0
Beat Walti, Vice Chairman 991 0 0 0
Ilias Läber, Member 0 0 0 0
Chris E. Muntwyler, Member 991 0 0 0
Roger Schmid, Member 6,875 0 0 0
Hans-Peter Strodel, Member 991 0 0 0
Knud Elmholdt Stubkjær, Member 564 0 0 0
Total on December 31, 2013 17,976 0 0 0
Executive Board
Peter Ulber, Chief Executive Officer 0 0 0 0
Robert Erni, Chief Financial Officer 2,575 0 0 0
Christoph Hess, General Counsel and Corporate Secretary 5,079 0 0 0
Karl Weyeneth, Chief Operating Officer 2,801 0 0 303
Alastair Robertson, Chief Human Resources Officer 5,119 0 0 0
Total on December 31, 2013 15,574 0 0 303
Total on December 31, 2013 33,550 0 0 303
NUMBER OF PWT
NOMINAL SHARES
NUMBER OF OPTIONS (END OF VESTING PERIOD)
2012 2013 2014
Board of Directors
Rudolf W. Hug, Chairman 8,926 0 1,325 2,020
Beat Walti, Vice Chairman 991 0 0 0
Lars Förberg, Member 564 0 0 0
Chris E. Muntwyler, Member 991 0 0 0
Roger Schmid, Member 9,375 0 1,325 0
Hans-Peter Strodel, Member 991 0 0 0
Knud Elmholdt Stubkjær, Member 564 0 0 0
Total on December 31, 2012 22,402 0 2,650 2,020
Executive Board
Monika Ribar, Chief Executive Officer 35,596 0 1,325 2,020
Christoph Hess, General Counsel and Corporate Secretary 4,922 0 600 1,000
Karl Weyeneth, Chief Operating Officer 5,423 0 497 303
Alastair Robertson, Chief Human Resources Officer 5,314 0 0 200
Total on December 31, 2012 51,255 0 2,422 3,523
Total on December 31, 2012 73,657 0 5,072 5,543
Panalpina Annual Report 2013
Consolidated Financial Statements 130

Shareholders, pension funds, associated companies and all subsidiaries are defined as parties related to the Group. Apart from the trans actions with related parties mentioned above, we refer to notes 7 and 8.
29 BUSINESS COMBINATIONS / DISINVESTMENTSIn 2013 and 2012 there were no business combinations and no significant subsidiaries were sold.
30 ADDITIONAL INFORMATION
IN THOUSAND CHF 2013 2012
Contractual commitments on non-cancelable operating lease contracts
Less than one year 191,339 185,965
Between one and five years 344,270 382,343
More than five years 71,454 102,558
Total residual commitments 607,063 670,866
30.1 PLEDGED ASSETSAs of the statement of financial position date 2013 and 2012, the Group does not have any pledged assets.
30.2 PENDING LEGAL CLAIMS
IntroductionIn addition to the matters discussed in note 4 – Provisions, from time to time the Group is involved in legal proceedings in the ordinary course of its business. Other than as noted below, the Group is not a party to any legal, administrative or arbitration proceedings that could significantly harm the Group’s business, financial condition and results of operations taken as a whole, and it does not know of any such proceedings that may currently be contemplated by governmental or third parties.
Claim against Pantainer Ltd.The Panalpina subsidiary Pantainer and other group companies are named third-party defendants in a litigation launched in Japan in 2005. Insurers are seeking compensation for general average contributions and cargo loss/damage resulting from a fire on a vessel allegedly caused by a customer’s cargo. The customer lost the case in the second instance and appealed to the Japan Supreme Court. The value in dispute amounts to USD 9 million plus interest and costs.
Business practices investigationIn November 2010, Panalpina entered into a Deferred Prosecution Agreement (DPA) with the US Department of Justice (DOJ) to resolve claims against it arising from an investigation by the DOJ and the US Securities and Exchange Commission (SEC) for violations of the US Foreign Corrupt Practices Act (FCPA). Under the DPA, the DOJ has agreed to defer any criminal prosecution for three years.
In December 2013 the competent US judge dismissed all criminal charges against Panalpina regarding violations of the U.S. Foreign Corrupt Practices Act (FCPA).
Freight forwarding anti-trust investigationIn October 2007, Panalpina’s headquarters in Switzerland and the US were visited by the respective competition authorities. Further, a request for information was served by the New Zealand Commerce Division and a document retention notice by the Competition Bureau Canada.
Panalpina Annual Report 2013
Consolidated Financial Statements 131

In April 2008, the Australian Competition and Consumer Commission served a notice on the Australian subsidiary requesting information and documents. In June 2008, Panalpina’s UK subsidiary was the recipient of a request for information issued by the European Commission requesting certain information and records relating to alleged anti-trust violations in the freight forwarding industry.
In August 2010, Brazilian authorities announced preliminary investigations against the freight forwarding industry.
These activities were part of an investigation of several competition authorities against various major freight forwarding companies for alleged anti-competitive behavior.
In 2009, the Competition Bureau Canada closed its investigation into alleged anti-competitive activity due to a lack of evidence substantiating an undue lessening of competition. In January 2010, the Australian Competition and Consumer Commission also discontinued its investigation.
In October 2010, Panalpina announced a settlement with the DOJ over violations of the Sherman Antitrust Act related to the sale of international air freight forwarding services. Under the terms of the settlement, which has been approved by the competent court, Panalpina has agreed to pay a fine of USD 12 million.
In 2011 Panalpina completed settlement negotiations with the New Zealand Commerce Commission and the agreed penalty has been approved by the competent court.
In February 2010, Panalpina was served with a Statement of Objections by the European Commission, alleging anti-competitive behavior in the freight forwarding industry. In March 2012, the EU Commission has fined various major freight forwarding companies for anti-trust violations before 2008 related to isolated air freight surcharges on certain European trade lanes. Panalpina was ordered to pay a penalty of EUR 46.5 million. Panalpina has appealed the European Commission’s decision to the European General Court.
Further Panalpina entered into a settlement agreement with competition authorities in Switzerland and agreed to pay a penalty of CHF 3.1 million in 2012.
Regarding the Brazilian proceedings, in 2012 Panalpina’s holding company was served with a preliminary investigation notice by the Brazilian competition authority (SDE) alleging anti-trust violations.
In November 2012 Panalpina received a notice from the Competition Commission Singapore requiring the provision of specified information related to the airfreight surcharges that had been subject of the previous and meanwhile completed investigations by other competition authorities. Panalpina provided this information in December 2012 and responded to a further information request in November 2013.
The pending anti-trust proceedings in Brazil and Singapore may result in penalties being imposed on Panalpina. Management, however, holds the view based on legal opinions that the outcome of these proceedings will have no material effect on the financial situation of the Group beyond the existing provision for pending claims.
Furthermore, in 2008 a civil class action lawsuit was filed in the USA against Panalpina and a number of its major competitors as a direct consequence of these investigations, alleging a conspiracy in the pricing of freight forwarding services. In the reporting year Panalpina entered into a preliminary agreement to settle this class action lawsuit and agreed to pay an amount of USD 35 million, which includes previously received proceeds of USD 5.8 million, in an unrelated class action against various airlines. The settlement is subject to U.S. court approval.
30.3 SUBSEQUENT EVENTSSince the statement of financial position date, no events have become known for which a disclosure is required.
Panalpina Annual Report 2013
Consolidated Financial Statements 132

31 PRINCIPAL GROUP COMPANIES AND PARTICIPATIONS
COMPANY REGISTERED CURRENCY
NOMINAL CAPITAL IN 1,000
EQUITY INTEREST
IN %INVEST-
MENT
METHOD OF CON- SOLIDA-
TION
Europe
Panalpina World Transport (Holding) Ltd. Basel CHF 2,375 K
Panalpina Management Ltd. Basel CHF 2,500 100 1 K
Panalpina Ltd. Basel CHF 600 100 1 K
Pantainer Ltd. Basel CHF 100 100 1 K
Panalpina Insurance Broker Ltd. Basel CHF 100 100 1 K
Panalpina International Ltd. Basel CHF 1,000 100 1 K
Hausmann Transport Ltd. Basel CHF 100 100 1 K
Panalpina Air & Ocean Ltd. Basel CHF 2,700 100 1 K
Panalpina Global Employment Services Ltd. Basel CHF 100 100 1 K
Panalpina Welttransport (Deutschland) GmbH Mörfelden EUR 10,226 100 1 K
Panalpina Welttransport GmbH Vienna EUR 36 100 1 K
Panalpina Welttransport GmbH Höchst EUR 36 100 1 K
Panalpina France Transports Internationaux S.A.S. Paris-Roissy EUR 2,000 100 1 K
Panalpina Trasporti Mondiali S.p.A. Milan EUR 2,000 100 1 K
Panalpina Transportes Mundiales S.A. Madrid EUR 451 100 1 K
Panalpina Transportes Mundiais Lda Lisbon EUR 50 100 1 K
Panalpina World Transport Ltd. London GBP 12,350 100 1 K
Panalpina World Transport (Ireland) Ltd. Dublin EUR 25 100 1 K
Panalpina World Transport N.V. Antwerp EUR 19,050 100 1 K
Panalpina Luxembourg S.A. Luxembourg EUR 31 100 1 K
Panalpina World Transport B.V. Amsterdam EUR 91 100 1 K
Panalpina (Beverwijk) B.V. Beverwijk EUR 18 100 1 K
Panalpina Czech Sro. Prague CZK 1,000 100 1 K
Panalpina Business Services (Prague), s.r.o. Prague CZK 1,000 100 1 K
Panalpina Croatia d.o.o. Rijeka HRK 400 100 1 K
Panalpina Slovakia S.R.O. Bratislava EUR 23 100 1 K
Panalpina Magyarorszag Kft. Budapest HUF 528,000 100 1 K
Panalpina Romania S.R.L. Oradea RON 6,072 100 1 K
Panalpina Polska Sp. z o.o. Wroclaw PLN 1,500 100 1 K
Panalpina AB Gothenburg SEK 1,000 100 1 K
Panalpina A / S Oslo NOK 75,060 100 1 K
Panalpina World Transport Nakliyat Ltd. Srk. Istanbul TRY 10,508 100 1 K
Panalpina World Transport ZAO Moscow RUB 2,100 100 1 K
Panalpina CIS Helsinki OY Vantaa EUR 8 100 1 K
Panalpina Logistics LLC Moscow RUB 240 100 1 K
Panalpina World Transport Ltd. Kiev UAH 376 100 1 K
Panalpina Annual Report 2013
Consolidated Financial Statements 133

North, Central and South America
Panalpina Inc. Jersey USD 83,000 100 1 K
Panalpina FMS, Inc. (Washington) Jersey City USD 1 100 1 K
International Claims Handling Services Inc. Miami USD 1 100 1 K
Panalpina Inc. Toronto CAD 100 100 1 K
Panalpina Transportes Mundiales, S.A. de C.V. Mexico City MXN 35,834 100 1 K
Panalpina S.A. Panama City USD 1,250 100 1 K
Almacenadora Mercantil S.A. Panama City USD 25 100 1 K
Panalpina S.A. de C.V. San Salvador SVC 100 100 1 K
Panalpina Transportes Mundiales S.A. San José CRC 2,500 100 1 K
Panalpina Servicios Aduanales S.A. San José CRC 1,590 100 1 K
Panalpina Uruguay Transportes Mundiales S.A. Montevideo UYU 4,093 100 1 K
Panalpina S.A. Santa Fé de Bogotá COP 7,450,838 100 1 K
DAPSA Depositos Aduaneros Panalpina S.A. Santa Fé de Bogotá COP 2,815,208 100 1 K
Panalpina C.A. Caracas VEF 7,299,297 100 1 K
Panalpina Ecuador S.A. Quito USD 1 100 1 K
Panalpina Aduanas S.A. Lima PEN 732 100 1 K
Panalpina Transportes Mundiales S.A. Lima PEN 4,008 100 1 K
Panalpina Ltda. São Paulo BRL 148,422 100 1 K
Panalpina Chile Transportes Mundiales Ltda. Santiago CLP 1,593,521 100 1 K
Panalpina Transportes Mundiales S.A. Buenos Aires ARS 50,580 100 1 K
Panalpina Logistics S.R.L. Buenos Aires ARS 16,662 100 1 K
Panalpina Transportes Mundiales S.R.L. Santo Domingo DOP 1,000 100 1 K
Mondi Reinsurance Ltd. Hamilton CHF 1,000 100 1 K
Panalpina Annual Report 2013
Consolidated Financial Statements 134
COMPANY REGISTERED CURRENCY
NOMINAL CAPITAL IN 1,000
EQUITY INTEREST
IN %INVEST-
MENT
METHOD OF CON- SOLIDA-
TION

Asia and Australia
Panalpina World Transport (Singapore) Pte. Ltd. Singapore SGD 2,500 100 1 K
PT Panalpina Nusajaya Transport Jakarta IDR 1,500,000 95 1 K
Panalpina China Ltd. Hong Kong HKD 1,000 100 1 K
Panalpina World Transport (PRC) Ltd. Shanghai CNY 13,500 100 1 K
Panalpina Logistics (Shanghai) Ltd. Shanghai CNY 5,000 100 1 K
Panalpina Logistics (Wuhan) Ltd. Wuhan CNY 10,000 100 1 K
Panalpina Logistics (Chengdu) Limited Chengdu CNY 5,000 100 1 K
Panalpina Asia-Pacific Services Ltd. Hong Kong HKD 500 100 1 K
Panalpina World Transport Ltd. Hong Kong HKD 500 100 1 K
Pantainer (H. K.) Limited Hong Kong HKD 100 100 1 K
International Claims Handling Services Ltd. Hong Kong HKD 10 100 1 K
Panalpina Taiwan Ltd. Taipei TWD 15,500 100 1 K
Panalpina IAF (Korea) Ltd. Seoul KRW 500,000 100 1 K
Panalpina World Transport (Thailand) Ltd. Bangkok THB 27,000 100 1 K
Panalpina Asia-Pacific Services (Thailand) Ltd. Bangkok THB 10,000 100 1 K
Panalpina Macao Ltd. Macao HKD 1,000 100 1 K
Panalpina World Transport (Vietnam) Company Ltd. Ho Chi Minh City VND 6,360,145 49 2 K
Panalpina Transport (Malaysia) Sdn. Bhd. Kuala Lumpur MYR 4,215 70 1 K
Panalpina World Transport (Japan) Ltd. Tokyo JPY 50,000 100 1 K
Panalpina World Transport (India) Pvt. Ltd. Delhi INR 100,050 100 1 K
Panindia Cargo Private Ltd. Delhi INR 100 100 1 K
Panalpina World Transport (Philippines) Inc. Manila PHP 10,000 99.998 1 K
Panalpina World Transport (Pty) Ltd. Sydney AUD 15,000 100 1 K
Panalpina World Transport LLP Almaty KZT 1,252,395 100 1 K
Panalpina Sakhalin Projects Yuzhno-Sakhalinsk RUB 30 49 2 K
Panalpina Annual Report 2013
Consolidated Financial Statements 135
COMPANY REGISTERED CURRENCY
NOMINAL CAPITAL IN 1,000
EQUITY INTEREST
IN %INVEST-
MENT
METHOD OF CON- SOLIDA-
TION

Middle East and Africa
Panalpina Gulf LLC Dubai AED 1,000 49 2 K
Panalpina Jebel Ali Ltd. Jebel Ali AED 100 100 1 K
Panalpina World Transport (Dubai) DWC-LLC Dubai AED 300 100 1 K
Panalpina World Transport (Kuwait) WLL Kuwait KWD 20 49 2 K
Panalpina (Bahrain) WLL Manama BHD 20 100 1 K
Panalpina Central Asia EC Manama USD 17,020 100 1 K
Alpha for General Transportation LLC. Baghdad IQD 11,000 100 1 K
Panalpina Georgia LLC Tbilisi GEL 11 100 1 K
Panalpina Azerbaijan LLC Baku AZN 1 100 1 K
Panalpina Turkmenistan LLC Turkmenbashi TMT 62 100 1 K
Qatar Shipping Company (Panalpina Qatar) WLL Doha QAR 200 49 2 K
Panalpina World Transport (Saudi Arabia) Ltd. Al Khobar SAR 500 100 1 K
Panalpina Transports Mondiaux Cameroun S.A.R.L. Douala XAF 150,000 90 1 K
Panalpina Transports Mondiaux Algérie EURL Hassi Messaoud DZD 128,039 100 1 K
Panalpina Transports Mondiaux Congo S.A.R.L. Pointe-Noire XAF 70,000 80 1 K
Panalpina Transports Mondiaux Gabon S.A. Port-Gentil XAF 50,000 90 1 K
Panalpina (Ghana) Ltd. Accra GHS 10 100 1 K
Panalpina Transportes Mundiais Navegãçao e Trânsitos S.A.R.L. Luanda AOA 18 49 2 K
K = fully consolidated1 = capital participation 51 – 100 %2 = controlling influence over management
Panalpina Annual Report 2013
Consolidated Financial Statements 136
COMPANY REGISTERED CURRENCY
NOMINAL CAPITAL IN 1,000
EQUITY INTEREST
IN %INVEST-
MENT
METHOD OF CON- SOLIDA-
TION

REPORT OF THE STATUTORY AUDITOR TO THE GENERAL MEETING OF SHAREHOLDERS OF Panalpina World Transport (Holding) Ltd., Basel
Report of the Statutory Auditor on the Consolidated Financial StatementsAs statutory auditor, we have audited the accompanying consolidated financial statements of Panalpina World Transport (Holding) Ltd., which comprise the consolidated income statement, consolidated statement of comprehensive income, consolidated statement of financial position, consolidated statement of changes in equity, consolidated statement of cash flows and notes on pages 63 to 136 for the year ended December 31, 2013.
Board of Directors’ ResponsibilityThe board of directors is responsible for the preparation of the consolidated financial statements in accordance with International Financial Reporting Standards (IFRS) and the requirements of Swiss law. This responsibility includes designing, implementing and maintaining an internal control system relevant to the preparation of consolidated financial statements that are free from material misstatement, whether due to fraud or error. The board of directors is further responsible for selecting and applying appropriate accounting policies and making accounting estimates that are reasonable in the circumstances.
Auditor’s ResponsibilityOur responsibility is to express an opinion on these consolidated financial statements based on our audit. We conducted our audit in accordance with Swiss law and Swiss Auditing Standards as well as International Standards on Auditing. Those standards require that we plan and perform the audit to obtain reasonable assurance whether the consolidated financial statements are free from material misstatement.
An audit involves performing procedures to obtain audit evidence about the amounts and disclosures in the consolidated financial statements. The procedures selected depend on the auditor’s judgment, including the assessment of the risks of material misstatement of the consolidated financial statements, whether due to fraud or error. In making those risk assessments, the auditor considers the internal control system relevant to the entity’s preparation and fair presentation of the consolidated financial statements in order to design audit procedures that are appropriate in the circumstances, but not for the purpose of expressing an opinion on the effectiveness of the entity’s internal control system. An audit also includes evaluating the appropriateness of the accounting policies used and the reasonableness of accounting estimates made, as well as evaluating the overall presentation of the consolidated financial statements. We believe that the audit evidence we have obtained is sufficient and appropriate to provide a basis for our audit opinion.
OpinionIn our opinion, the consolidated financial statements for the year ended December 31, 2013 give a true and fair view of the financial position, the results of operations and the cash flows in accordance with International Financial Reporting Standards (IFRS) and comply with Swiss law.
Report on Other Legal RequirementsWe confirm that we meet the legal requirements on licensing according to the Auditor Oversight Act (AOA) and independence (article 728 CO and article 11 AOA) and that there are no circumstances incompatible with our independence.
In accordance with article 728a paragraph 1 item 3 CO and Swiss Auditing Standard 890, we confirm that an internal control system exists, which has been designed for the preparation of consolidated financial statements according to the instructions of the board of directors.
We recommend that the consolidated financial statements submitted to you be approved.
KPMG AG
Regula Wallimann Martin RohrbachLicensed Audit Expert Licensed Audit ExpertAuditor in Charge
Zurich, February 28, 2014
Panalpina Annual Report 2013
Consolidated Financial Statements 137

IN MILLION CHF 2013 20121 20111 2010 2009
Forwarding services 8,175 8,066 7,926 8,676 7,340
Change in % 1.35 1.78 (8.64) 18.19 (30.73)
Net forwarding revenue 6,758 6,617 6,500 7,164 5,958
Change in % 2.13 1.81 (9.27) 20.25 (32.89)
Gross profit 1,561 1,465 1,477 1,480 1,377
Change in % 6.55 (0.81) (0.21) 7.49 (20.94)
in % of net revenue 23.10 22.14 22.72 20.66 23.11
Consolidated (loss) / profit 11.7 (71.8) 127.4 (26.0) 10.4
Change in % (116.30) (156.37) (590.06) (348.94) (90.82)
in % of gross profit 0.75 (4.90) 8.63 (1.76) 0.76
EBITDA 119.8 34.2 212.1 62.4 79.7
Change in % 250.29 (83.87) 240.09 (21.78) (66.88)
in % of gross profit 7.67 2.33 14.36 4.21 5.79
EBITA 85.5 3.1 183.6 23.5 42.5
Change in % 2,658.06 (98.33) 682.11 (44.77) (79.23)
in % of gross profit 5.48 0.21 12.43 1.59 3.09
EBIT 48.0 (39.6) 174.2 15.4 29.9
Change in % (221.21) (122.74) 1,033.97 (48.64) (84.50)
in % of gross profit 3.07 (2.70) 11.79 1.04 2.17
Cash generated from operations 73.8 (39.6) 229.1 75.3 311.8
Change in % (286.36) (117.27) 204.35 (75.86) 13.58
in % of gross profit 4.73 (2.69) 15.51 5.09 22.64
Net cash from operating activities 42.5 (71.5) 193.5 37.0 259.8
Change in % (159.44) (136.92) 422.45 (85.74) 34.45
in % of gross profit 2.72 (4.88) 13.10 2.50 18.87
Free cash flow (5.5) (81.9) 41.9 6.2 225.9
Change in % (93.28) (295.43) 570.94 (97.24) 32.73
in % of gross profit (0.35) (5.59) 2.84 0.42 16.41
Net working capital 174.6 134.0 85.2 143.0 132.2
Change in % 30.29 57.28 (40.42) 8.20 (62.42)
1 Prior year’s figures have been restated due to the application of IAS 19 (as revised in 2011) retrospectively. Please refer to note 3.
Panalpina Annual Report 2013
Consolidated Financial Statements 138
KEY FIGURES IN CHF Five-year review

IN MILLION CHF 2013 20121 20111 2010 2009
Capital expenditure on fixed assets 49.8 84.2 51.2 40.0 41.8
Change in % (40.86) 64.45 27.87 (4.31) (28.34)
in % of gross profit 3.19 5.75 3.47 2.71 3.04
Net capital expenditure on fixed assets 48.5 83.9 108.7 28.5 29.4
Change in % (42.19) (22.79) 281.81 (3.24) 14.81
in % of gross profit 3.11 5.73 7.36 1.92 2.14
Depreciation and amortization (incl. impairment losses) 71.9 73.9 37.9 47.0 49.8
Change in % (2.71) 94.99 (19.37) (5.65) 4.33
in % of gross profit 4.61 5.04 2.57 3.18 3.62
Personnel expenses 960.0 957.2 892.4 890.9 879.1
Personnel
Number of employees at year-end (world) 16,010 15,224 15,051 14,136 13,570
Number of employees at year-end (Switzerland) 754 759 775 749 737
Yearly average (world) 15,925 15,224 15,286 14,223 13,860
Productivity ratios (CHF)
Net sales per average employee 424,364 434,643 425,226 503,703 429,864
Gross profit per average employee 98,022 96,229 96,624 104,062 99,343
Personnel expenses per average employee 60,283 62,873 58,380 62,641 63,430
Personnel cost in % of gross profit 61.50 65.34 60.42 60.20 63.85
Leverage (liabilities / equity) 1.78 1.65 1.31 1.46 1.24
Net interest-bearing liabilities (332) (390) (562) (546) (535)
Gross gearing (interest-bearing liabilities / equity) 0.01 0.00 0.01 0.01 0.02
Net gearing (net interest-bearing liabilities / equity) (0.48) (0.53) (0.61) (0.68) (0.63)
ROCE (EBIT less tax / capital employed) in % 6.71 (19.42) 42.32 (5.40) 6.14
Current cash debt coverage ratio (net operating cash flow / average current liability) 0.04 (0.07) 0.19 0.04 0.27
Cash debt coverage ratio (net operating cash flow / average total liability) 0.03 (0.06) 0.16 0.03 0.24
Return on equity in % 1.6 (8.7) 14.8 (3.1) 1.2
Change in % (118.39) (158.78) (577.40) (360.81) (89.97)
1 Prior year’s figures have been restated due to the application of IAS 19 (as revised in 2011) retrospectively. Please refer to note 3.
Panalpina Annual Report 2013
Consolidated Financial Statements 139

IN MILLION CHF 2013 20121 20111 2010 2009
ASSETS 1,949 1,957 2,135 1,989 1,925
Change in % (0.41) (8.34) 7.32 3.35 (2.35)
Non-current assets 351 362 390 303 326
Change in % (3.04) (7.13) 28.73 (7.04) 11.66
Property, plant and equipment 119 130 113 114 141
Change in % (8.46) 15.03 (0.73) (19.27) (4.35)
Financial assets 114 98 135 111 113
Change in % 16.33 (27.71) 21.59 (1.75) 60.07
Intangible assets 118 134 142 78 72
Change in % (11.94) (5.89) 81.84 8.65 (2.52)
Current assets 1,598 1,595 1,745 1,686 1,599
Change in % 0.19 (8.60) 3.47 5.47 (4.78)
Liquid funds 337 393 574 555 548
Change in % (14.25) (31.58) 3.33 1.30 36.69
Receivables and other current assets 1,261 1,202 1,171 1,131 1,050
Change in % 4.91 2.65 3.54 7.66 (17.80)
LIABILITIES AND EQUITY 1,949 1,957 2,135 1,989 1,925
Change in % (0.42) (8.30) 7.31 3.34 (2.35)
Equity 697 734 919 804 857
Change in % (5.04) (20.10) 14.22 (6.15) (0.83)
Share capital 2 2 50 50 50
Change in % 0.00 (96.00) 0.00 0.00 0.00
Treasury shares (3) (10) (197) (196) (193)
Change in % (70.00) (94.93) 0.65 1.78 (2.62)
Translation reserves (188) (165) (162) (151) (136)
Change in % 13.94 1.85 7.30 10.70 (6.51)
Retained earnings and other reserves 886 907 1,228 1,101 1,136
Change in % (2.32) (24.77) 11.50 (3.02) (1.89)
Non-controlling interests 12 9 9 8 7
Liabilities 1,240 1,214 1,207 1,177 1,061
Change in % 2.14 0.60 2.54 10.94 (3.50)
Payables, accruals and deferred income 1,002 1,013 985 914 878
Change in % (1.09) 2.84 7.80 4.07 (3.69)
Borrowings 5 3 12 10 13
Change in % 66.67 (75.00) 23.23 (25.09) (36.49)
Provisions 233 198 210 254 170
Change in % 17.68 (6.19) (17.20) 49.20 1.54
1 Prior year’s figures have been restated due to the application of IAS 19 (as revised in 2011) retrospectively. Please refer to note 3.
Panalpina Annual Report 2013
Consolidated Financial Statements 140
CONSOLIDATED STATEMENT OF FINANCIAL POSITION IN CHFFive-year review

ANNUAL FINANCIAL
STATEMENTS Panalpina World Transport (Holding) Ltd.
Income Statement
Balance Sheet
Notes to the Financial statements
Appropriation of Available Earnings
Report of the Statutory Auditor
142
143
144
148
149
Panalpina Annual Report 2013
Annual Financial Statements 141
CONTENTS

IN THOUSAND CHF NOTES 2013 2012
Income
Income from participations 1 74,983 106,887
Financial income 2 10,282 11,631
Royalties income 3 27,302 37,490
Release of valuation allowance on loans to Group companies 0 0
Total income 112,567 156,008
Expenses
Personnel expenses 4 7,046 11,999
Fines 5 0 59,232
Other administrative expenses 6 5,999 6,710
Financial expenses 7 11,855 13,969
Depreciation and value adjustments on investments 8 15,632 60,487
Total expenses 40,532 152,397
Taxes 389 839
Profit for the year 71,646 2,772
INCOME STATEMENT for the years ended December 31, 2013 and 2012
Panalpina Annual Report 2013
Annual Financial Statements 142

IN THOUSAND CHF NOTES 2013 2012
ASSETSCurrent assets
Cash 2,764 1,340
Cash pool receivables from Group companies 10,331 37,920
Receivables:
from Group companies 461 224
from third parties 101 64
Financial receivables from Group companies 9 0 0
Other current financial assets 10 5,472 0
Prepaid expenses and deferred charges 30,566 39,029
Total current assets 49,695 78,577
Non-current assets
Participations 11 470,482 405,158
Loans to Group companies 9 303,327 308,329
Financial assets 0 7,721
Treasury shares 12 1,400 8,079
Total non-current assets 775,209 729,287
Total assets 824,904 807,864
LIABILITIES AND EQUITY
Current liabilities
Cash pool payables to Group companies 23,936 24,095
Payables:
due to Group companies 841 264
due to third parties 1,002 590
Financial liabilities to Group companies 9 43,774 42,783
Accrued expenses 7,547 13,391
Total current liabilities 77,100 81,123
Non-current liabilities
Loans due to Group companies 921 946
Provisions 363 3,577
Total non-current liabilities 1,284 4,523
Total liabilities 78,384 85,646
Equity
Share capital 13 2,375 2,375
Legal reserve 14 475 475
Reserve for own shares 3,339 10,018
Special reserve 262,786 256,107
Retained earnings:
balance brought forward from previous year 405,899 450,471
profit for the year 71,646 2,772
Total equity 746,520 722,218
Total liabilities and equity 824,904 807,864
Panalpina Annual Report 2013
Annual Financial Statements 143
BALANCE SHEET as of December 31

GeneralThe Group’s consolidated financial statements must be considered for an appropriate financial and economic assessment of the Panalpina Group. The statutory financial statements of Panalpina World Transport (Holding) Ltd. were prepared in accordance with the requirements of the Swiss Code of Obligations (SCO).
Valuation methods and translation of foreign currenciesTreasury shares are valued at the lower of cost and market value. Other current financial assets are reported at market value. All other assets including participations are reported at cost less appropriate value adjustments. Assets and liabilities denominated in foreign currencies are translated into Swiss francs (CHF), using year-end rates of exchange, except for participations which are translated at historical rates. Resulting exchange gains and losses are recognized in the income statement with the exception of unrealized gains, which are deferred. Transactions during the year that are denominated in foreign currencies are translated at exchange rates effective at the relevant transaction dates.
1 INCOME FROM PARTICIPATIONSThe decrease of CHF 31,904 thousand compared to the prior year is mainly due to the fact that in 2012 a capital gain was realized due to the sale of the 12 % investment of Luxair SA’s shares to the state of Luxembourg.
2 FINANCIAL INCOMEThe decrease of CHF 1,349 thousand compared to the prior year is attributable to higher foreign exchange gains of CHF 1,034 thousand, less interest income of CHF 4,365 thousand and increased income of CHF 1,982 thousand on financial assets.
3 ROYALTIES INCOMESince 2009, Panalpina World Transport (Holding) Ltd. receives a fee from its subsidiaries for usage of the Panalpina network and trademark. This fee decreased in 2013 by CHF 10,188 thousand compared to the prior year.
4 PERSONNEL EXPENSESIn accordance with the stipulations of the Transparency law, the compensation of key management personnel is disclosed in note 28 of the Group’s financial statements.
5 FINESThe amount of CHF 59,232 thousand in 2012 represents the penalties from WEKO and EU anti-trust claims.
6 OTHER ADMINISTRATIVE EXPENSESThe reduction of CHF 711 thousand in other administrative expenses is mostly attributable to a decline in project costs (CHF 2,921 thousand), no further settlement repayments from airlines (CHF 4,069 thousand) and a reduction in withholding tax payments (CHF 1,329 thousand).
Panalpina Annual Report 2013
Annual Financial Statements 144
NOTES TO THE FINANCIAL STATEMENTS

7 FINANCIAL EXPENSESThe decrease in financial expenses of CHF 2,114 thousand is mainly due to lower FX losses of CHF 3,740 thousand, a rise of CHF 3,366 thousand in interest expenses and a reduction in loss coverage to subsidiaries of CHF 1,740 thousand.
8 DEPRECIATION AND VALUE ADJUSTMENTS ON INVESTMENTSIn 2013, valuation adjustments to participations in subsidiaries amounting to CHF 15,632 thousand were booked through the income statement.
9 FINANCIAL RECEIVABLES AND LOANS TO GROUP COMPANIESIn 2012 a new Group company, Panalpina International Ltd., was established. This company ensures the financing of the whole Panalpina Group by granting loans and establishing cash pool structures in each region. All financing activities, excluding financing Panalpina International Ltd. itself, were transferred from Panalpina World Transport (Holding) Ltd. to Panalpina International Ltd.
10 OTHER CURRENT FINANCIAL ASSETSIn the year under review, investments were reclassified to short term to reflect the trading nature of these investments.
11 PARTICIPATIONSThe principal direct and indirect subsidiaries of Panalpina World Transport (Holding) Ltd. are listed under the heading “Principal Group companies and participations” on pages 133 to .136
12 TREASURY SHARES In the year under review, no treasury shares were purchased (2012: 42,000 shares, average purchase price 94.77) and treasury share sales totaled 66,931 shares (2012: 59,694 shares) with an average sale price of CHF 81.83 (2012: CHF 34.70). All shares are held to be used for the employee option plan.
The number of treasury shares held by Panalpina World Transport (Holding) Ltd. meets the definitions and requirements of art. 659, 659a, 663b para 10 and 671a SCO.
13 SHARE CAPITALThe fully paid-in share capital on December 31, 2013 amounts to CHF 2.375 million consisting of 23.75 million registered shares at a par value of CHF 0.10 each.
The Annual Meeting of Shareholders held on May 8, 2012 approved the proposal of the Board of Directors to cancel the 1,250,000 repurchased shares and the reduction of the nominal value of the remaining 23,750,000 shares by CHF 1.90 per share. After the cancellation and the nominal value reduction of the shares, the share capital amounts to CHF 2.375 million.
The Annual Meeting of Shareholders approved the proposal of the Board of Directors to adjust the authorized capital on May 15, 2013. The Board of Directors is therefore authorized to create authorized capital to the maximum amount of CHF 300,000 by issuing a maximum of 3,000,000 registered shares with a nominal value of CHF 0.10 each at any time until May 15, 2015.
Panalpina Annual Report 2013
Annual Financial Statements 145

NUMBER OF SHARES 31.12.2013
MOVE-MENT
IN YEAR 31.12.2012
MOVE-MENT
IN YEAR 31.12.2011
Total Panalpina World Transport (Holding) Ltd. shares issued 23,750,000 0 23,750,000 (1,250,000) 25,000,000
Total treasury shares held by Panalpina World Transport (Holding) Ltd. 33,467 (66,931) 100,398 (1,267,694) 1,368,092
in % 0.14 0.42 5.47
IN % 2013 2012
Shareholders
Ernst Göhner Stiftung, Switzerland 45.9 45.9
Cevian Capital II Master Fund L.P. 12.3 12.0
Bestinver Gestión, S.G. SGIIC, Spain ≤3 ≥5
Artisan Partners Limited Partnership, USA ≥5 ≥5
Portfolio investment ≤36.8 ≤32.1
Panalpina World Transport (Holding) Ltd. 0.1 0.4
Nominees
Chase Nominees Ltd., UK 5.2 4.3
14 LEGAL RESERVESThe legal reserve must be at least 20 % of the share capital of Panalpina World Transport (Holding) Ltd. in order to comply with the SCO. Panalpina World Transport (Holding) Ltd. has met the legal requirements for legal reserves under art. 671 SCO.
15 GUARANTEES
IN THOUSAND CHF 2013 2012
Guarantees in favor of third parties
Guarantees and indemnity liabilities, SCO, art. 663b para 1 480,072 486,529
Additionally, Panalpina World Transport (Holding) Ltd., Basel, has issued letters of awareness in favor of various banks concerning liabilities due from subsidiaries amounting to CHF 0.1 million (previous year: CHF 0.1 million).
16 CONTINGENT LIABILITIESPanalpina World Transport (Holding) Ltd. has signed a letter of indemnity as a security for the intraday cash pool overdraft limits over a maximum amount of CHF 64,500 thousand (2012: CHF 64,000 thousand).
Panalpina World Transport (Holding) Ltd. carries joint liability to the federal tax authorities for value-added tax of all Swiss subsidiaries.
Panalpina Annual Report 2013
Annual Financial Statements 146

17 PENDING LEGAL CLAIMSThe status of the proceedings are disclosed under “pending legal claims“ in the consolidated financial statements 2013 (pages 131 and 132).
18 RISK MANAGEMENTThe detailed disclosures regarding risk management / assessment that are required by Swiss law are included in notes 16 and 17 of the Group’s consolidated financial statements on pages 109 to 115.
Panalpina Annual Report 2013
Annual Financial Statements 147

The Board of Directors proposes the following appropriation of available earnings of total CHF 477,545,100 at the Annual General Meeting:
IN CHF 2013
Distribution of an ordinary dividend of CHF 2.20 gross per share* 52,176,373
To be carried forward 425,368,727
Total 477,545,100
* It is not planned to pay dividends on own shares held by the Group.
Panalpina Annual Report 2013
Annual Financial Statements 148
APPROPRIATION OF AVAILABLE EARNINGS

REPORT OF THE STATUTORY AUDITOR TO THE GENERAL MEETING OF SHAREHOLDERS OFPanalpina World Transport (Holding) Ltd., Basel
Report of the Statutory Auditor on the Financial StatementsAs statutory auditor, we have audited the accompanying financial statements of Panalpina World Transport (Holding) Ltd., which comprise the balance sheet, income statement and notes on pages 142 to 148 for the year ended December 31, 2013.
Board of Directors’ ResponsibilityThe board of directors is responsible for the preparation of the financial statements in accordance with the requirements of Swiss law and the company’s articles of incorporation. This responsibility includes designing, implementing and maintaining an internal control system relevant to the preparation of financial statements that are free from material misstatement, whether due to fraud or error. The board of directors is further responsible for selecting and applying appropriate accounting policies and making accounting estimates that are reasonable in the circumstances.
Auditor’s ResponsibilityOur responsibility is to express an opinion on these financial statements based on our audit. We conducted our audit in accordance with Swiss law and Swiss Auditing Standards. Those standards require that we plan and perform the audit to obtain reasonable assurance whether the financial statements are free from material misstatement.
An audit involves performing procedures to obtain audit evidence about the amounts and disclosures in the financial statements. The procedures selected depend on the auditor’s judgment, including the assessment of the risks of material misstatement of the financial statements, whether due to fraud or error. In making those risk assessments, the auditor considers the internal control system relevant to the entity’s preparation of the financial statements in order to design audit procedures that are appropriate in the circumstances, but not for the purpose of expressing an opinion on the effectiveness of the entity’s internal control system. An audit also includes evaluating the appropriateness of the accounting policies used and the reasonableness of accounting estimates made, as well as evaluating the overall presentation of the financial statements. We believe that the audit evidence we have obtained is sufficient and appropriate to provide a basis for our audit opinion.
OpinionIn our opinion, the financial statements for the year ended December 31, 2013 comply with Swiss law and the company’s articles of incorporation.
Report on Other Legal RequirementsWe confirm that we meet the legal requirements on licensing according to the Auditor Oversight Act (AOA) and independence (article 728 CO and article 11 AOA) and that there are no circumstances incompatible with our independence.
In accordance with article 728a paragraph 1 item 3 CO and Swiss Auditing Standard 890, we confirm that an internal control system exists, which has been designed for the preparation of financial statements according to the instructions of the board of directors.
We further confirm that the proposed appropriation of available earnings complies with Swiss law and the company’s articles of incorporation. We recommend that the financial statements submitted to you be approved.
KPMG AG
Regula Wallimann Martin RohrbachLicensed Audit Expert Licensed Audit ExpertAuditor in Charge
Zurich, February 28, 2014
Panalpina Annual Report 2013
Annual Financial Statements 149

Panalpina World Transport(Holding) Ltd.Viaduktstrasse 42P.O. BoxCH-4002 BaselPhone +41 61 226 11 11Fax +41 61 226 11 [email protected]