2013 and for body bone area, bone mineral content, and bone mineral density for individuals aged 8...
TRANSCRIPT
Total Body Bone Area, Bone Mineral Content, and Bone Mineral Density for Individuals Aged 8 Years and Over: United States, 1999–2006
Serie
s 11
, Nu
mb
er 2
53
Au
gu
st 2
013

Copyright information
All material appearing in this report is in the public domain and may be reproduced or copied without permission; citation as to source, however, is appreciated.
Suggested citation
Looker AC, Borrud LG, Hughes JP, et al. Total body bone area, bone mineral content, and bone mineral density for individuals aged 8 years and over: United States, 1999–2006. National Center for Health Statistics. Vital Health Stat 11(253). 2013.
Library of Congress Cataloging-in-Publication Data
Total body bone area, bone mineral content, and bone mineral density for individuals aged 8 years and over : United States, 1999-2006.
p. ; cm. -- (Vital and health statistics, series 11, data from the National Health Examination Survey, the National Health and Nutrition Examination Surveys, and the Hispanic Health and Nutrition Examination Survey ; number 253) (DHHS publication ; pub number 2013-1603) ″August 2013.″ Includes bibliographical references. ISBN 0-8406-0661-3 I. National Center for Health Statistics (U.S.), issuing body. II. Series: Vital and health statistics. Series 11, Data from the National Health Survey ; no. 253. III. Series: DHHS publication ; no. 2013-1603. [DNLM: 1. National Health and Nutrition Examination Survey (U.S.) 2. Bone and Bones--physiology--United States--Statistics. 3. Bone Density--United States-Statistics. 4. Bone and Bones--chemistry--United States--Statistics. 5. Data Interpretation, Statistical--United States. 6. Health Surveys--United States-Statistics. 7. Nutrition Surveys--United States--Statistics. W2 A N148vk no.253 2013] RA407.3 614.4’273--dc23 2013022789
For sale by the U.S. Government Printing Office Superintendent of Documents Mail Stop: SSOP Washington, DC 20402–9328 Printed on acid-free paper.
Series 11, Number 253
Total Body Bone Area, Bone Mineral Content, and Bone Mineral Density for Individuals Aged 8 Years and Over: United States, 1999–2006
Data From the National Health and Nutrition Examination Survey (NHANES)
U.S. DEPARTMENT OF HEALTH AND HUMAN SERVICES Centers for Disease Control and Prevention National Center for Health Statistics
Hyattsville, Maryland August 2013 DHHS Publication No. 2013–1603

National Center for Health Statistics
Charles J. Rothwell, M.S., Acting Director
Jennifer H. Madans, Ph.D., Associate Director for Science
Division of Health and Nutrition Examination Surveys
Kathryn S. Porter, M.D., M.S., Director

Contents
Abstract . . . . . . . . . . . . . . . . . . . . . . . . . . . . . . . . . . . . . . . . . . . . . . . . . . . . . . . . . . . . . . . . . . . . . . . . . . . . . . . . . . . . . . . . . . . . . . . . . . 1
Introduction . . . . . . . . . . . . . . . . . . . . . . . . . . . . . . . . . . . . . . . . . . . . . . . . . . . . . . . . . . . . . . . . . . . . . . . . . . . . . . . . . . . . . . . . . . . . . . . 1
Methods . . . . . . . . . . . . . . . . . . . . . . . . . . . . . . . . . . . . . . . . . . . . . . . . . . . . . . . . . . . . . . . . . . . . . . . . . . . . . . . . . . . . . . . . . . . . . . . . . . 1 Data Source . . . . . . . . . . . . . . . . . . . . . . . . . . . . . . . . . . . . . . . . . . . . . . . . . . . . . . . . . . . . . . . . . . . . . . . . . . . . . . . . . . . . . . . . . . . . . 1 Dual Energy X-ray Absorptiometry Component . . . . . . . . . . . . . . . . . . . . . . . . . . . . . . . . . . . . . . . . . . . . . . . . . . . . . . . . . . . . . . . . 2 Analytic Sample . . . . . . . . . . . . . . . . . . . . . . . . . . . . . . . . . . . . . . . . . . . . . . . . . . . . . . . . . . . . . . . . . . . . . . . . . . . . . . . . . . . . . . . . . 2 Statistical Analysis. . . . . . . . . . . . . . . . . . . . . . . . . . . . . . . . . . . . . . . . . . . . . . . . . . . . . . . . . . . . . . . . . . . . . . . . . . . . . . . . . . . . . . . . 3
Key Findings . . . . . . . . . . . . . . . . . . . . . . . . . . . . . . . . . . . . . . . . . . . . . . . . . . . . . . . . . . . . . . . . . . . . . . . . . . . . . . . . . . . . . . . . . . . . . . 3
References . . . . . . . . . . . . . . . . . . . . . . . . . . . . . . . . . . . . . . . . . . . . . . . . . . . . . . . . . . . . . . . . . . . . . . . . . . . . . . . . . . . . . . . . . . . . . . . . 5
Figures 1. Smoothed mean total body bone mineral density of males and females aged 8 years and over, by age and race and
ethnicity: United States 1999–2006 . . . . . . . . . . . . . . . . . . . . . . . . . . . . . . . . . . . . . . . . . . . . . . . . . . . . . . . . . . . . . . . . . . . . . . 4 2. Mean total body bone mineral density of males and females aged 8–19 years, by age and race and ethnicity:
United States 1999–2006 . . . . . . . . . . . . . . . . . . . . . . . . . . . . . . . . . . . . . . . . . . . . . . . . . . . . . . . . . . . . . . . . . . . . . . . . . . . . . . 5 3. Mean total body bone mineral density of males and females aged 20 years and over, by age and race and ethnicity:
United States 1999–2006 . . . . . . . . . . . . . . . . . . . . . . . . . . . . . . . . . . . . . . . . . . . . . . . . . . . . . . . . . . . . . . . . . . . . . . . . . . . . . . 6
Detailed Tables 1. Total body bone area (cm2) of persons aged 8 years and over, by sex, race and ethnicity, and age: United States,
1999–2006. . . . . . . . . . . . . . . . . . . . . . . . . . . . . . . . . . . . . . . . . . . . . . . . . . . . . . . . . . . . . . . . . . . . . . . . . . . . . . . . . . . . . . . . . . 7 2. Total body bone mineral content (g) of persons aged 8 years and over, by sex, race and ethnicity, and age:
United States, 1999–2006. . . . . . . . . . . . . . . . . . . . . . . . . . . . . . . . . . . . . . . . . . . . . . . . . . . . . . . . . . . . . . . . . . . . . . . . . . . . . . 9 3. Total body bone mineral density (g/cm2) of persons aged 8 years and over, by sex, race and ethnicity, and age:
United States, 1999–2006. . . . . . . . . . . . . . . . . . . . . . . . . . . . . . . . . . . . . . . . . . . . . . . . . . . . . . . . . . . . . . . . . . . . . . . . . . . . . 11 4. Total minus head (subtotal) bone area (cm2) of persons aged 8 years and over, by sex, race and ethnicity, and age:
United States, 1999–2006. . . . . . . . . . . . . . . . . . . . . . . . . . . . . . . . . . . . . . . . . . . . . . . . . . . . . . . . . . . . . . . . . . . . . . . . . . . . . 13 5. Total minus head (subtotal) bone mineral content (g) of persons aged 8 years and over, by sex, race and ethnicity, and
age: United States, 1999–2006. . . . . . . . . . . . . . . . . . . . . . . . . . . . . . . . . . . . . . . . . . . . . . . . . . . . . . . . . . . . . . . . . . . . . . . . . 15 6. Total minus head (subtotal) bone mineral density (g/cm2) of persons aged 8 years and over, by sex, race and ethnicity,
and age: United States, 1999–2006 . . . . . . . . . . . . . . . . . . . . . . . . . . . . . . . . . . . . . . . . . . . . . . . . . . . . . . . . . . . . . . . . . . . . . 17 7. Body trunk bone area (cm2) of persons aged 8 years and over, by sex, race and ethnicity, and age: United States,
1999–2006. . . . . . . . . . . . . . . . . . . . . . . . . . . . . . . . . . . . . . . . . . . . . . . . . . . . . . . . . . . . . . . . . . . . . . . . . . . . . . . . . . . . . . . . . 19 8. Body trunk bone mineral content (g) of persons aged 8 years and over, by sex, race and ethnicity, and age:
United States, 1999–2006. . . . . . . . . . . . . . . . . . . . . . . . . . . . . . . . . . . . . . . . . . . . . . . . . . . . . . . . . . . . . . . . . . . . . . . . . . . . . 21 9. Body trunk bone mineral density (g/cm2) of persons aged 8 years and over, by sex, race and ethnicity, and age:
United States, 1999–2006. . . . . . . . . . . . . . . . . . . . . . . . . . . . . . . . . . . . . . . . . . . . . . . . . . . . . . . . . . . . . . . . . . . . . . . . . . . . . 23 10. Thoracic spine bone area (cm2) of persons aged 8 years and over, by sex, race and ethnicity, and age: United States,
1999–2006. . . . . . . . . . . . . . . . . . . . . . . . . . . . . . . . . . . . . . . . . . . . . . . . . . . . . . . . . . . . . . . . . . . . . . . . . . . . . . . . . . . . . . . . . 25 11. Thoracic spine bone mineral content (g) of persons aged 8 years and over, by sex, race and ethnicity, and age:
United States, 1999–2006. . . . . . . . . . . . . . . . . . . . . . . . . . . . . . . . . . . . . . . . . . . . . . . . . . . . . . . . . . . . . . . . . . . . . . . . . . . . . 27 12. Thoracic spine bone mineral density (g/cm2) of persons aged 8 years and over, by sex, race and ethnicity, and age:
United States, 1999–2006. . . . . . . . . . . . . . . . . . . . . . . . . . . . . . . . . . . . . . . . . . . . . . . . . . . . . . . . . . . . . . . . . . . . . . . . . . . . . 29
iii

13. Lumbar spine bone area (cm2) of persons aged 8 years and over, by sex, race and ethnicity, and age: United States, 1999–2006. . . . . . . . . . . . . . . . . . . . . . . . . . . . . . . . . . . . . . . . . . . . . . . . . . . . . . . . . . . . . . . . . . . . . . . . . . . . . . . . . . . . . . . . . 31
14. Lumbar spine bone mineral content (g) of persons aged 8 years and over, by sex, race and ethnicity, and age: United States, 1999–2006. . . . . . . . . . . . . . . . . . . . . . . . . . . . . . . . . . . . . . . . . . . . . . . . . . . . . . . . . . . . . . . . . . . . . . . . . . . . . 33
15. Lumbar spine bone mineral density (g/cm2) of persons aged 8 years and over, by sex, race and ethnicity, and age: United States, 1999–2006. . . . . . . . . . . . . . . . . . . . . . . . . . . . . . . . . . . . . . . . . . . . . . . . . . . . . . . . . . . . . . . . . . . . . . . . . . . . . 35
16. Pelvis bone area (cm2) of persons aged 8 years and over, by sex, race and ethnicity, and age: United States, 1999–2006. . . . . . . . . . . . . . . . . . . . . . . . . . . . . . . . . . . . . . . . . . . . . . . . . . . . . . . . . . . . . . . . . . . . . . . . . . . . . . . . . . . . . . . . . 37
17. Pelvis bone mineral content (g) of persons aged 8 years and over, by sex, race and ethnicity, and age: United States, 1999–2006. . . . . . . . . . . . . . . . . . . . . . . . . . . . . . . . . . . . . . . . . . . . . . . . . . . . . . . . . . . . . . . . . . . . . . . . . . . . . . . . . . . . . . . . . 39
18. Pelvis bone mineral density (g/cm2) of persons aged 8 years and over, by sex, race and ethnicity, and age: United States, 1999–2006. . . . . . . . . . . . . . . . . . . . . . . . . . . . . . . . . . . . . . . . . . . . . . . . . . . . . . . . . . . . . . . . . . . . . . . . . . . . . 41
19. Right arm bone area (cm2) of persons aged 8 years and over, by sex, race and ethnicity, and age: United States, 1999–2006. . . . . . . . . . . . . . . . . . . . . . . . . . . . . . . . . . . . . . . . . . . . . . . . . . . . . . . . . . . . . . . . . . . . . . . . . . . . . . . . . . . . . . . . . 43
20. Right arm bone mineral content (g) of persons aged 8 years and over, by sex, race and ethnicity, and age: United States, 1999–2006. . . . . . . . . . . . . . . . . . . . . . . . . . . . . . . . . . . . . . . . . . . . . . . . . . . . . . . . . . . . . . . . . . . . . . . . . . . . . 45
21. Right arm bone mineral density (g/cm2) of persons aged 8 years and over, by sex, race and ethnicity, and age: United States, 1999–2006. . . . . . . . . . . . . . . . . . . . . . . . . . . . . . . . . . . . . . . . . . . . . . . . . . . . . . . . . . . . . . . . . . . . . . . . . . . . . 47
22. Left arm bone area (cm2) of persons aged 8 years and over, by sex, race and ethnicity, and age: United States, 1999–2006. . . . . . . . . . . . . . . . . . . . . . . . . . . . . . . . . . . . . . . . . . . . . . . . . . . . . . . . . . . . . . . . . . . . . . . . . . . . . . . . . . . . . . . . . 49
23. Left arm bone mineral content (g) of persons aged 8 years and over, by sex, race and ethnicity, and age: United States, 1999–2006. . . . . . . . . . . . . . . . . . . . . . . . . . . . . . . . . . . . . . . . . . . . . . . . . . . . . . . . . . . . . . . . . . . . . . . . . . . . . . . . . . . . . . . . . 51
24. Left arm bone mineral density (g/cm2) of persons aged 8 years and over, by sex, race and ethnicity, and age: United States, 1999–2006. . . . . . . . . . . . . . . . . . . . . . . . . . . . . . . . . . . . . . . . . . . . . . . . . . . . . . . . . . . . . . . . . . . . . . . . . . . . . 53
25. Right leg bone area (cm2) of persons aged 8 years and over, by sex, race and ethnicity, and age: United States, 1999–2006. . . . . . . . . . . . . . . . . . . . . . . . . . . . . . . . . . . . . . . . . . . . . . . . . . . . . . . . . . . . . . . . . . . . . . . . . . . . . . . . . . . . . . . . . 55
26. Right leg bone mineral content (g) of persons aged 8 years and over, by sex, race and ethnicity, and age: United States, 1999–2006. . . . . . . . . . . . . . . . . . . . . . . . . . . . . . . . . . . . . . . . . . . . . . . . . . . . . . . . . . . . . . . . . . . . . . . . . . . . . 57
27. Right leg bone mineral density (g/cm2) of persons aged 8 years and over, by sex, race and ethnicity, and age: United States, 1999–2006. . . . . . . . . . . . . . . . . . . . . . . . . . . . . . . . . . . . . . . . . . . . . . . . . . . . . . . . . . . . . . . . . . . . . . . . . . . . . 59
28. Left leg bone area (cm2) of persons aged 8 years and over, by sex, race and ethnicity, and age: United States, 1999–2006. . . . . . . . . . . . . . . . . . . . . . . . . . . . . . . . . . . . . . . . . . . . . . . . . . . . . . . . . . . . . . . . . . . . . . . . . . . . . . . . . . . . . . . . . 61
29. Left leg bone mineral content (g) of persons aged 8 years and over, by sex, race and ethnicity, and age: United States, 1999–2006. . . . . . . . . . . . . . . . . . . . . . . . . . . . . . . . . . . . . . . . . . . . . . . . . . . . . . . . . . . . . . . . . . . . . . . . . . . . . . . . . . . . . . . . . 63
30. Left leg bone mineral density (g/cm2) of persons aged 8 years and over, by sex, race and ethnicity, and age: United States, 1999–2006. . . . . . . . . . . . . . . . . . . . . . . . . . . . . . . . . . . . . . . . . . . . . . . . . . . . . . . . . . . . . . . . . . . . . . . . . . . . . 65
31. Right ribs bone area (cm2) of persons aged 8 years and over, by sex, race and ethnicity, and age: United States, 1999–2006. . . . . . . . . . . . . . . . . . . . . . . . . . . . . . . . . . . . . . . . . . . . . . . . . . . . . . . . . . . . . . . . . . . . . . . . . . . . . . . . . . . . . . . . . 67
32. Right ribs bone mineral content (g) of persons aged 8 years and over, by sex, race and ethnicity, and age: United States, 1999–2006. . . . . . . . . . . . . . . . . . . . . . . . . . . . . . . . . . . . . . . . . . . . . . . . . . . . . . . . . . . . . . . . . . . . . . . . . . . . . 69
33. Right ribs bone mineral density (g/cm2) of persons aged 8 years and over, by sex, race and ethnicity, and age: United States, 1999–2006. . . . . . . . . . . . . . . . . . . . . . . . . . . . . . . . . . . . . . . . . . . . . . . . . . . . . . . . . . . . . . . . . . . . . . . . . . . . . 71
34. Left ribs bone area (cm2) of persons aged 8 years and over, by sex, race and ethnicity, and age: United States, 1999–2006. . . . . . . . . . . . . . . . . . . . . . . . . . . . . . . . . . . . . . . . . . . . . . . . . . . . . . . . . . . . . . . . . . . . . . . . . . . . . . . . . . . . . . . . . 73
35. Left ribs bone mineral content (g) of persons aged 8 years and over, by sex, race and ethnicity, and age: United States, 1999–2006. . . . . . . . . . . . . . . . . . . . . . . . . . . . . . . . . . . . . . . . . . . . . . . . . . . . . . . . . . . . . . . . . . . . . . . . . . . . . . . . . . . . . . . . . 75
36. Left ribs bone mineral density (g/cm2) of persons aged 8 years and over, by sex, race and ethnicity, and age: United States, 1999–2006. . . . . . . . . . . . . . . . . . . . . . . . . . . . . . . . . . . . . . . . . . . . . . . . . . . . . . . . . . . . . . . . . . . . . . . . . . . . . 77
iv

Objectives This report presents bone
measurement data from total body dual energy x-ray absorptiometry scans for 28,454 persons aged 8 years and over who participated in the 1999–2006 National Health and Nutrition Examination Survey. The sample consisted of 22,667 respondents with valid data, and 5,787 with missing data that were successfully multiply imputed (i.e., not highly variable). Bone area, bone mineral content, and bone mineral density (BMD) are presented for the total body, the total body minus the head (e.g., subtotal), and 10 subregions of the body.
Methods Means, standard deviations, and
selected percentiles were calculated for the total body, total body minus head (subtotal), and 10 body subregions by sex, race and ethnicity, and age. Smoothed mean total body BMD was plotted by age, sex, and race and ethnicity. Multiple regression was used to evaluate differences in mean total body BMD by age, sex, and race and ethnicity.
Results After adjusting for race and ethnicity,
total body BMD among those under age 20 was significantly higher in respondents aged 12–19 than in those aged 8–11 in both sexes. Among adults of both sexes, total body BMD in persons aged 20–49 was significantly higher than in those aged 50–79, and significantly lower in persons aged 80 and over than in those aged 50–79, after adjusting for race and ethnicity. After adjusting for age, total body BMD was significantly higher in non-Hispanic black persons than in non-Hispanic white persons, regardless of age or sex. However, the pattern differed by age when Mexican-American persons were compared with non-Hispanic white persons: Age-adjusted total body BMD was significantly lower among Mexican-American males aged 8–19, was similar in Mexican-American females aged 8–19, and was significantly lower in Mexican-American men and women aged 20 and over.
Keywords: U.S. population • dual energy x-ray absorptiometry
Total Body Bone Area, Bone Mineral Content, and Bone Mineral Density for Individuals Aged 8 Years and Over: United States, 1999–2006 by Anne C. Looker, Ph.D., Lori G. Borrud, Dr.PH., and Jeffery P. Hughes, M.P.H., National Center for Health Statistics; and Bo Fan, M.D., John A. Shepherd, Ph.D., and Mary Sherman, R.T., University of California, San Francisco
Introduction
Dual energy x-ray absorptiometry (DXA) has long been accepted as the primary method for measuring bone mineral content (BMC) and bone mineral density (BMD) because of its high precision, accuracy, and low radiation exposure (1–5). More recently, whole body DXA also has become one of the most widely accepted methods of measuring body composition due to its speed, ease of use, and strong correlation with criterion methods of assessing body composition (6). In addition, DXA has shown to be comparable in reliability and accuracy to computed tomography and magnetic resonance imaging in assessing body composition in defined regions such as the arms, legs, and trunk (7–9).
In 1999, the National Health and Nutrition Examination Survey (NHANES) implemented whole body DXA scans of survey participants aged 8 years and over to provide nationally representative body composition data for the U.S. population. This report presents bone measurement data from whole body DXA scans for persons aged 8 and over who participated in the 1999–2006 NHANES. This report expands on
previous publications of NHANES total body DXA data (10–12) by providing detailed data on bone area, BMC, and BMD for all body subregions. In addition, this report incorporates data from the 2005–2006 NHANES that were not available at the time of the previous reports.
Methods
Data Source NHANES is conducted by the
Centers for Disease Control and Prevention’s National Center for Health Statistics (NCHS) to assess the health and nutritional status of a large representative cross-sectional sample of the noninstitutionalized civilian U.S. population (13). All procedures in NHANES 1999–2006 were approved by the NCHS Institutional Review Board. Parental permission was obtained for minors under age 18. Children aged 7–17 were also asked to provide documented assent. Consent was obtained for all adults aged 18 and over. Data were collected in NHANES 1999–2006 through household interviews and direct standardized
Page 1

Page 2 [ Series 11, No. 253
physical examinations that were conducted in specially equipped mobile examination centers (MECs) (13). NHANES 1999–2006 was designed to provide reliable estimates for three racial and ethnic groups: non-Hispanic white, non-Hispanic black, and Mexican American. Race and ethnicity were self-reported by the participants.
Dual Energy X-ray Absorptiometry Component
Survey participants aged 8 and over in 1999–2004 and aged 8–69 in 2005–2006 were eligible to receive a total body DXA scan, unless they were pregnant; reported exposure to radiographic contrast material (barium) use in the past 72 hours or exposure to nuclear medicine studies in the past 3 days; or exceeded the weight or height limits of the DXA table (i.e., weighed more than 300 pounds or were taller than 6 feet and 5 inches). Additionally, females aged 8–17 were excluded from the DXA component in 1999 so that concerns about reporting pregnancy test results for minors could be resolved. See ‘‘Analytic Sample’’ for a description of how individuals with missing data were handled in the analyses used in this report.
The DXA scans were acquired with a Hologic QDR 4500A fan-beam densitometer (Hologic, Inc., Bedford, M.A.) and with Hologic software, version 8.26:a3*. All scans were administered by certified radiology technologists. Details of the DXA examination protocol are documented in the Body Composition Procedures Manual on the NHANES website (14). A high level of quality control was maintained throughout the DXA data collection and scan analysis. Technologist performance was monitored through in-person observations in the field and scan review, with feedback provided as needed. Retraining sessions were conducted annually, and as needed, to reinforce correct techniques and appropriate protocol. Each participant scan was reviewed and analyzed by the NHANES quality control center at the
University of California, San Francisco (UCSF), Department of Radiology, using standard radiologic techniques and study-specific protocols developed for NHANES. All participant scans were reviewed by a second technologist, and differences were adjudicated by a supervisor. Hologic Discovery software, version 12.1, was used to analyze the scans. Codes to indicate invalidity were applied by UCSF to regions of the body that could not be analyzed accurately. Reasons for invalid regions included:
1. Jewelry and other objects not removed
2. Nonremovable objects (e.g., prostheses, implants, or casts)
3. Excessive x-ray ‘‘noise’’ due to truncal adiposity
4. Arm and leg overlap 5. Body parts out of the scan field 6. Positioning problems 7. Participant motion 8. Scanner failed 9. Other (e.g., missing limbs, unknown
artifacts, or fracture)
During the 1999–2006 DXA data collection, quality-control phantoms specific to each MEC, and phantoms that circulated among the MECs, were scanned according to a rigorous schedule to provide cross-calibration and longitudinal monitoring. Spine phantoms specific to each MEC were scanned daily, as required by the manufacturer, to ensure accurate calibration of the densitometer. MEC-specific whole body and tissue-step phantoms were scanned one to three times weekly. Phantoms simulating tissue or bone were used to quantify the accuracy and precision of DXA densitometers in order to detect drift or changes in measurement accuracy over time. A set of phantoms that included a spine phantom, block phantom, and whole body phantom circulated among the MECs and were scanned at the start of operations at each survey site. Air scans, which are phantomless scans of the scan field using the whole body scan mode, were used to monitor radiographic uniformity across the entire scan field. The phantom scanning schedule is described in the Body Composition Procedures Manual (14).
UCSF used the cumulative statistics method (CUSUM) and the MEC-specific phantom data to determine breaks in the calibration of the densitometers over the course of the survey (15). NCHS evaluated the effect of adjustment factors developed by UCSF from cross-calibration data collected before the start of data collection in 1999 and from the longitudinal monitoring data on the participant data. The magnitude of the adjustment was determined to be insignificant, and correction of the participant data was not required.
The DXA scans provided bone measures for both arms and both legs, left and right ribs, pelvis, thoracic spine, lumbar spine, and head. Values for the total body and body subregions include bone area (cm2), BMC (g), and BMD (g/cm2). Total values were calculated by summing measurements for all body subregions. Total body minus head (subtotal) values were calculated by summing measurements for all body subregions except the head.
Analytic Sample Respondents with missing total
body DXA data were not a random subset of the eligible sample. Details about characteristics of respondents with missing total body DXA data have been published elsewhere (12). Specifically, the percentage of eligible participants with valid data decreased with increasing age (primarily due to an increase in implants such as pacemakers, stents, and hip replacements) and with increasing body mass index (primarily due to truncal adiposity, which interfered with the ability to obtain valid measurements) (12). To address this potential bias, multiple imputation of missing data for the total body and body subregions was performed using a sequential regression multivariate imputation procedure, which is described in detail elsewhere (16,17). The regression models used to impute the data used a large number of predictor variables, including DXA data for any nonmissing total body subregions, as well as demographic, socioeconomic, and geographic variables; anthropometric measurements;

Series 11, No. 253 [ Page 3
health indicators; dietary intake and medication use; blood test results; and variables related to the design of the NHANES sample.
Data were multiply imputed for all sample persons in the eligible age range for this examination, except pregnant women and those with limb amputations other than fingers or toes. Specifically, in addition to persons with invalid DXA scan data, results were imputed for females aged 8–17 from 1999, persons with exposure to radiographic contrast or nuclear medicine materials, and persons who exceeded the DXA table size limitations. The imputed data for these individuals are included in this report. However, the imputed values of 438 respondents were found to vary greatly among the different imputed data sets. Review of the data for these participants showed that values were missing for all DXA measurements, as well as measured height and weight (important predictor variables in the imputation models). Because of the extreme variability of their imputed DXA data values, the data for these 438 respondents were not included in this report.
This report uses the total body DXA measurements for 28,479 respondents aged 8 and over (those aged 8–69 for 2005–2006) with complete total body DXA data, including 5,787 with imputed values that were not highly variable between the imputed data sets (e.g., values that did not lack measurements of height, weight, and all DXA data, as described above). These data represent 87% of the participants aged 8 and over who were interviewed (n = 32,819) and 92% of those who were interviewed and examined (n = 31,085).
Statistical Analysis Means, standard deviations, and
percentiles for bone area, BMC, and BMD are presented by sex and age for all racial and ethnic groups combined, and for Mexican-American, non-Hispanic white, and non-Hispanic black population subgroups separately. The analytic age groups used were: 8–11, 12–15, 16–19, 20–29, 30–39, 40–49,
50–59, 60–69, 70–79, and 80 and over. Data analyses were performed using
the statistical packages SAS, version 9.3 (SAS Institute, Cary, N.C.); and SUDAAN, version 11.0 (RTI International, Research Triangle Park, N.C.); or with the R survey package (University of Washington, Seattle W.A.) (18). The SUDAAN MI-COUNT option was used to accommodate the multiply imputed data. Standard errors and standard deviations of the means were estimated by Taylor Series Linearization (19), a method that incorporates the sample weights and accounts for the NHANES complex sample design. Eight-year MEC weights were applied to the data to account for differential probabilities of selection, nonresponse, and noncoverage. Estimates were considered statistically reliable if their relative standard error (RSE) was less than 30% and they were based on 12 or more degrees of freedom. The RSE is defined as the ratio of the standard error of the estimate divided by the estimate multiplied by 100. In the tables, estimates that do not meet criteria for statistical reliability are identified with an asterisk. Estimates whose standard errors were not calculable using SUDAAN due to small cell sizes were omitted from the tables. Means for adults aged 20 and over shown in the tables were age-adjusted to the U.S. 2000 standard population to facilitate comparisons between the sex and race and ethnicity subgroups (20). The age groups used to age-adjust these means were 20–29, 30–39, 40–49, 50–59, 60–69, 70–79, and 80 years and over.
Total body BMD data were plotted by age, sex, and race and ethnicity using ‘‘Svysmooth,’’ a smoothing procedure available in the R survey package that is designed for use with surveys with a complex design (18). Multiple regression (SUDAAN PROC REGRESS) was used to assess whether significant interactions in total BMD existed between age and sex, age and race and ethnicity, or sex and race and ethnicity. Results indicated that significant interactions existed when all ages and both sexes were analyzed together, but not when ages 8–19 and 20 and over were analyzed separately by
sex. As a result, comparisons of total body BMD by detailed age group or by race and ethnicity were made by sex within these two broad age categories. Multiple regression was used to compare mean total body BMD by detailed age group while adjusting for race and ethnicity and to compare mean total body BMD by race and ethnicity while adjusting for detailed age group.
Key Findings
Means; standard deviations; and percentiles for BMD, BMC, and bone area of the total body, total body minus head (subtotal), and 10 body subregions are shown in Tables 1–36 for persons aged 8 and over. Patterns in total body BMD by age, sex, and race and ethnicity are summarized in Figures 1–3.
+ Smoothed mean total body BMD increased until early adulthood and then remained relatively stable in males and females in the three racial and ethnic groups examined until approximately age 50, after which it declined with age in both sexes in the three groups (Figure 1).
++ Total body BMD was significantly higher (after adjusting for race and ethnicity) in respondents aged 12–19 years than in those aged 8–11 years in both sexes (Figure 2).
++ Total body BMD was significantly higher (after adjusting for age) in non-Hispanic black persons aged 8–19 years than in non-Hispanic white persons of this age group in both sexes. But the pattern differed by sex when Mexican-American persons were compared with non-Hispanic white persons: Age-adjusted total body BMD was significantly lower among Mexican-American males compared with non-Hispanic white males, but total body BMD was similar among Mexican-American and non-Hispanic white females (Figure 2).
++ Among adults aged 20 and over, total body BMD was significantly lower in each of the three succeeding age groups tested in both sexes, after adjusting for race and

Males
1.5
Non-Hispanic black 1.2
Mexican American Non-Hispanic white0.9
0.6
0.3
0.0 8 15 22 30 37 44 51 58 66 73 80 and
Age (years) over
Females 1.5
1.2 Non-Hispanic black
Non-Hispanic white0.9 Mexican American
0.6
0.3
0.0 8 15 22 30 37 44 51 58 66 73 80 and
Age (years) over
SOURCE: CDC/NCHS, National Health and Nutrition Examination Survey, 1999–2006.
Bon
e m
iner
al d
ensi
ty (g
/cm
2 )B
one
min
eral
den
sity
(g/c
m2 )
Page 4 [ Series 11, No. 253
Figure 1. Smoothed mean total body bone mineral density of males and females aged 8 years and over, by age and race and ethnicity: United States 1999–2006
eds. Human body composition, 2nd ed. Champaign, IL: Human Kinetics Press. 2005.
7. Visser M, Fuerst T, Lang T, Salamone L, Harris TB. Validity of fan-beam dual-energy x-ray absorptiometry for measuring fat-free mass and leg muscle mass. Health, aging, and body composition study—Dual energy x-ray absorptiometry and body composition working group. J Appl Physiol 87(4):1513–20. 1999.
8. Kim J, Wang Z, Heymsfield SB, Baumgartner RN, Gallagher D. Total-body skeletal muscle mass: Estimation by a new dual-energy x-ray absorptiometry method. Am J Clin Nutr 76(2):378–83. 2002.
9. Glickman SG, Marn CS, Supiano MA, Dengel DR. Validity and reliability of dual-energy x-ray absorptiometry for the assessment of abdominal adiposity. J Appl Physiol 97(2):509–14. 2004.
10. Looker AC, Melton LJ, Harris T, Borrud L, Shepherd J, McGowan J. Age, gender, and race/ethnic differences in total body and subregional bone density. Osteoporos Int 20(7):1141–9. 2009.
11. Kelly TL, Wilson KE, Heymsfield SB. Dual energy x-ray absorptiometry body composition reference values from NHANES. PLoS One 4(9):e7038. 2009.
12. Borrud LG, Flegal KM, Looker AC, Everhart JE, Harris TB, Shepherd JA. Body composition data for individuals 8 years of age and older: U.S. population, 1999–2004. National Center for Health Statistics. Vital Health Stat 11(250). 2010.
13. NCHS. About the National Health and Nutrition Examination Survey. Hyattsville, MD: NCHS. Available from: http://www.cdc.gov/nchs/nhanes/ about_nhanes.htm.
14. NCHS. National Health and Nutrition Examination Survey. Body composition procedures manual. 2004. Available from: http://www.cdc.gov/nchs/data/ nhanes/nhanes_03_04/BC.pdf.
15. Lu Y, Mathur AK, Blunt BA, Gluer CC, Will AS, Fuerst TP, et al. Dual x-ray absorptiometry quality control: Comparison of visual examination and process-control charts. J Bone Miner Res 11(5):626–37. 1996.
16. Schenker N, Borrud LG, Burt VL, Curtin LR, Flegal KM, Hughes J, et al. Multiple imputation of missing dual-energy x-ray absorptiometry data in the National Health and Nutrition Examination Survey. Stat Med 30(3):260–76. 2011.
ethnicity (Figure 3). When compared with non-Hispanic white persons and after adjusting for age, total body BMD was significantly higher in non-Hispanic black persons and significantly lower in Mexican-American persons in both sexes (Figure 3).
References
1. Njeh CF, Fuerst T, Hans D, Blake GM, Genant HK. Radiation exposure in bone mineral density assessment. Appl Radiat Isot 50(1):215–36. 1999.
2. Wahner HW, Fogelman I. The evaluation of osteoporosis: Dual energy
x-ray absorptiometry in clinical practice. London: Martin Dunitz Ltd. 1994.
3. WHO. Assessment of fracture risk and its application to screening for postmenopausal osteoporosis. 1994.
4. Genant HK, Engelke K, Fuerst T, Glüer CC, Grampp S, Harris ST, et al. Noninvasive assessment of bone mineral and structure: State of the art. J Bone Miner Res 11(6):707–30. 1996.
5. Thomas SR, Kalkwarf HJ, Buckley DD, Heubi JE. Effective dose of dual-energy x-ray absorptiometry scans in children as a function of age. J Clin Densitom 8(4):415–22. 2005.
6. Lohman TG, Chen Z. Dual-energy x-ray absorptiometry. In: Heymsfield SB, Lohman T, Wang ZM, Going SB,

Males
†
Bon
e m
iner
al d
ensi
ty (g
/cm
2 )
‡
‡
0.0
0.7
0.8
0.9
1.0
1.1
1.2
1.3
8–11 12–19 Non- Non- Mexican Age (years)1 Hispanic Hispanic American
white black Race and ethnicity2
Females
Bon
e m
iner
al d
ensi
ty (g
/cm
2 )
8–11 Age (years)1
Race and ethnicity2
12–19 Non-Hispanic
white
Non-Hispanic
black
Mexican American
0.00.0
0.7
0.8
0.9
1.0
1.1
1.2
1.3
† ‡
† p < 0.05 compared with 12–19 years. ‡ p < 0.05 compared with non-Hispanic white persons. 1Adjusted for race and ethnicity. 2Adjusted for age. SOURCE: CDC/NCHS, National Health and Nutrition Examination Survey, 1999–2006.
Series 11, No. 253 [ Page 5
Figure 2. Mean total body bone mineral density of males and females aged 8–19 years, by age and race and ethnicity: United States 1999–2006
17. CDC. The 1999–2004 dual energy 19. Wolter KM. Introduction to variance x-ray absorptiometry (DXA) multiple imputation data files and technical
estimation. New York, NY: Springer-Verlag New York, Inc. 1985.
documentation. Hyattsville, MD: CDC. Available from: http://www.cdc.gov/
20. Klein RJ, Schoenborn CA. Age adjustment using the 2000 projected
18. nchs/nhanes/dxx/dxa.htm. Lumley T. Chapter 4.4.3: Scatterplot
U.S. population. Healthy People statistical notes. No. 20. Hyattsville,
smoothers. In: Couper MR, Kalton G, Rao JNK, Schwarz N, Skinner C,
MD: National Center for Health Statistics. 2001.
Groves RM (eds.). Complex surveys: A guide to analysis using R. Hoboken, NJ: John Wiley & Sons, Inc., 4-17–8. 2010.

Men
Bon
e m
iner
al d
ensi
ty (g
/cm
2 )
† †
‡
‡
50–7920–49 80 and Non- Non- Mexican 0.0
0.7
0.8
0.9
1.0
1.1
1.2
1.3
over Hispanic Hispanic American Age (years)1 white black
Race and ethnicity2
Women
Bon
e m
iner
al d
ensi
ty (g
/cm
2 )
†
†
‡
‡
0.0
0.7
0.8
0.9
1.0
1.1
1.2
1.3
20–49 50–79 80 and Non- Non- Mexican over Hispanic Hispanic American
Age (years)1 white black Race and ethnicity2
† p < 0.05 compared with preceding age group. ‡ p < 0.05 compared with non-Hispanic white persons. 1Adjusted for race and ethnicity. 2Adjusted for age. SOURCE: CDC/NCHS, National Health and Nutrition Examination Survey, 1999–2006.
Figure 3. Mean total body bone mineral density of men and women aged 20 and over, by age and race and ethnicity: United States 1999–2006
Page 6 [ Series 11, No. 253

Series 11, No. 253 [ Page 7
Table 1. Total body bone area (cm2) of persons aged 8 years and over, by sex, race and ethnicity, and age: United States, 1999–2006
Percentile Sample Standard
Sex, race and ethnicity, and age size Mean deviation 5th 10th 15th 25th 50th 75th 85th 90th 95th
Male
All races and ethnicities 8–11 years . . . . . . . . . . . . . . . . 1,421 1,385.43 173.29 1,155.16 1,208.16 1,238.26 1,273.35 1,359.44 1,465.73 1,540.98 1,621.58 1,728.37 12–15 years . . . . . . . . . . . . . . . 2,264 1,892.79 303.75 1,432.46 1,488.17 1,541.90 1,651.57 1,896.80 2,121.18 2,228.47 2,284.43 2,356.98 16–19 years . . . . . . . . . . . . . . . 2,309 2,237.82 218.98 1,889.06 1,962.90 2,012.50 2,091.39 2,231.77 2,377.84 2,453.66 2,516.29 2,603.75 20–29 years . . . . . . . . . . . . . . . 1,530 2,287.04 213.77 1,948.13 2,024.37 2,075.21 2,149.05 2,280.41 2,416.98 2,500.66 2,557.67 2,648.46 30–39 years . . . . . . . . . . . . . . . 1,450 2,282.97 211.36 1,948.62 2,014.39 2,070.83 2,139.93 2,277.48 2,414.79 2,493.62 2,549.49 2,631.06 40–49 years . . . . . . . . . . . . . . . 1,549 2,302.50 192.79 1,985.67 2,060.67 2,113.18 2,175.26 2,293.65 2,430.76 2,497.68 2,543.60 2,617.29 50–59 years . . . . . . . . . . . . . . . 1,187 2,278.18 197.45 1,955.56 2,025.60 2,074.71 2,148.33 2,281.49 2,403.59 2,477.35 2,532.82 2,594.46 60–69 years . . . . . . . . . . . . . . . 1,350 2,266.41 200.14 1,933.90 2,014.00 2,061.57 2,138.66 2,267.98 2,400.50 2,470.28 2,512.87 2,585.41 70–79 years . . . . . . . . . . . . . . . 825 2,213.22 200.92 1,875.21 1,955.21 2,003.67 2,081.56 2,218.15 2,360.55 2,419.96 2,468.03 2,520.43 80 years and over . . . . . . . . . . . 501 2,128.00 195.85 1,789.13 1,877.64 1,925.61 2,003.98 2,129.79 2,256.90 2,324.73 2,373.93 2,457.52
20 years and over (age-adjusted) . . 8,392 2,272.49 . . . . . . . . . . . . . . . . . . . . . . . . . . . . . .
Mexican American. . . . . . . . . . . . . 8–11 years . . . . . . . . . . . . . . . . 468 1,395.64 176.15 1,184.93 1,217.75 1,236.19 1,276.95 1,352.63 1,485.23 1,576.48 1,653.67 1,742.76 12–15 years . . . . . . . . . . . . . . . 777 1,872.15 286.67 1,398.35 1,469.47 1,536.94 1,666.46 1,875.68 2,062.59 2,180.89 2,249.25 2,345.05 16–19 years . . . . . . . . . . . . . . . 783 2,146.98 211.21 1,836.46 1,897.34 1,946.98 2,003.62 2,129.24 2,278.38 2,345.66 2,421.15 2,510.61 20–29 years . . . . . . . . . . . . . . . 444 2,158.78 193.19 1,865.89 1,923.75 1,960.70 2,018.85 2,151.29 2,280.24 2,349.88 2,393.35 2,482.55 30–39 years . . . . . . . . . . . . . . . 337 2,142.19 173.94 1,868.94 1,920.90 1,970.95 2,021.59 2,143.35 2,248.70 2,309.67 2,353.58 2,433.20 40–49 years . . . . . . . . . . . . . . . 381 2,146.79 178.91 1,896.93 1,946.92 1,973.40 2,023.83 2,134.67 2,268.11 2,309.76 2,376.38 2,455.43 50–59 years . . . . . . . . . . . . . . . 174 2,136.82 157.42 1,897.05 1,947.00 1,980.99 2,027.10 2,142.37 2,238.26 2,302.23 2,343.35 2,397.99 60–69 years . . . . . . . . . . . . . . . 348 2,146.69 171.25 1,856.96 1,915.92 1,959.50 2,023.62 2,158.11 2,262.85 2,315.65 2,367.44 2,429.68 70–79 years . . . . . . . . . . . . . . . 164 *2,066.46 178.73 *1,746.73 *1,846.66 *1,909.72 *1,966.44 *2,088.26 *2,171.78 *2,219.11 *2,266.96 *2,326.63 80 years and over . . . . . . . . . . . 48 *2,017.35 188.41 *1,667.36 *1,772.87 *1,819.64 *1,888.39 *2,057.55 *2,107.33 *2,134.64 *2,235.24 †
20 years and over (age-adjusted) . . 1,896 2,133.77 . . . . . . . . . . . . . . . . . . . . . . . . . . . . . .
Non-Hispanic white 8–11 years . . . . . . . . . . . . . . . . 369 1,373.71 169.99 1,138.82 1,198.26 1,232.13 1,267.15 1,352.92 1,454.62 1,520.66 1,596.29 1,721.72 12–15 years . . . . . . . . . . . . . . . 578 1,897.87 308.84 1,429.73 1,490.68 1,542.32 1,644.79 1,907.26 2,137.30 2,240.27 2,290.53 2,364.08 16–19 years . . . . . . . . . . . . . . . 591 2,250.47 210.72 1,903.87 1,978.40 2,032.71 2,115.22 2,242.94 2,388.88 2,454.81 2,517.34 2,601.24 20–29 years . . . . . . . . . . . . . . . 617 2,306.68 198.59 1,989.07 2,069.15 2,114.91 2,182.76 2,294.16 2,427.54 2,506.18 2,552.57 2,641.03 30–39 years . . . . . . . . . . . . . . . 647 2,309.81 201.19 1,989.79 2,069.28 2,110.35 2,175.37 2,311.47 2,431.29 2,503.31 2,554.64 2,635.92 40–49 years . . . . . . . . . . . . . . . 700 2,328.63 180.43 2,044.40 2,112.44 2,153.07 2,210.90 2,320.05 2,445.69 2,510.14 2,555.21 2,633.08 50–59 years . . . . . . . . . . . . . . . 683 2,296.87 189.39 1,978.17 2,065.50 2,107.22 2,173.33 2,302.16 2,411.17 2,485.31 2,536.20 2,596.14 60–69 years . . . . . . . . . . . . . . . 623 2,287.35 188.23 1,987.47 2,049.98 2,093.03 2,167.40 2,286.87 2,416.06 2,481.13 2,520.44 2,590.39 70–79 years . . . . . . . . . . . . . . . 496 2,230.94 195.67 1,903.23 1,973.42 2,018.75 2,101.99 2,231.18 2,374.89 2,430.64 2,477.87 2,529.14 80 years and over . . . . . . . . . . . 398 2,131.25 188.80 1,809.65 1,887.31 1,935.35 2,007.95 2,131.59 2,257.99 2,321.89 2,365.85 2,442.56
20 years and over (age-adjusted) . . 4,164 2,294.13 . . . . . . . . . . . . . . . . . . . . . . . . . . . . . .
Non-Hispanic black 8–11 years . . . . . . . . . . . . . . . . 469 1,438.78 184.68 1,193.75 1,242.83 1,280.70 1,318.26 1,402.43 1,508.18 1,627.45 1,696.53 1,802.60 12–15 years . . . . . . . . . . . . . . . 745 1,954.93 307.33 1,470.70 1,543.36 1,598.46 1,742.44 1,958.98 2,161.57 2,263.58 2,327.58 2,438.23 16–19 years . . . . . . . . . . . . . . . 757 2,295.14 237.98 1,926.14 2,008.39 2,064.59 2,139.51 2,282.39 2,429.20 2,515.10 2,590.60 2,700.59 20–29 years . . . . . . . . . . . . . . . 325 2,373.82 227.71 2,057.28 2,110.80 2,146.94 2,212.31 2,365.25 2,505.90 2,587.34 2,649.40 2,761.00 30–39 years . . . . . . . . . . . . . . . 310 2,368.06 222.99 2,046.95 2,100.55 2,134.77 2,202.29 2,348.01 2,521.42 2,591.67 2,640.50 2,758.67 40–49 years . . . . . . . . . . . . . . . 366 2,332.08 195.45 2,020.70 2,091.64 2,131.17 2,201.15 2,322.41 2,459.21 2,524.59 2,572.22 2,653.83 50–59 years . . . . . . . . . . . . . . . 240 2,323.07 209.04 2,004.26 2,051.61 2,091.75 2,177.41 2,297.25 2,447.02 2,533.19 2,598.27 2,686.30 60–69 years . . . . . . . . . . . . . . . 303 2,306.83 189.05 2,014.58 2,066.50 2,127.58 2,188.86 2,296.17 2,419.75 2,512.34 2,557.02 2,612.24 70–79 years . . . . . . . . . . . . . . . 114 2,222.81 202.79 1,901.83 1,952.13 2,007.29 2,101.55 2,238.70 2,353.92 2,424.86 2,461.05 2,517.55 80 years and over . . . . . . . . . . . 36 *2,185.04 238.02 † *1,845.54 *1,926.68 *2,012.18 *2,180.16 *2,322.34 *2,464.67 † †
20 years and over (age-adjusted) . . 1,694 2,327.53 . . . . . . . . . . . . . . . . . . . . . . . . . . . . . .
See footnotes at end of table.

Page 8 [ Series 11, No. 253
Table 1. Total body bone area (cm2) of persons aged 8 years and over, by sex, race and ethnicity, and age: United States, 1999–2006—Con.
Percentile Sample Standard
Sex, race and ethnicity, and age size Mean deviation 5th 10th 15th 25th 50th 75th 85th 90th 95th
Female
All races and ethnicities 8–11 years . . . . . . . . . . . . . . . . 1,465 1,399.15 188.77 1,138.88 1,189.29 1,222.07 1,268.93 1,371.80 1,508.31 1,594.79 1,673.47 1,756.97 12–15 years . . . . . . . . . . . . . . . 2,318 1,794.10 191.98 1,474.44 1,546.28 1,597.82 1,665.83 1,799.67 1,921.50 1,988.26 2,038.11 2,104.28 16–19 years . . . . . . . . . . . . . . . 2,027 1,910.93 181.04 1,642.69 1,688.50 1,729.59 1,794.06 1,902.08 2,015.61 2,083.19 2,122.84 2,202.69 20–29 years . . . . . . . . . . . . . . . 1,378 1,939.51 168.01 1,666.17 1,728.72 1,764.17 1,822.55 1,934.27 2,049.31 2,112.01 2,153.98 2,223.64 30–39 years . . . . . . . . . . . . . . . 1,372 1,949.93 165.25 1,697.54 1,749.25 1,784.62 1,837.12 1,934.88 2,056.36 2,111.22 2,164.17 2,247.41 40–49 years . . . . . . . . . . . . . . . 1,570 1,955.81 166.15 1,690.92 1,744.32 1,783.81 1,840.68 1,949.81 2,052.94 2,127.44 2,169.05 2,227.48 50–59 years . . . . . . . . . . . . . . . 1,200 1,924.12 166.41 1,660.36 1,713.55 1,750.39 1,810.63 1,927.00 2,025.79 2,088.54 2,133.64 2,192.27 60–69 years . . . . . . . . . . . . . . . 1,419 1,897.05 177.87 1,610.87 1,669.05 1,719.43 1,774.38 1,900.83 2,014.14 2,070.98 2,113.83 2,177.12 70–79 years . . . . . . . . . . . . . . . 750 1,823.07 177.64 1,540.15 1,598.58 1,651.69 1,713.19 1,829.35 1,939.84 1,999.47 2,046.33 2,102.13 80 years and over . . . . . . . . . . . 594 1,711.52 184.73 1,398.80 1,459.84 1,524.61 1,589.75 1,719.63 1,832.80 1,886.33 1,942.48 2,009.52
20 years and over (age-adjusted) . . 8,283 1,918.24 . . . . . . . . . . . . . . . . . . . . . . . . . . . . . .
Mexican American 8–11 years . . . . . . . . . . . . . . . . 471 1,384.30 182.39 1,140.06 1,184.13 1,209.65 1,256.68 1,362.55 1,483.58 1,574.35 1,633.84 1,727.55 12–15 years . . . . . . . . . . . . . . . 821 1,767.35 176.21 1,481.38 1,546.05 1,584.36 1,653.07 1,763.67 1,892.26 1,938.73 1,978.80 2,053.41 16–19 years . . . . . . . . . . . . . . . 692 1,837.88 172.55 1,557.93 1,633.30 1,663.75 1,720.52 1,827.53 1,947.21 2,010.41 2,049.63 2,130.72 20–29 years . . . . . . . . . . . . . . . 364 1,873.05 152.32 1,620.86 1,662.82 1,711.03 1,785.10 1,866.41 1,963.29 2,028.47 2,066.58 2,134.81 30–39 years . . . . . . . . . . . . . . . 298 1,868.25 148.49 1,647.59 1,710.42 1,727.33 1,758.18 1,855.04 1,951.78 2,015.90 2,060.25 2,114.64 40–49 years . . . . . . . . . . . . . . . 372 1,876.80 143.95 1,638.87 1,697.03 1,735.32 1,776.41 1,877.07 1,970.90 2,021.33 2,056.53 2,137.35 50–59 years . . . . . . . . . . . . . . . 194 1,832.83 168.79 1,565.34 1,602.27 1,655.59 1,705.72 1,840.95 1,945.22 2,003.87 2,060.05 2,120.38 60–69 years . . . . . . . . . . . . . . . 375 1,775.99 166.46 1,492.68 1,556.42 1,613.82 1,661.19 1,780.84 1,894.23 1,945.38 1,973.04 2,016.97 70–79 years . . . . . . . . . . . . . . . 154 *1,708.49 182.10 *1,373.18 *1,491.34 *1,533.76 *1,615.47 *1,712.54 *1,841.90 *1,877.55 *1,919.26 *1,979.56 80 years and over . . . . . . . . . . . 47 *1,579.75 189.14 † *1,320.68 *1,371.02 *1,464.55 *1,578.15 *1,698.89 *1,768.29 *1,798.29 *1,842.83
20 years and over (age-adjusted) . . 1,804 1,829.35 . . . . . . . . . . . . . . . . . . . . . . . . . . . . . .
Non-Hispanic white 8–11 years . . . . . . . . . . . . . . . . 383 1,389.65 181.88 1,131.88 1,176.35 1,211.24 1,262.36 1,368.18 1,491.49 1,575.12 1,651.94 1,727.12 12–15 years . . . . . . . . . . . . . . . 576 1,785.21 190.62 1,460.87 1,529.28 1,584.72 1,656.10 1,795.99 1,919.95 1,978.65 2,024.09 2,075.38 16–19 years . . . . . . . . . . . . . . . 543 1,920.68 170.72 1,655.02 1,716.23 1,753.13 1,820.04 1,913.78 2,018.53 2,081.02 2,111.83 2,181.68 20–29 years . . . . . . . . . . . . . . . 583 1,950.77 158.19 1,684.72 1,745.39 1,779.90 1,837.10 1,950.65 2,055.80 2,114.21 2,152.38 2,208.92 30–39 years . . . . . . . . . . . . . . . 612 1,956.54 158.14 1,710.82 1,770.12 1,802.05 1,846.14 1,941.13 2,057.29 2,105.19 2,158.74 2,240.72 40–49 years . . . . . . . . . . . . . . . 668 1,964.22 163.06 1,707.76 1,759.67 1,792.63 1,852.99 1,962.70 2,063.39 2,135.27 2,174.56 2,231.86 50–59 years . . . . . . . . . . . . . . . 639 1,934.56 153.80 1,693.65 1,742.63 1,769.97 1,827.43 1,937.26 2,025.18 2,081.46 2,128.56 2,192.08 60–69 years . . . . . . . . . . . . . . . 644 1,905.06 167.76 1,629.04 1,693.77 1,738.79 1,794.47 1,909.92 2,014.54 2,066.93 2,107.56 2,160.15 70–79 years . . . . . . . . . . . . . . . 429 1,831.36 170.43 1,561.34 1,625.04 1,671.38 1,727.04 1,838.66 1,942.53 2,000.81 2,046.06 2,095.81 80 years and over . . . . . . . . . . . 457 1,718.40 176.26 1,419.23 1,474.21 1,544.98 1,604.24 1,725.07 1,831.80 1,882.19 1,937.59 2,006.42
20 years and over (age-adjusted) . . 4,032 1,926.98 . . . . . . . . . . . . . . . . . . . . . . . . . . . . . .
Non-Hispanic black 8–11 years . . . . . . . . . . . . . . . . 490 1,450.50 214.81 1,161.24 1,219.19 1,252.77 1,298.69 1,405.88 1,570.48 1,703.87 1,755.59 1,826.40 12–15 years . . . . . . . . . . . . . . . 737 1,880.72 197.93 1,566.58 1,643.36 1,686.51 1,745.76 1,866.15 2,009.42 2,090.08 2,137.36 2,218.17 16–19 years . . . . . . . . . . . . . . . 609 1,974.71 201.98 1,676.63 1,741.39 1,779.23 1,840.38 1,954.52 2,090.93 2,167.70 2,222.76 2,313.13 20–29 years . . . . . . . . . . . . . . . 297 1,999.63 176.48 1,713.90 1,794.59 1,827.03 1,883.97 1,989.32 2,099.49 2,186.38 2,241.87 2,295.73 30–39 years . . . . . . . . . . . . . . . 333 2,030.33 176.05 1,759.00 1,812.71 1,849.93 1,898.97 2,022.93 2,141.46 2,221.03 2,265.37 2,325.10 40–49 years . . . . . . . . . . . . . . . 398 2,017.41 163.80 1,761.81 1,822.11 1,853.30 1,912.52 2,007.33 2,112.49 2,173.22 2,217.24 2,298.78 50–59 years . . . . . . . . . . . . . . . 250 1,986.15 171.03 1,672.16 1,774.00 1,812.26 1,878.01 1,980.00 2,101.58 2,147.28 2,178.28 2,282.45 60–69 years . . . . . . . . . . . . . . . 306 1,991.13 180.95 1,682.57 1,759.26 1,802.02 1,875.30 1,992.25 2,121.06 2,177.03 2,220.57 2,258.70 70–79 years . . . . . . . . . . . . . . . 124 1,895.89 198.61 1,564.76 1,634.37 1,680.21 1,775.78 1,888.96 2,021.20 2,087.45 2,146.03 † 80 years and over . . . . . . . . . . . 58 *1,794.54 183.34 *1,465.86 *1,535.90 *1,578.61 *1,677.36 *1,806.94 *1,900.00 *1,989.72 *2,016.37 *2,043.34
20 years and over (age-adjusted) . . 1,766 1,988.89 . . . . . . . . . . . . . . . . . . . . . . . . . . . . . .
. . . Category not applicable.
* Figure does not meet standards of reliability or precision; relative standard error (standard error divided by estimate times 100) is 30%–39% or estimate is based on less than 12 degrees of freedom.
† Standard error not calculated by SUDAAN software.
NOTE: cm2 is centimeter squared.
SOURCE: National Health and Nutrition Examination Survey, 1999–2006.

Series 11, No. 253 [ Page 9
Table 2. Total body bone mineral content (g) of persons aged 8 years and over, by sex, race and ethnicity, and age: United States, 1999–2006
Percentile Sample Standard
Sex, race and ethnicity, and age size Mean deviation 5th 10th 15th 25th 50th 75th 85th 90th 95th
Male
All races and ethnicities 8–11 years . . . . . . . . . . . . . . . . 1,421 1,177.39 226.15 874.35 927.12 964.62 1,018.96 1,144.73 1,296.09 1,392.22 1,461.56 1,627.12 12–15 years . . . . . . . . . . . . . . . 2,264 1,921.44 495.21 1,223.83 1,310.07 1,380.46 1,525.23 1,885.99 2,260.40 2,470.32 2,591.59 2,757.37 16–19 years . . . . . . . . . . . . . . . 2,309 2,641.98 446.38 1,962.99 2,094.12 2,187.43 2,330.34 2,603.82 2,924.40 3,091.09 3,206.33 3,362.10 20–29 years . . . . . . . . . . . . . . . 1,530 2,789.47 461.76 2,102.17 2,247.12 2,333.01 2,497.93 2,744.04 3,038.82 3,228.09 3,389.10 3,579.33 30–39 years . . . . . . . . . . . . . . . 1,450 2,781.15 461.88 2,115.61 2,243.64 2,318.69 2,468.37 2,742.78 3,043.04 3,223.94 3,368.59 3,576.54 40–49 years . . . . . . . . . . . . . . . 1,549 2,787.27 426.08 2,133.19 2,268.93 2,350.15 2,490.34 2,769.83 3,035.73 3,211.56 3,345.46 3,514.63 50–59 years . . . . . . . . . . . . . . . 1,187 2,707.98 439.69 2,013.71 2,157.32 2,262.12 2,411.43 2,696.20 2,965.82 3,113.81 3,254.16 3,468.84 60–69 years . . . . . . . . . . . . . . . 1,350 2,662.58 438.41 1,984.54 2,123.17 2,222.15 2,359.51 2,651.88 2,922.96 3,138.95 3,236.15 3,401.72 70–79 years . . . . . . . . . . . . . . . 825 2,521.47 417.60 1,876.94 2,022.24 2,091.44 2,207.09 2,513.03 2,788.74 2,968.88 3,076.64 3,198.62 80 years and over . . . . . . . . . . . 501 2,374.86 420.70 1,730.53 1,864.00 1,963.63 2,092.49 2,338.02 2,637.50 2,826.06 2,917.57 3,097.50
20 years and over (age-adjusted) . . 8,392 2,720.04 . . . . . . . . . . . . . . . . . . . . . . . . . . . . . .
Mexican American 8–11 years . . . . . . . . . . . . . . . . 468 1,172.22 233.67 857.77 907.18 954.57 1,005.70 1,134.42 1,291.78 1,415.76 1,510.18 1,656.60 12–15 years . . . . . . . . . . . . . . . 777 1,890.02 489.10 1,162.13 1,273.49 1,371.26 1,528.46 1,850.30 2,191.18 2,403.71 2,524.11 2,775.35 16–19 years . . . . . . . . . . . . . . . 783 2,465.13 418.31 1,867.08 1,979.64 2,058.73 2,196.82 2,417.19 2,707.24 2,890.31 2,998.12 3,163.75 20–29 years . . . . . . . . . . . . . . . 444 2,542.87 385.20 1,971.49 2,078.90 2,140.12 2,258.83 2,507.68 2,761.33 2,914.13 3,057.66 3,222.07 30–39 years . . . . . . . . . . . . . . . 337 2,499.32 353.78 1,993.99 2,099.77 2,162.97 2,255.33 2,478.13 2,695.15 2,816.82 2,916.32 3,163.67 40–49 years . . . . . . . . . . . . . . . 381 2,489.46 377.69 1,948.66 2,055.98 2,121.28 2,230.40 2,454.43 2,703.75 2,870.77 2,956.97 3,182.57 50–59 years . . . . . . . . . . . . . . . 174 2,451.14 365.28 1,858.72 1,978.81 2,053.93 2,166.71 2,436.76 2,713.66 2,863.35 2,924.85 3,054.61 60–69 years . . . . . . . . . . . . . . . 348 2,447.83 363.81 1,888.15 1,983.84 2,064.81 2,157.46 2,451.78 2,675.93 2,808.04 2,898.75 3,024.01 70–79 years . . . . . . . . . . . . . . . 164 *2,297.08 361.48 *1,696.37 *1,804.62 *1,910.27 *2,049.93 *2,318.77 *2,515.92 *2,644.70 *2,764.67 *2,816.48 80 years and over . . . . . . . . . . . 48 *2,179.87 361.63 *1,577.82 *1,733.47 *1,840.98 *1,964.76 *2,139.62 *2,315.54 *2,535.78 *2,706.36 †
20 years and over (age-adjusted) . . 1,896 2,460.80 . . . . . . . . . . . . . . . . . . . . . . . . . . . . . .
Non-Hispanic white 8–11 years . . . . . . . . . . . . . . . . 369 1,160.63 217.87 865.72 923.08 959.56 1,008.70 1,132.71 1,275.79 1,352.05 1,439.01 1,611.25 12–15 years . . . . . . . . . . . . . . . 578 1,916.45 494.95 1,225.22 1,308.66 1,370.44 1,506.10 1,887.87 2,265.20 2,475.86 2,593.26 2,755.88 16–19 years . . . . . . . . . . . . . . . 591 2,647.47 421.49 1,967.04 2,109.48 2,206.59 2,361.70 2,630.68 2,920.67 3,074.09 3,191.44 3,324.29 20–29 years . . . . . . . . . . . . . . . 617 2,803.06 424.17 2,189.02 2,292.18 2,384.14 2,541.55 2,765.14 3,023.79 3,202.88 3,364.55 3,542.71 30–39 years . . . . . . . . . . . . . . . 647 2,815.95 439.77 2,167.57 2,290.34 2,380.77 2,520.49 2,777.38 3,056.66 3,234.12 3,353.04 3,564.69 40–49 years . . . . . . . . . . . . . . . 700 2,819.98 401.25 2,209.03 2,331.28 2,394.29 2,562.08 2,799.33 3,051.61 3,217.41 3,356.35 3,513.50 50–59 years . . . . . . . . . . . . . . . 683 2,725.42 420.65 2,077.46 2,201.33 2,294.50 2,446.24 2,715.01 2,968.86 3,106.56 3,247.77 3,452.92 60–69 years . . . . . . . . . . . . . . . 623 2,681.59 422.48 2,012.10 2,165.80 2,256.20 2,398.55 2,664.71 2,927.23 3,143.19 3,236.97 3,402.30 70–79 years . . . . . . . . . . . . . . . 496 2,544.65 414.39 1,918.28 2,032.65 2,101.54 2,216.31 2,548.30 2,803.69 2,991.92 3,091.21 3,210.59 80 years and over . . . . . . . . . . . 398 2,372.01 403.99 1,735.79 1,873.26 1,975.14 2,094.26 2,338.20 2,632.82 2,818.94 2,891.89 3,054.59
20 years and over (age-adjusted) . . 4,164 2,743.45 . . . . . . . . . . . . . . . . . . . . . . . . . . . . . .
Non-Hispanic black 8–11 years . . . . . . . . . . . . . . . . 469 1,280.06 247.85 939.12 1,000.90 1,043.15 1,116.30 1,246.16 1,409.07 1,503.41 1,585.11 1,719.65 12–15 years . . . . . . . . . . . . . . . 745 2,067.00 515.18 1,338.44 1,445.70 1,513.80 1,656.69 2,032.96 2,401.61 2,609.01 2,718.48 2,906.94 16–19 years . . . . . . . . . . . . . . . 757 2,846.38 506.46 2,127.89 2,255.38 2,364.12 2,517.75 2,789.55 3,110.88 3,309.83 3,472.70 3,672.25 20–29 years . . . . . . . . . . . . . . . 325 3,111.40 528.09 2,379.32 2,526.54 2,608.26 2,752.97 3,054.93 3,378.98 3,559.52 3,735.18 4,097.73 30–39 years . . . . . . . . . . . . . . . 310 3,075.01 504.72 2,361.70 2,492.85 2,579.43 2,707.56 3,037.99 3,376.50 3,565.64 3,692.00 4,002.88 40–49 years . . . . . . . . . . . . . . . 366 2,948.59 487.56 2,229.19 2,359.49 2,460.03 2,640.28 2,905.84 3,235.43 3,393.50 3,567.98 3,788.76 50–59 years . . . . . . . . . . . . . . . 240 2,932.53 485.95 2,194.48 2,337.71 2,437.87 2,576.01 2,901.76 3,234.80 3,411.10 3,573.94 3,736.65 60–69 years . . . . . . . . . . . . . . . 303 2,870.37 421.73 2,218.90 2,342.62 2,453.74 2,620.15 2,838.42 3,139.00 3,308.66 3,395.65 3,586.19 70–79 years . . . . . . . . . . . . . . . 114 2,608.13 428.40 1,925.41 2,077.33 2,174.71 2,301.25 2,596.09 2,924.69 3,047.34 3,121.43 3,264.66 80 years and over . . . . . . . . . . . 36 *2,592.35 544.18 † *1,908.17 *2,034.60 *2,189.83 *2,518.75 *2,821.76 *3,097.58 *3,305.14 †
20 years and over (age-adjusted) . . 1,694 2,950.18 . . . . . . . . . . . . . . . . . . . . . . . . . . . . . .
See footnotes at end of table.

Page 10 [ Series 11, No. 253
Table 2. Total body bone mineral content (g) of persons aged 8 years and over, by sex, race and ethnicity, and age: United States, 1999–2006—Con.
Percentile Sample Standard
Sex, race and ethnicity, and age size Mean deviation 5th 10th 15th 25th 50th 75th 85th 90th 95th
Female
All races and ethnicities 8–11 years . . . . . . . . . . . . . . . . 1,465 1,179.36 270.66 817.09 873.27 909.11 979.45 1,137.84 1,325.93 1,468.32 1,542.12 1,679.05 12–15 years . . . . . . . . . . . . . . . 2,318 1,829.51 334.85 1,305.33 1,413.91 1,484.98 1,587.00 1,822.24 2,048.43 2,171.28 2,264.21 2,398.36 16–19 years . . . . . . . . . . . . . . . 2,027 2,095.41 320.77 1,593.44 1,703.84 1,771.60 1,886.47 2,073.46 2,300.92 2,412.04 2,491.11 2,669.16 20–29 years . . . . . . . . . . . . . . . 1,378 2,177.48 307.49 1,704.49 1,792.50 1,855.52 1,961.07 2,163.75 2,367.99 2,487.38 2,571.77 2,691.63 30–39 years . . . . . . . . . . . . . . . 1,372 2,227.18 319.44 1,737.95 1,832.22 1,909.86 1,999.38 2,200.58 2,431.50 2,559.11 2,644.44 2,780.62 40–49 years . . . . . . . . . . . . . . . 1,570 2,223.11 328.86 1,718.65 1,830.39 1,898.92 1,999.02 2,188.48 2,420.00 2,559.08 2,650.01 2,811.85 50–59 years . . . . . . . . . . . . . . . 1,200 2,106.70 329.99 1,587.14 1,699.09 1,768.70 1,880.75 2,097.14 2,312.35 2,453.39 2,545.80 2,665.41 60–69 years . . . . . . . . . . . . . . . 1,419 1,984.01 343.74 1,456.96 1,562.55 1,631.86 1,744.02 1,979.67 2,197.72 2,325.45 2,415.80 2,550.93 70–79 years . . . . . . . . . . . . . . . 750 1,794.42 321.86 1,299.67 1,419.08 1,469.93 1,576.76 1,775.59 1,992.06 2,114.01 2,203.21 2,373.30 80 years and over . . . . . . . . . . . 594 1,596.55 318.42 1,081.32 1,194.09 1,271.92 1,375.97 1,570.65 1,811.14 1,913.71 2,007.26 2,122.05
20 years and over (age-adjusted) . . 8,283 2,108.32 . . . . . . . . . . . . . . . . . . . . . . . . . . . . . .
Mexican American 8–11 years . . . . . . . . . . . . . . . . 471 1,148.82 267.87 797.74 838.49 879.85 952.25 1,105.83 1,298.38 1,428.44 1,513.06 1,669.11 12–15 years . . . . . . . . . . . . . . . 821 1,788.78 305.57 1,297.58 1,416.33 1,484.19 1,588.24 1,789.57 1,988.73 2,079.27 2,153.27 2,293.59 16–19 years . . . . . . . . . . . . . . . 692 1,982.35 302.43 1,542.39 1,609.28 1,673.79 1,777.18 1,974.37 2,153.15 2,258.95 2,353.98 2,495.86 20–29 years . . . . . . . . . . . . . . . 364 2,072.16 282.61 1,615.40 1,725.95 1,776.37 1,866.93 2,050.09 2,259.21 2,379.35 2,456.14 2,577.74 30–39 years . . . . . . . . . . . . . . . 298 2,101.06 294.95 1,685.91 1,765.37 1,812.85 1,906.12 2,082.11 2,260.22 2,366.41 2,474.45 2,626.91 40–49 years . . . . . . . . . . . . . . . 372 2,110.27 280.54 1,661.95 1,765.96 1,824.86 1,946.88 2,089.35 2,306.24 2,405.12 2,461.86 2,566.11 50–59 years . . . . . . . . . . . . . . . 194 1,953.47 358.51 1,393.40 1,487.30 1,556.86 1,698.95 1,948.45 2,191.24 2,305.26 2,358.49 2,457.12 60–69 years . . . . . . . . . . . . . . . 375 1,783.27 324.32 1,251.97 1,359.98 1,446.30 1,543.20 1,780.00 1,992.46 2,097.65 2,231.46 2,334.03 70–79 years . . . . . . . . . . . . . . . 154 *1,614.39 313.23 *1,078.70 *1,203.86 *1,290.21 *1,450.73 *1,616.50 *1,782.70 *1,921.38 *1,991.30 *2,090.90 80 years and over . . . . . . . . . . . 47 *1,412.87 295.88 † *1,104.03 *1,149.45 *1,235.33 *1,373.01 *1,599.04 *1,712.40 *1,736.62 †
20 years and over (age-adjusted) . . 1,804 1,969.89 . . . . . . . . . . . . . . . . . . . . . . . . . . . . . .
Non-Hispanic white 8–11 years . . . . . . . . . . . . . . . . 383 1,162.18 254.76 808.09 869.61 904.08 972.86 1,133.02 1,301.84 1,439.96 1,517.38 1,605.77 12–15 years . . . . . . . . . . . . . . . 576 1,803.14 326.97 1,291.35 1,383.50 1,458.53 1,562.66 1,800.38 2,026.76 2,151.00 2,237.14 2,347.60 16–19 years . . . . . . . . . . . . . . . 543 2,096.82 300.47 1,603.30 1,718.12 1,800.36 1,901.55 2,081.46 2,293.54 2,396.02 2,459.79 2,649.33 20–29 years . . . . . . . . . . . . . . . 583 2,170.16 281.20 1,721.85 1,808.30 1,861.05 1,964.78 2,162.68 2,354.05 2,463.24 2,530.11 2,630.62 30–39 years . . . . . . . . . . . . . . . 612 2,220.34 301.31 1,745.65 1,846.13 1,925.75 2,003.05 2,204.17 2,425.51 2,529.28 2,609.27 2,744.89 40–49 years . . . . . . . . . . . . . . . 668 2,222.34 319.86 1,733.20 1,839.72 1,907.98 1,997.89 2,191.94 2,416.75 2,552.62 2,637.23 2,793.82 50–59 years . . . . . . . . . . . . . . . 639 2,119.14 305.82 1,653.70 1,740.43 1,803.52 1,910.31 2,105.57 2,307.60 2,444.76 2,529.04 2,639.69 60–69 years . . . . . . . . . . . . . . . 644 1,990.90 329.15 1,477.54 1,576.88 1,650.90 1,760.00 1,997.90 2,193.40 2,308.29 2,397.51 2,531.25 70–79 years . . . . . . . . . . . . . . . 429 1,799.11 313.74 1,323.29 1,431.43 1,478.11 1,589.51 1,786.61 1,989.29 2,109.59 2,186.83 2,364.67 80 years and over . . . . . . . . . . . 457 1,600.06 307.51 1,082.40 1,207.89 1,288.26 1,390.82 1,576.04 1,810.51 1,898.41 1,995.42 2,110.25
20 years and over (age-adjusted) . . 4,032 2,108.55 . . . . . . . . . . . . . . . . . . . . . . . . . . . . . .
Non-Hispanic black 8–11 years . . . . . . . . . . . . . . . . 490 1,278.36 309.48 876.57 936.12 981.12 1,062.97 1,206.69 1,454.32 1,594.31 1,687.42 1,831.14 12–15 years . . . . . . . . . . . . . . . 737 2,027.48 355.30 1,475.00 1,584.49 1,665.43 1,784.53 2,004.71 2,258.19 2,419.50 2,526.48 2,619.63 16–19 years . . . . . . . . . . . . . . . 609 2,285.89 355.63 1,757.08 1,866.22 1,923.22 2,024.48 2,264.04 2,495.91 2,633.21 2,727.24 2,906.05 20–29 years . . . . . . . . . . . . . . . 297 2,379.67 338.09 1,853.29 1,965.88 2,022.09 2,160.13 2,354.25 2,592.61 2,731.23 2,815.89 2,972.27 30–39 years . . . . . . . . . . . . . . . 333 2,437.26 343.48 1,925.37 2,017.17 2,089.64 2,185.15 2,401.34 2,665.83 2,779.77 2,869.86 2,984.25 40–49 years . . . . . . . . . . . . . . . 398 2,411.55 339.68 1,910.21 2,012.10 2,072.72 2,172.69 2,380.83 2,623.16 2,735.39 2,834.68 2,981.82 50–59 years . . . . . . . . . . . . . . . 250 2,265.57 357.01 1,688.71 1,811.04 1,903.94 2,019.63 2,266.18 2,489.01 2,631.71 2,711.34 2,877.79 60–69 years . . . . . . . . . . . . . . . 306 2,191.75 354.44 1,602.82 1,782.48 1,830.92 1,932.43 2,180.87 2,413.99 2,550.80 2,642.77 2,796.89 70–79 years . . . . . . . . . . . . . . . 124 1,972.93 350.67 1,417.60 1,524.37 1,598.41 1,711.24 1,975.13 2,194.36 2,322.06 2,384.22 † 80 years and over . . . . . . . . . . . 58 *1,770.19 366.47 *1,190.85 *1,311.85 *1,375.00 *1,497.22 *1,751.47 *2,015.90 *2,153.62 *2,232.55 *2,330.85
20 years and over (age-adjusted) . . 1,766 2,299.75 . . . . . . . . . . . . . . . . . . . . . . . . . . . . . .
. . . Category not applicable.
* Figure does not meet standards of reliability or precision; relative standard error (standard error divided by estimate times 100) is 30%–39% or estimate is based on less than 12 degrees of freedom.
† Standard error not calculated by SUDAAN software.
NOTE: g is grams.
SOURCE: National Health and Nutrition Examination Survey, 1999–2006.

Series 11, No. 253 [ Page 11
Table 3. Total body bone mineral density (g/cm2) of persons aged 8 years and over, by sex, race and ethnicity, and age: United States, 1999–2006
Percentile Sample Standard
Sex, race and ethnicity, and age size Mean deviation 5th 10th 15th 25th 50th 75th 85th 90th 95th
Male
All races and ethnicities 8–11 years . . . . . . . . . . . . . . . . 1,421 0.844 0.072 0.736 0.753 0.770 0.792 0.842 0.890 0.917 0.938 0.966 12–15 years . . . . . . . . . . . . . . . 2,264 1.001 0.114 0.830 0.862 0.881 0.920 0.988 1.074 1.124 1.153 1.198 16–19 years . . . . . . . . . . . . . . . 2,309 1.174 0.110 1.003 1.034 1.060 1.097 1.171 1.245 1.286 1.315 1.358 20–29 years . . . . . . . . . . . . . . . 1,530 1.213 0.109 1.045 1.082 1.101 1.142 1.202 1.280 1.324 1.356 1.403 30–39 years . . . . . . . . . . . . . . . 1,450 1.212 0.110 1.045 1.078 1.095 1.133 1.204 1.279 1.325 1.354 1.406 40–49 years . . . . . . . . . . . . . . . 1,549 1.205 0.108 1.033 1.073 1.094 1.131 1.200 1.277 1.312 1.338 1.381 50–59 years . . . . . . . . . . . . . . . 1,187 1.183 0.115 1.001 1.033 1.060 1.106 1.182 1.250 1.301 1.328 1.375 60–69 years . . . . . . . . . . . . . . . 1,350 1.169 0.117 0.980 1.026 1.050 1.088 1.162 1.241 1.291 1.329 1.369 70–79 years . . . . . . . . . . . . . . . 825 1.133 0.114 0.952 0.990 1.014 1.054 1.131 1.211 1.252 1.277 1.323 80 years and over . . . . . . . . . . . 501 1.109 0.119 0.918 0.964 0.993 1.025 1.108 1.181 1.229 1.263 1.312
20 years and over (age-adjusted) . . 8,392 1.190 . . . . . . . . . . . . . . . . . . . . . . . . . . . . . .
Mexican American 8–11 years . . . . . . . . . . . . . . . . 468 0.833 0.075 0.713 0.739 0.757 0.781 0.830 0.879 0.914 0.936 0.960 12–15 years . . . . . . . . . . . . . . . 777 0.995 0.120 0.817 0.852 0.872 0.906 0.983 1.067 1.118 1.152 1.221 16–19 years . . . . . . . . . . . . . . . 783 1.142 0.103 0.979 1.009 1.037 1.073 1.135 1.207 1.246 1.279 1.327 20–29 years . . . . . . . . . . . . . . . 444 1.173 0.096 1.021 1.056 1.073 1.107 1.170 1.226 1.264 1.298 1.352 30–39 years . . . . . . . . . . . . . . . 337 1.162 0.094 1.015 1.051 1.071 1.096 1.153 1.221 1.256 1.285 1.333 40–49 years . . . . . . . . . . . . . . . 381 1.155 0.101 1.001 1.024 1.050 1.089 1.151 1.215 1.253 1.289 1.326 50–59 years . . . . . . . . . . . . . . . 174 1.142 0.109 0.947 0.994 1.021 1.061 1.142 1.218 1.248 1.291 1.320 60–69 years . . . . . . . . . . . . . . . 348 1.136 0.104 0.973 1.004 1.024 1.059 1.137 1.195 1.238 1.259 1.298 70–79 years . . . . . . . . . . . . . . . 164 *1.106 0.107 *0.902 *0.950 *0.983 *1.027 *1.125 *1.184 *1.211 *1.226 *1.250 80 years and over . . . . . . . . . . . 48 *1.075 0.098 *0.926 *0.932 *0.967 *1.011 *1.069 *1.123 *1.186 *1.222 *1.263 20 years and over (age-adjusted) . . 1,896 1.148 . . . . . . . . . . . . . . . . . . . . . . . . . . . . . .
Non-Hispanic white 8–11 years . . . . . . . . . . . . . . . . 369 0.839 0.069 0.737 0.752 0.769 0.791 0.836 0.883 0.909 0.927 0.956 12–15 years . . . . . . . . . . . . . . . 578 0.995 0.111 0.830 0.860 0.878 0.917 0.980 1.065 1.119 1.145 1.194 16–19 years . . . . . . . . . . . . . . . 591 1.171 0.107 0.997 1.034 1.058 1.095 1.172 1.241 1.277 1.305 1.344 20–29 years . . . . . . . . . . . . . . . 617 1.210 0.099 1.052 1.086 1.105 1.145 1.199 1.271 1.317 1.337 1.378 30–39 years . . . . . . . . . . . . . . . 647 1.213 0.106 1.048 1.083 1.104 1.141 1.207 1.278 1.323 1.348 1.388 40–49 years . . . . . . . . . . . . . . . 700 1.206 0.102 1.041 1.078 1.101 1.137 1.203 1.274 1.308 1.336 1.373 50–59 years . . . . . . . . . . . . . . . 683 1.181 0.110 1.006 1.034 1.063 1.109 1.182 1.245 1.291 1.320 1.364 60–69 years . . . . . . . . . . . . . . . 623 1.167 0.114 0.986 1.028 1.052 1.088 1.159 1.235 1.283 1.321 1.365 70–79 years . . . . . . . . . . . . . . . 496 1.135 0.114 0.955 0.989 1.013 1.053 1.132 1.214 1.255 1.281 1.325 80 years and over . . . . . . . . . . . 398 1.107 0.115 0.918 0.966 0.995 1.023 1.107 1.177 1.220 1.255 1.307
20 years and over (age-adjusted) . . 4,164 1.190 . . . . . . . . . . . . . . . . . . . . . . . . . . . . . .
Non-Hispanic black 8–11 years . . . . . . . . . . . . . . . . 469 0.884 0.077 0.760 0.785 0.806 0.834 0.881 0.940 0.962 0.975 0.999 12–15 years . . . . . . . . . . . . . . . 745 1.044 0.118 0.871 0.903 0.925 0.955 1.034 1.120 1.162 1.194 1.260 16–19 years . . . . . . . . . . . . . . . 757 1.233 0.116 1.044 1.094 1.118 1.154 1.231 1.306 1.347 1.373 1.425 20–29 years . . . . . . . . . . . . . . . 325 1.304 0.120 1.111 1.165 1.183 1.216 1.292 1.372 1.422 1.459 1.513 30–39 years . . . . . . . . . . . . . . . 310 1.292 0.114 1.099 1.150 1.177 1.211 1.286 1.363 1.410 1.434 1.481 40–49 years . . . . . . . . . . . . . . . 366 1.258 0.131 1.061 1.096 1.128 1.169 1.250 1.334 1.380 1.419 1.475 50–59 years . . . . . . . . . . . . . . . 240 1.256 0.122 1.046 1.108 1.133 1.169 1.250 1.335 1.379 1.405 1.454 60–69 years . . . . . . . . . . . . . . . 303 1.240 0.115 1.060 1.095 1.119 1.160 1.231 1.324 1.356 1.388 1.426 70–79 years . . . . . . . . . . . . . . . 114 1.167 0.119 0.967 1.014 1.044 1.085 1.166 1.245 1.293 1.315 1.371 80 years and over . . . . . . . . . . . 36 *1.178 0.156 † *0.979 *1.028 *1.084 *1.167 *1.263 *1.285 *1.330 †
20 years and over (age-adjusted) . . 1,694 1.260 . . . . . . . . . . . . . . . . . . . . . . . . . . . . . .
See footnotes at end of table.

Page 12 [ Series 11, No. 253
Table 3. Total body bone mineral density (g/cm2) of persons aged 8 years and over, by sex, race and ethnicity, and age: United States, 1999–2006—Con.
Percentile Sample Standard
Sex, race and ethnicity, and age size Mean deviation 5th 10th 15th 25th 50th 75th 85th 90th 95th
Female
All races and ethnicities 8–11 years . . . . . . . . . . . . . . . . 1,465 0.834 0.087 0.698 0.723 0.740 0.771 0.830 0.890 0.924 0.946 0.981 12–15 years . . . . . . . . . . . . . . . 2,318 1.012 0.095 0.851 0.887 0.915 0.949 1.010 1.073 1.111 1.138 1.169 16–19 years . . . . . . . . . . . . . . . 2,027 1.092 0.090 0.945 0.981 1.002 1.033 1.088 1.145 1.183 1.211 1.252 20–29 years . . . . . . . . . . . . . . . 1,378 1.119 0.087 0.983 1.010 1.029 1.060 1.114 1.171 1.207 1.230 1.268 30–39 years . . . . . . . . . . . . . . . 1,372 1.138 0.094 0.989 1.021 1.041 1.075 1.138 1.195 1.232 1.261 1.292 40–49 years . . . . . . . . . . . . . . . 1,570 1.132 0.099 0.973 1.011 1.034 1.068 1.129 1.187 1.232 1.261 1.304 50–59 years . . . . . . . . . . . . . . . 1,200 1.090 0.105 0.920 0.956 0.982 1.020 1.086 1.160 1.199 1.222 1.266 60–69 years . . . . . . . . . . . . . . . 1,419 1.040 0.110 0.869 0.899 0.926 0.966 1.035 1.115 1.154 1.184 1.226 70–79 years . . . . . . . . . . . . . . . 750 0.978 0.105 0.811 0.846 0.872 0.903 0.970 1.050 1.098 1.130 1.166 80 years and over . . . . . . . . . . . 594 0.925 0.107 0.757 0.797 0.815 0.848 0.921 0.999 1.035 1.059 1.101
20 years and over (age-adjusted) . . 8,283 1.093 . . . . . . . . . . . . . . . . . . . . . . . . . . . . . .
Mexican American 8–11 years . . . . . . . . . . . . . . . . 471 0.820 0.091 0.684 0.702 0.721 0.757 0.812 0.878 0.918 0.947 0.980 12–15 years . . . . . . . . . . . . . . . 821 1.006 0.092 0.849 0.889 0.917 0.949 1.006 1.065 1.092 1.121 1.161 16–19 years . . . . . . . . . . . . . . . 692 1.074 0.089 0.933 0.962 0.984 1.015 1.069 1.126 1.158 1.182 1.226 20–29 years . . . . . . . . . . . . . . . 364 1.102 0.084 0.976 1.001 1.016 1.039 1.094 1.155 1.195 1.220 1.251 30–39 years . . . . . . . . . . . . . . . 298 1.121 0.097 0.984 1.015 1.028 1.055 1.116 1.177 1.210 1.236 1.277 40–49 years . . . . . . . . . . . . . . . 372 1.121 0.092 0.972 1.001 1.024 1.057 1.120 1.181 1.212 1.236 1.265 50–59 years . . . . . . . . . . . . . . . 194 1.059 0.125 0.875 0.906 0.930 0.967 1.055 1.142 1.175 1.198 1.220 60–69 years . . . . . . . . . . . . . . . 375 0.997 0.113 0.821 0.848 0.876 0.911 0.996 1.072 1.106 1.139 1.196 70–79 years . . . . . . . . . . . . . . . 154 *0.937 0.105 *0.765 *0.800 *0.827 *0.867 *0.940 *1.002 *1.043 *1.061 *1.099 80 years and over . . . . . . . . . . . 47 *0.885 0.098 † *0.769 *0.798 *0.822 *0.870 *0.935 *0.982 *1.027 †
20 years and over (age-adjusted) . . 1,804 1.069 . . . . . . . . . . . . . . . . . . . . . . . . . . . . . .
Non-Hispanic white 8–11 years . . . . . . . . . . . . . . . . 383 0.828 0.082 0.698 0.721 0.739 0.768 0.824 0.882 0.913 0.932 0.958 12–15 years . . . . . . . . . . . . . . . 576 1.003 0.092 0.848 0.879 0.905 0.938 1.003 1.064 1.102 1.128 1.155 16–19 years . . . . . . . . . . . . . . . 543 1.087 0.084 0.948 0.983 1.003 1.031 1.086 1.138 1.175 1.199 1.235 20–29 years . . . . . . . . . . . . . . . 583 1.109 0.079 0.984 1.007 1.026 1.055 1.106 1.158 1.189 1.207 1.245 30–39 years . . . . . . . . . . . . . . . 612 1.131 0.089 0.985 1.016 1.035 1.073 1.133 1.190 1.222 1.247 1.284 40–49 years . . . . . . . . . . . . . . . 668 1.127 0.096 0.971 1.010 1.032 1.065 1.123 1.180 1.226 1.254 1.296 50–59 years . . . . . . . . . . . . . . . 639 1.091 0.099 0.932 0.963 0.988 1.023 1.087 1.157 1.197 1.221 1.259 60–69 years . . . . . . . . . . . . . . . 644 1.040 0.107 0.871 0.902 0.927 0.968 1.035 1.116 1.150 1.179 1.221 70–79 years . . . . . . . . . . . . . . . 429 0.977 0.104 0.809 0.845 0.872 0.903 0.970 1.046 1.095 1.129 1.164 80 years and over . . . . . . . . . . . 457 0.924 0.105 0.752 0.797 0.815 0.848 0.923 0.996 1.034 1.057 1.091
20 years and over (age-adjusted) . . 4,032 1.088 . . . . . . . . . . . . . . . . . . . . . . . . . . . . . .
Non-Hispanic black 8–11 years . . . . . . . . . . . . . . . . 490 0.871 0.090 0.727 0.755 0.776 0.809 0.864 0.930 0.968 0.989 1.023 12–15 years . . . . . . . . . . . . . . . 737 1.071 0.097 0.910 0.943 0.968 1.006 1.073 1.135 1.170 1.193 1.237 16–19 years . . . . . . . . . . . . . . . 609 1.153 0.091 0.997 1.035 1.060 1.090 1.156 1.214 1.248 1.270 1.298 20–29 years . . . . . . . . . . . . . . . 297 1.186 0.092 1.035 1.063 1.084 1.119 1.186 1.247 1.280 1.300 1.346 30–39 years . . . . . . . . . . . . . . . 333 1.196 0.095 1.051 1.075 1.091 1.131 1.194 1.252 1.291 1.317 1.356 40–49 years . . . . . . . . . . . . . . . 398 1.191 0.098 1.032 1.071 1.090 1.125 1.189 1.248 1.289 1.322 1.362 50–59 years . . . . . . . . . . . . . . . 250 1.136 0.114 0.950 0.997 1.022 1.061 1.134 1.204 1.243 1.276 1.328 60–69 years . . . . . . . . . . . . . . . 306 1.096 0.113 0.915 0.949 0.974 1.018 1.094 1.173 1.204 1.241 1.276 70–79 years . . . . . . . . . . . . . . . 124 1.035 0.105 0.854 0.911 0.935 0.954 1.031 1.106 1.142 1.173 1.199 80 years and over . . . . . . . . . . . 58 *0.979 0.129 *0.781 *0.812 *0.845 *0.869 *0.982 *1.048 *1.102 *1.119 †
20 years and over (age-adjusted) . . 1,766 1.150 . . . . . . . . . . . . . . . . . . . . . . . . . . . . . .
. . . Category not applicable.
* Figure does not meet standards of reliability or precision; relative standard error (standard error divided by estimate times 100) is 30%–39% or estimate is based on less than 12 degrees of freedom.
† Standard error not calculated by SUDAAN software.
NOTE: g/cm2 is grams per centimeter squared.
SOURCE: National Health and Nutrition Examination Survey, 1999–2006.

Series 11, No. 253 [ Page 13
Table 4. Total minus head (subtotal) bone area (cm2) of persons aged 8 years and over, by sex, race and ethnicity, and age: United States, 1999–2006
Percentile Sample Standard
Sex, race and ethnicity, and age size Mean deviation 5th 10th 15th 25th 50th 75th 85th 90th 95th
Male All races and ethnicities
8–11 years . . . . . . . . . . . . . . . . 1,421 1,163.80 168.87 947.33 985.99 1,018.96 1,053.72 1,134.88 1,239.17 1,311.97 1,392.53 1,502.00 12–15 years . . . . . . . . . . . . . . . 2,264 1,660.56 297.32 1,208.32 1,263.22 1,315.73 1,427.10 1,663.72 1,880.48 1,984.57 2,045.21 2,117.60 16–19 years . . . . . . . . . . . . . . . 2,309 1,997.36 213.81 1,658.06 1,729.86 1,778.28 1,853.01 1,990.10 2,132.23 2,212.23 2,267.14 2,355.97 20–29 years . . . . . . . . . . . . . . . 1,530 2,047.54 208.88 1,712.17 1,794.55 1,841.66 1,911.46 2,038.87 2,170.79 2,253.60 2,312.77 2,399.69 30–39 years . . . . . . . . . . . . . . . 1,450 2,046.30 205.62 1,725.98 1,787.79 1,838.74 1,908.00 2,036.54 2,175.17 2,247.59 2,311.95 2,380.63 40–49 years . . . . . . . . . . . . . . . 1,549 2,068.45 187.23 1,760.12 1,838.54 1,880.08 1,946.96 2,063.25 2,194.31 2,260.24 2,303.73 2,375.01 50–59 years . . . . . . . . . . . . . . . 1,187 2,046.63 191.56 1,735.33 1,804.15 1,849.68 1,920.03 2,051.10 2,169.40 2,235.13 2,294.27 2,355.27 60–69 years . . . . . . . . . . . . . . . 1,350 2,037.15 194.85 1,702.39 1,794.62 1,837.24 1,913.96 2,042.18 2,168.84 2,239.34 2,276.87 2,346.17 70–79 years . . . . . . . . . . . . . . . 825 1,987.77 196.23 1,658.32 1,737.52 1,781.99 1,855.57 1,995.52 2,131.38 2,192.18 2,234.15 2,292.95 80 years and over . . . . . . . . . . . 501 1,904.58 191.35 1,577.96 1,657.86 1,706.72 1,783.71 1,904.64 2,028.27 2,092.83 2,148.87 2,225.72
20 years and over (age-adjusted) . . 8,392 2,038.97 . . . . . . . . . . . . . . . . . . . . . . . . . . . . . .
Mexican American 8–11 years . . . . . . . . . . . . . . . . 468 1,174.22 173.42 969.92 1,001.00 1,020.85 1,057.68 1,135.06 1,261.03 1,351.22 1,420.93 1,521.42 12–15 years . . . . . . . . . . . . . . . 777 1,640.62 279.06 1,173.52 1,251.87 1,319.09 1,438.11 1,646.79 1,819.59 1,936.70 2,012.09 2,105.88 16–19 years . . . . . . . . . . . . . . . 783 1,909.29 205.59 1,601.77 1,669.18 1,714.33 1,769.38 1,892.26 2,036.16 2,105.42 2,174.04 2,263.46 20–29 years . . . . . . . . . . . . . . . 444 1,922.77 187.76 1,633.76 1,695.93 1,726.09 1,788.71 1,916.55 2,039.97 2,111.79 2,155.46 2,240.94 30–39 years . . . . . . . . . . . . . . . 337 1,909.19 167.69 1,647.01 1,695.78 1,745.59 1,794.51 1,909.18 2,012.04 2,071.74 2,112.60 2,193.05 40–49 years . . . . . . . . . . . . . . . 381 1,918.20 173.80 1,672.38 1,720.56 1,747.01 1,799.56 1,908.56 2,034.30 2,080.80 2,137.86 2,214.77 50–59 years . . . . . . . . . . . . . . . 174 1,909.89 152.82 1,676.13 1,735.24 1,753.81 1,799.99 1,919.26 2,009.90 2,076.83 2,108.11 2,147.74 60–69 years . . . . . . . . . . . . . . . 348 1,920.44 165.63 1,637.90 1,700.55 1,740.82 1,810.52 1,926.03 2,030.53 2,074.82 2,130.40 2,203.66 70–79 years . . . . . . . . . . . . . . . 164 *1,842.79 174.12 *1,539.34 *1,621.68 *1,683.13 *1,744.83 *1,852.76 *1,947.42 *1,999.01 *2,032.07 *2,097.50 80 years and over . . . . . . . . . . . 48 *1,796.06 182.25 *1,459.64 *1,555.18 *1,600.02 *1,671.05 *1,839.89 *1,889.50 *1,910.16 *2,005.17 †
20 years and over (age-adjusted) . . 1,896 1,904.13 . . . . . . . . . . . . . . . . . . . . . . . . . . . . . .
Non-Hispanic white 8–11 years . . . . . . . . . . . . . . . . 369 1,152.37 165.36 928.81 974.08 1,011.23 1,048.25 1,129.69 1,233.33 1,292.58 1,371.19 1,480.69 12–15 years . . . . . . . . . . . . . . . 578 1,665.49 302.27 1,206.28 1,264.43 1,315.16 1,422.15 1,671.12 1,901.07 2,001.04 2,052.78 2,121.43 16–19 years . . . . . . . . . . . . . . . 591 2,009.51 205.58 1,667.36 1,747.68 1,794.66 1,877.37 2,003.99 2,145.49 2,213.87 2,266.40 2,341.26 20–29 years . . . . . . . . . . . . . . . 617 2,066.69 193.69 1,757.80 1,838.91 1,882.99 1,947.09 2,051.85 2,180.71 2,256.23 2,309.38 2,390.84 30–39 years . . . . . . . . . . . . . . . 647 2,072.47 195.02 1,761.32 1,837.14 1,880.04 1,941.20 2,074.70 2,189.47 2,259.82 2,313.35 2,383.56 40–49 years . . . . . . . . . . . . . . . 700 2,093.70 174.64 1,821.72 1,877.86 1,924.80 1,974.41 2,081.74 2,207.20 2,271.20 2,312.78 2,389.49 50–59 years . . . . . . . . . . . . . . . 683 2,064.59 183.69 1,758.85 1,844.40 1,881.98 1,945.62 2,070.33 2,179.78 2,250.82 2,299.46 2,356.60 60–69 years . . . . . . . . . . . . . . . 623 2,058.26 182.01 1,772.72 1,825.60 1,873.08 1,941.38 2,055.72 2,179.73 2,247.37 2,283.77 2,354.11 70–79 years . . . . . . . . . . . . . . . 496 2,005.50 190.29 1,687.78 1,757.71 1,802.55 1,878.59 2,007.91 2,144.29 2,205.77 2,240.64 2,297.80 80 years and over . . . . . . . . . . . 398 1,907.82 184.38 1,593.29 1,672.68 1,716.42 1,788.06 1,907.34 2,028.70 2,090.54 2,141.84 2,212.01
20 years and over (age-adjusted) . . 4,164 2,060.09 . . . . . . . . . . . . . . . . . . . . . . . . . . . . . .
Non-Hispanic black 8–11 years . . . . . . . . . . . . . . . . 469 1,215.81 180.82 973.83 1,027.41 1,056.63 1,099.70 1,178.97 1,283.54 1,406.54 1,467.26 1,586.48 12–15 years . . . . . . . . . . . . . . . 745 1,722.56 301.00 1,246.76 1,320.78 1,375.92 1,506.28 1,731.61 1,934.12 2,018.05 2,086.48 2,194.75 16–19 years . . . . . . . . . . . . . . . 757 2,055.83 232.60 1,698.93 1,777.62 1,831.32 1,906.48 2,043.94 2,188.64 2,272.99 2,338.71 2,450.54 20–29 years . . . . . . . . . . . . . . . 325 2,134.16 221.75 1,824.87 1,872.86 1,919.14 1,979.82 2,122.52 2,261.11 2,339.10 2,402.27 2,516.11 30–39 years . . . . . . . . . . . . . . . 310 2,135.21 216.76 1,825.93 1,868.96 1,903.48 1,978.23 2,122.93 2,293.02 2,354.81 2,402.74 2,503.41 40–49 years . . . . . . . . . . . . . . . 366 2,099.81 190.94 1,793.92 1,859.18 1,904.26 1,969.22 2,091.26 2,224.53 2,292.85 2,333.44 2,405.52 50–59 years . . . . . . . . . . . . . . . 240 2,092.18 202.71 1,787.16 1,816.66 1,868.56 1,949.61 2,076.26 2,217.12 2,292.85 2,363.16 2,430.27 60–69 years . . . . . . . . . . . . . . . 303 2,076.66 185.10 1,786.66 1,840.10 1,896.70 1,961.79 2,065.64 2,191.86 2,264.08 2,315.43 2,380.46 70–79 years . . . . . . . . . . . . . . . 114 1,996.99 200.68 1,675.44 1,721.39 1,789.21 1,874.76 2,020.26 2,125.42 2,194.73 2,235.28 2,298.17 80 years and over . . . . . . . . . . . 36 *1,961.61 232.46 † *1,631.99 *1,718.04 *1,790.53 *1,961.33 *2,087.26 *2,237.69 † †
20 years and over (age-adjusted) . . 1,694 2,095.16 . . . . . . . . . . . . . . . . . . . . . . . . . . . . . .
See footnotes at end of table.

Page 14 [ Series 11, No. 253
Table 4. Total minus head (subtotal) bone area (cm2) of persons aged 8 years and over, by sex, race and ethnicity, and age: United States, 1999–2006—Con.
Percentile Sample Standard
Sex, race and ethnicity, and age size Mean deviation 5th 10th 15th 25th 50th 75th 85th 90th 95th
Female
All races and ethnicities 8–11 years . . . . . . . . . . . . . . . . 1,465 1,189.20 184.41 934.22 985.51 1,016.98 1,061.93 1,160.81 1,293.84 1,381.00 1,457.00 1,547.72 12–15 years . . . . . . . . . . . . . . . 2,318 1,575.77 187.05 1,264.40 1,331.48 1,381.50 1,451.35 1,575.98 1,699.24 1,767.39 1,814.80 1,876.99 16–19 years . . . . . . . . . . . . . . . 2,027 1,690.36 177.40 1,421.93 1,478.01 1,511.47 1,575.34 1,681.97 1,792.44 1,856.97 1,899.15 1,980.19 20–29 years . . . . . . . . . . . . . . . 1,378 1,719.52 165.67 1,449.49 1,506.97 1,545.32 1,607.91 1,715.87 1,823.58 1,890.98 1,931.27 1,997.62 30–39 years . . . . . . . . . . . . . . . 1,372 1,731.56 162.27 1,482.15 1,534.24 1,572.54 1,619.90 1,716.02 1,837.85 1,891.87 1,942.34 2,028.06 40–49 years . . . . . . . . . . . . . . . 1,570 1,740.26 163.10 1,482.83 1,539.30 1,570.62 1,630.48 1,736.53 1,839.52 1,907.20 1,950.34 2,009.58 50–59 years . . . . . . . . . . . . . . . 1,200 1,710.20 162.75 1,452.29 1,502.78 1,538.12 1,600.51 1,714.41 1,808.44 1,874.90 1,914.24 1,973.94 60–69 years . . . . . . . . . . . . . . . 1,419 1,685.26 173.94 1,410.36 1,462.65 1,506.02 1,562.76 1,688.39 1,800.20 1,859.19 1,895.15 1,959.26 70–79 years . . . . . . . . . . . . . . . 750 1,616.99 173.74 1,333.33 1,400.30 1,450.22 1,507.66 1,619.67 1,727.84 1,790.16 1,837.35 1,892.66 80 years and over . . . . . . . . . . . 594 1,507.20 180.29 1,200.42 1,264.69 1,320.89 1,392.73 1,515.38 1,628.39 1,680.25 1,730.65 1,794.58
20 years and over (age-adjusted) . . 8,283 1,703.22 . . . . . . . . . . . . . . . . . . . . . . . . . . . . . .
Mexican American 8–11 years . . . . . . . . . . . . . . . . 471 1,174.52 177.97 935.11 978.32 1,004.28 1,048.13 1,152.80 1,276.55 1,358.57 1,421.76 1,511.40 12–15 years . . . . . . . . . . . . . . . 821 1,547.93 171.99 1,263.22 1,325.29 1,369.38 1,435.27 1,543.83 1,666.67 1,716.32 1,747.52 1,825.54 16–19 years . . . . . . . . . . . . . . . 692 1,616.97 169.18 1,341.84 1,414.54 1,444.84 1,502.07 1,606.46 1,718.97 1,787.85 1,827.89 1,902.63 20–29 years . . . . . . . . . . . . . . . 364 1,652.80 149.78 1,407.60 1,445.06 1,486.17 1,560.11 1,650.71 1,741.92 1,799.04 1,846.40 1,917.82 30–39 years . . . . . . . . . . . . . . . 298 1,649.43 144.13 1,436.42 1,499.34 1,512.96 1,546.97 1,639.52 1,734.70 1,791.59 1,828.73 1,904.56 40–49 years . . . . . . . . . . . . . . . 372 1,662.28 140.76 1,429.82 1,487.01 1,524.81 1,560.77 1,660.63 1,753.95 1,800.78 1,834.28 1,910.67 50–59 years . . . . . . . . . . . . . . . 194 1,622.09 163.87 1,358.05 1,404.02 1,446.20 1,504.65 1,634.72 1,730.84 1,790.89 1,834.07 1,895.93 60–69 years . . . . . . . . . . . . . . . 375 1,566.88 161.33 1,288.45 1,360.28 1,410.10 1,454.32 1,573.99 1,679.77 1,733.63 1,761.99 1,798.71 70–79 years . . . . . . . . . . . . . . . 154 *1,503.01 174.43 *1,182.29 *1,292.93 *1,333.91 *1,413.66 *1,506.17 *1,617.51 *1,665.50 *1,706.10 *1,762.87 80 years and over . . . . . . . . . . . 47 *1,381.36 185.80 † *1,122.18 *1,179.65 *1,258.09 *1,381.05 *1,504.62 *1,569.02 *1,595.17 *1,641.11
20 years and over (age-adjusted) . . 1,804 1,615.50 . . . . . . . . . . . . . . . . . . . . . . . . . . . . . .
Non-Hispanic white 8–11 years . . . . . . . . . . . . . . . . 383 1,180.47 178.00 927.04 976.88 1,006.90 1,056.37 1,158.02 1,282.78 1,360.87 1,442.95 1,509.97 12–15 years . . . . . . . . . . . . . . . 576 1,567.88 185.47 1,253.56 1,319.24 1,372.27 1,442.89 1,576.26 1,698.50 1,757.54 1,797.53 1,846.41 16–19 years . . . . . . . . . . . . . . . 543 1,701.23 166.45 1,450.82 1,502.39 1,540.97 1,602.47 1,693.98 1,793.50 1,852.37 1,887.59 1,962.35 20–29 years . . . . . . . . . . . . . . . 583 1,732.03 155.53 1,469.11 1,532.35 1,569.37 1,626.57 1,728.76 1,829.59 1,893.81 1,927.60 1,981.43 30–39 years . . . . . . . . . . . . . . . 612 1,738.96 154.77 1,504.38 1,557.65 1,587.82 1,632.71 1,724.09 1,841.26 1,886.93 1,936.59 2,020.36 40–49 years . . . . . . . . . . . . . . . 668 1,748.98 159.91 1,495.75 1,549.25 1,579.67 1,639.29 1,745.98 1,842.29 1,912.59 1,956.56 2,012.62 50–59 years . . . . . . . . . . . . . . . 639 1,720.61 149.90 1,482.42 1,529.24 1,561.09 1,615.09 1,723.93 1,808.04 1,864.27 1,909.43 1,972.53 60–69 years . . . . . . . . . . . . . . . 644 1,693.35 163.88 1,432.88 1,487.88 1,532.17 1,581.80 1,697.24 1,802.26 1,854.72 1,888.39 1,944.90 70–79 years . . . . . . . . . . . . . . . 429 1,625.63 166.62 1,363.07 1,420.88 1,467.95 1,526.02 1,631.19 1,728.75 1,790.92 1,837.82 1,884.33 80 years and over . . . . . . . . . . . 457 1,514.49 172.03 1,223.23 1,278.72 1,338.34 1,406.22 1,521.41 1,626.44 1,676.42 1,725.90 1,796.38
20 years and over (age-adjusted) . . 4,032 1,712.48 . . . . . . . . . . . . . . . . . . . . . . . . . . . . . .
Non-Hispanic black 8–11 years . . . . . . . . . . . . . . . . 490 1,239.45 209.39 959.11 1,016.97 1,043.48 1,096.66 1,195.93 1,357.12 1,483.29 1,532.36 1,605.34 12–15 years . . . . . . . . . . . . . . . 737 1,659.35 193.14 1,361.80 1,422.66 1,471.08 1,526.87 1,643.11 1,786.54 1,860.90 1,917.17 1,988.29 16–19 years . . . . . . . . . . . . . . . 609 1,751.63 199.65 1,451.62 1,525.44 1,559.98 1,621.27 1,732.72 1,863.28 1,938.20 1,998.26 2,089.74 20–29 years . . . . . . . . . . . . . . . 297 1,777.65 173.69 1,492.28 1,581.68 1,608.55 1,666.49 1,767.86 1,873.81 1,955.52 2,014.03 2,065.00 30–39 years . . . . . . . . . . . . . . . 333 1,810.41 173.50 1,541.07 1,591.54 1,635.63 1,688.02 1,797.98 1,922.17 1,999.64 2,051.64 2,102.20 40–49 years . . . . . . . . . . . . . . . 398 1,800.35 160.41 1,559.13 1,605.48 1,640.09 1,693.56 1,791.81 1,894.98 1,948.65 1,994.48 2,074.88 50–59 years . . . . . . . . . . . . . . . 250 1,771.93 167.98 1,466.47 1,553.71 1,610.99 1,663.15 1,761.09 1,882.19 1,933.85 1,966.29 2,063.62 60–69 years . . . . . . . . . . . . . . . 306 1,776.56 179.09 1,470.84 1,545.66 1,591.53 1,660.07 1,777.47 1,897.04 1,959.90 2,000.82 2,045.30 70–79 years . . . . . . . . . . . . . . . 124 1,685.11 193.55 1,358.72 1,427.30 1,479.97 1,566.28 1,680.71 1,805.48 1,884.19 1,932.56 † 80 years and over . . . . . . . . . . . 58 *1,584.19 173.60 *1,263.88 *1,335.09 *1,380.34 *1,479.30 *1,591.68 *1,688.35 *1,767.41 *1,789.70 *1,816.26
20 years and over (age-adjusted) . . 1,766 1,771.85 . . . . . . . . . . . . . . . . . . . . . . . . . . . . . .
. . . Category not applicable.
* Figure does not meet standards of reliability or precision; relative standard error (standard error divided by estimate times 100) is 30%–39% or estimate is based on less than 12 degrees of freedom.
† Standard error not calculated by SUDAAN software.
NOTE: cm2 is centimeter squared.
SOURCE: National Health and Nutrition Examination Survey, 1999–2006.

Series 11, No. 253 [ Page 15
Table 5. Total minus head (subtotal) bone mineral content (g) of persons aged 8 years and over, by sex, race and ethnicity, and age: United States, 1999–2006
Percentile Sample Standard
Sex, race and ethnicity, and age size Mean deviation 5th 10th 15th 25th 50th 75th 85th 90th 95th
Male
All races and ethnicities 8–11 years . . . . . . . . . . . . . . . . 1,421 856.17 204.56 590.56 629.87 661.99 714.39 826.74 961.16 1,049.14 1,118.44 1,249.26 12–15 years . . . . . . . . . . . . . . . 2,264 1,552.50 455.19 904.60 974.94 1,052.68 1,187.98 1,515.81 1,866.79 2,045.89 2,163.37 2,317.20 16–19 years . . . . . . . . . . . . . . . 2,309 2,176.08 402.70 1,568.52 1,670.00 1,769.86 1,898.84 2,142.28 2,435.43 2,598.96 2,690.53 2,831.75 20–29 years . . . . . . . . . . . . . . . 1,530 2,284.74 417.97 1,660.29 1,797.10 1,881.41 2,010.38 2,248.38 2,512.55 2,681.53 2,829.87 3,008.30 30–39 years . . . . . . . . . . . . . . . 1,450 2,265.15 411.77 1,685.10 1,780.71 1,856.86 1,979.20 2,224.88 2,493.57 2,667.60 2,786.36 2,976.95 40–49 years . . . . . . . . . . . . . . . 1,549 2,274.40 371.28 1,715.26 1,835.03 1,904.31 2,013.40 2,258.07 2,493.43 2,629.63 2,749.85 2,918.67 50–59 years . . . . . . . . . . . . . . . 1,187 2,210.25 382.38 1,627.34 1,753.07 1,823.69 1,953.19 2,189.50 2,435.71 2,587.50 2,691.32 2,852.79 60–69 years . . . . . . . . . . . . . . . 1,350 2,179.33 382.30 1,592.10 1,699.96 1,785.92 1,923.90 2,168.26 2,403.78 2,578.51 2,681.02 2,840.21 70–79 years . . . . . . . . . . . . . . . 825 2,053.85 367.32 1,501.14 1,608.79 1,665.42 1,785.34 2,046.28 2,284.51 2,429.53 2,531.16 2,663.55 80 years and over . . . . . . . . . . . 501 1,909.87 365.69 1,363.72 1,466.10 1,544.67 1,663.30 1,885.76 2,132.57 2,293.98 2,403.17 2,572.64
20 years and over (age-adjusted) . . 8,392 2,219.37 . . . . . . . . . . . . . . . . . . . . . . . . . . . . . .
Mexican American 8–11 years . . . . . . . . . . . . . . . . 468 862.40 218.06 586.02 622.31 658.27 713.16 817.39 970.48 1,083.56 1,197.60 1,307.66 12–15 years . . . . . . . . . . . . . . . 777 1,529.82 441.28 867.67 969.31 1,058.38 1,216.90 1,507.32 1,804.22 1,974.47 2,115.88 2,320.21 16–19 years . . . . . . . . . . . . . . . 783 2,014.44 372.80 1,477.25 1,577.73 1,654.08 1,771.75 1,974.81 2,218.65 2,392.70 2,494.94 2,641.91 20–29 years . . . . . . . . . . . . . . . 444 2,066.25 344.99 1,576.79 1,658.09 1,707.63 1,818.44 2,022.04 2,270.27 2,402.53 2,503.32 2,662.92 30–39 years . . . . . . . . . . . . . . . 337 2,019.64 304.07 1,589.59 1,672.93 1,728.78 1,805.25 2,000.22 2,202.65 2,285.37 2,383.65 2,602.61 40–49 years . . . . . . . . . . . . . . . 381 2,018.32 328.01 1,549.89 1,642.55 1,706.32 1,798.65 1,979.48 2,189.97 2,343.56 2,433.37 2,621.00 50–59 years . . . . . . . . . . . . . . . 174 1,994.30 312.64 1,519.18 1,599.10 1,630.78 1,737.89 2,000.04 2,222.75 2,307.73 2,388.63 2,508.38 60–69 years . . . . . . . . . . . . . . . 348 1,984.26 310.45 1,517.75 1,593.86 1,645.30 1,763.24 1,965.73 2,176.53 2,292.75 2,391.45 2,494.54 70–79 years . . . . . . . . . . . . . . . 164 *1,842.92 315.22 *1,315.52 *1,415.67 *1,521.85 *1,628.98 *1,861.78 *2,045.31 *2,160.28 *2,232.58 *2,315.96 80 years and over . . . . . . . . . . . 48 *1,728.72 316.29 *1,214.50 *1,331.75 *1,411.55 *1,531.65 *1,681.48 *1,849.17 *1,951.90 *2,162.65 †
20 years and over (age-adjusted) . . 1,896 1,992.17 . . . . . . . . . . . . . . . . . . . . . . . . . . . . . .
Non-Hispanic white 8–11 years . . . . . . . . . . . . . . . . 369 841.06 194.50 581.38 625.06 653.94 706.64 817.42 943.45 1,034.75 1,091.01 1,233.60 12–15 years . . . . . . . . . . . . . . . 578 1,548.81 455.99 904.02 971.58 1,041.85 1,180.88 1,512.15 1,876.69 2,046.52 2,167.24 2,306.38 16–19 years . . . . . . . . . . . . . . . 591 2,183.51 378.92 1,575.18 1,684.25 1,782.89 1,926.21 2,159.55 2,440.28 2,587.24 2,665.08 2,800.36 20–29 years . . . . . . . . . . . . . . . 617 2,299.44 386.71 1,734.46 1,861.31 1,924.14 2,072.29 2,261.56 2,505.86 2,648.29 2,810.74 2,969.89 30–39 years . . . . . . . . . . . . . . . 647 2,299.44 393.99 1,751.52 1,837.78 1,914.52 2,029.91 2,259.03 2,518.25 2,680.04 2,787.53 2,968.43 40–49 years . . . . . . . . . . . . . . . 700 2,305.84 349.08 1,779.02 1,895.11 1,940.61 2,065.54 2,282.95 2,513.87 2,640.36 2,758.31 2,926.67 50–59 years . . . . . . . . . . . . . . . 683 2,227.29 365.88 1,692.94 1,788.91 1,867.41 1,981.77 2,207.00 2,439.86 2,584.37 2,690.56 2,845.83 60–69 years . . . . . . . . . . . . . . . 623 2,202.17 366.54 1,638.21 1,739.53 1,830.66 1,959.99 2,188.92 2,415.96 2,593.21 2,687.63 2,846.84 70–79 years . . . . . . . . . . . . . . . 496 2,078.32 363.53 1,531.41 1,628.29 1,682.41 1,807.49 2,069.52 2,301.97 2,450.81 2,553.20 2,684.03 80 years and over . . . . . . . . . . . 398 1,908.85 350.77 1,373.71 1,476.41 1,553.98 1,674.06 1,887.72 2,129.58 2,279.25 2,386.22 2,530.08
20 years and over (age-adjusted) . . 4,164 2,243.12 . . . . . . . . . . . . . . . . . . . . . . . . . . . . . .
Non-Hispanic black 8–11 years . . . . . . . . . . . . . . . . 469 939.76 227.34 646.89 688.23 722.36 791.88 900.41 1,041.68 1,158.26 1,226.21 1,370.58 12–15 years . . . . . . . . . . . . . . . 745 1,679.29 475.97 971.78 1,086.28 1,163.85 1,302.69 1,651.98 1,979.65 2,182.55 2,288.18 2,437.25 16–19 years . . . . . . . . . . . . . . . 757 2,357.05 463.72 1,708.55 1,818.94 1,912.33 2,040.40 2,317.01 2,618.39 2,774.96 2,915.55 3,134.22 20–29 years . . . . . . . . . . . . . . . 325 2,559.34 479.28 1,879.09 2,027.76 2,103.71 2,251.91 2,494.82 2,806.31 2,992.19 3,132.79 3,452.83 30–39 years . . . . . . . . . . . . . . . 310 2,517.74 455.29 1,857.11 1,971.70 2,066.09 2,198.24 2,486.33 2,766.04 2,957.79 3,097.98 3,351.35 40–49 years . . . . . . . . . . . . . . . 366 2,402.95 425.30 1,793.65 1,881.76 1,977.24 2,124.85 2,352.32 2,647.76 2,801.21 2,917.20 3,155.71 50–59 years . . . . . . . . . . . . . . . 240 2,394.04 429.07 1,768.32 1,895.27 1,948.00 2,071.17 2,379.92 2,653.62 2,805.92 2,911.95 3,134.25 60–69 years . . . . . . . . . . . . . . . 303 2,330.38 371.43 1,746.81 1,903.16 1,974.97 2,104.99 2,293.53 2,535.82 2,695.62 2,781.58 2,982.10 70–79 years . . . . . . . . . . . . . . . 114 2,109.21 371.99 1,521.74 1,627.84 1,739.21 1,868.53 2,100.15 2,363.23 2,458.11 2,527.52 2,720.32 80 years and over . . . . . . . . . . . 36 *2,090.32 473.68 † *1,461.78 *1,580.06 *1,686.53 *2,017.52 *2,340.74 *2,587.66 *2,740.81 † 20 years and over (age-adjusted) . . 1,694 2,408.46 . . . . . . . . . . . . . . . . . . . . . . . . . . . . . .
See footnotes at end of table.

Page 16 [ Series 11, No. 253
Table 5. Total minus head (subtotal) bone mineral content (g) of persons aged 8 years and over, by sex, race and ethnicity, and age: United States, 1999–2006—Con.
Percentile Sample Standard
Sex, race and ethnicity, and age size Mean deviation 5th 10th 15th 25th 50th 75th 85th 90th 95th
Female
All races and ethnicities 8–11 years . . . . . . . . . . . . . . . . 1,465 885.53 245.33 559.16 609.81 646.79 706.33 838.85 1,027.12 1,150.16 1,231.32 1,349.24 12–15 years . . . . . . . . . . . . . . . 2,318 1,446.87 288.01 1,001.00 1,090.69 1,148.41 1,246.60 1,439.32 1,633.07 1,743.27 1,813.96 1,936.01 16–19 years . . . . . . . . . . . . . . . 2,027 1,640.09 281.36 1,194.93 1,297.43 1,354.60 1,453.16 1,621.23 1,814.31 1,925.72 1,995.73 2,137.79 20–29 years . . . . . . . . . . . . . . . 1,378 1,680.56 265.54 1,285.98 1,346.45 1,403.24 1,490.47 1,672.97 1,850.95 1,944.65 2,013.39 2,116.07 30–39 years . . . . . . . . . . . . . . . 1,372 1,700.81 268.78 1,298.54 1,378.33 1,433.49 1,511.42 1,669.63 1,873.64 1,968.97 2,054.52 2,173.96 40–49 years . . . . . . . . . . . . . . . 1,570 1,701.27 275.08 1,287.78 1,373.43 1,420.93 1,515.43 1,681.05 1,864.82 1,980.10 2,059.24 2,178.45 50–59 years . . . . . . . . . . . . . . . 1,200 1,609.08 269.09 1,191.40 1,280.30 1,334.09 1,424.55 1,597.94 1,770.89 1,882.94 1,963.04 2,077.46 60–69 years . . . . . . . . . . . . . . . 1,419 1,516.09 278.33 1,088.89 1,180.99 1,233.03 1,321.67 1,502.15 1,703.86 1,798.60 1,869.48 1,962.94 70–79 years . . . . . . . . . . . . . . . 750 1,364.51 260.06 959.38 1,046.29 1,096.12 1,205.96 1,350.17 1,517.11 1,624.84 1,694.93 1,811.79 80 years and over . . . . . . . . . . . 594 1,189.39 257.03 765.23 855.95 921.70 1,020.47 1,175.23 1,354.71 1,466.56 1,537.27 1,612.38 20 years and over (age-adjusted) . . 8,283 1,612.33 . . . . . . . . . . . . . . . . . . . . . . . . . . . . . .
Mexican American 8–11 years . . . . . . . . . . . . . . . . 471 860.75 241.43 547.71 590.02 617.18 687.04 814.50 1,000.50 1,108.76 1,197.38 1,350.77 12–15 years . . . . . . . . . . . . . . . 821 1,406.39 262.08 993.30 1,083.60 1,147.02 1,227.81 1,403.27 1,583.11 1,657.39 1,709.93 1,828.23 16–19 years . . . . . . . . . . . . . . . 692 1,528.38 261.79 1,148.69 1,211.89 1,266.56 1,344.15 1,521.43 1,667.65 1,768.54 1,852.96 1,986.57 20–29 years . . . . . . . . . . . . . . . 364 1,574.22 240.98 1,182.74 1,279.36 1,332.86 1,391.65 1,562.78 1,727.34 1,843.09 1,902.31 2,002.52 30–39 years . . . . . . . . . . . . . . . 298 1,581.66 240.36 1,239.19 1,315.63 1,353.34 1,413.92 1,556.60 1,708.20 1,809.74 1,891.87 2,030.98 40–49 years . . . . . . . . . . . . . . . 372 1,590.06 226.08 1,229.40 1,312.85 1,361.96 1,448.03 1,572.32 1,734.24 1,813.83 1,871.47 1,979.73 50–59 years . . . . . . . . . . . . . . . 194 1,484.01 282.11 1,034.65 1,125.51 1,185.38 1,271.04 1,471.17 1,656.65 1,789.08 1,814.69 1,906.29 60–69 years . . . . . . . . . . . . . . . 375 1,336.27 249.37 942.97 1,018.66 1,063.15 1,165.11 1,329.02 1,506.91 1,601.30 1,667.34 1,730.79 70–79 years . . . . . . . . . . . . . . . 154 *1,206.65 244.75 *770.42 *912.36 *976.90 *1,075.28 *1,211.16 *1,324.25 *1,441.48 *1,493.83 *1,578.59 80 years and over . . . . . . . . . . . 47 *1,042.94 246.37 † *721.07 *795.83 *890.24 *1,028.67 *1,172.99 *1,294.97 *1,323.22 † 20 years and over (age-adjusted) . . 1,804 1,485.64 . . . . . . . . . . . . . . . . . . . . . . . . . . . . . .
Non-Hispanic white 8–11 years . . . . . . . . . . . . . . . . 383 872.38 232.43 555.53 602.80 641.53 697.86 830.53 1,016.39 1,113.32 1,214.59 1,315.94 12–15 years . . . . . . . . . . . . . . . 576 1,429.76 282.01 981.54 1,083.04 1,135.78 1,231.95 1,428.81 1,618.80 1,723.62 1,793.50 1,891.02 16–19 years . . . . . . . . . . . . . . . 543 1,653.78 262.35 1,227.20 1,328.16 1,402.63 1,484.17 1,643.00 1,815.52 1,923.70 1,981.28 2,121.96 20–29 years . . . . . . . . . . . . . . . 583 1,688.86 243.56 1,309.66 1,370.61 1,427.07 1507.96 1,686.81 1,853.03 1,935.43 1,986.95 2,088.14 30–39 years . . . . . . . . . . . . . . . 612 1,704.11 252.93 1,328.60 1,398.20 1,455.87 1,520.72 1,686.92 1,868.76 1,957.41 2,025.62 2,152.86 40–49 years . . . . . . . . . . . . . . . 668 1,705.06 267.52 1,302.26 1,379.16 1,427.04 1,523.99 1,687.12 1,859.29 1,977.43 2,049.81 2,177.76 50–59 years . . . . . . . . . . . . . . . 639 1,620.74 249.68 1,253.62 1,319.75 1,363.65 1,453.65 1,605.91 1,765.95 1,867.81 1,955.65 2,052.66 60–69 years . . . . . . . . . . . . . . . 644 1,523.10 265.89 1,116.85 1,197.58 1,246.71 1,337.67 1,511.89 1,700.31 1,789.77 1,848.36 1,943.67 70–79 years . . . . . . . . . . . . . . . 429 1,371.84 253.71 990.74 1,054.36 1,112.02 1,213.21 1,361.63 1,516.91 1,619.99 1,689.78 1,805.89 80 years and over . . . . . . . . . . . 457 1,195.38 249.14 796.80 877.77 934.46 1,030.69 1,184.03 1,353.73 1,463.90 1,522.07 1,605.56 20 years and over (age-adjusted) . . 4,032 1,618.80 . . . . . . . . . . . . . . . . . . . . . . . . . . . . . .
Non-Hispanic black 8–11 years . . . . . . . . . . . . . . . . 490 969.41 280.60 622.99 670.52 704.39 764.79 901.62 1,144.74 1,253.14 1,366.08 1,481.58 12–15 years . . . . . . . . . . . . . . . 737 1,605.97 303.17 1,143.49 1,248.90 1,293.10 1,394.35 1,579.24 1,796.39 1,923.54 2,016.23 2,126.83 16–19 years . . . . . . . . . . . . . . . 609 1,783.61 320.04 1,334.73 1,408.45 1,463.56 1,548.68 1,759.44 1,966.49 2,106.72 2,186.51 2,356.22 20–29 years . . . . . . . . . . . . . . . 297 1,827.45 294.94 1,367.47 1,464.77 1,527.24 1,633.06 1,807.47 1,989.62 2,117.47 2,249.70 2,352.71 30–39 years . . . . . . . . . . . . . . . 333 1,861.59 294.47 1,411.89 1,499.48 1,563.41 1,645.41 1,841.71 2,063.39 2,147.27 2,218.77 2,354.37 40–49 years . . . . . . . . . . . . . . . 398 1,849.51 283.76 1,431.08 1,506.11 1,561.18 1,658.98 1,824.28 2,022.57 2,125.28 2,185.92 2,343.65 50–59 years . . . . . . . . . . . . . . . 250 1,734.80 290.40 1,266.03 1,373.30 1,455.50 1,525.38 1,707.80 1,925.11 2,055.54 2,113.78 2,213.89 60–69 years . . . . . . . . . . . . . . . 306 1,679.24 294.61 1,189.34 1,312.20 1,389.10 1,486.20 1,670.47 1,869.48 1,965.20 2,042.91 2,145.82 70–79 years . . . . . . . . . . . . . . . 124 1,484.66 286.59 1,010.71 1,127.45 1,188.05 1,290.53 1,484.23 1,678.25 1,777.74 1,853.89 † 80 years and over . . . . . . . . . . . 58 *1,305.58 274.76 *844.45 *938.48 *1,024.83 *1,093.46 *1,301.59 *1,498.49 *1,601.03 *1,650.04 *1,744.46 20 years and over (age-adjusted) . . 1,766 1,757.20 . . . . . . . . . . . . . . . . . . . . . . . . . . . . . .
. . . Category not applicable.
* Figure does not meet standards of reliability or precision; relative standard error (standard error divided by estimate times 100) is 30%–39% or estimate is based on less than 12 degrees of freedom.
† Standard error not calculated by SUDAAN software.
NOTE: g is grams.
SOURCE: National Health and Nutrition Examination Survey, 1999–2006.

Series 11, No. 253 [ Page 17
Table 6. Total minus head (subtotal) bone mineral density (g/cm2) of persons aged 8 years and over, by sex, race and ethnicity, and age: United States, 1999–2006
Percentile Sample Standard
Sex, race and ethnicity, and age size Mean deviation 5th 10th 15th 25th 50th 75th 85th 90th 95th
Male
All races and ethnicities 8–11 years . . . . . . . . . . . . . . . . 1,421 0.727 0.077 0.604 0.626 0.644 0.673 0.726 0.778 0.804 0.825 0.864 12–15 years . . . . . . . . . . . . . . . 2,264 0.917 0.120 0.733 0.765 0.789 0.828 0.906 1.000 1.046 1.072 1.124 16–19 years . . . . . . . . . . . . . . . 2,309 1.082 0.108 0.911 0.949 0.970 1.008 1.077 1.150 1.192 1.223 1.261 20–29 years . . . . . . . . . . . . . . . 1,530 1.108 0.107 0.941 0.980 1.001 1.038 1.098 1.171 1.221 1.248 1.296 30–39 years . . . . . . . . . . . . . . . 1,450 1.100 0.107 0.948 0.970 0.989 1.023 1.090 1.164 1.208 1.240 1.291 40–49 years . . . . . . . . . . . . . . . 1,549 1.094 0.100 0.934 0.969 0.992 1.027 1.091 1.155 1.190 1.217 1.259 50–59 years . . . . . . . . . . . . . . . 1,187 1.073 0.107 0.903 0.941 0.963 1.001 1.070 1.138 1.183 1.207 1.253 60–69 years . . . . . . . . . . . . . . . 1,350 1.063 0.109 0.888 0.929 0.957 0.991 1.061 1.131 1.176 1.206 1.253 70–79 years . . . . . . . . . . . . . . . 825 1.027 0.108 0.858 0.893 0.918 0.946 1.027 1.097 1.143 1.172 1.202 80 years and over . . . . . . . . . . . 501 0.995 0.112 0.823 0.861 0.884 0.916 0.991 1.063 1.110 1.140 1.178
20 years and over (age-adjusted) . . 8,392 1.081 . . . . . . . . . . . . . . . . . . . . . . . . . . . . . .
Mexican American 8–11 years . . . . . . . . . . . . . . . . 468 0.725 0.083 0.597 0.617 0.636 0.667 0.719 0.778 0.813 0.840 0.874 12–15 years . . . . . . . . . . . . . . . 777 0.915 0.123 0.726 0.765 0.786 0.827 0.907 0.989 1.042 1.080 1.139 16–19 years . . . . . . . . . . . . . . . 783 1.048 0.099 0.891 0.920 0.947 0.982 1.039 1.109 1.146 1.177 1.225 20–29 years . . . . . . . . . . . . . . . 444 1.069 0.092 0.924 0.955 0.976 1.005 1.064 1.121 1.154 1.182 1.241 30–39 years . . . . . . . . . . . . . . . 337 1.053 0.085 0.917 0.949 0.964 0.993 1.051 1.109 1.136 1.156 1.199 40–49 years . . . . . . . . . . . . . . . 381 1.047 0.094 0.897 0.931 0.948 0.981 1.045 1.107 1.138 1.162 1.215 50–59 years . . . . . . . . . . . . . . . 174 1.039 0.100 0.870 0.903 0.916 0.958 1.046 1.110 1.138 1.163 1.195 60–69 years . . . . . . . . . . . . . . . 348 1.028 0.095 0.883 0.905 0.929 0.964 1.024 1.081 1.122 1.150 1.185 70–79 years . . . . . . . . . . . . . . . 164 *0.994 0.100 *0.819 *0.848 *0.876 *0.930 *1.006 *1.071 *1.095 *1.106 *1.126 80 years and over . . . . . . . . . . . 48 *0.956 0.091 *0.821 *0.841 *0.861 *0.891 *0.941 *1.002 *1.044 *1.094 *1.151
20 years and over (age-adjusted) . . 1,896 1.040 . . . . . . . . . . . . . . . . . . . . . . . . . . . . . .
Non-Hispanic white 8–11 years . . . . . . . . . . . . . . . . 369 0.722 0.073 0.605 0.626 0.643 0.673 0.722 0.769 0.792 0.810 0.838 12–15 years . . . . . . . . . . . . . . . 578 0.912 0.118 0.730 0.762 0.786 0.823 0.900 0.995 1.041 1.064 1.120 16–19 years . . . . . . . . . . . . . . . 591 1.080 0.104 0.906 0.948 0.971 1.009 1.080 1.148 1.184 1.215 1.253 20–29 years . . . . . . . . . . . . . . . 617 1.106 0.099 0.954 0.985 1.005 1.044 1.098 1.163 1.211 1.236 1.275 30–39 years . . . . . . . . . . . . . . . 647 1.103 0.104 0.953 0.977 0.996 1.031 1.094 1.167 1.207 1.237 1.282 40–49 years . . . . . . . . . . . . . . . 700 1.096 0.094 0.944 0.976 0.998 1.033 1.096 1.156 1.189 1.211 1.251 50–59 years . . . . . . . . . . . . . . . 683 1.073 0.103 0.908 0.943 0.965 1.003 1.070 1.136 1.176 1.201 1.244 60–69 years . . . . . . . . . . . . . . . 623 1.064 0.106 0.896 0.935 0.960 0.992 1.061 1.129 1.170 1.205 1.248 70–79 years . . . . . . . . . . . . . . . 496 1.030 0.108 0.861 0.898 0.919 0.948 1.030 1.102 1.148 1.174 1.204 80 years and over . . . . . . . . . . . 398 0.994 0.108 0.824 0.865 0.885 0.918 0.989 1.059 1.102 1.132 1.168
20 years and over (age-adjusted) . . 4,164 1.082 . . . . . . . . . . . . . . . . . . . . . . . . . . . . . .
Non-Hispanic black 8–11 years . . . . . . . . . . . . . . . . 469 0.764 0.081 0.631 0.658 0.671 0.713 0.764 0.819 0.846 0.863 0.886 12–15 years . . . . . . . . . . . . . . . 745 0.958 0.124 0.771 0.804 0.826 0.865 0.952 1.041 1.081 1.115 1.175 16–19 years . . . . . . . . . . . . . . . 757 1.138 0.116 0.957 0.999 1.021 1.056 1.135 1.215 1.255 1.282 1.320 20–29 years . . . . . . . . . . . . . . . 325 1.191 0.119 1.011 1.052 1.075 1.112 1.177 1.265 1.305 1.349 1.396 30–39 years . . . . . . . . . . . . . . . 310 1.172 0.112 0.982 1.027 1.064 1.097 1.163 1.243 1.289 1.318 1.362 40–49 years . . . . . . . . . . . . . . . 366 1.137 0.121 0.947 0.998 1.023 1.057 1.128 1.209 1.251 1.286 1.346 50–59 years . . . . . . . . . . . . . . . 240 1.137 0.114 0.952 0.993 1.021 1.060 1.125 1.211 1.254 1.279 1.320 60–69 years . . . . . . . . . . . . . . . 303 1.117 0.107 0.940 0.981 1.013 1.042 1.114 1.188 1.221 1.251 1.277 70–79 years . . . . . . . . . . . . . . . 114 1.050 0.110 0.857 0.915 0.938 0.983 1.044 1.124 1.162 1.184 1.237 80 years and over . . . . . . . . . . . 36 *1.056 0.142 † *0.867 *0.893 *0.946 *1.036 *1.135 *1.194 *1.223 †
20 years and over (age-adjusted) . . 1,694 1.141 . . . . . . . . . . . . . . . . . . . . . . . . . . . . . .
See footnotes at end of table.

Page 18 [ Series 11, No. 253
Table 6. Total minus head (subtotal) bone mineral density (g/cm2) of persons aged 8 years and over, by sex, race and ethnicity, and age: United States, 1999–2006—Con.
Percentile Sample Standard
Sex, race and ethnicity, and age size Mean deviation 5th 10th 15th 25th 50th 75th 85th 90th 95th
Female
All races and ethnicities 8–11 years . . . . . . . . . . . . . . . . 1,465 0.732 0.094 0.583 0.612 0.633 0.664 0.727 0.793 0.835 0.861 0.889 12–15 years . . . . . . . . . . . . . . . 2,318 0.910 0.087 0.764 0.799 0.822 0.852 0.909 0.967 1.000 1.023 1.053 16–19 years . . . . . . . . . . . . . . . 2,027 0.965 0.086 0.824 0.859 0.880 0.909 0.960 1.017 1.048 1.079 1.118 20–29 years . . . . . . . . . . . . . . . 1,378 0.973 0.079 0.846 0.876 0.894 0.918 0.969 1.022 1.049 1.074 1.112 30–39 years . . . . . . . . . . . . . . . 1,372 0.977 0.081 0.847 0.879 0.894 0.919 0.974 1.030 1.057 1.078 1.115 40–49 years . . . . . . . . . . . . . . . 1,570 0.973 0.085 0.841 0.868 0.892 0.915 0.965 1.025 1.058 1.085 1.126 50–59 years . . . . . . . . . . . . . . . 1,200 0.936 0.087 0.796 0.826 0.845 0.875 0.931 0.991 1.028 1.052 1.082 60–69 years . . . . . . . . . . . . . . . 1,419 0.893 0.091 0.746 0.777 0.800 0.830 0.890 0.952 0.987 1.011 1.051 70–79 years . . . . . . . . . . . . . . . 750 0.837 0.088 0.693 0.724 0.748 0.780 0.830 0.894 0.931 0.955 0.985 80 years and over . . . . . . . . . . . 594 0.781 0.092 0.633 0.664 0.692 0.716 0.774 0.839 0.875 0.897 0.940
20 years and over (age-adjusted) . . 8,283 0.940 . . . . . . . . . . . . . . . . . . . . . . . . . . . . . .
Mexican American 8–11 years . . . . . . . . . . . . . . . . 471 0.720 0.098 0.571 0.594 0.613 0.650 0.713 0.783 0.826 0.857 0.888 12–15 years . . . . . . . . . . . . . . . 821 0.901 0.084 0.759 0.793 0.819 0.850 0.902 0.958 0.979 1.003 1.038 16–19 years . . . . . . . . . . . . . . . 692 0.940 0.081 0.816 0.841 0.859 0.885 0.937 0.987 1.017 1.037 1.084 20–29 years . . . . . . . . . . . . . . . 364 0.948 0.076 0.834 0.852 0.867 0.893 0.939 0.997 1.036 1.054 1.086 30–39 years . . . . . . . . . . . . . . . 298 0.955 0.082 0.833 0.860 0.880 0.900 0.943 1.003 1.034 1.058 1.092 40–49 years . . . . . . . . . . . . . . . 372 0.953 0.074 0.826 0.860 0.880 0.898 0.953 1.003 1.026 1.039 1.070 50–59 years . . . . . . . . . . . . . . . 194 0.908 0.101 0.750 0.783 0.806 0.840 0.910 0.969 0.998 1.020 1.054 60–69 years . . . . . . . . . . . . . . . 375 0.846 0.090 0.697 0.730 0.748 0.778 0.850 0.908 0.938 0.962 0.990 70–79 years . . . . . . . . . . . . . . . 154 *0.795 0.089 *0.640 *0.700 *0.716 *0.742 *0.795 *0.844 *0.883 *0.911 *0.938 80 years and over . . . . . . . . . . . 47 *0.745 0.090 † *0.627 *0.654 *0.691 *0.745 *0.791 *0.818 *0.857 †
20 years and over (age-adjusted) . . 1,804 0.912 . . . . . . . . . . . . . . . . . . . . . . . . . . . . . .
Non-Hispanic white 8–11 years . . . . . . . . . . . . . . . . 383 0.728 0.090 0.582 0.615 0.632 0.663 0.723 0.787 0.824 0.846 0.884 12–15 years . . . . . . . . . . . . . . . 576 0.904 0.086 0.757 0.796 0.817 0.846 0.904 0.959 0.995 1.018 1.041 16–19 years . . . . . . . . . . . . . . . 543 0.967 0.081 0.836 0.867 0.887 0.911 0.963 1.017 1.044 1.075 1.111 20–29 years . . . . . . . . . . . . . . . 583 0.971 0.072 0.851 0.883 0.897 0.920 0.968 1.017 1.042 1.057 1.098 30–39 years . . . . . . . . . . . . . . . 612 0.976 0.077 0.848 0.881 0.897 0.921 0.973 1.028 1.054 1.073 1.101 40–49 years . . . . . . . . . . . . . . . 668 0.970 0.083 0.841 0.866 0.893 0.914 0.962 1.021 1.051 1.079 1.119 50–59 years . . . . . . . . . . . . . . . 639 0.938 0.082 0.808 0.834 0.850 0.880 0.932 0.990 1.026 1.047 1.080 60–69 years . . . . . . . . . . . . . . . 644 0.894 0.089 0.752 0.779 0.802 0.832 0.891 0.948 0.986 1.010 1.050 70–79 years . . . . . . . . . . . . . . . 429 0.838 0.088 0.691 0.724 0.748 0.782 0.831 0.896 0.929 0.954 0.984 80 years and over . . . . . . . . . . . 457 0.782 0.091 0.633 0.666 0.695 0.720 0.775 0.840 0.875 0.896 0.939
20 years and over (age-adjusted) . . 4,032 0.939 . . . . . . . . . . . . . . . . . . . . . . . . . . . . . .
Non-Hispanic black 8–11 years . . . . . . . . . . . . . . . . 490 0.768 0.097 0.610 0.652 0.669 0.699 0.761 0.835 0.873 0.895 0.933 12–15 years . . . . . . . . . . . . . . . 737 0.960 0.086 0.818 0.848 0.873 0.902 0.959 1.017 1.052 1.071 1.106 16–19 years . . . . . . . . . . . . . . . 609 1.012 0.087 0.872 0.901 0.920 0.950 1.012 1.068 1.104 1.128 1.157 20–29 years . . . . . . . . . . . . . . . 297 1.023 0.085 0.890 0.911 0.931 0.958 1.022 1.081 1.111 1.135 1.167 30–39 years . . . . . . . . . . . . . . . 333 1.023 0.085 0.883 0.912 0.937 0.968 1.020 1.075 1.108 1.128 1.170 40–49 years . . . . . . . . . . . . . . . 398 1.023 0.084 0.900 0.919 0.933 0.962 1.017 1.075 1.113 1.133 1.158 50–59 years . . . . . . . . . . . . . . . 250 0.974 0.095 0.818 0.854 0.878 0.917 0.967 1.033 1.069 1.093 1.124 60–69 years . . . . . . . . . . . . . . . 306 0.940 0.096 0.783 0.813 0.840 0.872 0.940 0.998 1.038 1.059 1.098 70–79 years . . . . . . . . . . . . . . . 124 0.874 0.090 0.708 0.769 0.791 0.808 0.875 0.938 0.963 0.988 1.026 80 years and over . . . . . . . . . . . 58 *0.817 0.104 *0.656 *0.689 *0.703 *0.741 *0.809 *0.885 *0.908 *0.931 †
20 years and over (age-adjusted) . . 1,766 0.985 . . . . . . . . . . . . . . . . . . . . . . . . . . . . . .
. . . Category not applicable.
* Figure does not meet standards of reliability or precision; relative standard error (standard error divided by estimate times 100) is 30%–39% or estimate is based on less than 12 degrees of freedom.
† Standard error not calculated by SUDAAN software.
NOTE: g/cm2 is grams per centimeter squared.
SOURCE: National Health and Nutrition Examination Survey, 1999–2006.

Series 11, No. 253 [ Page 19
Table 7. Body trunk bone area (cm2) of persons aged 8 years and over, by sex, race and ethnicity, and age: United States, 1999–2006
Percentile Sample Standard
Sex, race and ethnicity, and age size Mean deviation 5th 10th 15th 25th 50th 75th 85th 90th 95th
Male
All races and ethnicities 8–11 years . . . . . . . . . . . . . . . . 1,421 419.10 52.69 341.65 361.07 370.11 385.47 412.65 448.76 471.22 484.79 509.32 12–15 years . . . . . . . . . . . . . . . 2,264 576.40 103.89 418.35 440.14 459.39 492.82 577.24 653.73 686.39 711.72 748.60 16–19 years . . . . . . . . . . . . . . . 2,309 705.52 76.00 583.55 611.72 629.89 653.07 705.47 752.23 782.81 799.00 827.14 20–29 years . . . . . . . . . . . . . . . 1,530 718.17 78.46 596.24 623.85 641.73 665.87 713.24 762.72 793.28 815.06 853.92 30–39 years . . . . . . . . . . . . . . . 1,450 711.14 78.29 594.63 617.05 631.63 658.40 708.50 758.10 781.92 804.23 846.15 40–49 years . . . . . . . . . . . . . . . 1,549 709.95 75.69 594.50 619.07 634.33 658.04 707.08 753.50 787.76 804.03 837.08 50–59 years . . . . . . . . . . . . . . . 1,187 696.94 76.39 573.23 602.27 621.06 644.46 692.74 746.14 777.61 792.69 824.34 60–69 years . . . . . . . . . . . . . . . 1,350 691.61 78.05 571.78 596.26 612.77 637.64 692.65 740.21 768.60 787.99 822.96 70–79 years . . . . . . . . . . . . . . . 825 665.80 76.50 540.26 567.46 585.70 612.30 664.91 717.67 743.46 761.59 794.72 80 years and over . . . . . . . . . . . 501 631.20 73.31 513.34 538.97 553.43 578.90 630.22 679.72 708.69 723.09 752.54
20 years and over (age-adjusted) . . 8,392 700.49 . . . . . . . . . . . . . . . . . . . . . . . . . . . . . .
Mexican American 8–11 years . . . . . . . . . . . . . . . . 468 420.33 55.63 349.08 361.07 369.72 384.58 409.53 443.47 476.42 504.19 529.20 12–15 years . . . . . . . . . . . . . . . 777 572.53 97.80 412.69 439.69 463.05 498.84 575.52 639.58 671.75 699.53 736.67 16–19 years . . . . . . . . . . . . . . . 783 673.42 72.97 566.84 588.20 602.57 625.88 666.50 711.77 742.98 767.29 793.23 20–29 years . . . . . . . . . . . . . . . 444 678.57 67.66 575.66 594.40 609.26 630.30 675.13 719.16 742.38 763.25 791.26 30–39 years . . . . . . . . . . . . . . . 337 674.91 65.48 573.01 596.41 612.86 633.34 670.14 710.91 741.04 758.85 786.71 40–49 years . . . . . . . . . . . . . . . 381 670.58 69.30 562.86 587.06 602.15 626.65 665.45 714.17 735.66 749.50 776.71 50–59 years . . . . . . . . . . . . . . . 174 661.29 63.07 570.19 582.50 600.59 614.92 657.69 696.74 728.89 742.49 764.48 60–69 years . . . . . . . . . . . . . . . 348 664.45 67.25 552.21 578.01 592.39 622.58 662.22 703.43 728.19 746.53 786.68 70–79 years . . . . . . . . . . . . . . . 164 *631.38 64.80 *509.39 *541.95 *563.46 *590.54 *629.49 *676.87 *696.35 *709.58 *732.54 80 years and over . . . . . . . . . . . 48 *612.58 77.77 *466.71 *481.97 *517.80 *556.09 *613.57 *668.36 *688.36 *700.02 †
20 years and over (age-adjusted) . . 1,896 664.95 . . . . . . . . . . . . . . . . . . . . . . . . . . . . . .
Non-Hispanic white 8–11 years . . . . . . . . . . . . . . . . 369 421.65 52.70 337.53 363.26 373.64 388.14 418.81 452.34 472.86 483.57 505.45 12–15 years . . . . . . . . . . . . . . . 578 583.31 106.46 426.90 447.07 463.93 493.67 582.19 664.01 699.14 721.84 754.57 16–19 years . . . . . . . . . . . . . . . 591 715.42 73.63 593.88 625.76 642.14 668.37 712.99 760.72 790.04 805.05 835.60 20–29 years . . . . . . . . . . . . . . . 617 727.41 74.76 610.49 642.49 655.95 677.33 723.28 768.73 802.13 818.93 852.46 30–39 years . . . . . . . . . . . . . . . 647 720.72 78.27 609.05 626.45 643.38 669.30 718.09 766.95 789.55 816.80 856.92 40–49 years . . . . . . . . . . . . . . . 700 720.11 74.22 609.12 631.92 645.51 670.56 714.66 762.99 793.97 812.62 848.51 50–59 years . . . . . . . . . . . . . . . 683 703.81 75.40 582.39 607.81 630.47 653.02 700.31 755.53 783.25 798.35 826.69 60–69 years . . . . . . . . . . . . . . . 623 699.95 75.50 584.19 606.48 621.62 646.86 699.67 745.66 775.04 794.36 827.55 70–79 years . . . . . . . . . . . . . . . 496 672.53 75.51 551.01 576.28 591.51 618.90 672.24 723.07 749.10 766.47 797.07 80 years and over . . . . . . . . . . . 398 632.47 72.14 520.33 541.52 556.72 582.54 631.47 679.13 709.07 721.74 750.94
20 years and over (age-adjusted) . . 4,164 708.96 . . . . . . . . . . . . . . . . . . . . . . . . . . . . . .
Non-Hispanic black 8–11 years . . . . . . . . . . . . . . . . 469 414.95 53.36 340.40 357.37 365.48 378.49 409.90 441.00 466.76 486.96 512.89 12–15 years . . . . . . . . . . . . . . . 745 572.79 101.41 412.96 434.77 462.90 496.86 571.80 641.88 681.10 695.08 737.72 16–19 years . . . . . . . . . . . . . . . 757 697.21 80.46 574.34 604.50 620.28 644.23 691.96 742.87 772.14 797.33 840.11 20–29 years . . . . . . . . . . . . . . . 325 722.19 83.72 606.10 621.01 639.18 663.59 716.70 771.93 799.92 824.42 854.81 30–39 years . . . . . . . . . . . . . . . 310 717.78 79.30 602.25 620.86 633.74 660.28 713.46 764.52 787.51 812.12 850.74 40–49 years . . . . . . . . . . . . . . . 366 696.81 74.56 585.64 601.65 620.37 640.30 690.23 742.55 771.73 791.92 819.64 50–59 years . . . . . . . . . . . . . . . 240 690.96 77.97 566.31 588.45 613.93 637.60 689.01 737.53 766.20 781.46 822.85 60–69 years . . . . . . . . . . . . . . . 303 679.63 78.82 559.96 585.05 600.79 624.44 675.84 725.24 756.47 781.46 811.70 70–79 years . . . . . . . . . . . . . . . 114 647.22 70.40 529.53 544.68 568.73 599.23 646.82 696.54 718.97 742.12 766.74 80 years and over . . . . . . . . . . . 36 *626.63 75.39 † *517.10 *535.83 *572.45 *619.93 *673.57 *705.53 *727.16 †
20 years and over (age-adjusted) . . 1,694 695.90 . . . . . . . . . . . . . . . . . . . . . . . . . . . . . .
See footnotes at end of table.

Page 20 [ Series 11, No. 253
Table 7. Body trunk bone area (cm2) of persons aged 8 years and over, by sex, race and ethnicity, and age: United States, 1999–2006—Con.
Percentile Sample Standard
Sex, race and ethnicity, and age size Mean deviation 5th 10th 15th 25th 50th 75th 85th 90th 95th
Female
All races and ethnicities 8–11 years . . . . . . . . . . . . . . . . 1,465 421.28 66.04 329.92 344.44 358.27 375.69 411.27 459.94 488.37 514.10 546.04 12–15 years . . . . . . . . . . . . . . . 2,318 571.19 70.46 455.11 481.54 497.48 524.48 570.35 617.93 643.80 659.98 686.33 16–19 years . . . . . . . . . . . . . . . 2,027 615.73 62.88 519.27 538.45 551.32 571.08 615.33 653.88 676.98 692.41 723.07 20–29 years . . . . . . . . . . . . . . . 1,378 625.48 64.67 525.96 546.27 560.40 582.15 621.38 665.68 689.82 706.65 733.23 30–39 years . . . . . . . . . . . . . . . 1,372 626.05 67.03 524.39 544.86 560.35 579.86 620.90 664.32 691.28 710.24 744.84 40–49 years . . . . . . . . . . . . . . . 1,570 624.34 67.21 524.44 544.59 558.07 579.38 618.36 664.95 693.01 708.52 740.43 50–59 years . . . . . . . . . . . . . . . 1,200 609.59 66.15 507.37 528.00 543.74 567.40 605.19 649.77 672.46 690.14 722.58 60–69 years . . . . . . . . . . . . . . . 1,419 591.82 68.82 485.33 507.31 523.15 543.81 589.14 637.04 657.66 672.56 700.97 70–79 years . . . . . . . . . . . . . . . 750 563.81 63.37 455.60 485.13 497.01 524.70 563.39 604.92 626.41 643.59 666.25 80 years and over . . . . . . . . . . . 594 521.99 60.87 426.07 444.23 459.21 481.71 520.38 558.00 585.56 600.86 626.62
20 years and over (age-adjusted) . . 8,283 609.51 . . . . . . . . . . . . . . . . . . . . . . . . . . . . . .
Mexican American 8–11 years . . . . . . . . . . . . . . . . 471 416.06 65.49 323.09 341.44 352.55 371.51 406.76 455.49 483.98 501.35 542.76 12–15 years . . . . . . . . . . . . . . . 821 560.87 65.09 455.43 480.38 495.50 516.54 560.25 600.83 625.66 643.81 666.29 16–19 years . . . . . . . . . . . . . . . 692 593.13 63.17 502.10 518.43 529.31 548.19 586.42 630.17 653.56 671.71 701.33 20–29 years . . . . . . . . . . . . . . . 364 608.04 57.26 511.68 531.41 546.42 569.30 605.93 643.52 662.39 675.79 702.93 30–39 years . . . . . . . . . . . . . . . 298 602.77 59.66 512.65 531.61 545.51 563.88 598.79 635.68 657.09 675.29 701.22 40–49 years . . . . . . . . . . . . . . . 372 605.87 57.24 511.69 531.00 549.06 570.34 603.47 640.80 662.21 679.34 701.00 50–59 years . . . . . . . . . . . . . . . 194 590.47 59.80 497.03 517.04 521.59 547.38 590.54 633.06 656.27 671.74 680.31 60–69 years . . . . . . . . . . . . . . . 375 564.36 58.59 471.53 491.63 504.05 526.35 562.40 600.38 627.50 638.60 656.78 70–79 years . . . . . . . . . . . . . . . 154 *542.34 63.82 *438.52 *466.71 *486.52 *502.22 *539.02 *579.98 *601.95 *622.06 *656.39 80 years and over . . . . . . . . . . . 47 *493.86 54.06 *401.30 *418.86 *426.87 *446.13 *502.17 *528.42 *542.55 *552.35 *570.36
20 years and over (age-adjusted) . . 1,804 588.48 . . . . . . . . . . . . . . . . . . . . . . . . . . . . . .
Non-Hispanic white 8–11 years . . . . . . . . . . . . . . . . 383 424.30 64.99 333.38 347.02 362.88 379.81 413.67 462.13 486.41 513.85 548.04 12–15 years . . . . . . . . . . . . . . . 576 574.17 71.42 450.30 478.31 499.56 525.90 576.28 622.06 646.90 660.78 685.13 16–19 years . . . . . . . . . . . . . . . 543 623.42 57.89 529.32 552.10 564.37 584.89 622.86 657.34 679.16 695.46 720.88 20–29 years . . . . . . . . . . . . . . . 583 633.60 61.87 540.62 559.16 571.62 591.01 628.26 671.58 693.44 709.56 741.71 30–39 years . . . . . . . . . . . . . . . 612 632.54 66.40 532.77 551.92 567.53 585.59 628.06 672.98 698.76 714.30 750.13 40–49 years . . . . . . . . . . . . . . . 668 630.00 67.01 528.09 549.94 563.54 583.97 624.06 669.64 698.89 715.81 744.28 50–59 years . . . . . . . . . . . . . . . 639 614.70 63.74 516.67 537.05 551.78 574.30 608.89 651.48 675.32 690.59 722.22 60–69 years . . . . . . . . . . . . . . . 644 596.24 67.80 489.40 513.61 529.94 549.25 593.26 640.17 659.10 672.44 701.79 70–79 years . . . . . . . . . . . . . . . 429 567.91 62.11 461.22 490.09 503.35 528.88 569.88 609.10 628.06 645.13 668.45 80 years and over . . . . . . . . . . . 457 525.07 59.51 433.67 448.96 462.69 484.64 523.68 559.04 587.27 605.13 628.73
20 years and over (age-adjusted) . . 4,032 615.33 . . . . . . . . . . . . . . . . . . . . . . . . . . . . . .
Non-Hispanic black 8–11 years . . . . . . . . . . . . . . . . 490 416.21 72.11 322.46 335.92 346.62 364.06 401.96 460.47 491.84 514.35 546.34 12–15 years . . . . . . . . . . . . . . . 737 571.26 72.39 462.87 486.46 497.98 522.55 563.45 618.90 649.04 670.37 698.82 16–19 years . . . . . . . . . . . . . . . 609 612.44 75.46 510.56 524.39 538.83 557.93 604.38 652.94 684.09 704.87 751.57 20–29 years . . . . . . . . . . . . . . . 297 622.37 71.39 514.01 543.30 557.63 574.00 614.32 665.70 690.11 710.17 751.48 30–39 years . . . . . . . . . . . . . . . 333 632.21 73.55 527.21 546.18 558.85 579.97 625.72 673.54 705.58 728.10 764.52 40–49 years . . . . . . . . . . . . . . . 398 623.18 69.50 519.48 538.27 552.41 579.32 617.22 659.01 685.11 699.41 748.58 50–59 years . . . . . . . . . . . . . . . 250 610.22 69.23 500.96 523.48 540.91 560.88 606.70 651.70 682.45 703.69 723.90 60–69 years . . . . . . . . . . . . . . . 306 601.33 73.39 489.60 511.06 527.59 548.60 595.14 653.20 677.43 690.69 722.29 70–79 years . . . . . . . . . . . . . . . 124 563.27 69.15 460.70 483.01 489.61 508.98 556.65 611.50 637.71 652.78 681.04 80 years and over . . . . . . . . . . . 58 *520.54 62.77 *414.07 *433.64 *451.91 *475.60 *514.72 *563.87 *583.64 *593.58 *618.85
20 years and over (age-adjusted) . . 1,766 610.96 . . . . . . . . . . . . . . . . . . . . . . . . . . . . . .
. . . Category not applicable.
* Figure does not meet standards of reliability or precision; relative standard error (standard error divided by estimate times 100) is 30%–39% or estimate is based on less than 12 degrees of freedom.
† Standard error not calculated by SUDAAN software.
NOTE: cm2 is centimeter squared.
SOURCE: National Health and Nutrition Examination Survey, 1999–2006.

Series 11, No. 253 [ Page 21
Table 8. Body trunk bone mineral content (g) of persons aged 8 years and over, by sex, race and ethnicity, and age: United States, 1999–2006
Percentile Sample Standard
Sex, race and ethnicity, and age size Mean deviation 5th 10th 15th 25th 50th 75th 85th 90th 95th
Male
All races and ethnicities 8–11 years . . . . . . . . . . . . . . . . 1,421 276.81 57.47 193.88 214.73 222.79 236.46 270.43 307.03 330.15 346.44 385.51 12–15 years . . . . . . . . . . . . . . . 2,264 490.33 157.04 275.57 301.72 323.43 364.37 476.37 591.87 663.47 702.21 762.11 16–19 years . . . . . . . . . . . . . . . 2,309 715.23 146.48 500.77 541.87 569.96 613.28 702.94 802.18 863.67 903.01 959.36 20–29 years . . . . . . . . . . . . . . . 1,530 731.32 148.69 523.23 563.42 588.82 631.79 716.52 810.37 868.87 929.38 994.34 30–39 years . . . . . . . . . . . . . . . 1,450 713.02 148.03 508.05 547.87 573.39 611.41 692.20 792.72 849.42 899.48 967.45 40–49 years . . . . . . . . . . . . . . . 1,549 706.91 140.87 500.73 546.25 573.12 608.77 692.78 789.81 841.07 883.71 956.40 50–59 years . . . . . . . . . . . . . . . 1,187 678.84 141.82 475.12 514.55 537.64 578.54 665.19 765.71 817.87 854.72 915.46 60–69 years . . . . . . . . . . . . . . . 1,350 671.61 142.51 459.82 498.78 531.67 575.16 662.35 756.18 810.08 861.37 938.42 70–79 years . . . . . . . . . . . . . . . 825 623.29 136.00 422.09 457.58 479.54 524.02 611.96 712.16 766.58 798.23 849.85 80 years and over . . . . . . . . . . . 501 571.87 135.05 373.78 411.90 436.21 474.73 558.07 648.98 707.35 755.00 824.65
20 years and over (age-adjusted) . . 8,392 691.50 . . . . . . . . . . . . . . . . . . . . . . . . . . . . . .
Mexican American 8–11 years . . . . . . . . . . . . . . . . 468 275.43 62.04 196.18 213.49 220.62 232.59 262.77 304.77 332.69 362.06 399.16 12–15 years . . . . . . . . . . . . . . . 777 484.00 153.39 259.25 297.99 324.02 370.74 464.73 578.72 639.55 688.21 761.20 16–19 years . . . . . . . . . . . . . . . 783 653.34 133.05 469.38 501.15 528.78 565.34 634.72 724.39 783.05 830.97 886.77 20–29 years . . . . . . . . . . . . . . . 444 662.86 119.15 488.48 527.21 551.06 576.18 650.35 735.60 776.26 816.76 877.57 30–39 years . . . . . . . . . . . . . . . 337 644.44 113.26 483.53 511.72 535.29 570.83 637.30 703.30 756.82 780.67 843.92 40–49 years . . . . . . . . . . . . . . . 381 638.08 123.74 456.00 493.40 517.61 557.75 622.11 706.14 761.71 797.46 862.75 50–59 years . . . . . . . . . . . . . . . 174 623.79 120.55 441.67 475.80 505.00 543.34 609.57 700.92 747.01 769.51 822.43 60–69 years . . . . . . . . . . . . . . . 348 623.33 123.00 457.12 482.17 502.74 535.70 605.03 690.54 738.35 774.89 837.36 70–79 years . . . . . . . . . . . . . . . 164 575.26 118.27 *367.99 *423.39 *460.01 *491.02 *577.26 *658.47 *684.31 *729.21 *769.97 80 years and over . . . . . . . . . . . 48 529.07 123.37 *330.21 *367.20 *408.65 *431.58 *509.38 *596.26 *653.82 *696.14 †
20 years and over (age-adjusted) . . 1,896 629.97 . . . . . . . . . . . . . . . . . . . . . . . . . . . . . .
Non-Hispanic white 8–11 years . . . . . . . . . . . . . . . . 369 277.61 56.48 188.27 215.97 225.41 237.21 273.02 310.56 331.27 344.07 384.49 12–15 years . . . . . . . . . . . . . . . 578 495.39 159.32 279.02 304.12 324.20 363.32 481.55 601.09 673.34 710.37 769.96 16–19 years . . . . . . . . . . . . . . . 591 724.50 141.06 511.03 549.28 581.34 624.42 717.90 813.28 869.35 904.66 961.93 20–29 years . . . . . . . . . . . . . . . 617 736.45 139.37 536.62 579.85 605.09 643.87 723.69 811.46 861.00 917.37 982.87 30–39 years . . . . . . . . . . . . . . . 647 722.72 146.27 515.99 558.09 585.01 627.94 701.72 807.13 851.21 900.43 962.67 40–49 years . . . . . . . . . . . . . . . 700 716.59 137.69 512.69 562.67 584.02 620.11 703.93 798.91 846.79 886.16 961.51 50–59 years . . . . . . . . . . . . . . . 683 682.69 137.98 481.77 520.40 546.05 590.29 668.15 768.73 817.85 854.29 910.61 60–69 years . . . . . . . . . . . . . . . 623 678.08 138.80 470.43 507.25 541.88 583.92 669.07 758.77 810.98 862.55 941.65 70–79 years . . . . . . . . . . . . . . . 496 630.99 136.04 430.96 461.80 481.90 531.15 619.71 723.23 776.68 805.82 855.65 80 years and over . . . . . . . . . . . 398 570.62 131.12 376.21 414.73 438.22 477.85 556.49 647.27 699.33 748.06 802.50
20 years and over (age-adjusted) . . 4,164 698.43 . . . . . . . . . . . . . . . . . . . . . . . . . . . . . .
Non-Hispanic black 8–11 years . . . . . . . . . . . . . . . . 469 285.38 61.86 202.34 216.44 229.11 244.56 275.20 314.57 339.24 358.54 395.66 12–15 years . . . . . . . . . . . . . . . 745 506.26 161.96 286.70 312.61 336.54 381.08 491.34 608.26 673.88 713.55 781.15 16–19 years . . . . . . . . . . . . . . . 757 746.80 168.76 514.82 561.82 593.25 632.88 725.73 834.07 902.75 936.62 1027.88 20–29 years . . . . . . . . . . . . . . . 325 806.16 179.98 557.17 609.10 640.97 682.14 783.31 908.02 980.69 1014.26 1133.05 30–39 years . . . . . . . . . . . . . . . 310 780.45 163.34 558.05 593.65 613.20 668.59 757.09 868.19 939.10 994.99 1072.70 40–49 years . . . . . . . . . . . . . . . 366 732.60 160.15 519.35 551.75 577.16 618.99 707.04 818.41 893.43 943.01 1000.70 50–59 years . . . . . . . . . . . . . . . 240 729.87 162.66 501.35 540.94 564.94 617.24 714.65 821.92 884.56 936.06 1014.83 60–69 years . . . . . . . . . . . . . . . 303 708.40 151.41 487.59 523.88 566.53 606.22 695.86 792.50 855.18 899.13 990.87 70–79 years . . . . . . . . . . . . . . . 114 630.85 130.73 431.29 459.98 494.14 539.19 627.61 708.74 754.62 796.38 834.93 80 years and over . . . . . . . . . . . 36 616.65 166.37 † *413.76 *447.08 *471.86 *579.47 *699.66 *762.42 *864.33 †
20 years and over (age-adjusted) . . 1,694 739.59 . . . . . . . . . . . . . . . . . . . . . . . . . . . . . .
See footnotes at end of table.

Page 22 [ Series 11, No. 253
Table 8. Body trunk bone mineral content (g) of persons aged 8 years and over, by sex, race and ethnicity, and age: United States, 1999–2006—Con.
Percentile Sample Standard
Sex, race and ethnicity, and age size Mean deviation 5th 10th 15th 25th 50th 75th 85th 90th 95th
Female
All races and ethnicities 8–11 years . . . . . . . . . . . . . . . . 1,465 285.59 80.31 182.48 202.03 211.18 227.76 266.78 326.01 366.46 398.36 440.93 12–15 years . . . . . . . . . . . . . . . 2,318 493.68 107.63 327.28 359.72 381.36 418.86 489.73 561.83 605.69 633.83 677.83 16–19 years . . . . . . . . . . . . . . . 2,027 571.01 103.83 411.68 442.43 468.34 498.37 561.18 634.75 675.91 709.73 749.80 20–29 years . . . . . . . . . . . . . . . 1,378 583.20 101.41 435.36 461.88 483.16 510.55 574.47 644.14 683.26 714.78 754.81 30–39 years . . . . . . . . . . . . . . . 1,372 588.59 107.44 433.16 461.23 480.10 513.86 578.45 650.16 699.14 726.32 770.80 40–49 years . . . . . . . . . . . . . . . 1,570 581.20 112.82 422.79 452.23 472.94 502.54 566.62 647.51 694.02 726.90 779.68 50–59 years . . . . . . . . . . . . . . . 1,200 540.99 109.30 381.70 417.87 434.42 463.22 530.16 605.76 647.16 681.58 734.88 60–69 years . . . . . . . . . . . . . . . 1,419 500.99 109.69 344.29 372.35 391.13 425.26 489.86 566.51 608.30 639.07 698.03 70–79 years . . . . . . . . . . . . . . . 750 450.87 94.14 309.24 336.88 356.21 385.45 448.20 504.95 541.83 569.96 612.69 80 years and over . . . . . . . . . . . 594 392.26 88.07 259.52 281.57 301.17 332.29 381.80 443.19 479.73 504.86 543.55
20 years and over (age-adjusted) . . 8,283 549.08 . . . . . . . . . . . . . . . . . . . . . . . . . . . . . .
Mexican American 8–11 years . . . . . . . . . . . . . . . . 471 277.71 80.01 178.01 191.42 200.76 222.46 261.07 318.95 356.80 377.28 445.57 12–15 years . . . . . . . . . . . . . . . 821 478.39 97.95 321.39 357.48 382.07 413.82 476.02 539.95 570.38 595.07 640.71 16–19 years . . . . . . . . . . . . . . . 692 533.27 97.64 393.56 417.72 439.83 465.39 525.91 586.04 622.04 654.47 707.69 20–29 years . . . . . . . . . . . . . . . 364 552.16 91.61 414.32 443.96 459.85 483.00 545.00 613.24 651.19 670.12 699.98 30–39 years . . . . . . . . . . . . . . . 298 553.38 100.07 420.25 442.47 463.45 488.72 544.16 605.17 639.76 669.15 724.09 40–49 years . . . . . . . . . . . . . . . 372 552.79 91.83 411.65 435.35 457.33 492.09 549.56 611.74 641.58 666.72 708.28 50–59 years . . . . . . . . . . . . . . . 194 510.00 108.37 355.81 377.68 400.08 426.27 501.37 579.09 605.43 634.74 698.63 60–69 years . . . . . . . . . . . . . . . 375 453.46 93.79 307.00 337.70 358.45 389.20 447.59 514.00 546.33 570.40 614.38 70–79 years . . . . . . . . . . . . . . . 154 *415.36 91.71 *268.63 *301.60 *329.92 *357.63 *412.38 *460.89 *494.28 *526.25 *574.87 80 years and over . . . . . . . . . . . 47 *360.14 80.64 *226.14 *245.24 *273.68 *313.99 *353.62 *403.99 *429.91 *438.81 †
20 years and over (age-adjusted) . . 1,804 515.62 . . . . . . . . . . . . . . . . . . . . . . . . . . . . . .
Non-Hispanic white 8–11 years . . . . . . . . . . . . . . . . 383 286.06 77.68 182.39 203.78 214.08 229.98 269.88 324.70 362.15 397.34 430.21 12–15 years . . . . . . . . . . . . . . . 576 492.80 109.10 320.65 355.98 375.62 416.21 490.65 565.21 605.92 629.72 675.82 16–19 years . . . . . . . . . . . . . . . 543 578.86 98.32 421.17 458.76 482.49 512.15 574.97 642.50 678.89 711.25 740.33 20–29 years . . . . . . . . . . . . . . . 583 587.74 94.73 450.16 471.35 491.33 518.24 578.46 647.58 682.53 714.00 743.35 30–39 years . . . . . . . . . . . . . . . 612 591.35 103.65 438.71 465.34 486.00 517.34 581.92 650.16 700.33 724.82 765.85 40–49 years . . . . . . . . . . . . . . . 668 583.46 111.01 425.93 456.35 477.39 503.40 569.40 648.16 694.59 727.84 780.25 50–59 years . . . . . . . . . . . . . . . 639 544.79 104.66 398.81 428.79 444.13 470.75 532.16 605.28 643.06 680.48 730.33 60–69 years . . . . . . . . . . . . . . . 644 504.20 107.90 351.89 376.52 393.91 429.13 494.15 567.09 608.45 637.90 696.09 70–79 years . . . . . . . . . . . . . . . 429 454.59 92.86 310.93 340.18 361.11 392.49 451.74 508.04 543.30 570.83 609.62 80 years and over . . . . . . . . . . . 457 394.57 86.63 264.25 285.37 304.07 336.04 384.75 444.44 482.10 506.62 543.94
20 years and over (age-adjusted) . . 4,032 552.32 . . . . . . . . . . . . . . . . . . . . . . . . . . . . . .
Non-Hispanic black 8–11 years . . . . . . . . . . . . . . . . 490 293.29 90.92 184.22 201.77 212.63 229.16 271.50 341.27 383.83 412.36 462.20 12–15 years . . . . . . . . . . . . . . . 737 522.49 114.41 350.20 381.05 407.96 444.55 511.70 594.73 643.81 675.76 720.58 16–19 years . . . . . . . . . . . . . . . 609 599.00 121.68 430.03 461.59 477.94 508.50 585.31 666.98 722.55 761.78 812.33 20–29 years . . . . . . . . . . . . . . . 297 616.05 118.68 448.72 481.88 503.95 537.23 600.40 680.02 730.77 758.10 827.09 30–39 years . . . . . . . . . . . . . . . 333 630.21 121.81 455.55 485.41 510.82 542.34 616.70 700.93 741.86 764.86 840.15 40–49 years . . . . . . . . . . . . . . . 398 621.72 125.66 449.83 471.90 495.65 532.37 612.10 689.67 735.62 771.24 836.86 50–59 years . . . . . . . . . . . . . . . 250 573.80 121.67 405.30 430.58 450.15 482.36 562.33 644.05 705.06 736.49 781.84 60–69 years . . . . . . . . . . . . . . . 306 544.80 118.49 371.41 398.59 418.84 461.24 535.02 612.05 668.51 704.25 749.36 70–79 years . . . . . . . . . . . . . . . 124 474.31 103.29 313.70 349.26 366.07 403.60 459.76 533.87 585.05 618.99 † 80 years and over . . . . . . . . . . . 58 *415.78 98.84 *266.49 *295.71 *317.14 *343.27 *415.34 *463.02 *488.74 *521.71 †
20 years and over (age-adjusted) . . 1,766 585.35 . . . . . . . . . . . . . . . . . . . . . . . . . . . . . .
. . . Category not applicable.
* Figure does not meet standards of reliability or precision; relative standard error (standard error divided by estimate times 100) is 30%–39% or estimate is based on less than 12 degrees of freedom.
† Standard error not calculated by SUDAAN software.
NOTE: g is grams.
SOURCE: National Health and Nutrition Examination Survey, 1999–2006.

Series 11, No. 253 [ Page 23
Table 9. Body trunk bone mineral density (g/cm2) of persons aged 8 years and over, by sex, race and ethnicity, and age: United States, 1999–2006
Percentile Sample Standard
Sex, race and ethnicity, and age size Mean deviation 5th 10th 15th 25th 50th 75th 85th 90th 95th
Male
All races and ethnicities 8–11 years . . . . . . . . . . . . . . . . 1,421 0.655 0.064 0.556 0.574 0.586 0.609 0.651 0.692 0.719 0.738 0.772 12–15 years . . . . . . . . . . . . . . . 2,264 0.831 0.130 0.642 0.670 0.694 0.732 0.819 0.919 0.970 1.007 1.060 16–19 years . . . . . . . . . . . . . . . 2,309 1.006 0.123 0.820 0.861 0.883 0.916 0.995 1.083 1.132 1.165 1.226 20–29 years . . . . . . . . . . . . . . . 1,530 1.011 0.119 0.835 0.872 0.893 0.929 1.001 1.078 1.131 1.166 1.214 30–39 years . . . . . . . . . . . . . . . 1,450 0.995 0.122 0.819 0.852 0.872 0.907 0.980 1.066 1.112 1.145 1.217 40–49 years . . . . . . . . . . . . . . . 1,549 0.989 0.118 0.813 0.844 0.869 0.908 0.980 1.062 1.103 1.134 1.194 50–59 years . . . . . . . . . . . . . . . 1,187 0.967 0.125 0.776 0.807 0.840 0.881 0.958 1.045 1.093 1.120 1.182 60–69 years . . . . . . . . . . . . . . . 1,350 0.963 0.128 0.765 0.804 0.832 0.875 0.959 1.039 1.093 1.135 1.185 70–79 years . . . . . . . . . . . . . . . 825 0.928 0.128 0.729 0.769 0.799 0.838 0.917 1.011 1.067 1.099 1.152 80 years and over . . . . . . . . . . . 501 0.896 0.130 0.708 0.748 0.765 0.798 0.887 0.969 1.023 1.065 1.133
20 years and over (age-adjusted) . . 8,392 0.979 . . . . . . . . . . . . . . . . . . . . . . . . . . . . . .
Mexican American 8–11 years . . . . . . . . . . . . . . . . 468 0.649 0.068 0.551 0.567 0.580 0.599 0.640 0.691 0.720 0.742 0.770 12–15 years . . . . . . . . . . . . . . . 777 0.826 0.133 0.634 0.660 0.688 0.731 0.813 0.905 0.963 1.004 1.067 16–19 years . . . . . . . . . . . . . . . 783 0.962 0.111 0.793 0.827 0.851 0.885 0.954 1.022 1.077 1.109 1.164 20–29 years . . . . . . . . . . . . . . . 444 0.971 0.103 0.809 0.845 0.871 0.901 0.964 1.031 1.065 1.099 1.159 30–39 years . . . . . . . . . . . . . . . 337 0.950 0.099 0.801 0.828 0.849 0.877 0.941 1.013 1.048 1.084 1.128 40–49 years . . . . . . . . . . . . . . . 381 0.946 0.112 0.773 0.808 0.835 0.869 0.935 1.017 1.058 1.087 1.136 50–59 years . . . . . . . . . . . . . . . 174 0.937 0.118 0.758 0.784 0.807 0.850 0.930 1.013 1.054 1.082 1.137 60–69 years . . . . . . . . . . . . . . . 348 0.932 0.117 0.768 0.792 0.812 0.855 0.916 0.998 1.039 1.081 1.146 70–79 years . . . . . . . . . . . . . . . 164 *0.904 0.123 *0.703 *0.735 *0.768 *0.805 *0.915 *0.987 *1.030 *1.046 *1.097 80 years and over . . . . . . . . . . . 48 *0.855 0.113 *0.701 *0.725 *0.755 *0.769 *0.821 *0.912 *0.981 *1.017 *1.069
20 years and over (age-adjusted) . . 1,896 0.941 . . . . . . . . . . . . . . . . . . . . . . . . . . . . . .
Non-Hispanic white 8–11 years . . . . . . . . . . . . . . . . 369 0.653 0.061 0.553 0.574 0.586 0.610 0.650 0.689 0.715 0.733 0.761 12–15 years . . . . . . . . . . . . . . . 578 0.829 0.128 0.644 0.668 0.690 0.729 0.819 0.914 0.970 1.007 1.054 16–19 years . . . . . . . . . . . . . . . 591 1.005 0.120 0.819 0.863 0.883 0.918 0.996 1.081 1.127 1.156 1.215 20–29 years . . . . . . . . . . . . . . . 617 1.006 0.107 0.845 0.876 0.895 0.931 0.999 1.065 1.122 1.151 1.192 30–39 years . . . . . . . . . . . . . . . 647 0.996 0.117 0.822 0.856 0.875 0.913 0.980 1.064 1.108 1.135 1.198 40–49 years . . . . . . . . . . . . . . . 700 0.989 0.112 0.816 0.850 0.872 0.910 0.984 1.060 1.099 1.126 1.187 50–59 years . . . . . . . . . . . . . . . 683 0.963 0.120 0.774 0.806 0.840 0.884 0.957 1.038 1.084 1.112 1.158 60–69 years . . . . . . . . . . . . . . . 623 0.962 0.124 0.771 0.808 0.836 0.876 0.959 1.035 1.087 1.125 1.179 70–79 years . . . . . . . . . . . . . . . 496 0.931 0.127 0.733 0.769 0.804 0.840 0.918 1.013 1.073 1.103 1.152 80 years and over . . . . . . . . . . . 398 0.893 0.125 0.709 0.750 0.766 0.799 0.883 0.966 1.016 1.057 1.120
20 years and over (age-adjusted) . . 4,164 0.977 . . . . . . . . . . . . . . . . . . . . . . . . . . . . . .
Non-Hispanic black 8–11 years . . . . . . . . . . . . . . . . 469 0.681 0.070 0.574 0.598 0.614 0.635 0.677 0.725 0.750 0.774 0.794 12–15 years . . . . . . . . . . . . . . . 745 0.864 0.138 0.675 0.699 0.718 0.757 0.850 0.951 1.000 1.048 1.112 16–19 years . . . . . . . . . . . . . . . 757 1.061 0.136 0.858 0.901 0.926 0.967 1.052 1.144 1.198 1.241 1.290 20–29 years . . . . . . . . . . . . . . . 325 1.106 0.142 0.892 0.940 0.974 1.010 1.089 1.178 1.254 1.294 1.372 30–39 years . . . . . . . . . . . . . . . 310 1.079 0.135 0.861 0.919 0.942 0.984 1.069 1.161 1.221 1.253 1.307 40–49 years . . . . . . . . . . . . . . . 366 1.043 0.144 0.839 0.879 0.904 0.945 1.026 1.123 1.179 1.219 1.298 50–59 years . . . . . . . . . . . . . . . 240 1.047 0.139 0.841 0.871 0.905 0.949 1.023 1.133 1.197 1.233 1.293 60–69 years . . . . . . . . . . . . . . . 303 1.034 0.134 0.823 0.879 0.910 0.939 1.020 1.124 1.171 1.203 1.266 70–79 years . . . . . . . . . . . . . . . 114 0.968 0.134 0.764 0.805 0.827 0.867 0.959 1.045 1.090 1.142 1.204 80 years and over . . . . . . . . . . . 36 *0.972 0.169 † *0.773 *0.791 *0.827 *0.956 *1.066 *1.127 *1.189 †
20 years and over (age-adjusted) . . 1,694 1.052 . . . . . . . . . . . . . . . . . . . . . . . . . . . . . .
See footnotes at end of table.

Page 24 [ Series 11, No. 253
Table 9. Body trunk bone mineral density (g/cm2) of persons aged 8 years and over, by sex, race and ethnicity, and age: United States, 1999–2006—Con.
Percentile Sample Standard
Sex, race and ethnicity, and age size Mean deviation 5th 10th 15th 25th 50th 75th 85th 90th 95th
Female All races and ethnicities
8–11 years . . . . . . . . . . . . . . . . 1,465 0.667 0.085 0.544 0.568 0.583 0.606 0.653 0.717 0.758 0.785 0.822 12–15 years . . . . . . . . . . . . . . . 2,318 0.855 0.100 0.694 0.728 0.753 0.786 0.854 0.920 0.955 0.984 1.028 16–19 years . . . . . . . . . . . . . . . 2,027 0.922 0.098 0.769 0.804 0.821 0.851 0.919 0.985 1.021 1.046 1.098 20–29 years . . . . . . . . . . . . . . . 1,378 0.928 0.092 0.784 0.815 0.836 0.866 0.921 0.983 1.015 1.040 1.094 30–39 years . . . . . . . . . . . . . . . 1,372 0.935 0.098 0.782 0.813 0.833 0.864 0.931 0.998 1.035 1.061 1.097 40–49 years . . . . . . . . . . . . . . . 1,570 0.925 0.106 0.764 0.800 0.819 0.852 0.915 0.989 1.036 1.061 1.106 50–59 years . . . . . . . . . . . . . . . 1,200 0.881 0.107 0.717 0.749 0.773 0.806 0.873 0.950 0.996 1.027 1.068 60–69 years . . . . . . . . . . . . . . . 1,419 0.839 0.109 0.673 0.707 0.725 0.759 0.831 0.906 0.953 0.986 1.033 70–79 years . . . . . . . . . . . . . . . 750 0.793 0.100 0.643 0.672 0.691 0.721 0.783 0.854 0.894 0.924 0.967 80 years and over . . . . . . . . . . . 594 0.744 0.102 0.590 0.625 0.643 0.676 0.736 0.807 0.843 0.864 0.925
20 years and over (age-adjusted) . . 8,283 0.893 . . . . . . . . . . . . . . . . . . . . . . . . . . . . . .
Mexican American 8–11 years . . . . . . . . . . . . . . . . 471 0.656 0.088 0.535 0.554 0.570 0.599 0.642 0.700 0.743 0.779 0.826 12–15 years . . . . . . . . . . . . . . . 821 0.845 0.095 0.686 0.726 0.750 0.786 0.845 0.905 0.935 0.960 1.001 16–19 years . . . . . . . . . . . . . . . 692 0.894 0.091 0.751 0.781 0.803 0.831 0.890 0.946 0.979 1.011 1.053 20–29 years . . . . . . . . . . . . . . . 364 0.903 0.085 0.768 0.794 0.816 0.839 0.898 0.964 0.992 1.016 1.052 30–39 years . . . . . . . . . . . . . . . 298 0.913 0.101 0.761 0.793 0.812 0.850 0.905 0.968 1.005 1.031 1.068 40–49 years . . . . . . . . . . . . . . . 372 0.908 0.091 0.759 0.792 0.811 0.843 0.907 0.969 1.003 1.021 1.056 50–59 years . . . . . . . . . . . . . . . 194 0.857 0.118 0.688 0.717 0.737 0.780 0.845 0.924 0.963 0.987 1.022 60–69 years . . . . . . . . . . . . . . . 375 0.797 0.102 0.638 0.667 0.686 0.718 0.795 0.861 0.910 0.934 0.973 70–79 years . . . . . . . . . . . . . . . 154 *0.758 0.100 *0.596 *0.633 *0.663 *0.698 *0.751 *0.816 *0.843 *0.880 *0.937 80 years and over . . . . . . . . . . . 47 *0.722 0.099 † *0.578 *0.624 *0.660 *0.719 *0.769 *0.809 *0.831 †
20 years and over (age-adjusted) . . 1,804 0.868 . . . . . . . . . . . . . . . . . . . . . . . . . . . . . .
Non-Hispanic white 8–11 years . . . . . . . . . . . . . . . . 383 0.664 0.082 0.547 0.569 0.582 0.605 0.649 0.711 0.748 0.780 0.807 12–15 years . . . . . . . . . . . . . . . 576 0.849 0.100 0.685 0.722 0.747 0.778 0.847 0.917 0.951 0.975 1.016 16–19 years . . . . . . . . . . . . . . . 543 0.923 0.093 0.776 0.810 0.825 0.853 0.920 0.987 1.017 1.041 1.090 20–29 years . . . . . . . . . . . . . . . 583 0.924 0.085 0.790 0.820 0.837 0.866 0.918 0.975 1.006 1.026 1.081 30–39 years . . . . . . . . . . . . . . . 612 0.930 0.093 0.783 0.813 0.831 0.863 0.927 0.991 1.026 1.053 1.081 40–49 years . . . . . . . . . . . . . . . 668 0.920 0.102 0.764 0.799 0.820 0.850 0.910 0.982 1.030 1.054 1.098 50–59 years . . . . . . . . . . . . . . . 639 0.881 0.100 0.727 0.756 0.778 0.809 0.873 0.948 0.988 1.020 1.065 60–69 years . . . . . . . . . . . . . . . 644 0.839 0.107 0.678 0.708 0.726 0.759 0.831 0.905 0.950 0.984 1.029 70–79 years . . . . . . . . . . . . . . . 429 0.794 0.099 0.646 0.674 0.693 0.726 0.782 0.855 0.895 0.921 0.965 80 years and over . . . . . . . . . . . 457 0.745 0.099 0.592 0.626 0.644 0.678 0.737 0.806 0.843 0.864 0.926
20 years and over (age-adjusted) . . 4,032 0.890 . . . . . . . . . . . . . . . . . . . . . . . . . . . . . .
Non-Hispanic black 8–11 years . . . . . . . . . . . . . . . . 490 0.691 0.094 0.553 0.586 0.605 0.623 0.674 0.742 0.782 0.817 0.866 12–15 years . . . . . . . . . . . . . . . 737 0.905 0.102 0.735 0.774 0.802 0.836 0.903 0.971 1.007 1.037 1.078 16–19 years . . . . . . . . . . . . . . . 609 0.971 0.101 0.805 0.839 0.865 0.901 0.965 1.039 1.076 1.102 1.144 20–29 years . . . . . . . . . . . . . . . 297 0.983 0.099 0.822 0.851 0.884 0.916 0.977 1.042 1.091 1.111 1.163 30–39 years . . . . . . . . . . . . . . . 333 0.991 0.104 0.823 0.859 0.880 0.920 0.983 1.051 1.094 1.124 1.175 40–49 years . . . . . . . . . . . . . . . 398 0.990 0.112 0.818 0.846 0.872 0.908 0.984 1.054 1.096 1.131 1.186 50–59 years . . . . . . . . . . . . . . . 250 0.933 0.119 0.756 0.789 0.809 0.845 0.923 1.011 1.060 1.079 1.138 60–69 years . . . . . . . . . . . . . . . 306 0.899 0.116 0.723 0.759 0.778 0.817 0.889 0.970 1.016 1.042 1.099 70–79 years . . . . . . . . . . . . . . . 124 0.835 0.105 0.654 0.704 0.720 0.768 0.832 0.898 0.940 0.976 1.020 80 years and over . . . . . . . . . . . 58 *0.791 0.124 *0.621 *0.651 *0.673 *0.712 *0.780 *0.844 *0.872 *0.894 †
20 years and over (age-adjusted) . . 1,766 0.949 . . . . . . . . . . . . . . . . . . . . . . . . . . . . . .
. . . Category not applicable.
* Figure does not meet standards of reliability or precision; relative standard error (standard error divided by estimate times 100) is 30%–39% or estimate is based on less than 12 degrees of freedom.
† Standard error not calculated by SUDAAN software.
NOTE: g/cm2 is grams per centimeter squared.
SOURCE: National Health and Nutrition Examination Survey, 1999–2006.

Series 11, No. 253 [ Page 25
Table 10. Thoracic spine bone area (cm2) of persons aged 8 years and over, by sex, race and ethnicity, and age: United States, 1999–2006
Percentile Sample Standard
Sex, race and ethnicity, and age size Mean deviation 5th 10th 15th 25th 50th 75th 85th 90th 95th
Male
All races and ethnicities 8–11 years . . . . . . . . . . . . . . . . 1,421 82.20 14.22 61.23 65.26 67.72 72.23 80.87 90.87 97.56 101.17 108.91 12–15 years . . . . . . . . . . . . . . . 2,264 114.81 23.30 79.10 84.46 89.41 97.84 114.31 131.19 138.45 143.91 153.16 16–19 years . . . . . . . . . . . . . . . 2,309 141.67 20.11 110.55 117.24 121.60 128.23 140.39 153.86 162.40 167.69 176.30 20–29 years . . . . . . . . . . . . . . . 1,530 151.52 21.00 120.72 126.41 130.45 137.60 149.95 163.68 171.43 177.80 187.50 30–39 years . . . . . . . . . . . . . . . 1,450 156.34 22.09 121.71 129.77 134.57 141.99 154.37 169.55 178.12 184.05 195.00 40–49 years . . . . . . . . . . . . . . . 1,549 159.56 21.67 126.86 132.85 137.54 145.06 158.26 173.29 180.71 186.66 196.43 50–59 years . . . . . . . . . . . . . . . 1,187 157.34 22.44 121.72 130.45 135.73 142.99 155.84 172.20 181.71 187.15 194.04 60–69 years . . . . . . . . . . . . . . . 1,350 154.84 24.09 116.38 125.49 130.95 138.25 153.14 171.16 179.92 185.27 195.88 70–79 years . . . . . . . . . . . . . . . 825 148.66 23.73 111.28 118.49 124.45 131.85 147.55 163.31 173.53 180.32 189.88 80 years and over . . . . . . . . . . . 501 137.69 21.55 100.95 108.46 114.42 121.90 137.96 152.76 159.38 165.49 172.30
20 years and over (age-adjusted) . . 8,392 154.65 . . . . . . . . . . . . . . . . . . . . . . . . . . . . . .
Mexican American 8–11 years . . . . . . . . . . . . . . . . 468 84.11 15.62 62.57 66.08 68.84 73.12 81.81 93.26 99.43 104.94 113.25 12–15 years . . . . . . . . . . . . . . . 777 115.46 23.01 78.02 85.98 91.38 98.62 114.82 131.02 139.27 144.27 155.95 16–19 years . . . . . . . . . . . . . . . 783 136.43 18.92 106.23 113.52 117.38 123.57 135.70 147.13 154.27 159.42 170.25 20–29 years . . . . . . . . . . . . . . . 444 143.43 18.08 115.40 120.41 124.89 129.81 141.95 155.38 162.10 167.07 173.91 30–39 years . . . . . . . . . . . . . . . 337 149.23 19.97 119.65 123.64 129.39 135.81 147.26 162.47 169.94 175.14 184.70 40–49 years . . . . . . . . . . . . . . . 381 149.79 19.52 121.01 125.90 129.07 136.98 148.41 163.12 168.85 173.70 183.51 50–59 years . . . . . . . . . . . . . . . 174 148.06 17.59 119.97 128.28 132.25 136.14 147.44 157.27 165.24 169.28 176.55 60–69 years . . . . . . . . . . . . . . . 348 148.06 20.55 114.73 121.79 125.52 133.84 147.40 162.17 169.88 173.99 180.58 70–79 years . . . . . . . . . . . . . . . 164 *138.45 20.60 *105.88 *111.81 *115.72 *124.33 *138.47 *152.89 *159.00 *163.42 *171.03 80 years and over . . . . . . . . . . . 48 *134.20 22.08 † *105.43 *108.00 *115.91 *136.44 *148.18 *158.90 *163.22 †
20 years and over (age-adjusted) . . 1,896 146.39 . . . . . . . . . . . . . . . . . . . . . . . . . . . . . .
Non-Hispanic white 8–11 years . . . . . . . . . . . . . . . . 369 83.67 13.86 62.97 66.63 69.42 73.56 82.37 92.56 99.29 102.21 109.58 12–15 years . . . . . . . . . . . . . . . 578 117.42 23.66 80.53 87.37 91.81 99.27 117.15 133.38 141.02 146.29 155.50 16–19 years . . . . . . . . . . . . . . . 591 145.22 19.34 116.43 121.87 125.64 132.53 143.94 156.58 165.10 170.45 178.28 20–29 years . . . . . . . . . . . . . . . 617 155.11 20.35 124.96 131.75 135.06 141.81 153.37 165.95 174.78 180.87 189.47 30–39 years . . . . . . . . . . . . . . . 647 159.73 22.02 126.02 133.29 138.27 145.79 158.38 172.13 180.11 187.10 197.81 40–49 years . . . . . . . . . . . . . . . 700 162.89 21.11 131.02 137.29 142.16 147.97 161.23 175.76 183.01 189.93 198.98 50–59 years . . . . . . . . . . . . . . . 683 159.78 22.16 123.32 132.57 137.97 145.11 157.73 174.84 182.92 188.11 195.96 60–69 years . . . . . . . . . . . . . . . 623 157.40 23.90 118.42 128.87 134.35 140.95 155.42 173.58 181.62 187.75 198.30 70–79 years . . . . . . . . . . . . . . . 496 150.71 23.67 112.44 121.97 126.32 133.67 149.26 165.39 175.50 182.80 191.62 80 years and over . . . . . . . . . . . 398 138.43 21.28 101.85 110.30 115.43 123.03 138.77 153.01 159.54 165.43 172.71
20 years and over (age-adjusted) . . 4,164 157.59 . . . . . . . . . . . . . . . . . . . . . . . . . . . . . .
Non-Hispanic black 8–11 years . . . . . . . . . . . . . . . . 469 76.26 12.94 57.73 61.75 63.60 67.65 74.81 83.77 88.27 93.44 100.37 12–15 years . . . . . . . . . . . . . . . 745 106.91 21.95 71.42 78.69 83.11 91.29 106.53 120.98 128.53 134.06 142.91 16–19 years . . . . . . . . . . . . . . . 757 131.45 19.64 101.07 108.06 112.13 118.68 129.44 143.66 149.85 155.77 165.32 20–29 years . . . . . . . . . . . . . . . 325 141.89 20.63 110.54 119.60 123.05 127.81 139.42 153.16 162.88 168.89 175.53 30–39 years . . . . . . . . . . . . . . . 310 147.89 21.03 116.02 121.65 125.81 132.74 146.88 160.11 168.02 176.70 185.48 40–49 years . . . . . . . . . . . . . . . 366 148.12 20.59 117.75 123.35 127.02 132.59 147.37 159.33 168.30 175.17 182.12 50–59 years . . . . . . . . . . . . . . . 240 147.83 22.58 110.40 121.12 125.16 132.41 147.57 162.60 170.70 177.34 183.68 60–69 years . . . . . . . . . . . . . . . 303 144.15 23.25 106.57 113.25 120.09 128.14 142.44 158.35 169.39 173.57 181.91 70–79 years . . . . . . . . . . . . . . . 114 139.26 22.46 100.04 109.66 116.51 125.76 137.05 152.69 162.06 167.09 179.79 80 years and over . . . . . . . . . . . 36 *127.27 21.28 † *97.58 *102.74 *111.83 *125.05 *143.23 *147.58 *153.68 †
20 years and over (age-adjusted) . . 1,694 144.77 . . . . . . . . . . . . . . . . . . . . . . . . . . . . . .
See footnotes at end of table.

Page 26 [ Series 11, No. 253
Table 10. Thoracic spine bone area (cm2) of persons aged 8 years and over, by sex, race and ethnicity, and age: United States, 1999–2006—Con.
Percentile Sample Standard
Sex, race and ethnicity, and age size Mean deviation 5th 10th 15th 25th 50th 75th 85th 90th 95th
Female
All races and ethnicities 8–11 years . . . . . . . . . . . . . . . . 1,465 86.43 18.30 60.82 65.18 67.93 72.85 84.04 97.66 105.81 111.35 119.03 12–15 years . . . . . . . . . . . . . . . 2,318 119.40 18.47 88.58 96.35 100.11 106.30 119.15 132.47 138.80 143.25 149.21 16–19 years . . . . . . . . . . . . . . . 2,027 130.77 17.96 102.81 107.94 111.95 118.69 129.78 141.92 149.01 154.39 161.24 20–29 years . . . . . . . . . . . . . . . 1,378 137.06 19.42 108.52 113.16 116.65 123.80 135.89 148.32 156.52 162.34 170.76 30–39 years . . . . . . . . . . . . . . . 1,372 141.80 20.47 111.95 116.12 120.11 127.11 140.78 154.07 162.58 167.81 175.95 40–49 years . . . . . . . . . . . . . . . 1,570 144.70 19.49 114.15 120.08 124.81 131.70 143.82 156.43 164.68 169.92 177.91 50–59 years . . . . . . . . . . . . . . . 1,200 144.35 19.58 113.57 119.98 124.29 131.68 143.67 156.97 163.38 169.18 176.24 60–69 years . . . . . . . . . . . . . . . 1,419 142.50 21.76 107.41 115.40 120.22 128.22 142.11 157.10 164.79 170.26 177.82 70–79 years . . . . . . . . . . . . . . . 750 139.41 21.81 103.65 111.95 117.07 124.88 139.61 153.36 161.19 167.46 176.61 80 years and over . . . . . . . . . . . 594 128.47 21.18 94.87 102.70 106.21 113.58 128.14 142.23 149.93 155.61 162.93
20 years and over (age-adjusted) . . 8,283 141.20 . . . . . . . . . . . . . . . . . . . . . . . . . . . . . .
Mexican American 8–11 years . . . . . . . . . . . . . . . . 471 83.90 17.16 58.81 63.97 66.81 71.26 81.19 95.58 101.07 106.25 112.68 12–15 years . . . . . . . . . . . . . . . 821 117.87 17.32 91.35 96.75 99.94 105.70 116.52 129.48 136.55 142.08 145.80 16–19 years . . . . . . . . . . . . . . . 692 126.37 17.94 100.39 104.45 108.27 114.21 124.52 137.27 143.77 149.19 159.51 20–29 years . . . . . . . . . . . . . . . 364 132.92 16.91 106.64 112.36 115.20 120.09 132.29 144.03 150.88 155.56 162.28 30–39 years . . . . . . . . . . . . . . . 298 136.94 17.60 111.04 116.48 118.90 124.49 135.58 146.86 154.20 160.42 169.43 40–49 years . . . . . . . . . . . . . . . 372 139.05 16.35 114.29 118.76 121.92 128.10 138.27 148.86 154.50 160.01 167.49 50–59 years . . . . . . . . . . . . . . . 194 137.54 17.00 110.79 115.99 119.60 125.30 136.09 149.51 157.26 160.37 166.05 60–69 years . . . . . . . . . . . . . . . 375 133.42 19.10 103.39 110.43 114.61 120.77 132.24 146.65 152.60 156.10 162.24 70–79 years . . . . . . . . . . . . . . . 154 *127.91 16.61 *102.38 *108.76 *112.05 *116.16 *127.87 *138.25 *143.17 *147.38 *152.97 80 years and over . . . . . . . . . . . 47 *120.13 17.71 *89.32 *95.40 *97.80 *107.03 *121.49 *133.50 *136.29 *139.13 *143.23
20 years and over (age-adjusted) . . 1,804 134.86 . . . . . . . . . . . . . . . . . . . . . . . . . . . . . .
Non-Hispanic white 8–11 years . . . . . . . . . . . . . . . . 383 89.04 18.27 63.03 67.12 70.15 75.46 86.46 99.97 108.54 114.33 123.33 12–15 years . . . . . . . . . . . . . . . 576 120.91 18.33 88.03 97.94 101.80 107.92 121.57 133.24 138.65 144.06 149.84 16–19 years . . . . . . . . . . . . . . . 543 133.61 16.56 106.88 113.08 116.78 122.30 132.67 144.11 149.73 155.20 161.72 20–29 years . . . . . . . . . . . . . . . 583 140.35 19.05 112.69 116.19 121.30 127.12 138.83 151.08 158.96 164.55 175.68 30–39 years . . . . . . . . . . . . . . . 612 145.23 20.67 113.78 118.66 123.67 130.65 144.04 157.74 165.85 170.83 179.03 40–49 years . . . . . . . . . . . . . . . 668 147.83 19.40 116.74 124.02 128.58 134.36 147.18 160.76 167.50 173.13 179.92 50–59 years . . . . . . . . . . . . . . . 639 147.28 19.15 117.80 123.50 127.87 134.81 146.92 158.86 165.65 171.47 177.85 60–69 years . . . . . . . . . . . . . . . 644 144.89 21.29 108.96 118.49 123.40 130.61 143.86 158.97 167.33 171.85 179.52 70–79 years . . . . . . . . . . . . . . . 429 141.74 21.31 107.15 114.42 119.24 127.85 141.60 154.92 163.53 169.51 178.67 80 years and over . . . . . . . . . . . 457 130.35 20.64 98.29 105.00 108.00 116.00 129.70 144.22 150.98 156.73 164.60
20 years and over (age-adjusted) . . 4,032 144.19 . . . . . . . . . . . . . . . . . . . . . . . . . . . . . .
Non-Hispanic black 8–11 years . . . . . . . . . . . . . . . . 490 79.66 17.88 54.50 59.24 62.96 67.04 77.46 89.23 97.68 102.78 110.42 12–15 years . . . . . . . . . . . . . . . 737 113.86 18.27 86.71 91.90 95.64 100.85 112.38 125.98 132.63 137.53 146.06 16–19 years . . . . . . . . . . . . . . . 609 123.33 20.64 93.02 98.16 103.22 108.81 120.74 135.98 144.88 151.40 159.62 20–29 years . . . . . . . . . . . . . . . 297 129.78 20.35 96.98 104.45 109.03 115.42 128.44 141.12 150.64 158.01 166.04 30–39 years . . . . . . . . . . . . . . . 333 135.68 20.63 103.74 110.23 114.95 121.49 133.71 148.11 157.54 164.98 172.45 40–49 years . . . . . . . . . . . . . . . 398 134.91 18.20 104.84 111.85 116.60 121.63 134.37 147.47 153.93 157.49 164.61 50–59 years . . . . . . . . . . . . . . . 250 135.51 17.40 105.97 112.52 117.20 124.47 135.40 148.18 154.19 157.20 163.62 60–69 years . . . . . . . . . . . . . . . 306 133.56 21.91 98.69 106.33 111.82 119.88 133.27 147.49 155.30 160.00 167.02 70–79 years . . . . . . . . . . . . . . . 124 128.36 22.95 92.33 97.55 102.54 109.29 128.33 144.83 152.08 157.34 164.85 80 years and over . . . . . . . . . . . 58 *118.14 20.45 *84.97 *90.84 *95.92 *103.12 *116.73 *132.76 *137.66 *141.51 *149.43
20 years and over (age-adjusted) . . 1,766 132.76 . . . . . . . . . . . . . . . . . . . . . . . . . . . . . .
. . . Category not applicable.
* Figure does not meet standards of reliability or precision; relative standard error (standard error divided by estimate times 100) is 30%–39% or estimate is based on less than 12 degrees of freedom. † Standard error not calculated by SUDAAN software.
NOTE: cm2 is centimeter squared.
SOURCE: National Health and Nutrition Examination Survey, 1999–2006.

Series 11, No. 253 [ Page 27
Table 11. Thoracic spine bone mineral content (g) of persons aged 8 years and over, by sex, race and ethnicity, and age: United States, 1999–2006
Percentile Sample Standard
Sex, race and ethnicity, and age size Mean deviation 5th 10th 15th 25th 50th 75th 85th 90th 95th
Male
All races and ethnicities 8–11 years . . . . . . . . . . . . . . . . 1,421 48.17 11.55 31.66 34.58 36.54 39.95 47.16 54.82 60.56 62.91 68.90 12–15 years . . . . . . . . . . . . . . . 2,264 83.72 26.68 45.08 51.36 54.81 62.67 80.49 101.35 112.53 118.63 130.75 16–19 years . . . . . . . . . . . . . . . 2,309 121.73 24.84 83.53 90.69 96.89 105.59 119.80 136.58 146.45 153.65 165.40 20–29 years . . . . . . . . . . . . . . . 1,530 134.07 28.55 96.68 102.45 107.50 114.71 130.73 148.17 159.06 168.33 185.33 30–39 years . . . . . . . . . . . . . . . 1,450 141.12 31.84 97.91 105.49 111.72 119.73 136.34 157.13 170.66 181.39 200.02 40–49 years . . . . . . . . . . . . . . . 1,549 147.76 34.40 102.57 110.34 115.05 123.76 143.85 165.55 180.56 190.33 206.74 50–59 years . . . . . . . . . . . . . . . 1,187 145.53 34.51 96.14 106.79 112.73 122.42 140.87 164.78 180.83 189.79 207.51 60–69 years . . . . . . . . . . . . . . . 1,350 147.58 37.76 92.57 102.89 110.58 120.90 143.26 169.23 187.29 197.47 215.00 70–79 years . . . . . . . . . . . . . . . 825 138.72 35.55 83.82 94.87 103.34 113.83 136.00 159.50 174.84 183.07 201.07 80 years and over . . . . . . . . . . . 501 125.89 33.29 76.52 84.43 92.08 102.01 123.36 146.21 159.83 170.12 184.23
20 years and over (age-adjusted) . . 8,392 141.70 . . . . . . . . . . . . . . . . . . . . . . . . . . . . . .
Mexican American 8–11 years . . . . . . . . . . . . . . . . 468 49.28 13.19 31.84 35.07 36.86 40.11 47.30 55.33 61.07 66.15 72.26 12–15 years . . . . . . . . . . . . . . . 777 83.88 26.08 44.90 51.58 56.85 65.04 80.07 100.73 112.13 119.51 127.72 16–19 years . . . . . . . . . . . . . . . 783 114.00 23.52 79.23 86.30 91.31 98.84 111.67 126.68 136.53 144.40 155.20 20–29 years . . . . . . . . . . . . . . . 444 123.67 23.31 89.60 95.53 100.27 107.30 121.13 138.54 148.28 156.40 164.30 30–39 years . . . . . . . . . . . . . . . 337 131.57 27.57 93.11 100.31 106.42 113.41 126.74 146.59 158.60 166.05 184.86 40–49 years . . . . . . . . . . . . . . . 381 134.68 29.25 93.71 102.66 106.61 113.78 132.76 150.39 160.53 168.26 184.94 50–59 years . . . . . . . . . . . . . . . 174 135.58 30.49 90.89 100.80 107.79 116.15 129.49 152.23 163.85 170.69 189.27 60–69 years . . . . . . . . . . . . . . . 348 138.32 33.19 93.21 99.16 104.77 114.94 133.84 155.38 169.56 179.98 196.66 70–79 years . . . . . . . . . . . . . . . 164 *127.22 32.01 *79.54 *87.40 *94.06 *103.84 *123.34 *149.13 *161.05 *168.58 *178.70 80 years and over . . . . . . . . . . . 48 *120.36 31.20 *71.19 *78.73 *81.58 *102.10 *114.63 *137.70 *148.87 *155.86 *168.77
20 years and over (age-adjusted) . . 1,896 131.22 . . . . . . . . . . . . . . . . . . . . . . . . . . . . . .
Non-Hispanic white 8–11 years . . . . . . . . . . . . . . . . 369 48.91 11.29 32.60 34.93 37.12 40.46 47.77 55.69 61.00 63.41 69.09 12–15 years . . . . . . . . . . . . . . . 578 85.75 27.45 46.67 52.34 55.40 63.36 82.24 104.60 115.49 121.64 133.60 16–19 years . . . . . . . . . . . . . . . 591 124.72 24.06 85.76 94.80 101.05 109.19 122.43 139.34 149.13 155.14 166.53 20–29 years . . . . . . . . . . . . . . . 617 136.25 28.21 98.94 105.33 110.00 117.55 132.60 149.84 159.82 170.48 187.11 30–39 years . . . . . . . . . . . . . . . 647 143.67 32.19 98.88 108.70 113.29 122.67 139.34 159.96 174.08 183.47 201.12 40–49 years . . . . . . . . . . . . . . . 700 150.44 34.88 104.30 112.22 117.14 125.62 145.92 168.09 183.98 193.03 209.69 50–59 years . . . . . . . . . . . . . . . 683 146.89 34.14 97.09 107.21 114.45 123.76 143.31 166.97 181.96 191.04 207.09 60–69 years . . . . . . . . . . . . . . . 623 149.39 37.74 92.91 104.60 111.65 123.18 145.32 171.48 188.86 198.35 216.86 70–79 years . . . . . . . . . . . . . . . 496 140.83 35.84 86.32 97.10 104.90 115.76 138.49 161.63 177.02 185.17 203.40 80 years and over . . . . . . . . . . . 398 125.94 32.54 77.06 84.60 92.09 102.58 123.96 144.97 159.29 168.03 181.86
20 years and over (age-adjusted) . . 4,164 143.79 . . . . . . . . . . . . . . . . . . . . . . . . . . . . . .
Non-Hispanic black 8–11 years . . . . . . . . . . . . . . . . 469 45.41 10.96 30.59 33.09 34.82 37.90 44.55 50.38 55.34 59.73 64.87 12–15 years . . . . . . . . . . . . . . . 745 79.39 25.76 42.46 47.32 51.40 60.71 76.24 96.09 105.37 113.62 121.48 16–19 years . . . . . . . . . . . . . . . 757 116.13 25.63 79.90 87.14 91.44 99.08 112.32 130.67 140.31 147.89 161.02 20–29 years . . . . . . . . . . . . . . . 325 135.16 31.34 93.40 103.08 106.89 113.86 129.40 152.26 161.09 171.57 188.83 30–39 years . . . . . . . . . . . . . . . 310 142.39 32.54 99.99 105.21 110.41 119.07 138.32 158.57 172.78 182.92 198.55 40–49 years . . . . . . . . . . . . . . . 366 143.25 35.23 99.22 104.79 108.83 117.55 138.38 161.89 176.70 186.12 202.41 50–59 years . . . . . . . . . . . . . . . 240 147.28 38.65 93.87 103.74 110.05 120.86 142.67 166.52 182.69 196.29 214.02 60–69 years . . . . . . . . . . . . . . . 303 147.63 38.31 94.60 102.82 110.58 121.74 144.09 168.50 182.78 194.97 215.57 70–79 years . . . . . . . . . . . . . . . 114 134.15 32.19 84.21 96.84 102.47 111.12 131.15 151.89 167.09 174.26 189.86 80 years and over . . . . . . . . . . . 36 *124.55 39.11 † *83.26 *91.52 *93.96 *109.26 *151.27 *168.26 *182.92 †
20 years and over (age-adjusted) . . 1,694 141.03 . . . . . . . . . . . . . . . . . . . . . . . . . . . . . .
See footnotes at end of table.
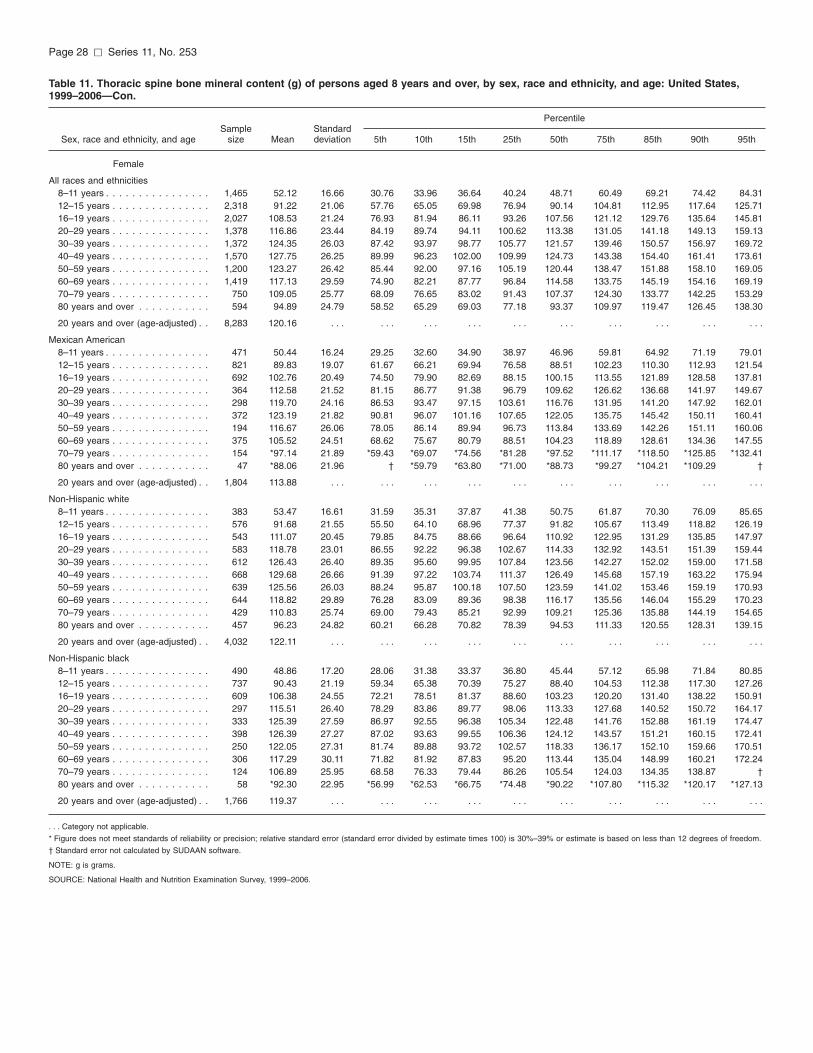
Page 28 [ Series 11, No. 253
Table 11. Thoracic spine bone mineral content (g) of persons aged 8 years and over, by sex, race and ethnicity, and age: United States, 1999–2006—Con.
Percentile Sample Standard
Sex, race and ethnicity, and age size Mean deviation 5th 10th 15th 25th 50th 75th 85th 90th 95th
Female
All races and ethnicities 8–11 years . . . . . . . . . . . . . . . . 1,465 52.12 16.66 30.76 33.96 36.64 40.24 48.71 60.49 69.21 74.42 84.31 12–15 years . . . . . . . . . . . . . . . 2,318 91.22 21.06 57.76 65.05 69.98 76.94 90.14 104.81 112.95 117.64 125.71 16–19 years . . . . . . . . . . . . . . . 2,027 108.53 21.24 76.93 81.94 86.11 93.26 107.56 121.12 129.76 135.64 145.81 20–29 years . . . . . . . . . . . . . . . 1,378 116.86 23.44 84.19 89.74 94.11 100.62 113.38 131.05 141.18 149.13 159.13 30–39 years . . . . . . . . . . . . . . . 1,372 124.35 26.03 87.42 93.97 98.77 105.77 121.57 139.46 150.57 156.97 169.72 40–49 years . . . . . . . . . . . . . . . 1,570 127.75 26.25 89.99 96.23 102.00 109.99 124.73 143.38 154.40 161.41 173.61 50–59 years . . . . . . . . . . . . . . . 1,200 123.27 26.42 85.44 92.00 97.16 105.19 120.44 138.47 151.88 158.10 169.05 60–69 years . . . . . . . . . . . . . . . 1,419 117.13 29.59 74.90 82.21 87.77 96.84 114.58 133.75 145.19 154.16 169.19 70–79 years . . . . . . . . . . . . . . . 750 109.05 25.77 68.09 76.65 83.02 91.43 107.37 124.30 133.77 142.25 153.29 80 years and over . . . . . . . . . . . 594 94.89 24.79 58.52 65.29 69.03 77.18 93.37 109.97 119.47 126.45 138.30
20 years and over (age-adjusted) . . 8,283 120.16 . . . . . . . . . . . . . . . . . . . . . . . . . . . . . .
Mexican American 8–11 years . . . . . . . . . . . . . . . . 471 50.44 16.24 29.25 32.60 34.90 38.97 46.96 59.81 64.92 71.19 79.01 12–15 years . . . . . . . . . . . . . . . 821 89.83 19.07 61.67 66.21 69.94 76.58 88.51 102.23 110.30 112.93 121.54 16–19 years . . . . . . . . . . . . . . . 692 102.76 20.49 74.50 79.90 82.69 88.15 100.15 113.55 121.89 128.58 137.81 20–29 years . . . . . . . . . . . . . . . 364 112.58 21.52 81.15 86.77 91.38 96.79 109.62 126.62 136.68 141.97 149.67 30–39 years . . . . . . . . . . . . . . . 298 119.70 24.16 86.53 93.47 97.15 103.61 116.76 131.95 141.20 147.92 162.01 40–49 years . . . . . . . . . . . . . . . 372 123.19 21.82 90.81 96.07 101.16 107.65 122.05 135.75 145.42 150.11 160.41 50–59 years . . . . . . . . . . . . . . . 194 116.67 26.06 78.05 86.14 89.94 96.73 113.84 133.69 142.26 151.11 160.06 60–69 years . . . . . . . . . . . . . . . 375 105.52 24.51 68.62 75.67 80.79 88.51 104.23 118.89 128.61 134.36 147.55 70–79 years . . . . . . . . . . . . . . . 154 *97.14 21.89 *59.43 *69.07 *74.56 *81.28 *97.52 *111.17 *118.50 *125.85 *132.41 80 years and over . . . . . . . . . . . 47 *88.06 21.96 † *59.79 *63.80 *71.00 *88.73 *99.27 *104.21 *109.29 †
20 years and over (age-adjusted) . . 1,804 113.88 . . . . . . . . . . . . . . . . . . . . . . . . . . . . . .
Non-Hispanic white 8–11 years . . . . . . . . . . . . . . . . 383 53.47 16.61 31.59 35.31 37.87 41.38 50.75 61.87 70.30 76.09 85.65 12–15 years . . . . . . . . . . . . . . . 576 91.68 21.55 55.50 64.10 68.96 77.37 91.82 105.67 113.49 118.82 126.19 16–19 years . . . . . . . . . . . . . . . 543 111.07 20.45 79.85 84.75 88.66 96.64 110.92 122.95 131.29 135.85 147.97 20–29 years . . . . . . . . . . . . . . . 583 118.78 23.01 86.55 92.22 96.38 102.67 114.33 132.92 143.51 151.39 159.44 30–39 years . . . . . . . . . . . . . . . 612 126.43 26.40 89.35 95.60 99.95 107.84 123.56 142.27 152.02 159.00 171.58 40–49 years . . . . . . . . . . . . . . . 668 129.68 26.66 91.39 97.22 103.74 111.37 126.49 145.68 157.19 163.22 175.94 50–59 years . . . . . . . . . . . . . . . 639 125.56 26.03 88.24 95.87 100.18 107.50 123.59 141.02 153.46 159.19 170.93 60–69 years . . . . . . . . . . . . . . . 644 118.82 29.89 76.28 83.09 89.36 98.38 116.17 135.56 146.04 155.29 170.23 70–79 years . . . . . . . . . . . . . . . 429 110.83 25.74 69.00 79.43 85.21 92.99 109.21 125.36 135.88 144.19 154.65 80 years and over . . . . . . . . . . . 457 96.23 24.82 60.21 66.28 70.82 78.39 94.53 111.33 120.55 128.31 139.15
20 years and over (age-adjusted) . . 4,032 122.11 . . . . . . . . . . . . . . . . . . . . . . . . . . . . . .
Non-Hispanic black 8–11 years . . . . . . . . . . . . . . . . 490 48.86 17.20 28.06 31.38 33.37 36.80 45.44 57.12 65.98 71.84 80.85 12–15 years . . . . . . . . . . . . . . . 737 90.43 21.19 59.34 65.38 70.39 75.27 88.40 104.53 112.38 117.30 127.26 16–19 years . . . . . . . . . . . . . . . 609 106.38 24.55 72.21 78.51 81.37 88.60 103.23 120.20 131.40 138.22 150.91 20–29 years . . . . . . . . . . . . . . . 297 115.51 26.40 78.29 83.86 89.77 98.06 113.33 127.68 140.52 150.72 164.17 30–39 years . . . . . . . . . . . . . . . 333 125.39 27.59 86.97 92.55 96.38 105.34 122.48 141.76 152.88 161.19 174.47 40–49 years . . . . . . . . . . . . . . . 398 126.39 27.27 87.02 93.63 99.55 106.36 124.12 143.57 151.21 160.15 172.41 50–59 years . . . . . . . . . . . . . . . 250 122.05 27.31 81.74 89.88 93.72 102.57 118.33 136.17 152.10 159.66 170.51 60–69 years . . . . . . . . . . . . . . . 306 117.29 30.11 71.82 81.92 87.83 95.20 113.44 135.04 148.99 160.21 172.24 70–79 years . . . . . . . . . . . . . . . 124 106.89 25.95 68.58 76.33 79.44 86.26 105.54 124.03 134.35 138.87 † 80 years and over . . . . . . . . . . . 58 *92.30 22.95 *56.99 *62.53 *66.75 *74.48 *90.22 *107.80 *115.32 *120.17 *127.13
20 years and over (age-adjusted) . . 1,766 119.37 . . . . . . . . . . . . . . . . . . . . . . . . . . . . . .
. . . Category not applicable.
* Figure does not meet standards of reliability or precision; relative standard error (standard error divided by estimate times 100) is 30%–39% or estimate is based on less than 12 degrees of freedom.
† Standard error not calculated by SUDAAN software.
NOTE: g is grams.
SOURCE: National Health and Nutrition Examination Survey, 1999–2006.

Series 11, No. 253 [ Page 29
Table 12. Thoracic spine bone mineral density (g/cm2) of persons aged 8 years and over, by sex, race and ethnicity, and age: United States, 1999–2006
Percentile Sample Standard
Sex, race and ethnicity, and age size Mean deviation 5th 10th 15th 25th 50th 75th 85th 90th 95th
Male
All races and ethnicities 8–11 years . . . . . . . . . . . . . . . . 1,421 0.581 0.061 0.488 0.503 0.517 0.539 0.578 0.617 0.642 0.661 0.689 12–15 years . . . . . . . . . . . . . . . 2,264 0.715 0.107 0.549 0.582 0.601 0.636 0.707 0.788 0.830 0.855 0.898 16–19 years . . . . . . . . . . . . . . . 2,309 0.855 0.094 0.702 0.734 0.757 0.790 0.853 0.911 0.946 0.974 1.021 20–29 years . . . . . . . . . . . . . . . 1,530 0.880 0.102 0.728 0.758 0.782 0.812 0.871 0.936 0.983 1.010 1.056 30–39 years . . . . . . . . . . . . . . . 1,450 0.897 0.112 0.731 0.763 0.785 0.817 0.884 0.960 1.003 1.040 1.103 40–49 years . . . . . . . . . . . . . . . 1,549 0.919 0.127 0.737 0.768 0.794 0.831 0.908 0.996 1.044 1.078 1.131 50–59 years . . . . . . . . . . . . . . . 1,187 0.918 0.135 0.721 0.760 0.788 0.828 0.902 0.995 1.055 1.086 1.153 60–69 years . . . . . . . . . . . . . . . 1,350 0.945 0.146 0.721 0.766 0.797 0.841 0.933 1.037 1.092 1.143 1.209 70–79 years . . . . . . . . . . . . . . . 825 0.926 0.147 0.701 0.740 0.771 0.822 0.912 1.017 1.076 1.116 1.185 80 years and over . . . . . . . . . . . 501 0.906 0.151 0.695 0.727 0.753 0.796 0.887 0.998 1.059 1.111 1.181
20 years and over (age-adjusted) . . 8,392 0.910 . . . . . . . . . . . . . . . . . . . . . . . . . . . . . .
Mexican American 8–11 years . . . . . . . . . . . . . . . . 468 0.580 0.064 0.483 0.503 0.517 0.534 0.571 0.622 0.646 0.662 0.689 12–15 years . . . . . . . . . . . . . . . 777 0.713 0.105 0.554 0.578 0.601 0.639 0.704 0.781 0.828 0.852 0.885 16–19 years . . . . . . . . . . . . . . . 783 0.831 0.091 0.695 0.723 0.740 0.765 0.822 0.889 0.924 0.945 0.990 20–29 years . . . . . . . . . . . . . . . 444 0.858 0.091 0.714 0.739 0.762 0.793 0.855 0.915 0.950 0.977 1.015 30–39 years . . . . . . . . . . . . . . . 337 0.877 0.102 0.725 0.758 0.775 0.804 0.864 0.935 0.987 1.000 1.046 40–49 years . . . . . . . . . . . . . . . 381 0.894 0.121 0.720 0.757 0.777 0.813 0.874 0.963 1.009 1.045 1.114 50–59 years . . . . . . . . . . . . . . . 174 0.910 0.135 0.720 0.754 0.770 0.809 0.901 0.972 1.038 1.076 1.136 60–69 years . . . . . . . . . . . . . . . 348 0.927 0.134 0.740 0.767 0.794 0.828 0.918 0.998 1.062 1.090 1.159 70–79 years . . . . . . . . . . . . . . . 164 *0.912 0.147 *0.694 *0.734 *0.746 *0.796 *0.893 *1.010 *1.073 *1.116 *1.157 80 years and over . . . . . . . . . . . 48 *0.890 0.143 *0.680 *0.733 *0.763 *0.790 *0.861 *0.957 *1.033 *1.102 *1.147
20 years and over (age-adjusted) . . 1,896 0.891 . . . . . . . . . . . . . . . . . . . . . . . . . . . . . .
Non-Hispanic white 8–11 years . . . . . . . . . . . . . . . . 369 0.580 0.059 0.483 0.506 0.515 0.539 0.578 0.616 0.636 0.660 0.683 12–15 years . . . . . . . . . . . . . . . 578 0.715 0.108 0.550 0.583 0.600 0.635 0.709 0.789 0.835 0.855 0.899 16–19 years . . . . . . . . . . . . . . . 591 0.855 0.092 0.701 0.734 0.759 0.791 0.855 0.909 0.945 0.971 1.013 20–29 years . . . . . . . . . . . . . . . 617 0.873 0.096 0.728 0.756 0.781 0.807 0.867 0.925 0.972 0.995 1.035 30–39 years . . . . . . . . . . . . . . . 647 0.893 0.108 0.731 0.762 0.786 0.817 0.882 0.956 0.997 1.028 1.086 40–49 years . . . . . . . . . . . . . . . 700 0.916 0.126 0.735 0.766 0.791 0.829 0.908 0.990 1.036 1.068 1.119 50–59 years . . . . . . . . . . . . . . . 683 0.913 0.131 0.714 0.751 0.783 0.826 0.897 0.986 1.047 1.080 1.137 60–69 years . . . . . . . . . . . . . . . 623 0.941 0.143 0.721 0.761 0.792 0.841 0.931 1.031 1.083 1.134 1.203 70–79 years . . . . . . . . . . . . . . . 496 0.927 0.147 0.703 0.743 0.775 0.826 0.913 1.017 1.076 1.121 1.193 80 years and over . . . . . . . . . . . 398 0.902 0.147 0.697 0.728 0.754 0.794 0.882 0.990 1.053 1.098 1.171
20 years and over (age-adjusted) . . 4,164 0.906 . . . . . . . . . . . . . . . . . . . . . . . . . . . . . .
Non-Hispanic black 8–11 years . . . . . . . . . . . . . . . . 469 0.590 0.065 0.493 0.510 0.523 0.545 0.584 0.629 0.654 0.674 0.698 12–15 years . . . . . . . . . . . . . . . 745 0.728 0.110 0.566 0.590 0.605 0.643 0.719 0.802 0.840 0.876 0.915 16–19 years . . . . . . . . . . . . . . . 757 0.878 0.100 0.724 0.757 0.774 0.807 0.873 0.942 0.982 1.011 1.050 20–29 years . . . . . . . . . . . . . . . 325 0.946 0.116 0.787 0.815 0.832 0.861 0.929 1.022 1.065 1.096 1.145 30–39 years . . . . . . . . . . . . . . . 310 0.956 0.121 0.781 0.810 0.834 0.868 0.945 1.033 1.074 1.102 1.174 40–49 years . . . . . . . . . . . . . . . 366 0.959 0.144 0.757 0.794 0.819 0.852 0.940 1.040 1.093 1.146 1.196 50–59 years . . . . . . . . . . . . . . . 240 0.987 0.156 0.768 0.806 0.840 0.871 0.968 1.071 1.134 1.187 1.251 60–69 years . . . . . . . . . . . . . . . 303 1.015 0.152 0.788 0.837 0.862 0.903 1.005 1.113 1.172 1.210 1.276 70–79 years . . . . . . . . . . . . . . . 114 0.958 0.145 0.735 0.789 0.800 0.846 0.952 1.051 1.110 1.128 1.179 80 years and over . . . . . . . . . . . 36 *0.965 0.184 † *0.760 *0.794 *0.829 *0.942 *1.077 *1.128 *1.213 †
20 years and over (age-adjusted) . . 1,694 0.966 . . . . . . . . . . . . . . . . . . . . . . . . . . . . . .
See footnotes at end of table.

Page 30 [ Series 11, No. 253
Table 12. Thoracic spine bone mineral density (g/cm2) of persons aged 8 years and over, by sex, race and ethnicity, and age: United States, 1999–2006—Con.
Percentile Sample Standard
Sex, race and ethnicity, and age size Mean deviation 5th 10th 15th 25th 50th 75th 85th 90th 95th
Female
All races and ethnicities 8–11 years . . . . . . . . . . . . . . . . 1,465 0.592 0.077 0.475 0.500 0.515 0.539 0.586 0.638 0.670 0.696 0.728 12–15 years . . . . . . . . . . . . . . . 2,318 0.757 0.090 0.610 0.641 0.661 0.697 0.759 0.815 0.845 0.869 0.907 16–19 years . . . . . . . . . . . . . . . 2,027 0.826 0.089 0.682 0.715 0.734 0.765 0.821 0.882 0.918 0.945 0.978 20–29 years . . . . . . . . . . . . . . . 1,378 0.849 0.094 0.703 0.735 0.751 0.784 0.842 0.903 0.939 0.967 1.018 30–39 years . . . . . . . . . . . . . . . 1,372 0.874 0.105 0.714 0.746 0.766 0.798 0.864 0.943 0.978 1.013 1.056 40–49 years . . . . . . . . . . . . . . . 1,570 0.880 0.115 0.711 0.736 0.761 0.797 0.874 0.953 0.994 1.031 1.078 50–59 years . . . . . . . . . . . . . . . 1,200 0.851 0.122 0.666 0.702 0.727 0.765 0.840 0.929 0.982 1.012 1.056 60–69 years . . . . . . . . . . . . . . . 1,419 0.816 0.133 0.625 0.656 0.685 0.719 0.805 0.893 0.951 0.986 1.048 70–79 years . . . . . . . . . . . . . . . 750 0.779 0.121 0.597 0.638 0.660 0.695 0.768 0.854 0.904 0.932 0.990 80 years and over . . . . . . . . . . . 594 0.734 0.128 0.552 0.586 0.612 0.641 0.721 0.809 0.855 0.890 0.955
20 years and over (age-adjusted) . . 8,283 0.847 . . . . . . . . . . . . . . . . . . . . . . . . . . . . . .
Mexican American 8–11 years . . . . . . . . . . . . . . . . 471 0.590 0.081 0.470 0.492 0.507 0.535 0.584 0.637 0.669 0.696 0.753 12–15 years . . . . . . . . . . . . . . . 821 0.757 0.086 0.618 0.652 0.672 0.700 0.756 0.806 0.841 0.864 0.901 16–19 years . . . . . . . . . . . . . . . 692 0.810 0.083 0.690 0.709 0.728 0.754 0.803 0.858 0.885 0.915 0.952 20–29 years . . . . . . . . . . . . . . . 364 0.843 0.092 0.708 0.728 0.747 0.778 0.834 0.900 0.943 0.965 1.004 30–39 years . . . . . . . . . . . . . . . 298 0.870 0.107 0.710 0.745 0.772 0.801 0.864 0.928 0.968 0.992 1.045 40–49 years . . . . . . . . . . . . . . . 372 0.884 0.106 0.710 0.752 0.770 0.808 0.886 0.955 0.989 1.020 1.059 50–59 years . . . . . . . . . . . . . . . 194 0.844 0.133 0.668 0.686 0.704 0.745 0.831 0.930 0.967 1.004 1.045 60–69 years . . . . . . . . . . . . . . . 375 0.787 0.125 0.599 0.641 0.663 0.700 0.773 0.861 0.921 0.952 0.997 70–79 years . . . . . . . . . . . . . . . 154 *0.754 0.116 *0.553 *0.605 *0.623 *0.669 *0.756 *0.820 *0.859 *0.890 *0.962 80 years and over . . . . . . . . . . . 47 *0.728 0.127 *0.558 *0.583 *0.613 *0.654 *0.710 *0.776 *0.819 *0.837 †
20 years and over (age-adjusted) . . 1,804 0.839 . . . . . . . . . . . . . . . . . . . . . . . . . . . . . .
Non-Hispanic white 8–11 years . . . . . . . . . . . . . . . . 383 0.590 0.074 0.474 0.499 0.517 0.539 0.586 0.633 0.662 0.690 0.720 12–15 years . . . . . . . . . . . . . . . 576 0.750 0.091 0.596 0.631 0.654 0.686 0.756 0.809 0.839 0.860 0.898 16–19 years . . . . . . . . . . . . . . . 543 0.828 0.086 0.688 0.716 0.736 0.768 0.821 0.884 0.920 0.945 0.974 20–29 years . . . . . . . . . . . . . . . 583 0.843 0.089 0.702 0.734 0.747 0.780 0.837 0.898 0.931 0.954 0.995 30–39 years . . . . . . . . . . . . . . . 612 0.867 0.103 0.710 0.741 0.759 0.790 0.859 0.936 0.971 0.995 1.041 40–49 years . . . . . . . . . . . . . . . 668 0.874 0.113 0.706 0.733 0.757 0.792 0.867 0.945 0.985 1.022 1.071 50–59 years . . . . . . . . . . . . . . . 639 0.849 0.117 0.676 0.706 0.728 0.765 0.840 0.925 0.976 1.007 1.048 60–69 years . . . . . . . . . . . . . . . 644 0.814 0.132 0.624 0.655 0.685 0.716 0.799 0.891 0.949 0.982 1.036 70–79 years . . . . . . . . . . . . . . . 429 0.778 0.119 0.599 0.639 0.661 0.697 0.766 0.850 0.900 0.932 0.985 80 years and over . . . . . . . . . . . 457 0.733 0.126 0.552 0.587 0.612 0.641 0.721 0.809 0.853 0.887 0.953
20 years and over (age-adjusted) . . 4,032 0.842 . . . . . . . . . . . . . . . . . . . . . . . . . . . . . .
Non-Hispanic black 8–11 years . . . . . . . . . . . . . . . . 490 0.600 0.084 0.470 0.497 0.512 0.543 0.594 0.652 0.684 0.709 0.754 12–15 years . . . . . . . . . . . . . . . 737 0.788 0.093 0.636 0.670 0.691 0.724 0.787 0.845 0.882 0.908 0.944 16–19 years . . . . . . . . . . . . . . . 609 0.857 0.094 0.705 0.740 0.759 0.789 0.855 0.916 0.956 0.979 1.014 20–29 years . . . . . . . . . . . . . . . 297 0.884 0.102 0.735 0.757 0.779 0.812 0.875 0.947 0.990 1.026 1.068 30–39 years . . . . . . . . . . . . . . . 333 0.919 0.112 0.753 0.780 0.803 0.837 0.922 0.986 1.031 1.060 1.108 40–49 years . . . . . . . . . . . . . . . 398 0.932 0.125 0.739 0.774 0.798 0.844 0.925 1.004 1.053 1.080 1.147 50–59 years . . . . . . . . . . . . . . . 250 0.896 0.140 0.704 0.728 0.748 0.789 0.876 0.982 1.045 1.089 1.159 60–69 years . . . . . . . . . . . . . . . 306 0.873 0.143 0.662 0.698 0.728 0.772 0.855 0.956 1.023 1.071 1.128 70–79 years . . . . . . . . . . . . . . . 124 0.832 0.134 0.643 0.678 0.699 0.727 0.822 0.912 0.966 1.007 1.077 80 years and over . . . . . . . . . . . 58 *0.781 0.152 *0.561 *0.605 *0.626 *0.689 *0.760 *0.851 *0.904 *0.941 †
20 years and over (age-adjusted) . . 1,766 0.894 . . . . . . . . . . . . . . . . . . . . . . . . . . . . . .
. . . Category not applicable.
* Figure does not meet standards of reliability or precision; relative standard error (standard error divided by estimate times 100) is 30%–39% or estimate is based on less than 12 degrees of freedom.
† Standard error not calculated by SUDAAN software.
NOTE: g/cm2 is grams per centimeter squared.
SOURCE: National Health and Nutrition Examination Survey, 1999–2006.

Series 11, No. 253 [ Page 31
Table 13. Lumbar spine bone area (cm2) of persons aged 8 years and over, by sex, race and ethnicity, and age: United States, 1999–2006
Percentile Sample Standard
Sex, race and ethnicity, and age size Mean deviation 5th 10th 15th 25th 50th 75th 85th 90th 95th
Male
All races and ethnicities 8–11 years . . . . . . . . . . . . . . . . 1,421 33.91 6.86 22.11 25.06 26.71 29.53 34.36 38.30 39.97 41.60 44.22 12–15 years . . . . . . . . . . . . . . . 2,264 47.55 10.85 29.82 33.90 36.29 39.57 47.21 55.14 59.05 61.86 65.47 16–19 years . . . . . . . . . . . . . . . 2,309 58.17 8.90 43.57 46.89 49.12 52.36 57.99 63.88 67.23 69.69 73.69 20–29 years . . . . . . . . . . . . . . . 1,530 58.45 9.32 43.82 47.22 49.08 52.04 58.06 64.74 68.08 70.67 74.25 30–39 years . . . . . . . . . . . . . . . 1,450 58.72 9.48 42.83 46.26 48.65 52.16 58.84 64.92 68.46 70.97 74.71 40–49 years . . . . . . . . . . . . . . . 1,549 60.23 10.17 43.52 47.05 49.18 53.33 60.30 67.41 70.69 73.13 76.86 50–59 years . . . . . . . . . . . . . . . 1,187 59.92 9.89 43.45 47.15 49.88 53.52 60.10 66.28 70.14 72.23 76.20 60–69 years . . . . . . . . . . . . . . . 1,350 59.36 11.03 41.73 46.22 49.04 52.96 59.27 65.66 69.02 71.88 75.71 70–79 years . . . . . . . . . . . . . . . 825 58.94 10.73 41.24 45.56 47.38 51.29 59.22 66.37 69.99 72.39 75.39 80 years and over . . . . . . . . . . . 501 58.31 10.31 41.07 45.27 48.14 51.65 57.87 65.05 68.94 71.98 75.72
20 years and over (age-adjusted) . . 8,392 59.25 . . . . . . . . . . . . . . . . . . . . . . . . . . . . . .
Mexican American 8–11 years . . . . . . . . . . . . . . . . 468 33.12 6.84 21.38 24.69 26.07 29.08 33.17 37.27 39.43 41.07 44.78 12–15 years . . . . . . . . . . . . . . . 777 47.50 10.66 29.39 33.94 36.32 39.72 47.59 55.32 58.50 60.91 64.38 16–19 years . . . . . . . . . . . . . . . 783 57.02 8.66 43.43 45.89 47.82 50.99 57.16 62.17 66.05 68.27 71.61 20–29 years . . . . . . . . . . . . . . . 444 57.41 8.32 43.51 47.04 49.22 51.85 57.25 62.80 66.01 67.95 71.17 30–39 years . . . . . . . . . . . . . . . 337 56.30 8.14 42.15 45.24 47.24 50.36 56.91 61.40 64.39 66.17 70.03 40–49 years . . . . . . . . . . . . . . . 381 57.32 8.57 43.51 45.68 47.74 51.59 57.57 63.10 66.07 68.73 71.47 50–59 years . . . . . . . . . . . . . . . 174 56.66 8.44 42.58 45.13 47.21 50.68 57.16 62.07 64.80 66.32 69.99 60–69 years . . . . . . . . . . . . . . . 348 57.70 9.44 43.32 46.37 48.32 51.33 56.41 63.66 67.20 71.10 73.94 70–79 years . . . . . . . . . . . . . . . 164 *59.32 9.72 *42.60 *46.38 *49.87 *52.71 *58.70 *65.08 *67.81 *72.46 *75.31 80 years and over . . . . . . . . . . . 48 *59.07 10.86 *42.38 *45.81 *47.30 *51.34 *57.26 *63.92 *73.23 *76.27 †
20 years and over (age-adjusted) . . 1,896 57.30 . . . . . . . . . . . . . . . . . . . . . . . . . . . . . .
Non-Hispanic white 8–11 years . . . . . . . . . . . . . . . . 369 34.29 6.92 22.72 25.19 26.87 29.64 34.80 38.67 40.42 42.24 44.33 12–15 years . . . . . . . . . . . . . . . 578 48.10 11.10 30.01 33.97 36.60 39.89 47.56 55.63 60.23 62.99 66.76 16–19 years . . . . . . . . . . . . . . . 591 59.08 8.89 44.05 47.70 49.88 53.48 58.74 64.55 68.31 70.90 74.38 20–29 years . . . . . . . . . . . . . . . 617 59.38 9.20 45.12 48.16 49.74 52.61 58.88 65.51 69.07 71.60 75.21 30–39 years . . . . . . . . . . . . . . . 647 59.75 9.65 43.71 47.25 49.29 53.17 59.77 66.35 69.30 72.12 76.07 40–49 years . . . . . . . . . . . . . . . 700 61.30 10.27 44.55 47.76 49.71 54.31 61.37 68.60 71.95 74.25 78.10 50–59 years . . . . . . . . . . . . . . . 683 60.73 9.95 43.70 48.63 51.03 54.29 60.90 67.04 70.71 72.91 76.84 60–69 years . . . . . . . . . . . . . . . 623 60.14 11.14 42.26 47.04 49.86 53.69 59.98 66.51 69.73 72.48 76.55 70–79 years . . . . . . . . . . . . . . . 496 59.65 10.81 41.50 45.97 48.04 52.03 59.94 67.18 70.83 72.92 75.73 80 years and over . . . . . . . . . . . 398 58.57 10.33 41.19 45.57 48.64 51.76 58.17 65.28 69.24 72.21 75.76
20 years and over (age-adjusted) . . 4,164 60.15 . . . . . . . . . . . . . . . . . . . . . . . . . . . . . .
Non-Hispanic black 8–11 years . . . . . . . . . . . . . . . . 469 34.33 6.72 22.71 26.02 27.42 29.88 34.32 38.76 40.70 42.16 45.16 12–15 years . . . . . . . . . . . . . . . 745 47.02 10.04 30.84 33.85 35.91 40.14 46.97 53.77 57.72 60.04 63.80 16–19 years . . . . . . . . . . . . . . . 757 56.43 9.09 42.19 44.83 47.28 49.96 56.21 62.44 65.68 67.67 72.18 20–29 years . . . . . . . . . . . . . . . 325 57.48 9.78 41.64 45.76 47.86 50.71 57.32 63.02 68.16 70.23 73.09 30–39 years . . . . . . . . . . . . . . . 310 57.05 9.85 39.96 43.91 46.63 50.83 57.22 63.50 66.70 69.68 72.98 40–49 years . . . . . . . . . . . . . . . 366 57.08 9.54 41.42 45.01 47.16 50.49 56.72 63.39 67.53 69.44 72.52 50–59 years . . . . . . . . . . . . . . . 240 58.27 9.68 40.88 45.07 48.00 51.82 58.51 64.50 67.75 71.23 74.14 60–69 years . . . . . . . . . . . . . . . 303 57.29 9.47 42.37 45.48 47.76 50.53 56.61 63.46 66.66 69.85 73.72 70–79 years . . . . . . . . . . . . . . . 114 55.68 9.62 39.77 43.95 46.14 48.90 55.30 62.64 66.00 67.24 70.14 80 years and over . . . . . . . . . . . 36 *56.04 10.22 † *41.92 *43.36 *47.96 *56.31 *62.57 *64.93 *66.17 †
20 years and over (age-adjusted) . . 1,694 57.19 . . . . . . . . . . . . . . . . . . . . . . . . . . . . . .
See footnotes at end of table.

Page 32 [ Series 11, No. 253
Table 13. Lumbar spine bone area (cm2) of persons aged 8 years and over, by sex, race and ethnicity, and age: United States, 1999–2006—Con.
Percentile Sample Standard
Sex, race and ethnicity, and age size Mean deviation 5th 10th 15th 25th 50th 75th 85th 90th 95th
Female
All races and ethnicities 8–11 years . . . . . . . . . . . . . . . . 1,465 34.82 7.08 24.46 26.58 28.02 29.88 34.32 39.08 42.38 44.70 47.50 12–15 years . . . . . . . . . . . . . . . 2,318 47.37 7.53 35.46 37.67 39.34 42.13 47.17 52.25 55.30 57.12 59.93 16–19 years . . . . . . . . . . . . . . . 2,027 50.34 7.43 38.74 41.20 42.58 45.15 50.28 55.15 57.78 59.81 62.42 20–29 years . . . . . . . . . . . . . . . 1,378 50.87 7.65 38.49 41.54 43.29 45.80 50.65 56.10 59.07 60.59 63.21 30–39 years . . . . . . . . . . . . . . . 1,372 50.84 7.91 37.51 41.21 42.96 45.83 50.48 56.10 59.32 61.05 63.63 40–49 years . . . . . . . . . . . . . . . 1,570 51.62 8.16 38.33 40.81 42.83 45.88 51.61 56.95 59.92 62.23 64.82 50–59 years . . . . . . . . . . . . . . . 1,200 50.44 8.00 37.15 39.91 41.91 45.14 50.52 55.59 58.64 60.43 63.91 60–69 years . . . . . . . . . . . . . . . 1,419 48.51 8.50 34.93 37.44 39.45 42.68 48.35 54.56 57.65 59.46 62.16 70–79 years . . . . . . . . . . . . . . . 750 47.70 8.37 33.73 36.79 39.01 41.83 48.02 53.26 56.30 58.22 60.98 80 years and over . . . . . . . . . . . 594 45.26 8.63 31.39 34.10 36.04 39.31 44.83 51.04 53.94 56.35 59.90
20 years and over (age-adjusted) . . 8,283 50.19 . . . . . . . . . . . . . . . . . . . . . . . . . . . . . .
Mexican American 8–11 years . . . . . . . . . . . . . . . . 471 33.66 6.79 22.75 25.17 26.29 28.94 33.26 37.80 40.52 42.81 45.11 12–15 years . . . . . . . . . . . . . . . 821 46.40 6.94 35.42 38.09 39.46 41.74 46.10 51.08 53.56 55.20 57.66 16–19 years . . . . . . . . . . . . . . . 692 48.72 6.55 37.68 40.26 41.85 44.30 48.75 53.25 55.39 56.74 58.94 20–29 years . . . . . . . . . . . . . . . 364 49.63 7.03 37.83 40.54 42.42 45.11 49.78 54.41 56.64 58.33 60.98 30–39 years . . . . . . . . . . . . . . . 298 49.62 6.79 39.13 40.92 42.46 44.72 49.35 54.06 56.50 58.55 61.00 40–49 years . . . . . . . . . . . . . . . 372 49.08 7.56 36.90 39.40 41.13 43.91 48.67 54.05 57.32 58.52 61.41 50–59 years . . . . . . . . . . . . . . . 194 47.85 8.77 35.24 37.61 38.91 42.46 47.81 52.38 54.89 56.86 59.62 60–69 years . . . . . . . . . . . . . . . 375 45.90 7.99 32.20 35.32 38.11 40.66 46.23 50.75 53.85 55.56 58.50 70–79 years . . . . . . . . . . . . . . . 154 *44.84 8.28 *30.73 *32.74 *35.34 *38.21 *45.77 *51.54 *53.73 *55.36 *57.35 80 years and over . . . . . . . . . . . 47 *44.61 8.35 *29.61 *33.62 *36.23 *38.81 *44.88 *50.09 *52.86 *54.44 †
20 years and over (age-adjusted) . . 1,804 48.22 . . . . . . . . . . . . . . . . . . . . . . . . . . . . . .
Non-Hispanic white 8–11 years . . . . . . . . . . . . . . . . 383 35.41 7.14 25.15 27.39 28.42 30.30 34.73 39.74 43.29 45.91 48.61 12–15 years . . . . . . . . . . . . . . . 576 48.00 7.88 34.91 37.54 39.42 42.42 48.01 53.23 56.02 58.10 61.00 16–19 years . . . . . . . . . . . . . . . 543 51.67 7.34 40.32 42.30 43.93 46.41 51.61 56.29 59.19 60.90 63.47 20–29 years . . . . . . . . . . . . . . . 583 51.92 7.60 39.52 42.87 44.12 47.05 51.55 57.29 59.86 61.36 63.91 30–39 years . . . . . . . . . . . . . . . 612 51.81 8.09 37.42 42.01 43.70 46.83 51.88 57.30 60.16 61.92 64.55 40–49 years . . . . . . . . . . . . . . . 668 52.59 8.16 38.75 41.54 43.82 47.20 52.58 57.85 60.76 62.92 65.45 50–59 years . . . . . . . . . . . . . . . 639 51.48 7.77 37.66 41.11 43.34 46.30 51.72 56.62 59.49 61.11 64.36 60–69 years . . . . . . . . . . . . . . . 644 49.05 8.49 35.35 37.71 40.01 43.08 49.06 55.05 58.15 59.85 63.02 70–79 years . . . . . . . . . . . . . . . 429 48.29 8.36 34.31 37.47 39.45 42.38 48.57 53.93 56.54 58.70 61.63 80 years and over . . . . . . . . . . . 457 45.63 8.59 31.51 34.41 36.31 39.68 45.18 51.58 54.03 56.70 60.08
20 years and over (age-adjusted) . . 4,032 51.08 . . . . . . . . . . . . . . . . . . . . . . . . . . . . . .
Non-Hispanic black 8–11 years . . . . . . . . . . . . . . . . 490 34.36 7.46 22.40 25.62 26.94 29.18 34.21 38.67 41.98 43.63 47.52 12–15 years . . . . . . . . . . . . . . . 737 46.57 7.16 34.93 37.39 39.09 41.57 46.70 51.47 53.64 55.13 58.18 16–19 years . . . . . . . . . . . . . . . 609 47.99 6.88 36.92 39.06 41.01 43.26 47.79 52.76 55.04 56.33 58.78 20–29 years . . . . . . . . . . . . . . . 297 48.49 7.43 36.16 39.13 41.05 43.73 48.27 53.49 56.75 58.47 60.58 30–39 years . . . . . . . . . . . . . . . 333 48.77 7.39 36.88 39.56 41.20 43.90 48.42 53.88 56.27 57.77 60.39 40–49 years . . . . . . . . . . . . . . . 398 49.48 7.71 36.76 39.46 42.03 44.49 49.23 54.90 57.70 59.35 62.23 50–59 years . . . . . . . . . . . . . . . 250 48.17 7.84 36.10 38.67 40.12 42.47 47.92 53.18 55.80 58.10 61.38 60–69 years . . . . . . . . . . . . . . . 306 47.72 8.08 34.72 36.83 38.56 42.21 47.82 53.36 56.53 58.20 60.21 70–79 years . . . . . . . . . . . . . . . 124 44.96 7.77 31.35 34.45 36.47 40.06 45.01 49.72 51.89 54.77 58.15 80 years and over . . . . . . . . . . . 58 *44.25 9.07 *28.86 *32.73 *34.81 *39.02 *43.42 *48.94 *51.47 *54.58 *60.21
20 years and over (age-adjusted) . . 1,766 48.15 . . . . . . . . . . . . . . . . . . . . . . . . . . . . . .
. . . Category not applicable.
* Figure does not meet standards of reliability or precision; relative standard error (standard error divided by estimate times 100) is 30%–39% or estimate is based on less than 12 degrees of freedom.
† Standard error not calculated by SUDAAN software.
NOTE: cm2 is centimeter squared.
SOURCE: National Health and Nutrition Examination Survey, 1999–2006.

Series 11, No. 253 [ Page 33
Table 14. Lumbar spine bone mineral content (g) of persons aged 8 years and over, by sex, race and ethnicity, and age: United States, 1999–2006
Percentile Sample Standard
Sex, race and ethnicity, and age size Mean deviation 5th 10th 15th 25th 50th 75th 85th 90th 95th
Male
All races and ethnicities 8–11 years . . . . . . . . . . . . . . . . 1,421 23.46 6.31 13.82 15.52 16.96 19.44 23.45 27.09 29.37 31.05 34.43 12–15 years . . . . . . . . . . . . . . . 2,264 41.31 15.04 20.24 23.74 25.80 29.35 39.62 51.61 57.73 61.31 67.92 16–19 years . . . . . . . . . . . . . . . 2,309 61.24 13.82 39.86 44.83 47.80 51.91 59.96 69.51 75.63 78.99 85.41 20–29 years . . . . . . . . . . . . . . . 1,530 62.39 14.06 42.05 45.83 48.31 52.93 60.54 70.84 76.54 81.08 87.82 30–39 years . . . . . . . . . . . . . . . 1,450 62.00 14.83 39.57 43.51 47.25 51.71 61.16 70.47 76.79 80.34 88.66 40–49 years . . . . . . . . . . . . . . . 1,549 63.21 16.22 39.87 43.69 46.49 51.69 61.45 73.36 79.26 85.15 91.93 50–59 years . . . . . . . . . . . . . . . 1,187 62.46 16.36 37.72 42.28 45.66 51.10 60.92 72.30 80.25 83.54 89.99 60–69 years . . . . . . . . . . . . . . . 1,350 64.23 18.15 38.34 43.23 46.47 51.68 62.44 74.67 82.18 86.82 95.77 70–79 years . . . . . . . . . . . . . . . 825 *64.21 19.39 37.59 42.04 44.68 50.24 60.72 76.23 84.72 90.22 98.06 80 years and over . . . . . . . . . . . 501 *64.47 20.51 35.40 41.46 45.01 50.88 61.61 74.37 85.71 92.39 103.02
20 years and over (age-adjusted) . . 8,392 62.93 . . . . . . . . . . . . . . . . . . . . . . . . . . . . . .
Mexican American 8–11 years . . . . . . . . . . . . . . . . 468 22.28 6.16 12.76 14.68 16.24 18.31 22.12 25.78 27.81 29.33 33.28 12–15 years . . . . . . . . . . . . . . . 777 40.94 14.85 19.30 23.18 25.34 29.57 39.65 51.28 57.99 61.26 66.25 16–19 years . . . . . . . . . . . . . . . 783 57.03 13.03 37.32 40.92 43.53 47.88 55.91 64.75 69.46 73.63 79.87 20–29 years . . . . . . . . . . . . . . . 444 58.19 12.38 40.27 43.45 45.91 49.91 56.93 65.06 71.28 75.36 81.32 30–39 years . . . . . . . . . . . . . . . 337 55.75 12.10 36.38 40.84 43.37 47.41 54.45 64.05 67.38 71.68 76.43 40–49 years . . . . . . . . . . . . . . . 381 56.35 13.71 37.50 40.65 42.92 45.78 54.92 65.04 69.98 73.64 78.17 50–59 years . . . . . . . . . . . . . . . 174 56.15 13.67 36.39 39.16 42.39 46.88 54.54 63.87 71.63 75.44 81.33 60–69 years . . . . . . . . . . . . . . . 348 60.02 17.47 37.46 40.19 42.24 47.78 57.07 68.79 78.10 84.59 93.79 70–79 years . . . . . . . . . . . . . . . 164 *63.19 20.37 *34.55 *41.90 *44.87 *49.29 *61.22 *72.09 *79.98 *85.96 *101.12 80 years and over . . . . . . . . . . . 48 *63.63 23.48 *32.93 *40.28 *43.06 *44.56 *59.01 *72.54 *84.99 *98.70 †
20 years and over (age-adjusted) . . 1,896 57.81 . . . . . . . . . . . . . . . . . . . . . . . . . . . . . .
Non-Hispanic white 8–11 years . . . . . . . . . . . . . . . . 369 23.56 6.23 14.10 15.51 16.92 19.58 23.81 27.27 29.37 30.97 33.76 12–15 years . . . . . . . . . . . . . . . 578 41.59 15.36 20.73 23.95 25.85 28.99 39.79 52.15 58.49 62.62 68.81 16–19 years . . . . . . . . . . . . . . . 591 61.77 13.72 40.15 45.77 48.42 52.15 60.34 70.06 76.23 79.56 85.52 20–29 years . . . . . . . . . . . . . . . 617 62.88 13.24 43.32 46.65 49.43 54.14 61.01 71.44 76.68 80.76 87.08 30–39 years . . . . . . . . . . . . . . . 647 63.02 14.90 39.88 44.53 48.22 52.54 62.45 71.35 77.80 81.11 89.84 40–49 years . . . . . . . . . . . . . . . 700 64.13 16.19 40.50 44.20 47.62 53.03 62.35 73.96 80.61 86.86 92.53 50–59 years . . . . . . . . . . . . . . . 683 62.90 16.05 37.65 42.50 46.28 52.22 61.80 72.35 80.26 83.34 89.07 60–69 years . . . . . . . . . . . . . . . 623 64.96 18.06 39.32 44.23 47.19 52.53 63.18 75.05 82.56 87.03 96.01 70–79 years . . . . . . . . . . . . . . . 496 65.16 19.45 38.06 42.41 45.11 51.32 61.62 77.81 86.18 92.02 99.09 80 years and over . . . . . . . . . . . 398 *64.56 20.37 35.91 41.53 45.13 51.02 61.88 74.56 85.66 92.27 102.21
20 years and over (age-adjusted) . . 4,164 63.66 . . . . . . . . . . . . . . . . . . . . . . . . . . . . . .
Non-Hispanic black 8–11 years . . . . . . . . . . . . . . . . 469 25.19 6.83 14.50 17.11 18.59 20.69 24.40 29.34 31.89 33.16 36.65 12–15 years . . . . . . . . . . . . . . . 745 42.90 14.86 22.09 24.86 27.47 32.01 41.36 52.16 58.95 63.68 70.68 16–19 years . . . . . . . . . . . . . . . 757 63.16 15.01 40.38 45.00 48.47 52.43 62.20 72.40 77.84 82.11 89.09 20–29 years . . . . . . . . . . . . . . . 325 67.92 17.25 43.51 48.45 51.22 55.72 66.09 76.61 85.71 90.01 98.40 30–39 years . . . . . . . . . . . . . . . 310 65.77 16.56 39.18 46.37 48.80 54.13 64.62 75.49 81.28 86.33 97.13 40–49 years . . . . . . . . . . . . . . . 366 64.62 17.61 39.98 43.93 46.72 52.43 62.61 74.92 81.63 86.43 94.06 50–59 years . . . . . . . . . . . . . . . 240 67.39 19.25 39.99 44.04 47.62 53.03 65.09 80.02 87.52 91.61 99.12 60–69 years . . . . . . . . . . . . . . . 303 66.85 18.47 40.23 44.65 47.77 53.47 64.29 77.83 86.45 92.40 99.56 70–79 years . . . . . . . . . . . . . . . 114 64.02 18.96 38.08 43.87 46.98 49.78 60.93 74.52 82.53 88.74 94.57 80 years and over . . . . . . . . . . . 36 *67.09 22.87 † *40.16 *44.28 *51.69 *62.22 *78.09 *90.04 *97.82 †
20 years and over (age-adjusted) . . 1,694 66.20 . . . . . . . . . . . . . . . . . . . . . . . . . . . . . .
See footnotes at end of table.

Page 34 [ Series 11, No. 253
Table 14. Lumbar spine bone mineral content (g) of persons aged 8 years and over, by sex, race and ethnicity, and age: United States, 1999–2006—Con.
Percentile Sample Standard
Sex, race and ethnicity, and age size Mean deviation 5th 10th 15th 25th 50th 75th 85th 90th 95th
Female
All races and ethnicities 8–11 years . . . . . . . . . . . . . . . . 1,465 25.87 8.38 15.32 17.26 18.30 19.99 23.98 30.06 35.06 37.80 41.70 12–15 years . . . . . . . . . . . . . . . 2,318 46.07 11.76 27.98 31.14 34.07 37.90 45.47 52.96 58.09 61.36 67.67 16–19 years . . . . . . . . . . . . . . . 2,027 53.10 11.21 36.15 39.26 41.86 45.52 52.21 59.36 64.08 68.27 73.09 20–29 years . . . . . . . . . . . . . . . 1,378 54.82 11.11 37.26 41.21 43.92 47.23 54.10 62.02 66.40 69.10 73.45 30–39 years . . . . . . . . . . . . . . . 1,372 55.10 11.74 37.38 40.85 43.20 46.94 54.44 62.13 66.98 70.39 75.50 40–49 years . . . . . . . . . . . . . . . 1,570 55.31 12.82 36.50 38.95 42.00 46.37 54.43 63.16 68.22 71.82 78.40 50–59 years . . . . . . . . . . . . . . . 1,200 51.51 12.83 32.45 35.45 37.93 42.33 50.78 59.86 64.81 68.93 73.14 60–69 years . . . . . . . . . . . . . . . 1,419 48.05 14.08 28.16 31.08 33.61 37.79 46.91 56.61 62.20 66.46 71.57 70–79 years . . . . . . . . . . . . . . . 750 45.96 13.73 26.63 30.16 32.87 36.27 44.27 54.17 59.05 62.87 69.90 80 years and over . . . . . . . . . . . 594 42.47 13.51 22.56 26.01 28.92 32.70 41.23 50.72 55.87 60.83 65.55
20 years and over (age-adjusted) . . 8,283 52.47 . . . . . . . . . . . . . . . . . . . . . . . . . . . . . .
Mexican American 8–11 years . . . . . . . . . . . . . . . . 471 *24.62 7.87 14.21 16.09 17.14 18.96 23.33 28.31 32.38 35.75 39.72 12–15 years . . . . . . . . . . . . . . . 821 44.29 10.26 26.96 31.43 34.16 37.76 43.27 50.81 54.43 56.80 61.61 16–19 years . . . . . . . . . . . . . . . 692 49.72 9.88 34.71 37.75 39.80 42.86 49.14 55.31 59.61 62.86 67.12 20–29 years . . . . . . . . . . . . . . . 364 51.52 10.30 36.02 39.31 41.75 44.75 50.75 57.76 61.86 64.46 68.29 30–39 years . . . . . . . . . . . . . . . 298 51.85 11.65 33.92 37.91 39.96 43.96 50.92 58.95 63.38 66.22 70.47 40–49 years . . . . . . . . . . . . . . . 372 50.65 11.67 32.19 36.90 39.01 42.14 49.99 57.75 63.06 66.09 69.87 50–59 years . . . . . . . . . . . . . . . 194 47.15 14.40 27.07 31.16 34.25 37.83 44.60 55.04 60.83 62.80 71.03 60–69 years . . . . . . . . . . . . . . . 375 42.17 12.29 23.87 27.46 30.28 33.30 41.83 49.11 53.09 58.61 62.88 70–79 years . . . . . . . . . . . . . . . 154 *39.83 11.82 *20.08 *24.07 *27.42 *31.62 *39.46 *47.97 *52.60 *54.37 *58.52 80 years and over . . . . . . . . . . . 47 *38.68 13.22 † *22.32 *23.72 *29.90 *37.71 *46.48 *50.07 *52.52 †
20 years and over (age-adjusted) . . 1,804 48.20 . . . . . . . . . . . . . . . . . . . . . . . . . . . . . .
Non-Hispanic white 8–11 years . . . . . . . . . . . . . . . . 383 25.99 8.28 15.66 17.57 18.56 20.02 23.90 30.57 35.30 37.66 41.54 12–15 years . . . . . . . . . . . . . . . 576 46.26 12.33 27.58 30.49 33.14 37.67 45.59 53.86 59.15 61.90 68.72 16–19 years . . . . . . . . . . . . . . . 543 54.36 11.16 37.74 41.26 43.45 46.82 53.29 60.23 64.72 69.53 74.20 20–29 years . . . . . . . . . . . . . . . 583 55.76 10.73 39.13 42.66 45.05 48.66 55.07 62.46 66.88 70.01 73.69 30–39 years . . . . . . . . . . . . . . . 612 55.87 11.72 37.28 41.35 43.94 48.11 55.37 62.93 67.61 70.98 75.74 40–49 years . . . . . . . . . . . . . . . 668 56.07 12.72 37.64 39.58 42.57 46.87 55.53 63.78 68.74 72.43 79.24 50–59 years . . . . . . . . . . . . . . . 639 52.55 12.40 32.88 36.64 39.17 43.84 51.99 60.60 65.50 69.03 73.10 60–69 years . . . . . . . . . . . . . . . 644 48.52 13.98 28.46 31.69 34.17 38.28 47.38 56.92 62.90 66.77 71.55 70–79 years . . . . . . . . . . . . . . . 429 46.59 13.87 27.49 30.69 33.16 36.83 44.98 54.68 59.39 63.92 70.31 80 years and over . . . . . . . . . . . 457 42.87 13.40 22.89 26.43 29.46 33.15 41.48 51.17 55.91 61.09 65.76
20 years and over (age-adjusted) . . 4,032 53.25 . . . . . . . . . . . . . . . . . . . . . . . . . . . . . .
Non-Hispanic black 8–11 years . . . . . . . . . . . . . . . . 490 27.16 9.41 14.69 16.87 18.45 20.66 25.73 31.41 36.39 39.94 45.11 12–15 years . . . . . . . . . . . . . . . 737 48.34 11.68 29.46 33.84 36.21 40.42 48.02 55.49 59.72 64.37 69.14 16–19 years . . . . . . . . . . . . . . . 609 53.50 11.07 36.08 39.09 41.68 45.60 53.17 60.75 65.39 68.69 72.78 20–29 years . . . . . . . . . . . . . . . 297 55.27 11.83 36.60 40.23 43.58 46.75 54.64 64.18 68.73 70.49 74.68 30–39 years . . . . . . . . . . . . . . . 333 56.31 11.74 39.09 41.91 43.88 48.30 55.35 63.90 69.14 72.16 75.46 40–49 years . . . . . . . . . . . . . . . 398 57.03 13.75 37.05 39.97 43.81 47.47 55.72 65.31 70.89 74.37 82.00 50–59 years . . . . . . . . . . . . . . . 250 52.29 13.57 33.43 36.68 38.58 42.53 51.03 59.96 66.83 69.98 76.07 60–69 years . . . . . . . . . . . . . . . 306 51.54 14.96 30.20 32.73 35.51 40.52 50.64 60.34 66.18 71.91 77.34 70–79 years . . . . . . . . . . . . . . . 124 46.51 13.61 27.22 31.40 34.08 36.86 44.63 52.61 58.48 65.24 † 80 years and over . . . . . . . . . . . 58 *43.88 14.85 *20.59 *25.83 *29.48 *33.79 *42.02 *52.76 *58.47 *61.83 *71.93
20 years and over (age-adjusted) . . 1,766 53.77 . . . . . . . . . . . . . . . . . . . . . . . . . . . . . .
* Figure does not meet standards of reliability or precision; relative standard error (standard error divided by estimate times 100) is 30%–39% or estimate is based on less than 12 degrees of freedom.
. . . Category not applicable.
† Standard error not calculated by SUDAAN software.
NOTE: g is grams.
SOURCE: National Health and Nutrition Examination Survey, 1999–2006.

Series 11, No. 253 [ Page 35
Table 15. Lumbar spine bone mineral density (g/cm2) of persons aged 8 years and over, by sex, race and ethnicity, and age: United States, 1999–2006
Percentile Sample Standard
Sex, race and ethnicity, and age size Mean deviation 5th 10th 15th 25th 50th 75th 85th 90th 95th
Male
All races and ethnicities 8–11 years . . . . . . . . . . . . . . . . 1,421 0.685 0.075 0.568 0.592 0.607 0.632 0.682 0.729 0.761 0.779 0.816 12–15 years . . . . . . . . . . . . . . . 2,264 0.845 0.147 0.635 0.671 0.693 0.732 0.829 0.942 1.005 1.041 1.105 16–19 years . . . . . . . . . . . . . . . 2,309 1.047 0.137 0.836 0.877 0.910 0.954 1.035 1.131 1.188 1.224 1.288 20–29 years . . . . . . . . . . . . . . . 1,530 1.064 0.143 0.858 0.902 0.924 0.965 1.049 1.146 1.208 1.249 1.314 30–39 years . . . . . . . . . . . . . . . 1,450 1.050 0.151 0.827 0.870 0.896 0.944 1.044 1.133 1.191 1.240 1.315 40–49 years . . . . . . . . . . . . . . . 1,549 1.042 0.156 0.817 0.859 0.892 0.934 1.020 1.134 1.195 1.248 1.312 50–59 years . . . . . . . . . . . . . . . 1,187 1.034 0.167 0.791 0.832 0.867 0.918 1.015 1.126 1.201 1.258 1.338 60–69 years . . . . . . . . . . . . . . . 1,350 1.073 0.187 0.793 0.847 0.885 0.942 1.057 1.192 1.275 1.325 1.402 70–79 years . . . . . . . . . . . . . . . 825 1.078 0.199 0.786 0.843 0.878 0.932 1.057 1.193 1.290 1.345 1.440 80 years and over . . . . . . . . . . . 501 1.092 0.229 0.781 0.833 0.861 0.922 1.062 1.213 1.329 1.395 1.515
20 years and over (age-adjusted) . . 8,392 1.055 . . . . . . . . . . . . . . . . . . . . . . . . . . . . . .
Mexican American 8–11 years . . . . . . . . . . . . . . . . 468 0.665 0.071 0.558 0.576 0.594 0.617 0.661 0.707 0.731 0.756 0.793 12–15 years . . . . . . . . . . . . . . . 777 0.838 0.147 0.620 0.655 0.684 0.725 0.822 0.930 1.002 1.049 1.104 16–19 years . . . . . . . . . . . . . . . 783 0.994 0.126 0.800 0.843 0.870 0.902 0.989 1.064 1.117 1.156 1.212 20–29 years . . . . . . . . . . . . . . . 444 1.009 0.121 0.823 0.859 0.882 0.925 1.003 1.080 1.127 1.163 1.221 30–39 years . . . . . . . . . . . . . . . 337 0.985 0.130 0.771 0.833 0.863 0.900 0.973 1.063 1.110 1.156 1.211 40–49 years . . . . . . . . . . . . . . . 381 0.977 0.147 0.768 0.796 0.828 0.866 0.958 1.067 1.127 1.169 1.213 50–59 years . . . . . . . . . . . . . . . 174 0.983 0.147 0.770 0.803 0.827 0.874 0.968 1.064 1.141 1.184 1.243 60–69 years . . . . . . . . . . . . . . . 348 1.028 0.182 0.778 0.822 0.854 0.894 0.997 1.137 1.219 1.287 1.344 70–79 years . . . . . . . . . . . . . . . 164 *1.051 0.220 *0.748 *0.798 *0.846 *0.895 *1.009 *1.175 *1.246 *1.324 *1.424 80 years and over . . . . . . . . . . . 48 *1.052 0.225 *0.746 *0.793 *0.811 *0.849 *1.017 *1.180 *1.253 *1.374 †
20 years and over (age-adjusted) . . 1,896 1.000 . . . . . . . . . . . . . . . . . . . . . . . . . . . . . .
Non-Hispanic white 8–11 years . . . . . . . . . . . . . . . . 369 0.680 0.070 0.566 0.590 0.604 0.628 0.679 0.725 0.749 0.769 0.797 12–15 years . . . . . . . . . . . . . . . 578 0.841 0.145 0.628 0.670 0.691 0.727 0.827 0.938 1.000 1.034 1.100 16–19 years . . . . . . . . . . . . . . . 591 1.040 0.132 0.831 0.869 0.906 0.950 1.027 1.127 1.177 1.211 1.261 20–29 years . . . . . . . . . . . . . . . 617 1.056 0.129 0.864 0.902 0.926 0.965 1.046 1.136 1.187 1.227 1.290 30–39 years . . . . . . . . . . . . . . . 647 1.049 0.147 0.827 0.870 0.897 0.950 1.046 1.129 1.181 1.227 1.299 40–49 years . . . . . . . . . . . . . . . 700 1.038 0.148 0.822 0.862 0.897 0.935 1.020 1.126 1.188 1.232 1.295 50–59 years . . . . . . . . . . . . . . . 683 1.028 0.161 0.787 0.832 0.864 0.918 1.012 1.119 1.189 1.242 1.314 60–69 years . . . . . . . . . . . . . . . 623 1.072 0.183 0.796 0.848 0.886 0.942 1.056 1.191 1.267 1.324 1.394 70–79 years . . . . . . . . . . . . . . . 496 1.081 0.196 0.795 0.850 0.885 0.935 1.057 1.193 1.292 1.343 1.438 80 years and over . . . . . . . . . . . 398 1.089 0.225 0.786 0.834 0.864 0.921 1.060 1.207 1.319 1.388 1.499
20 years and over (age-adjusted) . . 4,164 1.052 . . . . . . . . . . . . . . . . . . . . . . . . . . . . . .
Non-Hispanic black 8–11 years . . . . . . . . . . . . . . . . 469 0.726 0.084 0.599 0.631 0.645 0.669 0.716 0.772 0.808 0.830 0.863 12–15 years . . . . . . . . . . . . . . . 745 0.891 0.157 0.668 0.708 0.734 0.771 0.871 0.993 1.046 1.089 1.175 16–19 years . . . . . . . . . . . . . . . 757 1.112 0.149 0.897 0.936 0.964 1.009 1.092 1.207 1.266 1.320 1.378 20–29 years . . . . . . . . . . . . . . . 325 1.174 0.172 0.924 0.966 0.991 1.054 1.154 1.275 1.348 1.398 1.486 30–39 years . . . . . . . . . . . . . . . 310 1.145 0.163 0.883 0.934 0.972 1.037 1.138 1.251 1.312 1.360 1.441 40–49 years . . . . . . . . . . . . . . . 366 1.124 0.194 0.867 0.911 0.940 0.984 1.103 1.226 1.317 1.380 1.451 50–59 years . . . . . . . . . . . . . . . 240 1.143 0.194 0.853 0.900 0.932 1.013 1.126 1.256 1.359 1.398 1.496 60–69 years . . . . . . . . . . . . . . . 303 1.156 0.201 0.872 0.924 0.962 1.013 1.124 1.278 1.361 1.407 1.513 70–79 years . . . . . . . . . . . . . . . 114 1.139 0.207 0.847 0.898 0.913 0.984 1.105 1.255 1.351 1.403 1.473 80 years and over . . . . . . . . . . . 36 *1.182 0.287 † *0.835 *0.888 *0.971 *1.146 *1.336 *1.459 *1.563 †
20 years and over (age-adjusted) . . 1,694 1.148 . . . . . . . . . . . . . . . . . . . . . . . . . . . . . .
See footnotes at end of table.

Page 36 [ Series 11, No. 253
Table 15. Lumbar spine bone mineral density (g/cm2) of persons aged 8 years and over, by sex, race and ethnicity, and age: United States, 1999–2006—Con.
Percentile Sample Standard
Sex, race and ethnicity, and age size Mean deviation 5th 10th 15th 25th 50th 75th 85th 90th 95th
Female
All races and ethnicities 8–11 years . . . . . . . . . . . . . . . . 1,465 0.730 0.106 0.583 0.609 0.624 0.655 0.713 0.787 0.840 0.879 0.932 12–15 years . . . . . . . . . . . . . . . 2,318 0.962 0.135 0.743 0.793 0.825 0.871 0.960 1.044 1.096 1.134 1.187 16–19 years . . . . . . . . . . . . . . . 2,027 1.050 0.123 0.864 0.898 0.923 0.960 1.040 1.128 1.177 1.218 1.272 20–29 years . . . . . . . . . . . . . . . 1,378 1.074 0.123 0.879 0.922 0.950 0.991 1.070 1.147 1.193 1.229 1.285 30–39 years . . . . . . . . . . . . . . . 1,372 1.080 0.133 0.878 0.912 0.942 0.984 1.075 1.165 1.220 1.256 1.301 40–49 years . . . . . . . . . . . . . . . 1,570 1.066 0.150 0.844 0.886 0.917 0.961 1.053 1.159 1.215 1.248 1.320 50–59 years . . . . . . . . . . . . . . . 1,200 1.014 0.159 0.778 0.824 0.852 0.900 0.997 1.114 1.172 1.225 1.297 60–69 years . . . . . . . . . . . . . . . 1,419 0.978 0.170 0.721 0.772 0.808 0.859 0.962 1.078 1.150 1.206 1.285 70–79 years . . . . . . . . . . . . . . . 750 0.952 0.173 0.707 0.753 0.784 0.834 0.925 1.055 1.117 1.174 1.259 80 years and over . . . . . . . . . . . 594 0.924 0.175 0.661 0.717 0.751 0.800 0.904 1.026 1.099 1.155 1.231
20 years and over (age-adjusted) . . 8,283 1.038 . . . . . . . . . . . . . . . . . . . . . . . . . . . . . .
Mexican American 8–11 years . . . . . . . . . . . . . . . . 471 0.718 0.101 0.584 0.603 0.623 0.649 0.703 0.766 0.818 0.856 0.922 12–15 years . . . . . . . . . . . . . . . 821 0.946 0.122 0.742 0.794 0.826 0.866 0.949 1.023 1.062 1.099 1.153 16–19 years . . . . . . . . . . . . . . . 692 1.016 0.120 0.836 0.869 0.896 0.935 1.010 1.092 1.139 1.170 1.217 20–29 years . . . . . . . . . . . . . . . 364 1.034 0.116 0.852 0.886 0.917 0.954 1.021 1.109 1.154 1.194 1.236 30–39 years . . . . . . . . . . . . . . . 298 1.038 0.139 0.811 0.862 0.896 0.949 1.036 1.119 1.158 1.216 1.259 40–49 years . . . . . . . . . . . . . . . 372 1.025 0.131 0.822 0.862 0.889 0.932 1.025 1.107 1.161 1.202 1.249 50–59 years . . . . . . . . . . . . . . . 194 0.971 0.162 0.748 0.787 0.810 0.849 0.952 1.061 1.134 1.182 1.254 60–69 years . . . . . . . . . . . . . . . 375 0.906 0.150 0.679 0.715 0.744 0.796 0.907 0.997 1.056 1.096 1.142 70–79 years . . . . . . . . . . . . . . . 154 *0.875 0.151 *0.631 *0.684 *0.717 *0.767 *0.869 *0.975 *1.024 *1.056 *1.144 80 years and over . . . . . . . . . . . 47 *0.849 0.166 † *0.632 *0.675 *0.734 *0.841 *0.929 *0.992 *1.055 †
20 years and over (age-adjusted) . . 1,804 0.988 . . . . . . . . . . . . . . . . . . . . . . . . . . . . . .
Non-Hispanic white 8–11 years . . . . . . . . . . . . . . . . 383 0.721 0.101 0.577 0.605 0.619 0.649 0.707 0.776 0.825 0.862 0.906 12–15 years . . . . . . . . . . . . . . . 576 0.951 0.136 0.729 0.785 0.811 0.860 0.952 1.037 1.087 1.121 1.161 16–19 years . . . . . . . . . . . . . . . 543 1.047 0.118 0.866 0.902 0.927 0.960 1.041 1.123 1.170 1.203 1.247 20–29 years . . . . . . . . . . . . . . . 583 1.072 0.115 0.894 0.934 0.954 0.992 1.069 1.140 1.188 1.222 1.273 30–39 years . . . . . . . . . . . . . . . 612 1.074 0.125 0.884 0.913 0.944 0.979 1.072 1.159 1.209 1.249 1.287 40–49 years . . . . . . . . . . . . . . . 668 1.062 0.147 0.845 0.885 0.914 0.960 1.047 1.155 1.207 1.241 1.296 50–59 years . . . . . . . . . . . . . . . 639 1.015 0.154 0.777 0.826 0.856 0.907 1.000 1.116 1.167 1.214 1.281 60–69 years . . . . . . . . . . . . . . . 644 0.977 0.165 0.730 0.775 0.811 0.860 0.960 1.077 1.149 1.197 1.278 70–79 years . . . . . . . . . . . . . . . 429 0.953 0.171 0.711 0.757 0.790 0.836 0.928 1.049 1.115 1.166 1.255 80 years and over . . . . . . . . . . . 457 0.926 0.173 0.664 0.720 0.755 0.800 0.907 1.030 1.100 1.154 1.233
20 years and over (age-adjusted) . . 4,032 1.035 . . . . . . . . . . . . . . . . . . . . . . . . . . . . . .
Non-Hispanic black 8–11 years . . . . . . . . . . . . . . . . 490 0.774 0.119 0.598 0.635 0.658 0.691 0.756 0.842 0.900 0.940 0.991 12–15 years . . . . . . . . . . . . . . . 737 1.028 0.139 0.798 0.848 0.885 0.939 1.026 1.122 1.178 1.214 1.252 16–19 years . . . . . . . . . . . . . . . 609 1.110 0.132 0.898 0.940 0.969 1.013 1.104 1.198 1.248 1.278 1.329 20–29 years . . . . . . . . . . . . . . . 297 1.135 0.143 0.912 0.952 0.988 1.034 1.129 1.216 1.277 1.314 1.391 30–39 years . . . . . . . . . . . . . . . 333 1.151 0.141 0.941 0.978 1.005 1.054 1.137 1.238 1.287 1.325 1.401 40–49 years . . . . . . . . . . . . . . . 398 1.145 0.165 0.881 0.940 0.978 1.039 1.131 1.246 1.314 1.361 1.410 50–59 years . . . . . . . . . . . . . . . 250 1.077 0.169 0.836 0.872 0.904 0.953 1.055 1.183 1.264 1.311 1.358 60–69 years . . . . . . . . . . . . . . . 306 1.067 0.191 0.777 0.832 0.872 0.935 1.044 1.185 1.253 1.314 1.398 70–79 years . . . . . . . . . . . . . . . 124 1.027 0.196 0.737 0.791 0.823 0.876 0.999 1.152 1.216 1.278 1.370 80 years and over . . . . . . . . . . . 58 *0.975 0.207 *0.673 *0.722 *0.789 *0.842 *0.949 *1.061 *1.144 *1.211 †
20 years and over (age-adjusted) . . 1,766 1.108 . . . . . . . . . . . . . . . . . . . . . . . . . . . . . .
. . . Category not applicable.
* Figure does not meet standards of reliability or precision; relative standard error (standard error divided by estimate times 100) is 30%–39% or estimate is based on less than 12 degrees of freedom.
† Standard error not calculated by SUDAAN software.
NOTE: g/cm2 is grams per centimeter squared.
SOURCE: National Health and Nutrition Examination Survey, 1999–2006.

Series 11, No. 253 [ Page 37
Table 16. Pelvis bone area (cm2) of persons aged 8 years and over, by sex, race and ethnicity, and age: United States, 1999–2006
Percentile Sample Standard
Sex, race and ethnicity, and age size Mean deviation 5th 10th 15th 25th 50th 75th 85th 90th 95th
Male
All races and ethnicities 8–11 years . . . . . . . . . . . . . . . . 1,421 129.70 23.79 90.61 98.03 104.41 114.27 130.78 145.05 152.58 157.44 166.82 12–15 years . . . . . . . . . . . . . . . 2,264 194.17 46.96 124.90 135.24 143.21 155.87 192.56 227.25 246.97 255.87 273.17 16–19 years . . . . . . . . . . . . . . . 2,309 247.53 37.96 187.98 200.78 209.22 220.63 245.98 273.37 286.85 296.35 311.17 20–29 years . . . . . . . . . . . . . . . 1,530 236.62 36.88 180.70 192.15 198.77 210.92 234.65 260.92 275.32 286.15 300.81 30–39 years . . . . . . . . . . . . . . . 1,450 222.10 35.79 167.77 178.31 185.90 196.18 219.97 245.16 259.87 269.35 284.67 40–49 years . . . . . . . . . . . . . . . 1,549 215.81 32.65 164.98 176.46 183.09 192.06 213.76 235.38 249.29 259.93 276.43 50–59 years . . . . . . . . . . . . . . . 1,187 208.19 32.51 160.32 168.97 174.09 184.77 207.40 228.18 239.90 247.03 264.09 60–69 years . . . . . . . . . . . . . . . 1,350 207.89 30.65 157.36 169.22 176.83 188.34 208.05 226.93 238.60 246.67 259.17 70–79 years . . . . . . . . . . . . . . . 825 203.97 30.91 155.56 164.79 171.01 182.64 203.51 224.39 237.11 244.07 253.33 80 years and over . . . . . . . . . . . 501 199.57 32.93 148.21 158.60 165.96 177.11 199.06 218.24 230.64 242.51 253.20
20 years and over (age-adjusted) . . 8,392 217.24 . . . . . . . . . . . . . . . . . . . . . . . . . . . . . .
Mexican American 8–11 years . . . . . . . . . . . . . . . . 468 125.61 24.44 88.11 94.71 98.92 108.36 124.48 141.94 149.73 154.07 161.65 12–15 years . . . . . . . . . . . . . . . 777 188.65 43.87 115.57 132.18 140.81 154.66 189.35 218.45 235.67 247.22 262.35 16–19 years . . . . . . . . . . . . . . . 783 228.90 35.07 174.45 187.26 193.46 205.82 226.11 249.46 265.63 273.87 288.30 20–29 years . . . . . . . . . . . . . . . 444 216.83 31.00 167.98 178.80 186.16 196.36 213.96 236.59 248.13 257.22 270.02 30–39 years . . . . . . . . . . . . . . . 337 198.82 28.41 154.74 164.81 170.42 179.50 195.77 215.93 228.88 236.14 250.01 40–49 years . . . . . . . . . . . . . . . 381 197.33 28.42 155.53 164.34 169.26 178.03 194.00 213.52 225.06 233.43 246.99 50–59 years . . . . . . . . . . . . . . . 174 193.57 27.92 149.07 158.91 163.66 173.65 191.43 211.73 223.31 230.21 241.63 60–69 years . . . . . . . . . . . . . . . 348 194.47 27.31 154.90 163.06 167.24 174.09 192.15 211.45 222.86 231.99 238.70 70–79 years . . . . . . . . . . . . . . . 164 *190.45 25.73 *148.88 *158.77 *160.50 *174.10 *190.78 *207.94 *215.69 *220.29 *229.14 80 years and over . . . . . . . . . . . 48 *183.23 31.02 *132.50 *137.23 *144.44 *162.34 *183.14 *201.47 *212.63 *227.29 *236.86
20 years and over (age-adjusted) . . 1,896 199.12 . . . . . . . . . . . . . . . . . . . . . . . . . . . . . .
Non-Hispanic white 8–11 years . . . . . . . . . . . . . . . . 369 131.95 24.41 89.40 97.23 105.73 117.37 133.28 147.88 154.27 160.63 167.94 12–15 years . . . . . . . . . . . . . . . 578 197.73 48.56 126.51 136.96 144.22 156.59 195.95 232.53 251.57 262.65 275.73 16–19 years . . . . . . . . . . . . . . . 591 252.43 37.84 191.48 206.23 213.16 224.34 250.88 279.25 291.60 300.36 314.23 20–29 years . . . . . . . . . . . . . . . 617 240.23 35.90 184.34 195.96 204.20 213.96 237.65 264.47 278.59 288.36 302.32 30–39 years . . . . . . . . . . . . . . . 647 226.93 35.88 171.08 182.88 189.69 202.72 225.62 249.12 264.80 275.10 287.47 40–49 years . . . . . . . . . . . . . . . 700 219.37 31.89 168.88 181.05 187.59 196.40 217.62 238.35 251.75 262.06 278.32 50–59 years . . . . . . . . . . . . . . . 683 210.19 32.23 162.17 170.84 176.85 187.04 209.54 229.79 240.53 248.22 265.42 60–69 years . . . . . . . . . . . . . . . 623 209.89 30.04 159.94 171.94 180.65 190.43 209.00 228.65 239.88 247.16 259.76 70–79 years . . . . . . . . . . . . . . . 496 206.60 29.75 158.60 168.23 174.74 185.87 205.55 226.58 238.12 245.37 254.65 80 years and over . . . . . . . . . . . 398 200.30 32.23 151.88 160.35 167.47 178.31 199.21 218.16 230.68 242.13 253.36
20 years and over (age-adjusted) . . 4,164 220.47 . . . . . . . . . . . . . . . . . . . . . . . . . . . . . .
Non-Hispanic black 8–11 years . . . . . . . . . . . . . . . . 469 129.42 21.65 96.13 104.43 109.20 115.28 128.04 141.83 150.04 154.28 167.95 12–15 years . . . . . . . . . . . . . . . 745 194.48 44.66 127.76 139.33 146.26 158.68 193.07 224.91 240.76 252.30 271.38 16–19 years . . . . . . . . . . . . . . . 757 248.08 37.09 188.69 200.51 211.87 223.49 246.86 271.01 283.47 292.90 309.84 20–29 years . . . . . . . . . . . . . . . 325 246.98 37.43 190.81 197.76 203.89 221.04 246.51 268.84 281.77 292.20 310.67 30–39 years . . . . . . . . . . . . . . . 310 231.79 33.83 178.27 190.75 199.62 209.49 231.43 254.29 266.97 277.51 289.78 40–49 years . . . . . . . . . . . . . . . 366 218.72 34.32 168.09 177.45 183.32 193.89 214.41 239.28 256.24 266.64 282.99 50–59 years . . . . . . . . . . . . . . . 240 215.27 34.95 164.10 172.61 179.71 190.83 214.03 238.46 246.55 259.44 270.31 60–69 years . . . . . . . . . . . . . . . 303 211.53 30.31 162.94 172.59 181.81 191.94 210.60 228.93 241.20 250.16 267.10 70–79 years . . . . . . . . . . . . . . . 114 201.00 32.11 154.75 162.62 165.72 175.81 199.58 219.90 230.46 242.20 259.08 80 years and over . . . . . . . . . . . 36 *204.23 37.62 † *144.80 *164.09 *180.57 *206.39 *221.56 *240.74 *249.86 †
20 years and over (age-adjusted) . . 1,694 223.28 . . . . . . . . . . . . . . . . . . . . . . . . . . . . . .
See footnotes at end of table.

Page 38 [ Series 11, No. 253
Table 16. Pelvis bone area (cm2) of persons aged 8 years and over, by sex, race and ethnicity, and age: United States, 1999–2006—Con.
Percentile Sample Standard
Sex, race and ethnicity, and age size Mean deviation 5th 10th 15th 25th 50th 75th 85th 90th 95th
Female
All races and ethnicities 8–11 years . . . . . . . . . . . . . . . . 1,465 125.19 25.13 86.84 93.81 99.54 107.15 123.40 141.37 149.98 157.29 171.04 12–15 years . . . . . . . . . . . . . . . 2,318 179.46 29.54 131.39 140.88 148.92 159.63 178.10 199.45 210.93 218.62 228.02 16–19 years . . . . . . . . . . . . . . . 2,027 195.96 29.52 150.50 158.82 165.97 175.28 194.61 215.08 227.00 234.34 246.71 20–29 years . . . . . . . . . . . . . . . 1,378 192.31 29.71 146.10 155.14 160.30 170.21 191.34 212.24 224.10 231.20 241.86 30–39 years . . . . . . . . . . . . . . . 1,372 185.29 29.42 141.43 150.45 155.90 164.08 182.49 203.59 215.79 224.52 238.49 40–49 years . . . . . . . . . . . . . . . 1,570 181.64 30.94 137.63 144.22 150.07 158.88 178.32 200.47 212.84 222.29 238.42 50–59 years . . . . . . . . . . . . . . . 1,200 169.61 29.15 127.95 134.70 141.17 149.02 166.51 186.37 198.88 208.01 222.02 60–69 years . . . . . . . . . . . . . . . 1,419 164.34 28.73 122.47 130.86 136.31 145.56 162.53 180.72 190.27 197.61 213.38 70–79 years . . . . . . . . . . . . . . . 750 156.19 25.99 117.90 124.48 128.70 136.83 154.07 171.85 183.77 191.53 201.28 80 years and over . . . . . . . . . . . 594 148.37 25.09 107.26 116.86 123.09 130.57 147.56 164.47 173.39 180.83 190.20
20 years and over (age-adjusted) . . 8,283 177.08 . . . . . . . . . . . . . . . . . . . . . . . . . . . . . .
Mexican American 8–11 years . . . . . . . . . . . . . . . . 471 122.12 23.98 86.32 91.88 97.53 104.35 120.57 136.67 148.30 156.45 164.51 12–15 years . . . . . . . . . . . . . . . 821 171.48 26.80 128.91 137.88 143.94 153.42 170.78 189.98 197.67 203.28 215.17 16–19 years . . . . . . . . . . . . . . . 692 179.96 27.30 138.43 145.83 151.22 160.06 177.94 196.88 207.91 216.24 227.08 20–29 years . . . . . . . . . . . . . . . 364 173.92 25.41 136.19 143.02 147.30 155.17 172.04 191.31 200.30 204.57 217.14 30–39 years . . . . . . . . . . . . . . . 298 167.44 24.61 130.64 137.82 142.47 151.54 165.17 180.10 189.95 198.75 213.32 40–49 years . . . . . . . . . . . . . . . 372 165.85 24.93 128.53 134.53 140.74 149.25 163.64 181.02 190.47 196.09 207.96 50–59 years . . . . . . . . . . . . . . . 194 159.16 27.18 119.39 125.25 131.58 139.86 157.13 176.70 187.49 194.79 205.70 60–69 years . . . . . . . . . . . . . . . 375 150.68 25.44 114.12 122.11 126.34 134.50 148.64 163.05 176.92 182.06 200.22 70–79 years . . . . . . . . . . . . . . . 154 *148.50 24.76 *107.72 *116.15 *123.89 *132.46 *147.14 *165.70 *172.63 *178.03 *192.53 80 years and over . . . . . . . . . . . 47 *136.29 24.79 *95.08 *101.81 *108.69 *119.61 *136.08 *151.28 *164.82 *169.37 †
20 years and over (age-adjusted) . . 1,804 162.26 . . . . . . . . . . . . . . . . . . . . . . . . . . . . . .
Non-Hispanic white 8–11 years . . . . . . . . . . . . . . . . 383 126.74 24.66 88.66 95.36 100.69 109.34 125.56 142.03 151.17 157.51 171.08 12–15 years . . . . . . . . . . . . . . . 576 181.76 30.52 128.55 140.26 149.29 162.12 180.16 204.73 214.81 220.72 231.85 16–19 years . . . . . . . . . . . . . . . 543 201.40 28.49 156.31 166.08 172.41 182.09 200.80 219.90 230.53 237.49 249.53 20–29 years . . . . . . . . . . . . . . . 583 197.87 28.39 152.94 161.59 167.23 177.14 198.27 217.30 228.43 233.98 243.09 30–39 years . . . . . . . . . . . . . . . 612 189.94 29.40 146.55 154.53 159.47 168.82 187.03 208.19 221.00 228.43 242.26 40–49 years . . . . . . . . . . . . . . . 668 185.35 30.62 139.65 147.96 153.92 162.37 182.65 204.31 217.33 225.97 241.26 50–59 years . . . . . . . . . . . . . . . 639 171.50 28.04 130.49 138.46 144.48 152.19 168.47 187.84 199.07 208.25 222.19 60–69 years . . . . . . . . . . . . . . . 644 166.42 28.01 126.28 133.71 139.21 147.87 164.95 181.67 191.36 198.44 214.38 70–79 years . . . . . . . . . . . . . . . 429 157.59 25.57 120.23 126.24 131.54 138.52 155.30 173.43 184.93 192.25 201.88 80 years and over . . . . . . . . . . . 457 149.10 24.60 108.29 117.96 124.35 132.17 148.80 164.69 173.48 181.16 190.20
20 years and over (age-adjusted) . . 4,032 180.55 . . . . . . . . . . . . . . . . . . . . . . . . . . . . . .
Non-Hispanic black 8–11 years . . . . . . . . . . . . . . . . 490 121.82 26.25 82.32 89.79 96.63 104.40 119.66 136.25 148.21 155.80 167.32 12–15 years . . . . . . . . . . . . . . . 737 179.98 30.04 131.87 142.82 150.83 159.50 178.85 199.41 210.95 219.60 230.79 16–19 years . . . . . . . . . . . . . . . 609 193.43 28.29 152.82 159.51 165.13 173.09 192.08 210.98 220.37 227.94 240.08 20–29 years . . . . . . . . . . . . . . . 297 190.40 28.88 149.32 156.04 161.40 168.62 188.02 209.25 218.15 227.86 239.64 30–39 years . . . . . . . . . . . . . . . 333 185.95 27.41 143.65 151.84 157.23 166.41 185.53 202.90 212.80 219.92 230.25 40–49 years . . . . . . . . . . . . . . . 398 181.82 31.06 139.86 145.99 151.49 158.87 178.21 200.16 210.02 219.93 233.98 50–59 years . . . . . . . . . . . . . . . 250 171.81 32.51 126.86 136.52 140.13 148.93 166.57 189.82 205.62 214.53 225.75 60–69 years . . . . . . . . . . . . . . . 306 169.66 31.24 125.23 133.42 137.68 148.53 167.73 186.38 196.09 206.48 226.83 70–79 years . . . . . . . . . . . . . . . 124 159.26 28.20 113.32 123.27 128.62 138.84 159.76 174.90 186.65 196.58 † 80 years and over . . . . . . . . . . . 58 *154.15 27.82 *116.23 *123.02 *128.97 *135.25 *148.23 *167.71 *181.90 *188.12 †
20 years and over (age-adjusted) . . 1,766 178.32 . . . . . . . . . . . . . . . . . . . . . . . . . . . . . .
. . . Category not applicable.
* Figure does not meet standards of reliability or precision; relative standard error (standard error divided by estimate times 100) is 30%–39% or estimate is based on less than 12 degrees of freedom.
† Standard error not calculated by SUDAAN software.
NOTE: cm2 is centimeter squared.
SOURCE: National Health and Nutrition Examination Survey, 1999–2006.

Series 11, No. 253 [ Page 39
Table 17. Pelvis bone mineral content (g) of persons aged 8 years and over, by sex, race and ethnicity, and age: United States, 1999–2006
Percentile Sample Standard
Sex, race and ethnicity, and age size Mean deviation 5th 10th 15th 25th 50th 75th 85th 90th 95th
Male
All races and ethnicities 8–11 years . . . . . . . . . . . . . . . . 1,421 112.97 28.10 73.51 81.04 86.44 93.68 110.18 127.87 137.99 146.75 160.40 12–15 years . . . . . . . . . . . . . . . 2,264 224.12 85.05 112.35 124.92 136.85 155.02 212.62 278.24 316.49 340.40 376.71 16–19 years . . . . . . . . . . . . . . . 2,309 337.90 86.46 216.75 237.69 252.68 277.25 328.48 390.77 425.38 448.91 490.67 20–29 years . . . . . . . . . . . . . . . 1,530 329.62 82.30 213.18 234.77 249.33 273.18 321.01 373.52 408.06 434.95 483.78 30–39 years . . . . . . . . . . . . . . . 1,450 308.40 78.71 201.75 219.51 231.67 252.02 298.21 350.78 385.25 408.84 449.05 40–49 years . . . . . . . . . . . . . . . 1,549 296.85 71.24 192.84 214.19 228.30 247.38 289.38 337.79 364.93 388.62 421.70 50–59 years . . . . . . . . . . . . . . . 1,187 277.80 71.35 177.60 193.29 206.13 228.13 272.58 319.58 344.72 364.12 401.60 60–69 years . . . . . . . . . . . . . . . 1,350 269.22 69.86 162.61 183.79 200.79 222.69 262.43 309.34 341.42 359.79 396.87 70–79 years . . . . . . . . . . . . . . . 825 247.84 66.02 152.89 168.35 183.71 201.06 241.07 285.85 318.39 336.78 367.32 80 years and over . . . . . . . . . . . 501 225.48 66.26 133.56 148.33 162.19 178.24 216.16 262.54 287.37 316.11 347.25
20 years and over (age-adjusted) . . 8,392 292.15 . . . . . . . . . . . . . . . . . . . . . . . . . . . . . .
Mexican American 8–11 years . . . . . . . . . . . . . . . . 468 109.28 29.37 71.37 79.36 84.00 89.19 105.50 122.03 134.23 144.54 164.87 12–15 years . . . . . . . . . . . . . . . 777 218.09 83.71 104.06 121.81 134.06 153.43 207.78 266.58 303.71 327.18 375.51 16–19 years . . . . . . . . . . . . . . . 783 298.69 75.58 195.64 211.35 228.33 247.75 286.37 341.85 375.53 396.91 438.37 20–29 years . . . . . . . . . . . . . . . 444 289.96 67.29 195.65 214.09 226.75 246.74 280.21 323.77 355.56 379.62 409.04 30–39 years . . . . . . . . . . . . . . . 337 263.41 57.03 183.61 197.55 206.51 223.16 257.75 296.56 317.47 334.68 367.70 40–49 years . . . . . . . . . . . . . . . 381 258.87 62.27 175.01 185.99 197.80 216.15 250.13 291.24 319.02 339.96 371.00 50–59 years . . . . . . . . . . . . . . . 174 247.53 59.42 161.13 173.93 184.69 207.24 240.60 284.36 307.94 327.58 353.44 60–69 years . . . . . . . . . . . . . . . 348 242.24 60.27 166.33 176.23 186.18 199.49 230.75 277.99 303.29 314.29 342.62 70–79 years . . . . . . . . . . . . . . . 164 *222.21 55.13 *132.21 *150.18 *163.24 *181.28 *225.10 *256.23 *274.19 *296.26 *312.49 80 years and over . . . . . . . . . . . 48 *193.99 54.38 *123.56 *126.55 *131.76 *160.02 *180.58 *218.74 *256.35 *273.99 †
20 years and over (age-adjusted) . . 1,896 256.02 . . . . . . . . . . . . . . . . . . . . . . . . . . . . . .
Non-Hispanic white 8–11 years . . . . . . . . . . . . . . . . 369 114.39 27.97 72.76 82.27 87.72 94.53 112.49 129.09 140.15 148.85 160.33 12–15 years . . . . . . . . . . . . . . . 578 226.74 85.88 114.06 124.61 137.81 155.25 215.85 284.58 324.92 343.83 379.77 16–19 years . . . . . . . . . . . . . . . 591 343.08 83.53 222.85 241.18 257.19 283.40 335.64 396.08 430.74 454.02 491.14 20–29 years . . . . . . . . . . . . . . . 617 332.34 76.48 221.93 242.59 257.14 278.64 323.96 373.22 405.24 431.60 475.31 30–39 years . . . . . . . . . . . . . . . 647 314.66 77.18 206.63 226.46 240.75 260.48 306.63 358.18 388.71 409.14 448.97 40–49 years . . . . . . . . . . . . . . . 700 301.66 68.61 202.57 222.40 233.90 254.71 294.70 339.97 367.69 389.86 420.63 50–59 years . . . . . . . . . . . . . . . 683 279.43 69.27 181.22 196.08 208.28 231.75 273.81 319.63 344.06 362.28 398.31 60–69 years . . . . . . . . . . . . . . . 623 271.59 68.15 167.75 188.63 205.03 226.02 264.33 310.48 343.00 360.32 395.27 70–79 years . . . . . . . . . . . . . . . 496 251.67 65.68 156.94 172.54 185.48 204.58 244.23 291.38 325.07 343.23 369.70 80 years and over . . . . . . . . . . . 398 225.19 64.59 135.02 151.90 163.13 179.39 215.77 261.78 285.78 312.16 346.56
20 years and over (age-adjusted) . . 4,164 295.82 . . . . . . . . . . . . . . . . . . . . . . . . . . . . . .
Non-Hispanic black 8–11 years . . . . . . . . . . . . . . . . 469 118.38 29.57 79.64 86.96 92.38 99.74 114.39 131.97 141.06 152.55 171.83 12–15 years . . . . . . . . . . . . . . . 745 235.80 89.34 121.62 134.04 144.34 162.95 227.09 291.70 326.98 346.81 394.79 16–19 years . . . . . . . . . . . . . . . 757 363.55 101.48 230.58 256.30 270.58 291.04 351.80 418.98 451.72 479.69 524.08 20–29 years . . . . . . . . . . . . . . . 325 378.10 99.56 242.49 266.38 287.07 309.40 359.06 428.41 484.87 503.46 549.17 30–39 years . . . . . . . . . . . . . . . 310 349.77 85.60 231.25 246.18 265.79 294.49 336.40 399.55 438.70 465.74 503.38 40–49 years . . . . . . . . . . . . . . . 366 317.07 83.91 202.83 225.40 235.67 259.40 303.96 361.12 394.05 429.06 471.20 50–59 years . . . . . . . . . . . . . . . 240 310.38 82.77 194.01 211.14 224.75 252.58 300.69 357.08 383.87 415.74 459.54 60–69 years . . . . . . . . . . . . . . . 303 292.74 73.56 181.01 208.81 224.21 247.44 284.96 332.30 362.92 390.27 425.18 70–79 years . . . . . . . . . . . . . . . 114 254.61 68.88 156.85 171.97 185.15 203.96 247.29 291.65 312.50 330.32 382.35 80 years and over . . . . . . . . . . . 36 *253.86 83.16 † *152.88 *167.42 *194.61 *243.89 *280.18 *323.87 *375.57 †
20 years and over (age-adjusted) . . 1,694 323.60 . . . . . . . . . . . . . . . . . . . . . . . . . . . . . .
See footnotes at end of table.

Page 40 [ Series 11, No. 253
Table 17. Pelvis bone mineral content (g) of persons aged 8 years and over, by sex, race and ethnicity, and age: United States, 1999–2006—Con.
Percentile Sample Standard
Sex, race and ethnicity, and age size Mean deviation 5th 10th 15th 25th 50th 75th 85th 90th 95th
Female
All races and ethnicities 8–11 years . . . . . . . . . . . . . . . . 1,465 116.46 38.48 70.04 76.19 81.47 89.23 108.03 134.84 155.06 170.27 193.10 12–15 years . . . . . . . . . . . . . . . 2,318 215.93 55.54 131.13 146.43 159.34 177.81 212.32 250.25 273.41 287.80 316.48 16–19 years . . . . . . . . . . . . . . . 2,027 249.58 57.40 164.59 179.56 192.71 210.50 242.82 285.80 308.45 328.41 352.57 20–29 years . . . . . . . . . . . . . . . 1,378 247.89 52.60 169.36 183.72 194.53 210.21 244.55 278.44 303.98 317.41 336.45 30–39 years . . . . . . . . . . . . . . . 1,372 243.66 53.75 164.12 178.74 189.41 205.06 239.17 275.78 298.43 316.07 338.89 40–49 years . . . . . . . . . . . . . . . 1,570 236.45 57.67 156.24 172.99 181.19 195.30 228.09 268.95 295.92 314.70 339.97 50–59 years . . . . . . . . . . . . . . . 1,200 210.98 54.42 135.63 149.17 157.61 173.37 203.80 241.53 266.47 281.04 314.78 60–69 years . . . . . . . . . . . . . . . 1,419 192.46 51.48 119.23 132.31 143.35 156.89 187.44 220.90 243.42 260.76 283.33 70–79 years . . . . . . . . . . . . . . . 750 168.28 44.43 105.94 118.67 125.64 138.05 162.00 191.64 211.43 227.53 248.53 80 years and over . . . . . . . . . . . 594 145.50 41.15 84.01 95.84 103.64 117.38 141.77 168.03 185.56 196.60 214.40
20 years and over (age-adjusted) . . 8,283 221.74 . . . . . . . . . . . . . . . . . . . . . . . . . . . . . .
Mexican American 8–11 years . . . . . . . . . . . . . . . . 471 111.13 36.65 66.24 73.77 77.04 86.33 103.15 125.54 144.06 163.97 187.83 12–15 years . . . . . . . . . . . . . . . 821 204.61 50.86 123.33 142.24 154.11 171.23 201.44 236.54 252.39 263.95 288.92 16–19 years . . . . . . . . . . . . . . . 692 224.78 51.48 151.47 165.38 172.62 187.06 219.09 254.99 275.40 292.68 316.27 20–29 years . . . . . . . . . . . . . . . 364 222.19 46.46 154.40 164.85 172.54 188.55 219.53 251.44 270.60 280.11 300.75 30–39 years . . . . . . . . . . . . . . . 298 217.98 50.74 147.87 162.13 171.67 185.37 210.66 241.88 262.04 276.96 307.47 40–49 years . . . . . . . . . . . . . . . 372 214.05 46.70 142.85 157.22 167.73 181.61 209.18 243.98 262.10 271.38 291.12 50–59 years . . . . . . . . . . . . . . . 194 191.73 54.20 115.41 126.04 137.16 153.55 188.12 218.60 245.44 254.82 280.55 60–69 years . . . . . . . . . . . . . . . 375 167.39 43.22 102.44 114.00 123.29 136.10 163.01 196.01 213.59 223.63 243.21 70–79 years . . . . . . . . . . . . . . . 154 *152.72 42.64 *84.13 *102.12 *114.93 *123.93 *146.71 *177.73 *192.74 *202.47 *227.50 80 years and over . . . . . . . . . . . 47 *128.83 36.79 † *79.30 *88.62 *103.61 *125.68 *150.52 *162.21 *168.41 †
20 years and over (age-adjusted) . . 1,804 199.08 . . . . . . . . . . . . . . . . . . . . . . . . . . . . . .
Non-Hispanic white 8–11 years . . . . . . . . . . . . . . . . 383 117.18 37.31 72.29 77.37 83.64 90.59 109.13 135.39 154.54 168.93 190.64 12–15 years . . . . . . . . . . . . . . . 576 216.71 56.20 129.70 146.08 159.79 177.33 212.63 250.80 274.61 290.19 318.71 16–19 years . . . . . . . . . . . . . . . 543 255.84 55.89 171.91 189.94 200.10 216.73 248.73 290.87 314.61 332.28 352.98 20–29 years . . . . . . . . . . . . . . . 583 252.58 49.27 177.30 190.80 199.73 218.18 250.56 281.60 306.98 317.83 335.74 30–39 years . . . . . . . . . . . . . . . 612 247.21 51.53 173.77 183.09 193.37 208.38 244.72 277.76 301.13 317.30 340.27 40–49 years . . . . . . . . . . . . . . . 668 238.78 56.21 162.57 176.03 183.91 197.97 231.15 270.96 297.06 316.47 339.39 50–59 years . . . . . . . . . . . . . . . 639 212.92 51.69 141.90 153.36 163.59 176.68 205.71 242.77 266.68 278.16 313.97 60–69 years . . . . . . . . . . . . . . . 644 194.15 50.26 122.61 135.39 145.96 159.99 189.75 221.34 243.11 260.46 283.17 70–79 years . . . . . . . . . . . . . . . 429 169.94 43.97 108.59 121.36 128.58 139.98 163.59 192.71 211.52 228.18 248.56 80 years and over . . . . . . . . . . . 457 146.23 39.86 83.85 96.59 104.22 117.96 143.17 168.68 186.64 197.34 212.88
20 years and over (age-adjusted) . . 4,032 224.50 . . . . . . . . . . . . . . . . . . . . . . . . . . . . . .
Non-Hispanic black 8–11 years . . . . . . . . . . . . . . . . 490 119.55 43.62 67.47 74.64 82.55 90.77 109.32 139.66 160.72 174.87 205.50 12–15 years . . . . . . . . . . . . . . . 737 231.50 59.23 141.92 160.20 171.82 191.59 223.84 267.64 293.39 313.93 339.36 16–19 years . . . . . . . . . . . . . . . 609 263.11 61.40 175.42 192.08 202.39 218.32 256.83 299.51 323.46 346.84 374.63 20–29 years . . . . . . . . . . . . . . . 297 263.68 57.96 183.42 198.78 208.98 223.68 254.25 299.80 321.63 336.79 358.37 30–39 years . . . . . . . . . . . . . . . 333 261.93 58.27 176.90 192.91 202.84 220.32 258.30 296.22 315.26 333.00 360.03 40–49 years . . . . . . . . . . . . . . . 398 257.50 64.89 172.81 185.66 193.48 209.97 245.33 295.03 318.58 339.98 368.90 50–59 years . . . . . . . . . . . . . . . 250 227.27 62.62 141.53 158.73 169.54 181.09 219.12 257.78 292.66 314.38 347.35 60–69 years . . . . . . . . . . . . . . . 306 213.39 57.43 133.54 146.79 153.68 167.93 211.55 247.14 267.33 284.55 317.97 70–79 years . . . . . . . . . . . . . . . 124 179.23 49.27 102.27 122.70 129.27 142.21 174.53 213.80 227.28 239.71 271.09 80 years and over . . . . . . . . . . . 58 *159.54 53.41 *92.38 *106.42 *115.23 *127.19 *155.21 *176.21 *191.12 *202.46 †
20 years and over (age-adjusted) . . 1,766 239.32 . . . . . . . . . . . . . . . . . . . . . . . . . . . . . .
. . . Category not applicable.
* Figure does not meet standards of reliability or precision; relative standard error (standard error divided by estimate times 100) is 30%–39% or estimate is based on less than 12 degrees of freedom.
† Standard error not calculated by SUDAAN software.
NOTE: g is grams.
SOURCE: National Health and Nutrition Examination Survey, 1999–2006.

Series 11, No. 253 [ Page 41
Table 18. Pelvis bone mineral density (g/cm2) of persons aged 8 years and over, by sex, race and ethnicity, and age: United States, 1999–2006
Percentile Sample Standard
Sex, race and ethnicity, and age size Mean deviation 5th 10th 15th 25th 50th 75th 85th 90th 95th
Male
All races and ethnicities 8–11 years . . . . . . . . . . . . . . . . 1,421 0.868 0.115 0.689 0.722 0.743 0.782 0.866 0.939 0.990 1.020 1.068 12–15 years . . . . . . . . . . . . . . . 2,264 1.123 0.193 0.842 0.885 0.923 0.983 1.103 1.246 1.322 1.373 1.451 16–19 years . . . . . . . . . . . . . . . 2,309 1.352 0.199 1.057 1.111 1.148 1.209 1.338 1.481 1.552 1.604 1.696 20–29 years . . . . . . . . . . . . . . . 1,530 1.382 0.203 1.086 1.144 1.191 1.247 1.359 1.499 1.577 1.631 1.731 30–39 years . . . . . . . . . . . . . . . 1,450 1.378 0.205 1.090 1.145 1.179 1.238 1.354 1.496 1.561 1.636 1.735 40–49 years . . . . . . . . . . . . . . . 1,549 1.366 0.192 1.073 1.132 1.181 1.240 1.347 1.481 1.557 1.614 1.684 50–59 years . . . . . . . . . . . . . . . 1,187 1.322 0.194 1.038 1.095 1.130 1.188 1.312 1.433 1.516 1.569 1.653 60–69 years . . . . . . . . . . . . . . . 1,350 1.279 0.191 0.975 1.050 1.087 1.155 1.267 1.388 1.479 1.530 1.615 70–79 years . . . . . . . . . . . . . . . 825 1.200 0.182 0.920 0.973 1.020 1.072 1.187 1.309 1.395 1.457 1.525 80 years and over . . . . . . . . . . . 501 1.112 0.179 0.855 0.902 0.933 0.984 1.091 1.217 1.289 1.348 1.455
20 years and over (age-adjusted) . . 8,392 1.330 . . . . . . . . . . . . . . . . . . . . . . . . . . . . . .
Mexican American 8–11 years . . . . . . . . . . . . . . . . 468 0.867 0.128 0.677 0.713 0.740 0.773 0.858 0.945 0.999 1.057 1.091 12–15 years . . . . . . . . . . . . . . . 777 1.124 0.205 0.824 0.876 0.919 0.987 1.098 1.248 1.335 1.391 1.489 16–19 years . . . . . . . . . . . . . . . 783 1.293 0.186 1.019 1.079 1.112 1.158 1.278 1.411 1.480 1.534 1.605 20–29 years . . . . . . . . . . . . . . . 444 1.328 0.180 1.076 1.113 1.152 1.204 1.306 1.423 1.509 1.566 1.653 30–39 years . . . . . . . . . . . . . . . 337 1.318 0.166 1.057 1.112 1.142 1.193 1.312 1.423 1.485 1.521 1.586 40–49 years . . . . . . . . . . . . . . . 381 1.301 0.179 1.027 1.089 1.120 1.173 1.289 1.412 1.477 1.544 1.617 50–59 years . . . . . . . . . . . . . . . 174 1.268 0.176 0.982 1.055 1.090 1.148 1.260 1.378 1.444 1.509 1.570 60–69 years . . . . . . . . . . . . . . . 348 1.232 0.168 1.005 1.054 1.078 1.108 1.209 1.325 1.375 1.442 1.550 70–79 years . . . . . . . . . . . . . . . 164 *1.154 0.178 *0.860 *0.938 *0.972 *1.040 *1.134 *1.271 *1.336 *1.376 *1.463 80 years and over . . . . . . . . . . . 48 *1.043 0.140 *0.856 *0.890 *0.910 *0.939 *1.003 *1.109 *1.196 *1.244 *1.304
20 years and over (age-adjusted) . . 1,896 1.273 . . . . . . . . . . . . . . . . . . . . . . . . . . . . . .
Non-Hispanic white 8–11 years . . . . . . . . . . . . . . . . 369 0.864 0.109 0.692 0.726 0.743 0.782 0.865 0.931 0.984 1.006 1.049 12–15 years . . . . . . . . . . . . . . . 578 1.115 0.185 0.836 0.878 0.920 0.973 1.100 1.237 1.308 1.357 1.423 16–19 years . . . . . . . . . . . . . . . 591 1.347 0.189 1.054 1.109 1.148 1.210 1.339 1.474 1.543 1.594 1.679 20–29 years . . . . . . . . . . . . . . . 617 1.376 0.190 1.093 1.148 1.195 1.248 1.358 1.488 1.556 1.613 1.696 30–39 years . . . . . . . . . . . . . . . 647 1.378 0.201 1.092 1.152 1.182 1.239 1.352 1.497 1.553 1.626 1.731 40–49 years . . . . . . . . . . . . . . . 700 1.367 0.184 1.079 1.140 1.189 1.250 1.354 1.479 1.548 1.603 1.676 50–59 years . . . . . . . . . . . . . . . 683 1.318 0.187 1.044 1.097 1.132 1.192 1.311 1.420 1.505 1.557 1.634 60–69 years . . . . . . . . . . . . . . . 623 1.279 0.186 0.980 1.056 1.091 1.159 1.267 1.386 1.472 1.523 1.605 70–79 years . . . . . . . . . . . . . . . 496 1.203 0.181 0.927 0.981 1.027 1.073 1.190 1.314 1.403 1.459 1.530 80 years and over . . . . . . . . . . . 398 1.107 0.174 0.853 0.899 0.933 0.985 1.089 1.208 1.272 1.341 1.420
20 years and over (age-adjusted) . . 4,164 1.329 . . . . . . . . . . . . . . . . . . . . . . . . . . . . . .
Non-Hispanic black 8–11 years . . . . . . . . . . . . . . . . 469 0.910 0.124 0.720 0.761 0.789 0.823 0.901 0.989 1.036 1.065 1.117 12–15 years . . . . . . . . . . . . . . . 745 1.179 0.213 0.885 0.931 0.971 1.023 1.161 1.307 1.388 1.442 1.562 16–19 years . . . . . . . . . . . . . . . 757 1.448 0.234 1.113 1.174 1.219 1.286 1.421 1.580 1.667 1.737 1.830 20–29 years . . . . . . . . . . . . . . . 325 1.518 0.248 1.165 1.243 1.288 1.353 1.486 1.638 1.743 1.843 1.953 30–39 years . . . . . . . . . . . . . . . 310 1.500 0.237 1.175 1.221 1.257 1.331 1.471 1.637 1.709 1.790 1.943 40–49 years . . . . . . . . . . . . . . . 366 1.437 0.233 1.113 1.176 1.208 1.278 1.396 1.571 1.677 1.720 1.838 50–59 years . . . . . . . . . . . . . . . 240 1.429 0.223 1.083 1.146 1.193 1.277 1.404 1.548 1.643 1.721 1.809 60–69 years . . . . . . . . . . . . . . . 303 1.370 0.204 1.049 1.126 1.162 1.237 1.358 1.499 1.558 1.621 1.703 70–79 years . . . . . . . . . . . . . . . 114 1.253 0.197 0.947 1.002 1.053 1.113 1.243 1.369 1.452 1.503 1.642 80 years and over . . . . . . . . . . . 36 *1.223 0.226 † *0.933 *0.953 *1.033 *1.171 *1.368 *1.465 *1.522 †
20 years and over (age-adjusted) . . 1,694 1.432 . . . . . . . . . . . . . . . . . . . . . . . . . . . . . .
See footnotes at end of table.

Page 42 [ Series 11, No. 253
Table 18. Pelvis bone mineral density (g/cm2) of persons aged 8 years and over, by sex, race and ethnicity, and age: United States, 1999–2006—Con.
Percentile Sample Standard
Sex, race and ethnicity, and age size Mean deviation 5th 10th 15th 25th 50th 75th 85th 90th 95th
Female
All races and ethnicities 8–11 years . . . . . . . . . . . . . . . . 1,465 0.916 0.153 0.690 0.735 0.757 0.799 0.904 1.010 1.075 1.130 1.200 12–15 years . . . . . . . . . . . . . . . 2,318 1.190 0.161 0.933 0.990 1.031 1.080 1.183 1.296 1.357 1.407 1.463 16–19 years . . . . . . . . . . . . . . . 2,027 1.265 0.161 1.006 1.059 1.099 1.159 1.259 1.366 1.419 1.471 1.550 20–29 years . . . . . . . . . . . . . . . 1,378 1.285 0.156 1.048 1.100 1.127 1.179 1.269 1.381 1.441 1.480 1.556 30–39 years . . . . . . . . . . . . . . . 1,372 1.310 0.166 1.050 1.102 1.138 1.196 1.297 1.416 1.478 1.523 1.588 40–49 years . . . . . . . . . . . . . . . 1,570 1.293 0.165 1.046 1.101 1.129 1.179 1.276 1.391 1.462 1.510 1.583 50–59 years . . . . . . . . . . . . . . . 1,200 1.232 0.158 0.992 1.042 1.074 1.116 1.222 1.337 1.394 1.432 1.489 60–69 years . . . . . . . . . . . . . . . 1,419 1.158 0.158 0.916 0.970 1.000 1.047 1.146 1.256 1.319 1.363 1.436 70–79 years . . . . . . . . . . . . . . . 750 1.066 0.149 0.826 0.888 0.914 0.960 1.060 1.159 1.214 1.271 1.330 80 years and over . . . . . . . . . . . 594 0.967 0.145 0.747 0.787 0.818 0.866 0.957 1.059 1.112 1.150 1.212
20 years and over (age-adjusted) . . 8,283 1.238 . . . . . . . . . . . . . . . . . . . . . . . . . . . . . .
Mexican American 8–11 years . . . . . . . . . . . . . . . . 471 0.897 0.159 0.679 0.711 0.738 0.774 0.874 0.991 1.073 1.124 1.174 12–15 years . . . . . . . . . . . . . . . 821 1.181 0.159 0.923 0.986 1.025 1.075 1.175 1.283 1.322 1.372 1.448 16–19 years . . . . . . . . . . . . . . . 692 1.241 0.156 1.003 1.052 1.085 1.135 1.225 1.331 1.399 1.439 1.510 20–29 years . . . . . . . . . . . . . . . 364 1.271 0.146 1.040 1.073 1.118 1.170 1.266 1.366 1.429 1.468 1.514 30–39 years . . . . . . . . . . . . . . . 298 1.292 0.156 1.072 1.107 1.138 1.192 1.271 1.386 1.439 1.465 1.537 40–49 years . . . . . . . . . . . . . . . 372 1.282 0.146 1.057 1.097 1.130 1.180 1.270 1.368 1.430 1.486 1.535 50–59 years . . . . . . . . . . . . . . . 194 1.190 0.177 0.937 0.993 1.013 1.065 1.188 1.286 1.353 1.387 1.444 60–69 years . . . . . . . . . . . . . . . 375 1.099 0.147 0.869 0.914 0.937 0.987 1.091 1.190 1.257 1.292 1.340 70–79 years . . . . . . . . . . . . . . . 154 *1.013 0.153 *0.770 *0.835 *0.874 *0.913 *1.011 *1.111 *1.174 *1.207 *1.243 80 years and over . . . . . . . . . . . 47 *0.932 0.140 † *0.718 *0.775 *0.863 *0.939 *0.993 *1.040 *1.060 †
20 years and over (age-adjusted) . . 1,804 1.211 . . . . . . . . . . . . . . . . . . . . . . . . . . . . . .
Non-Hispanic white 8–11 years . . . . . . . . . . . . . . . . 383 0.911 0.146 0.691 0.739 0.758 0.798 0.903 1.002 1.063 1.112 1.191 12–15 years . . . . . . . . . . . . . . . 576 1.179 0.158 0.926 0.984 1.023 1.068 1.173 1.288 1.339 1.396 1.438 16–19 years . . . . . . . . . . . . . . . 543 1.262 0.152 1.013 1.066 1.099 1.161 1.262 1.364 1.412 1.453 1.519 20–29 years . . . . . . . . . . . . . . . 583 1.273 0.143 1.052 1.104 1.127 1.172 1.260 1.365 1.422 1.457 1.526 30–39 years . . . . . . . . . . . . . . . 612 1.298 0.159 1.040 1.091 1.128 1.188 1.288 1.399 1.466 1.507 1.562 40–49 years . . . . . . . . . . . . . . . 668 1.280 0.158 1.042 1.099 1.126 1.173 1.264 1.372 1.436 1.483 1.560 50–59 years . . . . . . . . . . . . . . . 639 1.231 0.151 1.004 1.048 1.080 1.118 1.221 1.335 1.390 1.423 1.473 60–69 years . . . . . . . . . . . . . . . 644 1.155 0.155 0.915 0.969 1.001 1.044 1.145 1.251 1.314 1.354 1.431 70–79 years . . . . . . . . . . . . . . . 429 1.067 0.149 0.824 0.891 0.916 0.961 1.059 1.162 1.215 1.274 1.330 80 years and over . . . . . . . . . . . 457 0.968 0.142 0.750 0.788 0.819 0.868 0.956 1.062 1.111 1.149 1.209
20 years and over (age-adjusted) . . 4,032 1.230 . . . . . . . . . . . . . . . . . . . . . . . . . . . . . .
Non-Hispanic black 8–11 years . . . . . . . . . . . . . . . . 490 0.961 0.165 0.729 0.759 0.797 0.840 0.945 1.064 1.136 1.172 1.250 12–15 years . . . . . . . . . . . . . . . 737 1.272 0.161 1.020 1.076 1.111 1.164 1.261 1.383 1.444 1.480 1.545 16–19 years . . . . . . . . . . . . . . . 609 1.349 0.174 1.087 1.134 1.175 1.222 1.329 1.453 1.537 1.580 1.653 20–29 years . . . . . . . . . . . . . . . 297 1.379 0.171 1.103 1.172 1.205 1.253 1.372 1.484 1.544 1.600 1.676 30–39 years . . . . . . . . . . . . . . . 333 1.401 0.180 1.125 1.170 1.212 1.274 1.391 1.505 1.575 1.629 1.699 40–49 years . . . . . . . . . . . . . . . 398 1.405 0.174 1.120 1.187 1.225 1.286 1.397 1.509 1.571 1.623 1.694 50–59 years . . . . . . . . . . . . . . . 250 1.309 0.170 1.051 1.096 1.132 1.198 1.297 1.411 1.478 1.527 1.608 60–69 years . . . . . . . . . . . . . . . 306 1.245 0.172 0.993 1.042 1.076 1.128 1.229 1.345 1.416 1.463 1.563 70–79 years . . . . . . . . . . . . . . . 124 1.111 0.158 0.840 0.898 0.942 1.011 1.101 1.210 1.280 1.326 1.366 80 years and over . . . . . . . . . . . 58 *1.018 0.175 *0.766 *0.826 *0.859 *0.912 *0.986 *1.100 *1.164 *1.204 †
20 years and over (age-adjusted) . . 1,766 1.325 . . . . . . . . . . . . . . . . . . . . . . . . . . . . . .
. . . Category not applicable.
* Figure does not meet standards of reliability or precision; relative standard error (standard error divided by estimate times 100) is 30%–39% or estimate is based on less than 12 degrees of freedom.
† Standard error not calculated by SUDAAN software.
NOTE: g/cm2 is grams per centimeter squared.
SOURCE: National Health and Nutrition Examination Survey, 1999–2006.

Series 11, No. 253 [ Page 43
Table 19. Right arm bone area (cm2) of persons aged 8 years and over, by sex, race and ethnicity, and age: United States, 1999–2006
Percentile Sample Standard
Sex, race and ethnicity, and age size Mean deviation 5th 10th 15th 25th 50th 75th 85th 90th 95th
Male
All races and ethnicities 8–11 years . . . . . . . . . . . . . . . . 1,421 124.92 24.00 93.42 100.35 103.95 109.02 121.34 136.24 146.60 156.17 171.41 12–15 years . . . . . . . . . . . . . . . 2,264 190.98 42.86 126.09 134.49 143.66 156.89 190.43 222.91 236.53 245.30 261.66 16–19 years . . . . . . . . . . . . . . . 2,309 242.09 31.66 192.15 203.15 210.06 220.76 240.53 262.60 274.40 282.14 295.58 20–29 years . . . . . . . . . . . . . . . 1,530 255.90 28.21 209.61 221.29 228.02 237.07 255.70 273.67 283.97 291.68 302.88 30–39 years . . . . . . . . . . . . . . . 1,450 259.78 27.90 215.28 224.69 231.48 240.74 258.74 278.46 288.10 296.04 305.41 40–49 years . . . . . . . . . . . . . . . 1,549 266.03 26.62 222.72 232.97 239.37 248.69 265.12 283.88 293.20 300.17 309.73 50–59 years . . . . . . . . . . . . . . . 1,187 265.30 26.93 220.49 230.51 236.98 248.92 265.32 282.29 292.23 298.88 309.88 60–69 years . . . . . . . . . . . . . . . 1,350 264.31 27.72 218.79 230.26 236.84 247.90 264.43 282.43 292.09 299.31 309.21 70–79 years . . . . . . . . . . . . . . . 825 259.61 28.31 210.64 222.79 229.76 241.22 260.15 280.21 289.23 294.89 304.91 80 years and over . . . . . . . . . . . 501 249.01 29.40 199.84 211.32 217.87 228.74 248.65 268.46 279.65 285.47 298.80
20 years and over (age-adjusted) . . 8,392 261.22 . . . . . . . . . . . . . . . . . . . . . . . . . . . . . .
Mexican American 8–11 years . . . . . . . . . . . . . . . . 468 126.16 23.71 98.42 103.04 105.32 110.17 120.87 135.77 151.49 158.88 170.33 12–15 years . . . . . . . . . . . . . . . 777 188.53 40.11 125.83 133.51 142.74 157.31 188.97 217.17 232.29 242.05 254.73 16–19 years . . . . . . . . . . . . . . . 783 231.26 28.55 187.63 196.40 202.19 210.88 230.07 248.21 259.77 267.73 279.51 20–29 years . . . . . . . . . . . . . . . 444 240.56 25.83 199.62 206.65 214.22 222.74 240.11 257.02 268.38 274.06 281.27 30–39 years . . . . . . . . . . . . . . . 337 241.31 23.98 203.83 210.54 215.90 226.40 240.14 255.43 266.90 273.52 281.02 40–49 years . . . . . . . . . . . . . . . 381 244.34 24.67 206.54 214.97 220.13 227.74 242.12 260.55 269.66 277.61 286.68 50–59 years . . . . . . . . . . . . . . . 174 246.64 23.35 208.95 218.99 223.29 230.35 245.00 264.17 271.16 274.79 286.17 60–69 years . . . . . . . . . . . . . . . 348 247.95 23.95 210.38 215.89 221.64 228.63 247.52 264.83 273.64 277.19 286.02 70–79 years . . . . . . . . . . . . . . . 164 *238.97 24.33 *200.36 *207.84 *213.95 *224.10 *240.03 *252.38 *261.04 *268.00 *277.61 80 years and over . . . . . . . . . . . 48 *229.94 23.89 *189.65 *205.03 *209.94 *216.92 *226.89 *242.34 *255.08 *262.94 †
20 years and over (age-adjusted) . . 1,896 242.61 . . . . . . . . . . . . . . . . . . . . . . . . . . . . . .
Non-Hispanic white 8–11 years . . . . . . . . . . . . . . . . 369 122.37 23.06 90.73 98.48 102.65 106.75 118.97 133.09 142.76 149.84 170.73 12–15 years . . . . . . . . . . . . . . . 578 190.24 42.72 125.95 133.89 142.29 154.12 190.59 221.86 235.93 243.45 260.71 16–19 years . . . . . . . . . . . . . . . 591 242.12 30.42 193.67 203.95 211.34 221.29 240.54 262.39 273.07 280.29 293.42 20–29 years . . . . . . . . . . . . . . . 617 257.73 26.07 216.93 226.67 231.54 241.12 257.98 274.19 284.63 291.07 299.54 30–39 years . . . . . . . . . . . . . . . 647 263.04 25.55 223.74 232.09 237.40 245.04 262.04 280.01 288.51 296.46 304.71 40–49 years . . . . . . . . . . . . . . . 700 268.97 24.67 229.45 238.79 244.44 252.61 267.73 285.37 294.47 301.28 310.28 50–59 years . . . . . . . . . . . . . . . 683 267.37 25.24 223.46 235.26 241.51 251.89 267.57 282.98 292.72 298.77 308.45 60–69 years . . . . . . . . . . . . . . . 623 266.57 25.01 226.41 235.54 241.13 250.55 266.01 282.64 291.98 298.79 308.20 70–79 years . . . . . . . . . . . . . . . 496 261.17 27.18 214.00 226.03 232.68 243.68 262.00 281.05 289.21 294.41 304.44 80 years and over . . . . . . . . . . . 398 248.93 28.01 202.75 212.71 219.32 229.33 248.95 267.96 277.84 283.95 294.79
20 years and over (age-adjusted) . . 4,164 263.57 . . . . . . . . . . . . . . . . . . . . . . . . . . . . . .
Non-Hispanic black 8–11 years . . . . . . . . . . . . . . . . 469 135.19 27.21 101.46 105.97 110.13 117.74 129.82 146.26 160.01 170.43 195.51 12–15 years . . . . . . . . . . . . . . . 745 205.55 45.17 135.46 145.05 153.76 171.33 205.19 236.84 253.21 263.43 276.56 16–19 years . . . . . . . . . . . . . . . 757 256.96 33.58 202.58 217.45 223.74 235.68 257.03 276.63 288.95 296.69 310.91 20–29 years . . . . . . . . . . . . . . . 325 271.62 29.36 225.30 237.17 242.71 252.25 269.81 289.51 302.57 310.80 320.72 30–39 years . . . . . . . . . . . . . . . 310 275.09 30.64 225.42 231.98 241.90 253.36 276.18 294.75 306.14 313.20 325.33 40–49 years . . . . . . . . . . . . . . . 366 275.78 26.99 229.29 242.00 247.80 256.24 277.38 294.00 302.93 309.12 320.69 50–59 years . . . . . . . . . . . . . . . 240 277.73 28.75 231.83 240.65 249.34 258.68 275.89 295.92 310.27 315.99 323.07 60–69 years . . . . . . . . . . . . . . . 303 279.36 27.44 231.93 245.41 251.70 261.11 278.87 299.14 307.67 313.36 324.30 70–79 years . . . . . . . . . . . . . . . 114 271.80 33.27 209.66 224.91 235.63 250.82 275.93 294.30 302.75 310.05 316.61 80 years and over . . . . . . . . . . . 36 *268.24 37.93 † *213.05 *223.07 *239.81 *264.95 *294.38 *308.34 *323.56 †
20 years and over (age-adjusted) . . 1,694 274.86 . . . . . . . . . . . . . . . . . . . . . . . . . . . . . .
See footnotes at end of table.

Page 44 [ Series 11, No. 253
Table 19. Right arm bone area (cm2) of persons aged 8 years and over, by sex, race and ethnicity, and age: United States, 1999–2006—Con.
Percentile Sample Standard
Sex, race and ethnicity, and age size Mean deviation 5th 10th 15th 25th 50th 75th 85th 90th 95th
Female
All races and ethnicities 8–11 years . . . . . . . . . . . . . . . . 1,465 130.38 24.90 95.56 102.22 107.03 113.97 127.27 143.53 154.86 165.07 175.41 12–15 years . . . . . . . . . . . . . . . 2,318 180.92 27.63 135.63 144.54 152.99 162.59 179.90 198.36 210.14 216.67 225.63 16–19 years . . . . . . . . . . . . . . . 2,027 198.92 25.25 161.21 169.08 173.39 181.72 197.58 214.46 223.11 229.73 242.81 20–29 years . . . . . . . . . . . . . . . 1,378 206.65 23.75 168.15 175.87 181.59 190.81 206.57 222.03 231.76 236.84 245.86 30–39 years . . . . . . . . . . . . . . . 1,372 210.39 23.09 174.76 182.39 186.57 194.13 209.78 223.92 232.98 240.26 251.84 40–49 years . . . . . . . . . . . . . . . 1,570 214.08 23.00 177.16 185.26 190.34 198.54 214.31 228.49 237.83 244.37 252.59 50–59 years . . . . . . . . . . . . . . . 1,200 211.75 24.04 173.12 180.63 186.13 195.67 211.11 227.22 235.92 243.75 252.47 60–69 years . . . . . . . . . . . . . . . 1,419 208.68 25.94 167.34 175.29 181.65 191.53 208.52 224.63 233.76 240.64 251.14 70–79 years . . . . . . . . . . . . . . . 750 200.72 26.07 162.88 168.53 174.51 182.84 198.97 218.04 227.43 233.97 244.56 80 years and over . . . . . . . . . . . 594 185.97 28.23 136.70 150.60 158.28 167.87 186.75 205.59 213.34 219.86 230.15
20 years and over (age-adjusted) . . 8,283 208.60 . . . . . . . . . . . . . . . . . . . . . . . . . . . . . .
Mexican American 8–11 years . . . . . . . . . . . . . . . . 471 128.92 23.81 95.96 102.81 106.56 112.95 126.08 143.34 151.61 160.77 175.10 12–15 years . . . . . . . . . . . . . . . 821 178.49 25.14 137.05 145.45 151.72 162.20 178.71 193.64 203.01 209.98 219.63 16–19 years . . . . . . . . . . . . . . . 692 190.02 23.32 153.78 161.83 165.15 173.90 189.46 204.98 214.56 220.20 228.45 20–29 years . . . . . . . . . . . . . . . 364 199.59 21.75 163.35 171.62 176.43 185.44 198.08 214.72 223.06 228.19 234.98 30–39 years . . . . . . . . . . . . . . . 298 202.08 20.92 171.31 176.99 181.64 188.73 199.77 215.31 221.77 229.69 240.30 40–49 years . . . . . . . . . . . . . . . 372 205.81 20.54 170.92 180.58 186.78 192.47 204.85 219.84 226.18 232.10 237.73 50–59 years . . . . . . . . . . . . . . . 194 199.94 23.72 158.58 169.21 173.93 182.76 200.89 217.31 223.96 226.97 236.61 60–69 years . . . . . . . . . . . . . . . 375 193.90 24.29 152.17 163.33 168.63 177.47 193.71 209.71 218.31 224.12 236.07 70–79 years . . . . . . . . . . . . . . . 154 *185.65 26.01 *139.29 *150.08 *157.20 *171.14 *183.39 *204.90 *214.34 *220.92 *228.29 80 years and over . . . . . . . . . . . 47 *173.06 25.34 † *135.48 *142.27 *160.36 *171.17 *193.00 *196.14 *198.26 †
20 years and over (age-adjusted) . . 1,804 198.54 . . . . . . . . . . . . . . . . . . . . . . . . . . . . . .
Non-Hispanic white 8–11 years . . . . . . . . . . . . . . . . 383 127.96 23.29 94.16 101.36 106.00 112.45 126.16 139.48 152.43 160.10 168.28 12–15 years . . . . . . . . . . . . . . . 576 177.57 26.23 132.84 143.09 151.05 160.38 176.86 194.59 205.53 212.64 219.94 16–19 years . . . . . . . . . . . . . . . 543 198.44 23.65 162.61 170.59 175.01 182.94 197.56 211.78 221.49 227.40 236.11 20–29 years . . . . . . . . . . . . . . . 583 206.32 21.99 169.99 177.56 183.05 191.65 206.26 220.71 228.54 234.68 242.55 30–39 years . . . . . . . . . . . . . . . 612 209.32 21.52 176.02 182.98 186.57 194.46 209.40 222.45 229.53 236.01 246.69 40–49 years . . . . . . . . . . . . . . . 668 213.43 22.05 177.73 185.32 190.41 198.52 213.69 227.58 235.97 242.78 250.42 50–59 years . . . . . . . . . . . . . . . 639 212.24 22.03 176.01 183.58 189.48 198.01 211.42 226.09 234.54 241.51 250.44 60–69 years . . . . . . . . . . . . . . . 644 208.13 23.93 169.74 176.41 182.56 192.18 208.63 223.33 231.21 237.13 247.14 70–79 years . . . . . . . . . . . . . . . 429 200.66 24.38 164.42 171.03 175.84 183.64 199.38 216.94 226.36 232.62 242.02 80 years and over . . . . . . . . . . . 457 186.05 26.88 142.86 152.18 159.93 168.20 186.71 204.35 211.94 218.61 227.54
20 years and over (age-adjusted) . . 4,032 208.19 . . . . . . . . . . . . . . . . . . . . . . . . . . . . . .
Non-Hispanic black 8–11 years . . . . . . . . . . . . . . . . 490 141.11 29.31 101.86 108.69 114.15 121.02 136.19 157.34 171.85 179.38 192.86 12–15 years . . . . . . . . . . . . . . . 737 200.37 28.36 154.03 165.02 171.99 181.87 198.92 218.88 230.24 238.27 249.23 16–19 years . . . . . . . . . . . . . . . 609 215.29 26.92 173.56 182.45 188.17 197.02 215.02 231.14 242.30 248.87 260.63 20–29 years . . . . . . . . . . . . . . . 297 222.35 24.17 181.68 191.69 197.79 208.03 221.39 237.60 246.10 255.19 261.72 30–39 years . . . . . . . . . . . . . . . 333 227.44 24.29 188.28 195.69 200.56 211.31 226.20 244.05 253.50 257.81 265.54 40–49 years . . . . . . . . . . . . . . . 398 229.91 22.64 193.20 201.11 207.44 215.82 229.17 244.88 252.97 257.33 264.77 50–59 years . . . . . . . . . . . . . . . 250 227.88 24.45 186.08 195.51 202.13 210.97 227.82 244.73 252.74 259.31 265.87 60–69 years . . . . . . . . . . . . . . . 306 231.73 27.70 184.24 195.57 203.57 214.80 231.52 246.89 258.71 266.54 280.55 70–79 years . . . . . . . . . . . . . . . 124 221.64 29.93 169.94 183.07 189.63 198.35 221.97 239.19 251.14 260.95 270.13 80 years and over . . . . . . . . . . . 58 *206.82 26.55 *158.65 *169.93 *178.49 *188.71 *208.64 *224.07 *233.48 *238.93 *248.92
20 years and over (age-adjusted) . . 1,766 226.10 . . . . . . . . . . . . . . . . . . . . . . . . . . . . . .
. . . Category not applicable.
* Figure does not meet standards of reliability or precision; relative standard error (standard error divided by estimate times 100) is 30%–39% or estimate is based on less than 12 degrees of freedom.
† Standard error not calculated by SUDAAN software.
NOTE: cm2 is centimeter squared.
SOURCE: National Health and Nutrition Examination Survey, 1999–2006.

Series 11, No. 253 [ Page 45
Table 20. Right arm bone mineral content (g) of persons aged 8 years and over, by sex, race and ethnicity, and age: United States, 1999–2006
Percentile Sample Standard
Sex, race and ethnicity, and age size Mean deviation 5th 10th 15th 25th 50th 75th 85th 90th 95th
Male
All races and ethnicities 8–11 years . . . . . . . . . . . . . . . . 1,421 74.46 20.25 48.22 52.15 55.47 59.94 71.26 85.48 93.48 101.27 112.37 12–15 years . . . . . . . . . . . . . . . 2,264 142.55 45.94 76.09 85.82 92.65 106.07 138.26 176.21 192.13 202.20 220.96 16–19 years . . . . . . . . . . . . . . . 2,309 210.19 39.80 147.86 160.69 168.48 182.73 207.16 235.82 252.59 262.38 278.46 20–29 years . . . . . . . . . . . . . . . 1,530 231.14 39.93 169.47 183.03 192.03 203.60 227.78 254.66 270.29 282.21 297.39 30–39 years . . . . . . . . . . . . . . . 1,450 236.65 40.18 177.39 187.08 196.85 208.51 232.65 261.99 276.14 286.99 307.19 40–49 years . . . . . . . . . . . . . . . 1,549 240.85 38.33 180.45 193.14 202.00 214.61 239.05 264.13 281.05 290.60 305.22 50–59 years . . . . . . . . . . . . . . . 1,187 236.44 39.17 173.17 188.31 197.52 210.27 234.40 261.53 276.89 287.73 301.38 60–69 years . . . . . . . . . . . . . . . 1,350 231.62 39.76 169.78 181.58 192.01 205.23 230.18 256.01 271.55 282.88 300.22 70–79 years . . . . . . . . . . . . . . . 825 219.50 38.92 156.91 170.60 178.62 192.73 219.23 245.55 260.00 271.44 286.92 80 years and over . . . . . . . . . . . 501 201.72 39.57 140.69 154.31 162.57 174.62 198.56 225.49 244.53 255.60 270.48
20 years and over (age-adjusted) . . 8,392 232.95 . . . . . . . . . . . . . . . . . . . . . . . . . . . . . .
Mexican American 8–11 years . . . . . . . . . . . . . . . . 468 74.09 20.59 48.84 52.59 55.19 59.25 69.69 84.19 95.23 102.11 114.75 12–15 years . . . . . . . . . . . . . . . 777 139.56 44.00 74.39 83.56 92.39 106.18 137.35 169.17 186.35 197.02 215.22 16–19 years . . . . . . . . . . . . . . . 783 196.06 35.84 143.99 152.65 160.87 169.93 193.14 216.93 233.46 243.56 257.76 20–29 years . . . . . . . . . . . . . . . 444 211.60 34.27 162.58 170.90 176.09 186.57 207.96 231.12 248.23 258.28 271.51 30–39 years . . . . . . . . . . . . . . . 337 212.39 31.41 166.38 175.58 180.78 189.88 210.26 229.99 242.47 254.55 269.59 40–49 years . . . . . . . . . . . . . . . 381 213.52 33.19 162.05 176.84 182.15 191.53 211.10 233.25 247.81 256.95 266.01 50–59 years . . . . . . . . . . . . . . . 174 214.30 34.20 158.39 170.47 178.93 189.03 215.85 233.88 248.75 258.69 266.91 60–69 years . . . . . . . . . . . . . . . 348 211.79 32.00 164.91 170.84 175.66 189.25 212.23 232.26 242.90 250.78 267.08 70–79 years . . . . . . . . . . . . . . . 164 *197.74 34.14 *138.33 *152.34 *162.44 *174.76 *198.73 *219.84 *232.68 *238.17 *250.46 80 years and over . . . . . . . . . . . 48 *181.69 29.93 *131.01 *153.04 *155.91 *161.57 *175.54 *195.65 *208.11 *220.57 *243.72
20 years and over (age-adjusted) . . 1,896 210.08 . . . . . . . . . . . . . . . . . . . . . . . . . . . . . .
Non-Hispanic white 8–11 years . . . . . . . . . . . . . . . . 369 72.92 19.36 47.39 51.40 53.99 58.79 70.33 83.92 90.53 97.00 110.19 12–15 years . . . . . . . . . . . . . . . 578 141.94 45.78 75.99 84.41 91.61 104.64 138.19 176.46 191.79 201.12 219.76 16–19 years . . . . . . . . . . . . . . . 591 210.43 37.85 149.02 162.40 169.40 185.11 208.77 235.29 252.12 261.07 275.81 20–29 years . . . . . . . . . . . . . . . 617 233.57 37.88 174.48 187.50 196.93 208.97 230.62 255.74 271.08 282.47 295.96 30–39 years . . . . . . . . . . . . . . . 647 241.09 37.57 182.66 197.58 204.18 216.05 238.28 263.83 276.53 287.35 308.00 40–49 years . . . . . . . . . . . . . . . 700 244.12 35.76 189.36 201.00 207.95 219.55 242.56 266.18 282.55 291.28 304.90 50–59 years . . . . . . . . . . . . . . . 683 238.36 37.09 179.97 194.32 201.11 213.19 236.81 262.20 276.39 287.21 299.52 60–69 years . . . . . . . . . . . . . . . 623 233.73 37.09 177.83 189.32 195.49 208.94 231.28 255.85 269.97 281.93 298.03 70–79 years . . . . . . . . . . . . . . . 496 220.90 37.97 158.97 172.65 182.27 193.89 221.14 246.60 260.66 271.63 286.90 80 years and over . . . . . . . . . . . 398 200.70 37.23 141.88 155.10 164.16 175.47 198.43 222.28 242.22 251.22 265.59
20 years and over (age-adjusted) . . 4,164 235.63 . . . . . . . . . . . . . . . . . . . . . . . . . . . . . .
Non-Hispanic black 8–11 years . . . . . . . . . . . . . . . . 469 83.51 22.96 54.08 58.81 61.57 67.86 79.24 94.82 105.38 113.37 125.85 12–15 years . . . . . . . . . . . . . . . 745 156.74 48.26 87.20 96.46 104.52 118.78 152.75 187.84 207.95 218.51 238.37 16–19 years . . . . . . . . . . . . . . . 757 228.11 44.08 163.08 175.94 185.48 198.93 224.60 252.72 269.61 283.83 301.92 20–29 years . . . . . . . . . . . . . . . 325 253.53 43.79 193.69 204.64 211.77 223.47 249.95 275.06 292.27 306.57 333.59 30–39 years . . . . . . . . . . . . . . . 310 258.84 44.70 191.36 200.54 215.73 229.11 256.80 285.95 301.25 314.16 338.09 40–49 years . . . . . . . . . . . . . . . 366 256.63 43.34 187.83 202.96 213.82 228.65 255.44 282.86 299.85 308.37 328.77 50–59 years . . . . . . . . . . . . . . . 240 258.97 42.48 191.52 203.23 214.34 229.33 256.40 285.24 299.76 312.88 327.49 60–69 years . . . . . . . . . . . . . . . 303 255.69 39.58 189.48 206.83 215.22 228.99 257.39 280.68 294.27 303.52 319.21 70–79 years . . . . . . . . . . . . . . . 114 236.80 45.54 155.66 177.34 187.07 207.78 237.75 265.09 283.01 291.95 304.91 80 years and over . . . . . . . . . . . 36 *234.79 53.59 † *160.76 *178.47 *188.12 *231.05 *263.65 *298.46 *317.63 †
20 years and over (age-adjusted) . . 1,694 254.14 . . . . . . . . . . . . . . . . . . . . . . . . . . . . . .
See footnotes at end of table.

Page 46 [ Series 11, No. 253
Table 20. Right arm bone mineral content (g) of persons aged 8 years and over, by sex, race and ethnicity, and age: United States, 1999–2006—Con.
Percentile Sample Standard
Sex, race and ethnicity, and age size Mean deviation 5th 10th 15th 25th 50th 75th 85th 90th 95th
Female
All races and ethnicities 8–11 years . . . . . . . . . . . . . . . . 1,465 75.20 22.44 45.87 49.80 53.86 58.96 70.72 87.90 98.50 106.92 116.88 12–15 years . . . . . . . . . . . . . . . 2,318 127.36 27.23 82.86 93.59 99.81 109.44 125.77 144.12 155.35 162.79 173.84 16–19 years . . . . . . . . . . . . . . . 2,027 147.92 25.79 108.22 116.73 121.80 130.83 146.76 163.06 173.29 180.31 194.18 20–29 years . . . . . . . . . . . . . . . 1,378 155.99 25.50 116.89 124.47 129.47 137.66 154.78 171.48 181.54 189.09 200.62 30–39 years . . . . . . . . . . . . . . . 1,372 160.61 25.58 123.59 130.40 134.23 142.05 158.52 176.44 186.22 194.02 207.06 40–49 years . . . . . . . . . . . . . . . 1,570 162.77 25.86 123.97 130.53 134.93 144.72 161.82 179.06 188.84 195.36 207.19 50–59 years . . . . . . . . . . . . . . . 1,200 155.48 26.04 115.52 122.67 128.13 137.70 153.77 172.02 183.72 188.80 198.61 60–69 years . . . . . . . . . . . . . . . 1,419 146.17 28.58 103.19 111.36 117.62 127.09 144.52 163.46 173.36 179.90 193.78 70–79 years . . . . . . . . . . . . . . . 750 132.43 26.52 92.86 100.47 106.24 113.10 131.23 149.59 157.61 166.83 177.55 80 years and over . . . . . . . . . . . 594 114.94 26.42 70.63 81.23 89.70 97.79 113.59 131.68 141.28 148.84 160.33
20 years and over (age-adjusted) . . 8,283 153.49 . . . . . . . . . . . . . . . . . . . . . . . . . . . . . .
Mexican American 8–11 years . . . . . . . . . . . . . . . . 471 72.47 22.04 43.41 47.35 50.15 56.33 68.27 85.15 93.43 102.64 117.77 12–15 years . . . . . . . . . . . . . . . 821 124.14 24.43 84.28 92.89 99.97 108.66 123.56 140.38 148.83 152.70 162.26 16–19 years . . . . . . . . . . . . . . . 692 137.68 23.05 100.83 109.75 114.10 121.22 137.24 151.32 159.87 166.81 177.32 20–29 years . . . . . . . . . . . . . . . 364 147.60 22.01 114.04 120.49 123.62 131.86 145.63 162.92 171.49 174.82 186.28 30–39 years . . . . . . . . . . . . . . . 298 151.97 22.59 120.29 125.20 128.90 135.41 149.77 163.70 173.17 180.90 196.93 40–49 years . . . . . . . . . . . . . . . 372 153.70 21.56 119.52 127.55 131.71 140.02 152.41 166.65 175.64 180.71 191.19 50–59 years . . . . . . . . . . . . . . . 194 143.40 26.55 100.98 109.94 116.53 123.27 143.92 158.77 167.79 173.06 185.99 60–69 years . . . . . . . . . . . . . . . 375 129.13 24.65 87.07 98.14 103.12 112.36 128.12 147.48 156.51 162.90 169.18 70–79 years . . . . . . . . . . . . . . . 154 *115.96 25.47 *74.41 *82.18 *88.88 *101.57 *114.13 *129.83 *142.82 *151.29 *159.28 80 years and over . . . . . . . . . . . 47 *101.67 24.81 † *69.80 *77.78 *85.48 *100.49 *116.17 *125.19 *130.52 †
20 years and over (age-adjusted) . . 1,804 142.55 . . . . . . . . . . . . . . . . . . . . . . . . . . . . . .
Non-Hispanic white 8–11 years . . . . . . . . . . . . . . . . 383 73.72 20.77 45.81 49.15 53.45 58.72 70.05 85.81 95.50 103.03 112.20 12–15 years . . . . . . . . . . . . . . . 576 124.49 25.86 80.78 91.65 96.88 107.77 124.29 140.87 150.73 159.21 167.33 16–19 years . . . . . . . . . . . . . . . 543 147.98 23.92 110.14 118.89 123.46 131.88 147.28 161.96 172.23 177.49 189.40 20–29 years . . . . . . . . . . . . . . . 583 155.55 23.16 118.86 126.40 130.95 138.65 154.57 170.27 179.82 184.71 195.64 30–39 years . . . . . . . . . . . . . . . 612 159.39 23.40 124.92 131.25 134.56 142.26 158.22 174.04 182.52 189.63 199.11 40–49 years . . . . . . . . . . . . . . . 668 161.83 24.39 124.57 130.73 134.98 144.53 161.21 177.24 186.82 192.35 202.37 50–59 years . . . . . . . . . . . . . . . 639 155.90 23.85 119.22 125.15 131.33 139.49 154.29 170.75 181.57 187.85 195.96 60–69 years . . . . . . . . . . . . . . . 644 145.68 26.58 103.95 112.58 118.76 128.74 144.63 161.74 171.07 176.17 186.51 70–79 years . . . . . . . . . . . . . . . 429 132.13 25.00 94.35 100.99 107.06 114.53 131.51 148.94 156.40 162.96 173.24 80 years and over . . . . . . . . . . . 457 114.83 25.17 72.42 84.44 90.79 98.77 113.57 130.68 139.80 146.42 156.89
20 years and over (age-adjusted) . . 4,032 152.93 . . . . . . . . . . . . . . . . . . . . . . . . . . . . . .
Non-Hispanic black 8–11 years . . . . . . . . . . . . . . . . 490 84.62 26.34 51.34 56.69 59.67 64.33 79.39 99.95 110.40 120.16 131.21 12–15 years . . . . . . . . . . . . . . . 737 146.17 29.06 101.16 111.03 117.10 126.68 144.82 164.64 177.47 183.56 195.16 16–19 years . . . . . . . . . . . . . . . 609 165.73 28.98 122.98 131.09 136.76 146.31 163.33 182.62 195.10 204.87 215.92 20–29 years . . . . . . . . . . . . . . . 297 175.08 27.54 130.37 138.14 148.85 157.24 173.76 193.23 202.75 209.68 219.27 30–39 years . . . . . . . . . . . . . . . 333 181.24 27.90 138.27 146.89 151.86 160.75 179.72 198.30 209.75 218.36 230.73 40–49 years . . . . . . . . . . . . . . . 398 182.62 26.84 142.31 149.86 156.64 163.72 180.91 199.10 208.06 215.28 226.00 50–59 years . . . . . . . . . . . . . . . 250 173.80 27.65 126.13 139.93 145.02 154.84 174.31 190.72 201.99 210.43 220.44 60–69 years . . . . . . . . . . . . . . . 306 171.57 30.94 122.66 134.34 139.27 151.12 170.13 189.02 203.50 212.97 227.46 70–79 years . . . . . . . . . . . . . . . 124 154.32 30.72 107.81 113.81 122.34 131.23 153.12 175.28 186.28 195.11 † 80 years and over . . . . . . . . . . . 58 *135.27 28.31 *84.24 *100.16 *105.49 *113.15 *134.28 *155.10 *161.61 *169.01 †
20 years and over (age-adjusted) . . 1,766 173.89 . . . . . . . . . . . . . . . . . . . . . . . . . . . . . .
. . . Category not applicable.
* Figure does not meet standards of reliability or precision; relative standard error (standard error divided by estimate times 100) is 30%–39% or estimate is based on less than 12 degrees of freedom.
† Standard error not calculated by SUDAAN software.
NOTE: g is grams.
SOURCE: National Health and Nutrition Examination Survey, 1999–2006.

Series 11, No. 253 [ Page 47
Table 21. Right arm bone mineral density (g/cm2) of persons aged 8 years and over, by sex, race and ethnicity, and age: United States, 1999–2006
Percentile Sample Standard
Sex, race and ethnicity, and age size Mean deviation 5th 10th 15th 25th 50th 75th 85th 90th 95th
Male
All races and ethnicities 8–11 years . . . . . . . . . . . . . . . . 1,421 0.590 0.067 0.473 0.499 0.518 0.543 0.589 0.635 0.656 0.678 0.698 12–15 years . . . . . . . . . . . . . . . 2,264 0.731 0.090 0.587 0.618 0.637 0.667 0.727 0.795 0.823 0.849 0.883 16–19 years . . . . . . . . . . . . . . . 2,309 0.863 0.074 0.744 0.770 0.786 0.811 0.861 0.912 0.940 0.959 0.984 20–29 years . . . . . . . . . . . . . . . 1,530 0.898 0.077 0.782 0.804 0.821 0.847 0.892 0.945 0.974 0.993 1.028 30–39 years . . . . . . . . . . . . . . . 1,450 0.906 0.078 0.789 0.810 0.825 0.853 0.899 0.950 0.984 1.010 1.043 40–49 years . . . . . . . . . . . . . . . 1,549 0.901 0.074 0.787 0.808 0.825 0.847 0.897 0.949 0.977 0.997 1.025 50–59 years . . . . . . . . . . . . . . . 1,187 0.887 0.078 0.763 0.792 0.805 0.832 0.885 0.935 0.967 0.990 1.019 60–69 years . . . . . . . . . . . . . . . 1,350 0.871 0.082 0.751 0.771 0.789 0.815 0.867 0.921 0.955 0.976 1.008 70–79 years . . . . . . . . . . . . . . . 825 0.840 0.080 0.711 0.741 0.761 0.788 0.835 0.892 0.927 0.942 0.970 80 years and over . . . . . . . . . . . 501 0.804 0.082 0.678 0.706 0.720 0.746 0.798 0.852 0.892 0.911 0.945
20 years and over (age-adjusted) . . 8,392 0.887 . . . . . . . . . . . . . . . . . . . . . . . . . . . . . .
Mexican American 8–11 years . . . . . . . . . . . . . . . . 468 0.580 0.069 0.467 0.489 0.505 0.530 0.582 0.627 0.643 0.666 0.696 12–15 years . . . . . . . . . . . . . . . 777 0.726 0.092 0.578 0.608 0.627 0.660 0.726 0.783 0.819 0.840 0.876 16–19 years . . . . . . . . . . . . . . . 783 0.843 0.071 0.726 0.752 0.770 0.796 0.838 0.888 0.915 0.935 0.966 20–29 years . . . . . . . . . . . . . . . 444 0.875 0.064 0.775 0.796 0.811 0.829 0.869 0.912 0.944 0.964 0.996 30–39 years . . . . . . . . . . . . . . . 337 0.877 0.062 0.781 0.797 0.812 0.835 0.873 0.914 0.941 0.954 0.992 40–49 years . . . . . . . . . . . . . . . 381 0.870 0.067 0.772 0.791 0.800 0.819 0.872 0.914 0.937 0.950 0.978 50–59 years . . . . . . . . . . . . . . . 174 0.865 0.076 0.735 0.761 0.784 0.815 0.867 0.914 0.932 0.954 0.981 60–69 years . . . . . . . . . . . . . . . 348 0.851 0.070 0.746 0.763 0.779 0.797 0.850 0.897 0.920 0.934 0.957 70–79 years . . . . . . . . . . . . . . . 164 *0.823 0.084 *0.676 *0.719 *0.729 *0.768 *0.830 *0.877 *0.895 *0.920 *0.932 80 years and over . . . . . . . . . . . 48 *0.786 0.063 *0.686 *0.706 *0.715 *0.734 *0.782 *0.830 *0.843 *0.875 *0.903
20 years and over (age-adjusted) . . 1,896 0.862 . . . . . . . . . . . . . . . . . . . . . . . . . . . . . .
Non-Hispanic white 8–11 years . . . . . . . . . . . . . . . . 369 0.590 0.067 0.470 0.498 0.518 0.546 0.588 0.635 0.656 0.679 0.696 12–15 years . . . . . . . . . . . . . . . 578 0.731 0.089 0.588 0.618 0.637 0.667 0.727 0.797 0.823 0.844 0.880 16–19 years . . . . . . . . . . . . . . . 591 0.864 0.074 0.746 0.772 0.788 0.814 0.862 0.913 0.941 0.961 0.983 20–29 years . . . . . . . . . . . . . . . 617 0.902 0.075 0.786 0.809 0.827 0.852 0.898 0.949 0.976 0.992 1.024 30–39 years . . . . . . . . . . . . . . . 647 0.913 0.078 0.796 0.815 0.833 0.861 0.908 0.956 0.992 1.016 1.053 40–49 years . . . . . . . . . . . . . . . 700 0.904 0.071 0.793 0.816 0.830 0.853 0.899 0.950 0.979 0.999 1.026 50–59 years . . . . . . . . . . . . . . . 683 0.887 0.076 0.770 0.796 0.809 0.833 0.885 0.936 0.968 0.988 1.015 60–69 years . . . . . . . . . . . . . . . 623 0.873 0.080 0.754 0.774 0.792 0.819 0.868 0.922 0.954 0.973 1.006 70–79 years . . . . . . . . . . . . . . . 496 0.841 0.080 0.713 0.741 0.759 0.787 0.834 0.894 0.927 0.944 0.973 80 years and over . . . . . . . . . . . 398 0.801 0.079 0.677 0.707 0.721 0.746 0.796 0.848 0.886 0.903 0.939
20 years and over (age-adjusted) . . 4,164 0.890 . . . . . . . . . . . . . . . . . . . . . . . . . . . . . .
Non-Hispanic black 8–11 years . . . . . . . . . . . . . . . . 469 0.611 0.068 0.483 0.517 0.537 0.567 0.618 0.657 0.683 0.696 0.711 12–15 years . . . . . . . . . . . . . . . 745 0.750 0.088 0.610 0.641 0.658 0.687 0.744 0.807 0.846 0.866 0.901 16–19 years . . . . . . . . . . . . . . . 757 0.882 0.077 0.758 0.788 0.804 0.830 0.880 0.929 0.957 0.978 1.008 20–29 years . . . . . . . . . . . . . . . 325 0.929 0.083 0.806 0.828 0.844 0.868 0.922 0.973 1.013 1.040 1.081 30–39 years . . . . . . . . . . . . . . . 310 0.936 0.078 0.815 0.847 0.860 0.882 0.928 0.985 1.012 1.031 1.065 40–49 years . . . . . . . . . . . . . . . 366 0.926 0.089 0.793 0.820 0.837 0.863 0.921 0.977 1.006 1.025 1.080 50–59 years . . . . . . . . . . . . . . . 240 0.928 0.079 0.797 0.831 0.853 0.877 0.923 0.970 1.013 1.035 1.076 60–69 years . . . . . . . . . . . . . . . 303 0.911 0.083 0.780 0.810 0.831 0.857 0.909 0.964 0.990 1.012 1.044 70–79 years . . . . . . . . . . . . . . . 114 0.864 0.088 0.705 0.767 0.780 0.809 0.861 0.927 0.943 0.960 0.991 80 years and over . . . . . . . . . . . 36 *0.867 0.099 † *0.741 *0.766 *0.795 *0.857 *0.935 *0.955 *0.987 †
20 years and over (age-adjusted) . . 1,694 0.919 . . . . . . . . . . . . . . . . . . . . . . . . . . . . . .
See footnotes at end of table.

Page 48 [ Series 11, No. 253
Table 21. Right arm bone mineral density (g/cm2) of persons aged 8 years and over, by sex, race and ethnicity, and age: United States, 1999–2006—Con.
Percentile Sample Standard
Sex, race and ethnicity, and age size Mean deviation 5th 10th 15th 25th 50th 75th 85th 90th 95th
Female
All races and ethnicities 8–11 years . . . . . . . . . . . . . . . . 1,465 0.567 0.074 0.442 0.467 0.486 0.518 0.569 0.617 0.646 0.663 0.686 12–15 years . . . . . . . . . . . . . . . 2,318 0.698 0.059 0.597 0.621 0.638 0.660 0.699 0.737 0.758 0.771 0.793 16–19 years . . . . . . . . . . . . . . . 2,027 0.740 0.056 0.647 0.668 0.684 0.705 0.737 0.775 0.796 0.811 0.837 20–29 years . . . . . . . . . . . . . . . 1,378 0.751 0.055 0.664 0.679 0.693 0.713 0.752 0.787 0.807 0.821 0.840 30–39 years . . . . . . . . . . . . . . . 1,372 0.760 0.056 0.673 0.690 0.703 0.719 0.757 0.795 0.816 0.835 0.858 40–49 years . . . . . . . . . . . . . . . 1,570 0.757 0.059 0.668 0.687 0.698 0.716 0.753 0.793 0.817 0.835 0.864 50–59 years . . . . . . . . . . . . . . . 1,200 0.731 0.063 0.635 0.653 0.664 0.688 0.728 0.767 0.790 0.809 0.839 60–69 years . . . . . . . . . . . . . . . 1,419 0.696 0.074 0.589 0.608 0.624 0.651 0.693 0.737 0.760 0.781 0.804 70–79 years . . . . . . . . . . . . . . . 750 0.655 0.065 0.548 0.569 0.585 0.612 0.652 0.698 0.724 0.739 0.769 80 years and over . . . . . . . . . . . 594 0.612 0.072 0.500 0.527 0.542 0.562 0.609 0.656 0.678 0.702 0.725
20 years and over (age-adjusted) . . 8,283 0.731 . . . . . . . . . . . . . . . . . . . . . . . . . . . . . .
Mexican American 8–11 years . . . . . . . . . . . . . . . . 471 0.552 0.078 0.424 0.443 0.464 0.495 0.556 0.605 0.634 0.656 0.676 12–15 years . . . . . . . . . . . . . . . 821 0.690 0.058 0.595 0.616 0.632 0.656 0.691 0.728 0.747 0.764 0.787 16–19 years . . . . . . . . . . . . . . . 692 0.721 0.051 0.641 0.656 0.669 0.687 0.720 0.753 0.769 0.782 0.807 20–29 years . . . . . . . . . . . . . . . 364 0.737 0.049 0.658 0.676 0.686 0.701 0.735 0.768 0.788 0.804 0.826 30–39 years . . . . . . . . . . . . . . . 298 0.749 0.055 0.663 0.685 0.696 0.713 0.741 0.784 0.801 0.812 0.839 40–49 years . . . . . . . . . . . . . . . 372 0.745 0.054 0.658 0.677 0.689 0.706 0.745 0.779 0.800 0.814 0.831 50–59 years . . . . . . . . . . . . . . . 194 0.713 0.071 0.602 0.629 0.642 0.666 0.712 0.756 0.774 0.782 0.818 60–69 years . . . . . . . . . . . . . . . 375 0.662 0.065 0.557 0.579 0.590 0.613 0.660 0.711 0.734 0.746 0.763 70–79 years . . . . . . . . . . . . . . . 154 *0.618 0.067 *0.507 *0.534 *0.551 *0.576 *0.615 *0.661 *0.681 *0.701 *0.726 80 years and over . . . . . . . . . . . 47 *0.580 0.071 † *0.484 *0.503 *0.541 *0.570 *0.616 *0.644 *0.659 †
20 years and over (age-adjusted) . . 1,804 0.713 . . . . . . . . . . . . . . . . . . . . . . . . . . . . . .
Non-Hispanic white 8–11 years . . . . . . . . . . . . . . . . 383 0.568 0.071 0.445 0.473 0.490 0.522 0.569 0.615 0.641 0.658 0.684 12–15 years . . . . . . . . . . . . . . . 576 0.695 0.059 0.594 0.616 0.633 0.657 0.697 0.733 0.757 0.768 0.789 16–19 years . . . . . . . . . . . . . . . 543 0.743 0.053 0.652 0.674 0.689 0.711 0.739 0.776 0.796 0.810 0.838 20–29 years . . . . . . . . . . . . . . . 583 0.751 0.051 0.667 0.680 0.693 0.715 0.754 0.786 0.805 0.814 0.831 30–39 years . . . . . . . . . . . . . . . 612 0.759 0.053 0.673 0.692 0.705 0.719 0.756 0.793 0.813 0.831 0.850 40–49 years . . . . . . . . . . . . . . . 668 0.755 0.057 0.669 0.687 0.698 0.715 0.751 0.791 0.813 0.828 0.856 50–59 years . . . . . . . . . . . . . . . 639 0.732 0.060 0.642 0.656 0.670 0.690 0.729 0.767 0.789 0.807 0.838 60–69 years . . . . . . . . . . . . . . . 644 0.696 0.075 0.590 0.609 0.626 0.654 0.693 0.735 0.757 0.778 0.802 70–79 years . . . . . . . . . . . . . . . 429 0.654 0.064 0.547 0.568 0.586 0.612 0.652 0.697 0.722 0.733 0.760 80 years and over . . . . . . . . . . . 457 0.612 0.071 0.500 0.528 0.543 0.564 0.610 0.655 0.678 0.701 0.724
20 years and over (age-adjusted) . . 4,032 0.731 . . . . . . . . . . . . . . . . . . . . . . . . . . . . . .
Non-Hispanic black 8–11 years . . . . . . . . . . . . . . . . 490 0.590 0.073 0.462 0.493 0.510 0.543 0.592 0.641 0.664 0.681 0.703 12–15 years . . . . . . . . . . . . . . . 737 0.724 0.059 0.627 0.650 0.664 0.683 0.726 0.762 0.782 0.799 0.816 16–19 years . . . . . . . . . . . . . . . 609 0.766 0.056 0.679 0.696 0.708 0.727 0.763 0.800 0.819 0.838 0.857 20–29 years . . . . . . . . . . . . . . . 297 0.784 0.059 0.686 0.706 0.721 0.742 0.782 0.822 0.844 0.860 0.890 30–39 years . . . . . . . . . . . . . . . 333 0.794 0.059 0.701 0.721 0.731 0.754 0.789 0.827 0.856 0.871 0.899 40–49 years . . . . . . . . . . . . . . . 398 0.792 0.061 0.700 0.717 0.730 0.749 0.786 0.828 0.851 0.873 0.902 50–59 years . . . . . . . . . . . . . . . 250 0.760 0.070 0.643 0.668 0.691 0.716 0.756 0.796 0.820 0.849 0.878 60–69 years . . . . . . . . . . . . . . . 306 0.736 0.069 0.629 0.643 0.663 0.691 0.734 0.778 0.803 0.825 0.864 70–79 years . . . . . . . . . . . . . . . 124 0.691 0.067 0.569 0.605 0.627 0.643 0.691 0.739 0.757 0.779 0.809 80 years and over . . . . . . . . . . . 58 *0.648 0.075 *0.526 *0.545 *0.567 *0.597 *0.650 *0.685 *0.716 *0.735 †
20 years and over (age-adjusted) . . 1,766 0.765 . . . . . . . . . . . . . . . . . . . . . . . . . . . . . .
. . . Category not applicable.
* Figure does not meet standards of reliability or precision; relative standard error (standard error divided by estimate times 100) is 30%–39% or estimate is based on less than 12 degrees of freedom.
† Standard error not calculated by SUDAAN software.
NOTE: g/cm2 is grams per centimeter squared.
SOURCE: National Health and Nutrition Examination Survey, 1999–2006.

Series 11, No. 253 [ Page 49
Table 22. Left arm bone area (cm2) of persons aged 8 years and over, by sex, race and ethnicity, and age: United States, 1999–2006
Percentile Sample Standard
Sex, race and ethnicity, and age size Mean deviation 5th 10th 15th 25th 50th 75th 85th 90th 95th
Male
All races and ethnicities 8–11 years . . . . . . . . . . . . . . . . 1,421 122.50 23.69 92.44 98.95 102.05 107.19 118.95 132.58 142.98 152.80 167.36 12–15 years . . . . . . . . . . . . . . . 2,264 186.44 42.46 122.73 131.05 138.57 152.81 184.94 217.41 231.95 241.75 257.25 16–19 years . . . . . . . . . . . . . . . 2,309 237.49 32.13 187.01 197.01 204.27 215.66 236.05 259.05 269.28 277.74 292.07 20–29 years . . . . . . . . . . . . . . . 1,530 250.52 29.05 202.67 214.55 221.68 231.46 250.06 269.26 279.71 286.07 297.56 30–39 years . . . . . . . . . . . . . . . 1,450 255.71 28.51 209.50 220.39 226.74 237.29 255.73 272.95 283.85 292.50 304.07 40–49 years . . . . . . . . . . . . . . . 1,549 261.87 26.92 217.32 226.90 233.93 243.84 262.27 280.21 289.66 296.26 305.78 50–59 years . . . . . . . . . . . . . . . 1,187 261.42 27.28 214.22 224.99 234.52 243.46 261.94 278.63 288.55 295.18 305.28 60–69 years . . . . . . . . . . . . . . . 1,350 260.89 28.69 213.37 225.10 232.82 243.05 261.85 279.24 289.26 297.55 307.55 70–79 years . . . . . . . . . . . . . . . 825 256.97 28.97 208.59 220.77 228.18 237.83 257.41 275.59 287.26 293.81 303.35 80 years and over . . . . . . . . . . . 501 245.67 29.14 199.93 210.33 216.69 226.15 244.20 263.54 274.23 283.25 296.39
20 years and over (age-adjusted) . . 8,392 257.14 . . . . . . . . . . . . . . . . . . . . . . . . . . . . . .
Mexican American 8–11 years . . . . . . . . . . . . . . . . 468 123.33 23.43 94.93 100.63 103.03 107.34 118.49 133.42 146.80 154.09 167.00 12–15 years . . . . . . . . . . . . . . . 777 182.91 39.65 121.70 130.31 138.24 152.62 181.30 210.16 226.90 234.55 249.71 16–19 years . . . . . . . . . . . . . . . 783 225.37 29.47 181.29 189.55 195.64 205.74 223.79 243.36 255.47 264.50 274.55 20–29 years . . . . . . . . . . . . . . . 444 234.62 26.03 194.43 202.36 207.12 215.76 233.85 252.96 259.98 267.93 279.48 30–39 years . . . . . . . . . . . . . . . 337 236.36 24.82 196.23 206.30 210.22 218.27 236.55 251.36 262.31 268.03 278.51 40–49 years . . . . . . . . . . . . . . . 381 238.22 24.44 201.93 208.63 213.81 222.78 235.24 253.18 263.47 269.95 281.49 50–59 years . . . . . . . . . . . . . . . 174 239.78 23.88 205.03 212.01 215.99 221.38 237.64 256.65 263.58 269.07 278.45 60–69 years . . . . . . . . . . . . . . . 348 242.13 24.88 199.65 209.95 215.00 224.29 243.30 259.43 266.19 272.11 283.59 70–79 years . . . . . . . . . . . . . . . 164 *234.13 24.62 *192.96 *201.46 *208.53 *219.28 *234.92 *248.84 *259.51 *264.08 *272.89 80 years and over . . . . . . . . . . . 48 *225.45 25.82 *186.07 *190.08 *193.61 *208.30 *226.44 *238.48 *246.17 *249.65 †
20 years and over (age-adjusted) . . 1,896 236.87 . . . . . . . . . . . . . . . . . . . . . . . . . . . . . .
Non-Hispanic white 8–11 years . . . . . . . . . . . . . . . . 369 120.10 23.07 88.86 96.30 100.52 105.25 117.63 129.44 139.08 147.74 164.65 12–15 years . . . . . . . . . . . . . . . 578 185.64 42.30 121.70 130.27 137.15 151.78 184.68 216.74 230.40 241.23 255.49 16–19 years . . . . . . . . . . . . . . . 591 237.51 30.66 188.56 199.01 205.01 216.41 236.53 258.71 267.78 274.81 289.37 20–29 years . . . . . . . . . . . . . . . 617 252.12 26.99 207.60 220.15 225.84 233.09 252.48 269.71 278.74 284.40 294.44 30–39 years . . . . . . . . . . . . . . . 647 259.14 25.83 219.72 226.71 232.45 241.33 258.87 274.40 284.62 293.10 303.37 40–49 years . . . . . . . . . . . . . . . 700 264.80 24.80 224.21 232.37 237.85 247.95 264.43 281.84 290.62 296.88 306.11 50–59 years . . . . . . . . . . . . . . . 683 263.67 25.45 219.07 231.50 239.91 247.15 263.70 279.57 288.75 295.09 304.14 60–69 years . . . . . . . . . . . . . . . 623 263.00 26.43 221.52 230.55 236.76 245.55 263.08 279.46 289.09 297.23 306.64 70–79 years . . . . . . . . . . . . . . . 496 259.17 27.23 214.32 223.81 231.63 240.42 259.86 276.84 287.71 294.57 304.49 80 years and over . . . . . . . . . . . 398 245.72 27.74 202.35 211.18 218.87 226.94 244.62 262.82 273.64 281.24 292.09
20 years and over (age-adjusted) . . 4,164 259.55 . . . . . . . . . . . . . . . . . . . . . . . . . . . . . .
Non-Hispanic black 8–11 years . . . . . . . . . . . . . . . . 469 133.53 26.14 100.56 106.79 109.98 116.72 128.22 143.82 155.54 167.07 191.79 12–15 years . . . . . . . . . . . . . . . 745 201.45 44.72 133.46 142.08 150.23 167.40 200.46 232.54 247.53 259.40 274.67 16–19 years . . . . . . . . . . . . . . . 757 253.53 34.51 199.67 212.39 220.19 231.14 253.90 274.57 286.25 294.80 307.18 20–29 years . . . . . . . . . . . . . . . 325 268.00 30.10 221.90 232.60 237.95 246.31 263.41 285.72 300.26 307.07 316.98 30–39 years . . . . . . . . . . . . . . . 310 273.26 30.14 227.96 235.41 242.55 251.66 271.57 292.33 304.90 311.96 326.37 40–49 years . . . . . . . . . . . . . . . 366 272.53 27.68 225.68 236.32 242.21 253.94 273.97 289.95 300.03 306.42 317.34 50–59 years . . . . . . . . . . . . . . . 240 273.80 29.32 226.80 234.16 244.14 252.49 272.62 293.53 305.37 313.72 321.99 60–69 years . . . . . . . . . . . . . . . 303 276.80 27.03 233.88 241.86 250.00 259.79 275.48 294.29 305.44 311.71 319.18 70–79 years . . . . . . . . . . . . . . . 114 267.58 33.24 214.53 225.32 234.31 248.57 269.81 289.87 298.77 303.34 309.52 80 years and over . . . . . . . . . . . 36 *263.50 38.91 † *211.15 *219.13 *229.97 *263.47 *288.06 *300.09 *317.96 †
20 years and over (age-adjusted) . . 1,694 271.66 . . . . . . . . . . . . . . . . . . . . . . . . . . . . . .
See footnotes at end of table.

Page 50 [ Series 11, No. 253
Table 22. Left arm bone area (cm2) of persons aged 8 years and over, by sex, race and ethnicity, and age: United States, 1999–2006—Con.
Percentile Sample Standard
Sex, race and ethnicity, and age size Mean deviation 5th 10th 15th 25th 50th 75th 85th 90th 95th
Female
All races and ethnicities 8–11 years . . . . . . . . . . . . . . . . 1,465 128.25 24.59 94.85 101.31 105.32 112.50 125.21 141.26 153.18 161.45 174.97 12–15 years . . . . . . . . . . . . . . . 2,318 176.95 27.91 131.64 141.89 149.26 158.68 176.19 194.69 206.04 213.09 222.60 16–19 years . . . . . . . . . . . . . . . 2,027 194.80 25.98 154.25 162.36 169.30 177.36 193.29 209.99 219.93 227.76 239.51 20–29 years . . . . . . . . . . . . . . . 1,378 202.29 24.34 162.42 171.15 176.17 186.01 201.87 218.64 226.90 233.12 243.83 30–39 years . . . . . . . . . . . . . . . 1,372 205.38 22.99 169.41 175.78 181.65 189.69 204.37 219.39 228.39 235.36 245.95 40–49 years . . . . . . . . . . . . . . . 1,570 208.93 23.43 171.42 180.30 184.33 192.60 208.90 223.25 233.40 238.53 247.82 50–59 years . . . . . . . . . . . . . . . 1,200 206.79 24.11 168.22 174.67 181.61 191.04 206.67 222.66 232.24 237.32 245.50 60–69 years . . . . . . . . . . . . . . . 1,419 203.82 25.68 162.60 171.55 177.08 186.28 202.92 220.42 228.27 234.08 246.77 70–79 years . . . . . . . . . . . . . . . 750 196.06 26.22 156.47 163.33 170.03 178.89 194.11 212.16 222.90 229.41 240.85 80 years and over . . . . . . . . . . . 594 181.92 27.98 135.28 147.93 154.22 162.28 181.42 201.99 210.62 217.37 225.16
20 years and over (age-adjusted) . . 8,283 203.77 . . . . . . . . . . . . . . . . . . . . . . . . . . . . . .
Mexican American 8–11 years . . . . . . . . . . . . . . . . 471 126.87 22.83 95.59 102.31 106.02 112.17 124.02 139.03 148.63 157.88 170.76 12–15 years . . . . . . . . . . . . . . . 821 173.70 25.04 132.25 141.31 147.64 157.82 173.51 190.84 197.01 204.86 216.46 16–19 years . . . . . . . . . . . . . . . 692 185.23 23.39 146.97 155.23 161.07 169.22 185.06 200.02 208.18 215.12 224.43 20–29 years . . . . . . . . . . . . . . . 364 192.55 21.97 155.80 163.81 169.79 178.34 191.21 207.62 215.86 220.83 227.43 30–39 years . . . . . . . . . . . . . . . 298 195.40 19.90 165.62 172.23 176.72 181.75 193.20 207.80 215.14 220.72 231.19 40–49 years . . . . . . . . . . . . . . . 372 198.46 20.09 166.73 172.22 178.38 184.20 198.35 212.65 219.68 223.11 229.71 50–59 years . . . . . . . . . . . . . . . 194 192.95 24.45 149.86 161.52 167.66 174.33 194.98 210.00 216.45 220.94 233.68 60–69 years . . . . . . . . . . . . . . . 375 187.41 24.55 149.40 156.67 161.91 170.53 186.46 203.80 213.84 221.88 227.70 70–79 years . . . . . . . . . . . . . . . 154 *179.33 25.47 *138.44 *147.13 *157.24 *163.60 *178.06 *197.08 *203.30 *211.98 *221.25 80 years and over . . . . . . . . . . . 47 *166.12 23.37 † *131.96 *140.67 *152.38 *164.60 *181.74 *187.31 *196.05 †
20 years and over (age-adjusted) . . 1,804 191.64 . . . . . . . . . . . . . . . . . . . . . . . . . . . . . .
Non-Hispanic white 8–11 years . . . . . . . . . . . . . . . . 383 125.81 23.01 92.92 100.06 103.95 110.78 123.94 137.95 149.10 155.80 166.80 12–15 years . . . . . . . . . . . . . . . 576 173.59 26.48 127.41 138.82 147.01 155.30 173.92 190.83 200.56 208.06 216.16 16–19 years . . . . . . . . . . . . . . . 543 194.31 24.32 154.77 164.07 171.33 178.71 193.60 207.58 217.24 224.62 235.65 20–29 years . . . . . . . . . . . . . . . 583 202.12 22.45 165.12 172.45 177.20 187.47 201.83 217.30 224.89 230.00 240.11 30–39 years . . . . . . . . . . . . . . . 612 204.46 21.45 170.67 175.99 182.51 189.92 204.24 217.12 225.10 230.68 241.52 40–49 years . . . . . . . . . . . . . . . 668 208.64 22.56 173.95 180.40 184.91 192.76 208.52 222.27 232.29 237.25 246.65 50–59 years . . . . . . . . . . . . . . . 639 207.46 21.88 171.54 178.58 185.40 193.02 206.95 221.79 231.07 236.15 242.79 60–69 years . . . . . . . . . . . . . . . 644 203.53 23.68 165.16 173.53 178.47 187.37 203.00 218.55 226.86 231.15 240.86 70–79 years . . . . . . . . . . . . . . . 429 196.12 24.82 158.13 165.17 172.04 179.81 193.90 211.19 221.04 228.17 240.02 80 years and over . . . . . . . . . . . 457 182.01 26.45 139.09 150.32 155.03 162.81 181.37 201.01 208.86 214.32 223.23
20 years and over (age-adjusted) . . 4,032 203.57 . . . . . . . . . . . . . . . . . . . . . . . . . . . . . .
Non-Hispanic black 8–11 years . . . . . . . . . . . . . . . . 490 139.44 29.30 100.89 108.74 112.27 120.01 134.14 155.15 169.70 178.15 190.70 12–15 years . . . . . . . . . . . . . . . 737 197.34 28.76 151.49 160.93 168.49 177.93 195.85 216.97 226.59 234.28 247.47 16–19 years . . . . . . . . . . . . . . . 609 211.98 27.89 168.89 177.55 183.49 192.59 211.42 227.79 238.51 246.70 257.79 20–29 years . . . . . . . . . . . . . . . 297 218.15 23.88 175.48 185.39 193.97 203.15 217.40 233.22 241.28 249.58 259.25 30–39 years . . . . . . . . . . . . . . . 333 222.92 23.54 184.52 192.16 197.54 206.13 223.78 238.31 246.86 253.35 261.87 40–49 years . . . . . . . . . . . . . . . 398 224.84 22.28 186.49 197.02 203.54 211.13 223.52 239.98 246.47 252.03 261.09 50–59 years . . . . . . . . . . . . . . . 250 221.69 25.95 175.97 187.00 193.95 203.94 223.32 238.77 246.99 253.98 260.99 60–69 years . . . . . . . . . . . . . . . 306 226.40 27.69 179.81 189.84 197.54 210.49 225.10 243.12 254.30 260.82 276.11 70–79 years . . . . . . . . . . . . . . . 124 216.08 28.86 169.94 180.43 184.69 194.86 218.00 231.91 242.26 255.49 268.48 80 years and over . . . . . . . . . . . 58 *204.23 27.30 *154.16 *167.77 *175.79 *184.87 *207.67 *223.01 *228.82 *235.45 *244.38
20 years and over (age-adjusted) . . 1,766 221.19 . . . . . . . . . . . . . . . . . . . . . . . . . . . . . .
. . . Category not applicable.
* Figure does not meet standards of reliability or precision; relative standard error (standard error divided by estimate times 100) is 30%–39% or estimate is based on less than 12 degrees of freedom.
† Standard error not calculated by SUDAAN software.
NOTE: cm2 is centimeter squared.
SOURCE: National Health and Nutrition Examination Survey, 1999–2006.

Series 11, No. 253 [ Page 51
Table 23. Left arm bone mineral content (g) of persons aged 8 years and over, by sex, race and ethnicity, and age: United States, 1999–2006
Percentile Sample Standard
Sex, race and ethnicity, and age size Mean deviation 5th 10th 15th 25th 50th 75th 85th 90th 95th
Male
All races and ethnicities 8–11 years . . . . . . . . . . . . . . . . 1,421 70.25 18.93 45.65 49.63 52.35 57.01 67.77 79.37 87.92 94.39 106.40 12–15 years . . . . . . . . . . . . . . . 2,264 133.09 43.19 71.15 79.58 86.37 99.37 128.67 163.53 179.28 192.12 207.44 16–19 years . . . . . . . . . . . . . . . 2,309 197.52 37.94 139.86 150.13 156.72 171.24 195.39 222.48 236.53 246.38 261.43 20–29 years . . . . . . . . . . . . . . . 1,530 218.46 38.73 159.54 171.86 179.42 191.87 215.43 242.47 256.90 267.31 284.98 30–39 years . . . . . . . . . . . . . . . 1,450 225.43 39.49 166.98 178.35 186.70 198.15 222.24 248.71 263.51 274.92 295.26 40–49 years . . . . . . . . . . . . . . . 1,549 231.23 37.53 171.33 183.71 192.17 205.70 229.26 254.34 269.77 279.97 295.04 50–59 years . . . . . . . . . . . . . . . 1,187 227.87 37.97 166.95 180.58 190.76 203.34 225.02 251.23 265.77 276.98 292.82 60–69 years . . . . . . . . . . . . . . . 1,350 223.73 39.05 163.82 175.25 185.49 197.46 222.37 247.12 261.46 274.62 291.38 70–79 years . . . . . . . . . . . . . . . 825 213.01 38.81 152.80 164.15 172.26 186.68 211.21 238.75 253.53 261.68 277.35 80 years and over . . . . . . . . . . . 501 195.28 37.63 137.78 148.23 157.92 171.01 191.29 218.74 233.46 245.55 258.13
20 years and over (age-adjusted) . . 8,392 223.17 . . . . . . . . . . . . . . . . . . . . . . . . . . . . . .
Mexican American 8–11 years . . . . . . . . . . . . . . . . 468 69.61 19.33 45.06 49.05 51.26 55.60 65.52 78.60 89.49 96.37 105.50 12–15 years . . . . . . . . . . . . . . . 777 129.85 41.96 69.00 77.85 84.51 97.89 126.04 156.13 169.66 184.84 203.34 16–19 years . . . . . . . . . . . . . . . 783 183.95 34.34 133.54 144.74 150.44 159.92 180.21 202.92 219.81 228.77 242.15 20–29 years . . . . . . . . . . . . . . . 444 199.45 32.32 153.70 160.34 165.95 176.57 195.43 220.63 231.94 240.50 254.07 30–39 years . . . . . . . . . . . . . . . 337 202.20 30.87 157.54 164.97 170.60 179.17 200.42 220.44 234.06 243.52 257.24 40–49 years . . . . . . . . . . . . . . . 381 202.50 32.03 155.17 166.19 171.28 180.94 198.86 222.44 232.01 242.69 257.56 50–59 years . . . . . . . . . . . . . . . 174 202.68 31.89 150.66 162.33 167.84 178.85 204.95 220.68 232.88 244.05 254.92 60–69 years . . . . . . . . . . . . . . . 348 203.10 32.21 150.07 161.44 168.34 180.85 204.41 223.72 234.26 242.01 252.13 70–79 years . . . . . . . . . . . . . . . 164 *189.12 31.99 *134.75 *147.73 *152.86 *164.37 *189.80 *211.82 *220.97 *227.41 *241.06 80 years and over . . . . . . . . . . . 48 *174.51 31.72 *126.88 *141.00 *143.66 *152.29 *175.45 *184.36 *199.45 *210.15 †
20 years and over (age-adjusted) . . 1,896 199.55 . . . . . . . . . . . . . . . . . . . . . . . . . . . . . .
Non-Hispanic white 8–11 years . . . . . . . . . . . . . . . . 369 68.66 18.00 43.80 48.17 51.78 56.50 66.59 76.81 85.57 90.84 105.24 12–15 years . . . . . . . . . . . . . . . 578 132.15 42.78 70.93 78.22 85.08 97.32 127.21 162.97 177.59 190.20 206.09 16–19 years . . . . . . . . . . . . . . . 591 197.58 35.70 141.91 150.47 157.45 172.10 196.51 222.22 235.63 243.84 256.65 20–29 years . . . . . . . . . . . . . . . 617 220.31 36.42 163.87 177.02 184.76 194.95 217.90 243.07 256.84 266.28 280.16 30–39 years . . . . . . . . . . . . . . . 647 229.62 37.01 174.77 185.82 193.34 204.19 227.74 250.97 264.56 275.30 296.15 40–49 years . . . . . . . . . . . . . . . 700 234.38 34.78 180.21 190.62 198.93 210.55 232.35 255.82 271.14 280.49 294.24 50–59 years . . . . . . . . . . . . . . . 683 230.05 35.72 172.62 188.07 195.26 206.40 227.36 251.88 265.41 276.07 291.10 60–69 years . . . . . . . . . . . . . . . 623 225.65 36.70 170.74 182.21 190.88 200.60 224.04 247.07 260.63 272.78 290.80 70–79 years . . . . . . . . . . . . . . . 496 215.18 37.81 156.30 167.42 173.89 188.61 214.39 240.21 254.06 261.52 277.98 80 years and over . . . . . . . . . . . 398 194.46 35.32 139.09 150.72 158.90 172.03 191.12 217.40 231.03 242.77 254.67
20 years and over (age-adjusted) . . 4,164 225.76 . . . . . . . . . . . . . . . . . . . . . . . . . . . . . .
Non-Hispanic black 8–11 years . . . . . . . . . . . . . . . . 469 79.82 21.49 52.04 55.97 59.54 65.56 76.38 90.38 100.57 105.61 121.49 12–15 years . . . . . . . . . . . . . . . 745 147.86 45.79 82.75 90.49 98.53 111.89 144.82 178.34 196.39 207.13 224.60 16–19 years . . . . . . . . . . . . . . . 757 216.26 42.79 155.27 167.27 175.46 187.35 213.85 240.63 256.92 268.68 285.49 20–29 years . . . . . . . . . . . . . . . 325 242.78 43.16 184.50 194.29 200.40 210.95 238.15 265.61 283.13 293.42 318.71 30–39 years . . . . . . . . . . . . . . . 310 249.64 43.04 186.60 198.45 208.09 218.76 245.85 274.18 290.70 305.90 326.32 40–49 years . . . . . . . . . . . . . . . 366 248.31 42.77 182.53 196.63 205.03 219.53 246.78 272.39 289.06 301.94 320.09 50–59 years . . . . . . . . . . . . . . . 240 249.03 41.57 185.70 196.83 205.96 218.50 244.62 274.09 291.29 301.90 318.27 60–69 years . . . . . . . . . . . . . . . 303 248.21 38.25 182.31 201.31 211.30 223.92 247.18 274.98 284.74 292.06 306.09 70–79 years . . . . . . . . . . . . . . . 114 227.80 43.25 153.03 176.82 182.63 200.45 227.54 258.46 269.70 279.68 288.27 80 years and over . . . . . . . . . . . 36 *225.38 51.44 † *154.00 *170.30 *182.68 *230.61 *251.88 *275.18 *302.05 †
20 years and over (age-adjusted) . . 1,694 244.91 . . . . . . . . . . . . . . . . . . . . . . . . . . . . . .
See footnotes at end of table.

Page 52 [ Series 11, No. 253
Table 23. Left arm bone mineral content (g) of persons aged 8 years and over, by sex, race and ethnicity, and age: United States, 1999–2006—Con.
Percentile Sample Standard
Sex, race and ethnicity, and age size Mean deviation 5th 10th 15th 25th 50th 75th 85th 90th 95th
Female
All races and ethnicities 8–11 years . . . . . . . . . . . . . . . . 1,465 72.22 21.71 44.10 48.01 51.25 56.47 68.35 83.83 93.65 102.53 113.52 12–15 years . . . . . . . . . . . . . . . 2,318 121.20 26.56 78.06 88.63 94.76 103.77 120.04 136.94 148.20 155.62 167.00 16–19 years . . . . . . . . . . . . . . . 2,027 140.77 25.51 101.46 110.10 114.37 123.54 139.41 155.43 165.53 173.09 184.55 20–29 years . . . . . . . . . . . . . . . 1,378 148.63 25.11 110.79 117.37 122.23 130.60 147.49 164.14 174.14 181.14 192.17 30–39 years . . . . . . . . . . . . . . . 1,372 152.66 24.76 116.52 123.41 128.18 134.34 150.94 167.92 177.29 185.48 197.35 40–49 years . . . . . . . . . . . . . . . 1,570 155.00 25.11 116.84 124.51 129.64 137.52 153.71 168.93 180.35 187.82 197.71 50–59 years . . . . . . . . . . . . . . . 1,200 148.79 25.19 108.49 117.51 123.44 132.02 147.47 164.97 175.16 181.73 192.62 60–69 years . . . . . . . . . . . . . . . 1,419 139.90 27.89 98.77 107.09 112.73 120.52 138.20 155.54 165.89 173.14 185.86 70–79 years . . . . . . . . . . . . . . . 750 126.43 26.01 87.74 95.14 100.54 107.69 124.60 142.82 152.28 158.80 175.57 80 years and over . . . . . . . . . . . 594 109.83 25.80 68.12 77.74 82.60 92.74 108.06 126.10 137.23 143.37 152.52
20 years and over (age-adjusted) . . 8,283 146.35 . . . . . . . . . . . . . . . . . . . . . . . . . . . . . .
Mexican American 8–11 years . . . . . . . . . . . . . . . . 471 69.17 20.72 42.47 45.40 48.45 53.95 65.66 80.40 89.38 96.30 112.66 12–15 years . . . . . . . . . . . . . . . 821 117.25 23.61 78.89 88.02 93.35 102.53 115.97 132.26 142.50 146.61 155.70 16–19 years . . . . . . . . . . . . . . . 692 130.64 22.59 95.88 102.66 107.10 115.09 129.90 144.38 152.21 158.89 169.54 20–29 years . . . . . . . . . . . . . . . 364 138.72 21.59 105.11 111.04 117.13 123.01 138.13 154.35 160.68 166.52 176.75 30–39 years . . . . . . . . . . . . . . . 298 142.77 20.74 112.98 118.38 122.03 128.51 140.53 153.82 162.87 170.29 179.84 40–49 years . . . . . . . . . . . . . . . 372 144.51 20.66 111.67 119.09 123.22 129.93 144.74 158.16 165.32 169.69 178.52 50–59 years . . . . . . . . . . . . . . . 194 135.41 25.70 94.24 101.63 108.07 116.85 134.96 151.03 159.70 168.80 175.64 60–69 years . . . . . . . . . . . . . . . 375 122.63 24.33 83.77 92.43 96.56 104.65 120.97 140.41 149.05 156.34 163.50 70–79 years . . . . . . . . . . . . . . . 154 *110.17 24.09 *72.91 *77.96 *87.37 *95.95 *108.25 *125.27 *133.84 *141.56 *151.21 80 years and over . . . . . . . . . . . 47 *94.94 21.56 † *65.74 *74.19 *81.15 *93.70 *106.27 *116.59 *122.01 †
20 years and over (age-adjusted) . . 1,804 134.27 . . . . . . . . . . . . . . . . . . . . . . . . . . . . . .
Non-Hispanic white 8–11 years . . . . . . . . . . . . . . . . 383 70.73 20.10 44.05 47.64 50.66 55.95 67.41 81.83 90.58 96.95 110.81 12–15 years . . . . . . . . . . . . . . . 576 118.35 25.01 76.55 86.45 92.76 101.41 118.51 134.53 144.64 151.09 160.20 16–19 years . . . . . . . . . . . . . . . 543 140.61 23.53 102.16 112.02 115.95 124.84 139.76 154.10 164.09 170.08 180.48 20–29 years . . . . . . . . . . . . . . . 583 148.10 22.44 113.49 119.81 124.40 131.91 147.21 162.89 170.01 177.94 185.88 30–39 years . . . . . . . . . . . . . . . 612 151.53 22.75 116.99 124.06 128.77 134.51 150.69 165.56 173.27 180.38 191.78 40–49 years . . . . . . . . . . . . . . . 668 154.33 23.78 117.87 125.27 129.94 137.50 153.33 167.49 178.24 185.32 194.18 50–59 years . . . . . . . . . . . . . . . 639 149.47 22.98 112.38 121.54 126.93 133.35 147.98 164.16 173.29 178.61 191.85 60–69 years . . . . . . . . . . . . . . . 644 139.56 26.24 99.30 108.68 113.92 122.20 138.57 154.57 163.52 170.33 178.25 70–79 years . . . . . . . . . . . . . . . 429 126.17 24.79 88.67 95.49 101.61 108.34 124.64 141.90 150.15 155.95 170.35 80 years and over . . . . . . . . . . . 457 109.74 24.48 68.99 78.98 84.06 93.68 108.10 124.92 134.96 141.32 149.14
20 years and over (age-adjusted) . . 4,032 145.91 . . . . . . . . . . . . . . . . . . . . . . . . . . . . . .
Non-Hispanic black 8–11 years . . . . . . . . . . . . . . . . 490 81.93 25.94 50.18 54.10 57.52 62.80 77.26 97.03 108.47 116.21 126.85 12–15 years . . . . . . . . . . . . . . . 737 140.45 28.49 97.08 106.38 111.98 120.81 138.91 159.04 169.26 178.20 188.24 16–19 years . . . . . . . . . . . . . . . 609 159.00 28.77 115.58 123.45 130.59 138.90 156.94 174.96 187.24 196.44 208.37 20–29 years . . . . . . . . . . . . . . . 297 167.75 26.65 120.87 133.33 140.76 149.27 167.80 184.19 194.55 201.66 212.76 30–39 years . . . . . . . . . . . . . . . 333 172.79 26.74 130.48 139.65 144.73 154.10 172.31 188.65 200.60 208.12 219.92 40–49 years . . . . . . . . . . . . . . . 398 174.28 25.27 137.36 144.17 148.92 156.86 171.47 189.00 198.23 205.08 216.27 50–59 years . . . . . . . . . . . . . . . 250 165.19 27.21 116.54 132.92 138.59 147.38 165.58 180.62 192.65 201.86 210.80 60–69 years . . . . . . . . . . . . . . . 306 164.29 29.53 115.95 125.60 134.03 145.05 162.42 181.93 194.59 201.91 216.46 70–79 years . . . . . . . . . . . . . . . 124 146.74 29.78 100.70 109.21 114.51 125.62 145.44 164.18 180.79 186.71 † 80 years and over . . . . . . . . . . . 58 *130.03 28.64 *78.27 *93.36 *99.73 *108.54 *129.51 *150.67 *160.20 *163.05 *173.43
20 years and over (age-adjusted) . . 1,766 165.98 . . . . . . . . . . . . . . . . . . . . . . . . . . . . . .
. . . Category not applicable.
* Figure does not meet standards of reliability or precision; relative standard error (standard error divided by estimate times 100) is 30%–39% or estimate is based on less than 12 degrees of freedom.
† Standard error not calculated by SUDAAN software.
NOTE: g is grams.
SOURCE: National Health and Nutrition Examination Survey, 1999–2006.

Series 11, No. 253 [ Page 53
Table 24. Left arm bone mineral density (g/cm2) of persons aged 8 years and over, by sex, race and ethnicity, and age: United States, 1999–2006
Percentile Sample Standard
Sex, race and ethnicity, and age size Mean deviation 5th 10th 15th 25th 50th 75th 85th 90th 95th
Male
All races and ethnicities 8–11 years . . . . . . . . . . . . . . . . 1,421 0.567 0.063 0.458 0.483 0.500 0.524 0.570 0.611 0.633 0.647 0.664 12–15 years . . . . . . . . . . . . . . . 2,264 0.699 0.085 0.566 0.588 0.609 0.639 0.696 0.758 0.790 0.811 0.841 16–19 years . . . . . . . . . . . . . . . 2,309 0.827 0.069 0.720 0.740 0.754 0.779 0.824 0.870 0.897 0.915 0.940 20–29 years . . . . . . . . . . . . . . . 1,530 0.867 0.072 0.759 0.781 0.796 0.818 0.860 0.909 0.941 0.962 0.993 30–39 years . . . . . . . . . . . . . . . 1,450 0.877 0.074 0.768 0.788 0.800 0.825 0.872 0.918 0.950 0.971 1.008 40–49 years . . . . . . . . . . . . . . . 1,549 0.879 0.072 0.764 0.788 0.807 0.827 0.872 0.921 0.953 0.970 1.006 50–59 years . . . . . . . . . . . . . . . 1,187 0.867 0.075 0.753 0.775 0.791 0.812 0.865 0.912 0.941 0.963 0.997 60–69 years . . . . . . . . . . . . . . . 1,350 0.853 0.078 0.736 0.759 0.772 0.799 0.850 0.898 0.932 0.953 0.990 70–79 years . . . . . . . . . . . . . . . 825 0.824 0.081 0.689 0.728 0.742 0.769 0.819 0.876 0.905 0.924 0.949 80 years and over . . . . . . . . . . . 501 0.789 0.081 0.662 0.689 0.707 0.740 0.783 0.842 0.872 0.899 0.924
20 years and over (age-adjusted) . . 8,392 0.863 . . . . . . . . . . . . . . . . . . . . . . . . . . . . . .
Mexican American 8–11 years . . . . . . . . . . . . . . . . 468 0.557 0.065 0.450 0.467 0.484 0.512 0.557 0.600 0.625 0.642 0.667 12–15 years . . . . . . . . . . . . . . . 777 0.695 0.089 0.556 0.583 0.601 0.633 0.690 0.753 0.785 0.809 0.839 16–19 years . . . . . . . . . . . . . . . 783 0.811 0.064 0.706 0.729 0.744 0.768 0.810 0.853 0.877 0.893 0.919 20–29 years . . . . . . . . . . . . . . . 444 0.846 0.059 0.757 0.771 0.783 0.806 0.842 0.884 0.902 0.918 0.953 30–39 years . . . . . . . . . . . . . . . 337 0.852 0.060 0.760 0.780 0.792 0.809 0.848 0.884 0.908 0.933 0.961 40–49 years . . . . . . . . . . . . . . . 381 0.846 0.066 0.746 0.768 0.784 0.804 0.841 0.884 0.906 0.923 0.959 50–59 years . . . . . . . . . . . . . . . 174 0.841 0.069 0.722 0.748 0.763 0.792 0.845 0.895 0.912 0.917 0.937 60–69 years . . . . . . . . . . . . . . . 348 0.835 0.070 0.722 0.750 0.769 0.787 0.831 0.872 0.895 0.915 0.953 70–79 years . . . . . . . . . . . . . . . 164 *0.803 0.074 *0.679 *0.702 *0.719 *0.754 *0.807 *0.853 *0.877 *0.890 *0.908 80 years and over . . . . . . . . . . . 48 *0.769 0.065 *0.679 *0.685 *0.698 *0.711 *0.766 *0.801 *0.831 *0.848 *0.895
20 years and over (age-adjusted) . . 1,896 0.838 . . . . . . . . . . . . . . . . . . . . . . . . . . . . . .
Non-Hispanic white 8–11 years . . . . . . . . . . . . . . . . 369 0.566 0.060 0.458 0.485 0.501 0.525 0.569 0.608 0.630 0.641 0.658 12–15 years . . . . . . . . . . . . . . . 578 0.697 0.084 0.567 0.588 0.609 0.638 0.691 0.759 0.788 0.805 0.839 16–19 years . . . . . . . . . . . . . . . 591 0.828 0.069 0.721 0.741 0.754 0.779 0.827 0.871 0.899 0.914 0.939 20–29 years . . . . . . . . . . . . . . . 617 0.869 0.070 0.761 0.784 0.799 0.820 0.863 0.912 0.942 0.960 0.989 30–39 years . . . . . . . . . . . . . . . 647 0.882 0.074 0.771 0.793 0.806 0.831 0.878 0.922 0.953 0.974 1.010 40–49 years . . . . . . . . . . . . . . . 700 0.881 0.069 0.770 0.795 0.814 0.833 0.876 0.923 0.950 0.970 1.005 50–59 years . . . . . . . . . . . . . . . 683 0.869 0.074 0.761 0.780 0.794 0.814 0.866 0.912 0.942 0.962 0.996 60–69 years . . . . . . . . . . . . . . . 623 0.854 0.077 0.741 0.761 0.774 0.801 0.850 0.897 0.931 0.951 0.987 70–79 years . . . . . . . . . . . . . . . 496 0.825 0.082 0.692 0.728 0.741 0.769 0.822 0.878 0.910 0.926 0.951 80 years and over . . . . . . . . . . . 398 0.786 0.077 0.667 0.691 0.707 0.739 0.782 0.836 0.864 0.885 0.917
20 years and over (age-adjusted) . . 4,164 0.865 . . . . . . . . . . . . . . . . . . . . . . . . . . . . . .
Non-Hispanic black 8–11 years . . . . . . . . . . . . . . . . 469 0.592 0.065 0.470 0.502 0.522 0.550 0.596 0.639 0.653 0.665 0.687 12–15 years . . . . . . . . . . . . . . . 745 0.721 0.083 0.592 0.618 0.636 0.664 0.717 0.777 0.809 0.831 0.858 16–19 years . . . . . . . . . . . . . . . 757 0.847 0.074 0.732 0.759 0.774 0.799 0.842 0.892 0.920 0.940 0.968 20–29 years . . . . . . . . . . . . . . . 325 0.901 0.078 0.789 0.807 0.821 0.844 0.886 0.950 0.983 1.005 1.040 30–39 years . . . . . . . . . . . . . . . 310 0.909 0.075 0.793 0.820 0.832 0.856 0.900 0.957 0.978 1.001 1.041 40–49 years . . . . . . . . . . . . . . . 366 0.906 0.086 0.782 0.807 0.823 0.846 0.896 0.960 0.985 1.004 1.045 50–59 years . . . . . . . . . . . . . . . 240 0.905 0.077 0.782 0.808 0.830 0.862 0.896 0.946 0.983 1.006 1.042 60–69 years . . . . . . . . . . . . . . . 303 0.893 0.078 0.758 0.792 0.815 0.842 0.892 0.943 0.972 0.984 1.013 70–79 years . . . . . . . . . . . . . . . 114 0.845 0.082 0.683 0.751 0.773 0.797 0.842 0.897 0.924 0.934 0.976 80 years and over . . . . . . . . . . . 36 *0.847 0.097 † *0.727 *0.751 *0.774 *0.841 *0.917 *0.935 *0.964 †
20 years and over (age-adjusted) . . 1,694 0.896 . . . . . . . . . . . . . . . . . . . . . . . . . . . . . .
See footnotes at end of table.

Page 54 [ Series 11, No. 253
Table 24. Left arm bone mineral density (g/cm2) of persons aged 8 years and over, by sex, race and ethnicity, and age: United States, 1999–2006—Con.
Percentile Sample Standard
Sex, race and ethnicity, and age size Mean deviation 5th 10th 15th 25th 50th 75th 85th 90th 95th
Female
All races and ethnicities 8–11 years . . . . . . . . . . . . . . . . 1,465 0.554 0.072 0.429 0.454 0.476 0.503 0.556 0.603 0.630 0.647 0.669 12–15 years . . . . . . . . . . . . . . . 2,318 0.679 0.057 0.581 0.604 0.619 0.642 0.681 0.716 0.734 0.747 0.771 16–19 years . . . . . . . . . . . . . . . 2,027 0.719 0.054 0.633 0.649 0.661 0.682 0.717 0.752 0.774 0.787 0.811 20–29 years . . . . . . . . . . . . . . . 1,378 0.731 0.052 0.646 0.666 0.676 0.695 0.732 0.763 0.784 0.796 0.817 30–39 years . . . . . . . . . . . . . . . 1,372 0.740 0.055 0.653 0.672 0.684 0.703 0.735 0.774 0.794 0.810 0.838 40–49 years . . . . . . . . . . . . . . . 1,570 0.739 0.056 0.653 0.671 0.680 0.701 0.734 0.772 0.795 0.812 0.835 50–59 years . . . . . . . . . . . . . . . 1,200 0.716 0.061 0.619 0.640 0.655 0.673 0.714 0.753 0.775 0.791 0.815 60–69 years . . . . . . . . . . . . . . . 1,419 0.682 0.081 0.577 0.597 0.612 0.636 0.680 0.720 0.745 0.763 0.790 70–79 years . . . . . . . . . . . . . . . 750 0.640 0.063 0.531 0.558 0.573 0.594 0.640 0.682 0.702 0.718 0.747 80 years and over . . . . . . . . . . . 594 0.597 0.070 0.484 0.512 0.527 0.549 0.593 0.644 0.665 0.682 0.717
20 years and over (age-adjusted) . . 8,283 0.713 . . . . . . . . . . . . . . . . . . . . . . . . . . . . . .
Mexican American 8–11 years . . . . . . . . . . . . . . . . 471 0.536 0.076 0.404 0.431 0.446 0.482 0.540 0.585 0.617 0.637 0.663 12–15 years . . . . . . . . . . . . . . . 821 0.670 0.056 0.573 0.602 0.617 0.637 0.671 0.705 0.727 0.736 0.752 16–19 years . . . . . . . . . . . . . . . 692 0.702 0.050 0.622 0.639 0.651 0.668 0.702 0.731 0.747 0.761 0.786 20–29 years . . . . . . . . . . . . . . . 364 0.718 0.048 0.637 0.656 0.667 0.681 0.718 0.749 0.765 0.781 0.801 30–39 years . . . . . . . . . . . . . . . 298 0.728 0.051 0.650 0.668 0.678 0.691 0.723 0.759 0.777 0.788 0.811 40–49 years . . . . . . . . . . . . . . . 372 0.726 0.051 0.637 0.658 0.672 0.687 0.729 0.760 0.776 0.794 0.805 50–59 years . . . . . . . . . . . . . . . 194 0.697 0.066 0.591 0.616 0.631 0.656 0.701 0.732 0.749 0.762 0.805 60–69 years . . . . . . . . . . . . . . . 375 0.649 0.064 0.550 0.569 0.582 0.601 0.648 0.694 0.718 0.734 0.755 70–79 years . . . . . . . . . . . . . . . 154 *0.608 0.066 *0.489 *0.523 *0.545 *0.569 *0.608 *0.648 *0.677 *0.693 *0.713 80 years and over . . . . . . . . . . . 47 *0.565 0.060 † *0.489 *0.502 *0.530 *0.564 *0.599 *0.627 *0.635 †
20 years and over (age-adjusted) . . 1,804 0.695 . . . . . . . . . . . . . . . . . . . . . . . . . . . . . .
Non-Hispanic white 8–11 years . . . . . . . . . . . . . . . . 383 0.554 0.069 0.430 0.458 0.481 0.510 0.554 0.599 0.628 0.641 0.664 12–15 years . . . . . . . . . . . . . . . 576 0.676 0.056 0.578 0.601 0.615 0.639 0.680 0.714 0.730 0.743 0.767 16–19 years . . . . . . . . . . . . . . . 543 0.720 0.051 0.638 0.653 0.666 0.684 0.720 0.752 0.773 0.784 0.803 20–29 years . . . . . . . . . . . . . . . 583 0.730 0.047 0.650 0.669 0.678 0.696 0.732 0.761 0.777 0.790 0.803 30–39 years . . . . . . . . . . . . . . . 612 0.738 0.053 0.653 0.674 0.685 0.704 0.733 0.773 0.793 0.807 0.835 40–49 years . . . . . . . . . . . . . . . 668 0.737 0.055 0.655 0.672 0.680 0.701 0.731 0.770 0.791 0.810 0.832 50–59 years . . . . . . . . . . . . . . . 639 0.718 0.058 0.625 0.647 0.658 0.676 0.716 0.754 0.775 0.790 0.812 60–69 years . . . . . . . . . . . . . . . 644 0.682 0.084 0.576 0.596 0.612 0.639 0.681 0.717 0.741 0.759 0.788 70–79 years . . . . . . . . . . . . . . . 429 0.639 0.062 0.530 0.555 0.572 0.594 0.640 0.678 0.701 0.717 0.745 80 years and over . . . . . . . . . . . 457 0.597 0.069 0.485 0.515 0.527 0.549 0.593 0.643 0.664 0.680 0.717
20 years and over (age-adjusted) . . 4,032 0.713 . . . . . . . . . . . . . . . . . . . . . . . . . . . . . .
Non-Hispanic black 8–11 years . . . . . . . . . . . . . . . . 490 0.578 0.072 0.453 0.482 0.500 0.530 0.580 0.627 0.649 0.667 0.693 12–15 years . . . . . . . . . . . . . . . 737 0.706 0.056 0.615 0.638 0.650 0.668 0.707 0.744 0.763 0.776 0.794 16–19 years . . . . . . . . . . . . . . . 609 0.746 0.055 0.659 0.678 0.691 0.709 0.741 0.781 0.803 0.821 0.846 20–29 years . . . . . . . . . . . . . . . 297 0.765 0.055 0.674 0.692 0.708 0.728 0.762 0.803 0.827 0.837 0.856 30–39 years . . . . . . . . . . . . . . . 333 0.772 0.058 0.683 0.702 0.714 0.733 0.765 0.804 0.828 0.852 0.882 40–49 years . . . . . . . . . . . . . . . 398 0.773 0.057 0.679 0.701 0.717 0.735 0.768 0.806 0.831 0.844 0.872 50–59 years . . . . . . . . . . . . . . . 250 0.742 0.067 0.632 0.661 0.679 0.698 0.741 0.776 0.803 0.826 0.867 60–69 years . . . . . . . . . . . . . . . 306 0.722 0.066 0.609 0.633 0.652 0.675 0.721 0.765 0.782 0.802 0.833 70–79 years . . . . . . . . . . . . . . . 124 0.674 0.066 0.554 0.584 0.607 0.630 0.677 0.716 0.738 0.755 0.789 80 years and over . . . . . . . . . . . 58 *0.630 0.074 *0.502 *0.526 *0.550 *0.577 *0.638 *0.678 *0.701 *0.715 *0.742
20 years and over (age-adjusted) . . 1,766 0.746 . . . . . . . . . . . . . . . . . . . . . . . . . . . . . .
. . . Category not applicable.
* Figure does not meet standards of reliability or precision; relative standard error (standard error divided by estimate times 100) is 30%–39% or estimate is based on less than 12 degrees of freedom.
† Standard error not calculated by SUDAAN software.
NOTE: g/cm2 is grams per centimeter squared.
SOURCE: National Health and Nutrition Examination Survey, 1999–2006.

Series 11, No. 253 [ Page 55
Table 25. Right leg bone area (cm2) of persons aged 8 years and over, by sex, race and ethnicity, and age: United States, 1999–2006
Percentile Sample Standard
Sex, race and ethnicity, and age size Mean deviation 5th 10th 15th 25th 50th 75th 85th 90th 95th
Male
All races and ethnicities 8–11 years . . . . . . . . . . . . . . . . 1,421 249.20 40.56 196.82 207.21 213.00 221.81 243.64 269.58 285.75 305.32 327.93 12–15 years . . . . . . . . . . . . . . . 2,264 353.38 60.15 259.38 274.66 284.55 306.99 353.80 398.29 418.96 431.36 447.87 16–19 years . . . . . . . . . . . . . . . 2,309 405.58 46.44 331.77 347.16 358.25 373.18 404.66 434.53 455.00 467.14 481.05 20–29 years . . . . . . . . . . . . . . . 1,530 410.48 46.58 337.43 353.26 364.78 380.00 408.11 438.94 453.83 469.93 488.93 30–39 years . . . . . . . . . . . . . . . 1,450 408.67 45.74 336.77 352.03 362.23 376.67 406.44 438.36 454.76 467.60 484.85 40–49 years . . . . . . . . . . . . . . . 1,549 413.76 41.48 347.64 362.11 371.92 385.92 413.93 440.52 454.91 466.35 482.67 50–59 years . . . . . . . . . . . . . . . 1,187 410.08 42.53 342.15 358.48 367.03 381.20 409.42 437.89 452.95 464.77 480.81 60–69 years . . . . . . . . . . . . . . . 1,350 408.23 42.61 334.89 355.70 365.25 380.27 407.89 436.16 453.11 462.40 478.81 70–79 years . . . . . . . . . . . . . . . 825 400.54 44.08 331.99 345.47 357.08 371.65 400.13 430.93 446.79 457.21 469.16 80 years and over . . . . . . . . . . . 501 386.14 42.18 318.19 332.78 343.46 357.84 385.88 414.46 426.61 438.78 454.58
20 years and over (age-adjusted) . . 8,392 408.55 . . . . . . . . . . . . . . . . . . . . . . . . . . . . . .
Mexican American 8–11 years . . . . . . . . . . . . . . . . 468 252.66 40.72 200.46 209.68 214.86 224.92 244.93 274.90 294.73 306.27 334.96 12–15 years . . . . . . . . . . . . . . . 777 348.37 56.72 253.98 270.37 283.22 308.20 349.73 386.12 408.12 424.12 441.74 16–19 years . . . . . . . . . . . . . . . 783 388.93 45.61 320.29 335.74 344.32 359.31 383.39 415.98 438.42 450.96 469.66 20–29 years . . . . . . . . . . . . . . . 444 383.68 42.86 317.68 332.16 340.50 354.16 381.52 411.06 427.77 436.83 452.78 30–39 years . . . . . . . . . . . . . . . 337 376.73 37.92 314.93 326.06 335.84 352.45 375.83 401.35 414.09 423.06 440.24 40–49 years . . . . . . . . . . . . . . . 381 381.25 38.96 325.63 337.01 346.18 357.13 377.64 403.77 421.50 429.33 451.72 50–59 years . . . . . . . . . . . . . . . 174 380.04 34.26 322.79 337.10 343.97 358.72 376.76 403.84 416.32 424.21 436.06 60–69 years . . . . . . . . . . . . . . . 348 380.38 35.34 324.80 334.40 342.62 354.90 380.77 403.73 418.38 428.81 437.49 70–79 years . . . . . . . . . . . . . . . 164 *366.71 40.79 *294.20 *325.15 *333.10 *344.84 *371.90 *392.36 *401.70 *406.99 *422.27 80 years and over . . . . . . . . . . . 48 *360.32 38.39 *286.47 *310.08 *317.94 *333.43 *363.04 *384.92 *394.12 *397.25 *415.41
20 years and over (age-adjusted) . . 1,896 378.28 . . . . . . . . . . . . . . . . . . . . . . . . . . . . . .
Non-Hispanic white 8–11 years . . . . . . . . . . . . . . . . 369 244.73 39.06 193.00 204.15 210.73 219.79 239.07 265.56 280.44 295.07 323.60 12–15 years . . . . . . . . . . . . . . . 578 353.36 61.01 256.81 271.80 281.94 304.21 354.64 399.66 422.16 432.27 447.21 16–19 years . . . . . . . . . . . . . . . 591 406.88 44.36 331.25 350.64 360.74 377.24 406.88 434.46 454.55 466.43 478.71 20–29 years . . . . . . . . . . . . . . . 617 413.80 43.05 346.64 363.14 371.63 385.23 411.39 440.54 453.84 468.86 485.45 30–39 years . . . . . . . . . . . . . . . 647 413.68 42.65 343.84 361.12 369.02 385.08 413.02 441.50 455.87 467.69 481.93 40–49 years . . . . . . . . . . . . . . . 700 418.28 38.63 356.89 371.01 379.76 391.90 417.02 443.12 457.72 468.77 484.37 50–59 years . . . . . . . . . . . . . . . 683 413.22 41.21 347.22 364.21 372.26 386.78 413.49 439.77 453.76 466.56 481.25 60–69 years . . . . . . . . . . . . . . . 623 412.49 40.16 349.10 363.02 370.63 384.54 409.81 439.01 454.84 463.46 480.50 70–79 years . . . . . . . . . . . . . . . 496 404.23 42.99 337.72 349.42 359.56 374.14 402.91 434.49 451.16 459.51 470.55 80 years and over . . . . . . . . . . . 398 387.09 40.65 320.51 337.40 345.23 358.78 386.57 414.69 426.45 437.20 452.65
20 years and over (age-adjusted) . . 4,164 412.48 . . . . . . . . . . . . . . . . . . . . . . . . . . . . . .
Non-Hispanic black 8–11 years . . . . . . . . . . . . . . . . 469 265.80 43.10 207.81 218.08 226.73 235.94 258.17 283.53 311.62 325.62 346.48 12–15 years . . . . . . . . . . . . . . . 745 370.83 60.58 274.95 291.54 303.07 329.59 371.22 409.48 426.61 441.33 468.35 16–19 years . . . . . . . . . . . . . . . 757 423.01 51.00 344.79 360.70 373.47 387.59 420.87 451.74 474.03 485.66 508.50 20–29 years . . . . . . . . . . . . . . . 325 434.89 49.51 366.78 376.86 384.91 400.30 429.65 460.24 482.84 502.88 523.31 30–39 years . . . . . . . . . . . . . . . 310 433.19 49.86 357.80 372.56 384.84 396.77 429.29 466.49 484.30 496.72 524.13 40–49 years . . . . . . . . . . . . . . . 366 426.15 42.96 356.16 371.00 382.38 401.28 424.45 452.43 466.98 477.88 493.99 50–59 years . . . . . . . . . . . . . . . 240 424.07 43.91 362.06 368.46 375.63 389.79 420.52 455.43 469.38 479.94 494.88 60–69 years . . . . . . . . . . . . . . . 303 418.64 41.34 350.51 367.90 377.11 394.08 417.79 445.71 460.20 468.83 483.16 70–79 years . . . . . . . . . . . . . . . 114 401.82 46.30 319.37 347.39 360.31 373.77 404.36 432.12 438.12 447.49 463.64 80 years and over . . . . . . . . . . . 36 *399.64 49.36 † *325.63 *337.81 *368.66 *396.98 *426.89 *456.01 † †
20 years and over (age-adjusted) . . 1,694 424.91 . . . . . . . . . . . . . . . . . . . . . . . . . . . . . .
See footnotes at end of table.

Page 56 [ Series 11, No. 253
Table 25. Right leg bone area (cm2) of persons aged 8 years and over, by sex, race and ethnicity, and age: United States, 1999–2006—Con.
Percentile Sample Standard
Sex, race and ethnicity, and age size Mean deviation 5th 10th 15th 25th 50th 75th 85th 90th 95th
Female
All races and ethnicities 8–11 years . . . . . . . . . . . . . . . . 1,465 255.44 40.01 197.16 208.58 216.85 228.72 251.23 280.85 295.46 308.30 326.78 12–15 years . . . . . . . . . . . . . . . 2,318 324.17 38.98 261.72 274.90 284.86 297.93 323.33 350.65 365.09 374.20 387.14 16–19 years . . . . . . . . . . . . . . . 2,027 340.82 39.93 281.94 294.02 302.98 314.44 337.74 363.87 377.91 388.38 404.36 20–29 years . . . . . . . . . . . . . . . 1,378 343.13 36.20 285.32 297.38 306.82 318.19 342.02 366.42 379.04 388.43 403.83 30–39 years . . . . . . . . . . . . . . . 1,372 345.24 35.04 292.04 302.35 309.84 321.14 341.56 368.27 381.60 392.07 407.81 40–49 years . . . . . . . . . . . . . . . 1,570 346.78 35.69 289.60 302.25 310.41 322.54 345.98 370.00 382.30 392.47 407.31 50–59 years . . . . . . . . . . . . . . . 1,200 341.08 35.96 283.41 296.58 304.28 317.35 341.96 364.28 377.01 386.21 398.68 60–69 years . . . . . . . . . . . . . . . 1,419 340.40 38.53 279.07 292.65 302.22 314.77 341.62 366.71 378.36 387.89 400.17 70–79 years . . . . . . . . . . . . . . . 750 327.50 41.56 257.75 279.43 288.48 304.39 329.13 354.05 367.19 376.75 391.47 80 years and over . . . . . . . . . . . 594 308.27 43.41 234.00 253.54 264.75 281.93 310.48 340.26 349.61 359.67 370.49
20 years and over (age-adjusted) . . 8,283 340.85 . . . . . . . . . . . . . . . . . . . . . . . . . . . . . .
Mexican American 8–11 years . . . . . . . . . . . . . . . . 471 251.85 37.75 197.07 208.21 217.03 225.83 249.47 273.70 292.34 301.81 318.44 12–15 years . . . . . . . . . . . . . . . 821 318.34 35.71 260.69 273.79 281.22 295.11 316.70 343.16 354.19 363.49 376.14 16–19 years . . . . . . . . . . . . . . . 692 324.49 36.85 268.66 280.52 288.06 299.15 322.29 346.04 361.07 369.20 391.36 20–29 years . . . . . . . . . . . . . . . 364 326.46 33.23 274.59 283.84 293.10 305.58 323.70 347.98 360.94 369.45 384.26 30–39 years . . . . . . . . . . . . . . . 298 325.01 31.12 277.98 287.86 294.48 301.88 323.18 342.98 355.67 363.83 376.83 40–49 years . . . . . . . . . . . . . . . 372 326.08 31.44 278.67 288.59 292.37 306.23 325.78 345.39 357.28 365.56 381.87 50–59 years . . . . . . . . . . . . . . . 194 319.12 37.75 256.91 272.20 283.03 295.10 319.75 341.34 353.63 364.02 386.54 60–69 years . . . . . . . . . . . . . . . 375 310.11 36.75 250.25 261.85 270.20 286.60 312.73 336.09 346.89 353.99 365.42 70–79 years . . . . . . . . . . . . . . . 154 *296.83 41.95 *224.73 *241.44 *261.09 *273.81 *300.90 *322.17 *338.29 *345.65 *353.17 80 years and over . . . . . . . . . . . 47 *274.45 51.17 † *187.86 *220.30 *238.99 *284.73 *307.19 *325.89 *337.07 *345.57
20 years and over (age-adjusted) . . 1,804 318.38 . . . . . . . . . . . . . . . . . . . . . . . . . . . . . .
Non-Hispanic white 8–11 years . . . . . . . . . . . . . . . . 383 252.16 38.34 193.26 206.08 213.77 226.58 249.85 275.74 290.76 303.88 318.46 12–15 years . . . . . . . . . . . . . . . 576 322.17 38.23 259.23 273.20 282.18 296.01 322.24 348.73 361.11 370.71 382.96 16–19 years . . . . . . . . . . . . . . . 543 342.89 37.99 284.92 298.78 308.60 319.78 341.46 364.72 377.19 385.71 401.32 20–29 years . . . . . . . . . . . . . . . 583 345.70 34.10 288.16 302.67 310.52 321.75 346.36 367.09 379.35 388.67 400.80 30–39 years . . . . . . . . . . . . . . . 612 346.56 32.97 295.65 307.18 313.14 324.56 343.64 368.63 379.30 389.91 406.02 40–49 years . . . . . . . . . . . . . . . 668 348.80 34.75 292.57 305.75 313.44 326.00 349.24 370.67 383.72 393.33 407.44 50–59 years . . . . . . . . . . . . . . . 639 343.20 33.34 292.17 302.94 309.06 320.47 343.70 364.37 376.30 384.86 397.26 60–69 years . . . . . . . . . . . . . . . 644 342.68 35.92 285.03 298.41 307.56 318.22 343.29 367.02 377.88 386.91 398.08 70–79 years . . . . . . . . . . . . . . . 429 329.70 40.38 266.09 284.41 294.53 310.04 330.69 354.70 367.86 376.63 390.94 80 years and over . . . . . . . . . . . 457 310.20 41.17 242.53 258.34 272.63 284.34 310.88 340.98 349.70 359.74 368.85
20 years and over (age-adjusted) . . 4,032 342.87 . . . . . . . . . . . . . . . . . . . . . . . . . . . . . .
Non-Hispanic black 8–11 years . . . . . . . . . . . . . . . . 490 271.40 44.44 209.85 222.71 230.62 240.49 264.40 299.41 322.70 334.94 349.35 12–15 years . . . . . . . . . . . . . . . 737 345.48 39.52 286.46 298.09 307.09 316.43 343.59 370.69 385.87 396.51 412.57 16–19 years . . . . . . . . . . . . . . . 609 356.33 43.66 294.42 307.42 315.80 328.39 352.33 379.92 396.37 407.20 428.70 20–29 years . . . . . . . . . . . . . . . 297 357.99 37.85 299.78 315.80 321.93 331.65 354.78 378.94 396.45 406.83 425.17 30–39 years . . . . . . . . . . . . . . . 333 364.28 37.59 305.96 317.94 326.06 336.99 361.93 388.03 403.91 412.89 434.20 40–49 years . . . . . . . . . . . . . . . 398 361.51 34.22 312.01 320.92 326.39 336.66 358.70 383.02 396.47 406.01 419.95 50–59 years . . . . . . . . . . . . . . . 250 355.93 36.86 293.80 304.63 318.64 331.48 354.65 380.64 392.02 399.43 417.76 60–69 years . . . . . . . . . . . . . . . 306 359.02 37.45 291.11 312.81 320.72 333.13 360.10 383.28 398.24 405.44 418.30 70–79 years . . . . . . . . . . . . . . . 124 341.45 45.22 258.82 285.47 297.58 317.02 343.05 368.88 387.16 397.50 412.71 80 years and over . . . . . . . . . . . 58 *326.70 41.28 *247.94 *266.67 *282.39 *302.54 *326.96 *349.58 *362.71 *376.16 *390.92
20 years and over (age-adjusted) . . 1,766 357.05 . . . . . . . . . . . . . . . . . . . . . . . . . . . . . .
. . . Category not applicable.
* Figure does not meet standards of reliability or precision; relative standard error (standard error divided by estimate times 100) is 30%–39% or estimate is based on less than 12 degrees of freedom.
† Standard error not calculated by SUDAAN software.
NOTE: cm2 is centimeter squared.
SOURCE: National Health and Nutrition Examination Survey, 1999–2006.

Series 11, No. 253 [ Page 57
Table 26. Right leg bone mineral content (g) of persons aged 8 years and over, by sex, race and ethnicity, and age: United States, 1999–2006
Percentile Sample Standard
Sex, race and ethnicity, and age size Mean deviation 5th 10th 15th 25th 50th 75th 85th 90th 95th
Male
All races and ethnicities 8–11 years . . . . . . . . . . . . . . . . 1,421 218.85 58.29 143.09 156.40 164.03 179.24 207.50 250.17 277.44 298.62 333.98 12–15 years . . . . . . . . . . . . . . . 2,264 394.79 110.22 232.78 253.07 273.35 309.38 387.85 472.76 515.71 541.80 575.88 16–19 years . . . . . . . . . . . . . . . 2,309 527.41 99.42 375.29 404.83 426.30 459.00 518.95 593.54 634.03 659.15 696.79 20–29 years . . . . . . . . . . . . . . . 1,530 551.91 106.42 397.42 429.59 447.44 479.17 541.46 610.79 653.93 686.54 736.72 30–39 years . . . . . . . . . . . . . . . 1,450 544.97 103.54 398.84 421.11 439.62 472.81 536.54 606.48 644.97 677.49 726.24 40–49 years . . . . . . . . . . . . . . . 1,549 547.18 91.22 406.73 435.43 456.58 484.66 544.39 600.80 636.62 665.72 705.30 50–59 years . . . . . . . . . . . . . . . 1,187 533.04 94.34 385.27 420.36 441.89 469.39 528.75 586.00 627.28 657.59 694.84 60–69 years . . . . . . . . . . . . . . . 1,350 525.15 95.40 376.71 410.20 430.14 462.90 520.87 583.59 619.62 646.86 686.06 70–79 years . . . . . . . . . . . . . . . 825 497.58 91.32 353.55 386.67 405.74 434.08 499.10 558.44 587.48 609.02 646.96 80 years and over . . . . . . . . . . . 501 467.26 90.77 330.77 358.29 374.83 408.04 456.79 520.33 559.46 590.24 626.00
20 years and over (age-adjusted) . . 8,392 535.29 . . . . . . . . . . . . . . . . . . . . . . . . . . . . . .
Mexican American 8–11 years . . . . . . . . . . . . . . . . 468 222.87 61.81 144.87 154.54 163.39 180.47 208.61 255.31 287.38 318.30 343.67 12–15 years . . . . . . . . . . . . . . . 777 389.90 106.79 225.01 251.26 274.52 313.61 385.87 451.19 500.23 534.91 579.87 16–19 years . . . . . . . . . . . . . . . 783 491.87 94.19 357.47 383.49 400.80 428.18 483.04 539.63 589.94 616.06 659.64 20–29 years . . . . . . . . . . . . . . . 444 495.76 89.47 372.22 391.85 405.61 433.43 484.52 550.60 588.64 616.99 645.07 30–39 years . . . . . . . . . . . . . . . 337 480.69 76.90 360.75 390.06 406.78 429.58 480.08 525.02 544.67 574.15 614.95 40–49 years . . . . . . . . . . . . . . . 381 481.00 80.98 359.59 389.80 407.70 430.87 473.03 526.90 559.58 583.01 624.25 50–59 years . . . . . . . . . . . . . . . 174 476.54 76.70 361.62 372.17 387.27 408.36 478.98 532.68 549.44 571.18 594.31 60–69 years . . . . . . . . . . . . . . . 348 470.52 72.99 355.06 382.33 396.07 414.06 466.42 517.79 547.53 569.33 603.84 70–79 years . . . . . . . . . . . . . . . 164 *438.26 78.75 *310.26 *345.84 *365.85 *387.15 *443.66 *491.93 *513.04 *526.86 *556.52 80 years and over . . . . . . . . . . . 48 *419.86 81.66 *294.02 *327.17 *331.35 *366.17 *421.66 *445.17 *479.35 *540.42 †
20 years and over (age-adjusted) . . 1,896 475.50 . . . . . . . . . . . . . . . . . . . . . . . . . . . . . .
Non-Hispanic white 8–11 years . . . . . . . . . . . . . . . . 369 212.32 54.41 140.08 153.96 161.52 176.74 202.09 241.52 265.95 284.26 317.02 12–15 years . . . . . . . . . . . . . . . 578 391.32 109.76 231.38 249.59 266.43 302.96 384.06 469.89 514.63 537.95 571.89 16–19 years . . . . . . . . . . . . . . . 591 526.71 92.23 375.99 407.90 429.31 463.90 522.98 592.75 624.99 648.31 682.61 20–29 years . . . . . . . . . . . . . . . 617 554.82 98.45 409.78 440.82 455.60 492.87 543.34 604.57 650.44 678.94 726.20 30–39 years . . . . . . . . . . . . . . . 647 553.00 98.11 404.57 436.02 455.24 485.59 546.38 612.91 646.07 677.73 721.19 40–49 years . . . . . . . . . . . . . . . 700 554.99 85.23 424.49 454.95 469.33 498.63 550.36 603.92 637.32 668.45 707.69 50–59 years . . . . . . . . . . . . . . . 683 537.34 90.60 402.04 431.30 452.05 476.08 535.61 586.32 624.72 658.55 693.97 60–69 years . . . . . . . . . . . . . . . 623 531.49 92.39 391.57 420.11 440.74 469.24 526.03 586.11 623.07 649.39 687.85 70–79 years . . . . . . . . . . . . . . . 496 504.63 90.10 365.69 393.96 415.63 439.86 504.62 566.76 590.65 614.71 654.04 80 years and over . . . . . . . . . . . 398 468.42 87.60 335.91 362.98 379.94 411.78 457.98 522.56 557.93 584.86 620.53
20 years and over (age-adjusted) . . 4,164 541.18 . . . . . . . . . . . . . . . . . . . . . . . . . . . . . .
Non-Hispanic black 8–11 years . . . . . . . . . . . . . . . . 469 246.73 64.71 161.39 172.27 182.72 201.86 235.87 276.08 305.90 332.99 370.04 12–15 years . . . . . . . . . . . . . . . 745 435.13 114.98 259.88 285.63 310.33 345.99 431.82 507.90 549.21 578.02 614.79 16–19 years . . . . . . . . . . . . . . . 757 582.40 114.15 421.12 452.02 470.99 501.41 574.31 648.80 696.57 723.58 772.28 20–29 years . . . . . . . . . . . . . . . 325 627.32 118.53 454.22 495.94 518.34 550.06 609.96 690.21 730.51 772.01 835.90 30–39 years . . . . . . . . . . . . . . . 310 614.05 116.22 451.29 473.47 490.71 535.83 604.26 674.83 725.78 760.72 819.71 40–49 years . . . . . . . . . . . . . . . 366 581.64 101.70 424.52 451.12 481.57 520.16 577.32 639.53 676.69 704.92 767.56 50–59 years . . . . . . . . . . . . . . . 240 578.17 104.33 424.27 453.33 471.12 501.72 572.86 643.98 675.76 701.46 755.95 60–69 years . . . . . . . . . . . . . . . 303 558.59 89.54 421.49 452.16 471.90 498.26 556.04 611.65 644.22 669.73 704.45 70–79 years . . . . . . . . . . . . . . . 114 502.75 93.95 332.06 391.75 409.01 440.23 512.75 557.45 592.86 615.12 645.58 80 years and over . . . . . . . . . . . 36 *502.58 113.67 † *367.18 *382.90 *410.84 *490.43 *575.07 *639.23 *648.03 †
20 years and over (age-adjusted) . . 1,694 583.83 . . . . . . . . . . . . . . . . . . . . . . . . . . . . . .
See footnotes at end of table.

Page 58 [ Series 11, No. 253
Table 26. Right leg bone mineral content (g) of persons aged 8 years and over, by sex, race and ethnicity, and age: United States, 1999–2006—Con.
Percentile Sample Standard
Sex, race and ethnicity, and age size Mean deviation 5th 10th 15th 25th 50th 75th 85th 90th 95th
Female
All races and ethnicities 8–11 years . . . . . . . . . . . . . . . . 1,465 227.95 63.91 139.42 154.22 163.08 179.74 217.65 267.12 294.25 319.63 346.86 12–15 years . . . . . . . . . . . . . . . 2,318 355.10 69.91 243.56 270.81 284.18 305.90 352.50 401.31 428.62 444.25 475.99 16–19 years . . . . . . . . . . . . . . . 2,027 392.70 70.07 283.79 306.23 322.91 346.57 387.23 432.85 461.23 480.04 523.01 20–29 years . . . . . . . . . . . . . . . 1,378 399.31 66.23 295.50 319.56 330.72 353.39 396.04 440.60 465.06 483.91 514.14 30–39 years . . . . . . . . . . . . . . . 1,372 402.04 64.58 304.76 325.75 335.49 357.71 396.82 441.71 469.13 484.08 519.24 40–49 years . . . . . . . . . . . . . . . 1,570 403.35 65.16 304.88 323.25 337.91 358.69 401.57 442.95 466.63 486.97 515.60 50–59 years . . . . . . . . . . . . . . . 1,200 383.99 65.41 283.50 305.01 318.12 339.99 381.36 424.08 447.03 472.80 497.99 60–69 years . . . . . . . . . . . . . . . 1,419 365.67 66.34 261.13 285.66 297.32 319.11 365.48 409.11 434.00 448.01 471.82 70–79 years . . . . . . . . . . . . . . . 750 327.79 67.03 220.41 246.58 264.40 285.65 325.47 370.59 394.94 411.99 435.44 80 years and over . . . . . . . . . . . 594 287.05 67.26 180.55 199.21 216.17 240.83 286.93 330.85 360.30 373.29 394.48
20 years and over (age-adjusted) . . 8,283 383.78 . . . . . . . . . . . . . . . . . . . . . . . . . . . . . .
Mexican American 8–11 years . . . . . . . . . . . . . . . . 471 222.45 62.66 137.70 149.79 158.37 174.71 212.45 261.73 286.09 308.24 340.10 12–15 years . . . . . . . . . . . . . . . 821 346.52 64.30 244.85 268.60 282.14 303.58 343.75 388.29 407.42 426.09 455.53 16–19 years . . . . . . . . . . . . . . . 692 365.81 66.01 269.48 287.36 298.83 320.98 361.74 402.98 429.11 446.28 477.24 20–29 years . . . . . . . . . . . . . . . 364 370.46 60.49 275.70 297.99 307.94 328.17 365.87 407.22 434.93 450.97 479.06 30–39 years . . . . . . . . . . . . . . . 298 369.40 57.04 284.04 299.98 312.58 327.47 364.27 402.29 431.23 442.98 473.72 40–49 years . . . . . . . . . . . . . . . 372 371.94 55.50 287.44 303.95 319.17 337.09 368.73 404.26 431.57 445.09 468.48 50–59 years . . . . . . . . . . . . . . . 194 348.98 70.24 238.43 261.46 278.12 301.55 343.30 393.99 423.44 438.15 454.91 60–69 years . . . . . . . . . . . . . . . 375 316.01 60.90 212.66 236.02 249.30 273.76 316.62 363.20 381.12 392.92 409.02 70–79 years . . . . . . . . . . . . . . . 154 *282.81 60.99 *177.04 *209.27 *226.92 *248.81 *283.04 *321.52 *345.33 *355.06 *372.94 80 years and over . . . . . . . . . . . 47 *245.24 69.40 † *156.68 *170.82 *195.46 *243.31 *293.63 *317.02 *327.00 †
20 years and over (age-adjusted) . . 1,804 348.55 . . . . . . . . . . . . . . . . . . . . . . . . . . . . . .
Non-Hispanic white 8–11 years . . . . . . . . . . . . . . . . 383 222.63 59.92 138.37 152.87 160.74 176.16 214.29 261.82 289.38 306.08 331.51 12–15 years . . . . . . . . . . . . . . . 576 349.68 67.05 242.05 269.28 279.08 301.06 348.90 395.85 418.27 436.83 458.77 16–19 years . . . . . . . . . . . . . . . 543 395.45 65.29 289.62 315.23 330.56 354.16 392.81 432.12 458.79 476.77 520.84 20–29 years . . . . . . . . . . . . . . . 583 401.74 61.56 300.59 324.40 336.81 357.99 399.49 440.48 464.63 480.06 506.76 30–39 years . . . . . . . . . . . . . . . 612 403.50 60.85 311.04 332.12 339.48 361.39 398.53 439.85 466.24 480.63 509.84 40–49 years . . . . . . . . . . . . . . . 668 404.86 63.27 308.22 325.47 340.79 362.41 403.07 444.33 466.18 485.63 514.74 50–59 years . . . . . . . . . . . . . . . 639 387.40 60.15 297.37 314.55 326.39 346.03 384.65 423.60 444.99 470.46 495.16 60–69 years . . . . . . . . . . . . . . . 644 368.10 63.12 267.84 291.26 302.03 323.96 367.13 408.95 433.08 444.47 466.75 70–79 years . . . . . . . . . . . . . . . 429 329.89 65.95 220.10 251.37 268.30 289.05 327.97 371.50 394.33 410.45 434.01 80 years and over . . . . . . . . . . . 457 289.03 65.07 183.48 207.40 221.27 245.44 287.67 332.10 359.87 372.55 392.26
20 years and over (age-adjusted) . . 4,032 385.91 . . . . . . . . . . . . . . . . . . . . . . . . . . . . . .
Non-Hispanic black 8–11 years . . . . . . . . . . . . . . . . 490 256.05 72.63 163.24 175.55 186.42 200.97 242.83 303.63 337.42 360.82 386.17 12–15 years . . . . . . . . . . . . . . . 737 401.03 72.05 295.83 315.08 327.15 351.01 392.96 448.55 477.85 499.57 523.10 16–19 years . . . . . . . . . . . . . . . 609 432.86 77.79 321.34 343.44 354.91 378.30 427.97 477.48 507.81 533.75 568.30 20–29 years . . . . . . . . . . . . . . . 297 437.18 71.61 329.02 352.02 366.69 388.19 428.79 476.76 517.65 534.25 562.11 30–39 years . . . . . . . . . . . . . . . 333 441.03 68.65 333.16 348.93 367.30 393.56 436.43 483.51 516.25 530.82 552.27 40–49 years . . . . . . . . . . . . . . . 398 437.74 64.62 346.56 358.42 367.42 389.31 434.00 478.98 503.01 520.45 551.54 50–59 years . . . . . . . . . . . . . . . 250 412.24 67.53 307.86 329.05 342.37 365.68 407.02 454.74 485.68 501.43 532.57 60–69 years . . . . . . . . . . . . . . . 306 400.17 68.00 284.90 310.98 329.79 360.28 399.69 441.50 464.32 484.29 512.90 70–79 years . . . . . . . . . . . . . . . 124 354.48 74.10 223.82 253.83 279.49 302.71 351.86 405.12 425.61 438.98 † 80 years and over . . . . . . . . . . . 58 *312.67 73.14 *196.13 *214.97 *233.48 *262.90 *303.57 *363.17 *389.27 *421.97 *441.93
20 years and over (age-adjusted) . . 1,766 417.80 . . . . . . . . . . . . . . . . . . . . . . . . . . . . . .
. . . Category not applicable. * Figure does not meet standards of reliability or precision; relative standard error (standard error divided by estimate times 100) is 30%–39% or estimate is based on less than 12 degrees of freedom. † Standard error not calculated by SUDAAN software.
NOTE: g is grams.
SOURCE: National Health and Nutrition Examination Survey, 1999–2006.

Series 11, No. 253 [ Page 59
Table 27. Right leg bone mineral density (g/cm2) of persons aged 8 years and over, by sex, race and ethnicity, and age: United States, 1999–2006
Percentile Sample Standard
Sex, race and ethnicity, and age size Mean deviation 5th 10th 15th 25th 50th 75th 85th 90th 95th
Male
All races and ethnicities 8–11 years . . . . . . . . . . . . . . . . 1,421 0.866 0.105 0.699 0.732 0.754 0.792 0.866 0.933 0.969 1.003 1.044 12–15 years . . . . . . . . . . . . . . . 2,264 1.099 0.147 0.870 0.909 0.942 0.993 1.093 1.196 1.257 1.291 1.342 16–19 years . . . . . . . . . . . . . . . 2,309 1.293 0.136 1.080 1.121 1.156 1.199 1.289 1.379 1.430 1.464 1.517 20–29 years . . . . . . . . . . . . . . . 1,530 1.336 0.139 1.125 1.164 1.198 1.240 1.328 1.416 1.477 1.517 1.578 30–39 years . . . . . . . . . . . . . . . 1,450 1.325 0.134 1.127 1.162 1.189 1.231 1.311 1.407 1.466 1.505 1.568 40–49 years . . . . . . . . . . . . . . . 1,549 1.316 0.125 1.119 1.167 1.189 1.232 1.319 1.392 1.436 1.467 1.524 50–59 years . . . . . . . . . . . . . . . 1,187 1.293 0.133 1.075 1.127 1.162 1.204 1.289 1.372 1.420 1.467 1.514 60–69 years . . . . . . . . . . . . . . . 1,350 1.279 0.136 1.068 1.112 1.143 1.188 1.274 1.360 1.415 1.460 1.510 70–79 years . . . . . . . . . . . . . . . 825 1.235 0.134 1.026 1.069 1.094 1.145 1.234 1.318 1.368 1.407 1.467 80 years and over . . . . . . . . . . . 501 1.202 0.143 0.982 1.026 1.056 1.105 1.199 1.293 1.341 1.377 1.431
20 years and over (age-adjusted) . . 8,392 1.302 . . . . . . . . . . . . . . . . . . . . . . . . . . . . . .
Mexican American 8–11 years . . . . . . . . . . . . . . . . 468 0.868 0.114 0.695 0.724 0.742 0.783 0.865 0.943 0.990 1.021 1.075 12–15 years . . . . . . . . . . . . . . . 777 1.101 0.149 0.868 0.919 0.942 0.996 1.091 1.184 1.255 1.303 1.362 16–19 years . . . . . . . . . . . . . . . 783 1.257 0.126 1.058 1.098 1.126 1.170 1.251 1.334 1.376 1.426 1.483 20–29 years . . . . . . . . . . . . . . . 444 1.285 0.121 1.101 1.134 1.159 1.198 1.276 1.363 1.411 1.442 1.511 30–39 years . . . . . . . . . . . . . . . 337 1.271 0.113 1.085 1.131 1.156 1.191 1.269 1.343 1.386 1.408 1.445 40–49 years . . . . . . . . . . . . . . . 381 1.256 0.117 1.072 1.105 1.129 1.181 1.250 1.333 1.368 1.415 1.445 50–59 years . . . . . . . . . . . . . . . 174 1.249 0.127 1.047 1.074 1.103 1.140 1.272 1.342 1.379 1.402 1.421 60–69 years . . . . . . . . . . . . . . . 348 1.232 0.115 1.044 1.087 1.109 1.151 1.227 1.303 1.353 1.389 1.418 70–79 years . . . . . . . . . . . . . . . 164 *1.187 0.124 *0.983 *1.022 *1.058 *1.110 *1.195 *1.279 *1.309 *1.329 *1.360 80 years and over . . . . . . . . . . . 48 *1.157 0.129 *0.974 *1.002 *1.036 *1.079 *1.119 *1.213 *1.258 *1.302 †
20 years and over (age-adjusted) . . 1,896 1.251 . . . . . . . . . . . . . . . . . . . . . . . . . . . . . .
Non-Hispanic white 8–11 years . . . . . . . . . . . . . . . . 369 0.857 0.099 0.695 0.733 0.752 0.786 0.853 0.921 0.953 0.977 1.031 12–15 years . . . . . . . . . . . . . . . 578 1.089 0.143 0.868 0.905 0.939 0.982 1.080 1.185 1.248 1.280 1.326 16–19 years . . . . . . . . . . . . . . . 591 1.288 0.130 1.072 1.120 1.163 1.202 1.287 1.371 1.420 1.446 1.496 20–29 years . . . . . . . . . . . . . . . 617 1.333 0.131 1.131 1.173 1.208 1.246 1.328 1.409 1.459 1.501 1.554 30–39 years . . . . . . . . . . . . . . . 647 1.329 0.132 1.132 1.164 1.196 1.238 1.319 1.411 1.468 1.505 1.565 40–49 years . . . . . . . . . . . . . . . 700 1.322 0.119 1.134 1.180 1.199 1.242 1.325 1.394 1.434 1.463 1.523 50–59 years . . . . . . . . . . . . . . . 683 1.294 0.129 1.089 1.135 1.168 1.209 1.291 1.370 1.414 1.465 1.506 60–69 years . . . . . . . . . . . . . . . 623 1.282 0.134 1.083 1.120 1.151 1.191 1.277 1.361 1.413 1.459 1.508 70–79 years . . . . . . . . . . . . . . . 496 1.242 0.134 1.030 1.076 1.101 1.150 1.238 1.326 1.377 1.416 1.474 80 years and over . . . . . . . . . . . 398 1.203 0.140 0.995 1.031 1.063 1.106 1.203 1.289 1.338 1.376 1.428
20 years and over (age-adjusted) . . 4,164 1.305 . . . . . . . . . . . . . . . . . . . . . . . . . . . . . .
Non-Hispanic black 8–11 years . . . . . . . . . . . . . . . . 469 0.916 0.109 0.733 0.771 0.800 0.846 0.920 0.995 1.022 1.045 1.083 12–15 years . . . . . . . . . . . . . . . 745 1.158 0.156 0.917 0.954 0.996 1.044 1.149 1.260 1.317 1.351 1.416 16–19 years . . . . . . . . . . . . . . . 757 1.368 0.144 1.128 1.190 1.221 1.267 1.363 1.461 1.514 1.551 1.603 20–29 years . . . . . . . . . . . . . . . 325 1.434 0.148 1.199 1.261 1.288 1.336 1.420 1.516 1.590 1.628 1.690 30–39 years . . . . . . . . . . . . . . . 310 1.409 0.141 1.190 1.217 1.261 1.305 1.412 1.500 1.551 1.580 1.643 40–49 years . . . . . . . . . . . . . . . 366 1.358 0.145 1.130 1.180 1.216 1.262 1.353 1.444 1.496 1.538 1.605 50–59 years . . . . . . . . . . . . . . . 240 1.356 0.144 1.122 1.169 1.207 1.254 1.348 1.451 1.502 1.540 1.589 60–69 years . . . . . . . . . . . . . . . 303 1.330 0.135 1.101 1.164 1.193 1.240 1.326 1.425 1.465 1.487 1.543 70–79 years . . . . . . . . . . . . . . . 114 1.243 0.139 0.983 1.085 1.123 1.153 1.238 1.330 1.383 1.413 1.467 80 years and over . . . . . . . . . . . 36 *1.248 0.174 † † *1.044 *1.108 *1.239 *1.341 *1.406 *1.438 †
20 years and over (age-adjusted) . . 1,694 1.365 . . . . . . . . . . . . . . . . . . . . . . . . . . . . . .
See footnotes at end of table.

Page 60 [ Series 11, No. 253
Table 27. Right leg bone mineral density (g/cm2) of persons aged 8 years and over, by sex, race and ethnicity, and age: United States, 1999–2006—Con.
Percentile Sample Standard
Sex, race and ethnicity, and age size Mean deviation 5th 10th 15th 25th 50th 75th 85th 90th 95th
Female
All races and ethnicities 8–11 years . . . . . . . . . . . . . . . . 1,465 0.878 0.122 0.681 0.718 0.749 0.788 0.875 0.960 1.011 1.042 1.083 12–15 years . . . . . . . . . . . . . . . 2,318 1.087 0.109 0.901 0.954 0.980 1.013 1.085 1.158 1.199 1.229 1.266 16–19 years . . . . . . . . . . . . . . . 2,027 1.147 0.111 0.967 1.008 1.037 1.076 1.141 1.211 1.259 1.290 1.341 20–29 years . . . . . . . . . . . . . . . 1,378 1.159 0.107 0.983 1.027 1.054 1.089 1.153 1.224 1.267 1.297 1.348 30–39 years . . . . . . . . . . . . . . . 1,372 1.160 0.104 0.999 1.032 1.055 1.086 1.155 1.228 1.267 1.289 1.326 40–49 years . . . . . . . . . . . . . . . 1,570 1.158 0.103 0.998 1.032 1.053 1.088 1.153 1.222 1.264 1.293 1.337 50–59 years . . . . . . . . . . . . . . . 1,200 1.120 0.110 0.942 0.986 1.008 1.046 1.120 1.187 1.228 1.261 1.299 60–69 years . . . . . . . . . . . . . . . 1,419 1.068 0.111 0.877 0.922 0.953 0.996 1.067 1.143 1.184 1.208 1.251 70–79 years . . . . . . . . . . . . . . . 750 0.993 0.113 0.800 0.849 0.875 0.916 0.988 1.072 1.113 1.140 1.173 80 years and over . . . . . . . . . . . 594 0.921 0.116 0.736 0.776 0.800 0.836 0.916 1.003 1.045 1.074 1.119
20 years and over (age-adjusted) . . 8,283 1.119 . . . . . . . . . . . . . . . . . . . . . . . . . . . . . .
Mexican American 8–11 years . . . . . . . . . . . . . . . . 471 0.869 0.129 0.666 0.698 0.725 0.770 0.865 0.958 1.004 1.038 1.089 12–15 years . . . . . . . . . . . . . . . 821 1.081 0.105 0.908 0.944 0.973 1.016 1.085 1.145 1.186 1.209 1.248 16–19 years . . . . . . . . . . . . . . . 692 1.121 0.106 0.957 0.989 1.013 1.051 1.111 1.186 1.227 1.247 1.298 20–29 years . . . . . . . . . . . . . . . 364 1.130 0.105 0.971 0.996 1.023 1.053 1.120 1.197 1.253 1.275 1.319 30–39 years . . . . . . . . . . . . . . . 298 1.133 0.106 0.970 1.005 1.033 1.063 1.119 1.197 1.240 1.274 1.322 40–49 years . . . . . . . . . . . . . . . 372 1.137 0.094 0.976 1.018 1.043 1.069 1.141 1.201 1.226 1.247 1.301 50–59 years . . . . . . . . . . . . . . . 194 1.085 0.125 0.871 0.928 0.962 1.011 1.092 1.154 1.199 1.227 1.276 60–69 years . . . . . . . . . . . . . . . 375 1.012 0.111 0.823 0.863 0.888 0.936 1.018 1.090 1.123 1.150 1.190 70–79 years . . . . . . . . . . . . . . . 154 *0.944 0.113 *0.755 *0.813 *0.838 *0.867 *0.943 *1.007 *1.056 *1.086 *1.134 80 years and over . . . . . . . . . . . 47 *0.878 0.116 † *0.714 *0.748 *0.785 *0.864 *0.945 *1.009 *1.051 †
20 years and over (age-adjusted) . . 1,804 1.086 . . . . . . . . . . . . . . . . . . . . . . . . . . . . . .
Non-Hispanic white 8–11 years . . . . . . . . . . . . . . . . 383 0.870 0.117 0.678 0.716 0.746 0.783 0.866 0.950 0.998 1.020 1.070 12–15 years . . . . . . . . . . . . . . . 576 1.077 0.106 0.894 0.950 0.975 1.003 1.077 1.147 1.188 1.215 1.245 16–19 years . . . . . . . . . . . . . . . 543 1.149 0.105 0.981 1.015 1.044 1.080 1.143 1.207 1.255 1.286 1.336 20–29 years . . . . . . . . . . . . . . . 583 1.158 0.100 0.984 1.035 1.061 1.093 1.152 1.218 1.258 1.281 1.338 30–39 years . . . . . . . . . . . . . . . 612 1.160 0.099 1.003 1.040 1.060 1.089 1.157 1.228 1.264 1.285 1.313 40–49 years . . . . . . . . . . . . . . . 668 1.156 0.102 0.998 1.032 1.053 1.090 1.150 1.218 1.260 1.289 1.331 50–59 years . . . . . . . . . . . . . . . 639 1.125 0.102 0.962 0.997 1.014 1.055 1.125 1.188 1.227 1.255 1.294 60–69 years . . . . . . . . . . . . . . . 644 1.069 0.108 0.883 0.926 0.958 0.999 1.068 1.140 1.182 1.205 1.247 70–79 years . . . . . . . . . . . . . . . 429 0.993 0.113 0.799 0.848 0.873 0.915 0.988 1.074 1.113 1.140 1.168 80 years and over . . . . . . . . . . . 457 0.922 0.114 0.736 0.779 0.800 0.839 0.916 1.003 1.043 1.071 1.117
20 years and over (age-adjusted) . . 4,032 1.119 . . . . . . . . . . . . . . . . . . . . . . . . . . . . . .
Non-Hispanic black 8–11 years . . . . . . . . . . . . . . . . 490 0.928 0.126 0.732 0.772 0.792 0.839 0.921 1.016 1.062 1.099 1.139 12–15 years . . . . . . . . . . . . . . . 737 1.154 0.110 0.974 1.010 1.037 1.081 1.152 1.228 1.266 1.290 1.336 16–19 years . . . . . . . . . . . . . . . 609 1.209 0.114 1.029 1.061 1.086 1.129 1.211 1.283 1.329 1.355 1.395 20–29 years . . . . . . . . . . . . . . . 297 1.217 0.115 1.035 1.076 1.094 1.131 1.210 1.299 1.343 1.371 1.417 30–39 years . . . . . . . . . . . . . . . 333 1.207 0.109 1.032 1.069 1.089 1.131 1.207 1.275 1.316 1.339 1.394 40–49 years . . . . . . . . . . . . . . . 398 1.207 0.104 1.045 1.075 1.100 1.131 1.205 1.275 1.315 1.346 1.380 50–59 years . . . . . . . . . . . . . . . 250 1.154 0.115 0.958 1.010 1.033 1.075 1.155 1.223 1.271 1.304 1.349 60–69 years . . . . . . . . . . . . . . . 306 1.110 0.121 0.899 0.950 0.982 1.025 1.111 1.194 1.230 1.261 1.319 70–79 years . . . . . . . . . . . . . . . 124 1.030 0.117 0.819 0.898 0.923 0.947 1.036 1.115 1.147 1.175 1.214 80 years and over . . . . . . . . . . . 58 *0.948 0.135 *0.740 *0.769 *0.804 *0.848 *0.933 *1.051 *1.089 *1.113 *1.155
20 years and over (age-adjusted) . . 1,766 1.164 . . . . . . . . . . . . . . . . . . . . . . . . . . . . . .
. . . Category not applicable.
* Figure does not meet standards of reliability or precision; relative standard error (standard error divided by estimate times 100) is 30%–39% or estimate is based on less than 12 degrees of freedom.
† Standard error not calculated by SUDAAN software.
NOTE: g/cm2 is grams per centimeter squared.
SOURCE: National Health and Nutrition Examination Survey, 1999–2006.

Series 11, No. 253 [ Page 61
Table 28. Left leg bone area (cm2) of persons aged 8 years and over, by sex, race and ethnicity, and age: United States, 1999–2006
Percentile Sample Standard
Sex, race and ethnicity, and age size Mean deviation 5th 10th 15th 25th 50th 75th 85th 90th 95th
Male
All races and ethnicities 8–11 years . . . . . . . . . . . . . . . . 1,421 248.07 40.99 195.41 204.74 213.08 221.23 240.71 268.00 287.46 301.97 330.30 12–15 years . . . . . . . . . . . . . . . 2,264 353.33 60.72 257.75 272.03 286.80 307.68 352.76 397.76 417.22 429.71 448.19 16–19 years . . . . . . . . . . . . . . . 2,309 406.66 46.83 334.82 348.08 357.14 373.71 404.87 436.83 457.02 467.39 485.97 20–29 years . . . . . . . . . . . . . . . 1,530 412.46 47.25 337.79 355.42 364.71 381.22 410.60 440.24 458.57 470.71 491.36 30–39 years . . . . . . . . . . . . . . . 1,450 410.97 46.35 338.02 353.93 363.64 378.57 408.94 440.65 457.28 469.22 489.72 40–49 years . . . . . . . . . . . . . . . 1,549 416.82 41.47 349.24 365.00 375.96 389.23 415.98 443.81 460.55 469.39 486.03 50–59 years . . . . . . . . . . . . . . . 1,187 412.88 42.68 343.69 361.06 369.54 385.90 412.83 438.50 454.45 468.33 485.14 60–69 years . . . . . . . . . . . . . . . 1,350 412.09 43.11 340.94 356.62 367.85 384.66 413.83 440.69 455.57 465.78 481.84 70–79 years . . . . . . . . . . . . . . . 825 404.83 45.35 331.77 349.04 359.06 376.70 405.84 435.49 450.55 460.07 477.32 80 years and over . . . . . . . . . . . 501 392.54 42.38 319.56 340.38 350.59 367.18 392.61 418.41 434.21 445.03 459.33
20 years and over (age-adjusted) . . 8,392 411.55 . . . . . . . . . . . . . . . . . . . . . . . . . . . . . .
Mexican American 8–11 years . . . . . . . . . . . . . . . . 468 251.73 40.53 199.03 209.81 215.89 223.59 242.77 273.91 294.25 304.21 333.44 12–15 years . . . . . . . . . . . . . . . 777 348.26 56.97 251.79 270.31 286.10 308.38 349.44 385.68 407.73 420.82 441.85 16–19 years . . . . . . . . . . . . . . . 783 390.29 45.66 324.23 335.03 345.19 358.83 385.58 417.57 438.92 449.30 469.25 20–29 years . . . . . . . . . . . . . . . 444 385.31 43.14 317.63 332.74 340.22 355.36 382.92 412.23 428.43 439.28 457.58 30–39 years . . . . . . . . . . . . . . . 337 379.87 37.93 319.73 329.53 337.97 354.82 379.60 404.02 418.80 426.89 440.66 40–49 years . . . . . . . . . . . . . . . 381 383.79 38.92 323.43 339.88 347.83 359.63 380.44 405.80 422.37 430.95 452.98 50–59 years . . . . . . . . . . . . . . . 174 382.12 33.03 328.23 341.72 348.32 361.01 378.84 404.45 415.42 426.70 435.54 60–69 years . . . . . . . . . . . . . . . 348 385.50 36.69 324.55 337.38 347.84 360.91 384.71 409.92 422.06 435.65 446.58 70–79 years . . . . . . . . . . . . . . . 164 *371.59 41.43 *293.68 *327.50 *335.65 *349.07 *376.21 *396.17 *409.08 *414.56 *428.66 80 years and over . . . . . . . . . . . 48 *367.76 40.98 † *316.94 *328.73 *339.10 *367.45 *393.23 *401.38 *410.98 †
20 years and over (age-adjusted) . . 1,896 381.39 . . . . . . . . . . . . . . . . . . . . . . . . . . . . . .
Non-Hispanic white 8–11 years . . . . . . . . . . . . . . . . 369 243.49 39.90 192.08 201.82 208.64 218.95 235.69 264.65 281.73 296.26 324.21 12–15 years . . . . . . . . . . . . . . . 578 352.92 61.37 257.01 271.29 283.74 306.09 354.60 398.72 419.74 429.78 446.69 16–19 years . . . . . . . . . . . . . . . 591 407.55 44.86 335.97 349.64 359.15 376.01 406.93 437.28 455.71 465.69 483.85 20–29 years . . . . . . . . . . . . . . . 617 415.61 43.84 346.50 362.59 373.13 385.39 413.24 441.09 458.78 468.77 489.66 30–39 years . . . . . . . . . . . . . . . 647 415.87 43.55 345.28 362.77 371.37 385.77 415.64 443.28 457.43 469.28 489.27 40–49 years . . . . . . . . . . . . . . . 700 421.52 38.53 356.59 375.37 384.40 394.58 420.56 446.71 462.79 470.43 487.73 50–59 years . . . . . . . . . . . . . . . 683 416.50 41.26 351.04 367.07 376.61 391.30 416.58 440.70 456.30 469.52 485.65 60–69 years . . . . . . . . . . . . . . . 623 416.23 40.81 349.27 365.58 373.40 389.87 416.63 442.70 457.39 467.16 482.46 70–79 years . . . . . . . . . . . . . . . 496 408.37 44.30 336.82 353.30 361.39 380.70 408.95 438.19 452.51 463.06 481.44 80 years and over . . . . . . . . . . . 398 393.60 40.91 325.77 345.28 352.90 368.29 393.39 418.39 433.26 443.87 458.77
20 years and over (age-adjusted) . . 4,164 415.52 . . . . . . . . . . . . . . . . . . . . . . . . . . . . . .
Non-Hispanic black 8–11 years . . . . . . . . . . . . . . . . 469 266.33 42.99 208.05 218.61 227.05 237.55 258.72 285.73 311.42 327.39 350.64 12–15 years . . . . . . . . . . . . . . . 745 371.92 61.55 275.82 291.55 302.58 327.74 372.35 410.09 429.42 444.09 472.52 16–19 years . . . . . . . . . . . . . . . 757 425.10 51.14 348.22 362.09 373.77 389.10 423.17 454.30 475.74 489.02 513.04 20–29 years . . . . . . . . . . . . . . . 325 437.43 49.42 368.32 379.42 388.02 402.47 432.16 466.87 484.85 499.34 525.51 30–39 years . . . . . . . . . . . . . . . 310 435.88 49.20 361.41 375.03 385.36 400.91 429.75 464.78 485.20 500.23 522.74 40–49 years . . . . . . . . . . . . . . . 366 428.52 42.99 356.23 376.02 386.17 400.32 427.30 452.23 471.34 481.46 501.14 50–59 years . . . . . . . . . . . . . . . 240 425.60 44.55 362.31 372.12 377.78 390.68 422.34 455.65 473.64 483.16 501.29 60–69 years . . . . . . . . . . . . . . . 303 422.20 41.68 354.30 368.92 382.47 394.93 420.36 447.86 467.07 476.19 493.31 70–79 years . . . . . . . . . . . . . . . 114 408.56 47.12 319.70 355.74 362.87 377.07 412.67 438.42 450.14 458.95 472.71 80 years and over . . . . . . . . . . . 36 *403.57 51.38 † *320.89 *331.64 *378.68 *402.25 *435.15 *452.23 † †
20 years and over (age-adjusted) . . 1,694 427.81 . . . . . . . . . . . . . . . . . . . . . . . . . . . . . .
See footnotes at end of table.

Page 62 [ Series 11, No. 253
Table 28. Left leg bone area (cm2) of persons aged 8 years and over, by sex, race and ethnicity, and age: United States, 1999–2006—Con.
Percentile Sample Standard
Sex, race and ethnicity, and age size Mean deviation 5th 10th 15th 25th 50th 75th 85th 90th 95th
Female
All races and ethnicities 8–11 years . . . . . . . . . . . . . . . . 1,465 253.84 40.68 195.77 207.43 215.52 226.28 249.37 278.47 295.42 310.64 328.74 12–15 years . . . . . . . . . . . . . . . 2,318 322.53 39.02 259.09 272.06 282.19 297.07 322.39 349.22 362.02 371.11 385.01 16–19 years . . . . . . . . . . . . . . . 2,027 340.08 40.37 280.56 290.94 301.36 316.25 337.09 364.25 377.31 385.09 403.00 20–29 years . . . . . . . . . . . . . . . 1,378 341.95 35.90 283.38 295.76 304.96 316.60 341.81 366.31 378.70 387.07 401.99 30–39 years . . . . . . . . . . . . . . . 1,372 344.49 35.19 290.03 302.09 309.92 320.83 340.85 366.69 382.53 390.39 404.91 40–49 years . . . . . . . . . . . . . . . 1,570 346.11 35.45 290.32 301.99 310.75 321.64 345.88 369.59 381.28 390.14 406.41 50–59 years . . . . . . . . . . . . . . . 1,200 340.97 36.02 281.04 294.96 304.69 318.02 341.62 362.88 376.15 383.43 400.53 60–69 years . . . . . . . . . . . . . . . 1,419 340.53 37.50 279.82 292.89 300.72 315.55 341.15 364.87 378.45 386.56 400.79 70–79 years . . . . . . . . . . . . . . . 750 328.88 41.30 262.29 279.66 290.59 304.66 331.12 353.24 368.16 378.76 393.84 80 years and over . . . . . . . . . . . 594 309.03 44.28 234.69 253.02 263.00 285.21 310.84 340.12 352.52 360.07 375.28
20 years and over (age-adjusted) . . 8,283 340.47 . . . . . . . . . . . . . . . . . . . . . . . . . . . . . .
Mexican American 8–11 years . . . . . . . . . . . . . . . . 471 250.81 38.35 198.23 206.42 214.25 224.39 248.69 272.67 292.34 303.44 317.43 12–15 years . . . . . . . . . . . . . . . 821 316.52 35.74 258.57 271.03 280.41 292.30 316.42 339.64 350.11 358.82 374.25 16–19 years . . . . . . . . . . . . . . . 692 324.07 37.23 267.74 278.95 285.30 298.23 322.01 346.83 359.91 371.74 388.94 20–29 years . . . . . . . . . . . . . . . 364 326.14 32.80 270.70 283.98 295.55 306.13 323.74 346.42 359.75 369.87 380.21 30–39 years . . . . . . . . . . . . . . . 298 324.15 31.48 276.69 285.51 292.17 302.51 323.70 344.46 353.58 362.49 372.39 40–49 years . . . . . . . . . . . . . . . 372 326.05 31.08 276.94 287.97 294.78 305.40 324.81 345.33 354.17 365.25 380.83 50–59 years . . . . . . . . . . . . . . . 194 319.58 37.34 254.38 276.75 284.00 294.16 318.93 344.42 352.60 364.49 386.16 60–69 years . . . . . . . . . . . . . . . 375 311.08 36.97 253.29 262.24 271.09 288.05 312.76 338.36 346.05 354.05 364.81 70–79 years . . . . . . . . . . . . . . . 154 *298.86 41.23 *219.67 *250.60 *264.70 *278.23 *300.26 *325.33 *337.58 *344.86 *358.36 80 years and over . . . . . . . . . . . 47 *273.84 51.09 † *195.60 *215.09 *242.45 *287.86 *308.21 *326.55 *329.02 *337.50
20 years and over (age-adjusted) . . 1,804 318.44 . . . . . . . . . . . . . . . . . . . . . . . . . . . . . .
Non-Hispanic white 8–11 years . . . . . . . . . . . . . . . . 383 250.22 39.03 190.56 204.04 212.23 223.42 246.68 275.41 289.29 301.80 319.96 12–15 years . . . . . . . . . . . . . . . 576 320.36 38.15 256.49 269.99 279.42 295.06 321.50 347.46 359.30 368.63 378.69 16–19 years . . . . . . . . . . . . . . . 543 342.14 38.44 283.82 297.22 308.26 318.85 338.82 364.74 376.51 382.78 400.40 20–29 years . . . . . . . . . . . . . . . 583 344.27 33.96 288.54 301.35 309.42 320.86 344.69 367.22 378.75 387.28 400.81 30–39 years . . . . . . . . . . . . . . . 612 346.07 33.17 293.43 305.56 313.72 323.03 342.56 366.69 382.38 388.97 402.78 40–49 years . . . . . . . . . . . . . . . 668 348.09 34.45 292.68 306.42 312.66 324.84 348.08 370.47 382.02 389.52 406.84 50–59 years . . . . . . . . . . . . . . . 639 342.99 32.93 290.55 302.62 310.76 322.07 342.90 362.30 375.20 382.19 397.00 60–69 years . . . . . . . . . . . . . . . 644 342.76 35.01 287.79 297.00 305.82 319.01 342.48 365.19 378.21 384.72 399.27 70–79 years . . . . . . . . . . . . . . . 429 331.23 39.67 266.44 286.43 295.44 309.17 333.36 354.37 368.50 378.63 393.45 80 years and over . . . . . . . . . . . 457 311.14 42.05 241.57 257.38 269.53 288.88 311.21 341.03 353.07 359.87 374.12
20 years and over (age-adjusted) . . 4,032 342.50 . . . . . . . . . . . . . . . . . . . . . . . . . . . . . .
Non-Hispanic black 8–11 years . . . . . . . . . . . . . . . . 490 271.27 44.88 208.41 221.59 227.98 240.06 262.23 298.19 323.74 333.05 349.94 12–15 years . . . . . . . . . . . . . . . 737 344.88 39.65 285.54 296.86 305.90 318.11 342.54 369.31 385.52 395.86 412.25 16–19 years . . . . . . . . . . . . . . . 609 355.57 43.80 292.27 307.18 315.33 328.72 351.14 378.64 394.36 405.18 426.15 20–29 years . . . . . . . . . . . . . . . 297 356.77 36.52 299.02 313.07 321.34 331.25 353.65 378.15 394.73 408.41 421.42 30–39 years . . . . . . . . . . . . . . . 333 363.54 37.20 304.50 315.04 325.15 339.17 361.25 386.76 401.28 411.10 429.22 40–49 years . . . . . . . . . . . . . . . 398 360.88 34.46 310.50 317.99 325.50 337.59 357.69 381.83 395.87 403.40 421.57 50–59 years . . . . . . . . . . . . . . . 250 356.19 37.07 292.58 309.65 317.79 329.03 357.89 378.68 389.88 403.05 417.32 60–69 years . . . . . . . . . . . . . . . 306 358.06 38.07 296.78 310.24 320.22 332.60 358.45 384.24 397.37 406.07 413.74 70–79 years . . . . . . . . . . . . . . . 124 342.66 47.58 261.79 280.12 299.55 315.15 345.73 375.84 388.17 399.66 413.31 80 years and over . . . . . . . . . . . 58 *325.90 43.66 *243.18 *260.73 *277.62 *303.62 *326.27 *346.63 *364.50 *379.13 *397.98
20 years and over (age-adjusted) . . 1,766 356.53 . . . . . . . . . . . . . . . . . . . . . . . . . . . . . .
. . . Category not applicable.
* Figure does not meet standards of reliability or precision; relative standard error (standard error divided by estimate times 100) is 30%–39% or estimate is based on less than 12 degrees of freedom.
† Standard error not calculated by SUDAAN software.
NOTE: cm2 is centimeter squared.
SOURCE: National Health and Nutrition Examination Survey, 1999–2006.

Series 11, No. 253 [ Page 63
Table 29. Left leg bone mineral content (g) of persons aged 8 years and over, by sex, race and ethnicity, and age: United States, 1999–2006
Percentile Sample Standard
Sex, race and ethnicity, and age size Mean deviation 5th 10th 15th 25th 50th 75th 85th 90th 95th
Male
All races and ethnicities 8–11 years . . . . . . . . . . . . . . . . 1,421 215.77 58.07 139.72 154.04 162.01 175.59 204.22 246.69 273.14 291.76 330.42 12–15 years . . . . . . . . . . . . . . . 2,264 391.72 109.99 226.75 251.84 272.39 307.98 383.44 467.49 508.54 535.30 571.33 16–19 years . . . . . . . . . . . . . . . 2,309 525.71 99.48 375.60 402.00 423.27 456.81 516.51 592.79 627.41 651.20 687.98 20–29 years . . . . . . . . . . . . . . . 1,530 551.90 107.53 389.14 426.78 448.01 478.42 541.78 610.86 655.13 686.80 740.89 30–39 years . . . . . . . . . . . . . . . 1,450 545.07 104.61 393.82 422.25 440.67 470.47 536.34 608.53 650.07 678.42 729.36 40–49 years . . . . . . . . . . . . . . . 1,549 548.21 92.05 405.46 436.59 456.33 486.53 544.71 604.94 638.84 662.15 709.47 50–59 years . . . . . . . . . . . . . . . 1,187 534.04 94.83 388.99 420.75 441.43 470.33 528.60 588.02 624.71 658.99 700.79 60–69 years . . . . . . . . . . . . . . . 1,350 527.19 94.89 378.78 413.95 433.84 463.94 523.36 581.56 620.42 650.20 693.79 70–79 years . . . . . . . . . . . . . . . 825 500.45 93.02 353.63 384.41 406.30 436.88 500.63 558.62 590.83 621.63 655.30 80 years and over . . . . . . . . . . . 501 473.72 91.28 333.34 363.90 380.77 414.63 462.82 526.73 569.45 590.98 628.18
20 years and over (age-adjusted) . . 8,392 536.44 . . . . . . . . . . . . . . . . . . . . . . . . . . . . . .
Mexican American 8–11 years . . . . . . . . . . . . . . . . 468 220.38 61.35 143.22 153.00 159.84 178.21 208.41 256.30 286.99 312.52 342.45 12–15 years . . . . . . . . . . . . . . . 777 386.50 105.21 222.60 252.71 273.29 311.01 380.75 450.49 494.74 527.89 561.18 16–19 years . . . . . . . . . . . . . . . 783 489.20 92.88 355.24 379.73 396.31 428.10 480.27 543.95 580.07 613.84 648.71 20–29 years . . . . . . . . . . . . . . . 444 496.56 90.49 365.33 387.43 402.39 433.24 487.61 552.32 586.77 609.69 653.27 30–39 years . . . . . . . . . . . . . . . 337 479.90 78.20 357.54 391.11 405.31 428.63 476.40 523.09 550.40 575.07 604.34 40–49 years . . . . . . . . . . . . . . . 381 483.20 82.26 364.48 387.89 402.96 427.77 477.74 526.42 562.20 580.07 632.77 50–59 years . . . . . . . . . . . . . . . 174 476.97 73.59 366.93 379.15 396.96 415.92 477.13 531.45 553.23 569.07 596.17 60–69 years . . . . . . . . . . . . . . . 348 475.49 73.83 361.11 382.62 394.30 419.77 474.81 522.81 548.57 570.03 603.00 70–79 years . . . . . . . . . . . . . . . 164 *442.51 78.65 *304.33 *331.66 *370.64 *396.58 *448.50 *494.17 *511.44 *533.46 *563.31 80 years and over . . . . . . . . . . . 48 *423.57 74.35 *302.47 *331.71 *350.09 *371.37 *424.82 *439.56 *479.07 *543.82 †
20 years and over (age-adjusted) . . 1,896 477.05 . . . . . . . . . . . . . . . . . . . . . . . . . . . . . .
Non-Hispanic white 8–11 years . . . . . . . . . . . . . . . . 369 209.54 54.50 136.80 151.25 160.03 173.00 197.77 238.26 263.17 282.92 319.52 12–15 years . . . . . . . . . . . . . . . 578 387.99 109.06 226.44 248.50 268.20 301.62 381.50 463.73 506.05 531.39 565.71 16–19 years . . . . . . . . . . . . . . . 591 524.26 92.55 376.66 404.80 425.63 460.23 517.64 589.66 621.75 644.78 677.29 20–29 years . . . . . . . . . . . . . . . 617 554.27 99.46 406.71 440.52 459.41 491.57 545.49 607.45 645.26 679.44 728.16 30–39 years . . . . . . . . . . . . . . . 647 552.99 99.72 402.55 431.58 453.36 481.25 549.82 613.63 652.04 678.49 723.02 40–49 years . . . . . . . . . . . . . . . 700 555.73 85.86 423.99 452.31 470.37 499.05 549.42 606.77 640.11 663.95 711.81 50–59 years . . . . . . . . . . . . . . . 683 538.81 90.89 398.04 436.08 451.94 479.69 533.12 589.89 625.57 658.64 698.97 60–69 years . . . . . . . . . . . . . . . 623 533.21 91.48 397.52 425.08 441.86 470.39 528.43 583.58 622.01 654.78 695.57 70–79 years . . . . . . . . . . . . . . . 496 506.60 92.10 364.40 389.19 411.24 441.36 506.24 563.64 595.74 629.12 656.89 80 years and over . . . . . . . . . . . 398 474.63 88.27 339.72 368.55 387.61 417.07 464.72 527.51 568.85 588.85 623.38
20 years and over (age-adjusted) . . 4,164 542.09 . . . . . . . . . . . . . . . . . . . . . . . . . . . . . .
Non-Hispanic black 8–11 years . . . . . . . . . . . . . . . . 469 244.30 64.37 161.34 171.40 181.53 197.80 232.73 277.56 306.10 330.48 367.43 12–15 years . . . . . . . . . . . . . . . 745 433.27 115.80 257.26 285.26 310.52 344.60 433.36 506.19 549.36 574.51 617.70 16–19 years . . . . . . . . . . . . . . . 757 583.46 114.95 419.65 451.99 470.68 504.63 574.94 646.99 693.34 722.56 782.85 20–29 years . . . . . . . . . . . . . . . 325 629.54 118.99 463.98 499.64 519.51 549.02 613.28 685.55 738.15 784.37 842.16 30–39 years . . . . . . . . . . . . . . . 310 614.75 115.14 452.80 473.40 492.98 527.65 604.79 675.70 724.75 763.95 810.02 40–49 years . . . . . . . . . . . . . . . 366 583.75 105.82 418.24 457.13 481.09 518.20 574.18 645.03 676.60 703.81 776.77 50–59 years . . . . . . . . . . . . . . . 240 577.99 105.80 421.91 456.71 475.32 500.84 567.36 645.18 682.33 709.82 753.72 60–69 years . . . . . . . . . . . . . . . 303 559.47 90.19 414.22 453.60 471.06 503.11 559.31 610.07 649.45 662.04 709.08 70–79 years . . . . . . . . . . . . . . . 114 511.01 93.85 337.76 386.35 428.01 453.03 511.85 569.52 602.52 627.80 651.21 80 years and over . . . . . . . . . . . 36 *510.90 116.22 † *364.05 *383.37 *421.86 *496.39 *570.68 *627.64 *652.34 †
20 years and over (age-adjusted) . . 1,694 585.97 . . . . . . . . . . . . . . . . . . . . . . . . . . . . . .
See footnotes at end of table.

Page 64 [ Series 11, No. 253
Table 29. Left leg bone mineral content (g) of persons aged 8 years and over, by sex, race and ethnicity, and age: United States, 1999–2006—Con.
Percentile Sample Standard
Sex, race and ethnicity, and age size Mean deviation 5th 10th 15th 25th 50th 75th 85th 90th 95th
Female
All races and ethnicities 8–11 years . . . . . . . . . . . . . . . . 1,465 224.54 64.09 135.62 149.42 160.22 176.87 213.10 262.93 294.29 317.27 345.81 12–15 years . . . . . . . . . . . . . . . 2,318 349.50 69.67 240.96 264.57 278.08 300.29 346.67 394.35 419.59 438.06 467.97 16–19 years . . . . . . . . . . . . . . . 2,027 387.67 70.20 276.70 301.26 317.65 343.01 383.96 428.78 457.50 474.18 515.15 20–29 years . . . . . . . . . . . . . . . 1,378 393.41 64.45 291.02 310.86 326.02 347.54 391.45 435.21 456.43 475.53 504.94 30–39 years . . . . . . . . . . . . . . . 1,372 396.88 64.83 297.69 318.83 331.61 350.35 392.34 438.27 463.06 480.06 514.09 40–49 years . . . . . . . . . . . . . . . 1,570 398.94 65.07 302.12 317.66 331.49 356.25 394.44 437.45 464.66 484.29 510.55 50–59 years . . . . . . . . . . . . . . . 1,200 379.82 64.33 278.36 300.53 312.59 336.70 378.18 420.15 444.27 465.79 489.37 60–69 years . . . . . . . . . . . . . . . 1,419 363.34 65.90 258.86 281.97 296.15 314.77 360.85 406.44 430.36 443.49 469.86 70–79 years . . . . . . . . . . . . . . . 750 326.96 66.35 221.77 248.88 260.74 284.82 323.51 369.82 395.45 412.91 433.21 80 years and over . . . . . . . . . . . 594 285.29 68.19 172.53 196.71 214.27 241.65 282.81 329.68 357.88 374.62 399.70
20 years and over (age-adjusted) . . 8,283 379.61 . . . . . . . . . . . . . . . . . . . . . . . . . . . . . .
Mexican American 8–11 years . . . . . . . . . . . . . . . . 471 218.92 62.49 134.35 147.22 155.18 172.20 206.14 256.75 284.17 302.54 338.71 12–15 years . . . . . . . . . . . . . . . 821 340.07 63.32 238.22 261.80 275.68 297.29 338.53 383.54 401.11 416.53 443.27 16–19 years . . . . . . . . . . . . . . . 692 360.95 65.60 263.32 281.45 294.42 314.79 355.09 397.99 424.05 440.71 473.21 20–29 years . . . . . . . . . . . . . . . 364 365.26 60.21 274.18 292.72 306.87 321.56 359.94 403.25 428.23 451.28 475.35 30–39 years . . . . . . . . . . . . . . . 298 364.12 56.76 280.34 296.73 308.01 325.73 359.88 392.32 424.94 447.45 470.21 40–49 years . . . . . . . . . . . . . . . 372 367.10 55.30 277.06 300.77 310.74 334.07 364.30 398.49 422.83 441.81 466.42 50–59 years . . . . . . . . . . . . . . . 194 346.20 67.98 241.55 261.42 273.97 300.49 338.72 391.01 417.03 434.77 450.26 60–69 years . . . . . . . . . . . . . . . 375 315.02 61.25 214.35 237.08 246.06 274.20 315.25 362.19 379.31 389.10 408.08 70–79 years . . . . . . . . . . . . . . . 154 *282.32 59.75 *175.69 *209.75 *224.02 *249.58 *282.30 *313.25 *339.06 *351.59 *379.75 80 years and over . . . . . . . . . . . 47 *240.93 67.09 † *141.61 *174.09 *193.12 *240.14 *287.59 *309.59 *315.11 *341.12
20 years and over (age-adjusted) . . 1,804 344.65 . . . . . . . . . . . . . . . . . . . . . . . . . . . . . .
Non-Hispanic white 8–11 years . . . . . . . . . . . . . . . . 383 219.23 60.29 133.06 146.55 156.36 174.39 209.16 256.54 282.52 307.78 331.65 12–15 years . . . . . . . . . . . . . . . 576 344.43 67.14 239.61 261.82 274.32 295.87 343.53 390.33 414.49 429.50 454.59 16–19 years . . . . . . . . . . . . . . . 543 390.86 65.35 284.84 311.83 327.48 349.89 386.69 429.72 453.92 470.14 510.88 20–29 years . . . . . . . . . . . . . . . 583 395.71 59.55 297.23 318.97 335.49 354.96 393.65 434.03 454.79 470.44 496.29 30–39 years . . . . . . . . . . . . . . . 612 398.32 61.20 305.29 323.22 337.69 353.61 394.60 436.59 460.38 472.97 510.10 40–49 years . . . . . . . . . . . . . . . 668 400.57 63.22 304.39 320.49 333.44 359.68 395.87 437.35 464.65 483.26 510.16 50–59 years . . . . . . . . . . . . . . . 639 383.15 59.50 294.89 310.09 320.85 341.22 381.07 419.97 442.19 462.81 484.77 60–69 years . . . . . . . . . . . . . . . 644 365.54 62.53 268.71 290.68 301.38 320.22 362.16 406.19 428.29 439.60 464.99 70–79 years . . . . . . . . . . . . . . . 429 329.04 64.76 224.99 249.86 265.48 289.16 325.88 369.74 393.96 410.99 432.30 80 years and over . . . . . . . . . . . 457 287.19 65.86 175.34 203.26 222.06 243.44 284.85 330.34 357.04 372.54 395.77
20 years and over (age-adjusted) . . 4,032 381.70 . . . . . . . . . . . . . . . . . . . . . . . . . . . . . .
Non-Hispanic black 8–11 years . . . . . . . . . . . . . . . . 490 253.49 72.27 158.59 172.35 183.21 199.00 238.74 301.44 333.62 357.94 381.87 12–15 years . . . . . . . . . . . . . . . 737 395.82 71.34 288.33 311.38 325.60 346.28 389.39 442.76 467.59 492.77 517.82 16–19 years . . . . . . . . . . . . . . . 609 427.00 77.37 314.63 335.22 351.95 374.21 418.61 470.98 504.81 523.46 569.14 20–29 years . . . . . . . . . . . . . . . 297 431.37 68.98 325.52 351.15 366.45 382.67 421.00 473.08 505.66 530.85 552.19 30–39 years . . . . . . . . . . . . . . . 333 436.30 69.14 324.32 346.30 364.60 390.76 431.03 478.24 508.83 523.84 550.15 40–49 years . . . . . . . . . . . . . . . 398 433.14 64.90 338.14 352.46 367.66 388.34 427.34 471.22 497.07 511.90 549.56 50–59 years . . . . . . . . . . . . . . . 250 409.75 67.77 299.27 316.85 340.15 365.62 405.81 452.23 484.32 503.87 518.58 60–69 years . . . . . . . . . . . . . . . 306 398.40 69.45 281.65 308.10 327.35 355.56 398.20 446.61 463.42 484.00 506.95 70–79 years . . . . . . . . . . . . . . . 124 354.79 75.82 218.74 259.21 274.79 302.13 357.36 410.26 426.03 444.27 469.54 80 years and over . . . . . . . . . . . 58 *311.82 74.68 *189.71 *207.74 *224.04 *260.83 *300.12 *363.70 *390.40 *410.52 *431.06
20 years and over (age-adjusted) . . 1,766 414.15 . . . . . . . . . . . . . . . . . . . . . . . . . . . . . .
. . . Category not applicable. * Figure does not meet standards of reliability or precision; relative standard error (standard error divided by estimate times 100) is 30%–39% or estimate is based on less than 12 degrees of freedom. † Standard error not calculated by SUDAAN software.
NOTE: g is grams.
SOURCE: National Health and Nutrition Examination Survey, 1999–2006.
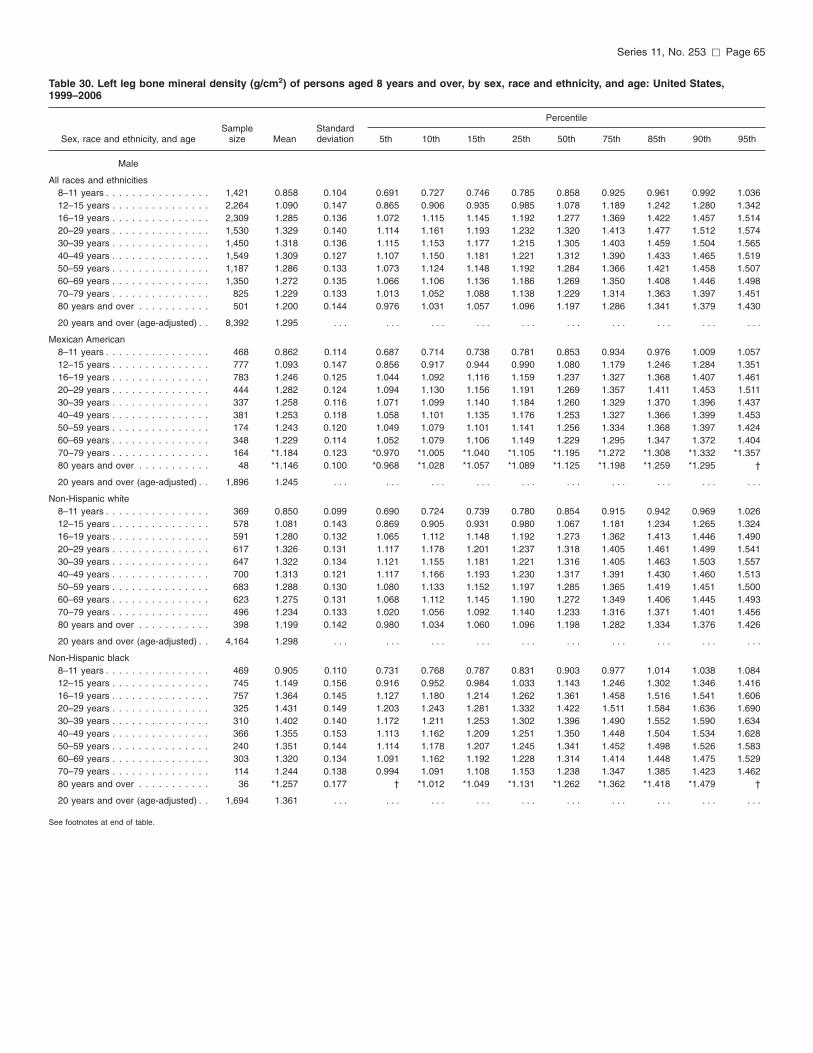
Series 11, No. 253 [ Page 65
Table 30. Left leg bone mineral density (g/cm2) of persons aged 8 years and over, by sex, race and ethnicity, and age: United States, 1999–2006
Percentile Sample Standard
Sex, race and ethnicity, and age size Mean deviation 5th 10th 15th 25th 50th 75th 85th 90th 95th
Male
All races and ethnicities 8–11 years . . . . . . . . . . . . . . . . 1,421 0.858 0.104 0.691 0.727 0.746 0.785 0.858 0.925 0.961 0.992 1.036 12–15 years . . . . . . . . . . . . . . . 2,264 1.090 0.147 0.865 0.906 0.935 0.985 1.078 1.189 1.242 1.280 1.342 16–19 years . . . . . . . . . . . . . . . 2,309 1.285 0.136 1.072 1.115 1.145 1.192 1.277 1.369 1.422 1.457 1.514 20–29 years . . . . . . . . . . . . . . . 1,530 1.329 0.140 1.114 1.161 1.193 1.232 1.320 1.413 1.477 1.512 1.574 30–39 years . . . . . . . . . . . . . . . 1,450 1.318 0.136 1.115 1.153 1.177 1.215 1.305 1.403 1.459 1.504 1.565 40–49 years . . . . . . . . . . . . . . . 1,549 1.309 0.127 1.107 1.150 1.181 1.221 1.312 1.390 1.433 1.465 1.519 50–59 years . . . . . . . . . . . . . . . 1,187 1.286 0.133 1.073 1.124 1.148 1.192 1.284 1.366 1.421 1.458 1.507 60–69 years . . . . . . . . . . . . . . . 1,350 1.272 0.135 1.066 1.106 1.136 1.186 1.269 1.350 1.408 1.446 1.498 70–79 years . . . . . . . . . . . . . . . 825 1.229 0.133 1.013 1.052 1.088 1.138 1.229 1.314 1.363 1.397 1.451 80 years and over . . . . . . . . . . . 501 1.200 0.144 0.976 1.031 1.057 1.096 1.197 1.286 1.341 1.379 1.430
20 years and over (age-adjusted) . . 8,392 1.295 . . . . . . . . . . . . . . . . . . . . . . . . . . . . . .
Mexican American 8–11 years . . . . . . . . . . . . . . . . 468 0.862 0.114 0.687 0.714 0.738 0.781 0.853 0.934 0.976 1.009 1.057 12–15 years . . . . . . . . . . . . . . . 777 1.093 0.147 0.856 0.917 0.944 0.990 1.080 1.179 1.246 1.284 1.351 16–19 years . . . . . . . . . . . . . . . 783 1.246 0.125 1.044 1.092 1.116 1.159 1.237 1.327 1.368 1.407 1.461 20–29 years . . . . . . . . . . . . . . . 444 1.282 0.124 1.094 1.130 1.156 1.191 1.269 1.357 1.411 1.453 1.511 30–39 years . . . . . . . . . . . . . . . 337 1.258 0.116 1.071 1.099 1.140 1.184 1.260 1.329 1.370 1.396 1.437 40–49 years . . . . . . . . . . . . . . . 381 1.253 0.118 1.058 1.101 1.135 1.176 1.253 1.327 1.366 1.399 1.453 50–59 years . . . . . . . . . . . . . . . 174 1.243 0.120 1.049 1.079 1.101 1.141 1.256 1.334 1.368 1.397 1.424 60–69 years . . . . . . . . . . . . . . . 348 1.229 0.114 1.052 1.079 1.106 1.149 1.229 1.295 1.347 1.372 1.404 70–79 years . . . . . . . . . . . . . . . 164 *1.184 0.123 *0.970 *1.005 *1.040 *1.105 *1.195 *1.272 *1.308 *1.332 *1.357 80 years and over . . . . . . . . . . . 48 *1.146 0.100 *0.968 *1.028 *1.057 *1.089 *1.125 *1.198 *1.259 *1.295 †
20 years and over (age-adjusted) . . 1,896 1.245 . . . . . . . . . . . . . . . . . . . . . . . . . . . . . .
Non-Hispanic white 8–11 years . . . . . . . . . . . . . . . . 369 0.850 0.099 0.690 0.724 0.739 0.780 0.854 0.915 0.942 0.969 1.026 12–15 years . . . . . . . . . . . . . . . 578 1.081 0.143 0.869 0.905 0.931 0.980 1.067 1.181 1.234 1.265 1.324 16–19 years . . . . . . . . . . . . . . . 591 1.280 0.132 1.065 1.112 1.148 1.192 1.273 1.362 1.413 1.446 1.490 20–29 years . . . . . . . . . . . . . . . 617 1.326 0.131 1.117 1.178 1.201 1.237 1.318 1.405 1.461 1.499 1.541 30–39 years . . . . . . . . . . . . . . . 647 1.322 0.134 1.121 1.155 1.181 1.221 1.316 1.405 1.463 1.503 1.557 40–49 years . . . . . . . . . . . . . . . 700 1.313 0.121 1.117 1.166 1.193 1.230 1.317 1.391 1.430 1.460 1.513 50–59 years . . . . . . . . . . . . . . . 683 1.288 0.130 1.080 1.133 1.152 1.197 1.285 1.365 1.419 1.451 1.500 60–69 years . . . . . . . . . . . . . . . 623 1.275 0.131 1.068 1.112 1.145 1.190 1.272 1.349 1.406 1.445 1.493 70–79 years . . . . . . . . . . . . . . . 496 1.234 0.133 1.020 1.056 1.092 1.140 1.233 1.316 1.371 1.401 1.456 80 years and over . . . . . . . . . . . 398 1.199 0.142 0.980 1.034 1.060 1.096 1.198 1.282 1.334 1.376 1.426
20 years and over (age-adjusted) . . 4,164 1.298 . . . . . . . . . . . . . . . . . . . . . . . . . . . . . .
Non-Hispanic black 8–11 years . . . . . . . . . . . . . . . . 469 0.905 0.110 0.731 0.768 0.787 0.831 0.903 0.977 1.014 1.038 1.084 12–15 years . . . . . . . . . . . . . . . 745 1.149 0.156 0.916 0.952 0.984 1.033 1.143 1.246 1.302 1.346 1.416 16–19 years . . . . . . . . . . . . . . . 757 1.364 0.145 1.127 1.180 1.214 1.262 1.361 1.458 1.516 1.541 1.606 20–29 years . . . . . . . . . . . . . . . 325 1.431 0.149 1.203 1.243 1.281 1.332 1.422 1.511 1.584 1.636 1.690 30–39 years . . . . . . . . . . . . . . . 310 1.402 0.140 1.172 1.211 1.253 1.302 1.396 1.490 1.552 1.590 1.634 40–49 years . . . . . . . . . . . . . . . 366 1.355 0.153 1.113 1.162 1.209 1.251 1.350 1.448 1.504 1.534 1.628 50–59 years . . . . . . . . . . . . . . . 240 1.351 0.144 1.114 1.178 1.207 1.245 1.341 1.452 1.498 1.526 1.583 60–69 years . . . . . . . . . . . . . . . 303 1.320 0.134 1.091 1.162 1.192 1.228 1.314 1.414 1.448 1.475 1.529 70–79 years . . . . . . . . . . . . . . . 114 1.244 0.138 0.994 1.091 1.108 1.153 1.238 1.347 1.385 1.423 1.462 80 years and over . . . . . . . . . . . 36 *1.257 0.177 † *1.012 *1.049 *1.131 *1.262 *1.362 *1.418 *1.479 †
20 years and over (age-adjusted) . . 1,694 1.361 . . . . . . . . . . . . . . . . . . . . . . . . . . . . . .
See footnotes at end of table.

Page 66 [ Series 11, No. 253
Table 30. Left leg bone mineral density (g/cm2) of persons aged 8 years and over, by sex, race and ethnicity, and age: United States, 1999–2006—Con.
Percentile Sample Standard
Sex, race and ethnicity, and age size Mean deviation 5th 10th 15th 25th 50th 75th 85th 90th 95th
Female
All races and ethnicities 8–11 years . . . . . . . . . . . . . . . . 1,465 0.870 0.122 0.663 0.709 0.739 0.784 0.867 0.949 1.002 1.035 1.082 12–15 years . . . . . . . . . . . . . . . 2,318 1.075 0.110 0.894 0.940 0.968 1.002 1.070 1.149 1.182 1.212 1.261 16–19 years . . . . . . . . . . . . . . . 2,027 1.134 0.113 0.954 0.994 1.022 1.063 1.130 1.203 1.246 1.281 1.332 20–29 years . . . . . . . . . . . . . . . 1,378 1.145 0.103 0.992 1.017 1.038 1.077 1.138 1.209 1.256 1.278 1.328 30–39 years . . . . . . . . . . . . . . . 1,372 1.147 0.104 0.978 1.021 1.041 1.073 1.143 1.216 1.250 1.278 1.323 40–49 years . . . . . . . . . . . . . . . 1,570 1.148 0.104 0.986 1.018 1.047 1.075 1.142 1.212 1.255 1.284 1.328 50–59 years . . . . . . . . . . . . . . . 1,200 1.109 0.107 0.934 0.976 0.996 1.033 1.107 1.180 1.216 1.252 1.285 60–69 years . . . . . . . . . . . . . . . 1,419 1.061 0.111 0.879 0.917 0.946 0.986 1.059 1.131 1.175 1.200 1.250 70–79 years . . . . . . . . . . . . . . . 750 0.987 0.112 0.798 0.840 0.873 0.911 0.981 1.068 1.101 1.130 1.172 80 years and over . . . . . . . . . . . 594 0.912 0.119 0.718 0.763 0.793 0.828 0.902 0.992 1.037 1.068 1.110
20 years and over (age-adjusted) . . 8,283 1.108 . . . . . . . . . . . . . . . . . . . . . . . . . . . . . .
Mexican American 8–11 years . . . . . . . . . . . . . . . . 471 0.858 0.129 0.654 0.696 0.720 0.762 0.852 0.946 1.001 1.028 1.088 12–15 years . . . . . . . . . . . . . . . 821 1.067 0.104 0.893 0.930 0.963 1.001 1.069 1.139 1.169 1.197 1.231 16–19 years . . . . . . . . . . . . . . . 692 1.108 0.105 0.938 0.978 1.003 1.037 1.099 1.171 1.211 1.232 1.292 20–29 years . . . . . . . . . . . . . . . 364 1.115 0.103 0.967 0.994 1.011 1.039 1.101 1.184 1.232 1.263 1.297 30–39 years . . . . . . . . . . . . . . . 298 1.119 0.103 0.966 0.999 1.023 1.046 1.107 1.176 1.226 1.252 1.308 40–49 years . . . . . . . . . . . . . . . 372 1.122 0.093 0.961 1.010 1.027 1.056 1.125 1.180 1.211 1.240 1.275 50–59 years . . . . . . . . . . . . . . . 194 1.076 0.120 0.878 0.921 0.956 0.998 1.078 1.145 1.186 1.231 1.273 60–69 years . . . . . . . . . . . . . . . 375 1.005 0.110 0.819 0.859 0.890 0.923 1.006 1.081 1.116 1.142 1.178 70–79 years . . . . . . . . . . . . . . . 154 *0.936 0.110 *0.737 *0.801 *0.842 *0.868 *0.931 *0.997 *1.051 *1.075 *1.098 80 years and over . . . . . . . . . . . 47 *0.866 0.119 † *0.695 *0.716 *0.785 *0.874 *0.924 *0.976 *1.030 †
20 years and over (age-adjusted) . . 1,804 1.074 . . . . . . . . . . . . . . . . . . . . . . . . . . . . . .
Non-Hispanic white 8–11 years . . . . . . . . . . . . . . . . 383 0.862 0.118 0.657 0.706 0.735 0.778 0.862 0.941 0.985 1.012 1.066 12–15 years . . . . . . . . . . . . . . . 576 1.067 0.107 0.893 0.933 0.962 0.995 1.066 1.138 1.172 1.199 1.240 16–19 years . . . . . . . . . . . . . . . 543 1.138 0.108 0.967 1.010 1.031 1.066 1.134 1.203 1.242 1.276 1.327 20–29 years . . . . . . . . . . . . . . . 583 1.145 0.095 0.995 1.026 1.049 1.082 1.138 1.205 1.251 1.273 1.312 30–39 years . . . . . . . . . . . . . . . 612 1.147 0.100 0.978 1.023 1.045 1.077 1.145 1.215 1.247 1.273 1.309 40–49 years . . . . . . . . . . . . . . . 668 1.146 0.102 0.989 1.020 1.048 1.075 1.142 1.209 1.251 1.280 1.322 50–59 years . . . . . . . . . . . . . . . 639 1.113 0.103 0.949 0.984 1.003 1.042 1.112 1.182 1.217 1.253 1.287 60–69 years . . . . . . . . . . . . . . . 644 1.061 0.108 0.881 0.919 0.951 0.990 1.061 1.128 1.168 1.197 1.242 70–79 years . . . . . . . . . . . . . . . 429 0.986 0.112 0.796 0.836 0.868 0.914 0.980 1.068 1.102 1.127 1.170 80 years and over . . . . . . . . . . . 457 0.913 0.116 0.719 0.765 0.800 0.830 0.902 0.993 1.035 1.067 1.111
20 years and over (age-adjusted) . . 4,032 1.108 . . . . . . . . . . . . . . . . . . . . . . . . . . . . . .
Non-Hispanic black 8–11 years . . . . . . . . . . . . . . . . 490 0.919 0.123 0.722 0.763 0.788 0.829 0.913 1.011 1.051 1.084 1.126 12–15 years . . . . . . . . . . . . . . . 737 1.141 0.110 0.964 1.001 1.027 1.067 1.137 1.210 1.256 1.283 1.334 16–19 years . . . . . . . . . . . . . . . 609 1.195 0.114 1.013 1.053 1.080 1.112 1.191 1.266 1.322 1.347 1.390 20–29 years . . . . . . . . . . . . . . . 297 1.205 0.113 1.032 1.065 1.081 1.115 1.198 1.280 1.328 1.357 1.389 30–39 years . . . . . . . . . . . . . . . 333 1.196 0.111 1.021 1.055 1.075 1.117 1.203 1.261 1.308 1.331 1.374 40–49 years . . . . . . . . . . . . . . . 398 1.196 0.103 1.028 1.070 1.093 1.127 1.191 1.265 1.308 1.329 1.364 50–59 years . . . . . . . . . . . . . . . 250 1.146 0.114 0.954 0.994 1.030 1.075 1.148 1.214 1.258 1.283 1.330 60–69 years . . . . . . . . . . . . . . . 306 1.108 0.125 0.904 0.956 0.978 1.022 1.108 1.188 1.234 1.271 1.313 70–79 years . . . . . . . . . . . . . . . 124 1.026 0.116 0.819 0.889 0.917 0.949 1.023 1.100 1.144 1.169 1.216 80 years and over . . . . . . . . . . . 58 *0.947 0.135 *0.722 *0.769 *0.792 *0.832 *0.947 *1.043 *1.072 *1.089 *1.134
20 years and over (age-adjusted) . . 1,766 1.155 . . . . . . . . . . . . . . . . . . . . . . . . . . . . . .
. . . Category not applicable.
* Figure does not meet standards of reliability or precision; relative standard error (standard error divided by estimate times 100) is 30%–39% or estimate is based on less than 12 degrees of freedom.
† Standard error not calculated by SUDAAN software.
NOTE: g/cm2 is grams per centimeter squared.
SOURCE: National Health and Nutrition Examination Survey, 1999–2006.

Series 11, No. 253 [ Page 67
Table 31. Right ribs bone area (cm2) of persons aged 8 years and over, by sex, race and ethnicity, and age: United States, 1999–2006
Percentile Sample Standard
Sex, race and ethnicity, and age size Mean deviation 5th 10th 15th 25th 50th 75th 85th 90th 95th
Male
All races and ethnicities 8–11 years . . . . . . . . . . . . . . . . 1,421 85.13 15.66 62.61 66.97 70.09 74.22 83.34 93.13 100.22 106.32 115.97 12–15 years . . . . . . . . . . . . . . . 2,264 108.45 21.64 76.60 82.56 86.84 93.21 106.90 121.43 129.95 135.75 145.53 16–19 years . . . . . . . . . . . . . . . 2,309 127.39 21.17 97.45 103.37 107.22 113.60 125.21 138.65 147.31 155.08 165.57 20–29 years . . . . . . . . . . . . . . . 1,530 136.38 27.18 100.28 106.17 110.59 118.85 132.24 149.74 161.81 170.65 185.62 30–39 years . . . . . . . . . . . . . . . 1,450 139.87 28.25 99.37 105.38 112.08 121.01 137.04 156.10 167.07 174.73 186.76 40–49 years . . . . . . . . . . . . . . . 1,549 142.17 30.15 100.36 108.06 113.46 121.10 138.74 159.05 169.25 179.70 193.34 50–59 years . . . . . . . . . . . . . . . 1,187 141.79 29.04 99.16 107.24 113.25 120.55 138.96 159.53 171.11 180.28 191.98 60–69 years . . . . . . . . . . . . . . . 1,350 141.13 28.41 100.55 107.05 112.28 120.76 138.71 157.73 171.80 179.04 190.49 70–79 years . . . . . . . . . . . . . . . 825 130.17 27.01 89.23 98.45 103.92 111.29 128.02 146.14 156.54 164.88 176.56 80 years and over . . . . . . . . . . . 501 118.62 23.09 82.50 89.01 95.32 102.68 116.82 131.82 141.35 148.02 160.28
20 years and over (age-adjusted) . . 8,392 138.36 . . . . . . . . . . . . . . . . . . . . . . . . . . . . . .
Mexican American 8–11 years . . . . . . . . . . . . . . . . 468 86.85 18.11 61.54 64.99 69.68 74.75 83.09 97.99 106.02 113.17 119.90 12–15 years . . . . . . . . . . . . . . . 777 108.46 20.89 77.46 83.85 87.06 93.84 106.95 121.47 128.69 134.09 146.26 16–19 years . . . . . . . . . . . . . . . 783 124.19 21.13 92.54 99.99 104.37 110.23 121.83 135.19 144.80 150.65 159.83 20–29 years . . . . . . . . . . . . . . . 444 131.07 24.28 95.55 104.40 107.80 114.65 128.36 143.34 153.81 161.85 174.76 30–39 years . . . . . . . . . . . . . . . 337 137.66 25.27 100.42 106.42 111.78 119.51 135.50 153.21 162.97 171.69 180.59 40–49 years . . . . . . . . . . . . . . . 381 136.87 26.88 95.69 105.82 110.12 117.22 134.69 152.32 161.45 170.88 185.24 50–59 years . . . . . . . . . . . . . . . 174 136.72 26.22 100.76 106.52 111.64 117.86 134.70 149.37 159.43 169.79 179.97 60–69 years . . . . . . . . . . . . . . . 348 136.94 25.44 98.76 104.81 111.79 120.29 134.24 151.62 162.21 169.74 183.71 70–79 years . . . . . . . . . . . . . . . 164 *123.68 22.56 *91.24 *97.49 *101.61 *107.23 *120.87 *136.83 *147.69 *151.80 † 80 years and over . . . . . . . . . . . 48 *116.42 25.36 *65.33 *81.10 *87.43 *97.61 *120.49 *132.71 *143.62 *148.98 *157.36
20 years and over (age-adjusted) . . 1,896 133.91 . . . . . . . . . . . . . . . . . . . . . . . . . . . . . .
Non-Hispanic white 8–11 years . . . . . . . . . . . . . . . . 369 84.55 14.79 62.86 67.05 69.95 74.16 83.07 91.74 98.79 104.21 113.39 12–15 years . . . . . . . . . . . . . . . 578 108.72 21.73 75.83 82.85 87.29 93.57 107.11 121.46 129.99 136.02 144.35 16–19 years . . . . . . . . . . . . . . . 591 127.73 21.07 98.04 103.62 107.87 114.09 125.67 138.34 147.01 155.06 166.75 20–29 years . . . . . . . . . . . . . . . 617 136.94 27.26 100.66 106.49 110.57 119.17 132.70 150.41 162.98 170.84 186.80 30–39 years . . . . . . . . . . . . . . . 647 140.23 28.92 98.83 104.43 111.75 120.80 137.23 157.09 168.44 176.21 187.43 40–49 years . . . . . . . . . . . . . . . 700 143.65 30.85 101.70 108.58 114.19 122.05 139.77 160.30 172.30 182.38 196.17 50–59 years . . . . . . . . . . . . . . . 683 143.04 29.28 99.93 107.38 114.08 121.62 140.57 161.18 173.34 181.53 193.57 60–69 years . . . . . . . . . . . . . . . 623 143.06 28.27 102.93 109.37 113.83 122.32 141.30 159.93 173.83 179.93 192.31 70–79 years . . . . . . . . . . . . . . . 496 130.97 27.32 89.13 99.07 104.60 112.17 128.81 146.72 158.24 166.21 178.41 80 years and over . . . . . . . . . . . 398 118.47 22.83 82.83 89.48 95.27 102.68 116.56 131.69 140.89 147.57 158.52
20 years and over (age-adjusted) . . 4,164 139.31 . . . . . . . . . . . . . . . . . . . . . . . . . . . . . .
Non-Hispanic black 8–11 years . . . . . . . . . . . . . . . . 469 85.90 16.48 62.23 67.60 70.23 74.28 83.82 94.85 100.81 106.80 117.60 12–15 years . . . . . . . . . . . . . . . 745 110.46 22.47 77.15 84.25 88.06 95.13 108.13 122.64 131.95 138.29 149.61 16–19 years . . . . . . . . . . . . . . . 757 128.48 22.11 99.29 104.75 108.43 113.72 125.22 139.76 149.14 155.56 166.64 20–29 years . . . . . . . . . . . . . . . 325 138.51 27.85 101.03 109.43 113.32 121.14 133.31 150.66 161.51 171.42 186.58 30–39 years . . . . . . . . . . . . . . . 310 142.49 28.31 104.56 111.79 116.23 123.68 139.23 156.17 167.98 176.17 194.75 40–49 years . . . . . . . . . . . . . . . 366 139.72 29.71 101.24 107.86 112.93 119.57 134.91 155.55 165.88 172.07 194.43 50–59 years . . . . . . . . . . . . . . . 240 138.06 27.50 99.40 106.48 111.84 119.73 135.29 151.80 162.37 171.68 187.28 60–69 years . . . . . . . . . . . . . . . 303 137.36 29.19 96.56 103.69 108.24 117.57 134.26 152.36 164.64 173.54 189.14 70–79 years . . . . . . . . . . . . . . . 114 128.12 24.69 93.85 97.16 99.58 111.82 125.93 144.60 153.50 158.75 169.09 80 years and over . . . . . . . . . . . 36 *121.87 24.74 † *84.63 *92.06 *108.52 *119.03 *133.91 *144.85 *158.80 †
20 years and over (age-adjusted) . . 1,694 137.80 . . . . . . . . . . . . . . . . . . . . . . . . . . . . . .
See footnotes at end of table.
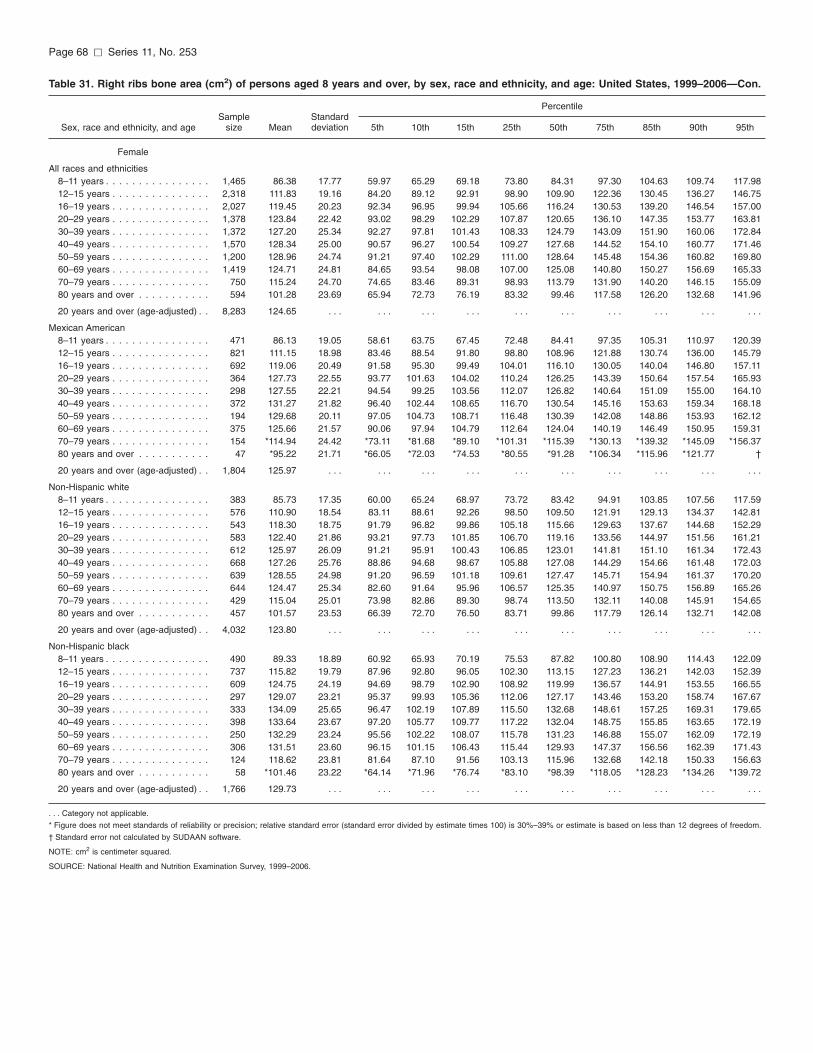
Page 68 [ Series 11, No. 253
Table 31. Right ribs bone area (cm2) of persons aged 8 years and over, by sex, race and ethnicity, and age: United States, 1999–2006—Con.
Percentile Sample Standard
Sex, race and ethnicity, and age size Mean deviation 5th 10th 15th 25th 50th 75th 85th 90th 95th
Female
All races and ethnicities 8–11 years . . . . . . . . . . . . . . . . 1,465 86.38 17.77 59.97 65.29 69.18 73.80 84.31 97.30 104.63 109.74 117.98 12–15 years . . . . . . . . . . . . . . . 2,318 111.83 19.16 84.20 89.12 92.91 98.90 109.90 122.36 130.45 136.27 146.75 16–19 years . . . . . . . . . . . . . . . 2,027 119.45 20.23 92.34 96.95 99.94 105.66 116.24 130.53 139.20 146.54 157.00 20–29 years . . . . . . . . . . . . . . . 1,378 123.84 22.42 93.02 98.29 102.29 107.87 120.65 136.10 147.35 153.77 163.81 30–39 years . . . . . . . . . . . . . . . 1,372 127.20 25.34 92.27 97.81 101.43 108.33 124.79 143.09 151.90 160.06 172.84 40–49 years . . . . . . . . . . . . . . . 1,570 128.34 25.00 90.57 96.27 100.54 109.27 127.68 144.52 154.10 160.77 171.46 50–59 years . . . . . . . . . . . . . . . 1,200 128.96 24.74 91.21 97.40 102.29 111.00 128.64 145.48 154.36 160.82 169.80 60–69 years . . . . . . . . . . . . . . . 1,419 124.71 24.81 84.65 93.54 98.08 107.00 125.08 140.80 150.27 156.69 165.33 70–79 years . . . . . . . . . . . . . . . 750 115.24 24.70 74.65 83.46 89.31 98.93 113.79 131.90 140.20 146.15 155.09 80 years and over . . . . . . . . . . . 594 101.28 23.69 65.94 72.73 76.19 83.32 99.46 117.58 126.20 132.68 141.96
20 years and over (age-adjusted) . . 8,283 124.65 . . . . . . . . . . . . . . . . . . . . . . . . . . . . . .
Mexican American 8–11 years . . . . . . . . . . . . . . . . 471 86.13 19.05 58.61 63.75 67.45 72.48 84.41 97.35 105.31 110.97 120.39 12–15 years . . . . . . . . . . . . . . . 821 111.15 18.98 83.46 88.54 91.80 98.80 108.96 121.88 130.74 136.00 145.79 16–19 years . . . . . . . . . . . . . . . 692 119.06 20.49 91.58 95.30 99.49 104.01 116.10 130.05 140.04 146.80 157.11 20–29 years . . . . . . . . . . . . . . . 364 127.73 22.55 93.77 101.63 104.02 110.24 126.25 143.39 150.64 157.54 165.93 30–39 years . . . . . . . . . . . . . . . 298 127.55 22.21 94.54 99.25 103.56 112.07 126.82 140.64 151.09 155.00 164.10 40–49 years . . . . . . . . . . . . . . . 372 131.27 21.82 96.40 102.44 108.65 116.70 130.54 145.16 153.63 159.34 168.18 50–59 years . . . . . . . . . . . . . . . 194 129.68 20.11 97.05 104.73 108.71 116.48 130.39 142.08 148.86 153.93 162.12 60–69 years . . . . . . . . . . . . . . . 375 125.66 21.57 90.06 97.94 104.79 112.64 124.04 140.19 146.49 150.95 159.31 70–79 years . . . . . . . . . . . . . . . 154 *114.94 24.42 *73.11 *81.68 *89.10 *101.31 *115.39 *130.13 *139.32 *145.09 *156.37 80 years and over . . . . . . . . . . . 47 *95.22 21.71 *66.05 *72.03 *74.53 *80.55 *91.28 *106.34 *115.96 *121.77 †
20 years and over (age-adjusted) . . 1,804 125.97 . . . . . . . . . . . . . . . . . . . . . . . . . . . . . .
Non-Hispanic white 8–11 years . . . . . . . . . . . . . . . . 383 85.73 17.35 60.00 65.24 68.97 73.72 83.42 94.91 103.85 107.56 117.59 12–15 years . . . . . . . . . . . . . . . 576 110.90 18.54 83.11 88.61 92.26 98.50 109.50 121.91 129.13 134.37 142.81 16–19 years . . . . . . . . . . . . . . . 543 118.30 18.75 91.79 96.82 99.86 105.18 115.66 129.63 137.67 144.68 152.29 20–29 years . . . . . . . . . . . . . . . 583 122.40 21.86 93.21 97.73 101.85 106.70 119.16 133.56 144.97 151.56 161.21 30–39 years . . . . . . . . . . . . . . . 612 125.97 26.09 91.21 95.91 100.43 106.85 123.01 141.81 151.10 161.34 172.43 40–49 years . . . . . . . . . . . . . . . 668 127.26 25.76 88.86 94.68 98.67 105.88 127.08 144.29 154.66 161.48 172.03 50–59 years . . . . . . . . . . . . . . . 639 128.55 24.98 91.20 96.59 101.18 109.61 127.47 145.71 154.94 161.37 170.20 60–69 years . . . . . . . . . . . . . . . 644 124.47 25.34 82.60 91.64 95.96 106.57 125.35 140.97 150.75 156.89 165.26 70–79 years . . . . . . . . . . . . . . . 429 115.04 25.01 73.98 82.86 89.30 98.74 113.50 132.11 140.08 145.91 154.65 80 years and over . . . . . . . . . . . 457 101.57 23.53 66.39 72.70 76.50 83.71 99.86 117.79 126.14 132.71 142.08
20 years and over (age-adjusted) . . 4,032 123.80 . . . . . . . . . . . . . . . . . . . . . . . . . . . . . .
Non-Hispanic black 8–11 years . . . . . . . . . . . . . . . . 490 89.33 18.89 60.92 65.93 70.19 75.53 87.82 100.80 108.90 114.43 122.09 12–15 years . . . . . . . . . . . . . . . 737 115.82 19.79 87.96 92.80 96.05 102.30 113.15 127.23 136.21 142.03 152.39 16–19 years . . . . . . . . . . . . . . . 609 124.75 24.19 94.69 98.79 102.90 108.92 119.99 136.57 144.91 153.55 166.55 20–29 years . . . . . . . . . . . . . . . 297 129.07 23.21 95.37 99.93 105.36 112.06 127.17 143.46 153.20 158.74 167.67 30–39 years . . . . . . . . . . . . . . . 333 134.09 25.65 96.47 102.19 107.89 115.50 132.68 148.61 157.25 169.31 179.65 40–49 years . . . . . . . . . . . . . . . 398 133.64 23.67 97.20 105.77 109.77 117.22 132.04 148.75 155.85 163.65 172.19 50–59 years . . . . . . . . . . . . . . . 250 132.29 23.24 95.56 102.22 108.07 115.78 131.23 146.88 155.07 162.09 172.19 60–69 years . . . . . . . . . . . . . . . 306 131.51 23.60 96.15 101.15 106.43 115.44 129.93 147.37 156.56 162.39 171.43 70–79 years . . . . . . . . . . . . . . . 124 118.62 23.81 81.64 87.10 91.56 103.13 115.96 132.68 142.18 150.33 156.63 80 years and over . . . . . . . . . . . 58 *101.46 23.22 *64.14 *71.96 *76.74 *83.10 *98.39 *118.05 *128.23 *134.26 *139.72
20 years and over (age-adjusted) . . 1,766 129.73 . . . . . . . . . . . . . . . . . . . . . . . . . . . . . .
. . . Category not applicable.
* Figure does not meet standards of reliability or precision; relative standard error (standard error divided by estimate times 100) is 30%–39% or estimate is based on less than 12 degrees of freedom.
† Standard error not calculated by SUDAAN software.
NOTE: cm2 is centimeter squared.
SOURCE: National Health and Nutrition Examination Survey, 1999–2006.

Series 11, No. 253 [ Page 69
Table 32. Right ribs bone mineral content (g) of persons aged 8 years and over, by sex, race and ethnicity, and age: United States, 1999–2006
Percentile Sample Standard
Sex, race and ethnicity, and age size Mean deviation 5th 10th 15th 25th 50th 75th 85th 90th 95th
Male
All races and ethnicities 8–11 years . . . . . . . . . . . . . . . . 1,421 45.35 11.76 28.76 31.85 33.49 36.88 44.07 51.23 56.85 61.97 67.63 12–15 years . . . . . . . . . . . . . . . 2,264 69.63 20.35 39.90 45.57 48.93 54.85 67.49 82.03 90.77 96.68 104.94 16–19 years . . . . . . . . . . . . . . . 2,309 95.96 21.21 65.05 70.38 74.48 81.08 94.19 107.64 117.23 123.80 134.22 20–29 years . . . . . . . . . . . . . . . 1,530 103.19 26.86 68.72 74.77 78.73 84.76 99.81 115.91 125.44 133.26 151.17 30–39 years . . . . . . . . . . . . . . . 1,450 102.68 26.73 66.93 72.94 77.61 85.13 100.48 115.70 125.63 132.43 146.52 40–49 years . . . . . . . . . . . . . . . 1,549 102.93 26.86 66.74 72.82 77.82 85.55 99.52 116.30 127.03 137.13 149.15 50–59 years . . . . . . . . . . . . . . . 1,187 100.74 25.52 64.83 71.64 75.56 83.66 97.29 114.26 125.22 134.37 147.81 60–69 years . . . . . . . . . . . . . . . 1,350 100.22 25.23 64.49 70.23 75.74 82.91 97.55 114.05 123.39 132.28 146.39 70–79 years . . . . . . . . . . . . . . . 825 88.86 23.07 56.21 61.19 64.85 72.79 86.63 103.30 112.64 118.08 128.19 80 years and over . . . . . . . . . . . 501 79.27 20.74 48.40 53.36 57.23 64.51 77.80 91.45 99.86 107.07 116.00
20 years and over (age-adjusted) . . 8,392 100.04 . . . . . . . . . . . . . . . . . . . . . . . . . . . . . .
Mexican American 8–11 years . . . . . . . . . . . . . . . . 468 46.34 13.03 27.44 31.18 33.71 37.23 43.74 54.53 60.49 64.56 69.51 12–15 years . . . . . . . . . . . . . . . 777 69.14 19.66 40.16 45.74 49.67 55.23 66.75 81.43 89.59 94.28 103.29 16–19 years . . . . . . . . . . . . . . . 783 90.43 20.34 61.98 67.32 71.44 76.67 88.50 101.26 109.85 117.67 127.44 20–29 years . . . . . . . . . . . . . . . 444 95.92 21.37 64.87 71.65 76.18 81.62 93.11 108.38 116.68 123.01 132.38 30–39 years . . . . . . . . . . . . . . . 337 98.75 22.44 67.72 74.26 78.70 83.38 95.31 109.81 121.15 129.89 139.63 40–49 years . . . . . . . . . . . . . . . 381 97.09 23.77 63.05 69.96 73.95 81.14 94.66 109.70 118.59 126.58 139.78 50–59 years . . . . . . . . . . . . . . . 174 96.36 23.38 65.46 72.42 75.64 80.60 92.57 108.43 116.06 123.04 132.57 60–69 years . . . . . . . . . . . . . . . 348 95.08 20.77 63.05 68.16 73.51 80.18 94.50 106.74 114.42 120.00 130.78 70–79 years . . . . . . . . . . . . . . . 164 *82.87 19.81 *56.25 *59.33 *62.33 *68.78 *81.39 *94.46 *103.83 *111.99 † 80 years and over . . . . . . . . . . . 48 *75.99 22.92 *37.47 *42.95 *47.44 *60.25 *73.11 *89.37 *99.27 *102.97 †
20 years and over (age-adjusted) . . 1,896 94.75 . . . . . . . . . . . . . . . . . . . . . . . . . . . . . .
Non-Hispanic white 8–11 years . . . . . . . . . . . . . . . . 369 44.68 11.16 28.64 31.14 33.14 36.34 44.02 50.63 55.29 59.73 66.56 12–15 years . . . . . . . . . . . . . . . 578 69.78 20.33 39.61 45.65 49.00 54.85 67.75 82.20 90.93 97.28 104.72 16–19 years . . . . . . . . . . . . . . . 591 96.20 20.51 65.15 70.36 74.95 81.85 95.38 107.63 116.40 121.24 132.64 20–29 years . . . . . . . . . . . . . . . 617 103.11 26.45 69.02 74.90 79.26 85.32 99.97 114.97 124.97 132.12 149.62 30–39 years . . . . . . . . . . . . . . . 647 102.59 26.88 67.00 72.89 77.24 84.85 100.79 115.43 125.35 132.25 145.90 40–49 years . . . . . . . . . . . . . . . 700 103.79 27.18 68.05 73.14 77.99 86.52 100.95 116.50 128.20 138.49 150.10 50–59 years . . . . . . . . . . . . . . . 683 101.18 25.29 65.11 71.82 75.78 84.59 97.41 115.10 125.91 135.13 147.45 60–69 years . . . . . . . . . . . . . . . 623 101.38 24.92 65.03 71.38 77.31 83.92 98.49 115.03 124.65 132.67 146.78 70–79 years . . . . . . . . . . . . . . . 496 89.33 23.14 56.59 61.29 64.52 73.28 87.11 103.42 112.91 118.97 128.74 80 years and over . . . . . . . . . . . 398 78.75 19.96 48.67 53.97 57.50 64.32 77.61 90.72 99.00 104.33 113.34
20 years and over (age-adjusted) . . 4,164 100.39 . . . . . . . . . . . . . . . . . . . . . . . . . . . . . .
Non-Hispanic black 8–11 years . . . . . . . . . . . . . . . . 469 47.43 12.79 30.17 33.40 34.92 38.35 45.59 54.73 60.69 63.92 70.55 12–15 years . . . . . . . . . . . . . . . 745 73.12 21.79 41.20 47.49 51.94 57.71 70.45 85.60 94.92 100.44 111.27 16–19 years . . . . . . . . . . . . . . . 757 100.56 23.41 69.08 75.30 78.62 84.47 97.48 113.97 122.80 129.43 140.33 20–29 years . . . . . . . . . . . . . . . 325 112.98 30.63 71.59 79.42 84.37 93.86 109.86 126.02 136.97 147.69 167.82 30–39 years . . . . . . . . . . . . . . . 310 112.59 30.01 72.84 80.58 84.60 93.27 107.08 126.82 134.27 146.44 168.15 40–49 years . . . . . . . . . . . . . . . 366 105.95 28.39 68.25 76.15 80.10 86.83 100.27 120.04 131.52 138.86 153.60 50–59 years . . . . . . . . . . . . . . . 240 105.03 26.29 68.00 74.77 79.53 88.39 102.68 117.99 126.07 134.66 154.22 60–69 years . . . . . . . . . . . . . . . 303 104.03 27.85 67.51 73.56 77.27 84.37 100.00 118.64 131.90 142.01 153.38 70–79 years . . . . . . . . . . . . . . . 114 91.35 21.90 53.69 63.64 67.70 74.82 90.33 106.71 112.97 118.12 124.34 80 years and over . . . . . . . . . . . 36 *87.60 24.83 † *54.57 *61.46 *71.39 *81.84 *98.65 *109.93 *118.40 †
20 years and over (age-adjusted) . . 1,694 106.25 . . . . . . . . . . . . . . . . . . . . . . . . . . . . . .
See footnotes at end of table.

Page 70 [ Series 11, No. 253
Table 32. Right ribs bone mineral content (g) of persons aged 8 years and over, by sex, race and ethnicity, and age: United States, 1999–2006—Con.
Percentile Sample Standard
Sex, race and ethnicity, and age size Mean deviation 5th 10th 15th 25th 50th 75th 85th 90th 95th
Female
All races and ethnicities 8–11 years . . . . . . . . . . . . . . . . 1,465 45.16 13.26 26.93 29.65 31.86 35.21 43.56 52.67 58.72 63.34 68.90 12–15 years . . . . . . . . . . . . . . . 2,318 69.93 17.10 45.78 49.70 53.39 58.51 68.08 79.23 86.14 92.40 102.31 16–19 years . . . . . . . . . . . . . . . 2,027 80.04 18.31 55.76 59.55 62.29 67.47 77.89 89.93 97.57 102.81 111.59 20–29 years . . . . . . . . . . . . . . . 1,378 82.83 19.87 56.13 60.88 64.65 68.76 80.34 93.27 100.92 106.87 119.01 30–39 years . . . . . . . . . . . . . . . 1,372 85.17 22.80 55.49 60.84 64.07 69.61 81.42 97.21 106.15 114.00 125.62 40–49 years . . . . . . . . . . . . . . . 1,570 84.26 21.31 53.26 58.80 62.84 68.91 81.86 96.86 105.40 110.89 120.73 50–59 years . . . . . . . . . . . . . . . 1,200 81.90 21.15 53.06 57.25 61.03 66.90 79.85 93.74 101.77 108.17 120.68 60–69 years . . . . . . . . . . . . . . . 1,419 76.25 20.64 46.10 51.32 55.18 61.85 74.30 88.43 97.45 103.39 111.91 70–79 years . . . . . . . . . . . . . . . 750 67.36 18.81 37.71 45.45 48.87 54.45 65.90 78.69 86.15 90.43 99.53 80 years and over . . . . . . . . . . . 594 56.06 16.45 32.16 36.55 39.38 44.44 54.47 67.40 73.03 77.15 84.05
20 years and over (age-adjusted) . . 8,283 80.29 . . . . . . . . . . . . . . . . . . . . . . . . . . . . . .
Mexican American 8–11 years . . . . . . . . . . . . . . . . 471 44.89 14.28 26.27 28.83 30.85 34.28 41.97 53.21 59.68 63.62 71.03 12–15 years . . . . . . . . . . . . . . . 821 69.07 16.45 44.90 49.38 52.37 58.32 68.40 77.82 84.57 90.55 97.90 16–19 years . . . . . . . . . . . . . . . 692 78.52 18.09 54.92 58.91 61.95 66.28 75.98 87.06 96.62 102.96 110.84 20–29 years . . . . . . . . . . . . . . . 364 84.89 19.25 56.64 61.92 66.05 70.52 82.98 97.43 103.08 108.97 116.83 30–39 years . . . . . . . . . . . . . . . 298 84.68 19.22 58.11 62.55 65.41 71.10 83.09 95.97 102.15 109.61 118.04 40–49 years . . . . . . . . . . . . . . . 372 86.60 18.61 58.01 62.60 66.86 73.78 85.49 98.83 105.91 109.17 116.48 50–59 years . . . . . . . . . . . . . . . 194 81.91 17.55 55.82 61.50 65.06 69.71 80.06 91.22 101.06 105.01 111.92 60–69 years . . . . . . . . . . . . . . . 375 75.01 18.72 48.48 52.02 56.03 61.09 73.47 86.16 93.44 100.07 108.54 70–79 years . . . . . . . . . . . . . . . 154 *66.10 19.25 *37.24 *43.26 *48.93 *53.33 *63.71 *75.60 *84.85 *90.90 † 80 years and over . . . . . . . . . . . 47 *52.39 16.42 *29.16 *32.57 *35.59 *41.14 *49.34 *59.64 *66.78 *71.91 †
20 years and over (age-adjusted) . . 1,804 80.67 . . . . . . . . . . . . . . . . . . . . . . . . . . . . . .
Non-Hispanic white 8–11 years . . . . . . . . . . . . . . . . 383 44.34 12.68 26.82 29.35 31.14 34.93 42.88 50.93 57.54 61.82 67.08 12–15 years . . . . . . . . . . . . . . . 576 68.70 16.43 45.61 48.59 51.82 57.65 67.14 78.34 84.38 90.37 98.07 16–19 years . . . . . . . . . . . . . . . 543 78.73 16.47 55.91 58.84 61.90 66.97 77.13 89.36 95.19 99.52 108.21 20–29 years . . . . . . . . . . . . . . . 583 80.87 18.32 56.32 60.69 64.46 67.93 78.42 90.44 97.82 102.35 113.97 30–39 years . . . . . . . . . . . . . . . 612 83.28 22.61 53.94 58.77 62.78 68.50 79.55 94.19 103.48 113.07 124.30 40–49 years . . . . . . . . . . . . . . . 668 82.75 21.08 52.85 57.40 61.13 67.00 80.65 95.90 104.45 109.47 118.11 50–59 years . . . . . . . . . . . . . . . 639 81.12 21.04 52.86 56.98 60.20 65.85 79.15 93.02 100.55 106.75 120.11 60–69 years . . . . . . . . . . . . . . . 644 76.04 20.55 45.43 51.01 55.28 61.94 74.25 88.14 96.89 102.67 111.10 70–79 years . . . . . . . . . . . . . . . 429 67.14 18.81 37.11 45.10 48.82 54.72 65.75 78.56 85.62 89.35 97.34 80 years and over . . . . . . . . . . . 457 56.10 16.34 32.32 36.77 39.72 44.49 54.33 67.27 72.76 77.33 83.87
20 years and over (age-adjusted) . . 4,032 79.04 . . . . . . . . . . . . . . . . . . . . . . . . . . . . . .
Non-Hispanic black 8–11 years . . . . . . . . . . . . . . . . 490 48.65 14.80 27.91 31.85 34.17 37.74 46.37 57.10 64.17 68.67 75.17 12–15 years . . . . . . . . . . . . . . . 737 76.29 18.91 50.75 54.56 58.13 62.93 73.20 87.22 95.42 102.74 109.68 16–19 years . . . . . . . . . . . . . . . 609 88.77 24.14 59.44 64.01 66.98 72.29 84.39 99.89 108.61 117.44 130.25 20–29 years . . . . . . . . . . . . . . . 297 92.54 23.68 57.79 65.24 69.71 76.33 89.54 105.94 114.88 120.01 133.00 30–39 years . . . . . . . . . . . . . . . 333 95.68 25.33 61.62 68.67 71.72 78.08 92.81 107.96 118.04 128.28 144.57 40–49 years . . . . . . . . . . . . . . . 398 93.94 22.85 60.99 68.29 72.07 79.33 91.85 105.76 113.86 120.00 134.04 50–59 years . . . . . . . . . . . . . . . 250 89.63 22.09 55.87 63.79 67.66 74.76 86.45 102.19 110.58 117.77 129.75 60–69 years . . . . . . . . . . . . . . . 306 85.40 21.72 54.17 59.51 63.75 69.97 82.27 100.23 106.85 113.65 124.76 70–79 years . . . . . . . . . . . . . . . 124 73.08 19.83 43.51 51.15 52.53 58.43 69.61 84.94 94.78 99.81 106.99 80 years and over . . . . . . . . . . . 58 *60.25 16.98 *33.43 *36.90 *39.74 *48.02 *58.32 *72.41 *76.04 *79.32 *88.34
20 years and over (age-adjusted) . . 1,766 89.21 . . . . . . . . . . . . . . . . . . . . . . . . . . . . . .
. . . Category not applicable.
* Figure does not meet standards of reliability or precision; relative standard error (standard error divided by estimate times 100) is 30%–39% or estimate is based on less than 12 degrees of freedom.
† Standard error not calculated by SUDAAN software.
NOTE: g is grams.
SOURCE: National Health and Nutrition Examination Survey, 1999–2006.

Series 11, No. 253 [ Page 71
Table 33. Right ribs bone mineral density (g/cm2) of persons aged 8 years and over, by sex, race and ethnicity, and age: United States, 1999–2006
Percentile Sample Standard
Sex, race and ethnicity, and age size Mean deviation 5th 10th 15th 25th 50th 75th 85th 90th 95th
Male
All races and ethnicities 8–11 years . . . . . . . . . . . . . . . . 1,421 0.527 0.056 0.440 0.456 0.467 0.485 0.522 0.565 0.586 0.602 0.620 12–15 years . . . . . . . . . . . . . . . 2,264 0.633 0.088 0.496 0.522 0.542 0.568 0.626 0.690 0.722 0.745 0.790 16–19 years . . . . . . . . . . . . . . . 2,309 0.750 0.087 0.613 0.645 0.664 0.690 0.744 0.802 0.836 0.865 0.906 20–29 years . . . . . . . . . . . . . . . 1,530 0.752 0.086 0.614 0.646 0.663 0.692 0.747 0.808 0.841 0.863 0.905 30–39 years . . . . . . . . . . . . . . . 1,450 0.730 0.084 0.607 0.626 0.645 0.669 0.723 0.779 0.818 0.848 0.877 40–49 years . . . . . . . . . . . . . . . 1,549 0.721 0.083 0.593 0.617 0.634 0.658 0.719 0.771 0.806 0.826 0.862 50–59 years . . . . . . . . . . . . . . . 1,187 0.708 0.084 0.578 0.602 0.621 0.646 0.702 0.758 0.792 0.816 0.851 60–69 years . . . . . . . . . . . . . . . 1,350 0.707 0.088 0.574 0.600 0.619 0.648 0.696 0.762 0.798 0.827 0.857 70–79 years . . . . . . . . . . . . . . . 825 0.679 0.087 0.543 0.571 0.589 0.618 0.672 0.737 0.767 0.786 0.832 80 years and over . . . . . . . . . . . 501 0.663 0.088 0.534 0.557 0.575 0.597 0.655 0.721 0.756 0.786 0.823
20 years and over (age-adjusted) . . 8,392 0.719 . . . . . . . . . . . . . . . . . . . . . . . . . . . . . .
Mexican American 8–11 years . . . . . . . . . . . . . . . . 468 0.527 0.056 0.440 0.454 0.464 0.482 0.524 0.567 0.590 0.605 0.623 12–15 years . . . . . . . . . . . . . . . 777 0.629 0.087 0.500 0.522 0.537 0.568 0.621 0.681 0.720 0.745 0.788 16–19 years . . . . . . . . . . . . . . . 783 0.725 0.081 0.599 0.624 0.644 0.670 0.719 0.770 0.803 0.824 0.866 20–29 years . . . . . . . . . . . . . . . 444 0.730 0.073 0.609 0.641 0.655 0.680 0.726 0.776 0.807 0.824 0.855 30–39 years . . . . . . . . . . . . . . . 337 0.715 0.076 0.602 0.620 0.636 0.658 0.707 0.764 0.792 0.813 0.854 40–49 years . . . . . . . . . . . . . . . 381 0.706 0.075 0.585 0.607 0.625 0.652 0.706 0.751 0.781 0.807 0.836 50–59 years . . . . . . . . . . . . . . . 174 0.703 0.081 0.573 0.600 0.618 0.648 0.694 0.753 0.780 0.801 0.851 60–69 years . . . . . . . . . . . . . . . 348 0.693 0.076 0.578 0.600 0.618 0.642 0.682 0.741 0.771 0.794 0.830 70–79 years . . . . . . . . . . . . . . . 164 *0.666 0.081 *0.530 *0.552 *0.576 *0.606 *0.668 *0.722 *0.755 *0.771 *0.790 80 years and over . . . . . . . . . . . 48 *0.643 0.084 *0.506 *0.528 *0.546 *0.591 *0.623 *0.693 *0.729 *0.760 *0.794
20 years and over (age-adjusted) . . 1,896 0.704 . . . . . . . . . . . . . . . . . . . . . . . . . . . . . .
Non-Hispanic white 8–11 years . . . . . . . . . . . . . . . . 369 0.523 0.055 0.438 0.451 0.464 0.482 0.517 0.562 0.580 0.597 0.613 12–15 years . . . . . . . . . . . . . . . 578 0.633 0.089 0.491 0.519 0.541 0.567 0.626 0.692 0.722 0.743 0.791 16–19 years . . . . . . . . . . . . . . . 591 0.750 0.087 0.614 0.646 0.666 0.691 0.746 0.802 0.833 0.864 0.897 20–29 years . . . . . . . . . . . . . . . 617 0.749 0.082 0.614 0.648 0.664 0.692 0.745 0.801 0.835 0.854 0.888 30–39 years . . . . . . . . . . . . . . . 647 0.728 0.082 0.606 0.625 0.645 0.671 0.723 0.777 0.809 0.841 0.873 40–49 years . . . . . . . . . . . . . . . 700 0.719 0.082 0.592 0.618 0.635 0.656 0.718 0.769 0.803 0.822 0.857 50–59 years . . . . . . . . . . . . . . . 683 0.705 0.082 0.580 0.601 0.620 0.645 0.700 0.753 0.788 0.808 0.845 60–69 years . . . . . . . . . . . . . . . 623 0.706 0.086 0.576 0.603 0.621 0.649 0.695 0.759 0.793 0.821 0.851 70–79 years . . . . . . . . . . . . . . . 496 0.679 0.086 0.546 0.572 0.589 0.617 0.671 0.737 0.766 0.784 0.831 80 years and over . . . . . . . . . . . 398 0.661 0.084 0.534 0.557 0.574 0.596 0.654 0.719 0.751 0.782 0.804
20 years and over (age-adjusted) . . 4,164 0.717 . . . . . . . . . . . . . . . . . . . . . . . . . . . . . .
Non-Hispanic black 8–11 years . . . . . . . . . . . . . . . . 469 0.546 0.059 0.448 0.471 0.484 0.503 0.544 0.584 0.611 0.622 0.642 12–15 years . . . . . . . . . . . . . . . 745 0.652 0.089 0.515 0.539 0.560 0.589 0.645 0.708 0.743 0.773 0.803 16–19 years . . . . . . . . . . . . . . . 757 0.778 0.088 0.640 0.671 0.692 0.718 0.770 0.830 0.868 0.894 0.937 20–29 years . . . . . . . . . . . . . . . 325 0.809 0.096 0.658 0.687 0.708 0.746 0.812 0.864 0.895 0.929 0.968 30–39 years . . . . . . . . . . . . . . . 310 0.785 0.095 0.627 0.661 0.686 0.720 0.780 0.852 0.875 0.917 0.950 40–49 years . . . . . . . . . . . . . . . 366 0.755 0.094 0.613 0.635 0.665 0.690 0.746 0.811 0.847 0.873 0.918 50–59 years . . . . . . . . . . . . . . . 240 0.757 0.090 0.618 0.648 0.668 0.697 0.755 0.809 0.842 0.884 0.913 60–69 years . . . . . . . . . . . . . . . 303 0.753 0.094 0.603 0.636 0.657 0.690 0.753 0.813 0.848 0.872 0.904 70–79 years . . . . . . . . . . . . . . . 114 0.711 0.094 0.561 0.592 0.616 0.651 0.697 0.765 0.808 0.831 0.870 80 years and over . . . . . . . . . . . 36 *0.714 0.107 † *0.601 *0.604 *0.626 *0.695 *0.763 *0.828 *0.854 †
20 years and over (age-adjusted) . . 1,694 0.766 . . . . . . . . . . . . . . . . . . . . . . . . . . . . . .
See footnotes at end of table.

Page 72 [ Series 11, No. 253
Table 33. Right ribs bone mineral density (g/cm2) of persons aged 8 years and over, by sex, race and ethnicity, and age: United States, 1999–2006—Con.
Percentile Sample Standard
Sex, race and ethnicity, and age size Mean deviation 5th 10th 15th 25th 50th 75th 85th 90th 95th
Female
All races and ethnicities 8–11 years . . . . . . . . . . . . . . . . 1,465 0.515 0.058 0.422 0.441 0.455 0.474 0.511 0.552 0.574 0.589 0.614 12–15 years . . . . . . . . . . . . . . . 2,318 0.619 0.069 0.511 0.534 0.550 0.573 0.614 0.662 0.689 0.710 0.739 16–19 years . . . . . . . . . . . . . . . 2,027 0.666 0.069 0.563 0.584 0.595 0.615 0.662 0.708 0.737 0.756 0.793 20–29 years . . . . . . . . . . . . . . . 1,378 0.665 0.071 0.558 0.579 0.592 0.614 0.660 0.706 0.733 0.757 0.795 30–39 years . . . . . . . . . . . . . . . 1,372 0.664 0.074 0.554 0.574 0.588 0.613 0.655 0.710 0.737 0.759 0.793 40–49 years . . . . . . . . . . . . . . . 1,570 0.653 0.074 0.543 0.564 0.577 0.600 0.644 0.699 0.730 0.752 0.782 50–59 years . . . . . . . . . . . . . . . 1,200 0.631 0.076 0.514 0.534 0.553 0.578 0.624 0.677 0.707 0.731 0.763 60–69 years . . . . . . . . . . . . . . . 1,419 0.606 0.077 0.495 0.513 0.530 0.553 0.599 0.651 0.684 0.707 0.739 70–79 years . . . . . . . . . . . . . . . 750 0.579 0.070 0.468 0.494 0.510 0.533 0.574 0.617 0.650 0.674 0.707 80 years and over . . . . . . . . . . . 594 0.549 0.071 0.440 0.463 0.481 0.500 0.542 0.591 0.619 0.637 0.670
20 years and over (age-adjusted) . . 8,283 0.638 . . . . . . . . . . . . . . . . . . . . . . . . . . . . . .
Mexican American 8–11 years . . . . . . . . . . . . . . . . 471 0.512 0.063 0.415 0.433 0.446 0.469 0.504 0.550 0.580 0.600 0.626 12–15 years . . . . . . . . . . . . . . . 821 0.616 0.067 0.504 0.531 0.545 0.571 0.617 0.656 0.682 0.699 0.727 16–19 years . . . . . . . . . . . . . . . 692 0.655 0.066 0.557 0.575 0.589 0.609 0.652 0.693 0.718 0.739 0.776 20–29 years . . . . . . . . . . . . . . . 364 0.661 0.066 0.555 0.578 0.592 0.615 0.657 0.701 0.723 0.743 0.772 30–39 years . . . . . . . . . . . . . . . 298 0.661 0.069 0.562 0.579 0.591 0.610 0.655 0.702 0.730 0.745 0.776 40–49 years . . . . . . . . . . . . . . . 372 0.657 0.070 0.549 0.570 0.583 0.603 0.655 0.702 0.729 0.746 0.780 50–59 years . . . . . . . . . . . . . . . 194 0.629 0.076 0.518 0.535 0.550 0.567 0.621 0.678 0.707 0.731 0.753 60–69 years . . . . . . . . . . . . . . . 375 0.592 0.075 0.481 0.503 0.515 0.538 0.582 0.640 0.677 0.692 0.724 70–79 years . . . . . . . . . . . . . . . 154 *0.568 0.069 *0.452 *0.480 *0.496 *0.516 *0.566 *0.613 *0.637 *0.650 *0.675 80 years and over . . . . . . . . . . . 47 *0.543 0.079 *0.422 *0.438 *0.448 *0.485 *0.540 *0.593 *0.619 *0.635 †
20 years and over (age-adjusted) . . 1,804 0.635 . . . . . . . . . . . . . . . . . . . . . . . . . . . . . .
Non-Hispanic white 8–11 years . . . . . . . . . . . . . . . . 383 0.510 0.055 0.421 0.436 0.452 0.470 0.508 0.545 0.565 0.577 0.598 12–15 years . . . . . . . . . . . . . . . 576 0.614 0.068 0.506 0.530 0.544 0.565 0.611 0.658 0.684 0.701 0.733 16–19 years . . . . . . . . . . . . . . . 543 0.662 0.064 0.564 0.586 0.595 0.614 0.657 0.701 0.726 0.745 0.775 20–29 years . . . . . . . . . . . . . . . 583 0.658 0.065 0.556 0.576 0.588 0.611 0.656 0.699 0.722 0.741 0.772 30–39 years . . . . . . . . . . . . . . . 612 0.656 0.072 0.548 0.566 0.582 0.606 0.650 0.702 0.731 0.745 0.777 40–49 years . . . . . . . . . . . . . . . 668 0.646 0.071 0.538 0.558 0.573 0.598 0.640 0.690 0.721 0.742 0.771 50–59 years . . . . . . . . . . . . . . . 639 0.627 0.072 0.515 0.534 0.553 0.578 0.622 0.671 0.697 0.720 0.750 60–69 years . . . . . . . . . . . . . . . 644 0.606 0.075 0.497 0.516 0.531 0.554 0.599 0.650 0.683 0.705 0.733 70–79 years . . . . . . . . . . . . . . . 429 0.579 0.070 0.465 0.494 0.511 0.533 0.572 0.615 0.650 0.674 0.707 80 years and over . . . . . . . . . . . 457 0.548 0.069 0.441 0.468 0.482 0.500 0.542 0.588 0.614 0.631 0.663
20 years and over (age-adjusted) . . 4,032 0.633 . . . . . . . . . . . . . . . . . . . . . . . . . . . . . .
Non-Hispanic black 8–11 years . . . . . . . . . . . . . . . . 490 0.536 0.062 0.442 0.459 0.474 0.494 0.532 0.576 0.602 0.617 0.634 12–15 years . . . . . . . . . . . . . . . 737 0.652 0.073 0.536 0.558 0.575 0.597 0.648 0.704 0.731 0.750 0.774 16–19 years . . . . . . . . . . . . . . . 609 0.705 0.076 0.583 0.604 0.627 0.652 0.699 0.750 0.784 0.807 0.833 20–29 years . . . . . . . . . . . . . . . 297 0.710 0.082 0.586 0.606 0.626 0.653 0.706 0.758 0.792 0.817 0.847 30–39 years . . . . . . . . . . . . . . . 333 0.707 0.080 0.588 0.610 0.625 0.649 0.698 0.748 0.788 0.812 0.840 40–49 years . . . . . . . . . . . . . . . 398 0.698 0.078 0.584 0.601 0.615 0.640 0.688 0.753 0.781 0.799 0.834 50–59 years . . . . . . . . . . . . . . . 250 0.672 0.082 0.553 0.569 0.583 0.606 0.675 0.726 0.758 0.775 0.808 60–69 years . . . . . . . . . . . . . . . 306 0.643 0.080 0.523 0.549 0.562 0.588 0.633 0.690 0.725 0.753 0.783 70–79 years . . . . . . . . . . . . . . . 124 0.610 0.072 0.491 0.510 0.526 0.559 0.604 0.656 0.686 0.707 0.732 80 years and over . . . . . . . . . . . 58 *0.590 0.075 *0.457 *0.485 *0.506 *0.528 *0.589 *0.650 *0.665 *0.680 *0.692
20 years and over (age-adjusted) . . 1,766 0.680 . . . . . . . . . . . . . . . . . . . . . . . . . . . . . .
. . . Category not applicable.
* Figure does not meet standards of reliability or precision; relative standard error (standard error divided by estimate times 100) is 30%–39% or estimate is based on less than 12 degrees of freedom.
† Standard error not calculated by SUDAAN software.
NOTE: g/cm2 is grams per centimeter squared.
SOURCE: National Health and Nutrition Examination Survey, 1999–2006.

Series 11, No. 253 [ Page 73
Table 34. Left ribs bone area (cm2) of persons aged 8 years and over, by sex, race and ethnicity, and age: United States, 1999–2006
Percentile Sample Standard
Sex, race and ethnicity, and age size Mean deviation 5th 10th 15th 25th 50th 75th 85th 90th 95th
Male
All races and ethnicities 8–11 years . . . . . . . . . . . . . . . . 1,421 88.13 16.10 66.07 69.50 72.36 76.48 85.96 97.65 104.40 109.66 119.45 12–15 years . . . . . . . . . . . . . . . 2,264 111.39 21.99 78.20 84.21 88.96 95.46 110.14 124.11 132.73 139.07 149.34 16–19 years . . . . . . . . . . . . . . . 2,309 130.72 20.01 101.12 106.71 111.14 117.83 128.65 140.85 149.12 155.93 167.81 20–29 years . . . . . . . . . . . . . . . 1,530 135.17 22.43 102.80 109.91 113.63 120.08 132.36 147.00 155.78 163.19 176.50 30–39 years . . . . . . . . . . . . . . . 1,450 134.07 21.91 102.76 108.05 112.66 119.10 131.34 146.38 155.60 162.63 173.04 40–49 years . . . . . . . . . . . . . . . 1,549 132.15 21.39 100.52 106.27 111.02 117.01 129.80 145.28 153.65 158.91 168.80 50–59 years . . . . . . . . . . . . . . . 1,187 129.69 21.35 97.57 103.41 108.24 115.01 127.86 142.44 150.43 157.39 167.71 60–69 years . . . . . . . . . . . . . . . 1,350 128.38 20.89 96.17 103.39 107.39 113.73 126.61 142.16 149.93 155.35 163.88 70–79 years . . . . . . . . . . . . . . . 825 124.03 21.88 91.18 96.87 101.47 108.93 122.63 137.71 147.09 152.69 161.27 80 years and over . . . . . . . . . . . 501 116.99 19.21 87.94 93.15 97.52 102.67 116.83 130.17 136.62 141.43 148.92
20 years and over (age-adjusted) . . 8,392 130.97 . . . . . . . . . . . . . . . . . . . . . . . . . . . . . .
Mexican American 8–11 years . . . . . . . . . . . . . . . . 468 90.63 18.32 64.67 69.60 73.26 76.82 88.22 101.02 109.81 117.26 126.58 12–15 years . . . . . . . . . . . . . . . 777 112.44 21.80 79.44 84.88 89.20 97.24 111.39 124.84 134.61 141.00 152.93 16–19 years . . . . . . . . . . . . . . . 783 126.86 20.48 98.96 102.93 106.99 113.64 124.65 137.10 146.29 152.43 163.31 20–29 years . . . . . . . . . . . . . . . 444 129.82 20.30 99.96 105.98 109.86 116.06 127.04 141.97 150.21 155.48 163.58 30–39 years . . . . . . . . . . . . . . . 337 132.87 20.71 101.62 107.00 110.77 119.05 130.92 147.02 154.05 159.49 169.59 40–49 years . . . . . . . . . . . . . . . 381 129.26 20.30 96.61 105.34 109.77 115.81 128.22 140.75 148.79 153.48 163.31 50–59 years . . . . . . . . . . . . . . . 174 126.26 19.47 98.51 104.34 108.36 112.62 122.18 137.61 144.24 151.71 159.00 60–69 years . . . . . . . . . . . . . . . 348 127.27 19.96 97.28 102.97 106.07 112.89 125.23 140.74 147.71 153.83 161.60 70–79 years . . . . . . . . . . . . . . . 164 *119.46 18.29 *89.17 *95.26 *100.81 *103.75 *120.03 *132.12 *140.08 *143.30 *149.28 80 years and over . . . . . . . . . . . 48 *119.65 21.03 *84.06 *88.07 *94.92 *106.82 *118.19 *132.96 *138.70 *144.57 *156.18
20 years and over (age-adjusted) . . 1,896 128.20 . . . . . . . . . . . . . . . . . . . . . . . . . . . . . .
Non-Hispanic white 8–11 years . . . . . . . . . . . . . . . . 369 87.16 15.31 65.61 69.03 71.47 76.20 85.15 96.58 103.04 108.26 113.50 12–15 years . . . . . . . . . . . . . . . 578 111.32 21.81 77.99 83.69 89.32 95.52 110.59 123.74 131.47 137.69 148.64 16–19 years . . . . . . . . . . . . . . . 591 130.95 19.36 102.25 107.26 111.92 118.93 128.97 140.74 148.54 155.42 169.54 20–29 years . . . . . . . . . . . . . . . 617 135.74 22.07 103.93 111.16 115.03 120.67 132.98 146.88 155.94 163.74 176.82 30–39 years . . . . . . . . . . . . . . . 647 134.06 21.88 103.10 108.32 113.18 118.96 131.06 146.02 156.11 162.78 173.20 40–49 years . . . . . . . . . . . . . . . 700 132.88 21.64 100.84 106.41 111.61 117.47 130.89 146.02 154.58 159.70 169.47 50–59 years . . . . . . . . . . . . . . . 683 130.06 21.42 97.58 103.84 108.71 115.25 128.01 142.92 151.07 157.82 167.71 60–69 years . . . . . . . . . . . . . . . 623 129.44 20.79 97.29 104.54 108.18 114.72 127.58 143.08 151.34 156.36 164.73 70–79 years . . . . . . . . . . . . . . . 496 124.57 22.20 91.03 96.06 101.14 109.22 123.34 138.92 148.44 152.94 161.62 80 years and over . . . . . . . . . . . 398 116.68 18.96 87.44 92.93 97.40 102.55 116.72 129.93 136.23 140.26 147.18
20 years and over (age-adjusted) . . 4,164 131.42 . . . . . . . . . . . . . . . . . . . . . . . . . . . . . .
Non-Hispanic black 8–11 years . . . . . . . . . . . . . . . . 469 89.02 16.34 66.50 70.31 73.43 78.16 86.29 97.85 106.18 111.49 119.81 12–15 years . . . . . . . . . . . . . . . 745 113.90 21.76 81.12 87.82 91.94 99.19 112.05 126.68 135.46 141.19 150.93 16–19 years . . . . . . . . . . . . . . . 757 132.74 21.17 103.33 109.90 113.45 118.73 129.92 143.35 151.39 158.15 170.63 20–29 years . . . . . . . . . . . . . . . 325 137.31 21.93 106.45 112.42 115.77 123.16 135.96 148.07 155.53 160.27 175.33 30–39 years . . . . . . . . . . . . . . . 310 138.55 23.40 106.33 112.76 117.11 121.94 135.20 149.99 160.16 168.21 180.39 40–49 years . . . . . . . . . . . . . . . 366 133.15 20.88 103.66 109.50 113.02 118.42 129.93 146.75 153.68 158.32 169.64 50–59 years . . . . . . . . . . . . . . . 240 131.51 21.13 98.08 106.16 111.96 116.56 130.78 142.78 152.66 157.75 167.14 60–69 years . . . . . . . . . . . . . . . 303 129.27 20.74 98.39 105.19 108.22 115.79 127.54 141.70 147.19 152.87 164.63 70–79 years . . . . . . . . . . . . . . . 114 123.14 20.36 94.34 98.51 102.72 107.91 121.23 134.54 141.11 150.00 158.23 80 years and over . . . . . . . . . . . 36 *117.20 20.07 † *93.56 *96.99 *100.68 *112.29 *128.36 *135.66 *142.74 †
20 years and over (age-adjusted) . . 1,694 132.84 . . . . . . . . . . . . . . . . . . . . . . . . . . . . . .
See footnotes at end of table.

Page 74 [ Series 11, No. 253
Table 34. Left ribs bone area (cm2) of persons aged 8 years and over, by sex, race and ethnicity, and age: United States, 1999–2006—Con.
Percentile Sample Standard
Sex, race and ethnicity, and age size Mean deviation 5th 10th 15th 25th 50th 75th 85th 90th 95th
Female
All races and ethnicities 8–11 years . . . . . . . . . . . . . . . . 1,465 88.44 16.80 63.36 68.10 71.10 76.45 87.25 99.52 105.40 110.27 117.15 12–15 years . . . . . . . . . . . . . . . 2,318 113.12 17.63 86.70 91.34 95.75 101.94 112.46 123.62 130.50 134.99 144.18 16–19 years . . . . . . . . . . . . . . . 2,027 119.19 17.72 94.15 98.66 101.93 106.85 117.16 129.43 137.24 141.44 151.59 20–29 years . . . . . . . . . . . . . . . 1,378 121.38 19.26 94.56 99.28 103.15 108.66 119.01 131.71 140.38 145.40 155.19 30–39 years . . . . . . . . . . . . . . . 1,372 120.90 20.06 92.26 97.03 101.15 106.96 117.90 132.56 142.01 147.69 156.97 40–49 years . . . . . . . . . . . . . . . 1,570 118.02 19.17 90.50 94.45 99.19 104.66 116.04 128.91 137.11 143.40 152.07 50–59 years . . . . . . . . . . . . . . . 1,200 116.21 18.89 87.36 93.21 97.46 103.86 114.32 127.66 134.80 140.08 149.73 60–69 years . . . . . . . . . . . . . . . 1,419 111.74 18.62 82.78 88.57 92.78 98.62 110.83 123.97 129.96 135.18 143.09 70–79 years . . . . . . . . . . . . . . . 750 105.25 18.03 77.26 83.38 87.86 92.94 104.63 115.99 122.72 128.83 137.14 80 years and over . . . . . . . . . . . 594 98.60 16.95 71.46 76.43 80.49 87.81 97.87 109.51 115.50 120.23 128.65
20 years and over (age-adjusted) . . 8,283 116.36 . . . . . . . . . . . . . . . . . . . . . . . . . . . . . .
Mexican American 8–11 years . . . . . . . . . . . . . . . . 471 90.23 17.93 64.36 68.87 72.07 77.41 88.23 101.24 108.18 113.71 122.99 12–15 years . . . . . . . . . . . . . . . 821 113.95 17.86 87.19 92.69 96.29 101.59 112.26 125.85 133.16 135.54 143.84 16–19 years . . . . . . . . . . . . . . . 692 119.00 17.85 93.18 98.47 102.11 107.04 116.91 127.72 135.83 141.24 153.16 20–29 years . . . . . . . . . . . . . . . 364 123.82 17.16 97.13 101.52 105.80 111.98 122.60 133.55 141.28 146.02 154.14 30–39 years . . . . . . . . . . . . . . . 298 121.20 18.47 92.91 98.71 102.79 108.71 120.39 131.88 138.88 142.69 149.55 40–49 years . . . . . . . . . . . . . . . 372 120.61 17.53 93.31 97.40 101.97 107.98 119.15 130.84 138.62 144.76 152.39 50–59 years . . . . . . . . . . . . . . . 194 116.22 16.34 91.68 95.74 98.95 104.12 114.81 126.69 131.10 136.18 141.93 60–69 years . . . . . . . . . . . . . . . 375 108.68 17.14 82.27 88.14 91.32 95.47 107.94 119.88 125.89 129.64 137.06 70–79 years . . . . . . . . . . . . . . . 154 *106.13 17.21 *77.00 *83.25 *87.91 *93.62 *104.88 *119.22 *123.11 *128.83 *133.54 80 years and over . . . . . . . . . . . 47 *97.59 13.99 *71.74 *78.73 *85.56 *88.90 *96.57 *106.59 *111.23 *112.49 †
20 years and over (age-adjusted) . . 1,804 117.15 . . . . . . . . . . . . . . . . . . . . . . . . . . . . . .
Non-Hispanic white 8–11 years . . . . . . . . . . . . . . . . 383 87.36 16.27 63.12 68.38 70.89 75.39 85.92 97.42 103.92 107.71 114.09 12–15 years . . . . . . . . . . . . . . . 576 112.58 17.54 85.81 90.22 94.83 101.91 112.73 122.79 129.43 133.27 141.46 16–19 years . . . . . . . . . . . . . . . 543 118.42 16.41 93.80 98.97 102.28 107.11 117.24 128.01 135.21 139.36 147.73 20–29 years . . . . . . . . . . . . . . . 583 121.04 19.29 94.20 99.96 103.39 108.47 118.59 131.35 140.03 144.63 153.70 30–39 years . . . . . . . . . . . . . . . 612 119.57 19.65 90.81 96.28 99.96 106.29 116.23 131.61 140.37 147.04 155.80 40–49 years . . . . . . . . . . . . . . . 668 116.96 19.09 89.85 93.63 98.30 103.32 114.74 127.65 135.54 142.55 151.60 50–59 years . . . . . . . . . . . . . . . 639 115.86 18.45 87.52 93.58 97.62 104.04 113.77 126.89 133.73 138.64 148.97 60–69 years . . . . . . . . . . . . . . . 644 111.39 18.51 82.09 87.70 92.73 98.35 110.91 123.89 129.32 134.25 141.78 70–79 years . . . . . . . . . . . . . . . 429 105.23 17.82 76.43 83.64 87.64 93.23 104.99 115.93 122.26 128.44 136.49 80 years and over . . . . . . . . . . . 457 98.41 17.00 71.44 76.35 80.25 87.14 97.73 109.52 115.17 120.09 128.83
20 years and over (age-adjusted) . . 4,032 115.69 . . . . . . . . . . . . . . . . . . . . . . . . . . . . . .
Non-Hispanic black 8–11 years . . . . . . . . . . . . . . . . 490 91.02 17.91 64.53 69.00 72.83 78.57 89.11 101.88 109.60 115.65 122.77 12–15 years . . . . . . . . . . . . . . . 737 115.01 17.77 89.50 94.17 97.71 102.90 112.52 125.74 132.91 139.65 147.88 16–19 years . . . . . . . . . . . . . . . 609 122.92 21.88 92.80 99.41 102.37 107.55 119.56 133.78 144.06 150.79 164.19 20–29 years . . . . . . . . . . . . . . . 297 124.62 21.00 95.34 99.99 105.11 111.37 121.70 136.08 144.47 152.23 160.20 30–39 years . . . . . . . . . . . . . . . 333 127.70 21.84 96.98 102.28 105.74 112.33 125.16 140.69 149.38 154.84 166.20 40–49 years . . . . . . . . . . . . . . . 398 123.32 20.33 94.17 99.63 103.98 109.55 121.70 134.76 141.87 147.13 157.08 50–59 years . . . . . . . . . . . . . . . 250 122.41 19.55 94.13 98.02 102.43 108.75 121.18 134.93 141.51 146.97 157.34 60–69 years . . . . . . . . . . . . . . . 306 118.86 19.46 90.63 96.19 99.81 104.65 117.15 131.99 139.79 145.13 154.62 70–79 years . . . . . . . . . . . . . . . 124 112.04 20.38 84.99 89.25 92.17 95.87 109.50 123.54 133.54 139.40 146.65 80 years and over . . . . . . . . . . . 58 *102.51 17.43 *71.01 *79.35 *82.92 *93.05 *101.86 *113.67 *118.67 *123.71 *129.25
20 years and over (age-adjusted) . . 1,766 121.99 . . . . . . . . . . . . . . . . . . . . . . . . . . . . . .
. . . Category not applicable.
* Figure does not meet standards of reliability or precision; relative standard error (standard error divided by estimate times 100) is 30%–39% or estimate is based on less than 12 degrees of freedom.
† Standard error not calculated by SUDAAN software.
NOTE: cm2 is centimeter squared.
SOURCE: National Health and Nutrition Examination Survey, 1999–2006.

Series 11, No. 253 [ Page 75
Table 35. Left ribs bone mineral content (g) of persons aged 8 years and over, by sex, race and ethnicity, and age: United States, 1999–2006
Percentile Sample Standard
Sex, race and ethnicity, and age size Mean deviation 5th 10th 15th 25th 50th 75th 85th 90th 95th
Male
All races and ethnicities 8–11 years . . . . . . . . . . . . . . . . 1,421 46.84 11.67 31.08 33.58 35.15 38.24 45.07 53.13 59.58 62.67 68.42 12–15 years . . . . . . . . . . . . . . . 2,264 71.54 20.51 41.74 45.86 49.97 56.34 70.30 84.39 92.90 98.23 107.80 16–19 years . . . . . . . . . . . . . . . 2,309 98.39 20.16 68.42 74.60 78.14 84.52 96.49 110.86 118.60 124.35 134.31 20–29 years . . . . . . . . . . . . . . . 1,530 102.03 21.96 71.29 77.66 81.28 86.44 100.18 113.05 121.77 129.32 140.63 30–39 years . . . . . . . . . . . . . . . 1,450 98.80 21.84 67.84 74.57 78.47 84.28 96.19 110.67 118.53 125.41 136.36 40–49 years . . . . . . . . . . . . . . . 1,549 96.14 19.72 65.98 72.40 77.25 82.68 94.25 108.39 115.91 121.00 129.43 50–59 years . . . . . . . . . . . . . . . 1,187 92.29 19.44 64.56 69.12 71.89 78.59 90.39 104.58 112.38 117.78 126.40 60–69 years . . . . . . . . . . . . . . . 1,350 90.34 19.46 60.91 66.87 70.94 76.44 89.11 102.42 109.52 115.54 123.53 70–79 years . . . . . . . . . . . . . . . 825 83.64 19.36 54.97 59.71 63.82 70.07 81.08 96.43 103.75 108.94 117.13 80 years and over . . . . . . . . . . . 501 76.74 18.10 50.90 54.17 57.70 63.38 75.45 87.76 96.18 101.33 108.62
20 years and over (age-adjusted) . . 8,392 94.66 . . . . . . . . . . . . . . . . . . . . . . . . . . . . . .
Mexican American 8–11 years . . . . . . . . . . . . . . . . 468 48.23 13.02 30.38 33.68 35.51 38.87 45.66 55.98 62.05 67.74 73.82 12–15 years . . . . . . . . . . . . . . . 777 71.93 19.80 42.07 47.16 50.48 57.55 70.23 83.50 92.06 97.04 106.45 16–19 years . . . . . . . . . . . . . . . 783 93.16 19.27 65.62 71.56 75.45 80.53 90.60 103.48 111.84 118.14 126.87 20–29 years . . . . . . . . . . . . . . . 444 95.09 17.56 69.16 74.17 78.21 82.13 93.68 105.85 111.03 115.64 123.49 30–39 years . . . . . . . . . . . . . . . 337 94.94 18.48 67.52 74.68 78.03 83.37 92.48 105.74 112.20 118.24 126.51 40–49 years . . . . . . . . . . . . . . . 381 91.07 17.39 63.58 70.66 74.53 79.93 89.22 101.57 108.65 112.62 120.04 50–59 years . . . . . . . . . . . . . . . 174 88.15 17.23 64.03 67.39 69.73 75.74 87.27 96.83 102.49 108.03 118.29 60–69 years . . . . . . . . . . . . . . . 348 87.66 17.39 62.89 67.28 69.92 75.15 86.25 98.93 105.42 109.26 116.76 70–79 years . . . . . . . . . . . . . . . 164 *79.74 16.42 *52.77 *57.95 *62.61 *68.30 *78.45 *92.07 *97.49 *100.96 *105.12 80 years and over . . . . . . . . . . . 48 *75.07 17.85 *44.31 *49.50 *53.93 *64.19 *73.12 *86.07 *96.28 *99.13 †
20 years and over (age-adjusted) . . 1,896 90.15 . . . . . . . . . . . . . . . . . . . . . . . . . . . . . .
Non-Hispanic white 8–11 years . . . . . . . . . . . . . . . . 369 46.05 11.02 30.38 33.57 34.94 37.67 44.64 52.10 58.29 61.33 65.71 12–15 years . . . . . . . . . . . . . . . 578 71.51 20.55 41.63 45.07 49.67 56.38 70.68 84.06 92.85 98.59 107.60 16–19 years . . . . . . . . . . . . . . . 591 98.72 19.27 68.70 75.52 79.36 85.47 96.99 111.56 118.52 122.56 133.13 20–29 years . . . . . . . . . . . . . . . 617 101.84 20.99 72.28 78.41 81.77 86.68 100.20 112.33 120.68 128.14 138.42 30–39 years . . . . . . . . . . . . . . . 647 98.75 21.40 68.20 75.32 79.04 84.30 96.15 110.12 117.49 124.83 135.72 40–49 years . . . . . . . . . . . . . . . 700 96.55 19.57 66.07 72.91 77.52 83.24 94.69 108.45 116.21 121.07 129.41 50–59 years . . . . . . . . . . . . . . . 683 92.28 18.86 64.83 69.50 72.87 78.76 90.67 104.59 111.54 117.07 125.00 60–69 years . . . . . . . . . . . . . . . 623 90.75 19.04 63.19 67.60 71.35 77.47 89.45 102.26 109.62 115.58 123.40 70–79 years . . . . . . . . . . . . . . . 496 83.98 19.56 55.47 60.19 64.23 70.13 81.17 96.58 103.92 109.81 118.06 80 years and over . . . . . . . . . . . 398 76.16 17.64 50.77 53.96 57.47 63.22 74.58 87.19 95.21 100.58 107.24
20 years and over (age-adjusted) . . 4,164 94.74 . . . . . . . . . . . . . . . . . . . . . . . . . . . . . .
Non-Hispanic black 8–11 years . . . . . . . . . . . . . . . . 469 48.95 12.63 32.14 34.70 36.46 40.23 46.81 56.53 61.79 65.66 71.78 12–15 years . . . . . . . . . . . . . . . 745 75.03 21.15 44.80 50.07 53.70 60.03 72.22 88.24 96.24 101.28 112.13 16–19 years . . . . . . . . . . . . . . . 757 103.37 22.08 73.82 78.41 82.64 88.24 100.57 116.05 124.66 130.21 142.28 20–29 years . . . . . . . . . . . . . . . 325 111.98 25.28 76.93 84.83 88.53 94.16 109.92 124.83 132.95 143.50 155.50 30–39 years . . . . . . . . . . . . . . . 310 109.91 25.12 75.67 80.90 85.54 92.52 106.51 121.20 130.34 139.41 159.68 40–49 years . . . . . . . . . . . . . . . 366 101.69 21.36 71.10 76.56 80.26 86.54 99.02 114.44 122.31 127.28 137.76 50–59 years . . . . . . . . . . . . . . . 240 99.77 22.08 68.26 73.49 78.52 83.77 97.01 112.76 121.88 128.73 137.02 60–69 years . . . . . . . . . . . . . . . 303 97.12 20.34 65.93 72.78 76.06 83.04 95.77 108.39 116.87 123.04 131.70 70–79 years . . . . . . . . . . . . . . . 114 86.70 18.41 56.42 63.77 68.58 73.60 84.57 101.18 106.79 109.09 114.62 80 years and over . . . . . . . . . . . 36 *83.52 18.92 † *59.15 *60.82 *67.43 *80.84 *95.07 *104.49 † †
20 years and over (age-adjusted) . . 1,694 102.48 . . . . . . . . . . . . . . . . . . . . . . . . . . . . . .
See footnotes at end of table.

Page 76 [ Series 11, No. 253
Table 35. Left ribs bone mineral content (g) of persons aged 8 years and over, by sex, race and ethnicity, and age: United States, 1999–2006—Con.
Percentile Sample Standard
Sex, race and ethnicity, and age size Mean deviation 5th 10th 15th 25th 50th 75th 85th 90th 95th
Female
All races and ethnicities 8–11 years . . . . . . . . . . . . . . . . 1,465 45.96 12.70 28.79 31.28 33.10 36.71 44.48 53.40 58.16 62.94 68.94 12–15 years . . . . . . . . . . . . . . . 2,318 70.52 15.85 46.15 51.37 55.10 59.88 69.63 80.24 85.95 90.38 98.33 16–19 years . . . . . . . . . . . . . . . 2,027 79.74 16.56 56.14 60.78 64.21 68.27 77.64 89.13 95.82 100.07 108.36 20–29 years . . . . . . . . . . . . . . . 1,378 80.79 17.01 58.04 61.29 64.39 69.12 79.03 90.37 96.86 101.23 108.98 30–39 years . . . . . . . . . . . . . . . 1,372 80.29 17.92 56.38 60.12 63.08 67.79 78.03 89.54 97.25 103.46 114.13 40–49 years . . . . . . . . . . . . . . . 1,570 77.40 17.41 53.10 57.37 60.75 65.56 75.64 86.55 93.22 100.12 108.85 50–59 years . . . . . . . . . . . . . . . 1,200 73.31 16.56 50.10 54.11 57.61 62.25 71.34 82.50 89.07 94.24 102.20 60–69 years . . . . . . . . . . . . . . . 1,419 67.07 15.69 44.89 48.97 51.91 55.99 65.59 75.46 82.03 87.09 95.20 70–79 years . . . . . . . . . . . . . . . 750 60.21 14.06 39.71 43.58 46.43 50.47 59.14 68.24 74.41 78.30 83.62 80 years and over . . . . . . . . . . . 594 53.32 12.75 33.71 37.58 39.97 44.71 52.58 60.21 66.10 70.71 76.29
20 years and over (age-adjusted) . . 8,283 74.40 . . . . . . . . . . . . . . . . . . . . . . . . . . . . . .
Mexican American 8–11 years . . . . . . . . . . . . . . . . 471 46.60 13.68 28.93 31.11 33.41 36.75 44.07 54.07 60.67 65.01 72.96 12–15 years . . . . . . . . . . . . . . . 821 70.57 15.34 46.79 51.92 54.56 60.58 69.41 80.34 86.86 89.60 95.97 16–19 years . . . . . . . . . . . . . . . 692 77.47 15.21 56.15 59.81 63.05 66.76 76.20 85.78 90.30 94.53 105.27 20–29 years . . . . . . . . . . . . . . . 364 80.95 14.89 59.58 62.92 65.90 69.65 79.17 91.02 96.83 99.74 105.62 30–39 years . . . . . . . . . . . . . . . 298 79.15 15.67 56.19 59.76 63.15 68.81 78.03 88.55 93.41 98.66 103.51 40–49 years . . . . . . . . . . . . . . . 372 78.29 14.98 56.28 60.50 63.19 68.42 76.08 87.06 92.91 97.08 104.68 50–59 years . . . . . . . . . . . . . . . 194 72.52 14.00 51.46 56.51 58.34 62.58 71.18 80.25 85.18 88.62 95.69 60–69 years . . . . . . . . . . . . . . . 375 63.35 13.81 43.16 46.19 49.55 53.82 61.54 71.63 77.37 81.39 87.44 70–79 years . . . . . . . . . . . . . . . 154 *59.55 14.35 *37.88 *39.62 *44.10 *49.36 *59.41 *67.57 *73.96 *78.19 *86.13 80 years and over . . . . . . . . . . . 47 *52.15 10.24 *33.87 *38.74 *40.25 *44.10 *53.25 *58.18 *62.05 *64.69 †
20 years and over (age-adjusted) . . 1,804 73.76 . . . . . . . . . . . . . . . . . . . . . . . . . . . . . .
Non-Hispanic white 8–11 years . . . . . . . . . . . . . . . . 383 45.06 12.02 28.39 30.85 32.64 36.32 43.97 52.20 57.26 60.89 66.82 12–15 years . . . . . . . . . . . . . . . 576 69.43 15.45 45.00 50.94 54.45 58.69 68.94 79.58 84.66 88.80 95.72 16–19 years . . . . . . . . . . . . . . . 543 78.84 14.94 56.05 60.55 64.74 68.12 77.59 88.60 94.09 97.28 104.74 20–29 years . . . . . . . . . . . . . . . 583 79.73 15.93 57.86 61.44 64.37 68.87 78.37 88.91 95.39 98.93 105.13 30–39 years . . . . . . . . . . . . . . . 612 78.55 16.58 55.92 59.51 62.08 66.94 76.65 87.23 94.71 99.84 109.34 40–49 years . . . . . . . . . . . . . . . 668 76.17 16.64 52.57 57.07 60.35 65.12 74.61 84.73 91.78 97.97 106.29 50–59 years . . . . . . . . . . . . . . . 639 72.62 15.70 50.98 54.31 57.95 62.12 70.87 81.06 86.40 91.36 99.48 60–69 years . . . . . . . . . . . . . . . 644 66.65 15.18 44.78 49.02 52.10 56.08 65.50 74.80 81.11 85.06 93.69 70–79 years . . . . . . . . . . . . . . . 429 60.07 13.48 39.75 43.67 46.49 50.84 59.47 68.03 73.73 77.39 82.15 80 years and over . . . . . . . . . . . 457 53.11 12.55 33.75 37.68 39.97 44.54 52.11 59.80 65.43 70.15 76.27
20 years and over (age-adjusted) . . 4,032 73.40 . . . . . . . . . . . . . . . . . . . . . . . . . . . . . .
Non-Hispanic black 8–11 years . . . . . . . . . . . . . . . . 490 49.04 14.23 30.42 33.42 35.28 39.17 47.03 56.33 63.23 68.44 74.89 12–15 years . . . . . . . . . . . . . . . 737 75.90 17.45 51.12 55.16 58.74 63.10 73.62 86.59 94.55 99.83 108.27 16–19 years . . . . . . . . . . . . . . . 609 87.23 21.91 59.44 63.58 66.56 71.43 83.46 99.15 107.77 113.60 127.75 20–29 years . . . . . . . . . . . . . . . 297 89.04 21.02 60.27 65.75 68.75 75.84 86.08 100.04 106.96 114.20 125.53 30–39 years . . . . . . . . . . . . . . . 333 90.88 21.94 62.78 66.51 68.95 74.20 87.82 104.31 112.13 119.81 128.56 40–49 years . . . . . . . . . . . . . . . 398 86.84 20.40 57.43 63.37 66.11 72.99 85.27 98.00 104.60 111.06 120.91 50–59 years . . . . . . . . . . . . . . . 250 82.55 19.27 55.02 61.06 64.36 68.27 80.82 94.99 100.30 105.06 117.28 60–69 years . . . . . . . . . . . . . . . 306 77.16 17.66 51.58 55.01 58.59 64.83 75.10 87.76 96.08 101.41 108.09 70–79 years . . . . . . . . . . . . . . . 124 68.58 17.51 45.36 48.91 51.55 55.18 65.56 78.70 86.28 91.37 † 80 years and over . . . . . . . . . . . 58 *59.79 14.71 *35.97 *39.28 *42.65 *50.15 *58.03 *70.17 *73.43 *76.02 *83.28 20 years and over (age-adjusted) . . 1,766 83.67 . . . . . . . . . . . . . . . . . . . . . . . . . . . . . .
. . . Category not applicable.
* Figure does not meet standards of reliability or precision; relative standard error (standard error divided by estimate times 100) is 30%–39% or estimate is based on less than 12 degrees of freedom.
† Standard error not calculated by SUDAAN software.
NOTE: g is grams.
SOURCE: National Health and Nutrition Examination Survey, 1999–2006.

Series 11, No. 253 [ Page 77
Table 36. Left ribs bone mineral density (g/cm2) of persons aged 8 years and over, by sex, race and ethnicity, and age: United States, 1999–2006
Percentile Sample Standard
Sex, race and ethnicity, and age size Mean deviation 5th 10th 15th 25th 50th 75th 85th 90th 95th
Male
All races and ethnicities 8–11 years . . . . . . . . . . . . . . . . 1,421 0.527 0.054 0.439 0.459 0.470 0.488 0.524 0.560 0.586 0.600 0.621 12–15 years . . . . . . . . . . . . . . . 2,264 0.634 0.089 0.499 0.523 0.539 0.569 0.624 0.692 0.725 0.756 0.795 16–19 years . . . . . . . . . . . . . . . 2,309 0.750 0.088 0.621 0.643 0.659 0.689 0.741 0.802 0.838 0.865 0.904 20–29 years . . . . . . . . . . . . . . . 1,530 0.753 0.086 0.618 0.645 0.665 0.694 0.747 0.807 0.834 0.859 0.899 30–39 years . . . . . . . . . . . . . . . 1,450 0.734 0.088 0.603 0.628 0.648 0.671 0.726 0.788 0.822 0.845 0.888 40–49 years . . . . . . . . . . . . . . . 1,549 0.726 0.083 0.592 0.618 0.639 0.667 0.722 0.778 0.812 0.836 0.865 50–59 years . . . . . . . . . . . . . . . 1,187 0.710 0.085 0.577 0.605 0.623 0.650 0.704 0.763 0.795 0.817 0.852 60–69 years . . . . . . . . . . . . . . . 1,350 0.702 0.089 0.558 0.595 0.612 0.646 0.693 0.756 0.796 0.824 0.856 70–79 years . . . . . . . . . . . . . . . 825 0.672 0.086 0.539 0.563 0.583 0.607 0.666 0.729 0.758 0.782 0.814 80 years and over . . . . . . . . . . . 501 0.652 0.088 0.519 0.549 0.565 0.591 0.646 0.702 0.743 0.761 0.790
20 years and over (age-adjusted) . . 8,392 0.720 . . . . . . . . . . . . . . . . . . . . . . . . . . . . . .
Mexican American 8–11 years . . . . . . . . . . . . . . . . 468 0.527 0.055 0.444 0.459 0.470 0.485 0.521 0.565 0.589 0.599 0.623 12–15 years . . . . . . . . . . . . . . . 777 0.633 0.090 0.502 0.526 0.540 0.566 0.628 0.684 0.719 0.750 0.797 16–19 years . . . . . . . . . . . . . . . 783 0.732 0.081 0.609 0.634 0.651 0.679 0.725 0.779 0.809 0.832 0.878 20–29 years . . . . . . . . . . . . . . . 444 0.732 0.071 0.610 0.638 0.657 0.684 0.729 0.777 0.804 0.824 0.845 30–39 years . . . . . . . . . . . . . . . 337 0.713 0.076 0.600 0.622 0.638 0.657 0.708 0.765 0.792 0.815 0.833 40–49 years . . . . . . . . . . . . . . . 381 0.704 0.078 0.583 0.615 0.624 0.645 0.699 0.754 0.787 0.811 0.840 50–59 years . . . . . . . . . . . . . . . 174 0.698 0.087 0.558 0.583 0.600 0.630 0.704 0.754 0.781 0.801 0.849 60–69 years . . . . . . . . . . . . . . . 348 0.689 0.083 0.571 0.581 0.600 0.633 0.684 0.733 0.760 0.791 0.840 70–79 years . . . . . . . . . . . . . . . 164 *0.665 0.073 *0.545 *0.557 *0.579 *0.611 *0.663 *0.723 *0.748 *0.762 *0.774 80 years and over . . . . . . . . . . . 48 *0.624 0.079 † *0.530 *0.536 *0.565 *0.621 *0.668 *0.699 *0.732 †
20 years and over (age-adjusted) . . 1,896 0.702 . . . . . . . . . . . . . . . . . . . . . . . . . . . . . .
Non-Hispanic white 8–11 years . . . . . . . . . . . . . . . . 369 0.524 0.053 0.438 0.456 0.467 0.485 0.524 0.557 0.578 0.597 0.615 12–15 years . . . . . . . . . . . . . . . 578 0.634 0.091 0.497 0.519 0.536 0.567 0.623 0.694 0.727 0.758 0.798 16–19 years . . . . . . . . . . . . . . . 591 0.752 0.088 0.625 0.645 0.662 0.690 0.741 0.802 0.841 0.867 0.902 20–29 years . . . . . . . . . . . . . . . 617 0.748 0.080 0.618 0.644 0.663 0.692 0.745 0.802 0.825 0.849 0.882 30–39 years . . . . . . . . . . . . . . . 647 0.734 0.085 0.605 0.631 0.649 0.676 0.727 0.787 0.819 0.840 0.882 40–49 years . . . . . . . . . . . . . . . 700 0.725 0.080 0.592 0.620 0.640 0.669 0.723 0.776 0.809 0.834 0.860 50–59 years . . . . . . . . . . . . . . . 683 0.709 0.082 0.579 0.610 0.624 0.651 0.703 0.759 0.789 0.809 0.847 60–69 years . . . . . . . . . . . . . . . 623 0.700 0.087 0.563 0.598 0.615 0.646 0.689 0.754 0.791 0.819 0.850 70–79 years . . . . . . . . . . . . . . . 496 0.671 0.086 0.538 0.564 0.583 0.607 0.663 0.730 0.759 0.781 0.813 80 years and over . . . . . . . . . . . 398 0.649 0.082 0.518 0.550 0.564 0.591 0.645 0.698 0.737 0.757 0.779
20 years and over (age-adjusted) . . 4,164 0.718 . . . . . . . . . . . . . . . . . . . . . . . . . . . . . .
Non-Hispanic black 8–11 years . . . . . . . . . . . . . . . . 469 0.544 0.058 0.448 0.471 0.483 0.503 0.540 0.582 0.606 0.616 0.637 12–15 years . . . . . . . . . . . . . . . 745 0.650 0.087 0.522 0.543 0.561 0.589 0.645 0.702 0.745 0.765 0.805 16–19 years . . . . . . . . . . . . . . . 757 0.775 0.086 0.635 0.665 0.692 0.719 0.769 0.829 0.866 0.891 0.919 20–29 years . . . . . . . . . . . . . . . 325 0.811 0.097 0.665 0.694 0.713 0.743 0.807 0.863 0.902 0.935 0.977 30–39 years . . . . . . . . . . . . . . . 310 0.790 0.097 0.647 0.670 0.693 0.724 0.784 0.845 0.883 0.913 0.977 40–49 years . . . . . . . . . . . . . . . 366 0.762 0.095 0.617 0.645 0.671 0.700 0.755 0.811 0.847 0.885 0.948 50–59 years . . . . . . . . . . . . . . . 240 0.755 0.089 0.620 0.648 0.663 0.689 0.749 0.812 0.848 0.871 0.923 60–69 years . . . . . . . . . . . . . . . 303 0.749 0.089 0.605 0.640 0.659 0.687 0.742 0.813 0.841 0.861 0.891 70–79 years . . . . . . . . . . . . . . . 114 0.702 0.089 0.554 0.588 0.606 0.641 0.704 0.750 0.794 0.813 0.846 80 years and over . . . . . . . . . . . 36 *0.713 0.114 † *0.587 *0.602 *0.632 *0.682 *0.776 *0.804 *0.818 †
20 years and over (age-adjusted) . . 1,694 0.767 . . . . . . . . . . . . . . . . . . . . . . . . . . . . . .
See footnotes at end of table.

Page 78 [ Series 11, No. 253
Table 36. Left ribs bone mineral density (g/cm2) of persons aged 8 years and over, by sex, race and ethnicity, and age: United States, 1999–2006—Con.
Percentile Sample Standard
Sex, race and ethnicity, and age size Mean deviation 5th 10th 15th 25th 50th 75th 85th 90th 95th
Female
All races and ethnicities 8–11 years . . . . . . . . . . . . . . . . 1,465 0.513 0.059 0.420 0.441 0.455 0.471 0.509 0.549 0.572 0.585 0.610 12–15 years . . . . . . . . . . . . . . . 2,318 0.619 0.070 0.508 0.529 0.546 0.568 0.617 0.662 0.690 0.710 0.738 16–19 years . . . . . . . . . . . . . . . 2,027 0.665 0.069 0.559 0.581 0.596 0.617 0.658 0.710 0.736 0.758 0.789 20–29 years . . . . . . . . . . . . . . . 1,378 0.663 0.069 0.557 0.578 0.590 0.613 0.661 0.703 0.733 0.753 0.779 30–39 years . . . . . . . . . . . . . . . 1,372 0.661 0.070 0.554 0.573 0.588 0.609 0.655 0.705 0.731 0.752 0.778 40–49 years . . . . . . . . . . . . . . . 1,570 0.652 0.075 0.539 0.563 0.578 0.601 0.647 0.698 0.730 0.748 0.779 50–59 years . . . . . . . . . . . . . . . 1,200 0.628 0.075 0.511 0.534 0.550 0.576 0.625 0.671 0.699 0.721 0.757 60–69 years . . . . . . . . . . . . . . . 1,419 0.597 0.073 0.490 0.508 0.523 0.545 0.590 0.641 0.673 0.694 0.728 70–79 years . . . . . . . . . . . . . . . 750 0.569 0.068 0.464 0.486 0.500 0.521 0.562 0.611 0.642 0.659 0.695 80 years and over . . . . . . . . . . . 594 0.537 0.066 0.432 0.454 0.465 0.491 0.535 0.580 0.608 0.622 0.649
20 years and over (age-adjusted) . . 8,283 0.634 . . . . . . . . . . . . . . . . . . . . . . . . . . . . . .
Mexican American 8–11 years . . . . . . . . . . . . . . . . 471 0.509 0.062 0.416 0.435 0.445 0.463 0.503 0.546 0.578 0.591 0.623 12–15 years . . . . . . . . . . . . . . . 821 0.615 0.067 0.505 0.530 0.548 0.570 0.616 0.657 0.678 0.700 0.735 16–19 years . . . . . . . . . . . . . . . 692 0.649 0.064 0.552 0.570 0.583 0.603 0.643 0.690 0.713 0.732 0.753 20–29 years . . . . . . . . . . . . . . . 364 0.652 0.063 0.561 0.577 0.585 0.605 0.648 0.691 0.716 0.736 0.763 30–39 years . . . . . . . . . . . . . . . 298 0.651 0.067 0.551 0.570 0.583 0.605 0.647 0.692 0.721 0.735 0.759 40–49 years . . . . . . . . . . . . . . . 372 0.647 0.065 0.542 0.564 0.578 0.602 0.644 0.687 0.708 0.729 0.762 50–59 years . . . . . . . . . . . . . . . 194 0.623 0.074 0.515 0.534 0.556 0.576 0.617 0.662 0.689 0.707 0.731 60–69 years . . . . . . . . . . . . . . . 375 0.580 0.071 0.467 0.491 0.508 0.528 0.579 0.626 0.651 0.670 0.705 70–79 years . . . . . . . . . . . . . . . 154 *0.556 0.069 *0.442 *0.469 *0.484 *0.508 *0.554 *0.596 *0.621 *0.640 *0.666 80 years and over . . . . . . . . . . . 47 *0.532 0.061 *0.437 *0.451 *0.463 *0.485 *0.526 *0.573 *0.595 *0.618 †
20 years and over (age-adjusted) . . 1,804 0.625 . . . . . . . . . . . . . . . . . . . . . . . . . . . . . .
Non-Hispanic white 8–11 years . . . . . . . . . . . . . . . . 383 0.510 0.056 0.418 0.438 0.451 0.468 0.507 0.545 0.564 0.580 0.601 12–15 years . . . . . . . . . . . . . . . 576 0.612 0.068 0.503 0.522 0.539 0.562 0.609 0.655 0.684 0.703 0.729 16–19 years . . . . . . . . . . . . . . . 543 0.663 0.065 0.562 0.583 0.597 0.618 0.656 0.708 0.730 0.746 0.779 20–29 years . . . . . . . . . . . . . . . 583 0.657 0.065 0.556 0.575 0.587 0.612 0.656 0.695 0.720 0.741 0.769 30–39 years . . . . . . . . . . . . . . . 612 0.654 0.066 0.551 0.570 0.585 0.606 0.651 0.701 0.722 0.736 0.768 40–49 years . . . . . . . . . . . . . . . 668 0.648 0.072 0.536 0.562 0.577 0.599 0.643 0.692 0.723 0.741 0.773 50–59 years . . . . . . . . . . . . . . . 639 0.624 0.070 0.516 0.537 0.551 0.577 0.622 0.666 0.693 0.710 0.742 60–69 years . . . . . . . . . . . . . . . 644 0.595 0.070 0.493 0.510 0.524 0.546 0.589 0.638 0.668 0.691 0.720 70–79 years . . . . . . . . . . . . . . . 429 0.568 0.066 0.465 0.486 0.502 0.521 0.562 0.607 0.641 0.658 0.693 80 years and over . . . . . . . . . . . 457 0.536 0.064 0.436 0.455 0.466 0.490 0.534 0.576 0.606 0.620 0.648
20 years and over (age-adjusted) . . 4,032 0.630 . . . . . . . . . . . . . . . . . . . . . . . . . . . . . .
Non-Hispanic black . . . . . . . . . . . . 8–11 years . . . . . . . . . . . . . . . . 490 0.531 0.062 0.433 0.457 0.469 0.487 0.526 0.569 0.592 0.608 0.635 12–15 years . . . . . . . . . . . . . . . 737 0.654 0.074 0.537 0.559 0.579 0.603 0.650 0.704 0.735 0.750 0.773 16–19 years . . . . . . . . . . . . . . . 609 0.703 0.077 0.584 0.605 0.620 0.649 0.699 0.753 0.782 0.806 0.840 20–29 years . . . . . . . . . . . . . . . 297 0.709 0.075 0.586 0.612 0.633 0.656 0.706 0.759 0.780 0.799 0.834 30–39 years . . . . . . . . . . . . . . . 333 0.706 0.078 0.592 0.607 0.622 0.649 0.700 0.753 0.787 0.812 0.846 40–49 years . . . . . . . . . . . . . . . 398 0.699 0.079 0.581 0.596 0.611 0.640 0.695 0.746 0.774 0.795 0.838 50–59 years . . . . . . . . . . . . . . . 250 0.669 0.083 0.525 0.559 0.583 0.618 0.668 0.721 0.753 0.772 0.806 60–69 years . . . . . . . . . . . . . . . 306 0.645 0.077 0.524 0.554 0.567 0.590 0.637 0.694 0.726 0.745 0.768 70–79 years . . . . . . . . . . . . . . . 124 0.608 0.078 0.477 0.503 0.519 0.555 0.602 0.652 0.687 0.708 0.742 80 years and over . . . . . . . . . . . 58 *0.578 0.071 *0.454 *0.484 *0.504 *0.527 *0.583 *0.617 *0.637 *0.652 *0.694
20 years and over (age-adjusted) . . 1,766 0.679 . . . . . . . . . . . . . . . . . . . . . . . . . . . . . .
. . . Category not applicable.
* Figure does not meet standards of reliability or precision; relative standard error (standard error divided by estimate times 100) is 30%–39% or estimate is based on less than 12 degrees of freedom. † Standard error not calculated by SUDAAN software.
NOTE: g/cm2 is grams per centimeter squared.
SOURCE: National Health and Nutrition Examination Survey, 1999–2006.

Vital and Health Statistics Series Descriptions
ACTIVE SERIES
Series 1. Programs and Collection Procedures—This type of report describes the data collection programs of the National Center for Health Statistics. Series 1 includes descriptions of the methods used to collect and process the data, definitions, and other material necessary for understanding the data.
Series 2. Data Evaluation and Methods Research—This type of report concerns statistical methods and includes analytical techniques, objective evaluations of reliability of collected data, and contributions to statistical theory. Also included are experimental tests of new survey methods, comparisons of U.S. methodologies with those of other countries, and as of 2009, studies of cognition and survey measurement, and final reports of major committees concerning vital and health statistics measurement and methods.
Series 3. Analytical and Epidemiological Studies—This type of report presents analytical or interpretive studies based on vital and health statistics. As of 2009, Series 3 also includes studies based on surveys that are not part of continuing data systems of the National Center for Health Statistics and international vital and health statistics reports.
Series 10. Data From the National Health Interview Survey—This type of report contains statistics on illness; unintentional injuries; disability; use of hospital, medical, and other health services; and a wide range of special current health topics covering many aspects of health behaviors, health status, and health care utilization. Series 10 is based on data collected in this continuing national household interview survey.
Series 11. Data From the National Health Examination Survey, the National Health and Nutrition Examination Surveys, and the Hispanic Health and Nutrition Examination Survey— In this type of report, data from direct examination, testing, and measurement on representative samples of the civilian noninstitutionalized population provide the basis for (1) medically defined total prevalence of specific diseases or conditions in the United States and the distributions of the population with respect to physical, physiological, and psychological characteristics, and (2) analyses of trends and relationships among various measurements and between survey periods.
Series 13. Data From the National Health Care Survey—This type of report contains statistics on health resources and the public’s use of health care resources including ambulatory, hospital, and long-term care services based on data collected directly from health care providers and provider records.
Series 20. Data on Mortality—This type of report contains statistics on mortality that are not included in regular, annual, or monthly reports. Special analyses by cause of death, age, other demographic variables, and geographic and trend analyses are included.
Series 21. Data on Natality, Marriage, and Divorce—This type of report contains statistics on natality, marriage, and divorce that are not included in regular, annual, or monthly reports. Special analyses by health and demographic variables and geographic and trend analyses are included.
Series 23. Data From the National Survey of Family Growth—These reports contain statistics on factors that affect birth rates, including contraception and infertility; factors affecting the formation and dissolution of families, including cohabitation, marriage, divorce, and remarriage; and behavior related to the risk of HIV and other sexually transmitted diseases. These statistics are based on national surveys of women and men of childbearing age.
DISCONTINUED SERIES
Series 4. Documents and Committee Reports—These are final reports of major committees concerned with vital and health statistics and documents. The last Series 4 report was published in 2002. As of 2009, this type of report is included in Series 2 or another appropriate series, depending on the report topic.
Series 5. International Vital and Health Statistics Reports—This type of report compares U.S. vital and health statistics with those of other countries or presents other international data of relevance to the health statistics system of the United States. The last Series 5 report was published in 2003. As of 2009, this type of report is included in Series 3 or another series, depending on the report topic.
Series 6. Cognition and Survey Measurement—This type of report uses methods of cognitive science to design, evaluate, and test survey instruments. The last Series 6 report was published in 1999. As of 2009, this type of report is included in Series 2.
Series 12. Data From the Institutionalized Population Surveys— The last Series 12 report was published in 1974. Reports from these surveys are included in Series 13.
Series 14. Data on Health Resources: Manpower and Facilities— The last Series 14 report was published in 1989. Reports on health resources are included in Series 13.
Series 15. Data From Special Surveys—This type of report contains statistics on health and health-related topics collected in special surveys that are not part of the continuing data systems of the National Center for Health Statistics. The last Series 15 report was published in 2002. As of 2009, reports based on these surveys are included in Series 3.
Series 16. Compilations of Advance Data From Vital and Health Statistics—The last Series 16 report was published in 1996. All reports are available online, and so compilations of Advance Data reports are no longer needed.
Series 22. Data From the National Mortality and Natality Surveys— The last Series 22 report was published in 1973. Reports from these sample surveys, based on vital records, are published in Series 20 or 21.
Series 24. Compilations of Data on Natality, Mortality, Marriage, and Divorce—The last Series 24 report was published in 1996. All reports are available online, and so compilations of reports are no longer needed.
For answers to questions about this report or for a list of reports published in these series, contact:
Information Dissemination Staff National Center for Health Statistics Centers for Disease Control and Prevention 3311 Toledo Road, Room 5419 Hyattsville, MD 20782
Tel: 1–800–CDC–INFO (1–800–232–4636) TTY: 1–888–232–6348 Internet: http://www.cdc.gov/nchs Online request form: http://www.cdc.gov/cdc-info/
requestform.html For e-mail updates on NCHS publication releases, subscribe
online at: http://www.cdc.gov/nchs/govdelivery.htm.

FOLD FOLDSPINE
PRINTER: ADJUST THE SPINE TO FIT
U.S. DEPARTMENT OF HEALTH & HUMAN SERVICES
Centers for Disease Control and Prevention National Center for Health Statistics PERMIT NO. G-284 3311 Toledo Road, Room 5419 Room 5214Hyattsville, MD 20782
OFFICIAL BUSINESS PENALTY FOR PRIVATE USE, $300
FIRST CLASS POSTAGE & FEES PAID
CDC/NCHS
DHHS Publication No. 2013–1603, Series 11, No. 253 CS240914