2012年3月期 第第2四半期決算説明会資料title...
TRANSCRIPT

2011年11月1日
2012年3月期2012年3月期
第第22四半期決算説明会資料四半期決算説明会資料第第22四半期決算説明会資料四半期決算説明会資料Presentation on Financial ResultsPresentation on Financial ResultsPresentation on Financial Results Presentation on Financial Results
for the First Six Months for the First Six Months of of the Fiscal the Fiscal Year Ending March 31, 2012Year Ending March 31, 2012g ,g ,
Copyright 2011NSD CO., LTD.V1.0

目次目次
ページ
2012年3月期第2四半期 連結決算の概況 3
連結 業績の概要 第2四半期(4 9月) 5連結 業績の概要 第2四半期(4~9月) 5
連結 業績の実績と予想 6
連結 セグメント別売上高と売上総利益 第2四半期(4~9月) 7
連結 セグメント別業績の実績と予想 8
単独 業績の概要 第2四半期(4~9月) 9
単独 業績の実績と予想 10単
単独 セグメント別売上高と売上総利益 第2四半期(4~9月) 11
単独 セグメント別業績の実績と予想 12
単独 業種別売上高 (ソフトウエア開発・コンピュータ室運営管理) 第2四半期(4~9月) 13
単独 金融業業態別売上高 (ソフトウエア開発・コンピュータ室運営管理) 第2四半期(4~9月) 14
単独 ソフトウエア開発受注動向 15
単独 製造費用とセグメント別外注費比率 16
販売費及び一般管理費(単独)/設備投資額・減価償却費・研究開発費・従業員数 17
会社概要 18
Copyright 2011 1
会社概要 18
※ この資料において、表示単位未満の金額は全て切り捨てております。また、パーセントで表示してある数値は全て四捨五入しております。

IndexIndex
page
Summary of Consolidated Financial Results for cumulative 2Q of FY Mar. 2012 4
Operating Results for the Six month Period (Apr Sep ) : Consolidated 5Operating Results for the Six-month Period (Apr.-Sep.) : Consolidated 5
Operating Results and Estimates : Consolidated 6
Net Sales and Gross Profit by Division for the Six-month Period (Apr.-Sep.) : Consolidated 7
Operating Results and Estimates by Division : Consolidated 8
Operating Results for the Six-month Period (Apr.-Sep.) : Non-Consolidated 9
Operating Results and Estimates : Non-Consolidated 10p g
Net Sales and Gross Profit by Division for the Six-month Period(Apr.-Sep.) : Non-Consolidated 11
Operating Results and Estimates by Division : Non-Consolidated 12
Net Sales by User Industry (Software Development and Facilities Management) for the Six-month Period (Apr.-Sep.) : Non-Consolidated 13
Sales Breakdown by Financial Business Category (Software Development and Facilities Management) for the Six-month Period (Apr.-Sep.) :Non-Consolidated
14
Software Development: Order, Net Sales and Order Backlog Trend : Non-Consolidated 15
Manufacturing Costs and Subcontracting Costs Breakdown : Non-Consolidated 16
Non-Consolidated SG&A Expenses / Capital Expenditure, Depreciation and Amortization, R&D Costs and Number of Employees 17
C t D t 18
Copyright 2011 2
Corporate Data 18
Notes: In this report fractions in yen are rounded off. Percent is rounded to its closest value.

2012012年2年33月期第2四半期月期第2四半期 連結決算の概況連結決算の概況
当第 2四半期におけるわが国経済は、生産活動や輸出等には回復が見られたものの、電力供給不足に対する節電等の対応
や歴史的な円高への対応、ギリシャに端を発した欧州債務危機問題と世界景気の減速等、依然として先行き不透明な状況に
ありましたありました。
情報サービス産業では、企業の IT 投資全般に依然として慎重姿勢が続き、厳しい経営環境が続きました。
このような状況のもと、当社グループは積極的な受注活動と新規事業の推進、プロジェクトマネジメントの徹底及びコス
トの削減等により 収益性の確保に努めてまいりましたトの削減等により、収益性の確保に努めてまいりました。
その結果、売上高につきましては、東日本大震災及び原子力発電所事故により被災しました連結子会社の減収はあったも
のの、全体としては若干の増収となりましたが、利益面につきましては、一部のプロジェクトで採算が悪化した影響及び転
進支援による早期割増退職金の計上等により減益となりました
表1. 連結決算概況 表2. セグメント別連結売上高 概況百万円
(利益率)百万円
(構成比) (構成比の変化)
進支援による早期割増退職金の計上等により減益となりました。
当社グループの業績は、下表1、下表2のとおりとなりました。
(利益率)
2Q実績 前年同期比
売上高 % of sales % of sales16,771 0.8% 36,000
営業利益 8 1% 10 3%
2012/3
通期予想
(構成比) (構成比の変化)
売上高実績 前年同期比
93.9% 0.0%15,751 0.8%
90.6% 1.5% 金融業のシステム統合案件が概ね順調に推移したこ情報サービス
概要
システムソリュー
ションサービス―
営業利益 8.1% 10.3%1,357 18.3% 3,700
経常利益 9.3% 10.8%1,566 12.5% 3,900
純利益 4 2% 6 1%
15,204 2.5%3.3% 1.5%
547 30.9%4.8% 0.2%
798 3.6%
と等により、売上高増となりました。
取扱い製品の見直しによる影響により、売上高減と
なりました。
企業の雇用過剰感が続いていることにより人材派遣
に対する需要は増加せず、売上高減となりました。
情報サ ビス
ソフトウエア
プロダクト
人材派遣
Copyright 2011 3
純利益 4.2% 6.1%708 28.9% 2,200
%1.3% 0.2%
221 17.1%
対する需要 増 ず、売 高減 なりま た。
元社員寮等の自社所有物件の戸数増と入居率向上に
より、売上高増となりました。不動産賃貸

Summary of Consolidated Financial Results for cumulative 2Q of FY Mar. 2012Summary of Consolidated Financial Results for cumulative 2Q of FY Mar. 2012
During the 2nd Quarter of the Fiscal Year 2012 (from April 1, 2011 through September 30, 2011), while the Japanese economy hasshown some recovery in sectors such as production activities and exports, the prospect for full-fledged recovery has still remained uncleardue to the various factors, such as influence of energy-saving measures in coping with power supply shortages, or addressing historicalappreciation of the yen as well as Greek-triggered debt crisis in Europe and a slowdown of the global economyappreciation of the yen as well as Greek triggered debt crisis in Europe and a slowdown of the global economy.
In the information services industry, business environment has also been severe since customers have kept a cautious attitude tooverall IT-related investment.
Under these circumstances, NSD group has exerted every effort to maximize profitability by promoting proactive sales activities ford d b i d b i l ti t i t j t t d t d tiorders and new businesses, and by implementing strict project management and cost reduction.
As a result of these efforts, the sales revenue has increased slightly despite the revenue decrease of our Fukushima subsidiarywhich has suffered from the East Japan Great Earthquake and subsequent accident at the nuclear power plant, but the profits havedecreased due to a certain project with deteriorated profits and appropriation of early retirement benefits to support employee’s career
Table-1. Summary of Consolidated Financial Results
Table-2.Consolidated Net Sales by Division millions of yenmillions of yen
change. Our consolidated achievements of the 2nd Quarter of the Fiscal Year 2012 are shown on the following Table-1and Table-2.
(% of total)
Sales Results
93.9% 0.0%
15,751 0.8%90.6% 1.5%
Reasons for increase or decrease
―
The sales have increased thanks to favorable orders for system consolidationInformation
YoY (%)of total of Net Sales
System SolutionServices
y(Margin)
Results% of sales % of sales
16,771 0.8% 36,000
YoY (%)forecast of
FY Mar. 2012
Net Sales
15,204 2.5%3.3% 1.5%
547 30.9%4.8% 0.2%
798 3.6%
yprojects from financial institution.
The sales have decreased affected by the replacement of product and servicelines.
The demand for staffing services has not increased due to prevailing corporatesentiment of overstaffing of employees.
Services
SoftwareProducts
Staffing Services
8.1% 10.3%
1,357 18.3% 3,7009.3% 10.8%
1,566 12.5% 3,900OrdinaryIncome
OperatingIncome
Copyright 2011 4
798 3.6%1.3% 0.2%
221 17.1%
The sales have increased thanks to the increase of the number of roomsavailable and the improved occupancy rate at the company-owned propertieswhich were originally intended for employee dormitories.
Real EstateServices
4.2% 6.1%
708 28.9% 2,200Net Income

連結連結 業績の概要業績の概要 第2四半期(第2四半期(44~~99月)月)Operating Results for the SixOperating Results for the Six--month Period (Apr.month Period (Apr.--Sep.) : ConsolidatedSep.) : Consolidated
百万円 millions of yen
Results Increase orDecrease YoY (%) Estimates Difference
% of sales % of sales % of sales % of sales
17 984 16 644 16 771 127 0 8% 17 000 228売上高
Net Sales
2011/9E2011/92009/9 2010/9
20,000
30,000
売上高
Net Sales
17,984 16,644 16,771 127 0.8% 17,000 228
79.7% 81.5% 83.4% 81.2%
14,325 13,560 13,989 429 3.2% 13,800 189
20.3% 18.5% 16.6% 18.8%
3 658 3 083 2 781 301 9 8% 3 200 418売上総利益Gross Profit
Net Sales
売上原価Cost of Sales
0
10,000
2009/9 2010/9 2011/9
3,658 3,083 2,781 301 9.8% 3,200 418
8.8% 8.5% 8.5% 9.4%
1,594 1,422 1,424 2 0.1% 1,600 175
11.5% 10.0% 8.1% 9.4%
Gross Profit
販売費及び
一般管理費SG & A Expenses
営業利益
20%
30%
4,000
6,000
営業利益
Operating Income
20%
30%
4,000
6,000
売上総利益
Gross Profit
売上総利益率Gross Profit Margin
2,063 1,661 1,357 303 18.3% 1,600 242
12.0% 10.8% 9.3% 10.6%
2,152 1,790 1,566 223 12.5% 1,800 233
0.2% 0.3% 0.1% 0.0%
経常利益Ordinary Income
特別利益
Operating Income
0%
10%
0
2,000
2009/9 2010/9 2011/9
営業利益率Operating Income Margin
0%
10%
0
2,000
2009/9 2010/9 2011/9
35 48 10 38 78.9% 0 10
0.2% 0.2% 1.0% 0.6%
33 31 165 134 432.6% 100 65
12.0% 10.9% 8.4% 10.0%
特別利益Extraordinary Income
特別損失Extraordinary Loss
税金等調整前純利益
20%
30%
4,000
6,000
経常利益
Ordinary Income
経常利益率
20%
30%
4,000
6,000
第2四半期純利益
2QNet Income
2,155 1,807 1,411 396 21.9% 1,700 288
6.9% 6.0% 4.2% 5.9%
1,241 995 708 287 28.9% 1,000 291※1 左上の比率は対売上比 The rates on the upper-left corners are percentages of net sales.
第2四半期純利益2Q Net Income
税金等調整前純利益Income before Taxes
0%
10%
0
2,000
2009/9 2010/9 2011/9
Ordinary Income Margin
0%
10%
0
2,000
2009/9 2010/9 2011/9
純利益率Net Income Margin
Copyright 2011 5
※1 左上の比率は対売上比 The rates on the upper left corners are percentages of net sales.※2 2011年5月11日発表の予想値 Estimates announced on May 11, 2011

連結連結 業績の実績と予想業績の実績と予想Operating Results and Estimates : ConsolidatedOperating Results and Estimates : Consolidated
百万円 millions of yen
ResultsIncrease orDecrease YoY (%) Estimates
Increase orDecrease
YoY (%) EstimatesIncrease orDecrease YoY (%)
% of sales % of sales % of sales % of sales % of sales % of sales
16 644 16 771 127 0 8% 16 690 19 228 2 538 15 2% 33 334 36 000 2 665 8 0%
上期 1st-Half 通期 Full-Year
2010/92011/9
2011/32012/3E※22012/3E※3
2011/3
下期 2nd-Half
売上高Net Sales 16,644 16,771 127 0.8% 16,690 19,228 2,538 15.2% 33,334 36,000 2,665 8.0%
18.5% 16.6% 19.3% 20.9% 18.9% 18.9%3,083 2,781 301 9.8% 3,228 4,018 789 24.5% 6,311 6,800 488 7.7%
8.5% 8.5% 7.8% 8.7% 8.2% 8.6%1,422 1,424 2 0.1% 1,307 1,675 368 28.2% 2,729 3,100 370 13.6%
10.0% 8.1% 11.5% 12.2% 10.7% 10.3%
売上総利益Gross Profit
販売費及び一般管理費SG&A Expenses
営業利益
1,661 1,357 303 18.3% 1,920 2,342 421 21.9% 3,582 3,700 117 3.3%10.8% 9.3% 12.0% 12.1% 11.4% 10.8%
1,790 1,566 223 12.5% 1,994 2,333 338 17.0% 3,785 3,900 114 3.0%0.3% 0.1% 0.0% 0.1% 0.1% 0.0%
48 10 38 78.9% 0 10 10 N/A 48 0 48 N/A特別利益
Extraordinary Income
経常利益Ordinary Income
営業利益Operating Income
0.2% 1.0% 1.1% 0.2% 0.6% 0.6%31 165 134 432.6% 177 34 143 80.7% 208 200 8 4.3%
10.9% 8.4% 10.9% 11.9% 10.9% 10.3%1,807 1,411 396 21.9% 1,817 2,288 470 25.9% 3,625 3,700 74 2.1%
6.0% 4.2% 6.5% 7.8% 6.2% 6.1%995 708 287 28 9% 1 085 1 491 406 37 4% 2 080 2 200 119 5 7%
第2四半期純利益2Q Net Income
特別損失Extraordinary Loss
税金等調整前純利益Income before Taxes
■ 上期
995 708 287 28.9% 1,085 1,491 406 37.4% 2,080 2,200 119 5.7%※1 左上の比率は対売上比 The rates on the upper-left corners are percentages of net sales.※2 通期予想値は2011年5月11日発表の予想値 Full-year estimates is that announced on May 11, 2011※3 下期の予想値は通期予想と上期実績の差 The numbers of the 2nd-half estimates are full-year estimates minus 1st-half results.
2Q Net Income
30%12,000
売上総利益
Gross Profit30%12,000
販管費
SG&A Expense 30%12,000
営業利益
Operating Income30%12,000
経常利益
Ordinary Income30%12,000
純利益
Net Income
■ 上期
1st-half■ 下期
2nd-half利益率
Profit margin10%
20%
4,000
8,000
10%
20%
4,000
8,000
10%
20%
4,000
8,000
10%
20%
4,000
8,000
10%
20%
4,000
8,000
Copyright 2011 6
0%0
2011/3 2012/3E※2
0%0
2011/3 2012/3E※2
0%0
2011/3 2012/3E※2
0%0
2011/3 2012/3E※2
0%0
2011/3 2012/3E※2

連結連結 セグメント別売上高と売上総利益セグメント別売上高と売上総利益 第2四半期(第2四半期(44~~99月)月)Net Sales and Gross Profit by Division for the SixNet Sales and Gross Profit by Division for the Six--month Period (Apr.month Period (Apr.--Sep.) : ConsolidatedSep.) : Consolidated
売上高百万円 millions of yen
1,153791 547
900828 798
171189 221
15,000
20,000
売上高
Net Sales
百万円 o s o ye
ResultsIncrease orDecrease YoY (%) Estimates Difference
94.0% 93.9% 93.9% 94.1%
16,912 15,626 15,751 125 0.8% 16,000 248
3,535 2,969 2,652 317 10.7% 3,100 447
2011/9
システムソリューションサービス
System Solution Services
2011/9E
売上総利益Gross Profit
売 上 高Net Sales
2009/9 2010/9
15,758 14,834 15,204
5,000
10,000
, , , ,
20.9% 19.0% 16.8% ― 2.2% 19.4% 2.5%87.6% 89.1% 90.6% 90.6%
15,758 14,834 15,204 369 2.5% 15,400 195
3,267 2,765 2,479 285 10.3% 2,920 440情報サービス
Information Services
System Solution Services
売上総利益Gross Profit
売上総利益率Gross Profit Margin
売 上 高Net Sales
0
2009/9 2010/9 2011/9
システムソリューションサービス System Solution Services
20.7% 18.6% 16.3% ― 2.3% 19.0% 2.6%6.4% 4.8% 3.3% 3.5%
1,153 791 547 244 30.9% 600 52
268 204 172 32 15.7% 180 7
売 上 高Net Sales
ソフトウエアプロダクト
Software Products
売上総利益Gross Profit
売上総利益率Gross Profit Margin
売上総利益率
システムソリュ ションサ ビス System Solution Services■ 情報サービス Information Services■ ソフトウエアプロダクト Sof tware Products■ 人材派遣 Staff ing Services■ 不動産賃貸業 Real Estate Services
23.3% 25.8% 31.5% ― 5.7% 30.0% 1.5%5.0% 5.0% 4.8% 4.7%
900 828 798 30 3.6% 800 1
62 55 44 10 19.7% 50 5
売上総利益率Gross Profit Margin
売 上 高Net Sales
売上総利益Gross Profit
人材派遣Staffing Services
23.3%25.8%
31.5%35.1%30.8%
38.3%40%
売上総利益率
Gross Profit Margin7.0% 6.7% 5.6% ― 1.1% 6.3% 0.7%1.0% 1.1% 1.3% 1.2%
171 189 221 32 17.1% 200 21
60 58 84 26 45.7% 50 34売上総利益Gross Profit
売上総利益率Gross Profit Margin
売 上 高Net Sales
不動産賃貸Real Estate Services
7.0%6.7%
5.6%
20.7%18.6% 16.3%
20%35.1% 30.8% 38.3% ― 7.5% 25.0% 13.3%
100.0% 100.0% 100.0% 100.0%
17,984 16,644 16,771 127 0.8% 17,000 228
3,658 3,083 2,781 301 9.8% 3,200 418
売上総利益率
売上総利益Gross Profit
売 上 高Net Sales
売上総利益率Gross Profit Margin
合 計Total
Copyright 2011 7
0%
2009/9 2010/9 2011/9
20.3% 18.5% 16.6% ― 1.9% 18.8% 2.2%※1 左上の比率は構成比 The rates on the upper-left corners are percentages of total.※2 2011年5月11日発表の予想値 Estimates announced on May 11, 2011
売上総利益率Gross Profit Margin

連結連結 セグメント別業績の実績と予想セグメント別業績の実績と予想Operating Results and Estimates by Division : Consolidated Operating Results and Estimates by Division : Consolidated
百万円 millions of yen百 y
Results YoY (%) Estimates YoY (%) Estimates YoY (%)
16,644 16,771 0.8% 16,690 19,228 15.2% 33,334 36,000 8.0%
上期 1st-Half 下期 2nd-Half 通期 Full-Year
2010/92011/9
2011/32012/3E※3
2011/32012/3E※2
売上高Net Sales
システムソリューションサービスS t S l ti S i 15,626 15,751 0.8% 15,647 18,148 16.0% 31,273 33,900 8.4%
14,834 15,204 2.5% 15,099 17,395 15.2% 29,934 32,600 8.9%
791 547 30.9% 547 752 37.5% 1,339 1,300 2.9%
828 798 3.6% 855 901 5.4% 1,684 1,700 0.9%
内
訳
System Solution Services
情報サービスInformation Services
ソフトウエアプロダクトSoftware Products
人材派遣Staffing Services , ,
189 221 17.1% 187 178 4.8% 376 400 6.2%18.5% 16.6% 19.3% 20.9% 18.9% 18.9%
3,083 2,781 9.8% 3,228 4,018 24.5% 6,311 6,800 7.7%19.0% 16.8% 19.8% 21.8% 19.4% 19.5%
2,969 2,652 10.7% 3,104 3,947 27.2% 6,074 6,600 8.7%18 6% 16 3% 19 3% 21 4% 19 0% 19 0%
不動産賃貸Real Estate Services
売上総利益Gross Profit
システムソリューションサービスSystem Solution Services
情報サービス 18.6% 16.3% 19.3% 21.4% 19.0% 19.0%2,765 2,479 10.3% 2,921 3,720 27.3% 5,686 6,200 9.0%
25.8% 31.5% 33.5% 30.2% 28.9% 30.8%204 172 15.7% 183 227 24.2% 387 400 3.2%
6.7% 5.6% 6.8% 6.2% 6.7% 5.9%55 44 19.7% 58 55 4.6% 113 100 12.0%
30.8% 38.3% 35.0% 8.4% 32.9% 25.0%58 84 45 7% 65 15 77 1% 123 100 19 3%
内
訳
情報サービスInformation Services
ソフトウエアプロダクトSoftware Products
人材派遣Staffing Services
不動産賃貸Real Estate Services
40%40,000
人材派遣Staffing Services 40%40,000
不動産賃貸Real Estate Services
58 84 45.7% 65 15 77.1% 123 100 19.3%※1 左上の比率は利益率 The rates on the upper-left corners are profit margin.※2 通期予想値は2011年5月11日発表の予想値 Full-year estimates is that announced on May 11, 2011※3 下期の予想値は通期予想と上期実績の差 The numbers of the 2nd-half estimates are full-year estimates minus 1st-half results.
Real Estate Services
40%40,000
システムソリューションサービスSystem Solution Services
40%40,000
情報サービス
Information Services40%40,000
ソフトウエアプロダクト
Software Products
■ 上期
1st-half■ 下期
2nd-half利益率
Profit margin10%
20%
30%
10,000
20,000
30,000
10%
20%
30%
10,000
20,000
30,000
10%
20%
30%
10,000
20,000
30,000
10%
20%
30%
10,000
20,000
30,000
10%
20%
30%
10,000
20,000
30,000
Copyright 2011 8
0%0
,
2011/3 2012/3E※2
0%02011/3 2012/3E※2
0%02011/3 2012/3E※2
0%
%
0
,
2011/3 2012/3E※20%
10%
0
10,000
2011/3 2012/3E※2

単独単独 業績の概要業績の概要 第2四半期(第2四半期(44~~99月)月)Operating Results for the SixOperating Results for the Six--month Period (Apr.month Period (Apr.--Sep.) : NonSep.) : Non--ConsolidatedConsolidated
百万円 millions of yen
Results Increase orDecrease
YoY(%) Estimates Difference
% of sales % of sales % of sales % of sales
2010/92011/9 2011/9E
売上高
2009/9
15,000
20,000
売上高
Net Sales
16,063 14,643 14,719 75 0.5% 15,200 480
79.1% 81.2% 83.5% 80.3%
12,702 11,885 12,284 398 3.4% 12,200 84
20.9% 18.8% 16.5% 19.7%
売上原価Cost of Sales
売上高Net Sales
売上総利益
0
5,000
10,000
2009/9 2010/9 2011/9
3,360 2,757 2,434 322 11.7% 3,000 565
9.1% 8.7% 8.5% 9.2%
1,469 1,267 1,253 14 1.1% 1,400 146
11.8% 10.2% 8.0% 10.5%営業利益
販売費及び
一般管理費SG & A Expenses
売上総利益Gross Profit
20%
30%
4,000
6,000
売上総利益
Gross Profit
売上総利益率Gross Profit Margin 20%
30%
4,000
6,000
営業利益
Operating Income
営業利益率11.8% 10.2% 8.0% 10.5%
1,890 1,489 1,181 308 20.7% 1,600 418
12.7% 11.7% 11.3% 13.2%
2,035 1,709 1,664 44 2.6% 2,000 335
0 0% 0 3% 0 1% 0 0%
経常利益Ordinary Income
営業利益Operating Income
特別利益
0%
10%
0
2,000
2009/9 2010/9 2011/9
0%
10%
0
2,000
2009/9 2010/9 2011/9
営業利益率Operating Income Margin
経常利益 純利益0.0% 0.3% 0.1% 0.0%
1 46 10 36 78.4% 0 10
0.2% 0.2% 0.8% 0.7%
33 31 121 90 290.4% 100 21
12 5% 11 8% 10 6% 12 5%
特別損失Extraordinary Loss
特別利益Extraordinary
Income
20%
30%
4,000
6,000
経常利益Ordinary Income
経常利益率O di I M i
20%
30%
4,000
6,000
純利益Net Income
12.5% 11.8% 10.6% 12.5%
2,004 1,725 1,553 171 10.0% 1,900 346
7.4% 6.9% 6.3% 7.2%
1,185 1,009 931 78 7.8% 1,100 168
※1 左上の比率は対売上比 The rates on the upper left corners are percentages of net sales
税引前純利益Income before Taxes
第2四半期純利益2Q Net Income 0%
10%
0
2,000
2009/9 2010/9 2011/9
Ordinary Income Margin
0%
10%
0
2,000
2009/9 2010/9 2011/9
純利益率Net Income Margin
Copyright 2011 9
※1 左上の比率は対売上比 The rates on the upper-left corners are percentages of net sales.※2 2011年5月11日発表の予想値 Estimates announced on May 11, 2011

単独単独 業績の実績と予想業績の実績と予想Operating Results and Estimates : NonOperating Results and Estimates : Non--ConsolidatedConsolidated
百万円 millions of yen
ResultsIncrease orDecrease YoY (%) Estimates
Increase orDecrease YoY (%) Estimates
Increase orDecrease YoY (%)
% of sales % of sales % of sales % of sales % of sales % of sales
通期 Full-Year
2010/92011/9
2011/32012/3E ※3
2011/32012/3E※2
上期 1st-Half 下期 2nd-Half
売上高Net Sales 14,643 14,719 75 0.5% 14,887 17,280 2,393 16.1% 29,530 32,000 2,469 8.4%
18.8% 16.5% 19.7% 23.5% 19.3% 20.3%2,757 2,434 322 11.7% 2,932 4,065 1,132 38.6% 5,690 6,500 809 14.2%
8.7% 8.5% 7.8% 9.0% 8.2% 8.8%1,267 1,253 14 1.1% 1,163 1,546 383 33.0% 2,430 2,800 369 15.2%
10.2% 8.0% 11.9% 14.6% 11.0% 11.6%
Net Sales
売上総利益Gross Profit
販売費及び一般管理費SG & A Expenses
営業利益
1,489 1,181 308 20.7% 1,769 2,518 749 42.3% 3,259 3,700 440 13.5%11.7% 11.3% 12.8% 14.1% 12.3% 12.8%
1,709 1,664 44 2.6% 1,910 2,435 525 27.5% 3,619 4,100 480 13.3%0.3% 0.1% 0.0% 0.1% 0.2% 0.0%
46 10 36 78.4% 0 10 10 N/A 46 0 46 N/A0.2% 0.8% 1.0% 0.5% 0.6% 0.6%
経常利益Ordinary Income
特別利益Extraordinary Income
Operating Income
特別損失
31 121 90 290.4% 145 78 66 45.8% 176 200 23 13.6%11.8% 10.6% 11.9% 13.6% 11.8% 12.2%
1,725 1,553 171 10.0% 1,765 2,346 581 32.9% 3,490 3,900 409 11.7%6.9% 6.3% 7.1% 7.9% 7.0% 7.2%
1,009 931 78 7.8% 1,054 1,368 314 29.9% 2,064 2,300 235 11.4%※1 左上の比率は対売上比 The rates on the upper-left corners are percentages of net sales
特別損失Extraordinary Loss
税引前純利益Income before Taxes
純利益Net Income
30%12,000
売上総利益Gross Profit
30%9,000
販管費SG&A Expense
30%9,000
営業利益Operating Profit
30%9,000
純利益Net Income
30%9,000
経常利益Ordinary Income
■ 上期
1st-half
※1 左上の比率は対売上比 The rates on the upper-left corners are percentages of net sales.※2 通期予想値は2011年5月11日発表の予想値 Full-year estimates is that announced on May 11, 2011※3 下期の予想値は通期予想と上期実績の差 The numbers of the 2nd-half estimates are full-year estimates minus 1st-half results.
10%
20%
4,000
8,000
10%
20%
3,000
6,000
10%
20%
3,000
6,000
10%
20%
3,000
6,000
10%
20%
3,000
6,000
1st-half■ 下期
2nd-half利益率
Profit margin
Copyright 2011 10
0%0
2011/3 2012/3E
0%0
2011/3 2012/3E0%0
2011/3 2012/3E
0%0
2011/3 2012/3E
0%0
2011/3 2012/3E

単独単独 セグメント別売上高と売上総利益セグメント別売上高と売上総利益 第2四半期(第2四半期(44~~99月)月)Net Sales and Gross Profit by Division for the SixNet Sales and Gross Profit by Division for the Six--month Period (Apr.month Period (Apr.--Sep.) : NonSep.) : Non--ConsolidatedConsolidated
百万円 millions of yen
Results Increase orDecrease YoY (%) Estimates Difference
87.9% 89.3% 90.5% 90.5%14 124 13 071 13 314 242 1 9% 13 750 435
売 上 高Net Sales
2011/9 2011/9E2009/9 2010/9
20,000
売上高
Net Sales
14,124 13,071 13,314 242 1.9% 13,750 435
2,926 2,349 2,057 292 12.4% 2,650 592
20.7% 18.0% 15.5% - 2.5% 19.3% 3.8%
Net Sales
売上総利益Gross Profit
売上総利益率Gross Profit
Margin
ソフトウエア開 発
SoftwareDevelopment
14,124 13,071 13,314
884900 929
1,054671 475
5 000
10,000
15,000
5.5% 6.2% 6.3% 5.9%
884 900 929 28 3.2% 900 29
186 215 209 6 2.8% 180 29
コンピュータ室運営管理Facilities
Management
売上総利益Gross Profit
売上総利益率
売 上 高Net Sales
0
5,000
2009/9 2010/9 2011/9
■ ソフトウエア開発 Software Development
21.1% 23.9% 22.6% - 1.4% 20.0% 2.6%6.6% 4.6% 3.2% 3.6%
1,054 671 475 195 29.1% 550 74ソフトウエアプロダクト
売上総利益率Gross Profit
Margin
売 上 高Net Sales
売上総利益 35.2%40%
売上総利益率
Gross Profit Margin
■ コンピュータ室運営管理 Facilities Management■ ソフトウエアプロダクト Software Products
246 192 167 24 12.9% 170 2
23.4% 28.6% 35.2% - 6.5% 30.9% 4.3%100.0% 100.0% 100.0% 100.0%
16 063 14 643 14 719 75 0 5% 15 200 480
SoftwareProducts
売上総利益率Gross Profit
Margin
Gross Profit
売 上 高Net Sales 20.7% 18 0%
21.1%
23.9% 22.6%23.4%
28.6%
20%
16,063 14,643 14,719 75 0.5% 15,200 480
3,360 2,757 2,434 322 11.7% 3,000 565
20.9% 18.8% 16.5% - 2.3% 19.7% 3.2%
合 計Total
Net Sales
売上総利益Gross Profit
売上総利益率Gross Profit
Margin
18.0%15.5%
0%2009/9 2010/9 2011/9
Copyright 2011 11
※1 左上の比率は対売上比 The rates on the upper-left corners are percentages of net sales.※2 2011年5月11日発表の予想値 Estimates announced on May 11, 2011

単独単独 セグメント別業績の実績と予想セグメント別業績の実績と予想Operating Results and Estimates by Division : NonOperating Results and Estimates by Division : Non--ConsolidatedConsolidated
百万円 millions of yen百万円 millions of yen
Results YoY (%) Estimates YoY (%) Estimates YoY (%)
14 643 14 719 0 5% 14 887 17 280 16 1% 29 530 32 000 8 4%
上期 1st-Half
2011/9通期 Full-Year
2012/3E※3 2012/3E※2
2011/3
下期 2nd-Half
2011/3
売上高Net Sales
2010/9
14,643 14,719 0.5% 14,887 17,280 16.1% 29,530 32,000 8.4%
13,071 13,314 1.9% 13,535 15,785 16.6% 26,606 29,100 9.4%
900 929 3.2% 892 770 13.6% 1,792 1,700 5.2%コンピュータ室運営管理Facilities Management
ソフトウ アプロダクト
Net Sales
ソフトウエア開発Software Development
671 475 29.1% 460 724 57.4% 1,131 1,200 6.1%18.8% 16.5% 19.7% 23.5% 19.3% 20.3%
2,757 2,434 11.7% 2,932 4,065 38.6% 5,690 6,500 14.2%18.0% 15.5% 18.7% 23.7% 18.4% 19.9%
2 349 2 057 12 4% 2 536 3 742 47 5% 4 886 5 800 18 7%
ソフトウエアプロダクトSoftware Products
売上総利益Gross Profit
ソフトウエア開発Software Development 2,349 2,057 12.4% 2,536 3,742 47.5% 4,886 5,800 18.7%
23.9% 22.6% 24.9% 18.2% 24.4% 20.6%215 209 2.8% 221 140 36.7% 437 350 20.0%
28.6% 35.2% 37.8% 25.2% 32.4% 29.2%192 167 12.9% 174 182 5.0% 366 350 4.4%
※1 左上の比率は売上総利益率 The rates on the upper left corners are gross profit margin
Software Development
コンピュータ室運営管理Facilities Management
ソフトウエアプロダクトSoftware Products
※1 左上の比率は売上総利益率 The rates on the upper-left corners are gross profit margin.※2 通期予想値は2011年5月11日発表の予想値 Full-year estimates is that announced on May 11, 2011※3 下期の予想値は通期予想と上期実績の差 The numbers of the 2nd-half estimates are full-year estimates minus 1st-half results.
40%40,000
コンピューター室運営管理
Facilities Management40%40,000
ソフトウエア開発
Software Development40%40,000
ソフトウエアプロダクト
Software Product40%40,000
合計Total
■ 上期
1st-half■ 下期
2nd-half利益率
Profit margin10%
20%
30%
10,000
20,000
30,000
10%
20%
30%
10,000
20,000
30,000
10%
20%
30%
10,000
20,000
30,000
10%
20%
30%
10,000
20,000
30,000
Copyright 2011 12
0%0
2011/3 2012/3E
0%0
2011/3 2012/3E
0%0
2011/3 2012/3E0%0
2011/3 2012/3E

単独単独 業種別売上高(ソフトウエア開発・コンピュータ室運営管理)業種別売上高(ソフトウエア開発・コンピュータ室運営管理) 第2四半期(第2四半期(44~~99月)月)Net Sales by User Industry (SoftwareNet Sales by User Industry (Software DevelopmentDevelopment and Facilities Management) and Facilities Management) for the Sixfor the Six--month Period (Apr.month Period (Apr.--Sep.) : NonSep.) : Non--ConsolidatedConsolidated
illi f百万円 millions of yen
Results % of Total Results % of Total Results % of TotalIncrease or Decrease
YoY (%)
金 融 業Finance 4,583 30.5% 4,628 33.1% 5,082 35.7% 453 9.8%
サ ビ ス 業
2011/92009/9 2010/9
サ ー ビ ス 業Services 4,920 32.8% 4,466 32.0% 4,210 29.6% 255 5.7%
製 造 業Manufacturing 3,527 23.5% 3,101 22.2% 3,273 23.0% 171 5.5%
商 業Commerce 591 3.9% 764 5.5% 672 4.7% 92 12.1%
運 輸 業522 3 5% 333 2 4% 373 2 6% 40 12 0%Transportation 522 3.5% 333 2.4% 373 2.6% 40 12.0%
通 信 業Telecommunications 299 2.0% 218 1.6% 259 1.8% 40 18.7%
建 設 業Construction 232 1.6% 256 1.8% 215 1.5% 41 16.1%
電 力 ・ ガ スElectricity & Gas 169 1.1% 50 0.3% 84 0.6% 33 67.0%y公 共 団 体
Public 152 1.0% 142 1.0% 66 0.5% 75 53.2%そ の 他
Others 9 0.1% 8 0.1% 5 0.0% 3 35.1%合 計
Total 15,008 100.0% 13,972 100.0% 14,243 100.0% 271 1.9%
金融業Finance 金融業
製造業
■ 金融業 Finance■ サービス業 Services■ 製造業 Manufacturing■ 商 業 CommerceFinance
33.2%
サービス業Services
製造業Manufacturing
22.2%
Finance 35.7%
サービス業
製造業
Manufacturing 23.0%
■ 商 業 Commerce■ 運輸業 Transportation■ 通信業 Telecommunications■ 建設業 Construction■ 電力・ガス Electricity & Gas■ 公共団体 Public
Copyright 2011 13
Services32.0%
2010/9
サ ビス業
Services29.6%
2011/9
■ その他 Others

単独単独 金融業業態別売上高(ソフトウエア開発・コンピュータ室運営管理)金融業業態別売上高(ソフトウエア開発・コンピュータ室運営管理) 第2四半期(第2四半期(44~~99月)月)Sales Breakdown by Financial Business CategorySales Breakdown by Financial Business Category((Software Development and Facilities Software Development and Facilities ManagementManagement)) for the Sixfor the Six--month Period (Apr.month Period (Apr.--Sep.) : NonSep.) : Non--Consolidated Consolidated
百万円 millions of yen
Results % of Total Results % of Total Results % of Total Increase orDecrease YoY (%)
メガバンクLargest Banks 1 351 29 5% 1 093 23 6% 1 185 23 3% 92 8 5%
2011/92009/9 2010/9
Largest Banks 1,351 29.5% 1,093 23.6% 1,185 23.3% 92 8.5%信託銀行
Trust Banks 534 11.7% 432 9.3% 599 11.8% 167 38.7%地銀・信金他
Regional / Local / Other Banks 641 14.0% 810 17.5% 1,261 24.8% 451 55.7%生保 損保生保・損保
Insurance Companies 1,519 33.1% 1,421 30.7% 1,388 27.3% 32 2.3%証券会社
Securities Companies 206 4.5% 225 4.9% 145 2.9% 80 35.7%ノンバンク他
Others 330 7.2% 645 14.0% 500 9.9% 145 22.5%合計Total 4,583 100.0% 4,628 100.0% 5,082 100.0% 453 9.8%
メガバンク
Largest Banks23.6%
メガバンク
Largest Banks23.3%
生保・損保
■ メガバンク Largest Banks■ 信託銀行 Trust Banks
信託銀行
Trust Banks9.3%
地銀・信金他
Regional / Local / Oth B k
生保・損保
Insurance Companies30.7%
信託銀行
Trust Banks, 11.8%
地銀・信金他
Regional / Local / Other Banks,
生保・損保
Insurance Companies,
27.3%
■ 信託銀行 Trust Banks■ 地銀・信金他 Regional/ Local/ Other Banks■ 生保・損保 Insurance Companies■ 証券会社 Securities Companies■ ノンバンク他 Others
Copyright 2011 14
Other Banks17.5%
2010/9
,24.8%
2011/9
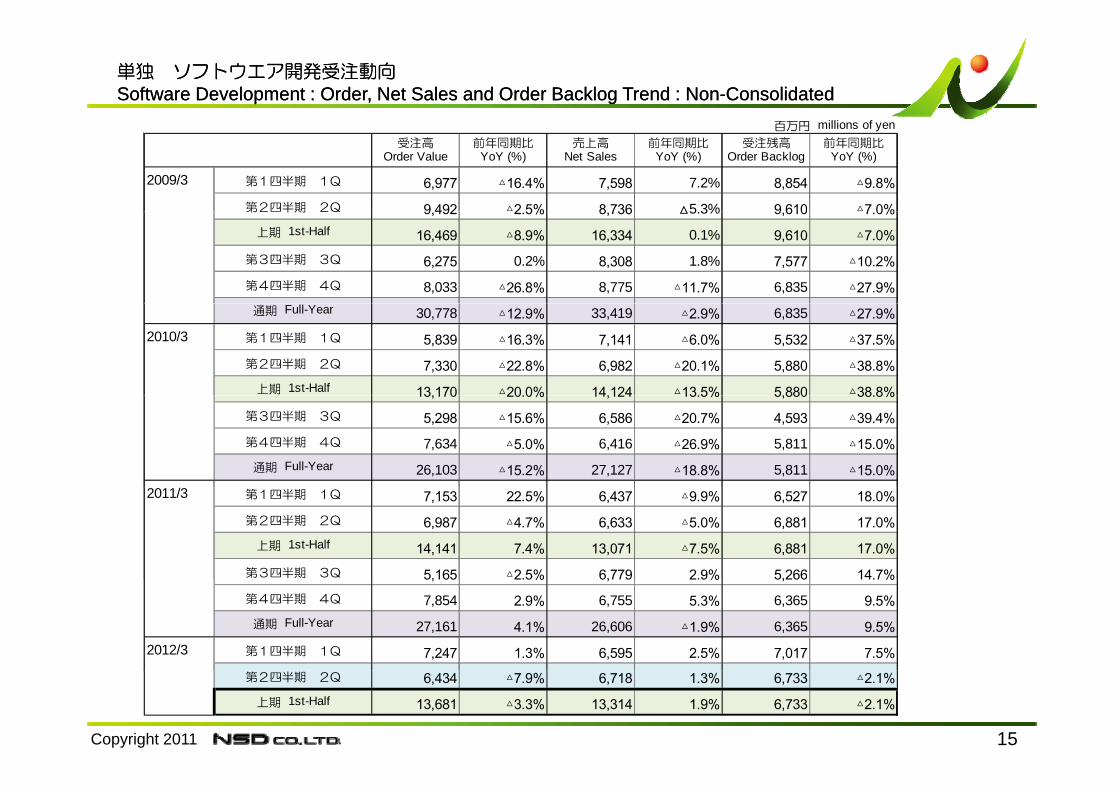
単独単独 ソフトウエア開発受注動向ソフトウエア開発受注動向Software Development : Order, Net Sales and Order Backlog Trend : NonSoftware Development : Order, Net Sales and Order Backlog Trend : Non--ConsolidatedConsolidated
百万円 millions of yen受注高
Order Value前年同期比
YoY (%)売上高
Net Sales前年同期比
YoY (%)受注残高
Order Backlog前年同期比
YoY (%)
2009/3 第1四半期 1Q 6,977 △16.4% 7,598 7.2% 8,854 △9.8%第2四半期 2Q 9 492 △2 5% 8 736 5 3% 9 610 △7 0%第2四半期 2Q 9,492 2.5% 8,736 5.3% 9,610 7.0%
上期 1st-Half 16,469 △8.9% 16,334 0.1% 9,610 △7.0%第3四半期 3Q 6,275 0.2% 8,308 1.8% 7,577 △10.2%第4四半期 4Q 8,033 △26.8% 8,775 △11.7% 6,835 △27.9%通期 Full-Year 30,778 △12.9% 33,419 △2.9% 6,835 △27.9%
2010/3 第1四半期 1Q 5,839 △16.3% 7,141 △6.0% 5,532 △37.5%第2四半期 2Q 7,330 △22.8% 6,982 △20.1% 5,880 △38.8%
上期 1st-Half 13 170 △20 0% 14 124 △13 5% 5 880 △38 8%13,170 20.0% 14,124 13.5% 5,880 38.8%第3四半期 3Q 5,298 △15.6% 6,586 △20.7% 4,593 △39.4%第4四半期 4Q 7,634 △5.0% 6,416 △26.9% 5,811 △15.0%通期 Full-Year 26,103 △15.2% 27,127 △18.8% 5,811 △15.0%
2011/3 第1四半期 1Q 7,153 22.5% 6,437 △9.9% 6,527 18.0%第2四半期 2Q 6,987 △4.7% 6,633 △5.0% 6,881 17.0%
上期 1st-Half 14,141 7.4% 13,071 △7.5% 6,881 17.0%第3四半期 3Q 5,165 △2.5% 6,779 2.9% 5,266 14.7%5,165 2.5% 6,779 2.9% 5,266 14.7%第4四半期 4Q 7,854 2.9% 6,755 5.3% 6,365 9.5%通期 Full-Year 27,161 4.1% 26,606 △1.9% 6,365 9.5%
2012/3 第1四半期 1Q 7,247 1.3% 6,595 2.5% 7,017 7.5%
Copyright 2011 15
第2四半期 2Q 6,434 △7.9% 6,718 1.3% 6,733 △2.1%上期 1st-Half 13,681 △3.3% 13,314 1.9% 6,733 △2.1%

単独単独 製造費用とセグメント別外注費比率製造費用とセグメント別外注費比率Manufacturing Costs and Subcontracting Costs Breakdown : NonManufacturing Costs and Subcontracting Costs Breakdown : Non--ConsolidatedConsolidated
製造費用の推移Manufacturing Costs 百万円 millions of yen
2009/9 2010/9 2011/982.0% 84.6% 81.4%
9 529 9 676 9 990労務費
Personnel Costs
セグメント別外注費と外注費比率
Subcontracting Costs by Division 百万円 millions of yen2009/9 2010/9 2011/9
ソフトウエア開発9,529 9,676 9,99014.4% 11.6% 14.5%
1,669 1,318 1,7751.5% 1.7% 1.5%
179 196 179賃借料
Rental Costs
Personnel Costs
外注費Subcontracting Costs
ソフトウエア開発Softw are Development 1,405 1,087 1,516
外注費比率Subcontracting Costs Divided by
Net Sales 10.0% 8.3% 11.4%
2.1% 2.1% 2.6%245 242 322
100.0% 100.0% 100.0%11,623 11,434 12,268
合計Total
その他Others
コンピュータ室運営管理Facilities Management 263 231 258
外注費比率Subcontracting Costs Divided by
Net Sales 29.8% 25.7% 27.8%
15,000
製造費用の推移Manufacturing Costs
その他
※ 左上の比率は構成比 The rates on the upper-left corners are percentages of total.
40%2,000
セグメント別外注費
Subcontracting Costs by Division
外注費(ソフト)
10,000
,Others
賃借料
Rental Costs
外注費 20%1,000
外注費(ソフト)
Subcontracting Costs (Software)
外注費(FM)
Subcontracting Costs (FM)
0
5,000
2009/9 2010/9 2011/9
外注費
Subcontracting Costs
労務費
Personnel Costs
0%0
外注費比率(ソフト)
Subcontracting Costs /Net Sales (Software)
外注費比率(FM)
Subcontracting costs /Net Sales(FM)
Copyright 2011 16
2009/9 2010/9 2011/9 0%02009/9 2010/9 2011/9

販売費及び一般管理費(単独)販売費及び一般管理費(単独)//設備投資額・減価償却費・研究開発費・従業員数設備投資額・減価償却費・研究開発費・従業員数NonNon--Consolidated SG & A Expenses / Capital Expenditure, Depreciation and Amortization, R&D Consolidated SG & A Expenses / Capital Expenditure, Depreciation and Amortization, R&D Costs and Number of EmployeesCosts and Number of Employees販売費及び 般管理費(単独)
設備投資額・減価償却費・研究開発費・従業員数Capital Expenditure, Depreciation and Amortization, R&D Costs and Number of Employees
販売費及び一般管理費(単独)Non-Consolidated SG & A Expenses
連結 Consolidated百万円、人
\ millions , number of people2010/3 2012/32011/3
百万円 millions of yen
Results Increase orDecrease
YoY (%)
48.2% 51.8% 51.6% 0.3%
2011/92009/9 2010/9
人件費2009/9 2010/3 2010/9 2011/3 2011/9 2012/3E
設備投資額Capital Expenditure 38 374 61 592 148 540
減価償却費Depreciation & Amortization 258 466 141 294 174 400
708 657 646 11 1.7%13.9% 17.3% 12.4% 4.9%
204 219 155 63 28.9%6.4% 2.3% 2.0% 0.3%
93 28 24 4 14 1%
賃借料Rental Costs
人件費Personnel Costs
減価償却費Depreciation and 258 466 141 294 174 400
研究開発費R&D Costs 12 84 12 55 120 240
従業員数(人)Number of Employee 3,793 3,690 3,763 3,734 3,874
93 28 24 4 14.1%31.5% 28.6% 34.0% 5.4%
463 362 426 63 17.6%100.0% 100.0% 100.0%
1,469 1,267 1,253 14 1.1%合計Total
Amortization
その他Others
単独 Non-Consolidated
2009/9 2010/3 2010/9 2011/3 2011/9 2012/3E
設備投資額
2011/3
百万円、人
\ millions , number of people
2010/3 2012/3
89.6% 89.2% 89.9% 0.7%
1,317 1,130 1,126 4 0.4%10.4% 10.8% 10.1% 0.7%
152 136 126 10 7.5%※ 左上の比率は構成比 The rates on the upper-left corners are percentages of total
内一般管理費General and
Administrative Expenses
内販売費Selling Expenses
1,500
2,000
販管費の推移
SG & A Expenses
その他Others
減価償却費Depreciation and
Capital Expenditure 21 339 54 561 107 240減価償却費
Depreciation & Amortization 229 405 118 248 147 330研究開発費
R&D Costs 12 84 12 55 120 240
500
1,000
Depreciation and Amortization賃借料Rental Costs
人件費Personnel Costs
12 84 12 55 120 240従業員数(人)
Number of Employee 2,884 2,810 2,914 2,873 3,010
Copyright 2011 17
02009/9 2010/9 2011/9

会社概要会社概要CorporateCorporate DataData
[ 2011年9月30日現在 ] [ As of September 30, 2011 ]
株式会社 N S D Name of Company : NSD CO., LTD.
1969年4月8日 Foundation : April 8, 1969
7 205 864 914 円 Capital : 7 205 864 914 yen資本金
設 立
会社名
7,205,864,914 円 Capital : 7,205,864,914 yen
200,000,000株 Number of Shares : Authorized : 200,000,000
51,172,160株 Outstanding : 51,172,160
自己株式の総数* 8,168,301株 Treasury stocks*: 8,168,301
*従業員持株ESOP信託口株数 908,200株を含む * Including shares of ESOP(Employee stock ownership program) trust account 908,200
発行済株式の総数
発行可能株式総数株式数
資本金
従業員持株ESOP信託口株数 908,200株を含む
上場証券取引所 東京証券取引所 市場第一部 Stock Listing : Tokyo Stock Exchange, 1st Section
大株主 ステートストリートバンクアンドトラストカンパニー 505223 Major Shareholders : State Street Bank and Trust Company 505223
(*自己株式除く) IPC株式会社 IPC Co., Ltd.
野村信託銀行株式会社(信託口) The Nomura Trust and Banking Co Ltd (Trust Account)* Treasury stocks are excluded
野村信託銀行株式会社(信託口) The Nomura Trust and Banking Co., Ltd. (Trust Account)
大同生命保険株式会社 Daido Life Insurance Company
日本トラスティ・サービス信託銀行㈱(信託口) Japan Trustee Services Bank,Ltd. (Trust Account)
有限会社KDアソシエイツ KD Associates, Ltd.
タイヨーパールファンドエルピー Taiyo Pearl Fund, L.P.
Di l i
株主数 11,399 名 (2011年3月期末 9,377名) Number of Shareholders : 11,399 (As of March 31, 2011 9,377)
従業員数 連結 3,874 名 (2011年3月期末 3,734名) Number of Employees : Consolidated 3,874 (As of March 31, 2011 3,734)
単独 3,010 名 (2011年3月期末 2,873名) Non-Consolidated 3,010 (As of March 31, 2011 2,873)
免責事項
本資料は、当社及び当グループ会社の業績・事業戦略に関する情報の提供を目的としたものであり、当社及び
当グループ会社の株式の購入や売却を勧誘するものではありません。本レポートの内容には、将来の業績に関す
る意見や予測等の情報を掲載することがありますが、これらの情報は、現時点の当社の判断に基づいて作成され
ております。よって、その実現・達成を約束するものではなく、また今後、予告なしに変更されることがありま
す。本レポート利用の結果生じたいかなる損害についても、当社は一切責任を負いません。また、本レポートの
DisclaimerThis report is intended to provide information about the business performance and strategy of NSD CO., LTD.
(NSD) and the NSD Group. It is not intended and should not be construed as an inducement to purchase or sell
stock in NSD or NSD Group companies. Statements in this presentation that are not historical facts are
forward-looking statements, based on the current beliefs, estimates and expectations of management. As these
beliefs, estimates and expectations are subject to a number of risks, uncertainties, and assumptions, actual
lt b t i ll diff t NSD d t k bli ti t d t f d l ki t t t d
Copyright 2011 18
す。本レポ ト利用の結果生じたいかなる損害についても、当社は 切責任を負いません。また、本レポ トの
無断での複製、転送等を行わないようにお願い致します。
results may be materially different. NSD undertakes no obligation to update any forward-looking statements, and
shall in no event be liable for any damages arising out of the use or interpretation of this material. Please refrain
from copying, disseminating or distributing this material without the prior consent of NSD.