2012 transportation volume tables - oregon
TRANSCRIPT
� T R A N S P O R T A T I O N D E V E L O P M E N T D I V I S I O N �
Published by
Transportation Data Section Transportation Systems Monitoring Unit
October 2013
2012
TRANSPORTATION
VOLUME
TABLES

This document is prepared by the Oregon Department of Transportation (ODOT), but funded by a combination of funding from the Federal Highway Administration
(FHWA) and ODOT. ODOT assumes responsibility for the facts and accuracy of the data presented in the report. The contents of this report do not necessarily
reflect the views or policies of FHWA.

2012 TRANSPORTATION
VOLUME TABLES
OREGON DEPARTMENT OF TRANSPORTATION
TRANSPORTATION DATA SECTION TRANSPORTATION SYSTEMS MONITORING UNIT
555 13TH STREET N.E., SUITE #2 SALEM, OR. 97301-4178
October 2013


1
TABLE OF CONTENTS
Page Internet Access, Publication Cost, Information Telephone Number .............. …………………3 Introduction .................................................................................................................................. 5 2012 Trend Data .......................................................................................................................... 9
Section I Introduction to Urban and Rural Traffic Volumes on the State Highway System ........................................................................................................... …11 Cross Reference Table listing - State Highway Numbers coincident with posted Highway Route Numbers………………………………………… ........... 13 Cross Reference Table listing - Posted Highway Route Numbers coincident with State Highway Numbers......................................................................... 17 Traffic counting schedule on the State Highway System.. .............................................. 23 Map of State Highway System and Principle Routes. ................................................... . 25 Tabulation of Traffic Volumes on State Highways… .................................................... 27
Introduction to Interchange Ramp Volume Diagrams… ....................................................... 143 Pacific Highway No. 1 (I-5)........................................................................................... . 145 Columbia River Highway No. 2 and Old Oregon Trail No. 6 (I-84). ........................... . 165 The Dalles-California Highway No. 4 (US97), the Bend Parkway section in Bend. ............................................................................... . 181 Sunset Highway No. 47 (US26) from Wilson River Highway No. 37 (OR 6) east to Stadium Freeway Highway No. 61 (I-405) in Portland… ..................... 185 Stadium Freeway Highway No. 61 (I-405)… ................................................................ 189 East Portland Freeway Highway No. 64 (I-205)… ........................................................ 193

2
TABLE OF CONTENTS (Continued) Belt Line Highway No. 69 (OR569)… ............................................................................ 199 McNary Highway No. 70 (I-82)…................................................................................... 203 Beaverton – Tigard Highway No. 144 (OR217)… .......................................................... 207 North Santiam Highway No. 162 (OR22) (from I-5 to Stayton/Sublimity Exit)…… ................................................... ………… 211 Eugene – Springfield Highway No. 227 (I-105 & OR126)… ......................................... 215
Section II Introduction to Traffic Trends at Automatic Traffic Recorder Stations… ............................ 219 Map of Automatic Traffic Recorder Stations… ........................................................... 221 Summary of Traffic Trends at Automatic Traffic Recorder Stations and Automatic Vehicle Classification Stations….................................................................................. 223 Glossary… .............................................................................................................................. 313

3
INTERNET ACCESS
PUBLICATION COST
PHONE NUMBERS FOR INFORMATION
The 1986 through 2012 Transportation Volume Tables can be viewed on the Internet at:
https://www.oregon.gov/ODOT/DATA/Pages/Traffic-Counting.aspx (Then click on link: Traffic Volume Tables)
The 1998 through 2012 Traffic Volumes and Classification data can be viewed on the Internet at:
https://highway.odot.state.or.us/cf/highwayreports/traffic_parms.cfm
Beginning in 2012, the printed Transportation Volume Tables are only available in a 3-hole punched loose leaf format. A PDF copy is also available for download:
https://www.oregon.gov/ODOT/DATA/Pages/Traffic-Counting.aspx
A Traffic Flow Map is available on CD or as a paper hard copy. It can be purchased for $5.00 at the address below. A PDF copy of the map is also available for download at:
https://www.oregon.gov/ODOT/DATA/Pages/Traffic-Counting.aspx (Look down the page for “Traffic Flow Volume Maps”)
To purchase any of these publications, make a check payable to “Oregon Department of Transportation (ODOT)”, list which publication(s) you want, where you would like the documents sent, and send it to:
Oregon Department of Transportation Transportation Systems Monitoring Unit 555 - 13th Street NE, Suite #2 Salem OR 97301-4178
If you would like additional information regarding the Transportation Volume Tables please call (503) 986-4147.

4

5
INTRODUCTION This publication is compiled and edited by the Transportation Systems Monitoring Unit and contains the following traffic count information:
• 2012 Trend Data. • Traffic volumes for over five thousand locations statewide. • Traffic data collected from 176 Automatic Traffic Recorder Stations.
Section I contains tabulation by State Highway road numbers listing AADT (Annual Average Daily Traffic) at various milepoints along the highways, and includes all vehicle totals in both directions unless identified as one-way traffic. One third of all State Highways were counted in 2012 and adjusted to 2012 AADT. The AADT’s for the remaining two thirds of the State Highways were adjusted to reflect area traffic growth trends. When a new highway is completed and opens to traffic for only part of the year, the AADT as given in this tabulation, is presented as if the facility was open to traffic for the entire year. The state highway numbering system has carried three highway numbers for many years that had a directional suffix. As ODOT has grown more dependent on databases, these three highways were often entered using specific numbers instead. In the Transportation Volume Tables, these highways are shifted to the order corresponding to those numbers, rather than the old designations. Pacific Highway East No. 1E (OR99E) will now be found as Highway 81. Pacific Highway West No. 1W (OR99W) will now be found as Highway 91. Lower Columbia River Highway No. 2W (US30) will now be found as Highway 92. Also included are interchange ramp diagrams with volumes for Pacific Highway No. 1 (I-5), Columbia River Highway No. 2 (I-84), Old Oregon Trail No. 6 (I-84), The Dalles-California Highway No. 4 (US 97), Sunset Highway No. 47 (US 26), Stadium Freeway Highway No. 61 (I-405), East Portland Freeway Highway No. 64 (I-205), Beltline Highway No. 69 (OR569) in Eugene, McNary Highway No. 70 (I-82), Beaverton – Tigard Highway No. 144 (OR 217), North Santiam Highway No. 162 (OR 22), and Eugene – Springfield Highway No. 227 (I-105 & OR 126)
Note I: The highway numbers seen throughout this publication are the Oregon Department of Transportation internal highway numbers. These numbers are not what you would see on road signs when driving on our highways. For those not familiar with our highway numbering system, there are two Highway Cross Reference Tables provided in the front part of Section I. Note II: The AADT’s provided in this publication are applicable for a given range of milepoints. Due to space constraints we are unable to indicate the beginning and ending milepoints for which the AADT’s are applicable. For information about the ranges please contact the TSM Unit at the phone number listed.

6
With the replacement of ODOT’s previous inventory database, the following spurs were renumbered and shifted to the order corresponding to these new numbers rather than the old designations.
New Highway Number
Old Highway Number Highway Name
481 12 Baker-Copperfield Spur 482 25 Redwood Spur 483 39 McMinnville Spur 484 50 Esplanade Spur 485 104 Fort Stevens Spur 486 271 Gold Hill Spur 487 301 Celilo-Wasco Spur 488 422 Chiloquin Spur 489 450 Parma Spur 490 450 Homedale Spur 491 455 Weiser Spur 492 455 Payette Spur 493 455 Ontario Spur
Section II contains a summary of traffic data collected at Automatic Traffic Recorder Stations during the past ten years. Stations with less than ten years of historical data are shown from the date of installation to the present date. The data includes yearly comparisons of AADT, seasonal variation by months, peak days, peak hours, and types of vehicles. The vehicle classification breakdown is based on manual counts taken for a 16 or 24 hour period; a 48 hour tube count; or from the station itself (only at permanent classifiers).
The terminology as applied to vehicle classification or type is defined as follows:
Motorcycles-Scooters -- All two or three-wheeled motorized vehicles. Typical vehicles in this category have saddle type seats and are steered by handle bars rather than a wheel. This category includes motorcycles, motor scooters, mopeds, motor-powered bicycles, and three-wheel motorcycles. Passenger Cars -- All sedans, coupes, station wagons, and minivans manufactured primarily for the purpose of carrying passengers. This includes passenger cars pulling recreational or other light trailers.
Other Two-Axle, Four-Tire Single Unit Vehicles -- All two-axle, four-tire vehicles, other than passenger cars. Included in this classification are pickups, panels, vans, and other vehicles such as campers, motor homes, ambulances, hearses, and carryalls. Other two-axle, four-tire single unit vehicles pulling recreational or other light trailers are included in this classification.

7
Buses -- All vehicles manufactured and licensed as traditional passenger-carrying buses with two axles and six tires or three or more axles. This category includes only traditional buses (including school buses) functioning as passenger-carrying vehicles. All two-axle, four-tire minibuses should be classified as other two-axle, four-tire single unit vehicles. Modified buses should be considered to be a truck and be appropriately classified.
NOTE: In reporting information on trucks, the following criteria are used: a. Truck tractor units traveling without a trailer are considered
single unit trucks. b. A truck tractor unit pulling other truck tractor units in a "saddle
mount” configuration are considered as one single unit truck and will be defined only by the axles on the pulling unit.
c. Vehicles are defined by the number of axles in contact with the roadway. Therefore, "floating" axles are counted only when in the down position. d. The term "trailer" includes both semi- and full trailers.
Two-Axle, Six-tire, Single Unit Trucks -- All vehicles on a single frame, including trucks, camping and recreation vehicles, motor homes, etc., having two axles and dual rear wheels. Three-Axle Single Unit Trucks -- All vehicles on a single frame, including trucks, camping and recreational vehicles, motor homes, etc., having three axles.
Four or More Axle Single Unit Trucks -- All trucks on a single frame with four or more axles.
Four or Less Axle Single Trailer Trucks -- All vehicles with four or less axles consisting of two units, one of which is a tractor or straight truck power unit.
Five-Axle Single Trailer Trucks -- All five-axle vehicles consisting of two units, one of which is a tractor or straight truck power unit. Six or More Axle Single Trailer Trucks -- All vehicles with six or more axles consisting of two units, one of which is a tractor or straight truck power unit.
Five or Less Axle Multi - Trailer Trucks -- All vehicles with five or less axles consisting of at least three units, one of which is a tractor or straight truck power unit.

8
Six-Axle Multi - Trailer Trucks -- All six-axle vehicles consisting of at least three units, one of which is a tractor or straight truck power unit. Seven or More Axle Multi - Trailer Trucks -- All vehicles with seven or more axles consisting of at least three units, one of which is a tractor or straight truck power unit.

9
2012 TREND DATA
Gasoline distributed to retail dealers during 2012 decreased 1.4 percent as compared to 2011.
Special Use Fuels distributed to retail dealers during 2012 decreased 2.3 percent as compared to 2011. Special Use Fuels include diesel, propane, and natural gas.
The 2012 motor vehicle registrations increased 0.2 percent as compared to 2011. Historical motor vehicle registration data may also be found on the web at:
https://www.oregon.gov/odot/dmv/pages/news/vehicle_stats.aspx
The 2012 Vehicle Miles of Travel (VMT) on the state highways decreased 0.1 percent as compared to 2011. Historical VMT data may also be found on the web at:
https://www.oregon.gov/ODOT/DATA/Pages/Traffic-Counting.aspx#VMT
Oregon State Highway Vehicle Miles Traveled Year VMT % Change 2012 19,416,500,000 -0.1%2011 19,431,700,000 -1.5%2010 19,731,200,000 -0.5%2009 19,830,600,000 1.7% 2008 19,504,300,000 -5.2%2007 20,584,500,000 -0.4%2006 20,664,000,000 -0.3%2005 20,723,100,000 -0.2%2004 20,754,300,000 -0.3%2003 20,819,400,000 -0.6%2002 20,940,700,000 2.0% 2001 20,529,100,000 0.4% 2000 20,450,700,000 0.6% 1999 20,320,700,000 3.1% 1998 19,716,000,000 1.8% 1997 19,376,500,000 3.0% 1996 18,809,300,000 2.2% 1995 18,406,900,000 2.4% 1994 17,975,400,000 2.7% 1993 17,508,400,000 2.0% 1992 17,163,400,000 1.3% 1991 16,936,700,000 3.6% 1990 16,354,900,000 3.5%
(Rounded to the nearest 100,000)

10

11
SECTION I
INTRODUCTION TO
TRAFFIC VOLUMES ON THE STATE HIGHWAY SYSTEM
Section I contains a tabulation of vehicular traffic at various locations on the State Highway System. This tabulation is designed for use with the State Highway Numbering System.
This section includes: • A Cross Reference Table listing State Highway Numbers to posted Highway Route Numbers. • A Cross Reference Table listing posted Highway Route Numbers to State Highway Numbers. • A list showing the year each highway was last counted. • A map showing the State Highway Numbering System with accompanying Highway Route Numbers.

12

13
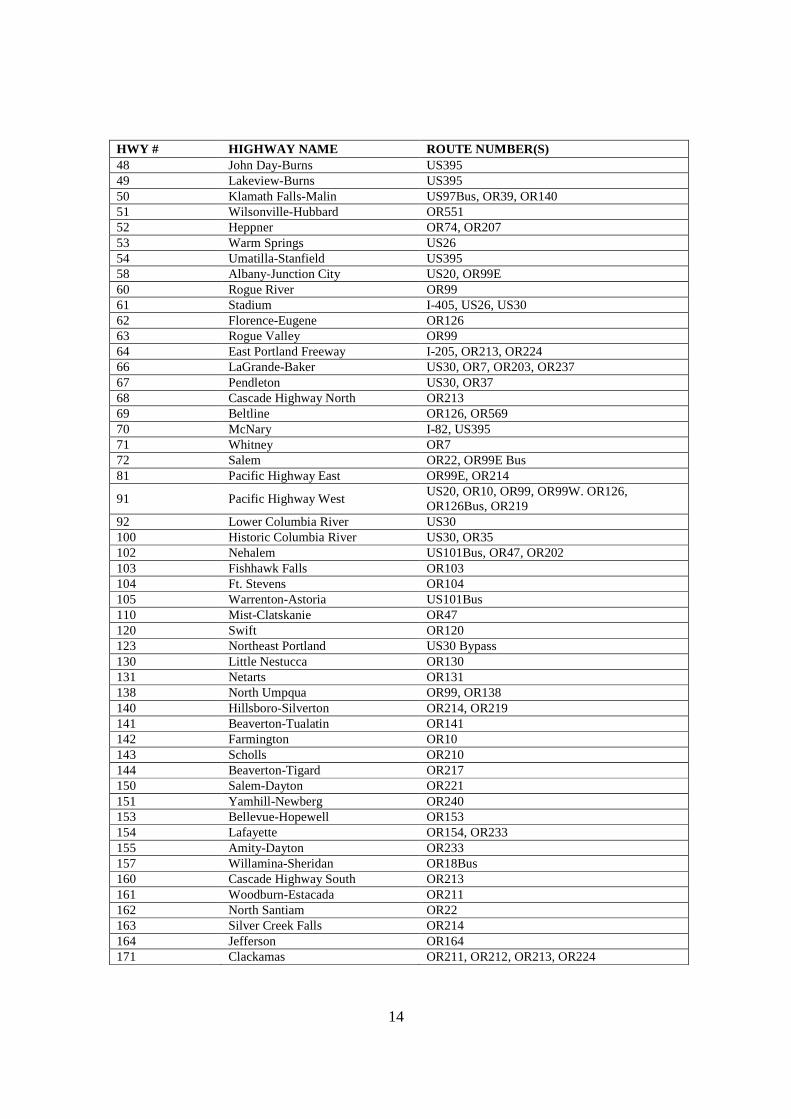
CROSS REFERENCE TABLE
Highway Numbers, Highway Names, and Posted Route Numbers
Oct. 2013
This publication lists each highway in the order of its State Highway Numbers. The following reference lists the State Highway Number, Highway Name, and posted Highway Route Numbers that traverse all or a
portion of each State Highway. A route common with another for less than one mile is not shown.
HWY # HIGHWAY NAME ROUTE NUMBER(S) 1 Pacific I-5, US30, OR99, OR99E, OR138 2 Columbia River I-84, US30, US395, US730 3 Oswego OR43 4 The Dalles-California US26, US30, US97, US197, OR216 5 John Day US26, US395, OR19, OR206, OR207 6 Old Oregon Trail I-84, US30, US395 7 Central Oregon US20, US26, US395, OR201 8 Oregon-Washington US30, OR11 9 Oregon Coast US101, OR255 10 Wallowa Lake OR82 11 Enterprise-Lewiston OR3 12 Baker-Copperfield OR7, OR86, OR86S 14 Crooked River OR27 15 McKenzie US20, OR126, OR126Bus , OR242 16 Santiam US20, OR126 17 McKenzie-Bend US20, US97Bus 18 Willamette OR58 19 Fremont US395, OR31, OR140 20 Klamath Falls-Lakeview US97Bus, OR39, OR140 21 Green Springs OR66, OR140 22 Crater Lake OR62 23 Dairy-Bonanza OR70 25 Redwood US199, OR99 26 Mt. Hood US26, OR35 27 Alsea OR34 28 Pendleton-John Day US395, OR37 29 Tualatin Valley OR8, OR47 30 Willamina-Salem OR22 31 Albany-Corvallis US20 32 Three Rivers OR22 33 Corvallis-Newport US20, OR34 35 Coos Bay-Roseburg OR42, OR99 36 Pendleton-Cold Springs OR37 37 Wilson River OR6 38 Oregon Caves OR46 39 Salmon River OR18, OR22, OR233 40 Beaverton-Hillsdale OR10 41 Ochoco US26, OR126 42 Sherman US97 43 Monmouth-Independence OR51 44 Wapinitia OR216 45 Umpqua OR38, OR99 46 Necanicum OR53 47 Sunset US26, OR47
14
HWY # HIGHWAY NAME ROUTE NUMBER(S) 48 John Day-Burns US395 49 Lakeview-Burns US395 50 Klamath Falls-Malin US97Bus, OR39, OR140 51 Wilsonville-Hubbard OR551 52 Heppner OR74, OR207 53 Warm Springs US26 54 Umatilla-Stanfield US395 58 Albany-Junction City US20, OR99E 60 Rogue River OR99 61 Stadium I-405, US26, US30 62 Florence-Eugene OR126 63 Rogue Valley OR99 64 East Portland Freeway I-205, OR213, OR224 66 LaGrande-Baker US30, OR7, OR203, OR237 67 Pendleton US30, OR37 68 Cascade Highway North OR213 69 Beltline OR126, OR569 70 McNary I-82, US395 71 Whitney OR7 72 Salem OR22, OR99E Bus 81 Pacific Highway East OR99E, OR214
91 Pacific Highway West US20, OR10, OR99, OR99W. OR126, OR126Bus, OR219
92 Lower Columbia River US30 100 Historic Columbia River US30, OR35 102 Nehalem US101Bus, OR47, OR202 103 Fishhawk Falls OR103 104 Ft. Stevens OR104 105 Warrenton-Astoria US101Bus 110 Mist-Clatskanie OR47 120 Swift OR120 123 Northeast Portland US30 Bypass 130 Little Nestucca OR130 131 Netarts OR131 138 North Umpqua OR99, OR138 140 Hillsboro-Silverton OR214, OR219 141 Beaverton-Tualatin OR141 142 Farmington OR10 143 Scholls OR210 144 Beaverton-Tigard OR217 150 Salem-Dayton OR221 151 Yamhill-Newberg OR240 153 Bellevue-Hopewell OR153 154 Lafayette OR154, OR233 155 Amity-Dayton OR233 157 Willamina-Sheridan OR18Bus 160 Cascade Highway South OR213 161 Woodburn-Estacada OR211 162 North Santiam OR22 163 Silver Creek Falls OR214 164 Jefferson OR164 171 Clackamas OR211, OR212, OR213, OR224
15
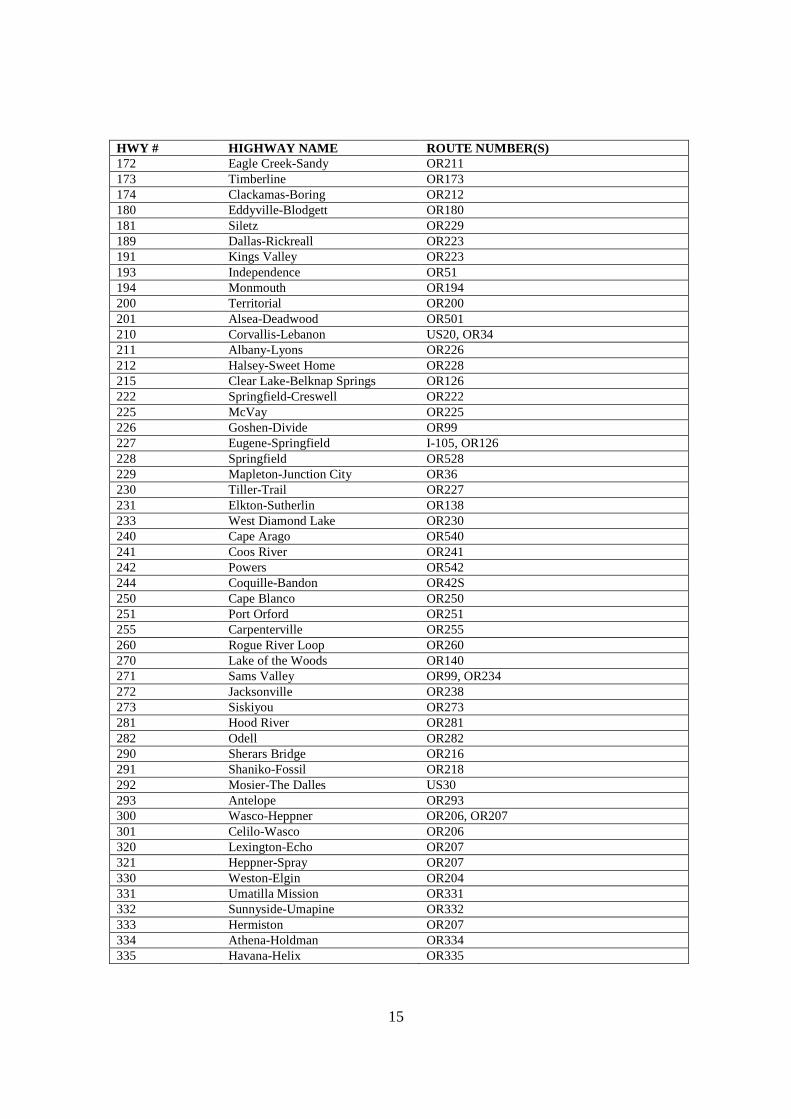
HWY # HIGHWAY NAME ROUTE NUMBER(S) 172 Eagle Creek-Sandy OR211 173 Timberline OR173 174 Clackamas-Boring OR212 180 Eddyville-Blodgett OR180 181 Siletz OR229 189 Dallas-Rickreall OR223 191 Kings Valley OR223 193 Independence OR51 194 Monmouth OR194 200 Territorial OR200 201 Alsea-Deadwood OR501 210 Corvallis-Lebanon US20, OR34 211 Albany-Lyons OR226 212 Halsey-Sweet Home OR228 215 Clear Lake-Belknap Springs OR126 222 Springfield-Creswell OR222 225 McVay OR225 226 Goshen-Divide OR99 227 Eugene-Springfield I-105, OR126 228 Springfield OR528 229 Mapleton-Junction City OR36 230 Tiller-Trail OR227 231 Elkton-Sutherlin OR138 233 West Diamond Lake OR230 240 Cape Arago OR540 241 Coos River OR241 242 Powers OR542 244 Coquille-Bandon OR42S 250 Cape Blanco OR250 251 Port Orford OR251 255 Carpenterville OR255 260 Rogue River Loop OR260 270 Lake of the Woods OR140 271 Sams Valley OR99, OR234 272 Jacksonville OR238 273 Siskiyou OR273 281 Hood River OR281 282 Odell OR282 290 Sherars Bridge OR216 291 Shaniko-Fossil OR218 292 Mosier-The Dalles US30 293 Antelope OR293 300 Wasco-Heppner OR206, OR207 301 Celilo-Wasco OR206 320 Lexington-Echo OR207 321 Heppner-Spray OR207 330 Weston-Elgin OR204 331 Umatilla Mission OR331 332 Sunnyside-Umapine OR332 333 Hermiston OR207 334 Athena-Holdman OR334 335 Havana-Helix OR335

16
HWY # HIGHWAY NAME ROUTE NUMBER(S) 339 Freewater OR339 340 Medical Springs OR203 341 Ukiah-Hilgard OR244 342 Cove OR237 350 Little Sheep Creek OR350 351 Joseph-Wallowa Lake OR351 360 Madras-Prineville US26 361 Culver OR361 370 O’Neil OR370 372 Century Drive None 380 Paulina OR380 390 Service Creek-Mitchell OR207 402 Kimberly-Long Creek OR402 410 Sumpter OR410 413 Halfway-Cornucopia OR413 414 Pine Creek OR414 415 Dooley Mountain OR245 420 Midland None 422 Chiloquin OR422 424 South Klamath Falls OR140 426 Hatfield OR39 429 Crescent Lake OR429 431 Warner OR140 440 Frenchglen OR205 442 Steens OR78 449 Huntington US30 450 Succor Creek OR201 451 Vale-West OR451 453 Adrian-Arena Valley OR453 454 Adrain-Caldwell OR454 455 Olds Ferry-Ontario US30Bus, OR201 456 I.O.N. US95 481 Baker-Copperfield Spur OR86S 482 Redwood Spur None 483 McMinnville Spur OR18 484 Esplanade Spur US97Bus 485 Fort Stevens Spur OR104S 486 Gold Hill Spur OR99, OR234 487 Celilo-Wasco Spur None 488 Chiloquin Spur OR422S 489 Parma Spur OR452 490 Homedale Spur OR201 491 Weiser Spur US95S 492 Payette Spur OR52 493 Ontario Spur US30, US30Bus
17
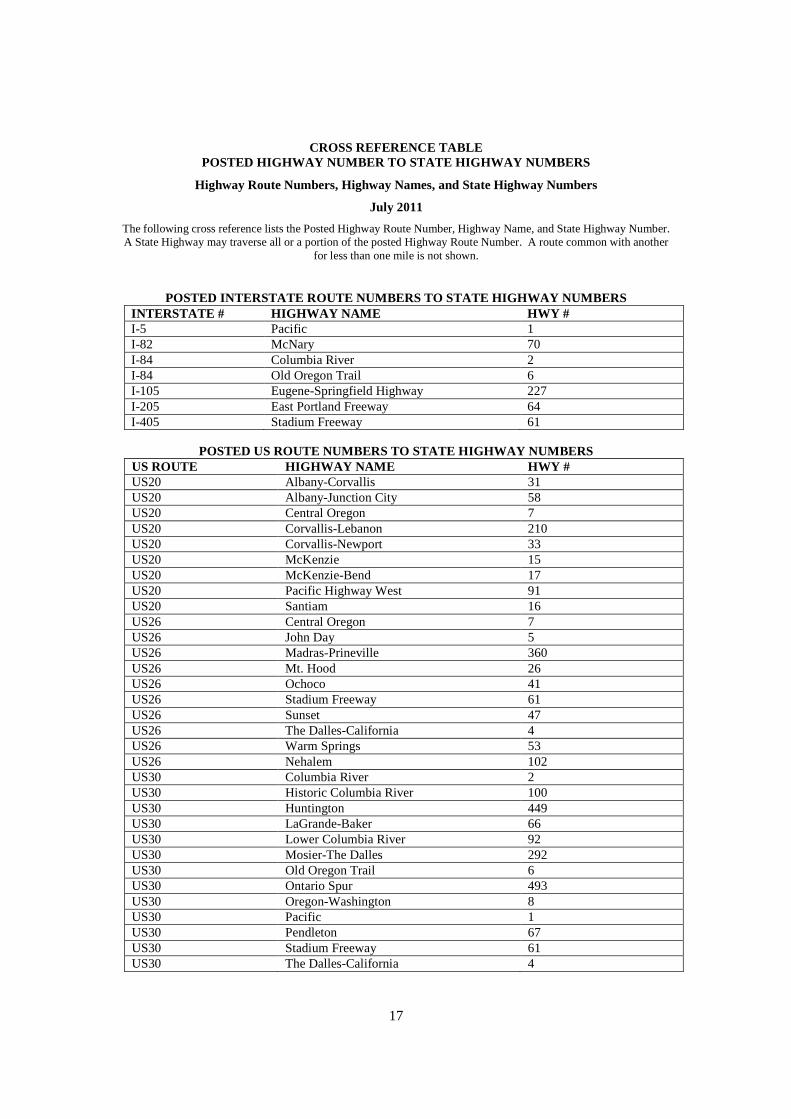
CROSS REFERENCE TABLE POSTED HIGHWAY NUMBER TO STATE HIGHWAY NUMBERS
Highway Route Numbers, Highway Names, and State Highway Numbers
July 2011
The following cross reference lists the Posted Highway Route Number, Highway Name, and State Highway Number. A State Highway may traverse all or a portion of the posted Highway Route Number. A route common with another
for less than one mile is not shown.
POSTED INTERSTATE ROUTE NUMBERS TO STATE HIGHWAY NUMBERS INTERSTATE # HIGHWAY NAME HWY # I-5 Pacific 1 I-82 McNary 70 I-84 Columbia River 2 I-84 Old Oregon Trail 6 I-105 Eugene-Springfield Highway 227 I-205 East Portland Freeway 64 I-405 Stadium Freeway 61
POSTED US ROUTE NUMBERS TO STATE HIGHWAY NUMBERS
US ROUTE HIGHWAY NAME HWY # US20 Albany-Corvallis 31 US20 Albany-Junction City 58 US20 Central Oregon 7 US20 Corvallis-Lebanon 210 US20 Corvallis-Newport 33 US20 McKenzie 15 US20 McKenzie-Bend 17 US20 Pacific Highway West 91 US20 Santiam 16 US26 Central Oregon 7 US26 John Day 5 US26 Madras-Prineville 360 US26 Mt. Hood 26 US26 Ochoco 41 US26 Stadium Freeway 61 US26 Sunset 47 US26 The Dalles-California 4 US26 Warm Springs 53 US26 Nehalem 102 US30 Columbia River 2 US30 Historic Columbia River 100 US30 Huntington 449 US30 LaGrande-Baker 66 US30 Lower Columbia River 92 US30 Mosier-The Dalles 292 US30 Old Oregon Trail 6 US30 Ontario Spur 493 US30 Oregon-Washington 8 US30 Pacific 1 US30 Pendleton 67 US30 Stadium Freeway 61 US30 The Dalles-California 4

18
POSTED US ROUTE NUMBERS TO STATE HIGHWAY NUMBERS US ROUTE HIGHWAY NAME HWY # US30Bus Olds Ferry-Ontario 455 US30Bus Ontario Spur 493 US30 Bypass Northeast Portland 123 US95 I.O.N 456 US95S Weiser Spur 491 US97 Sherman 42 US97 The Dalles-California 4 US97Bus Esplanade Spur 484 US97Bus Klamath Falls-Lakeview 20 US97Bus Klamath Falls-Malin 50 US97Bus McKenzie-Bend 17 US101 Oregon Coast 9 US101Bus Nehalem 102 US101Bus Warrenton-Astoria 105 US197 The Dalles-California 4 US199 Redwood 25 US395 Central Oregon 7 US395 Columbia River 2 US395 Fremont 19 US395 John Day 5 US395 John Day-Burns 48 US395 Lakeview-Burns 49 US395 McNary 70 US395 Old Oregon Trail 6 US395 Pendleton-John Day 28 US395 Umatilla-Stanfield 54 US730 Columbia River 2
POSTED OREGON ROUTE NUMBER TO STATE HIGHWAY NUMBER OR ROUTE HIGHWAY NAME HWY # OR3 Enterprise-Lewiston 11 OR6 Wilson River 37 OR7 Baker-Copperfield 12 OR7 La Grande-Baker 66 OR7 Whitney 71 OR8 Tualatin Valley 29 OR10 Beaverton-Hillsdale 40 OR10 Farmington 142 OR10 Pacific Highway West 91 OR11 Oregon-Washington 8 OR18 McMinnville Spur 483 OR18 Salmon River 39 OR18Bus Willamina-Sheridan 157 OR19 John Day 5 OR22 North Santiam 162 OR22 Salem 72 OR22 Salmon River 39 OR22 Three Rivers 32 OR22 Willamina-Salem 30 OR27 Crooked River 14

19
POSTED OREGON ROUTE NUMBER TO STATE HIGHWAY NUMBER OR ROUTE HIGHWAY NAME HWY # OR31 Fremont 19 OR34 Alsea 27 OR34 Corvallis-Lebanon 210 OR34 Corvallis-Newport 33 OR34 Pacific Highway West 91 OR35 Historic Columbia River 100 OR35 Mt. Hood 26 OR36 Mapleton-Junction City 229 OR37 Pendleton 67 OR37 Pendleton-Cold Springs 36 OR37 Pendleton-John Day 28 OR38 Umpqua 45 OR39 Hatfield 426 OR39 Klamath Falls-Lakeview 20 OR39 Klamath Falls-Malin 50 OR42 Coos Bay-Roseburg 35 OR42S Coquille-Bandon 244 OR43 Oswego 3 OR46 Oregon Caves 38 OR47 Mist-Clatskanie 110 OR47 Nehalem 102 OR47 Sunset 47 OR47 Tualatin Valley 29 OR51 Independence 193 OR51 Monmouth-Independence 43 OR52 Payette Spur 492 OR53 Necanicum 46 OR58 Willamette 18 OR62 Crater Lake 22 OR66 Green Springs 21 OR70 Dairy-Bonanza 23 OR74 Heppner 52 OR78 Steens 442 OR82 Wallowa Lake 10 OR86 Baker-Copperfield 12 OR86S Baker-Copperfield 12 OR86S Baker-Copperfield Spur 481 OR99 Coos Bay-Roseburg 35 OR99 Gold Hill Spur 486 OR99 Goshen-Divide 226 OR99 North Umpqua 138 OR99 Pacific 1 OR99 Pacific Highway West 91 OR99 Redwood 25 OR99 Rogue River 60 OR99 Rogue Valley 63 OR99 Sams Valley 271 OR99 Umpqua 45 OR99 Willamette 18

20
POSTED OREGON ROUTE NUMBER TO STATE HIGHWAY NUMBER OR ROUTE HIGHWAY NAME HWY # OR99E Albany-Junction City 58 OR99E Pacific 1 OR99E Pacific Highway East 81 OR99E Bus Salem 72 OR99W Pacific Highway West 91 OR103 Fishhawk Falls 103 OR104 Ft. Stevens 104 OR104S Ft. Stevens Spur 485 OR120 Swift 120 OR126 Beltline 69 OR126 Clear Lake-Belknap Springs 215 OR126 Eugene-Springfield 227 OR126 Florence-Eugene 62 OR126 McKenzie 15 OR126 Ochoco 41 OR126 Pacific Highway West 91 OR126 Santiam 16 OR126Bus McKenzie 15 OR126Bus Pacific Highway West 91 OR130 Little Nestucca 130 OR131 Netarts 131 OR138 Elkton-Sutherlin 231 OR138 North Umpqua 138 OR138 Pacific 1 OR140 Fremont 19 OR140 Green Springs 21 OR140 Klamath Falls-Lakeview 20 OR140 Klamath Falls-Malin 50 OR140 Lake of the Woods 270 OR140 South Klamath Falls 424 OR140 Warner 431 OR141 Beaverton-Tualatin 141 OR153 Bellevue-Hopewell 153 OR154 Lafayette 154 OR164 Jefferson 164 OR173 Timberline 173 OR180 Eddyville-Blodgett 180 OR194 Monmouth 194 OR200 Territorial 200 OR201 Central Oregon 7 OR201 Homedale Spur 490 OR201 Olds Ferry-Ontario 455 OR201 Succor Creek 450 OR202 Nehalem 102 OR203 LaGrande-Baker 66 OR203 Medical Springs 340 OR204 Weston-Elgin 330 OR205 Frenchglen 440 OR206 Celilo-Wasco 301 OR206 Wasco-Heppner 300

21
POSTED OREGON ROUTE NUMBER TO STATE HIGHWAY NUMBER OR ROUTE HIGHWAY NAME HWY # OR207 Heppner 52 OR207 Heppner-Spray 321 OR207 Hermiston 333 OR207 John Day 5 OR207 Lexington-Echo 320 OR207 Service Creek-Mitchell 390 OR207 Wasco-Heppner 300 OR210 Scholls 143 OR211 Clackamas 171 OR211 Eagle Creek-Sandy 172 OR211 Woodburn-Estacada 161 OR212 Clackamas 171 OR212 Clackamas-Boring 174 OR213 Cascade Highway South 160 OR213 Cascade Highway North 68 OR213 Clackamas 171 OR213 East Portland Freeway 64 OR214 Hillsboro-Silverton 140 OR214 Pacific Highway East 81 OR214 Silver Creek Falls 163 OR216 Sherars Bridge 290 OR216 The Dalles-California 4 OR216 Wapinitia 44 OR217 Beaverton-Tigard 144 OR218 Shaniko-Fossil 291 OR219 Hillsboro-Silverton 140 OR221 Salem-Dayton 150 OR222 Springfield-Creswell 222 OR223 Dallas-Rickreall 189 OR223 Kings Valley 191 OR224 Clackamas 171 OR224 East Portland Freeway 64 OR225 McVay 225 OR226 Albany-Lyons 211 OR227 Tiller-Trail 230 OR228 Halsey-Sweet Home 212 OR229 Siletz 181 OR230 West Diamond Lake 233 OR233 Amity-Dayton 155 OR233 Lafayette 154 OR233 Salmon River 39 OR234 Gold Hill Spur 486 OR234 Sams Valley 271 OR237 Cove 342 OR237 LaGrande-Baker 66 OR238 Jacksonville 272 OR240 Yamhill-Newberg 151 OR241 Coos River 241 OR242 McKenzie 15 OR244 Ukiah-Hilgard 341 OR245 Dooley Mountain 415

22
POSTED OREGON ROUTE NUMBER TO STATE HIGHWAY NUMBER OR ROUTE HIGHWAY NAME HWY # OR250 Cape Blanco 250 OR251 Port Orford 251 OR255 Carpenterville 255 OR260 Rogue River Loop 260 OR273 Siskiyou 273 OR281 Hood River 281 OR282 Odell 282 OR293 Antelope 293 OR331 Umatilla Mission 331 OR332 Sunnyside-Umapine 332 OR334 Athena-Holdman 334 OR335 Havana-Helix 335 OR339 Freewater 339 OR350 Little Sheep Creek 350 OR351 Joseph-Wallowa Lake 351 OR361 Culver 361 OR370 O’Neil 370 OR380 Paulina 380 OR402 Kimberly-Long Creek 402 OR410 Sumpter 410 OR413 Halfway-Cornucopia 413 OR414 Pine Creek 414 OR422 Chiloquin 422 OR422S Chiloquin Spur 488 OR429 Crescent Lake 429 OR451 Vale-West 451 OR452 Parma Spur 489 OR453 Adrian-Arena Valley 453 OR454 Adrian-Caldwell 454 OR501 Alsea-Deadwood 201 OR528 Springfield 228 OR540 Cape Arago 240 OR542 Powers 242 OR551 Wilsonville-Hubbard 51 OR569 Beltline 69

23
HIGHWAY COUNT SCHEDULE The traffic counting program on the state highway system is conducted over a three year period. The tabulation below lists the year that each highway was last counted.
HWY NO.
HIGHWAY NAME YEAR COUNTED
HWY NO.
HIGHWAY NAME YEAR COUNTED
1 Pacific 11 49 Lakeview-Burns 10 2 Columbia River 11 50 Klamath Falls-Malin 10 3 Oswego 12 51 Wilsonville-Hubbard 11 4 The Dalles-California 11 52 Heppner 12 5 John Day 12 53 Warm Springs 11 6 Old Oregon Trail 11 54 Umatilla-Stanfield 08 7 Central Oregon 12 58 Albany-Junction City 08 8 Oregon-Washington 10 60 Rogue River 10 9 Oregon Coast 12 61 Stadium 11 10 Wallowa Lake 10 62 Florence-Eugene 12 11 Enterprise-Lewiston 10 63 Rogue Valley 10 12 Baker-Copperfield 10 64 East Portland Freeway 11 14 Crooked River 12 66 La Grande-Baker 10 15 McKenzie 10 67 Pendleton 11 16 Santiam 10 68 Cascade (N. Section) 08 17 McKenzie-Bend 11 69 Beltline 11 18 Willamette 10 70 McNary 11 19 Fremont 10 71 Whitney 10 20 Klamath Falls-Lakeview 10 72 Salem 08 21 Green Springs 10 81 Pacific Highway E 10 22 Crater Lake 10 91 Pacific Highway W 10 23 Dairy-Bonanza 10 92 Lower Columbia River 10 25 Redwood 12 100 Historic Columbia River 10 26 Mt. Hood 12 102 Nehalem 10 27 Alsea 12 103 Fishhawk Falls 10 28 Pendleton-John Day 12 104 Ft. Stevens 10 29 Tualatin Valley 12 105 Warrenton-Astoria 10 30 Willamina-Salem 11 110 Mist Clatskanie 12 31 Albany-Corvallis 11 120 Swift 11 32 Three Rivers 12 123 Northeast Portland 11 33 Corvallis-Newport 12 130 Little Nestucca 12 35 Coos Bay-Roseburg 12 131 Netarts 12 36 Pendleton-Cold Springs 10 138 North Umpqua 10 37 Wilson River 12 140 Hillsboro-Silverton 10 38 Oregon Caves 12 141 Beaverton-Tualatin 12 39 Salmon River 12 142 Farmington 12 40 Beaverton-Hillsdale 12 143 Scholls 12 41 Ochoco 12 144 Beaverton-Tigard 11 42 Sherman 10 150 Salem-Dayton 11 43 Monmouth-Independence 11 151 Yamhill-Newberg 11 44 Wapinitia 12 153 Bellevue-Hopewell 11 45 Umpqua 12 154 Lafayette 11 46 Necanicum 10 155 Amity-Dayton 11 47 Sunset 11 157 Willamina-Sheridan 12 48 John Day-Burns 11 160 Cascade (S. Section) 10

24
HWY NO.
HIGHWAY NAME YEAR COUNTED
HWY NO.
HIGHWAY NAME YEAR COUNTED
161 Woodburn-Estacada 10 331 Umatilla Mission 10 162 North Santiam 11 332 Sunnyside-Umapine 10 163 Silver Creek Falls 12 333 Hermiston 12 164 Jefferson 11 334 Athena-Holdman 10 171 Clackamas 10 335 Havana-Helix 10 172 Eagle Creek-Sandy 10 339 Freewater 10 173 Timberline 10 340 Medical Springs 10 174 Clackamas-Boring 10 341 Ukiah-Hilgard 11 180 Eddyville-Blodgett 12 342 Cove 10 181 Siletz 12 350 Little Sheep Creek 10 189 Dallas-Rickreall 12 351 Joseph-Wallowa Lake 10 191 Kings Valley 12 360 Madras-Prineville 12 193 Independence 11 361 Culver 12 194 Monmouth 12 370 O’Neil 12 200 Territorial 12 372 Century Drive 09 201 Alsea-Deadwood 12 380 Paulina 12 210 Corvallis-Lebanon 10 390 Service Creek-Mitchell 12 211 Albany-Lyons 10 402 Kimberly-Long Creek 12 212 Halsey-Sweet Home 10 410 Sumpter 10 215 Clear Lake-Belknap Springs 10 413 Halfway-Cornucopia 10 222 Springfield-Creswell 10 414 Pine Creek 10 225 McVay 10 415 Dooley Mountain 10 226 Goshen-Divide 12 420 Midland 10 227 Eugene-Springfield 11 422 Chiloquin 10 228 Springfield 11 424 South Klamath Falls 10 229 Mapleton-Junction City 12 426 Hatfield 10 230 Tiller-Trail 10 429 Crescent Lake 10 231 Elkton-Sutherlin 12 431 Warner 10 233 West Diamond Lake 10 440 Frenchglen 12 240 Cape Arago 12 442 Steens 12 241 Coos River 12 449 Huntington 11 242 Powers 12 450 Succor Creek 12 244 Coquille-Bandon 12 451 Vale-West 12 250 Cape Blanco 12 453 Adrian-Arena Valley 12 251 Port Orford 12 454 Adrian-Caldwell 12 255 Carpenterville 12 455 Olds Ferry-Ontario 11 260 Rogue River Loop 10 456 I.O.N. 12 270 Lake of the Woods 10 481 Baker-Copperfield Spur 10 271 Sams Valley 11 482 Redwood Spur 12 272 Jacksonville 10 483 McMinnville Spur 12 273 Siskiyou 11 484 Esplanade Spur 10 281 Hood River 10 485 Fort Stevens Spur 10 282 Odell 10 486 Gold Hill Spur 10 290 Sherars Bridge 12 487 Celilo-Wasco Spur 10 291 Shaniko-Fossil 12 488 Chiloquin Spur 10 292 Mosier-The Dalles 11 489 Parma Spur 12 293 Antelope 12 490 Homedale Spur 12 300 Wasco-Heppner 12 491 Weiser Spur 11 301 Celilo-Wasco 10 492 Payette Spur 11 320 Lexington-Echo 12 493 Ontario Spur 11 321 Heppner-Spray 12 330 Weston-Elgin 10

LAKEHARNEY
MALHEUR
LANE
GRANT
KLAMATH
DOUGLAS
LINN
BAKER
CROOK
UMATILLA
WALLOWA
WASCO
UNION
JACKSON
COOS
CURRY
DESCHUTES
MORROW
WHEELER
JEFFERSON
GILLIAM
MARIONPOLK
CLACKAMAS
JOSEPHINE
LINCOLN
TILLAMOOKYAMHILL
SHERMAN
CLATSOP
BENTON
COLUMBIA
HOODRIVERWASHINGTON
Adel
Vida
Ruch
Rome
PostNoti
Otis
Keno
Hebo
Mist
Vale
Scio
MoroIone
Echo
Cove
Bend
Trail
Sixes
Riley
Oxbow
Minam
Goble
Odell
Olney
FloraElsie
Dolph
Dairy
Crane
Cairo
Bates
Alsea
Wasco
Unity
Union
Ukiah
Spray
Salem
Rufus
Nyssa
Waterloo
Gates
Malin
Lyons
Helix
Elgin
Dufur
Drain
HinesBurns
Adams
Algoma
Wilbur
Weiser
Jewell
Elmira
Zigzag
O'Neil
Mehama
Imnaha
Brooks
Durkee
Anlauf
Goshen
Mayger
Beatty Basque
Mosier
Veneta
Turner
Toledo
Siletz
Talent
Seneca
Keizer
Powers
Monroe
Maupin
Madras
Lowell
Joseph
Imbler
Idanha
HainesFossil
Eugene
Elkton
Dallas
Culver
Condon
Coburg
Riddle
Halsey
Bandon
Weston
Albany
Adrian
Dillard
Narrows
Blalock
Marquam
Paulina
Netarts
Umapine
La Pine
Midland
Juntura
Holdman
Hilgard
Goldson
Chemult
Svensen
Provolt
Yachats
Winston
Westfir
Wallowa
Seaside
Oakland
SumpterStayton
Sisters
Shaniko
Redmond
Rainier
Ontario
Paisley
Newport
WheelerNehalem
Merrill
PhoenixMedford
Lostine
Lebanon
Irrigon
Heppner
HalfwayGranite
Detroit
Bonanza
Astoria
Ashland
Siskiyou
Gardiner
Prospect
Parkdale
Neskowin
Westport
Blodgett
MapletonDeadwood
Kimberly
Jamieson
Ironside
Hamilton
Crescent
Crabtree
Cascadia
Brothers
Yoncalla
Waldport
VernoniaUmatilla
Sheridan
Roseburg
Richland
Prescott
Oakridge
MonumentMonmouth
Mitchell
Lonerock
Lakeview
Lakeside
JohnDay
Glendale
Gearhart
Bay City
Florence
Dayville
Metolius
Creswell
Coquille
Coos Bay
Boardman
Antelope
McDermitt
Wapinitia
Rickreall
Oceanside
Swisshome
Kernville
EddyvilleSalisbury
Warrenton
Tillamook
Sutherlin
Sublimity
Stanfield
SilvertonWillamina
Reedsport
Pendleton
Manzanita
MillCity
Lexington
La Grande
Greenhorn
Gold Hill
Garibaldi
Depoe Bay
PhilomathCorvallis
Chiloquin
Scappoose
Brookings
Arlington
Jefferson
Scottsburg
Otter Rock
Wolf Creek
Frenchglen
Cornucopia
CharlestonCape Arago
Blue River
The Dalles
Sweet Home
Shady Cove
Prineville
Pilot Rock
North Bend
Long Creek
Huntington
Hood River
Harrisburg
Gold Beach
Dunes City
Falls City
Enterprise
Clatskanie
BakerCity
Union Creek
Tygh Valley
Silver Lake
Modoc Point
Ripplebrook
Cape Blanco
Island City
Rogue River
Port Orford
CanyonCity
Grants Pass
Springfield
EaglePoint
Canyonville
Butte Falls
Millersburg
Oregon Caves
Warm Springs
Valley Falls
Powell Butte
Wallowa Lake
Ft. Klamath
Cannon BeachSaint Helens
PrairieCity
North Powder
Myrtle PointMyrtle Creek
Mt. Vernon
Independence
Lincoln City
GrassValley
ServiceCreek
New Princeton
Crescent Lake
Central Point
Klamath Falls
Junction City
Jordan Valley
Columbia City
Cottage Grove
Cave Junction
Cascade Locks Celilo
Village
Burns Jct
Klamath Agency
Rockaway Beach
Roaring Springs
Medical Springs
Gov't Camp
Jacksonville
Greenleaf
SantiamJct
Payette Jct
Heppner Jct
Milton-FreewaterNecanicum
Jct
Athena
Aumsville
Summerville
ColdSprings
Jct
BiggsJct
Scotts Mills
MolallaWoodburnGervaisMt. Angel
Silver Falls
WillaminaValleyJct
Pittsburg
£¤30£¤30
ÄÆ
204
ÄÆ
3
ÄÆ
207
ÄÆ
35
ÄÆ
230
ÄÆ
19
ÄÆ
34
ÄÆ
62
ÄÆ
255
ÄÆ
42
ÄÆ
221
ÄÆ
47
ÄÆ
281
ÄÆ
334
ÄÆ
224
ÄÆ
27
ÄÆ
39
ÄÆ
218
ÄÆ
542
ÄÆ
273
ÄÆ
361
§̈¦84
§̈¦84
§̈¦84
§̈¦84
§̈¦5
§̈¦84
§̈¦5
§̈¦84
§̈¦84
£¤395
ÄÆ
138
ÄÆ126
ÄÆ
528
ÄÆ
350
ÄÆ
82
£¤97
£¤95
£¤101
£¤20
£¤30
£¤26
£¤395
£¤730
£¤199
£¤101B
£¤20
£¤30
£¤395£¤97
£¤97
£¤101
£¤97
£¤395
£¤26
£¤97
£¤20395
ÄÆ
31ÄÆ
22
ÄÆ
78
ÄÆ
140
ÄÆ
205
ÄÆ
410
ÄÆ
6
ÄÆ
244
ÄÆ380
ÄÆ
66
ÄÆ
245
ÄÆ126
ÄÆ
138
ÄÆ
242
ÄÆ
206
ÄÆ
74
ÄÆ
200
ÄÆ
223
ÄÆ569
ÄÆ
451
ÄÆ
501
ÄÆ
351
ÄÆ
413
ÄÆ
454
ÄÆ
52
ÄÆ
251
ÄÆ
42
ÄÆ
62
ÄÆ
19
ÄÆ
207
ÄÆ
138
ÄÆ
126
ÄÆ
19
ÄÆ
206
ÄÆ
74
ÄÆ
207
ÄÆ
453
ÄÆ
18Bus
ÄÆ
201
£¤395
£¤2620
ÄÆ
201
£¤2620
ÄÆ
201
£¤95Spur£¤30£¤26
ÄÆ
7
ÄÆ
414
ÄÆ
140
ÄÆ
140
ÄÆ
422
ÄÆ422 Spur
ÄÆ
70
ÄÆ
140
ÄÆ
39
ÄÆ
39
£¤97
£¤97BUS
§̈¦5
ÄÆ
99
ÄÆ
260
ÄÆ
234
ÄÆ
99
ÄÆ
99
ÄÆ
238ÄÆ
46
ÄÆ
250
ÄÆ42S
ÄÆ
241
ÄÆ
38
ÄÆ
99
ÄÆ
126
ÄÆ
36
§̈¦5
§̈¦105
ÄÆ
58
£¤20
£¤20
ÄÆ
126£¤20£¤20
ÄÆ
86 ÄÆ
86Spur
£¤30
£¤30
ÄÆ
203
ÄÆ
237
ÄÆ
237
ÄÆ
82
£¤395730
ÄÆ
37
ÄÆ
207
ÄÆ
11ÄÆ
331
£¤395
ÄÆ20774
£¤30395
£¤26
£¤197
£¤395§̈¦82
§̈¦84£¤30
£¤26
ÄÆ
216
£¤197
ÄÆ
206
ÄÆ
216
£¤97
ÄÆ
126
ÄÆ
18
ÄÆ2218 ÄÆ
22
£¤101
£¤30ÄÆ
104Spur
ÄÆ
104
ÄÆ
229
ÄÆ
53
ÄÆ
22
ÄÆ
99
ÄÆ
201ÄÆ
226
ÄÆ
202
ÄÆ
228
£¤30Bus
£¤26£¤20
£¤26
£¤20
£¤101
7
5
49
442
28
19
20
440
41300
48
431
456
52
16
138
102
21
380
270
11
53
341
4
66
91
37
71162
26
330
321
14
15
27
191 291
42
12
360
350
340
4
320
44
415
233
32
272255
029
32
35
390
334
215
271
370
293
9
163
361
18
9
4
413
455
110
301
372
138
229
45
50
402
47
58
211
10
290
22
41
66
45
5
4 491
100
36
212
62
91
46
33 33
38
180
342
100
16
28
450
4
22
1
1
1
1666
28
52
300
41
53
4
9
200 15
1
8
8
281
244
242
487
42
15
39
226
150
2
22 33
5
6
6
6
7
19
488
50
81
241
200
130
240
210
9292
449201
260
23
194
157
485
451
131
332
222
225
193
351
103
164
31
333
70
181
250
54
100
331
69
273
454
30
339
105
410
420
4
424
63
422
426
453
227
173
43
429
153
60
282
104
292
228
189
50
414
67
251
231
20
26
5
9
455
17
9
25
39
9
492
7
490
489
4937 7
71
481
6
6
320
5
300
SEEENLARGEMENT
OTHER SIDE
20
19
7
42
£¤97
28
£¤26
456£¤95
£¤20
£¤395
ÄÆ
180
ÄÆ
99W ÄÆ
99E
ÄÆ
99W ÄÆ
99E
ÄÆ
164
ÄÆ
214
ÄÆ
282
2
£¤395 10
ÄÆ
402
ÄÆ
19207
5
ÄÆ
207
ÄÆ
293
ÄÆ126
ÄÆ
370
ÄÆ
429
ÄÆ
222
45
ÄÆ
38
£¤101
35
µ
0 5025 Miles
332 State Highway Number
§¦5 Interstate Route
£¤101 US Route
Oregon Route
ÄÆ
11
STATE OF OREGONSTATE HIGHWAY SYSTEM
PREPARED BY THEOREGON DEPARTMENT OF TRANSPORTATION
TRANSPORTATION DEVELOPMENT DIVISIONTRANSPORTATION DATA SECTION
IN COOPERATION WITH THEU.S. DEPARTMENT OF TRANSPORTATION
FEDERAL HIGHWAY ADMINISTRATION
DECEMBER 2012
OREGONDEPARTMENT OFTRANSPORTATION
DISCLAIMER:This product is for informational purposes only and may nothave been prepared for or be suitable for legal, engineering
or surveying purposes. Users of this information should review or consult the primary data and information sources
to ascertain the usability of the information.
\\s6000e\GISWORK\GIS23_74_Traffic_Monitoring_Support\mxd

Sandy
Banks
Canby
Amity
Zigzag
Brooks
Buxton
DonaldAurora
Gaston
Dundee
DaytonBarlow
Durham
Tigard
Marquam
Hubbard
Newberg
MolallaGervais
Gresham
Yamhill
Carlton
Damascus
Woodburn
Sherwood
Sheridan
Portland
Estacada
Fairview
Tualatin
Willamina
WestLinn
Milwaukie
Hillsboro
Gladstone
Cornelius
Lafayette
Scappoose
Troutdale
KingCity
Beaverton
Saint Paul
EagleCreek
MountAngel
Wilsonville
OregonCity
McMinnville
LakeOswego
Scotts Mills
MaywoodPark
North Plains
JohnsonCity
HappyValley
ForestGrove
WoodVillage
MultnomahFalls
Valley Junction§̈¦5
§̈¦205
§̈¦405
§̈¦205
£¤30BY
£¤26
£¤26
£¤30
£¤26
£¤26
ÄÆ
6
ÄÆ
99E
ÄÆ
18
ÄÆ
221
ÄÆ
219
ÄÆ
213
ÄÆ
8
ÄÆ
224
ÄÆ
211
ÄÆ
240ÄÆ
99W
ÄÆ
153
ÄÆ
217
ÄÆ
233
ÄÆ
551
ÄÆ
18B
ÄÆ
141
ÄÆ
120
ÄÆ
10
ÄÆ99E
ÄÆ
47
ÄÆ
18
ÄÆ
141
ÄÆ
221
ÄÆ
99W
ÄÆ
224 ÄÆ
211
ÄÆ
18
ÄÆ
213
ÄÆ
47
ÄÆ
99W
ÄÆ
211
ÄÆ
219
§̈¦84
§̈¦5
£¤26
£¤26
ÄÆ
8
ÄÆ
47
ÄÆ
99E
ÄÆ
211
ÄÆ
224
ÄÆ212
ÄÆ
213
ÄÆ43
ÄÆ
214
ÄÆ
224
ÄÆ
99W
ÄÆ
99E
§̈¦84
£¤30BY
ÄÆ
47
102
37
29
161
81
91
171
140
151
155
157
154
64
123
2
102
1
102
142
47
47
92
140
2
26144
29 2940
1
160
174
64
100
17226
26
161
141
1
140
16081
51
8129
39
39
143
483
153
150
141
39 150
3
2
120
171
61
47
140
91
68
171
171
91
91
123
153
1
81CLACKAMASYAMHILL
WASHINGTON MULTNOMAH
POLK
§̈¦84
26
§̈¦5
§̈¦5
29
ÄÆ
153
ÄÆ
47
ÄÆ224
ÄÆ212
ÄÆ
154
£¤30ÄÆ
10
DISCLAIMER:This product is for informational purposes only and may not have been
prepared for or be suitable for legal, engineering or surveying purposes. Users of this information should review or consult the primary data and information sources to ascertain the usability of the information.
µ
0 6 123 Miles
State Highway NumberInterstate Route
STATE OF OREGONPORTLAND AREA ENLARGEMENT
STATE HIGHWAY SYSTEMPREPARED BY THE
OREGON DEPARTMENT OF TRANSPORTATIONTRANSPORTATION DEVELOPMENT DIVISION
TRANSPORTATION DATA SECTIONIN COOPERATION WITH THE
U.S. DEPARTMENT OF TRANSPORTATIONFEDERAL HIGHWAY ADMINISTRATION
DECEMBER 2012
£¤101
ÄÆ
213
§̈¦5
100
U.S. Route
OR Route
27
TRAFFIC VOLUMES ON STATE HIGHWAYS
An asterisk (*) appearing to the left of a count location description indicates an Automatic Traffic Recorder Station or Automatic Vehicle Classification Station. For 2012 monthly traffic volumes, vehicle classification breakdown or historical trends at these stations see Section II of this book.

28

2012
TRAFFIC VOLUMES ON STATE HIGHWAYS
Milepoint 2012 AADT All Vehicles
ATR AVC Location Description
29
PACIFIC HIGHWAY NO. 1
Milepoint indicates distance from Oregon-Califor nia State Line
0.00 13400 Oregon-California State Line
5.02 13400 0.30 mile south of Siskiyou Interchange
11.03 14300 * Neil Creek Automatic Traffic Recorder, Sta. 15-002, 0.86 mile south of Rogue Valley Highway No. 63 Interchange (OR99)
13.67 13500 0.50 mile south of Green Springs Highway Interchange (OR66)
18.60 24200 0.50 mile south of North Ashland Interchange
19.87 35500 0.77 mile north of North Ashland Interchange
23.90 38800 0.50 mile south of Fern Valley Road Interchange
26.91 37800 0.30 mile south of South Medford Interchange
28.33 45200 * Medford Viaduct Automatic Traffic Recorder, Sta. 15-019, 1.96 mile southeast of the South Medford Interchange
30.59 36200 0.30 mile north of Crater Lake Highway Interchange (OR62)
34.94 31100 0.50 mile south of Seven Oaks Interchange
36.04 33300 0.60 mile north of Seven Oaks Interchange
42.84 32100 * Gold Hill Automatic Traffic Recorder, Sta. 15-001, 2.77 miles south of the Valley of the Rogue Bridge Interchange
44.97 32400 0.50 mile east of Rogue River Highway (OR99), Homestead Interchange
45.61 31600 On Rogue River Bridge
48.32 31400 0.50 mile east of Rogue River Interchange
55.38 31000 0.40 mile south of East Grants Pass Interchange (US199)
57.56 24000 0.50 mile south of Redwood Highway (OR99), N. Grants Pass Interchange
61.05 29500 0.40 mile south of Louse Creek Interchange
64.20 19700 * Grave Creek Automatic Traffic Recorder, Sta. 17-001, 2.08 miles south of Monument Drive (Jump Off Joe) Interchange
71.29 17800 0.10 mile south of Sunny Valley Interchange
75.73 17200 0.30 mile south of South Wolf Creek Interchange
76.50 15800 0.10 mile south of North Wolf Creek Interchange
77.91 16900 0.20 mile south of Speaker Road Interchange
80.30 17100 0.50 mile south of Glendale Junction Interchange
83.09 16900 0.20 mile south of Barton Road Interchange
85.84 16200 0.30 mile south of Quines Creek Road Interchange
87.72 16900 0.40 mile south of Azalea Interchange
95.52 17100 0.30 mile south of Canyon Creek Interchange
97.68 17300 0.60 mile south of Canyonville Interchange
98.82 18700 * Canyonville Automatic Traffic Recorder, Sta. 10-008, 0.54 mile north of Canyonville/Days Creek Interchange (Fifth Street)
101.10 22200 0.30 mile south of Riddle (Yokum Road) Interchange
101.60 22400 0.30 mile south of Gazley Road Interchange
103.65 23100 0.30 mile south of Riddle Road Interchange
106.41 24600 0.30 mile south of Weaver Road Interchange
107.91 24700 0.40 mile south of Myrtle Creek Interchange
109.86 28900 0.50 mile south of Boomer Hill Road Interchange
112.03 28800 0.50 mile south of Dillard Junction Interchange
113.14 26600 0.30 mile south of Clarks Branch Road Interchange
119.01 25100 0.50 mile south of Coos Bay-Roseburg Highway Interchange (OR99)
120.01 40100 0.50 mile north of Coos Bay-Roseburg Highway Interchange (OR99)
120.79 41300 0.30 mile north of Oakland-Shady Highway Interchange (OR99)
122.71 41900 0.30 mile south of Fairgrounds Interchange
123.84 42500 0.30 mile south of West Harvard Avenue Interchange

2012
TRAFFIC VOLUMES ON STATE HIGHWAYS
Milepoint 2012 AADT All Vehicles
ATR AVC Location Description
30
PACIFIC HIGHWAY NO. 1 (Continued)
126.83 33400 0.40 mile south of North Roseburg Interchange
129.12 33300 0.10 mile south of Winchester Interchange
129.75 29300 * Roseburg Automatic Traffic Recorder, Sta. 10-005, 0.53 mile north of Winchester Interchange
136.02 26100 0.50 mile south of Elkton-Sutherlin Highway Interchange (OR138)
136.72 21000 0.20 mile north of Elkton-Sutherlin Highway Interchange (OR138)
138.46 19900 0.10 mile north of South Oakland Interchange
140.77 21200 0.50 mile north of North Oakland Interchange
145.39 20900 * Oakland Automatic Traffic Recorder, Sta.10-007, 5.06 miles north of OR99
148.11 20700 0.10 mile south of North Rice Hill Interchange
149.94 19800 0.40 mile south of Yoncalla Interchange
150.84 18200 0.50 mile north of Yoncalla Interchange
155.54 18400 1.00 mile north of Elkhead Road Interchange
159.94 18500 0.20 mile south of Salt Springs Road Interchange
161.61 18500 0.10 mile south of Buck Creek Road Connection
162.06 18400 0.30 mile south of Umpqua Highway Interchange (OR99)
163.13 23200 0.30 mile south of Curtin Interchange
168.01 23700 0.36 mile south of Goshen-Divide Interchange at Lane-Douglas County Line
169.25 21900 * Martin Creek Automatic Traffic Recorder, Sta. 20-020, 1.24 miles northeast of Douglas-Lane County Line
174.64 24300 0.10 mile south of Cottage Grove Interchange
176.46 31200 0.30 mile south of Saginaw Interchange
182.53 30500 0.30 mile south of Springfield-Creswell Highway Interchange
183.13 32500 0.30 mile north of Springfield-Creswell Highway Interchange
187.83 32100 1.00 mile south of Willamette Highway Interchange (OR58)
189.03 49500 0.20 mile south of Bonneville Power Interchange (30th Avenue Connection)
190.07 40100 0.20 mile south of McVay Highway Connection
190.92 50500 * Eugene-Glenwood Automatic Traffic Recorder, Sta. 20-025, 1.06 mile south of Glenwood Interchange
192.15 56400 0.10 mile south of Pacific Highway West (OR99)
193.44 50900 0.50 mile south of Eugene-Springfield Highway Interchange (I-105)
195.10 68500 0.35 mile south of Belt Line Road Interchange (OR569)
198.85 41900 0.30 mile south of Van Duyn Road Interchange
208.76 36200 0.30 mile south of Diamond Hill Interchange
214.56 36200 * Lake Creek Automatic Traffic Recorder, Sta. 22-016, 2.01 miles south of Halsey-Sweet Home Highway No. 212 Interchange (OR228)
227.69 37900 0.40 mile south of Corvallis-Lebanon Highway Interchange (OR34)
232.93 46300 0.30 mile south of Santiam Highway Interchange (US20)
233.73 45700 0.50 mile south of Albany-Junction City Highway Interchange (OR99E)
234.80 58100 * North Albany Automatic Traffic Recorder, Sta. 22-005, 0.41 mile north of Albany-Junction City Highway No. 58 (OR99E)
237.37 57900 0.30 mile south of Viewcrest Interchange
238.12 58400 0.10 mile south of Jefferson Highway (south junction) Overcrossing
239.47 56400 0.20 mile south of Dever Interchange
240.10 56400 0.59 mile south of Santiam River
241.83 56200 0.30 mile south of Talbot Interchange
243.33 56300 0.20 mile south of Ankeny Hill Road Interchange
244.26 56300 0.20 mile south of Jefferson Highway Interchange (North Jct.)
248.01 58200 0.40 mile south of Battle Creek-Sunnyside Interchange
248.56 57100 0.80 mile south of Commercial Street Connection

2012
TRAFFIC VOLUMES ON STATE HIGHWAYS
Milepoint 2012 AADT All Vehicles
ATR AVC Location Description
31
PACIFIC HIGHWAY NO. 1 (Continued)
251.03 54300 0.50 mile south of Kuebler Interchange
252.20 69100 * Salem-Kuebler Automatic Traffic Recorder, Sta. 24-021, 0.02 mile north of Turner Road Overcrossing
255.98 89800 0.30 mile south of Market Street Interchange
258.10 90500 0.40 mile south of Hayesville Interchange
259.50 81400 0.70 mile south of Chemawa Road Interchange (OR99E Bus)
263.09 87400 0.40 mile south of Brooks Interchange
271.55 82200 0.30 mile south of Hillsboro-Silverton Highway Interchange (OR214)
278.27 82100 0.40 mile south of Aurora-Donald Interchange (Ehlen Road)
281.20 84300 * Wilsonville Automatic Traffic Recorder, Sta. 03-011, 1.38 miles south of Wilsonville-Hubbard Highway No. 51 Interchange (OR551)
283.58 119500 0.30 mile south of Wilsonville Interchange
285.88 120500 0.30 mile south of Stafford Road Interchange
287.91 135800 0.60 mile south of East Portland Freeway Interchange (I-205)
289.20 134400 0.30 mile south of Nyberg Road Interchange
290.14 153200 * Tigard Automatic Traffic Recorder, Sta. 34-008, 0.34 mile south of Boones Ferry Road Interchange
290.99 154300 0.30 mile south of Upper Boones Ferry Road Interchange
291.80 154500 0.40 mile south of Beaverton-Tigard Highway Interchange (OR217)
292.80 97500 0.25 mile south of Haines St. interchange
293.30 95800 0.30 mile south of Pacific Highway West (OR99W), at Tigard Jct. (at Haines St. undercrossing)
294.74 113800 0.30 mile south of Capitol Highway Interchange
295.43 112600 0.10 mile south of Taylors Ferry Road Connection
296.24 110300 0.10 mile south of Spring Garden Road Undercrossing
296.45 114800 0.10 mile south of Multnomah Boulevard Undercrossing
297.08 119800 0.10 mile south of Terwilliger Boulevard Undercrossing
298.24 137100 * Iowa Street Automatic Traffic Recorder, Sta. 26-016, 1.07 miles north of S.W. Terwilliger Boulevard, in Portland
299.13 133600 0.10 mile south of Macadam and Hood Avenue connections
299.87 117800 0.10 mile south of Stadium Freeway Interchange (I-405)
300.37 134500 * Marquam Bridge Automatic Traffic Recorder, Sta. 26-026, 0.34 mile northeast of Stadium Freeway No. 61 Interchange (I-405)
301.09 86400 Undercrossing, S.E. Morrison Street Bridge
301.50 61700 Undercrossing, Burnside Bridge
301.70 80700 Undercrossing, eastbound connection to Columbia River Highway (I-84)
301.99 122400 Overcrossing, N.E. Holladay Street
302.70 121400 0.40 mile south of Stadium Freeway Interchange (I-405)
303.68 143300 0.30 mile south of N. Going Street Interchange
304.23 119800 0.20 mile south of N. Killingsworth Street Overcrossing
304.66 129700 * Minnesota Freeway Automatic Traffic Recorder, Sta. 26-019, 0.03 mile south of N. Ainsworth Street undercrossing
305.14 123700 0.30 mile south of Northeast Portland Highway Interchange (US30 Bypass)
305.64 107600 0.20 mile north of Northeast Portland Highway Interchange (US30 Bypass)
306.36 92700 0.50 mile south of Overcrossing Pacific Highway West (OR99W)
307.08 90600 0.38 mile south of Pacific Highway East (OR99E)
307.66 126500 0.20 mile north of Pacific Highway East (OR99E)
307.97 124300 * Interstate Bridge Automatic Traffic Recorder, Sta. 26-004, 0.41 mile south of Oregon-Washington State Line

2012
TRAFFIC VOLUMES ON STATE HIGHWAYS
Milepoint 2012 AADT All Vehicles
ATR AVC Location Description
32
COLUMBIA RIVER HIGHWAY NO. 2
Milepoint indicates distance from Pacific Highwa y (I-5), in Portland
0.49 141400 * West Banfield Automatic Traffic Recorder, Sta. 26-015, 0.49 mile east of Pacific Highway No. 1 Interchange (I-5)
0.76 149500 0.24 mile east of Pacific Highway East (OR99E, Grand Avenue) undercrossing
1.43 169200 0.57 mile west of N.E. 33rd Avenue Interchange
2.27 143800 0.27 mile east of N.E. 33rd Avenue Interchange
3.35 154600 * Hoyt Automatic Traffic Recorder, Sta. 26-014, At the N.E. 53rd Avenue Undercrossing.
3.96 147000 0.30 mile west of N.E. Halsey Street ramp connection
4.81 143200 0.20 mile west of 82nd Avenue, Cascade Highway North Interchange (OR213)
5.31 133800 0.10 mile west of East Portland Freeway (I-205) connection (south junction)
5.99 59500 0.30 mile south of East Portland Freeway (I-205) connection (North Jct.)
6.45 39500 0.10 mile west of N.E. 102nd Avenue Interchange
6.75 34400 0.20 mile east of N.E. 102nd Avenue Interchange
Equation: MP 7.37 BK = MP 9.70 AH
9.78 105400 0.30 mile west of N.E. 122nd Avenue Interchange
11.45 100900 * Fairview Automatic Traffic Recorder, Sta. 26-028, 1.59 miles west of N.E. 181st Avenue Interchange
13.44 79200 0.40 mile east of N.E. 181st Avenue Interchange
15.20 60900 0.20 mile west of 223rd Avenue
16.46 44800 0.50 mile east of N.E. 238th Drive Interchange
17.32 19000 0.05 mile west of Overcrossing for Troutdale connection
17.71 28500 * Troutdale Automatic Traffic Recorder, Sta. 26-001, 0.04 mile west of Sandy River, east of Troutdale
18.12 25700 0.30 mile east of Jordan Interchange
22.40 23700 0.30 mile east of Corbett Interchange
25.19 23500 0.20 mile east of Rooster Rock State Park Interchange
28.16 21800 0.30 mile east of Bridal Veil connection
31.89 21100 0.50 mile east of Multnomah Falls Interchange
35.73 21100 0.10 mile east of Historic Columbia Highway (US30)
40.07 21300 0.20 mile west of Bonneville Dam Interchange
42.88 21200 0.50 mile west of West Cascade Locks Interchange
43.58 18100 0.20 mile east of West Cascade Locks Interchange
45.53 20700 * Cascade Locks Automatic Traffic Recorder, Sta. 14-004, 0.20 mile east of East Cascade Locks Interchange
47.61 21200 0.30 mile east of Herman Creek Interchange
51.29 21200 0.30 mile east of Wyeth Interchange
56.34 21200 0.30 mile east of Viento Interchange
61.86 21400 0.20 mile west of West Hood River Interchange
62.92 23200 1.00 mile west of 2nd Street Interchange
64.24 27100 0.20 mile west of Hood River Bridge Interchange
69.59 22300 0.20 mile west of Mosier Interchange
75.93 20200 * Rowena Automatic Traffic Recorder, Sta. 33-001, 0.72 mile west of the Rowena Interchange
77.15 20100 0.50 mile east of Rowena Interchange
82.62 18000 Hostetler Way Overcrossing
85.27 21700 0.24 mile west of Brewery Grade Interchange
85.81 20800 0.30 mile east of Brewery Grade Interchange
87.31 15100 0.30 mile east of The Dalles-California Highway (US197)
89.13 14700 0.30 mile east of The Dalles Dam Interchange
97.44 14000 0.30 mile east of Celilo-Wasco Highway (OR206)
2012
TRAFFIC VOLUMES ON STATE HIGHWAYS
Milepoint 2012 AADT All Vehicles
ATR AVC Location Description
33
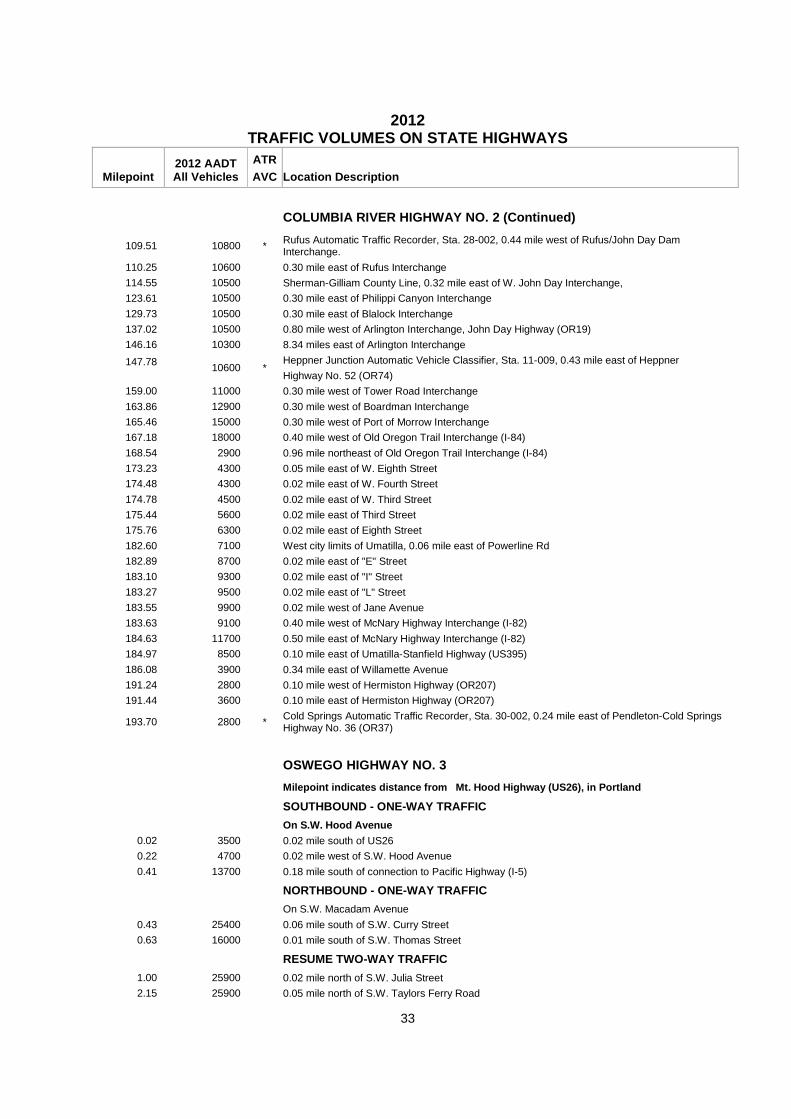
COLUMBIA RIVER HIGHWAY NO. 2 (Continued)
109.51 10800 * Rufus Automatic Traffic Recorder, Sta. 28-002, 0.44 mile west of Rufus/John Day Dam Interchange.
110.25 10600 0.30 mile east of Rufus Interchange
114.55 10500 Sherman-Gilliam County Line, 0.32 mile east of W. John Day Interchange,
123.61 10500 0.30 mile east of Philippi Canyon Interchange
129.73 10500 0.30 mile east of Blalock Interchange
137.02 10500 0.80 mile west of Arlington Interchange, John Day Highway (OR19)
146.16 10300 8.34 miles east of Arlington Interchange
147.78
10600 * Heppner Junction Automatic Vehicle Classifier, Sta. 11-009, 0.43 mile east of Heppner
Highway No. 52 (OR74)
159.00 11000 0.30 mile west of Tower Road Interchange
163.86 12900 0.30 mile west of Boardman Interchange
165.46 15000 0.30 mile west of Port of Morrow Interchange
167.18 18000 0.40 mile west of Old Oregon Trail Interchange (I-84)
168.54 2900 0.96 mile northeast of Old Oregon Trail Interchange (I-84)
173.23 4300 0.05 mile east of W. Eighth Street
174.48 4300 0.02 mile east of W. Fourth Street
174.78 4500 0.02 mile east of W. Third Street
175.44 5600 0.02 mile east of Third Street
175.76 6300 0.02 mile east of Eighth Street
182.60 7100 West city limits of Umatilla, 0.06 mile east of Powerline Rd
182.89 8700 0.02 mile east of "E" Street
183.10 9300 0.02 mile east of "I" Street
183.27 9500 0.02 mile east of "L" Street
183.55 9900 0.02 mile west of Jane Avenue
183.63 9100 0.40 mile west of McNary Highway Interchange (I-82)
184.63 11700 0.50 mile east of McNary Highway Interchange (I-82)
184.97 8500 0.10 mile east of Umatilla-Stanfield Highway (US395)
186.08 3900 0.34 mile east of Willamette Avenue
191.24 2800 0.10 mile west of Hermiston Highway (OR207)
191.44 3600 0.10 mile east of Hermiston Highway (OR207)
193.70 2800 * Cold Springs Automatic Traffic Recorder, Sta. 30-002, 0.24 mile east of Pendleton-Cold Springs Highway No. 36 (OR37)
OSWEGO HIGHWAY NO. 3
Milepoint indicates distance from Mt. Hood Highwa y (US26), in Portland
SOUTHBOUND - ONE-WAY TRAFFIC
On S.W. Hood Avenue
0.02 3500 0.02 mile south of US26
0.22 4700 0.02 mile west of S.W. Hood Avenue
0.41 13700 0.18 mile south of connection to Pacific Highway (I-5)
NORTHBOUND - ONE-WAY TRAFFIC
On S.W. Macadam Avenue
0.43 25400 0.06 mile south of S.W. Curry Street
0.63 16000 0.01 mile south of S.W. Thomas Street
RESUME TWO-WAY TRAFFIC
1.00 25900 0.02 mile north of S.W. Julia Street
2.15 25900 0.05 mile north of S.W. Taylors Ferry Road

2012
TRAFFIC VOLUMES ON STATE HIGHWAYS
Milepoint 2012 AADT All Vehicles
ATR AVC Location Description
34
OSWEGO HIGHWAY NO. 3 (Continued)
2.54 34400 0.05 mile north of Sellwood Ferry Road
3.64 20000 South city limits of Portland
4.02 19500 0.02 mile north of S.W. Riverwood Road
5.69 19000 0.02 mile north of Terwilliger Boulevard
5.80 24100 0.06 mile south of Terwilliger Boulevard
6.11 21900 0.02 mile north of S. "A" Avenue
6.17 31800 0.04 mile south of S. "A" Avenue
6.40 30300 0.02 mile south of North Shore Road
6.65 29300 0.05 mile north of S. McVey Avenue
6.77 18500 On Oswego Creek Bridge
7.54 18000 0.04 mile south of S. Glenmorrie Road
8.04 16700 South city limits of Lake Oswego, north city limits of West Linn, 0.03 mile north of S. Arbor Drive
9.52 17800 0.02 mile north of Jolie Pointe Road
10.27 18500 0.02 mile south of W. "A" Street
11.07 21300 0.10 mile north of East Portland Freeway (I-205)
***Willamette River Bridge was open for only 2 mont hs in 2012***
11.34 10700 0.01 mile north of S. Willamette Falls Drive
11.43 10000 On Willamette River Bridge, south city limits of West Linn and north city limits of Oregon City
THE DALLES-CALIFORNIA HIGHWAY NO. 4
Milepoint indicates distance from Washington-Oreg on State Line
0.00 6100 Washington-Oregon State Line, The Dalles Bridge
0.79 5200 0.15 mile south of Columbia River Highway Interchange (I-84)
1.01 5300 0.10 mile south of Mosier-The Dalles Highway (US30)
1.24 3000 0.02 mile south of N.E. Fremont Street
10.30 2400 * Dufur Automatic Traffic Recorder, Sta. 33-005, 0.84 mile south of Boyd Market Road (North Jct)
13.27 1300 0.05 mile south of Boyd Loop Road
16.08 1300 On Mays Canyon Creek Bridge
Equation: MP 23.00 BK = MP 27.88 AH
22.87 1400 0.02 mile south of Dufur Gap Road
33.84 1400 0.05 mile north of Sherars Bridge Highway (OR216)
33.94 980 0.05 mile south of Sherars Bridge Highway (OR216)
Equation: MP 37.77 BK = MP 39.33 AH
42.36 1000 0.07 mile north of Wapinitia Highway (OR216)
42.48 990 0.05 mile south of Wapinitia Highway (OR216)
43.96 1100 West city limits of Maupin, 0.30 mile south of Deschutes Avenue
45.84 1100 On Deschutes River Bridge
45.98 750 0.02 mile south of Bakeoven Road
46.40 470 South city limits of Maupin, 0.32 mile south of Deschutes River Road
67.00 390 0.17 mile north of Sherman Highway (US97)
67.22 2000 0.05 mile south of Sherman Highway (US97)
81.00 3300 0.02 mile south of Old Highway 97
87.78 3600 0.50 mile south of N.E. Elm Lane
89.60 4000 0.05 mile north of N.E. Cherry Lane
91.17 4200 0.05 mile north of N.E. Meadowlark Lane
91.43 6200 0.03 mile south of N.E. Loucks Road
91.98 7300 0.10 mile north of Warm Springs Highway (US26)

2012
TRAFFIC VOLUMES ON STATE HIGHWAYS
Milepoint 2012 AADT All Vehicles
ATR AVC Location Description
35
THE DALLES-CALIFORNIA HIGHWAY NO. 4 (Continued)
SOUTHBOUND - ONE-WAY TRAFFIC
On 4th Street
92.13 8500 0.02 mile north of Pine Street
92.44 12000 0.02 mile north of Culver Highway
92.76 10600 0.02 mile north of "G" Street
93.06 10000 0.02 mile south of "J" Street
NORTHBOUND - ONE-WAY TRAFFIC
On 5th Street
92.12 9900 0.02 mile north of Pine Street
92.43 12100 0.02 mile north of Culver Highway
92.47 10600 0.02 mile south of Culver Highway
92.73 11000 0.02 mile north of "G" Street
93.06 9000 0.02 mile south of "J" Street
RESUME TWO-WAY TRAFFIC
Equation: MP 93.12 BK = MP 96.04 AH
96.46 17900 0.02 mile north of S.W. Fairgrounds Road
97.11 12400 * Madras Automatic Traffic Recorder, Sta. 16-002, 0.18 mile north of Madras-Prineville Highway No. 360 (US26)
97.31 9400 0.02 mile south of Madras-Prineville Highway (US26)
103.61 8300 0.02 mile north of S.W. Iris Lane
105.63 8800 0.10 mile north of Culver Highway
105.83 12000 0.10 mile south of Culver Highway
112.83 12500 Jefferson-Deschutes County Line
115.86 12600 0.02 mile north of "A" Avenue at Terrebonne
118.50 14400 0.02 mile north of O'Neil Highway
119.09 18200 * North Redmond Automatic Traffic Recorder, Sta. 09-023, 0.57 mile south of O'Neil Highway No. 370
Equation: MP 118.96 BK = MP Z119.14 AH
120.92 18500 * Redmond-Hemlock Automatic Traffic Recorder, Sta. 09-022, 0.04 mile north of S.W. Antler Avenue
121.06 15000 0.10 mile south of S.W. Antler Avenue
121.31 16700 0.10 mile south of S.W. Evergreen Avenue
121.56 16900 0.10 mile south of S.W. Glacier Avenue
122.08 25600 0.10 mile south of S.W. Veterans Way
123.30 23400 0.30 mile north of Yew Avenue Interchange
124.39 26300 * Redmond Automatic Traffic Recorder, Sta. 09-020, 0.79 miles south of Yew Avenue
126.22 26300 0.02 mile south of S.W. Quarry Avenue
130.28 25600 0.10 mile south of Bend-Deschutes Market Road
134.70 33200 0.05 mile north of Nels Anderson Place and entrance to Mt. View Mall
135.16 33100 0.30 mile north of Empire Avenue Interchange
135.95 42700 * Bend-Empire Automatic Traffic Recorder, Sta. 09-007, 0.49 mile south of Empire Avenue
136.20 37200 0.19 mile south of Butler Market Road Interchange
136.62 36800 0.51 mile north of Revere Avenue Interchange
137.36 39100 * Bend-Revere Automatic Traffic Recorder, Sta. 09-009, 0.23 mile south of Revere Avenue
137.69 38700 0.16 mile south of N.W. Lafayette Avenue
138.00 37700 0.08 mile north of Colorado Interchange
138.60 31600 0.15 mile north of S.E. Truman Avenue
138.90 30000 0.27 mile north of Reed Market Road Interchange
139.61 22600 0.44 mile south of Reed Market Road Interchange

2012
TRAFFIC VOLUMES ON STATE HIGHWAYS
Milepoint 2012 AADT All Vehicles
ATR AVC Location Description
36
THE DALLES-CALIFORNIA HIGHWAY NO. 4 (Continued)
139.80 22000 0.17 mile north of Powers Road Interchange
140.22 18500 0.08 mile north of Badger Road
140.45 17800 * Bend-Pinebrook Automatic Traffic Recorder, Sta. 09-025, 0.07 mile north of Pinebrook Boulevard
140.65 14100 0.13 mile south of Pinebrook Boulevard
Equation: MP 141.12 BK = MP 141.86 AH
142.41 19800 * Lava Butte Automatic Traffic Recorder, Sta. 09-003, 0.17 mile south of China Hat Road
144.20 14900 0.75 mile south of Galen Baker Road
153.83 11700 0.75 mile south of South Century Drive
155.60 10500 0.10 mile south of Vandevert Road
161.84 10100 0.10 mile south of Paulina Lake Road
167.48 10300 0.02 mile north of 1st Street in La Pine
169.58 8200 0.10 mile north of Fremont Highway (OR31)
169.88 6700 0.20 mile south of Fremont Highway (OR31)
183.84 4700 0.20 mile north of Mississippi Drive at Gilchrist
185.57 4900 Crescent Post Office
194.75 3800 0.40 mile north of Willamette Highway (OR58)
195.55 5200 0.40 mile south of Willamette Highway (OR58)
204.65 4600 * Chemult Automatic Vehicle Classifier, Sta. 18-006, 0.40 mile south of Chemult Dump Road
212.79 5300 0.30 mile north of North Umpqua Highway (OR138)
213.29 3400 0.20 mile south of North Umpqua Highway (OR138)
231.91 3700 0.02 mile north of Fuego Road
243.22 3300 * Chiloquin Automatic Traffic Recorder, Sta. 18-023, 4.32 miles north of Chiloquin Highway No. 422
247.04 3600 0.50 mile north of Chiloquin Highway (North Jct.)
248.98 3700 0.10 mile north of Chiloquin Highway (south junction)
249.18 5400 0.10 mile south of Chiloquin Highway (south junction)
254.30 5300 * Modoc Point Automatic Traffic Recorder, Sta. 18-022, 3.53 miles north of Modoc Point Road
258.03 5700 0.20 mile south of Old Modoc Point Road
265.76 5900 0.10 mile south of Algoma Road
268.95 6500 0.10 mile south of Shady Pine Road
271.27 6500 0.02 mile south of Wocus Road
272.28 10400 0.30 mile north of Klamath Falls-Malin Highway (OR39-US97 Bus.) (Crater Lake Parkway)
273.08 6700 0.50 mile south of Klamath Falls-Malin Highway (OR39-US97 Bus.) (Crater Lake Parkway)
273.92 5600 0.30 mile south of Nevada Avenue Interchange
276.48 8200 0.40 mile north of Green Springs Highway (OR66) and S. Klamath Falls Highway (OR140)
277.43 4500 0.30 mile south of Green Springs Highway (OR66) and S. Klamath Falls Highway (OR140)
Equation: MP 277.61 BK = MP 278.03 AH
278.69 4300 On Klamath River Bridge
280.06 4100 0.10 mile north of Miller Island Road
282.82 3700 0.05 mile north of Cross Road
291.73 3500 * Midland Automatic Vehicle Classifier, Sta. 18-019, At the Oregon-California State Line
JOHN DAY HIGHWAY NO. 5
Milepoint indicates distance from Columbia River Highway (I-84), in Arlington
0.32 920 0.02 mile north of Beech Street
0.48 930 0.03 mile northwest of Main Street
0.53 990 0.02 mile southeast of Main Street
0.62 1100 0.02 mile southeast of Columbia Street

2012
TRAFFIC VOLUMES ON STATE HIGHWAYS
Milepoint 2012 AADT All Vehicles
ATR AVC Location Description
37
JOHN DAY HIGHWAY NO. 5 (Continued)
Equation: MP 1.13 BK = MP Z0.97 AH
1.62 1100 0.02 mile northwest of Rhea Lane (Airport Road)
1.66 990 0.02 mile south of Rhea Lane (Airport Road)
3.89 890 0.10 mile north of Fourmile Road
6.81 680 * Shutler Automatic Traffic Recorder, Sta. 11-007, 6.81 miles south of Columbia River Highway No. 2 (I-84/US30)
7.20 270 0.02 mile south of Cedar Springs Road
11.95 260 0.02 mile north of Cameron Road (The Tree Lane)
15.39 250 0.02 mile north of Baseline Road
16.81 180 0.02 mile north of Upper Rock Creek Road
19.83 170 0.02 mile north of Mikkalo Road
19.87 260 0.02 mile south of Mikkalo Road
23.13 290 0.02 mile south of Clem Road
29.48 300 0.30 mile south of Cayuse Canyon Road at Gwendolen
On Washington Street 37.45 340 0.05 mile north of Cottonwood Road
37.52 500 0.02 mile south of Cottonwood Road
37.90 610 0.02 mile north of Walnut Street
On Walnut Street
37.94 690 0.02 mile west of Washington Street
38.05 1100 0.02 mile east of Wasco-Heppner Highway (OR206/Main Street)
On Main Street 38.09 1700 0.02 mile south of Wasco-Heppner Highway (OR206)/ Walnut Street)
38.25 1700 0.02 mile north of Wasco-Heppner Highway (OR206/Park Street)
38.37 720 0.09 mile south of Wasco-Heppner Highway (OR206/Park Street)
38.40 760 0.02 mile south of Bayard Street
38.64 630 0.13 mile south of Trimble Street
39.54 590 0.02 mile south of Shannon Road
43.81 570 0.20 mile south of Trail Fork Road
Equation: MP 44.51 BK = MP 44.99 AH
45.39 510 0.10 mile south of Wehrli Canyon Loop
50.41 510 0.60 mile north of Carter Hill Road
52.06 530 Gilliam-Wheeler County Line
57.31 560 0.02 mile northwest of Butte Creek Road
57.57 590 0.03 mile northwest of W. 1st Street
57.62 410 0.02 mile southeast of W. 1st Street
58.13 460 0.02 mile west of Shaniko-Fossil Highway (OR218)
58.17 650 0.02 mile east of Shaniko-Fossil Highway (OR218)
Equation: MP 58.21 BK = MP 59.18 AH
59.20 440 0.04 mile west of Jay Street
59.64 410 0.40 mile east of Jay Street
62.65 310 0.10 mile south of Kinzua Road
69.37 260 0.30 mile south of Rowe Creek Road
72.95 240 0.90 mile south of Winlock Road
78.46 280 0.10 mile northwest of Service Creek-Mitchell Highway (OR207)
79.06 270 0.50 mile east of Service Creek-Mitchell Highway (OR207)
80.95 270 0.05 mile east of Alder Creek Road

2012
TRAFFIC VOLUMES ON STATE HIGHWAYS
Milepoint 2012 AADT All Vehicles
ATR AVC Location Description
38
JOHN DAY HIGHWAY NO. 5 (Continued)
Equation: MP 86.71 BK = MP 88.13 AH
92.17 340 0.10 mile north of Asher Drive
92.58 620 0.02 mile west of Main Street
95.06 360 0.50 mile southwest of Heppner-Spray Highway (OR207)
95.66 240 0.10 mile northeast of Heppner-Spray Highway (OR207)
104.73 190 Wheeler-Grant County Line
105.33 250 0.10 mile south of Kimberly-Long Creek Highway
Equation: MP 123.69 BK = MP 123.98 AH
124.07 310 0.10 mile north of Ochoco Highway (US26)
124.27 660 0.10 mile south of Ochoco Highway (US26)
130.05 740 0.30 mile north of Franks Creek Road
130.45 760 0.10 mile south of Franks Creek Road
130.91 840 0.10 mile west of Schoolhouse Road
131.04 970 0.03 mile east of Schoolhouse Road
131.40 870 * Dayville Automatic Traffic Recorder, Sta. 12-003, 1.05 miles east of Franks Creek Road in Dayville
133.59 780 0.10 mile south of Cheechacko Ranch Road
143.23 770 0.02 mile west of Dry Creek Road
Equation: MP 143.91 BK = MP 143.98 AH
148.22 870 0.02 mile west of Moon Creek Road
152.43 1000 0.10 mile west of Happy Valley Lane
153.65 1100 0.20 mile east of Roper Road
154.01 1600 0.02 mile west of Pendleton-John Day Highway (US395)
154.05 2300 0.02 mile east of Pendleton-John Day Highway (US395)
154.27 2300 0.10 mile east of S.E. Park Avenue
155.99 2200 0.10 mile west of Laycock Creek Road (Pleasant Hill Road)
159.11 2500 0.02 mile west of Luce Creek Road
161.09 4300 0.05 mile west of Old John Day Highway (Screech Alley Loop)
161.30 4500 0.16 mile east of Old John Day Highway (Screech Alley Loop)
161.98 5800 0.10 mile east of N.W. 3rd Avenue
162.10 6000 0.08 mile west of Bridge Street
162.27 6300 0.02 mile west of John Day-Burns Highway (US395)
162.31 3300 0.02 mile east of John Day-Burns Highway (US395)
162.42 2800 0.02 mile east of Elm Street
162.50 2600 0.02 mile east of S.E. Hillcrest Avenue
162.82 2600 0.20 mile east of S.E. Gunther Road
168.49 1600 0.02 mile west of Pine Creek Road
168.53 1400 0.02 mile east of Pine Creek Road
173.34 1400 0.02 mile east of Art Morgan Road
175.11 1700 0.02 mile east of Johnson Avenue
175.24 1600 0.02 mile west of Main Street
175.28 840 0.02 mile east of Main Street
175.79 830 * Prairie City Automatic Traffic Recorder, Sta. 12-009, 0.53 mile east of Main Street in Prairie City
190.65 590 0.02 mile west of Whitney Highway (OR7)
190.77 290 0.10 mile east of Whitney Highway (OR7)
193.65 250 0.10 mile west of Crawford Creek Road
199.61 250 Grant-Baker County Line
Equation: MP 203.19 BK = MP 203.82 AH
210.28 270 0.26 mile west of Dooley Mountain Highway (OR245)
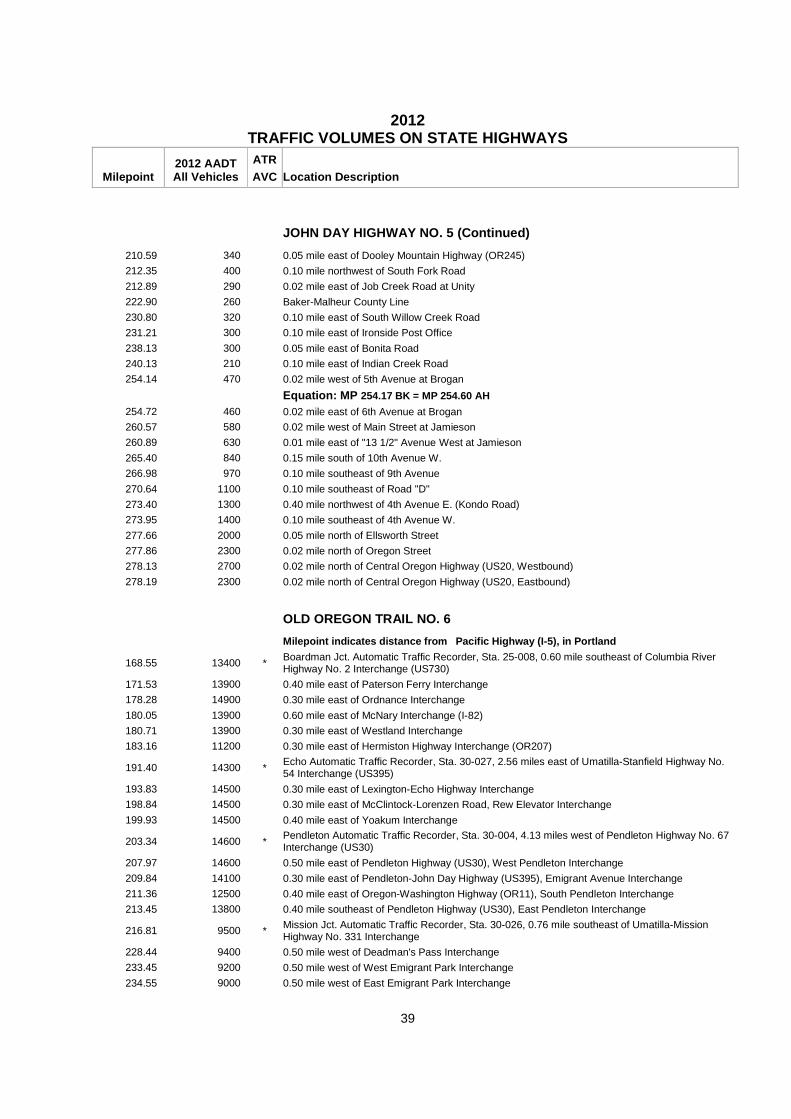
2012
TRAFFIC VOLUMES ON STATE HIGHWAYS
Milepoint 2012 AADT All Vehicles
ATR AVC Location Description
39
JOHN DAY HIGHWAY NO. 5 (Continued)
210.59 340 0.05 mile east of Dooley Mountain Highway (OR245)
212.35 400 0.10 mile northwest of South Fork Road
212.89 290 0.02 mile east of Job Creek Road at Unity
222.90 260 Baker-Malheur County Line
230.80 320 0.10 mile east of South Willow Creek Road
231.21 300 0.10 mile east of Ironside Post Office
238.13 300 0.05 mile east of Bonita Road
240.13 210 0.10 mile east of Indian Creek Road
254.14 470 0.02 mile west of 5th Avenue at Brogan
Equation: MP 254.17 BK = MP 254.60 AH
254.72 460 0.02 mile east of 6th Avenue at Brogan
260.57 580 0.02 mile west of Main Street at Jamieson
260.89 630 0.01 mile east of "13 1/2" Avenue West at Jamieson
265.40 840 0.15 mile south of 10th Avenue W.
266.98 970 0.10 mile southeast of 9th Avenue
270.64 1100 0.10 mile southeast of Road "D"
273.40 1300 0.40 mile northwest of 4th Avenue E. (Kondo Road)
273.95 1400 0.10 mile southeast of 4th Avenue W.
277.66 2000 0.05 mile north of Ellsworth Street
277.86 2300 0.02 mile north of Oregon Street
278.13 2700 0.02 mile north of Central Oregon Highway (US20, Westbound)
278.19 2300 0.02 mile north of Central Oregon Highway (US20, Eastbound)
OLD OREGON TRAIL NO. 6
Milepoint indicates distance from Pacific Highway (I-5), in Portland
168.55 13400 * Boardman Jct. Automatic Traffic Recorder, Sta. 25-008, 0.60 mile southeast of Columbia River Highway No. 2 Interchange (US730)
171.53 13900 0.40 mile east of Paterson Ferry Interchange
178.28 14900 0.30 mile east of Ordnance Interchange
180.05 13900 0.60 mile east of McNary Interchange (I-82)
180.71 13900 0.30 mile east of Westland Interchange
183.16 11200 0.30 mile east of Hermiston Highway Interchange (OR207)
191.40 14300 * Echo Automatic Traffic Recorder, Sta. 30-027, 2.56 miles east of Umatilla-Stanfield Highway No. 54 Interchange (US395)
193.83 14500 0.30 mile east of Lexington-Echo Highway Interchange
198.84 14500 0.30 mile east of McClintock-Lorenzen Road, Rew Elevator Interchange
199.93 14500 0.40 mile east of Yoakum Interchange
203.34 14600 * Pendleton Automatic Traffic Recorder, Sta. 30-004, 4.13 miles west of Pendleton Highway No. 67 Interchange (US30)
207.97 14600 0.50 mile east of Pendleton Highway (US30), West Pendleton Interchange
209.84 14100 0.30 mile east of Pendleton-John Day Highway (US395), Emigrant Avenue Interchange
211.36 12500 0.40 mile east of Oregon-Washington Highway (OR11), South Pendleton Interchange
213.45 13800 0.40 mile southeast of Pendleton Highway (US30), East Pendleton Interchange
216.81 9500 * Mission Jct. Automatic Traffic Recorder, Sta. 30-026, 0.76 mile southeast of Umatilla-Mission Highway No. 331 Interchange
228.44 9400 0.50 mile west of Deadman's Pass Interchange
233.45 9200 0.50 mile west of West Emigrant Park Interchange
234.55 9000 0.50 mile west of East Emigrant Park Interchange
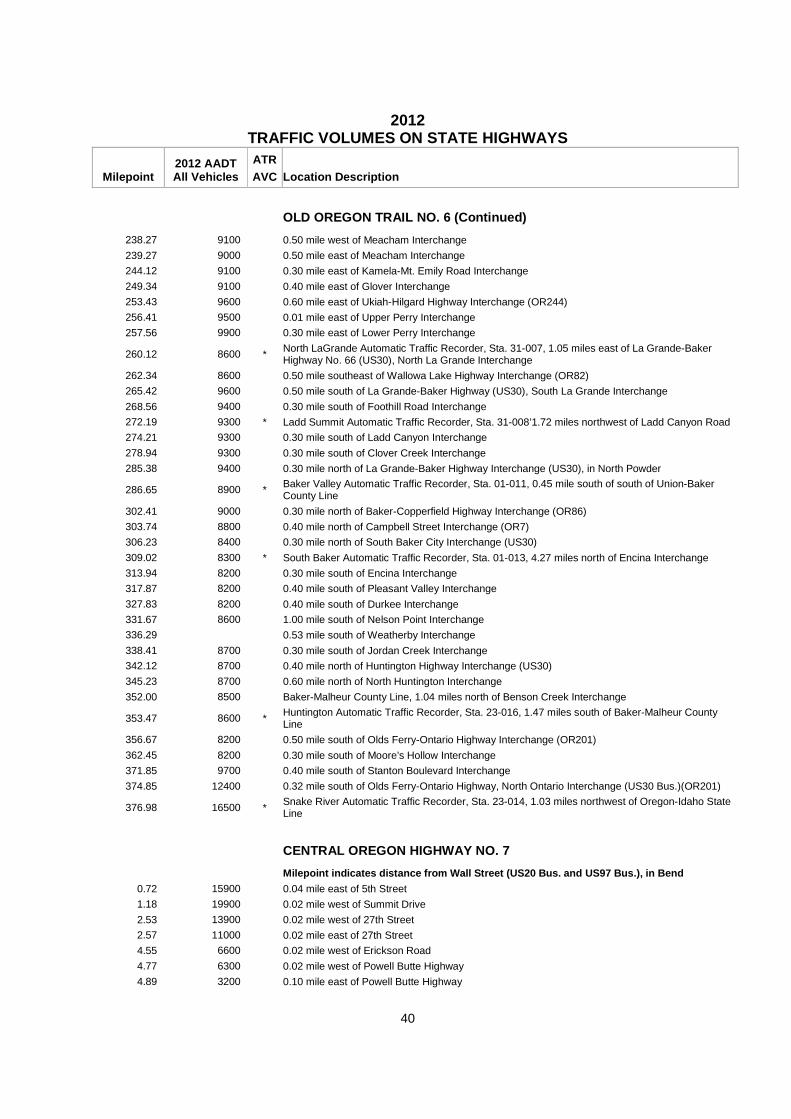
2012
TRAFFIC VOLUMES ON STATE HIGHWAYS
Milepoint 2012 AADT All Vehicles
ATR AVC Location Description
40
OLD OREGON TRAIL NO. 6 (Continued)
238.27 9100 0.50 mile west of Meacham Interchange
239.27 9000 0.50 mile east of Meacham Interchange
244.12 9100 0.30 mile east of Kamela-Mt. Emily Road Interchange
249.34 9100 0.40 mile east of Glover Interchange
253.43 9600 0.60 mile east of Ukiah-Hilgard Highway Interchange (OR244)
256.41 9500 0.01 mile east of Upper Perry Interchange
257.56 9900 0.30 mile east of Lower Perry Interchange
260.12 8600 * North LaGrande Automatic Traffic Recorder, Sta. 31-007, 1.05 miles east of La Grande-Baker Highway No. 66 (US30), North La Grande Interchange
262.34 8600 0.50 mile southeast of Wallowa Lake Highway Interchange (OR82)
265.42 9600 0.50 mile south of La Grande-Baker Highway (US30), South La Grande Interchange
268.56 9400 0.30 mile south of Foothill Road Interchange
272.19 9300 * Ladd Summit Automatic Traffic Recorder, Sta. 31-008’1.72 miles northwest of Ladd Canyon Road
274.21 9300 0.30 mile south of Ladd Canyon Interchange
278.94 9300 0.30 mile south of Clover Creek Interchange
285.38 9400 0.30 mile north of La Grande-Baker Highway Interchange (US30), in North Powder
286.65 8900 * Baker Valley Automatic Traffic Recorder, Sta. 01-011, 0.45 mile south of south of Union-Baker County Line
302.41 9000 0.30 mile north of Baker-Copperfield Highway Interchange (OR86)
303.74 8800 0.40 mile north of Campbell Street Interchange (OR7)
306.23 8400 0.30 mile north of South Baker City Interchange (US30)
309.02 8300 * South Baker Automatic Traffic Recorder, Sta. 01-013, 4.27 miles north of Encina Interchange
313.94 8200 0.30 mile south of Encina Interchange
317.87 8200 0.40 mile south of Pleasant Valley Interchange
327.83 8200 0.40 mile south of Durkee Interchange
331.67 8600 1.00 mile south of Nelson Point Interchange
336.29 0.53 mile south of Weatherby Interchange
338.41 8700 0.30 mile south of Jordan Creek Interchange
342.12 8700 0.40 mile north of Huntington Highway Interchange (US30)
345.23 8700 0.60 mile north of North Huntington Interchange
352.00 8500 Baker-Malheur County Line, 1.04 miles north of Benson Creek Interchange
353.47 8600 * Huntington Automatic Traffic Recorder, Sta. 23-016, 1.47 miles south of Baker-Malheur County Line
356.67 8200 0.50 mile south of Olds Ferry-Ontario Highway Interchange (OR201)
362.45 8200 0.30 mile south of Moore's Hollow Interchange
371.85 9700 0.40 mile south of Stanton Boulevard Interchange
374.85 12400 0.32 mile south of Olds Ferry-Ontario Highway, North Ontario Interchange (US30 Bus.)(OR201)
376.98 16500 * Snake River Automatic Traffic Recorder, Sta. 23-014, 1.03 miles northwest of Oregon-Idaho State Line
CENTRAL OREGON HIGHWAY NO. 7
Milepoint indicates distance from Wall Street (US20 Bus. and US97 Bus.), in Bend
0.72 15900 0.04 mile east of 5th Street
1.18 19900 0.02 mile west of Summit Drive
2.53 13900 0.02 mile west of 27th Street
2.57 11000 0.02 mile east of 27th Street
4.55 6600 0.02 mile west of Erickson Road
4.77 6300 0.02 mile west of Powell Butte Highway
4.89 3200 0.10 mile east of Powell Butte Highway

2012
TRAFFIC VOLUMES ON STATE HIGHWAYS
Milepoint 2012 AADT All Vehicles
ATR AVC Location Description
41
CENTRAL OREGON HIGHWAY NO. 7 (Continued)
6.28 2400 * Pilot Butte Automatic Traffic Recorder, Sta. 09-005, 1.49 miles east of Powell Butte Road
Equation: MP 17.60 BK = MP 18.01 AH
Equation: MP 20.97 BK = MP 21.69 AH
25.80 1100 0.39 mile west of Pine Mountain Road
35.63 1300 0.02 mile west of Crooked River Highway (OR27)
35.80 1200 0.15 mile east of Crooked River Highway (OR27)
42.99 1200 0.25 mile east of Camp Creek Road
63.45 1200 * Hampton Automatic Vehicle Classifier, Sta. 09-024, 5.80 miles northwest of Deschutes-Lake County Line
83.79 1300 Lake-Harney County Line
104.60 1400 0.09 mile west of Lakeview-Burns Highway (US395)
104.79 1400 0.10 mile east of Lakeview-Burns Highway (US395/US20)
126.60 2100 * Hines Automatic Traffic Recorder, Sta. 13-003, 0.04 mile northeast of Greenhouse Lane, southwest of Hines
128.09 2300 0.03 mile north of Hotchkiss Lane
129.14 4100 0.02 mile north of Barnes Avenue
129.58 4800 0.02 mile north of Conley Avenue
130.10 5500 0.12 mile north of W. Roe Davis Avenue, on S. Oregon Avenue
131.10 6400 0.02 mile southwest of W. Monroe Street on Hines Boulevard
131.32 5900 0.01 mile west of Court Avenue on W. Monroe Street
131.48 4900 0.01 mile west of Steens Highway (OR78), on W. Monroe Street
On N. Broadway
131.52 3400 0.02 mile north of Steens Highway (OR78)
131.67 3500 0.02 mile north of Adams Street
131.78 3200 0.02 mile north of "A" Street
131.98 2900 0.02 mile south of Foley Drive
132.05 2300 0.05 mile north of Foley Drive
132.51 1800 0.40 mile north of Park Street (north city limit of Burns, on Seneca Drive)
133.89 1700 0.40 mile west of John Day-Burns Highway (US395)
134.49 1400 0.20 mile east of John Day-Burns Highway (US395)
144.22 1100 0.02 mile west of Old Lawen-Harney Road
154.98 990 0.10 mile east of Crane-Buchanan Road
173.22 970 0.02 mile west of Drewsey Road
180.15 980 Harney-Malheur County Line
189.00 1100 0.27 mile west of Beulah Road
189.38 1200 * Juntura Automatic Traffic Recorder, Sta. 23-013, 0.11 mile east of Juntura-Riverside Road
189.51 1100 0.02 mile east of Frances Street
200.96 1000 0.50 mile east of Pole Creek Road
213.36 1000 0.02 mile east of road to Harper Dam
223.06 1100 0.10 mile west of Harper-Westfall Road
223.26 1200 0.10 mile east of Harper-Westfall Road
224.91 1200 0.50 mile west of Coleman Road
230.08 1200 0.10 mile east of Little Valley Road
Equation: MP 237.23 BK = MP 238.28 AH
238.62 1500 0.16 mile west of Vale-West Highway
238.88 1600 0.10 mile east of Vale-West Highway
240.17 1600 0.02 mile east of Hope Road
244.26 1900 0.05 mile west of Bench Road
245.61 2000 0.10 mile west of "A" Street E.
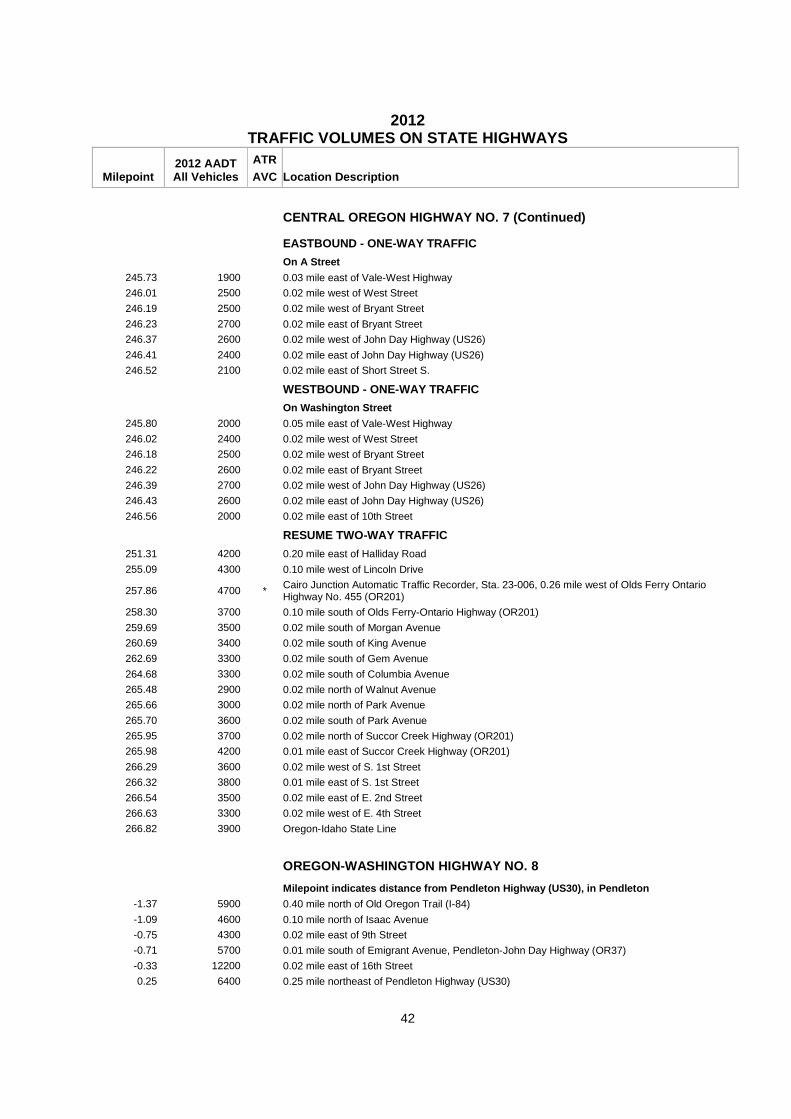
2012
TRAFFIC VOLUMES ON STATE HIGHWAYS
Milepoint 2012 AADT All Vehicles
ATR AVC Location Description
42
CENTRAL OREGON HIGHWAY NO. 7 (Continued)
EASTBOUND - ONE-WAY TRAFFIC
On A Street
245.73 1900 0.03 mile east of Vale-West Highway
246.01 2500 0.02 mile west of West Street
246.19 2500 0.02 mile west of Bryant Street
246.23 2700 0.02 mile east of Bryant Street
246.37 2600 0.02 mile west of John Day Highway (US26)
246.41 2400 0.02 mile east of John Day Highway (US26)
246.52 2100 0.02 mile east of Short Street S.
WESTBOUND - ONE-WAY TRAFFIC
On Washington Street
245.80 2000 0.05 mile east of Vale-West Highway
246.02 2400 0.02 mile west of West Street
246.18 2500 0.02 mile west of Bryant Street
246.22 2600 0.02 mile east of Bryant Street
246.39 2700 0.02 mile west of John Day Highway (US26)
246.43 2600 0.02 mile east of John Day Highway (US26)
246.56 2000 0.02 mile east of 10th Street
RESUME TWO-WAY TRAFFIC
251.31 4200 0.20 mile east of Halliday Road
255.09 4300 0.10 mile west of Lincoln Drive
257.86 4700 * Cairo Junction Automatic Traffic Recorder, Sta. 23-006, 0.26 mile west of Olds Ferry Ontario Highway No. 455 (OR201)
258.30 3700 0.10 mile south of Olds Ferry-Ontario Highway (OR201)
259.69 3500 0.02 mile south of Morgan Avenue
260.69 3400 0.02 mile south of King Avenue
262.69 3300 0.02 mile south of Gem Avenue
264.68 3300 0.02 mile south of Columbia Avenue
265.48 2900 0.02 mile north of Walnut Avenue
265.66 3000 0.02 mile north of Park Avenue
265.70 3600 0.02 mile south of Park Avenue
265.95 3700 0.02 mile north of Succor Creek Highway (OR201)
265.98 4200 0.01 mile east of Succor Creek Highway (OR201)
266.29 3600 0.02 mile west of S. 1st Street
266.32 3800 0.01 mile east of S. 1st Street
266.54 3500 0.02 mile east of E. 2nd Street
266.63 3300 0.02 mile west of E. 4th Street
266.82 3900 Oregon-Idaho State Line
OREGON-WASHINGTON HIGHWAY NO. 8
Milepoint indicates distance from Pendleton Highway (US30), in Pendleton
-1.37 5900 0.40 mile north of Old Oregon Trail (I-84)
-1.09 4600 0.10 mile north of Isaac Avenue
-0.75 4300 0.02 mile east of 9th Street
-0.71 5700 0.01 mile south of Emigrant Avenue, Pendleton-John Day Highway (OR37)
-0.33 12200 0.02 mile east of 16th Street
0.25 6400 0.25 mile northeast of Pendleton Highway (US30)

2012
TRAFFIC VOLUMES ON STATE HIGHWAYS
Milepoint 2012 AADT All Vehicles
ATR AVC Location Description
43
OREGON-WASHINGTON HIGHWAY NO. 8 (Continued)
0.35 4200 0.02 mile northeast of Riverside Drive
0.48 4200 0.02 mile northeast of Lindell Lane
0.77 3400 0.06 mile northeast of Riverside School Road
6.09 4400 0.10 mile southwest of Havana-Helix Highway
6.21 3900 0.02 mile northeast of Havana-Helix Highway
11.56 4300 0.08 mile south of Mann Road
12.14 3800 East city limits of Adams
16.05 3800 0.02 mile west of Pambrun Road
17.27 3200 0.05 mile south of Athena-Holdman Highway
17.37 3600 0.05 mile north of Athena-Holdman Highway
20.23 3900 0.22 mile southwest of Weston-Elgin Highway (OR204)
20.65 4200 0.20 mile northeast of Weston-Elgin Highway (OR204)
21.77 4600 0.02 mile northeast of Steen Road (old highway alignment)
23.47 5300 0.02 mile north of Blue Mt. Station Road
26.59 5800 0.39 mile north of Steen Road
26.90 8300 0.02 mile north of S.E. 14th Avenue
Equation: MP 26.93 BK = MP 29.92 AH
30.60 12800 0.02 mile south of Freewater Highway (Columbia Street)
30.65 10200 0.03 mile north of Freewater Highway (S. Main Street)
31.18 11700 0.02 mile south of N.E. 5th Avenue
31.22 11500 0.02 mile north of N.E. 5th Avenue
31.64 10200 0.28 mile south of Elizabeth Street
32.62 13400 0.02 mile south of Sunnyside-Umapine Highway
32.66 13100 0.02 mile north of Sunnyside-Umapine Highway
34.46 14300 * Milton Automatic Traffic Recorder, Sta. 30-021, 0.86 mile south of Oregon-Washington State Line
35.30 14000 0.02 mile south of State Line Road, Oregon-Washington State Line
OREGON COAST HIGHWAY NO. 9
Milepoint indicates distance from Washington-Oregon State Line
3.79 6900 * Astoria Bridge Automatic Traffic Recorder, Sta. 04-004, 0.01 mile north of Lower Columbia River Highway No. 92 (US30)
On Marine Drive
3.90 23400 0.10 mile southwest of Lower Columbia River Highway (US30)
4.27 24000 0.05 mile northeast of Nehalem Highway (OR202)
4.97 19600 South city limits of Astoria on Youngs Bay Bridge
7.05 12800 0.02 mile northeast of Warrenton-Astoria Highway, (US101 Bus.)
7.30 13800 0.20 mile northeast of Fort Stevens Highway Spur and connection to Warrenton-Astoria Highway (US101 Bus.)
7.63 12900 0.10 mile south of Fort Stevens Highway Spur and connection to Warrenton-Astoria Highway (US101 Bus.)
8.72 11100 South city limits of Warrenton
9.58 13600 0.10 mile south of Fort Stevens Highway
Equation: MP 10.16 BK = MP 12.15 AH
15.90 13200 * Gearhart Automatic Traffic Recorder, Sta. 04-001, 2.09 miles north of Dellmoor Loop Road
18.36 16400 0.10 mile north of Cutler Lane
18.85 17000 0.02 mile south of Pacific Way
19.32 18200 0.02 mile north of Airport Road
19.58 18500 0.10 mile north of Wahanna Road
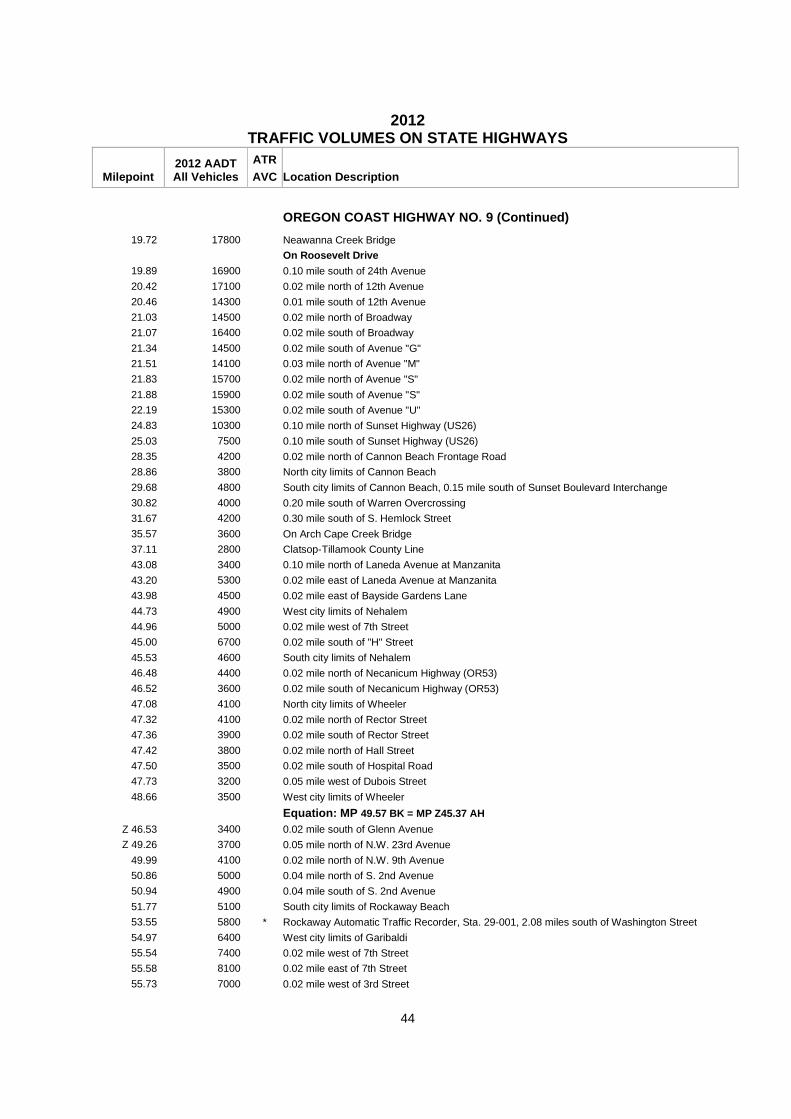
2012
TRAFFIC VOLUMES ON STATE HIGHWAYS
Milepoint 2012 AADT All Vehicles
ATR AVC Location Description
44
OREGON COAST HIGHWAY NO. 9 (Continued)
19.72 17800 Neawanna Creek Bridge
On Roosevelt Drive
19.89 16900 0.10 mile south of 24th Avenue
20.42 17100 0.02 mile north of 12th Avenue
20.46 14300 0.01 mile south of 12th Avenue
21.03 14500 0.02 mile north of Broadway
21.07 16400 0.02 mile south of Broadway
21.34 14500 0.02 mile south of Avenue "G"
21.51 14100 0.03 mile north of Avenue "M"
21.83 15700 0.02 mile north of Avenue "S"
21.88 15900 0.02 mile south of Avenue "S"
22.19 15300 0.02 mile south of Avenue "U"
24.83 10300 0.10 mile north of Sunset Highway (US26)
25.03 7500 0.10 mile south of Sunset Highway (US26)
28.35 4200 0.02 mile north of Cannon Beach Frontage Road
28.86 3800 North city limits of Cannon Beach
29.68 4800 South city limits of Cannon Beach, 0.15 mile south of Sunset Boulevard Interchange
30.82 4000 0.20 mile south of Warren Overcrossing
31.67 4200 0.30 mile south of S. Hemlock Street
35.57 3600 On Arch Cape Creek Bridge
37.11 2800 Clatsop-Tillamook County Line
43.08 3400 0.10 mile north of Laneda Avenue at Manzanita
43.20 5300 0.02 mile east of Laneda Avenue at Manzanita
43.98 4500 0.02 mile east of Bayside Gardens Lane
44.73 4900 West city limits of Nehalem
44.96 5000 0.02 mile west of 7th Street
45.00 6700 0.02 mile south of "H" Street
45.53 4600 South city limits of Nehalem
46.48 4400 0.02 mile north of Necanicum Highway (OR53)
46.52 3600 0.02 mile south of Necanicum Highway (OR53)
47.08 4100 North city limits of Wheeler
47.32 4100 0.02 mile north of Rector Street
47.36 3900 0.02 mile south of Rector Street
47.42 3800 0.02 mile north of Hall Street
47.50 3500 0.02 mile south of Hospital Road
47.73 3200 0.05 mile west of Dubois Street
48.66 3500 West city limits of Wheeler
Equation: MP 49.57 BK = MP Z45.37 AH
Z 46.53 3400 0.02 mile south of Glenn Avenue
Z 49.26 3700 0.05 mile north of N.W. 23rd Avenue
49.99 4100 0.02 mile north of N.W. 9th Avenue
50.86 5000 0.04 mile north of S. 2nd Avenue
50.94 4900 0.04 mile south of S. 2nd Avenue
51.77 5100 South city limits of Rockaway Beach
53.55 5800 * Rockaway Automatic Traffic Recorder, Sta. 29-001, 2.08 miles south of Washington Street
54.97 6400 West city limits of Garibaldi
55.54 7400 0.02 mile west of 7th Street
55.58 8100 0.02 mile east of 7th Street
55.73 7000 0.02 mile west of 3rd Street
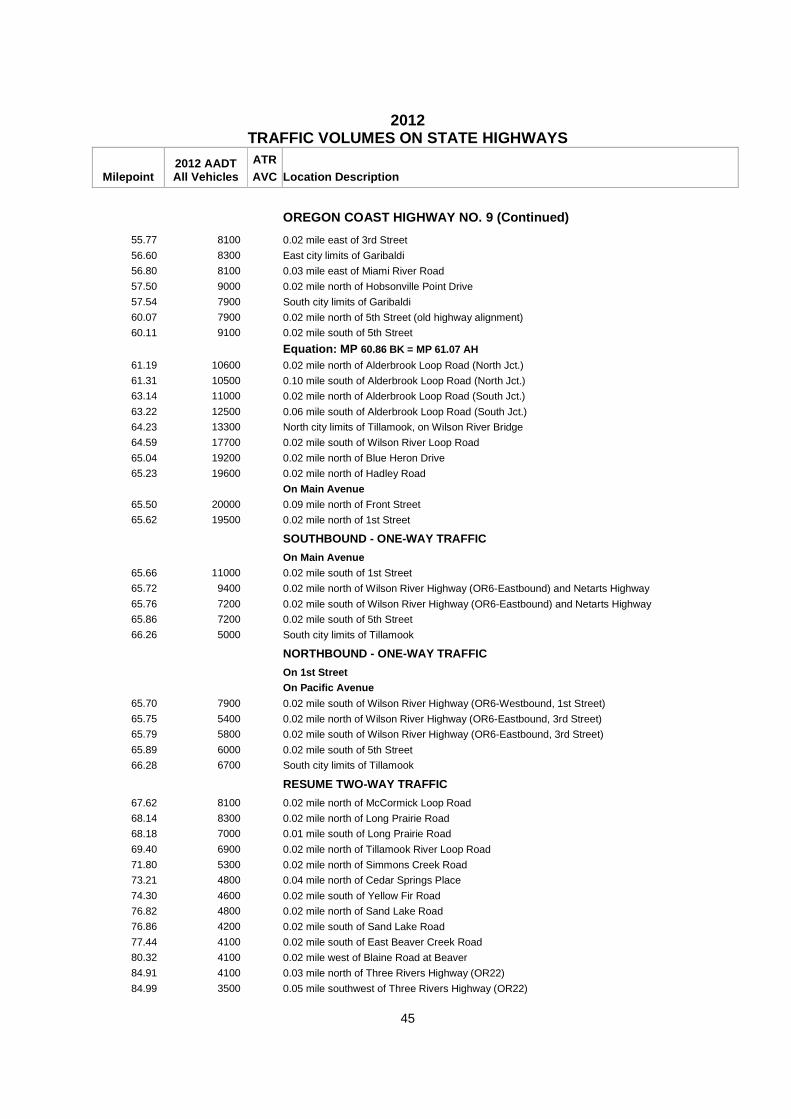
2012
TRAFFIC VOLUMES ON STATE HIGHWAYS
Milepoint 2012 AADT All Vehicles
ATR AVC Location Description
45
OREGON COAST HIGHWAY NO. 9 (Continued)
55.77 8100 0.02 mile east of 3rd Street
56.60 8300 East city limits of Garibaldi
56.80 8100 0.03 mile east of Miami River Road
57.50 9000 0.02 mile north of Hobsonville Point Drive
57.54 7900 South city limits of Garibaldi
60.07 7900 0.02 mile north of 5th Street (old highway alignment)
60.11 9100 0.02 mile south of 5th Street
Equation: MP 60.86 BK = MP 61.07 AH
61.19 10600 0.02 mile north of Alderbrook Loop Road (North Jct.)
61.31 10500 0.10 mile south of Alderbrook Loop Road (North Jct.)
63.14 11000 0.02 mile north of Alderbrook Loop Road (South Jct.)
63.22 12500 0.06 mile south of Alderbrook Loop Road (South Jct.)
64.23 13300 North city limits of Tillamook, on Wilson River Bridge
64.59 17700 0.02 mile south of Wilson River Loop Road
65.04 19200 0.02 mile north of Blue Heron Drive
65.23 19600 0.02 mile north of Hadley Road
On Main Avenue
65.50 20000 0.09 mile north of Front Street
65.62 19500 0.02 mile north of 1st Street
SOUTHBOUND - ONE-WAY TRAFFIC
On Main Avenue
65.66 11000 0.02 mile south of 1st Street
65.72 9400 0.02 mile north of Wilson River Highway (OR6-Eastbound) and Netarts Highway
65.76 7200 0.02 mile south of Wilson River Highway (OR6-Eastbound) and Netarts Highway
65.86 7200 0.02 mile south of 5th Street
66.26 5000 South city limits of Tillamook
NORTHBOUND - ONE-WAY TRAFFIC
On 1st Street On Pacific Avenue
65.70 7900 0.02 mile south of Wilson River Highway (OR6-Westbound, 1st Street)
65.75 5400 0.02 mile north of Wilson River Highway (OR6-Eastbound, 3rd Street)
65.79 5800 0.02 mile south of Wilson River Highway (OR6-Eastbound, 3rd Street)
65.89 6000 0.02 mile south of 5th Street
66.28 6700 South city limits of Tillamook
RESUME TWO-WAY TRAFFIC
67.62 8100 0.02 mile north of McCormick Loop Road
68.14 8300 0.02 mile north of Long Prairie Road
68.18 7000 0.01 mile south of Long Prairie Road
69.40 6900 0.02 mile north of Tillamook River Loop Road
71.80 5300 0.02 mile north of Simmons Creek Road
73.21 4800 0.04 mile north of Cedar Springs Place
74.30 4600 0.02 mile south of Yellow Fir Road
76.82 4800 0.02 mile north of Sand Lake Road
76.86 4200 0.02 mile south of Sand Lake Road
77.44 4100 0.02 mile south of East Beaver Creek Road
80.32 4100 0.02 mile west of Blaine Road at Beaver
84.91 4100 0.03 mile north of Three Rivers Highway (OR22)
84.99 3500 0.05 mile southwest of Three Rivers Highway (OR22)

2012
TRAFFIC VOLUMES ON STATE HIGHWAYS
Milepoint 2012 AADT All Vehicles
ATR AVC Location Description
46
OREGON COAST HIGHWAY NO. 9 (Continued)
89.75 3100 0.02 mile north of Resort Drive
89.89 2600 0.12 mile south of Resort Drive
91.27 3100 0.10 mile north of Little Nestucca Highway
91.47 2800 0.10 mile south of Little Nestucca Highway
93.66 2700 0.02 mile northeast of Winema Road
Equation: MP 96.15 BK = MP 96.76 AH
97.60 2900 0.10 mile north of Summit Road at Neskowin
102.80 2900 Tillamook-Lincoln County Line
104.05 3300 0.11 mile south of Three Rocks Road
105.01 2600 0.20 mile north of Salmon River Highway (OR18)
105.61 13600 0.40 mile south of Salmon River Highway (OR18)
Equation: MP 105.64 BK = MP 110.75 AH
111.32 15000 0.02 mile south of East Devils Lake Road
112.35 15100 * West Devils Lake Automatic Traffic Recorder, Sta. 21-007, At West Devils Lake Road
112.80 19000 0.02 mile south of Logan Road to Roads End
113.16 23000 0.02 mile north of N. 34th Street
113.38 23500 0.02 mile south of Holmes Road
113.95 23900 0.02 mile north of N. 21st Street
113.99 24500 0.02 mile south of N. 21st Street
114.31 19700 0.02 mile north of N. 14th Street
114.54 26400 0.02 mile south of N. 10th Street
114.91 23900 * D River Wayside Automatic Traffic Recorder, Sta. 21-008, 0.07 mile north of "D" River State Wayside
115.33 25600 0.01 mile south of S.W. Galley Street
115.58 23600 0.02 mile south of East Devils Lake Road
116.12 21300 0.02 mile south of S.E. 23rd Drive
117.03 20200 0.02 mile north of High School Drive
117.48 18000 0.02 mile south of S. Coast Avenue
117.98 16900 0.02 mile north of S.E. 51st Street
118.17 16300 On Schooner Creek Bridge
118.70 15000 0.03 mile south of S.W. 63rd Avenue
119.22 14900 0.10 mile south of Drift Creek Road
120.16 11000 On Siletz River Bridge
121.97 10500 0.30 mile north of Tom Robertson Boulevard
122.49 9300 0.06 mile north of Wessler Street
124.38 9400 0.02 mile south of Willow Street at Lincoln Beach
126.45 10300 North city limits of Depoe Bay
127.16 9100 0.30 mile north of Collins Street
128.57 8100 0.39 mile north of S.W. Oceana Street
132.43 7700 0.02 mile north of Otter Rock Highway
136.53 8800 North city limits of Newport, 0.02 mile north of Iron Mountain Beach Road (N.E. 73rd. Street)
137.29 13900 0.03 mile north of N.E. 58th Street
138.48 16900 0.10 mile south of N.W. Ocean View Drive
139.11 17400 * North Newport Automatic Traffic Recorder, Sta. 21-009, At 25th Street, in Newport
139.56 24800 0.02 mile south of N.W. 15th Street
140.07 22800 0.02 mile north of N.E. 6th Street
140.14 23800 0.05 mile south of N.E. 6th Street
140.26 23800 0.01 mile south of N.E. 3rd Street
140.34 22400 0.02 mile north of Corvallis-Newport Highway (US20)

2012
TRAFFIC VOLUMES ON STATE HIGHWAYS
Milepoint 2012 AADT All Vehicles
ATR AVC Location Description
47
OREGON COAST HIGHWAY NO. 9 (Continued)
140.40 19600 0.04 mile south of Corvallis-Newport Highway (US20)
140.54 18000 0.02 mile southwest of Angle Street
140.64 18100 0.02 mile northeast of Hurbert Street
140.68 17800 0.02 mile southwest of Hurbert Street
140.91 18800 0.02 mile north of Abbey Street
140.95 17700 0.02 mile south of Abbey Street
141.37 17300 0.02 mile south of S.W. Waterline Drive
142.16 14500 0.05 mile south of S.E. Pacific Way
142.28 13200 0.06 mile north of Ferry Slip Road
142.45 12600 0.05 mile south of Ferry Slip Road
144.40 9800 0.10 mile south of Airport Road
145.74 9100 0.10 mile south of S.E. 98th Street
146.46 9300 South city limits of Newport, 0.04 mile north of S.E. 116th Street
148.98 9600 0.02 mile south of Beaver Creek Road
154.05 9400 0.02 mile south of Legion Road
155.07 9900 0.02 mile south of Bayview Road
155.92 9500 0.02 mile south of Alsea Highway (OR34)
156.36 8100 South city limits of Waldport
157.24 6900 On Patterson Creek Bridge
158.99 6100 0.02 mile south of Wakonda Beach Road
162.24 5200 On Vingie Creek Bridge
163.41 5500 North city limits of Yachats
164.10 5500 0.02 mile north of 7th Street
164.45 4500 0.01 mile northwest of Yachats River Road
164.48 4300 0.02 mile southeast of Yachats River Road
165.48 3500 South city limits of Yachats
167.61 2900 Lincoln-Lane County Line
171.40 3100 0.02 mile south of Tenmile Creek Road
174.40 3100 On Rock Creek Bridge
178.36 3400 0.20 mile south of entrance to Devils Elbow State Park
184.78 4500 On Sutton Creek Bridge
186.46 6100 * Florence Automatic Traffic Recorder, Sta. 20-026, 0.77 mile north of Heceta Beach Road
187.58 8700 0.18 mile north of Munsel Lake Road
187.79 9400 0.03 mile south of Munsel Lake Road
188.64 13300 0.02 mile south of 36th Street
189.05 14900 0.02 mile south of 29th Street
189.46 16400 0.02 mile south of 22nd Street
189.75 17100 0.02 mile south of 17th Street
189.99 17100 0.02 mile south of 13th Street
190.14 16500 0.02 mile north of connection to Florence-Eugene Highway (OR126/10th Street)
190.25 15600 0.01 mile south of Florence-Eugene Highway (OR126/9th Street)
190.51 14100 0.02 mile north of Rhododendron Drive
190.55 13700 0.02 mile south of Rhododendron Drive
190.65 11200 0.02 mile south of Maple Street
190.74 11200 0.02 mile south of 2nd Street
190.98 10800 South city limits of Florence
191.37 9900 0.02 mile south of Glenada Road
193.45 8200 0.02 mile north of entrance to Honeyman State Park and Cleawox Lake
193.51 6200 0.04 mile south of entrance to Honeyman State Park and Cleawox Lake

2012
TRAFFIC VOLUMES ON STATE HIGHWAYS
Milepoint 2012 AADT All Vehicles
ATR AVC Location Description
48
OREGON COAST HIGHWAY NO. 9 (Continued)
196.00 4900 0.02 mile south of Clear Lake Road
196.73 4700 0.02 mile south of Pacific Avenue
198.58 4000 Lane-Douglas County Line
202.72 4600 On Tahkenitch Creek Bridge
209.06 4700 0.10 mile north of Old Highway 101
209.48 4900 0.02 mile north of Spring Street
209.51 5000 0.01 mile south of Spring Street
209.66 5200 0.02 mile south of Pitt Street
211.11 5800 North city limits of Reedsport
211.65 9500 0.07 mile south of Umpqua Highway (OR38)
212.02 10600 0.03 mile northeast of Winchester Avenue
212.08 12800 0.03 mile southwest of Winchester Avenue
212.51 12700 0.02 mile northeast of 20th Street
212.76 10100 0.03 mile west of Bowman Drive
213.40 9300 West city limits of Reedsport
215.17 9800 0.60 mile northeast of 8th Street at Winchester Bay
215.94 7900 0.02 mile southwest of Broadway Avenue
216.81 7700 0.10 mile south of Umpqua Lighthouse Road
220.58 8000 Douglas-Coos County Line
221.67 7200 * Lakeside Automatic Traffic Recorder, Sta. 06-001, 1.09 miles south of Douglas-Coos County Line
222.71 7600 0.02 mile north of Airport Way
222.75 8700 0.02 mile south of Airport Way
228.78 8800 0.10 mile north of Wildwood Road
229.25 10600 0.02 mile north of Hauser Depot Road
229.29 10700 0.02 mile south of Hauser Depot Road
233.09 12600 On Haynes Inlet Bridge
233.22 13500 0.02 mile south of North Bay Drive
234.03 15300 North city limits of North Bend
235.02 16100 0.02 mile north of Florida Avenue
235.06 14400 0.02 mile south of Florida Avenue
SOUTHBOUND - ONE-WAY TRAFFIC
On Sherman Avenue 235.29 7800 0.02 mile north of California Avenue
235.39 9600 0.02 mile north of Cape Arago Highway (Virginia Avenue)
235.43 9500 0.02 mile south of Cape Arago Highway (Virginia Avenue)
NORTHBOUND - ONE-WAY TRAFFIC
On Sheridan Avenue
235.31 7300 0.02 mile north of California Avenue
235.40 6300 0.02 mile north of Cape Arago Highway (Virginia Avenue)
235.44 9200 0.02 mile south of Cape Arago Highway (Virginia Avenue)
RESUME TWO-WAY TRAFFIC
235.60 13600 0.01 mile south of Sheridan Avenue
236.77 20100 South city limits of North Bend, north city limits of Coos Bay
On Bayshore Drive
237.58 21800 0.02 mile north of Hemlock Avenue
SOUTHBOUND - ONE-WAY TRAFFIC
On Broadway
237.79 12000 0.02 mile south of Fir Avenue
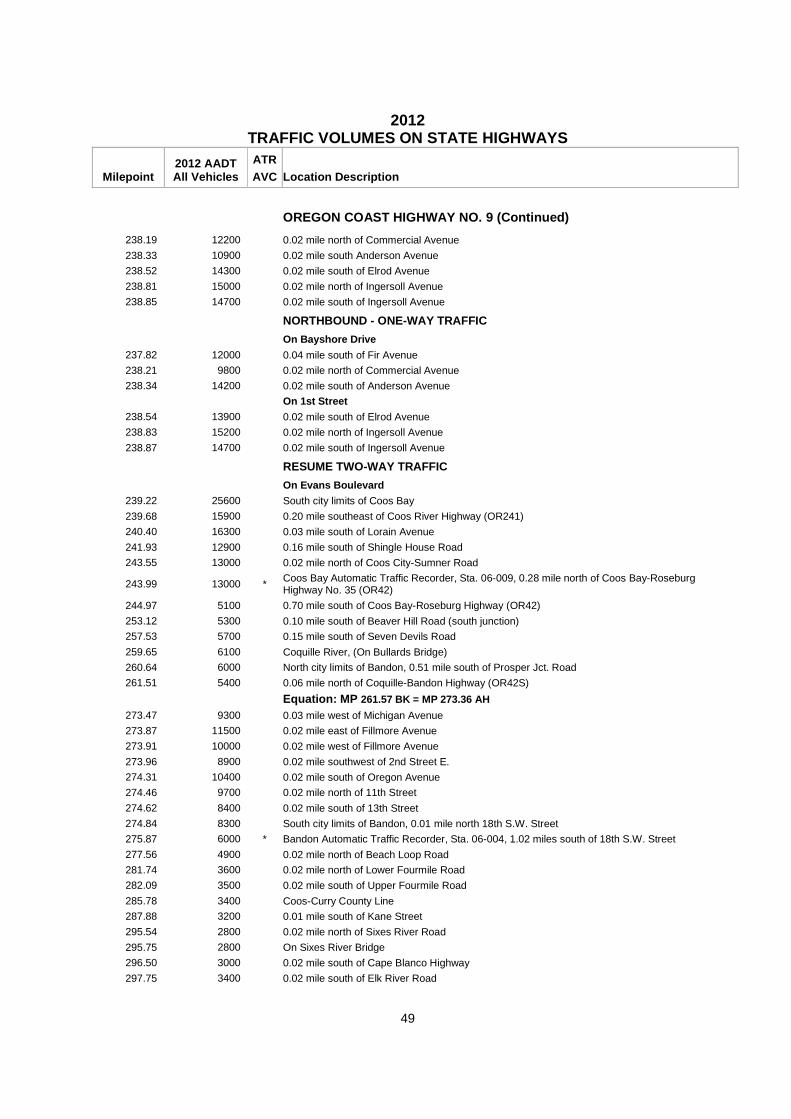
2012
TRAFFIC VOLUMES ON STATE HIGHWAYS
Milepoint 2012 AADT All Vehicles
ATR AVC Location Description
49
OREGON COAST HIGHWAY NO. 9 (Continued)
238.19 12200 0.02 mile north of Commercial Avenue
238.33 10900 0.02 mile south Anderson Avenue
238.52 14300 0.02 mile south of Elrod Avenue
238.81 15000 0.02 mile north of Ingersoll Avenue
238.85 14700 0.02 mile south of Ingersoll Avenue
NORTHBOUND - ONE-WAY TRAFFIC
On Bayshore Drive
237.82 12000 0.04 mile south of Fir Avenue
238.21 9800 0.02 mile north of Commercial Avenue
238.34 14200 0.02 mile south of Anderson Avenue
On 1st Street
238.54 13900 0.02 mile south of Elrod Avenue
238.83 15200 0.02 mile north of Ingersoll Avenue
238.87 14700 0.02 mile south of Ingersoll Avenue
RESUME TWO-WAY TRAFFIC
On Evans Boulevard
239.22 25600 South city limits of Coos Bay
239.68 15900 0.20 mile southeast of Coos River Highway (OR241)
240.40 16300 0.03 mile south of Lorain Avenue
241.93 12900 0.16 mile south of Shingle House Road
243.55 13000 0.02 mile north of Coos City-Sumner Road
243.99 13000 * Coos Bay Automatic Traffic Recorder, Sta. 06-009, 0.28 mile north of Coos Bay-Roseburg Highway No. 35 (OR42)
244.97 5100 0.70 mile south of Coos Bay-Roseburg Highway (OR42)
253.12 5300 0.10 mile south of Beaver Hill Road (south junction)
257.53 5700 0.15 mile south of Seven Devils Road
259.65 6100 Coquille River, (On Bullards Bridge)
260.64 6000 North city limits of Bandon, 0.51 mile south of Prosper Jct. Road
261.51 5400 0.06 mile north of Coquille-Bandon Highway (OR42S)
Equation: MP 261.57 BK = MP 273.36 AH
273.47 9300 0.03 mile west of Michigan Avenue
273.87 11500 0.02 mile east of Fillmore Avenue
273.91 10000 0.02 mile west of Fillmore Avenue
273.96 8900 0.02 mile southwest of 2nd Street E.
274.31 10400 0.02 mile south of Oregon Avenue
274.46 9700 0.02 mile north of 11th Street
274.62 8400 0.02 mile south of 13th Street
274.84 8300 South city limits of Bandon, 0.01 mile north 18th S.W. Street
275.87 6000 * Bandon Automatic Traffic Recorder, Sta. 06-004, 1.02 miles south of 18th S.W. Street
277.56 4900 0.02 mile north of Beach Loop Road
281.74 3600 0.02 mile north of Lower Fourmile Road
282.09 3500 0.02 mile south of Upper Fourmile Road
285.78 3400 Coos-Curry County Line
287.88 3200 0.01 mile south of Kane Street
295.54 2800 0.02 mile north of Sixes River Road
295.75 2800 On Sixes River Bridge
296.50 3000 0.02 mile south of Cape Blanco Highway
297.75 3400 0.02 mile south of Elk River Road

2012
TRAFFIC VOLUMES ON STATE HIGHWAYS
Milepoint 2012 AADT All Vehicles
ATR AVC Location Description
50
OREGON COAST HIGHWAY NO. 9 (Continued)
299.83 3600 North city limits of Port Orford, 0.01 mile south of Paradise Point Road
300.48 4400 0.02 mile south of 19th Street
300.76 4500 0.02 mile north of 13th Street
300.97 4300 0.02 mile north of Port Orford Highway
301.00 3800 0.01 mile south of Port Orford Highway
301.22 3100 0.01 mile west of Jackson Street
301.25 3100 0.02 mile east of Jackson Street
301.32 2900 0.02 mile west of Jefferson Street
301.45 2500 * Port Orford Automatic Traffic Recorder, Sta. 08-009, 0.11 mile southeast of Jefferson Street (Battle Rock Wayside)
307.73 2400 0.03 mile north of Humbug Mountain State Park Picnic Area
307.78 2400 0.02 mile south of entrance to Humbug Mountain State Park Picnic Area
316.94 2200 0.01 mile north of Euchre Creek Road
316.98 2200 0.02 mile south of Euchre Creek Road
320.70 2400 0.25 mile north of Nesika Beach Connection
321.20 2600 0.25 mile south of Nesika Beach Connection
322.22 3000 0.10 mile south of Nesika Beach Road
327.39 3000 0.10 mile north of Wedderburn Junction
327.85 6100 North city limits of Gold Beach
327.92 7100 0.02 mile south of Jerrys Flat Road
328.50 8100 0.02 mile south of Moore Street
328.62 8100 0.02 mile south of Caughell Street
328.75 9500 0.01 mile south of 1st Street
328.90 9600 0.02 mile south of 4th Street
329.21 8100 0.02 mile south of 8th Street
329.93 5600 0.29 mile south of Kerber Street
330.34 4600 0.05 mile south of Hunter Creek Loop
331.12 3500 0.05 mile south of Hunter Creek Road
334.77 2900 0.10 mile north of Cape View Loop Road (Carpenterville Highway)
336.94 3100 0.08 mile north of Meyers Creek Road
339.10 3000 On Pistol River Bridge
341.31 3000 0.30 mile north of Byrdies Road
347.78 3000 On Thomas Creek Bridge
354.73 4800 0.10 mile north of Dawson Road
355.38 8200 North city limits of Brookings, 0.02 mile south of Harris Heights Road
356.13 10000 0.02 mile south of Ransom Avenue
356.51 12200 0.02 mile northwest of Arnold Lane
357.06 16300 0.02 mile west of Pacific Avenue
357.10 15500 0.02 mile east of Pacific Avenue
357.35 15400 0.02 mile east of Fern Avenue
357.59 18600 0.01 mile east of Alder Street
357.98 20200 South city limits of Brookings on Chetco River Bridge
358.15 16700 0.02 mile southeast of South Bank Chetco River Road
358.70 14700 0.06 mile north of Hoffeldt Lane
358.82 13800 0.06 mile south of Hoffeldt Lane
359.37 12100 0.05 mile south of Benham Lane
359.58 9900 0.02 mile south of Pedrioli Road
362.00 8400 * Winchuck Automatic Vehicle Classifier, Sta. 08-005, 1.11 miles north of Oregon-California State Line
362.61 7700 At Winchuck River Bridge

2012
TRAFFIC VOLUMES ON STATE HIGHWAYS
Milepoint 2012 AADT All Vehicles
ATR AVC Location Description
51
OREGON COAST HIGHWAY NO. 9 (Continued)
363.11 7300 Oregon-California State Line
WALLOWA LAKE HIGHWAY NO. 10
Milepoint indicates distance from La Grande-Baker Highway (US30), in La Grande
0.20 13800 0.02 mile southwest of Monroe Avenue
0.30 15500 0.06 mile northeast of N. Pine Street
0.74 16700 0.15 mile southwest of Old Oregon Trail (I-84)
1.04 17200 0.15 mile northeast of Old Oregon Trail (I-84)
1.18 15500 0.02 mile northeast of Riddle Road
1.74 11000 * Island City Automatic Traffic Recorder, Sta. 31-003, 0.82 mile east of Old Oregon Trail Highway No. 6 (I-84)
2.39 8700 0.02 mile west of Cove Highway (OR237)
2.43 7800 0.02 mile north of Cove Highway (OR237)
North city limits of Island City
2.71 5100 0.02 mile east of Hunter Lane
8.35 3900 0.02 mile south of Stanley Lane at Alicel
10.93 4700 0.02 mile south of Woodell Lane
South city limits of Imbler
12.36 3700 0.02 mile north of 6th Street
12.52 3300 0.02 mile north of Striker Lane, north city limits of Imbler
19.48 3700 South city limits of Elgin, 0.14 mile south of Hemlock Street
Equation: MP 19.73 BK = MP 19.96 AH
20.23 3100 0.02 mile south of Weston-Elgin Highway (OR204)
20.27 2500 0.02 mile north of Weston-Elgin Highway (OR204)
20.32 2000 0.02 mile east of 8th Avenue
20.41 2000 0.02 mile east of N. 6th Avenue
20.70 1800 * Elgin Automatic Traffic Recorder, Sta. 31-005, 0.45 mile northeast of Weston-Elgin Highway No. 330 (OR204)
24.59 1300 0.02 mile west of Good Road
28.38 1300 0.10 mile west of Merritt Lane
Union-Wallowa County Line, MP 33.00
Equation: MP 41.73 BK = MP 42.09 AH
46.47 1400 0.02 mile southeast of 7th Street
46.83 1500 0.05 mile south of 2nd Street
47.46 1900 0.15 mile southeast of Ellen Street
47.67 1800 South city limits of Wallowa, 0.09 mile south of Winema Street
54.11 1900 On Lostine River Bridge
North city limits of Lostine
54.93 2000 0.04 mile south of Wallowa Street
East city limits of Lostine
63.99 2600 0.04 mile south of Tejaka Lane
64.94 4900 0.02 mile west of W. 2nd Street
65.00 5000 0.02 mile west of Enterprise-Lewiston Highway (OR3)
65.07 4800 0.05 mile east of Enterprise-Lewiston Highway (OR3)
65.19 5500 0.02 mile north of Greenwood Street
65.23 5700 0.02 mile south of Greenwood Street
65.33 5400 0.04 mile north of Hogan Street (Litch Street)
65.81 3400 0.06 mile west of S.E. Florence Street
East city limits of Enterprise

2012
TRAFFIC VOLUMES ON STATE HIGHWAYS
Milepoint 2012 AADT All Vehicles
ATR AVC Location Description
52
WALLOWA LAKE HIGHWAY NO. 10 (Continued)
68.45 3100 0.02 mile west of Crow Creek Road (Eggleson Lane)
North city limits of Joseph
71.40 3400 0.02 mile north of Little Sheep Creek Highway
ENTERPRISE-LEWISTON HIGHWAY NO. 11
Milepoint indicates distance from Washington-Orego n State Line
0.00 300 Washington-Oregon State Line
28.49 290 0.02 mile south of Charolais Road (Wellamotkin Drive USFS Road #46)
36.85 330 0.02 mile north of Dunham Loop
42.67 780 North city limits of Enterprise, 0.16 mile north of N.W. Flora Street
42.92 1800 0.02 mile north of N.W. Silver Street
43.17 2600 0.02 mile north of Wallowa Lake Highway (OR82)
BAKER-COPPERFIELD HIGHWAY NO. 12
Milepoint indicates distance from La Grande-Baker Highway (US30), in Baker City
On Main Street
0.02 5200 0.02 mile north of La Grande-Baker Highway (US30)
0.22 5100 0.02 mile south of Campbell Street
On Campbell Street
0.25 7500 0.01 mile east of Main Street
0.59 7000 0.02 mile west of Cedar Street
0.62 7900 0.01 mile east of Cedar Street
1.09 5400 0.10 mile west of Old Oregon Trail (I-84)
2.75 1200 0.01 mile east of West Airport Road
Equation: MP 2.77 BK = MP Z2.52 AH
7.44 940 0.02 mile west of Ruckles Creek Road
10.00 750 0.02 mile west of Keating Cutoff Road
14.31 640 0.02 mile west of Ruckles Creek Road
23.22 540 0.05 mile east of Sparta Road
Equation: MP 31.73 BK = MP 32.01 AH
37.55 560 * Richland Automatic Traffic Recorder, Sta. 01-010, 2.21 miles northwest of Dry Gulch Road
39.89 650 0.02 mile east of Foothill Road
41.04 670 0.02 mile south of New Bridge Road connection
West city limits of Richland
Equation: MP 41.37 BK = MP 42.00 AH
42.06 1100 0.02 mile west of 2nd Street
42.27 920 East City Limits of Richland, 0.12 Mile east of 1st Street
42.92 790 0.10 mile west of Robinette Road (Hewitt Park)
43.12 590 0.10 mile northeast of Robinette Road (Hewitt Park)
53.53 600 0.02 mile south of Pine Town Road, Baker - Copperfield Spur
53.60 210 0.05 mile north of Pine Town Road, Baker - Copperfield Spur
54.41 610 0.02 mile east of Pine Creek Highway
63.48 330 0.02 mile west of North Pine Creek Road
70.38 380 0.10 mile south of road to Oxbow & Brownlee Dam
70.52 520 0.04 mile south of road to Homestead
70.80 250 Oregon-Idaho State Line
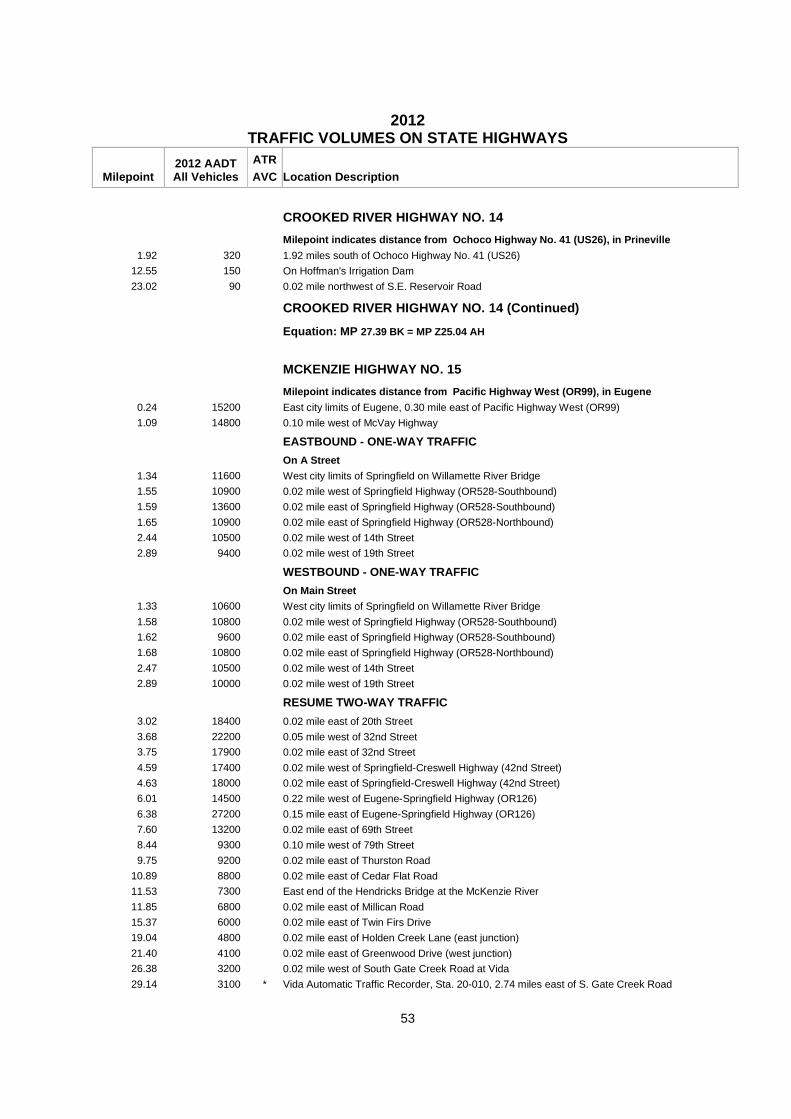
2012
TRAFFIC VOLUMES ON STATE HIGHWAYS
Milepoint 2012 AADT All Vehicles
ATR AVC Location Description
53
CROOKED RIVER HIGHWAY NO. 14
Milepoint indicates distance from Ochoco Highway N o. 41 (US26), in Prineville
1.92 320 1.92 miles south of Ochoco Highway No. 41 (US26)
12.55 150 On Hoffman's Irrigation Dam
23.02 90 0.02 mile northwest of S.E. Reservoir Road
CROOKED RIVER HIGHWAY NO. 14 (Continued)
Equation: MP 27.39 BK = MP Z25.04 AH
MCKENZIE HIGHWAY NO. 15
Milepoint indicates distance from Pacific Highway West (OR99), in Eugene
0.24 15200 East city limits of Eugene, 0.30 mile east of Pacific Highway West (OR99)
1.09 14800 0.10 mile west of McVay Highway
EASTBOUND - ONE-WAY TRAFFIC
On A Street
1.34 11600 West city limits of Springfield on Willamette River Bridge
1.55 10900 0.02 mile west of Springfield Highway (OR528-Southbound)
1.59 13600 0.02 mile east of Springfield Highway (OR528-Southbound)
1.65 10900 0.02 mile east of Springfield Highway (OR528-Northbound)
2.44 10500 0.02 mile west of 14th Street
2.89 9400 0.02 mile west of 19th Street
WESTBOUND - ONE-WAY TRAFFIC
On Main Street
1.33 10600 West city limits of Springfield on Willamette River Bridge
1.58 10800 0.02 mile west of Springfield Highway (OR528-Southbound)
1.62 9600 0.02 mile east of Springfield Highway (OR528-Southbound)
1.68 10800 0.02 mile east of Springfield Highway (OR528-Northbound)
2.47 10500 0.02 mile west of 14th Street
2.89 10000 0.02 mile west of 19th Street
RESUME TWO-WAY TRAFFIC
3.02 18400 0.02 mile east of 20th Street
3.68 22200 0.05 mile west of 32nd Street
3.75 17900 0.02 mile east of 32nd Street
4.59 17400 0.02 mile west of Springfield-Creswell Highway (42nd Street)
4.63 18000 0.02 mile east of Springfield-Creswell Highway (42nd Street)
6.01 14500 0.22 mile west of Eugene-Springfield Highway (OR126)
6.38 27200 0.15 mile east of Eugene-Springfield Highway (OR126)
7.60 13200 0.02 mile east of 69th Street
8.44 9300 0.10 mile west of 79th Street
9.75 9200 0.02 mile east of Thurston Road
10.89 8800 0.02 mile east of Cedar Flat Road
11.53 7300 East end of the Hendricks Bridge at the McKenzie River
11.85 6800 0.02 mile east of Millican Road
15.37 6000 0.02 mile east of Twin Firs Drive
19.04 4800 0.02 mile east of Holden Creek Lane (east junction)
21.40 4100 0.02 mile east of Greenwood Drive (west junction)
26.38 3200 0.02 mile west of South Gate Creek Road at Vida
29.14 3100 * Vida Automatic Traffic Recorder, Sta. 20-010, 2.74 miles east of S. Gate Creek Road

2012
TRAFFIC VOLUMES ON STATE HIGHWAYS
Milepoint 2012 AADT All Vehicles
ATR AVC Location Description
54
MCKENZIE HIGHWAY NO. 15 (Continued)
36.00 2700 0.90 mile east of Nimrod
45.37 2300 0.02 mile west of Cougar Reservoir Road
49.80 2000 0.02 mile east of road to McKenzie Bridge Campground
54.12 1600 0.02 mile west of Paradise Forest Camp Road
54.24 1500 0.10 mile east of Paradise Forest Camp Road
54.92 1500 0.05 mile west of Clear Lake-Belknap Springs Highway (OR126)
Equation: MP 54.97 BK = MP 55.46 AH
61.91 300 At the McKenzie Highway west snow gate (OR242)
Linn - Deschutes County Line, MP 77.14
89.40 280 On Trout Creek Bridge, 2.83 miles west of Sisters
91.29 1400 0.02 mile east of Edgington Road
Equation: MP 92.05 BK = MP Z91.85 AH
Z 91.96 1400 0.07 mile west of Santiam Highway (US20)
92.07 10200 0.05 mile east of Hood Street
92.52 10700 0.01 mile east of Elm Street
92.85 12600 0.02 mile east of Locust Street
93.09 4900 0.02 mile east of McKenzie-Bend Highway (US20)
97.48 4200 0.02 mile east of Goodrich Road
107.23 5300 0.20 mile west of Cline Falls Highway
107.53 7900 0.10 mile east of Cline Falls Highway
108.27 8100 * Cline Falls Automatic Traffic Recorder, Sta. 09-021, 1.38 miles west of S.W. Helmholtz Way (S.W. 43rd Street)
On S.W. Highland Avenue 110.13 9000 0.02 mile west of S.W. 35th Street
110.92 12600 0.02 mile east of S.W. 23rd Street
111.39 16500 0.02 mile west of S.W. 15th Street
EASTBOUND - ONE-WAY TRAFFIC
On S.W. Highland Avenue 111.61 8300 0.02 mile west of S.W. 11th Street
111.72 5200 0.02 mile west of S.W. 9th Street
111.76 6200 0.02 mile east of S.W. 9th Street
WESTBOUND - ONE-WAY TRAFFIC
On Glacier Avenue
111.57 7600 0.02 mile west of S.W. 13th Street
111.67 8400 0.02 mile east of S.W. 11th Street
111.77 5200 0.02 mile east of S.W. 9th Street
SANTIAM HIGHWAY NO. 16
Milepoint indicates distance from Albany-Junction City Highway (OR99E)
0.06 15500 0.09 mile west of Burkhart Street S.E.
0.47 19700 0.02 mile west of Waverly Drive
0.79 18200 0.08 mile west of southbound Pacific Highway (I-5) ramps
1.37 14000 0.07 mile east of northbound Pacific Highway (I-5) ramps
2.63 7700 0.02 mile east of Scravel Hill Road
6.40 8300 0.15 mile west of Albany-Lyons Highway (OR226)
6.65 6500 0.10 mile southeast of Albany-Lyons Highway (OR226)
8.58 5600 0.05 mile south of Bohlken Drive
10.92 7000 0.02 mile south of KGAL Drive

2012
TRAFFIC VOLUMES ON STATE HIGHWAYS
Milepoint 2012 AADT All Vehicles
ATR AVC Location Description
55
SANTIAM HIGHWAY NO. 16 (Continued)
12.27 7700 0.02 mile south of Reeves Parkway
On Main Street
12.85 8700 0.05 mile south of Corvallis-Lebanon Highway (OR34-Morton Street)
SOUTHBOUND - ONE-WAY TRAFFIC
On Main Street
12.98 5400 0.05 mile south of Carolina Street
13.16 6300 0.02 mile south of Vine Street
13.30 6600 0.02 mile north of E. Grant Street
13.35 7400 0.02 mile south of W. Grant Street
13.47 8400 0.02 mile south of Oak Street
NORTHBOUND - ONE-WAY TRAFFIC
On Carolina Street 12.98 4900 0.05 mile east of Main Street
On Park Street
13.23 6100 0.02 mile south of E. Vine Street
13.37 6100 0.02 mile north of E. Grant Street
13.41 7000 0.02 mile south of E. Grant Street
13.54 7700 0.02 mile south of E. Oak Street
RESUME TWO-WAY TRAFFIC
13.64 17000 0.05 mile south of Elmore Street
14.06 20200 Lebanon Ditch, 0.06 mile north of Airport Road
14.45 19800 0.07 mile southeast of S. Main Road
14.85 19300 0.04 mile southeast of Market Drive
15.64 13000 0.23 mile northwest of Crowfoot Road
16.04 12900 0.02 mile southeast of Weirich Road
19.05 11100 * Waterloo Automatic Traffic Recorder, Sta. 22-013, 0.38 mile southeast of Sodaville-Waterloo Drive, southeast of Lebanon
22.84 9000 0.02 mile south of Fairview Road
26.60 9500 West city limits of Sweet Home, 0.07 mile north of Osage Street
26.79 11000 0.08 mile east of 1st Avenue
27.10 12200 0.03 mile east of Halsey-Sweet Home Highway (OR228-Holley Road)
27.44 10200 0.02 mile east of 13th Avenue
27.74 10100 0.02 mile east of 18th Avenue
28.07 8900 0.02 mile west of 23rd Avenue
28.61 7400 0.02 mile east of Clark Mill Road
29.82 5700 0.02 mile west of 47th Avenue
30.27 5400 0.02 mile west of Wiley Creek Drive
30.31 3800 0.02 mile east of Wiley Creek Drive
31.33 3100 0.15 mile east of Riggs Hill Road
33.00 2100 0.02 mile east of Quartzville Road
35.08 1900 2.10 miles east of Quartzville Drive
43.16 1100 0.02 mile east of Canyon Creek Road
51.47 1100 * Upper Soda Automatic Traffic Recorder, Sta. 22-017, 0.91 mile west of Soda Fork Road
71.42 1100 0.10 mile west of Clear Lake-Belknap Springs Highway (OR126)
71.72 2800 0.20 mile east of Clear Lake-Belknap Springs Highway (OR126)
74.50 2800 0.40 mile west of North Santiam Highway (OR22)
75.05 5400 0.15 mile east of North Santiam Highway (OR22)
Linn - Jefferson County Line, MP 80.77
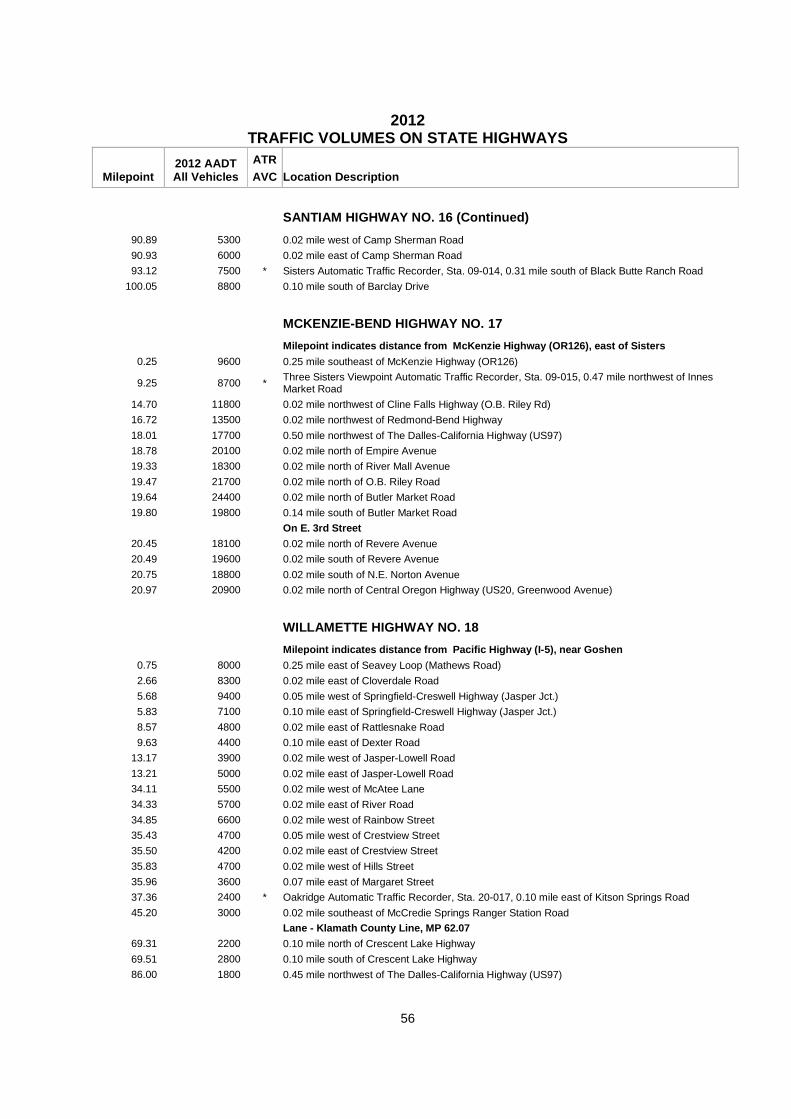
2012
TRAFFIC VOLUMES ON STATE HIGHWAYS
Milepoint 2012 AADT All Vehicles
ATR AVC Location Description
56
SANTIAM HIGHWAY NO. 16 (Continued)
90.89 5300 0.02 mile west of Camp Sherman Road
90.93 6000 0.02 mile east of Camp Sherman Road
93.12 7500 * Sisters Automatic Traffic Recorder, Sta. 09-014, 0.31 mile south of Black Butte Ranch Road
100.05 8800 0.10 mile south of Barclay Drive
MCKENZIE-BEND HIGHWAY NO. 17
Milepoint indicates distance from McKenzie Highway (OR126), east of Sisters
0.25 9600 0.25 mile southeast of McKenzie Highway (OR126)
9.25 8700 * Three Sisters Viewpoint Automatic Traffic Recorder, Sta. 09-015, 0.47 mile northwest of Innes Market Road
14.70 11800 0.02 mile northwest of Cline Falls Highway (O.B. Riley Rd)
16.72 13500 0.02 mile northwest of Redmond-Bend Highway
18.01 17700 0.50 mile northwest of The Dalles-California Highway (US97)
18.78 20100 0.02 mile north of Empire Avenue
19.33 18300 0.02 mile north of River Mall Avenue
19.47 21700 0.02 mile north of O.B. Riley Road
19.64 24400 0.02 mile north of Butler Market Road
19.80 19800 0.14 mile south of Butler Market Road
On E. 3rd Street
20.45 18100 0.02 mile north of Revere Avenue
20.49 19600 0.02 mile south of Revere Avenue
20.75 18800 0.02 mile south of N.E. Norton Avenue
20.97 20900 0.02 mile north of Central Oregon Highway (US20, Greenwood Avenue)
WILLAMETTE HIGHWAY NO. 18
Milepoint indicates distance from Pacific Highway (I-5), near Goshen
0.75 8000 0.25 mile east of Seavey Loop (Mathews Road)
2.66 8300 0.02 mile east of Cloverdale Road
5.68 9400 0.05 mile west of Springfield-Creswell Highway (Jasper Jct.)
5.83 7100 0.10 mile east of Springfield-Creswell Highway (Jasper Jct.)
8.57 4800 0.02 mile east of Rattlesnake Road
9.63 4400 0.10 mile east of Dexter Road
13.17 3900 0.02 mile west of Jasper-Lowell Road
13.21 5000 0.02 mile east of Jasper-Lowell Road
34.11 5500 0.02 mile west of McAtee Lane
34.33 5700 0.02 mile east of River Road
34.85 6600 0.02 mile west of Rainbow Street
35.43 4700 0.05 mile west of Crestview Street
35.50 4200 0.02 mile east of Crestview Street
35.83 4700 0.02 mile west of Hills Street
35.96 3600 0.07 mile east of Margaret Street
37.36 2400 * Oakridge Automatic Traffic Recorder, Sta. 20-017, 0.10 mile east of Kitson Springs Road
45.20 3000 0.02 mile southeast of McCredie Springs Ranger Station Road
Lane - Klamath County Line, MP 62.07
69.31 2200 0.10 mile north of Crescent Lake Highway
69.51 2800 0.10 mile south of Crescent Lake Highway
86.00 1800 0.45 mile northwest of The Dalles-California Highway (US97)

2012
TRAFFIC VOLUMES ON STATE HIGHWAYS
Milepoint 2012 AADT All Vehicles
ATR AVC Location Description
57
FREMONT HIGHWAY NO. 19
Milepoint indicates distance from The Dalles - Cal ifornia Highway (US97), south of LaPine
0.20 1500 0.20 mile east of The Dalles-California Highway (US97)
Deschutes - Klamath County Line, MP 2.31
18.21 810 Klamath-Lake County Line, 0.59 mile south of Mowich Spring Road (NF-2516)
49.60 660 * Silver Lake Automatic Vehicle Classifier, Sta. 19-010, 2.25 miles southeast of 1st Street
62.95 500 Picture Rock Pass Summit
North city limits of Paisley
97.60 430 0.02 mile north of Red House Lane
98.34 690 0.02 mile north of Mill Street
98.38 810 0.02 mile south of Mill Street
98.89 550 East city limits of Paisley, 0.11 mile south of Murphy Lane
120.37 550 0.20 mile north of Lakeview-Burns Highway (US395)
120.83 710 * Valley Falls Automatic Vehicle Classifier, Sta. 19-004, 0.26 mile south of Lakeview-Burns Highway No. 49 (US395)
138.29 750 0.05 mile north of Warner Highway (OR140)
138.39 1100 0.05 mile south of Warner Highway (OR140)
140.71 1300 0.02 mile north of Goldmohr Terrace Road (Sunnyslope Lane)
142.63 1600 0.02 mile north of N. 9th Street
142.88 1800 0.02 mile north of N. 6th Street
143.01 2500 0.02 mile north of Klamath Falls-Lakeview Highway (OR140)
143.06 4400 0.03 mile southeast of Klamath Falls-Lakeview Highway (OR140)
143.32 3500 0.02 mile south of Center Street
143.65 3100 0.02 mile north of 4th Street South
143.86 2800 0.02 mile north of 7th Street South
144.08 1900 0.02 mile south of "F" Street South
144.22 1700 0.02 mile south of 10th Street South
144.47 1200 0.02 mile south of 12th Street South
148.63 910 0.02 mile north of Crane Creek Road
157.43 790 * New Pine Creek Automatic Traffic Recorder, Sta. 19-008, 0.30 mile north of Oregon-California state line
KLAMATH FALLS-LAKEVIEW HIGHWAY NO. 20
Milepoint indicates distance from The Dalles - Cal ifornia Highway (US97), in Klamath Falls
0.14 4800 0.04 mile west of Ewauna Street
MP 0.19 to MP 2.50 Transferred to the City of Klama th Falls 2.70 19000 0.02 mile west of Altamont Drive
2.74 15800 0.02 mile east of Altamont Drive
3.26 18300 0.02 mile west of Klamath Falls-Malin Highway (OR39)
3.30 18500 0.02 mile east of Klamath Falls-Malin Highway (OR39)
3.72 18900 0.02 mile west of Wiard Street
3.98 17300 0.02 mile west of Homedale Road
4.02 15600 0.02 mile east of Homedale Road
4.27 13000 0.02 mile east of Madison Street
5.34 11000 0.20 mile west of Western Street (OR140/OR39 Interchange)
5.74 6100 0.20 mile east of Western Street (OR140/OR39 Interchange)
10.08 3900 0.02 mile west of S. Poe Valley Road
10.12 3500 0.02 mile east of S. Poe Valley Road
19.00 2100 0.02 mile west of Dairy-Bonanza Highway (OR70)
19.12 1800 0.10 mile east of Dairy-Bonanza Highway (OR70)
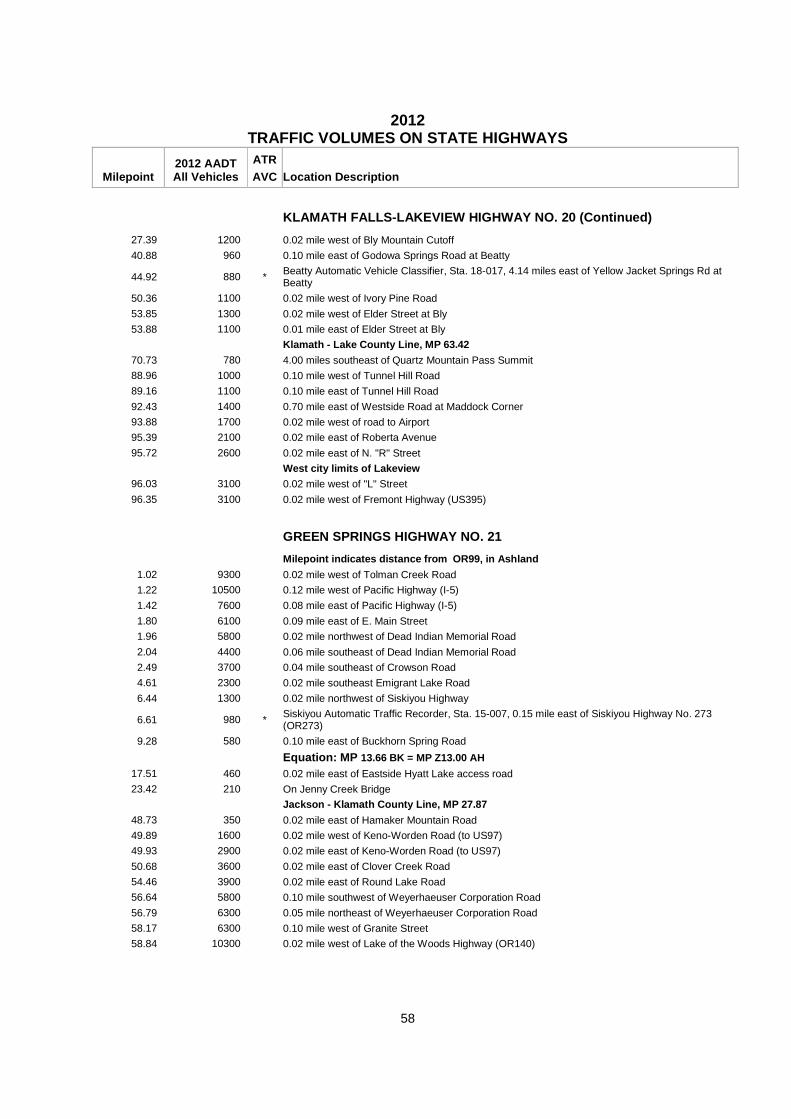
2012
TRAFFIC VOLUMES ON STATE HIGHWAYS
Milepoint 2012 AADT All Vehicles
ATR AVC Location Description
58
KLAMATH FALLS-LAKEVIEW HIGHWAY NO. 20 (Continued)
27.39 1200 0.02 mile west of Bly Mountain Cutoff
40.88 960 0.10 mile east of Godowa Springs Road at Beatty
44.92 880 * Beatty Automatic Vehicle Classifier, Sta. 18-017, 4.14 miles east of Yellow Jacket Springs Rd at Beatty
50.36 1100 0.02 mile west of Ivory Pine Road
53.85 1300 0.02 mile west of Elder Street at Bly
53.88 1100 0.01 mile east of Elder Street at Bly
Klamath - Lake County Line, MP 63.42
70.73 780 4.00 miles southeast of Quartz Mountain Pass Summit
88.96 1000 0.10 mile west of Tunnel Hill Road
89.16 1100 0.10 mile east of Tunnel Hill Road
92.43 1400 0.70 mile east of Westside Road at Maddock Corner
93.88 1700 0.02 mile west of road to Airport
95.39 2100 0.02 mile east of Roberta Avenue
95.72 2600 0.02 mile east of N. "R" Street
West city limits of Lakeview 96.03 3100 0.02 mile west of "L" Street
96.35 3100 0.02 mile west of Fremont Highway (US395)
GREEN SPRINGS HIGHWAY NO. 21
Milepoint indicates distance from OR99, in Ashland
1.02 9300 0.02 mile west of Tolman Creek Road
1.22 10500 0.12 mile west of Pacific Highway (I-5)
1.42 7600 0.08 mile east of Pacific Highway (I-5)
1.80 6100 0.09 mile east of E. Main Street
1.96 5800 0.02 mile northwest of Dead Indian Memorial Road
2.04 4400 0.06 mile southeast of Dead Indian Memorial Road
2.49 3700 0.04 mile southeast of Crowson Road
4.61 2300 0.02 mile southeast Emigrant Lake Road
6.44 1300 0.02 mile northwest of Siskiyou Highway
6.61 980 * Siskiyou Automatic Traffic Recorder, Sta. 15-007, 0.15 mile east of Siskiyou Highway No. 273 (OR273)
9.28 580 0.10 mile east of Buckhorn Spring Road
Equation: MP 13.66 BK = MP Z13.00 AH
17.51 460 0.02 mile east of Eastside Hyatt Lake access road
23.42 210 On Jenny Creek Bridge
Jackson - Klamath County Line, MP 27.87
48.73 350 0.02 mile east of Hamaker Mountain Road
49.89 1600 0.02 mile west of Keno-Worden Road (to US97)
49.93 2900 0.02 mile east of Keno-Worden Road (to US97)
50.68 3600 0.02 mile east of Clover Creek Road
54.46 3900 0.02 mile east of Round Lake Road
56.64 5800 0.10 mile southwest of Weyerhaeuser Corporation Road
56.79 6300 0.05 mile northeast of Weyerhaeuser Corporation Road
58.17 6300 0.10 mile west of Granite Street
58.84 10300 0.02 mile west of Lake of the Woods Highway (OR140)

2012
TRAFFIC VOLUMES ON STATE HIGHWAYS
Milepoint 2012 AADT All Vehicles
ATR AVC Location Description
59
CRATER LAKE HIGHWAY NO. 22
Milepoint indicates distance from Rogue Valley Hig hway (OR99), in Medford
0.20 29200 0.15 mile north of Rogue Valley Highway (OR99), Siskyou Boulevard
0.84 35700 0.05 mile west of Poplar Drive
1.11 41600 * North Medford Automatic Traffic Recorder, Sta. 15-017, 0.64 mile east of Pacific Highway 1 (I-5)
1.38 34100 0.02 mile southwest of Whittle Avenue
2.10 24500 0.02 mile north of Elliot Road
3.63 23400 0.02 mile south of E. Vilas Road
3.67 25400 0.02 mile north of E. Vilas Road
5.42 27800 0.02 mile south of Agate Road
5.98 24700 0.05 mile south of Lake of the Woods Highway (OR140)
6.08 22000 0.05 mile north of Lake of the Woods Highway (OR140)
7.34 17000 0.02 mile south of Avenue "H", entrance to Camp White
7.38 15800 0.02 mile north of Avenue "H", entrance to Camp White
9.40 14600 0.02 mile south of Nick Young Road
9.44 11800 0.02 mile north of Nick Young Road
13.58 8200 0.05 mile south of Sams Valley Highway (OR234)
13.73 8100 0.10 mile north of Sams Valley Highway (OR234)
14.55 8200 0.01 mile south of Butte Falls Road
15.46 7200 * Shady Cove Automatic Traffic Recorder, Sta. 15-013, 1.83 miles north of Sams Valley Highway No. 271 (OR234)
18.35 6600 0.06 mile south of Brophy Way
19.81 7800 0.03 mile north of Indian Creek Road
20.11 7900 0.02 mile north of Rogue River Drive
21.10 5300 North city limits of Shady Cove, 0.07 mile north of Train Lane
22.37 4700 0.05 mile south of Tiller-Trail Highway (OR227)
22.60 3900 0.18 mile east of Tiller-Trail Highway (OR227)
25.54 3400 0.02 mile west of Elk Creek Road
Equation: MP 26.65 BK = MP 26.91 AH
29.30 2700 0.05 mile south of Crowfoot Road
Equation: MP 35.70 BK = MP 36.64 AH
44.19 1600 0.02 mile south of Mill Creek Drive
Equation: MP 44.29 BK = MP 45.31 AH
51.46 1700 0.10 mile east of Woodruff Bridge Road
57.29 1600 0.02 mile south of West Diamond Lake Highway (OR230)
57.81 790 0.50 mile east of West Diamond Lake Highway (OR230)
Jackson - Klamath County Line, MP 65.45
65.45 420 At west boundary of Crater Lake National Forest
National Park Jurisdiction, MP 65.45 to MP 83.63
89.75 420 0.02 mile north of Nicholson Road
89.79 470 0.02 mile south of Nicholson Road
91.10 430 * Fort Klamath Automatic Traffic Recorder, Sta. 18-021, 0.28 mile northwest of Sun Mountain Road
97.30 720 0.01 mile north of Modoc Point Road
98.53 670 0.02 mile north of Chiloquin Highway (North Jct.)
102.37 420 0.10 mile north of South Chiloquin Highway
103.67 610 0.28 mile northwest of The Dalles-California Highway (US97)
DAIRY-BONANZA HIGHWAY NO. 23
MIlepoint indicates distance from Klamath Falls - L akeview Highway (OR140), at Dairy

2012
TRAFFIC VOLUMES ON STATE HIGHWAYS
Milepoint 2012 AADT All Vehicles
ATR AVC Location Description
60
DAIRY-BONANZA HIGHWAY NO. 23 (Continued)
0.10 570 0.10 mile east of Klamath Falls-Lakeview Highway (OR140)
2.96 560 0.02 mile east of Burgdorf Road
5.94 660 West city limits of Bonanza, 0.24 mile west of Bowne Avenue
6.43 850 0.05 mile west of Carroll Avenue
6.50 1200 0.02 mile east of Carroll Avenue
6.81 1400 0.01 mile east of 2nd Avenue
6.95 710 0.02 mile southwest of Central Street
REDWOOD HIGHWAY NO. 25
Milepoint indicates distance from Rogue River High way (OR99), at Redwood Jct. in Grants Pass
SOUTHBOUND - ONE-WAY TRAFFIC
On 6th Street
-2.61 8700 On Southbound off-ramp from I-5 to NW 6th St, at the North Grants Pass exit
-2.18 11600 0.02 mile north of Hillcrest Drive
-1.97 11800 0.02 mile north of Midland Avenue
-1.69 13900 0.02 mile south of Savage Street
-1.17 14100 0.02 mile north of N.E. "A" Street
-1.13 17500 0.02 mile south of N.E. "A" Street
-0.96 15100 0.02 mile north of "E" Street
-0.89 15000 0.02 mile north of "F" Street
-0.81 15600 0.02 mile north of "G" Street
-0.65 14600 0.02 mile north of "J" Street
-0.41 15200 0.02 mile north of "M" Street
-0.37 18700 0.02 mile south of "M" Street
-0.14 18800 On Rogue River Bridge
NORTHBOUND - ONE-WAY TRAFFIC
On 7th Street -2.57 4400 0.02 mile north of N.W. Morgan Lane
-2.29 11300 0.10 mile north of Hillcrest Drive
-2.07 13200 0.02 mile north of Midland Avenue
-1.79 12900 0.02 mile south of Savage Street
-1.23 13500 0.02 mile north of N.E. "A" Street
-1.19 14400 0.02 mile south of N.E. "A" Street
-1.02 14900 0.02 mile north of "E" Street
-0.96 14900 0.02 mile north of "F" Street
-0.88 14300 0.02 mile north of "G" Street
-0.72 14200 0.02 mile north of "J" Street
-0.49 14300 0.02 mile north of "M" Street
-0.45 18500 0.02 mile south of "M" Street
-0.24 18100 On Rogue River Bridge
RESUME TWO-WAY TRAFFIC
0.75 30400 0.04 mile east of Fairgrounds Road
0.89 31100 0.10 mile west of Fairgrounds Road
1.22 17800 0.02 mile east of Allen Creek Road
2.03 19300 0.02 mile east of Dowell Road
2.58 12900 0.02 mile west of Willow Lane
4.68 10300 * Timber Ridge Automatic Traffic Recorder, Sta. 17-005, 0.50 mile east of Redwood Avenue
5.20 10200 0.02 mile west of Redwood Avenue

2012
TRAFFIC VOLUMES ON STATE HIGHWAYS
Milepoint 2012 AADT All Vehicles
ATR AVC Location Description
61
REDWOOD HIGHWAY NO. 25 (Continued)
6.33 10000 0.02 mile east of Helms Road
6.97 10300 0.12 mile east of Rogue River Loop Highway
7.14 9000 0.05 mile west of Rogue River Loop Highway
8.81 8300 0.02 mile south of Fish Hatchery Road
Equation: MP 9.03 BK = MP 9.33 AH
16.10 7500 Hayes Hill Summit
17.87 7600 0.02 mile south of Draper Valley Road (North Jct.)
19.60 8100 0.02 mile south of Draper Valley Road (South Jct.)
20.08 8100 0.10 mile north of Illinois River Road
20.24 7900 0.02 mile north of Hogue Drive (North Jct.)
20.37 7900 0.37 mile north of Deer Creek Bridge
20.81 7400 0.02 mile south of Lakeshore Drive
21.44 7600 0.08 mile south of Hogue Drive (south junction)
26.32 8100 0.09 mile north of 5th Street
26.81 8500 0.10 mile south of Finch Road
27.71 7800 North city limits of Cave Junction, 0.04 mile south of Laurel Road
28.65 8600 0.02 mile south of Lister Street
28.93 10400 0.02 mile north of Oregon Caves Highway (OR46)
29.27 7700 South city limits of Cave Junction, 0.14 mile south of Hamilton Avenue
29.65 5100 0.02 mile south of Rockydale Road
32.34 4300 0.02 mile north of Westside Road
36.22 3100 0.02 mile north of O'Brien Road
36.71 3000 0.02 mile north of Gene Brown Road
41.32 2800 * O’Brien Automatic Vehicle Classifier, Sta. 17-003, 0.37 mile north of Oregon-California State Line
MT. HOOD HIGHWAY NO. 26
Milepoint indicates distance from Pacific Highway West (OR99W), in Portland
0.85 54100 0.77 mile east of Pacific Highway West (OR99W) overcrossing, on the east side of Ross Island Bridge
1.08 49500 0.07 mile east of Pacific Highway East Overcrossing (OR99E)
1.17 40300 0.02 mile east of S.E. 8th Avenue
1.36 39300 0.04 mile east of S.E. Milwaukie Avenue
1.79 36600 0.02 mile east of S.E. 21st Avenue
1.83 38100 0.02 mile west of S.E. 21st Avenue
2.09 34200 0.02 mile east of S.E. 26th Avenue
2.89 35200 0.02 mile west of S.E. 39th Avenue
2.93 36100 0.02 mile east of S.E. 39th Avenue
3.23 35300 0.02 mile east of S.E. 45th Avenue
3.41 39500 0.05 mile west of S.E. Foster Road
3.46 22100 0.02 mile west of S.E. 52nd Avenue
3.59 23500 0.02 mile east of S.E. 52nd Avenue
4.06 23900 0.02 mile east of S.E. 62nd Avenue
4.56 24100 0.02 mile east of S.E. 72nd Avenue
5.02 24900 0.02 mile west of Cascade Highway North (OR213)
5.16 24700 0.05 mile west of S.E. 84th Avenue
5.67 34200 0.07 mile west of East Portland Freeway (I-205)
5.82 19300 0.08 mile east of East Portland Freeway (I-205)
6.69 17400 0.02 mile west of S.E. 112th Avenue

2012
TRAFFIC VOLUMES ON STATE HIGHWAYS
Milepoint 2012 AADT All Vehicles
ATR AVC Location Description
62
MT. HOOD HIGHWAY NO. 26 (Continued)
6.73 17200 0.02 mile east of S.E. 112th Avenue
7.19 17300 0.02 mile west of S.E. 122nd Avenue
7.23 18500 0.02 mile east of S.E. 122nd Avenue
7.92 18500 0.02 mile east of S.E. 136th Avenue
8.34 18200 0.02 mile west of S.E. 144th Avenue
8.42 17800 0.02 mile east of S.E. 145th Avenue
9.37 17700 0.02 mile east of S.E. 164th Avenue
9.96 19900 West city limits of Gresham, 0.09 mile east of S.E. 174th Avenue
Transferred to City of Gresham, MP 9.96 to MP 14.22
14.36 30000 * Gresham Automatic Traffic Recorder, Sta. 26-003, 0.18 mile southeast of SE Powell Valley Road
14.80 27300 0.05 mile south of S.E. Palmquist Road
18.30 24100 0.05 mile northwest of S.E. Haley Road
19.24 23800 0.30 mile northwest of Clackamas-Boring Highway (OR212)
21.40 30100 0.30 mile southeast of S.E. Kelso Road
22.72 33200 0.02 mile northwest of S.E. 362nd Drive, west city limits of Sandy
23.85 34500 0.02 mile west of Bluff Road
EASTBOUND - ONE-WAY TRAFFIC
On Pioneer Boulevard
23.89 16900 0.02 mile east of Bluff Road
24.02 17100 0.02 mile west of Beers Avenue
24.35 16500 0.05 mile west of Eagle Creek-Sandy Highway (OR211)
24.42 13500 0.02 mile east of Eagle Creek-Sandy Highway (OR211)
24.59 12300 0.02 mile west of Ten Eyck Road
WESTBOUND - ONE-WAY TRAFFIC
On Proctor Boulevard
23.89 17400 0.02 mile east of Bluff Road
24.04 17500 0.02 mile west of Beers Avenue
24.36 15200 0.05 mile west of Eagle Creek-Sandy Highway (OR211)
24.40 13100 0.02 mile east of Eagle Creek-Sandy Highway (OR211)
24.61 11400 0.02 mile west of Ten Eyck Road
RESUME TWO-WAY TRAFFIC
Equation: MP 24.70 BK = MP 24.92
25.10 16700 0.02 mile west of Langensand Road
25.66 22400 0.10 mile east of Vista Loop Drive
26.76 25900 0.10 mile west of S.E. Firwood Road
26.93 18600 0.07 mile east of S.E. Firwood Road
29.66 16900 0.23 mile west of Wagoneer Loop Drive (East Jct.)
34.87 20200 0.10 mile west of E. Sleepy Hollow Drive
35.07 14000 0.10 mile east of E. Sleepy Hollow Drive
38.54 15600 0.10 mile west of E. Brightwood Loop Road (East Jct.)
41.19 11300 0.02 mile west of Vine Maple Drive
Equation: MP 41.60 BK = MP 42.25 AH
Equation: MP 44.57 BK = MP 44.79 AH
46.38 8500 * Rhododendron Automatic Traffic Recorder, Sta. 03-006, 0.30 mile east of Camp Creek Rd (USFS 28)
52.78 10800 0.10 mile west of road to Government Camp (West jct.)
54.13 7900 0.10 mile west of Timberline Highway
56.00 9300 0.50 mile west of Warm Springs Highway (US26)
Equation: MP 56.11 BK = MP 57.20 AH

2012
TRAFFIC VOLUMES ON STATE HIGHWAYS
Milepoint 2012 AADT All Vehicles
ATR AVC Location Description
63
MT. HOOD HIGHWAY NO. 26 (Continued)
57.79 2000 * Mt. Hood Meadows Automatic Traffic Recorder, Sta. 03-007, 0.02 mile east of Warm Springs Highway No. 53 (US26)
70.64 1300 0.10 mile south of Lookout Mountain Loop Road
80.06 1600 0.02 mile south of Base Line Road
Equation: MP 80.59 BK = MP 82.62 AH
82.91 1200 * Mt. Hood Automatic Traffic Recorder, Sta. 14-003, 2.12 miles south of Hood River Highway No. 281
85.00 1700 0.02 mile south of Hood River Highway
88.34 3000 0.07 mile north of Hood River Highway
88.74 3600 0.02 mile north of Woodworth Road
90.57 4100 0.20 mile north of Miller Road
93.40 4700 0.07 mile south of Central Vale Road
Equation: MP 94.17 BK = MP 94.43 AH
95.15 5000 0.10 mile south of Odell Highway
95.30 5200 0.05 mile north of Odell Highway
95.86 5100 0.02 mile south of Neal Creek Road
95.90 5300 0.02 mile north of Neal Creek Road
Equation: MP 96.87 BK = MP 97.08 AH
97.57 6500 0.02 mile south of Dethman Ridge Drive
97.61 7400 0.02 mile north of Dethman Ridge Drive
97.81 7200 0.02 mile north of Van Horn Drive
101.72 7500 0.10 mile south of Historic Columbia River Highway (US30) and connection to Columbia River Highway (I-84)
ALSEA HIGHWAY NO. 27
Milepoint indicates distance from Oregon Coast High way (US101), in Waldport
0.08 7100 0.02 mile east of Verbena Street
0.30 7000 0.02 mile northeast of Bay Street
0.52 5000 0.02 mile east of Mill Street
1.62 4700 Southeast city limits of Waldport, 0.22 mile east of Meadowlark Lane
1.80 4300 0.02 mile west of S.E. Clover Lane
2.40 3100 On Eckman Slough Bridge
2.63 2500 0.02 mile east of Eckman Creek Road
5.21 1500 At Siuslaw Forest Boundary
7.15 1400 0.02 mile east of Risley Creek Road
9.82 1100 0.02 mile west of Roe Lane
10.49 1100 0.02 mile west of Little Switzerland Road
14.22 780 On Scott Creek Bridge
20.09 680 0.02 mile south of Five Rivers Road to Denzer
20.13 610 0.02 mile north of Five Rivers Road to Denzer
27.52 700 Lincoln-Benton County Line
33.11 800 0.02 mile east of Salmonberry Road
38.15 1000 0.04 mile east of Hayden Road
39.71 1100 0.10 mile west of Alsea-Deadwood Highway
39.85 1500 0.04 mile east of Alsea-Deadwood Highway
40.00 1700 0.04 mile east of 3rd Street
40.06 1900 0.02 mile east of Alder Street
40.99 1800 0.02 mile northeast of Honey Grove Road
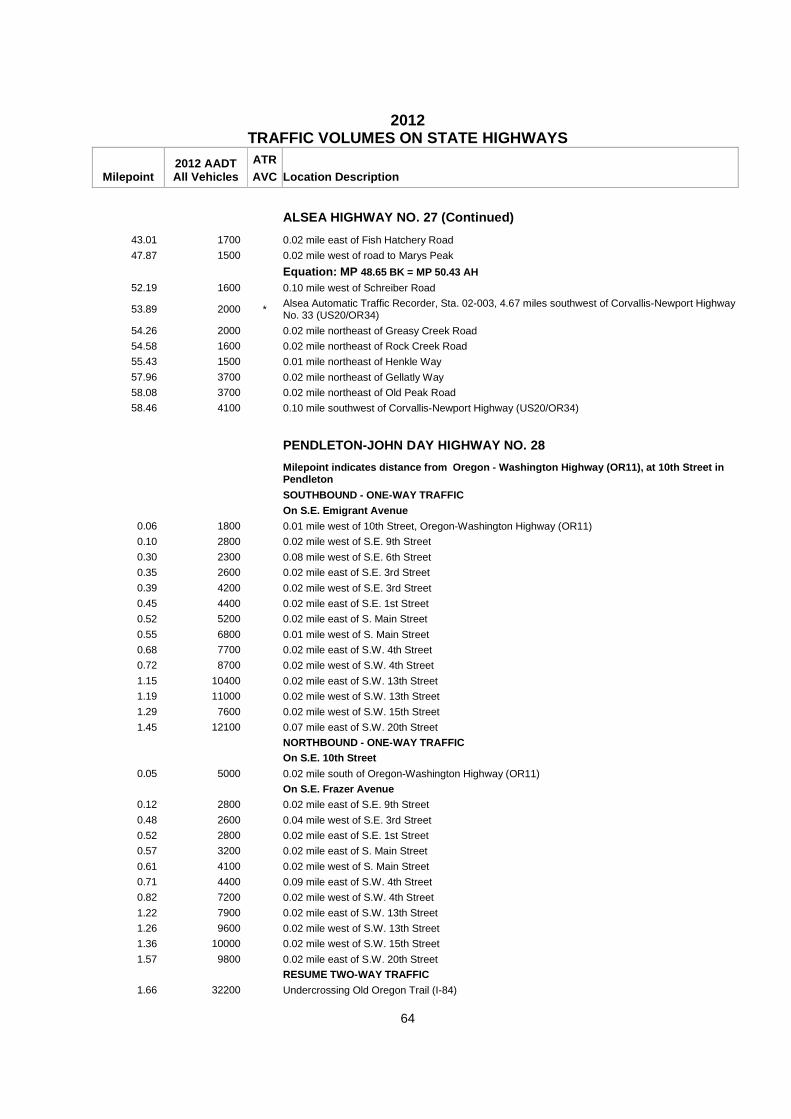
2012
TRAFFIC VOLUMES ON STATE HIGHWAYS
Milepoint 2012 AADT All Vehicles
ATR AVC Location Description
64
ALSEA HIGHWAY NO. 27 (Continued)
43.01 1700 0.02 mile east of Fish Hatchery Road
47.87 1500 0.02 mile west of road to Marys Peak
Equation: MP 48.65 BK = MP 50.43 AH
52.19 1600 0.10 mile west of Schreiber Road
53.89 2000 * Alsea Automatic Traffic Recorder, Sta. 02-003, 4.67 miles southwest of Corvallis-Newport Highway No. 33 (US20/OR34)
54.26 2000 0.02 mile northeast of Greasy Creek Road
54.58 1600 0.02 mile northeast of Rock Creek Road
55.43 1500 0.01 mile northeast of Henkle Way
57.96 3700 0.02 mile northeast of Gellatly Way
58.08 3700 0.02 mile northeast of Old Peak Road
58.46 4100 0.10 mile southwest of Corvallis-Newport Highway (US20/OR34)
PENDLETON-JOHN DAY HIGHWAY NO. 28
Milepoint indicates distance from Oregon - Washing ton Highway (OR11), at 10th Street in Pendleton
SOUTHBOUND - ONE-WAY TRAFFIC
On S.E. Emigrant Avenue
0.06 1800 0.01 mile west of 10th Street, Oregon-Washington Highway (OR11)
0.10 2800 0.02 mile west of S.E. 9th Street
0.30 2300 0.08 mile west of S.E. 6th Street
0.35 2600 0.02 mile east of S.E. 3rd Street
0.39 4200 0.02 mile west of S.E. 3rd Street
0.45 4400 0.02 mile east of S.E. 1st Street
0.52 5200 0.02 mile east of S. Main Street
0.55 6800 0.01 mile west of S. Main Street
0.68 7700 0.02 mile east of S.W. 4th Street
0.72 8700 0.02 mile west of S.W. 4th Street
1.15 10400 0.02 mile east of S.W. 13th Street
1.19 11000 0.02 mile west of S.W. 13th Street
1.29 7600 0.02 mile west of S.W. 15th Street
1.45 12100 0.07 mile east of S.W. 20th Street
NORTHBOUND - ONE-WAY TRAFFIC
On S.E. 10th Street
0.05 5000 0.02 mile south of Oregon-Washington Highway (OR11)
On S.E. Frazer Avenue 0.12 2800 0.02 mile east of S.E. 9th Street
0.48 2600 0.04 mile west of S.E. 3rd Street
0.52 2800 0.02 mile east of S.E. 1st Street
0.57 3200 0.02 mile east of S. Main Street
0.61 4100 0.02 mile west of S. Main Street
0.71 4400 0.09 mile east of S.W. 4th Street
0.82 7200 0.02 mile west of S.W. 4th Street
1.22 7900 0.02 mile east of S.W. 13th Street
1.26 9600 0.02 mile west of S.W. 13th Street
1.36 10000 0.02 mile west of S.W. 15th Street
1.57 9800 0.02 mile east of S.W. 20th Street
RESUME TWO-WAY TRAFFIC 1.66 32200 Undercrossing Old Oregon Trail (I-84)
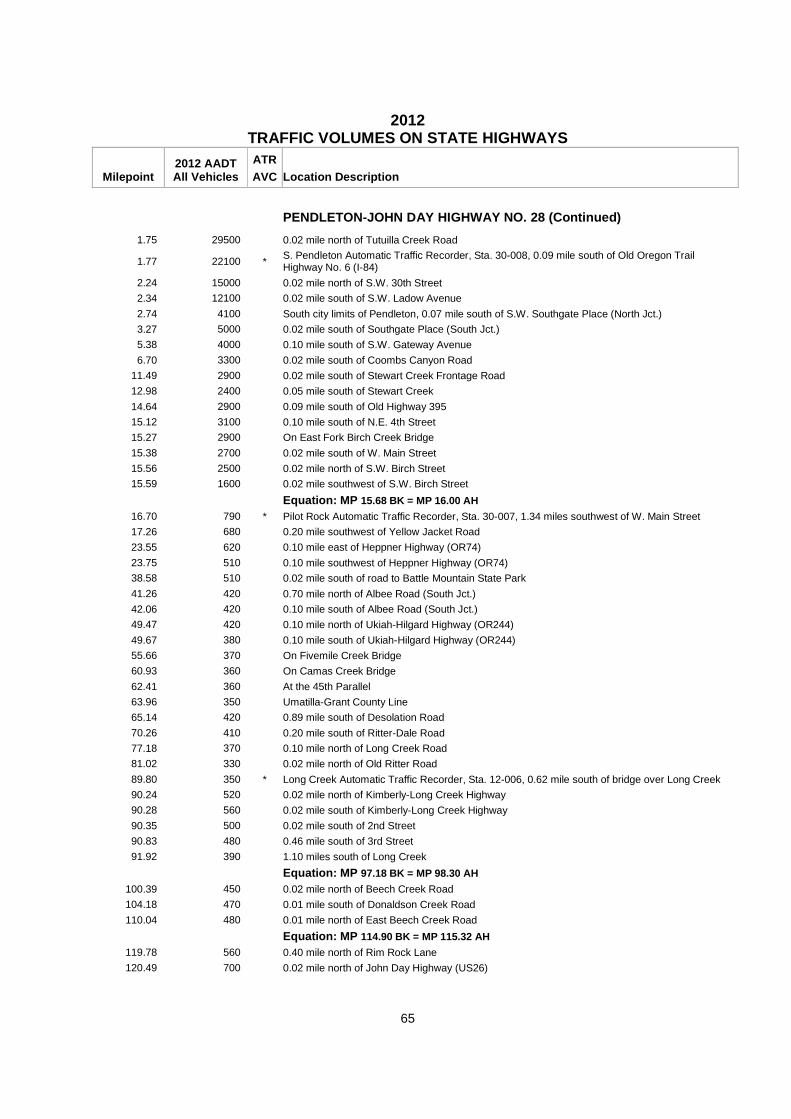
2012
TRAFFIC VOLUMES ON STATE HIGHWAYS
Milepoint 2012 AADT All Vehicles
ATR AVC Location Description
65
PENDLETON-JOHN DAY HIGHWAY NO. 28 (Continued)
1.75 29500 0.02 mile north of Tutuilla Creek Road
1.77 22100 * S. Pendleton Automatic Traffic Recorder, Sta. 30-008, 0.09 mile south of Old Oregon Trail Highway No. 6 (I-84)
2.24 15000 0.02 mile north of S.W. 30th Street
2.34 12100 0.02 mile south of S.W. Ladow Avenue
2.74 4100 South city limits of Pendleton, 0.07 mile south of S.W. Southgate Place (North Jct.)
3.27 5000 0.02 mile south of Southgate Place (South Jct.)
5.38 4000 0.10 mile south of S.W. Gateway Avenue
6.70 3300 0.02 mile south of Coombs Canyon Road
11.49 2900 0.02 mile south of Stewart Creek Frontage Road
12.98 2400 0.05 mile south of Stewart Creek
14.64 2900 0.09 mile south of Old Highway 395
15.12 3100 0.10 mile south of N.E. 4th Street
15.27 2900 On East Fork Birch Creek Bridge
15.38 2700 0.02 mile south of W. Main Street
15.56 2500 0.02 mile north of S.W. Birch Street
15.59 1600 0.02 mile southwest of S.W. Birch Street
Equation: MP 15.68 BK = MP 16.00 AH
16.70 790 * Pilot Rock Automatic Traffic Recorder, Sta. 30-007, 1.34 miles southwest of W. Main Street
17.26 680 0.20 mile southwest of Yellow Jacket Road
23.55 620 0.10 mile east of Heppner Highway (OR74)
23.75 510 0.10 mile southwest of Heppner Highway (OR74)
38.58 510 0.02 mile south of road to Battle Mountain State Park
41.26 420 0.70 mile north of Albee Road (South Jct.)
42.06 420 0.10 mile south of Albee Road (South Jct.)
49.47 420 0.10 mile north of Ukiah-Hilgard Highway (OR244)
49.67 380 0.10 mile south of Ukiah-Hilgard Highway (OR244)
55.66 370 On Fivemile Creek Bridge
60.93 360 On Camas Creek Bridge
62.41 360 At the 45th Parallel
63.96 350 Umatilla-Grant County Line
65.14 420 0.89 mile south of Desolation Road
70.26 410 0.20 mile south of Ritter-Dale Road
77.18 370 0.10 mile north of Long Creek Road
81.02 330 0.02 mile north of Old Ritter Road
89.80 350 * Long Creek Automatic Traffic Recorder, Sta. 12-006, 0.62 mile south of bridge over Long Creek
90.24 520 0.02 mile north of Kimberly-Long Creek Highway
90.28 560 0.02 mile south of Kimberly-Long Creek Highway
90.35 500 0.02 mile south of 2nd Street
90.83 480 0.46 mile south of 3rd Street
91.92 390 1.10 miles south of Long Creek
Equation: MP 97.18 BK = MP 98.30 AH
100.39 450 0.02 mile north of Beech Creek Road
104.18 470 0.01 mile south of Donaldson Creek Road
110.04 480 0.01 mile north of East Beech Creek Road
Equation: MP 114.90 BK = MP 115.32 AH
119.78 560 0.40 mile north of Rim Rock Lane
120.49 700 0.02 mile north of John Day Highway (US26)
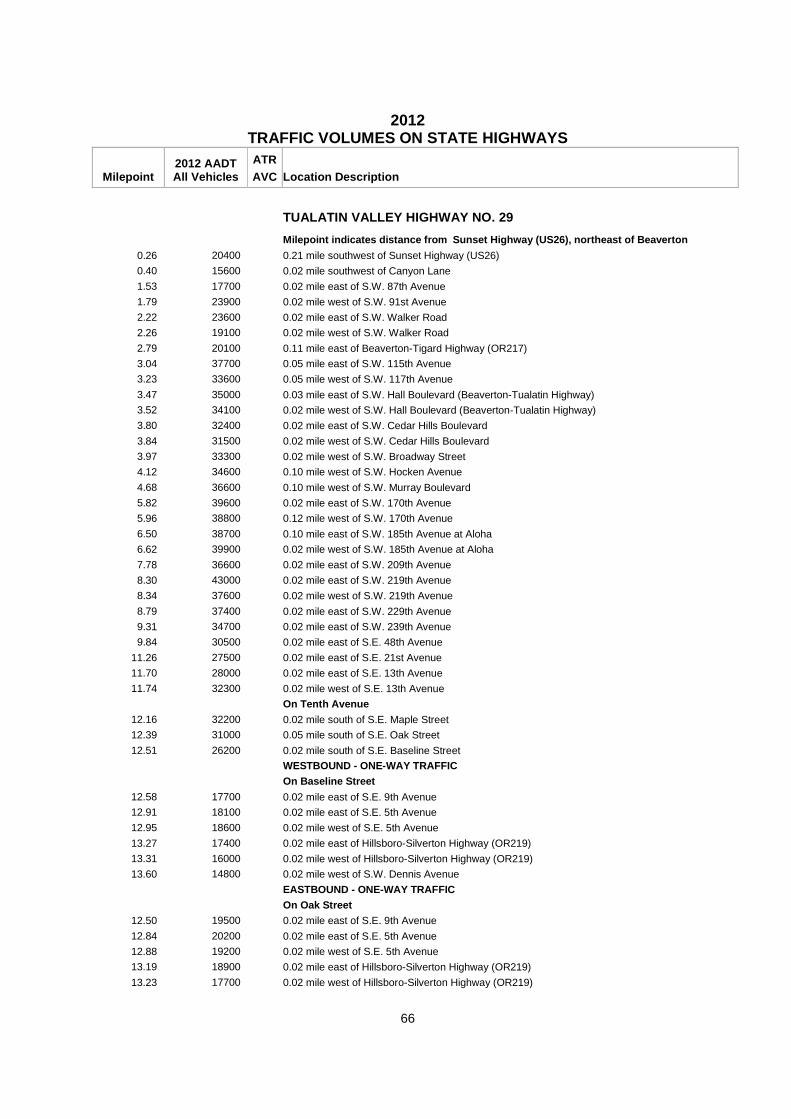
2012
TRAFFIC VOLUMES ON STATE HIGHWAYS
Milepoint 2012 AADT All Vehicles
ATR AVC Location Description
66
TUALATIN VALLEY HIGHWAY NO. 29
Milepoint indicates distance from Sunset Highway ( US26), northeast of Beaverton
0.26 20400 0.21 mile southwest of Sunset Highway (US26)
0.40 15600 0.02 mile southwest of Canyon Lane
1.53 17700 0.02 mile east of S.W. 87th Avenue
1.79 23900 0.02 mile west of S.W. 91st Avenue
2.22 23600 0.02 mile east of S.W. Walker Road
2.26 19100 0.02 mile west of S.W. Walker Road
2.79 20100 0.11 mile east of Beaverton-Tigard Highway (OR217)
3.04 37700 0.05 mile east of S.W. 115th Avenue
3.23 33600 0.05 mile west of S.W. 117th Avenue
3.47 35000 0.03 mile east of S.W. Hall Boulevard (Beaverton-Tualatin Highway)
3.52 34100 0.02 mile west of S.W. Hall Boulevard (Beaverton-Tualatin Highway)
3.80 32400 0.02 mile east of S.W. Cedar Hills Boulevard
3.84 31500 0.02 mile west of S.W. Cedar Hills Boulevard
3.97 33300 0.02 mile west of S.W. Broadway Street
4.12 34600 0.10 mile west of S.W. Hocken Avenue
4.68 36600 0.10 mile west of S.W. Murray Boulevard
5.82 39600 0.02 mile east of S.W. 170th Avenue
5.96 38800 0.12 mile west of S.W. 170th Avenue
6.50 38700 0.10 mile east of S.W. 185th Avenue at Aloha
6.62 39900 0.02 mile west of S.W. 185th Avenue at Aloha
7.78 36600 0.02 mile east of S.W. 209th Avenue
8.30 43000 0.02 mile east of S.W. 219th Avenue
8.34 37600 0.02 mile west of S.W. 219th Avenue
8.79 37400 0.02 mile east of S.W. 229th Avenue
9.31 34700 0.02 mile east of S.W. 239th Avenue
9.84 30500 0.02 mile east of S.E. 48th Avenue
11.26 27500 0.02 mile east of S.E. 21st Avenue
11.70 28000 0.02 mile east of S.E. 13th Avenue
11.74 32300 0.02 mile west of S.E. 13th Avenue
On Tenth Avenue
12.16 32200 0.02 mile south of S.E. Maple Street
12.39 31000 0.05 mile south of S.E. Oak Street
12.51 26200 0.02 mile south of S.E. Baseline Street
WESTBOUND - ONE-WAY TRAFFIC On Baseline Street
12.58 17700 0.02 mile east of S.E. 9th Avenue
12.91 18100 0.02 mile east of S.E. 5th Avenue
12.95 18600 0.02 mile west of S.E. 5th Avenue
13.27 17400 0.02 mile east of Hillsboro-Silverton Highway (OR219)
13.31 16000 0.02 mile west of Hillsboro-Silverton Highway (OR219)
13.60 14800 0.02 mile west of S.W. Dennis Avenue
EASTBOUND - ONE-WAY TRAFFIC
On Oak Street
12.50 19500 0.02 mile east of S.E. 9th Avenue
12.84 20200 0.02 mile east of S.E. 5th Avenue
12.88 19200 0.02 mile west of S.E. 5th Avenue
13.19 18900 0.02 mile east of Hillsboro-Silverton Highway (OR219)
13.23 17700 0.02 mile west of Hillsboro-Silverton Highway (OR219)

2012
TRAFFIC VOLUMES ON STATE HIGHWAYS
Milepoint 2012 AADT All Vehicles
ATR AVC Location Description
67
TUALATIN VALLEY HIGHWAY NO. 29 (Continued)
13.52 17200 0.02 mile west of S.W. Dennis Avenue
RESUME TWO-WAY STREET
14.25 34000 0.10 mile west of S.W. 17th Avenue
14.84 33300 * Cornelius Automatic Traffic Recorder, Sta. 34-009, 0.28 mile west of N.W. 334th Avenue
15.17 33400 0.05 mile west of N.W. 341st Avenue
15.70 33200 0.02 mile east of W. 26th Avenue
WESTBOUND - ONE-WAY TRAFFIC
On Adair Street
16.11 16700 0.02 mile east of 19th Avenue
16.46 16600 0.02 mile west of 14th Avenue
16.64 16500 0.02 mile west of 11th Avenue
16.69 16700 0.02mile west of 10th Avenue
17.05 16300 0.01 mile west of 4th Avenue
17.37 15700 0.02 mile west of Yew Street
EASTBOUND - ONE-WAY TRAFFIC
On Baseline Street
16.05 15700 0.02 mile east of 20th Avenue
16.46 17000 0.02 mile west of 14th Avenue
16.63 16600 0.02 mile west of 11th Avenue
16.69 16400 0.02 mile west of 10th Avenue
17.05 16300 0.02 mile west of 4th Avenue
17.36 15500 0.02 mile west of Yew Street
RESUME TWO-WAY TRAFFIC 17.56 31300 0.10 mile west of Mt. View Lane
18.54 10100 0.02 mile east of Maple Street
19.20 11500 0.02 mile west of Elm Street
20.01 9800 0.05 mile south of Old Nehalem Highway (B Street)
Equation: MP 20.40 BK = MP 21.08 AH
21.52 11900 0.05 mile north of Dudney Avenue at Dilley
21.62 11800 0.05 mile south of Dudney Avenue at Dilley
22.33 10200 0.02 mile south of Springhill Road
23.68 10500 0.05 mile south of Seghers Road
24.83 8600 0.02 mile south of Patton Road
25.43 8900 0.02 mile north of Main Street at Gaston
25.47 7800 0.02 mile south of Main Street at Gaston
25.72 7300 South city limits of Gaston, Washington-Yamhill County Line
Equation: MP 25.73 BK = MP 26.52 AH
28.79 5000 0.02 mile south of Wapato-Newberg Road (Flett Road)
31.02 4300 0.02 mile north of Roosevelt Drive
34.14 4700 0.03 mile east of Pike Road
34.22 4900 0.05 mile south of Pike Road
34.45 5800 0.02 mile north of Yamhill-Newberg Highway (OR240)
34.49 5800 0.02 mile south of Yamhill-Newberg Highway (OR240)
34.60 5200 0.02 mile north of W. 3rd Street
34.94 4400 0.32 mile south of W. 3rd Street
37.37 5300 0.13 mile north of Lincoln Street
37.56 5500 0.02 mile north of Johnson Street
37.85 6100 0.02 mile north of Main Street
37.89 5600 0.02 mile east of Yamhill Street
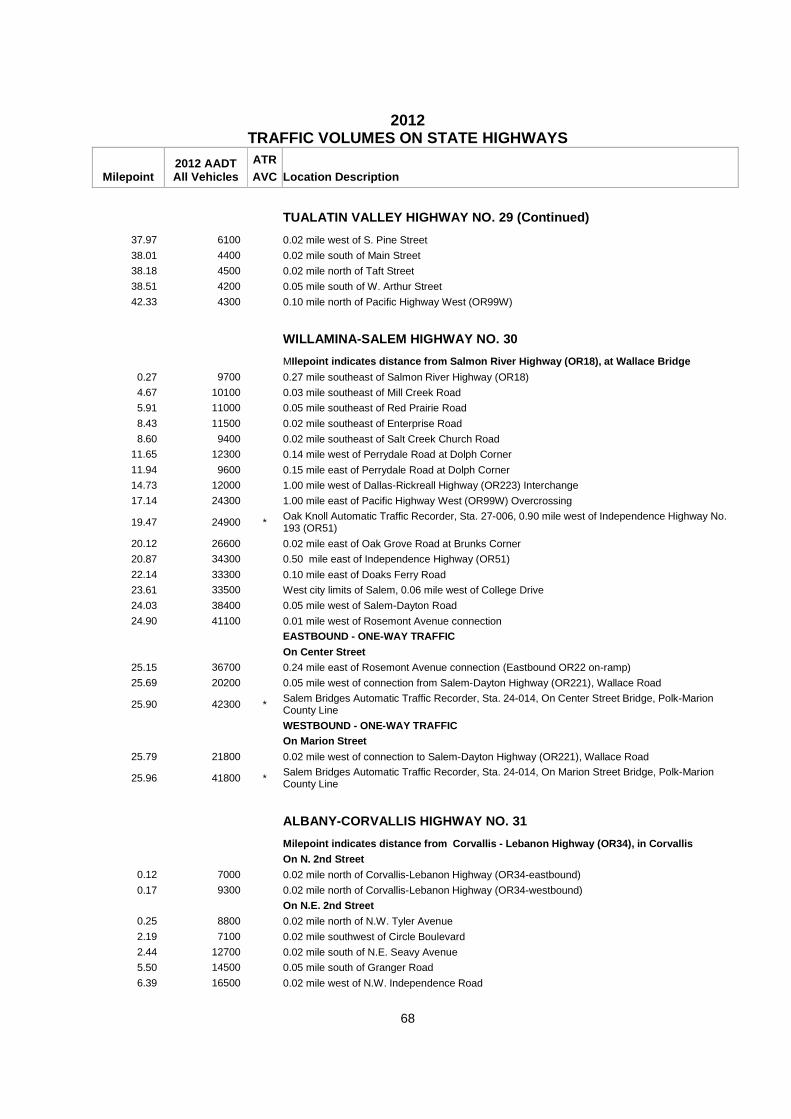
2012
TRAFFIC VOLUMES ON STATE HIGHWAYS
Milepoint 2012 AADT All Vehicles
ATR AVC Location Description
68
TUALATIN VALLEY HIGHWAY NO. 29 (Continued)
37.97 6100 0.02 mile west of S. Pine Street
38.01 4400 0.02 mile south of Main Street
38.18 4500 0.02 mile north of Taft Street
38.51 4200 0.05 mile south of W. Arthur Street
42.33 4300 0.10 mile north of Pacific Highway West (OR99W)
WILLAMINA-SALEM HIGHWAY NO. 30
MIlepoint indicates distance from Salmon River Highw ay (OR18), at Wallace Bridge
0.27 9700 0.27 mile southeast of Salmon River Highway (OR18)
4.67 10100 0.03 mile southeast of Mill Creek Road
5.91 11000 0.05 mile southeast of Red Prairie Road
8.43 11500 0.02 mile southeast of Enterprise Road
8.60 9400 0.02 mile southeast of Salt Creek Church Road
11.65 12300 0.14 mile west of Perrydale Road at Dolph Corner
11.94 9600 0.15 mile east of Perrydale Road at Dolph Corner
14.73 12000 1.00 mile west of Dallas-Rickreall Highway (OR223) Interchange
17.14 24300 1.00 mile east of Pacific Highway West (OR99W) Overcrossing
19.47 24900 * Oak Knoll Automatic Traffic Recorder, Sta. 27-006, 0.90 mile west of Independence Highway No. 193 (OR51)
20.12 26600 0.02 mile east of Oak Grove Road at Brunks Corner
20.87 34300 0.50 mile east of Independence Highway (OR51)
22.14 33300 0.10 mile east of Doaks Ferry Road
23.61 33500 West city limits of Salem, 0.06 mile west of College Drive
24.03 38400 0.05 mile west of Salem-Dayton Road
24.90 41100 0.01 mile west of Rosemont Avenue connection
EASTBOUND - ONE-WAY TRAFFIC
On Center Street
25.15 36700 0.24 mile east of Rosemont Avenue connection (Eastbound OR22 on-ramp)
25.69 20200 0.05 mile west of connection from Salem-Dayton Highway (OR221), Wallace Road
25.90 42300 * Salem Bridges Automatic Traffic Recorder, Sta. 24-014, On Center Street Bridge, Polk-Marion County Line
WESTBOUND - ONE-WAY TRAFFIC
On Marion Street
25.79 21800 0.02 mile west of connection to Salem-Dayton Highway (OR221), Wallace Road
25.96 41800 * Salem Bridges Automatic Traffic Recorder, Sta. 24-014, On Marion Street Bridge, Polk-Marion County Line
ALBANY-CORVALLIS HIGHWAY NO. 31
Milepoint indicates distance from Corvallis - Leba non Highway (OR34), in Corvallis
On N. 2nd Street
0.12 7000 0.02 mile north of Corvallis-Lebanon Highway (OR34-eastbound)
0.17 9300 0.02 mile north of Corvallis-Lebanon Highway (OR34-westbound)
On N.E. 2nd Street 0.25 8800 0.02 mile north of N.W. Tyler Avenue
2.19 7100 0.02 mile southwest of Circle Boulevard
2.44 12700 0.02 mile south of N.E. Seavy Avenue
5.50 14500 0.05 mile south of Granger Road
6.39 16500 0.02 mile west of N.W. Independence Road
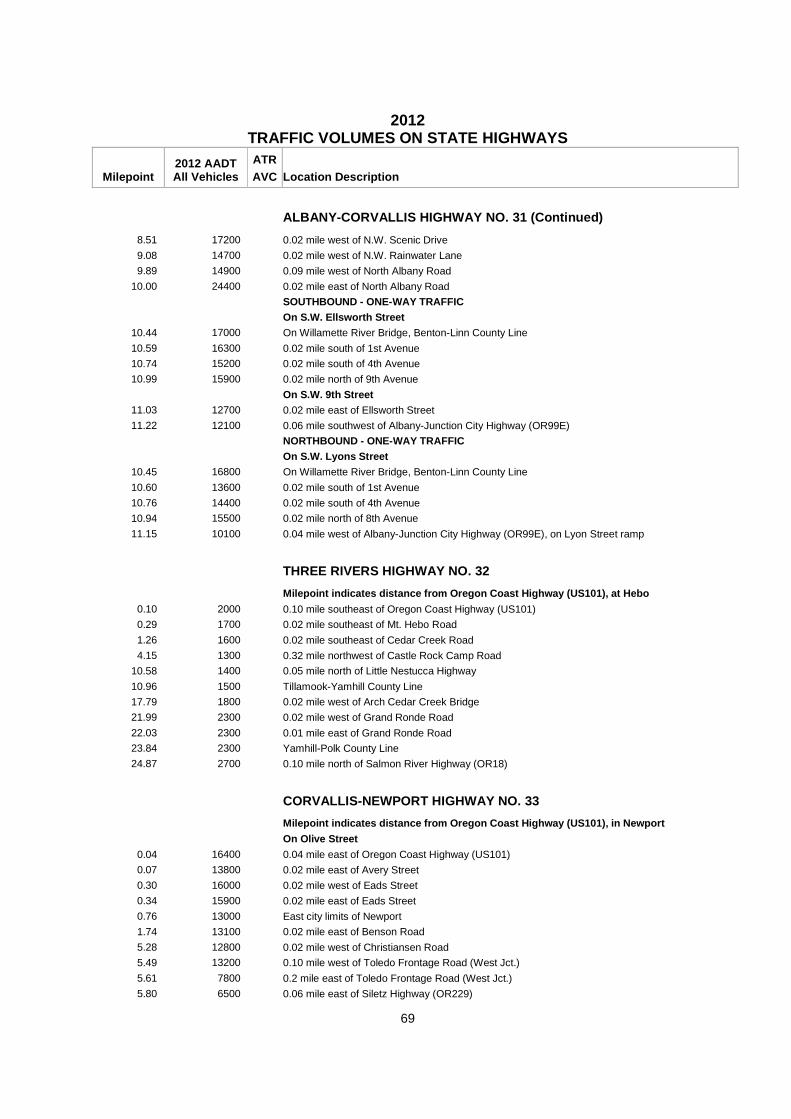
2012
TRAFFIC VOLUMES ON STATE HIGHWAYS
Milepoint 2012 AADT All Vehicles
ATR AVC Location Description
69
ALBANY-CORVALLIS HIGHWAY NO. 31 (Continued)
8.51 17200 0.02 mile west of N.W. Scenic Drive
9.08 14700 0.02 mile west of N.W. Rainwater Lane
9.89 14900 0.09 mile west of North Albany Road
10.00 24400 0.02 mile east of North Albany Road
SOUTHBOUND - ONE-WAY TRAFFIC
On S.W. Ellsworth Street
10.44 17000 On Willamette River Bridge, Benton-Linn County Line
10.59 16300 0.02 mile south of 1st Avenue
10.74 15200 0.02 mile south of 4th Avenue
10.99 15900 0.02 mile north of 9th Avenue
On S.W. 9th Street 11.03 12700 0.02 mile east of Ellsworth Street
11.22 12100 0.06 mile southwest of Albany-Junction City Highway (OR99E)
NORTHBOUND - ONE-WAY TRAFFIC
On S.W. Lyons Street
10.45 16800 On Willamette River Bridge, Benton-Linn County Line
10.60 13600 0.02 mile south of 1st Avenue
10.76 14400 0.02 mile south of 4th Avenue
10.94 15500 0.02 mile north of 8th Avenue
11.15 10100 0.04 mile west of Albany-Junction City Highway (OR99E), on Lyon Street ramp
THREE RIVERS HIGHWAY NO. 32
Milepoint indicates distance from Oregon Coast High way (US101), at Hebo
0.10 2000 0.10 mile southeast of Oregon Coast Highway (US101)
0.29 1700 0.02 mile southeast of Mt. Hebo Road
1.26 1600 0.02 mile southeast of Cedar Creek Road
4.15 1300 0.32 mile northwest of Castle Rock Camp Road
10.58 1400 0.05 mile north of Little Nestucca Highway
10.96 1500 Tillamook-Yamhill County Line
17.79 1800 0.02 mile west of Arch Cedar Creek Bridge
21.99 2300 0.02 mile west of Grand Ronde Road
22.03 2300 0.01 mile east of Grand Ronde Road
23.84 2300 Yamhill-Polk County Line
24.87 2700 0.10 mile north of Salmon River Highway (OR18)
CORVALLIS-NEWPORT HIGHWAY NO. 33
Milepoint indicates distance from Oregon Coast High way (US101), in Newport
On Olive Street
0.04 16400 0.04 mile east of Oregon Coast Highway (US101)
0.07 13800 0.02 mile east of Avery Street
0.30 16000 0.02 mile west of Eads Street
0.34 15900 0.02 mile east of Eads Street
0.76 13000 East city limits of Newport
1.74 13100 0.02 mile east of Benson Road
5.28 12800 0.02 mile west of Christiansen Road
5.49 13200 0.10 mile west of Toledo Frontage Road (West Jct.)
5.61 7800 0.2 mile east of Toledo Frontage Road (West Jct.)
5.80 6500 0.06 mile east of Siletz Highway (OR229)
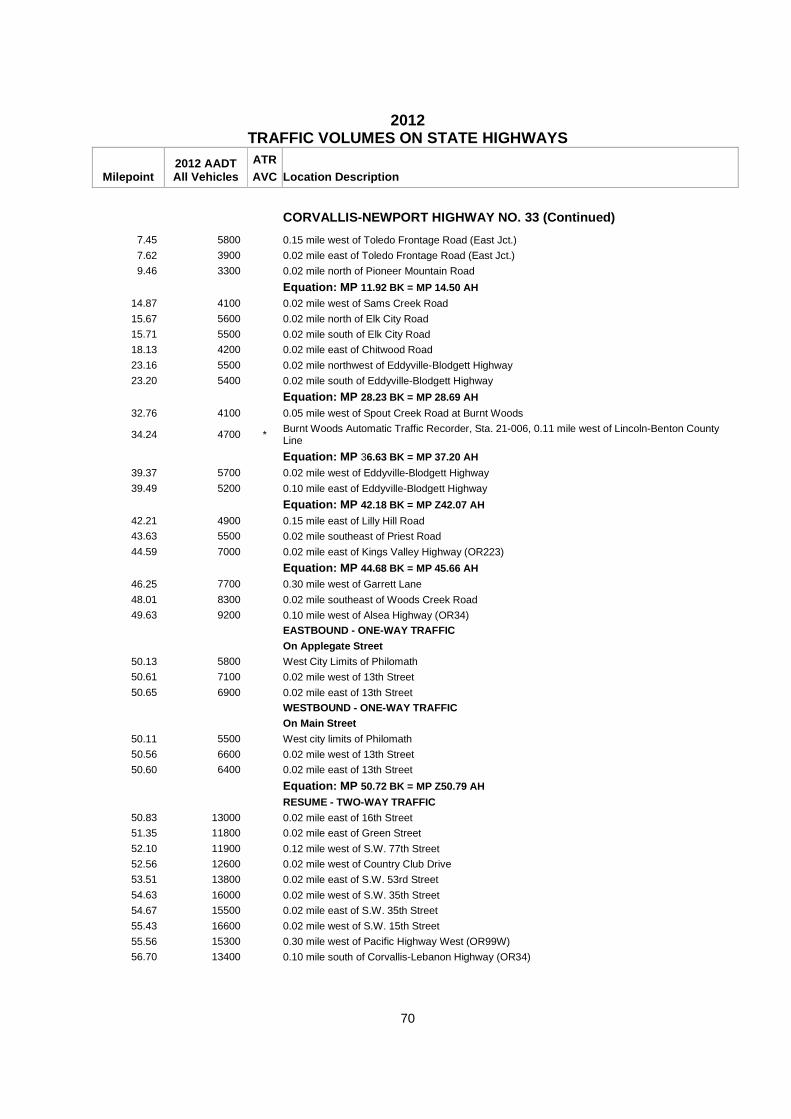
2012
TRAFFIC VOLUMES ON STATE HIGHWAYS
Milepoint 2012 AADT All Vehicles
ATR AVC Location Description
70
CORVALLIS-NEWPORT HIGHWAY NO. 33 (Continued)
7.45 5800 0.15 mile west of Toledo Frontage Road (East Jct.)
7.62 3900 0.02 mile east of Toledo Frontage Road (East Jct.)
9.46 3300 0.02 mile north of Pioneer Mountain Road
Equation: MP 11.92 BK = MP 14.50 AH
14.87 4100 0.02 mile west of Sams Creek Road
15.67 5600 0.02 mile north of Elk City Road
15.71 5500 0.02 mile south of Elk City Road
18.13 4200 0.02 mile east of Chitwood Road
23.16 5500 0.02 mile northwest of Eddyville-Blodgett Highway
23.20 5400 0.02 mile south of Eddyville-Blodgett Highway
Equation: MP 28.23 BK = MP 28.69 AH
32.76 4100 0.05 mile west of Spout Creek Road at Burnt Woods
34.24 4700 * Burnt Woods Automatic Traffic Recorder, Sta. 21-006, 0.11 mile west of Lincoln-Benton County Line
Equation: MP 36.63 BK = MP 37.20 AH
39.37 5700 0.02 mile west of Eddyville-Blodgett Highway
39.49 5200 0.10 mile east of Eddyville-Blodgett Highway
Equation: MP 42.18 BK = MP Z42.07 AH
42.21 4900 0.15 mile east of Lilly Hill Road
43.63 5500 0.02 mile southeast of Priest Road
44.59 7000 0.02 mile east of Kings Valley Highway (OR223)
Equation: MP 44.68 BK = MP 45.66 AH
46.25 7700 0.30 mile west of Garrett Lane
48.01 8300 0.02 mile southeast of Woods Creek Road
49.63 9200 0.10 mile west of Alsea Highway (OR34)
EASTBOUND - ONE-WAY TRAFFIC
On Applegate Street
50.13 5800 West City Limits of Philomath
50.61 7100 0.02 mile west of 13th Street
50.65 6900 0.02 mile east of 13th Street
WESTBOUND - ONE-WAY TRAFFIC
On Main Street
50.11 5500 West city limits of Philomath
50.56 6600 0.02 mile west of 13th Street
50.60 6400 0.02 mile east of 13th Street
Equation: MP 50.72 BK = MP Z50.79 AH
RESUME - TWO-WAY TRAFFIC
50.83 13000 0.02 mile east of 16th Street
51.35 11800 0.02 mile east of Green Street
52.10 11900 0.12 mile west of S.W. 77th Street
52.56 12600 0.02 mile west of Country Club Drive
53.51 13800 0.02 mile east of S.W. 53rd Street
54.63 16000 0.02 mile west of S.W. 35th Street
54.67 15500 0.02 mile east of S.W. 35th Street
55.43 16600 0.02 mile west of S.W. 15th Street
55.56 15300 0.30 mile west of Pacific Highway West (OR99W)
56.70 13400 0.10 mile south of Corvallis-Lebanon Highway (OR34)

2012
TRAFFIC VOLUMES ON STATE HIGHWAYS
Milepoint 2012 AADT All Vehicles
ATR AVC Location Description
71
COOS BAY-ROSEBURG HIGHWAY NO. 35
Milepoint indicates distance from Oregon Coast Hig hway (US101), near Davis Slough
0.70 7800 0.70 mile south of Oregon Coast Highway (US101)
4.14 7300 Southern Pacific Overcrossing at Delmar
6.66 6900 0.10 mile north of North Bank Lane
9.56 8000 0.05 mile northwest of Cedar Point Road
9.85 8600 0.12 mile west of W. Central Boulevard
10.15 7300 0.18 mile southeast of W. Central Boulevard
10.87 8700 0.02 mile east of Coquille-Bandon Highway (OR42S)
11.31 7700 0.02 mile south of N. Adams Street
Equation: MP 11.42 BK = MP 12.13 AH
12.80 7200 South city limits of Coquille
13.20 6500 0.02 mile north of Rink Creek Lane
13.24 6200 0.02 mile south of Rink Creek Lane
15.27 5600 0.09 mile south of Finley Loop (South Jct.)
17.35 5500 0.27 mile north of road to Norway Cemetery
17.85 5500 0.23 mile south of road to Norway Cemetery
19.30 5800 0.02 mile north of North Fork Lane
19.65 5800 0.02 mile north of Robison Lane
20.01 5500 North city limits of Myrtle Point
20.56 5900 0.02 mile north of Spruce Street
20.60 6300 0.02 mile south of Spruce Street
20.65 6300 0.02 mile south of Maple Street
20.82 5400 0.02 mile south of Harris Street
21.12 5000 0.02 mile south of Maryland Avenue
21.81 3900 0.02 mile north of Carlisle Lane
23.03 3700 0.40 mile west of Powers Highway
23.83 3000 0.40 mile east of Powers Highway
26.72 2700 On Endicott Creek Bridge
29.13 2700 0.02 mile west of King Creek Road
30.48 2600 0.02 mile west of Myrtle Creek Road
Equation: MP 39.04 BK = MP 40.53 AH
37.29 2300 0.02 mile east of Sandy Creek Road
44.95 2200 Coos-Douglas County Line
52.39 2400 0.02 mile west of Westside Road
54.82 2800 0.12 mile southwest of E. Camas Road
55.02 3000 0.08 mile northeast of E. Camas Road
Equation: MP 60.14 BK = MP 61.72 AH
63.67 3200 0.07 mile southwest of Benedict Road
64.18 3500 0.02 mile southwest of Reston Road
65.66 3600 On Porter Creek Bridge
66.37 4500 0.02 mile east of Tenmile Valley Road
70.51 5200 * Brockway Automatic Traffic Recorder, Sta. 10-006, 1.22 miles west of Brockway Road
71.90 4500 West city limits of Winston
73.06 7400 0.02 mile west of Civil Bend Avenue
73.10 7700 0.02 mile east of Civil Bend Avenue
73.27 8700 0.10 mile west of Main Street (OR99)

2012
TRAFFIC VOLUMES ON STATE HIGHWAYS
Milepoint 2012 AADT All Vehicles
ATR AVC Location Description
72
COOS BAY-ROSEBURG HIGHWAY NO. 35 (Continued)
73.42 12000 0.05 mile north of Main Street (OR99)
73.74 12200 0.02 mile south of Brosi Orchard Road
73.86 12000 0.02 mile south of Safari Road
74.41 14100 0.06 mile south of Umpqua River
75.70 16600 0.02 mile southwest of Southwest Carnes Road (Kelley's Corner)
76.05 17000 0.02 mile southwest of Winery Lane
76.40 18000 0.25 mile southwest of Pacific Highway (I-5)
PENDLETON-COLD SPRINGS HIGHWAY NO. 36
Milepoint indicates distance from Cold Springs
0.74 40 At Columbia River Highway Undercrossing
0.94 610 0.20 mile south of Columbia River Highway (US395 and US730)
Equation: MP 6.59 BK = MP 6.90 AH
8.83 380 0.02 mile west of South Cold Springs Road
13.23 260 0.02 mile west of Holdman Road at Holdman
18.84 200 0.11 mile west of Eggers Road
20.08 210 0.05 mile west of Athena-Holdman Highway
20.27 350 0.14 mile south of Athena-Holdman Highway
23.37 530 0.02 mile south of South Cold Springs Road
26.11 680 0.10 mile south of Despain Gulch Road
North city limits of Pendleton
30.66 1600 0.02 mile north of N.W. Carden Avenue
30.73 4700 0.02 mile north of Pendleton Highway (US30)
WILSON RIVER HIGHWAY NO. 37
Milepoint indicates distance from Oregon Coast High way (US101), in Tillamook
EASTBOUND - ONE-WAY TRAFFIC
On 3rd Street
0.01 6100 0.01 mile east of Oregon Coast Highway (US101-Southbound)
0.05 6000 0.02 mile east of Oregon Coast Highway (US101-Northbound)
0.16 5400 0.02 mile east of Madrona Avenue
0.24 2300 0.02 mile east of Ocean Place
WESTBOUND - ONE-WAY TRAFFIC
On 1st Street
0.02 5500 0.02 mile east of Oregon Coast Highway (US101-Northbound)
0.13 4800 0.02 mile east of Madrona Avenue
0.20 3900 0.01 mile east of Ocean Place
RESUME TWO-WAY TRAFFIC
0.48 4900 East city limits of Tillamook
1.91 6200 0.11 mile east of Wilson River Loop
2.51 4000 0.02 mile west of Olson Road
2.55 5200 0.02 mile east of Olson Road
4.20 4600 0.02 mile west of Fairview Road
4.24 3400 0.02 mile east of Fairview Road
Equation: MP 4.63 BK = MP 5.00 AH
5.71 4200 0.02 mile east of Mills Bridge Road

2012
TRAFFIC VOLUMES ON STATE HIGHWAYS
Milepoint 2012 AADT All Vehicles
ATR AVC Location Description
73
WILSON RIVER HIGHWAY NO. 37 (Continued)
10.79 3900 0.02 mile west of Kansas Creek Road
10.86 3900 0.05 mile east of Kansas Creek Road
22.63 3800 0.02 mile west of Northfork Road
32.88 4000 Tillamook-Washington County Line
38.55 4600 * Gales Creek Automatic Traffic Recorder, Sta. 34-004, 0.75 mile west of Glenwood Lane
39.05 4500 0.10 mile east of Timber Road
42.13 4800 0.15 mile northwest of Gales Creek Road
42.38 4200 0.10 mile east of Gales Creek Road
43.34 4200 0.10 mile northeast of Parson Road
48.59 4700 0.50 mile west of Nehalem Highway (OR47)
49.59 8300 0.50 mile east of Nehalem Highway (OR47)
51.12 8500 0.50 mile west of Sunset Highway (US26)
OREGON CAVES HIGHWAY NO. 38
Milepoint indicates distance from Redwood Highway (US199), in Cave Junction
0.11 4300 0.02 mile east of Caves Avenue
0.29 4300 0.06 mile west of Old Stage Road
0.37 3600 0.02 mile east of Old Stage Road
0.51 3200 0.10 mile east of Frederick Court
1.74 3100 0.02 mile west of Holland Loop Road (West Jct.)
2.41 1400 0.02 mile west of White School House Road
3.15 1100 0.02 mile west of Smith Sawyer Road
3.75 890 0.02 mile east of White School House Road
6.15 670 0.03 mile west of Holland Loop Road (East Jct.)
6.53 490 On Arch Bear Creek Bridge
11.02 270 0.43 mile west of Grayback Forest Camp Road
11.97 220 0.20 mile east of French Peak Road
19.09 220 0.10 mile west of Oregon Caves National Monument
SALMON RIVER HIGHWAY NO. 39
Milepoint indicates distance from Oregon Coast High way (US101), near Otis Jct.
0.40 9800 0.40 mile east of Oregon Coast Highway (US101)
1.36 9800 0.05 mile east of Old Scenic Hwy 101 (North Bank Road)
3.96 9300 On Bear Creek Bridge
5.28 7500 0.02 mile west of North Bank Road at Rose Lodge
5.32 9100 0.02 mile east of North Bank Road at Rose Lodge
10.26 6400 Lincoln-Tillamook County Line
14.90 6700 Tillamook-Polk County Line
20.65 7300 0.02 mile west of Fire Hall Road
21.16 7900 0.02 mile west of Grand Ronde Road
21.20 10700 0.02 mile east of Grand Ronde Road
22.96 15200 0.10 mile west of Three Rivers Highway (OR22)
23.23 17200 * Valley Jct. Automatic Traffic Recorder, Sta. 27-001, 0.19 mile east of Three Rivers Highway No. 32 (OR22)
23.97 16800 0.70 mile west of Fort Hill Frontage Road Overcrossing
26.67 14500 0.10 mile west of Willamina-Sheridan Highway (OR18 Bus.)
27.91 6700 0.03 mile east of connection to Willamina-Salem Highway (OR22)
29.76 6800 Polk-Yamhill County Line

2012
TRAFFIC VOLUMES ON STATE HIGHWAYS
Milepoint 2012 AADT All Vehicles
ATR AVC Location Description
74
SALMON RIVER HIGHWAY NO. 39 (Continued)
30.65 7000 0.02 mile east of Harmony Road
32.30 7300 0.30 mile west of Sheridan Interchange (Ballston Road)
32.90 7300 0.30 mile east of Sheridan Interchange (Ballston Road)
34.01 8100 0.10 mile west of Willamina-Sheridan Highway (OR18 Bus.)
34.21 12700 0.10 mile east of Willamina-Sheridan Highway (OR18 Bus.)
36.91 13400 0.02 mile west of Bellevue-Hopewell Highway
36.95 13300 0.02 mile east of Bellevue-Hopewell Highway
41.00 12900 * Salmon River Automatic Traffic Recorder, Sta. 36-006, 3.36 miles south of Pacific Highway West No. 91 (OR99W)
43.04 14400 0.02 mile northeast of Durham Lane
43.76 14400 0.60 mile west of Undercrossing Pacific Highway West (OR99W)
44.71 14200 0.35 mile east of Pacific Highway West (OR99W)
46.79 21400 0.10 mile east of Norton Lane
48.58 19300 0.05 mile west of Cruickshank Road
48.61 15100 0.02 mile east of Cruickshank Road
49.96 14900 0.05 mile east of Lafayette Highway (OR233)
51.03 14300 0.20 mile west of Salem-Dayton Highway (OR221)
52.56 13600 0.15 mile southwest of Pacific Highway West (OR99W)
BEAVERTON-HILLSDALE HIGHWAY NO. 40
Milepoint indicates distance from Tualatin Valley Highway (OR8), in Beaverton
1.09 33700 0.05 mile west of S.W. 110th Avenue
1.45 31000 0.05 mile west of S.W. Western Avenue
1.55 30400 0.05 mile east of S.W. Western Avenue
1.88 29900 0.02 mile west of S.W. Jamieson Road
2.03 27400 0.04 mile west of S.W. 91st Avenue
2.54 26100 0.02 mile west of S.W. Laurelwood Avenue
2.58 27000 0.02 mile east of S.W. Laurelwood Avenue
3.08 27800 0.05 mile west of Scholls Ferry Road (OR210)
3.39 26400 0.02 mile west of west city limits of Portland, Washington-Multnomah County Line
Transferred to the City of Portland, MP 3.41 to MP 6.87
OCHOCO HIGHWAY NO. 41
Milepoint indicates distance from The Dalles - Cal ifornia Highway (US97), in Redmond
On Evergreen Avenue 0.40 6400 0.02 mile east of S. Franklin Street
0.51 5800 0.01 mile east of S. Jackson Street
0.91 5200 0.07 mile southeast of 9th Street on Ochoco Way
2.32 7400 East city limits of Redmond
3.23 7000 * Powell Butte Automatic Vehicle Classifier, Sta. 07-002, 0.35 mile west of Deschutes-Crook County Line
6.82 7200 0.02 mile west of Powell Butte Highway
6.86 9000 0.02 mile east of Powell Butte Highway
7.82 9000 0.02 mile west of S. Reif Road
7.86 8700 0.02 mile east of S. Reif Road
9.37 8100 0.02 mile east of Minson Road
15.82 9600 0.01 mile west of Tom McCall Road
15.86 10600 0.02 mile east of Tom McCall Road
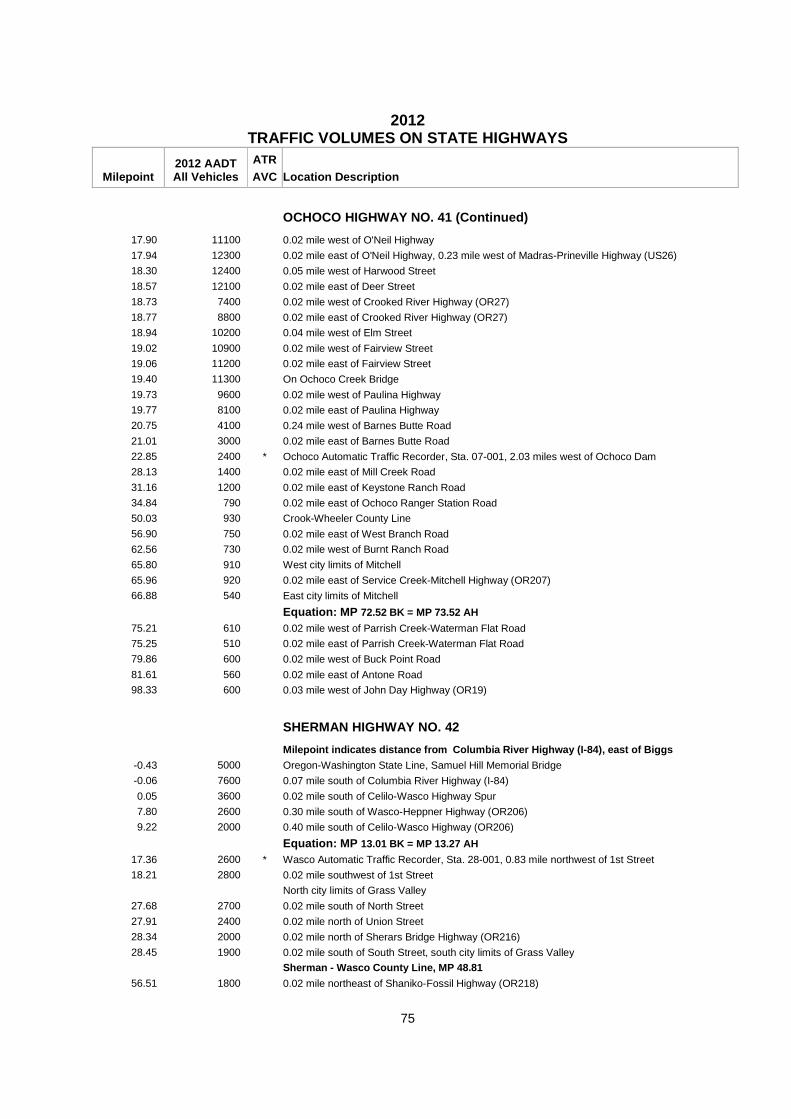
2012
TRAFFIC VOLUMES ON STATE HIGHWAYS
Milepoint 2012 AADT All Vehicles
ATR AVC Location Description
75
OCHOCO HIGHWAY NO. 41 (Continued)
17.90 11100 0.02 mile west of O'Neil Highway
17.94 12300 0.02 mile east of O'Neil Highway, 0.23 mile west of Madras-Prineville Highway (US26)
18.30 12400 0.05 mile west of Harwood Street
18.57 12100 0.02 mile east of Deer Street
18.73 7400 0.02 mile west of Crooked River Highway (OR27)
18.77 8800 0.02 mile east of Crooked River Highway (OR27)
18.94 10200 0.04 mile west of Elm Street
19.02 10900 0.02 mile west of Fairview Street
19.06 11200 0.02 mile east of Fairview Street
19.40 11300 On Ochoco Creek Bridge
19.73 9600 0.02 mile west of Paulina Highway
19.77 8100 0.02 mile east of Paulina Highway
20.75 4100 0.24 mile west of Barnes Butte Road
21.01 3000 0.02 mile east of Barnes Butte Road
22.85 2400 * Ochoco Automatic Traffic Recorder, Sta. 07-001, 2.03 miles west of Ochoco Dam
28.13 1400 0.02 mile east of Mill Creek Road
31.16 1200 0.02 mile east of Keystone Ranch Road
34.84 790 0.02 mile east of Ochoco Ranger Station Road
50.03 930 Crook-Wheeler County Line
56.90 750 0.02 mile east of West Branch Road
62.56 730 0.02 mile west of Burnt Ranch Road
65.80 910 West city limits of Mitchell
65.96 920 0.02 mile east of Service Creek-Mitchell Highway (OR207)
66.88 540 East city limits of Mitchell
Equation: MP 72.52 BK = MP 73.52 AH
75.21 610 0.02 mile west of Parrish Creek-Waterman Flat Road
75.25 510 0.02 mile east of Parrish Creek-Waterman Flat Road
79.86 600 0.02 mile west of Buck Point Road
81.61 560 0.02 mile east of Antone Road
98.33 600 0.03 mile west of John Day Highway (OR19)
SHERMAN HIGHWAY NO. 42
Milepoint indicates distance from Columbia River H ighway (I-84), east of Biggs
-0.43 5000 Oregon-Washington State Line, Samuel Hill Memorial Bridge
-0.06 7600 0.07 mile south of Columbia River Highway (I-84)
0.05 3600 0.02 mile south of Celilo-Wasco Highway Spur
7.80 2600 0.30 mile south of Wasco-Heppner Highway (OR206)
9.22 2000 0.40 mile south of Celilo-Wasco Highway (OR206)
Equation: MP 13.01 BK = MP 13.27 AH
17.36 2600 * Wasco Automatic Traffic Recorder, Sta. 28-001, 0.83 mile northwest of 1st Street
18.21 2800 0.02 mile southwest of 1st Street
North city limits of Grass Valley
27.68 2700 0.02 mile south of North Street
27.91 2400 0.02 mile north of Union Street
28.34 2000 0.02 mile north of Sherars Bridge Highway (OR216)
28.45 1900 0.02 mile south of South Street, south city limits of Grass Valley
Sherman - Wasco County Line, MP 48.81
56.51 1800 0.02 mile northeast of Shaniko-Fossil Highway (OR218)
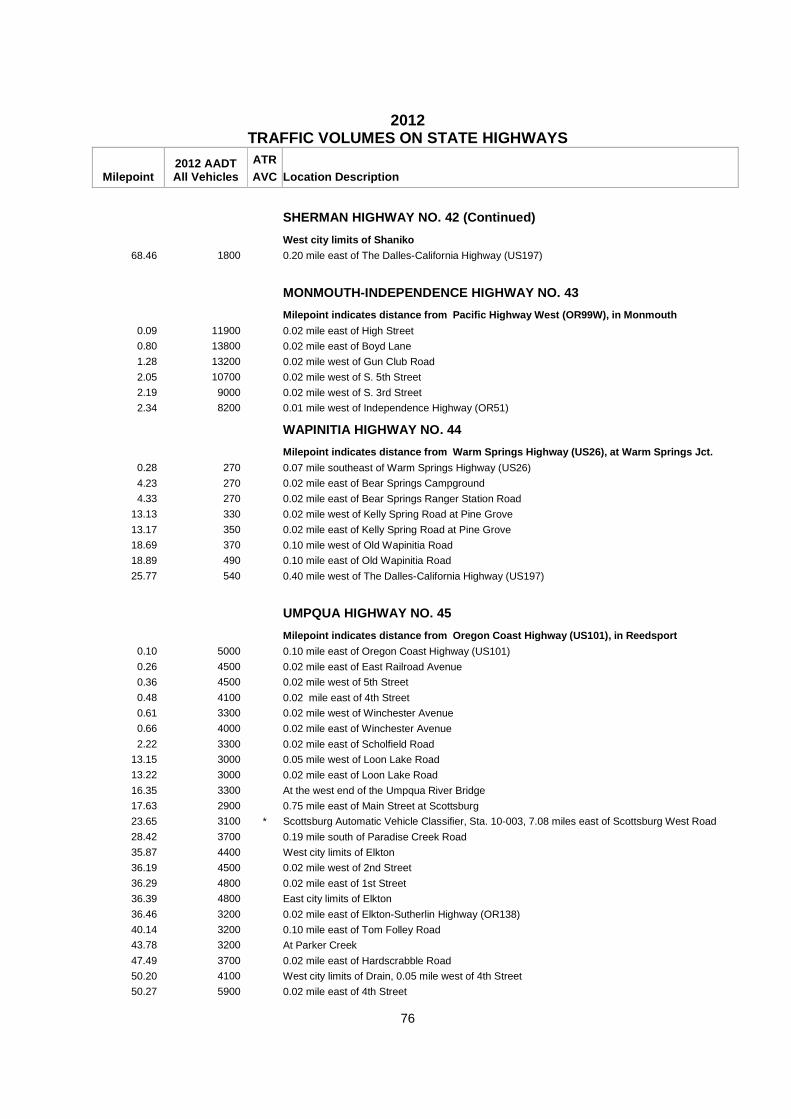
2012
TRAFFIC VOLUMES ON STATE HIGHWAYS
Milepoint 2012 AADT All Vehicles
ATR AVC Location Description
76
SHERMAN HIGHWAY NO. 42 (Continued)
West city limits of Shaniko
68.46 1800 0.20 mile east of The Dalles-California Highway (US197)
MONMOUTH-INDEPENDENCE HIGHWAY NO. 43
Milepoint indicates distance from Pacific Highway West (OR99W), in Monmouth
0.09 11900 0.02 mile east of High Street
0.80 13800 0.02 mile east of Boyd Lane
1.28 13200 0.02 mile west of Gun Club Road
2.05 10700 0.02 mile west of S. 5th Street
2.19 9000 0.02 mile west of S. 3rd Street
2.34 8200 0.01 mile west of Independence Highway (OR51)
WAPINITIA HIGHWAY NO. 44
Milepoint indicates distance from Warm Springs Hig hway (US26), at Warm Springs Jct.
0.28 270 0.07 mile southeast of Warm Springs Highway (US26)
4.23 270 0.02 mile east of Bear Springs Campground
4.33 270 0.02 mile east of Bear Springs Ranger Station Road
13.13 330 0.02 mile west of Kelly Spring Road at Pine Grove
13.17 350 0.02 mile east of Kelly Spring Road at Pine Grove
18.69 370 0.10 mile west of Old Wapinitia Road
18.89 490 0.10 mile east of Old Wapinitia Road
25.77 540 0.40 mile west of The Dalles-California Highway (US197)
UMPQUA HIGHWAY NO. 45
Milepoint indicates distance from Oregon Coast Hig hway (US101), in Reedsport
0.10 5000 0.10 mile east of Oregon Coast Highway (US101)
0.26 4500 0.02 mile east of East Railroad Avenue
0.36 4500 0.02 mile west of 5th Street
0.48 4100 0.02 mile east of 4th Street
0.61 3300 0.02 mile west of Winchester Avenue
0.66 4000 0.02 mile east of Winchester Avenue
2.22 3300 0.02 mile east of Scholfield Road
13.15 3000 0.05 mile west of Loon Lake Road
13.22 3000 0.02 mile east of Loon Lake Road
16.35 3300 At the west end of the Umpqua River Bridge
17.63 2900 0.75 mile east of Main Street at Scottsburg
23.65 3100 * Scottsburg Automatic Vehicle Classifier, Sta. 10-003, 7.08 miles east of Scottsburg West Road
28.42 3700 0.19 mile south of Paradise Creek Road
35.87 4400 West city limits of Elkton
36.19 4500 0.02 mile west of 2nd Street
36.29 4800 0.02 mile east of 1st Street
36.39 4800 East city limits of Elkton
36.46 3200 0.02 mile east of Elkton-Sutherlin Highway (OR138)
40.14 3200 0.10 mile east of Tom Folley Road
43.78 3200 At Parker Creek
47.49 3700 0.02 mile east of Hardscrabble Road
50.20 4100 West city limits of Drain, 0.05 mile west of 4th Street
50.27 5900 0.02 mile east of 4th Street

2012
TRAFFIC VOLUMES ON STATE HIGHWAYS
Milepoint 2012 AADT All Vehicles
ATR AVC Location Description
77
UMPQUA HIGHWAY NO. 45 (Continued)
50.38 5600 0.02 mile west of 1st Street
50.42 5800 0.02 mile north of "B" Avenue
50.46 5400 0.02 mile north of "C" Avenue
50.56 5300 0.02 mile north of "E" Avenue
51.20 4900 North city limits of Drain
52.41 4800 0.02 mile south of Upper Smith River Road
52.45 5100 0.02 mile north of Upper Smith River Road
56.35 4700 0.02 mile west of Curtin Road
56.78 4800 0.35 mile west of Pacific Highway (I-5)
NECANICUM HIGHWAY NO. 46
Milepoint indicates distance from Sunset Highway ( US26), at Necanicum Jct.
0.14 630 0.10 mile south of Sunset Highway (US26)
0.82 430 0.10 mile south of Hamlet Road
7.71 350 On North Fork Nehalem River Bridge
11.38 510 Clatsop-Tillamook County Line
12.71 540 0.10 mile north of North Fork Road (south junction)
12.91 490 0.10 mile south of North Fork Road (south junction)
13.52 500 0.02 mile south of God's Valley Road
16.18 730 0.11 mile north of McDonald Road
16.69 760 0.40 mile south of McDonald Road
16.84 800 0.02 mile south of McKimmens Road
18.93 1500 0.10 mile north of Oregon Coast Highway (US101)
SUNSET HIGHWAY NO. 47
Milepoint indicates distance from Oregon Coast High way (US101), north of Cannon Beach
0.60 6900 0.70 mile east of Oregon Coast Highway (US101)
4.40 7500 On Necanicum River, Black Bridge
9.47 6400 0.05 mile east of Necanicum Highway (OR53)
10.19 5900 0.02 mile east of Saddle Mountain Road
21.81 6500 0.05 mile west of Fishhawk Falls Highway
30.75 6100 Clatsop-Tillamook County Line
34.16 7000 Tillamook-Washington County Line
37.67 6500 * Timber Jct. Automatic Traffic Recorder, Sta. 34-005, 0.03 mile west of Vernonia Road
40.74 7800 0.10 mile west of the Sunset Tunnel
45.32 6600 0.09 mile west of Nehalem Highway (OR47), Staleys Jct.
45.72 9500 0.05 mile west of Fisher/Buxton Road
47.54 11100 0.05 mile east of Hayward Road
49.51 10500 0.20 mile east of Nehalem Highway (OR47), Davies Jct.
52.83 10600 0.50 mile west of Wilson River Highway (OR6)
53.73 19000 0.40 mile east of Wilson River Highway (OR6)
56.23 20100 * North Plains Automatic Vehicle Classifier, Sta. 34-007, 0.93 mile northwest of North Plains (Glencoe Road) Interchange
57.46 30400 0.30 mile east of North Plains (Glencoe Road) Interchange
59.24 39100 0.50 mile east of Jackson Road Interchange
62.07 54000 0.39 mile west of Cornelius Pass Interchange
63.89 73200 0.40 mile west of N.W. 185th Avenue Interchange
65.30 93800 0.61 mile west of Cornell Road Interchange
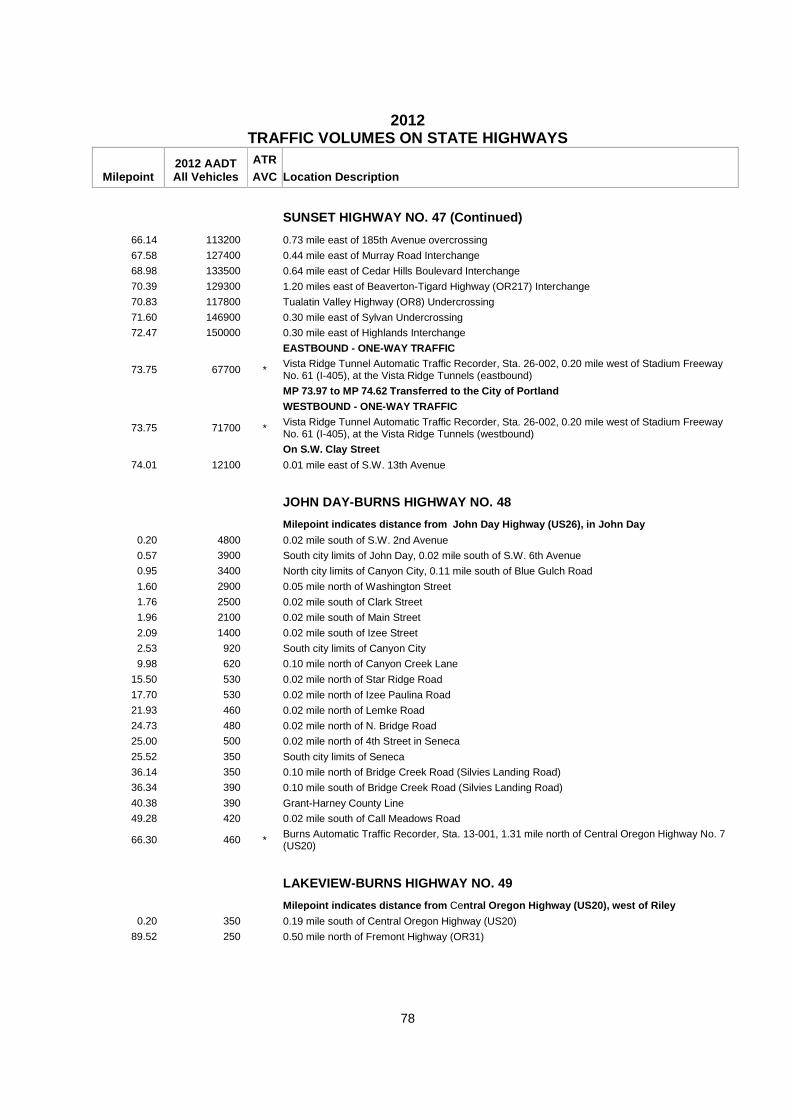
2012
TRAFFIC VOLUMES ON STATE HIGHWAYS
Milepoint 2012 AADT All Vehicles
ATR AVC Location Description
78
SUNSET HIGHWAY NO. 47 (Continued)
66.14 113200 0.73 mile east of 185th Avenue overcrossing
67.58 127400 0.44 mile east of Murray Road Interchange
68.98 133500 0.64 mile east of Cedar Hills Boulevard Interchange
70.39 129300 1.20 miles east of Beaverton-Tigard Highway (OR217) Interchange
70.83 117800 Tualatin Valley Highway (OR8) Undercrossing
71.60 146900 0.30 mile east of Sylvan Undercrossing
72.47 150000 0.30 mile east of Highlands Interchange
EASTBOUND - ONE-WAY TRAFFIC
73.75 67700 * Vista Ridge Tunnel Automatic Traffic Recorder, Sta. 26-002, 0.20 mile west of Stadium Freeway No. 61 (I-405), at the Vista Ridge Tunnels (eastbound)
MP 73.97 to MP 74.62 Transferred to the City of Por tland
WESTBOUND - ONE-WAY TRAFFIC
73.75 71700 * Vista Ridge Tunnel Automatic Traffic Recorder, Sta. 26-002, 0.20 mile west of Stadium Freeway No. 61 (I-405), at the Vista Ridge Tunnels (westbound)
On S.W. Clay Street
74.01 12100 0.01 mile east of S.W. 13th Avenue
JOHN DAY-BURNS HIGHWAY NO. 48
Milepoint indicates distance from John Day Highway (US26), in John Day
0.20 4800 0.02 mile south of S.W. 2nd Avenue
0.57 3900 South city limits of John Day, 0.02 mile south of S.W. 6th Avenue
0.95 3400 North city limits of Canyon City, 0.11 mile south of Blue Gulch Road
1.60 2900 0.05 mile north of Washington Street
1.76 2500 0.02 mile south of Clark Street
1.96 2100 0.02 mile south of Main Street
2.09 1400 0.02 mile south of Izee Street
2.53 920 South city limits of Canyon City
9.98 620 0.10 mile north of Canyon Creek Lane
15.50 530 0.02 mile north of Star Ridge Road
17.70 530 0.02 mile north of Izee Paulina Road
21.93 460 0.02 mile north of Lemke Road
24.73 480 0.02 mile north of N. Bridge Road
25.00 500 0.02 mile north of 4th Street in Seneca
25.52 350 South city limits of Seneca
36.14 350 0.10 mile north of Bridge Creek Road (Silvies Landing Road)
36.34 390 0.10 mile south of Bridge Creek Road (Silvies Landing Road)
40.38 390 Grant-Harney County Line
49.28 420 0.02 mile south of Call Meadows Road
66.30 460 * Burns Automatic Traffic Recorder, Sta. 13-001, 1.31 mile north of Central Oregon Highway No. 7 (US20)
LAKEVIEW-BURNS HIGHWAY NO. 49
Milepoint indicates distance from Central Oregon Highway (US20), west of Riley
0.20 350 0.19 mile south of Central Oregon Highway (US20)
89.52 250 0.50 mile north of Fremont Highway (OR31)
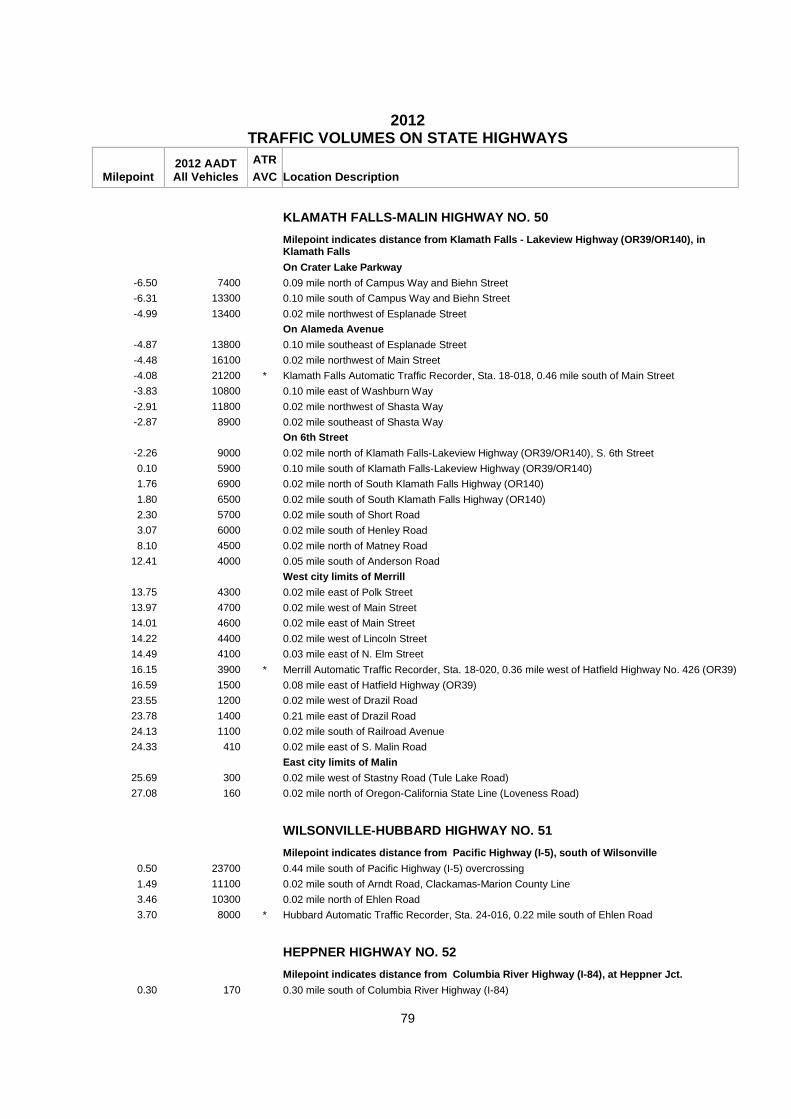
2012
TRAFFIC VOLUMES ON STATE HIGHWAYS
Milepoint 2012 AADT All Vehicles
ATR AVC Location Description
79
KLAMATH FALLS-MALIN HIGHWAY NO. 50
Milepoint indicates distance from Klamath Falls - L akeview Highway (OR39/OR140), in Klamath Falls
On Crater Lake Parkway
-6.50 7400 0.09 mile north of Campus Way and Biehn Street
-6.31 13300 0.10 mile south of Campus Way and Biehn Street
-4.99 13400 0.02 mile northwest of Esplanade Street
On Alameda Avenue
-4.87 13800 0.10 mile southeast of Esplanade Street
-4.48 16100 0.02 mile northwest of Main Street
-4.08 21200 * Klamath Falls Automatic Traffic Recorder, Sta. 18-018, 0.46 mile south of Main Street
-3.83 10800 0.10 mile east of Washburn Way
-2.91 11800 0.02 mile northwest of Shasta Way
-2.87 8900 0.02 mile southeast of Shasta Way
On 6th Street
-2.26 9000 0.02 mile north of Klamath Falls-Lakeview Highway (OR39/OR140), S. 6th Street
0.10 5900 0.10 mile south of Klamath Falls-Lakeview Highway (OR39/OR140)
1.76 6900 0.02 mile north of South Klamath Falls Highway (OR140)
1.80 6500 0.02 mile south of South Klamath Falls Highway (OR140)
2.30 5700 0.02 mile south of Short Road
3.07 6000 0.02 mile south of Henley Road
8.10 4500 0.02 mile north of Matney Road
12.41 4000 0.05 mile south of Anderson Road
West city limits of Merrill 13.75 4300 0.02 mile east of Polk Street
13.97 4700 0.02 mile west of Main Street
14.01 4600 0.02 mile east of Main Street
14.22 4400 0.02 mile west of Lincoln Street
14.49 4100 0.03 mile east of N. Elm Street
16.15 3900 * Merrill Automatic Traffic Recorder, Sta. 18-020, 0.36 mile west of Hatfield Highway No. 426 (OR39)
16.59 1500 0.08 mile east of Hatfield Highway (OR39)
23.55 1200 0.02 mile west of Drazil Road
23.78 1400 0.21 mile east of Drazil Road
24.13 1100 0.02 mile south of Railroad Avenue
24.33 410 0.02 mile east of S. Malin Road
East city limits of Malin
25.69 300 0.02 mile west of Stastny Road (Tule Lake Road)
27.08 160 0.02 mile north of Oregon-California State Line (Loveness Road)
WILSONVILLE-HUBBARD HIGHWAY NO. 51
Milepoint indicates distance from Pacific Highway (I-5), south of Wilsonville
0.50 23700 0.44 mile south of Pacific Highway (I-5) overcrossing
1.49 11100 0.02 mile south of Arndt Road, Clackamas-Marion County Line
3.46 10300 0.02 mile north of Ehlen Road
3.70 8000 * Hubbard Automatic Traffic Recorder, Sta. 24-016, 0.22 mile south of Ehlen Road
HEPPNER HIGHWAY NO. 52
Milepoint indicates distance from Columbia River H ighway (I-84), at Heppner Jct.
0.30 170 0.30 mile south of Columbia River Highway (I-84)
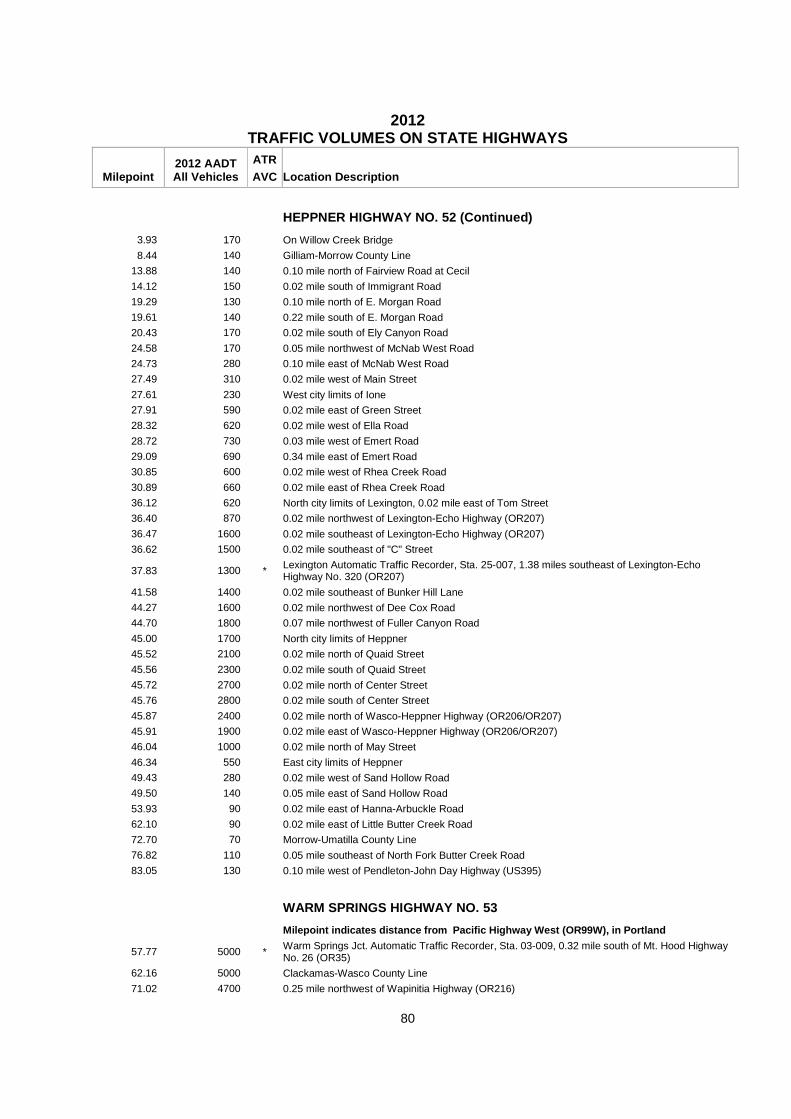
2012
TRAFFIC VOLUMES ON STATE HIGHWAYS
Milepoint 2012 AADT All Vehicles
ATR AVC Location Description
80
HEPPNER HIGHWAY NO. 52 (Continued)
3.93 170 On Willow Creek Bridge
8.44 140 Gilliam-Morrow County Line
13.88 140 0.10 mile north of Fairview Road at Cecil
14.12 150 0.02 mile south of Immigrant Road
19.29 130 0.10 mile north of E. Morgan Road
19.61 140 0.22 mile south of E. Morgan Road
20.43 170 0.02 mile south of Ely Canyon Road
24.58 170 0.05 mile northwest of McNab West Road
24.73 280 0.10 mile east of McNab West Road
27.49 310 0.02 mile west of Main Street
27.61 230 West city limits of Ione
27.91 590 0.02 mile east of Green Street
28.32 620 0.02 mile west of Ella Road
28.72 730 0.03 mile west of Emert Road
29.09 690 0.34 mile east of Emert Road
30.85 600 0.02 mile west of Rhea Creek Road
30.89 660 0.02 mile east of Rhea Creek Road
36.12 620 North city limits of Lexington, 0.02 mile east of Tom Street
36.40 870 0.02 mile northwest of Lexington-Echo Highway (OR207)
36.47 1600 0.02 mile southeast of Lexington-Echo Highway (OR207)
36.62 1500 0.02 mile southeast of "C" Street
37.83 1300 * Lexington Automatic Traffic Recorder, Sta. 25-007, 1.38 miles southeast of Lexington-Echo Highway No. 320 (OR207)
41.58 1400 0.02 mile southeast of Bunker Hill Lane
44.27 1600 0.02 mile northwest of Dee Cox Road
44.70 1800 0.07 mile northwest of Fuller Canyon Road
45.00 1700 North city limits of Heppner
45.52 2100 0.02 mile north of Quaid Street
45.56 2300 0.02 mile south of Quaid Street
45.72 2700 0.02 mile north of Center Street
45.76 2800 0.02 mile south of Center Street
45.87 2400 0.02 mile north of Wasco-Heppner Highway (OR206/OR207)
45.91 1900 0.02 mile east of Wasco-Heppner Highway (OR206/OR207)
46.04 1000 0.02 mile north of May Street
46.34 550 East city limits of Heppner
49.43 280 0.02 mile west of Sand Hollow Road
49.50 140 0.05 mile east of Sand Hollow Road
53.93 90 0.02 mile east of Hanna-Arbuckle Road
62.10 90 0.02 mile east of Little Butter Creek Road
72.70 70 Morrow-Umatilla County Line
76.82 110 0.05 mile southeast of North Fork Butter Creek Road
83.05 130 0.10 mile west of Pendleton-John Day Highway (US395)
WARM SPRINGS HIGHWAY NO. 53
Milepoint indicates distance from Pacific Highway West (OR99W), in Portland
57.77 5000 * Warm Springs Jct. Automatic Traffic Recorder, Sta. 03-009, 0.32 mile south of Mt. Hood Highway No. 26 (OR35)
62.16 5000 Clackamas-Wasco County Line
71.02 4700 0.25 mile northwest of Wapinitia Highway (OR216)
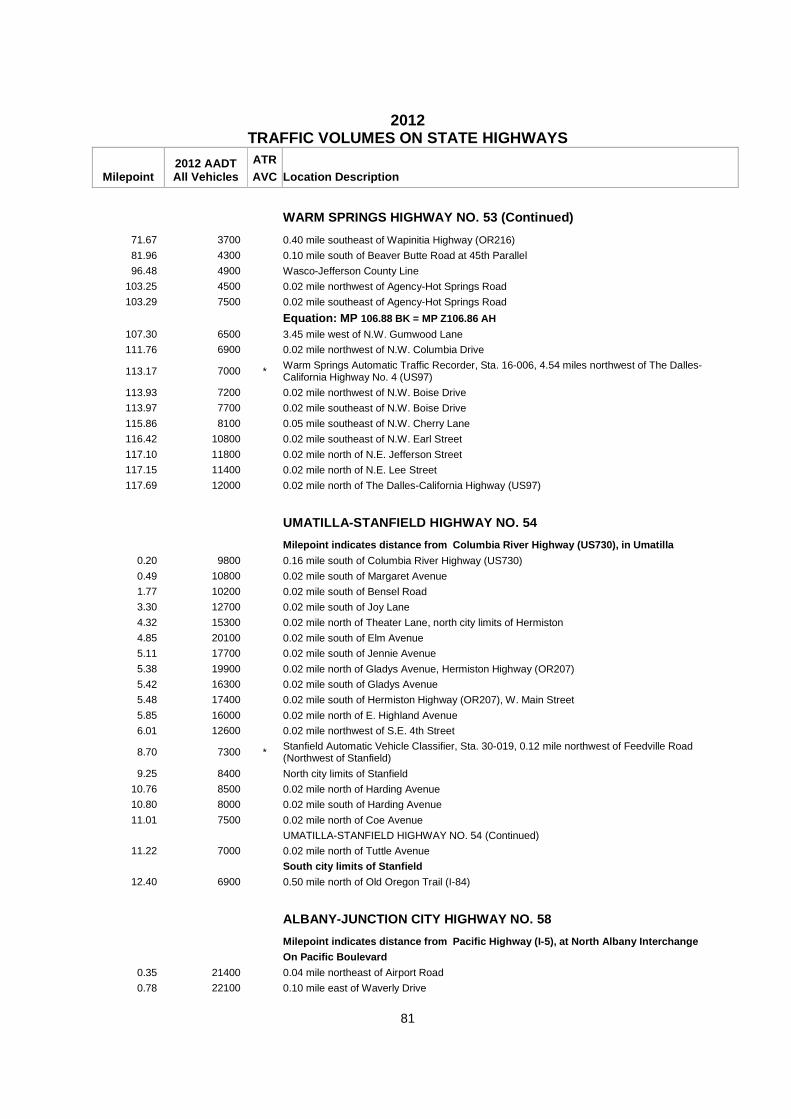
2012
TRAFFIC VOLUMES ON STATE HIGHWAYS
Milepoint 2012 AADT All Vehicles
ATR AVC Location Description
81
WARM SPRINGS HIGHWAY NO. 53 (Continued)
71.67 3700 0.40 mile southeast of Wapinitia Highway (OR216)
81.96 4300 0.10 mile south of Beaver Butte Road at 45th Parallel
96.48 4900 Wasco-Jefferson County Line
103.25 4500 0.02 mile northwest of Agency-Hot Springs Road
103.29 7500 0.02 mile southeast of Agency-Hot Springs Road
Equation: MP 106.88 BK = MP Z106.86 AH
107.30 6500 3.45 mile west of N.W. Gumwood Lane
111.76 6900 0.02 mile northwest of N.W. Columbia Drive
113.17 7000 * Warm Springs Automatic Traffic Recorder, Sta. 16-006, 4.54 miles northwest of The Dalles-California Highway No. 4 (US97)
113.93 7200 0.02 mile northwest of N.W. Boise Drive
113.97 7700 0.02 mile southeast of N.W. Boise Drive
115.86 8100 0.05 mile southeast of N.W. Cherry Lane
116.42 10800 0.02 mile southeast of N.W. Earl Street
117.10 11800 0.02 mile north of N.E. Jefferson Street
117.15 11400 0.02 mile north of N.E. Lee Street
117.69 12000 0.02 mile north of The Dalles-California Highway (US97)
UMATILLA-STANFIELD HIGHWAY NO. 54
Milepoint indicates distance from Columbia River H ighway (US730), in Umatilla
0.20 9800 0.16 mile south of Columbia River Highway (US730)
0.49 10800 0.02 mile south of Margaret Avenue
1.77 10200 0.02 mile south of Bensel Road
3.30 12700 0.02 mile south of Joy Lane
4.32 15300 0.02 mile north of Theater Lane, north city limits of Hermiston
4.85 20100 0.02 mile south of Elm Avenue
5.11 17700 0.02 mile south of Jennie Avenue
5.38 19900 0.02 mile north of Gladys Avenue, Hermiston Highway (OR207)
5.42 16300 0.02 mile south of Gladys Avenue
5.48 17400 0.02 mile south of Hermiston Highway (OR207), W. Main Street
5.85 16000 0.02 mile north of E. Highland Avenue
6.01 12600 0.02 mile northwest of S.E. 4th Street
8.70 7300 * Stanfield Automatic Vehicle Classifier, Sta. 30-019, 0.12 mile northwest of Feedville Road (Northwest of Stanfield)
9.25 8400 North city limits of Stanfield
10.76 8500 0.02 mile north of Harding Avenue
10.80 8000 0.02 mile south of Harding Avenue
11.01 7500 0.02 mile north of Coe Avenue
UMATILLA-STANFIELD HIGHWAY NO. 54 (Continued)
11.22 7000 0.02 mile north of Tuttle Avenue
South city limits of Stanfield
12.40 6900 0.50 mile north of Old Oregon Trail (I-84)
ALBANY-JUNCTION CITY HIGHWAY NO. 58
Milepoint indicates distance from Pacific Highway (I-5), at North Albany Interchange
On Pacific Boulevard
0.35 21400 0.04 mile northeast of Airport Road
0.78 22100 0.10 mile east of Waverly Drive

2012
TRAFFIC VOLUMES ON STATE HIGHWAYS
Milepoint 2012 AADT All Vehicles
ATR AVC Location Description
82
ALBANY-JUNCTION CITY HIGHWAY NO. 58 (Continued)
0.90 19800 0.02 mile west of Waverly Drive
SOUTHBOUND - ONE-WAY TRAFFIC
On Pacific Boulevard
1.32 7300 0.10 mile east of Santiam Highway (US20)
1.48 17200 0.06 mile west of Santiam Highway (US20)
1.78 17000 0.02 mile east of Main Street
1.91 16200 0.02 mile east of Madison Street
1.95 16200 0.02 mile west of Madison Street
NORTHBOUND - ONE-WAY TRAFFIC
On 9th Avenue
1.33 9600 0.03 mile east of Santiam Highway (US20)
1.39 16100 0.03 mile west of Santiam Highway (US20)
1.80 17000 0.02 mile east of Main Street
1.91 16100 0.02 mile east of Madison Street
1.95 16300 0.02 mile west of Madison Street
RESUME TWO-WAY TRAFFIC
2.14 35900 * Central Albany Automatic Vehicle Classifier, Sta. 22-022, 0.28 mile northeast of Albany-Corvallis Highway No. 31 (US20)
2.47 33100 0.07 mile north of Ellsworth Street S.W.
2.69 20400 0.05 mile southwest of 12th Avenue
2.95 22000 0.06 mile north of Queen Avenue
3.03 18000 0.02 mile south of Queen Avenue
3.67 18300 0.02 mile north of 29th Avenue
4.26 16000 0.02 mile south of 37th Avenue
5.79 11900 0.02 mile north of Allen Lane
7.66 12200 0.15 mile north of Corvallis-Lebanon Highway (OR34)
7.96 6600 0.15 mile south of Corvallis-Lebanon Highway (OR34)
8.68 3800 0.02 mile north of Tangent Drive
8.79 3200 0.02 mile north of Birdfoot Drive
9.32 2600 South city limits of Tangent, 0.18 mile south of Glass Drive
14.73 2600 0.02 mile north of "F" Street
19.29 2400 North city limits of Halsey
19.38 3900 0.02 mile south of Halsey-Sweet Home Highway (OR228)
19.87 3400 0.02 mile south of "J" Street
20.31 3000 South city limits of Halsey
21.64 3100 * Halsey Automatic Traffic Recorder, Sta. 22-012, 2.28 miles south of Halsey-Sweet Home Highway No. 212 (OR228)
28.17 3400 North city limits of Harrisburg
28.46 4700 0.02 mile north of Territorial Street
28.50 6300 0.02 mile south of Territorial Street
28.66 6900 0.02 mile south of Moore Street
29.09 8700 South city limits of Harrisburg, Linn-Lane County Line, at Willamette River
30.69 8300 0.02 mile south of Noraton Road
32.32 7600 North city limits of Junction City, 0.05 mile northeast of Pacific Highway West (OR99W)
ROGUE RIVER HIGHWAY NO. 60
Milepoint indicates distance from Redwood Highway (US199), at south city limits of Grants Pass
0.06 9700 0.06 mile south of E. Park Street
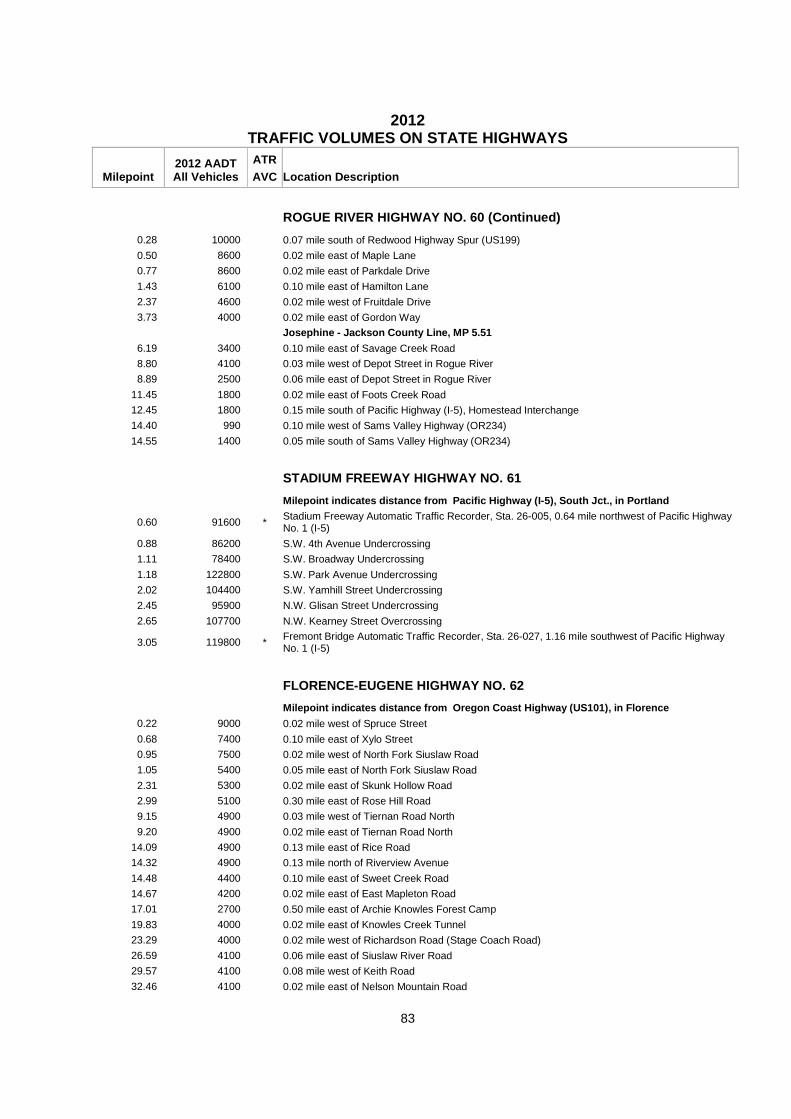
2012
TRAFFIC VOLUMES ON STATE HIGHWAYS
Milepoint 2012 AADT All Vehicles
ATR AVC Location Description
83
ROGUE RIVER HIGHWAY NO. 60 (Continued)
0.28 10000 0.07 mile south of Redwood Highway Spur (US199)
0.50 8600 0.02 mile east of Maple Lane
0.77 8600 0.02 mile east of Parkdale Drive
1.43 6100 0.10 mile east of Hamilton Lane
2.37 4600 0.02 mile west of Fruitdale Drive
3.73 4000 0.02 mile east of Gordon Way
Josephine - Jackson County Line, MP 5.51
6.19 3400 0.10 mile east of Savage Creek Road
8.80 4100 0.03 mile west of Depot Street in Rogue River
8.89 2500 0.06 mile east of Depot Street in Rogue River
11.45 1800 0.02 mile east of Foots Creek Road
12.45 1800 0.15 mile south of Pacific Highway (I-5), Homestead Interchange
14.40 990 0.10 mile west of Sams Valley Highway (OR234)
14.55 1400 0.05 mile south of Sams Valley Highway (OR234)
STADIUM FREEWAY HIGHWAY NO. 61
Milepoint indicates distance from Pacific Highway (I-5), South Jct., in Portland
0.60 91600 * Stadium Freeway Automatic Traffic Recorder, Sta. 26-005, 0.64 mile northwest of Pacific Highway No. 1 (I-5)
0.88 86200 S.W. 4th Avenue Undercrossing
1.11 78400 S.W. Broadway Undercrossing
1.18 122800 S.W. Park Avenue Undercrossing
2.02 104400 S.W. Yamhill Street Undercrossing
2.45 95900 N.W. Glisan Street Undercrossing
2.65 107700 N.W. Kearney Street Overcrossing
3.05 119800 * Fremont Bridge Automatic Traffic Recorder, Sta. 26-027, 1.16 mile southwest of Pacific Highway No. 1 (I-5)
FLORENCE-EUGENE HIGHWAY NO. 62
Milepoint indicates distance from Oregon Coast Hig hway (US101), in Florence
0.22 9000 0.02 mile west of Spruce Street
0.68 7400 0.10 mile east of Xylo Street
0.95 7500 0.02 mile west of North Fork Siuslaw Road
1.05 5400 0.05 mile east of North Fork Siuslaw Road
2.31 5300 0.02 mile east of Skunk Hollow Road
2.99 5100 0.30 mile east of Rose Hill Road
9.15 4900 0.03 mile west of Tiernan Road North
9.20 4900 0.02 mile east of Tiernan Road North
14.09 4900 0.13 mile east of Rice Road
14.32 4900 0.13 mile north of Riverview Avenue
14.48 4400 0.10 mile east of Sweet Creek Road
14.67 4200 0.02 mile east of East Mapleton Road
17.01 2700 0.50 mile east of Archie Knowles Forest Camp
19.83 4000 0.02 mile east of Knowles Creek Tunnel
23.29 4000 0.02 mile west of Richardson Road (Stage Coach Road)
26.59 4100 0.06 mile east of Siuslaw River Road
29.57 4100 0.08 mile west of Keith Road
32.46 4100 0.02 mile east of Nelson Mountain Road
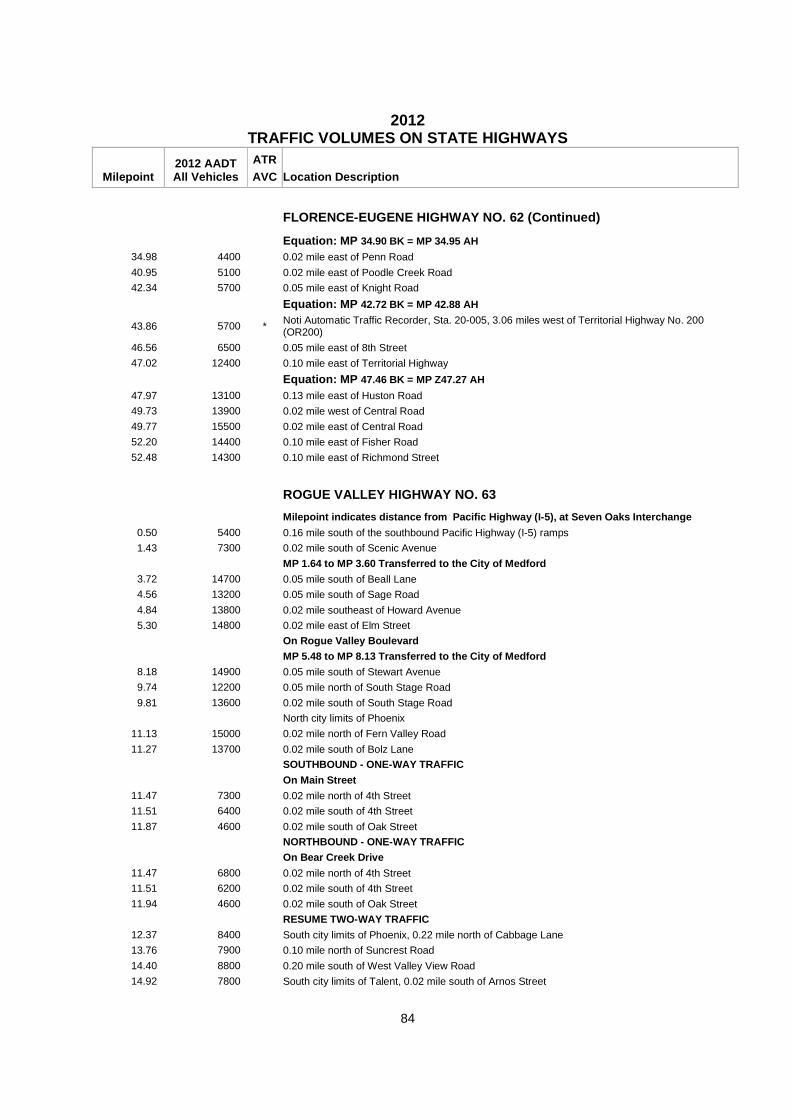
2012
TRAFFIC VOLUMES ON STATE HIGHWAYS
Milepoint 2012 AADT All Vehicles
ATR AVC Location Description
84
FLORENCE-EUGENE HIGHWAY NO. 62 (Continued)
Equation: MP 34.90 BK = MP 34.95 AH
34.98 4400 0.02 mile east of Penn Road
40.95 5100 0.02 mile east of Poodle Creek Road
42.34 5700 0.05 mile east of Knight Road
Equation: MP 42.72 BK = MP 42.88 AH
43.86 5700 * Noti Automatic Traffic Recorder, Sta. 20-005, 3.06 miles west of Territorial Highway No. 200 (OR200)
46.56 6500 0.05 mile east of 8th Street
47.02 12400 0.10 mile east of Territorial Highway
Equation: MP 47.46 BK = MP Z47.27 AH
47.97 13100 0.13 mile east of Huston Road
49.73 13900 0.02 mile west of Central Road
49.77 15500 0.02 mile east of Central Road
52.20 14400 0.10 mile east of Fisher Road
52.48 14300 0.10 mile east of Richmond Street
ROGUE VALLEY HIGHWAY NO. 63
Milepoint indicates distance from Pacific Highway (I-5), at Seven Oaks Interchange
0.50 5400 0.16 mile south of the southbound Pacific Highway (I-5) ramps
1.43 7300 0.02 mile south of Scenic Avenue
MP 1.64 to MP 3.60 Transferred to the City of Medfo rd
3.72 14700 0.05 mile south of Beall Lane
4.56 13200 0.05 mile south of Sage Road
4.84 13800 0.02 mile southeast of Howard Avenue
5.30 14800 0.02 mile east of Elm Street
On Rogue Valley Boulevard
MP 5.48 to MP 8.13 Transferred to the City of Medfo rd
8.18 14900 0.05 mile south of Stewart Avenue
9.74 12200 0.05 mile north of South Stage Road
9.81 13600 0.02 mile south of South Stage Road
North city limits of Phoenix
11.13 15000 0.02 mile north of Fern Valley Road
11.27 13700 0.02 mile south of Bolz Lane
SOUTHBOUND - ONE-WAY TRAFFIC
On Main Street 11.47 7300 0.02 mile north of 4th Street
11.51 6400 0.02 mile south of 4th Street
11.87 4600 0.02 mile south of Oak Street
NORTHBOUND - ONE-WAY TRAFFIC
On Bear Creek Drive
11.47 6800 0.02 mile north of 4th Street
11.51 6200 0.02 mile south of 4th Street
11.94 4600 0.02 mile south of Oak Street
RESUME TWO-WAY TRAFFIC
12.37 8400 South city limits of Phoenix, 0.22 mile north of Cabbage Lane
13.76 7900 0.10 mile north of Suncrest Road
14.40 8800 0.20 mile south of West Valley View Road
14.92 7800 South city limits of Talent, 0.02 mile south of Arnos Street
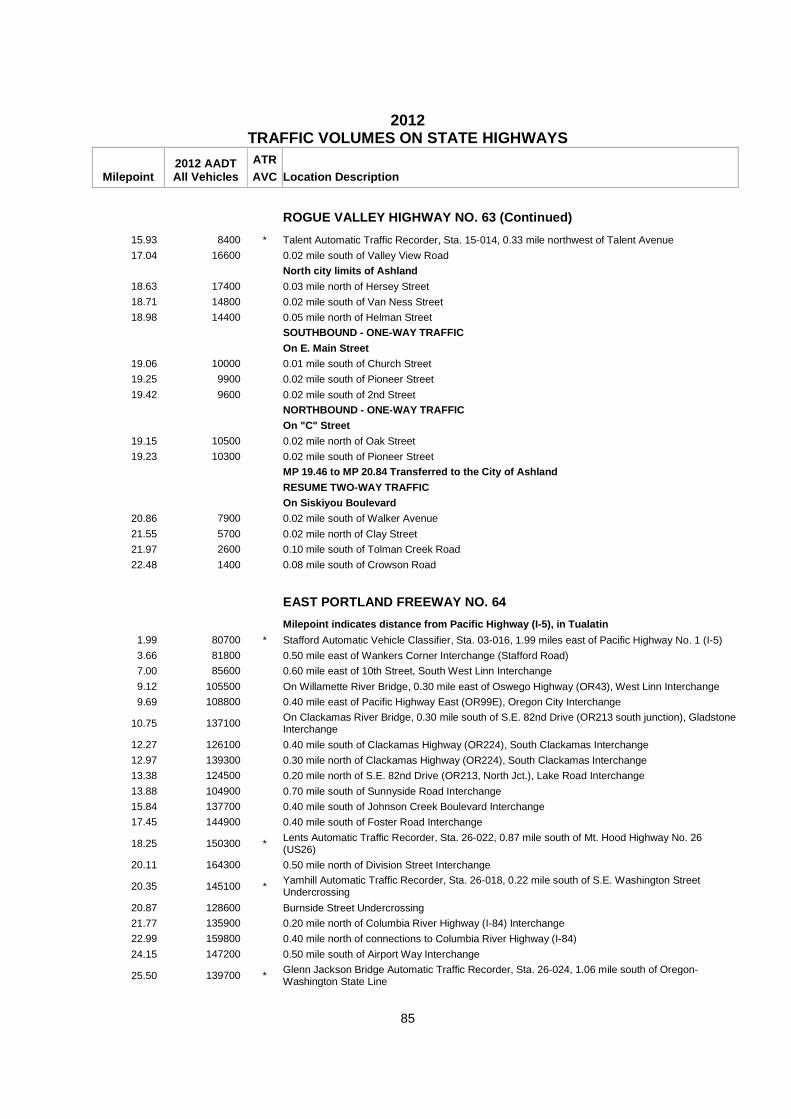
2012
TRAFFIC VOLUMES ON STATE HIGHWAYS
Milepoint 2012 AADT All Vehicles
ATR AVC Location Description
85
ROGUE VALLEY HIGHWAY NO. 63 (Continued)
15.93 8400 * Talent Automatic Traffic Recorder, Sta. 15-014, 0.33 mile northwest of Talent Avenue
17.04 16600 0.02 mile south of Valley View Road
North city limits of Ashland
18.63 17400 0.03 mile north of Hersey Street
18.71 14800 0.02 mile south of Van Ness Street
18.98 14400 0.05 mile north of Helman Street
SOUTHBOUND - ONE-WAY TRAFFIC
On E. Main Street
19.06 10000 0.01 mile south of Church Street
19.25 9900 0.02 mile south of Pioneer Street
19.42 9600 0.02 mile south of 2nd Street
NORTHBOUND - ONE-WAY TRAFFIC
On "C" Street
19.15 10500 0.02 mile north of Oak Street
19.23 10300 0.02 mile south of Pioneer Street
MP 19.46 to MP 20.84 Transferred to the City of Ash land
RESUME TWO-WAY TRAFFIC
On Siskiyou Boulevard
20.86 7900 0.02 mile south of Walker Avenue
21.55 5700 0.02 mile north of Clay Street
21.97 2600 0.10 mile south of Tolman Creek Road
22.48 1400 0.08 mile south of Crowson Road
EAST PORTLAND FREEWAY NO. 64
Milepoint indicates distance from Pacific Highway ( I-5), in Tualatin
1.99 80700 * Stafford Automatic Vehicle Classifier, Sta. 03-016, 1.99 miles east of Pacific Highway No. 1 (I-5)
3.66 81800 0.50 mile east of Wankers Corner Interchange (Stafford Road)
7.00 85600 0.60 mile east of 10th Street, South West Linn Interchange
9.12 105500 On Willamette River Bridge, 0.30 mile east of Oswego Highway (OR43), West Linn Interchange
9.69 108800 0.40 mile east of Pacific Highway East (OR99E), Oregon City Interchange
10.75 137100 On Clackamas River Bridge, 0.30 mile south of S.E. 82nd Drive (OR213 south junction), Gladstone Interchange
12.27 126100 0.40 mile south of Clackamas Highway (OR224), South Clackamas Interchange
12.97 139300 0.30 mile north of Clackamas Highway (OR224), South Clackamas Interchange
13.38 124500 0.20 mile north of S.E. 82nd Drive (OR213, North Jct.), Lake Road Interchange
13.88 104900 0.70 mile south of Sunnyside Road Interchange
15.84 137700 0.40 mile south of Johnson Creek Boulevard Interchange
17.45 144900 0.40 mile south of Foster Road Interchange
18.25 150300 * Lents Automatic Traffic Recorder, Sta. 26-022, 0.87 mile south of Mt. Hood Highway No. 26 (US26)
20.11 164300 0.50 mile north of Division Street Interchange
20.35 145100 * Yamhill Automatic Traffic Recorder, Sta. 26-018, 0.22 mile south of S.E. Washington Street Undercrossing
20.87 128600 Burnside Street Undercrossing
21.77 135900 0.20 mile north of Columbia River Highway (I-84) Interchange
22.99 159800 0.40 mile north of connections to Columbia River Highway (I-84)
24.15 147200 0.50 mile south of Airport Way Interchange
25.50 139700 * Glenn Jackson Bridge Automatic Traffic Recorder, Sta. 26-024, 1.06 mile south of Oregon- Washington State Line
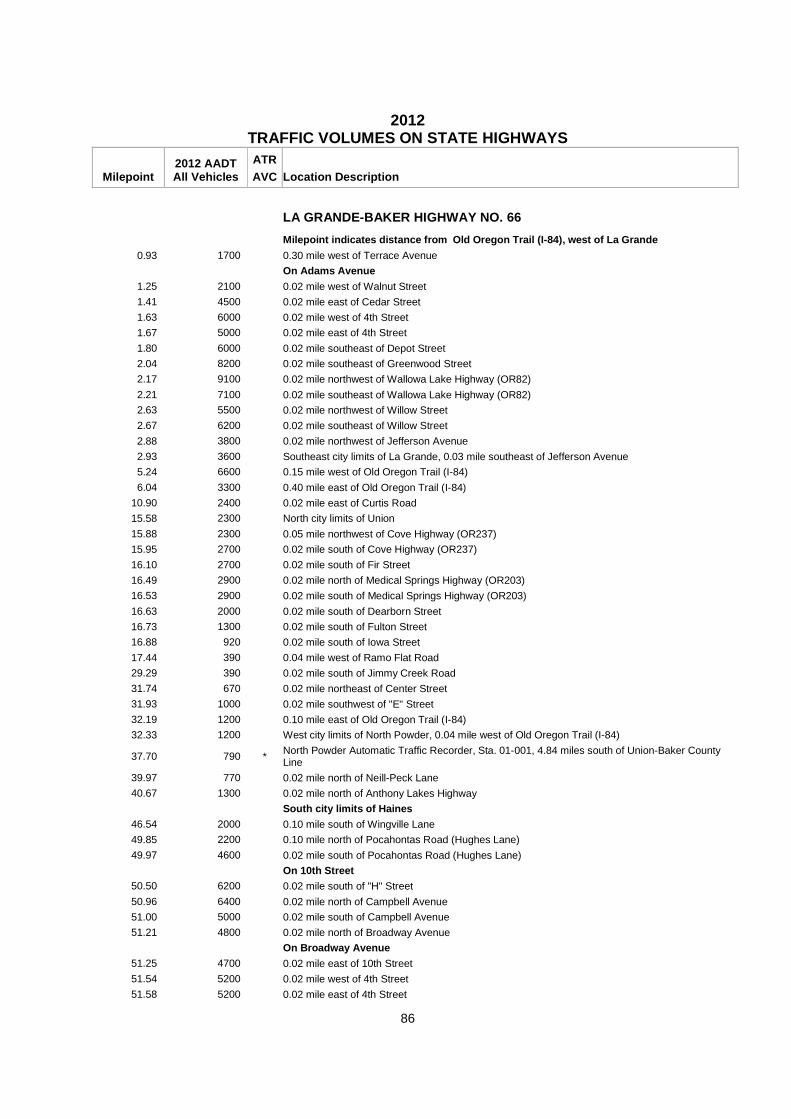
2012
TRAFFIC VOLUMES ON STATE HIGHWAYS
Milepoint 2012 AADT All Vehicles
ATR AVC Location Description
86
LA GRANDE-BAKER HIGHWAY NO. 66
Milepoint indicates distance from Old Oregon Trail (I-84), west of La Grande
0.93 1700 0.30 mile west of Terrace Avenue
On Adams Avenue
1.25 2100 0.02 mile west of Walnut Street
1.41 4500 0.02 mile east of Cedar Street
1.63 6000 0.02 mile west of 4th Street
1.67 5000 0.02 mile east of 4th Street
1.80 6000 0.02 mile southeast of Depot Street
2.04 8200 0.02 mile southeast of Greenwood Street
2.17 9100 0.02 mile northwest of Wallowa Lake Highway (OR82)
2.21 7100 0.02 mile southeast of Wallowa Lake Highway (OR82)
2.63 5500 0.02 mile northwest of Willow Street
2.67 6200 0.02 mile southeast of Willow Street
2.88 3800 0.02 mile northwest of Jefferson Avenue
2.93 3600 Southeast city limits of La Grande, 0.03 mile southeast of Jefferson Avenue
5.24 6600 0.15 mile west of Old Oregon Trail (I-84)
6.04 3300 0.40 mile east of Old Oregon Trail (I-84)
10.90 2400 0.02 mile east of Curtis Road
15.58 2300 North city limits of Union
15.88 2300 0.05 mile northwest of Cove Highway (OR237)
15.95 2700 0.02 mile south of Cove Highway (OR237)
16.10 2700 0.02 mile south of Fir Street
16.49 2900 0.02 mile north of Medical Springs Highway (OR203)
16.53 2900 0.02 mile south of Medical Springs Highway (OR203)
16.63 2000 0.02 mile south of Dearborn Street
16.73 1300 0.02 mile south of Fulton Street
16.88 920 0.02 mile south of Iowa Street
17.44 390 0.04 mile west of Ramo Flat Road
29.29 390 0.02 mile south of Jimmy Creek Road
31.74 670 0.02 mile northeast of Center Street
31.93 1000 0.02 mile southwest of "E" Street
32.19 1200 0.10 mile east of Old Oregon Trail (I-84)
32.33 1200 West city limits of North Powder, 0.04 mile west of Old Oregon Trail (I-84)
37.70 790 * North Powder Automatic Traffic Recorder, Sta. 01-001, 4.84 miles south of Union-Baker County Line
39.97 770 0.02 mile north of Neill-Peck Lane
40.67 1300 0.02 mile north of Anthony Lakes Highway
South city limits of Haines
46.54 2000 0.10 mile south of Wingville Lane
49.85 2200 0.10 mile north of Pocahontas Road (Hughes Lane)
49.97 4600 0.02 mile south of Pocahontas Road (Hughes Lane)
On 10th Street 50.50 6200 0.02 mile south of "H" Street
50.96 6400 0.02 mile north of Campbell Avenue
51.00 5000 0.02 mile south of Campbell Avenue
51.21 4800 0.02 mile north of Broadway Avenue
On Broadway Avenue 51.25 4700 0.02 mile east of 10th Street
51.54 5200 0.02 mile west of 4th Street
51.58 5200 0.02 mile east of 4th Street

2012
TRAFFIC VOLUMES ON STATE HIGHWAYS
Milepoint 2012 AADT All Vehicles
ATR AVC Location Description
87
LA GRANDE-BAKER HIGHWAY NO. 66 (Continued)
51.77 3800 0.02 mile west of Baker-Copperfield Highway (OR86)
On Main Street
51.81 6000 0.02 mile south of Baker-Copperfield Highway (OR86)
52.02 5200 0.02 mile north of Whitney Highway (OR7)
52.09 2900 0.05 mile east of Whitney Highway (OR7), on Bridge Street
52.44 2100 0.02 mile north of Myrtle Avenue on Elm Street
53.10 940 0.05 mile northwest of S. Bridge Street
South city limits of Baker City
54.06 910 0.40 mile west of Old Oregon Trail Highway (I-84)
PENDLETON HIGHWAY NO. 67
Milepoint indicates distance from Old Oregon Trail (I-84), west of Pendleton
On S.W. Westgate Avenue 1.17 5500 0.02 mile east of Old Airport Road
1.65 6000 0.02 mile west of Clopton Road
1.93 6700 0.15 mile west of Pendleton-Cold Springs Highway (OR37)
2.10 10200 0.02 mile east of Pendleton-Cold Springs Highway (OR37)
2.50 8900 0.02 mile east of S.W. 18th Street
EASTBOUND - ONE-WAY TRAFFIC
On S.W. Dorion Avenue 2.89 8400 0.02 mile west of S.W. 10th Street
2.93 7500 0.02 mile east of S.W. 10th Street
3.22 6900 0.02 mile east of S.W. 4th Street
3.37 6600 0.02 mile west of S. Main Street
On S.E. Dorion Avenue
3.41 6200 0.02 mile east of S. Main Street
3.52 5500 0.02 mile west of S.E. 3rd Street
3.66 5700 0.02 mile west of S.E. 6th Street
WESTBOUND - ONE-WAY TRAFFIC
On S.W. Court Avenue
2.86 7300 0.02 mile west of S.W. 10th Street
2.90 7100 0.02 mile east of S.W. 10th Street
3.19 6600 0.02 mile east of S.W. 4th Street
3.35 6100 0.02 mile west of S. Main Street
On S.E. Court Avenue
3.39 6500 0.02 mile east of S. Main Street
3.50 5800 0.02 mile west of S.E. 3rd Street
3.65 5800 0.02 mile west of S.E. 6th Street
RESUME TWO-WAY TRAFFIC
3.89 10400 0.03 mile west of Oregon-Washington Highway (OR11), and Pendleton-John Day Highway (US395)
4.96 4800 East city limits of Pendleton, 0.34 mile east of Oregon-Washington Highway (OR11)
5.80 1500 0.80 mile north of Old Oregon Trail (I-84)
CASCADE HIGHWAY NORTH NO. 68
Milepoint indicates distance from N.E. Columbia Bo ulevard, in Portland
On N.E. 82nd Avenue 0.15 10100 0.05 mile south of N.E. Columbia Boulevard
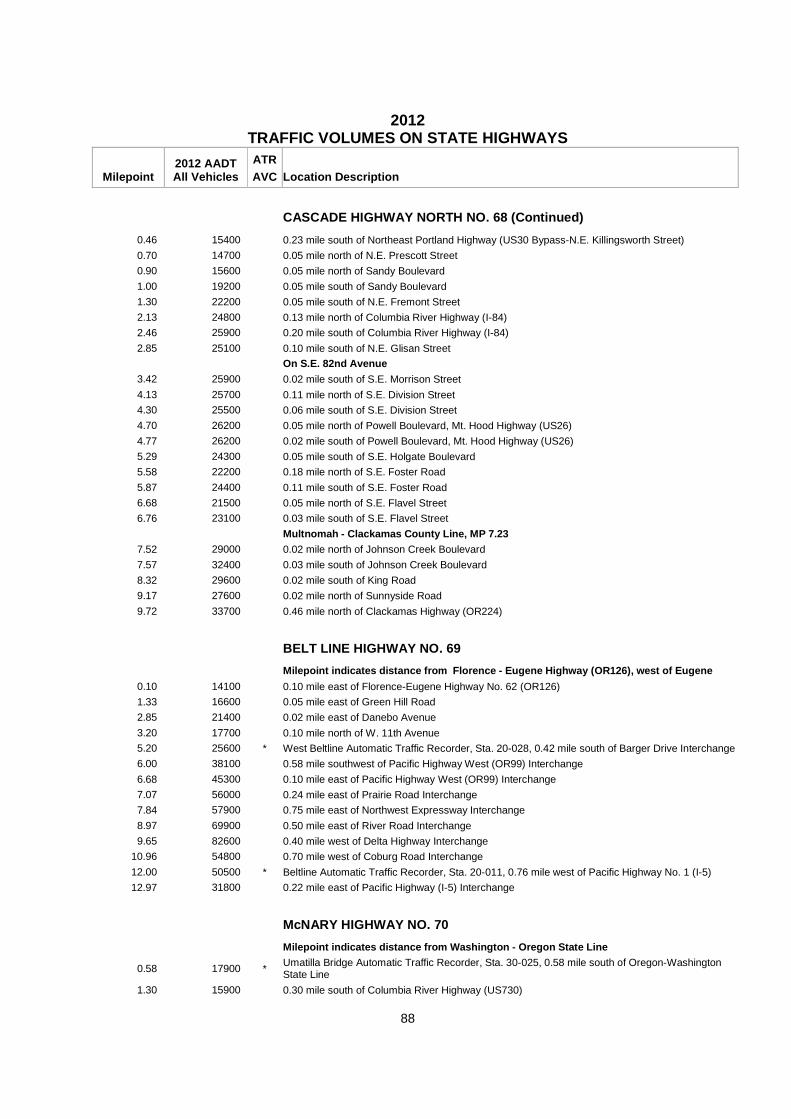
2012
TRAFFIC VOLUMES ON STATE HIGHWAYS
Milepoint 2012 AADT All Vehicles
ATR AVC Location Description
88
CASCADE HIGHWAY NORTH NO. 68 (Continued)
0.46 15400 0.23 mile south of Northeast Portland Highway (US30 Bypass-N.E. Killingsworth Street)
0.70 14700 0.05 mile north of N.E. Prescott Street
0.90 15600 0.05 mile north of Sandy Boulevard
1.00 19200 0.05 mile south of Sandy Boulevard
1.30 22200 0.05 mile south of N.E. Fremont Street
2.13 24800 0.13 mile north of Columbia River Highway (I-84)
2.46 25900 0.20 mile south of Columbia River Highway (I-84)
2.85 25100 0.10 mile south of N.E. Glisan Street
On S.E. 82nd Avenue
3.42 25900 0.02 mile south of S.E. Morrison Street
4.13 25700 0.11 mile north of S.E. Division Street
4.30 25500 0.06 mile south of S.E. Division Street
4.70 26200 0.05 mile north of Powell Boulevard, Mt. Hood Highway (US26)
4.77 26200 0.02 mile south of Powell Boulevard, Mt. Hood Highway (US26)
5.29 24300 0.05 mile south of S.E. Holgate Boulevard
5.58 22200 0.18 mile north of S.E. Foster Road
5.87 24400 0.11 mile south of S.E. Foster Road
6.68 21500 0.05 mile north of S.E. Flavel Street
6.76 23100 0.03 mile south of S.E. Flavel Street
Multnomah - Clackamas County Line, MP 7.23
7.52 29000 0.02 mile north of Johnson Creek Boulevard
7.57 32400 0.03 mile south of Johnson Creek Boulevard
8.32 29600 0.02 mile south of King Road
9.17 27600 0.02 mile north of Sunnyside Road
9.72 33700 0.46 mile north of Clackamas Highway (OR224)
BELT LINE HIGHWAY NO. 69
Milepoint indicates distance from Florence - Eugen e Highway (OR126), west of Eugene
0.10 14100 0.10 mile east of Florence-Eugene Highway No. 62 (OR126)
1.33 16600 0.05 mile east of Green Hill Road
2.85 21400 0.02 mile east of Danebo Avenue
3.20 17700 0.10 mile north of W. 11th Avenue
5.20 25600 * West Beltline Automatic Traffic Recorder, Sta. 20-028, 0.42 mile south of Barger Drive Interchange
6.00 38100 0.58 mile southwest of Pacific Highway West (OR99) Interchange
6.68 45300 0.10 mile east of Pacific Highway West (OR99) Interchange
7.07 56000 0.24 mile east of Prairie Road Interchange
7.84 57900 0.75 mile east of Northwest Expressway Interchange
8.97 69900 0.50 mile east of River Road Interchange
9.65 82600 0.40 mile west of Delta Highway Interchange
10.96 54800 0.70 mile west of Coburg Road Interchange
12.00 50500 * Beltline Automatic Traffic Recorder, Sta. 20-011, 0.76 mile west of Pacific Highway No. 1 (I-5)
12.97 31800 0.22 mile east of Pacific Highway (I-5) Interchange
McNARY HIGHWAY NO. 70
Milepoint indicates distance from Washington - Oreg on State Line
0.58 17900 * Umatilla Bridge Automatic Traffic Recorder, Sta. 30-025, 0.58 mile south of Oregon-Washington State Line
1.30 15900 0.30 mile south of Columbia River Highway (US730)
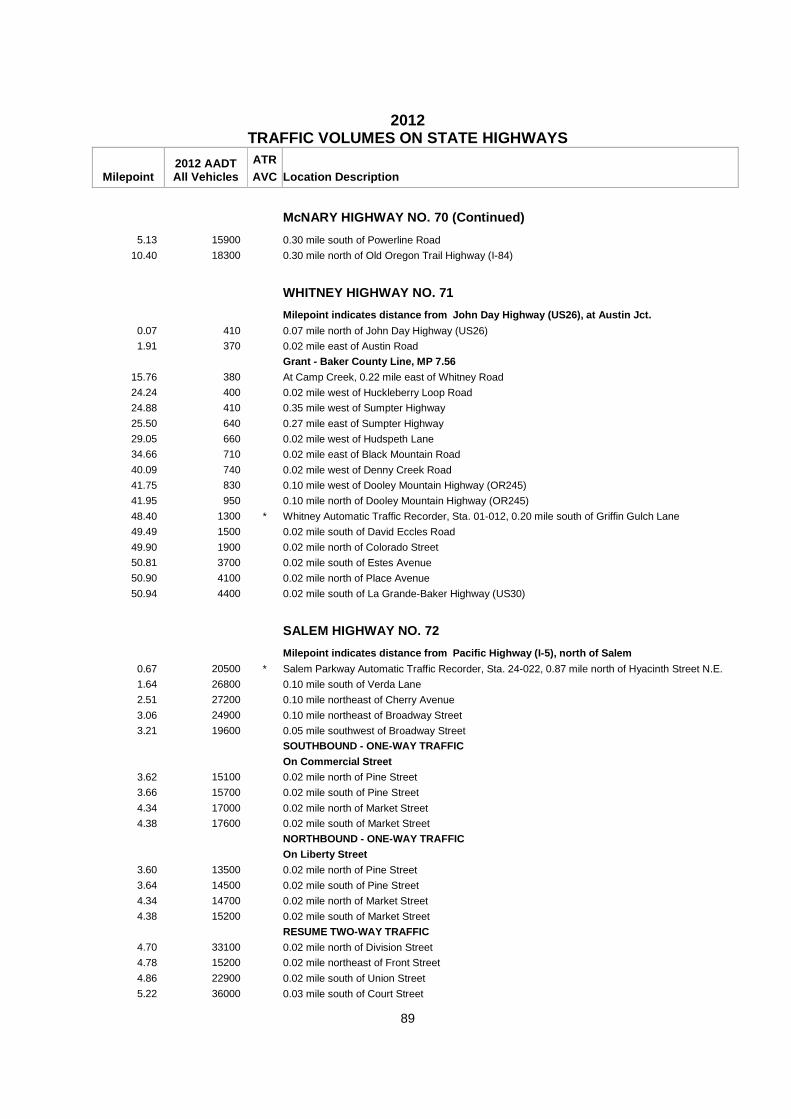
2012
TRAFFIC VOLUMES ON STATE HIGHWAYS
Milepoint 2012 AADT All Vehicles
ATR AVC Location Description
89
McNARY HIGHWAY NO. 70 (Continued)
5.13 15900 0.30 mile south of Powerline Road
10.40 18300 0.30 mile north of Old Oregon Trail Highway (I-84)
WHITNEY HIGHWAY NO. 71
Milepoint indicates distance from John Day Highway (US26), at Austin Jct.
0.07 410 0.07 mile north of John Day Highway (US26)
1.91 370 0.02 mile east of Austin Road
Grant - Baker County Line, MP 7.56
15.76 380 At Camp Creek, 0.22 mile east of Whitney Road
24.24 400 0.02 mile west of Huckleberry Loop Road
24.88 410 0.35 mile west of Sumpter Highway
25.50 640 0.27 mile east of Sumpter Highway
29.05 660 0.02 mile west of Hudspeth Lane
34.66 710 0.02 mile east of Black Mountain Road
40.09 740 0.02 mile west of Denny Creek Road
41.75 830 0.10 mile west of Dooley Mountain Highway (OR245)
41.95 950 0.10 mile north of Dooley Mountain Highway (OR245)
48.40 1300 * Whitney Automatic Traffic Recorder, Sta. 01-012, 0.20 mile south of Griffin Gulch Lane
49.49 1500 0.02 mile south of David Eccles Road
49.90 1900 0.02 mile north of Colorado Street
50.81 3700 0.02 mile south of Estes Avenue
50.90 4100 0.02 mile north of Place Avenue
50.94 4400 0.02 mile south of La Grande-Baker Highway (US30)
SALEM HIGHWAY NO. 72
Milepoint indicates distance from Pacific Highway (I-5), north of Salem
0.67 20500 * Salem Parkway Automatic Traffic Recorder, Sta. 24-022, 0.87 mile north of Hyacinth Street N.E.
1.64 26800 0.10 mile south of Verda Lane
2.51 27200 0.10 mile northeast of Cherry Avenue
3.06 24900 0.10 mile northeast of Broadway Street
3.21 19600 0.05 mile southwest of Broadway Street
SOUTHBOUND - ONE-WAY TRAFFIC
On Commercial Street 3.62 15100 0.02 mile north of Pine Street
3.66 15700 0.02 mile south of Pine Street
4.34 17000 0.02 mile north of Market Street
4.38 17600 0.02 mile south of Market Street
NORTHBOUND - ONE-WAY TRAFFIC
On Liberty Street
3.60 13500 0.02 mile north of Pine Street
3.64 14500 0.02 mile south of Pine Street
4.34 14700 0.02 mile north of Market Street
4.38 15200 0.02 mile south of Market Street
RESUME TWO-WAY TRAFFIC 4.70 33100 0.02 mile north of Division Street
4.78 15200 0.02 mile northeast of Front Street
4.86 22900 0.02 mile south of Union Street
5.22 36000 0.03 mile south of Court Street

2012
TRAFFIC VOLUMES ON STATE HIGHWAYS
Milepoint 2012 AADT All Vehicles
ATR AVC Location Description
90
SALEM HIGHWAY NO. 72 (Continued)
SOUTHBOUND - ONE-WAY TRAFFIC
On Front Street
5.41 19300 0.02 mile west of Commercial Street
On Trade Street
5.50 11400 0.02 mile west of Liberty Street
5.67 14400 0.02 mile west of Church Street
NORTHBOUND - ONE-WAY TRAFFIC
On Front Street
5.37 16000 0.02 mile west of Commercial Street
On Ferry Street
5.45 19000 0.02 mile west of Liberty Street
5.63 9900 0.02 mile west of Church Street
RESUME TWO-WAY TRAFFIC
On Pringle Creek Parkway
5.95 21500 0.02 mile east of Winter Street
6.18 22300 0.02 mile west of 12th Street
6.74 35700 0.03 mile west of 17th Street
On Mission Street
7.12 34400 0.02 mile west of 22nd Street
7.50 33900 0.02 mile west of 25th Street
7.82 47000 0.10 mile west of Turner Road
8.02 46600 0.10 mile east of Turner Road
8.28 47200 0.02 mile east of Hawthorne Avenue
PACIFIC HIGHWAY EAST NO. 81
Milepoint indicates distance from East Burnside, i n Portland
On Martin Luther King Jr. Boulevard
-5.53 13100 0.20 mile southeast of ramp to Delta Park (Marine Drive East)
-4.70 16800 0.02 mile north of Vancouver Avenue (Southbound connection)
-4.05 17300 0.04 mile north of N.E. Columbia Boulevard
-3.77 15300 0.02 mile north of Northeast Portland Highway (US30 Bypass)
MP -3.75 to MP 1.00 Transferred to the City of Port land On McLoughlin Boulevard
1.38 46400 0.11 mile north of Ross Island Bridge
1.69 62300 0.20 mile south of Ross Island Bridge
2.68 52300 0.05 mile north of S.E. 17th Avenue
3.02 42300 0.05 mile north of S.E. Harold Street
4.29 42600 0.01 mile north of S.E. Tacoma Street
4.59 41600 0.10 mile south of S.E. Umatilla Street (Multnomah-Clackamas County Line)
5.10 50400 0.10 mile north of S.E. Milport Road
5.21 38700 0.25 mile north of Clackamas Highway (OR224)
5.67 24700 0.05 mile north of Harrison Street
5.90 32000 0.02 mile south of Jefferson Street
6.55 26700 0.25 mile south of River Road
7.36 26400 0.05 mile north of Courtney Road
7.46 27200 0.05 mile south of Courtney Road
8.47 32200 0.05 mile south of Concord Road
10.51 29200 0.24 mile north of Gloucester Street
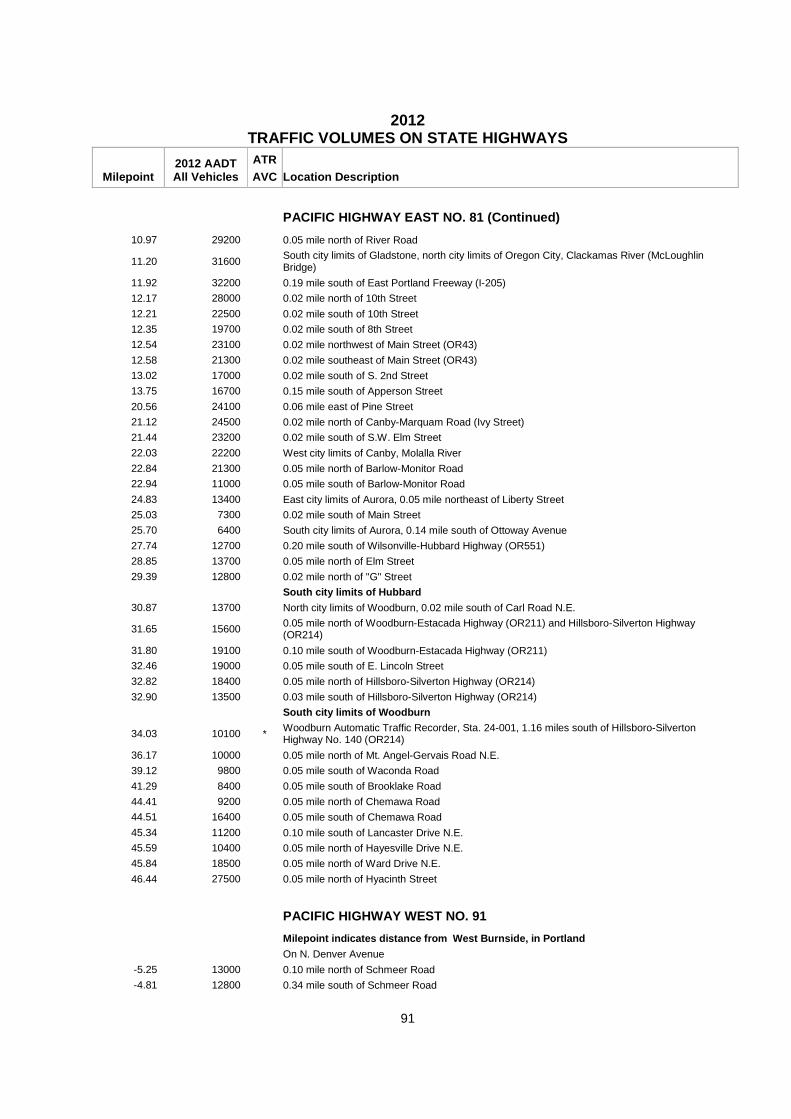
2012
TRAFFIC VOLUMES ON STATE HIGHWAYS
Milepoint 2012 AADT All Vehicles
ATR AVC Location Description
91
PACIFIC HIGHWAY EAST NO. 81 (Continued)
10.97 29200 0.05 mile north of River Road
11.20 31600 South city limits of Gladstone, north city limits of Oregon City, Clackamas River (McLoughlin Bridge)
11.92 32200 0.19 mile south of East Portland Freeway (I-205)
12.17 28000 0.02 mile north of 10th Street
12.21 22500 0.02 mile south of 10th Street
12.35 19700 0.02 mile south of 8th Street
12.54 23100 0.02 mile northwest of Main Street (OR43)
12.58 21300 0.02 mile southeast of Main Street (OR43)
13.02 17000 0.02 mile south of S. 2nd Street
13.75 16700 0.15 mile south of Apperson Street
20.56 24100 0.06 mile east of Pine Street
21.12 24500 0.02 mile north of Canby-Marquam Road (Ivy Street)
21.44 23200 0.02 mile south of S.W. Elm Street
22.03 22200 West city limits of Canby, Molalla River
22.84 21300 0.05 mile north of Barlow-Monitor Road
22.94 11000 0.05 mile south of Barlow-Monitor Road
24.83 13400 East city limits of Aurora, 0.05 mile northeast of Liberty Street
25.03 7300 0.02 mile south of Main Street
25.70 6400 South city limits of Aurora, 0.14 mile south of Ottoway Avenue
27.74 12700 0.20 mile south of Wilsonville-Hubbard Highway (OR551)
28.85 13700 0.05 mile north of Elm Street
29.39 12800 0.02 mile north of "G" Street
South city limits of Hubbard
30.87 13700 North city limits of Woodburn, 0.02 mile south of Carl Road N.E.
31.65 15600 0.05 mile north of Woodburn-Estacada Highway (OR211) and Hillsboro-Silverton Highway (OR214)
31.80 19100 0.10 mile south of Woodburn-Estacada Highway (OR211)
32.46 19000 0.05 mile south of E. Lincoln Street
32.82 18400 0.05 mile north of Hillsboro-Silverton Highway (OR214)
32.90 13500 0.03 mile south of Hillsboro-Silverton Highway (OR214)
South city limits of Woodburn
34.03 10100 * Woodburn Automatic Traffic Recorder, Sta. 24-001, 1.16 miles south of Hillsboro-Silverton Highway No. 140 (OR214)
36.17 10000 0.05 mile north of Mt. Angel-Gervais Road N.E.
39.12 9800 0.05 mile south of Waconda Road
41.29 8400 0.05 mile south of Brooklake Road
44.41 9200 0.05 mile north of Chemawa Road
44.51 16400 0.05 mile south of Chemawa Road
45.34 11200 0.10 mile south of Lancaster Drive N.E.
45.59 10400 0.05 mile north of Hayesville Drive N.E.
45.84 18500 0.05 mile north of Ward Drive N.E.
46.44 27500 0.05 mile north of Hyacinth Street
PACIFIC HIGHWAY WEST NO. 91
Milepoint indicates distance from West Burnside, i n Portland
On N. Denver Avenue
-5.25 13000 0.10 mile north of Schmeer Road
-4.81 12800 0.34 mile south of Schmeer Road
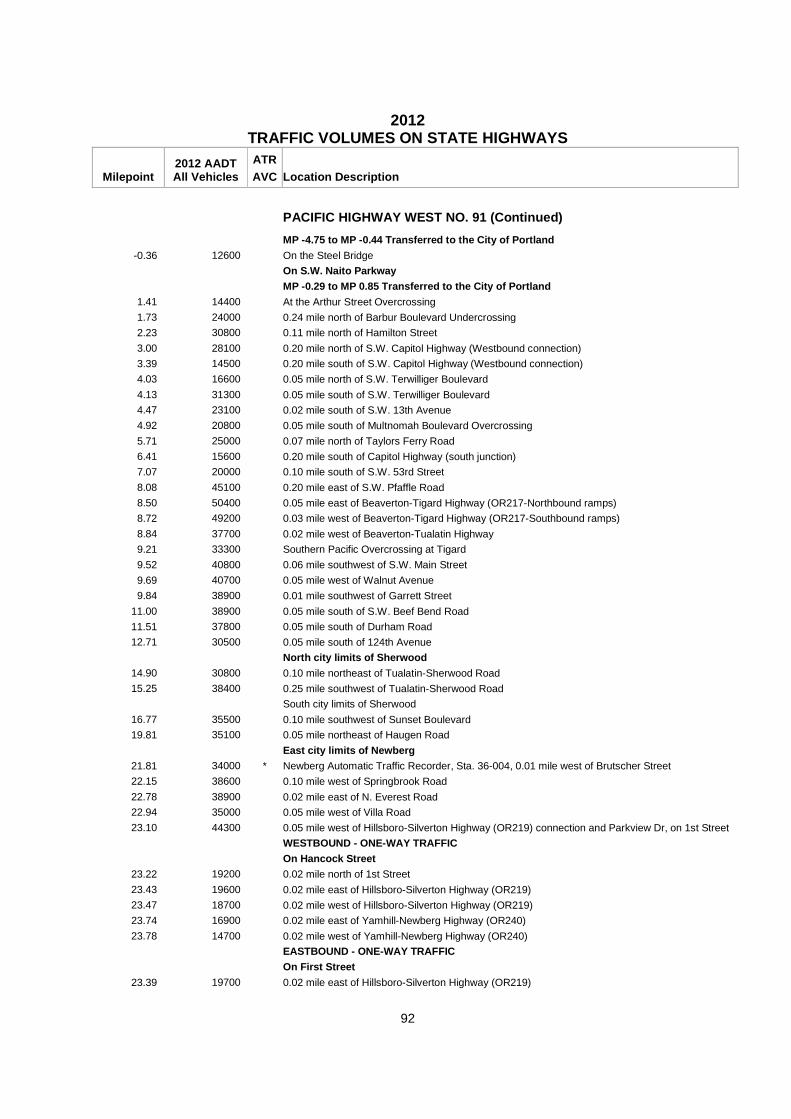
2012
TRAFFIC VOLUMES ON STATE HIGHWAYS
Milepoint 2012 AADT All Vehicles
ATR AVC Location Description
92
PACIFIC HIGHWAY WEST NO. 91 (Continued)
MP -4.75 to MP -0.44 Transferred to the City of Por tland
-0.36 12600 On the Steel Bridge
On S.W. Naito Parkway
MP -0.29 to MP 0.85 Transferred to the City of Port land
1.41 14400 At the Arthur Street Overcrossing
1.73 24000 0.24 mile north of Barbur Boulevard Undercrossing
2.23 30800 0.11 mile north of Hamilton Street
3.00 28100 0.20 mile north of S.W. Capitol Highway (Westbound connection)
3.39 14500 0.20 mile south of S.W. Capitol Highway (Westbound connection)
4.03 16600 0.05 mile north of S.W. Terwilliger Boulevard
4.13 31300 0.05 mile south of S.W. Terwilliger Boulevard
4.47 23100 0.02 mile south of S.W. 13th Avenue
4.92 20800 0.05 mile south of Multnomah Boulevard Overcrossing
5.71 25000 0.07 mile north of Taylors Ferry Road
6.41 15600 0.20 mile south of Capitol Highway (south junction)
7.07 20000 0.10 mile south of S.W. 53rd Street
8.08 45100 0.20 mile east of S.W. Pfaffle Road
8.50 50400 0.05 mile east of Beaverton-Tigard Highway (OR217-Northbound ramps)
8.72 49200 0.03 mile west of Beaverton-Tigard Highway (OR217-Southbound ramps)
8.84 37700 0.02 mile west of Beaverton-Tualatin Highway
9.21 33300 Southern Pacific Overcrossing at Tigard
9.52 40800 0.06 mile southwest of S.W. Main Street
9.69 40700 0.05 mile west of Walnut Avenue
9.84 38900 0.01 mile southwest of Garrett Street
11.00 38900 0.05 mile south of S.W. Beef Bend Road
11.51 37800 0.05 mile south of Durham Road
12.71 30500 0.05 mile south of 124th Avenue
North city limits of Sherwood
14.90 30800 0.10 mile northeast of Tualatin-Sherwood Road
15.25 38400 0.25 mile southwest of Tualatin-Sherwood Road
South city limits of Sherwood
16.77 35500 0.10 mile southwest of Sunset Boulevard
19.81 35100 0.05 mile northeast of Haugen Road
East city limits of Newberg
21.81 34000 * Newberg Automatic Traffic Recorder, Sta. 36-004, 0.01 mile west of Brutscher Street
22.15 38600 0.10 mile west of Springbrook Road
22.78 38900 0.02 mile east of N. Everest Road
22.94 35000 0.05 mile west of Villa Road
23.10 44300 0.05 mile west of Hillsboro-Silverton Highway (OR219) connection and Parkview Dr, on 1st Street
WESTBOUND - ONE-WAY TRAFFIC
On Hancock Street
23.22 19200 0.02 mile north of 1st Street
23.43 19600 0.02 mile east of Hillsboro-Silverton Highway (OR219)
23.47 18700 0.02 mile west of Hillsboro-Silverton Highway (OR219)
23.74 16900 0.02 mile east of Yamhill-Newberg Highway (OR240)
23.78 14700 0.02 mile west of Yamhill-Newberg Highway (OR240)
EASTBOUND - ONE-WAY TRAFFIC
On First Street
23.39 19700 0.02 mile east of Hillsboro-Silverton Highway (OR219)
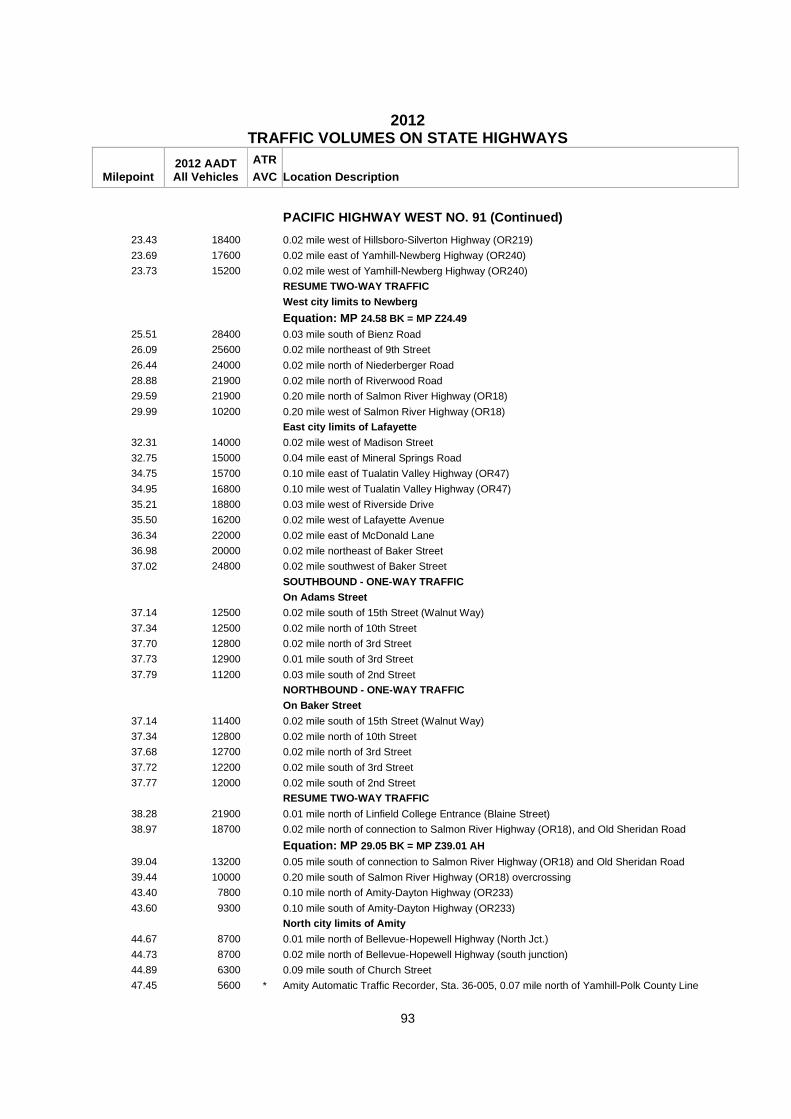
2012
TRAFFIC VOLUMES ON STATE HIGHWAYS
Milepoint 2012 AADT All Vehicles
ATR AVC Location Description
93
PACIFIC HIGHWAY WEST NO. 91 (Continued)
23.43 18400 0.02 mile west of Hillsboro-Silverton Highway (OR219)
23.69 17600 0.02 mile east of Yamhill-Newberg Highway (OR240)
23.73 15200 0.02 mile west of Yamhill-Newberg Highway (OR240)
RESUME TWO-WAY TRAFFIC
West city limits to Newberg
Equation: MP 24.58 BK = MP Z24.49
25.51 28400 0.03 mile south of Bienz Road
26.09 25600 0.02 mile northeast of 9th Street
26.44 24000 0.02 mile north of Niederberger Road
28.88 21900 0.02 mile north of Riverwood Road
29.59 21900 0.20 mile north of Salmon River Highway (OR18)
29.99 10200 0.20 mile west of Salmon River Highway (OR18)
East city limits of Lafayette 32.31 14000 0.02 mile west of Madison Street
32.75 15000 0.04 mile east of Mineral Springs Road
34.75 15700 0.10 mile east of Tualatin Valley Highway (OR47)
34.95 16800 0.10 mile west of Tualatin Valley Highway (OR47)
35.21 18800 0.03 mile west of Riverside Drive
35.50 16200 0.02 mile west of Lafayette Avenue
36.34 22000 0.02 mile east of McDonald Lane
36.98 20000 0.02 mile northeast of Baker Street
37.02 24800 0.02 mile southwest of Baker Street
SOUTHBOUND - ONE-WAY TRAFFIC
On Adams Street
37.14 12500 0.02 mile south of 15th Street (Walnut Way)
37.34 12500 0.02 mile north of 10th Street
37.70 12800 0.02 mile north of 3rd Street
37.73 12900 0.01 mile south of 3rd Street
37.79 11200 0.03 mile south of 2nd Street
NORTHBOUND - ONE-WAY TRAFFIC
On Baker Street
37.14 11400 0.02 mile south of 15th Street (Walnut Way)
37.34 12800 0.02 mile north of 10th Street
37.68 12700 0.02 mile north of 3rd Street
37.72 12200 0.02 mile south of 3rd Street
37.77 12000 0.02 mile south of 2nd Street
RESUME TWO-WAY TRAFFIC
38.28 21900 0.01 mile north of Linfield College Entrance (Blaine Street)
38.97 18700 0.02 mile north of connection to Salmon River Highway (OR18), and Old Sheridan Road
Equation: MP 29.05 BK = MP Z39.01 AH
39.04 13200 0.05 mile south of connection to Salmon River Highway (OR18) and Old Sheridan Road
39.44 10000 0.20 mile south of Salmon River Highway (OR18) overcrossing
43.40 7800 0.10 mile north of Amity-Dayton Highway (OR233)
43.60 9300 0.10 mile south of Amity-Dayton Highway (OR233)
North city limits of Amity
44.67 8700 0.01 mile north of Bellevue-Hopewell Highway (North Jct.)
44.73 8700 0.02 mile north of Bellevue-Hopewell Highway (south junction)
44.89 6300 0.09 mile south of Church Street
47.45 5600 * Amity Automatic Traffic Recorder, Sta. 36-005, 0.07 mile north of Yamhill-Polk County Line

2012
TRAFFIC VOLUMES ON STATE HIGHWAYS
Milepoint 2012 AADT All Vehicles
ATR AVC Location Description
94
PACIFIC HIGHWAY WEST NO. 91 (Continued)
49.74 4200 0.02 mile south of Bethel Road
57.18 4600 0.10 mile north of westbound Willamina-Salem Highway (OR22) ramps
57.61 11000 0.05 mile south of eastbound Willamina-Salem Highway (OR22) ramps
57.89 11600 At Rickreall Creek Bridge
59.24 11400 0.10 mile south of Orrs Corner Road
60.13 13700 0.10 mile south of Clow Corner Road
62.41 12400 0.10 mile south of Hoffman Road
North city limits of Monmouth
63.40 13900 0.02 mile north of Monmouth-Independence Highway (OR51)
63.44 13000 0.02 mile south of Monmouth-Independence Highway (OR51)
63.85 8300 0.06 mile south of Gwinn Street E.
66.58 7800 0.02 mile south of Parker Road
70.65 7200 0.02 mile north of Airlie Road (Suver Road)
70.90 7100 * Monmouth Automatic Traffic Recorder, Sta. 27-005, 1.43 mile north of Polk-Benton County Line
73.90 6500 0.15 mile south of Camp Adair Road
75.75 9800 0.02 mile south of Arnold Avenue
Equation: MP 77.94 BK = MP Z77.90 AH
78.91 11300 0.02 mile north of Lewisburg Road
78.95 11600 0.02 mile south of Lewisburg Road
80.62 14900 0.85 mile south of N.E. Elliott Circle
81.24 14400 0.05 mile south of N.E. Conifer Boulevard
81.47 15600 0.05 mile south of Walnut Boulevard
81.82 20400 0.05 mile south of Circle Boulevard
SOUTHBOUND - ONE-WAY TRAFFIC
On Fourth Street
83.00 10600 0.05 mile south of N.W. Buchanan Avenue
83.26 10100 0.02 mile north of N.W. Tyler Avenue
83.33 10000 0.02 mile north of Corvallis-Lebanon Highway (OR34-Westbound)
83.37 12300 0.02 mile south of Corvallis-Lebanon Highway (OR34-Westbound)
83.44 12600 0.02 mile south of Corvallis-Lebanon Highway (OR34-Eastbound)
83.54 10400 0.02 mile north of S.W. Monroe Avenue
83.69 13200 0.02 mile north of S.W. Jefferson Avenue
83.91 12600 0.02 mile north of Western Boulevard
83.95 13200 0.02 mile south of Western Boulevard
84.23 12200 On Marys River Bridge
NORTHBOUND - ONE-WAY TRAFFIC
On Third Street
82.90 10600 0.05 mile north of N.W. Buchanan Avenue
83.26 11600 0.02 mile north of N.W. Tyler Avenue
83.33 12000 0.02 mile north of Corvallis-Lebanon Highway (OR34-Westbound)
83.38 14100 0.03 mile south of Corvallis-Lebanon Highway (OR3-Westbound)
83.44 16000 0.02 mile south of Corvallis-Lebanon Highway (OR34-Eastbound)
83.54 16100 0.02 mile north of S.W. Monroe Street
83.73 16100 0.02 mile south of S.W. Jefferson Avenue
83.91 14000 0.02 mile north of Western Boulevard
83.95 12700 0.02 mile south of Western Boulevard
84.14 10100 On Marys River Bridge
RESUME TWO-WAY TRAFFIC
84.44 24100 0.05 mile north of S.W. Avery Avenue and Crystal Lake Drive

2012
TRAFFIC VOLUMES ON STATE HIGHWAYS
Milepoint 2012 AADT All Vehicles
ATR AVC Location Description
95
PACIFIC HIGHWAY WEST NO. 91 (Continued)
84.54 22700 0.05 mile south of S.W. Avery Avenue and Crystal Lake Drive
84.85 20700 0.11 mile north of S.E. Alexander Avenue
85.01 19100 0.05 mile south of S.E. Alexander Avenue
85.57 11100 0.02 mile south of S.E. Goodnight Avenue
86.20 8500 0.10 mile north of S.E. Kiger Island Drive
87.55 6100 0.02 mile south of S.W. Airport Avenue (Corvallis Airport)
94.90 5100 * Monroe Automatic Traffic Recorder, Sta. 02-007, 5.47 miles north of Monroe Cemetery Road
100.35 6500 0.02 mile north of Monroe Cemetery Road
101.10 7300 0.05 mile north of Territorial Highway
East city limits of Monroe
101.68 5200 0.02 mile south of West Ingram Island Road
Benton - Lane County Line, MP 104.36
106.51 5300 0.02 mile south of Lingo Lane
108.71 7200 0.05 mile north of Albany-Junction City Highway (OR99E)
On Ivy Street
108.83 11000 0.07 mile south of Albany-Junction City Highway (OR99E)
Equation: MP 108.92 BK = MP Z108.89 AH
109.23 14100 0.02 mile north of 10th Avenue
109.45 15400 0.02 mile north of 6th Avenue
109.74 15300 0.02 mile north of 1st Avenue
109.86 14500 0.10 mile south of 1st Avenue
South city limits of Junction City
111.18 14600 0.10 mile north of Mapleton-Junction City Highway (OR36)
111.38 13000 0.10 mile south of Mapleton-Junction City Highway (OR36)
115.28 14600 * Eugene-Meadowview Automatic Vehicle Classifier, Sta. 20-024, 1.00 mile south of Meadowview Road
115.89 13500 0.05 mile south of Awbrey Lane
116.94 14500 0.10 mile north of Airport Road
117.79 17400 0.10 mile north of Irving Road
117.99 21700 0.10 mile south of Irving Road
118.85 11400 North city limits of Eugene, 0.43 mile south of Belt Line Highway (OR569)
119.21 20800 0.10 mile south of Prairie Road
120.11 20900 0.20 mile south of Pattison Avenue
120.58 19400 0.03 mile north of Royal Avenue
120.87 22000 0.10 mile north of Elmira Road
121.04 22300 0.10 mile north of Roosevelt Boulevard
121.24 22000 0.10 mile south of Roosevelt Boulevard
EASTBOUND - ONE-WAY TRAFFIC
On 7th Avenue
122.24 18100 0.02 mile west of Garfield Street
122.28 21800 0.02 mile east of Garfield Street
122.75 24300 0.02 mile west of Polk Street
123.21 26600 0.02 mile west of Madison Street
MP 123.37 to MP 125.48 Transferred to the City of E ugene
WESTBOUND - ONE-WAY TRAFFIC
On 6th Avenue 122.17 18600 0.02 mile west of Garfield Street
122.21 21100 0.02 mile east of Garfield Street
122.68 23400 0.02 mile west of Polk Street
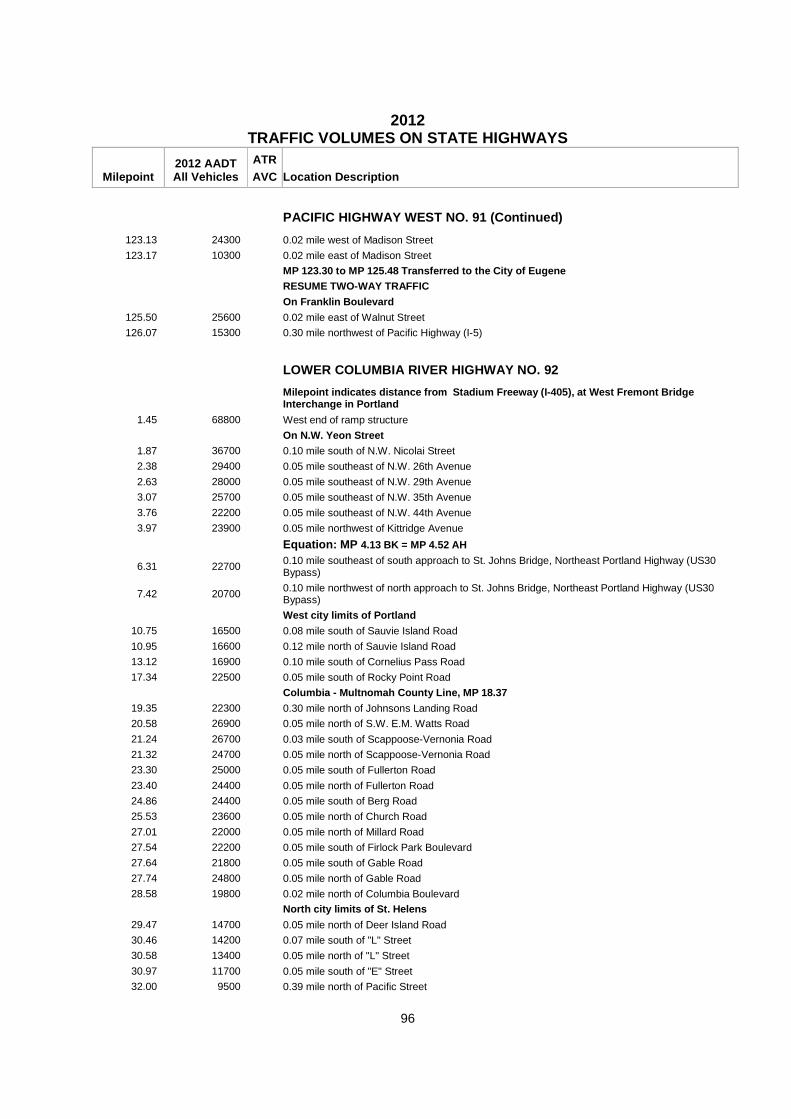
2012
TRAFFIC VOLUMES ON STATE HIGHWAYS
Milepoint 2012 AADT All Vehicles
ATR AVC Location Description
96
PACIFIC HIGHWAY WEST NO. 91 (Continued)
123.13 24300 0.02 mile west of Madison Street
123.17 10300 0.02 mile east of Madison Street
MP 123.30 to MP 125.48 Transferred to the City of E ugene
RESUME TWO-WAY TRAFFIC
On Franklin Boulevard
125.50 25600 0.02 mile east of Walnut Street
126.07 15300 0.30 mile northwest of Pacific Highway (I-5)
LOWER COLUMBIA RIVER HIGHWAY NO. 92
Milepoint indicates distance from Stadium Freeway (I-405), at West Fremont Bridge Interchange in Portland
1.45 68800 West end of ramp structure
On N.W. Yeon Street
1.87 36700 0.10 mile south of N.W. Nicolai Street
2.38 29400 0.05 mile southeast of N.W. 26th Avenue
2.63 28000 0.05 mile southeast of N.W. 29th Avenue
3.07 25700 0.05 mile southeast of N.W. 35th Avenue
3.76 22200 0.05 mile southeast of N.W. 44th Avenue
3.97 23900 0.05 mile northwest of Kittridge Avenue
Equation: MP 4.13 BK = MP 4.52 AH
6.31 22700 0.10 mile southeast of south approach to St. Johns Bridge, Northeast Portland Highway (US30 Bypass)
7.42 20700 0.10 mile northwest of north approach to St. Johns Bridge, Northeast Portland Highway (US30 Bypass)
West city limits of Portland
10.75 16500 0.08 mile south of Sauvie Island Road
10.95 16600 0.12 mile north of Sauvie Island Road
13.12 16900 0.10 mile south of Cornelius Pass Road
17.34 22500 0.05 mile south of Rocky Point Road
Columbia - Multnomah County Line, MP 18.37
19.35 22300 0.30 mile north of Johnsons Landing Road
20.58 26900 0.05 mile north of S.W. E.M. Watts Road
21.24 26700 0.03 mile south of Scappoose-Vernonia Road
21.32 24700 0.05 mile north of Scappoose-Vernonia Road
23.30 25000 0.05 mile south of Fullerton Road
23.40 24400 0.05 mile north of Fullerton Road
24.86 24400 0.05 mile south of Berg Road
25.53 23600 0.05 mile north of Church Road
27.01 22000 0.05 mile north of Millard Road
27.54 22200 0.05 mile south of Firlock Park Boulevard
27.64 21800 0.05 mile south of Gable Road
27.74 24800 0.05 mile north of Gable Road
28.58 19800 0.02 mile north of Columbia Boulevard
North city limits of St. Helens
29.47 14700 0.05 mile north of Deer Island Road
30.46 14200 0.07 mile south of "L" Street
30.58 13400 0.05 mile north of "L" Street
30.97 11700 0.05 mile south of "E" Street
32.00 9500 0.39 mile north of Pacific Street
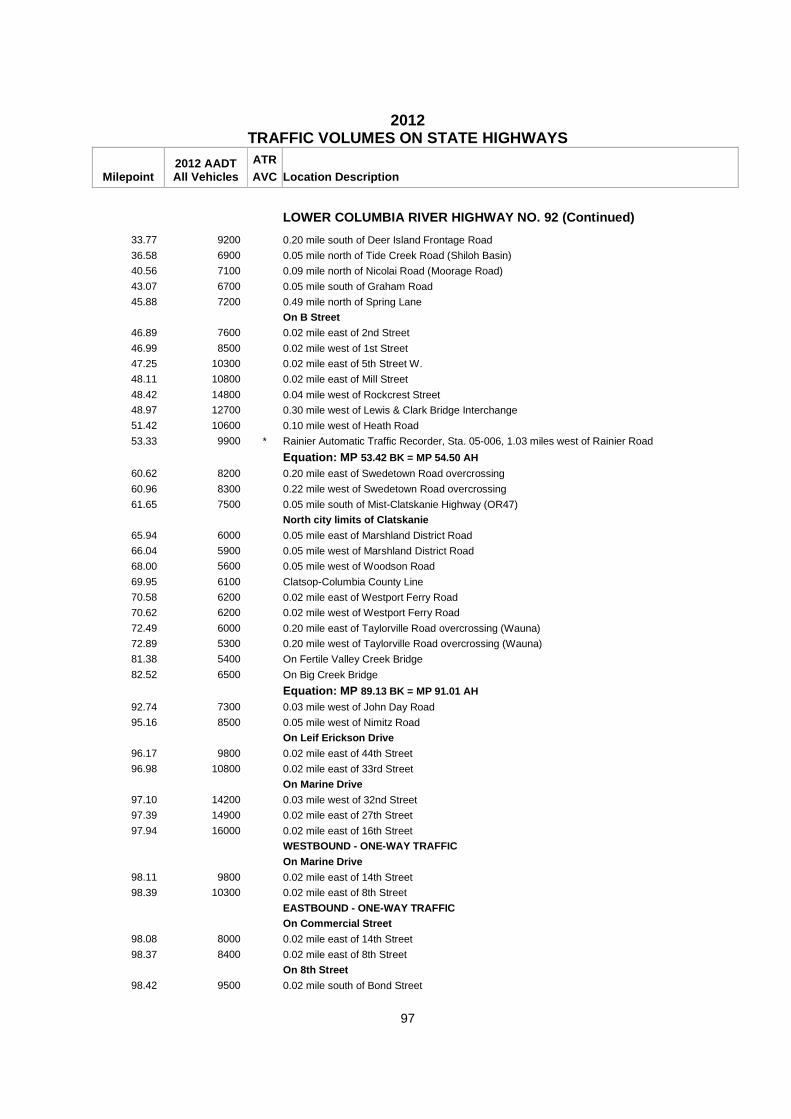
2012
TRAFFIC VOLUMES ON STATE HIGHWAYS
Milepoint 2012 AADT All Vehicles
ATR AVC Location Description
97
LOWER COLUMBIA RIVER HIGHWAY NO. 92 (Continued)
33.77 9200 0.20 mile south of Deer Island Frontage Road
36.58 6900 0.05 mile north of Tide Creek Road (Shiloh Basin)
40.56 7100 0.09 mile north of Nicolai Road (Moorage Road)
43.07 6700 0.05 mile south of Graham Road
45.88 7200 0.49 mile north of Spring Lane
On B Street
46.89 7600 0.02 mile east of 2nd Street
46.99 8500 0.02 mile west of 1st Street
47.25 10300 0.02 mile east of 5th Street W.
48.11 10800 0.02 mile east of Mill Street
48.42 14800 0.04 mile west of Rockcrest Street
48.97 12700 0.30 mile west of Lewis & Clark Bridge Interchange
51.42 10600 0.10 mile west of Heath Road
53.33 9900 * Rainier Automatic Traffic Recorder, Sta. 05-006, 1.03 miles west of Rainier Road
Equation: MP 53.42 BK = MP 54.50 AH
60.62 8200 0.20 mile east of Swedetown Road overcrossing
60.96 8300 0.22 mile west of Swedetown Road overcrossing
61.65 7500 0.05 mile south of Mist-Clatskanie Highway (OR47)
North city limits of Clatskanie
65.94 6000 0.05 mile east of Marshland District Road
66.04 5900 0.05 mile west of Marshland District Road
68.00 5600 0.05 mile west of Woodson Road
69.95 6100 Clatsop-Columbia County Line
70.58 6200 0.02 mile east of Westport Ferry Road
70.62 6200 0.02 mile west of Westport Ferry Road
72.49 6000 0.20 mile east of Taylorville Road overcrossing (Wauna)
72.89 5300 0.20 mile west of Taylorville Road overcrossing (Wauna)
81.38 5400 On Fertile Valley Creek Bridge
82.52 6500 On Big Creek Bridge
Equation: MP 89.13 BK = MP 91.01 AH
92.74 7300 0.03 mile west of John Day Road
95.16 8500 0.05 mile west of Nimitz Road
On Leif Erickson Drive
96.17 9800 0.02 mile east of 44th Street
96.98 10800 0.02 mile east of 33rd Street
On Marine Drive 97.10 14200 0.03 mile west of 32nd Street
97.39 14900 0.02 mile east of 27th Street
97.94 16000 0.02 mile east of 16th Street
WESTBOUND - ONE-WAY TRAFFIC
On Marine Drive
98.11 9800 0.02 mile east of 14th Street
98.39 10300 0.02 mile east of 8th Street
EASTBOUND - ONE-WAY TRAFFIC
On Commercial Street
98.08 8000 0.02 mile east of 14th Street
98.37 8400 0.02 mile east of 8th Street
On 8th Street
98.42 9500 0.02 mile south of Bond Street

2012
TRAFFIC VOLUMES ON STATE HIGHWAYS
Milepoint 2012 AADT All Vehicles
ATR AVC Location Description
98
LOWER COLUMBIA RIVER HIGHWAY NO. 92 (Continued)
RESUME TWO-WAY TRAFFIC
98.48 18200 0.02 mile east of 6th Street
99.31 18500 0.03 mile northeast of Oregon Coast Highway (US101)
HISTORIC COLUMBIA RIVER HIGHWAY NO. 100
Milepoint indicates distance from the west end of the Sandy River Bridge, east of Troutdale
0.03 2500 On Sandy River Bridge
0.18 3800 0.10 mile south of Jordan Road
East city limits of Troutdale
2.50 2600 0.05 mile west of Baseline Road (SE Stark Street)
2.75 4900 0.20 mile east of Baseline Road (SE Stark Street)
4.02 4700 0.05 mile west of Lucas Road at Springdale
4.22 4400 0.05 mile west of E. Bell Road
4.32 3300 0.05 mile southeast of E. Bell Road
4.49 1700 0.10 mile east of S.E. Hurlbert Road (Bull Run)
5.30 1200 0.15 mile north of Smith Road
6.72 2500 0.05 mile west of N.E. Evans Road (N.E. Corbett Hill Road) at Corbett
6.87 1800 0.13 mile east of N.E. Evans Road (N.E. Corbett Hill Road) at Corbett
7.54 2600 0.10 mile west of N.E. Littlepage Road
8.71 2000 0.05 mile west of Larch Mountain Road
8.81 850 0.05 mile east of Larch Mountain Road
11.61 670 0.01 mile west of Latourell Road
12.13 670 0.02 mile west of Alex Barr Road
13.94 700 * Bridal Veil Automatic Traffic Recorder, Sta. 26-012, 0.10 mile west of Bridal Veil Falls State Park
14.82 770 0.02 mile west of connection with Columbia River Highway (I-84)
21.60 1000 0.04 mile west of split to connections with Columbia River Highway (I-84)
30.41 4100 0.02 mile southwest of ramp to Bridge of the Gods, 0.24 mile north of Cascade Locks south city limits
30.48 3700 0.02 mile north of ramp to Bridge of the Gods
30.66 3900 0.02 mile northeast of S.E. Venture Street
31.26 3500 0.02 mile west of Forest lane
48.93 9100 0.05 mile east of Columbia River Highway (I-84), 0.01 mile northwest of Country Club Road
49.19 7700 0.11 mile east of Mt. Adams Avenue
On Cascade Avenue
49.49 8400 0.05 mile east of Rand Road (Wasco Street)
49.80 8800 0.02 mile east of 20th Street
On Oak Street
50.07 8100 0.05 mile west of 13th Street, Hood River Highway
50.17 5100 0.05 mile east of 13th Street, Hood River Highway
50.38 5300 0.02 mile east of 9th Street
50.72 4900 0.02 mile west of 2nd Street. connection to Columbia River Highway (I-84)
50.76 3200 0.02 mile east of 2nd Street, connection to Columbia River Highway (I-84)
On State Avenue
50.93 5300 0.05 mile east of Front Street
51.05 4800 East city limits of Hood River, 0.21 mile west of Mt. Hood Highway (OR35), and connection to Columbia River Highway (I-84)
51.31 640 0.05 mile east of Mt. Hood Highway (OR35), and connection overcrossing to Columbia River Highway (I-84)

2012
TRAFFIC VOLUMES ON STATE HIGHWAYS
Milepoint 2012 AADT All Vehicles
ATR AVC Location Description
99
HISTORIC COLUMBIA RIVER HIGHWAY NO. 100 (Continued)
51.86 320 0.05 mile east of Riverview Drive
52.00 160 0.02 mile east of Highline Road
57.28 2300 West city limits of Mosier, 0.15 mile west of connection overcrossing to Columbia River Highway (I-84)
On 1st Avenue
57.61 2500 0.02 mile west of Washington Street
57.72 710 0.02 mile west of Oregon Street
57.84 830 On Mosier Creek Bridge
East city limits of Mosier
66.14 260 0.02 mile west of Rowena Ferry Road
66.47 300 0.05 mile west of connection to Columbia River Highway (I-84)
66.54 590 0.05 mile east of connection to Columbia River Highway (I-84)
70.32 520 0.03 mile north of road to The Dalles Country Club
70.86 1200 0.03 mile south of Taylor-Frantz Road (Discovery Drive)
72.15 1600 0.05 mile north of connection from Columbia River Highway (I-84)
72.37 5800 West city limits of The Dalles, 0.06 mile south of Division Street
NEHALEM HIGHWAY NO. 102
Milepoint indicates distance from Oregon Coast Hig hway (US101), in Astoria
On W. Marine Drive
0.24 11600 0.02 mile south of Florence Avenue
0.50 11500 0.06 mile south of Antwerp Street
0.71 10100 0.02 mile southeast of Denver Street
1.40 9700 0.02 mile west of Warrenton-Astoria Highway (US101 Bus.)
On Olney Avenue 1.59 11700 0.02 mile west of 7th Street
1.63 5000 0.02 mile east of 7th Street
2.62 4100 0.02 mile west of Williamsport Road
2.78 4600 0.10 mile north of Dybile Road
4.34 4000 0.02 mile north of Walluski Loop Road (North Jct.)
4.58 3000 On Walluski River Bridge
7.05 1800 0.10 mile north of Walluski Loop Road (south junction)
7.18 1700 0.03 mile south of Walluski Loop Road (south junction)
9.46 740 0.02 mile east of Youngs River Loop Road
12.26 510 0.02 mile west of Norlund-McCoy Road
25.43 370 On Hamilton Creek Bridge
29.07 450 0.02 mile west of Beneke Road
29.18 450 0.02 mile west of Fishhawk Falls Highway at Jewell
29.25 420 0.05 mile east of Fishhawk Falls Highway at Jewell
29.84 550 On Nehalem River Bridge
39.13 530 Clatsop-Columbia County Line
40.79 600 0.02 mile east of Neverstill Road at Birkenfeld
46.08 1200 0.08 mile west of Mist-Clatskanie Highway (OR47)
46.19 910 0.05 mile east of Mist-Clatskanie Highway (OR47)
53.17 990 0.02 mile north of Apiary Road
53.29 970 0.10 mile south of Apiary Road
57.09 1300 0.02 mile north of Scappoose-Vernonia Road
57.16 1500 0.05 mile south of Scappoose-Vernonia Road
59.23 1600 0.02 mile south of Stoney Point Road

2012
TRAFFIC VOLUMES ON STATE HIGHWAYS
Milepoint 2012 AADT All Vehicles
ATR AVC Location Description
100
NEHALEM HIGHWAY NO. 102 (Continued)
60.40 1700 0.25 mile north of Knott Street
61.25 2500 0.02 mile north of Pebble Creek Road
61.29 2800 0.02 mile south of Pebble Creek Road
61.72 3900 0.01 mile west of Texas Avenue
62.11 4900 0.02 mile west of State Avenue
62.27 5200 On Rock Creek Bridge
62.51 3900 0.03 mile east of Rose Avenue
62.58 3400 0.04 mile south of Bridge Street
62.79 3300 0.02 mile south of River Street
64.27 3100 0.10 mile east of Timber Road
64.51 2200 0.10 mile southwest of Adams Road
69.14 2400 Columbia-Washington County Line
71.44 2500 0.02 mile north of Pebble Creek Road
76.47 2600 0.12 mile north of Strassel Road-Fisher Road
76.80 2900 0.16 mile north of Sunset Highway (US26)
81.23 2600 0.40 mile south of Sunset Highway (US26)
82.75 3100 0.10 mile north of N.W. Banks Road - Cedar Canyon Road
82.90 5000 0.05 mile south of N.W. Banks Road - Cedar Canyon Road
83.10 5200 0.02 mile north of Sunset Street
83.14 5400 0.02 mile south of Sunset Street
83.53 5800 0.19 mile north of Wilson River Highway (OR6)
83.92 6100 0.20 mile south of Wilson River Highway (OR6)
87.85 6100 0.20 mile north of Verboort Road
88.17 7500 0.12 mile south of Verboort Road
88.95 7000 0.02 mile south Sunset Drive
90.62 11600 0.02 mile north of Tualatin Valley Highway (OR8)
FISHHAWK FALLS HIGHWAY NO. 103
Milepoint indicates distance from Nehalem Highway (OR202), at Jewell
0.05 770 0.05 mile south of Nehalem Highway (OR202)
0.60 620 0.20 mile south of Meadow Lane
5.25 710 On Nehalem River (Vinemaple Bridge)
6.23 430 0.02 mile east of Cow Creek Road
6.90 960 0.02 mile south of Bay Road
8.97 1100 0.05 mile north of Sunset Highway (US26)
FORT STEVENS HIGHWAY NO. 104
Milepoint indicates distance from west city limits of Warrenton
0.00 1200 West city limits of Warrenton
0.12 2300 0.02 mile east of Lake Drive
0.72 2900 0.02 mile northwest of Fleet Street
0.76 2800 0.02 mile southeast of Fleet Street
1.25 3600 0.10 mile west of NW 17th Place
2.35 4800 0.02 mile north of N.W. 7th Place
3.11 6000 0.02 mile north of N.W. 1st Street
3.22 6300 0.10 mile north of Warrenton-Astoria Highway (US101 Bus.)
3.40 6400 0.01 mile south of Warrenton-Astoria Highway (US101 Bus.)
3.46 5400 0.02 mile south of S.E. 2nd Street

2012
TRAFFIC VOLUMES ON STATE HIGHWAYS
Milepoint 2012 AADT All Vehicles
ATR AVC Location Description
101
FORT STEVENS HIGHWAY NO. 104 (Continued)
3.92 5300 0.02 mile south of S.E. 9th Street
4.36 5300 0.07 mile north of Fort Stevens Highway Spur
4.45 4500 0.02 mile south of Fort Stevens Highway Spur
4.95 2700 0.10 mile south of Whiskey Road (N. junction)
5.98 3200 0.05 mile north of Oregon Coast Highway (US101)
WARRENTON-ASTORIA HIGHWAY NO. 105
Milepoint indicates distance from Fort Stevens Hig hway, in Warrenton
0.04 8800 0.04 mile east of Fort Stevens Highway
0.71 9800 0.02 mile west of S.E. King Avenue
0.75 9900 0.02 mile east of S.E. King Avenue
1.02 2800 0.08 mile south of S.E. 2nd Street
1.25 4600 0.02 mile north of Oregon Coast Highway (US101)
1.31 5300 0.04 mile south of Oregon Coast Highway (US101)
1.75 2900 South city limits of Warrenton
3.63 3700 0.10 mile east of Airport Lane
5.23 4300 0.02 mile west of "G" Street
5.60 4500 0.10 mile west of Youngs River Loop Road at Miles Crossing
5.80 6100 0.10 mile north of Youngs River Loop Road at Miles Crossing
7.05 6900 0.20 mile south of OR202
MIST-CLATSKANIE HIGHWAY NO. 110
Milepoint indicates distance from Lower Columbia R iver Highway (US30), in Clatskanie
0.05 1400 0.05 mile west of Lower Columbia River Highway (US30)
0.39 990 0.02 mile northwest of Norman Street
0.65 890 West city limits of Clatskanie
1.48 600 0.02 mile south of Palm Hill Road
6.61 430 0.10 mile south of Clatskanie Mountain Road
11.79 670 0.10 mile north of Nehalem Highway (OR202)
SWIFT HIGHWAY NO. 120
Milepoint indicates distance from U.P.R.R. overcro ssing
0.40 14100 On Columbia Slough Bridge
2.51 27500 0.20 mile west of southbound I-5 on-ramp
NORTHEAST PORTLAND HIGHWAY NO. 123
Milepoint indicates distance from Lower Columbia R iver Highway (US30), at St. Johns Bridge, in Portland
On N. Philadelphia Avenue
1.25 22500 At the northeast end of the St. Johns Bridge
1.30 19400 0.01 mile south of N. Ivanhoe Street
On N. Ivanhoe Street
1.44 8600 0.02 mile east of N. John Avenue
On N. Richmond Avenue 1.54 7000 0.02 mile north of N. Ivanhoe Street
On N. Lombard Street
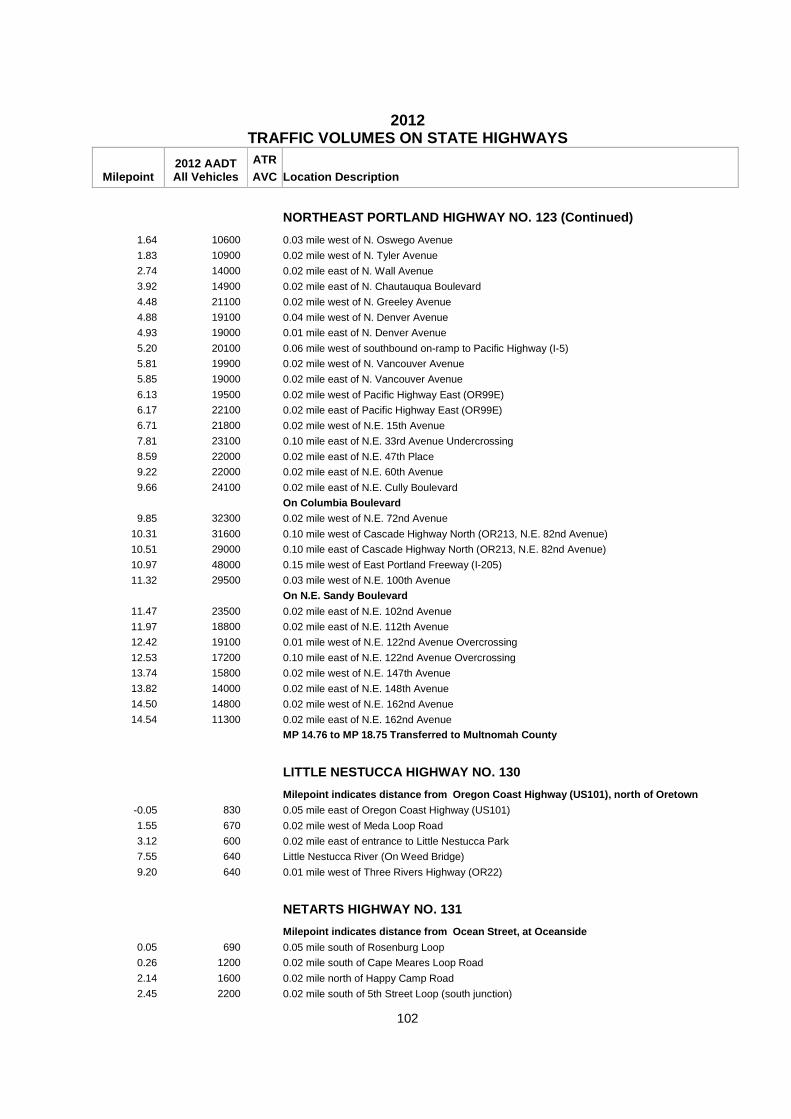
2012
TRAFFIC VOLUMES ON STATE HIGHWAYS
Milepoint 2012 AADT All Vehicles
ATR AVC Location Description
102
NORTHEAST PORTLAND HIGHWAY NO. 123 (Continued)
1.64 10600 0.03 mile west of N. Oswego Avenue
1.83 10900 0.02 mile west of N. Tyler Avenue
2.74 14000 0.02 mile east of N. Wall Avenue
3.92 14900 0.02 mile east of N. Chautauqua Boulevard
4.48 21100 0.02 mile west of N. Greeley Avenue
4.88 19100 0.04 mile west of N. Denver Avenue
4.93 19000 0.01 mile east of N. Denver Avenue
5.20 20100 0.06 mile west of southbound on-ramp to Pacific Highway (I-5)
5.81 19900 0.02 mile west of N. Vancouver Avenue
5.85 19000 0.02 mile east of N. Vancouver Avenue
6.13 19500 0.02 mile west of Pacific Highway East (OR99E)
6.17 22100 0.02 mile east of Pacific Highway East (OR99E)
6.71 21800 0.02 mile west of N.E. 15th Avenue
7.81 23100 0.10 mile east of N.E. 33rd Avenue Undercrossing
8.59 22000 0.02 mile east of N.E. 47th Place
9.22 22000 0.02 mile east of N.E. 60th Avenue
9.66 24100 0.02 mile east of N.E. Cully Boulevard
On Columbia Boulevard
9.85 32300 0.02 mile west of N.E. 72nd Avenue
10.31 31600 0.10 mile west of Cascade Highway North (OR213, N.E. 82nd Avenue)
10.51 29000 0.10 mile east of Cascade Highway North (OR213, N.E. 82nd Avenue)
10.97 48000 0.15 mile west of East Portland Freeway (I-205)
11.32 29500 0.03 mile west of N.E. 100th Avenue
On N.E. Sandy Boulevard
11.47 23500 0.02 mile east of N.E. 102nd Avenue
11.97 18800 0.02 mile east of N.E. 112th Avenue
12.42 19100 0.01 mile west of N.E. 122nd Avenue Overcrossing
12.53 17200 0.10 mile east of N.E. 122nd Avenue Overcrossing
13.74 15800 0.02 mile west of N.E. 147th Avenue
13.82 14000 0.02 mile east of N.E. 148th Avenue
14.50 14800 0.02 mile west of N.E. 162nd Avenue
14.54 11300 0.02 mile east of N.E. 162nd Avenue
MP 14.76 to MP 18.75 Transferred to Multnomah Count y
LITTLE NESTUCCA HIGHWAY NO. 130
Milepoint indicates distance from Oregon Coast Hig hway (US101), north of Oretown
-0.05 830 0.05 mile east of Oregon Coast Highway (US101)
1.55 670 0.02 mile west of Meda Loop Road
3.12 600 0.02 mile east of entrance to Little Nestucca Park
7.55 640 Little Nestucca River (On Weed Bridge)
9.20 640 0.01 mile west of Three Rivers Highway (OR22)
NETARTS HIGHWAY NO. 131
Milepoint indicates distance from Ocean Street, at Oceanside
0.05 690 0.05 mile south of Rosenburg Loop
0.26 1200 0.02 mile south of Cape Meares Loop Road
2.14 1600 0.02 mile north of Happy Camp Road
2.45 2200 0.02 mile south of 5th Street Loop (south junction)

2012
TRAFFIC VOLUMES ON STATE HIGHWAYS
Milepoint 2012 AADT All Vehicles
ATR AVC Location Description
103
NETARTS HIGHWAY NO. 131 (Continued)
2.89 2500 0.02 mile southeast of Park Avenue at Netarts
4.16 3500 0.02 mile east of Whiskey Creek Road
6.36 3900 0.05 mile west of Burton-Fraser Road
7.26 3500 0.04 mile south of Bayocean Road
7.32 4500 0.02 mile north of Bayocean Road
8.56 4800 West city limits of Tillamook
8.70 5500 0.02 mile west of Cedar Avenue
8.81 5400 0.02 mile west of Elm Avenue
8.96 6000 0.02 mile west of Stillwell Avenue
9.06 5300 0.02 mile west of Oregon Coast Highway, (US101-Southbound) and Wilson River Highway (OR6-Eastbound)
NORTH UMPQUA HIGHWAY NO. 138
Milepoint indicates distance from Stephens Street, in Roseburg
-0.89 18700 At Pacific Highway (I-5) overcrossing on Harvard Avenue
-0.70 18400 0.02 mile west of Madrone Street
EASTBOUND - ONE-WAY TRAFFIC
On Oak Street
-0.63 9600 0.05 mile east of Madrone Street
WESTBOUND - ONE-WAY TRAFFIC
On Washington Street
-0.52 11500 0.05 mile east of Madrone Street
RESUME TWO-WAY TRAFFIC
-0.14 17100 0.02 mile north of Douglas Avenue
0.02 10700 0.02 mile east of Stephens Street
0.12 15400 0.02 mile east of Winchester Street
0.19 14800 0.02 mile east of Fowler Street
0.39 14100 0.02 mile east of Casper Street
1.07 12100 0.02 mile west of Rifle Range Road
1.61 8800 0.14 mile east of N.E. Patterson Street
2.77 7800 0.02 mile east of N.E. Douglas Avenue
3.33 6700 0.02 mile east of Sunshine Road
5.71 4400 0.02 mile northeast of Hatfield Drive
14.07 3400 0.02 mile west of Wild River Drive (Old N. Umpqua Highway)
16.23 4200 0.02 mile west of Little River Road
16.35 3900 0.02 mile east of Glide Loop Drive
21.99 1500 0.02 mile west of Rock Creek Road
22.11 1300 0.10 mile east of Rock Creek Road
28.41 940 * Glide Automatic Traffic Recorder, Sta. 10-004, 0.10 mile west of Susan Creek Road
38.86 800 0.02 mile west of Steamboat Creek Road
39.08 780 0.14 mile east of Steamboat Creek Road
72.89 620 0.02 mile west of Lemolo Falls Road
78.83 510 0.02 mile south of Diamond Lake Road (East Shore Road)
83.06 550 0.02 mile north of West Diamond Lake Highway (OR230)
85.90 1200 0.10 mile west of north entrance to Crater Lake National Park
86.24 1200 0.10 mile east of north entrance to Crater Lake National Park
100.71 1200 0.10 mile west of The Dalles-California Highway (US97)

2012
TRAFFIC VOLUMES ON STATE HIGHWAYS
Milepoint 2012 AADT All Vehicles
ATR AVC Location Description
104
HILLSBORO-SILVERTON HIGHWAY NO. 140
Milepoint indicates distance from Tualatin Valley Highway (OR8), in Hillsboro
On S. 1st Avenue
0.02 10100 0.02 mile south of Tualatin Valley Highway (OR8-Westbound)
0.11 8400 0.02 mile south of Tualatin Valley Highway (OR8-Eastbound)
0.20 10300 0.02 mile south of Walnut Street
0.53 8100 0.02 mile south of Wood Street
South city limits of Hillsboro
2.53 8800 0.02 mile south of Tongue Lane
5.43 8400 0.02 mile north of Farmington Highway (OR10)
5.47 7500 0.02 mile south of Farmington Highway (OR10)
5.64 4000 0.10 mile south of Bald Peak Road
7.68 3700 0.05 mile north of E. Laurel Road
8.11 3900 0.10 mile north of Midway Road
10.03 3100 0.02 mile west of Scholls Highway (OR210)
10.07 3600 0.02 mile south of Scholls Highway (OR210)
10.15 2800 0.02 mile south of Scholls-Mountain Home Road
10.90 2700 0.02 mile south of Mountain Home Road
Washington - Yamhill County Line, MP 15.61
16.46 2600 0.02 mile south of Bald Peak Road (south junction)
17.94 3200 0.02 mile south of North Valley Road
18.45 3500 North city limits of Newberg, 0.07 mile north of E. Foothills Drive
On College Street
19.07 7800 0.02 mile north of Melody Lane
19.35 7200 0.02 mile south of Columbia Drive
19.72 7800 0.02 mile south of Mission Drive
19.90 7200 0.02 mile south of Vermillion Street
20.13 7100 0.02 mile north of Pacific Highway West (OR99W-Westbound)
20.17 5500 0.02 mile north of Pacific Highway West (OR99W-Eastbound)
20.68 5500 0.03 mile south of Pacific Highway West (OR99W)
21.15 10900 0.05 mile northwest of 2nd Street
21.55 10700 0.05 mile northwest of S. Springbrook Road
22.00 11700 0.17 mile north of Wynooski Road
Yamhill - Marion County Line, MP 23.46
25.03 3400 0.02 mile southwest of McKay Road N.E.
North city limits of St. Paul 28.09 3400 0.02 mile north of Church Street
28.13 1300 0.02 mile east of Main Street
31.88 2600 * St. Paul Automatic Traffic Recorder, Sta. 24-020, 1.85 miles south of St. Paul Highway N.E.
33.08 1500 0.02 mile east of Mahoney Road
35.89 4300 0.12 mile south of W. Woodburn-Butteville Road and 0.13 mile north of W. Butteville Road
36.20 5300 West city limits of Woodburn, 0.20 mile east of W. Butteville Road
36.68 17600 0.10 mile west of Pacific Highway (I-5)
36.88 24500 0.10 mile east of Pacific Highway (I-5)
37.82 18900 0.05 mile west of Settlemier Avenue
37.92 16600 0.05 mile east of Settlemier Avenue
39.24 14600 0.05 mile west of Pacific Highway East (OR99E)
39.31 7700 0.02 mile east of Pacific Highway East (OR99E)
39.66 7000 East city limits of Woodburn, 0.07 mile west of Serres Lane N.E.

2012
TRAFFIC VOLUMES ON STATE HIGHWAYS
Milepoint 2012 AADT All Vehicles
ATR AVC Location Description
105
HILLSBORO-SILVERTON HIGHWAY NO. 140 (Continued)
41.42 6500 0.02 mile west of Union School Road
41.61 6000 0.10 mile south of Elliott Prairie Road N.E.
43.13 5100 0.02 mile south of Bonney Road
45.49 6100 0.02 mile north of Industrial Way N.E. (0.01 mile north of Mt. Angel City Limits)
45.92 6900 0.02 mile south of Marquam Street
46.14 6200 0.02 mile south of Charles Street
46.19 5800 0.02 mile south of Church Street
South city limits of Mt. Angel
47.97 6200 0.02 mile south of Downs Road N.E.
49.64 5800 0.02 mile south of Jefferson Street
50.22 8800 0.02 mile north of "C" Street
WESTBOUND - ONE-WAY TRAFFIC
On C Street
50.26 11800 0.02 mile west of 1st Street
50.31 11900 0.02 mile west of Front Street
SOUTHBOUND - ONE-WAY TRAFFIC
On Water Street
50.37 4200 0.02 mile south of "C" Street
50.62 4400 0.02 mile north of Cascade Highway South (OR213)
50.70 4700 0.02 mile north of Silver Creek Falls Highway (OR214-Lewis Street)
NORTHBOUND - ONE-WAY TRAFFIC
On 1st Street
50.26 4600 0.02 mile south of "C" Street
50.40 4600 0.02 mile north of Park Street
EASTBOUND - ONE-WAY TRAFFIC
On Lewis Street
50.62 5000 0.02 mile east of Silver Creek Falls Highway (OR214)
BEAVERTON-TUALATIN HIGHWAY NO. 141
Milepoint indicates distance from Tualatin Valley Highway (OR8), in Beaverton
2.57 27400 0.14 mile west of Beaverton-Tigard Highway (OR217)
2.82 25800 0.02 mile west of Scholls Highway (OR210), at Progress
2.86 24900 0.02 mile east of Scholls Highway (OR210), at Progress
3.33 12200 0.02 mile east of S.W. Oleson Road
4.07 10400 0.02 mile north of S.W. Locust Street
4.23 12100 0.02 mile north of S.W. Oak Street
4.67 13000 0.02 mile north of S.W. Pfaffle Road
4.95 10600 0.02 mile north of Pacific Highway West (OR99W)
4.99 11900 0.02 mile south of Pacific Highway West (OR99W)
5.29 11700 0.02 mile south of Scoffins Street
5.42 12300 0.02 mile south of S.W. Commercial Street
5.55 14700 0.02 mile south of S.W. Burnham Street
5.82 14100 0.02 mile south of S.W. Omara Street
6.31 17800 0.02 mile north of S.W. Bonita Road
6.35 13500 0.02 mile south of S.W. Bonita Road
MP 7.07 to MP 7.69 Transferred to the City of Tigar d 7.85 12400 South city limits of Tigard, north city limits of Durham
8.64 22200 0.02 mile south of Lower Boones Ferry Road

2012
TRAFFIC VOLUMES ON STATE HIGHWAYS
Milepoint 2012 AADT All Vehicles
ATR AVC Location Description
106
BEAVERTON-TUALATIN HIGHWAY NO. 141 (Continued)
MP 8.91 to MP 11.52 Transferred to the City of Tual atin
MP 11.52 to MP 12.47 Transferred to Washington Coun ty
12.51 18400 0.05 mile south of Day Street
12.67 26700 0.04 mile east of Commercial Circle
FARMINGTON HIGHWAY NO. 142
Milepoint indicates distance from Hillsboro - Silv erton Highway (OR219), west of Farmington
MP -0.06 to MP 5.88 Transferred to Washington Count y
5.90 14500 0.02 mile east of S.W. 198th Avenue
6.64 17500 0.03 mile west of S.W. 185th Avenue
6.77 15800 0.10 mile east of S.W. 185th Avenue
7.13 18700 0.02 mile east of Rosa Road
MP 7.38 to MP 8.68 Transferred to Washington County
SCHOLLS HIGHWAY NO. 143
Milepoint indicates distance from Hillsboro - Silv erton Highway (OR219), at Scholls
MP 5.50 to MP 9.03 Transferred to Washington County
9.07 40000 0.13 mile southwest of Beaverton-Tigard Highway (OR217)
9.52 20300 East city limits of Beaverton, 0.08 mile south of Beaverton-Tualatin Highway
MP 9.61 to MP 12.40 Transferred to Washington Count y
BEAVERTON-TIGARD HIGHWAY NO. 144
Milepoint indicates distance from Sunset Highway ( US26), north of Beaverton
0.50 106600 0.50 mile south of Sunset Highway (US26)
1.21 111500 0.30 mile north of Tualatin Valley Highway (OR8) Overcrossing
2.16 118200 0.40 mile south of Beaverton-Hillsdale Highway (OR10) Overcrossing
2.73 115700 0.25 mile south of S.W. Allen Boulevard Interchange
3.32 115100 0.30 mile south of S.W. Denney Road Interchange
4.02 87000 0.20 mile south of Beaverton-Tualatin Highway Interchange
4.57 103800 0.30 mile south of Scholls Highway (OR210) Interchange
5.60 115700 0.30 mile northwest of Pacific Highway West (OR99W)
6.30 99900 0.40 mile southeast of Pacific Highway West (OR99W)
6.96 102600 0.10 mile northwest of southbound Pacific Highway (I-5) ramps
SALEM-DAYTON HIGHWAY NO. 150
Milepoint indicates distance from Salmon River Hig hway (OR18), north of Dayton
0.25 3700 0.25 mile southeast of Salmon River Highway (OR18)
0.50 3500 0.02 mile southeast of Amity-Dayton Highway (OR233)
0.56 3500 0.02 mile southeast of Alder Street
0.87 2500 South city limits of Dayton, 0.03 mile south of Palmer Lane
3.60 2400 0.02 mile south of Palmer Creek Road
7.15 2200 0.02 mile north of Grand Island Road
9.20 2000 0.06 mile north of Bellevue-Hopewell Highway
9.31 3700 0.05 mile south of Bellevue-Hopewell Highway
10.98 3200 Yamhill-Polk County Line
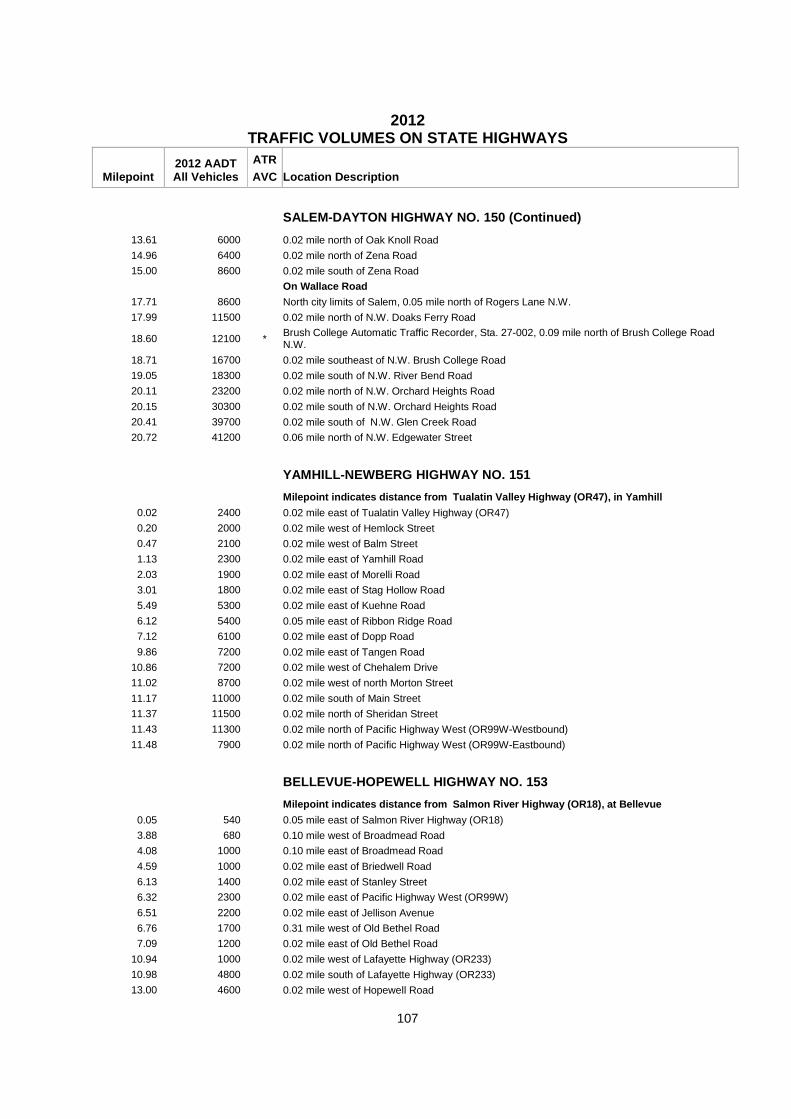
2012
TRAFFIC VOLUMES ON STATE HIGHWAYS
Milepoint 2012 AADT All Vehicles
ATR AVC Location Description
107
SALEM-DAYTON HIGHWAY NO. 150 (Continued)
13.61 6000 0.02 mile north of Oak Knoll Road
14.96 6400 0.02 mile north of Zena Road
15.00 8600 0.02 mile south of Zena Road
On Wallace Road
17.71 8600 North city limits of Salem, 0.05 mile north of Rogers Lane N.W.
17.99 11500 0.02 mile north of N.W. Doaks Ferry Road
18.60 12100 * Brush College Automatic Traffic Recorder, Sta. 27-002, 0.09 mile north of Brush College Road N.W.
18.71 16700 0.02 mile southeast of N.W. Brush College Road
19.05 18300 0.02 mile south of N.W. River Bend Road
20.11 23200 0.02 mile north of N.W. Orchard Heights Road
20.15 30300 0.02 mile south of N.W. Orchard Heights Road
20.41 39700 0.02 mile south of N.W. Glen Creek Road
20.72 41200 0.06 mile north of N.W. Edgewater Street
YAMHILL-NEWBERG HIGHWAY NO. 151
Milepoint indicates distance from Tualatin Valley Highway (OR47), in Yamhill
0.02 2400 0.02 mile east of Tualatin Valley Highway (OR47)
0.20 2000 0.02 mile west of Hemlock Street
0.47 2100 0.02 mile west of Balm Street
1.13 2300 0.02 mile east of Yamhill Road
2.03 1900 0.02 mile east of Morelli Road
3.01 1800 0.02 mile east of Stag Hollow Road
5.49 5300 0.02 mile east of Kuehne Road
6.12 5400 0.05 mile east of Ribbon Ridge Road
7.12 6100 0.02 mile east of Dopp Road
9.86 7200 0.02 mile east of Tangen Road
10.86 7200 0.02 mile west of Chehalem Drive
11.02 8700 0.02 mile west of north Morton Street
11.17 11000 0.02 mile south of Main Street
11.37 11500 0.02 mile north of Sheridan Street
11.43 11300 0.02 mile north of Pacific Highway West (OR99W-Westbound)
11.48 7900 0.02 mile north of Pacific Highway West (OR99W-Eastbound)
BELLEVUE-HOPEWELL HIGHWAY NO. 153
Milepoint indicates distance from Salmon River Hig hway (OR18), at Bellevue
0.05 540 0.05 mile east of Salmon River Highway (OR18)
3.88 680 0.10 mile west of Broadmead Road
4.08 1000 0.10 mile east of Broadmead Road
4.59 1000 0.02 mile east of Briedwell Road
6.13 1400 0.02 mile east of Stanley Street
6.32 2300 0.02 mile east of Pacific Highway West (OR99W)
6.51 2200 0.02 mile east of Jellison Avenue
6.76 1700 0.31 mile west of Old Bethel Road
7.09 1200 0.02 mile east of Old Bethel Road
10.94 1000 0.02 mile west of Lafayette Highway (OR233)
10.98 4800 0.02 mile south of Lafayette Highway (OR233)
13.00 4600 0.02 mile west of Hopewell Road

2012
TRAFFIC VOLUMES ON STATE HIGHWAYS
Milepoint 2012 AADT All Vehicles
ATR AVC Location Description
108
BELLEVUE-HOPEWELL HIGHWAY NO. 153 (Continued)
14.26 2000 0.10 mile west of Salem-Dayton Highway (OR221)
LAFAYETTE HIGHWAY NO. 154
Milepoint indicates distance from Salmon River Hig hway (OR18), east of McMinnville
0.10 2900 0.10 mile south of Salmon River Highway (OR18)
0.54 1600 0.02 mile south of Amity-Dayton Highway (OR233)
1.36 5600 0.20 mile south of Stringtown Road
3.29 4100 0.02 mile south of Stockhoff Road
4.09 4200 0.02 mile south of Alderman Road
6.24 4200 0.02 mile north of Bellevue-Hopewell Highway
AMITY-DAYTON HIGHWAY NO. 155
Milepoint indicates distance from Pacific Highway West (OR99W), north of Amity
0.15 1400 0.15 mile east of Pacific Highway West (OR99W)
2.24 1400 0.02 mile west of Whiteson Road
2.28 1700 0.02 mile east of Whiteson Road
4.30 1200 0.02 mile east of Airport Road
6.56 2700 0.10 mile south of Stringtown Road
6.76 5100 0.10 mile north of Stringtown Road
7.42 2000 0.02 mile southwest of Lafayette Highway (OR233)
7.46 1100 0.02 mile northeast of Lafayette Highway (OR233)
8.30 1500 0.02 mile east of Flower Lane
8.68 2600 0.02 mile west of 8th Street
9.03 3200 0.02 mile west of 5th Street
9.17 2800 0.02 mile west of Salem-Dayton Highway (OR221)
WILLAMINA-SHERIDAN HIGHWAY NO. 157
Milepoint indicates distance from Salmon River Hig hway (OR18), at Wallace Bridge
0.55 3800 0.06 mile north of Willamina-Salem Highway (OR22)
1.56 4400 South city limits of Willamina, 0.08 mile south of Hill Drive
2.03 4900 0.02 mile south of Polk Street
2.24 6200 0.04 mile south of W. Main Street
2.31 5900 0.02 mile west of "B" Street
2.40 5600 0.02 mile east of "C" Street
2.54 4900 0.02 mile east of "E" Street
2.78 3700 0.11 mile east of Oaken Hills Drive
5.59 4800 0.08 mile east of Rock Creek Road
6.53 5500 0.02 mile west of Western Street
7.11 6000 0.02 mile west of Bridge Street
7.15 6200 0.02 mile east of Bridge Street
7.26 5700 0.02 mile east of Hill Street
8.10 4700 0.50 mile west of Salmon River Highway (OR18)
CASCADE HIGHWAY SOUTH NO. 160
Milepoint indicates distance from East Portland Fr eeway (I-205), at Park Place Interchange
0.12 60500 0.02 mile north of Washington Street
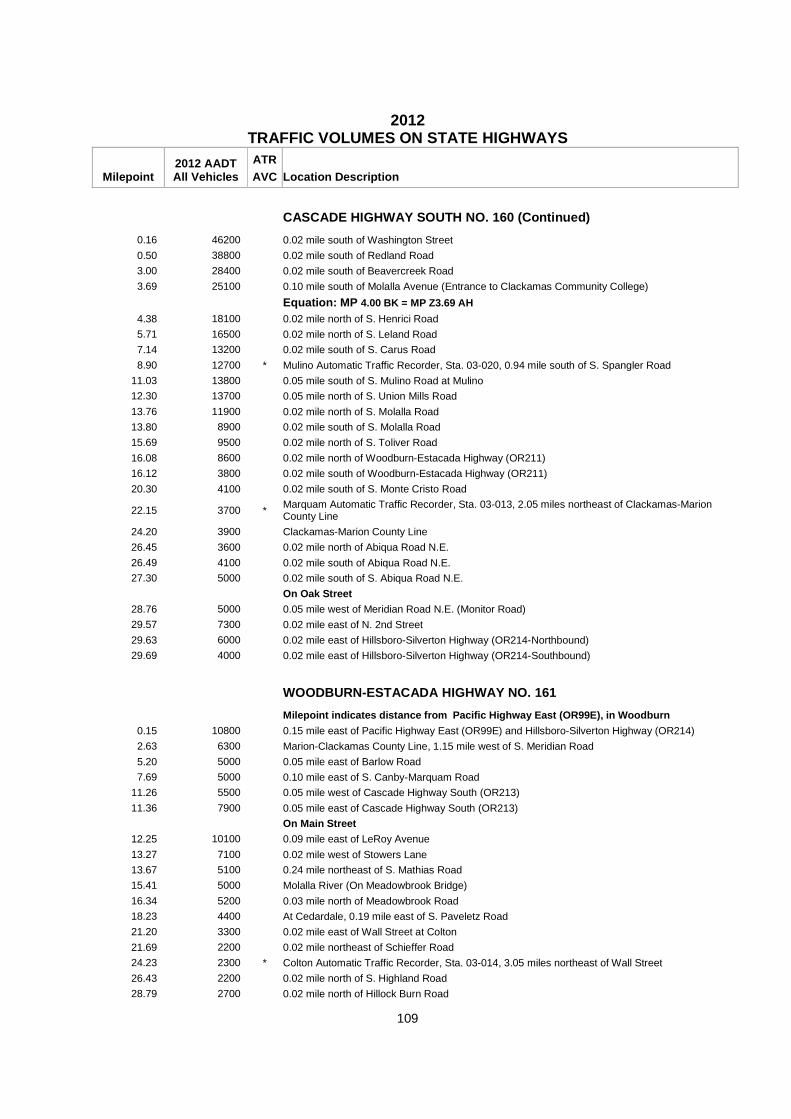
2012
TRAFFIC VOLUMES ON STATE HIGHWAYS
Milepoint 2012 AADT All Vehicles
ATR AVC Location Description
109
CASCADE HIGHWAY SOUTH NO. 160 (Continued)
0.16 46200 0.02 mile south of Washington Street
0.50 38800 0.02 mile south of Redland Road
3.00 28400 0.02 mile south of Beavercreek Road
3.69 25100 0.10 mile south of Molalla Avenue (Entrance to Clackamas Community College)
Equation: MP 4.00 BK = MP Z3.69 AH
4.38 18100 0.02 mile north of S. Henrici Road
5.71 16500 0.02 mile north of S. Leland Road
7.14 13200 0.02 mile south of S. Carus Road
8.90 12700 * Mulino Automatic Traffic Recorder, Sta. 03-020, 0.94 mile south of S. Spangler Road
11.03 13800 0.05 mile south of S. Mulino Road at Mulino
12.30 13700 0.05 mile north of S. Union Mills Road
13.76 11900 0.02 mile north of S. Molalla Road
13.80 8900 0.02 mile south of S. Molalla Road
15.69 9500 0.02 mile north of S. Toliver Road
16.08 8600 0.02 mile north of Woodburn-Estacada Highway (OR211)
16.12 3800 0.02 mile south of Woodburn-Estacada Highway (OR211)
20.30 4100 0.02 mile south of S. Monte Cristo Road
22.15 3700 * Marquam Automatic Traffic Recorder, Sta. 03-013, 2.05 miles northeast of Clackamas-Marion County Line
24.20 3900 Clackamas-Marion County Line
26.45 3600 0.02 mile north of Abiqua Road N.E.
26.49 4100 0.02 mile south of Abiqua Road N.E.
27.30 5000 0.02 mile south of S. Abiqua Road N.E.
On Oak Street
28.76 5000 0.05 mile west of Meridian Road N.E. (Monitor Road)
29.57 7300 0.02 mile east of N. 2nd Street
29.63 6000 0.02 mile east of Hillsboro-Silverton Highway (OR214-Northbound)
29.69 4000 0.02 mile east of Hillsboro-Silverton Highway (OR214-Southbound)
WOODBURN-ESTACADA HIGHWAY NO. 161
Milepoint indicates distance from Pacific Highway East (OR99E), in Woodburn
0.15 10800 0.15 mile east of Pacific Highway East (OR99E) and Hillsboro-Silverton Highway (OR214)
2.63 6300 Marion-Clackamas County Line, 1.15 mile west of S. Meridian Road
5.20 5000 0.05 mile east of Barlow Road
7.69 5000 0.10 mile east of S. Canby-Marquam Road
11.26 5500 0.05 mile west of Cascade Highway South (OR213)
11.36 7900 0.05 mile east of Cascade Highway South (OR213)
On Main Street
12.25 10100 0.09 mile east of LeRoy Avenue
13.27 7100 0.02 mile west of Stowers Lane
13.67 5100 0.24 mile northeast of S. Mathias Road
15.41 5000 Molalla River (On Meadowbrook Bridge)
16.34 5200 0.03 mile north of Meadowbrook Road
18.23 4400 At Cedardale, 0.19 mile east of S. Paveletz Road
21.20 3300 0.02 mile east of Wall Street at Colton
21.69 2200 0.02 mile northeast of Schieffer Road
24.23 2300 * Colton Automatic Traffic Recorder, Sta. 03-014, 3.05 miles northeast of Wall Street
26.43 2200 0.02 mile north of S. Highland Road
28.79 2700 0.02 mile north of Hillock Burn Road

2012
TRAFFIC VOLUMES ON STATE HIGHWAYS
Milepoint 2012 AADT All Vehicles
ATR AVC Location Description
110
WOODBURN-ESTACADA HIGHWAY NO. 161 (Continued)
30.73 3000 0.02 mile north of Day Hill Road (south junction)
32.55 5400 0.02 mile north of Hayden Road
33.20 6200 0.02 mile east of Day Hill Road (North Jct.)
33.40 6100 South city limits of Estacada, 0.09 mile south of Clackamas Highway (OR224)
NORTH SANTIAM HIGHWAY NO. 162
Milepoint indicates distance from E. State Street and Airport Road, in Salem
1.17 55600 0.25 mile west of Pacific Highway (I-5)
1.61 42700 0.30 mile west of Lancaster Drive Interchange
2.82 24100 * North Santiam Automatic Traffic Recorder, Sta. 24-004, 0.91 mile east of Lancaster Drive Interchange
4.13 24400 0.10 mile east of Deer Park Drive Interchange
5.84 24200 0.40 mile east of Joseph Street Interchange
7.17 20900 0.50 mile east of Silver Creek Falls Highway (OR214) Interchange
10.02 19200 * Aumsville Automatic Traffic Recorder, Sta. 24-005, 1.08 miles east of Shaw Highway Interchange
12.03 13200 0.50 mile east of Golf Club Road Interchange
13.63 9000 0.40 mile east of Cascade Highway
14.50 8200 0.20 mile east of Fern Ridge Road
15.78 9000 0.10 mile east of Old Mehama Road (west junction)
22.40 8500 0.02 mile west of Albany-Lyons Highway (OR226), at Mehama
22.44 7300 0.02 mile east of Albany-Lyons Highway (OR226), at Mehama
23.25 7000 0.02 mile east of North Fork Road
West city limits of Mill City
30.05 6400 0.02 mile east of N.W. 2nd Avenue, connection to Santiam River Bridge
30.39 6400 0.02 mile east of N.E. 4th Avenue
32.09 5900 West city limits of Gates
33.09 5700 0.02 mile west of Horeb Street
33.69 4700 * Gates Automatic Traffic Recorder, Sta. 24-013, 0.95 mile west of Railroad Avenue SE (Entrance to Minto County Park)
43.03 4600 0.30 mile east of Detroit Dam
West city limits of Detroit
50.12 3900 0.05 mile east of Breitenbush Road
51.30 3900 * Detroit Automatic Traffic Recorder, Sta. 24-015, 1.20 miles east of Detroit Avenue
52.56 3900 West city limits of Idanha
54.56 3800 0.02 mile east of Main Street
Marion - Linn County Line, MP 60.79
65.48 3500 On Minto Creek Bridge
69.44 3500 0.02 mile west of Downing Creek Falls Road
81.51 3000 0.40 mile northwest of Santiam Highway (US20)
SILVER CREEK FALLS HIGHWAY NO. 163
Milepoint indicates distance from Center Street in Salem, via OR22
9.16 1600 0.15 mile east of North Santiam Highway (OR22)
10.64 1000 0.02 mile west of Howell Prairie Road at Shaw
11.08 410 0.02 mile east of Shaw Highway S.E.
15.49 940 0.10 mile west of Cascade Highway S.E.
15.69 980 0.10 mile east of Cascade Highway S.E.
17.56 660 0.10 mile east of Victor Point Road

2012
TRAFFIC VOLUMES ON STATE HIGHWAYS
Milepoint 2012 AADT All Vehicles
ATR AVC Location Description
111
SILVER CREEK FALLS HIGHWAY NO. 163 (Continued)
19.45 420 0.10 mile east of Drift Creek Road
27.98 290 0.02 mile south of Hult Road
31.09 500 0.05 mile south of Drakes Road S.E.
31.19 820 0.05 mile north of Drakes Road S.E.
37.48 1500 0.02 mile east of Forest Ridge Road
38.96 2500 0.02 mile west of Quall Road
39.45 4100 0.02 mile east of Ike Mooney Road
On Water Street
40.01 5800 0.02 mile southeast of Peach Street
40.34 7400 0.02 mile northwest of Central Street
40.54 8300 0.02 mile northwest of Koons Street
40.79 9400 0.02 mile southeast of Jersey Street
40.83 9600 0.01 mile southeast of Hillsboro-Silverton Highway (OR214)
JEFFERSON HIGHWAY NO. 164
Milepoint indicates distance from Pacific Highway (I-5), south of Salem
0.37 2900 0.02 mile southeast of Enchanted Way S.E.
2.05 3300 0.02 mile north of Winter Creek Road
3.65 2500 0.02 mile south of Robison Road
4.90 3100 0.02 mile north of Talbot Road
5.47 4300 0.02 mile north of North Avenue
5.51 7000 0.02 mile south of North Avenue
5.74 7000 0.02 mile south of Santiam Street
5.98 6100 0.02 mile south of Union Street
6.37 7400 0.20 mile west of Mill Street
7.30 6500 0.01 mile west of Scravel Hill Road
8.12 6300 0.02 mile east of Mason Road
CLACKAMAS HIGHWAY NO. 171
Milepoint indicates distance from River Road, in M ilwaukie
0.04 7800 0.05 mile east of S.E. 17th Avenue
0.31 24900 0.20 mile east of Pacific Highway East (OR99E)
0.70 24600 0.02 mile south of Harrison Street
0.80 25300 0.02 mile south of Monroe Street
0.95 25900 0.02 mile southeast of Oak Street
1.94 27500 0.05 mile west of S.E. Freeman Way
2.71 27100 0.01 mile west of Rusk Road
3.30 29400 0.10 mile east of S.E. Lake Road
3.60 35400 * Milwaukie Automatic Traffic Recorder, Sta. 03-018, 0.13 mile west of Johnson Road
3.94 35200 0.02 mile west of southbound ramps to Cascade Highway North (OR213)
Equation: MP 3.96 BK = MP Z3.82 AH
Equation: MP 5.18 BK = MP Z4.89 AH
Z 5.04 47800 0.01 mile west of S.E. 82nd Drive
5.58 37600 0.04 mile east of Evelyn Street
6.80 32900 * Clackamas Automatic Traffic Recorder, Sta. 03-017, 0.14 mile west of S.E. 130th Avenue
7.62 31600 0.05 mile east of S.E. 142nd Avenue
8.11 30600 0.05 mile west of Clackamas-Boring Highway (OR212)
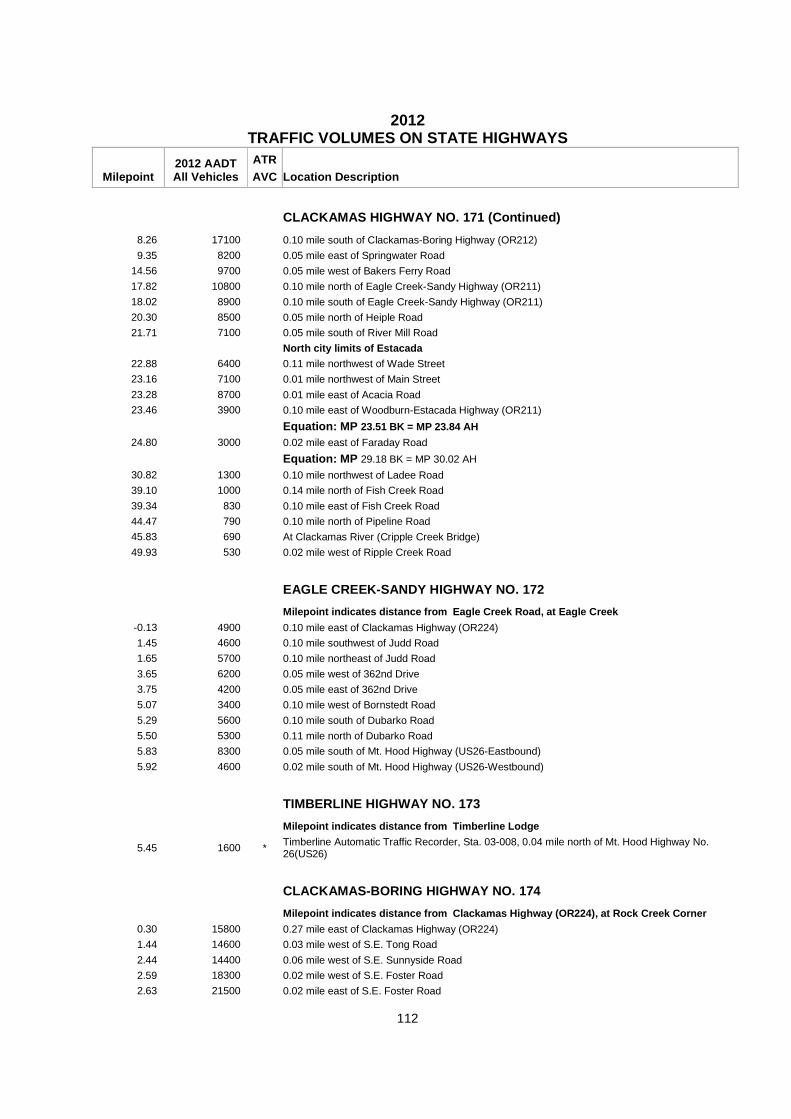
2012
TRAFFIC VOLUMES ON STATE HIGHWAYS
Milepoint 2012 AADT All Vehicles
ATR AVC Location Description
112
CLACKAMAS HIGHWAY NO. 171 (Continued)
8.26 17100 0.10 mile south of Clackamas-Boring Highway (OR212)
9.35 8200 0.05 mile east of Springwater Road
14.56 9700 0.05 mile west of Bakers Ferry Road
17.82 10800 0.10 mile north of Eagle Creek-Sandy Highway (OR211)
18.02 8900 0.10 mile south of Eagle Creek-Sandy Highway (OR211)
20.30 8500 0.05 mile north of Heiple Road
21.71 7100 0.05 mile south of River Mill Road
North city limits of Estacada
22.88 6400 0.11 mile northwest of Wade Street
23.16 7100 0.01 mile northwest of Main Street
23.28 8700 0.01 mile east of Acacia Road
23.46 3900 0.10 mile east of Woodburn-Estacada Highway (OR211)
Equation: MP 23.51 BK = MP 23.84 AH
24.80 3000 0.02 mile east of Faraday Road
Equation: MP 29.18 BK = MP 30.02 AH
30.82 1300 0.10 mile northwest of Ladee Road
39.10 1000 0.14 mile north of Fish Creek Road
39.34 830 0.10 mile east of Fish Creek Road
44.47 790 0.10 mile north of Pipeline Road
45.83 690 At Clackamas River (Cripple Creek Bridge)
49.93 530 0.02 mile west of Ripple Creek Road
EAGLE CREEK-SANDY HIGHWAY NO. 172
Milepoint indicates distance from Eagle Creek Road , at Eagle Creek
-0.13 4900 0.10 mile east of Clackamas Highway (OR224)
1.45 4600 0.10 mile southwest of Judd Road
1.65 5700 0.10 mile northeast of Judd Road
3.65 6200 0.05 mile west of 362nd Drive
3.75 4200 0.05 mile east of 362nd Drive
5.07 3400 0.10 mile west of Bornstedt Road
5.29 5600 0.10 mile south of Dubarko Road
5.50 5300 0.11 mile north of Dubarko Road
5.83 8300 0.05 mile south of Mt. Hood Highway (US26-Eastbound)
5.92 4600 0.02 mile south of Mt. Hood Highway (US26-Westbound)
TIMBERLINE HIGHWAY NO. 173
Milepoint indicates distance from Timberline Lodge
5.45 1600 * Timberline Automatic Traffic Recorder, Sta. 03-008, 0.04 mile north of Mt. Hood Highway No. 26(US26)
CLACKAMAS-BORING HIGHWAY NO. 174
Milepoint indicates distance from Clackamas Highwa y (OR224), at Rock Creek Corner
0.30 15800 0.27 mile east of Clackamas Highway (OR224)
1.44 14600 0.03 mile west of S.E. Tong Road
2.44 14400 0.06 mile west of S.E. Sunnyside Road
2.59 18300 0.02 mile west of S.E. Foster Road
2.63 21500 0.02 mile east of S.E. Foster Road

2012
TRAFFIC VOLUMES ON STATE HIGHWAYS
Milepoint 2012 AADT All Vehicles
ATR AVC Location Description
113
CLACKAMAS-BORING HIGHWAY NO. 174 (Continued)
3.72 17400 0.02 mile east of S.E. 222nd Drive
4.67 15600 0.02 mile west of S.E. 242nd Drive
5.71 11900 0.02 mile east of connection to S.E. 257th Avenue
6.88 13700 0.02 mile south of S.E. Wally Road
7.10 9700 0.03 mile east of S.E. 282nd Avenue
8.27 9600 0.10 mile west of Mt. Hood Highway (US26), eastbound onramp
EDDYVILLE-BLODGETT HIGHWAY NO. 180
Milepoint indicates distance from Corvallis - Newp ort Highway (US20), near Eddyville
0.02 140 0.02 mile east of Corvallis-Newport Highway (US20)
3.86 60 0.02 mile east of Hutchcroft Road
6.10 70 0.04 mile east of Norton Peak Lookout Road
11.55 140 0.15 mile west of Logsden Road
12.53 250 Lincoln-Benton County Line
14.16 330 0.02 mile north of Summit Street
14.36 430 0.02 mile north of Mary's River Road
14.70 470 On Marys River Bridge
19.00 530 0.18 mile north of Corvallis-Newport Highway (US20)
SILETZ HIGHWAY NO. 181
Milepoint indicates distance from Oregon Coast High way (US101), at Kernville
-0.11 1100 0.10 mile east of Oregon Coast Highway (US101)
1.21 770 0.21 mile east of Gorton Road
2.44 690 At National Forest Boundary
4.25 540 0.02 mile west of Siletz Street
5.69 400 0.20 mile east of Euchre Mountain Road
7.95 400 0.10 mile east of S. Siletz River Drive
13.67 350 0.02 mile south of Mowery's Landing Road
17.47 520 At Chitwood Creek
20.66 600 At Siletz River, on Ojalla Bridge
21.13 720 0.02 mile south of Ojalla Road
23.48 1200 North city limits of Siletz
23.74 2500 0.02 mile north of Metcalf Road
23.77 2300 0.01 mile south of Metcalf Road
23.80 4500 0.01 mile north of W. Buford Avenue
23.83 4200 0.02 mile south of W. Buford Avenue
24.10 3600 South city limits of Siletz
27.40 3500 0.04 mile north of Little Depot Creek
31.18 3600 0.06 mile north of Corvallis-Newport Highway (US20)
DALLAS-RICKREALL HIGHWAY NO. 189
Milepoint indicates distance from Kings Valley High way (OR223), in Dallas
0.05 17400 0.05 mile east of Kings Valley Highway (OR223)
0.34 13700 0.02 mile west of Polk Station Road
0.62 10000 0.02 mile east of La Creole Drive
1.05 12700 0.02 mile west of Oak Villa Road
1.57 13300 0.02 mile east of Fir Villa Road
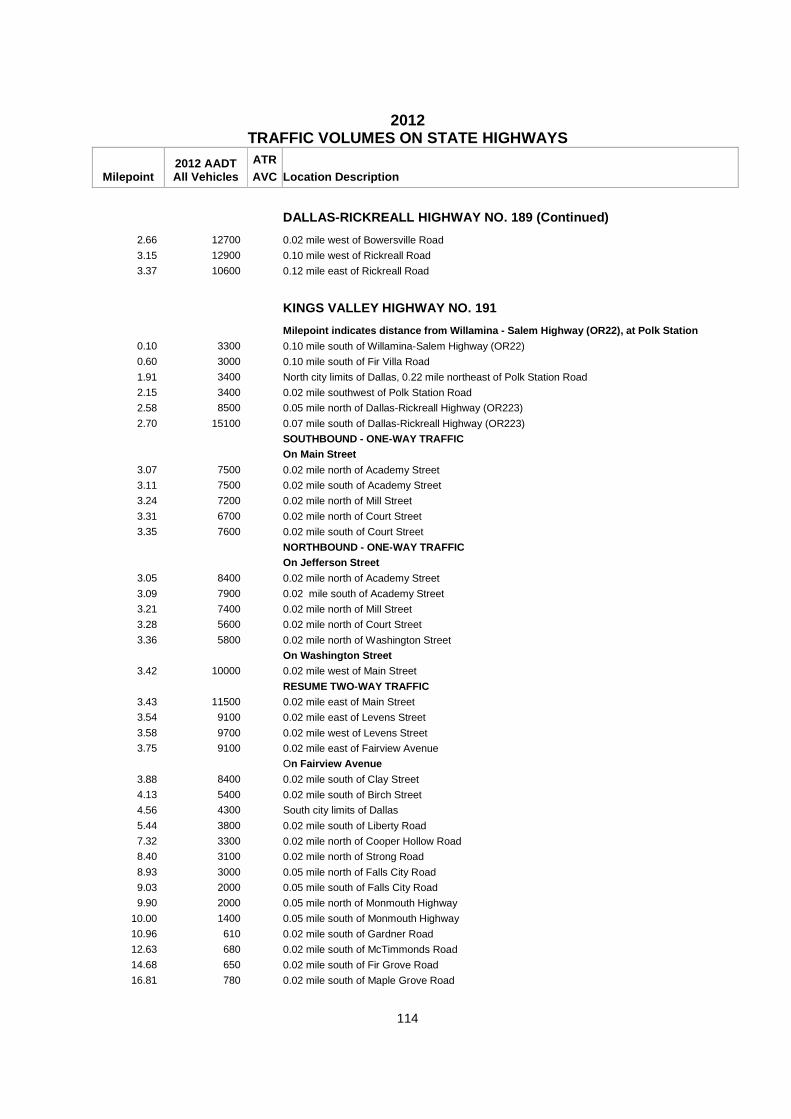
2012
TRAFFIC VOLUMES ON STATE HIGHWAYS
Milepoint 2012 AADT All Vehicles
ATR AVC Location Description
114
DALLAS-RICKREALL HIGHWAY NO. 189 (Continued)
2.66 12700 0.02 mile west of Bowersville Road
3.15 12900 0.10 mile west of Rickreall Road
3.37 10600 0.12 mile east of Rickreall Road
KINGS VALLEY HIGHWAY NO. 191
Milepoint indicates distance from Willamina - Salem Highway (OR22), at Polk Station
0.10 3300 0.10 mile south of Willamina-Salem Highway (OR22)
0.60 3000 0.10 mile south of Fir Villa Road
1.91 3400 North city limits of Dallas, 0.22 mile northeast of Polk Station Road
2.15 3400 0.02 mile southwest of Polk Station Road
2.58 8500 0.05 mile north of Dallas-Rickreall Highway (OR223)
2.70 15100 0.07 mile south of Dallas-Rickreall Highway (OR223)
SOUTHBOUND - ONE-WAY TRAFFIC On Main Street
3.07 7500 0.02 mile north of Academy Street
3.11 7500 0.02 mile south of Academy Street
3.24 7200 0.02 mile north of Mill Street
3.31 6700 0.02 mile north of Court Street
3.35 7600 0.02 mile south of Court Street
NORTHBOUND - ONE-WAY TRAFFIC On Jefferson Street
3.05 8400 0.02 mile north of Academy Street
3.09 7900 0.02 mile south of Academy Street
3.21 7400 0.02 mile north of Mill Street
3.28 5600 0.02 mile north of Court Street
3.36 5800 0.02 mile north of Washington Street
On Washington Street
3.42 10000 0.02 mile west of Main Street
RESUME TWO-WAY TRAFFIC
3.43 11500 0.02 mile east of Main Street
3.54 9100 0.02 mile east of Levens Street
3.58 9700 0.02 mile west of Levens Street
3.75 9100 0.02 mile east of Fairview Avenue
On Fairview Avenue
3.88 8400 0.02 mile south of Clay Street
4.13 5400 0.02 mile south of Birch Street
4.56 4300 South city limits of Dallas
5.44 3800 0.02 mile south of Liberty Road
7.32 3300 0.02 mile north of Cooper Hollow Road
8.40 3100 0.02 mile north of Strong Road
8.93 3000 0.05 mile north of Falls City Road
9.03 2000 0.05 mile south of Falls City Road
9.90 2000 0.05 mile north of Monmouth Highway
10.00 1400 0.05 mile south of Monmouth Highway
10.96 610 0.02 mile south of Gardner Road
12.63 680 0.02 mile south of McTimmonds Road
14.68 650 0.02 mile south of Fir Grove Road
16.81 780 0.02 mile south of Maple Grove Road
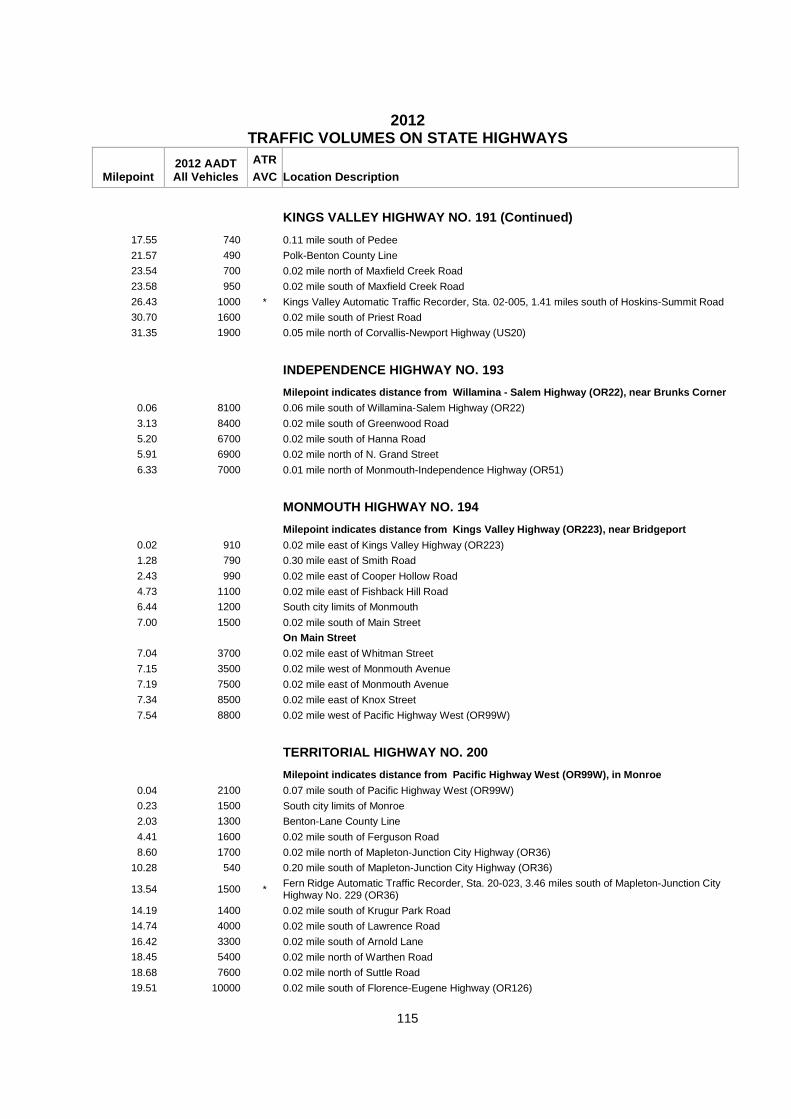
2012
TRAFFIC VOLUMES ON STATE HIGHWAYS
Milepoint 2012 AADT All Vehicles
ATR AVC Location Description
115
KINGS VALLEY HIGHWAY NO. 191 (Continued)
17.55 740 0.11 mile south of Pedee
21.57 490 Polk-Benton County Line
23.54 700 0.02 mile north of Maxfield Creek Road
23.58 950 0.02 mile south of Maxfield Creek Road
26.43 1000 * Kings Valley Automatic Traffic Recorder, Sta. 02-005, 1.41 miles south of Hoskins-Summit Road
30.70 1600 0.02 mile south of Priest Road
31.35 1900 0.05 mile north of Corvallis-Newport Highway (US20)
INDEPENDENCE HIGHWAY NO. 193
Milepoint indicates distance from Willamina - Sale m Highway (OR22), near Brunks Corner
0.06 8100 0.06 mile south of Willamina-Salem Highway (OR22)
3.13 8400 0.02 mile south of Greenwood Road
5.20 6700 0.02 mile south of Hanna Road
5.91 6900 0.02 mile north of N. Grand Street
6.33 7000 0.01 mile north of Monmouth-Independence Highway (OR51)
MONMOUTH HIGHWAY NO. 194
Milepoint indicates distance from Kings Valley Hig hway (OR223), near Bridgeport
0.02 910 0.02 mile east of Kings Valley Highway (OR223)
1.28 790 0.30 mile east of Smith Road
2.43 990 0.02 mile east of Cooper Hollow Road
4.73 1100 0.02 mile east of Fishback Hill Road
6.44 1200 South city limits of Monmouth
7.00 1500 0.02 mile south of Main Street
On Main Street
7.04 3700 0.02 mile east of Whitman Street
7.15 3500 0.02 mile west of Monmouth Avenue
7.19 7500 0.02 mile east of Monmouth Avenue
7.34 8500 0.02 mile east of Knox Street
7.54 8800 0.02 mile west of Pacific Highway West (OR99W)
TERRITORIAL HIGHWAY NO. 200
Milepoint indicates distance from Pacific Highway West (OR99W), in Monroe
0.04 2100 0.07 mile south of Pacific Highway West (OR99W)
0.23 1500 South city limits of Monroe
2.03 1300 Benton-Lane County Line
4.41 1600 0.02 mile south of Ferguson Road
8.60 1700 0.02 mile north of Mapleton-Junction City Highway (OR36)
10.28 540 0.20 mile south of Mapleton-Junction City Highway (OR36)
13.54 1500 * Fern Ridge Automatic Traffic Recorder, Sta. 20-023, 3.46 miles south of Mapleton-Junction City Highway No. 229 (OR36)
14.19 1400 0.02 mile south of Krugur Park Road
14.74 4000 0.02 mile south of Lawrence Road
16.42 3300 0.02 mile south of Arnold Lane
18.45 5400 0.02 mile north of Warthen Road
18.68 7600 0.02 mile north of Suttle Road
19.51 10000 0.02 mile south of Florence-Eugene Highway (OR126)

2012
TRAFFIC VOLUMES ON STATE HIGHWAYS
Milepoint 2012 AADT All Vehicles
ATR AVC Location Description
116
TERRITORIAL HIGHWAY NO. 200 (Continued)
19.72 9000 0.02 mile south of Broadway Avenue
19.89 7100 0.02 mile south of Hunter Road
20.10 6500 0.02 mile north of W. Bolton Hill Road
20.14 5300 0.02 mile south of W. Bolton Hill Road
20.70 2200 0.02 mile south of Perkins Road
24.11 1200 0.02 mile north of Vaughn Road
24.15 1800 0.02 mile south of Vaughn Road
25.15 1600 0.10 mile south of Crow Road
25.49 1000 On Coyote Creek Bridge
27.37 900 0.02 mile south of Doane Road
28.74 790 0.02 mile south of Briggs Hill Road
30.49 760 0.02 mile south of Powell Road
32.02 840 0.04 mile west of Lorane Highway at Gillespie Corners
32.08 1600 0.02 mile south of Lorane Highway at Gillespie Corners
37.75 1100 0.02 mile north of Cottage Grove-Lorane Road
37.79 1200 0.02 mile south of Cottage Grove-Lorane Road
37.89 740 0.02 mile south of Siuslaw River Road
40.43 500 0.02 mile south of Gowdyville Road
42.08 390 Lane-Douglas County Line
ALSEA-DEADWOOD HIGHWAY NO. 201
Milepoint indicates distance from Alsea Highway (O R34), at Alsea
0.02 870 0.02 mile south of Alsea Highway (OR34)
0.93 830 0.02 mile north of South Fork Road
1.11 470 On South Fork of Alsea River Bridge
1.33 390 0.02 mile south of Overman Road
2.55 250 0.02 mile south of Fudge Road
3.73 170 0.02 mile south of Van Horn Road
6.31 150 At Little Lobster Summit
9.41 120 0.02 mile north of Hazel Glen Road
CORVALLIS-LEBANON HIGHWAY NO. 210
Milepoint indicates distance from Albany - Corvall is Highway (US20), in Corvallis
EASTBOUND - ONE-WAY TRAFFIC On Van Buren Street
-0.08 13200 0.02 mile east of Pacific Highway West (OR99W-Southbound)
-0.03 11300 0.02 mile east of Pacific Highway West (OR99W-Northbound)
0.01 10000 0.02 mile east of Albany-Corvallis Highway (US20)
0.13 10100 East city limits of Corvallis, on Willamette River Bridge
WESTBOUND - ONE-WAY TRAFFIC On Harrison Street
-0.08 13300 0.02 mile east of Pacific Highway West (OR99W-Southbound)
-0.04 11100 0.01 mile east of Pacific Highway West (OR99W-Northbound)
0.13 10800 East city limits of Corvallis, on Willamette River Bridge
RESUME TWO-WAY TRAFFIC
0.36 33100 0.02 mile east of Corvallis-Newport Hwy No. 33 (OR34)
1.11 34400 0.10 mile west of Peoria Road
1.31 28200 0.10 mile east of Peoria Road

2012
TRAFFIC VOLUMES ON STATE HIGHWAYS
Milepoint 2012 AADT All Vehicles
ATR AVC Location Description
117
CORVALLIS-LEBANON HIGHWAY NO. 210 (Continued)
3.92 26700 * Riverside Drive Automatic Traffic Recorder, Sta. 22-020, 0.89 mile east of Riverside Drive
5.38 24300 0.02 mile east of Oakville Road
7.15 22900 0.50 mile west of Albany-Junction City Highway (OR99E)
7.85 22100 0.20 mile east of Albany-Junction City Highway (OR99E)
9.74 24900 0.30 mile west of Pacific Highway (I-5)
10.24 16300 0.20 mile east of Pacific Highway (I-5)
10.79 14100 0.02 mile east of Seven Mile Lane
13.99 15900 0.02 mile west of Red Bridge Road
14.03 15000 0.02 mile east of Red Bridge Road
15.90 5300 0.02 mile east of Langmack Road
West city limits of Lebanon 17.28 4700 0.02 mile east of 12th Street
17.44 5000 0.04 mile east of 10th Street
17.62 5500 0.02 mile west of 7th Street
17.78 5700 0.02 mile west of 5th Street
17.99 5500 0.02 mile west of S. 2nd Street
18.11 3500 0.02 mile west of Santiam Highway (US20)
ALBANY-LYONS HIGHWAY NO. 211
Milepoint indicates distance from Santiam Highway (US20), at Crabtree Corner
0.43 4800 * Crabtree Automatic Traffic Recorder, Sta. 22-010, 0.43 mile east of Santiam Highway No. 16 (US20)
4.01 3800 0.02 mile east of Brewster Road
4.79 2600 0.10 mile north of Fish Hatchery Drive
Equation: MP 4.31 BK = MP 4.70 AH
9.57 3100 0.02 mile north of S.W. 6th Avenue
9.67 3400 0.02 mile north of S.W. 4th Avenue
9.78 3500 0.02 mile south of S.E. 1st Avenue
9.82 1600 0.02 mile east of Main Street
9.88 1600 0.02 mile west of Birch Street
9.98 1500 East city limits of Scio, 0.08 mile east of S.E. Cedar Street
11.99 1400 0.02 mile west of Richardson Gap Road
16.49 1000 0.02 mile east of Camp Morrison Drive
18.68 1300 0.10 mile east of Kingston-Jordan Road
23.63 1400 0.02 mile west of road to N. McCully Mountain Road
South city limits of Lyons
24.39 1600 0.02 mile south of Main Street
24.43 3500 0.02 mile west of 6th Street
25.45 4000 At the N. Santiam River Bridge
25.69 3600 0.02 mile south of North Santiam Highway (OR22)
HALSEY-SWEET HOME HIGHWAY NO. 212
Milepoint indicates distance from Albany - Junctio n City Highway (OR99E), in Halsey
0.02 4000 0.02 mile east of Albany-Junction City Highway (OR99E)
1.45 4000 0.02 mile west of Bond Road
2.30 5000 0.10 mile west of Pacific Highway (I-5)
2.50 8000 0.10 mile east of Pacific Highway (I-5)
4.71 4100 0.02 mile east of Fisher Road
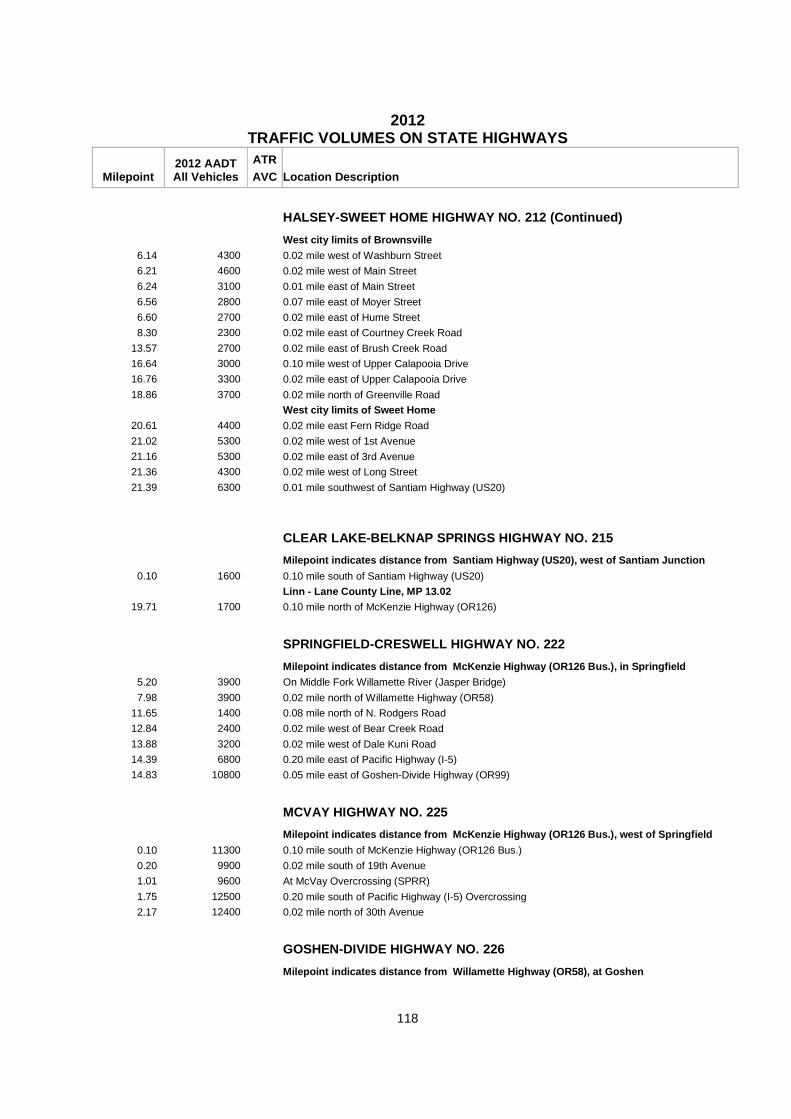
2012
TRAFFIC VOLUMES ON STATE HIGHWAYS
Milepoint 2012 AADT All Vehicles
ATR AVC Location Description
118
HALSEY-SWEET HOME HIGHWAY NO. 212 (Continued)
West city limits of Brownsville
6.14 4300 0.02 mile west of Washburn Street
6.21 4600 0.02 mile west of Main Street
6.24 3100 0.01 mile east of Main Street
6.56 2800 0.07 mile east of Moyer Street
6.60 2700 0.02 mile east of Hume Street
8.30 2300 0.02 mile east of Courtney Creek Road
13.57 2700 0.02 mile east of Brush Creek Road
16.64 3000 0.10 mile west of Upper Calapooia Drive
16.76 3300 0.02 mile east of Upper Calapooia Drive
18.86 3700 0.02 mile north of Greenville Road
West city limits of Sweet Home
20.61 4400 0.02 mile east Fern Ridge Road
21.02 5300 0.02 mile west of 1st Avenue
21.16 5300 0.02 mile east of 3rd Avenue
21.36 4300 0.02 mile west of Long Street
21.39 6300 0.01 mile southwest of Santiam Highway (US20)
CLEAR LAKE-BELKNAP SPRINGS HIGHWAY NO. 215
Milepoint indicates distance from Santiam Highway (US20), west of Santiam Junction
0.10 1600 0.10 mile south of Santiam Highway (US20)
Linn - Lane County Line, MP 13.02 19.71 1700 0.10 mile north of McKenzie Highway (OR126)
SPRINGFIELD-CRESWELL HIGHWAY NO. 222
Milepoint indicates distance from McKenzie Highway (OR126 Bus.), in Springfield
5.20 3900 On Middle Fork Willamette River (Jasper Bridge)
7.98 3900 0.02 mile north of Willamette Highway (OR58)
11.65 1400 0.08 mile north of N. Rodgers Road
12.84 2400 0.02 mile west of Bear Creek Road
13.88 3200 0.02 mile west of Dale Kuni Road
14.39 6800 0.20 mile east of Pacific Highway (I-5)
14.83 10800 0.05 mile east of Goshen-Divide Highway (OR99)
MCVAY HIGHWAY NO. 225
Milepoint indicates distance from McKenzie Highway (OR126 Bus.), west of Springfield
0.10 11300 0.10 mile south of McKenzie Highway (OR126 Bus.)
0.20 9900 0.02 mile south of 19th Avenue
1.01 9600 At McVay Overcrossing (SPRR)
1.75 12500 0.20 mile south of Pacific Highway (I-5) Overcrossing
2.17 12400 0.02 mile north of 30th Avenue
GOSHEN-DIVIDE HIGHWAY NO. 226
Milepoint indicates distance from Willamette Highw ay (OR58), at Goshen

2012
TRAFFIC VOLUMES ON STATE HIGHWAYS
Milepoint 2012 AADT All Vehicles
ATR AVC Location Description
119
GOSHEN-DIVIDE HIGHWAY NO. 226 (Continued)
0.18 4400 0.02 mile west of 1st Street on Goshen Avenue
0.25 5600 0.02 mile south of Goshen Avenue
0.41 5500 0.02 mile south of "B" Street
0.57 5400 0.02 mile south of "D" Street
2.08 4200 0.05 mile north of connection to Pacific Highway (I-5) Frontage Road
2.27 3600 0.02 mile south of Dillard Road
5.39 2900 0.24 mile south of W. Martin Road
5.69 4700 0.05 mile north of Springfield-Creswell Highway
5.76 13000 0.02 mile west of Springfield-Creswell Highway
5.80 4500 0.02 mile south of Oregon Avenue
5.85 4500 0.01 mile south of "C" Avenue
6.53 4000 0.02 mile north of Market Road
6.57 3300 0.02 mile south of Market Road
8.69 2600 0.02 mile north of Tate Road
8.73 2500 0.02 mile south of Tate Road
10.38 2500 0.02 mile south of Lynx Hollow Road
10.70 2800 0.02 mile south of Davison Road at Walker
11.99 3100 0.02 mile north of Saginaw East Road
12.03 3100 0.02 mile south of Saginaw East Road
13.79 2900 on Coast Fork Willamette River Bridge
14.05 3300 0.02 mile north of connection to Pacific Highway (I-5)
14.11 10300 0.04 mile south of connection to Pacific Highway (I-5)
14.40 7800 0.02 mile north of Thayer Avenue
14.68 5500 0.02 mile north of Whiteaker Avenue
14.77 8400 0.02 mile north of Main Street
14.81 8700 0.02 mile south of Main Street
14.86 8300 0.02 mile south of Washington Street
15.09 6000 0.02 mile south of 6th Street
15.32 6200 South city limits of Cottage Grove, 0.04 mile north of Harrison Avenue
15.46 4300 0.10 mile south of Harrison Avenue
16.02 3700 0.20 mile south of South River Road
16.82 2900 0.02 mile south of Dugan Lane
17.32 2800 0.02 mile south of Latham Road
19.55 2100 0.39 mile north of Pacific Highway (I-5)
EUGENE-SPRINGFIELD HIGHWAY NO. 227
Milepoint indicates distance from Pacific Highway W est (OR99/OR126 Bus), in Eugene
0.31 54400 0.10 mile north of connection from W. 6th Avenue (OR99/OR126 Bus.-Westbound)
1.29 58800 0.40 mile east of Delta Highway Interchange
2.82 57200 * Willakenzie Automatic Traffic Recorder, Sta. 20-008, 0.66 mile west of Pacific Highway No. 1 (I-5) in Eugene
4.08 64300 0.60 mile east of Pacific Highway (I-5) Interchange
5.17 57000 0.50 mile east of Springfield Highway Interchange (OR528)
6.59 42500 0.50 mile east of Mohawk Boulevard Interchange
8.66 30200 * East Springfield Automatic Traffic Recorder, Sta. 20-027, 0.39 mile north of 52nd Street
9.76 19400 0.20 mile north of McKenzie Highway (OR126 Bus.)
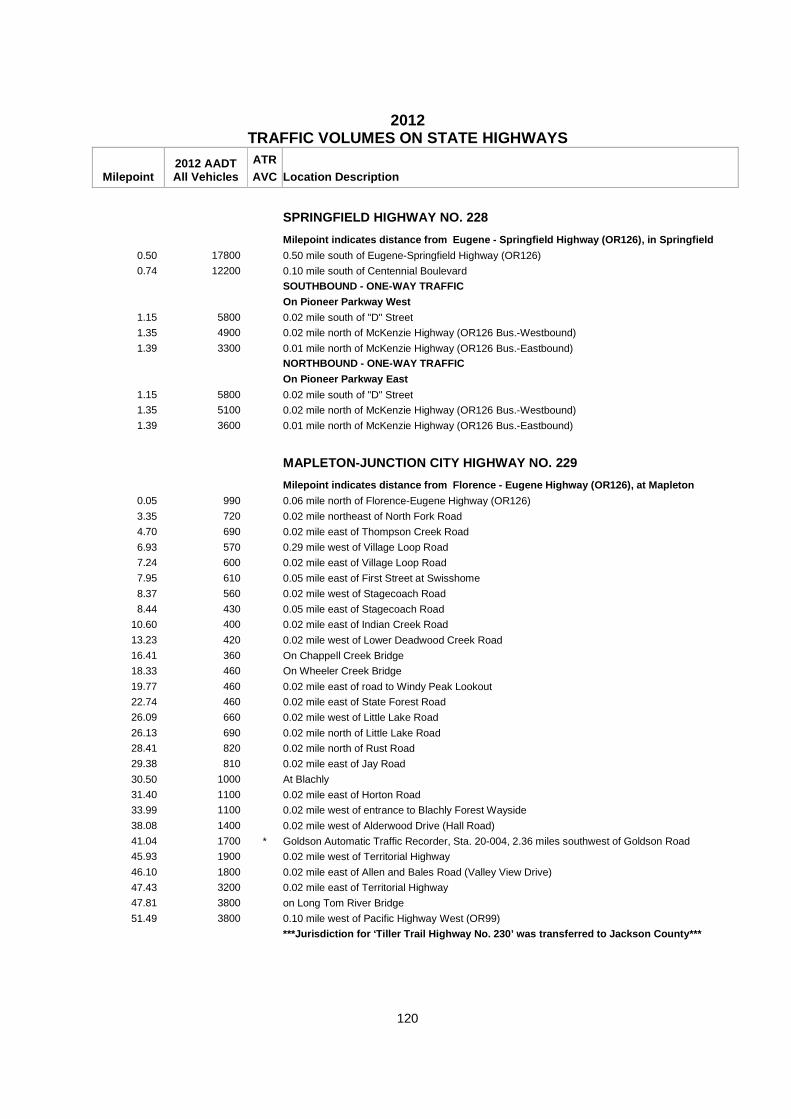
2012
TRAFFIC VOLUMES ON STATE HIGHWAYS
Milepoint 2012 AADT All Vehicles
ATR AVC Location Description
120
SPRINGFIELD HIGHWAY NO. 228
Milepoint indicates distance from Eugene - Springf ield Highway (OR126), in Springfield
0.50 17800 0.50 mile south of Eugene-Springfield Highway (OR126)
0.74 12200 0.10 mile south of Centennial Boulevard
SOUTHBOUND - ONE-WAY TRAFFIC
On Pioneer Parkway West
1.15 5800 0.02 mile south of "D" Street
1.35 4900 0.02 mile north of McKenzie Highway (OR126 Bus.-Westbound)
1.39 3300 0.01 mile north of McKenzie Highway (OR126 Bus.-Eastbound)
NORTHBOUND - ONE-WAY TRAFFIC
On Pioneer Parkway East
1.15 5800 0.02 mile south of "D" Street
1.35 5100 0.02 mile north of McKenzie Highway (OR126 Bus.-Westbound)
1.39 3600 0.01 mile north of McKenzie Highway (OR126 Bus.-Eastbound)
MAPLETON-JUNCTION CITY HIGHWAY NO. 229
Milepoint indicates distance from Florence - Eugen e Highway (OR126), at Mapleton
0.05 990 0.06 mile north of Florence-Eugene Highway (OR126)
3.35 720 0.02 mile northeast of North Fork Road
4.70 690 0.02 mile east of Thompson Creek Road
6.93 570 0.29 mile west of Village Loop Road
7.24 600 0.02 mile east of Village Loop Road
7.95 610 0.05 mile east of First Street at Swisshome
8.37 560 0.02 mile west of Stagecoach Road
8.44 430 0.05 mile east of Stagecoach Road
10.60 400 0.02 mile east of Indian Creek Road
13.23 420 0.02 mile west of Lower Deadwood Creek Road
16.41 360 On Chappell Creek Bridge
18.33 460 On Wheeler Creek Bridge
19.77 460 0.02 mile east of road to Windy Peak Lookout
22.74 460 0.02 mile east of State Forest Road
26.09 660 0.02 mile west of Little Lake Road
26.13 690 0.02 mile north of Little Lake Road
28.41 820 0.02 mile north of Rust Road
29.38 810 0.02 mile east of Jay Road
30.50 1000 At Blachly
31.40 1100 0.02 mile east of Horton Road
33.99 1100 0.02 mile west of entrance to Blachly Forest Wayside
38.08 1400 0.02 mile west of Alderwood Drive (Hall Road)
41.04 1700 * Goldson Automatic Traffic Recorder, Sta. 20-004, 2.36 miles southwest of Goldson Road
45.93 1900 0.02 mile west of Territorial Highway
46.10 1800 0.02 mile east of Allen and Bales Road (Valley View Drive)
47.43 3200 0.02 mile east of Territorial Highway
47.81 3800 on Long Tom River Bridge
51.49 3800 0.10 mile west of Pacific Highway West (OR99)
***Jurisdiction for ‘Tiller Trail Highway No. 230’ was transferred to Jackson County***

2012
TRAFFIC VOLUMES ON STATE HIGHWAYS
Milepoint 2012 AADT All Vehicles
ATR AVC Location Description
121
ELKTON-SUTHERLIN HIGHWAY NO. 231
Milepoint indicates distance from Umpqua Highway ( OR38), in Elkton
0.02 1900 0.02 mile south of Umpqua Highway (OR38)
0.11 1700 0.02 mile south of Azalea Drive, south city limits of Elkton
0.21 1500 0.02 mile south of Mehl Creek Road
1.68 1400 0.01 mile south of Wells Road
3.82 1400 On Smith Bridge (Umpqua River)
6.20 1300 0.02 mile north of Bullock Road
6.32 1200 On Kellogg Bridge(Umpqua River)
6.48 1200 0.02 mile south of Madison Road
13.27 1500 0.02 mile north of Bullock Bridge Road
13.31 1800 0.02 mile south of Bullock Bridge Road
13.73 1800 0.04 mile southeast of Tyee Road
16.79 1800 0.02 mile southeast of Green Valley Road
21.47 2200 0.02 mile north of Rolling Ridge Road
22.10 2300 On Rochester Bridge (Calapooya Creek)
22.81 3000 0.02 mile southeast of Stearns Lane
23.53 3900 0.36 mile northwest of Fort McKay Road
23.91 7200 0.02 mile east of Fort McKay Road
24.11 10200 0.10 mile west of Pacific Highway (I-5)
24.39 10700 0.18 mile east of Pacific Highway (I-5)
24.50 11900 0.03 mile east of N.W. Comstock Road
24.98 11200 0.02 mile east of N.W. Sherman Street
25.10 11200 0.02 mile east of N.W. Ash Street
25.37 11300 0.02 mile west of N.W. Calapooya Street
WEST DIAMOND LAKE HIGHWAY NO. 233
Milepoint indicates distance from Crater Lake High way (OR62), north of Union Creek
0.02 830 0.02 mile northeast of Crater Lake Highway (OR62)
5.86 610 0.15 mile south of County Line Road
23.78 970 0.02 mile west of North Umpqua Highway (OR138)
CAPE ARAGO HIGHWAY NO. 240
Milepoint indicates distance from Oregon Coast Hig hway (US101) in North Bend
On Virginia Avenue -0.03 5100 0.02 mile west of Sheridan Avenue, Oregon Coast Highway (US101-Northbound)
0.02 10000 0.02 mile west of Sherman Avenue, Oregon Coast Highway (US101-Southbound)
0.09 10500 0.02 mile east of McPherson Avenue
0.18 15600 0.02 mile west of Meade Avenue
0.42 15800 On Pony Creek Bridge
On Broadway Street 0.75 12400 0.02 mile east of Broadway
0.79 9300 0.02 mile south of Virginia Avenue on Broadway
1.29 12200 0.02 mile north of 16th Street
On Newmark Avenue
1.33 13300 0.02 mile south of 16th Street
2.10 17900 0.02 mile east of S. Oak Street
2.22 18000 0.02 mile east of Fir Street

2012
TRAFFIC VOLUMES ON STATE HIGHWAYS
Milepoint 2012 AADT All Vehicles
ATR AVC Location Description
122
CAPE ARAGO HIGHWAY NO. 240 (Continued)
MP 2.24 to MP 4.49 Transferred to the City of Coos Bay
4.49 8500 South city limits of Coos Bay
5.09 8100 0.02 mile south of Spaw Lane
5.95 7300 0.02 mile south of Tarheel Lane
7.03 5400 0.02 mile north of Henderson Lane
7.52 5600 0.02 mile north of Wilshire Boulevard
8.11 5900 0.02 mile west of Libby Lane
8.47 5800 0.02 mile east of Boat Basin Road at Charleston
8.76 2300 0.02 mile west of Shore Edge Drive
8.99 2400 0.02 mile west of Walker Road
9.78 2100 0.50 mile west of Coos Head Road
COOS RIVER HIGHWAY NO. 241
Milepoint indicates distance from Oregon Coast Hig hway (US101), at Bunker Hill
0.10 9000 0.02 mile west of Edwards Road
0.51 8700 On Isthmus Slough Bridge
MP 0.72 to MP 2.23 Transferred to the City of Coos Bay
2.31 2900 0.02 mile west of Catching Slough Road
3.37 2600 0.02 mile west of South Fork Coos River Road
3.73 1800 On Coos River (Chandler Bridge)
3.91 1000 0.02 mile east of East Bay Drive
7.33 740 On Mart Davis Creek Bridge
14.07 690 On Millicoma River (Allegany Bridge)
14.21 420 0.05 mile east of West Fork Millicoma Road at Allegany
15.10 400 0.20 mile east of Marlow Creek
19.13 370 0.02 mile west of East Fork Millicoma Road
POWERS HIGHWAY NO. 242
Milepoint indicates distance from Coos Bay - Roseb urg Highway (OR42), south of Myrtle Point
0.30 1600 0.30 mile south of Coos Bay-Roseburg Highway (OR42)
2.43 1200 0.02 mile north of Dement Creek Road
2.47 1000 0.02 mile south of Dement Creek Road
3.54 990 On Robbins Creek Bridge
9.73 840 0.02 mile south of Gaylord Road
10.73 800 0.12 mile south of Yellow Creek Road
17.14 770 On South Fork Coquille River (White Bridge)
17.86 1200 0.02 mile south of Alder Street
18.22 1600 On Coquille River (Powers Bridge)
18.38 1300 0.02 mile south of Spruce Street
18.56 910 0.02 mile west of 2nd Avenue
18.70 830 0.02 mile west of 4th Avenue
18.74 770 0.02 mile south of Poplar Street on 4th Avenue
18.89 670 0.10 mile south of Hemlock Street
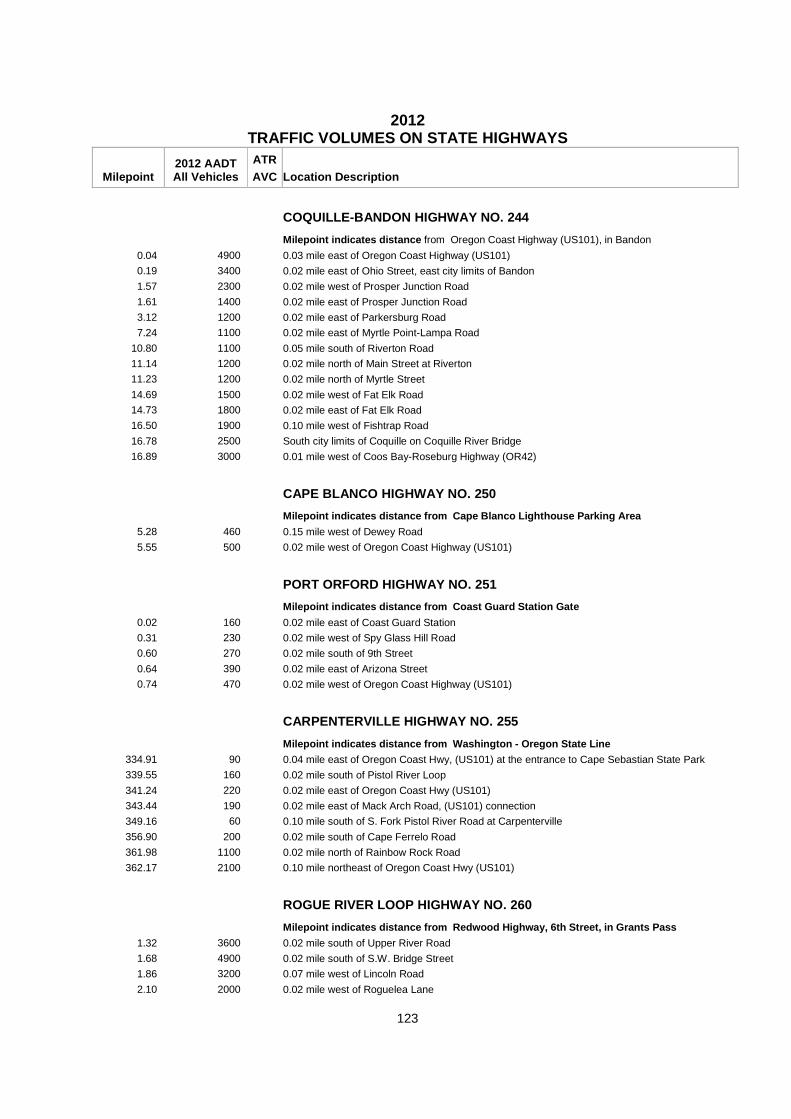
2012
TRAFFIC VOLUMES ON STATE HIGHWAYS
Milepoint 2012 AADT All Vehicles
ATR AVC Location Description
123
COQUILLE-BANDON HIGHWAY NO. 244
Milepoint indicates distance from Oregon Coast Highway (US101), in Bandon
0.04 4900 0.03 mile east of Oregon Coast Highway (US101)
0.19 3400 0.02 mile east of Ohio Street, east city limits of Bandon
1.57 2300 0.02 mile west of Prosper Junction Road
1.61 1400 0.02 mile east of Prosper Junction Road
3.12 1200 0.02 mile east of Parkersburg Road
7.24 1100 0.02 mile east of Myrtle Point-Lampa Road
10.80 1100 0.05 mile south of Riverton Road
11.14 1200 0.02 mile north of Main Street at Riverton
11.23 1200 0.02 mile north of Myrtle Street
14.69 1500 0.02 mile west of Fat Elk Road
14.73 1800 0.02 mile east of Fat Elk Road
16.50 1900 0.10 mile west of Fishtrap Road
16.78 2500 South city limits of Coquille on Coquille River Bridge
16.89 3000 0.01 mile west of Coos Bay-Roseburg Highway (OR42)
CAPE BLANCO HIGHWAY NO. 250
Milepoint indicates distance from Cape Blanco Ligh thouse Parking Area
5.28 460 0.15 mile west of Dewey Road
5.55 500 0.02 mile west of Oregon Coast Highway (US101)
PORT ORFORD HIGHWAY NO. 251
Milepoint indicates distance from Coast Guard Stat ion Gate
0.02 160 0.02 mile east of Coast Guard Station
0.31 230 0.02 mile west of Spy Glass Hill Road
0.60 270 0.02 mile south of 9th Street
0.64 390 0.02 mile east of Arizona Street
0.74 470 0.02 mile west of Oregon Coast Highway (US101)
CARPENTERVILLE HIGHWAY NO. 255
Milepoint indicates distance from Washington - Ore gon State Line
334.91 90 0.04 mile east of Oregon Coast Hwy, (US101) at the entrance to Cape Sebastian State Park
339.55 160 0.02 mile south of Pistol River Loop
341.24 220 0.02 mile east of Oregon Coast Hwy (US101)
343.44 190 0.02 mile east of Mack Arch Road, (US101) connection
349.16 60 0.10 mile south of S. Fork Pistol River Road at Carpenterville
356.90 200 0.02 mile south of Cape Ferrelo Road
361.98 1100 0.02 mile north of Rainbow Rock Road
362.17 2100 0.10 mile northeast of Oregon Coast Hwy (US101)
ROGUE RIVER LOOP HIGHWAY NO. 260
Milepoint indicates distance from Redwood Highway, 6th Street, in Grants Pass
1.32 3600 0.02 mile south of Upper River Road
1.68 4900 0.02 mile south of S.W. Bridge Street
1.86 3200 0.07 mile west of Lincoln Road
2.10 2000 0.02 mile west of Roguelea Lane

2012
TRAFFIC VOLUMES ON STATE HIGHWAYS
Milepoint 2012 AADT All Vehicles
ATR AVC Location Description
124
ROGUE RIVER LOOP HIGHWAY NO. 260 (Continued)
2.41 1800 0.02 mile west of Summer Lane
4.52 920 0.01 mile east of Sycamore Drive
5.73 670 0.02 mile east of Upper River Road
5.85 1700 0.10 mile west of Upper River Road
8.42 870 0.02 mile north of Gunnell Road
17.74 1100 0.10 mile south of Limpy Creek Road
20.11 1600 0.02 mile northwest of Marcy Loop Road
22.19 2100 0.05 mile north of Redwood Highway (US199)
LAKE OF THE WOODS HIGHWAY NO. 270
Milepoint indicates distance from Crater Lake High way (OR62), south of White City
-8.07 4900 0.10 mile northwest of Dean Creek Frontage Road
-6.97 4200 0.05 mile north of Blackwell Road
-5.32 4200 0.05 mile east of High Banks Road
-3.69 3400 0.05 mile east of W. Antelope Road
-2.76 2800 0.05 mile west of Pacific Avenue
MP -2.71 to MP -2.55 Under Jurisdiction of Jackson County
-2.59 3100 0.12 mile east of Pacific Avenue
-1.90 2900 0.05 mile east of 5th Street
-1.59 3200 0.05 mile east of 8th Street
-1.21 3200 0.05 mile west of Agate Road
-0.55 3100 0.05 mile north of Antelope Road
-0.25 4400 0.05 mile north of Leigh Way
-0.05 3100 0.05 mile west of Crater Lake Highway No. 22 (OR62)
0.12 5500 0.12 mile east of Crater Lake Highway (OR62)
2.31 5500 0.02 mile east of Kershaw Road
3.69 3400 0.10 mile east of Riley Road
7.96 2900 0.02 mile southwest of Brownsboro-Eagle Point Road
12.46 2700 0.10 mile west of Lake Creek Loop (west junction)
14.74 2500 0.02 mile west of Lake Creek Loop (east junction)
16.03 2600 * Lake of the Woods Automatic Traffic Recorder, Sta. 15-020, 1.27 miles east of Lake Creek Loop (east junction)
30.42 2300 0.01 mile west of road to Fish Lake Resort
Jackson - Klamath County Line, MP 32.25
37.60 2200 0.10 mile west of Dead Indian Memorial Road
44.42 2200 0.10 mile east of Rocky Point Road
50.39 2200 0.02 mile east of road to Aspen Creek Trail
61.58 2200 0.10 mile west of Running Y Road
68.74 2900 0.02 mile north of Green Springs Highway (OR66)
SAMS VALLEY HIGHWAY NO. 271
Milepoint indicates distance from Rogue River High way (OR99), at Rock Point Interchange
-0.20 2200 0.10 mile east of Rogue River Highway (OR99)
0.09 1900 On Rogue River (Rock Point Bridge)
0.19 2700 0.02 mile east of North River Road
0.80 2500 On Sardine Creek Bridge
On 2nd Avenue 1.55 3100 0.03 mile east of Kenneth Way

2012
TRAFFIC VOLUMES ON STATE HIGHWAYS
Milepoint 2012 AADT All Vehicles
ATR AVC Location Description
125
SAMS VALLEY HIGHWAY NO. 271 (Continued)
2.14 4300 0.02 mile west of Gustaf Street
2.34 4400 0.02 mile west of Dardanelles Street and Gold Hill Spur (OR99)
On 4th Street
2.38 3300 0.02 mile north of 2nd Avenue and Gold Hill Spur (OR99)
On 4th Avenue
2.46 2700 0.02 mile east of Dardanelles Street
2.60 2600 0.02 mile east of Beeman Street
North city limits of Gold Hill
4.76 2300 0.05 mile west of road to Gold Nugget Wayside
7.24 2100 0.02 mile southwest of Ramsey Road
7.28 2000 0.02 mile east of Ramsey Road
10.58 2900 0.10 mile west of Table Rock Road
10.83 2500 0.15 mile east of Table Rock Road
17.38 2900 0.10 mile west of Crater Lake Highway (OR62)
JACKSONVILLE HIGHWAY NO. 272
Milepoint indicates distance from Redwood Highway (US199), in Grants Pass
0.20 22900 South city limits of Grants Pass, south of Redwood Highway (US199), and Rogue River Highway (OR99)
0.24 15200 0.02 mile south of Union Avenue
0.85 13700 0.05 mile north of W. Harbeck Road
1.51 13600 0.02 mile north of New Hope Road
1.55 9200 0.02 mile south of New Hope Road
2.86 6800 0.02 mile south of Espey Road
5.20 5700 0.02 mile south of Cloverlawn Drive
6.08 5100 0.02 mile south of N. Applegate Road
7.20 3500 0.02 mile west of Grays Creek Road
9.76 3000 At Johnson Creek, 0.07 mile east of Crystal Drive
11.93 1300 0.10 mile east of Water Gap Road
Josephine - Jackson County Line, MP 13.79
13.88 1600 0.10 mile east of Williams Highway
18.02 1900 0.02 mile east of Thompson Creek Road
24.10 2300 0.02 mile west of Hamilton Road
24.94 2900 * Ruch Automatic Traffic Recorder, Sta. 15-011, 0.68 mile west of Applegate Road at Ruch
25.64 4600 0.02 mile east of Applegate Road
30.50 4800 0.02 mile east of Cady Road
32.41 5100 0.03 mile west of Mary Ann Drive, west city limits of Jacksonville
33.21 5700 0.02 mile west of Oregon Street
33.25 6200 0.02 mile east of Oregon Street
33.36 7300 0.02 mile west of 5th Street
33.40 5600 0.02 mile north of California Street
33.60 7200 0.02 mile north of "F" Street
North city limits of Jacksonville
34.82 7900 0.05 mile south of W. Main Street
34.97 5400 0.10 mile north of W. Main Street
36.22 4900 0.02 mile east of Hanley Street
37.76 12800 West Medford City Limits, 0.04 mile east Ross Lane N.
38.13 12200 0.05 mile east of Sage Road

2012
TRAFFIC VOLUMES ON STATE HIGHWAYS
Milepoint 2012 AADT All Vehicles
ATR AVC Location Description
126
JACKSONVILLE HIGHWAY NO. 272 (Continued)
38.44 9600 0.02 mile east of Central Avenue
SISKIYOU HIGHWAY NO. 273
Milepoint indicates distance from Green Springs Hi ghway (OR66), southeast of Ashland
0.02 630 0.02 mile south of Green Springs Highway (OR66)
3.51 230 0.02 mile north of Steinman Drive
3.55 160 0.02 mile south of Steinman Drive
7.00 500 0.49 mile north of Mt. Ashland Ski Road
12.00 30 0.16 mile northeast of Pacific Highway (I-5)
HOOD RIVER HIGHWAY NO. 281
Milepoint indicates distance from Historic Columbi a River Highway (US30), in Hood River
On 13th Street
0.02 10700 0.02 mile south of Historic Columbia River Highway (US30)
0.31 9900 0.02 mile north of May Street
SOUTHBOUND - ONE-WAY TRAFFIC
On 13th Street
0.35 7800 0.02 mile south of May Street
0.64 8600 0.02 mile north of Belmont Road
NORTHBOUND - ONE-WAY TRAFFIC
On May Street 0.35 6800 0.02 mile east of 13th Street
On 12th Street
0.42 7900 0.02 mile south of May Street
0.70 8700 0.02 mile north of Belmont Road
RESUME TWO-WAY TRAFFIC
0.81 16700 0.02 mile north of Nix Drive
1.19 9700 0.02 mile south of Brookside Drive, south city limits of Hood River
2.33 7100 0.02 mile north of Orchard Road
3.18 7400 0.05 mile south of Barrett Drive
4.16 6300 0.02 mile south of Portland Drive
5.11 1800 0.02 mile west of Odell Highway
7.38 1800 0.05 mile west of Summit Drive
11.42 1800 0.02 mile north of Lost Lake Road
14.23 1100 0.02 mile north of Alexander Drive
15.65 870 0.02 mile north of Bassler Drive
16.75 1200 0.02 mile west of Clear Creek Road at Parkdale
16.81 1800 0.02 mile east of 2nd Street
17.18 2000 0.02 mile east of Allen Road
19.02 1400 0.05 mile west of Mt. Hood Highway (OR35)
ODELL HIGHWAY NO. 282
Milepoint indicates distance from Hood River Highw ay, north of Odell
0.02 4400 0.02 mile south of Hood River Highway
0.72 3700 0.02 mile south of Wy'East Road
1.78 3900 0.04 mile north of Summit Drive
1.84 3900 0.02 mile south of Summit Drive

2012
TRAFFIC VOLUMES ON STATE HIGHWAYS
Milepoint 2012 AADT All Vehicles
ATR AVC Location Description
127
ODELL HIGHWAY NO. 282 (Continued)
2.25 1600 0.02 mile east of "A.G.A." Road
2.67 2800 0.05 mile north of Davis Road
2.74 3100 0.02 mile east of Davis Road
3.34 3200 0.11 mile west of Mt. Hood Highway No. 26 (OR35)
SHERARS BRIDGE HIGHWAY NO. 290
Milepoint indicates distance from The Dalles - Cal ifornia Highway (US197), at Tygh Valley
0.05 210 0.10 mile east of The Dalles-California Highway (US197)
4.72 70 0.02 mile east of Conroy Road
6.97 60 Railroad Undercrossing at Sherar Station
8.30 80 Wasco-Sherman County Line
16.06 60 0.02 mile west of Payne Road (East Jct.)
18.61 70 0.07 mile north of Finnegan Road (Ball Lane, South Jct.)
21.33 70 0.02 mile north of Davis Lane
24.76 90 0.02 mile east of Stradley Road
25.81 100 0.02 mile east of Finnegan Road
28.23 130 0.02 mile south of South Street
28.40 160 0.02 mile west of Sherman Highway (US97)
SHANIKO-FOSSIL HIGHWAY NO. 291
Milepoint indicates distance from Sherman Highway (US97), in Shaniko
0.03 110 0.03 mile south of Sherman Highway (US97)
0.56 100 South city limits of Shaniko, 0.46 mile south of 3rd Street
4.39 90 At the Summit, 0.66 mile south of Rooper Road
7.79 150 0.02 mile northwest of Union Street
7.95 150 0.01 mile north of Antelope Highway
Equation: MP 8.04 BK = MP 8.11 AH
8.24 200 East city limits of Antelope
11.81 130 0.02 mile east of Cold Camp Road
Equation: MP 17.11 BK = MP 17.21 AH
23.07 140 Wasco-Wheeler County Line
Equation: MP 24.93 BK = MP 25.30 AH
33.83 120 0.01 mile west of Pine Creek Road
39.24 130 0.01 mile south of Cottonwood Creek Road
Equation: MP 39.25 BK = MP 39.31 AH
Equation: MP 40.61 BK = MP 40.91 AH
42.61 180 0.02 mile south of road to cemetery
42.74 220 South city limits of Fossil
42.97 320 0.02 mile south of John Day Highway (OR19)
MOSIER-THE DALLES HIGHWAY NO. 292
Milepoint indicates distance from Columbia River H ighway (I-84), in Mosier
18.99 6000 0.25 mile east of connection to Columbia River Highway (I-84)
20.14 5300 0.10 mile west of The Dalles-California Highway (US197)

2012
TRAFFIC VOLUMES ON STATE HIGHWAYS
Milepoint 2012 AADT All Vehicles
ATR AVC Location Description
128
ANTELOPE HIGHWAY NO. 293
Milepoint indicates distance from The Dalles - Cali fornia Highway (US97), at Willowdale
0.10 190 0.10 mile east of The Dalles-California Highway (US97)
0.89 190 0.10 mile east of connection to The Dalles-California Highway (US97)
8.28 180 0.02 mile west of Tub Springs Road
Equation: MP 8.95 BK = MP Z8.86 AH
13.41 180 0.11 mile west of Shaniko-Fossil Highway (OR218)
WASCO-HEPPNER HIGHWAY NO. 300
Milepoint indicates distance from Old Sherman Highw ay, in Wasco
-1.67 680 0.30 mile east of Sherman Highway (US97)
-0.28 710 0.02 mile west of Clark Street
-0.11 930 0.02 mile north of Celilo-Wasco Highway (OR206)
-0.07 1400 0.02 mile south of Celilo-Wasco Highway (OR206)
0.02 880 0.02 mile east of Clark Street
0.58 630 East city limits of Wasco
0.88 500 0.02 mile southeast of Klondike Road
6.63 480 At Hay Canyon Bridge
9.40 430 0.02 mile west of Fairview Road
9.44 350 0.02 mile east of Fairview Road
14.95 330 Sherman-Gilliam County Line
24.37 310 0.02 mile east of Ajax Road
35.67 360 0.02 mile north of Ferry Canyon Road
36.08 400 0.15 mile northwest of Richmond Road
36.25 480 0.02 mile southeast of Richmond Road
40.15 480 West city limits of Condon
40.51 770 0.02 mile west of Lincoln Street
40.61 850 0.02 mile west of Oregon Street
40.66 680 0.02 mile west of John Day Highway (OR19)
40.92 420 0.04 mile east of John Day Highway (OR19)
41.00 340 0.02 mile east of Ward Street
41.19 200 0.02 mile east of Jefferson Street
41.74 190 * Condon Automatic Traffic Recorder, Sta. 11-004, 0.86 mile east of John Day Highway No. 5 (OR19)
45.58 140 0.02 mile west of Lonerock Highway
54.84 50 Gilliam-Morrow County Line
61.74 80 0.02 mile east of Ione-Gooseberry Road
73.31 120 0.02 mile west of Heppner-Spray Highway (OR207)
73.35 310 0.02 mile east of Heppner-Spray Highway (OR207)
78.25 300 0.02 mile southwest of Clarks Canyon Road
78.29 320 0.02 mile northeast of Clarks Canyon Road
82.38 570 0.02 mile north of Shobe Canyon Road
83.58 1100 South city limits of Heppner
84.08 1300 0.04 mile south of Heppner Highway (OR74)
CELILO-WASCO HIGHWAY NO. 301
Milepoint indicates distance from Columbia River Hi ghway (I-84), at Celilo
0.30 670 0.30 mile east of Columbia River Highway (I-84)
Wasco - Sherman County Line, MP 2.92

2012
TRAFFIC VOLUMES ON STATE HIGHWAYS
Milepoint 2012 AADT All Vehicles
ATR AVC Location Description
129
CELILO-WASCO HIGHWAY NO. 301 (Continued)
4.78 650 0.02 mile west of Celilo-Wasco Highway Spur
4.82 470 0.02 mile south of Celilo-Wasco Highway Spur
12.45 480 0.02 mile west of Van Gilder Road
14.53 280 0.20 mile west of Sherman Highway (US97)
15.07 440 West city limits of Wasco, 0.26 mile west of Church Street
15.55 530 0.02 mile west of Wasco-Heppner Highway (OR206)
LEXINGTON-ECHO HIGHWAY NO. 320
Milepoint indicates distance from Heppner Highway ( OR74), in Lexington
0.02 1200 0.02 mile northeast of Heppner Highway (OR74)
0.08 1100 0.02 mile northeast of East Street
0.25 870 North city limits of Lexington
2.35 1000 0.02 mile south of Lexington Grange Road
2.48 960 0.11 mile east of Lexington Grange Road
3.89 950 0.02 mile north of Turner Lane
10.15 740 0.02 mile northeast of Kilkenney Road
13.62 730 0.10 mile southwest of Grieb Lane
19.48 890 On Butter Creek Bridge
19.89 1000 0.13 mile west of Gordon Creek Road
27.19 1200 0.05 mile south of Hermiston Highway (OR207)
27.29 370 0.05 mile east of Hermiston Highway (OR207)
34.40 370 0.02 mile west of Echo Meadows Road
34.44 560 0.02 mile east of Echo Meadows Road
35.49 730 0.02 mile east of Front Street
35.68 780 0.02 mile west of Thielson Street
35.72 820 0.02 mile north of Main Street
36.23 1700 0.90 mile south of Umatilla-Stanfield Highway (US395)
HEPPNER-SPRAY HIGHWAY NO. 321
Milepoint indicates distance from Wasco - Heppner Highway (OR206), at Ruggs
0.02 300 0.02 mile south of Wasco-Heppner Highway (OR206)
2.85 280 0.02 mile north of Porcupine Road
2.89 270 0.02 mile south of Porcupine Road
8.65 270 0.02 mile north of Tall Rock Road
11.46 220 0.02 mile south of Deadman Hill Road
14.80 160 0.02 mile south of Sunflower Flat Road
16.07 150 At Chapin Creek
19.45 140 0.01 mile south of Deadman Hill Road
24.65 100 Morrow-Wheeler County Line
36.87 90 0.68 mile south of Haystack Creek
40.86 90 0.10 mile north of John Day Highway (OR19)
WESTON-ELGIN HIGHWAY NO. 330
Milepoint indicates distance from Winn Road, northe ast of Weston
-0.63 1200 0.69 mile south of Oregon-Washington Highway (OR11), at Hay Creek
-0.05 640 0.05 mile west of Winn Road at Hay Creek
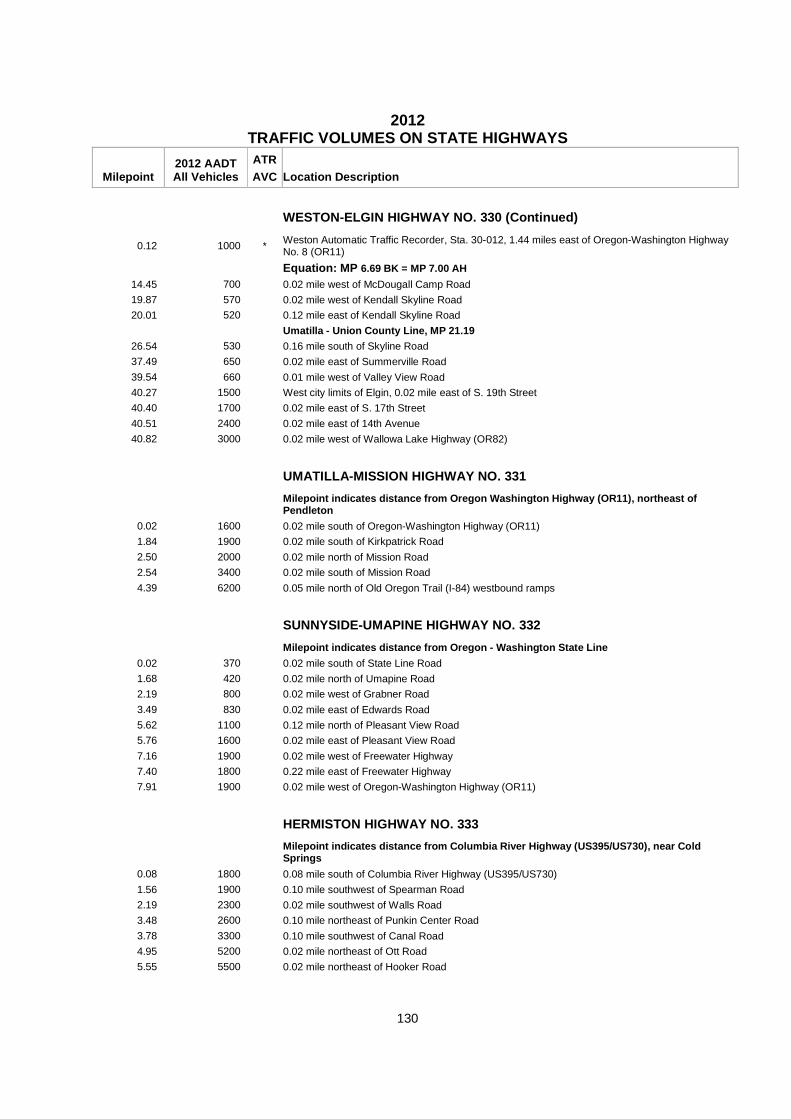
2012
TRAFFIC VOLUMES ON STATE HIGHWAYS
Milepoint 2012 AADT All Vehicles
ATR AVC Location Description
130
WESTON-ELGIN HIGHWAY NO. 330 (Continued)
0.12 1000 * Weston Automatic Traffic Recorder, Sta. 30-012, 1.44 miles east of Oregon-Washington Highway No. 8 (OR11)
Equation: MP 6.69 BK = MP 7.00 AH
14.45 700 0.02 mile west of McDougall Camp Road
19.87 570 0.02 mile west of Kendall Skyline Road
20.01 520 0.12 mile east of Kendall Skyline Road
Umatilla - Union County Line, MP 21.19
26.54 530 0.16 mile south of Skyline Road
37.49 650 0.02 mile east of Summerville Road
39.54 660 0.01 mile west of Valley View Road
40.27 1500 West city limits of Elgin, 0.02 mile east of S. 19th Street
40.40 1700 0.02 mile east of S. 17th Street
40.51 2400 0.02 mile east of 14th Avenue
40.82 3000 0.02 mile west of Wallowa Lake Highway (OR82)
UMATILLA-MISSION HIGHWAY NO. 331
Milepoint indicates distance from Oregon Washington Highway (OR11), northeast of Pendleton
0.02 1600 0.02 mile south of Oregon-Washington Highway (OR11)
1.84 1900 0.02 mile south of Kirkpatrick Road
2.50 2000 0.02 mile north of Mission Road
2.54 3400 0.02 mile south of Mission Road
4.39 6200 0.05 mile north of Old Oregon Trail (I-84) westbound ramps
SUNNYSIDE-UMAPINE HIGHWAY NO. 332
Milepoint indicates distance from Oregon - Washingt on State Line
0.02 370 0.02 mile south of State Line Road
1.68 420 0.02 mile north of Umapine Road
2.19 800 0.02 mile west of Grabner Road
3.49 830 0.02 mile east of Edwards Road
5.62 1100 0.12 mile north of Pleasant View Road
5.76 1600 0.02 mile east of Pleasant View Road
7.16 1900 0.02 mile west of Freewater Highway
7.40 1800 0.22 mile east of Freewater Highway
7.91 1900 0.02 mile west of Oregon-Washington Highway (OR11)
HERMISTON HIGHWAY NO. 333
Milepoint indicates distance from Columbia River Hi ghway (US395/US730), near Cold Springs
0.08 1800 0.08 mile south of Columbia River Highway (US395/US730)
1.56 1900 0.10 mile southwest of Spearman Road
2.19 2300 0.02 mile southwest of Walls Road
3.48 2600 0.10 mile northeast of Punkin Center Road
3.78 3300 0.10 mile southwest of Canal Road
4.95 5200 0.02 mile northeast of Ott Road
5.55 5500 0.02 mile northeast of Hooker Road
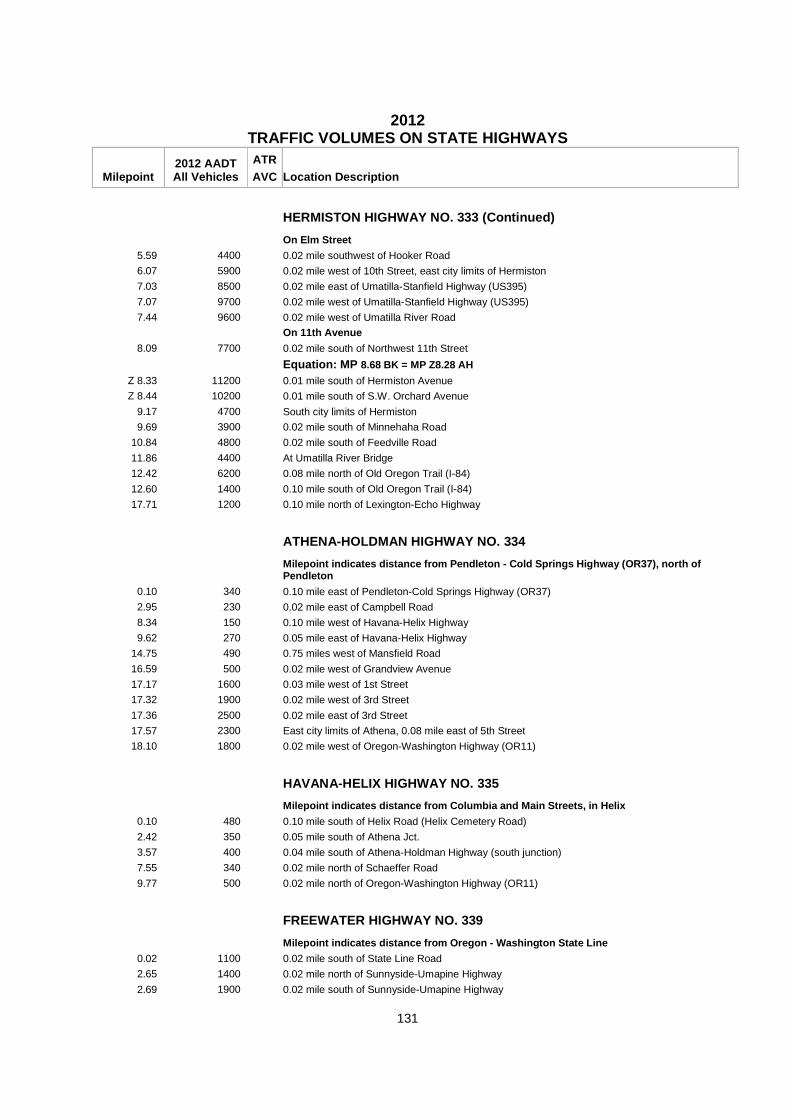
2012
TRAFFIC VOLUMES ON STATE HIGHWAYS
Milepoint 2012 AADT All Vehicles
ATR AVC Location Description
131
HERMISTON HIGHWAY NO. 333 (Continued)
On Elm Street
5.59 4400 0.02 mile southwest of Hooker Road
6.07 5900 0.02 mile west of 10th Street, east city limits of Hermiston
7.03 8500 0.02 mile east of Umatilla-Stanfield Highway (US395)
7.07 9700 0.02 mile west of Umatilla-Stanfield Highway (US395)
7.44 9600 0.02 mile west of Umatilla River Road
On 11th Avenue
8.09 7700 0.02 mile south of Northwest 11th Street
Equation: MP 8.68 BK = MP Z8.28 AH
Z 8.33 11200 0.01 mile south of Hermiston Avenue
Z 8.44 10200 0.01 mile south of S.W. Orchard Avenue
9.17 4700 South city limits of Hermiston
9.69 3900 0.02 mile south of Minnehaha Road
10.84 4800 0.02 mile south of Feedville Road
11.86 4400 At Umatilla River Bridge
12.42 6200 0.08 mile north of Old Oregon Trail (I-84)
12.60 1400 0.10 mile south of Old Oregon Trail (I-84)
17.71 1200 0.10 mile north of Lexington-Echo Highway
ATHENA-HOLDMAN HIGHWAY NO. 334
Milepoint indicates distance from Pendleton - Cold Springs Highway (OR37), north of Pendleton
0.10 340 0.10 mile east of Pendleton-Cold Springs Highway (OR37)
2.95 230 0.02 mile east of Campbell Road
8.34 150 0.10 mile west of Havana-Helix Highway
9.62 270 0.05 mile east of Havana-Helix Highway
14.75 490 0.75 miles west of Mansfield Road
16.59 500 0.02 mile west of Grandview Avenue
17.17 1600 0.03 mile west of 1st Street
17.32 1900 0.02 mile west of 3rd Street
17.36 2500 0.02 mile east of 3rd Street
17.57 2300 East city limits of Athena, 0.08 mile east of 5th Street
18.10 1800 0.02 mile west of Oregon-Washington Highway (OR11)
HAVANA-HELIX HIGHWAY NO. 335
Milepoint indicates distance from Columbia and Main Streets, in Helix
0.10 480 0.10 mile south of Helix Road (Helix Cemetery Road)
2.42 350 0.05 mile south of Athena Jct.
3.57 400 0.04 mile south of Athena-Holdman Highway (south junction)
7.55 340 0.02 mile north of Schaeffer Road
9.77 500 0.02 mile north of Oregon-Washington Highway (OR11)
FREEWATER HIGHWAY NO. 339
Milepoint indicates distance from Oregon - Washingt on State Line
0.02 1100 0.02 mile south of State Line Road
2.65 1400 0.02 mile north of Sunnyside-Umapine Highway
2.69 1900 0.02 mile south of Sunnyside-Umapine Highway

2012
TRAFFIC VOLUMES ON STATE HIGHWAYS
Milepoint 2012 AADT All Vehicles
ATR AVC Location Description
132
FREEWATER HIGHWAY NO. 339 (Continued)
3.16 1900 0.02 mile north of Cobb Road
MP 3.43 to MP 5.25 Transferred to the City of MIlto n - Freewater
MEDICAL SPRINGS HIGHWAY NO. 340
Milepoint indicates distance from La Grande - Baker Highway (OR237), in Union
0.02 580 0.02 mile east of La Grande-Baker Highway (OR237)
0.12 460 0.02 mile east of Bellwood Avenue
0.55 360 East city limits of Union
8.00 190 0.31 mile west of entrance to Catherine Creek State Park (Day Use Area)
8.91 210 0.60 mile east of entrance to Catherine Creek State Park (Day Use Area)
11.38 190 0.02 mile northwest of Catherine Creek Lane
22.90 110 Union-Baker County Line
36.86 210 * Medical Springs Automatic Traffic Recorder, Sta. 01-007, 2.08 miles east of Old Oregon Trail Highway No. 6 (I-84)
38.45 230 0.02 mile east of W. Airport Road
38.49 290 0.11 mile east of Old Oregon Trail (I-84)
UKIAH-HILGARD HIGHWAY NO. 341
Milepoint indicates distance from Pendleton - John Day Highway (US395), west of Ukiah
0.20 470 0.20 mile east of Pendleton-John Day Highway (US395)
1.26 610 0.02 mile east of Camas Street
1.31 580 0.02 mile east of Albee Street
1.45 250 East city limits of Ukiah, 0.05 mile east of Mill Street
2.25 240 0.02 mile east of Camas Creek Road
6.21 200 0.02 mile east of Cable Creek Road
14.54 200 0.02 mile east of Pearson Road
23.54 200 Umatilla-Union County Line
30.90 240 0.10 mile west of Starkey Road
31.10 240 0.10 mile northeast of Starkey Road
33.47 250 0.10 mile northeast of McIntyre Road
43.56 440 0.60 mile west of Rankin Road
46.82 630 0.40 mile south of Old Oregon Trail (I-84)
COVE HIGHWAY NO. 342
Milepoint indicates distance from Wallowa Lake High way (OR82), in Island City
0.02 2900 0.02 mile east of Wallowa Lake Highway (OR82)
0.14 2500 0.02 mile east of S. Sterling Street
4.18 1700 0.02 mile west of Peach Lane
9.44 1700 At Catherine Creek Bridge
12.19 1400 0.16 mile west of Lower Cove Road
North city limits of Cove
13.50 1400 0.02 mile east of French Street
13.63 1200 0.02 mile east of Orchard Street
13.85 790 0.11 mile east of High Valley Road, west city limits of Cove
15.98 530 0.02 mile west of Phys Point Road

2012
TRAFFIC VOLUMES ON STATE HIGHWAYS
Milepoint 2012 AADT All Vehicles
ATR AVC Location Description
133
COVE HIGHWAY NO. 342 (Continued)
20.31 570 0.02 mile east of Hutchinson Lane
North city limits of Union
21.81 730 0.02 mile north of Bryan Avenue
21.85 970 0.02 mile west of Cove Street
22.05 1100 0.02 mile east of La Grande-Baker Highway (OR203)
LITTLE SHEEP CREEK HIGHWAY NO. 350
Milepoint indicates distance from Wallowa Lake Hig hway (OR82), in Joseph
0.02 1500 0.02 mile east of Wallowa Lake Highway (OR82) and Joseph-Wallowa Lake Highway
0.26 920 East city limits of Joseph, 0.06 mile east of N. East Street
1.99 720 0.10 mile west of Dobbin Road
4.41 850 0.02 mile west of Tenderfoot Valley Road
6.39 270 At Sheep Creek Hill Summit
8.09 220 0.02 mile northeast of Wallowa Mountain Loop
23.28 190 0.02 mile southwest of Bear Gulch Road
29.34 190 0.02 mile southwest of Upper Imnaha Road
JOSEPH-WALLOWA LAKE HIGHWAY NO. 351
Milepoint indicates distance from Wallowa Lake High way (OR82), in Joseph
0.02 3600 0.02 mile south of Wallowa Lake Highway (OR82) and Little Sheep Creek Highway
0.15 3000 0.02 mile south of McCully Avenue
0.29 2200 0.02 mile south of 2nd Street
0.67 1700 0.02 mile west of 8th Street
0.80 900 South city limits of Joseph, 0.03 mile east of S. College Street
2.05 590 0.42 miles south of boat ramp access to Wallowa Lake
6.06 430 0.15 mile south of entrance to Wallowa Lake State Park
6.70 180 0.24 mile north of Power House at end of highway
MADRAS-PRINEVILLE HIGHWAY NO. 360
Milepoint indicates distance from The Dalles - Cali fornia Highway (US97), south of Madras
0.11 1700 0.02 mile southeast of The Dalles-California Highway (US97)
1.17 1500 0.02 mile south of S.W. Dover Lane
1.57 1700 0.02 mile south of Adams Drive
9.88 1700 0.02 mile north of Ramms Road
9.92 1600 0.02 mile south of Ramms Road
16.30 1700 Jefferson-Crook County Line
19.40 1700 0.10 mile northwest of Gerke Road
19.60 1600 0.10 mile southeast of Gerke Road
21.95 1900 0.02 mile northwest of Elliot Lane
22.07 2700 0.10 mile southeast of Elliot Lane
23.75 2200 0.02 mile southeast of Gumpert Road
26.00 5300 0.02 mile northwest of NW Richland Lane
CULVER HIGHWAY NO. 361
Milepoint indicates distance from The Dalles - Cali fornia Highway, (US26/US97), in Madras
0.02 3400 0.02 mile west of The Dalles-California Highway (US26/US97-Northbound)

2012
TRAFFIC VOLUMES ON STATE HIGHWAYS
Milepoint 2012 AADT All Vehicles
ATR AVC Location Description
134
CULVER HIGHWAY NO. 361 (Continued)
0.07 4200 0.02 mile west of The Dalles-California Highway (US26/US97-Southbound)
0.35 4000 0.02 mile southwest of Madison Street
0.90 3900 0.02 mile south of S.W. Belmont Lane
2.25 3200 0.02 mile northeast of S.W. Colfax Lane
2.89 3400 0.02 mile north of S.W. Bear Drive
2.93 3300 0.02 mile southwest of S.W. Bear Drive
3.82 3000 0.02 mile south of S.W. Dover Lane
4.33 2700 0.02 mile north of 7th Street
4.38 2600 0.03 mile south of 7th Street
4.61 2300 0.02 mile south of 9th Street, south city limits of Metolius
5.08 2200 0.02 mile southwest of S.W. Eureka Lane
7.01 2100 0.02 mile northeast of S.W. Ford Lane
7.05 2200 0.02 mile south of S.W. Ford Lane
8.81 2100 0.02 mile north of "A" Street
8.85 2000 0.02 mile south of "A" Street
9.30 2000 0.02 mile north of S.W. Iris Drive, south city limits of Culver
9.44 1400 0.12 mile south of S.W. Iris Drive
11.58 1700 0.04 mile west of The Dalles-California Highway (US97)
O'NEIL HIGHWAY NO. 370
Milepoint indicates distance from The Dalles - Cali fornia Highway (US97), north of Redmond
0.02 4400 0.02 mile east of The Dalles-California Highway No. 4 (US97)
0.19 2200 0.05 mile east of Canal Boulevard
0.84 1900 0.02 mile south of N.E. 5th Street
1.52 1600 0.11 mile west of N.E. 17th Street
2.51 2200 0.10 mile west of N.E. 33rd Street
3.84 1800 Deschutes-Crook County Line
5.01 1200 0.02 mile east of Lone Pine Road at O'Neil
13.65 1100 0.02 mile east of Elliot Lane
16.70 1600 0.02 mile west of Westview Road
17.65 1800 0.02 mile west of Ochoco Highway (OR126)
CENTURY DRIVE HIGHWAY NO. 372
Milepoint indicates distance from The Dalles - Cali fornia Highway (US97), in Bend
7.01 2700 0.12 mile north of road to Inn at 7th Mountain
7.25 3400 0.12 mile south of road to Inn at 7th Mountain
7.61 2100 0.02 mile south of road to Conklin Road
11.96 1900 0.20 mile west of Kiwa Butte Road
19.28 1000 0.50 mile west of Edison Ice Cave Road
21.96 840 0.02 mile south of Cascade Lakes Highway
PAULINA HIGHWAY NO. 380
Milepoint indicates distance from Ochoco Highway (U S26), in Prineville
0.02 5300 0.02 mile south of Ochoco Highway (US26)
0.53 4800 0.02 mile north of Melrose Drive
0.62 5300 0.02 mile south of Lynn Boulevard

2012
TRAFFIC VOLUMES ON STATE HIGHWAYS
Milepoint 2012 AADT All Vehicles
ATR AVC Location Description
135
PAULINA HIGHWAY NO. 380 (Continued)
0.72 5000 0.02 mile south of Lincoln Drive
0.81 5000 0.05 mile south of S.E. Carey Foster Road
1.30 4500 0.05 mile northwest of Juniper Canyon Road
1.40 790 0.05 mile southeast of Juniper Canyon Road
7.03 380 0.02 mile west of road to rock quarry
16.46 360 0.02 mile north of Crooked River Road
26.05 290 0.02 mile west of Newsome Creek Road (Shotgun Road)
26.09 230 0.02 mile east of Newsome Creek Road (Shotgun Road)
41.12 190 0.02 mile east of road to Maury Ranger Station
43.39 180 0.02 mile east of Camp Creek Road
55.53 170 0.10 mile west of Paulina Valley Road at Paulina
55.89 180 0.02 mile west of Paulina-Suplee Road
SERVICE CREEK-MITCHELL HIGHWAY NO. 390
Milepoint indicates distance from John Day Highway (OR19), at Service Creek
0.05 130 0.05 mile south of John Day Highway (OR19)
5.62 180 0.10 mile south of Richmond Road
Equation: MP 8.95 BK = MP 9.48 AH
14.60 170 0.02 mile east of Twickenham Road
21.75 170 0.05 mile north of Hudspeth Logging Road
24.30 220 0.02 mile north of Ochoco Highway (US26)
KIMBERLY-LONG CREEK HIGHWAY NO. 402
Milepoint indicates distance from John Day Highway (OR19), at Kimberly
0.02 190 0.02 mile northeast of John Day Highway (OR19)
5.30 180 0.15 mile east of Rudio Road
9.60 210 0.02 mile west of Cupper Creek Road
12.78 280 0.02 mile west of Monument Line Road (Top Road)
12.82 290 0.02 mile east of Monument Line Road (Top Road)
13.17 340 0.02 mile west of Wall Creek Road
13.62 350 0.02 mile northwest of John Day Street
13.96 260 East city limits of Monument
14.40 230 0.02 mile north of Deer Creek Road
17.07 140 0.02 mile east of W. Cottonwood Creek Road
23.38 160 0.20 mile west of Hamilton Road
26.91 160 0.02 mile east of Fox-Round Basin Road
34.34 220 0.02 mile west of Bennett Street
34.72 270 0.02 mile west of Eagle Street
34.86 310 0.02 mile west of Pendleton-John Day Highway (US395)
SUMPTER HIGHWAY NO. 410
Milepoint indicates distance from west city limits of Sumpter
0.00 220 West city limits of Sumpter
0.59 340 0.02 mile north of Auburn Street
3.56 320 0.15 mile northwest of Whitney Highway (OR7)
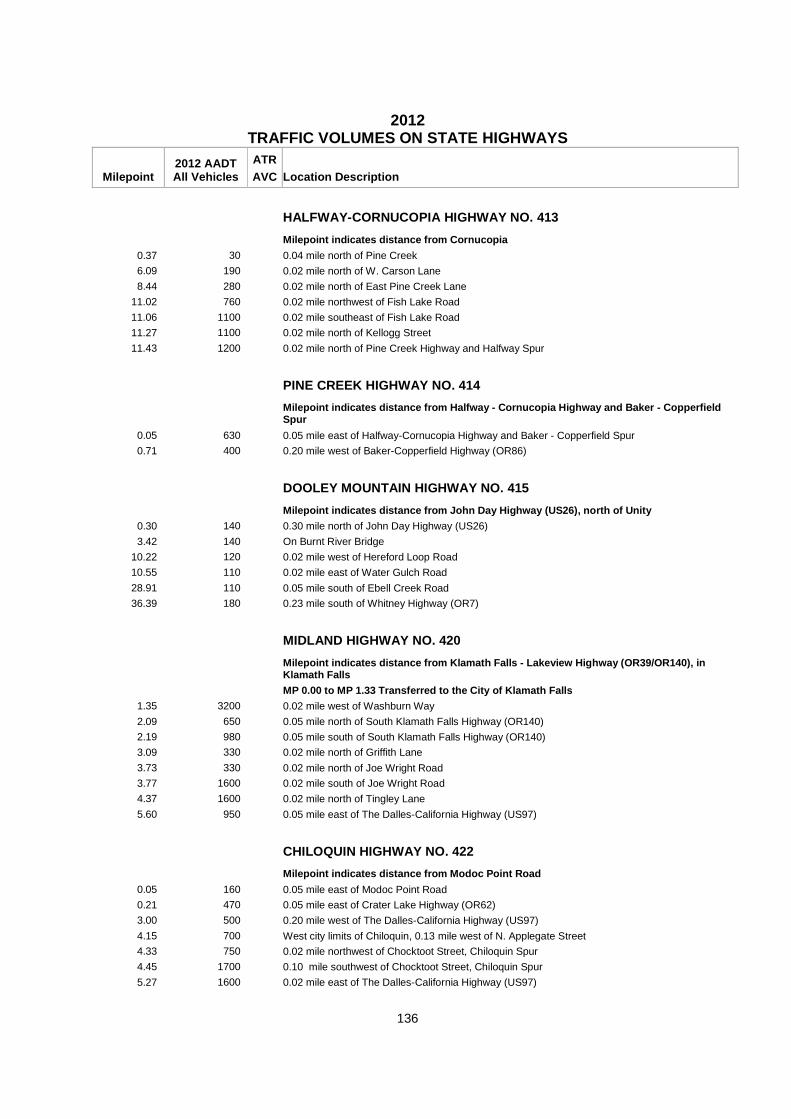
2012
TRAFFIC VOLUMES ON STATE HIGHWAYS
Milepoint 2012 AADT All Vehicles
ATR AVC Location Description
136
HALFWAY-CORNUCOPIA HIGHWAY NO. 413
Milepoint indicates distance from Cornucopia
0.37 30 0.04 mile north of Pine Creek
6.09 190 0.02 mile north of W. Carson Lane
8.44 280 0.02 mile north of East Pine Creek Lane
11.02 760 0.02 mile northwest of Fish Lake Road
11.06 1100 0.02 mile southeast of Fish Lake Road
11.27 1100 0.02 mile north of Kellogg Street
11.43 1200 0.02 mile north of Pine Creek Highway and Halfway Spur
PINE CREEK HIGHWAY NO. 414
Milepoint indicates distance from Halfway - Cornuco pia Highway and Baker - Copperfield Spur
0.05 630 0.05 mile east of Halfway-Cornucopia Highway and Baker - Copperfield Spur
0.71 400 0.20 mile west of Baker-Copperfield Highway (OR86)
DOOLEY MOUNTAIN HIGHWAY NO. 415
Milepoint indicates distance from John Day Highway (US26), north of Unity
0.30 140 0.30 mile north of John Day Highway (US26)
3.42 140 On Burnt River Bridge
10.22 120 0.02 mile west of Hereford Loop Road
10.55 110 0.02 mile east of Water Gulch Road
28.91 110 0.05 mile south of Ebell Creek Road
36.39 180 0.23 mile south of Whitney Highway (OR7)
MIDLAND HIGHWAY NO. 420
Milepoint indicates distance from Klamath Falls - L akeview Highway (OR39/OR140), in Klamath Falls
MP 0.00 to MP 1.33 Transferred to the City of Klama th Falls
1.35 3200 0.02 mile west of Washburn Way
2.09 650 0.05 mile north of South Klamath Falls Highway (OR140)
2.19 980 0.05 mile south of South Klamath Falls Highway (OR140)
3.09 330 0.02 mile north of Griffith Lane
3.73 330 0.02 mile north of Joe Wright Road
3.77 1600 0.02 mile south of Joe Wright Road
4.37 1600 0.02 mile north of Tingley Lane
5.60 950 0.05 mile east of The Dalles-California Highway (US97)
CHILOQUIN HIGHWAY NO. 422
Milepoint indicates distance from Modoc Point Road
0.05 160 0.05 mile east of Modoc Point Road
0.21 470 0.05 mile east of Crater Lake Highway (OR62)
3.00 500 0.20 mile west of The Dalles-California Highway (US97)
4.15 700 West city limits of Chiloquin, 0.13 mile west of N. Applegate Street
4.33 750 0.02 mile northwest of Chocktoot Street, Chiloquin Spur
4.45 1700 0.10 mile southwest of Chocktoot Street, Chiloquin Spur
5.27 1600 0.02 mile east of The Dalles-California Highway (US97)

2012
TRAFFIC VOLUMES ON STATE HIGHWAYS
Milepoint 2012 AADT All Vehicles
ATR AVC Location Description
137
SOUTH KLAMATH FALLS HIGHWAY NO. 424
Milepoint indicates distance from The Dalles - Cali fornia Highway (US97), south of Klamath Falls
0.12 8600 0.12 mile east of Green Springs Interchange
1.47 9300 0.10 mile northwest of Midland Highway
1.67 9000 0.10 mile southeast of Midland Highway
3.27 7500 0.47 mile east of Washburn Way
3.85 8300 0.02 mile west of Summers Lane
3.89 8100 0.02 mile east of Summers Lane
4.83 4900 0.20 mile east Homedale Road
5.95 5100 0.02 mile west of Klamath Falls-Malin Highway (OR39)
HATFIELD HIGHWAY NO. 426
Milepoint indicates distance from Klamath Falls - L akeview Highway (OR140), in Klamath Falls
17.00 2400 0.49 mile south of Klamath Falls-Malin Highway No. 50
18.70 2200 0.23 mile north of State Line Road
CRESCENT LAKE HIGHWAY NO. 429
Milepoint indicates distance from Willamette Highwa y (OR58), at Crescent Lake Jct.
0.02 370 0.02 mile south of Willamette Highway (OR58)
2.37 70 0.02 mile north of Lava Odell Road
WARNER HIGHWAY NO. 431
Milepoint indicates distance from Fremont Highway ( US395), north of Lakeview
0.10 500 0.10 mile east of Fremont Highway (US395)
8.07 490 0.02 mile west of Summit Prairie Road
Equation: MP 9.33 BK = MP 9.55 AH
15.81 380 0.02 mile east of Plush Cutoff Road
28.08 290 0.10 mile west of Twenty Mile Road
28.28 260 0.10 mile east of Twenty Mile Road
65.28 160 Oregon-Nevada State Line
FRENCHGLEN HIGHWAY NO. 440
Milepoint indicates distance from Steens Highway (O R78), east of Burns
0.01 390 * Frenchglen Automatic Traffic Recorder, Sta. 13-005, 0.01 mile south of Steens Highway No. 442 (OR78)
2.05 510 0.02 mile south of Hotchkiss Lane
6.09 470 0.02 mile north of Island Ranch Road
6.13 430 0.01 mile south of Island Ranch Road
23.90 270 0.03 mile north of Narrows-Princeton Road
23.96 220 0.03 mile south of Princeton-Narrows Road
40.63 220 0.02 mile northwest of Diamond Grain Camp Road (S. Diamond Lane)
40.67 200 0.02 mile southeast of Diamond Grain Camp Road (S. Diamond Lane)
58.24 230 0.05 mile north of Steens Mountain Loop Lane at Frenchglen
58.35 190 0.06 mile west of Steens Mountain Loop Lane at Frenchglen
Equation: MP 63.32 BK = MP 63.72 AH

2012
TRAFFIC VOLUMES ON STATE HIGHWAYS
Milepoint 2012 AADT All Vehicles
ATR AVC Location Description
138
FRENCHGLEN HIGHWAY NO. 440 (Continued)
73.33 160 0.02 mile north of Catlow Valley Road
STEENS HIGHWAY NO. 442
Milepoint indicates distance from Central Oregon Hi ghway (US20), in Burns
0.02 3200 0.02 mile east of Central Oregon Highway (US20)
0.07 2300 0.02 mile east of Alder Avenue
0.18 2400 0.02 mile east of Cedar Avenue
0.26 2000 0.01 mile west of S. Elm Avenue
0.50 1700 0.02 mile west of Crane Boulevard
0.68 1500 0.02 mile west of KOA Avenue
1.70 1500 * Steens Automatic Traffic Recorder, Sta. 13-007, 0.03 mile west of Frenchglen Highway No. 440 (OR205)
1.75 1100 0.02 mile east of Frenchglen Highway (OR205)
3.68 720 0.02 mile southeast of Airport Road
6.59 660 0.02 mile southeast of Faye Lane
16.73 550 0.02 mile east of Lawen Lane
27.98 550 0.10 mile northwest of Crane-Venator Road
28.18 560 0.10 mile south of Crane-Venator Road
37.77 370 0.02 mile north of Lava Beds Road
37.81 200 0.02 mile southeast of Lava Beds Road
51.81 160 0.02 mile west of Malheur Cave Road
60.88 150 Harney-Malheur County Line
65.20 150 0.02 mile southeast of Folly Farm Road
91.00 140 0.60 mile northwest of I.O.N. Highway (US95)
HUNTINGTON HIGHWAY NO. 449
Milepoint indicates distance from Old Oregon Trail (I-84), north of Lime
0.61 50 0.61 mile southeast of Old Oregon Trail (I-84)
3.21 200 0.05 mile north of connection to eastbound Old Oregon Trail Highway (I-84)
3.28 280 0.02 mile south of connection to eastbound Old Oregon Trail Highway (I-84)
5.84 490 0.02 mile south of E. 1st Street
6.47 340 0.36 mile south of E. Madison
9.98 500 Baker-Malheur County Line, 1.11 miles north of Old Oregon Trail (I-84)
SUCCOR CREEK HIGHWAY NO. 450
Milepoint indicates distance from Central Oregon Hi ghway (US20/US26), in Nyssa
0.04 2600 0.02 mile south of Central Oregon Highway (US20/US26)
0.39 1900 0.02 mile northeast of King Avenue, west city limits of Nyssa
0.43 1800 0.02 mile west of King Avenue
0.68 1500 0.02 mile west of Stringer Road
1.59 2000 0.02 mile north of Cloverdale Avenue
1.63 1900 0.02 mile south of Cloverdale Avenue
3.09 1900 0.02 mile east of Enterprise Avenue
3.26 1400 0.15 mile south of Enterprise Avenue
4.18 1200 0.02 mile south of Grand Avenue
6.54 1200 0.02 mile south of Klamath Avenue
7.94 1100 0.02 mile north of Owyhee Avenue

2012
TRAFFIC VOLUMES ON STATE HIGHWAYS
Milepoint 2012 AADT All Vehicles
ATR AVC Location Description
139
SUCCOR CREEK HIGHWAY NO. 450 (Continued)
8.02 1200 0.06 mile south of Owyhee Avenue
10.13 1100 0.02 mile north of Overstreet Road
10.17 1200 0.02 mile south of Overstreet Road
11.72 1300 North city limits of Adrian
11.96 1300 0.02 mile north of Main Street
12.12 1200 0.02 mile south of Washington Street
12.23 1200 South city limits of Adrian
12.50 1100 0.01 mile north of Parma Spur
12.53 460 0.02 mile south of Parma Spur
16.97 380 0.02 mile south of Napton Road
20.09 380 0.02 mile west of Homedale Spur
VALE-WEST HIGHWAY NO. 451
Milepoint indicates distance from Central Oregon Hi ghway (US20), west of Vale
0.13 270 0.10 mile north of Central Oregon Highway (US20)
0.50 250 0.02 mile north of Loop Road
2.21 60 0.10 mile south of Whitney Road
3.59 80 0.02 mile south of Reed Loop Road
4.64 120 0.02 mile west of Hope Road
4.90 170 0.02 mile west of Bully Creek Road
4.94 280 0.02 mile east of Bully Creek Road
6.63 400 0.02 mile west of Greenfield Road
6.67 650 0.02 mile east of Greenfield Road
7.68 870 0.02 mile east of Cedar Road
9.63 1200 0.02 mile west of Alder Road
9.89 1400 0.02 mile east of Stage Road
10.32 1900 0.07 mile west of Central Oregon Highway (US20)
ADRIAN-ARENA VALLEY HIGHWAY NO. 453
Milepoint indicates distance from Adrian - Caldwell Highway (OR454)
0.05 360 0.05 mile east of Adrian-Caldwell Highway
0.97 310 0.02 mile west of Primrose Road
1.01 240 0.02 mile south of Primrose Road
2.19 260 0.05 mile north of Adrian-Caldwell Highway
2.29 90 0.05 mile east of Adrian-Caldwell Highway
3.14 90 0.05 mile west of State Line Road
ADRIAN-CALDWELL HIGHWAY NO. 454
Milepoint indicates distance from Succor Creek High way (Parma Spur)
0.05 520 0.05 mile south of Parma Spur
0.31 200 0.06 mile south of Adrian-Arena Valley Highway (Russett Road)
1.63 90 0.20 mile east of Big Bend Road
2.46 100 0.02 mile west of Adrian-Arena Valley Highway
2.50 280 0.02 mile south of Adrian-Arena Valley Highway
3.55 320 0.02 mile east of Redtop Road
4.41 260 0.02 mile south of State Line Road

2012
TRAFFIC VOLUMES ON STATE HIGHWAYS
Milepoint 2012 AADT All Vehicles
ATR AVC Location Description
140
OLDS FERRY-ONTARIO HIGHWAY NO. 455
Milepoint indicates distance from Old Oregon Trail (I-84), near Olds Ferry
0.71 340 1.00 mile east of Old Oregon Trail Highway (I-84)
9.48 340 0.10 mile west of Nectarine Road
11.55 480 0.10 mile west of Weiser Spur (US95 Spur)
11.75 2800 0.10 mile east of Weiser Spur (US95 Spur)
16.61 2600 0.10 mile south of Ivy Road
19.55 3100 0.10 mile north of Payette Spur (OR52)
19.75 2600 0.10 mile south of Payette Spur (OR52)
21.71 5000 0.10 mile south of Boat Landing Road
24.85 5300 0.30 mile north of Old Oregon Trail Highway (I-84)
25.35 11600 0.20 mile south of Old Oregon Trail Highway (I-84)
Equation: MP 25.50 BK = MP 25.75 AH
26.17 5900 0.02 mile north of Verde Drive
27.75 4000 0.02 mile north of S.W. 4th Avenue
Equation: MP 27.90 BK = MP 29.44 AH
29.57 7200 0.02 mile south of Airport Way
31.61 8500 0.20 mile north of Central Oregon Highway (US20/US26)
I.O.N. HIGHWAY NO. 456
Milepoint indicates distance from Idaho - Oregon St ate Line
0.00 1500 Idaho-Oregon State Line
2.30 1400 0.02 mile south of Succor Creek Road
11.70 1400 0.02 mile south of Silver City Cutoff
18.88 1400 0.20 mile south of Pharmacy Hill Road
20.20 1500 0.02 mile north of California Avenue
20.24 1500 0.02 mile south of California Avenue
20.42 1500 0.02 mile north of Main Street
20.46 1600 0.02 mile west of Bassett Street
21.64 1500 West city limits of Jordan Valley
22.21 1300 0.02 mile west of Dinwitty Road
32.34 1300 0.02 mile west of Danner Loop Road
35.98 1300 0.02 mile west of Three Forks Road
47.41 1300 0.02 mile east of Arock Road
47.45 1200 0.02 mile west of Arock Road
52.97 1300 At Owyhee River Bridge
53.36 1300 0.06 mile east of Skull Creek Road
65.70 1200 0.50 mile east of Steens Highway (OR78)
91.48 1200 * Basque Automatic Vehicle Classifier, Sta. 23-012, 6.74 miles north of Blue Mountain Pass Summit
98.22 1200 At Blue Mountain Pass Summit
106.20 1200 0.02 mile south of Oregon Canyon Road
120.64 1300 0.02 mile south of Wilkinson Road
121.36 1400 Oregon-Nevada State Line at McDermitt
***Jurisdiction for ‘Redmond Spur Highway No. 480’ was transferred to the City of Redmond***

2012
TRAFFIC VOLUMES ON STATE HIGHWAYS
Milepoint 2012 AADT All Vehicles
ATR AVC Location Description
141
BAKER-COPPERFIELD SPUR HIGHWAY NO. 481
Milepoint indicates distance from La Grande - Baker Highway (US30), in Baker City
53.65 720 0.10 mile northwest of Baker-Copperfield Highway (OR86)
54.51 840 0.02 mile northwest of Dawson Street
54.68 1400 0.02 mile south of Pine Creek Highway
REDWOOD SPUR HIGHWAY NO. 482
Milepoint indicates distance from Rogue River Highw ay (OR99), at Redwood Jct. in Grants Pass
-0.05 18700 0.02 mile west of Parkdale Drive
-0.01 25400 0.02 mile east of Parkdale Drive
0.26 21900 0.02 mile north of "M" Street
1.28 18100 0.04 mile east of Terry Lane
1.54 20400 0.05 mile east of Agness Avenue
MCMINNVILLE SPUR HIGHWAY NO. 483
Milepoint indicates distance from Oregon Coast High way (US101), near Otis Jct.
46.60 15100 0.02 mile south of Mountain View Lane
46.75 15100 East city limits of McMinnville, 0.13 mile north of Mountain View Lane
ESPLANADE SPUR HIGHWAY NO. 484
Milepoint indicates distance from Klamath Falls - L akeview Highway (OR39/OR140), in Klamath Falls
5.02 5000 0.05 mile southwest of Klamath Falls-Malin Highway (OR39), on Esplanade Street
FORT STEVENS SPUR HIGHWAY NO. 485
Milepoint indicates distance from the west city lim its of Warrenton
4.53 3800 0.10 mile east of Fort Stevens Highway
5.37 1400 0.02 mile west of Oregon Coast Highway (US101)
GOLD HILL SPUR HIGHWAY NO. 486
Milepoint indicates distance from Rogue River Highw ay (OR99), in Grants Pass
2.38 6100 0.02 mile east of Dardanelles Street, Sams Valley Highway (OR234)
2.95 5100 0.12 mile north of Pacific Highway (I-5), at Kane Creek Interchange
CELILO-WASCO SPUR HIGHWAY NO. 487
Milepoint indicates distance from Columbia River Hi ghway (I-84), at Celilo
4.82 220 0.02 mile east of Celilo-Wasco Highway (OR206)
7.60 3900 0.02 mile west of Sherman Highway (US97)
CHILOQUIN SPUR HIGHWAY NO. 488
Milepoint indicates distance from Modoc Point Road
4.45 2700 0.06 mile east of Chiloquin Highway
4.56 2400 At Williamson River Bridge
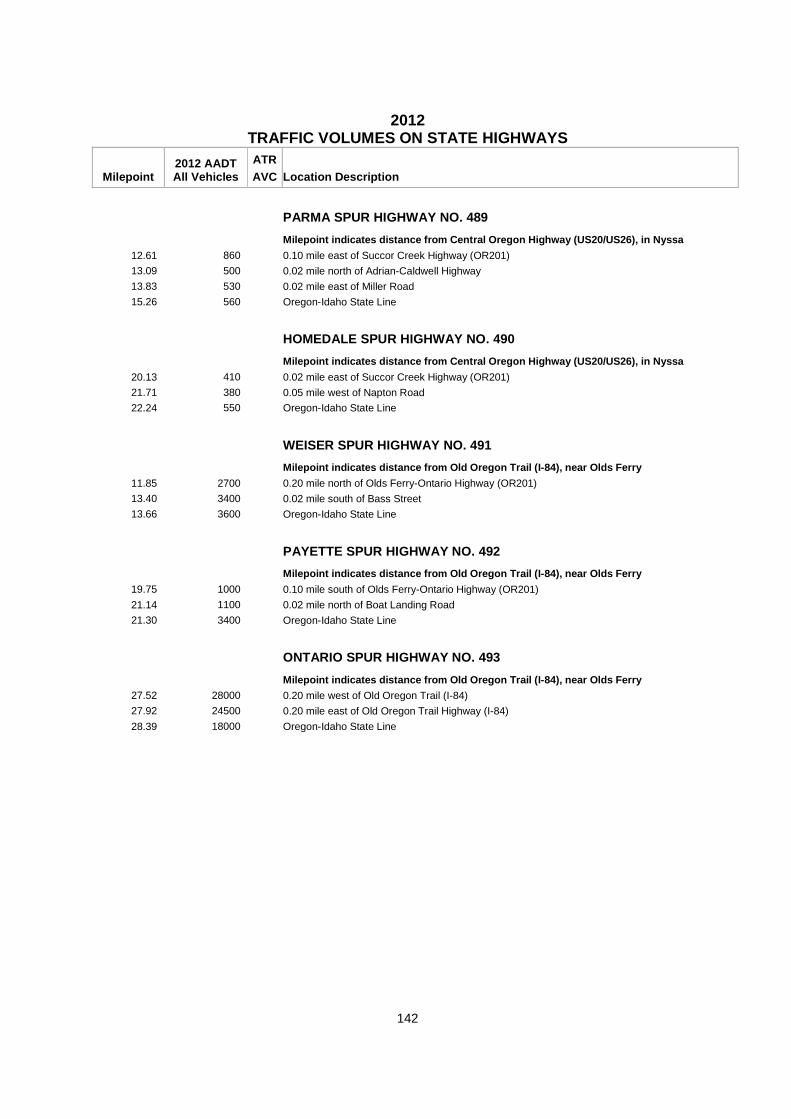
2012
TRAFFIC VOLUMES ON STATE HIGHWAYS
Milepoint 2012 AADT All Vehicles
ATR AVC Location Description
142
PARMA SPUR HIGHWAY NO. 489
Milepoint indicates distance from Central Oregon Hi ghway (US20/US26), in Nyssa
12.61 860 0.10 mile east of Succor Creek Highway (OR201)
13.09 500 0.02 mile north of Adrian-Caldwell Highway
13.83 530 0.02 mile east of Miller Road
15.26 560 Oregon-Idaho State Line
HOMEDALE SPUR HIGHWAY NO. 490
Milepoint indicates distance from Central Oregon Hi ghway (US20/US26), in Nyssa
20.13 410 0.02 mile east of Succor Creek Highway (OR201)
21.71 380 0.05 mile west of Napton Road
22.24 550 Oregon-Idaho State Line
WEISER SPUR HIGHWAY NO. 491
Milepoint indicates distance from Old Oregon Trail (I-84), near Olds Ferry
11.85 2700 0.20 mile north of Olds Ferry-Ontario Highway (OR201)
13.40 3400 0.02 mile south of Bass Street
13.66 3600 Oregon-Idaho State Line
PAYETTE SPUR HIGHWAY NO. 492
Milepoint indicates distance from Old Oregon Trail (I-84), near Olds Ferry
19.75 1000 0.10 mile south of Olds Ferry-Ontario Highway (OR201)
21.14 1100 0.02 mile north of Boat Landing Road
21.30 3400 Oregon-Idaho State Line
ONTARIO SPUR HIGHWAY NO. 493
Milepoint indicates distance from Old Oregon Trail (I-84), near Olds Ferry
27.52 28000 0.20 mile west of Old Oregon Trail (I-84)
27.92 24500 0.20 mile east of Old Oregon Trail Highway (I-84)
28.39 18000 Oregon-Idaho State Line


144

PACIFIC HIGHWAY NO. 1 (I-5)
Interchange Ramp Diagrams with Annual Average Daily Traffic Volumes.
145

146


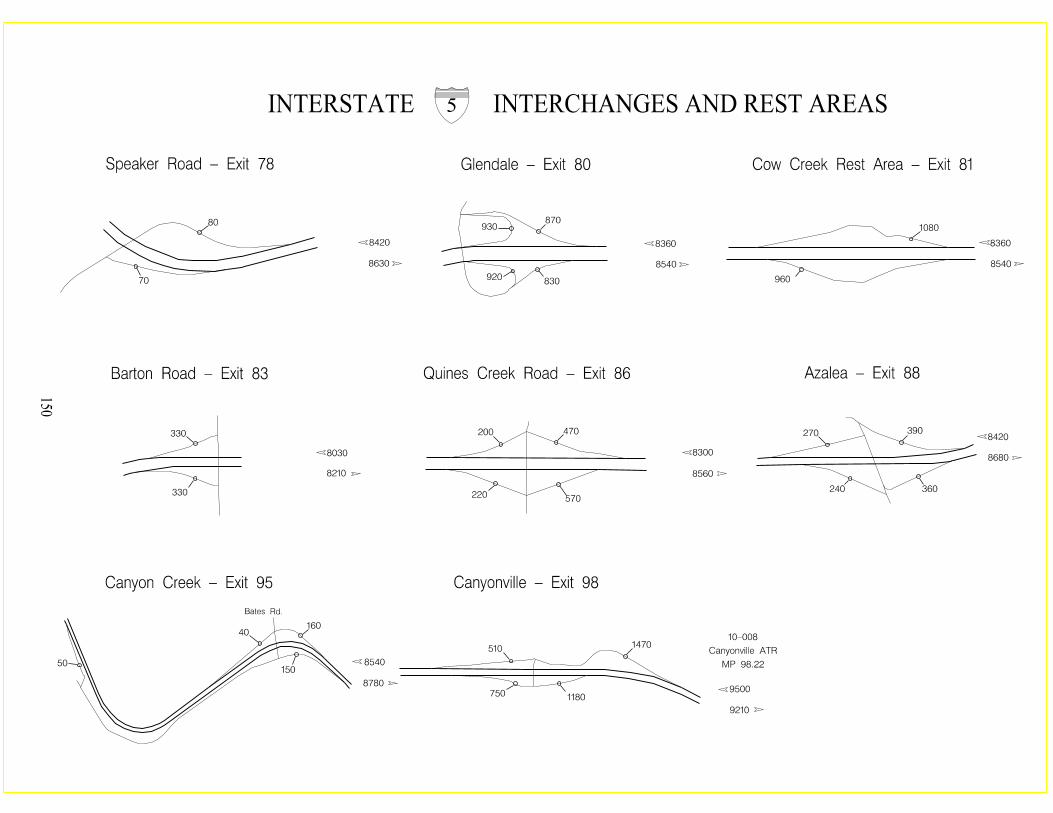


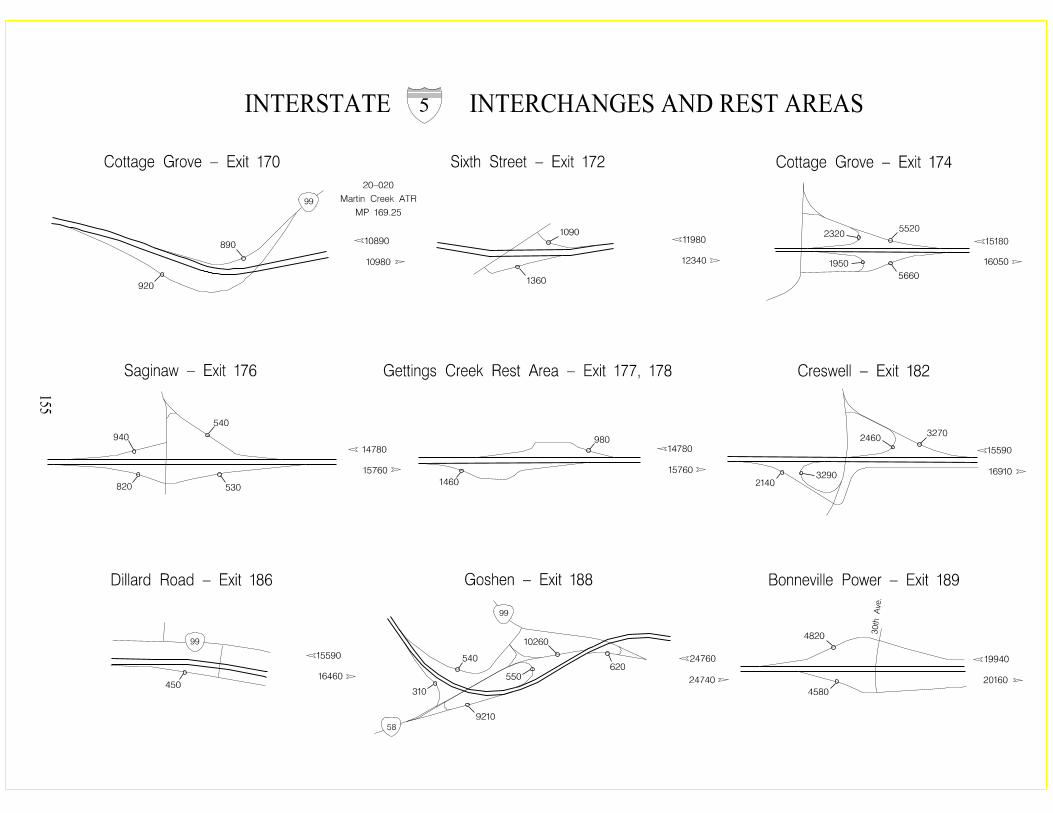


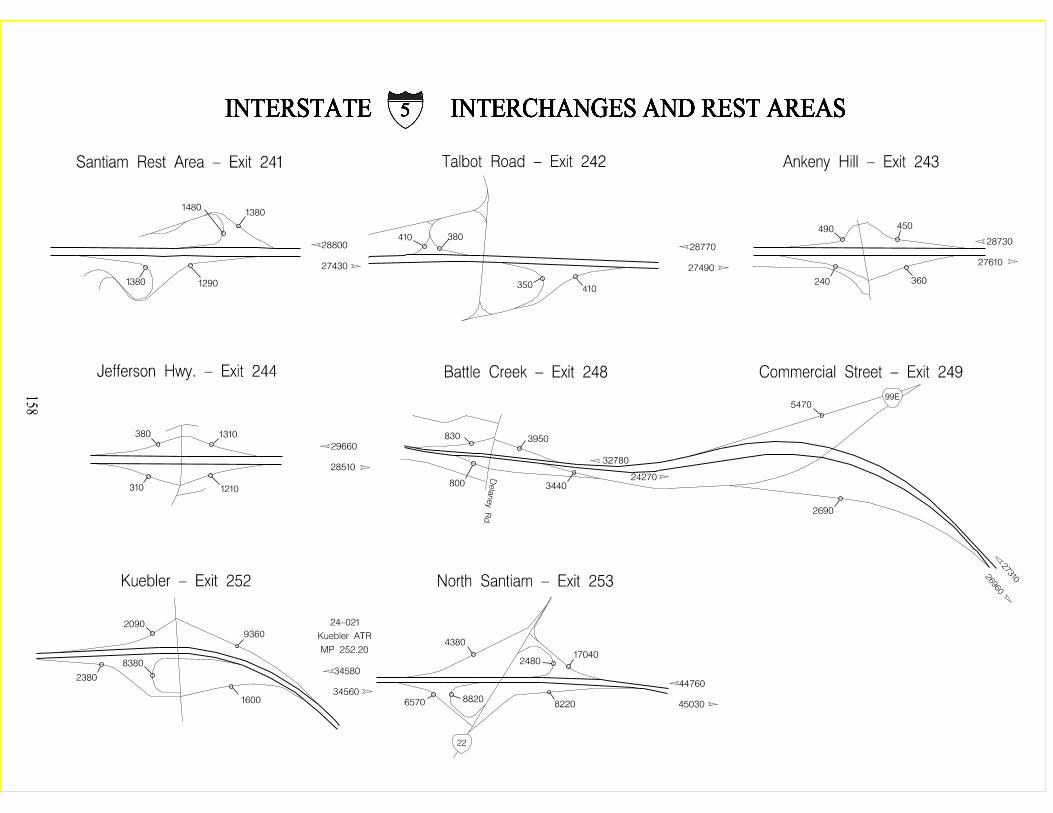


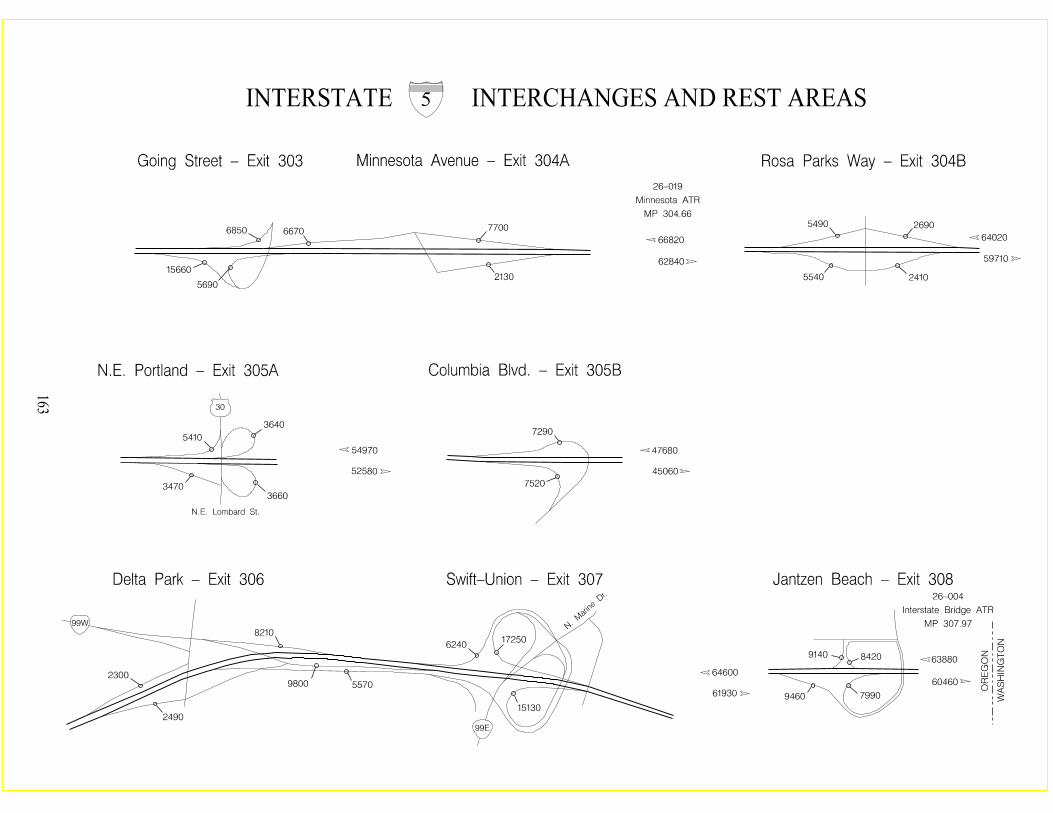

164
COLUMBIA RIVER HIGHWAY NO. 2 (I-84)
AND
OLD OREGON TRAIL NO. 6 (I-84)
Interchange Ramp Diagrams with Annual Average Daily Traffic Volumes.
165

166


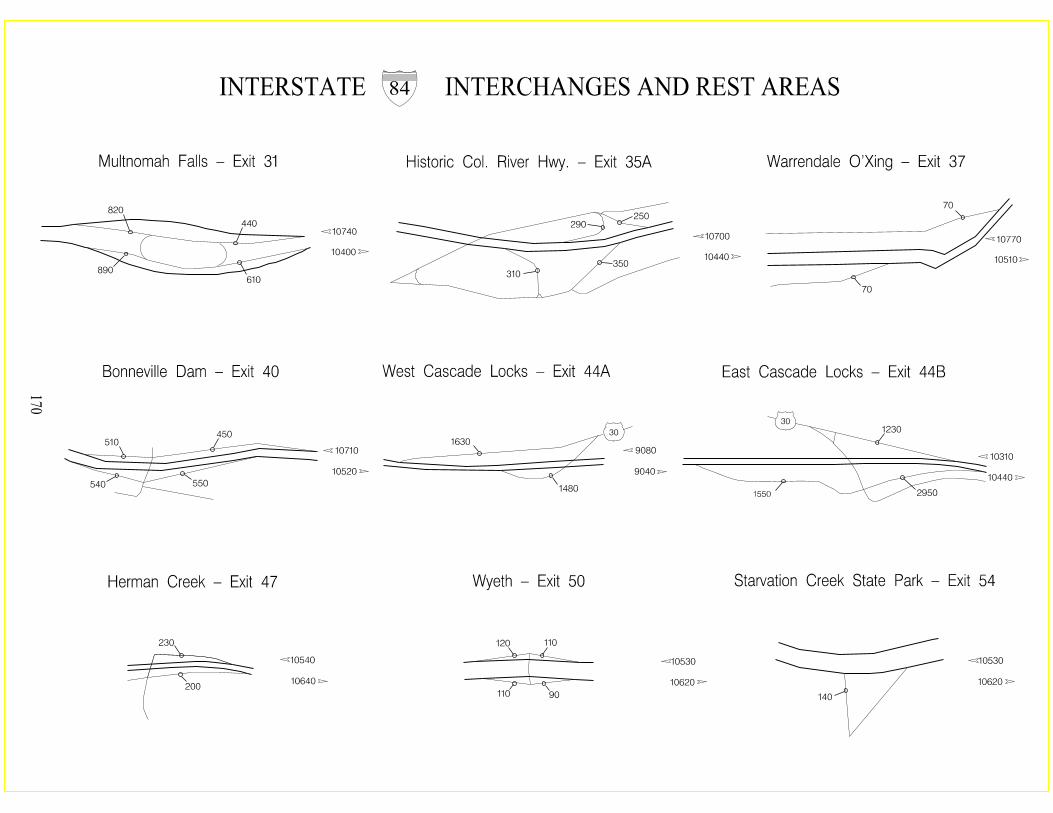
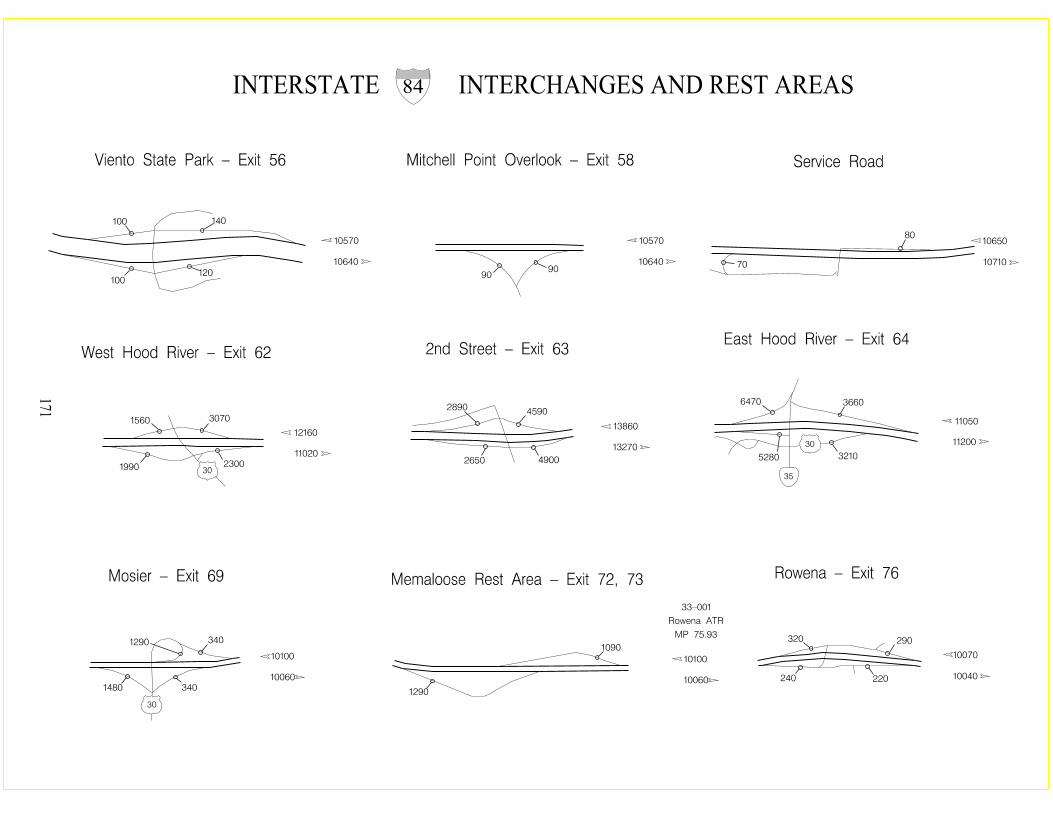


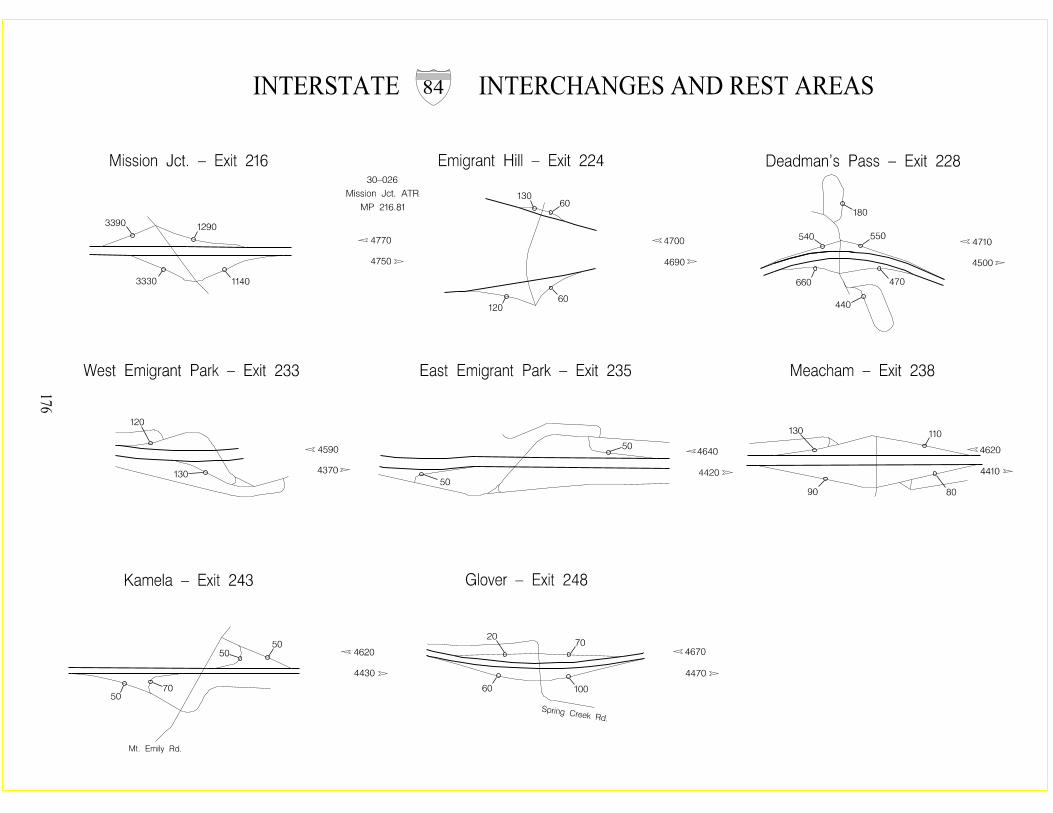
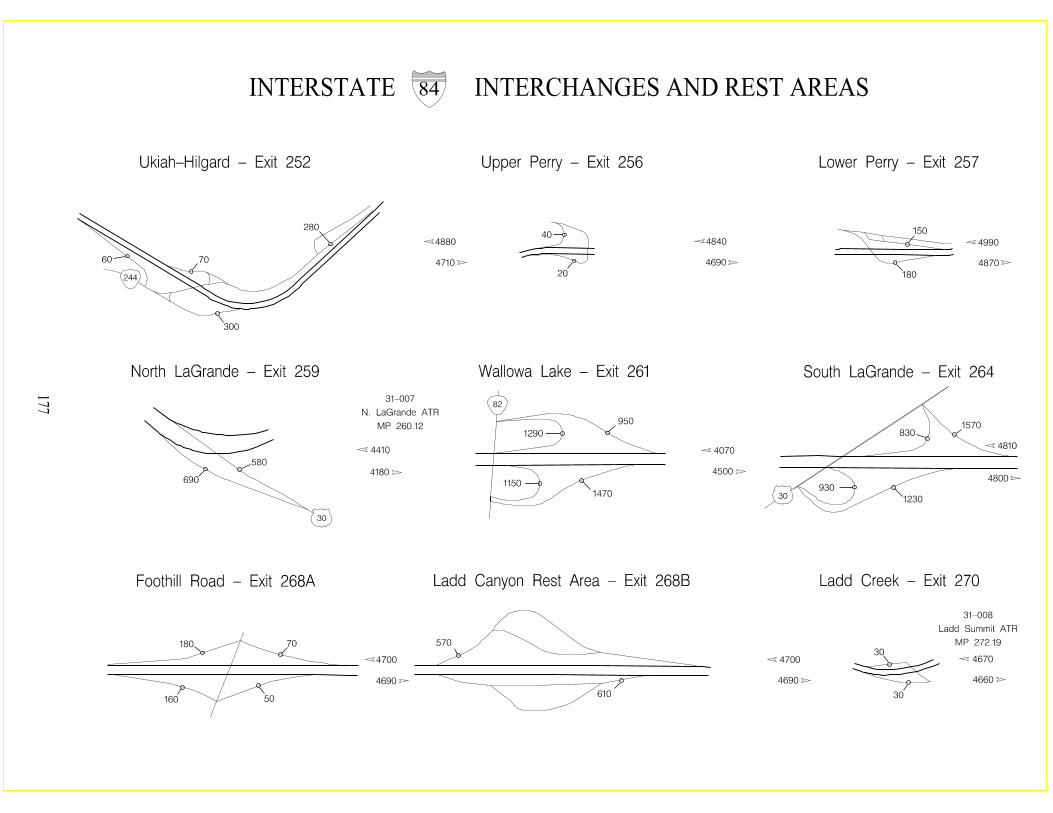
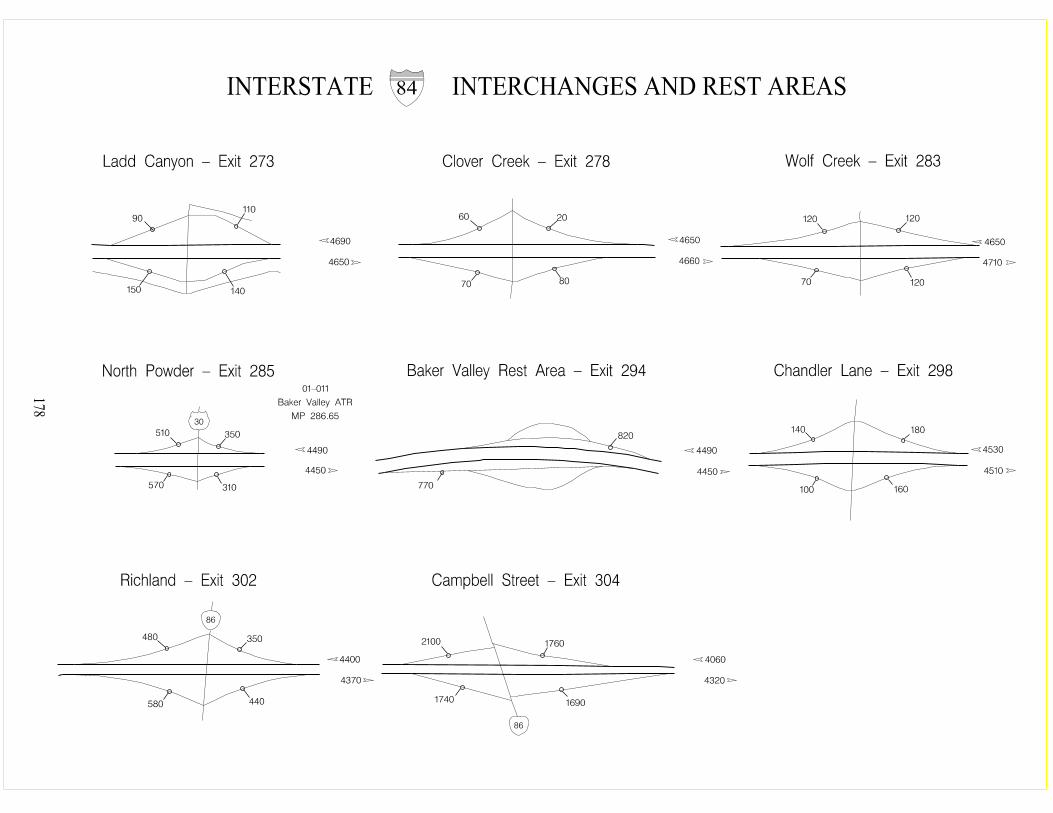

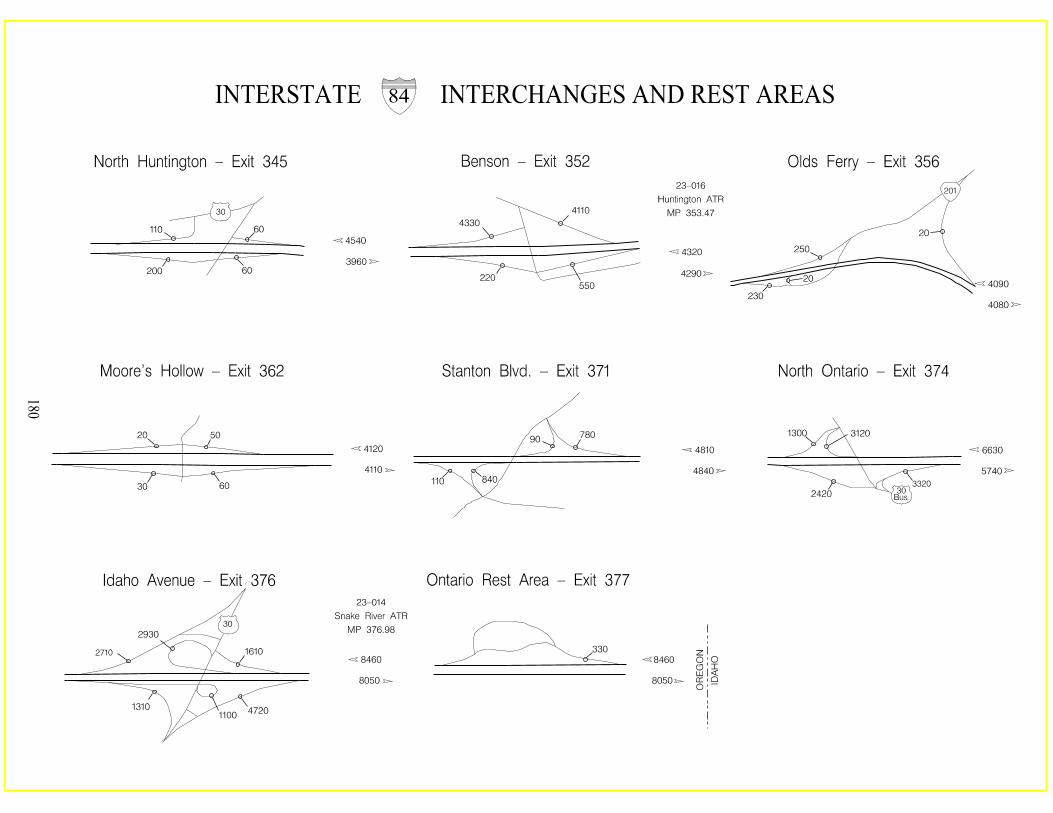

THE DALLES-CALIFORNIA HIGHWAY NO. 4 (US97)
Interchange Ramp Diagrams of the Bend Parkway section in Bend with Annual Average Daily Traffic Volumes.
181

182
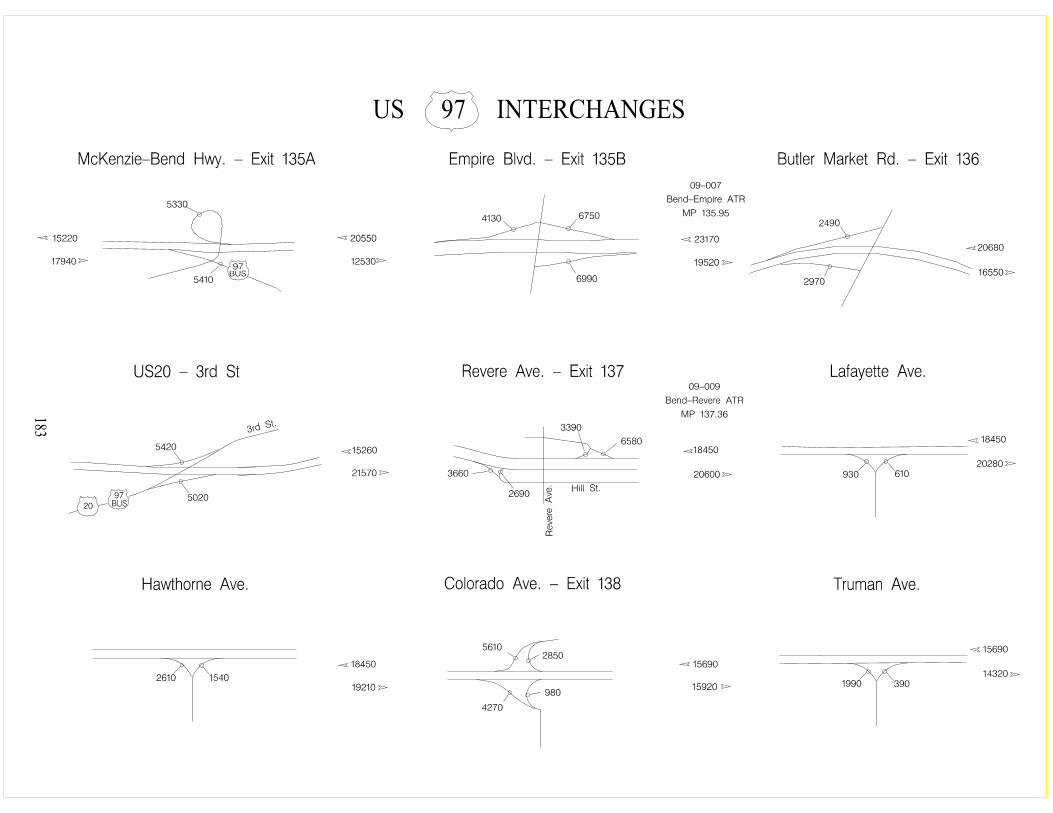


SUNSET HIGHWAY NO. 47 (US26)
Interchange Ramp Diagrams from Wilson River Highway No. 37 (OR6) east to Stadium Freeway Highway No. 61 (I-405) in Portland with Annual Average Daily Traffic Volumes.
185

186


STADIUM FREEWAY HIGHWAY NO. 61 (I-405)
Interchange Ramp Diagrams with Annual Average Daily Traffic Volumes.
189

190
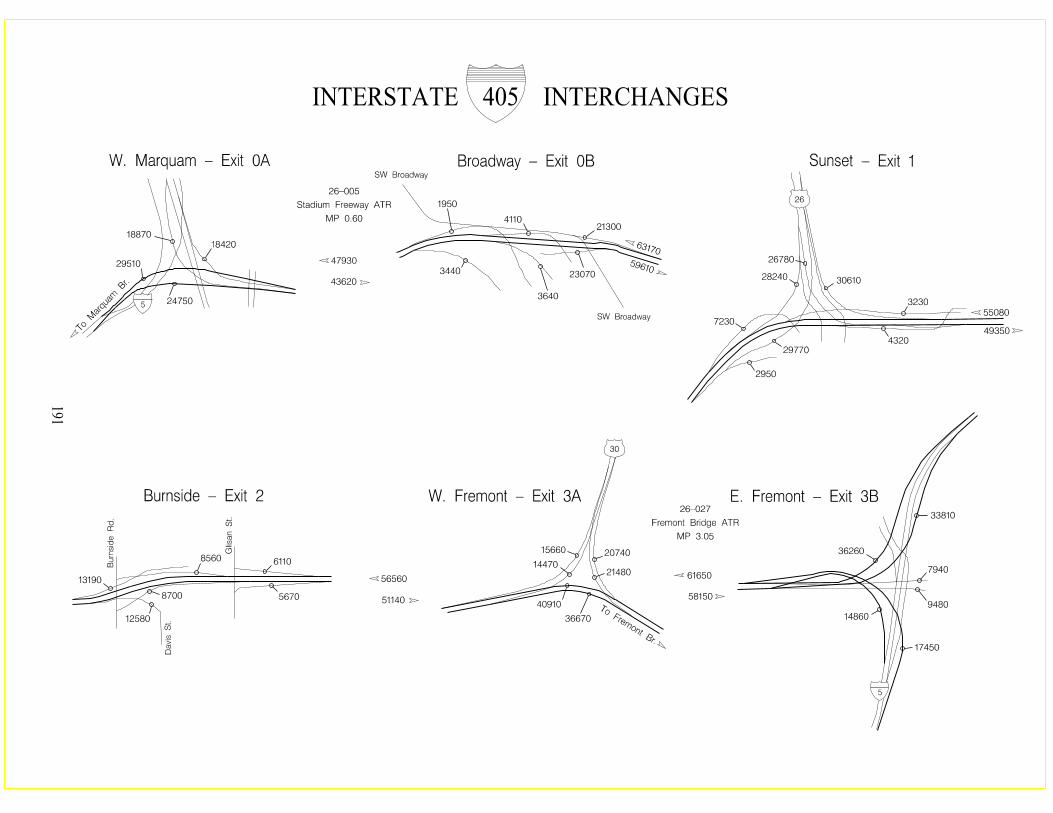

192
EAST PORTLAND FREEWAY HIGHWAY NO. 64 (I-205)
Interchange Ramp Diagrams with Annual Average Daily Traffic Volumes.
193

194

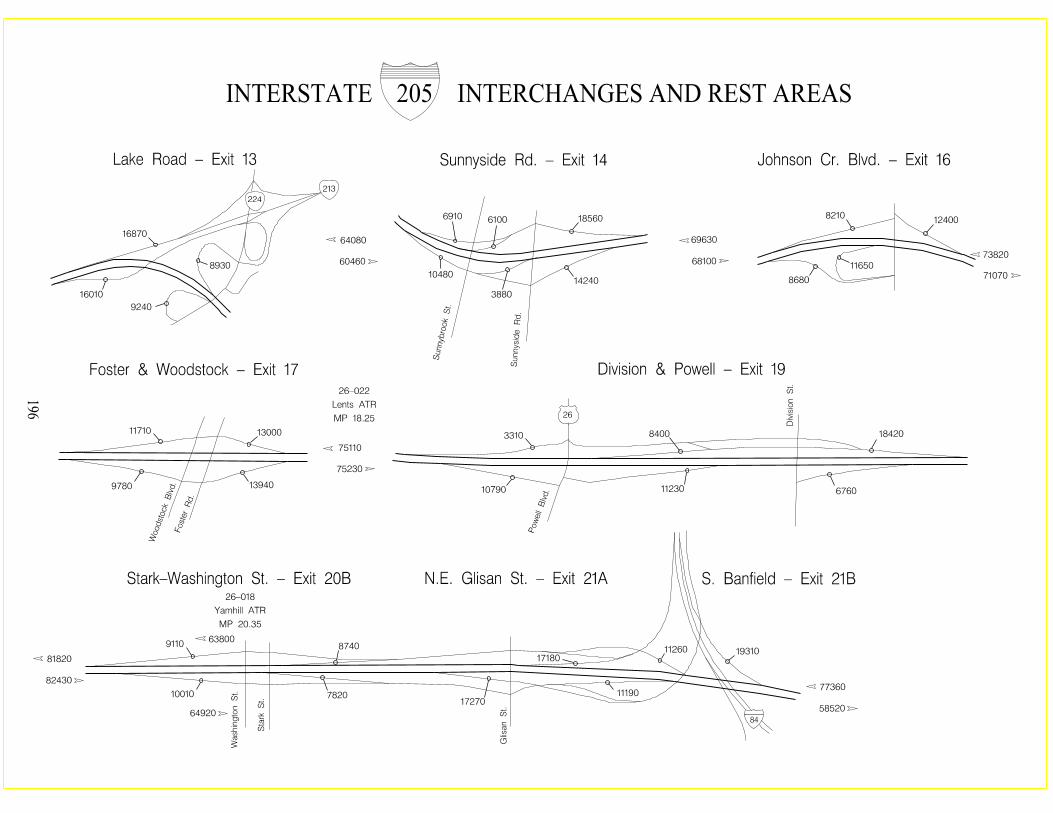
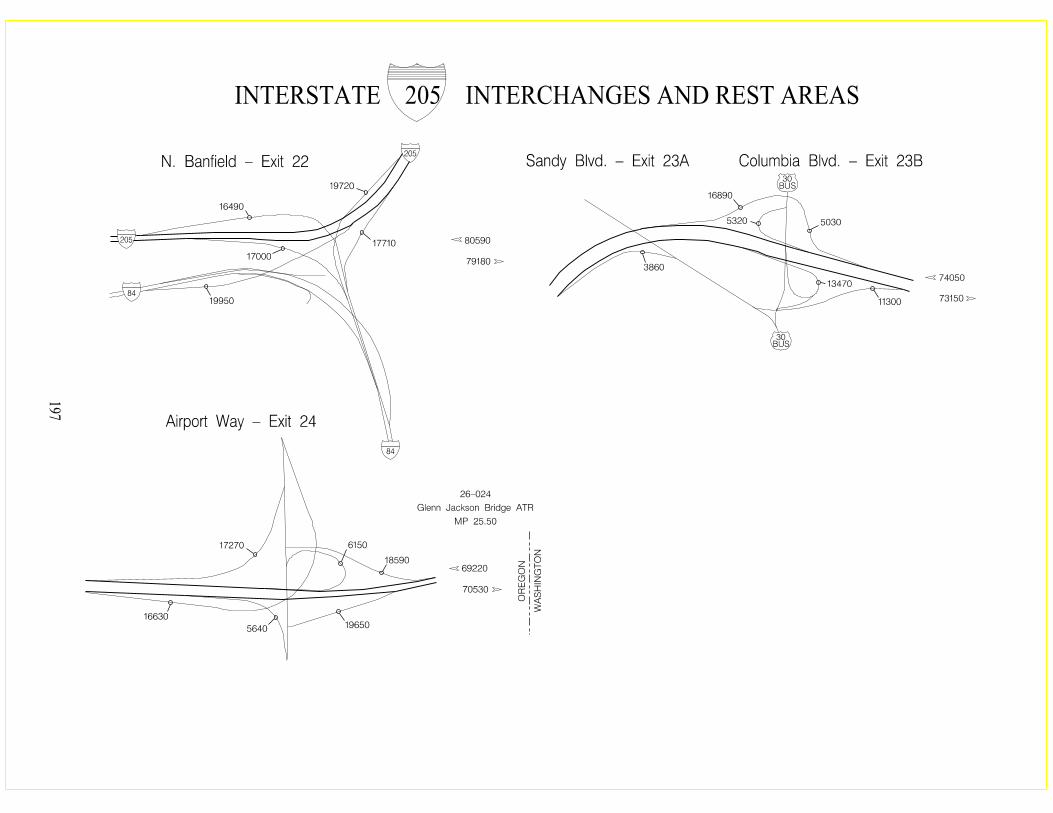

198

BELTLINE HIGHWAY NO. 69 (OR569)
Interchange Ramp Diagrams with Annual Average Daily Traffic Volumes.
199

200
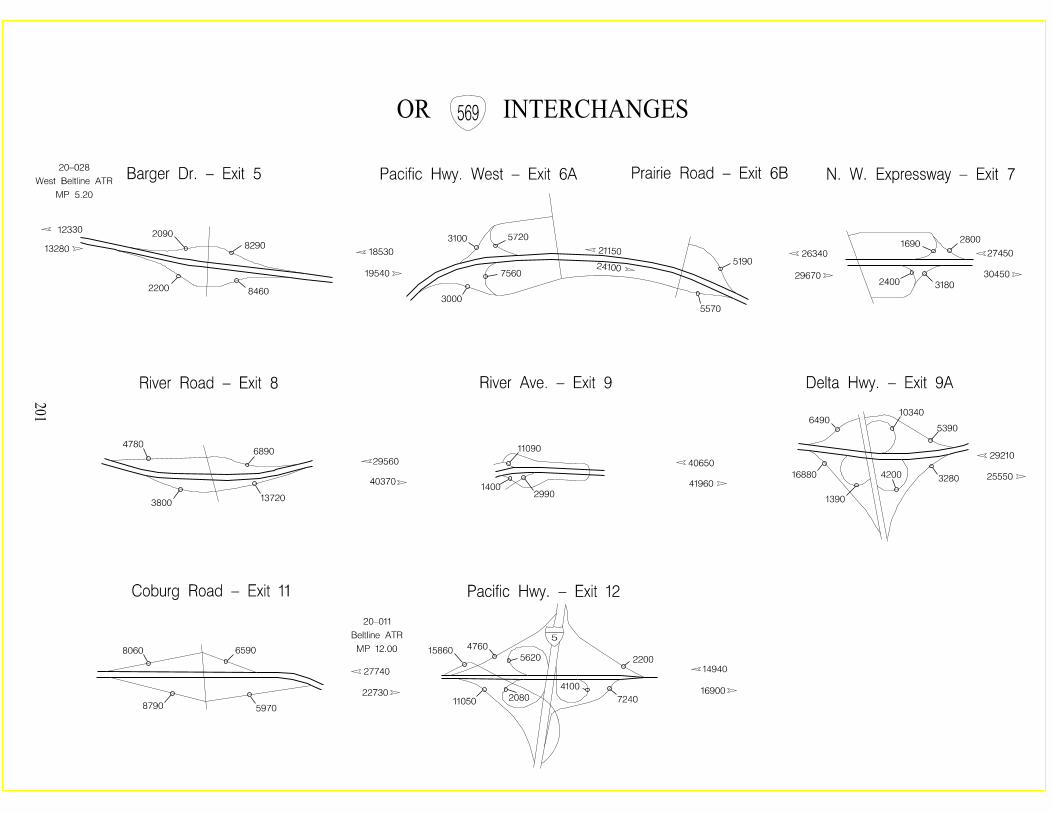

202

MCNARY HIGHWAY NO. 70 (I-82)
Interchange Ramp Diagrams with Annual Average Daily Traffic Volumes.
203

204
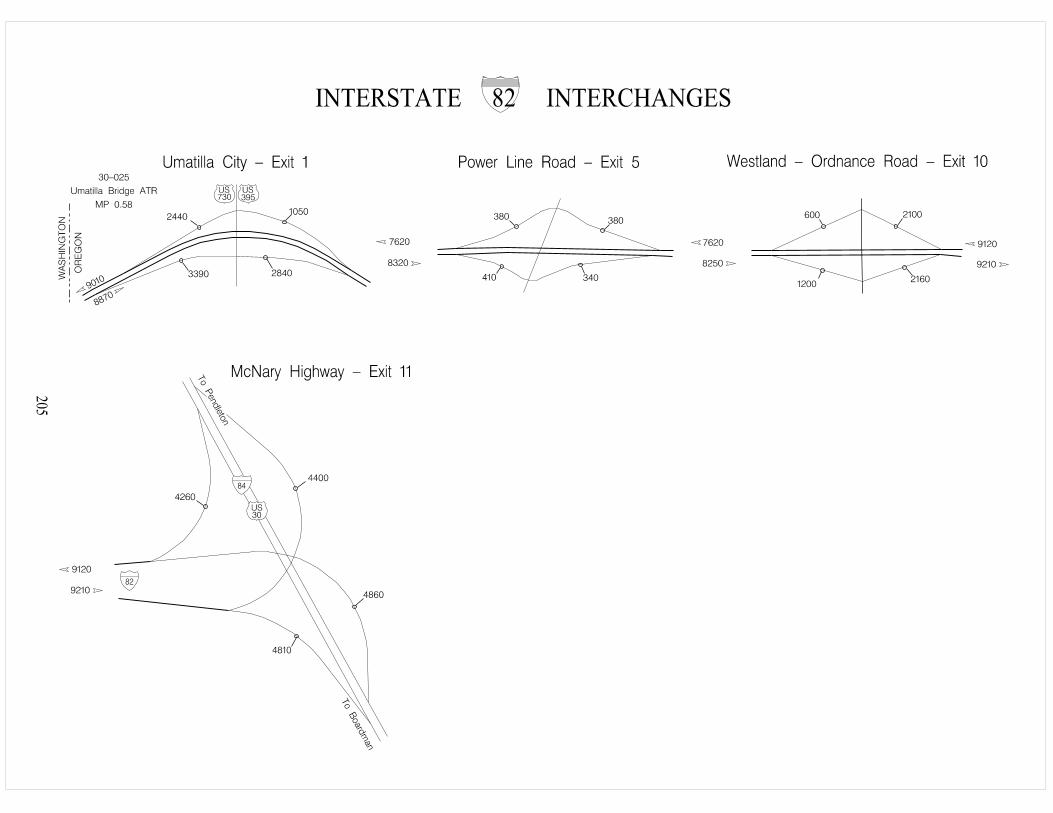

206

BEAVERTON – TIGARD HIGHWAY NO. 144 (OR217)
Interchange Ramp Diagrams with Annual Average Daily Traffic Volumes.
207

208


210

NORTH SANTIAM HIGHWAY NO. 162 (OR22)
Interchange Ramp Diagrams from I-5 to Stayton with Annual Average Daily Traffic Volumes.
211

212


214

EUGENE – SPRINGFIELD HIGHWAY NO. 227 (I-105 & OR126)
Interchange Ramp Diagrams with Annual Average Daily Traffic Volumes.
215

216
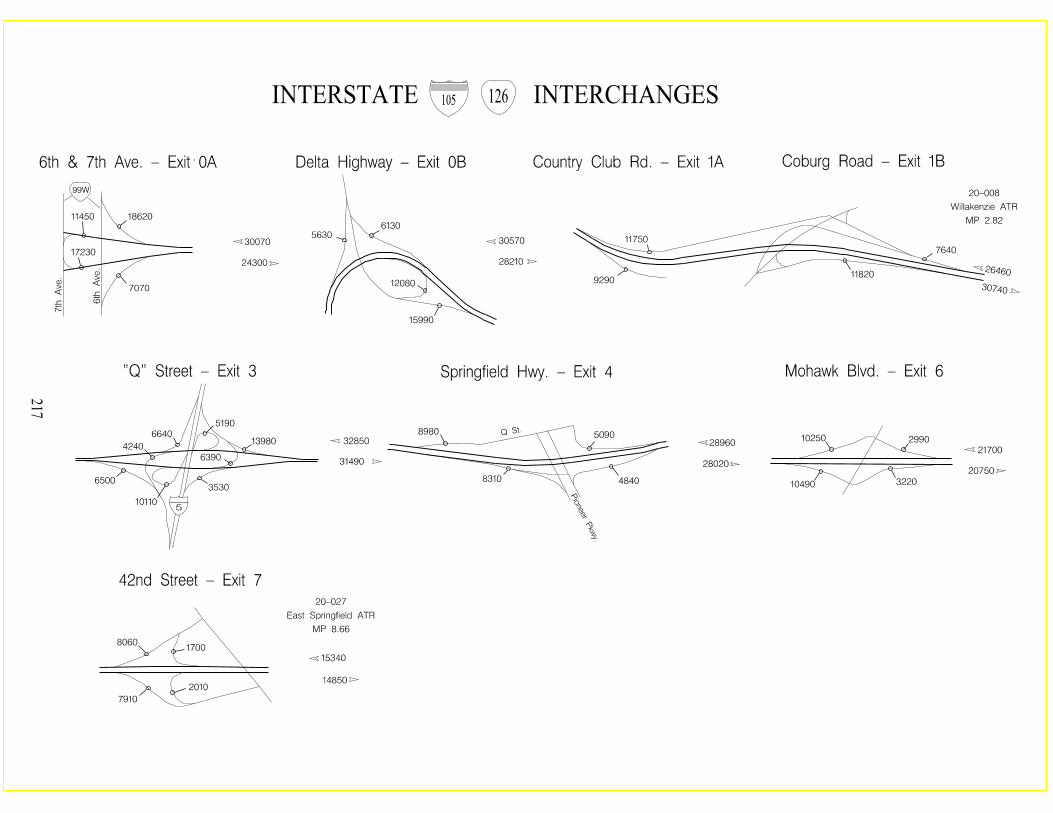

218

SECTION II
INTRODUCTION TO
TRENDS AT AUTOMATIC TRAFFIC RECORDER STATIONS
Section II contains traffic data at 174 Automatic Traffic Recorder Stations and Automatic Vehicle Classification Stations.
Historical data by year consists of the Average Daily Traffic (ADT), Maximum Day, Maximum Hour, 10th, 20th, and 30th Highest Hours. Please note the Maximum Day, Maximum Hour, 10th, 20th, and 30th Highest Hours are expressed in percent of the AADT. The bar graph shows the traffic volume pattern for the last 10 years or since the station was placed in service. Asterisks (***), indicate recorder was inoperative during these periods.
For Historical Data at Stations activated before 2002, see Transportation Volume Tables for 2010 or earlier publications.
The current year's data consists of both the Average Weekday Traffic and Average Daily Traffic by month and is shown as a percent AADT. Vehicle classification breakdown is shown as a percent of AADT. Classification counts, at Automatic Traffic Recorders, were obtained during a 16 or 24 hour period during 2009-2011. Classification counts, at Automatic Vehicle Classification Stations, are continuously collected for the period of operation.
ODOT has classification data located online for the entire State Highway network. If you are using the data in preparation for a project, please use the web address below to find the proper data required for your project.
https://highway.odot.state.or.us/cf/highwayreports/traffic_parms.cfm
219

220

BendVale
Cove
Scio
MoroIone
Echo
Salem
Rufus
Drain
Ukiah
Elgin
Malin
Unity
Wasco
Union
Spray
Nyssa
Lyons
Hines
Helix
Gates
Dufur
Burns
Adams
Riddle
Dallas
Toledo
Talent
Seneca
Powers
Madras
Joseph
Imbler
Idanha
Culver
Veneta
Turner
Adrian
Siletz
Mosier
Monroe
Maupin
Lowell
Halsey
Haines
Fossil
Eugene
Elkton
Condon
Bandon
Albany
Irrigon
Phoenix
Lostine
Yachats
Westfir
Wallowa
Sumpter
Paisley
La Pine
HalfwayGranite
Ashland
Seaside
Nehalem
Lebanon
Winston
Wheeler
Tangent
Stayton
Sisters
Shaniko
Redmond
Rainier
Ontario
Oakland
Newport
Molalla
Merrill
Medford
Heppner
Bonanza
Astoria
Oakridge
Glendale
Coos Bay
Sheridan
Bay City
Waldport
RichlandMonument
MitchellMetolius
Lonerock
Lakeview
Lakeside
JohnDay
Florence
Dayville
Yoncalla
Waterloo
BoardmanVernonia
UmatillaPrescott
Creswell
Coquille
Antelope
Roseburg
GoldHill
Hermiston
Arlington
La Grande
Tillamook
Reedsport
Philomath
Greenhorn
Chiloquin
Brookings
Warrenton
Stanfield
Lexington
Sutherlin
ScappoosePendleton
MillCity
Depoe Bay
DunesCity
TheDalles
Baker City
FallsCity
Shady Cove
Prineville
NorthBend
LongCreek
Gold Beach
Enterprise
HoodRiver
SweetHome
Pilot Rock
Huntington
Harrisburg
Clatskanie
RogueRiver
Island City
EaglePoint
Summerville
Port Orford
GrantsPass
CanyonCity
Springfield
Canyonville
ScottsMillsLincoln City
PrairieCityMount
Vernon
CannonBeach Saint Helens
North Powder
MyrtlePoint
MyrtleCreek
Jacksonville
GrassValley
Columbia City
CottageGrove
CaveJunction
CascadeLocks
KlamathFalls
Jordan Valley
Rockaway Beach
Milton-Freewater
Athena
Gearhart
Manzanita
Butte Falls
LAKEHARNEY
MALHEUR
LANE
GRANT
KLAMATH
DOUGLAS
LINN
BAKER
CROOK
UMATILLA
WALLOWA
WASCO
UNION
JACKSON
COOS
CURRY
DESCHUTES
MORROW
WHEELER
JEFFERSON
GILLIAM
MARIONPOLK
CLACKAMAS
JOSEPHINE
LINCOLN
TILLAMOOKYAMHILL
SHERMAN
CLATSOP
BENTON
COLUMBIA
HOODRIVERWASHINGTON
007
019
005
442
041
028
020
004
440
048
456
052
053431
138
018
012
102
380
021
270
011
049
341
300
010
015
071
162
229
045
026
321
014
200
027
042
360
047
272
350
340
320
044
058
050
001
091
016
415
233
006
290035
039
330
066
022
181
017
390
450
032
215
100
036
212
231
062
291
171
046
255 038
180
301
009
008
402
293
242
271
455
281
033
413
025
335
110
334
130
240
210
092
44920
1
260
023
244
451
131
351
103
104
250
273
002
429
001
006
300
001
007
022
004
004
138
004
018
015062
016
009
009
002
002
012
041
005
005
005
042
005456
019
F«
F«
F«
F«
F«
F«
F«
F«
F«
F«
F«
F«
F«
F«
F«
F«
F«F«
F«
F« F«F« F«
F«
F«
F«
F«
F«
F«
F«
F«
F«
F«
F«
F«
F«
F«
F«
F«
F«
F«
F«
F«
F«
F«
F«
F«
F«
F«
F«
F«
F«
F«
F«
F«
F«
F«
F«
F«
F«
F«F«
F«
F«
F«
F«F«
F«
F«
F«
F«
F«
F«F«
F«
F«F«
F«
F«
F«
F«
F«
F«
F«
F«
F«
F«
F «
F«
F«
F«
F«
F« F«
F«F«
F«
F«
F«
F«F «
F«
F«
F«
F«
F«
F«
F«
F«
F«
F«
F«
F«
F«
F«
F«
F«
F«
F«
F«
F «
F« F«
F«
F«
F«
F«
F«F«F«
F«
F«
F«
F«
F«
F«
F«
F«
F«
F«F«
F«F«
F«
F«
F«
F«
F«
F«
F«
F«
F«
F«
F«
F«F«
F«
F«F«
F«F«
F«
F«
F«
F«
F«
F«F«
F«
F«
F«
F«
F«
F «
F«
F« F«
23-013
22-010
30-007
25-008
14-003
22-012
03-008
10-007
15-011
21-006
07-001
09-01520-011
24-014
09-024
17-001
09-025
13-005
09-003
06-001
34-005
19-004
18-021
23-014
31-008
28-00130-008
22-005
22-013
07-002
04-001
10-004
30-021
17-003
11-009
01-012 01-010
09-020
23-016
21-007
13-007
09-005
04-004
15-017
10-003
36-006
24-004
15-001
25-007
08-005
06-004
20-023
19-008
11-004
10-005
22-016
19-010
20-017
12-003
03-007
33-001
27-005
24-001
24-021
30-025
17-005
36-005
03-006
05-006
15-019
02-005
31-003
30-012
24-005
22-020
09-007
28-002
20-005
22-017
20-004
15-002
01-007
01-011
30-026
24-02227-006
11-007
18-018
20-020
15-020
33-005
09-022
18-02215-013
12-006
09-009
30-002
30-019
22-022
23-006
10-008
27-001
18-006
31-005
20-008
13-001
10-006
01-001
29-001
21-008
30-027
24-01324-015
18-019
15-00715-014
12-009
16-006
09-014
16-002
08-009
03-009
06-009
20-010
18-023
18-020
02-007
18-017
31-007
30-004
13-003
34-004
23-012
02-003
03-01327-002
09-02120-024
09-023
01-014
20-026
21-00901-013
14-004
20-02720-028
20-025
SEEENLARGEMENT
OTHER SIDE
STATE OF OREGON
µ
0 5025 Miles
DECEMBER 2012
OREGONDEPARTMENT OFTRANSPORTATION
PERMANENT RECORDER STATION LOCATIONSPREPARED BY THE
OREGON DEPARTMENT OF TRANSPORTATIONTRANSPORTATION DEVELOPMENT DIVISION
TRANSPORTATION DATA SECTIONIN COOPERATION WITH THE
U.S. DEPARTMENT OF TRANSPORTATIONFEDERAL HIGHWAY ADMINISTRATION
STATE OF OREGON
332
F«01-001
State Highway Number
Recorder Number
Permanent Traffic Recorder Station
DISCLAIMER:This product is for informational purposes only and may nothave been prepared for or be suitable for legal, engineering
or surveying purposes. Users of this information should review or consult the primary data and information sources
to ascertain the usability of the information.
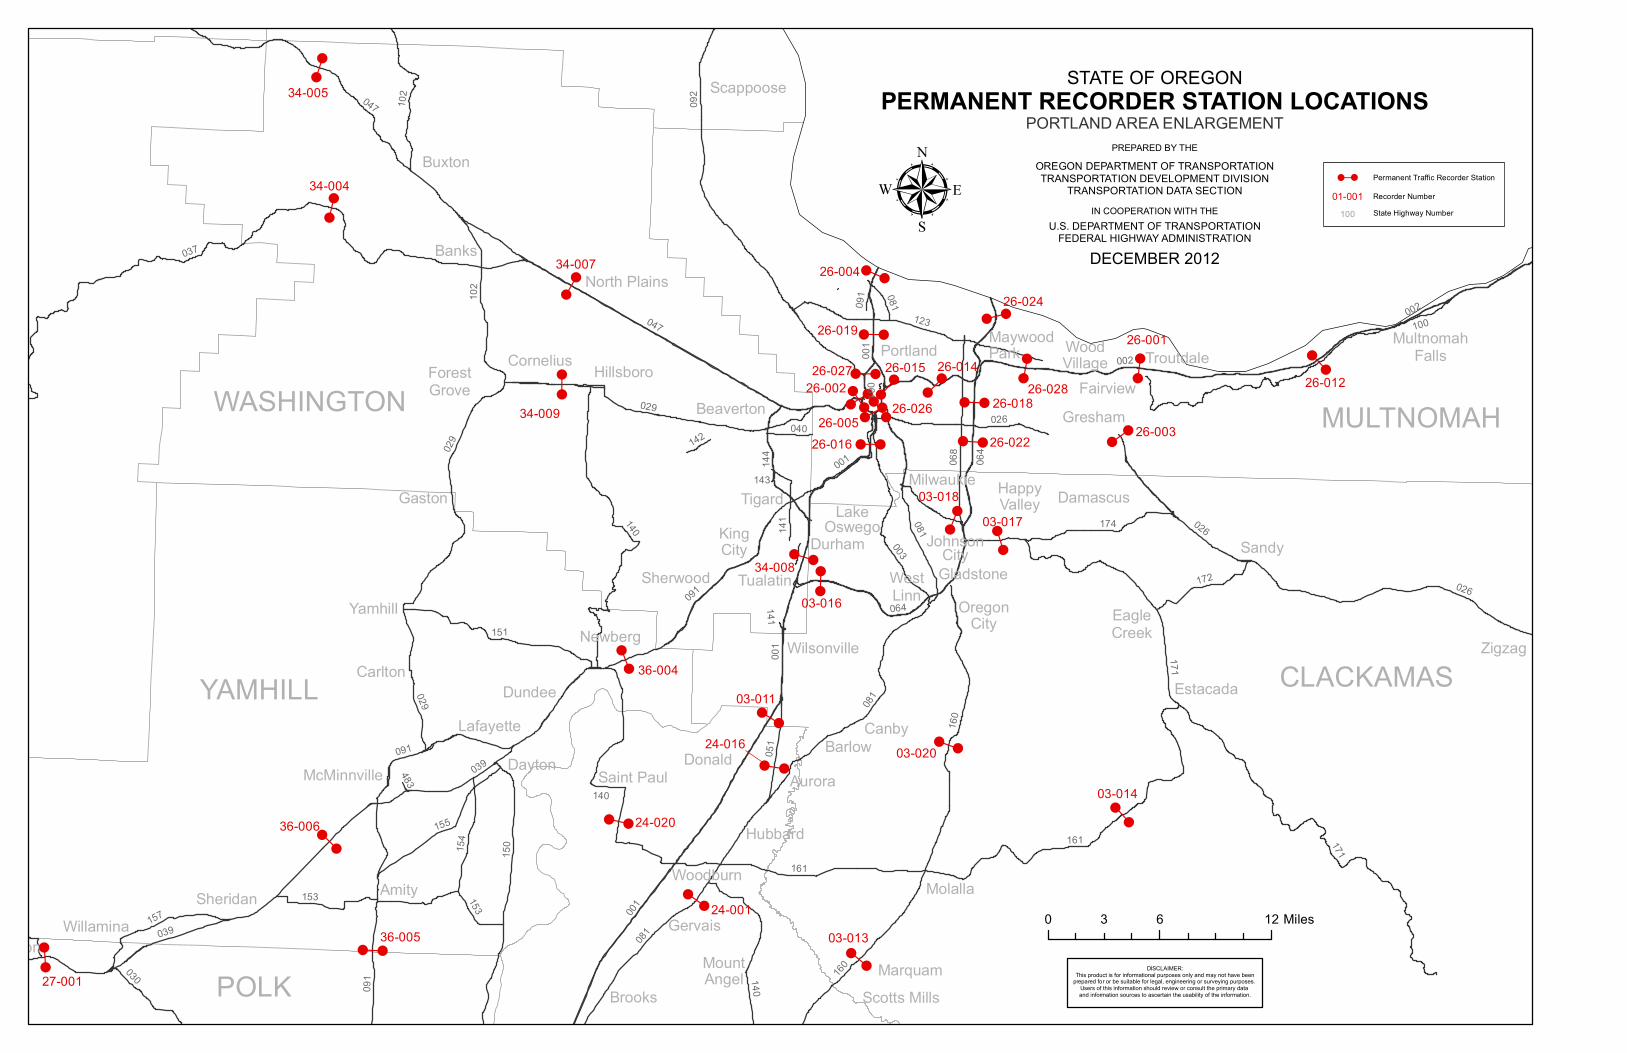
Sandy
Banks
Canby
Amity
Zigzag
Brooks
Buxton
DonaldAurora
Gaston
Dundee
DaytonBarlow
Durham
Tigard
Marquam
Hubbard
Newberg
MolallaGervais
Gresham
Yamhill
Carlton
Damascus
Woodburn
Sherwood
Sheridan
Portland
Estacada
Fairview
Tualatin
Willamina
WestLinn
Milwaukie
Hillsboro
Gladstone
Cornelius
Lafayette
Scappoose
Troutdale
KingCity
Beaverton
Saint Paul
EagleCreek
MountAngel
Wilsonville
OregonCity
McMinnville
LakeOswego
Scotts Mills
MaywoodPark
North Plains
JohnsonCity
HappyValley
ForestGrove
WoodVillage
MultnomahFalls
Valley Junction
F«
F«
F«
F«
F«
F«
F« F«
F« F«
F«
F «
F«
F«
F«
F«
F«
F«
F«
F«
F«F«
F«
F«
F«
F«
F«
F«
F«
F«
F«
F«
F«
F«
F«
F«F«
001
002
081
171
037
160
047
029
092
064
100
161
140
039
123
150
091
003
151
068
155
102
157
154
051
172
153
061
030
040
026
142
174
141
483
141
140
153
140
144
002
091
064
102 081
047
091
091
001
161
026
171
160
081
081
029
001
001
026
039
029
143
CLACKAMAS
Tillamook
YAMHILL
WASHINGTON MULTNOMAH
POLK
03-020
03-018
24-016
03-014
26-022
34-005
26-015
03-011
26-002
24-020
26-001
34-00926-003
34-007
26-005
36-006
26-016
26-024
03-017
24-00136-005
34-008
26-012
26-004
26-027
26-01826-026
03-016
24-022
27-001
26-014
26-019
34-004
03-013
36-004
26-028
µ
0 6 123 Miles
STATE OF OREGON
PORTLAND AREA ENLARGEMENTPERMANENT RECORDER STATION LOCATIONS
PREPARED BY THEOREGON DEPARTMENT OF TRANSPORTATIONTRANSPORTATION DEVELOPMENT DIVISION
TRANSPORTATION DATA SECTIONIN COOPERATION WITH THE
U.S. DEPARTMENT OF TRANSPORTATIONFEDERAL HIGHWAY ADMINISTRATION
DECEMBER 2012
DISCLAIMER:This product is for informational purposes only and may not have been
prepared for or be suitable for legal, engineering or surveying purposes. Users of this information should review or consult the primary data and information sources to ascertain the usability of the information.
State Highway Number100
Permanent Traffic Recorder StationF«01-001 Recorder Number
223
Summary of Trends
at
Automatic Traffic Recorder Stations
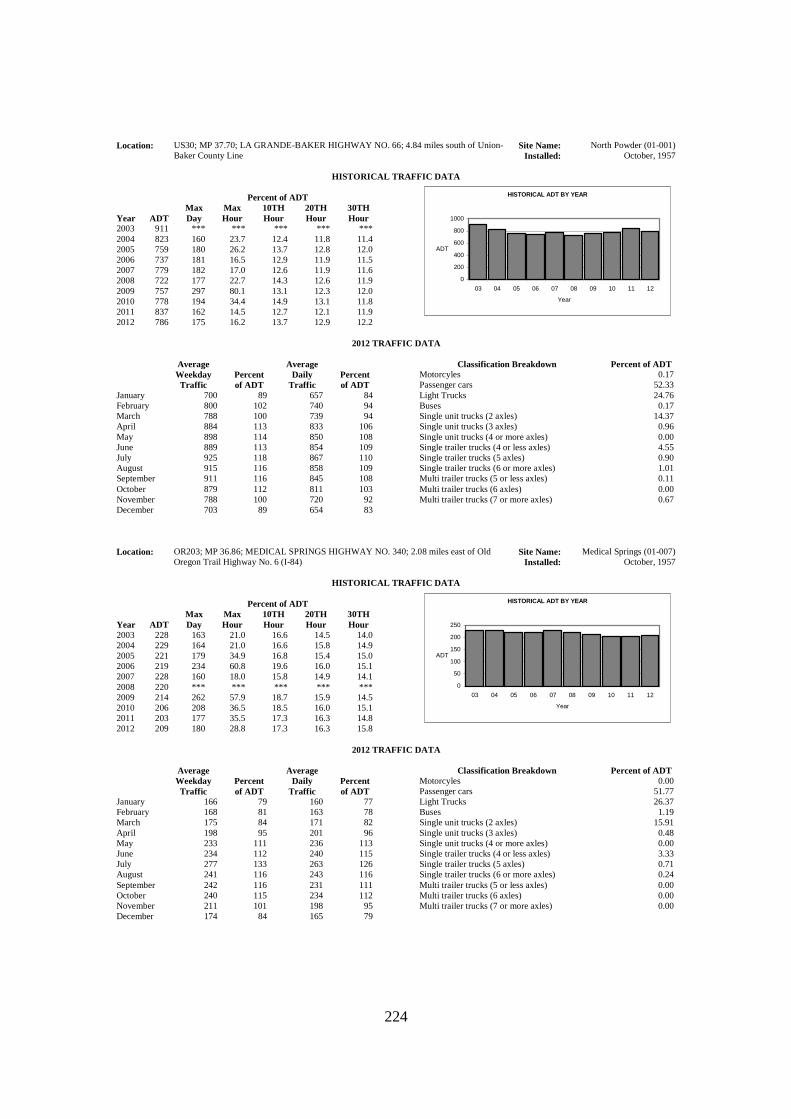
224
Location: US30; MP 37.70; LA GRANDE-BAKER HIGHWAY NO. 66; 4.84 miles south of Union-Baker County Line
Site Name: North Powder (01-001) Installed: October, 1957
HISTORICAL TRAFFIC DATA
Percent of ADT
Year ADT Max Day
Max Hour
10TH Hour
20TH Hour
30TH Hour
2003 911 *** *** *** *** *** 2004 823 160 23.7 12.4 11.8 11.4 2005 759 180 26.2 13.7 12.8 12.0 2006 737 181 16.5 12.9 11.9 11.5 2007 779 182 17.0 12.6 11.9 11.6 2008 722 177 22.7 14.3 12.6 11.9 2009 757 297 80.1 13.1 12.3 12.0 2010 778 194 34.4 14.9 13.1 11.8 2011 837 162 14.5 12.7 12.1 11.9 2012 786 175 16.2 13.7 12.9 12.2
HISTORICAL ADT BY YEAR
0
200
400
600
800
1000
03 04 05 06 07 08 09 10 11 12
Year
ADT
2012 TRAFFIC DATA
Average Weekday Traffic
Percent of ADT
Average Daily
Traffic Percent of ADT
January 700 89 657 84 February 800 102 740 94 March 788 100 739 94 April 884 113 833 106 May 898 114 850 108 June 889 113 854 109 July 925 118 867 110 August 915 116 858 109 September 911 116 845 108 October 879 112 811 103 November 788 100 720 92 December 703 89 654 83
Classification Breakdown Percent of ADT
Motorcyles 0.17 Passenger cars 52.33 Light Trucks 24.76 Buses 0.17 Single unit trucks (2 axles) 14.37 Single unit trucks (3 axles) 0.96 Single unit trucks (4 or more axles) 0.00 Single trailer trucks (4 or less axles) 4.55 Single trailer trucks (5 axles) 0.90 Single trailer trucks (6 or more axles) 1.01 Multi trailer trucks (5 or less axles) 0.11 Multi trailer trucks (6 axles) 0.00 Multi trailer trucks (7 or more axles) 0.67
Location: OR203; MP 36.86; MEDICAL SPRINGS HIGHWAY NO. 340; 2.08 miles east of Old
Oregon Trail Highway No. 6 (I-84) Site Name: Medical Springs (01-007)
Installed: October, 1957
HISTORICAL TRAFFIC DATA
Percent of ADT
Year ADT Max Day
Max Hour
10TH Hour
20TH Hour
30TH Hour
2003 228 163 21.0 16.6 14.5 14.0 2004 229 164 21.0 16.6 15.8 14.9 2005 221 179 34.9 16.8 15.4 15.0 2006 219 234 60.8 19.6 16.0 15.1 2007 228 160 18.0 15.8 14.9 14.1 2008 220 *** *** *** *** *** 2009 214 262 57.9 18.7 15.9 14.5 2010 206 208 36.5 18.5 16.0 15.1 2011 203 177 35.5 17.3 16.3 14.8 2012 209 180 28.8 17.3 16.3 15.8
HISTORICAL ADT BY YEAR
0
50
100
150
200
250
03 04 05 06 07 08 09 10 11 12
Year
ADT
2012 TRAFFIC DATA
Average Weekday Traffic
Percent of ADT
Average Daily
Traffic Percent of ADT
January 166 79 160 77 February 168 81 163 78 March 175 84 171 82 April 198 95 201 96 May 233 111 236 113 June 234 112 240 115 July 277 133 263 126 August 241 116 243 116 September 242 116 231 111 October 240 115 234 112 November 211 101 198 95 December 174 84 165 79
Classification Breakdown Percent of ADT
Motorcyles 0.00 Passenger cars 51.77 Light Trucks 26.37 Buses 1.19 Single unit trucks (2 axles) 15.91 Single unit trucks (3 axles) 0.48 Single unit trucks (4 or more axles) 0.00 Single trailer trucks (4 or less axles) 3.33 Single trailer trucks (5 axles) 0.71 Single trailer trucks (6 or more axles) 0.24 Multi trailer trucks (5 or less axles) 0.00 Multi trailer trucks (6 axles) 0.00 Multi trailer trucks (7 or more axles) 0.00

225
Location: OR86; MP 37.55; BAKER-COPPERFIELD HIGHWAY NO. 12; 2.21 miles northwest of Dry Gulch Road
Site Name: Richland (01-010) Installed: October, 1957
HISTORICAL TRAFFIC DATA
Percent of ADT
Year ADT Max Day
Max Hour
10TH Hour
20TH Hour
30TH Hour
2003 657 199 22.4 18.3 16.9 15.8 2004 659 *** *** *** *** *** 2005 637 *** *** *** *** *** 2006 609 298 48.6 20.5 16.4 15.1 2007 615 321 43.7 21.8 17.2 15.6 2008 559 235 26.1 21.3 18.3 16.6 2009 602 *** *** *** *** *** 2010 595 335 42.0 21.8 18.3 16.8 2011 552 367 48.2 23.9 17.4 16.5 2012 556 261 37.1 19.3 17.1 15.8
HISTORICAL ADT BY YEAR
0100200300400500600700
03 04 05 06 07 08 09 10 11 12
Year
ADT
2012 TRAFFIC DATA
Average Weekday Traffic
Percent of ADT
Average Daily
Traffic Percent of ADT
January 394 71 383 69 February 413 74 402 72 March 452 81 453 81 April 516 93 511 92 May 638 115 642 116 June 711 128 746 134 July 741 133 733 132 August 667 120 670 121 September 734 132 713 128 October 569 102 553 99 November 514 93 468 84 December 415 75 393 71
Classification Breakdown Percent of ADT
Motorcyles 3.62 Passenger cars 46.12 Light Trucks 24.32 Buses 0.71 Single unit trucks (2 axles) 15.33 Single unit trucks (3 axles) 0.71 Single unit trucks (4 or more axles) 0.00 Single trailer trucks (4 or less axles) 8.22 Single trailer trucks (5 axles) 0.65 Single trailer trucks (6 or more axles) 0.19 Multi trailer trucks (5 or less axles) 0.13 Multi trailer trucks (6 axles) 0.00 Multi trailer trucks (7 or more axles) 0.00
Location: I-84; MP 286.65; OLD OREGON TRAIL NO. 6; 0.45 mile south of south of Union-Baker
County Line Site Name: Baker Valley (01-011)
Installed: January, 1973
HISTORICAL TRAFFIC DATA
Percent of ADT
Year ADT Max Day
Max Hour
10TH Hour
20TH Hour
30TH Hour
2003 9137 *** *** *** *** *** 2004 9236 160 15.9 12.5 11.9 11.4 2005 9277 182 15.1 12.5 11.8 11.4 2006 9394 175 14.1 12.4 11.7 11.2 2007 9526 154 15.6 12.7 11.8 11.3 2008 8750 158 16.4 13.4 11.8 11.4 2009 8881 161 16.8 13.6 12.6 12.2 2010 9070 166 14.4 13.5 12.7 12.3 2011 8714 148 15.6 12.9 12.2 11.9 2012 8939 151 16.5 13.0 12.4 11.9
HISTORICAL ADT BY YEAR
0
2000
4000
6000
8000
10000
12000
03 04 05 06 07 08 09 10 11 12
Year
ADT
2012 TRAFFIC DATA
Average Weekday Traffic
Percent of ADT
Average Daily
Traffic Percent of ADT
January 6388 71 6263 70 February 6967 78 6891 77 March 8044 90 8283 93 April 8484 95 8678 97 May 9342 105 9403 105 June 10220 114 10520 118 July 10733 120 11296 126 August 11002 123 11365 127 September 9990 112 9945 111 October 9047 101 9157 102 November 8267 92 8375 94 December 6994 78 7090 79
Classification Breakdown Percent of ADT
Motorcyles 0.88 Passenger cars 45.73 Light Trucks 12.11 Buses 0.10 Single unit trucks (2 axles) 1.51 Single unit trucks (3 axles) 1.15 Single unit trucks (4 or more axles) 0.16 Single trailer trucks (4 or less axles) 4.36 Single trailer trucks (5 axles) 27.97 Single trailer trucks (6 or more axles) 3.47 Multi trailer trucks (5 or less axles) 0.24 Multi trailer trucks (6 axles) 0.17 Multi trailer trucks (7 or more axles) 2.15

226
Location: OR7; MP 48.40; WHITNEY HIGHWAY NO. 71; 0.20 mile south of Griffin Gulch Lane Site Name: Whitney (01-012) Installed: December, 1981
HISTORICAL TRAFFIC DATA
Percent of ADT
Year ADT Max Day
Max Hour
10TH Hour
20TH Hour
30TH Hour
2003 1508 407 37.7 29.8 25.3 23.5 2004 1466 347 30.8 28.6 25.6 24.0 2005 1403 424 39.8 30.6 24.1 22.3 2006 1429 329 31.1 26.7 24.5 22.5 2007 1409 361 33.5 27.5 24.6 22.6 2008 1327 *** *** *** *** *** 2009 1359 367 37.5 26.5 23.8 21.6 2010 1413 300 29.3 24.6 22.6 21.0 2011 1346 275 28.5 23.7 22.4 20.9 2012 1308 *** *** *** *** ***
HISTORICAL ADT BY YEAR
0
500
1000
1500
2000
03 04 05 06 07 08 09 10 11 12
Year
ADT
2012 TRAFFIC DATA
Average Weekday Traffic
Percent of ADT
Average Daily
Traffic Percent of ADT
January 863 66 843 64 February 916 70 901 69 March 926 71 941 72 April 1108 85 1144 87 May 1465 112 1657 127 June 1544 118 1647 126 July 1761 135 1842 141 August 1645 126 1735 133 September 1585 121 1706 130 October 1350 103 1338 102 November 1066 81 1060 81 December 897 69 884 68
Classification Breakdown Percent of ADT
Motorcyles 0.43 Passenger cars 49.17 Light Trucks 27.18 Buses 0.64 Single unit trucks (2 axles) 14.50 Single unit trucks (3 axles) 0.75 Single unit trucks (4 or more axles) 0.00 Single trailer trucks (4 or less axles) 4.54 Single trailer trucks (5 axles) 2.04 Single trailer trucks (6 or more axles) 0.14 Multi trailer trucks (5 or less axles) 0.11 Multi trailer trucks (6 axles) 0.11 Multi trailer trucks (7 or more axles) 0.39
Location: I-84; MP 309.02; OLD OREGON TRAIL NO. 6; 4.27 miles north of Encina Interchange Site Name: South Baker (01-013)
Installed: May, 2010
HISTORICAL TRAFFIC DATA
Percent of ADT
Year ADT Max Day
Max Hour
10TH Hour
20TH Hour
30TH Hour
2003 *** *** *** *** *** *** 2004 *** *** *** *** *** *** 2005 *** *** *** *** *** *** 2006 *** *** *** *** *** *** 2007 *** *** *** *** *** *** 2008 *** *** *** *** *** *** 2009 *** *** *** *** *** *** 2010 *** *** *** *** *** *** 2011 8304 179 15.5 12.9 12.3 12.0 2012 8328 *** *** *** *** ***
HISTORICAL ADT BY YEAR
0
2000
4000
6000
8000
10000
03 04 05 06 07 08 09 10 11 12
Year
ADT
2012 TRAFFIC DATA
Average Weekday Traffic
Percent of ADT
Average Daily
Traffic Percent of ADT
January 5846 70 5732 69 February 6354 76 6266 75 March 7496 90 7740 93 April 7966 96 8231 99 May 8534 102 8680 104 June 9500 114 9900 119 July 10100 121 10700 128 August 10605 127 10964 132 September 9100 109 9200 110 October 7872 95 8150 98 November 7567 91 7731 93 December 6441 77 6638 80
Classification Breakdown Percent of ADT
Motorcyles 1.14 Passenger cars 48.74 Light Trucks 9.17 Buses 0.32 Single unit trucks (2 axles) 2.30 Single unit trucks (3 axles) 0.84 Single unit trucks (4 or more axles) 0.01 Single trailer trucks (4 or less axles) 2.72 Single trailer trucks (5 axles) 28.22 Single trailer trucks (6 or more axles) 2.55 Multi trailer trucks (5 or less axles) 1.14 Multi trailer trucks (6 axles) 0.43 Multi trailer trucks (7 or more axles) 2.42

227
Location: 84; MP 336.29; OLD OREGON TRAIL NO. 6; 0.53 mile south of Weatherby Interchange Site Name: Weatherby (01-014) Installed: July, 2011
HISTORICAL TRAFFIC DATA
Percent of ADT
Year ADT Max Day
Max Hour
10TH Hour
20TH Hour
30TH Hour
2003 *** *** *** *** *** *** 2004 *** *** *** *** *** *** 2005 *** *** *** *** *** *** 2006 *** *** *** *** *** *** 2007 *** *** *** *** *** *** 2008 *** *** *** *** *** *** 2009 *** *** *** *** *** *** 2010 *** *** *** *** *** *** 2011 *** *** *** *** *** *** 2012 8336 157 16.8 12.7 11.9 11.6
HISTORICAL ADT BY YEAR
0
2000
4000
6000
8000
10000
03 04 05 06 07 08 09 10 11 12
Year
ADT
2012 TRAFFIC DATA
Average Weekday Traffic
Percent of ADT
Average Daily
Traffic Percent of ADT
January 5913 71 5809 70 February 6401 77 6326 76 March 7405 89 7688 92 April 7928 95 8133 98 May 8656 104 8757 105 June 9547 115 9872 118 July 9854 118 10487 126 August 10228 123 10640 128 September 9201 110 9246 111 October 8397 101 8553 103 November 7676 92 7834 94 December 6510 78 6692 80
Classification Breakdown Percent of ADT
Motorcyles 0.20 Passenger cars 23.74 Light Trucks 21.15 Buses 0.19 Single unit trucks (2 axles) 2.03 Single unit trucks (3 axles) 0.72 Single unit trucks (4 or more axles) 0.01 Single trailer trucks (4 or less axles) 1.63 Single trailer trucks (5 axles) 42.28 Single trailer trucks (6 or more axles) 3.86 Multi trailer trucks (5 or less axles) 1.19 Multi trailer trucks (6 axles) 0.52 Multi trailer trucks (7 or more axles) 2.48
Location: OR34; MP 53.89; ALSEA HIGHWAY NO. 27; 4.67 miles southwest of Corvallis-
Newport Highway No. 33 (US20/OR34) Site Name: Alsea (02-003)
Installed: July, 1957
HISTORICAL TRAFFIC DATA
Percent of ADT
Year ADT Max Day
Max Hour
10TH Hour
20TH Hour
30TH Hour
2003 2254 136 13.7 11.9 11.3 11.2 2004 2355 142 14.6 12.1 11.2 10.8 2005 2248 138 12.8 11.7 11.3 10.9 2006 2231 157 15.6 12.6 11.9 11.6 2007 2090 157 18.5 12.5 11.9 11.7 2008 1932 156 14.7 12.5 12.2 12.0 2009 1981 150 16.8 13.7 13.0 12.4 2010 2075 169 15.8 13.9 13.0 12.7 2011 2007 158 15.2 13.5 13.0 12.4 2012 2029 169 16.7 13.7 12.7 12.4
HISTORICAL ADT BY YEAR
0
500
1000
1500
2000
2500
03 04 05 06 07 08 09 10 11 12
Year
ADT
2012 TRAFFIC DATA
Average Weekday Traffic
Percent of ADT
Average Daily
Traffic Percent of ADT
January 1761 87 1732 85 February 1915 94 1910 94 March 1643 81 1658 82 April 1997 98 1993 98 May 2066 102 2125 105 June 2037 100 2069 102 July 2255 111 2303 114 August 2355 116 2513 124 September 2220 109 2268 112 October 2093 103 2084 103 November 1950 96 1910 94 December 1787 88 1783 88
Classification Breakdown Percent of ADT
Motorcyles 2.44 Passenger cars 57.34 Light Trucks 21.08 Buses 0.78 Single unit trucks (2 axles) 10.97 Single unit trucks (3 axles) 2.85 Single unit trucks (4 or more axles) 0.15 Single trailer trucks (4 or less axles) 1.15 Single trailer trucks (5 axles) 1.58 Single trailer trucks (6 or more axles) 1.39 Multi trailer trucks (5 or less axles) 0.05 Multi trailer trucks (6 axles) 0.02 Multi trailer trucks (7 or more axles) 0.20

228
Location: OR223; MP 26.43; KINGS VALLEY HIGHWAY NO. 191; 1.41 miles south of Hoskins-Summit Road
Site Name: Kings Valley (02-005) Installed: October, 1957
HISTORICAL TRAFFIC DATA
Percent of ADT
Year ADT Max Day
Max Hour
10TH Hour
20TH Hour
30TH Hour
2003 1157 *** *** *** *** *** 2004 1143 284 32.6 26.2 17.1 12.1 2005 1150 269 29.7 23.0 13.9 11.5 2006 1151 302 33.0 26.5 19.5 12.5 2007 1107 309 34.0 25.7 15.7 12.6 2008 1051 313 35.1 24.8 15.6 12.6 2009 1026 285 32.4 23.7 15.8 13.4 2010 1042 287 32.9 26.0 16.2 12.6 2011 1028 239 26.9 19.8 13.9 12.6 2012 1015 236 23.4 19.0 14.4 12.6
HISTORICAL ADT BY YEAR
0200400600800
100012001400
03 04 05 06 07 08 09 10 11 12
Year
ADT
2012 TRAFFIC DATA
Average Weekday Traffic
Percent of ADT
Average Daily
Traffic Percent of ADT
January 860 85 800 79 February 1011 100 943 93 March 893 88 873 86 April 1043 103 1032 102 May 1057 104 1057 104 June 1080 106 1056 104 July 1119 110 1108 109 August 1163 115 1175 116 September 1102 109 1168 115 October 1065 105 1031 102 November 1074 106 1018 100 December 980 97 924 91
Classification Breakdown Percent of ADT
Motorcyles 0.55 Passenger cars 58.76 Light Trucks 19.47 Buses 1.39 Single unit trucks (2 axles) 8.82 Single unit trucks (3 axles) 4.08 Single unit trucks (4 or more axles) 0.45 Single trailer trucks (4 or less axles) 1.35 Single trailer trucks (5 axles) 2.14 Single trailer trucks (6 or more axles) 2.99 Multi trailer trucks (5 or less axles) 0.00 Multi trailer trucks (6 axles) 0.00 Multi trailer trucks (7 or more axles) 0.00
Location: OR99W; MP 94.90; PACIFIC HIGHWAY WEST NO. 91; 5.47 miles north of Monroe
Cemetery Road Site Name: Monroe (02-007)
Installed: April, 1953
HISTORICAL TRAFFIC DATA
Percent of ADT
Year ADT Max Day
Max Hour
10TH Hour
20TH Hour
30TH Hour
2003 5248 139 14.2 11.5 11.1 10.8 2004 5051 142 13.0 11.5 11.2 10.9 2005 5007 140 13.2 11.3 10.9 10.7 2006 5032 155 16.9 12.2 11.2 10.9 2007 5119 144 15.5 11.3 11.0 10.7 2008 4762 139 14.9 12.1 11.5 11.0 2009 4961 *** *** *** *** *** 2010 5066 137 16.5 11.7 11.2 11.0 2011 5144 138 15.9 11.8 11.2 10.9 2012 5086 145 16.8 11.5 11.4 11.1
HISTORICAL ADT BY YEAR
0
1000
2000
3000
4000
5000
6000
03 04 05 06 07 08 09 10 11 12
Year
ADT
2012 TRAFFIC DATA
Average Weekday Traffic
Percent of ADT
Average Daily
Traffic Percent of ADT
January 4401 87 4243 83 February 4899 96 4858 96 March 4589 90 4558 90 April 4986 98 5025 99 May 5124 101 5222 103 June 5492 108 5401 106 July 5674 112 5615 110 August 5758 113 5636 111 September 5622 111 5525 109 October 5349 105 5356 105 November 5197 102 5131 101 December 4561 90 4464 88
Classification Breakdown Percent of ADT
Motorcyles 1.30 Passenger cars 58.01 Light Trucks 26.80 Buses 0.18 Single unit trucks (2 axles) 3.55 Single unit trucks (3 axles) 3.78 Single unit trucks (4 or more axles) 0.00 Single trailer trucks (4 or less axles) 0.32 Single trailer trucks (5 axles) 5.64 Single trailer trucks (6 or more axles) 0.26 Multi trailer trucks (5 or less axles) 0.02 Multi trailer trucks (6 axles) 0.00 Multi trailer trucks (7 or more axles) 0.14

229
Location: US26; MP 46.38; MT. HOOD HIGHWAY NO. 26; 0.30 mile east of Camp Creek Rd (USFS 28)
Site Name: Rhododendron (03-006) Installed: August, 1995
HISTORICAL TRAFFIC DATA
Percent of ADT
Year ADT Max Day
Max Hour
10TH Hour
20TH Hour
30TH Hour
2003 8416 222 23.8 21.3 19.5 18.8 2004 8211 205 22.4 19.5 18.8 18.2 2005 7906 216 23.0 20.3 19.6 18.9 2006 8535 231 22.4 19.1 18.5 18.0 2007 8542 198 21.2 18.9 18.1 17.7 2008 8162 233 22.9 20.4 19.2 18.8 2009 8736 197 22.3 19.6 18.4 17.8 2010 8714 207 21.6 19.8 18.9 18.5 2011 8330 214 24.7 20.0 18.6 18.1 2012 8480 227 24.0 21.0 20.2 19.4
HISTORICAL ADT BY YEAR
0
2000
4000
6000
8000
10000
03 04 05 06 07 08 09 10 11 12
Year
ADT
2012 TRAFFIC DATA
Average Weekday Traffic
Percent of ADT
Average Daily
Traffic Percent of ADT
January 6280 74 9101 107 February 5935 70 8640 102 March 6043 71 8166 96 April 4963 59 7106 84 May 5905 70 7473 88 June 6977 82 8337 98 July 9021 106 11229 132 August 9139 108 11656 137 September 7152 84 8708 103 October 5198 61 6190 73 November 4781 56 5676 67 December 7726 91 9477 112
Classification Breakdown Percent of ADT
Motorcyles 1.16 Passenger cars 70.48 Light Trucks 15.73 Buses 0.59 Single unit trucks (2 axles) 1.85 Single unit trucks (3 axles) 0.42 Single unit trucks (4 or more axles) 0.01 Single trailer trucks (4 or less axles) 1.87 Single trailer trucks (5 axles) 3.95 Single trailer trucks (6 or more axles) 1.50 Multi trailer trucks (5 or less axles) 0.22 Multi trailer trucks (6 axles) 0.19 Multi trailer trucks (7 or more axles) 2.03
Location: OR35; MP 57.79; MT. HOOD HIGHWAY NO. 26; 0.02 mile east of Warm Springs
Highway No. 53 (US26) Site Name: Mt. Hood Meadows
(03-007) Installed: September, 1995
HISTORICAL TRAFFIC DATA
Percent of ADT
Year ADT Max Day
Max Hour
10TH Hour
20TH Hour
30TH Hour
2003 1836 490 63.1 41.6 37.3 32.1 2004 1685 423 61.4 46.9 39.2 34.8 2005 1544 *** *** *** *** *** 2006 1770 *** *** *** *** *** 2007 2001 371 59.6 42.9 38.1 35.4 2008 1854 398 56.8 44.2 39.9 36.1 2009 2130 *** *** *** *** *** 2010 2145 374 49.2 39.5 34.8 33.2 2011 1976 476 79.2 49.1 45.0 39.1 2012 2023 452 65.4 43.4 40.3 37.7
HISTORICAL ADT BY YEAR
0
500
1000
1500
2000
2500
03 04 05 06 07 08 09 10 11 12
Year
ADT
2012 TRAFFIC DATA
Average Weekday Traffic
Percent of ADT
Average Daily
Traffic Percent of ADT
January 1902 94 3157 156 February 1738 86 3036 150 March 1892 94 2688 133 April 992 49 1780 88 May 911 45 1176 58 June 1242 61 1376 68 July 1832 91 2141 106 August 1766 87 2075 103 September 1570 78 1776 88 October 1013 50 1149 57 November 640 32 760 38 December 2380 118 3162 156
Classification Breakdown Percent of ADT
Motorcyles 3.16 Passenger cars 56.12 Light Trucks 18.42 Buses 1.31 Single unit trucks (2 axles) 7.81 Single unit trucks (3 axles) 1.89 Single unit trucks (4 or more axles) 0.00 Single trailer trucks (4 or less axles) 2.39 Single trailer trucks (5 axles) 2.62 Single trailer trucks (6 or more axles) 2.31 Multi trailer trucks (5 or less axles) 0.50 Multi trailer trucks (6 axles) 0.39 Multi trailer trucks (7 or more axles) 3.08

230
Location: OR173; MP 5.45; TIMBERLINE HIGHWAY NO. 173; 0.04 mile north of Mt. Hood Highway No. 26 (US26)
Site Name: Timberline (03-008) Installed: September, 1995
HISTORICAL TRAFFIC DATA
Percent of ADT
Year ADT Max Day
Max Hour
10TH Hour
20TH Hour
30TH Hour
2003 1635 336 40.8 31.1 27.5 26.2 2004 1554 287 39.6 31.3 27.5 26.7 2005 1418 *** *** *** *** *** 2006 1463 309 32.2 28.9 27.4 25.9 2007 1520 332 41.0 26.5 25.3 23.9 2008 1497 316 33.4 28.3 27.3 25.0 2009 1619 247 34.3 28.1 25.3 23.9 2010 1707 254 28.1 26.4 24.4 23.7 2011 1565 325 37.9 27.9 25.7 24.9 2012 1593 273 30.7 27.5 25.6 24.4
HISTORICAL ADT BY YEAR
0
500
1000
1500
2000
03 04 05 06 07 08 09 10 11 12
Year
ADT
2012 TRAFFIC DATA
Average Weekday Traffic
Percent of ADT
Average Daily
Traffic Percent of ADT
January 1021 64 1585 100 February 1007 63 1478 93 March 991 62 1441 90 April 779 49 1290 81 May 1018 64 1435 90 June 1645 103 1752 110 July 2193 138 2532 159 August 1927 121 2376 149 September 1312 82 1618 102 October 707 44 896 56 November 718 45 1039 65 December 1197 75 1672 105
Classification Breakdown Percent of ADT
Motorcyles 1.00 Passenger cars 75.88 Light Trucks 13.85 Buses 0.87 Single unit trucks (2 axles) 6.02 Single unit trucks (3 axles) 0.43 Single unit trucks (4 or more axles) 0.00 Single trailer trucks (4 or less axles) 1.30 Single trailer trucks (5 axles) 0.39 Single trailer trucks (6 or more axles) 0.00 Multi trailer trucks (5 or less axles) 0.17 Multi trailer trucks (6 axles) 0.00 Multi trailer trucks (7 or more axles) 0.09
Location: US26; MP 57.77; WARM SPRINGS HIGHWAY NO. 53; 0.32 mile south of Mt. Hood
Highway No. 26 (OR35) Site Name: Warm Springs Jct.
(03-009) Installed: August, 1995
HISTORICAL TRAFFIC DATA
Percent of ADT
Year ADT Max Day
Max Hour
10TH Hour
20TH Hour
30TH Hour
2003 5191 277 28.7 25.0 23.7 22.3 2004 5113 245 28.1 22.6 21.7 20.6 2005 5136 *** *** *** *** *** 2006 5064 239 26.8 22.9 22.2 21.1 2007 5099 244 26.5 23.7 22.0 21.1 2008 4715 238 27.5 24.4 23.3 22.3 2009 4924 267 28.9 25.7 23.7 22.3 2010 5068 250 27.2 24.6 23.5 22.3 2011 4944 249 27.2 25.4 24.2 22.6 2012 5008 249 27.4 25.5 23.7 21.6
HISTORICAL ADT BY YEAR
0
1000
2000
3000
4000
5000
6000
03 04 05 06 07 08 09 10 11 12
Year
ADT
2012 TRAFFIC DATA
Average Weekday Traffic
Percent of ADT
Average Daily
Traffic Percent of ADT
January 2535 51 2962 59 February 2875 57 3368 67 March 2963 59 3563 71 April 3384 68 4221 84 May 4586 92 5608 112 June 5270 105 6340 127 July 6454 129 7935 158 August 6418 128 8005 160 September 5267 105 6261 125 October 3892 78 4648 93 November 3391 68 3809 76 December 2940 59 3373 67
Classification Breakdown Percent of ADT
Motorcyles 1.07 Passenger cars 54.88 Light Trucks 16.18 Buses 2.40 Single unit trucks (2 axles) 7.72 Single unit trucks (3 axles) 0.61 Single unit trucks (4 or more axles) 0.05 Single trailer trucks (4 or less axles) 4.13 Single trailer trucks (5 axles) 7.17 Single trailer trucks (6 or more axles) 2.43 Multi trailer trucks (5 or less axles) 0.41 Multi trailer trucks (6 axles) 0.22 Multi trailer trucks (7 or more axles) 2.73

231
Location: I-5; MP 281.20; PACIFIC HIGHWAY NO. 1; 1.38 miles south of Wilsonville-Hubbard Highway No. 51 Interchange (OR551)
Site Name: Wilsonville (03-011) Installed: August, 1973
HISTORICAL TRAFFIC DATA
Percent of ADT
Year ADT Max Day
Max Hour
10TH Hour
20TH Hour
30TH Hour
2003 86362 132 10.4 9.2 9.1 9.0 2004 86727 131 10.1 9.1 8.9 8.9 2005 86787 132 10.1 9.0 8.9 8.8 2006 88038 129 8.9 8.8 8.7 8.6 2007 88174 *** *** *** *** *** 2008 83161 134 10.7 9.3 9.2 9.1 2009 85731 127 9.4 9.1 9.0 8.9 2010 86646 128 9.8 9.1 9.0 8.9 2011 85451 128 9.4 9.0 8.9 8.8 2012 84342 130 10.3 9.1 9.0 8.9
HISTORICAL ADT BY YEAR
0
20000
40000
60000
80000
100000
03 04 05 06 07 08 09 10 11 12
Year
ADT
2012 TRAFFIC DATA
Average Weekday Traffic
Percent of ADT
Average Daily
Traffic Percent of ADT
January 72364 86 71969 85 February 78287 93 78477 93 March 79365 94 79930 95 April 81769 97 84103 100 May 83859 99 85466 101 June 89552 106 90349 107 July 91533 109 93469 111 August 94421 112 95726 113 September 86609 103 89082 106 October 80620 96 82970 98 November 81240 96 81973 97 December 79064 94 78585 93
Classification Breakdown Percent of ADT
Motorcyles 0.25 Passenger cars 65.48 Light Trucks 17.62 Buses 0.19 Single unit trucks (2 axles) 2.78 Single unit trucks (3 axles) 0.69 Single unit trucks (4 or more axles) 0.01 Single trailer trucks (4 or less axles) 0.83 Single trailer trucks (5 axles) 8.27 Single trailer trucks (6 or more axles) 2.53 Multi trailer trucks (5 or less axles) 0.08 Multi trailer trucks (6 axles) 0.05 Multi trailer trucks (7 or more axles) 1.22
Location: OR213; MP 22.15; CASCADE HIGHWAY SOUTH NO. 160; 2.05 miles northeast of
Clackamas-Marion County Line Site Name: Marquam (03-013)
Installed: October, 1957
HISTORICAL TRAFFIC DATA
Percent of ADT
Year ADT Max Day
Max Hour
10TH Hour
20TH Hour
30TH Hour
2003 3658 164 13.6 12.1 11.3 11.0 2004 3683 127 12.4 11.5 11.1 10.8 2005 3774 152 16.0 11.6 11.3 11.1 2006 3893 144 13.1 11.9 11.5 11.2 2007 3934 152 12.9 12.2 11.8 11.4 2008 3677 148 14.1 12.2 11.6 11.4 2009 3909 158 29.3 12.3 11.6 11.3 2010 3985 141 17.0 11.7 11.3 11.1 2011 4008 139 14.2 11.7 11.3 11.1 2012 3742 160 14.9 12.3 12.0 11.8
HISTORICAL ADT BY YEAR
0
1000
2000
3000
4000
5000
03 04 05 06 07 08 09 10 11 12
Year
ADT
2012 TRAFFIC DATA
Average Weekday Traffic
Percent of ADT
Average Daily
Traffic Percent of ADT
January 2240 60 2006 54 February 2295 61 2274 61 March 3517 94 3444 92 April 3922 105 3935 105 May 4078 109 4100 110 June 4151 111 4151 111 July 4449 119 4499 120 August 4525 121 4614 123 September 4348 116 4450 119 October 4088 109 3969 106 November 4018 107 3830 102 December 3755 100 3626 97
Classification Breakdown Percent of ADT
Motorcyles 0.32 Passenger cars 64.33 Light Trucks 20.52 Buses 0.76 Single unit trucks (2 axles) 11.06 Single unit trucks (3 axles) 0.20 Single unit trucks (4 or more axles) 0.00 Single trailer trucks (4 or less axles) 2.45 Single trailer trucks (5 axles) 0.20 Single trailer trucks (6 or more axles) 0.00 Multi trailer trucks (5 or less axles) 0.12 Multi trailer trucks (6 axles) 0.04 Multi trailer trucks (7 or more axles) 0.00

232
Location: OR211; MP 24.23; WOODBURN-ESTACADA HIGHWAY NO. 161; 3.05 miles northeast of Wall Street
Site Name: Colton (03-014) Installed: October, 1957
HISTORICAL TRAFFIC DATA
Percent of ADT
Year ADT Max Day
Max Hour
10TH Hour
20TH Hour
30TH Hour
2003 2388 128 11.7 10.9 10.8 10.6 2004 2386 133 21.7 20.0 18.2 16.9 2005 2415 136 15.9 11.3 10.9 10.7 2006 2457 130 12.1 11.6 11.2 11.0 2007 2498 135 13.1 11.9 11.4 11.1 2008 2313 134 13.3 12.1 11.5 11.4 2009 2322 133 13.0 11.8 11.4 11.2 2010 2318 135 13.1 12.0 11.6 11.3 2011 2267 137 13.4 12.1 11.9 11.6 2012 2276 140 13.8 12.3 11.8 11.5
HISTORICAL ADT BY YEAR
0
500
1000
1500
2000
2500
3000
03 04 05 06 07 08 09 10 11 12
Year
ADT
2012 TRAFFIC DATA
Average Weekday Traffic
Percent of ADT
Average Daily
Traffic Percent of ADT
January 1815 80 1832 81 February 2043 90 2019 89 March 1897 83 1953 86 April 2231 98 2284 100 May 2354 103 2352 103 June 2319 102 2342 103 July 2523 111 2598 114 August 2564 113 2651 116 September 2709 119 2704 119 October 2529 111 2454 108 November 2242 98 2154 95 December 1993 88 1968 86
Classification Breakdown Percent of ADT
Motorcyles 3.80 Passenger cars 59.22 Light Trucks 20.24 Buses 0.56 Single unit trucks (2 axles) 10.61 Single unit trucks (3 axles) 1.02 Single unit trucks (4 or more axles) 0.05 Single trailer trucks (4 or less axles) 3.21 Single trailer trucks (5 axles) 0.79 Single trailer trucks (6 or more axles) 0.29 Multi trailer trucks (5 or less axles) 0.10 Multi trailer trucks (6 axles) 0.00 Multi trailer trucks (7 or more axles) 0.11
Location: I-205; MP 1.99; EAST PORTLAND FREEWAY NO. 64; 1.99 miles east of Pacific
Highway No. 1 (I-5) Site Name: Stafford (03-016)
Installed: January, 1971
HISTORICAL TRAFFIC DATA
Percent of ADT
Year ADT Max Day
Max Hour
10TH Hour
20TH Hour
30TH Hour
2003 82032 119 8.9 8.4 8.4 8.4 2004 82780 122 8.5 8.4 8.3 8.3 2005 82719 119 8.5 8.3 8.3 8.2 2006 83033 119 8.5 8.2 8.2 8.1 2007 82746 *** *** *** *** *** 2008 78070 121 11.0 8.5 8.4 8.4 2009 79618 118 8.7 8.4 8.3 8.3 2010 78932 118 8.7 8.4 8.4 8.3 2011 79712 *** *** *** *** *** 2012 80698 122 8.7 8.5 8.5 8.4
HISTORICAL ADT BY YEAR
0
20000
40000
60000
80000
100000
03 04 05 06 07 08 09 10 11 12
Year
ADT
2012 TRAFFIC DATA
Average Weekday Traffic
Percent of ADT
Average Daily
Traffic Percent of ADT
January 76600 95 73000 90 February 79747 99 75518 94 March 82066 102 77941 97 April 85251 106 81906 101 May 85025 105 81548 101 June 89794 111 85800 106 July 90023 112 87865 109 August 91772 114 88702 110 September 86604 107 83583 104 October 84362 105 80655 100 November 82448 102 77606 96 December 76991 95 74249 92
Classification Breakdown Percent of ADT
Motorcyles 0.40 Passenger cars 41.69 Light Trucks 46.01 Buses 0.26 Single unit trucks (2 axles) 5.28 Single unit trucks (3 axles) 0.47 Single unit trucks (4 or more axles) 0.10 Single trailer trucks (4 or less axles) 1.53 Single trailer trucks (5 axles) 2.95 Single trailer trucks (6 or more axles) 0.60 Multi trailer trucks (5 or less axles) 0.08 Multi trailer trucks (6 axles) 0.10 Multi trailer trucks (7 or more axles) 0.53

233
Location: OR212/OR224 MP 6.80; CLACKAMAS HIGHWAY NO. 171; 0.14 mile west of S.E. 130th Avenue
Site Name: Clackamas (03-017) Installed: June, 2005
HISTORICAL TRAFFIC DATA
Percent of ADT
Year ADT Max Day
Max Hour
10TH Hour
20TH Hour
30TH Hour
2003 *** *** *** *** *** *** 2004 *** *** *** *** *** *** 2005 *** *** *** *** *** *** 2006 *** *** *** *** *** *** 2007 33513 *** *** *** *** *** 2008 32177 122 9.2 8.9 8.8 8.8 2009 32093 124 9.1 8.7 8.6 8.6 2010 32404 122 8.9 8.7 8.6 8.6 2011 32240 122 9.0 8.8 8.7 8.6 2012 32857 122 9.8 9.0 8.8 8.7
HISTORICAL ADT BY YEAR
0
10000
20000
30000
40000
03 04 05 06 07 08 09 10 11 12
Year
ADT
2012 TRAFFIC DATA
Average Weekday Traffic
Percent of ADT
Average Daily
Traffic Percent of ADT
January 31689 96 30248 92 February 33211 101 31614 96 March 33196 101 31588 96 April 34257 104 32798 100 May 34489 105 33092 101 June 35750 109 34027 104 July 36470 111 35384 108 August 36932 112 35886 109 September 36607 111 34659 105 October 34832 106 32537 99 November 33224 101 30848 94 December 32882 100 31598 96
Classification Breakdown Percent of ADT
Motorcyles 0.87 Passenger cars 69.01 Light Trucks 22.46 Buses 0.53 Single unit trucks (2 axles) 2.59 Single unit trucks (3 axles) 1.08 Single unit trucks (4 or more axles) 0.04 Single trailer trucks (4 or less axles) 0.83 Single trailer trucks (5 axles) 1.92 Single trailer trucks (6 or more axles) 0.25 Multi trailer trucks (5 or less axles) 0.05 Multi trailer trucks (6 axles) 0.02 Multi trailer trucks (7 or more axles) 0.35
Location: OR224; MP 3.60; CLACKAMAS HIGHWAY NO. 171; 0.13 mile west of Johnson Road Site Name: Milwaukie (03-018)
Installed: July, 2007
HISTORICAL TRAFFIC DATA
Percent of ADT
Year ADT Max Day
Max Hour
10TH Hour
20TH Hour
30TH Hour
2003 *** *** *** *** *** *** 2004 *** *** *** *** *** *** 2005 *** *** *** *** *** *** 2006 *** *** *** *** *** *** 2007 *** *** *** *** *** *** 2008 35285 125 10.3 10.0 10.0 9.9 2009 35434 123 10.4 9.9 9.8 9.7 2010 35149 121 9.8 9.4 9.3 9.3 2011 35163 120 9.5 9.4 9.2 9.2 2012 35368 123 9.4 9.2 9.1 9.1
HISTORICAL ADT BY YEAR
0
10000
20000
30000
40000
03 04 05 06 07 08 09 10 11 12
Year
ADT
2012 TRAFFIC DATA
Average Weekday Traffic
Percent of ADT
Average Daily
Traffic Percent of ADT
January 37508 106 33605 95 February 39437 112 35312 100 March 38820 110 34782 98 April 40582 115 36537 103 May 39858 113 36236 102 June 40715 115 36508 103 July 39066 110 35461 100 August 40164 114 35996 102 September 40186 114 36092 102 October 40028 113 35659 101 November 38471 109 34098 96 December 37179 105 34128 96
Classification Breakdown Percent of ADT
Motorcyles 0.48 Passenger cars 78.62 Light Trucks 14.16 Buses 0.70 Single unit trucks (2 axles) 1.85 Single unit trucks (3 axles) 0.57 Single unit trucks (4 or more axles) 0.08 Single trailer trucks (4 or less axles) 0.49 Single trailer trucks (5 axles) 2.76 Single trailer trucks (6 or more axles) 0.21 Multi trailer trucks (5 or less axles) 0.01 Multi trailer trucks (6 axles) 0.01 Multi trailer trucks (7 or more axles) 0.06

234
Location: OR213; MP 8.90; CASCADE HIGHWAY SOUTH NO. 160; 0.94 mile south of S. Spangler Road
Site Name: Mulino (03-020) Installed: April, 2009
HISTORICAL TRAFFIC DATA
Percent of ADT
Year ADT Max Day
Max Hour
10TH Hour
20TH Hour
30TH Hour
2003 *** *** *** *** *** *** 2004 *** *** *** *** *** *** 2005 *** *** *** *** *** *** 2006 *** *** *** *** *** *** 2007 *** *** *** *** *** *** 2008 *** *** *** *** *** *** 2009 *** *** *** *** *** *** 2010 13007 119 10.1 9.6 9.6 9.5 2011 12962 124 10.2 9.7 9.6 9.5 2012 12721 122 10.1 9.8 9.6 9.5
HISTORICAL ADT BY YEAR
02000400060008000
100001200014000
03 04 05 06 07 08 09 10 11 12
Year
ADT
2012 TRAFFIC DATA
Average Weekday Traffic
Percent of ADT
Average Daily
Traffic Percent of ADT
January 12458 98 11702 92 February 13102 103 12392 97 March 12252 96 11556 91 April 13455 106 12993 102 May 13536 106 13022 102 June 13229 104 12824 101 July 14045 110 13565 107 August 13905 109 13510 106 September 13656 107 13353 105 October 13704 108 12942 102 November 13491 106 12585 99 December 12751 100 12216 96
Classification Breakdown Percent of ADT
Motorcyles 0.75 Passenger cars 71.01 Light Trucks 21.57 Buses 0.61 Single unit trucks (2 axles) 2.19 Single unit trucks (3 axles) 0.96 Single unit trucks (4 or more axles) 0.16 Single trailer trucks (4 or less axles) 0.23 Single trailer trucks (5 axles) 1.60 Single trailer trucks (6 or more axles) 0.78 Multi trailer trucks (5 or less axles) 0.01 Multi trailer trucks (6 axles) 0.00 Multi trailer trucks (7 or more axles) 0.13
Location: US101; MP 15.90; OREGON COAST HIGHWAY NO. 9; 2.09 miles north of Dellmoor
Loop Road Site Name: Gearhart (04-001)
Installed: October, 1956
HISTORICAL TRAFFIC DATA
Percent of ADT
Year ADT Max Day
Max Hour
10TH Hour
20TH Hour
30TH Hour
2003 13442 *** *** *** *** *** 2004 13802 152 14.3 12.4 12.0 11.9 2005 13808 149 12.7 12.2 11.9 11.7 2006 13797 146 12.8 12.3 11.9 11.8 2007 14018 145 12.4 12.1 11.9 11.7 2008 13485 153 14.3 12.2 11.8 11.7 2009 13797 146 13.1 12.5 12.3 12.1 2010 13635 149 12.7 12.4 12.1 12.0 2011 13182 149 14.2 12.5 12.4 12.2 2012 13158 157 13.6 12.9 12.5 12.4
HISTORICAL ADT BY YEAR
0
5000
10000
15000
03 04 05 06 07 08 09 10 11 12
Year
ADT
2012 TRAFFIC DATA
Average Weekday Traffic
Percent of ADT
Average Daily
Traffic Percent of ADT
January 10307 78 10157 77 February 11532 88 11617 88 March 11331 86 11496 87 April 12735 97 12989 99 May 13049 99 13512 103 June 14251 108 14205 108 July 16585 126 16656 127 August 17148 130 17620 134 September 14759 112 15170 115 October 12717 97 12462 95 November 11508 87 11260 86 December 10896 83 10756 82
Classification Breakdown Percent of ADT
Motorcyles 0.87 Passenger cars 34.20 Light Trucks 56.15 Buses 0.51 Single unit trucks (2 axles) 3.86 Single unit trucks (3 axles) 1.10 Single unit trucks (4 or more axles) 0.16 Single trailer trucks (4 or less axles) 1.16 Single trailer trucks (5 axles) 1.26 Single trailer trucks (6 or more axles) 0.51 Multi trailer trucks (5 or less axles) 0.00 Multi trailer trucks (6 axles) 0.00 Multi trailer trucks (7 or more axles) 0.22

235
Location: US101; MP 3.79; OREGON COAST HIGHWAY NO. 9; 0.01 mile north of Lower Columbia River Highway No. 92 (US30)
Site Name: Astoria Bridge (04-004) Installed: September, 1995
HISTORICAL TRAFFIC DATA
Percent of ADT
Year ADT Max Day
Max Hour
10TH Hour
20TH Hour
30TH Hour
2003 6890 173 16.3 15.4 14.6 14.4 2004 7077 171 16.1 14.5 14.1 13.7 2005 7013 168 16.2 14.9 14.4 13.9 2006 7141 164 16.6 15.0 14.6 14.4 2007 7127 165 16.3 15.0 14.6 14.1 2008 6761 175 17.3 15.8 15.0 14.3 2009 7207 191 17.2 15.9 15.0 14.6 2010 *** *** *** *** *** *** 2011 6912 174 18.9 16.0 15.5 15.0 2012 6878 168 16.8 15.2 14.7 14.5
HISTORICAL ADT BY YEAR
0
2000
4000
6000
8000
03 04 05 06 07 08 09 10 11 12
Year
ADT
2012 TRAFFIC DATA
Average Weekday Traffic
Percent of ADT
Average Daily
Traffic Percent of ADT
January 5053 73 5123 74 February 5760 84 5922 86 March 5602 81 5881 86 April 6600 96 6800 99 May 6568 95 7034 102 June 7242 105 7440 108 July 8658 126 8930 130 August 9041 131 9608 140 September 7702 112 8221 120 October 6123 89 6278 91 November 5773 84 5790 84 December 5401 79 5510 80
Classification Breakdown Percent of ADT
Motorcyles 0.26 Passenger cars 62.25 Light Trucks 29.60 Buses 0.24 Single unit trucks (2 axles) 2.70 Single unit trucks (3 axles) 1.23 Single unit trucks (4 or more axles) 0.02 Single trailer trucks (4 or less axles) 1.70 Single trailer trucks (5 axles) 1.55 Single trailer trucks (6 or more axles) 0.39 Multi trailer trucks (5 or less axles) 0.00 Multi trailer trucks (6 axles) 0.03 Multi trailer trucks (7 or more axles) 0.03
Location: US30; MP 53.33; LOWER COLUMBIA RIVER HIGHWAY NO. 92; 1.03 miles west of
Rainier Road Site Name: Rainier (05-006)
Installed: September, 1954
HISTORICAL TRAFFIC DATA
Percent of ADT
Year ADT Max Day
Max Hour
10TH Hour
20TH Hour
30TH Hour
2003 10283 152 13.9 12.1 11.7 11.5 2004 9950 153 13.9 12.5 12.2 12.0 2005 10222 151 12.6 12.1 11.9 11.7 2006 10717 146 12.7 11.8 11.5 11.4 2007 10986 151 12.9 12.2 11.6 11.3 2008 10142 148 12.6 12.1 11.7 11.6 2009 10282 156 14.3 12.7 12.4 12.0 2010 10195 149 13.8 12.4 12.2 11.9 2011 9997 150 13.5 12.4 12.1 11.9 2012 9905 157 13.4 12.6 12.1 11.8
HISTORICAL ADT BY YEAR
0
2000
4000
6000
8000
10000
12000
03 04 05 06 07 08 09 10 11 12
Year
ADT
2012 TRAFFIC DATA
Average Weekday Traffic
Percent of ADT
Average Daily
Traffic Percent of ADT
January 7884 80 7953 80 February 8834 89 9025 91 March 8770 89 8866 90 April 9300 94 9693 98 May 9710 98 10035 101 June 10119 102 10291 104 July 11500 116 11825 119 August 12071 122 12884 130 September 10872 110 11246 114 October 9530 96 9535 96 November 9102 92 8883 90 December 8734 88 8628 87
Classification Breakdown Percent of ADT
Motorcyles 0.00 Passenger cars 70.00 Light Trucks 17.94 Buses 0.35 Single unit trucks (2 axles) 2.87 Single unit trucks (3 axles) 1.61 Single unit trucks (4 or more axles) 0.06 Single trailer trucks (4 or less axles) 0.67 Single trailer trucks (5 axles) 3.62 Single trailer trucks (6 or more axles) 2.57 Multi trailer trucks (5 or less axles) 0.02 Multi trailer trucks (6 axles) 0.01 Multi trailer trucks (7 or more axles) 0.28

236
Location: US101; MP 221.67; OREGON COAST HIGHWAY NO. 9; 1.09 miles south of Douglas-Coos County Line
Site Name: Lakeside (06-001) Installed: January, 1992
HISTORICAL TRAFFIC DATA
Percent of ADT
Year ADT Max Day
Max Hour
10TH Hour
20TH Hour
30TH Hour
2003 8100 164 15.0 13.5 13.3 12.9 2004 8190 157 13.8 12.9 12.5 12.3 2005 8061 154 13.6 12.8 12.6 12.4 2006 7986 159 14.0 13.0 12.7 12.5 2007 7979 170 13.8 13.2 12.7 12.4 2008 7322 155 15.4 12.9 12.6 12.3 2009 7601 161 16.0 13.6 13.5 12.9 2010 7586 156 14.2 13.3 12.9 12.7 2011 7319 163 14.0 13.1 12.7 12.5 2012 7181 169 14.7 13.7 13.3 12.9
HISTORICAL ADT BY YEAR
0
2000
4000
6000
8000
10000
03 04 05 06 07 08 09 10 11 12
Year
ADT
2012 TRAFFIC DATA
Average Weekday Traffic
Percent of ADT
Average Daily
Traffic Percent of ADT
January 5402 75 5412 75 February 6038 84 6253 87 March 5976 83 6138 85 April 6254 87 6501 91 May 6876 96 7211 100 June 7753 108 7911 110 July 9032 126 9279 129 August 9418 131 9876 138 September 8267 115 8508 118 October 7000 97 7000 97 November 6013 84 5988 83 December 5989 83 6091 85
Classification Breakdown Percent of ADT
Motorcyles 2.71 Passenger cars 57.31 Light Trucks 18.01 Buses 3.46 Single unit trucks (2 axles) 9.06 Single unit trucks (3 axles) 0.85 Single unit trucks (4 or more axles) 0.03 Single trailer trucks (4 or less axles) 4.36 Single trailer trucks (5 axles) 2.00 Single trailer trucks (6 or more axles) 0.72 Multi trailer trucks (5 or less axles) 0.65 Multi trailer trucks (6 axles) 0.17 Multi trailer trucks (7 or more axles) 0.67
Location: US101; MP 275.87; OREGON COAST HIGHWAY NO. 9; 1.02 miles south of 18th S.W.
Street Site Name: Bandon (06-004)
Installed: September, 1954
HISTORICAL TRAFFIC DATA
Percent of ADT
Year ADT Max Day
Max Hour
10TH Hour
20TH Hour
30TH Hour
2003 6600 147 13.7 12.2 12.0 11.8 2004 6600 140 12.5 11.9 11.7 11.5 2005 6529 *** *** *** *** *** 2006 6473 147 12.9 12.3 11.9 11.7 2007 6338 143 12.8 12.4 12.1 11.9 2008 6090 145 13.2 12.3 11.7 11.6 2009 6233 *** *** *** *** *** 2010 6303 143 13.3 12.5 12.4 12.3 2011 6051 142 13.3 12.6 12.2 12.1 2012 5971 143 13.2 12.6 12.3 12.2
HISTORICAL ADT BY YEAR
01000200030004000500060007000
03 04 05 06 07 08 09 10 11 12
Year
ADT
2012 TRAFFIC DATA
Average Weekday Traffic
Percent of ADT
Average Daily
Traffic Percent of ADT
January 5088 85 4783 80 February 5513 92 5194 87 March 5444 91 5148 86 April 5809 97 5542 93 May 6214 104 5991 100 June 6960 117 6528 109 July 7726 129 7446 125 August 7972 134 7660 128 September 7270 122 6937 116 October 6295 105 5918 99 November 5593 94 5280 88 December 5349 90 5224 87
Classification Breakdown Percent of ADT
Motorcyles 1.96 Passenger cars 62.14 Light Trucks 19.09 Buses 2.10 Single unit trucks (2 axles) 8.73 Single unit trucks (3 axles) 0.70 Single unit trucks (4 or more axles) 0.13 Single trailer trucks (4 or less axles) 2.65 Single trailer trucks (5 axles) 1.35 Single trailer trucks (6 or more axles) 0.52 Multi trailer trucks (5 or less axles) 0.23 Multi trailer trucks (6 axles) 0.02 Multi trailer trucks (7 or more axles) 0.38

237
Location: US101; MP 243.99; OREGON COAST HIGHWAY NO. 9; 0.28 mile north of Coos Bay-Roseburg Highway No. 35 (OR42)
Site Name: Coos Bay (06-009) Installed: September, 1999
HISTORICAL TRAFFIC DATA
Percent of ADT
Year ADT Max Day
Max Hour
10TH Hour
20TH Hour
30TH Hour
2003 15192 139 11.3 10.7 10.5 10.4 2004 15241 *** *** *** *** *** 2005 15075 *** *** *** *** *** 2006 14902 *** *** *** *** *** 2007 14754 137 11.1 10.6 10.5 10.4 2008 13702 136 11.2 10.7 10.4 10.3 2009 13665 *** *** *** *** *** 2010 13632 137 11.7 10.8 10.6 10.5 2011 13487 135 11.2 10.6 10.3 10.2 2012 13044 140 11.2 10.7 10.5 10.4
HISTORICAL ADT BY YEAR
0
5000
10000
15000
20000
03 04 05 06 07 08 09 10 11 12
Year
ADT
2012 TRAFFIC DATA
Average Weekday Traffic
Percent of ADT
Average Daily
Traffic Percent of ADT
January 12201 94 11370 87 February 13348 102 12399 95 March 13152 101 12188 93 April 13548 104 12673 97 May 13926 107 13125 101 June 14735 113 13692 105 July 15873 122 14953 115 August 16161 124 15222 117 September 15148 116 14236 109 October 13997 107 12959 99 November 12944 99 11915 91 December 12402 95 11794 90
Classification Breakdown Percent of ADT
Motorcyles 1.23 Passenger cars 68.49 Light Trucks 19.57 Buses 0.14 Single unit trucks (2 axles) 2.03 Single unit trucks (3 axles) 1.75 Single unit trucks (4 or more axles) 0.10 Single trailer trucks (4 or less axles) 1.13 Single trailer trucks (5 axles) 2.88 Single trailer trucks (6 or more axles) 1.27 Multi trailer trucks (5 or less axles) 0.01 Multi trailer trucks (6 axles) 0.03 Multi trailer trucks (7 or more axles) 1.37
Location: US26; MP 22.85; OCHOCO HIGHWAY NO. 41; 2.03 miles west of Ochoco Dam Site Name: Ochoco (07-001)
Installed: October, 1954
HISTORICAL TRAFFIC DATA
Percent of ADT
Year ADT Max Day
Max Hour
10TH Hour
20TH Hour
30TH Hour
2003 2968 181 17.9 15.0 13.8 13.4 2004 2942 188 19.3 15.0 13.9 13.4 2005 2868 183 18.8 15.1 13.9 13.4 2006 2846 191 172 14.9 14.0 13.3 2007 2809 180 16.2 14.0 13.5 13.2 2008 2616 178 17.5 14.4 13.9 13.5 2009 2714 192 19.1 15.4 14.5 13.7 2010 2612 170 18.3 14.8 13.9 13.6 2011 2492 183 16.6 15.0 14.6 14.1 2012 2381 177 18.4 14.9 14.3 14.0
HISTORICAL ADT BY YEAR
0500
100015002000250030003500
03 04 05 06 07 08 09 10 11 12
Year
ADT
2012 TRAFFIC DATA
Average Weekday Traffic
Percent of ADT
Average Daily
Traffic Percent of ADT
January 1710 72 1685 71 February 1730 73 1719 72 March 1789 75 1824 77 April 2019 85 2143 90 May 2508 105 2672 112 June 2816 118 2967 125 July 3050 128 3287 138 August 2890 121 3085 130 September 2718 114 2934 123 October 2466 104 2494 105 November 2083 87 2074 87 December 1684 71 1690 71
Classification Breakdown Percent of ADT
Motorcyles 0.58 Passenger cars 51.50 Light Trucks 23.81 Buses 0.84 Single unit trucks (2 axles) 15.29 Single unit trucks (3 axles) 0.35 Single unit trucks (4 or more axles) 0.02 Single trailer trucks (4 or less axles) 4.54 Single trailer trucks (5 axles) 1.77 Single trailer trucks (6 or more axles) 0.82 Multi trailer trucks (5 or less axles) 0.26 Multi trailer trucks (6 axles) 0.07 Multi trailer trucks (7 or more axles) 0.15
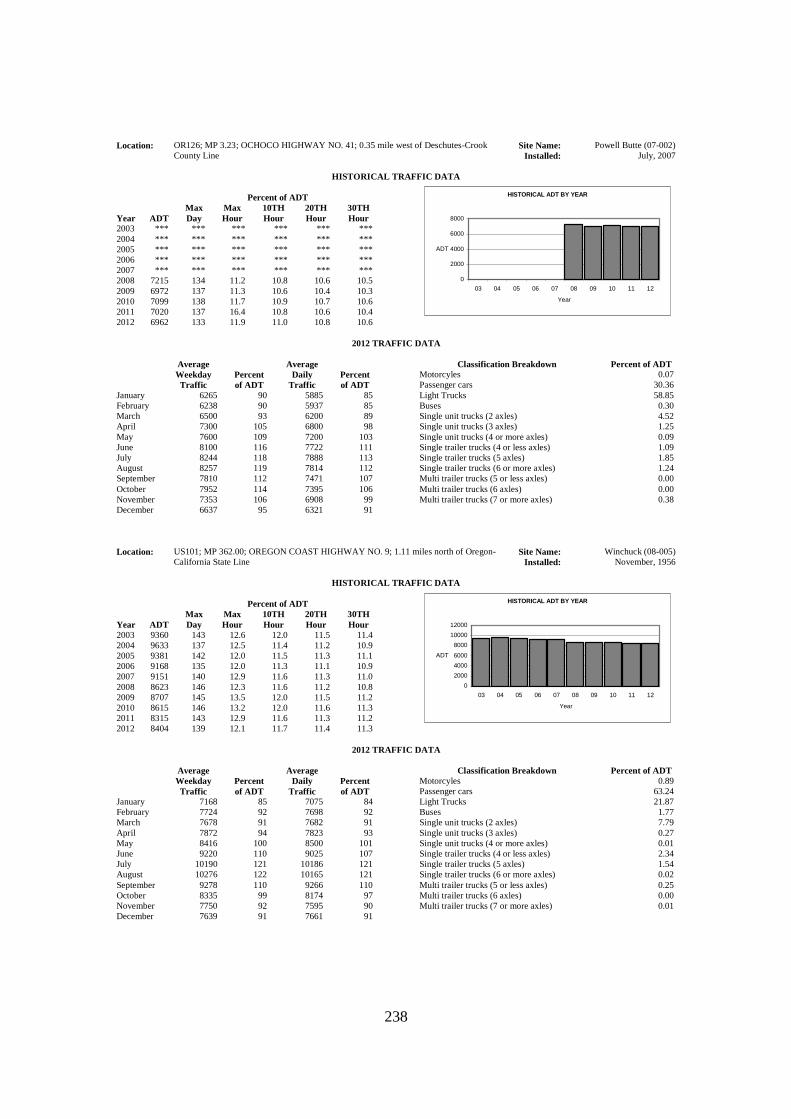
238
Location: OR126; MP 3.23; OCHOCO HIGHWAY NO. 41; 0.35 mile west of Deschutes-Crook County Line
Site Name: Powell Butte (07-002) Installed: July, 2007
HISTORICAL TRAFFIC DATA
Percent of ADT
Year ADT Max Day
Max Hour
10TH Hour
20TH Hour
30TH Hour
2003 *** *** *** *** *** *** 2004 *** *** *** *** *** *** 2005 *** *** *** *** *** *** 2006 *** *** *** *** *** *** 2007 *** *** *** *** *** *** 2008 7215 134 11.2 10.8 10.6 10.5 2009 6972 137 11.3 10.6 10.4 10.3 2010 7099 138 11.7 10.9 10.7 10.6 2011 7020 137 16.4 10.8 10.6 10.4 2012 6962 133 11.9 11.0 10.8 10.6
HISTORICAL ADT BY YEAR
0
2000
4000
6000
8000
03 04 05 06 07 08 09 10 11 12
Year
ADT
2012 TRAFFIC DATA
Average Weekday Traffic
Percent of ADT
Average Daily
Traffic Percent of ADT
January 6265 90 5885 85 February 6238 90 5937 85 March 6500 93 6200 89 April 7300 105 6800 98 May 7600 109 7200 103 June 8100 116 7722 111 July 8244 118 7888 113 August 8257 119 7814 112 September 7810 112 7471 107 October 7952 114 7395 106 November 7353 106 6908 99 December 6637 95 6321 91
Classification Breakdown Percent of ADT
Motorcyles 0.07 Passenger cars 30.36 Light Trucks 58.85 Buses 0.30 Single unit trucks (2 axles) 4.52 Single unit trucks (3 axles) 1.25 Single unit trucks (4 or more axles) 0.09 Single trailer trucks (4 or less axles) 1.09 Single trailer trucks (5 axles) 1.85 Single trailer trucks (6 or more axles) 1.24 Multi trailer trucks (5 or less axles) 0.00 Multi trailer trucks (6 axles) 0.00 Multi trailer trucks (7 or more axles) 0.38
Location: US101; MP 362.00; OREGON COAST HIGHWAY NO. 9; 1.11 miles north of Oregon-
California State Line Site Name: Winchuck (08-005)
Installed: November, 1956
HISTORICAL TRAFFIC DATA
Percent of ADT
Year ADT Max Day
Max Hour
10TH Hour
20TH Hour
30TH Hour
2003 9360 143 12.6 12.0 11.5 11.4 2004 9633 137 12.5 11.4 11.2 10.9 2005 9381 142 12.0 11.5 11.3 11.1 2006 9168 135 12.0 11.3 11.1 10.9 2007 9151 140 12.9 11.6 11.3 11.0 2008 8623 146 12.3 11.6 11.2 10.8 2009 8707 145 13.5 12.0 11.5 11.2 2010 8615 146 13.2 12.0 11.6 11.3 2011 8315 143 12.9 11.6 11.3 11.2 2012 8404 139 12.1 11.7 11.4 11.3
HISTORICAL ADT BY YEAR
0
2000
4000
6000
8000
10000
12000
03 04 05 06 07 08 09 10 11 12
Year
ADT
2012 TRAFFIC DATA
Average Weekday Traffic
Percent of ADT
Average Daily
Traffic Percent of ADT
January 7168 85 7075 84 February 7724 92 7698 92 March 7678 91 7682 91 April 7872 94 7823 93 May 8416 100 8500 101 June 9220 110 9025 107 July 10190 121 10186 121 August 10276 122 10165 121 September 9278 110 9266 110 October 8335 99 8174 97 November 7750 92 7595 90 December 7639 91 7661 91
Classification Breakdown Percent of ADT
Motorcyles 0.89 Passenger cars 63.24 Light Trucks 21.87 Buses 1.77 Single unit trucks (2 axles) 7.79 Single unit trucks (3 axles) 0.27 Single unit trucks (4 or more axles) 0.01 Single trailer trucks (4 or less axles) 2.34 Single trailer trucks (5 axles) 1.54 Single trailer trucks (6 or more axles) 0.02 Multi trailer trucks (5 or less axles) 0.25 Multi trailer trucks (6 axles) 0.00 Multi trailer trucks (7 or more axles) 0.01

239
Location: US101; MP 301.45; OREGON COAST HIGHWAY NO. 9; 0.11 mile southeast of Jefferson Street (Battle Rock Wayside)
Site Name: Port Orford (08-009) Installed: July, 2000
HISTORICAL TRAFFIC DATA
Percent of ADT
Year ADT Max Day
Max Hour
10TH Hour
20TH Hour
30TH Hour
2003 2867 169 18.6 15.4 15.0 14.7 2004 2940 173 18.6 15.1 14.8 14.5 2005 2850 179 17.1 15.5 15.0 14.7 2006 2795 *** *** *** *** *** 2007 2720 174 16.0 15.4 15.1 14.9 2008 2539 173 17.1 15.2 14.6 14.3 2009 2656 171 17.4 15.9 15.5 15.2 2010 2680 167 17.5 15.2 15.0 14.8 2011 2555 164 15.5 15.0 14.6 14.3 2012 2516 179 17.4 15.9 15.5 15.3
HISTORICAL ADT BY YEAR
0500
100015002000250030003500
03 04 05 06 07 08 09 10 11 12
Year
ADT
2012 TRAFFIC DATA
Average Weekday Traffic
Percent of ADT
Average Daily
Traffic Percent of ADT
January 1765 70 1696 67 February 1971 78 1937 77 March 1950 78 1876 75 April 2168 86 2117 84 May 2422 96 2379 95 June 3072 122 2917 116 July 3917 156 3752 149 August 4001 159 3862 154 September 3268 130 3159 126 October 2522 100 2353 94 November 2150 85 2100 83 December 1991 79 2040 81
Classification Breakdown Percent of ADT
Motorcyles 3.08 Passenger cars 56.36 Light Trucks 19.37 Buses 1.84 Single unit trucks (2 axles) 8.35 Single unit trucks (3 axles) 1.29 Single unit trucks (4 or more axles) 0.09 Single trailer trucks (4 or less axles) 2.89 Single trailer trucks (5 axles) 3.94 Single trailer trucks (6 or more axles) 1.63 Multi trailer trucks (5 or less axles) 0.18 Multi trailer trucks (6 axles) 0.00 Multi trailer trucks (7 or more axles) 0.98
Location: US97; MP 142.41; THE DALLES-CALIFORNIA HIGHWAY NO. 4; 0.17 mile south of
China Hat Road Site Name: Lava Butte (09-003)
Installed: January, 1951
HISTORICAL TRAFFIC DATA
Percent of ADT
Year ADT Max Day
Max Hour
10TH Hour
20TH Hour
30TH Hour
2003 22041 148 12.2 11.5 11.2 11.0 2004 22128 142 12.1 11.2 11.0 10.8 2005 22101 *** *** *** *** *** 2006 22150 141 11.9 11.3 11.1 10.9 2007 22460 *** *** *** *** *** 2008 20472 145 12.0 11.5 11.1 10.9 2009 20395 145 12.3 11.5 11.2 11.0 2010 20347 147 12.4 11.8 11.4 11.2 2011 19800 153 12.5 11.8 11.4 11.3 2012 19816 154 13.1 12.0 11.7 11.5
HISTORICAL ADT BY YEAR
0
5000
10000
15000
20000
25000
03 04 05 06 07 08 09 10 11 12
Year
ADT
2012 TRAFFIC DATA
Average Weekday Traffic
Percent of ADT
Average Daily
Traffic Percent of ADT
January 15766 80 15458 78 February 17067 86 16747 85 March 17619 89 17078 86 April 18766 95 18211 92 May 20418 103 20292 102 June 23270 117 22949 116 July 25456 128 25449 128 August 25903 131 25873 131 September 22444 113 22111 112 October 20260 102 19534 99 November 18340 93 17620 89 December 16847 85 16473 83
Classification Breakdown Percent of ADT
Motorcyles 1.05 Passenger cars 71.76 Light Trucks 19.39 Buses 0.21 Single unit trucks (2 axles) 1.74 Single unit trucks (3 axles) 0.46 Single unit trucks (4 or more axles) 0.01 Single trailer trucks (4 or less axles) 1.08 Single trailer trucks (5 axles) 3.66 Single trailer trucks (6 or more axles) 0.42 Multi trailer trucks (5 or less axles) 0.01 Multi trailer trucks (6 axles) 0.03 Multi trailer trucks (7 or more axles) 0.18

240
Location: US20; MP 6.28; CENTRAL OREGON HIGHWAY NO. 7; 1.49 miles east of Powell Butte Road
Site Name: Pilot Butte (09-005) Installed: October, 1951
HISTORICAL TRAFFIC DATA
Percent of ADT
Year ADT Max Day
Max Hour
10TH Hour
20TH Hour
30TH Hour
2003 2718 170 14.4 12.9 12.3 12.0 2004 2750 162 14.0 12.4 11.9 11.3 2005 2662 166 13.7 12.3 11.7 11.6 2006 2623 *** *** *** *** *** 2007 2677 167 13.6 12.7 12.0 11.9 2008 2457 158 15.9 14.7 14.0 13.2 2009 2486 162 13.8 12.4 12.1 11.7 2010 2524 159 14.7 12.9 12.4 12.1 2011 2358 157 15.2 13.4 12.6 12.1 2012 2389 161 15.8 13.1 12.4 12.1
HISTORICAL ADT BY YEAR
0
500
1000
1500
2000
2500
3000
03 04 05 06 07 08 09 10 11 12
Year
ADT
2012 TRAFFIC DATA
Average Weekday Traffic
Percent of ADT
Average Daily
Traffic Percent of ADT
January 1900 80 1874 78 February 1855 78 1902 80 March 2016 84 2100 88 April 2212 93 2332 98 May 2505 105 2603 109 June 2807 117 2822 118 July 2902 121 2954 124 August 2784 117 2879 120 September 2699 113 2752 115 October 2434 102 2484 104 November 2115 89 2157 90 December 1819 76 1808 76
Classification Breakdown Percent of ADT
Motorcyles 0.96 Passenger cars 44.70 Light Trucks 23.05 Buses 1.50 Single unit trucks (2 axles) 15.93 Single unit trucks (3 axles) 0.40 Single unit trucks (4 or more axles) 0.16 Single trailer trucks (4 or less axles) 6.22 Single trailer trucks (5 axles) 4.68 Single trailer trucks (6 or more axles) 1.05 Multi trailer trucks (5 or less axles) 0.27 Multi trailer trucks (6 axles) 0.16 Multi trailer trucks (7 or more axles) 0.92
Location: US97; MP 135.95; THE DALLES-CALIFORNIA HIGHWAY NO. 4; 0.49 mile south of
Empire Avenue Site Name: Bend-Empire (09-007)
Installed: June, 1998
HISTORICAL TRAFFIC DATA
Percent of ADT
Year ADT Max Day
Max Hour
10TH Hour
20TH Hour
30TH Hour
2003 38762 128 11.1 10.6 10.5 10.4 2004 41282 128 11.2 10.8 10.5 10.5 2005 43455 132 11.7 10.8 10.6 10.5 2006 46064 126 10.9 10.4 10.3 10.3 2007 46647 129 10.9 10.4 10.2 10.2 2008 43354 130 10.8 10.5 10.4 10.3 2009 42205 *** *** *** *** *** 2010 41291 *** *** *** *** *** 2011 41870 *** *** *** *** *** 2012 42691 128 10.9 10.4 10.2 10.2
HISTORICAL ADT BY YEAR
0
10000
20000
30000
40000
50000
03 04 05 06 07 08 09 10 11 12
Year
ADT
2012 TRAFFIC DATA
Average Weekday Traffic
Percent of ADT
Average Daily
Traffic Percent of ADT
January 39925 94 37705 88 February 42137 99 39609 93 March 42109 99 39676 93 April 45492 107 42534 100 May 46600 109 44080 103 June 48985 115 46116 108 July 49467 116 46820 110 August 50245 118 47262 111 September 47258 111 44307 104 October 45982 108 43009 101 November 43933 103 41000 96 December 42088 99 40174 94
Classification Breakdown Percent of ADT
Motorcyles 0.87 Passenger cars 64.07 Light Trucks 28.88 Buses 0.15 Single unit trucks (2 axles) 2.44 Single unit trucks (3 axles) 0.46 Single unit trucks (4 or more axles) 0.02 Single trailer trucks (4 or less axles) 0.71 Single trailer trucks (5 axles) 1.77 Single trailer trucks (6 or more axles) 0.39 Multi trailer trucks (5 or less axles) 0.01 Multi trailer trucks (6 axles) 0.00 Multi trailer trucks (7 or more axles) 0.23

241
Location: US97; MP 137.36; THE DALLES-CALIFORNIA HIGHWAY NO. 4; 0.23 mile south of Revere Avenue
Site Name: Bend-Revere (09-009) Installed: June, 1998
HISTORICAL TRAFFIC DATA
Percent of ADT
Year ADT Max Day
Max Hour
10TH Hour
20TH Hour
30TH Hour
2003 37125 129 10.9 10.5 10.4 10.3 2004 38565 127 11.3 10.7 10.5 10.4 2005 39657 134 11.0 10.7 10.6 10.5 2006 42163 *** *** *** *** *** 2007 42825 131 11.0 10.5 10.4 10.3 2008 39229 128 10.8 10.5 10.4 10.3 2009 38140 *** *** *** *** *** 2010 38467 133 10.7 10.4 10.3 10.2 2011 38506 130 10.9 10.4 10.3 10.2 2012 39052 129 10.8 10.4 10.3 10.2
HISTORICAL ADT BY YEAR
0
10000
20000
30000
40000
50000
03 04 05 06 07 08 09 10 11 12
Year
ADT
2012 TRAFFIC DATA
Average Weekday Traffic
Percent of ADT
Average Daily
Traffic Percent of ADT
January 36044 92 34073 87 February 38112 98 35886 92 March 38304 98 35925 92 April 41151 105 38332 98 May 42440 109 40178 103 June 45110 116 42227 108 July 46011 118 43568 112 August 46968 120 44174 113 September 43902 112 41106 105 October 42276 108 39343 101 November 39898 102 37111 95 December 38463 98 36699 94
Classification Breakdown Percent of ADT
Motorcyles 0.44 Passenger cars 67.05 Light Trucks 26.10 Buses 0.11 Single unit trucks (2 axles) 2.24 Single unit trucks (3 axles) 0.45 Single unit trucks (4 or more axles) 0.03 Single trailer trucks (4 or less axles) 0.65 Single trailer trucks (5 axles) 2.23 Single trailer trucks (6 or more axles) 0.43 Multi trailer trucks (5 or less axles) 0.03 Multi trailer trucks (6 axles) 0.00 Multi trailer trucks (7 or more axles) 0.24
Location: US20/OR126 MP 93.12; SANTIAM HIGHWAY NO. 16; 0.31 mile south of Black Butte
Ranch Road Site Name: Sisters (09-014)
Installed: October, 1957
HISTORICAL TRAFFIC DATA
Percent of ADT
Year ADT Max Day
Max Hour
10TH Hour
20TH Hour
30TH Hour
2003 7927 204 20.6 18.8 17.9 17.0 2004 8051 189 19.6 18.1 17.2 16.5 2005 8008 198 19.5 18.5 17.6 17.2 2006 7993 190 20.2 17.8 17.2 16.6 2007 8168 207 20.9 19.1 18.0 17.4 2008 7305 208 22.0 20.2 19.4 18.3 2009 7621 *** *** *** *** *** 2010 7670 210 22.2 19.8 19.2 18.5 2011 7489 211 22.2 20.1 19.4 18.8 2012 7490 *** *** *** *** ***
HISTORICAL ADT BY YEAR
0
2000
4000
6000
8000
10000
03 04 05 06 07 08 09 10 11 12
Year
ADT
2012 TRAFFIC DATA
Average Weekday Traffic
Percent of ADT
Average Daily
Traffic Percent of ADT
January 3793 51 4505 60 February 4119 55 5072 68 March 4378 58 5244 70 April 5040 67 6344 85 May 6282 84 7945 106 June 8400 112 9800 131 July 10400 139 11800 158 August 10200 136 11600 155 September 8000 107 9600 128 October 6003 80 7259 97 November 4987 67 5800 77 December 4372 58 4912 66
Classification Breakdown Percent of ADT
Motorcyles 1.45 Passenger cars 59.96 Light Trucks 18.63 Buses 2.23 Single unit trucks (2 axles) 8.52 Single unit trucks (3 axles) 0.22 Single unit trucks (4 or more axles) 0.01 Single trailer trucks (4 or less axles) 5.43 Single trailer trucks (5 axles) 1.69 Single trailer trucks (6 or more axles) 0.71 Multi trailer trucks (5 or less axles) 0.60 Multi trailer trucks (6 axles) 0.13 Multi trailer trucks (7 or more axles) 0.42

242
Location: US20; MP 9.25; MCKENZIE-BEND HIGHWAY NO. 17; 0.47 mile northwest of Innes Market Road
Site Name: Three Sisters Viewpoint (09-015)
Installed: January, 2003
HISTORICAL TRAFFIC DATA
Percent of ADT
Year ADT Max Day
Max Hour
10TH Hour
20TH Hour
30TH Hour
2003 8970 164 14.5 13.4 12.9 12.7 2004 9342 160 14.8 12.9 12.5 12.3 2005 9409 160 14.4 12.9 12.4 12.2 2006 9539 154 13.6 12.7 12.3 12.1 2007 9667 154 13.3 12.6 12.4 12.1 2008 8813 156 13.6 12.9 12.7 12.6 2009 8887 157 14.0 13.1 12.7 12.6 2010 8851 159 14.4 13.7 13.2 13.0 2011 8663 160 15.2 13.7 13.2 13.0 2012 8678 162 14.8 13.8 13.5 13.3
HISTORICAL ADT BY YEAR
0
2000
4000
6000
8000
10000
12000
03 04 05 06 07 08 09 10 11 12
Year
ADT
2012 TRAFFIC DATA
Average Weekday Traffic
Percent of ADT
Average Daily
Traffic Percent of ADT
January 6288 72 6442 74 February 6779 78 6994 81 March 6840 79 6965 80 April 7606 88 8006 92 May 8784 101 9279 107 June 10003 115 10426 120 July 10859 125 11538 133 August 10919 126 11524 133 September 9591 111 10023 115 October 8298 96 8663 100 November 7366 85 7443 86 December 6804 78 6835 79
Classification Breakdown Percent of ADT
Motorcyles 1.13 Passenger cars 61.59 Light Trucks 17.71 Buses 2.74 Single unit trucks (2 axles) 9.71 Single unit trucks (3 axles) 0.29 Single unit trucks (4 or more axles) 0.06 Single trailer trucks (4 or less axles) 4.27 Single trailer trucks (5 axles) 1.19 Single trailer trucks (6 or more axles) 0.34 Multi trailer trucks (5 or less axles) 0.69 Multi trailer trucks (6 axles) 0.06 Multi trailer trucks (7 or more axles) 0.22
Location: US97; MP 124.39; THE DALLES-CALIFORNIA HIGHWAY NO. 4; 0.79 miles south of
Yew Avenue Site Name: Redmond (09-020)
Installed: February, 1994
HISTORICAL TRAFFIC DATA
Percent of ADT
Year ADT Max Day
Max Hour
10TH Hour
20TH Hour
30TH Hour
2003 27751 133 10.7 10.2 10.0 9.9 2004 28647 136 11.3 10.4 10.3 10.2 2005 29788 138 11.3 10.5 10.3 10.1 2006 31315 138 11.4 10.3 10.2 10.1 2007 31492 138 10.8 10.5 10.0 10.0 2008 28041 145 11.7 10.6 10.3 10.1 2009 27242 152 11.8 10.4 10.1 10.0 2010 27361 146 12.1 10.7 10.3 10.2 2011 26517 148 12.2 10.9 10.3 10.0 2012 26314 140 12.3 10.4 10.3 10.3
HISTORICAL ADT BY YEAR
05000
100001500020000250003000035000
03 04 05 06 07 08 09 10 11 12
Year
ADT
2012 TRAFFIC DATA
Average Weekday Traffic
Percent of ADT
Average Daily
Traffic Percent of ADT
January 24288 92 22652 86 February 26020 99 24268 92 March 26077 99 24532 93 April 28064 107 26192 100 May 29056 110 27206 103 June 30500 116 28700 109 July 29581 112 28042 107 August 31215 119 29661 113 September 29591 112 27857 106 October 29032 110 27177 103 November 27265 104 25286 96 December 25553 97 24191 92
Classification Breakdown Percent of ADT
Motorcyles 0.60 Passenger cars 30.17 Light Trucks 59.65 Buses 0.34 Single unit trucks (2 axles) 2.59 Single unit trucks (3 axles) 0.63 Single unit trucks (4 or more axles) 0.16 Single trailer trucks (4 or less axles) 0.66 Single trailer trucks (5 axles) 3.39 Single trailer trucks (6 or more axles) 1.22 Multi trailer trucks (5 or less axles) 0.06 Multi trailer trucks (6 axles) 0.06 Multi trailer trucks (7 or more axles) 0.47
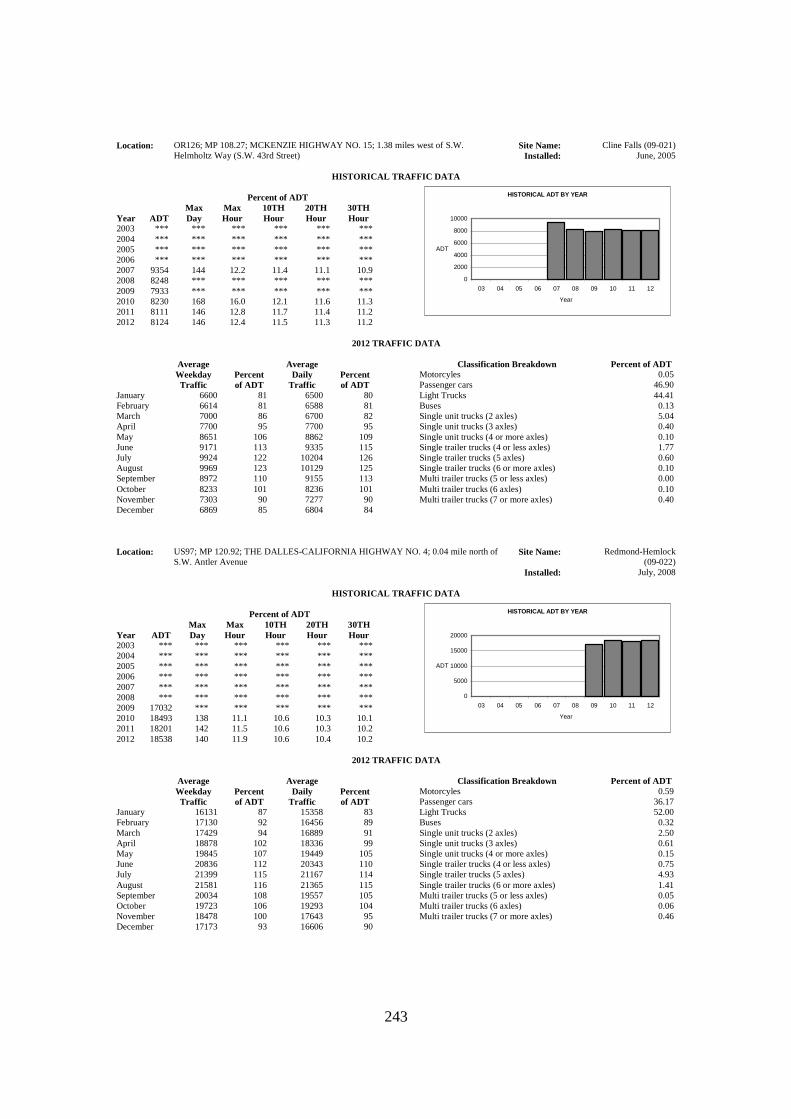
243
Location: OR126; MP 108.27; MCKENZIE HIGHWAY NO. 15; 1.38 miles west of S.W. Helmholtz Way (S.W. 43rd Street)
Site Name: Cline Falls (09-021) Installed: June, 2005
HISTORICAL TRAFFIC DATA
Percent of ADT
Year ADT Max Day
Max Hour
10TH Hour
20TH Hour
30TH Hour
2003 *** *** *** *** *** *** 2004 *** *** *** *** *** *** 2005 *** *** *** *** *** *** 2006 *** *** *** *** *** *** 2007 9354 144 12.2 11.4 11.1 10.9 2008 8248 *** *** *** *** *** 2009 7933 *** *** *** *** *** 2010 8230 168 16.0 12.1 11.6 11.3 2011 8111 146 12.8 11.7 11.4 11.2 2012 8124 146 12.4 11.5 11.3 11.2
HISTORICAL ADT BY YEAR
0
2000
4000
6000
8000
10000
03 04 05 06 07 08 09 10 11 12
Year
ADT
2012 TRAFFIC DATA
Average Weekday Traffic
Percent of ADT
Average Daily
Traffic Percent of ADT
January 6600 81 6500 80 February 6614 81 6588 81 March 7000 86 6700 82 April 7700 95 7700 95 May 8651 106 8862 109 June 9171 113 9335 115 July 9924 122 10204 126 August 9969 123 10129 125 September 8972 110 9155 113 October 8233 101 8236 101 November 7303 90 7277 90 December 6869 85 6804 84
Classification Breakdown Percent of ADT
Motorcyles 0.05 Passenger cars 46.90 Light Trucks 44.41 Buses 0.13 Single unit trucks (2 axles) 5.04 Single unit trucks (3 axles) 0.40 Single unit trucks (4 or more axles) 0.10 Single trailer trucks (4 or less axles) 1.77 Single trailer trucks (5 axles) 0.60 Single trailer trucks (6 or more axles) 0.10 Multi trailer trucks (5 or less axles) 0.00 Multi trailer trucks (6 axles) 0.10 Multi trailer trucks (7 or more axles) 0.40
Location: US97; MP 120.92; THE DALLES-CALIFORNIA HIGHWAY NO. 4; 0.04 mile north of
S.W. Antler Avenue Site Name: Redmond-Hemlock
(09-022) Installed: July, 2008
HISTORICAL TRAFFIC DATA
Percent of ADT
Year ADT Max Day
Max Hour
10TH Hour
20TH Hour
30TH Hour
2003 *** *** *** *** *** *** 2004 *** *** *** *** *** *** 2005 *** *** *** *** *** *** 2006 *** *** *** *** *** *** 2007 *** *** *** *** *** *** 2008 *** *** *** *** *** *** 2009 17032 *** *** *** *** *** 2010 18493 138 11.1 10.6 10.3 10.1 2011 18201 142 11.5 10.6 10.3 10.2 2012 18538 140 11.9 10.6 10.4 10.2
HISTORICAL ADT BY YEAR
0
5000
10000
15000
20000
03 04 05 06 07 08 09 10 11 12
Year
ADT
2012 TRAFFIC DATA
Average Weekday Traffic
Percent of ADT
Average Daily
Traffic Percent of ADT
January 16131 87 15358 83 February 17130 92 16456 89 March 17429 94 16889 91 April 18878 102 18336 99 May 19845 107 19449 105 June 20836 112 20343 110 July 21399 115 21167 114 August 21581 116 21365 115 September 20034 108 19557 105 October 19723 106 19293 104 November 18478 100 17643 95 December 17173 93 16606 90
Classification Breakdown Percent of ADT
Motorcyles 0.59 Passenger cars 36.17 Light Trucks 52.00 Buses 0.32 Single unit trucks (2 axles) 2.50 Single unit trucks (3 axles) 0.61 Single unit trucks (4 or more axles) 0.15 Single trailer trucks (4 or less axles) 0.75 Single trailer trucks (5 axles) 4.93 Single trailer trucks (6 or more axles) 1.41 Multi trailer trucks (5 or less axles) 0.05 Multi trailer trucks (6 axles) 0.06 Multi trailer trucks (7 or more axles) 0.46

244
Location: US97; MP 119.09; THE DALLES-CALIFORNIA HIGHWAY NO. 4; 0.57 mile south of O'Neil Highway No. 370
Site Name: North Redmond (09-023) Installed: August, 2008
HISTORICAL TRAFFIC DATA
Percent of ADT
Year ADT Max Day
Max Hour
10TH Hour
20TH Hour
30TH Hour
2003 *** *** *** *** *** *** 2004 *** *** *** *** *** *** 2005 *** *** *** *** *** *** 2006 *** *** *** *** *** *** 2007 *** *** *** *** *** *** 2008 *** *** *** *** *** *** 2009 18311 145 12.2 10.6 10.4 10.2 2010 18408 138 11.4 11.0 10.6 10.4 2011 17996 145 11.7 10.9 10.6 10.4 2012 18186 140 12.1 10.8 10.6 10.5
HISTORICAL ADT BY YEAR
0
5000
10000
15000
20000
03 04 05 06 07 08 09 10 11 12
Year
ADT
2012 TRAFFIC DATA
Average Weekday Traffic
Percent of ADT
Average Daily
Traffic Percent of ADT
January 15306 84 14831 82 February 16454 90 16086 88 March 16674 92 16504 91 April 17958 99 17931 99 May 19135 105 19165 105 June 20259 111 20159 111 July 20885 115 21089 116 August 21028 116 21225 117 September 19793 109 19635 108 October 18753 103 18849 104 November 17384 96 16870 93 December 16166 89 15888 87
Classification Breakdown Percent of ADT
Motorcyles 0.29 Passenger cars 50.92 Light Trucks 37.41 Buses 0.34 Single unit trucks (2 axles) 3.18 Single unit trucks (3 axles) 0.56 Single unit trucks (4 or more axles) 0.05 Single trailer trucks (4 or less axles) 0.72 Single trailer trucks (5 axles) 4.03 Single trailer trucks (6 or more axles) 1.77 Multi trailer trucks (5 or less axles) 0.05 Multi trailer trucks (6 axles) 0.08 Multi trailer trucks (7 or more axles) 0.60
Location: US20; MP 63.45; CENTRAL OREGON HIGHWAY NO. 7; 5.80 miles northwest of
Deschutes-Lake County Line Site Name: Hampton (09-024)
Installed: January, 2008
HISTORICAL TRAFFIC DATA
Percent of ADT
Year ADT Max Day
Max Hour
10TH Hour
20TH Hour
30TH Hour
2003 *** *** *** *** *** *** 2004 *** *** *** *** *** *** 2005 *** *** *** *** *** *** 2006 *** *** *** *** *** *** 2007 *** *** *** *** *** *** 2008 1090 215 28.2 19.3 18.1 16.8 2009 1184 198 20.6 18.0 17.0 16.3 2010 1200 200 21.0 18.2 17.2 16.7 2011 1183 185 20.1 16.7 16.1 15.5 2012 1234 *** *** *** *** ***
HISTORICAL ADT BY YEAR
0200400600800
100012001400
03 04 05 06 07 08 09 10 11 12
Year
ADT
2012 TRAFFIC DATA
Average Weekday Traffic
Percent of ADT
Average Daily
Traffic Percent of ADT
January 710 58 729 59 February 771 62 781 63 March 873 71 933 76 April 1057 86 1094 89 May 1294 105 1332 108 June 1535 124 1600 130 July 1573 127 1706 138 August 1656 134 1760 143 September 1531 124 1591 129 October 1299 105 1354 110 November 1047 85 1105 90 December 784 64 818 66
Classification Breakdown Percent of ADT
Motorcyles 1.89 Passenger cars 36.45 Light Trucks 17.97 Buses 2.43 Single unit trucks (2 axles) 14.27 Single unit trucks (3 axles) 0.36 Single unit trucks (4 or more axles) 0.05 Single trailer trucks (4 or less axles) 10.27 Single trailer trucks (5 axles) 10.04 Single trailer trucks (6 or more axles) 2.25 Multi trailer trucks (5 or less axles) 0.77 Multi trailer trucks (6 axles) 0.86 Multi trailer trucks (7 or more axles) 2.39
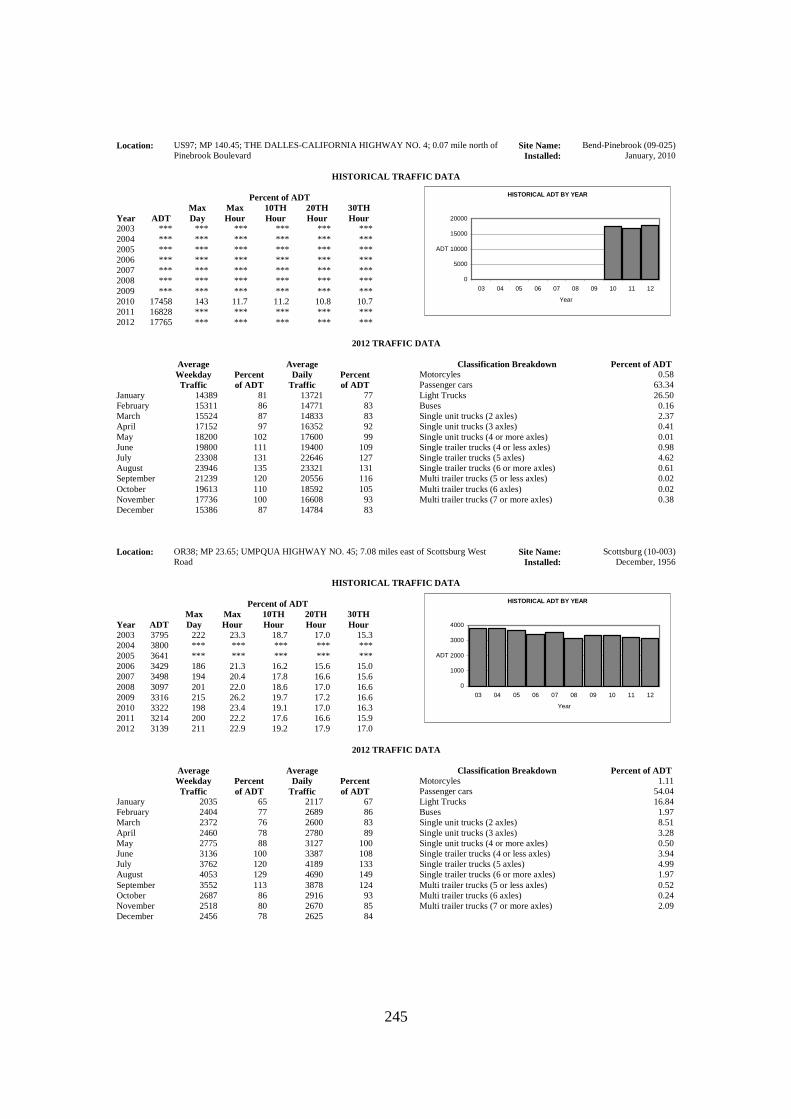
245
Location: US97; MP 140.45; THE DALLES-CALIFORNIA HIGHWAY NO. 4; 0.07 mile north of Pinebrook Boulevard
Site Name: Bend-Pinebrook (09-025) Installed: January, 2010
HISTORICAL TRAFFIC DATA
Percent of ADT
Year ADT Max Day
Max Hour
10TH Hour
20TH Hour
30TH Hour
2003 *** *** *** *** *** *** 2004 *** *** *** *** *** *** 2005 *** *** *** *** *** *** 2006 *** *** *** *** *** *** 2007 *** *** *** *** *** *** 2008 *** *** *** *** *** *** 2009 *** *** *** *** *** *** 2010 17458 143 11.7 11.2 10.8 10.7 2011 16828 *** *** *** *** *** 2012 17765 *** *** *** *** ***
HISTORICAL ADT BY YEAR
0
5000
10000
15000
20000
03 04 05 06 07 08 09 10 11 12
Year
ADT
2012 TRAFFIC DATA
Average Weekday Traffic
Percent of ADT
Average Daily
Traffic Percent of ADT
January 14389 81 13721 77 February 15311 86 14771 83 March 15524 87 14833 83 April 17152 97 16352 92 May 18200 102 17600 99 June 19800 111 19400 109 July 23308 131 22646 127 August 23946 135 23321 131 September 21239 120 20556 116 October 19613 110 18592 105 November 17736 100 16608 93 December 15386 87 14784 83
Classification Breakdown Percent of ADT
Motorcyles 0.58 Passenger cars 63.34 Light Trucks 26.50 Buses 0.16 Single unit trucks (2 axles) 2.37 Single unit trucks (3 axles) 0.41 Single unit trucks (4 or more axles) 0.01 Single trailer trucks (4 or less axles) 0.98 Single trailer trucks (5 axles) 4.62 Single trailer trucks (6 or more axles) 0.61 Multi trailer trucks (5 or less axles) 0.02 Multi trailer trucks (6 axles) 0.02 Multi trailer trucks (7 or more axles) 0.38
Location: OR38; MP 23.65; UMPQUA HIGHWAY NO. 45; 7.08 miles east of Scottsburg West
Road Site Name: Scottsburg (10-003)
Installed: December, 1956
HISTORICAL TRAFFIC DATA
Percent of ADT
Year ADT Max Day
Max Hour
10TH Hour
20TH Hour
30TH Hour
2003 3795 222 23.3 18.7 17.0 15.3 2004 3800 *** *** *** *** *** 2005 3641 *** *** *** *** *** 2006 3429 186 21.3 16.2 15.6 15.0 2007 3498 194 20.4 17.8 16.6 15.6 2008 3097 201 22.0 18.6 17.0 16.6 2009 3316 215 26.2 19.7 17.2 16.6 2010 3322 198 23.4 19.1 17.0 16.3 2011 3214 200 22.2 17.6 16.6 15.9 2012 3139 211 22.9 19.2 17.9 17.0
HISTORICAL ADT BY YEAR
0
1000
2000
3000
4000
03 04 05 06 07 08 09 10 11 12
Year
ADT
2012 TRAFFIC DATA
Average Weekday Traffic
Percent of ADT
Average Daily
Traffic Percent of ADT
January 2035 65 2117 67 February 2404 77 2689 86 March 2372 76 2600 83 April 2460 78 2780 89 May 2775 88 3127 100 June 3136 100 3387 108 July 3762 120 4189 133 August 4053 129 4690 149 September 3552 113 3878 124 October 2687 86 2916 93 November 2518 80 2670 85 December 2456 78 2625 84
Classification Breakdown Percent of ADT
Motorcyles 1.11 Passenger cars 54.04 Light Trucks 16.84 Buses 1.97 Single unit trucks (2 axles) 8.51 Single unit trucks (3 axles) 3.28 Single unit trucks (4 or more axles) 0.50 Single trailer trucks (4 or less axles) 3.94 Single trailer trucks (5 axles) 4.99 Single trailer trucks (6 or more axles) 1.97 Multi trailer trucks (5 or less axles) 0.52 Multi trailer trucks (6 axles) 0.24 Multi trailer trucks (7 or more axles) 2.09

246
Location: OR138; MP 28.41; NORTH UMPQUA HIGHWAY NO. 138; 0.10 mile west of Susan Creek Road
Site Name: Glide (10-004) Installed: June, 1966
HISTORICAL TRAFFIC DATA
Percent of ADT
Year ADT Max Day
Max Hour
10TH Hour
20TH Hour
30TH Hour
2003 1238 279 32.1 24.9 22.4 21.5 2004 1124 255 32.2 24.5 22.7 21.5 2005 1034 252 37.2 24.0 22.9 22.0 2006 951 269 30.1 25.9 24.3 22.8 2007 1000 248 29.8 25.1 23.6 22.2 2008 943 *** *** *** *** *** 2009 961 *** *** *** *** *** 2010 973 246 27.3 24.4 23.3 22.3 2011 976 253 27.7 24.0 22.4 21.2 2012 936 236 29.2 22.9 21.7 20.8
HISTORICAL ADT BY YEAR
0200400600800
100012001400
03 04 05 06 07 08 09 10 11 12
Year
ADT
2012 TRAFFIC DATA
Average Weekday Traffic
Percent of ADT
Average Daily
Traffic Percent of ADT
January 471 50 466 50 February 509 54 508 54 March 517 55 538 58 April 531 57 618 66 May 818 87 928 99 June 1240 133 1284 137 July 1510 161 1661 177 August 1493 160 1649 176 September 1400 150 1500 160 October 913 98 996 106 November 608 65 599 64 December 457 49 483 52
Classification Breakdown Percent of ADT
Motorcyles 0.32 Passenger cars 57.05 Light Trucks 38.39 Buses 0.62 Single unit trucks (2 axles) 1.61 Single unit trucks (3 axles) 0.55 Single unit trucks (4 or more axles) 0.00 Single trailer trucks (4 or less axles) 0.24 Single trailer trucks (5 axles) 0.75 Single trailer trucks (6 or more axles) 0.31 Multi trailer trucks (5 or less axles) 0.01 Multi trailer trucks (6 axles) 0.01 Multi trailer trucks (7 or more axles) 0.14
Location: I-5; MP 129.75; PACIFIC HIGHWAY NO. 1; 0.53 mile north of Winchester Interchange Site Name: Roseburg (10-005)
Installed: August, 1999
HISTORICAL TRAFFIC DATA
Percent of ADT
Year ADT Max Day
Max Hour
10TH Hour
20TH Hour
30TH Hour
2003 31953 *** *** *** *** *** 2004 32266 149 11.5 10.2 9.9 9.7 2005 31790 153 13.5 10.6 10.2 10.0 2006 31519 146 11.6 10.2 9.9 9.8 2007 31958 150 11.7 10.4 10.1 9.9 2008 29112 *** *** *** *** *** 2009 29874 136 10.7 10.2 10.0 9.9 2010 30099 *** *** *** *** *** 2011 29444 145 11.6 10.3 10.0 9.9 2012 29325 *** *** *** *** ***
HISTORICAL ADT BY YEAR
05000
100001500020000250003000035000
03 04 05 06 07 08 09 10 11 12
Year
ADT
2012 TRAFFIC DATA
Average Weekday Traffic
Percent of ADT
Average Daily
Traffic Percent of ADT
January 26000 89 25000 85 February 26500 90 26000 89 March 28400 97 28000 95 April 28400 97 28000 95 May 29700 101 29000 99 June 32500 111 32000 109 July 33600 115 33800 115 August 34400 117 34200 117 September 31400 107 31000 106 October 29600 101 29000 99 November 28700 98 28500 97 December 27600 94 27400 93
Classification Breakdown Percent of ADT
Motorcyles 0.20 Passenger cars 56.57 Light Trucks 15.05 Buses 0.16 Single unit trucks (2 axles) 4.09 Single unit trucks (3 axles) 1.35 Single unit trucks (4 or more axles) 0.00 Single trailer trucks (4 or less axles) 1.72 Single trailer trucks (5 axles) 16.43 Single trailer trucks (6 or more axles) 1.08 Multi trailer trucks (5 or less axles) 0.31 Multi trailer trucks (6 axles) 0.00 Multi trailer trucks (7 or more axles) 3.04

247
Location: OR42; MP 70.51; COOS BAY-ROSEBURG HIGHWAY NO. 35; 1.22 miles west of Brockway Road
Site Name: Brockway (10-006) Installed: October, 1956
HISTORICAL TRAFFIC DATA
Percent of ADT
Year ADT Max Day
Max Hour
10TH Hour
20TH Hour
30TH Hour
2003 6236 139 12.1 10.5 10.1 9.9 2004 6277 139 11.1 10.3 9.9 9.8 2005 6258 150 12.1 10.2 9.9 9.7 2006 6206 133 10.9 10.2 9.8 9.7 2007 6024 139 11.5 10.4 10.1 10.0 2008 5518 141 11.2 10.6 10.4 10.1 2009 5552 138 12.4 10.8 10.5 10.3 2010 5636 138 11.6 10.8 10.5 10.3 2011 5331 141 11.8 10.8 10.5 10.3 2012 5206 135 11.6 10.6 10.4 10.3
HISTORICAL ADT BY YEAR
01000200030004000500060007000
03 04 05 06 07 08 09 10 11 12
Year
ADT
2012 TRAFFIC DATA
Average Weekday Traffic
Percent of ADT
Average Daily
Traffic Percent of ADT
January 4535 87 4413 85 February 4951 95 4721 91 March 4852 93 4695 90 April 5178 99 5070 97 May 5495 106 5443 105 June 5595 107 5485 105 July 5969 115 5970 115 August 6156 118 6144 118 September 5869 113 5801 111 October 5384 103 5278 101 November 5067 97 4881 94 December 4692 90 4569 88
Classification Breakdown Percent of ADT
Motorcyles 1.12 Passenger cars 53.85 Light Trucks 19.20 Buses 2.33 Single unit trucks (2 axles) 9.78 Single unit trucks (3 axles) 2.74 Single unit trucks (4 or more axles) 0.08 Single trailer trucks (4 or less axles) 2.83 Single trailer trucks (5 axles) 3.38 Single trailer trucks (6 or more axles) 2.07 Multi trailer trucks (5 or less axles) 0.32 Multi trailer trucks (6 axles) 0.31 Multi trailer trucks (7 or more axles) 1.99
Location: I-5; MP 145.39; PACIFIC HIGHWAY NO. 1; 5.06 miles north of OR99 Site Name: Oakland (10-007)
Installed: October, 1956
HISTORICAL TRAFFIC DATA
Percent of ADT
Year ADT Max Day
Max Hour
10TH Hour
20TH Hour
30TH Hour
2003 22896 167 13.5 11.9 11.2 10.9 2004 23093 166 13.8 11.6 10.7 10.5 2005 22935 166 14.6 12.2 11.0 10.5 2006 22734 *** *** *** *** *** 2007 22668 165 12.6 10.8 10.5 10.4 2008 20708 170 15.2 12.6 11.2 10.7 2009 21488 168 14.9 12.2 11.5 11.1 2010 21893 154 14.4 12.5 11.5 11.1 2011 21273 *** *** *** *** *** 2012 20930 165 14.2 12.6 11.4 11.2
HISTORICAL ADT BY YEAR
0
5000
10000
15000
20000
25000
03 04 05 06 07 08 09 10 11 12
Year
ADT
2012 TRAFFIC DATA
Average Weekday Traffic
Percent of ADT
Average Daily
Traffic Percent of ADT
January 16703 80 16583 79 February 17659 84 17696 85 March 18928 90 19382 93 April 19828 95 20242 97 May 20830 100 20861 100 June 23700 113 24014 115 July 24535 117 25379 121 August 24627 118 25391 121 September 21662 103 22008 105 October 19595 94 19973 95 November 20199 97 20523 98 December 18424 88 19106 91
Classification Breakdown Percent of ADT
Motorcyles 0.21 Passenger cars 52.23 Light Trucks 15.88 Buses 0.09 Single unit trucks (2 axles) 1.68 Single unit trucks (3 axles) 1.84 Single unit trucks (4 or more axles) 0.56 Single trailer trucks (4 or less axles) 0.16 Single trailer trucks (5 axles) 22.50 Single trailer trucks (6 or more axles) 2.82 Multi trailer trucks (5 or less axles) 0.32 Multi trailer trucks (6 axles) 0.38 Multi trailer trucks (7 or more axles) 1.33
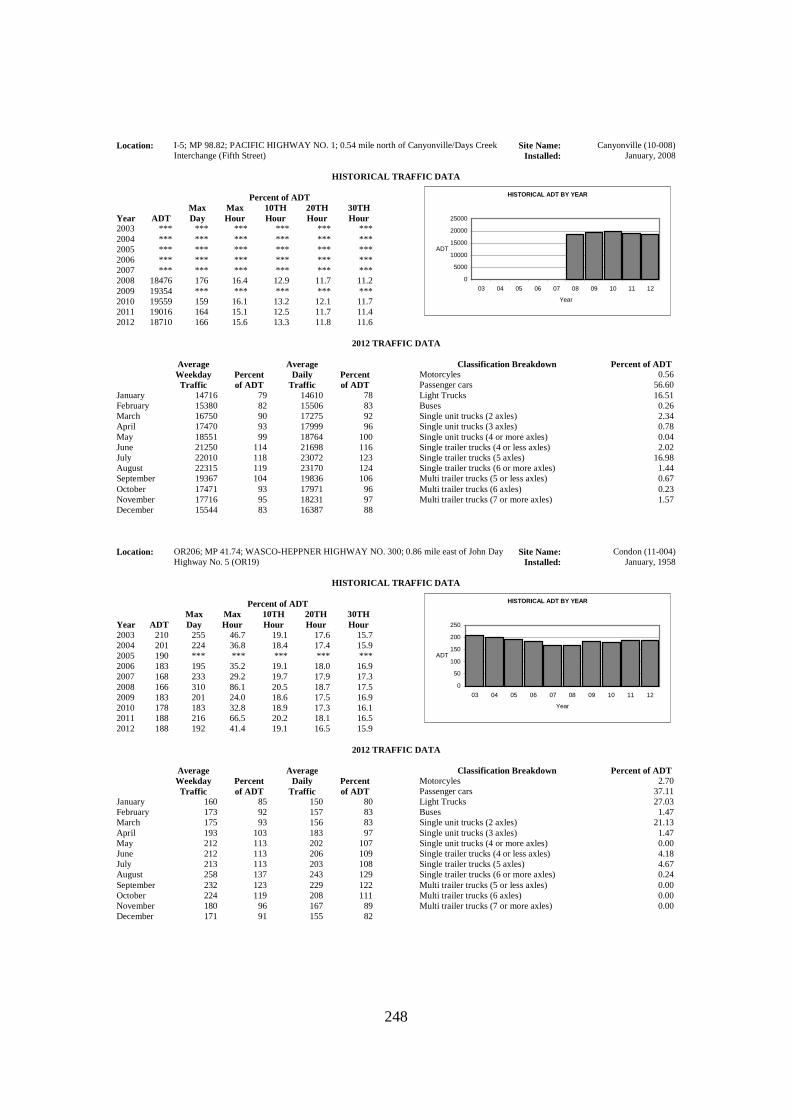
248
Location: I-5; MP 98.82; PACIFIC HIGHWAY NO. 1; 0.54 mile north of Canyonville/Days Creek Interchange (Fifth Street)
Site Name: Canyonville (10-008) Installed: January, 2008
HISTORICAL TRAFFIC DATA
Percent of ADT
Year ADT Max Day
Max Hour
10TH Hour
20TH Hour
30TH Hour
2003 *** *** *** *** *** *** 2004 *** *** *** *** *** *** 2005 *** *** *** *** *** *** 2006 *** *** *** *** *** *** 2007 *** *** *** *** *** *** 2008 18476 176 16.4 12.9 11.7 11.2 2009 19354 *** *** *** *** *** 2010 19559 159 16.1 13.2 12.1 11.7 2011 19016 164 15.1 12.5 11.7 11.4 2012 18710 166 15.6 13.3 11.8 11.6
HISTORICAL ADT BY YEAR
0
5000
10000
15000
20000
25000
03 04 05 06 07 08 09 10 11 12
Year
ADT
2012 TRAFFIC DATA
Average Weekday Traffic
Percent of ADT
Average Daily
Traffic Percent of ADT
January 14716 79 14610 78 February 15380 82 15506 83 March 16750 90 17275 92 April 17470 93 17999 96 May 18551 99 18764 100 June 21250 114 21698 116 July 22010 118 23072 123 August 22315 119 23170 124 September 19367 104 19836 106 October 17471 93 17971 96 November 17716 95 18231 97 December 15544 83 16387 88
Classification Breakdown Percent of ADT
Motorcyles 0.56 Passenger cars 56.60 Light Trucks 16.51 Buses 0.26 Single unit trucks (2 axles) 2.34 Single unit trucks (3 axles) 0.78 Single unit trucks (4 or more axles) 0.04 Single trailer trucks (4 or less axles) 2.02 Single trailer trucks (5 axles) 16.98 Single trailer trucks (6 or more axles) 1.44 Multi trailer trucks (5 or less axles) 0.67 Multi trailer trucks (6 axles) 0.23 Multi trailer trucks (7 or more axles) 1.57
Location: OR206; MP 41.74; WASCO-HEPPNER HIGHWAY NO. 300; 0.86 mile east of John Day
Highway No. 5 (OR19) Site Name: Condon (11-004)
Installed: January, 1958
HISTORICAL TRAFFIC DATA
Percent of ADT
Year ADT Max Day
Max Hour
10TH Hour
20TH Hour
30TH Hour
2003 210 255 46.7 19.1 17.6 15.7 2004 201 224 36.8 18.4 17.4 15.9 2005 190 *** *** *** *** *** 2006 183 195 35.2 19.1 18.0 16.9 2007 168 233 29.2 19.7 17.9 17.3 2008 166 310 86.1 20.5 18.7 17.5 2009 183 201 24.0 18.6 17.5 16.9 2010 178 183 32.8 18.9 17.3 16.1 2011 188 216 66.5 20.2 18.1 16.5 2012 188 192 41.4 19.1 16.5 15.9
HISTORICAL ADT BY YEAR
0
50
100
150
200
250
03 04 05 06 07 08 09 10 11 12
Year
ADT
2012 TRAFFIC DATA
Average Weekday Traffic
Percent of ADT
Average Daily
Traffic Percent of ADT
January 160 85 150 80 February 173 92 157 83 March 175 93 156 83 April 193 103 183 97 May 212 113 202 107 June 212 113 206 109 July 213 113 203 108 August 258 137 243 129 September 232 123 229 122 October 224 119 208 111 November 180 96 167 89 December 171 91 155 82
Classification Breakdown Percent of ADT
Motorcyles 2.70 Passenger cars 37.11 Light Trucks 27.03 Buses 1.47 Single unit trucks (2 axles) 21.13 Single unit trucks (3 axles) 1.47 Single unit trucks (4 or more axles) 0.00 Single trailer trucks (4 or less axles) 4.18 Single trailer trucks (5 axles) 4.67 Single trailer trucks (6 or more axles) 0.24 Multi trailer trucks (5 or less axles) 0.00 Multi trailer trucks (6 axles) 0.00 Multi trailer trucks (7 or more axles) 0.00
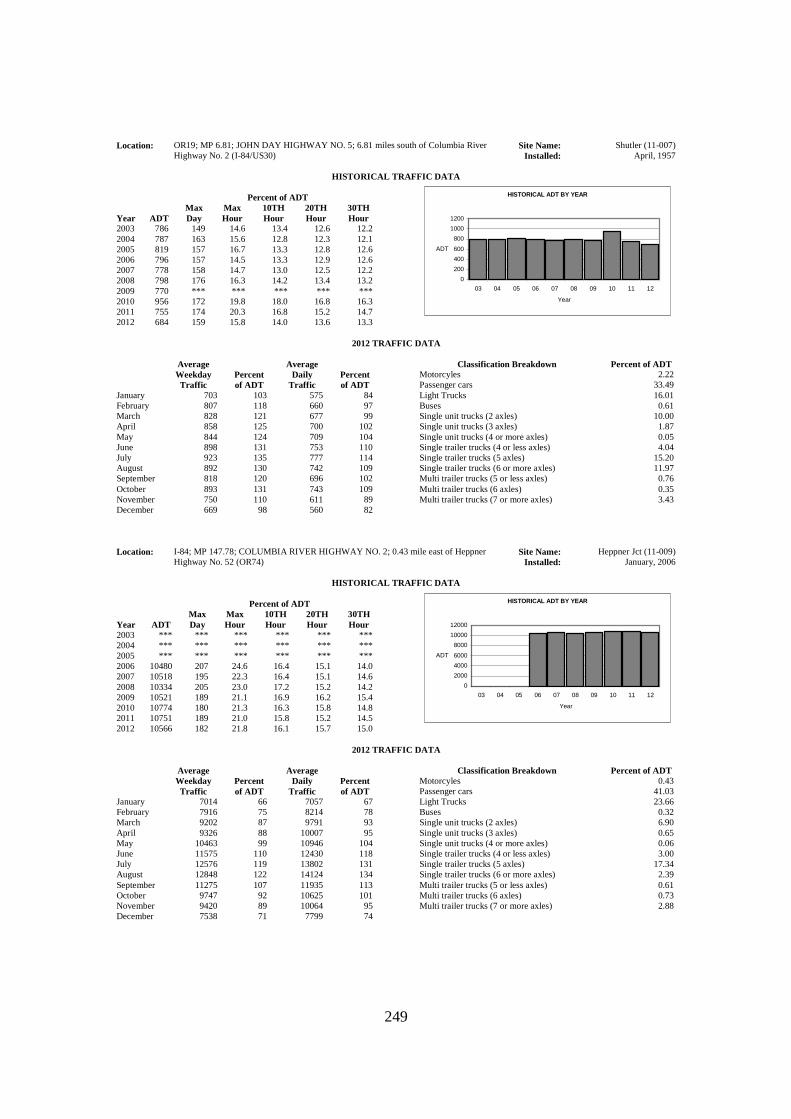
249
Location: OR19; MP 6.81; JOHN DAY HIGHWAY NO. 5; 6.81 miles south of Columbia River Highway No. 2 (I-84/US30)
Site Name: Shutler (11-007) Installed: April, 1957
HISTORICAL TRAFFIC DATA
Percent of ADT
Year ADT Max Day
Max Hour
10TH Hour
20TH Hour
30TH Hour
2003 786 149 14.6 13.4 12.6 12.2 2004 787 163 15.6 12.8 12.3 12.1 2005 819 157 16.7 13.3 12.8 12.6 2006 796 157 14.5 13.3 12.9 12.6 2007 778 158 14.7 13.0 12.5 12.2 2008 798 176 16.3 14.2 13.4 13.2 2009 770 *** *** *** *** *** 2010 956 172 19.8 18.0 16.8 16.3 2011 755 174 20.3 16.8 15.2 14.7 2012 684 159 15.8 14.0 13.6 13.3
HISTORICAL ADT BY YEAR
0
200
400
600
800
1000
1200
03 04 05 06 07 08 09 10 11 12
Year
ADT
2012 TRAFFIC DATA
Average Weekday Traffic
Percent of ADT
Average Daily
Traffic Percent of ADT
January 703 103 575 84 February 807 118 660 97 March 828 121 677 99 April 858 125 700 102 May 844 124 709 104 June 898 131 753 110 July 923 135 777 114 August 892 130 742 109 September 818 120 696 102 October 893 131 743 109 November 750 110 611 89 December 669 98 560 82
Classification Breakdown Percent of ADT
Motorcyles 2.22 Passenger cars 33.49 Light Trucks 16.01 Buses 0.61 Single unit trucks (2 axles) 10.00 Single unit trucks (3 axles) 1.87 Single unit trucks (4 or more axles) 0.05 Single trailer trucks (4 or less axles) 4.04 Single trailer trucks (5 axles) 15.20 Single trailer trucks (6 or more axles) 11.97 Multi trailer trucks (5 or less axles) 0.76 Multi trailer trucks (6 axles) 0.35 Multi trailer trucks (7 or more axles) 3.43
Location: I-84; MP 147.78; COLUMBIA RIVER HIGHWAY NO. 2; 0.43 mile east of Heppner
Highway No. 52 (OR74) Site Name: Heppner Jct (11-009)
Installed: January, 2006
HISTORICAL TRAFFIC DATA
Percent of ADT
Year ADT Max Day
Max Hour
10TH Hour
20TH Hour
30TH Hour
2003 *** *** *** *** *** *** 2004 *** *** *** *** *** *** 2005 *** *** *** *** *** *** 2006 10480 207 24.6 16.4 15.1 14.0 2007 10518 195 22.3 16.4 15.1 14.6 2008 10334 205 23.0 17.2 15.2 14.2 2009 10521 189 21.1 16.9 16.2 15.4 2010 10774 180 21.3 16.3 15.8 14.8 2011 10751 189 21.0 15.8 15.2 14.5 2012 10566 182 21.8 16.1 15.7 15.0
HISTORICAL ADT BY YEAR
0
2000
4000
6000
8000
10000
12000
03 04 05 06 07 08 09 10 11 12
Year
ADT
2012 TRAFFIC DATA
Average Weekday Traffic
Percent of ADT
Average Daily
Traffic Percent of ADT
January 7014 66 7057 67 February 7916 75 8214 78 March 9202 87 9791 93 April 9326 88 10007 95 May 10463 99 10946 104 June 11575 110 12430 118 July 12576 119 13802 131 August 12848 122 14124 134 September 11275 107 11935 113 October 9747 92 10625 101 November 9420 89 10064 95 December 7538 71 7799 74
Classification Breakdown Percent of ADT
Motorcyles 0.43 Passenger cars 41.03 Light Trucks 23.66 Buses 0.32 Single unit trucks (2 axles) 6.90 Single unit trucks (3 axles) 0.65 Single unit trucks (4 or more axles) 0.06 Single trailer trucks (4 or less axles) 3.00 Single trailer trucks (5 axles) 17.34 Single trailer trucks (6 or more axles) 2.39 Multi trailer trucks (5 or less axles) 0.61 Multi trailer trucks (6 axles) 0.73 Multi trailer trucks (7 or more axles) 2.88

250
Location: US26; MP 131.40; JOHN DAY HIGHWAY NO. 5; 1.05 miles east of Franks Creek Road in Dayville
Site Name: Dayville (12-003) Installed: October, 1957
HISTORICAL TRAFFIC DATA
Percent of ADT
Year ADT Max Day
Max Hour
10TH Hour
20TH Hour
30TH Hour
2003 1052 *** *** *** *** *** 2004 1031 *** *** *** *** *** 2005 997 222 32.4 19.1 17.3 16.5 2006 1017 254 22.6 18.8 17.2 16.4 2007 977 216 21.6 18.5 17.3 16.5 2008 887 214 22.4 17.6 16.1 15.6 2009 945 215 23.9 18.7 17.5 16.8 2010 956 212 20.7 18.3 17.1 16.4 2011 889 208 20.1 17.8 16.6 15.7 2012 869 194 19.7 18.0 17.2 16.2
HISTORICAL ADT BY YEAR
0
200
400
600
800
1000
1200
03 04 05 06 07 08 09 10 11 12
Year
ADT
2012 TRAFFIC DATA
Average Weekday Traffic
Percent of ADT
Average Daily
Traffic Percent of ADT
January 538 62 522 60 February 634 73 633 73 March 627 72 629 72 April 729 84 735 85 May 923 106 947 109 June 1062 122 1082 125 July 1112 128 1166 134 August 1117 129 1172 135 September 1146 132 1195 138 October 946 109 958 110 November 870 100 841 97 December 568 65 545 63
Classification Breakdown Percent of ADT
Motorcyles 1.15 Passenger cars 47.94 Light Trucks 21.02 Buses 1.70 Single unit trucks (2 axles) 15.27 Single unit trucks (3 axles) 0.60 Single unit trucks (4 or more axles) 0.00 Single trailer trucks (4 or less axles) 5.31 Single trailer trucks (5 axles) 2.96 Single trailer trucks (6 or more axles) 1.64 Multi trailer trucks (5 or less axles) 0.55 Multi trailer trucks (6 axles) 0.22 Multi trailer trucks (7 or more axles) 1.64
Location: US395; MP 89.80; PENDLETON-JOHN DAY HIGHWAY NO. 28; 0.62 mile south of
bridge over Long Creek Site Name: Long Creek (12-006)
Installed: October, 1957
HISTORICAL TRAFFIC DATA
Percent of ADT
Year ADT Max Day
Max Hour
10TH Hour
20TH Hour
30TH Hour
2003 508 *** *** *** *** *** 2004 485 197 19.0 15.7 14.6 13.8 2005 433 205 18.9 16.9 15.7 15.2 2006 402 *** *** *** *** *** 2007 405 190 23.9 19.5 17.5 16.8 2008 339 214 24.2 18.3 17.1 16.8 2009 364 240 25.8 20.1 17.9 17.3 2010 356 193 24.7 19.9 18.0 17.1 2011 342 198 23.7 18.4 17.6 16.7 2012 346 229 29.2 19.1 17.3 16.5
HISTORICAL ADT BY YEAR
0
100
200
300
400
500
600
03 04 05 06 07 08 09 10 11 12
Year
ADT
2012 TRAFFIC DATA
Average Weekday Traffic
Percent of ADT
Average Daily
Traffic Percent of ADT
January 213 62 205 59 February 235 68 235 68 March 256 74 255 74 April 292 84 297 86 May 373 108 395 114 June 436 126 451 130 July 463 134 480 139 August 445 129 470 136 September 455 132 480 139 October 361 104 386 112 November 288 83 297 86 December 193 56 200 58
Classification Breakdown Percent of ADT
Motorcyles 5.57 Passenger cars 34.89 Light Trucks 24.66 Buses 1.82 Single unit trucks (2 axles) 15.46 Single unit trucks (3 axles) 2.84 Single unit trucks (4 or more axles) 0.00 Single trailer trucks (4 or less axles) 6.02 Single trailer trucks (5 axles) 3.52 Single trailer trucks (6 or more axles) 4.77 Multi trailer trucks (5 or less axles) 0.34 Multi trailer trucks (6 axles) 0.00 Multi trailer trucks (7 or more axles) 0.11

251
Location: US26; MP 175.79; JOHN DAY HIGHWAY NO. 5; 0.53 mile east of Main Street in Prairie City
Site Name: Prairie City (12-009) Installed: January, 1981
HISTORICAL TRAFFIC DATA
Percent of ADT
Year ADT Max Day
Max Hour
10TH Hour
20TH Hour
30TH Hour
2003 1051 204 19.8 17.4 16.0 15.2 2004 1025 201 19.9 16.4 15.7 15.2 2005 966 211 20.4 17.3 15.6 15.0 2006 987 194 18.7 16.0 14.9 14.4 2007 943 194 25.2 17.4 16.1 15.4 2008 852 191 23.0 17.4 15.6 14.9 2009 913 187 19.3 17.3 16.5 15.8 2010 947 189 19.9 17.0 16.1 15.8 2011 862 186 22.1 16.9 15.9 15.7 2012 831 178 18.4 16.7 16.1 15.5
HISTORICAL ADT BY YEAR
0
200
400
600
800
1000
1200
03 04 05 06 07 08 09 10 11 12
Year
ADT
2012 TRAFFIC DATA
Average Weekday Traffic
Percent of ADT
Average Daily
Traffic Percent of ADT
January 515 62 506 61 February 586 71 578 70 March 599 72 611 74 April 676 81 705 85 May 882 106 928 112 June 1001 121 1041 125 July 1095 132 1124 135 August 1139 137 1149 138 September 1092 132 1142 137 October 894 108 901 108 November 724 87 725 87 December 561 68 556 67
Classification Breakdown Percent of ADT
Motorcyles 0.93 Passenger cars 44.39 Light Trucks 26.77 Buses 0.56 Single unit trucks (2 axles) 13.70 Single unit trucks (3 axles) 0.99 Single unit trucks (4 or more axles) 0.00 Single trailer trucks (4 or less axles) 6.05 Single trailer trucks (5 axles) 3.89 Single trailer trucks (6 or more axles) 1.05 Multi trailer trucks (5 or less axles) 0.31 Multi trailer trucks (6 axles) 0.06 Multi trailer trucks (7 or more axles) 1.30
Location: US395; MP 66.30; JOHN DAY-BURNS HIGHWAY NO. 48; 1.31 mile north of Central
Oregon Highway No. 7 (US20) Site Name: Burns (13-001)
Installed: January, 1958
HISTORICAL TRAFFIC DATA
Percent of ADT
Year ADT Max Day
Max Hour
10TH Hour
20TH Hour
30TH Hour
2003 578 189 18.2 15.9 14.9 14.5 2004 575 184 22.4 16.2 14.8 14.4 2005 516 180 20.9 16.3 15.3 14.5 2006 513 182 18.9 15.8 15.0 14.4 2007 522 182 20.7 17.1 16.3 15.7 2008 488 *** *** *** *** *** 2009 499 *** *** *** *** *** 2010 507 207 24.7 17.9 16.0 15.6 2011 454 175 18.7 16.1 15.2 14.7 2012 455 168 18.0 16.0 15.6 14.7
HISTORICAL ADT BY YEAR
0100200300400500600700
03 04 05 06 07 08 09 10 11 12
Year
ADT
2012 TRAFFIC DATA
Average Weekday Traffic
Percent of ADT
Average Daily
Traffic Percent of ADT
January 303 67 296 65 February 319 70 320 70 March 312 69 314 69 April 395 87 396 87 May 491 108 497 109 June 549 121 556 122 July 572 126 582 128 August 610 134 610 134 September 629 138 631 139 October 515 113 514 113 November 445 98 441 97 December 316 69 306 67
Classification Breakdown Percent of ADT
Motorcyles 4.02 Passenger cars 36.90 Light Trucks 27.20 Buses 1.09 Single unit trucks (2 axles) 17.39 Single unit trucks (3 axles) 1.09 Single unit trucks (4 or more axles) 0.17 Single trailer trucks (4 or less axles) 6.61 Single trailer trucks (5 axles) 3.43 Single trailer trucks (6 or more axles) 0.42 Multi trailer trucks (5 or less axles) 0.25 Multi trailer trucks (6 axles) 0.17 Multi trailer trucks (7 or more axles) 1.26

252
Location: US20; MP 126.60; CENTRAL OREGON HIGHWAY NO. 7; 0.04 mile northeast of Greenhouse Lane, southwest of Hines
Site Name: Hines (13-003) Installed: January, 1958
HISTORICAL TRAFFIC DATA
Percent of ADT
Year ADT Max Day
Max Hour
10TH Hour
20TH Hour
30TH Hour
2003 2391 169 15.8 13.8 13.1 12.8 2004 2378 164 15.3 13.2 12.7 12.5 2005 2308 180 15.6 13.9 13.3 13.0 2006 2295 180 15.0 13.8 13.3 12.9 2007 2378 169 18.5 14.3 13.8 13.4 2008 2109 169 16.7 14.9 14.2 13.7 2009 2190 173 16.2 14.4 14.0 13.5 2010 2185 171 17.1 14.7 14.1 13.8 2011 2088 174 16.0 14.6 14.0 13.7 2012 2069 166 16.6 14.5 14.2 14.1
HISTORICAL ADT BY YEAR
0
500
1000
1500
2000
2500
3000
03 04 05 06 07 08 09 10 11 12
Year
ADT
2012 TRAFFIC DATA
Average Weekday Traffic
Percent of ADT
Average Daily
Traffic Percent of ADT
January 1453 70 1377 67 February 1504 73 1422 69 March 1635 79 1628 79 April 1960 95 1898 92 May 2301 111 2216 107 June 2641 128 2590 125 July 2828 137 2865 138 August 2815 136 2805 136 September 2605 126 2546 123 October 2293 111 2226 108 November 1877 91 1841 89 December 1465 71 1418 69
Classification Breakdown Percent of ADT
Motorcyles 1.35 Passenger cars 44.75 Light Trucks 20.55 Buses 1.56 Single unit trucks (2 axles) 13.94 Single unit trucks (3 axles) 0.30 Single unit trucks (4 or more axles) 0.08 Single trailer trucks (4 or less axles) 6.80 Single trailer trucks (5 axles) 7.50 Single trailer trucks (6 or more axles) 1.20 Multi trailer trucks (5 or less axles) 0.44 Multi trailer trucks (6 axles) 0.30 Multi trailer trucks (7 or more axles) 1.23
Location: OR205; MP 0.01; FRENCHGLEN HIGHWAY NO. 440; 0.01 mile south of Steens
Highway No. 442 (OR78) Site Name: Frenchglen (13-005)
Installed: January, 2002
HISTORICAL TRAFFIC DATA
Percent of ADT
Year ADT Max Day
Max Hour
10TH Hour
20TH Hour
30TH Hour
2003 406 195 22.6 15.0 14.5 14.0 2004 403 225 33.5 16.9 14.9 14.1 2005 406 208 22.2 15.5 14.0 13.8 2006 434 204 25.1 15.2 14.5 13.8 2007 435 186 24.2 15.9 14.7 14.0 2008 421 175 17.8 15.4 14.2 13.8 2009 425 *** *** *** *** *** 2010 394 *** *** *** *** *** 2011 388 179 26.5 15.4 14.7 13.6 2012 391 177 21.7 15.6 14.6 14.1
HISTORICAL ADT BY YEAR
0
100
200
300
400
500
03 04 05 06 07 08 09 10 11 12
Year
ADT
2012 TRAFFIC DATA
Average Weekday Traffic
Percent of ADT
Average Daily
Traffic Percent of ADT
January 344 88 309 79 February 327 84 294 75 March 354 91 328 84 April 461 118 430 110 May 520 133 469 120 June 462 118 426 109 July 519 133 510 130 August 503 129 467 120 September 508 130 464 119 October 439 112 398 102 November 361 92 321 82 December 304 78 274 70
Classification Breakdown Percent of ADT
Motorcyles 0.67 Passenger cars 35.35 Light Trucks 28.41 Buses 1.53 Single unit trucks (2 axles) 19.73 Single unit trucks (3 axles) 1.05 Single unit trucks (4 or more axles) 0.00 Single trailer trucks (4 or less axles) 10.30 Single trailer trucks (5 axles) 0.95 Single trailer trucks (6 or more axles) 0.48 Multi trailer trucks (5 or less axles) 0.00 Multi trailer trucks (6 axles) 0.10 Multi trailer trucks (7 or more axles) 1.43

253
Location: OR78; MP 1.70; STEENS HIGHWAY NO. 442; 0.03 mile west of Frenchglen Highway No. 440 (OR205)
Site Name: Steens (13-007) Installed: January, 2002
HISTORICAL TRAFFIC DATA
Percent of ADT
Year ADT Max Day
Max Hour
10TH Hour
20TH Hour
30TH Hour
2003 1604 142 12.7 11.6 11.3 11.1 2004 1543 147 14.8 11.0 10.7 10.5 2005 1493 153 17.6 12.1 11.4 11.2 2006 1520 140 13.6 11.6 11.2 11.0 2007 1566 143 12.7 11.8 11.4 11.1 2008 1460 147 13.4 12.2 11.6 11.3 2009 1547 140 12.9 11.6 11.3 11.1 2010 1491 154 12.9 11.9 11.5 11.5 2011 1572 *** *** *** *** *** 2012 1491 *** *** *** *** ***
HISTORICAL ADT BY YEAR
0
500
1000
1500
2000
03 04 05 06 07 08 09 10 11 12
Year
ADT
2012 TRAFFIC DATA
Average Weekday Traffic
Percent of ADT
Average Daily
Traffic Percent of ADT
January 1312 88 1226 82 February 1339 90 1236 83 March 1381 93 1291 87 April 1599 107 1524 102 May 1719 115 1629 109 June 1667 112 1577 106 July 1710 115 1635 110 August 1692 114 1582 106 September 2114 142 2213 148 October 1725 116 1554 104 November 1382 93 1267 85 December 1241 83 1153 77
Classification Breakdown Percent of ADT
Motorcyles 1.33 Passenger cars 39.65 Light Trucks 25.93 Buses 0.90 Single unit trucks (2 axles) 19.69 Single unit trucks (3 axles) 0.62 Single unit trucks (4 or more axles) 0.03 Single trailer trucks (4 or less axles) 5.41 Single trailer trucks (5 axles) 3.65 Single trailer trucks (6 or more axles) 1.89 Multi trailer trucks (5 or less axles) 0.19 Multi trailer trucks (6 axles) 0.00 Multi trailer trucks (7 or more axles) 0.71
Location: OR35; MP 82.91; MT. HOOD HIGHWAY NO. 26; 2.12 miles south of Hood River
Highway No. 281 Site Name: Mt. Hood (14-003)
Installed: August, 1967
HISTORICAL TRAFFIC DATA
Percent of ADT
Year ADT Max Day
Max Hour
10TH Hour
20TH Hour
30TH Hour
2003 1162 408 44.2 31.2 28.2 25.7 2004 1097 274 69.2 24.8 23.4 22.2 2005 1063 *** *** *** *** *** 2006 1140 360 59.6 36.1 29.3 27.0 2007 1229 300 43.9 33.1 25.4 23.7 2008 1237 348 69.3 38.6 32.3 30.3 2009 1273 *** *** *** *** *** 2010 1275 305 47.6 30.8 23.5 21.3 2011 1167 319 64.8 30.4 25.5 23.2 2012 1213 346 62.6 33.5 25.4 23.7
HISTORICAL ADT BY YEAR
0200400600800
100012001400
03 04 05 06 07 08 09 10 11 12
Year
ADT
2012 TRAFFIC DATA
Average Weekday Traffic
Percent of ADT
Average Daily
Traffic Percent of ADT
January 903 74 1259 104 February 891 73 1391 115 March 935 77 1182 97 April 698 58 998 82 May 761 63 939 77 June 1005 83 1146 94 July 1417 117 1668 138 August 1428 118 1679 138 September 1166 96 1342 111 October 798 66 923 76 November 559 46 650 54 December 1063 88 1379 114
Classification Breakdown Percent of ADT
Motorcyles 2.60 Passenger cars 61.23 Light Trucks 16.34 Buses 1.36 Single unit trucks (2 axles) 6.59 Single unit trucks (3 axles) 2.15 Single unit trucks (4 or more axles) 0.03 Single trailer trucks (4 or less axles) 2.12 Single trailer trucks (5 axles) 3.32 Single trailer trucks (6 or more axles) 0.85 Multi trailer trucks (5 or less axles) 0.18 Multi trailer trucks (6 axles) 0.54 Multi trailer trucks (7 or more axles) 2.69

254
Location: I-84; MP 45.53; COLUMBIA RIVER HIGHWAY NO. 2; 0.20 mile east of East Cascade Locks Interchange
Site Name: Cascade Locks (14-004) Installed: November, 2010
HISTORICAL TRAFFIC DATA
Percent of ADT
Year ADT Max Day
Max Hour
10TH Hour
20TH Hour
30TH Hour
2003 *** *** *** *** *** *** 2004 *** *** *** *** *** *** 2005 *** *** *** *** *** *** 2006 *** *** *** *** *** *** 2007 *** *** *** *** *** *** 2008 *** *** *** *** *** *** 2009 *** *** *** *** *** *** 2010 *** *** *** *** *** *** 2011 20835 166 17.5 14.1 13.9 13.4 2012 20748 164 15.6 14.4 14.0 13.7
HISTORICAL ADT BY YEAR
0
5000
10000
15000
20000
25000
03 04 05 06 07 08 09 10 11 12
Year
ADT
2012 TRAFFIC DATA
Average Weekday Traffic
Percent of ADT
Average Daily
Traffic Percent of ADT
January 13730 66 14134 68 February 15726 76 16815 81 March 17253 83 18671 90 April 17699 85 19776 95 May 19604 94 21598 104 June 21154 102 23321 112 July 23657 114 26541 128 August 23870 115 26726 129 September 21500 104 23647 114 October 18819 91 21065 102 November 18039 87 19256 93 December 16219 78 17432 84
Classification Breakdown Percent of ADT
Motorcyles 0.07 Passenger cars 50.09 Light Trucks 22.84 Buses 0.21 Single unit trucks (2 axles) 2.74 Single unit trucks (3 axles) 0.57 Single unit trucks (4 or more axles) 0.04 Single trailer trucks (4 or less axles) 1.33 Single trailer trucks (5 axles) 13.60 Single trailer trucks (6 or more axles) 4.98 Multi trailer trucks (5 or less axles) 0.50 Multi trailer trucks (6 axles) 0.63 Multi trailer trucks (7 or more axles) 2.40
Location: I-5; MP 42.84; PACIFIC HIGHWAY NO. 1; 2.77 miles south of the Valley of the Rogue
Bridge Interchange Site Name: Gold Hill (15-001)
Installed: December, 1969
HISTORICAL TRAFFIC DATA
Percent of ADT
Year ADT Max Day
Max Hour
10TH Hour
20TH Hour
30TH Hour
2003 35124 141 11.0 10.0 9.8 9.7 2004 35489 132 11.4 9.7 9.6 9.4 2005 35401 *** *** *** *** *** 2006 35504 139 10.4 9.8 9.6 9.6 2007 35156 140 12.5 10.0 9.8 9.8 2008 32377 141 11.4 10.2 9.7 9.6 2009 33174 142 11.5 10.3 9.9 9.7 2010 34064 138 11.2 10.3 10.0 9.8 2011 32819 141 11.1 10.0 9.9 9.8 2012 32106 138 11.9 10.3 10.0 9.9
HISTORICAL ADT BY YEAR
0
10000
20000
30000
40000
03 04 05 06 07 08 09 10 11 12
Year
ADT
2012 TRAFFIC DATA
Average Weekday Traffic
Percent of ADT
Average Daily
Traffic Percent of ADT
January 28644 89 27337 85 February 29691 92 28703 89 March 30888 96 30016 93 April 32397 101 31461 98 May 33350 104 32547 101 June 36691 114 35775 111 July 37215 116 36767 115 August 37628 117 36968 115 September 34511 107 33535 104 October 32707 102 31784 99 November 32326 101 31232 97 December 29461 92 29141 91
Classification Breakdown Percent of ADT
Motorcyles 0.64 Passenger cars 49.60 Light Trucks 31.89 Buses 0.17 Single unit trucks (2 axles) 3.11 Single unit trucks (3 axles) 0.85 Single unit trucks (4 or more axles) 0.06 Single trailer trucks (4 or less axles) 1.16 Single trailer trucks (5 axles) 8.79 Single trailer trucks (6 or more axles) 1.90 Multi trailer trucks (5 or less axles) 0.22 Multi trailer trucks (6 axles) 0.22 Multi trailer trucks (7 or more axles) 1.39

255
Location: I-5; MP 11.03; PACIFIC HIGHWAY NO. 1; 0.86 mile south of Rogue Valley Highway No. 63 Interchange (OR99)
Site Name: Neil Creek (15-002) Installed: November, 1964
HISTORICAL TRAFFIC DATA
Percent of ADT
Year ADT Max Day
Max Hour
10TH Hour
20TH Hour
30TH Hour
2003 16100 *** *** *** *** *** 2004 15792 *** *** *** *** *** 2005 15799 *** *** *** *** *** 2006 15890 *** *** *** *** *** 2007 15821 *** *** *** *** *** 2008 14785 *** *** *** *** *** 2009 15052 176 17.4 13.6 12.7 12.2 2010 14937 171 17.8 14.1 13.1 12.7 2011 14664 177 16.7 13.1 12.6 12.2 2012 14280 172 24.3 14.5 13.1 12.6
HISTORICAL ADT BY YEAR
0
5000
10000
15000
20000
03 04 05 06 07 08 09 10 11 12
Year
ADT
2012 TRAFFIC DATA
Average Weekday Traffic
Percent of ADT
Average Daily
Traffic Percent of ADT
January 10615 74 10864 76 February 11153 78 11603 81 March 12131 85 13016 91 April 12836 90 13492 94 May 13941 98 14122 99 June 16484 115 17032 119 July 17481 122 18480 129 August 17077 120 17938 126 September 14577 102 14846 104 October 13035 91 13430 94 November 13433 94 13973 98 December 11872 83 12566 88
Classification Breakdown Percent of ADT
Motorcyles 0.69 Passenger cars 50.69 Light Trucks 10.39 Buses 0.19 Single unit trucks (2 axles) 1.68 Single unit trucks (3 axles) 0.54 Single unit trucks (4 or more axles) 0.01 Single trailer trucks (4 or less axles) 2.27 Single trailer trucks (5 axles) 30.05 Single trailer trucks (6 or more axles) 0.22 Multi trailer trucks (5 or less axles) 2.74 Multi trailer trucks (6 axles) 0.43 Multi trailer trucks (7 or more axles) 0.10
Location: OR66; MP 6.61; GREEN SPRINGS HIGHWAY NO. 21; 0.15 mile east of Siskiyou
Highway No. 273 (OR273) Site Name: Siskiyou Jct (15-007)
Installed: November, 1956
HISTORICAL TRAFFIC DATA
Percent of ADT
Year ADT Max Day
Max Hour
10TH Hour
20TH Hour
30TH Hour
2003 1210 166 14.8 14.0 13.2 12.7 2004 1165 151 16.1 14.1 13.4 13.0 2005 1100 152 17.7 14.1 13.3 13.0 2006 1034 189 18.3 15.8 14.7 14.0 2007 1030 167 17.6 14.4 13.9 13.4 2008 974 165 16.2 14.8 14.4 14.1 2009 1037 *** *** *** *** *** 2010 1013 186 19.5 16.7 15.4 14.8 2011 985 190 19.1 17.4 16.1 15.5 2012 979 195 19.7 17.1 16.3 15.6
HISTORICAL ADT BY YEAR
0200400600800
100012001400
03 04 05 06 07 08 09 10 11 12
Year
ADT
2012 TRAFFIC DATA
Average Weekday Traffic
Percent of ADT
Average Daily
Traffic Percent of ADT
January 703 72 691 71 February 696 71 714 73 March 695 71 716 73 April 828 85 911 93 May 1031 105 1110 113 June 1168 119 1218 124 July 1372 140 1448 148 August 1244 127 1335 136 September 1047 107 1125 115 October 956 98 981 100 November 824 84 821 84 December 686 70 682 70
Classification Breakdown Percent of ADT
Motorcyles 2.87 Passenger cars 65.61 Light Trucks 20.68 Buses 0.15 Single unit trucks (2 axles) 5.23 Single unit trucks (3 axles) 2.80 Single unit trucks (4 or more axles) 0.23 Single trailer trucks (4 or less axles) 1.67 Single trailer trucks (5 axles) 0.53 Single trailer trucks (6 or more axles) 0.23 Multi trailer trucks (5 or less axles) 0.00 Multi trailer trucks (6 axles) 0.00 Multi trailer trucks (7 or more axles) 0.00

256
Location: OR238; MP 24.94; JACKSONVILLE HIGHWAY NO. 272; 0.68 mile west of Applegate Road at Ruch
Site Name: Ruch (15-011) Installed: November, 1956
HISTORICAL TRAFFIC DATA
Percent of ADT
Year ADT Max Day
Max Hour
10TH Hour
20TH Hour
30TH Hour
2003 3216 126 15.4 11.8 11.3 10.9 2004 3148 132 15.3 11.4 10.7 10.5 2005 3028 136 13.7 12.2 11.4 11.1 2006 2959 *** *** *** *** *** 2007 2925 136 12.9 11.5 11.1 10.9 2008 2816 129 14.1 11.0 10.8 10.5 2009 2905 139 13.3 11.9 11.5 11.0 2010 2942 143 19.2 11.9 11.4 11.0 2011 2902 141 15.1 12.4 11.5 11.3 2012 2874 137 14.6 12.9 12.0 11.8
HISTORICAL ADT BY YEAR
0500
100015002000250030003500
03 04 05 06 07 08 09 10 11 12
Year
ADT
2012 TRAFFIC DATA
Average Weekday Traffic
Percent of ADT
Average Daily
Traffic Percent of ADT
January 2466 86 2372 83 February 2559 89 2505 87 March 2615 91 2532 88 April 2836 99 2838 99 May 3046 106 3094 108 June 3261 113 3287 114 July 3319 115 3366 117 August 3319 115 3322 116 September 3142 109 3153 110 October 3009 105 2949 103 November 2763 96 2659 93 December 2480 86 2408 84
Classification Breakdown Percent of ADT
Motorcyles 1.34 Passenger cars 64.95 Light Trucks 23.58 Buses 0.32 Single unit trucks (2 axles) 7.38 Single unit trucks (3 axles) 0.35 Single unit trucks (4 or more axles) 0.03 Single trailer trucks (4 or less axles) 1.43 Single trailer trucks (5 axles) 0.44 Single trailer trucks (6 or more axles) 0.12 Multi trailer trucks (5 or less axles) 0.00 Multi trailer trucks (6 axles) 0.06 Multi trailer trucks (7 or more axles) 0.00
Location: OR62; MP 15.46; CRATER LAKE HIGHWAY NO. 22; 1.83 miles north of Sams Valley
Highway No. 271 (OR234) Site Name: Shady Cove (15-013)
Installed: November, 1956
HISTORICAL TRAFFIC DATA
Percent of ADT
Year ADT Max Day
Max Hour
10TH Hour
20TH Hour
30TH Hour
2003 7849 143 14.0 12.2 11.5 11.1 2004 8087 141 12.7 11.6 11.1 10.9 2005 8001 144 13.2 12.4 11.2 10.8 2006 7881 140 13.7 11.6 11.2 10.7 2007 7727 136 14.4 11.6 11.1 10.8 2008 7244 140 14.1 12.1 11.5 11.2 2009 7361 146 15.2 12.7 12.1 11.5 2010 7474 150 14.3 12.7 11.7 11.3 2011 7214 141 14.0 12.6 12.2 11.3 2012 7159 144 13.9 12.9 11.9 11.4
HISTORICAL ADT BY YEAR
0
2000
4000
6000
8000
10000
03 04 05 06 07 08 09 10 11 12
Year
ADT
2012 TRAFFIC DATA
Average Weekday Traffic
Percent of ADT
Average Daily
Traffic Percent of ADT
January 5916 83 5705 80 February 6336 89 6165 86 March 6322 88 6187 86 April 6845 96 6849 96 May 7557 106 7628 107 June 8124 113 8213 115 July 8699 122 9052 126 August 8363 117 8768 122 September 7987 112 8018 112 October 7321 102 7140 100 November 6577 92 6280 88 December 6030 84 5898 82
Classification Breakdown Percent of ADT
Motorcyles 1.95 Passenger cars 60.38 Light Trucks 21.50 Buses 1.00 Single unit trucks (2 axles) 7.78 Single unit trucks (3 axles) 0.78 Single unit trucks (4 or more axles) 0.01 Single trailer trucks (4 or less axles) 3.98 Single trailer trucks (5 axles) 1.22 Single trailer trucks (6 or more axles) 0.85 Multi trailer trucks (5 or less axles) 0.16 Multi trailer trucks (6 axles) 0.06 Multi trailer trucks (7 or more axles) 0.33

257
Location: OR99; MP 15.93; ROGUE VALLEY HIGHWAY NO. 63; 0.33 mile northwest of Talent Avenue
Site Name: Talent (15-014) Installed: September, 1957
HISTORICAL TRAFFIC DATA
Percent of ADT
Year ADT Max Day
Max Hour
10TH Hour
20TH Hour
30TH Hour
2003 9661 135 13.1 10.8 10.3 10.1 2004 9364 140 14.2 10.8 10.2 10.0 2005 10472 *** *** *** *** *** 2006 9300 *** *** *** *** *** 2007 9317 *** *** *** *** *** 2008 8755 124 11.5 10.2 10.1 10.0 2009 9048 *** *** *** *** *** 2010 8847 126 13.2 10.3 10.2 10.0 2011 8741 124 13.3 10.4 10.2 10.1 2012 8428 131 14.0 11.7 10.7 10.5
HISTORICAL ADT BY YEAR
0
2000
4000
6000
8000
10000
12000
03 04 05 06 07 08 09 10 11 12
Year
ADT
2012 TRAFFIC DATA
Average Weekday Traffic
Percent of ADT
Average Daily
Traffic Percent of ADT
January 8435 100 7838 93 February 8881 105 8299 98 March 8798 104 8243 98 April 9364 111 8931 106 May 9433 112 8911 106 June 9801 116 9104 108 July 9321 111 8726 104 August 9161 109 8565 102 September 9218 109 8690 103 October 9089 108 8505 101 November 8425 100 7813 93 December 7846 93 7512 89
Classification Breakdown Percent of ADT
Motorcyles 0.22 Passenger cars 82.17 Light Trucks 15.21 Buses 0.13 Single unit trucks (2 axles) 1.64 Single unit trucks (3 axles) 0.18 Single unit trucks (4 or more axles) 0.04 Single trailer trucks (4 or less axles) 0.23 Single trailer trucks (5 axles) 0.09 Single trailer trucks (6 or more axles) 0.08 Multi trailer trucks (5 or less axles) 0.01 Multi trailer trucks (6 axles) 0.00 Multi trailer trucks (7 or more axles) 0.00
Location: OR62; MP 1.11; CRATER LAKE HIGHWAY NO. 22; 0.64 mile east of Pacific Highway
No. 1 (I-5) Site Name: North Medford (15-017)
Installed: July, 1995
HISTORICAL TRAFFIC DATA
Percent of ADT
Year ADT Max Day
Max Hour
10TH Hour
20TH Hour
30TH Hour
2003 37946 126 10.2 9.4 9.3 9.2 2004 38516 *** *** *** *** *** 2005 38483 *** *** *** *** *** 2006 38400 *** *** *** *** *** 2007 44222 *** *** *** *** *** 2008 42382 129 10.2 9.9 9.8 9.7 2009 41914 130 10.1 9.8 9.7 9.7 2010 42370 125 10.4 10.0 9.8 9.8 2011 42399 128 10.3 10.0 9.9 9.9 2012 41620 124 10.2 10.0 9.9 9.8
HISTORICAL ADT BY YEAR
0
10000
20000
30000
40000
50000
03 04 05 06 07 08 09 10 11 12
Year
ADT
2012 TRAFFIC DATA
Average Weekday Traffic
Percent of ADT
Average Daily
Traffic Percent of ADT
January 40220 97 39064 94 February 42521 102 41647 100 March 42133 101 41093 99 April 43912 106 42559 102 May 44086 106 43141 104 June 45649 110 44135 106 July 45247 109 43448 104 August 44578 107 42509 102 September 42392 102 40869 98 October 42038 101 40593 98 November 41217 99 39975 96 December 41012 99 40409 97
Classification Breakdown Percent of ADT
Motorcyles 0.44 Passenger cars 65.02 Light Trucks 31.04 Buses 0.20 Single unit trucks (2 axles) 1.66 Single unit trucks (3 axles) 0.19 Single unit trucks (4 or more axles) 0.03 Single trailer trucks (4 or less axles) 0.26 Single trailer trucks (5 axles) 0.98 Single trailer trucks (6 or more axles) 0.14 Multi trailer trucks (5 or less axles) 0.01 Multi trailer trucks (6 axles) 0.00 Multi trailer trucks (7 or more axles) 0.03

258
Location: I-5; MP 28.33; PACIFIC HIGHWAY NO. 1; 1.96 mile southeast of the South Medford Interchange
Site Name: Medford Viaduct (15-019) Installed: June, 1966
HISTORICAL TRAFFIC DATA
Percent of ADT
Year ADT Max Day
Max Hour
10TH Hour
20TH Hour
30TH Hour
2003 48817 *** *** *** *** *** 2004 49058 *** *** *** *** *** 2005 47242 137 10.7 9.4 9.3 9.1 2006 48225 132 10.2 9.6 9.5 9.4 2007 48188 132 10.4 9.6 9.5 9.4 2008 45926 131 10.4 9.5 9.4 9.3 2009 46362 *** *** *** *** *** 2010 45611 130 10.4 9.6 9.5 9.4 2011 44776 132 10.3 9.7 9.5 9.4 2012 45167 131 10.8 9.9 9.6 9.5
HISTORICAL ADT BY YEAR
0
10000
20000
30000
40000
50000
60000
03 04 05 06 07 08 09 10 11 12
Year
ADT
2012 TRAFFIC DATA
Average Weekday Traffic
Percent of ADT
Average Daily
Traffic Percent of ADT
January 41200 91 39000 86 February 43000 95 40000 89 March 44587 99 42419 94 April 47103 104 44602 99 May 48061 106 45563 101 June 50719 112 48206 107 July 51506 114 49125 109 August 52673 117 49873 110 September 50370 112 47626 105 October 49480 110 46726 103 November 48252 107 45462 101 December 44684 99 43402 96
Classification Breakdown Percent of ADT
Motorcyles 0.61 Passenger cars 67.53 Light Trucks 18.54 Buses 0.27 Single unit trucks (2 axles) 1.68 Single unit trucks (3 axles) 0.62 Single unit trucks (4 or more axles) 0.08 Single trailer trucks (4 or less axles) 1.03 Single trailer trucks (5 axles) 8.03 Single trailer trucks (6 or more axles) 0.58 Multi trailer trucks (5 or less axles) 0.53 Multi trailer trucks (6 axles) 0.21 Multi trailer trucks (7 or more axles) 0.29
Location: OR140; MP 16.03; LAKE OF THE WOODS HIGHWAY NO. 270; 1.27 miles east of
Lake Creek Loop (east junction) Site Name: Lake of the Woods
(15-020) Installed: June, 1966
HISTORICAL TRAFFIC DATA
Percent of ADT
Year ADT Max Day
Max Hour
10TH Hour
20TH Hour
30TH Hour
2003 2877 *** *** *** *** *** 2004 2921 *** *** *** *** *** 2005 2844 *** *** *** *** *** 2006 2807 *** *** *** *** *** 2007 2793 162 15.5 13.6 12.9 12.7 2008 2522 227 22.5 14.5 13.5 13.0 2009 2616 164 16.0 14.0 13.4 13.2 2010 2613 160 16.2 14.2 13.6 13.3 2011 2568 168 15.9 14.3 13.9 13.6 2012 2589 159 15.5 14.3 13.7 13.4
HISTORICAL ADT BY YEAR
0500
100015002000250030003500
03 04 05 06 07 08 09 10 11 12
Year
ADT
2012 TRAFFIC DATA
Average Weekday Traffic
Percent of ADT
Average Daily
Traffic Percent of ADT
January 1762 68 1862 72 February 1922 74 2069 80 March 1974 76 2056 79 April 2131 82 2305 89 May 2521 97 2738 106 June 2881 111 3059 118 July 3239 125 3479 134 August 3225 125 3518 136 September 2863 111 3066 118 October 2523 97 2725 105 November 2208 85 2224 86 December 1923 74 1971 76
Classification Breakdown Percent of ADT
Motorcyles 1.63 Passenger cars 46.93 Light Trucks 23.65 Buses 2.39 Single unit trucks (2 axles) 11.60 Single unit trucks (3 axles) 1.28 Single unit trucks (4 or more axles) 0.02 Single trailer trucks (4 or less axles) 7.27 Single trailer trucks (5 axles) 3.30 Single trailer trucks (6 or more axles) 0.62 Multi trailer trucks (5 or less axles) 0.77 Multi trailer trucks (6 axles) 0.15 Multi trailer trucks (7 or more axles) 0.39

259
Location: US97/US26 MP 97.11; THE DALLES-CALIFORNIA HIGHWAY NO. 4; 0.18 mile north of Madras-Prineville Highway No. 360 (US26)
Site Name: Madras (16-002) Installed: September, 1951
HISTORICAL TRAFFIC DATA
Percent of ADT
Year ADT Max Day
Max Hour
10TH Hour
20TH Hour
30TH Hour
2003 12726 168 13.7 12.5 11.9 11.6 2004 13143 159 12.8 11.7 11.5 11.1 2005 12936 157 13.0 11.9 11.3 11.1 2006 13186 154 12.4 11.6 11.3 11.0 2007 13447 154 12.4 11.6 11.2 11.1 2008 12266 151 13.3 11.8 11.5 11.3 2009 12428 159 13.1 11.9 11.8 11.6 2010 12554 153 12.7 12.3 11.8 11.6 2011 12246 162 13.3 12.3 11.9 11.7 2012 12381 157 13.4 12.2 11.9 11.8
HISTORICAL ADT BY YEAR
0
5000
10000
15000
03 04 05 06 07 08 09 10 11 12
Year
ADT
2012 TRAFFIC DATA
Average Weekday Traffic
Percent of ADT
Average Daily
Traffic Percent of ADT
January 9596 77 9420 76 February 10667 86 10644 86 March 10982 89 11082 90 April 11897 96 12104 98 May 12926 104 13251 107 June 13884 112 14268 115 July 14505 117 15149 122 August 14421 116 15190 123 September 13406 108 13685 111 October 12244 99 12396 100 November 11297 91 11147 90 December 10227 83 10243 83
Classification Breakdown Percent of ADT
Motorcyles 0.51 Passenger cars 28.06 Light Trucks 53.30 Buses 0.42 Single unit trucks (2 axles) 4.41 Single unit trucks (3 axles) 0.57 Single unit trucks (4 or more axles) 0.19 Single trailer trucks (4 or less axles) 1.21 Single trailer trucks (5 axles) 7.76 Single trailer trucks (6 or more axles) 1.46 Multi trailer trucks (5 or less axles) 0.11 Multi trailer trucks (6 axles) 0.02 Multi trailer trucks (7 or more axles) 1.98
Location: US26; MP 113.17; WARM SPRINGS HIGHWAY NO. 53; 4.54 miles northwest of The
Dalles-California Highway No. 4 (US97) Site Name: Warm Springs (16-006)
Installed: January, 1958
HISTORICAL TRAFFIC DATA
Percent of ADT
Year ADT Max Day
Max Hour
10TH Hour
20TH Hour
30TH Hour
2003 7193 213 18.1 16.8 15.7 15.1 2004 7125 180 16.9 14.8 13.7 13.3 2005 7026 189 17.5 14.6 14.0 13.5 2006 6981 190 18.4 15.3 13.9 13.5 2007 6967 191 17.7 15.5 14.5 13.8 2008 6428 187 18.5 15.5 14.8 14.2 2009 6579 192 18.2 15.7 15.1 14.5 2010 6838 184 18.5 15.9 15.0 14.5 2011 6779 183 18.4 15.9 15.0 14.5 2012 7015 187 17.8 16.1 14.9 14.7
HISTORICAL ADT BY YEAR
0
2000
4000
6000
8000
03 04 05 06 07 08 09 10 11 12
Year
ADT
2012 TRAFFIC DATA
Average Weekday Traffic
Percent of ADT
Average Daily
Traffic Percent of ADT
January 5002 71 5082 72 February 5762 82 6057 86 March 5614 80 6025 86 April 6193 88 6662 95 May 7006 100 7581 108 June 7482 107 8096 115 July 8151 116 8977 128 August 8290 118 9171 131 September 7490 107 8035 115 October 6428 92 6867 98 November 5895 84 6039 86 December 5398 77 5592 80
Classification Breakdown Percent of ADT
Motorcyles 0.42 Passenger cars 30.04 Light Trucks 54.48 Buses 0.92 Single unit trucks (2 axles) 3.63 Single unit trucks (3 axles) 0.76 Single unit trucks (4 or more axles) 0.23 Single trailer trucks (4 or less axles) 0.87 Single trailer trucks (5 axles) 4.91 Single trailer trucks (6 or more axles) 1.29 Multi trailer trucks (5 or less axles) 0.34 Multi trailer trucks (6 axles) 0.16 Multi trailer trucks (7 or more axles) 1.95

260
Location: I-5; MP 64.20; PACIFIC HIGHWAY NO. 1; 2.08 miles south of Monument Drive (Jump Off Joe) Interchange
Site Name: Grave Creek (17-001) Installed: January, 1938
HISTORICAL TRAFFIC DATA
Percent of ADT
Year ADT Max Day
Max Hour
10TH Hour
20TH Hour
30TH Hour
2003 21819 167 14.5 12.2 11.3 11.1 2004 22249 162 14.3 11.8 10.8 10.5 2005 22251 *** *** *** *** *** 2006 22138 159 15.2 11.4 11.1 10.8 2007 21644 164 14.1 11.8 11.0 10.8 2008 19810 170 15.4 12.4 11.4 10.8 2009 20560 *** *** *** *** *** 2010 20688 158 16.1 13.0 11.9 11.4 2011 20074 161 14.8 12.2 11.5 11.2 2012 19690 164 15.5 12.9 11.7 11.3
HISTORICAL ADT BY YEAR
0
5000
10000
15000
20000
25000
03 04 05 06 07 08 09 10 11 12
Year
ADT
2012 TRAFFIC DATA
Average Weekday Traffic
Percent of ADT
Average Daily
Traffic Percent of ADT
January 15722 80 15572 79 February 16397 83 16488 84 March 17795 90 18309 93 April 18550 94 19016 97 May 19575 99 19779 100 June 22207 113 22652 115 July 23097 117 24062 122 August 23072 117 23901 121 September 20382 104 20808 106 October 18522 94 18971 96 November 18898 96 19324 98 December 16622 84 17398 88
Classification Breakdown Percent of ADT
Motorcyles 0.48 Passenger cars 59.26 Light Trucks 16.99 Buses 0.19 Single unit trucks (2 axles) 2.26 Single unit trucks (3 axles) 0.61 Single unit trucks (4 or more axles) 0.01 Single trailer trucks (4 or less axles) 2.34 Single trailer trucks (5 axles) 14.06 Single trailer trucks (6 or more axles) 0.66 Multi trailer trucks (5 or less axles) 0.47 Multi trailer trucks (6 axles) 0.27 Multi trailer trucks (7 or more axles) 2.40
Location: US199; MP 41.32; REDWOOD HIGHWAY NO. 25; 0.37 mile north of Oregon-
California State Line Site Name: O'Brien (17-003)
Installed: November, 1956
HISTORICAL TRAFFIC DATA
Percent of ADT
Year ADT Max Day
Max Hour
10TH Hour
20TH Hour
30TH Hour
2003 2950 229 23.8 19.3 18.0 17.2 2004 3010 247 22.7 19.3 17.8 17.3 2005 2934 204 30.7 19.1 17.8 17.4 2006 2893 210 22.8 18.1 17.4 16.9 2007 2882 195 20.9 18.3 17.2 16.7 2008 2700 223 23.7 19.3 18.1 17.1 2009 2870 *** *** *** *** *** 2010 2893 240 27.1 19.3 18.2 17.4 2011 2761 199 22.0 18.5 17.7 17.1 2012 2774 197 21.7 18.7 18.0 17.4
HISTORICAL ADT BY YEAR
0500
100015002000250030003500
03 04 05 06 07 08 09 10 11 12
Year
ADT
2012 TRAFFIC DATA
Average Weekday Traffic
Percent of ADT
Average Daily
Traffic Percent of ADT
January 1705 61 1828 66 February 1862 67 2098 76 March 1920 69 2126 77 April 2064 74 2353 85 May 2511 91 2867 103 June 3056 110 3303 119 July 3853 139 4228 152 August 3855 139 4323 156 September 3131 113 3389 122 October 2307 83 2524 91 November 2135 77 2255 81 December 1792 65 1992 72
Classification Breakdown Percent of ADT
Motorcyles 2.34 Passenger cars 65.16 Light Trucks 15.51 Buses 1.44 Single unit trucks (2 axles) 6.39 Single unit trucks (3 axles) 0.08 Single unit trucks (4 or more axles) 0.04 Single trailer trucks (4 or less axles) 3.84 Single trailer trucks (5 axles) 4.51 Single trailer trucks (6 or more axles) 0.04 Multi trailer trucks (5 or less axles) 0.57 Multi trailer trucks (6 axles) 0.07 Multi trailer trucks (7 or more axles) 0.01

261
Location: US199; MP 4.68; REDWOOD HIGHWAY NO. 25; 0.50 mile east of Redwood Avenue Site Name: Timber Ridge (17-005) Installed: October, 2001
HISTORICAL TRAFFIC DATA
Percent of ADT
Year ADT Max Day
Max Hour
10TH Hour
20TH Hour
30TH Hour
2003 11737 140 11.5 10.4 10.1 9.9 2004 11860 138 11.2 10.3 10.0 9.8 2005 11725 145 11.4 10.4 10.0 9.9 2006 11561 133 10.9 10.1 10.0 9.8 2007 11422 134 10.8 10.3 10.2 10.0 2008 10553 143 11.5 10.7 10.3 10.2 2009 10927 135 11.6 10.8 10.5 10.3 2010 10954 135 12.3 10.8 10.5 10.4 2011 10453 142 13.2 10.9 10.4 10.3 2012 10310 134 12.6 10.8 10.6 10.5
HISTORICAL ADT BY YEAR
02000400060008000
100001200014000
03 04 05 06 07 08 09 10 11 12
Year
ADT
2012 TRAFFIC DATA
Average Weekday Traffic
Percent of ADT
Average Daily
Traffic Percent of ADT
January 9111 88 8675 84 February 9769 95 9433 91 March 9699 94 9350 91 April 10095 98 9888 96 May 10769 104 10693 104 June 11448 111 11201 109 July 12475 121 12393 120 August 12358 120 12373 120 September 11429 111 11155 108 October 10598 103 10263 100 November 9944 96 9502 92 December 9035 88 8790 85
Classification Breakdown Percent of ADT
Motorcyles 1.69 Passenger cars 33.75 Light Trucks 56.32 Buses 0.13 Single unit trucks (2 axles) 4.00 Single unit trucks (3 axles) 0.70 Single unit trucks (4 or more axles) 0.08 Single trailer trucks (4 or less axles) 1.02 Single trailer trucks (5 axles) 2.01 Single trailer trucks (6 or more axles) 0.19 Multi trailer trucks (5 or less axles) 0.00 Multi trailer trucks (6 axles) 0.00 Multi trailer trucks (7 or more axles) 0.11
Location: US97; MP 204.65; THE DALLES-CALIFORNIA HIGHWAY NO. 4; 0.40 mile south of
Chemult Dump Road Site Name: Chemult (18-006)
Installed: December, 1956
HISTORICAL TRAFFIC DATA
Percent of ADT
Year ADT Max Day
Max Hour
10TH Hour
20TH Hour
30TH Hour
2003 5056 183 17.2 14.6 14.3 13.9 2004 5008 170 17.0 15.1 14.2 13.7 2005 4901 190 22.4 15.8 15.0 14.4 2006 4763 177 16.4 15.1 14.6 14.3 2007 4890 181 21.4 15.8 15.1 14.6 2008 4374 193 18.1 16.9 16.0 15.3 2009 4588 *** *** *** *** *** 2010 4797 186 18.4 17.0 16.4 15.9 2011 4646 193 17.9 16.9 16.0 15.5 2012 4587 182 18.8 16.9 16.2 15.8
HISTORICAL ADT BY YEAR
0
1000
2000
3000
4000
5000
6000
03 04 05 06 07 08 09 10 11 12
Year
ADT
2012 TRAFFIC DATA
Average Weekday Traffic
Percent of ADT
Average Daily
Traffic Percent of ADT
January 2806 61 2835 62 February 3160 69 3211 70 March 3236 71 3388 74 April 3824 83 4006 87 May 4736 103 4834 105 June 5472 119 5844 127 July 6125 134 6721 147 August 6171 135 6740 147 September 5615 122 5931 129 October 4529 99 4750 104 November 3810 83 3906 85 December 2803 61 2872 63
Classification Breakdown Percent of ADT
Motorcyles 0.78 Passenger cars 36.38 Light Trucks 24.85 Buses 0.33 Single unit trucks (2 axles) 8.95 Single unit trucks (3 axles) 0.40 Single unit trucks (4 or more axles) 0.00 Single trailer trucks (4 or less axles) 3.38 Single trailer trucks (5 axles) 21.45 Single trailer trucks (6 or more axles) 1.20 Multi trailer trucks (5 or less axles) 0.33 Multi trailer trucks (6 axles) 0.40 Multi trailer trucks (7 or more axles) 1.55

262
Location: OR140; MP 44.92; KLAMATH FALLS-LAKEVIEW HIGHWAY NO. 20; 4.14 miles east of Yellow Jacket Springs Rd at Beatty
Site Name: Beatty (18-017) Installed: January, 1958
HISTORICAL TRAFFIC DATA
Percent of ADT
Year ADT Max Day
Max Hour
10TH Hour
20TH Hour
30TH Hour
2003 1163 196 16.6 13.8 12.7 12.5 2004 1191 182 30.8 13.5 12.7 12.3 2005 1095 183 15.5 13.6 13.1 12.6 2006 997 183 16.2 14.0 13.3 12.7 2007 991 179 16.3 14.3 13.2 12.9 2008 884 173 17.9 13.9 13.2 12.9 2009 962 *** *** *** *** *** 2010 1004 *** *** *** *** *** 2011 1032 *** *** *** *** *** 2012 877 *** *** *** *** ***
HISTORICAL ADT BY YEAR
0200400600800
100012001400
03 04 05 06 07 08 09 10 11 12
Year
ADT
2012 TRAFFIC DATA
Average Weekday Traffic
Percent of ADT
Average Daily
Traffic Percent of ADT
January 646 74 620 71 February 650 74 643 73 March 642 73 629 72 April 756 86 745 85 May 928 106 926 106 June 1050 120 1095 125 July 1190 136 1180 135 August 1200 137 1182 135 September 1150 131 1150 131 October 1000 114 1000 114 November 762 87 736 84 December 640 73 621 71
Classification Breakdown Percent of ADT
Motorcyles 1.98 Passenger cars 43.11 Light Trucks 25.51 Buses 0.95 Single unit trucks (2 axles) 16.01 Single unit trucks (3 axles) 0.74 Single unit trucks (4 or more axles) 0.00 Single trailer trucks (4 or less axles) 6.96 Single trailer trucks (5 axles) 3.78 Single trailer trucks (6 or more axles) 0.39 Multi trailer trucks (5 or less axles) 0.35 Multi trailer trucks (6 axles) 0.04 Multi trailer trucks (7 or more axles) 0.18
Location: OR39/US97Bus MP -4.08; KLAMATH FALLS-MALIN HIGHWAY NO. 50; 0.46 mile
south of Main Street Site Name: Klamath Falls (18-018)
Installed: November, 1999
HISTORICAL TRAFFIC DATA
Percent of ADT
Year ADT Max Day
Max Hour
10TH Hour
20TH Hour
30TH Hour
2003 23385 127 10.5 10.3 10.1 10.0 2004 23432 125 10.5 10.1 10.0 9.9 2005 24085 129 11.0 10.4 10.3 10.1 2006 23202 *** *** *** *** *** 2007 24757 131 11.6 10.6 10.5 10.4 2008 23409 131 10.8 10.4 10.3 10.2 2009 22965 128 12.6 10.2 10.1 10.0 2010 22496 130 10.8 10.4 10.3 10.2 2011 21520 127 11.1 10.4 10.3 10.2 2012 21163 130 10.8 10.3 10.3 10.2
HISTORICAL ADT BY YEAR
0
5000
10000
15000
20000
25000
30000
03 04 05 06 07 08 09 10 11 12
Year
ADT
2012 TRAFFIC DATA
Average Weekday Traffic
Percent of ADT
Average Daily
Traffic Percent of ADT
January 22646 107 20270 96 February 23264 110 21170 100 March 22294 105 20213 96 April 24520 116 22216 105 May 24444 116 22373 106 June 24257 115 22302 105 July 23041 109 21048 99 August 23519 111 21233 100 September 23735 112 21704 103 October 24492 116 22351 106 November 22891 108 20657 98 December 20310 96 18422 87
Classification Breakdown Percent of ADT
Motorcyles 0.81 Passenger cars 70.34 Light Trucks 25.17 Buses 0.33 Single unit trucks (2 axles) 1.96 Single unit trucks (3 axles) 0.24 Single unit trucks (4 or more axles) 0.02 Single trailer trucks (4 or less axles) 0.26 Single trailer trucks (5 axles) 0.71 Single trailer trucks (6 or more axles) 0.10 Multi trailer trucks (5 or less axles) 0.00 Multi trailer trucks (6 axles) 0.00 Multi trailer trucks (7 or more axles) 0.06

263
Location: US97; MP 291.73; THE DALLES-CALIFORNIA HIGHWAY NO. 4; At the Oregon-California State Line
Site Name: Midland (18-019) Installed: January, 1955
HISTORICAL TRAFFIC DATA
Percent of ADT
Year ADT Max Day
Max Hour
10TH Hour
20TH Hour
30TH Hour
2003 3869 159 14.3 12.4 11.7 11.3 2004 3884 154 13.3 12.3 11.5 11.2 2005 3901 170 20.1 13.0 12.1 11.8 2006 3786 169 16.7 12.1 11.5 11.3 2007 3755 147 14.0 12.2 11.8 11.5 2008 3402 159 15.1 13.0 12.1 11.7 2009 3550 157 14.5 12.9 12.2 11.8 2010 3574 *** *** *** *** *** 2011 3599 175 14.8 12.6 12.1 11.9 2012 3504 150 13.6 12.7 12.1 11.9
HISTORICAL ADT BY YEAR
0
1000
2000
3000
4000
5000
03 04 05 06 07 08 09 10 11 12
Year
ADT
2012 TRAFFIC DATA
Average Weekday Traffic
Percent of ADT
Average Daily
Traffic Percent of ADT
January 2483 71 2453 70 February 2645 75 2673 76 March 2730 78 2802 80 April 3253 93 3313 95 May 3736 107 3728 106 June 4169 119 4260 122 July 4381 125 4632 132 August 4291 122 4449 127 September 3985 114 4019 115 October 3833 109 3828 109 November 3386 97 3377 96 December 2499 71 2511 72
Classification Breakdown Percent of ADT
Motorcyles 1.46 Passenger cars 43.12 Light Trucks 14.07 Buses 2.40 Single unit trucks (2 axles) 7.32 Single unit trucks (3 axles) 0.94 Single unit trucks (4 or more axles) 0.02 Single trailer trucks (4 or less axles) 4.40 Single trailer trucks (5 axles) 24.89 Single trailer trucks (6 or more axles) 0.80 Multi trailer trucks (5 or less axles) 0.33 Multi trailer trucks (6 axles) 0.25 Multi trailer trucks (7 or more axles) 0.00
Location: OR39; MP 16.15; KLAMATH FALLS-MALIN HIGHWAY NO. 50; 0.36 mile west of
Hatfield Highway No. 426 (OR39) Site Name: Merrill (18-020)
Installed: January, 1958
HISTORICAL TRAFFIC DATA
Percent of ADT
Year ADT Max Day
Max Hour
10TH Hour
20TH Hour
30TH Hour
2003 4330 219 19.1 13.5 11.7 10.5 2004 4336 207 17.2 13.6 11.8 10.9 2005 4221 *** *** *** *** *** 2006 4085 240 19.3 14.5 12.2 10.6 2007 4237 245 20.7 13.7 12.6 10.8 2008 4049 250 20.6 14.4 12.7 10.7 2009 4168 247 20.1 14.8 12.7 11.6 2010 4175 243 20.1 15.5 13.3 11.6 2011 4018 213 17.0 14.1 12.2 10.9 2012 3889 212 17.0 13.8 11.5 11.0
HISTORICAL ADT BY YEAR
0
1000
2000
3000
4000
5000
03 04 05 06 07 08 09 10 11 12
Year
ADT
2012 TRAFFIC DATA
Average Weekday Traffic
Percent of ADT
Average Daily
Traffic Percent of ADT
January 3301 85 3098 80 February 3543 91 3343 86 March 3634 93 3480 89 April 4103 105 3977 102 May 4411 113 4225 109 June 4410 113 4292 110 July 4442 114 4338 112 August 4500 116 4345 112 September 4637 119 4701 121 October 4318 111 4145 107 November 3757 97 3567 92 December 3336 86 3159 81
Classification Breakdown Percent of ADT
Motorcyles 0.27 Passenger cars 54.94 Light Trucks 21.73 Buses 1.05 Single unit trucks (2 axles) 10.67 Single unit trucks (3 axles) 1.07 Single unit trucks (4 or more axles) 0.01 Single trailer trucks (4 or less axles) 4.22 Single trailer trucks (5 axles) 4.42 Single trailer trucks (6 or more axles) 0.27 Multi trailer trucks (5 or less axles) 0.70 Multi trailer trucks (6 axles) 0.52 Multi trailer trucks (7 or more axles) 0.13

264
Location: OR62; MP 91.10; CRATER LAKE HIGHWAY NO. 22; 0.28 mile northwest of Sun Mountain Road
Site Name: Fort Klamath (18-021) Installed: January, 1958
HISTORICAL TRAFFIC DATA
Percent of ADT
Year ADT Max Day
Max Hour
10TH Hour
20TH Hour
30TH Hour
2003 497 323 32.4 26.2 23.8 22.8 2004 521 288 30.5 24.8 23.4 22.3 2005 502 *** *** *** *** *** 2006 485 377 35.7 27.7 26.0 23.7 2007 480 316 31.1 27.5 25.2 23.8 2008 351 415 43.3 32.5 29.6 27.9 2009 470 280 32.5 27.4 24.5 23.0 2010 465 305 32.0 27.7 26.0 25.4 2011 437 377 56.5 30.4 28.2 26.1 2012 429 356 36.8 29.8 26.6 24.9
HISTORICAL ADT BY YEAR
0
100
200
300
400
500
600
03 04 05 06 07 08 09 10 11 12
Year
ADT
* Construction near ATR during 2008 count season. 2012 TRAFFIC DATA
Average Weekday Traffic
Percent of ADT
Average Daily
Traffic Percent of ADT
January 151 35 163 38 February 155 36 166 39 March 158 37 159 37 April 206 48 227 53 May 442 103 487 114 June 627 146 652 152 July 838 195 904 211 August 816 190 882 206 September 713 166 746 174 October 374 87 388 90 November 200 47 209 49 December 163 38 164 38
Classification Breakdown Percent of ADT
Motorcyles 1.80 Passenger cars 67.55 Light Trucks 19.10 Buses 0.15 Single unit trucks (2 axles) 8.84 Single unit trucks (3 axles) 0.38 Single unit trucks (4 or more axles) 0.00 Single trailer trucks (4 or less axles) 1.72 Single trailer trucks (5 axles) 0.23 Single trailer trucks (6 or more axles) 0.00 Multi trailer trucks (5 or less axles) 0.15 Multi trailer trucks (6 axles) 0.00 Multi trailer trucks (7 or more axles) 0.08
Location: US97; MP 254.30; THE DALLES-CALIFORNIA HIGHWAY NO. 4; 3.53 miles north of
Modoc Point Road Site Name: Modoc Point (18-022)
Installed: January, 2001
HISTORICAL TRAFFIC DATA
Percent of ADT
Year ADT Max Day
Max Hour
10TH Hour
20TH Hour
30TH Hour
2003 6109 153 12.4 11.5 11.1 10.9 2004 6092 149 13.5 11.6 11.0 10.8 2005 6226 165 13.5 11.7 11.3 11.1 2006 6155 160 12.7 11.7 11.2 11.0 2007 6079 148 13.0 11.3 11.1 10.9 2008 5346 154 13.0 11.7 11.5 11.3 2009 5569 153 14.0 12.2 11.8 11.6 2010 5599 160 13.4 12.5 12.2 11.9 2011 5395 170 14.2 12.4 11.9 11.6 2012 5281 161 13.4 12.8 12.2 11.8
HISTORICAL ADT BY YEAR
01000200030004000500060007000
03 04 05 06 07 08 09 10 11 12
Year
ADT
2012 TRAFFIC DATA
Average Weekday Traffic
Percent of ADT
Average Daily
Traffic Percent of ADT
January 3948 75 3834 73 February 4238 80 4173 79 March 4297 81 4331 82 April 5045 96 4975 94 May 5701 108 5613 106 June 6244 118 6389 121 July 6558 124 6846 130 August 6579 125 6836 129 September 6217 118 6215 118 October 5421 103 5417 103 November 4981 94 4869 92 December 3977 75 3872 73
Classification Breakdown Percent of ADT
Motorcyles 1.50 Passenger cars 50.33 Light Trucks 13.69 Buses 3.25 Single unit trucks (2 axles) 7.86 Single unit trucks (3 axles) 1.05 Single unit trucks (4 or more axles) 0.05 Single trailer trucks (4 or less axles) 9.91 Single trailer trucks (5 axles) 10.83 Single trailer trucks (6 or more axles) 0.45 Multi trailer trucks (5 or less axles) 0.56 Multi trailer trucks (6 axles) 0.26 Multi trailer trucks (7 or more axles) 0.26

265
Location: US97; MP 243.22; THE DALLES-CALIFORNIA HIGHWAY NO. 4; 4.32 miles north of Chiloquin Highway No. 422
Site Name: Chiloquin (18-023) Installed: January, 2008
HISTORICAL TRAFFIC DATA
Percent of ADT
Year ADT Max Day
Max Hour
10TH Hour
20TH Hour
30TH Hour
2003 *** *** *** *** *** *** 2004 *** *** *** *** *** *** 2005 *** *** *** *** *** *** 2006 *** *** *** *** *** *** 2007 *** *** *** *** *** *** 2008 3433 181 18.5 14.6 13.6 13.2 2009 3583 163 16.7 14.3 13.7 13.1 2010 3381 179 16.4 15.7 14.7 14.2 2011 3243 184 16.4 15.3 14.6 13.9 2012 3299 175 18.2 14.0 13.1 12.2
0500
1000150020002500300035004000
03 04 05 06 07 08 09 10 11 12
ADT
Year
HISTORICAL ADT BY YEAR
2012 TRAFFIC DATA
Average Weekday Traffic
Percent of ADT
Average Daily
Traffic Percent of ADT
January 1895 57 1883 57 February 2030 62 2096 64 March 2083 63 2212 67 April 2608 79 2694 82 May 3206 97 3200 97 June 4000 121 4200 127 July 4366 132 4739 144 August 4406 134 4725 143 September 4165 126 4310 131 October 3575 108 3720 113 November 3312 100 3352 102 December 2413 73 2456 74
Classification Breakdown Percent of ADT
Motorcyles 2.09 Passenger cars 43.29 Light Trucks 12.74 Buses 2.17 Single unit trucks (2 axles) 5.87 Single unit trucks (3 axles) 0.88 Single unit trucks (4 or more axles) 0.02 Single trailer trucks (4 or less axles) 7.12 Single trailer trucks (5 axles) 22.88 Single trailer trucks (6 or more axles) 1.17 Multi trailer trucks (5 or less axles) 0.42 Multi trailer trucks (6 axles) 0.42 Multi trailer trucks (7 or more axles) 0.93
Location: OR140; MP 2.80; SOUTH KLAMATH FALLS HIGHWAY NO. 424; At Washburn Way Site Name: South Klamath Falls
(18-024) Installed: November, 2012
HISTORICAL TRAFFIC DATA
Percent of ADT
Year ADT Max Day
Max Hour
10TH Hour
20TH Hour
30TH Hour
2003 *** *** *** *** *** *** 2004 *** *** *** *** *** *** 2005 *** *** *** *** *** *** 2006 *** *** *** *** *** *** 2007 *** *** *** *** *** *** 2008 *** *** *** *** *** *** 2009 *** *** *** *** *** *** 2010 *** *** *** *** *** *** 2011 *** *** *** *** *** *** 2012 *** *** *** *** *** ***
HISTORICAL ADT BY YEAR
0
0.2
0.4
0.6
0.8
1
03 04 05 06 07 08 09 10 11 12
Year
ADT
No data yet, new ATR in Nov. 2012. 2012 TRAFFIC DATA
Average Weekday Traffic
Percent of ADT
Average Daily
Traffic Percent of ADT
January *** *** *** *** February *** *** *** *** March *** *** *** *** April *** *** *** *** May *** *** *** *** June *** *** *** *** July *** *** *** *** August *** *** *** *** September *** *** *** *** October *** *** *** *** November *** *** *** *** December *** *** *** ***
Classification Breakdown Percent of ADT
Motorcyles *** Passenger cars *** Light Trucks *** Buses *** Single unit trucks (2 axles) *** Single unit trucks (3 axles) *** Single unit trucks (4 or more axles) *** Single trailer trucks (4 or less axles) *** Single trailer trucks (5 axles) *** Single trailer trucks (6 or more axles) *** Multi trailer trucks (5 or less axles) *** Multi trailer trucks (6 axles) *** Multi trailer trucks (7 or more axles) ***
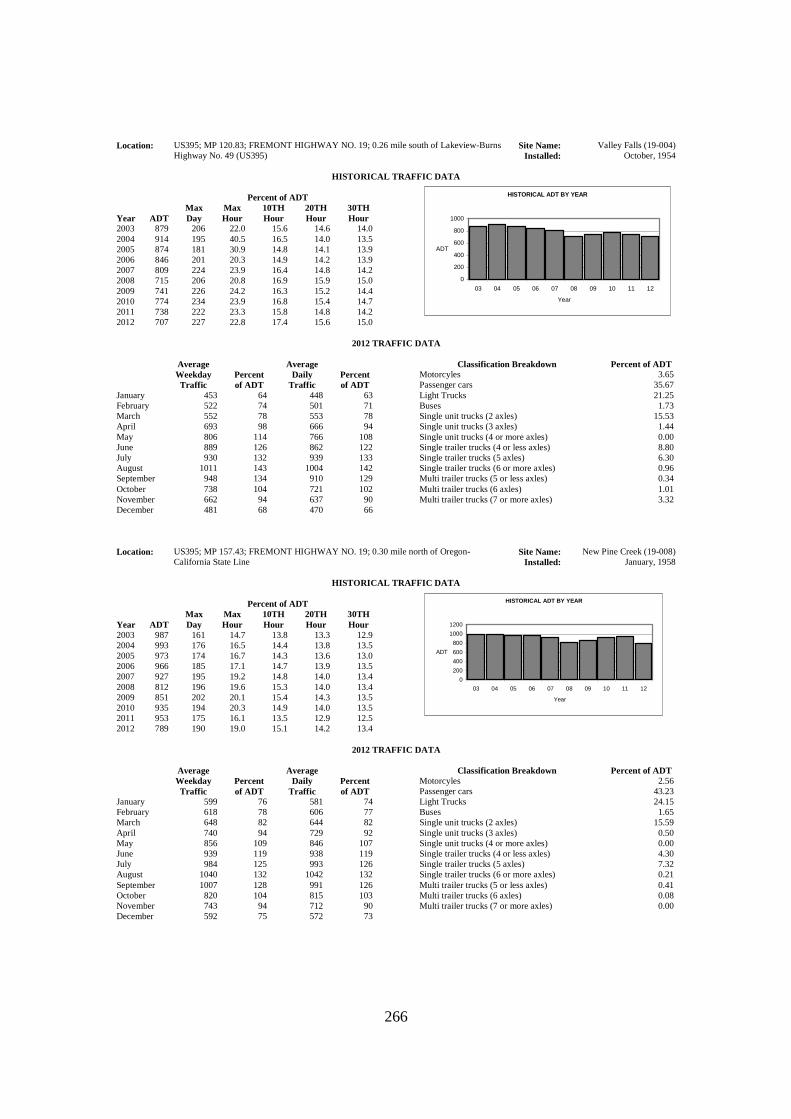
266
Location: US395; MP 120.83; FREMONT HIGHWAY NO. 19; 0.26 mile south of Lakeview-Burns Highway No. 49 (US395)
Site Name: Valley Falls (19-004) Installed: October, 1954
HISTORICAL TRAFFIC DATA
Percent of ADT
Year ADT Max Day
Max Hour
10TH Hour
20TH Hour
30TH Hour
2003 879 206 22.0 15.6 14.6 14.0 2004 914 195 40.5 16.5 14.0 13.5 2005 874 181 30.9 14.8 14.1 13.9 2006 846 201 20.3 14.9 14.2 13.9 2007 809 224 23.9 16.4 14.8 14.2 2008 715 206 20.8 16.9 15.9 15.0 2009 741 226 24.2 16.3 15.2 14.4 2010 774 234 23.9 16.8 15.4 14.7 2011 738 222 23.3 15.8 14.8 14.2 2012 707 227 22.8 17.4 15.6 15.0
HISTORICAL ADT BY YEAR
0
200
400
600
800
1000
03 04 05 06 07 08 09 10 11 12
Year
ADT
2012 TRAFFIC DATA
Average Weekday Traffic
Percent of ADT
Average Daily
Traffic Percent of ADT
January 453 64 448 63 February 522 74 501 71 March 552 78 553 78 April 693 98 666 94 May 806 114 766 108 June 889 126 862 122 July 930 132 939 133 August 1011 143 1004 142 September 948 134 910 129 October 738 104 721 102 November 662 94 637 90 December 481 68 470 66
Classification Breakdown Percent of ADT
Motorcyles 3.65 Passenger cars 35.67 Light Trucks 21.25 Buses 1.73 Single unit trucks (2 axles) 15.53 Single unit trucks (3 axles) 1.44 Single unit trucks (4 or more axles) 0.00 Single trailer trucks (4 or less axles) 8.80 Single trailer trucks (5 axles) 6.30 Single trailer trucks (6 or more axles) 0.96 Multi trailer trucks (5 or less axles) 0.34 Multi trailer trucks (6 axles) 1.01 Multi trailer trucks (7 or more axles) 3.32
Location: US395; MP 157.43; FREMONT HIGHWAY NO. 19; 0.30 mile north of Oregon-
California State Line Site Name: New Pine Creek (19-008)
Installed: January, 1958
HISTORICAL TRAFFIC DATA
Percent of ADT
Year ADT Max Day
Max Hour
10TH Hour
20TH Hour
30TH Hour
2003 987 161 14.7 13.8 13.3 12.9 2004 993 176 16.5 14.4 13.8 13.5 2005 973 174 16.7 14.3 13.6 13.0 2006 966 185 17.1 14.7 13.9 13.5 2007 927 195 19.2 14.8 14.0 13.4 2008 812 196 19.6 15.3 14.0 13.4 2009 851 202 20.1 15.4 14.3 13.5 2010 935 194 20.3 14.9 14.0 13.5 2011 953 175 16.1 13.5 12.9 12.5 2012 789 190 19.0 15.1 14.2 13.4
HISTORICAL ADT BY YEAR
0
200
400
600
800
1000
1200
03 04 05 06 07 08 09 10 11 12
Year
ADT
2012 TRAFFIC DATA
Average Weekday Traffic
Percent of ADT
Average Daily
Traffic Percent of ADT
January 599 76 581 74 February 618 78 606 77 March 648 82 644 82 April 740 94 729 92 May 856 109 846 107 June 939 119 938 119 July 984 125 993 126 August 1040 132 1042 132 September 1007 128 991 126 October 820 104 815 103 November 743 94 712 90 December 592 75 572 73
Classification Breakdown Percent of ADT
Motorcyles 2.56 Passenger cars 43.23 Light Trucks 24.15 Buses 1.65 Single unit trucks (2 axles) 15.59 Single unit trucks (3 axles) 0.50 Single unit trucks (4 or more axles) 0.00 Single trailer trucks (4 or less axles) 4.30 Single trailer trucks (5 axles) 7.32 Single trailer trucks (6 or more axles) 0.21 Multi trailer trucks (5 or less axles) 0.41 Multi trailer trucks (6 axles) 0.08 Multi trailer trucks (7 or more axles) 0.00

267
Location: OR31; MP 49.60; FREMONT HIGHWAY NO. 19; 2.25 miles southeast of 1st Street Site Name: Silver Lake (19-010) Installed: January, 1958
HISTORICAL TRAFFIC DATA
Percent of ADT
Year ADT Max Day
Max Hour
10TH Hour
20TH Hour
30TH Hour
2003 800 203 18.4 15.5 14.0 13.6 2004 814 193 21.8 17.0 15.6 14.7 2005 782 215 23.4 17.8 16.5 15.6 2006 715 194 21.6 16.8 15.5 14.6 2007 691 218 23.3 18.4 16.2 15.3 2008 628 197 24.8 17.3 16.4 15.4 2009 690 *** *** *** *** *** 2010 709 194 20.0 16.6 15.7 14.9 2011 659 205 20.8 16.4 15.2 14.7 2012 659 208 20.8 16.4 15.2 14.7
HISTORICAL ADT BY YEAR
0
200
400
600
800
1000
03 04 05 06 07 08 09 10 11 12
Year
ADT
2012 TRAFFIC DATA
Average Weekday Traffic
Percent of ADT
Average Daily
Traffic Percent of ADT
January 434 66 446 68 February 478 72 483 73 March 507 77 526 80 April 620 94 648 98 May 715 108 741 112 June 720 109 745 113 July 812 123 825 125 August 854 129 867 131 September 856 130 858 130 October 726 110 754 114 November 579 88 577 87 December 435 66 443 67
Classification Breakdown Percent of ADT
Motorcyles 1.21 Passenger cars 39.79 Light Trucks 22.48 Buses 0.88 Single unit trucks (2 axles) 18.40 Single unit trucks (3 axles) 0.55 Single unit trucks (4 or more axles) 0.00 Single trailer trucks (4 or less axles) 11.07 Single trailer trucks (5 axles) 4.02 Single trailer trucks (6 or more axles) 0.72 Multi trailer trucks (5 or less axles) 0.33 Multi trailer trucks (6 axles) 0.22 Multi trailer trucks (7 or more axles) 0.33
Location: OR36; MP 41.04; MAPLETON-JUNCTION CITY HIGHWAY NO. 229; 2.36 miles
southwest of Goldson Road Site Name: Goldson (20-004)
Installed: April, 1968
HISTORICAL TRAFFIC DATA
Percent of ADT
Year ADT Max Day
Max Hour
10TH Hour
20TH Hour
30TH Hour
2003 2139 *** *** *** *** *** 2004 2046 *** *** *** *** *** 2005 1951 *** *** *** *** *** 2006 1991 *** *** *** *** *** 2007 1993 154 15.2 12.1 11.5 11.3 2008 1805 196 24.2 13.5 12.6 12.1 2009 1816 421 37.1 33.2 28.4 27.0 2010 1812 162 16.6 14.3 13.1 12.9 2011 1740 165 15.2 13.8 13.3 12.8 2012 1706 161 15.9 14.0 13.4 12.9
HISTORICAL ADT BY YEAR
0
500
1000
1500
2000
2500
03 04 05 06 07 08 09 10 11 12
Year
ADT
2012 TRAFFIC DATA
Average Weekday Traffic
Percent of ADT
Average Daily
Traffic Percent of ADT
January 1357 80 1343 79 February 1545 91 1512 89 March 1446 85 1442 85 April 1633 96 1650 97 May 1745 102 1797 105 June 1913 112 1921 113 July 2001 117 2121 124 August 2035 119 2142 126 September 1883 110 1867 109 October 1696 99 1670 98 November 1612 94 1565 92 December 1477 87 1442 85
Classification Breakdown Percent of ADT
Motorcyles 1.84 Passenger cars 60.02 Light Trucks 15.66 Buses 0.78 Single unit trucks (2 axles) 10.28 Single unit trucks (3 axles) 3.44 Single unit trucks (4 or more axles) 0.18 Single trailer trucks (4 or less axles) 3.20 Single trailer trucks (5 axles) 2.56 Single trailer trucks (6 or more axles) 1.55 Multi trailer trucks (5 or less axles) 0.10 Multi trailer trucks (6 axles) 0.03 Multi trailer trucks (7 or more axles) 0.36
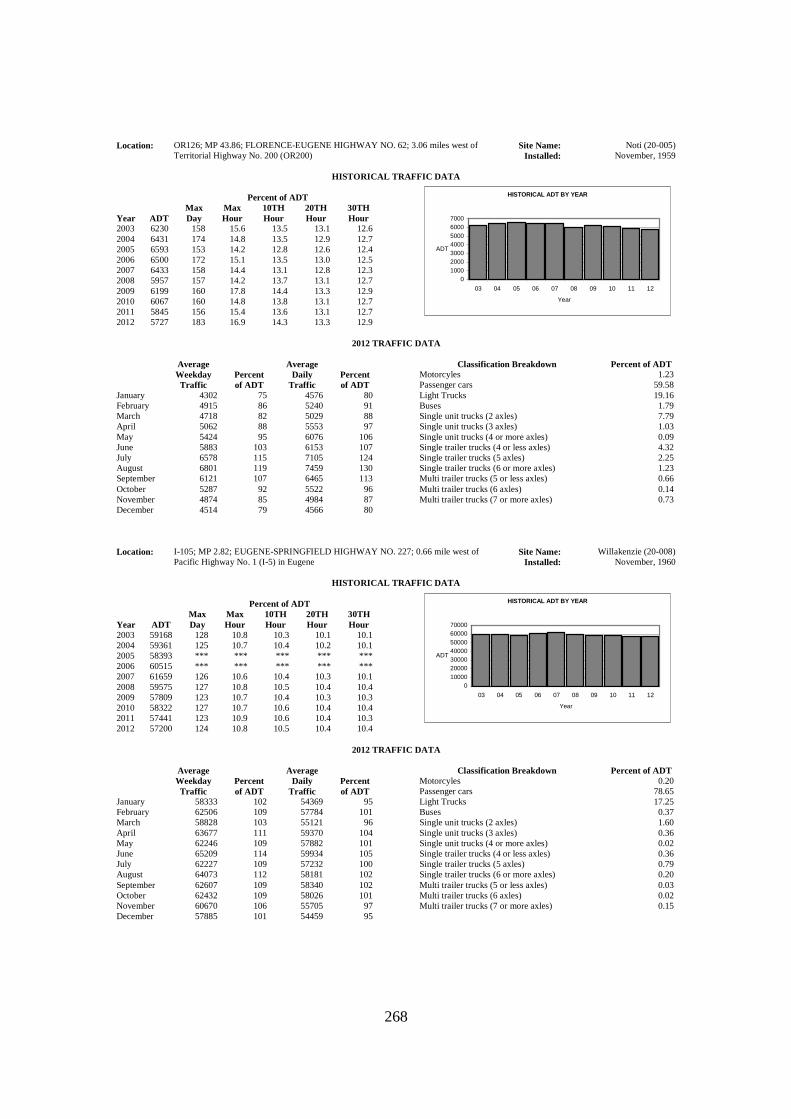
268
Location: OR126; MP 43.86; FLORENCE-EUGENE HIGHWAY NO. 62; 3.06 miles west of Territorial Highway No. 200 (OR200)
Site Name: Noti (20-005) Installed: November, 1959
HISTORICAL TRAFFIC DATA
Percent of ADT
Year ADT Max Day
Max Hour
10TH Hour
20TH Hour
30TH Hour
2003 6230 158 15.6 13.5 13.1 12.6 2004 6431 174 14.8 13.5 12.9 12.7 2005 6593 153 14.2 12.8 12.6 12.4 2006 6500 172 15.1 13.5 13.0 12.5 2007 6433 158 14.4 13.1 12.8 12.3 2008 5957 157 14.2 13.7 13.1 12.7 2009 6199 160 17.8 14.4 13.3 12.9 2010 6067 160 14.8 13.8 13.1 12.7 2011 5845 156 15.4 13.6 13.1 12.7 2012 5727 183 16.9 14.3 13.3 12.9
HISTORICAL ADT BY YEAR
01000200030004000500060007000
03 04 05 06 07 08 09 10 11 12
Year
ADT
2012 TRAFFIC DATA
Average Weekday Traffic
Percent of ADT
Average Daily
Traffic Percent of ADT
January 4302 75 4576 80 February 4915 86 5240 91 March 4718 82 5029 88 April 5062 88 5553 97 May 5424 95 6076 106 June 5883 103 6153 107 July 6578 115 7105 124 August 6801 119 7459 130 September 6121 107 6465 113 October 5287 92 5522 96 November 4874 85 4984 87 December 4514 79 4566 80
Classification Breakdown Percent of ADT
Motorcyles 1.23 Passenger cars 59.58 Light Trucks 19.16 Buses 1.79 Single unit trucks (2 axles) 7.79 Single unit trucks (3 axles) 1.03 Single unit trucks (4 or more axles) 0.09 Single trailer trucks (4 or less axles) 4.32 Single trailer trucks (5 axles) 2.25 Single trailer trucks (6 or more axles) 1.23 Multi trailer trucks (5 or less axles) 0.66 Multi trailer trucks (6 axles) 0.14 Multi trailer trucks (7 or more axles) 0.73
Location: I-105; MP 2.82; EUGENE-SPRINGFIELD HIGHWAY NO. 227; 0.66 mile west of
Pacific Highway No. 1 (I-5) in Eugene Site Name: Willakenzie (20-008)
Installed: November, 1960
HISTORICAL TRAFFIC DATA
Percent of ADT
Year ADT Max Day
Max Hour
10TH Hour
20TH Hour
30TH Hour
2003 59168 128 10.8 10.3 10.1 10.1 2004 59361 125 10.7 10.4 10.2 10.1 2005 58393 *** *** *** *** *** 2006 60515 *** *** *** *** *** 2007 61659 126 10.6 10.4 10.3 10.1 2008 59575 127 10.8 10.5 10.4 10.4 2009 57809 123 10.7 10.4 10.3 10.3 2010 58322 127 10.7 10.6 10.4 10.4 2011 57441 123 10.9 10.6 10.4 10.3 2012 57200 124 10.8 10.5 10.4 10.4
HISTORICAL ADT BY YEAR
010000200003000040000500006000070000
03 04 05 06 07 08 09 10 11 12
Year
ADT
2012 TRAFFIC DATA
Average Weekday Traffic
Percent of ADT
Average Daily
Traffic Percent of ADT
January 58333 102 54369 95 February 62506 109 57784 101 March 58828 103 55121 96 April 63677 111 59370 104 May 62246 109 57882 101 June 65209 114 59934 105 July 62227 109 57232 100 August 64073 112 58181 102 September 62607 109 58340 102 October 62432 109 58026 101 November 60670 106 55705 97 December 57885 101 54459 95
Classification Breakdown Percent of ADT
Motorcyles 0.20 Passenger cars 78.65 Light Trucks 17.25 Buses 0.37 Single unit trucks (2 axles) 1.60 Single unit trucks (3 axles) 0.36 Single unit trucks (4 or more axles) 0.02 Single trailer trucks (4 or less axles) 0.36 Single trailer trucks (5 axles) 0.79 Single trailer trucks (6 or more axles) 0.20 Multi trailer trucks (5 or less axles) 0.03 Multi trailer trucks (6 axles) 0.02 Multi trailer trucks (7 or more axles) 0.15

269
Location: OR126; MP 29.14; MCKENZIE HIGHWAY NO. 15; 2.74 miles east of S. Gate Creek Road
Site Name: Vida (20-010) Installed: October, 1957
HISTORICAL TRAFFIC DATA
Percent of ADT
Year ADT Max Day
Max Hour
10TH Hour
20TH Hour
30TH Hour
2003 3820 180 18.8 16.3 15.3 14.6 2004 3687 184 17.9 16.6 15.8 15.1 2005 3557 191 19.9 17.8 16.7 16.1 2006 3541 178 18.0 16.3 15.8 15.1 2007 3426 190 20.3 16.8 16.1 15.7 2008 3100 182 18.7 17.0 16.2 15.9 2009 3273 181 18.6 17.1 16.5 16.1 2010 3316 195 19.4 18.0 17.1 16.5 2011 3210 200 19.8 18.4 17.5 16.4 2012 3147 201 20.8 19.0 17.7 16.7
HISTORICAL ADT BY YEAR
0
1000
2000
3000
4000
5000
03 04 05 06 07 08 09 10 11 12
Year
ADT
2012 TRAFFIC DATA
Average Weekday Traffic
Percent of ADT
Average Daily
Traffic Percent of ADT
January 1981 63 2083 66 February 2154 68 2331 74 March 2151 68 2288 73 April 2508 80 2817 90 May 3010 96 3418 109 June 3601 114 3885 123 July 4016 128 4563 145 August 3967 126 4584 146 September 3448 110 3934 125 October 2853 91 3162 100 November 2379 76 2560 81 December 2038 65 2141 68
Classification Breakdown Percent of ADT
Motorcyles 0.63 Passenger cars 54.31 Light Trucks 19.11 Buses 1.60 Single unit trucks (2 axles) 10.77 Single unit trucks (3 axles) 2.00 Single unit trucks (4 or more axles) 0.10 Single trailer trucks (4 or less axles) 2.62 Single trailer trucks (5 axles) 5.69 Single trailer trucks (6 or more axles) 1.85 Multi trailer trucks (5 or less axles) 0.17 Multi trailer trucks (6 axles) 0.06 Multi trailer trucks (7 or more axles) 1.09
Location: OR569; MP 12.00; BELT LINE HIGHWAY NO. 69; 0.76 mile west of Pacific Highway
No. 1 (I-5) Site Name: Beltline (20-011)
Installed: May, 2000
HISTORICAL TRAFFIC DATA
Percent of ADT
Year ADT Max Day
Max Hour
10TH Hour
20TH Hour
30TH Hour
2003 50108 *** *** *** *** *** 2004 49161 *** *** *** *** *** 2005 52270 141 11.1 10.8 10.5 10.2 2006 49718 125 10.1 9.7 9.6 9.5 2007 47344 *** *** *** *** *** 2008 45275 *** *** *** *** *** 2009 48772 125 11.1 9.8 9.8 9.7 2010 51965 126 10.3 9.6 9.5 9.4 2011 50662 136 10.7 10.1 9.7 9.5 2012 50471 123 10.1 9.6 9.6 9.5
HISTORICAL ADT BY YEAR
0
10000
20000
30000
40000
50000
60000
03 04 05 06 07 08 09 10 11 12
Year
ADT
2012 TRAFFIC DATA
Average Weekday Traffic
Percent of ADT
Average Daily
Traffic Percent of ADT
January 49432 98 46701 93 February 52658 104 49562 98 March 49937 99 47757 95 April 53850 107 50901 101 May 53764 107 50999 101 June 56157 111 52796 105 July 55741 110 52755 105 August 56742 112 53185 105 September 54387 108 51470 102 October 54476 108 51283 102 November 52530 104 49246 98 December 52000 103 49000 97
Classification Breakdown Percent of ADT
Motorcyles 0.36 Passenger cars 72.51 Light Trucks 17.97 Buses 0.28 Single unit trucks (2 axles) 2.75 Single unit trucks (3 axles) 1.29 Single unit trucks (4 or more axles) 0.10 Single trailer trucks (4 or less axles) 0.57 Single trailer trucks (5 axles) 2.66 Single trailer trucks (6 or more axles) 1.00 Multi trailer trucks (5 or less axles) 0.11 Multi trailer trucks (6 axles) 0.01 Multi trailer trucks (7 or more axles) 0.39

270
Location: OR58; MP 37.36; WILLAMETTE HIGHWAY NO. 18; 0.10 mile east of Kitson Springs Road
Site Name: Oakridge (20-017) Installed: January, 1953
HISTORICAL TRAFFIC DATA
Percent of ADT
Year ADT Max Day
Max Hour
10TH Hour
20TH Hour
30TH Hour
2003 3017 272 27.6 24.2 20.5 19.2 2004 2856 221 26.2 21.1 19.5 18.9 2005 2726 229 27.8 21.3 20.4 19.4 2006 2747 229 27.0 21.6 19.4 18.8 2007 2767 253 28.7 22.9 21.0 19.8 2008 2690 213 24.0 21.2 19.6 18.9 2009 2627 236 30.0 22.6 21.5 20.4 2010 2650 241 28.5 23.2 21.7 20.6 2011 2509 258 30.8 23.4 21.9 20.8 2012 2380 237 29.5 24.7 23.0 21.3
HISTORICAL ADT BY YEAR
0500
100015002000250030003500
03 04 05 06 07 08 09 10 11 12
Year
ADT
2012 TRAFFIC DATA
Average Weekday Traffic
Percent of ADT
Average Daily
Traffic Percent of ADT
January 1295 54 1584 67 February 1454 61 1852 78 March 1521 64 1865 78 April 1693 71 1982 83 May 2421 102 2666 112 June 2076 87 2575 108 July 2786 117 3332 140 August 2977 125 3642 153 September 2696 113 3180 134 October 2040 86 2383 100 November 1686 71 1843 77 December 1469 62 1651 69
Classification Breakdown Percent of ADT
Motorcyles 0.97 Passenger cars 38.19 Light Trucks 25.12 Buses 0.07 Single unit trucks (2 axles) 2.53 Single unit trucks (3 axles) 0.69 Single unit trucks (4 or more axles) 0.04 Single trailer trucks (4 or less axles) 3.93 Single trailer trucks (5 axles) 17.32 Single trailer trucks (6 or more axles) 6.35 Multi trailer trucks (5 or less axles) 0.14 Multi trailer trucks (6 axles) 0.43 Multi trailer trucks (7 or more axles) 4.22
Location: I-5; MP 169.25; PACIFIC HIGHWAY NO. 1; 1.24 miles northeast of Douglas-Lane
County Line Site Name: Martin Creek (20-020)
Installed: September, 2001
HISTORICAL TRAFFIC DATA
Percent of ADT
Year ADT Max Day
Max Hour
10TH Hour
20TH Hour
30TH Hour
2003 23988 170 13.9 12.5 11.7 11.4 2004 24090 168 14.0 12.0 11.0 10.7 2005 23820 170 15.1 12.7 11.6 11.2 2006 23674 166 13.9 12.0 11.3 11.0 2007 23562 170 13.8 11.8 11.4 11.2 2008 21754 173 15.6 13.0 11.8 11.3 2009 22572 *** *** *** *** *** 2010 22949 *** *** *** *** *** 2011 22116 *** *** *** *** *** 2012 21871 166 14.9 12.7 11.9 11.6
HISTORICAL ADT BY YEAR
0
5000
10000
15000
20000
25000
30000
03 04 05 06 07 08 09 10 11 12
Year
ADT
2012 TRAFFIC DATA
Average Weekday Traffic
Percent of ADT
Average Daily
Traffic Percent of ADT
January 17029 78 17076 78 February 17956 82 18345 84 March 19244 88 20040 92 April 20021 92 20855 95 May 21197 97 21644 99 June 24251 111 24888 114 July 25407 116 26711 122 August 25712 118 27097 124 September 22563 103 23314 107 October 20142 92 20911 96 November 20807 95 21426 98 December 19205 88 20144 92
Classification Breakdown Percent of ADT
Motorcyles 0.20 Passenger cars 45.23 Light Trucks 18.04 Buses 0.04 Single unit trucks (2 axles) 2.03 Single unit trucks (3 axles) 1.42 Single unit trucks (4 or more axles) 2.23 Single trailer trucks (4 or less axles) 0.01 Single trailer trucks (5 axles) 25.61 Single trailer trucks (6 or more axles) 2.75 Multi trailer trucks (5 or less axles) 0.34 Multi trailer trucks (6 axles) 0.55 Multi trailer trucks (7 or more axles) 1.55
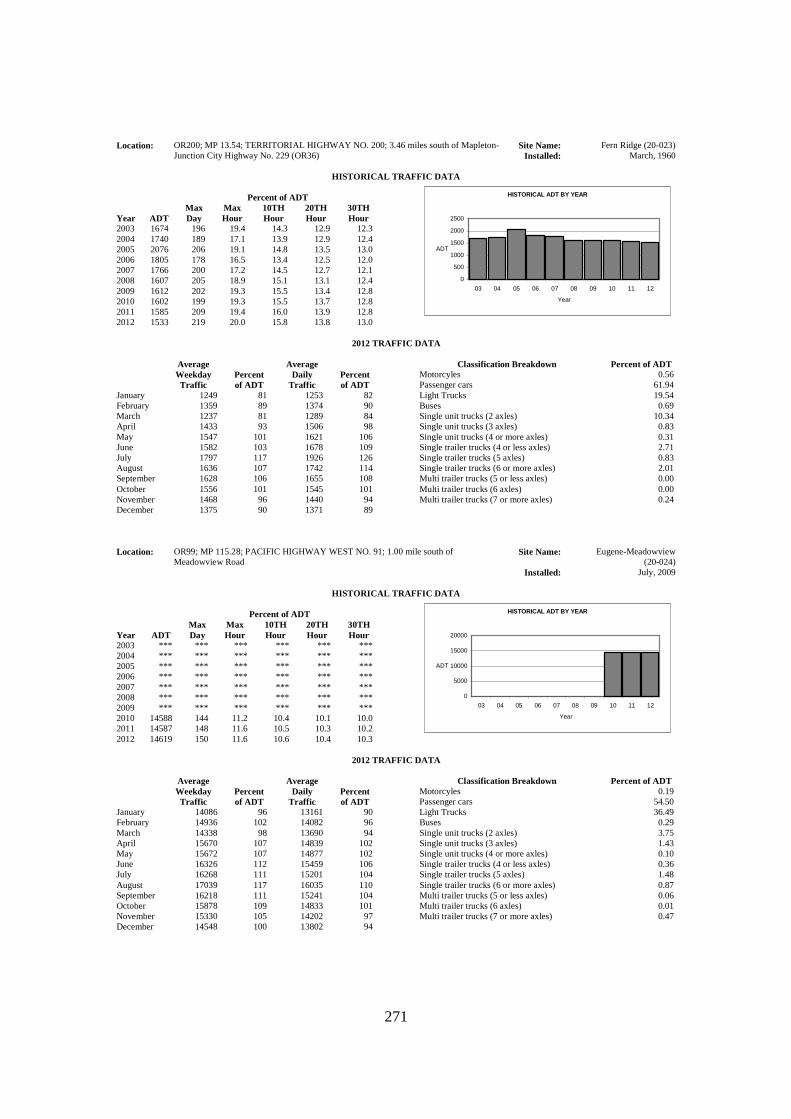
271
Location: OR200; MP 13.54; TERRITORIAL HIGHWAY NO. 200; 3.46 miles south of Mapleton-Junction City Highway No. 229 (OR36)
Site Name: Fern Ridge (20-023) Installed: March, 1960
HISTORICAL TRAFFIC DATA
Percent of ADT
Year ADT Max Day
Max Hour
10TH Hour
20TH Hour
30TH Hour
2003 1674 196 19.4 14.3 12.9 12.3 2004 1740 189 17.1 13.9 12.9 12.4 2005 2076 206 19.1 14.8 13.5 13.0 2006 1805 178 16.5 13.4 12.5 12.0 2007 1766 200 17.2 14.5 12.7 12.1 2008 1607 205 18.9 15.1 13.1 12.4 2009 1612 202 19.3 15.5 13.4 12.8 2010 1602 199 19.3 15.5 13.7 12.8 2011 1585 209 19.4 16.0 13.9 12.8 2012 1533 219 20.0 15.8 13.8 13.0
HISTORICAL ADT BY YEAR
0
500
1000
1500
2000
2500
03 04 05 06 07 08 09 10 11 12
Year
ADT
2012 TRAFFIC DATA
Average Weekday Traffic
Percent of ADT
Average Daily
Traffic Percent of ADT
January 1249 81 1253 82 February 1359 89 1374 90 March 1237 81 1289 84 April 1433 93 1506 98 May 1547 101 1621 106 June 1582 103 1678 109 July 1797 117 1926 126 August 1636 107 1742 114 September 1628 106 1655 108 October 1556 101 1545 101 November 1468 96 1440 94 December 1375 90 1371 89
Classification Breakdown Percent of ADT
Motorcyles 0.56 Passenger cars 61.94 Light Trucks 19.54 Buses 0.69 Single unit trucks (2 axles) 10.34 Single unit trucks (3 axles) 0.83 Single unit trucks (4 or more axles) 0.31 Single trailer trucks (4 or less axles) 2.71 Single trailer trucks (5 axles) 0.83 Single trailer trucks (6 or more axles) 2.01 Multi trailer trucks (5 or less axles) 0.00 Multi trailer trucks (6 axles) 0.00 Multi trailer trucks (7 or more axles) 0.24
Location: OR99; MP 115.28; PACIFIC HIGHWAY WEST NO. 91; 1.00 mile south of
Meadowview Road Site Name: Eugene-Meadowview
(20-024) Installed: July, 2009
HISTORICAL TRAFFIC DATA
Percent of ADT
Year ADT Max Day
Max Hour
10TH Hour
20TH Hour
30TH Hour
2003 *** *** *** *** *** *** 2004 *** *** *** *** *** *** 2005 *** *** *** *** *** *** 2006 *** *** *** *** *** *** 2007 *** *** *** *** *** *** 2008 *** *** *** *** *** *** 2009 *** *** *** *** *** *** 2010 14588 144 11.2 10.4 10.1 10.0 2011 14587 148 11.6 10.5 10.3 10.2 2012 14619 150 11.6 10.6 10.4 10.3
HISTORICAL ADT BY YEAR
0
5000
10000
15000
20000
03 04 05 06 07 08 09 10 11 12
Year
ADT
2012 TRAFFIC DATA
Average Weekday Traffic
Percent of ADT
Average Daily
Traffic Percent of ADT
January 14086 96 13161 90 February 14936 102 14082 96 March 14338 98 13690 94 April 15670 107 14839 102 May 15672 107 14877 102 June 16326 112 15459 106 July 16268 111 15201 104 August 17039 117 16035 110 September 16218 111 15241 104 October 15878 109 14833 101 November 15330 105 14202 97 December 14548 100 13802 94
Classification Breakdown Percent of ADT
Motorcyles 0.19 Passenger cars 54.50 Light Trucks 36.49 Buses 0.29 Single unit trucks (2 axles) 3.75 Single unit trucks (3 axles) 1.43 Single unit trucks (4 or more axles) 0.10 Single trailer trucks (4 or less axles) 0.36 Single trailer trucks (5 axles) 1.48 Single trailer trucks (6 or more axles) 0.87 Multi trailer trucks (5 or less axles) 0.06 Multi trailer trucks (6 axles) 0.01 Multi trailer trucks (7 or more axles) 0.47

272
Location: I-5; MP 190.92; PACIFIC HIGHWAY NO. 1; 1.06 mile south of Glenwood Interchange Site Name: Eugene-Glenwood (20-025)
Installed: February, 2010
HISTORICAL TRAFFIC DATA
Percent of ADT
Year ADT Max Day
Max Hour
10TH Hour
20TH Hour
30TH Hour
2003 *** *** *** *** *** *** 2004 *** *** *** *** *** *** 2005 *** *** *** *** *** *** 2006 *** *** *** *** *** *** 2007 *** *** *** *** *** *** 2008 *** *** *** *** *** *** 2009 *** *** *** *** *** *** 2010 53419 *** *** *** *** *** 2011 51795 134 10.8 9.9 9.7 9.6 2012 50499 132 10.6 9.9 9.7 9.6
HISTORICAL ADT BY YEAR
0
10000
20000
30000
40000
50000
60000
03 04 05 06 07 08 09 10 11 12
Year
ADT
2012 TRAFFIC DATA
Average Weekday Traffic
Percent of ADT
Average Daily
Traffic Percent of ADT
January 47054 93 43946 87 February 50752 101 47422 94 March 48743 97 46885 93 April 53723 106 50992 101 May 54607 108 51645 102 June 57142 113 54641 108 July 57659 114 56216 111 August 58137 115 56451 112 September 54251 107 52176 103 October 54048 107 51019 101 November 52511 104 49468 98 December 46003 91 45124 89
Classification Breakdown Percent of ADT
Motorcyles 0.83 Passenger cars 59.29 Light Trucks 21.98 Buses 0.20 Single unit trucks (2 axles) 3.00 Single unit trucks (3 axles) 1.40 Single unit trucks (4 or more axles) 0.01 Single trailer trucks (4 or less axles) 1.25 Single trailer trucks (5 axles) 9.12 Single trailer trucks (6 or more axles) 1.15 Multi trailer trucks (5 or less axles) 0.36 Multi trailer trucks (6 axles) 0.10 Multi trailer trucks (7 or more axles) 1.31
Location: US101; MP 186.46; OREGON COAST HIGHWAY NO. 9; 0.77 mile north of Heceta
Beach Road Site Name: Florence (20-026)
Installed: July, 2010
HISTORICAL TRAFFIC DATA
Percent of ADT
Year ADT Max Day
Max Hour
10TH Hour
20TH Hour
30TH Hour
2003 *** *** *** *** *** *** 2004 *** *** *** *** *** *** 2005 *** *** *** *** *** *** 2006 *** *** *** *** *** *** 2007 *** *** *** *** *** *** 2008 *** *** *** *** *** *** 2009 *** *** *** *** *** *** 2010 *** *** *** *** *** *** 2011 6229 158 15.7 14.9 14.3 14.0 2012 6122 155 15.0 14.1 13.6 13.3
HISTORICAL ADT BY YEAR
01000200030004000500060007000
03 04 05 06 07 08 09 10 11 12
Year
ADT
2012 TRAFFIC DATA
Average Weekday Traffic
Percent of ADT
Average Daily
Traffic Percent of ADT
January 4523 74 4622 76 February 4967 81 5138 84 March 5102 83 5250 86 April 5308 87 5593 91 May 5825 95 6323 103 June 6797 111 6861 112 July 8313 136 8500 139 August 8400 137 8800 144 September 7104 116 7225 118 October 5655 92 5579 91 November 4917 80 4936 81 December 4604 75 4634 76
Classification Breakdown Percent of ADT
Motorcyles 0.55 Passenger cars 63.49 Light Trucks 29.62 Buses 0.49 Single unit trucks (2 axles) 2.75 Single unit trucks (3 axles) 0.64 Single unit trucks (4 or more axles) 0.04 Single trailer trucks (4 or less axles) 0.77 Single trailer trucks (5 axles) 1.53 Single trailer trucks (6 or more axles) 0.08 Multi trailer trucks (5 or less axles) 0.02 Multi trailer trucks (6 axles) 0.00 Multi trailer trucks (7 or more axles) 0.02

273
Location: OR126; MP 8.66; EUGENE-SPRINGFIELD HIGHWAY NO. 227; 0.39 mile north of 52nd Street
Site Name: East Springfield (20-027) Installed: July, 2010
HISTORICAL TRAFFIC DATA
Percent of ADT
Year ADT Max Day
Max Hour
10TH Hour
20TH Hour
30TH Hour
2003 *** *** *** *** *** *** 2004 *** *** *** *** *** *** 2005 *** *** *** *** *** *** 2006 *** *** *** *** *** *** 2007 *** *** *** *** *** *** 2008 *** *** *** *** *** *** 2009 *** *** *** *** *** *** 2010 *** *** *** *** *** *** 2011 30158 122 11.2 10.5 10.4 10.3 2012 30189 122 10.7 10.4 10.4 10.3
HISTORICAL ADT BY YEAR
05000
100001500020000250003000035000
03 04 05 06 07 08 09 10 11 12
Year
ADT
2012 TRAFFIC DATA
Average Weekday Traffic
Percent of ADT
Average Daily
Traffic Percent of ADT
January 29186 97 27809 92 February 30754 102 29182 97 March 29132 96 28132 93 April 31606 105 30386 101 May 32143 106 31141 103 June 33131 110 31812 105 July 33053 109 31907 106 August 33437 111 31946 106 September 32826 109 31458 104 October 32146 106 30443 101 November 31020 103 29130 96 December 30039 100 28924 96
Classification Breakdown Percent of ADT
Motorcyles 0.27 Passenger cars 79.82 Light Trucks 16.07 Buses 0.42 Single unit trucks (2 axles) 1.05 Single unit trucks (3 axles) 0.43 Single unit trucks (4 or more axles) 0.02 Single trailer trucks (4 or less axles) 0.35 Single trailer trucks (5 axles) 1.08 Single trailer trucks (6 or more axles) 0.30 Multi trailer trucks (5 or less axles) 0.00 Multi trailer trucks (6 axles) 0.00 Multi trailer trucks (7 or more axles) 0.19
Location: OR569; MP 5.20; BELT LINE HIGHWAY NO. 69; 0.42 mile south of Barger Drive
Interchange Site Name: West Beltline (20-028)
Installed: July, 2010
HISTORICAL TRAFFIC DATA
Percent of ADT
Year ADT Max Day
Max Hour
10TH Hour
20TH Hour
30TH Hour
2003 *** *** *** *** *** *** 2004 *** *** *** *** *** *** 2005 *** *** *** *** *** *** 2006 *** *** *** *** *** *** 2007 *** *** *** *** *** *** 2008 *** *** *** *** *** *** 2009 *** *** *** *** *** *** 2010 *** *** *** *** *** *** 2011 25690 125 10.7 10.1 9.9 9.8 2012 25611 131 10.4 10.3 10.0 10.0
HISTORICAL ADT BY YEAR
0
5000
10000
15000
20000
25000
30000
03 04 05 06 07 08 09 10 11 12
Year
ADT
2012 TRAFFIC DATA
Average Weekday Traffic
Percent of ADT
Average Daily
Traffic Percent of ADT
January 24994 98 23554 92 February 26529 104 25025 98 March 25170 98 24011 94 April 27179 106 25653 100 May 27562 108 26096 102 June 29065 113 27091 106 July 29034 113 27257 106 August 29575 115 27401 107 September 27842 109 26145 102 October 27461 107 25640 100 November 26508 104 24609 96 December 25979 101 24855 97
Classification Breakdown Percent of ADT
Motorcyles 0.62 Passenger cars 72.55 Light Trucks 19.35 Buses 0.19 Single unit trucks (2 axles) 2.14 Single unit trucks (3 axles) 1.10 Single unit trucks (4 or more axles) 0.02 Single trailer trucks (4 or less axles) 0.79 Single trailer trucks (5 axles) 2.43 Single trailer trucks (6 or more axles) 0.53 Multi trailer trucks (5 or less axles) 0.00 Multi trailer trucks (6 axles) 0.02 Multi trailer trucks (7 or more axles) 0.26

274
Location: US20; MP 34.24; CORVALLIS-NEWPORT HIGHWAY NO. 33; 0.11 mile west of Lincoln-Benton County Line
Site Name: Burnt Woods (21-006) Installed: August, 1957
HISTORICAL TRAFFIC DATA
Percent of ADT
Year ADT Max Day
Max Hour
10TH Hour
20TH Hour
30TH Hour
2003 4919 164 15.3 14.9 14.5 13.6 2004 4973 186 17.3 15.3 14.4 14.1 2005 4975 165 15.9 14.5 13.7 13.3 2006 4976 190 22.8 15.7 14.6 14.0 2007 5046 163 15.5 14.0 13.6 13.1 2008 4706 181 16.9 14.8 14.2 13.8 2009 4997 169 19.5 15.7 14.9 14.4 2010 4809 187 17.4 15.8 14.8 14.2 2011 4663 172 17.5 15.4 14.9 14.2 2012 4747 191 17.0 15.8 14.9 14.5
HISTORICAL ADT BY YEAR
0
1000
2000
3000
4000
5000
6000
03 04 05 06 07 08 09 10 11 12
Year
ADT
2012 TRAFFIC DATA
Average Weekday Traffic
Percent of ADT
Average Daily
Traffic Percent of ADT
January 3400 72 3577 75 February 4054 85 4451 94 March 3863 81 4189 88 April 4029 85 4496 95 May 4298 91 4906 103 June 4831 102 5213 110 July 5536 117 6052 128 August 5691 120 6366 134 September 5057 107 5483 116 October 4171 88 4478 94 November 3859 81 3996 84 December 3718 78 3754 79
Classification Breakdown Percent of ADT
Motorcyles 0.79 Passenger cars 59.17 Light Trucks 17.53 Buses 1.87 Single unit trucks (2 axles) 10.11 Single unit trucks (3 axles) 0.86 Single unit trucks (4 or more axles) 0.01 Single trailer trucks (4 or less axles) 4.16 Single trailer trucks (5 axles) 2.05 Single trailer trucks (6 or more axles) 2.03 Multi trailer trucks (5 or less axles) 0.54 Multi trailer trucks (6 axles) 0.20 Multi trailer trucks (7 or more axles) 0.68
Location: US101; MP 112.35; OREGON COAST HIGHWAY NO. 9; At West Devils Lake Road Site Name: West Devils Lake (21-007)
Installed: May, 1998
HISTORICAL TRAFFIC DATA
Percent of ADT
Year ADT Max Day
Max Hour
10TH Hour
20TH Hour
30TH Hour
2003 16648 153 14.2 12.9 12.4 12.3 2004 16732 162 13.4 12.7 12.4 12.2 2005 16433 151 13.6 13.2 12.5 12.1 2006 16533 *** *** *** *** *** 2007 16605 150 13.3 12.6 12.2 12.0 2008 15498 159 14.1 13.2 13.0 12.8 2009 15983 153 13.5 13.1 12.8 12.6 2010 *** *** *** *** *** *** 2011 15197 157 14.4 13.5 13.2 12.9 2012 15122 167 14.4 14.0 13.2 12.9
HISTORICAL ADT BY YEAR
0
5000
10000
15000
20000
03 04 05 06 07 08 09 10 11 12
Year
ADT
2012 TRAFFIC DATA
Average Weekday Traffic
Percent of ADT
Average Daily
Traffic Percent of ADT
January 10851 72 11573 77 February 12273 81 13642 90 March 12651 84 13942 92 April 13156 87 14662 97 May 13847 92 15566 103 June 15214 101 16214 107 July 18346 121 19531 129 August 18468 122 20175 133 September 15840 105 17117 113 October 13261 88 14125 93 November 12154 80 12833 85 December 11645 77 12085 80
Classification Breakdown Percent of ADT
Motorcyles 0.04 Passenger cars 68.97 Light Trucks 23.63 Buses 0.68 Single unit trucks (2 axles) 2.67 Single unit trucks (3 axles) 0.50 Single unit trucks (4 or more axles) 0.02 Single trailer trucks (4 or less axles) 1.07 Single trailer trucks (5 axles) 1.62 Single trailer trucks (6 or more axles) 0.65 Multi trailer trucks (5 or less axles) 0.00 Multi trailer trucks (6 axles) 0.00 Multi trailer trucks (7 or more axles) 0.15

275
Location: US101; MP 114.91; OREGON COAST HIGHWAY NO. 9; 0.07 mile north of "D" River State Wayside
Site Name: D River Wayside (21-008) Installed: May, 1998
HISTORICAL TRAFFIC DATA
Percent of ADT
Year ADT Max Day
Max Hour
10TH Hour
20TH Hour
30TH Hour
2003 26086 144 11.7 11.3 11.2 11.0 2004 26302 145 11.5 11.1 11.0 10.8 2005 25736 141 11.7 11.2 11.0 10.9 2006 26183 144 11.3 11.2 10.9 10.8 2007 26279 139 11.4 11.1 11.0 10.9 2008 25036 145 12.0 11.4 11.3 11.2 2009 25051 145 11.8 11.3 11.2 11.1 2010 *** *** *** *** *** *** 2011 23972 146 12.1 11.7 11.5 11.4 2012 23935 152 12.2 11.7 11.5 11.5
HISTORICAL ADT BY YEAR
0
5000
10000
15000
20000
25000
30000
03 04 05 06 07 08 09 10 11 12
Year
ADT
2012 TRAFFIC DATA
Average Weekday Traffic
Percent of ADT
Average Daily
Traffic Percent of ADT
January 18409 77 18994 79 February 20766 87 22301 93 March 21814 91 22966 96 April 22391 94 23628 99 May 22562 94 24437 102 June 24751 103 25414 106 July 28727 120 29541 123 August 29313 122 30611 128 September 25296 106 26355 110 October 22160 93 22852 95 November 19731 82 20357 85 December 19576 82 19766 83
Classification Breakdown Percent of ADT
Motorcyles 0.33 Passenger cars 61.32 Light Trucks 31.84 Buses 0.57 Single unit trucks (2 axles) 2.96 Single unit trucks (3 axles) 0.67 Single unit trucks (4 or more axles) 0.07 Single trailer trucks (4 or less axles) 0.33 Single trailer trucks (5 axles) 0.89 Single trailer trucks (6 or more axles) 0.86 Multi trailer trucks (5 or less axles) 0.01 Multi trailer trucks (6 axles) 0.01 Multi trailer trucks (7 or more axles) 0.14
Location: US101; MP 139.11; OREGON COAST HIGHWAY NO. 9; At 25th Street in Newport Site Name: North Newport (21-009)
Installed: October, 1996
HISTORICAL TRAFFIC DATA
Percent of ADT
Year ADT Max Day
Max Hour
10TH Hour
20TH Hour
30TH Hour
2003 18930 141 12.1 11.6 11.4 11.3 2004 19294 142 12.1 11.4 11.2 11.1 2005 19153 *** *** *** *** *** 2006 19083 *** *** *** *** *** 2007 19159 139 11.7 11.3 11.1 11.1 2008 18078 140 12.2 11.4 11.1 11.0 2009 18304 142 12.4 11.8 11.6 11.4 2010 *** *** *** *** *** *** 2011 17482 141 12.4 11.7 11.4 11.3 2012 17419 132 11.4 10.6 10.1 9.9
HISTORICAL ADT BY YEAR
0
5000
10000
15000
20000
25000
03 04 05 06 07 08 09 10 11 12
Year
ADT
2012 TRAFFIC DATA
Average Weekday Traffic
Percent of ADT
Average Daily
Traffic Percent of ADT
January 13933 80 13860 80 February 15667 90 15944 92 March 15796 91 15996 92 April 16614 95 16805 96 May 17078 98 17600 101 June 19400 111 19300 111 July 21900 126 21900 126 August 22000 126 22100 127 September 19386 111 19449 112 October 16927 97 16421 94 November 15146 87 14956 86 December 15000 86 14700 84
Classification Breakdown Percent of ADT
Motorcyles 0.70 Passenger cars 77.46 Light Trucks 16.42 Buses 0.55 Single unit trucks (2 axles) 1.50 Single unit trucks (3 axles) 0.92 Single unit trucks (4 or more axles) 0.41 Single trailer trucks (4 or less axles) 0.65 Single trailer trucks (5 axles) 0.74 Single trailer trucks (6 or more axles) 0.50 Multi trailer trucks (5 or less axles) 0.02 Multi trailer trucks (6 axles) 0.01 Multi trailer trucks (7 or more axles) 0.12

276
Location: I-5; MP 234.80; PACIFIC HIGHWAY NO. 1; 0.41 mile north of Albany-Junction City Highway No. 58 (OR99E)
Site Name: North Albany (22-005) Installed: October, 1999
HISTORICAL TRAFFIC DATA
Percent of ADT
Year ADT Max Day
Max Hour
10TH Hour
20TH Hour
30TH Hour
2003 62259 134 11.0 9.7 9.6 9.5 2004 60486 134 10.1 9.8 9.7 9.5 2005 60632 *** *** *** *** *** 2006 60971 134 10.1 9.7 9.5 9.3 2007 61436 136 10.0 9.7 9.6 9.5 2008 57888 139 11.9 10.2 9.9 9.9 2009 59500 133 10.6 10.0 9.7 9.6 2010 60070 133 10.6 9.9 9.7 9.6 2011 58939 130 10.0 9.8 9.7 9.6 2012 58137 138 11.2 9.9 9.7 9.6
HISTORICAL ADT BY YEAR
010000200003000040000500006000070000
03 04 05 06 07 08 09 10 11 12
Year
ADT
2012 TRAFFIC DATA
Average Weekday Traffic
Percent of ADT
Average Daily
Traffic Percent of ADT
January 48853 84 49229 85 February 52334 90 53419 92 March 52798 91 54190 93 April 55321 95 57431 99 May 56767 98 58539 101 June 61848 106 63157 109 July 63104 109 64842 112 August 64365 111 65852 113 September 59419 102 61867 106 October 55423 95 57944 100 November 55826 96 57431 99 December 53196 92 53737 92
Classification Breakdown Percent of ADT
Motorcyles 0.70 Passenger cars 62.28 Light Trucks 15.15 Buses 0.15 Single unit trucks (2 axles) 2.90 Single unit trucks (3 axles) 0.70 Single unit trucks (4 or more axles) 0.07 Single trailer trucks (4 or less axles) 1.24 Single trailer trucks (5 axles) 13.26 Single trailer trucks (6 or more axles) 1.62 Multi trailer trucks (5 or less axles) 0.23 Multi trailer trucks (6 axles) 0.13 Multi trailer trucks (7 or more axles) 1.57
Location: OR226; MP 0.43; ALBANY-LYONS HIGHWAY NO. 211; 0.43 mile east of Santiam
Highway No. 16 (US20) Site Name: Crabtree (22-010)
Installed: January, 1950
HISTORICAL TRAFFIC DATA
Percent of ADT
Year ADT Max Day
Max Hour
10TH Hour
20TH Hour
30TH Hour
2003 5030 123 11.1 10.4 10.2 10.0 2004 5000 137 11.8 11.0 10.7 10.5 2005 4970 *** *** *** *** *** 2006 5032 128 11.5 10.7 10.5 10.3 2007 5021 134 12.0 10.8 10.6 10.5 2008 4791 169 20.7 11.3 11.0 10.8 2009 4931 134 11.6 10.8 10.6 10.5 2010 4976 142 13.0 11.6 11.1 10.7 2011 4794 131 11.7 10.8 10.6 10.5 2012 4824 132 12.9 11.2 11.0 10.8
HISTORICAL ADT BY YEAR
0
1000
2000
3000
4000
5000
6000
03 04 05 06 07 08 09 10 11 12
Year
ADT
2012 TRAFFIC DATA
Average Weekday Traffic
Percent of ADT
Average Daily
Traffic Percent of ADT
January 4200 87 4000 83 February 4400 91 4200 87 March 4452 92 4308 89 April 4905 102 4754 99 May 5012 104 4946 103 June 5332 111 5168 107 July 5634 117 5536 115 August 5820 121 5679 118 September 5499 114 5334 111 October 5263 109 5026 104 November 4785 99 4528 94 December 4577 95 4414 91
Classification Breakdown Percent of ADT
Motorcyles 0.23 Passenger cars 60.25 Light Trucks 22.09 Buses 1.28 Single unit trucks (2 axles) 10.00 Single unit trucks (3 axles) 0.86 Single unit trucks (4 or more axles) 0.11 Single trailer trucks (4 or less axles) 2.58 Single trailer trucks (5 axles) 1.33 Single trailer trucks (6 or more axles) 0.73 Multi trailer trucks (5 or less axles) 0.11 Multi trailer trucks (6 axles) 0.14 Multi trailer trucks (7 or more axles) 0.29

277
Location: OR99E; MP 21.64; ALBANY-JUNCTION CITY HIGHWAY NO. 58; 2.28 miles south of Halsey-Sweet Home Highway No. 212 (OR228)
Site Name: Halsey (22-012) Installed: March, 1954
HISTORICAL TRAFFIC DATA
Percent of ADT
Year ADT Max Day
Max Hour
10TH Hour
20TH Hour
30TH Hour
2003 3278 184 39.1 11.7 11.1 10.7 2004 3314 137 15.0 11.2 10.9 10.8 2005 3385 141 14.9 11.6 11.0 10.8 2006 3433 140 18.8 12.1 11.4 11.0 2007 3499 139 21.9 11.3 11.0 10.9 2008 2549 *** *** *** *** *** 2009 2361 *** *** *** *** *** 2010 2985 137 19.1 11.9 11.4 11.1 2011 3101 145 13.9 12.0 11.5 11.2 2012 3110 146 12.6 11.7 11.3 11.1
HISTORICAL ADT BY YEAR
0
1000
2000
3000
4000
03 04 05 06 07 08 09 10 11 12
Year
ADT
*Construction near ATR during the 2008-2009 count season 2012 TRAFFIC DATA
Average Weekday Traffic
Percent of ADT
Average Daily
Traffic Percent of ADT
January 2871 92 2679 86 February 3121 100 2907 93 March 2986 96 2836 91 April 3224 104 3083 99 May 3267 105 3145 101 June 3449 111 3284 106 July 3671 118 3504 113 August 3775 121 3631 117 September 3503 113 3329 107 October 3417 110 3209 103 November 3221 104 2924 94 December 2979 96 2794 90
Classification Breakdown Percent of ADT
Motorcyles 1.60 Passenger cars 51.49 Light Trucks 18.95 Buses 2.47 Single unit trucks (2 axles) 9.82 Single unit trucks (3 axles) 1.24 Single unit trucks (4 or more axles) 0.18 Single trailer trucks (4 or less axles) 3.85 Single trailer trucks (5 axles) 4.55 Single trailer trucks (6 or more axles) 3.69 Multi trailer trucks (5 or less axles) 0.19 Multi trailer trucks (6 axles) 0.11 Multi trailer trucks (7 or more axles) 1.86
Location: US20; MP 19.05; SANTIAM HIGHWAY NO. 16; 0.38 mile southeast of Sodaville-
Waterloo Drive, southeast of Lebanon Site Name: Waterloo (22-013)
Installed: October, 1956
HISTORICAL TRAFFIC DATA
Percent of ADT
Year ADT Max Day
Max Hour
10TH Hour
20TH Hour
30TH Hour
2003 12159 151 12.0 10.7 10.5 10.2 2004 12145 148 11.5 10.7 10.5 10.3 2005 12126 150 11.2 10.6 10.4 10.2 2006 12061 148 11.5 10.5 10.3 10.0 2007 12064 150 11.7 10.9 10.5 10.4 2008 11443 154 12.1 10.6 10.4 10.3 2009 11627 161 12.4 11.0 10.6 10.4 2010 11629 154 12.0 11.0 10.7 10.4 2011 11241 154 11.9 11.3 10.8 10.6 2012 11083 165 13.5 11.5 10.9 10.7
HISTORICAL ADT BY YEAR
02000400060008000
100001200014000
03 04 05 06 07 08 09 10 11 12
Year
ADT
2012 TRAFFIC DATA
Average Weekday Traffic
Percent of ADT
Average Daily
Traffic Percent of ADT
January 10352 93 9754 88 February 11128 100 10549 95 March 10310 93 9997 90 April 11312 102 10981 99 May 11717 106 11511 104 June 12090 109 11844 107 July 12596 114 12700 115 August 12725 115 13064 118 September 11843 107 11598 105 October 11324 102 10749 97 November 10800 97 10203 92 December 10502 95 10052 91
Classification Breakdown Percent of ADT
Motorcyles 0.00 Passenger cars 76.59 Light Trucks 18.68 Buses 0.32 Single unit trucks (2 axles) 1.81 Single unit trucks (3 axles) 0.99 Single unit trucks (4 or more axles) 0.06 Single trailer trucks (4 or less axles) 0.07 Single trailer trucks (5 axles) 0.67 Single trailer trucks (6 or more axles) 0.53 Multi trailer trucks (5 or less axles) 0.01 Multi trailer trucks (6 axles) 0.04 Multi trailer trucks (7 or more axles) 0.23

278
Location: I-5; MP 214.56; PACIFIC HIGHWAY NO. 1; 2.01 miles south of Halsey-Sweet Home Highway No. 212 Interchange (OR228)
Site Name: Lake Creek (22-016) Installed: January, 1994
HISTORICAL TRAFFIC DATA
Percent of ADT
Year ADT Max Day
Max Hour
10TH Hour
20TH Hour
30TH Hour
2003 37990 153 12.6 11.6 11.1 10.8 2004 38055 156 12.7 11.2 10.7 10.5 2005 38149 158 12.7 11.2 10.9 10.4 2006 38200 152 12.7 11.3 10.7 10.5 2007 38218 155 12.4 11.3 10.7 10.4 2008 36157 161 13.4 12.3 11.1 10.7 2009 37401 153 12.8 11.5 11.1 10.7 2010 37883 141 12.3 11.4 10.9 10.7 2011 36875 145 12.3 11.7 11.2 10.8 2012 36188 150 12.3 11.4 11.0 10.8
HISTORICAL ADT BY YEAR
0
10000
20000
30000
40000
50000
03 04 05 06 07 08 09 10 11 12
Year
ADT
2012 TRAFFIC DATA
Average Weekday Traffic
Percent of ADT
Average Daily
Traffic Percent of ADT
January 28760 79 29576 82 February 30595 85 31819 88 March 31902 88 33378 92 April 33071 91 35291 98 May 34662 96 36163 100 June 38898 107 40471 112 July 39745 110 42120 116 August 40487 112 42675 118 September 36401 101 39081 108 October 32980 91 35491 98 November 34001 94 35414 98 December 31826 88 32774 91
Classification Breakdown Percent of ADT
Motorcyles 0.52 Passenger cars 46.36 Light Trucks 26.34 Buses 0.22 Single unit trucks (2 axles) 3.39 Single unit trucks (3 axles) 0.98 Single unit trucks (4 or more axles) 0.12 Single trailer trucks (4 or less axles) 1.29 Single trailer trucks (5 axles) 13.32 Single trailer trucks (6 or more axles) 4.34 Multi trailer trucks (5 or less axles) 0.41 Multi trailer trucks (6 axles) 0.47 Multi trailer trucks (7 or more axles) 2.24
Location: US20; MP 51.47; SANTIAM HIGHWAY NO. 16; 0.91 mile west of Soda Fork Road Site Name: Upper Soda (22-017)
Installed: May, 1997
HISTORICAL TRAFFIC DATA
Percent of ADT
Year ADT Max Day
Max Hour
10TH Hour
20TH Hour
30TH Hour
2003 1117 252 27.6 25.1 23.1 22.3 2004 1148 242 25.4 23.9 22.5 21.4 2005 1107 240 28.7 23.6 22.4 21.8 2006 1112 231 27.4 23.3 22.3 21.5 2007 1144 254 27.4 24.2 22.6 21.8 2008 1031 248 28.7 25.7 24.1 22.9 2009 1114 244 54.1 26.5 24.3 23.3 2010 1114 242 28.4 25.0 22.9 22.3 2011 1063 249 29.9 25.3 23.2 22.3 2012 1056 240 26.9 24.6 23.3 22.6
HISTORICAL ADT BY YEAR
0200400600800
100012001400
03 04 05 06 07 08 09 10 11 12
Year
ADT
2012 TRAFFIC DATA
Average Weekday Traffic
Percent of ADT
Average Daily
Traffic Percent of ADT
January 423 40 623 59 February 478 45 690 65 March 500 47 685 65 April 526 50 801 76 May 838 79 1142 108 June 1063 101 1336 127 July 1272 120 1624 154 August 1346 127 1697 161 September 1187 112 1473 139 October 841 80 1110 105 November 650 62 873 83 December 504 48 619 59
Classification Breakdown Percent of ADT
Motorcyles 0.43 Passenger cars 59.15 Light Trucks 22.03 Buses 1.91 Single unit trucks (2 axles) 11.10 Single unit trucks (3 axles) 0.43 Single unit trucks (4 or more axles) 0.00 Single trailer trucks (4 or less axles) 4.08 Single trailer trucks (5 axles) 0.78 Single trailer trucks (6 or more axles) 0.00 Multi trailer trucks (5 or less axles) 0.00 Multi trailer trucks (6 axles) 0.00 Multi trailer trucks (7 or more axles) 0.09

279
Location: OR34; MP 3.92; CORVALLIS-LEBANON HIGHWAY NO. 210; 0.89 mile east of Riverside Drive
Site Name: Riverside Drive (22-020) Installed: February, 2004
HISTORICAL TRAFFIC DATA
Percent of ADT
Year ADT Max Day
Max Hour
10TH Hour
20TH Hour
30TH Hour
2003 *** *** *** *** *** *** 2004 *** *** *** *** *** *** 2005 28201 132 11.9 10.7 10.6 10.5 2006 27813 135 12.5 11.0 10.8 10.6 2007 27927 139 13.1 11.2 10.9 10.8 2008 26342 145 13.8 11.6 11.3 11.1 2009 26861 134 12.3 11.2 11.0 10.8 2010 27576 135 12.4 11.2 11.0 10.8 2011 27233 132 11.9 11.2 11.0 10.9 2012 26683 138 12.2 11.1 11.0 10.8
HISTORICAL ADT BY YEAR
0
5000
10000
15000
20000
25000
30000
03 04 05 06 07 08 09 10 11 12
Year
ADT
2012 TRAFFIC DATA
Average Weekday Traffic
Percent of ADT
Average Daily
Traffic Percent of ADT
January 26712 100 24622 92 February 28879 108 27062 101 March 26899 101 25235 95 April 29279 110 27649 104 May 29131 109 27932 105 June 29533 111 27949 105 July 28350 106 26584 100 August 29120 109 27312 102 September 28778 108 27503 103 October 29477 110 28170 106 November 28373 106 27483 103 December 24307 91 22687 85
Classification Breakdown Percent of ADT
Motorcyles 0.33 Passenger cars 72.15 Light Trucks 19.30 Buses 0.88 Single unit trucks (2 axles) 2.88 Single unit trucks (3 axles) 0.85 Single unit trucks (4 or more axles) 0.09 Single trailer trucks (4 or less axles) 0.54 Single trailer trucks (5 axles) 1.88 Single trailer trucks (6 or more axles) 0.70 Multi trailer trucks (5 or less axles) 0.00 Multi trailer trucks (6 axles) 0.02 Multi trailer trucks (7 or more axles) 0.38
Location: US20/OR99E MP 2.14; ALBANY-JUNCTION CITY HIGHWAY NO. 58; 0.28 mile
northeast of Albany-Corvallis Highway No. 31 (US20) Site Name: Central Albany (22-022)
Installed: June, 2005
HISTORICAL TRAFFIC DATA
Percent of ADT
Year ADT Max Day
Max Hour
10TH Hour
20TH Hour
30TH Hour
2003 *** *** *** *** *** *** 2004 *** *** *** *** *** *** 2005 *** *** *** *** *** *** 2006 *** *** *** *** *** *** 2007 39227 123 10.5 10.0 9.8 9.6 2008 37234 126 10.5 10.0 9.9 9.8 2009 36654 131 10.6 10.3 10.0 9.9 2010 35941 124 10.5 10.2 10.1 10.0 2011 35492 126 11.0 10.2 10.0 9.9 2012 35907 *** *** *** *** ***
05000
1000015000200002500030000350004000045000
03 04 05 06 07 08 09 10 11 12
ADT
Year
HISTORICAL ADT BY YEAR
2012 TRAFFIC DATA
Average Weekday Traffic
Percent of ADT
Average Daily
Traffic Percent of ADT
January 36541 102 34124 95 February 38782 108 36396 101 March 37477 104 35473 99 April 39962 111 37487 104 May 39838 111 37604 105 June 39708 111 37206 104 July 37662 105 35374 99 August 38665 108 36247 101 September 37989 106 35873 100 October 38800 108 36400 101 November 37600 105 34700 97 December 36000 100 34000 95
Classification Breakdown Percent of ADT
Motorcyles 0.23 Passenger cars 69.22 Light Trucks 25.95 Buses 0.47 Single unit trucks (2 axles) 1.85 Single unit trucks (3 axles) 0.38 Single unit trucks (4 or more axles) 0.02 Single trailer trucks (4 or less axles) 0.19 Single trailer trucks (5 axles) 1.15 Single trailer trucks (6 or more axles) 0.42 Multi trailer trucks (5 or less axles) 0.00 Multi trailer trucks (6 axles) 0.02 Multi trailer trucks (7 or more axles) 0.10

280
Location: US20/US26 MP 257.86; CENTRAL OREGON HIGHWAY NO. 7; 0.26 mile west of Olds Ferry Ontario Highway No. 455 (OR201)
Site Name: Cairo Junction (23-006) Installed: October, 1954
HISTORICAL TRAFFIC DATA
Percent of ADT
Year ADT Max Day
Max Hour
10TH Hour
20TH Hour
30TH Hour
2003 5130 142 11.2 10.3 10.1 10.0 2004 5080 153 11.5 10.5 10.2 10.0 2005 4941 *** *** *** *** *** 2006 4971 147 11.7 10.3 10.0 9.9 2007 4971 138 12.5 10.5 10.2 10.0 2008 4607 152 11.7 10.6 10.3 10.2 2009 4822 151 11.5 10.5 10.3 10.1 2010 4757 155 11.9 10.8 10.4 10.2 2011 4678 155 11.5 10.8 10.5 10.2 2012 4695 133 11.2 10.4 10.3 10.1
HISTORICAL ADT BY YEAR
0
1000
2000
3000
4000
5000
6000
03 04 05 06 07 08 09 10 11 12
Year
ADT
2012 TRAFFIC DATA
Average Weekday Traffic
Percent of ADT
Average Daily
Traffic Percent of ADT
January 4213 90 3878 83 February 4451 95 4106 87 March 4478 95 4212 90 April 4967 106 4660 99 May 5252 112 4952 105 June 5542 118 5284 113 July 5689 121 5467 116 August 5690 121 5356 114 September 5497 117 5147 110 October 5300 113 5000 106 November 4611 98 4271 91 December 4266 91 4006 85
Classification Breakdown Percent of ADT
Motorcyles 0.96 Passenger cars 57.11 Light Trucks 21.05 Buses 1.50 Single unit trucks (2 axles) 8.87 Single unit trucks (3 axles) 0.77 Single unit trucks (4 or more axles) 0.04 Single trailer trucks (4 or less axles) 3.78 Single trailer trucks (5 axles) 3.68 Single trailer trucks (6 or more axles) 1.15 Multi trailer trucks (5 or less axles) 0.18 Multi trailer trucks (6 axles) 0.13 Multi trailer trucks (7 or more axles) 0.78
Location: US95; MP 91.48; I.O.N. HIGHWAY NO. 456; 6.74 miles north of Blue Mountain Pass
Summit Site Name: Basque (23-012)
Installed: January, 1958
HISTORICAL TRAFFIC DATA
Percent of ADT
Year ADT Max Day
Max Hour
10TH Hour
20TH Hour
30TH Hour
2003 1308 199 21.7 15.2 14.0 12.9 2004 1335 271 36.3 14.5 13.6 12.4 2005 1356 222 21.5 16.7 15.0 13.7 2006 1332 273 36.9 17.3 14.6 14.0 2007 1266 212 22.3 15.4 14.2 13.5 2008 1133 243 31.9 21.2 16.6 15.6 2009 1153 215 22.8 16.6 14.9 14.0 2010 1188 224 30.7 20.5 15.7 14.6 2011 1173 205 21.6 15.7 14.1 13.6 2012 1239 210 21.1 15.2 14.5 13.9
HISTORICAL ADT BY YEAR
0
500
1000
1500
03 04 05 06 07 08 09 10 11 12
Year
ADT
2012 TRAFFIC DATA
Average Weekday Traffic
Percent of ADT
Average Daily
Traffic Percent of ADT
January 800 65 786 63 February 871 70 862 70 March 1045 84 1079 87 April 1139 92 1144 92 May 1315 106 1310 106 June 1459 118 1505 121 July 1588 128 1679 135 August 1573 127 1616 130 September 1347 109 1330 107 October 1256 101 1278 103 November 1220 98 1274 103 December 949 77 1013 82
Classification Breakdown Percent of ADT
Motorcyles 2.03 Passenger cars 43.24 Light Trucks 14.42 Buses 1.36 Single unit trucks (2 axles) 7.06 Single unit trucks (3 axles) 0.77 Single unit trucks (4 or more axles) 0.00 Single trailer trucks (4 or less axles) 8.41 Single trailer trucks (5 axles) 18.55 Single trailer trucks (6 or more axles) 1.29 Multi trailer trucks (5 or less axles) 0.99 Multi trailer trucks (6 axles) 0.40 Multi trailer trucks (7 or more axles) 1.48

281
Location: US20; MP 189.38; CENTRAL OREGON HIGHWAY NO. 7; 0.11 mile east of Juntura-Riverside Road
Site Name: Juntura (23-013) Installed: January, 1958
HISTORICAL TRAFFIC DATA
Percent of ADT
Year ADT Max Day
Max Hour
10TH Hour
20TH Hour
30TH Hour
2003 1267 204 19.7 16.4 15.0 14.3 2004 1291 180 17.9 15.3 14.4 14.0 2005 1257 204 17.2 15.8 14.9 14.6 2006 1236 204 17.5 15.9 15.1 14.5 2007 1272 189 18.4 16.3 15.4 14.9 2008 1118 195 23.3 18.0 16.4 15.7 2009 1171 192 19.2 17.2 16.1 15.5 2010 1187 192 18.8 17.3 16.2 15.8 2011 1146 201 17.6 16.2 15.6 14.9 2012 1155 176 18.6 16.3 15.7 15.1
HISTORICAL ADT BY YEAR
0200400600800
100012001400
03 04 05 06 07 08 09 10 11 12
Year
ADT
2012 TRAFFIC DATA
Average Weekday Traffic
Percent of ADT
Average Daily
Traffic Percent of ADT
January 712 62 709 61 February 743 64 757 66 March 820 71 865 75 April 966 84 994 86 May 1219 106 1226 106 June 1474 128 1539 133 July 1588 137 1693 147 August 1554 134 1643 142 September 1411 122 1428 124 October 1196 104 1232 107 November 970 84 1017 88 December 732 63 763 66
Classification Breakdown Percent of ADT
Motorcyles 1.37 Passenger cars 43.36 Light Trucks 17.09 Buses 1.33 Single unit trucks (2 axles) 7.67 Single unit trucks (3 axles) 0.67 Single unit trucks (4 or more axles) 0.04 Single trailer trucks (4 or less axles) 6.69 Single trailer trucks (5 axles) 13.69 Single trailer trucks (6 or more axles) 2.50 Multi trailer trucks (5 or less axles) 0.70 Multi trailer trucks (6 axles) 0.51 Multi trailer trucks (7 or more axles) 4.38
Location: MP 376.98; OLD OREGON TRAIL NO. 6; 1.03 mile west of Oregon-Idaho State Line Site Name: Snake River (23-014)
Installed: December, 1969
HISTORICAL TRAFFIC DATA
Percent of ADT
Year ADT Max Day
Max Hour
10TH Hour
20TH Hour
30TH Hour
2003 15672 138 10.5 9.9 9.6 9.3 2004 15624 141 11.3 9.9 9.5 9.3 2005 16037 156 11.3 10.0 9.4 9.2 2006 16502 151 11.4 10.0 9.4 9.1 2007 16408 *** *** *** *** *** 2008 15338 141 11.2 10.0 9.4 9.2 2009 16065 139 10.8 10.2 9.7 9.4 2010 16469 143 10.2 10.0 9.6 9.4 2011 16386 147 12.7 9.8 9.6 9.4 2012 16511 *** *** *** *** ***
HISTORICAL ADT BY YEAR
0
5000
10000
15000
20000
03 04 05 06 07 08 09 10 11 12
Year
ADT
2012 TRAFFIC DATA
Average Weekday Traffic
Percent of ADT
Average Daily
Traffic Percent of ADT
January 13771 83 13318 81 February 14808 90 14332 87 March 15652 95 15514 94 April 16505 100 16346 99 May 17279 105 17041 103 June 18609 113 18513 112 July 18782 114 18949 115 August 19090 116 19138 116 September 18007 109 17694 107 October 17375 105 16968 103 November 16069 97 15825 96 December 14365 87 14493 88
Classification Breakdown Percent of ADT
Motorcyles 0.45 Passenger cars 50.93 Light Trucks 19.32 Buses 0.29 Single unit trucks (2 axles) 2.15 Single unit trucks (3 axles) 0.56 Single unit trucks (4 or more axles) 0.01 Single trailer trucks (4 or less axles) 1.90 Single trailer trucks (5 axles) 18.05 Single trailer trucks (6 or more axles) 2.55 Multi trailer trucks (5 or less axles) 0.87 Multi trailer trucks (6 axles) 0.40 Multi trailer trucks (7 or more axles) 2.52

282
Location: I-84; MP 353.47; OLD OREGON TRAIL NO. 6; 1.47 miles south of Baker-Malheur County Line
Site Name: Huntington (23-016) Installed: October, 1967
HISTORICAL TRAFFIC DATA
Percent of ADT
Year ADT Max Day
Max Hour
10TH Hour
20TH Hour
30TH Hour
2003 8705 171 14.0 12.7 11.6 11.1 2004 8691 164 15.2 12.1 11.6 11.2 2005 8771 185 14.2 12.5 11.5 11.1 2006 8784 176 13.4 12.1 11.3 10.9 2007 8902 156 14.5 12.1 11.5 11.2 2008 8182 163 16.0 13.4 11.6 11.1 2009 8528 162 13.3 12.0 11.4 11.2 2010 8744 166 13.5 12.1 11.8 11.5 2011 8580 178 14.1 12.5 11.9 11.4 2012 8614 154 15.4 12.4 11.6 11.4
HISTORICAL ADT BY YEAR
0
2000
4000
6000
8000
10000
03 04 05 06 07 08 09 10 11 12
Year
ADT
2012 TRAFFIC DATA
Average Weekday Traffic
Percent of ADT
Average Daily
Traffic Percent of ADT
January 6130 71 6019 70 February 6635 77 6564 76 March 7639 89 7929 92 April 8180 95 8382 97 May 8964 104 9075 105 June 9905 115 10249 119 July 10334 120 10905 127 August 10534 122 10975 127 September 9480 110 9518 110 October 8651 100 8810 102 November 7912 92 8053 93 December 6716 78 6889 80
Classification Breakdown Percent of ADT
Motorcyles 0.18 Passenger cars 32.47 Light Trucks 12.00 Buses 0.25 Single unit trucks (2 axles) 2.48 Single unit trucks (3 axles) 0.53 Single unit trucks (4 or more axles) 0.48 Single trailer trucks (4 or less axles) 3.09 Single trailer trucks (5 axles) 36.52 Single trailer trucks (6 or more axles) 4.61 Multi trailer trucks (5 or less axles) 0.68 Multi trailer trucks (6 axles) 0.54 Multi trailer trucks (7 or more axles) 6.17
Location: OR99E; MP 34.03; PACIFIC HIGHWAY EAST NO. 81; 1.16 miles south of Hillsboro-
Silverton Highway No. 140 (OR214) Site Name: Woodburn (24-001)
Installed: January, 1937
HISTORICAL TRAFFIC DATA
Percent of ADT
Year ADT Max Day
Max Hour
10TH Hour
20TH Hour
30TH Hour
2003 10676 141 12.5 11.2 10.7 10.5 2004 10810 132 12.2 11.0 10.7 10.6 2005 10301 *** *** *** *** *** 2006 10748 128 13.4 11.2 10.9 10.7 2007 10954 126 13.0 11.8 11.3 11.1 2008 10254 128 11.9 11.4 11.2 11.0 2009 10263 139 15.9 11.1 10.9 10.6 2010 10224 131 13.4 11.6 11.3 11.1 2011 10147 126 14.7 11.9 11.4 11.2 2012 10050 *** *** *** *** ***
HISTORICAL ADT BY YEAR
0
2000
4000
6000
8000
10000
12000
03 04 05 06 07 08 09 10 11 12
Year
ADT
2012: No data May-Dec due to Construction. 2012 TRAFFIC DATA
Average Weekday Traffic
Percent of ADT
Average Daily
Traffic Percent of ADT
January 9126 91 8790 87 February 9771 97 9419 94 March 9611 96 9439 94 April 10153 101 10224 102 May 10600 105 10400 103 June 10800 107 10500 104 July 11400 113 11000 109 August 11600 115 11200 111 September 11100 110 10800 107 October 10800 107 10600 105 November 9800 98 9400 94 December 8876 88 8825 88
Classification Breakdown Percent of ADT
Motorcyles 0.50 Passenger cars 67.29 Light Trucks 24.27 Buses 0.42 Single unit trucks (2 axles) 3.39 Single unit trucks (3 axles) 0.88 Single unit trucks (4 or more axles) 0.07 Single trailer trucks (4 or less axles) 0.47 Single trailer trucks (5 axles) 2.06 Single trailer trucks (6 or more axles) 0.39 Multi trailer trucks (5 or less axles) 0.02 Multi trailer trucks (6 axles) 0.02 Multi trailer trucks (7 or more axles) 0.22

283
Location: OR22; MP 2.82; NORTH SANTIAM HIGHWAY NO. 162; 0.91 mile east of Lancaster Drive Interchange
Site Name: North Santiam (24-004) Installed: January, 1967
HISTORICAL TRAFFIC DATA
Percent of ADT
Year ADT Max Day
Max Hour
10TH Hour
20TH Hour
30TH Hour
2003 24196 136 11.0 10.6 10.4 10.2 2004 24414 139 11.1 10.6 10.4 10.2 2005 25361 141 11.3 10.7 10.6 10.3 2006 26062 133 10.8 10.4 10.1 10.0 2007 25999 134 10.9 10.5 10.3 10.2 2008 24427 134 11.2 10.6 10.4 10.3 2009 25014 135 10.8 10.5 10.3 10.2 2010 24911 134 10.8 10.5 10.3 10.2 2011 24313 137 10.9 10.6 10.4 10.2 2012 24107 135 11.2 10.7 10.5 10.3
HISTORICAL ADT BY YEAR
0
5000
10000
15000
20000
25000
30000
03 04 05 06 07 08 09 10 11 12
Year
ADT
2012 TRAFFIC DATA
Average Weekday Traffic
Percent of ADT
Average Daily
Traffic Percent of ADT
January 22072 92 21045 87 February 23587 98 22466 93 March 22669 94 21832 91 April 24355 101 23617 98 May 25184 104 24779 103 June 26414 110 25805 107 July 27426 114 27521 114 August 28387 118 28470 118 September 26440 110 26567 110 October 24800 103 24000 100 November 23210 96 21652 90 December 22477 93 21524 89
Classification Breakdown Percent of ADT
Motorcyles 0.83 Passenger cars 60.84 Light Trucks 30.65 Buses 0.62 Single unit trucks (2 axles) 2.71 Single unit trucks (3 axles) 1.01 Single unit trucks (4 or more axles) 0.02 Single trailer trucks (4 or less axles) 0.55 Single trailer trucks (5 axles) 1.91 Single trailer trucks (6 or more axles) 0.47 Multi trailer trucks (5 or less axles) 0.01 Multi trailer trucks (6 axles) 0.04 Multi trailer trucks (7 or more axles) 0.34
Location: OR22; MP 10.02; NORTH SANTIAM HIGHWAY NO. 162; 1.08 miles east of Shaw
Highway Interchange Site Name: Aumsville (24-005)
Installed: January, 2001
HISTORICAL TRAFFIC DATA
Percent of ADT
Year ADT Max Day
Max Hour
10TH Hour
20TH Hour
30TH Hour
2003 19988 143 11.9 11.1 11.0 10.8 2004 20482 146 11.8 11.2 10.8 10.6 2005 20825 143 11.8 11.3 10.9 10.7 2006 20902 140 11.8 10.9 10.7 10.6 2007 20650 139 11.8 11.1 10.9 10.8 2008 19241 142 12.0 11.2 11.0 10.9 2009 19304 140 12.1 11.2 11.0 10.8 2010 19295 141 11.8 11.4 11.1 11.0 2011 19073 144 11.9 11.5 11.2 11.0 2012 19169 144 12.7 11.8 11.7 11.4
HISTORICAL ADT BY YEAR
0
5000
10000
15000
20000
25000
03 04 05 06 07 08 09 10 11 12
Year
ADT
2012 TRAFFIC DATA
Average Weekday Traffic
Percent of ADT
Average Daily
Traffic Percent of ADT
January 16866 88 16115 84 February 18089 94 17328 90 March 17279 90 16788 88 April 18832 98 18395 96 May 19634 102 19504 102 June 20909 109 20665 108 July 22553 118 23064 120 August 23266 121 23924 125 September 20924 109 20950 109 October 19510 102 18824 98 November 18453 96 17464 91 December 17590 92 17006 89
Classification Breakdown Percent of ADT
Motorcyles 0.82 Passenger cars 70.61 Light Trucks 20.81 Buses 0.09 Single unit trucks (2 axles) 2.14 Single unit trucks (3 axles) 1.28 Single unit trucks (4 or more axles) 0.04 Single trailer trucks (4 or less axles) 0.74 Single trailer trucks (5 axles) 1.96 Single trailer trucks (6 or more axles) 0.87 Multi trailer trucks (5 or less axles) 0.00 Multi trailer trucks (6 axles) 0.01 Multi trailer trucks (7 or more axles) 0.63

284
Location: OR22; MP 33.69; NORTH SANTIAM HIGHWAY NO. 162; 0.95 mile west of Railroad Avenue SE (Entrance to Minto County Park)
Site Name: Gates (24-013) Installed: January, 2001
HISTORICAL TRAFFIC DATA
Percent of ADT
Year ADT Max Day
Max Hour
10TH Hour
20TH Hour
30TH Hour
2003 4705 286 31.1 27.2 26.0 24.8 2004 4990 252 27.4 25.1 24.2 23.2 2005 4977 262 27.3 25.3 24.2 23.0 2006 4959 252 26.9 24.4 23.4 22.7 2007 4872 251 26.6 25.4 24.2 23.5 2008 4474 273 32.0 27.3 26.4 25.5 2009 4690 259 28.2 26.6 25.1 23.9 2010 4741 271 29.7 27.1 25.9 24.5 2011 4687 275 29.8 28.2 26.1 24.7 2012 4701 278 30.1 28.6 26.9 25.3
HISTORICAL ADT BY YEAR
0
1000
2000
3000
4000
5000
6000
03 04 05 06 07 08 09 10 11 12
Year
ADT
2012 TRAFFIC DATA
Average Weekday Traffic
Percent of ADT
Average Daily
Traffic Percent of ADT
January 2200 47 2800 60 February 2544 54 3095 66 March 2590 55 3160 67 April 2972 63 3816 81 May 4263 91 5240 111 June 4853 103 5947 127 July 6142 131 7744 165 August 6206 132 8002 170 September 4841 103 5830 124 October 3567 76 4303 92 November 3015 64 3411 73 December 2750 59 3061 65
Classification Breakdown Percent of ADT
Motorcyles 0.29 Passenger cars 56.58 Light Trucks 18.76 Buses 2.57 Single unit trucks (2 axles) 10.06 Single unit trucks (3 axles) 0.37 Single unit trucks (4 or more axles) 0.04 Single trailer trucks (4 or less axles) 8.11 Single trailer trucks (5 axles) 1.62 Single trailer trucks (6 or more axles) 0.55 Multi trailer trucks (5 or less axles) 0.64 Multi trailer trucks (6 axles) 0.13 Multi trailer trucks (7 or more axles) 0.28
Location: OR22; MP 25.90; WILLAMINA-SALEM HIGHWAY NO. 30; 0.38 mile west of Salem
Highway No. 72 (OR22), Polk-Marion County Line Site Name: Salem Bridges (24-014)
Installed: January, 1953
HISTORICAL TRAFFIC DATA
Percent of ADT
Year ADT Max Day
Max Hour
10TH Hour
20TH Hour
30TH Hour
2003 85000 121 10.4 9.5 9.3 9.3 2004 84212 121 35.7 9.8 9.6 9.6 2005 86727 120 9.7 9.6 9.6 9.5 2006 88808 118 9.9 9.6 9.4 9.4 2007 88374 119 9.9 9.5 9.4 9.4 2008 85405 122 10.1 9.7 9.6 9.5 2009 85929 *** *** *** *** *** 2010 85100 121 9.6 9.4 9.3 9.3 2011 83816 120 10.5 9.4 9.3 9.3 2012 84116 121 9.9 9.8 9.7 9.6
HISTORICAL ADT BY YEAR
0
20000
40000
60000
80000
100000
03 04 05 06 07 08 09 10 11 12
Year
ADT
2012 TRAFFIC DATA
Average Weekday Traffic
Percent of ADT
Average Daily
Traffic Percent of ADT
January 84213 100 79469 94 February 88427 105 83907 100 March 84371 100 81145 96 April 90950 108 86771 103 May 89889 107 86683 103 June 91751 109 87623 104 July 89844 107 86021 102 August 91429 109 87230 104 September 89517 106 85781 102 October 89629 107 84422 100 November 85626 102 80431 96 December 83565 99 79908 95
Classification Breakdown Percent of ADT
Motorcyles 0.34 Passenger cars 49.88 Light Trucks 18.14 Buses 0.34 Single unit trucks (2 axles) 2.94 Single unit trucks (3 axles) 0.71 Single unit trucks (4 or more axles) 0.28 Single trailer trucks (4 or less axles) 1.78 Single trailer trucks (5 axles) 19.29 Single trailer trucks (6 or more axles) 2.50 Multi trailer trucks (5 or less axles) 0.35 Multi trailer trucks (6 axles) 0.28 Multi trailer trucks (7 or more axles) 3.20

285
Location: OR22; MP 51.30; NORTH SANTIAM HIGHWAY NO. 162; 1.20 miles east of Detroit Avenue
Site Name: Detroit (24-015) Installed: May, 1997
HISTORICAL TRAFFIC DATA
Percent of ADT
Year ADT Max Day
Max Hour
10TH Hour
20TH Hour
30TH Hour
2003 4055 268 30.7 27.2 25.3 24.3 2004 4294 240 27.4 24.5 23.3 22.8 2005 4307 250 26.6 24.4 23.6 22.5 2006 4283 240 26.7 24.1 22.8 21.8 2007 4194 242 27.5 25.0 24.2 23.4 2008 3779 263 31.2 27.2 25.7 24.8 2009 3996 *** *** *** *** *** 2010 4049 256 29.1 27.3 26.3 24.7 2011 3989 264 29.9 27.6 25.8 24.7 2012 3939 268 30.8 29.1 27.3 25.9
HISTORICAL ADT BY YEAR
0
1000
2000
3000
4000
5000
03 04 05 06 07 08 09 10 11 12
Year
ADT
2012 TRAFFIC DATA
Average Weekday Traffic
Percent of ADT
Average Daily
Traffic Percent of ADT
January 1854 47 2308 59 February 2077 53 2626 67 March 2152 55 2706 69 April 2351 60 3132 80 May 3300 84 4200 107 June 3963 101 4927 125 July 5023 128 6456 164 August 5294 134 6779 172 September 4060 103 4969 126 October 2996 76 3726 95 November 2472 63 2900 74 December 2193 56 2535 64
Classification Breakdown Percent of ADT
Motorcyles 0.59 Passenger cars 59.11 Light Trucks 18.43 Buses 1.41 Single unit trucks (2 axles) 8.18 Single unit trucks (3 axles) 0.44 Single unit trucks (4 or more axles) 0.04 Single trailer trucks (4 or less axles) 6.07 Single trailer trucks (5 axles) 3.20 Single trailer trucks (6 or more axles) 1.03 Multi trailer trucks (5 or less axles) 0.56 Multi trailer trucks (6 axles) 0.31 Multi trailer trucks (7 or more axles) 0.63
Location: OR551; MP 3.70; WILSONVILLE-HUBBARD HIGHWAY NO. 51; 0.22 mile south of
Ehlen Road Site Name: Hubbard (24-016)
Installed: January, 1954
HISTORICAL TRAFFIC DATA
Percent of ADT
Year ADT Max Day
Max Hour
10TH Hour
20TH Hour
30TH Hour
2003 7823 125 11.5 10.7 10.5 10.5 2004 8095 144 13.9 11.1 10.8 10.6 2005 8074 133 15.2 11.0 10.7 10.5 2006 8167 136 16.5 10.7 10.4 10.3 2007 8210 126 11.6 10.7 10.5 10.4 2008 7821 125 11.8 11.0 10.9 10.8 2009 7724 127 14.4 10.9 10.7 10.5 2010 7731 121 11.2 10.9 10.7 10.5 2011 7744 125 11.6 10.7 10.5 10.4 2012 8008 132 11.6 10.9 10.6 10.4
HISTORICAL ADT BY YEAR
0
2000
4000
6000
8000
10000
03 04 05 06 07 08 09 10 11 12
Year
ADT
2012 TRAFFIC DATA
Average Weekday Traffic
Percent of ADT
Average Daily
Traffic Percent of ADT
January 7847 98 7217 90 February 8373 105 7643 95 March 8466 106 7775 97 April 8892 111 8348 104 May 8822 110 8196 102 June 9014 113 8307 104 July 9015 113 8312 104 August 9297 116 8453 106 September 8860 111 8310 104 October 8881 111 8147 102 November 8654 108 7787 97 December 8081 101 7601 95
Classification Breakdown Percent of ADT
Motorcyles 0.07 Passenger cars 56.02 Light Trucks 31.51 Buses 0.26 Single unit trucks (2 axles) 3.53 Single unit trucks (3 axles) 1.11 Single unit trucks (4 or more axles) 0.14 Single trailer trucks (4 or less axles) 0.25 Single trailer trucks (5 axles) 4.77 Single trailer trucks (6 or more axles) 1.39 Multi trailer trucks (5 or less axles) 0.00 Multi trailer trucks (6 axles) 0.04 Multi trailer trucks (7 or more axles) 0.91
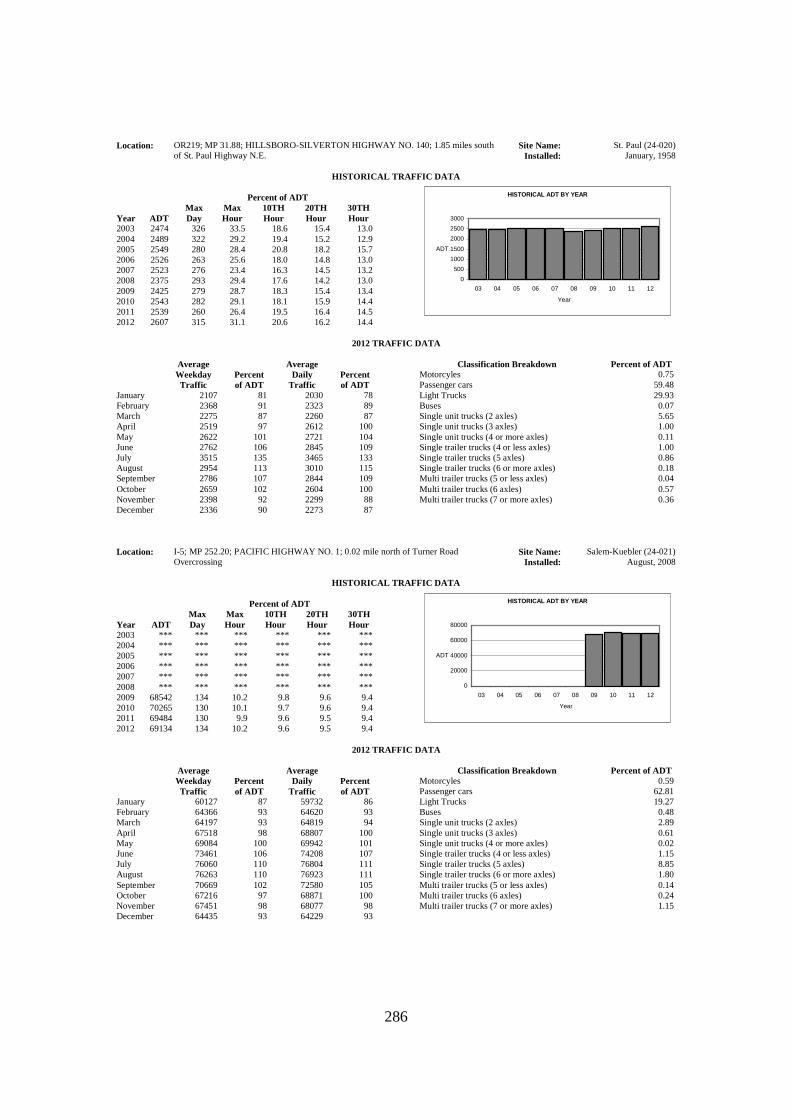
286
Location: OR219; MP 31.88; HILLSBORO-SILVERTON HIGHWAY NO. 140; 1.85 miles south of St. Paul Highway N.E.
Site Name: St. Paul (24-020) Installed: January, 1958
HISTORICAL TRAFFIC DATA
Percent of ADT
Year ADT Max Day
Max Hour
10TH Hour
20TH Hour
30TH Hour
2003 2474 326 33.5 18.6 15.4 13.0 2004 2489 322 29.2 19.4 15.2 12.9 2005 2549 280 28.4 20.8 18.2 15.7 2006 2526 263 25.6 18.0 14.8 13.0 2007 2523 276 23.4 16.3 14.5 13.2 2008 2375 293 29.4 17.6 14.2 13.0 2009 2425 279 28.7 18.3 15.4 13.4 2010 2543 282 29.1 18.1 15.9 14.4 2011 2539 260 26.4 19.5 16.4 14.5 2012 2607 315 31.1 20.6 16.2 14.4
HISTORICAL ADT BY YEAR
0
500
1000
1500
2000
2500
3000
03 04 05 06 07 08 09 10 11 12
Year
ADT
2012 TRAFFIC DATA
Average Weekday Traffic
Percent of ADT
Average Daily
Traffic Percent of ADT
January 2107 81 2030 78 February 2368 91 2323 89 March 2275 87 2260 87 April 2519 97 2612 100 May 2622 101 2721 104 June 2762 106 2845 109 July 3515 135 3465 133 August 2954 113 3010 115 September 2786 107 2844 109 October 2659 102 2604 100 November 2398 92 2299 88 December 2336 90 2273 87
Classification Breakdown Percent of ADT
Motorcyles 0.75 Passenger cars 59.48 Light Trucks 29.93 Buses 0.07 Single unit trucks (2 axles) 5.65 Single unit trucks (3 axles) 1.00 Single unit trucks (4 or more axles) 0.11 Single trailer trucks (4 or less axles) 1.00 Single trailer trucks (5 axles) 0.86 Single trailer trucks (6 or more axles) 0.18 Multi trailer trucks (5 or less axles) 0.04 Multi trailer trucks (6 axles) 0.57 Multi trailer trucks (7 or more axles) 0.36
Location: I-5; MP 252.20; PACIFIC HIGHWAY NO. 1; 0.02 mile north of Turner Road
Overcrossing Site Name: Salem-Kuebler (24-021)
Installed: August, 2008
HISTORICAL TRAFFIC DATA
Percent of ADT
Year ADT Max Day
Max Hour
10TH Hour
20TH Hour
30TH Hour
2003 *** *** *** *** *** *** 2004 *** *** *** *** *** *** 2005 *** *** *** *** *** *** 2006 *** *** *** *** *** *** 2007 *** *** *** *** *** *** 2008 *** *** *** *** *** *** 2009 68542 134 10.2 9.8 9.6 9.4 2010 70265 130 10.1 9.7 9.6 9.4 2011 69484 130 9.9 9.6 9.5 9.4 2012 69134 134 10.2 9.6 9.5 9.4
HISTORICAL ADT BY YEAR
0
20000
40000
60000
80000
03 04 05 06 07 08 09 10 11 12
Year
ADT
2012 TRAFFIC DATA
Average Weekday Traffic
Percent of ADT
Average Daily
Traffic Percent of ADT
January 60127 87 59732 86 February 64366 93 64620 93 March 64197 93 64819 94 April 67518 98 68807 100 May 69084 100 69942 101 June 73461 106 74208 107 July 76060 110 76804 111 August 76263 110 76923 111 September 70669 102 72580 105 October 67216 97 68871 100 November 67451 98 68077 98 December 64435 93 64229 93
Classification Breakdown Percent of ADT
Motorcyles 0.59 Passenger cars 62.81 Light Trucks 19.27 Buses 0.48 Single unit trucks (2 axles) 2.89 Single unit trucks (3 axles) 0.61 Single unit trucks (4 or more axles) 0.02 Single trailer trucks (4 or less axles) 1.15 Single trailer trucks (5 axles) 8.85 Single trailer trucks (6 or more axles) 1.80 Multi trailer trucks (5 or less axles) 0.14 Multi trailer trucks (6 axles) 0.24 Multi trailer trucks (7 or more axles) 1.15

287
Location: OR99EBUS; MP 0.67; SALEM HIGHWAY NO. 72; 0.87 mile north of Hyacinth Street N.E.
Site Name: Salem Parkway (24-022) Installed: June, 2009
HISTORICAL TRAFFIC DATA
Percent of ADT
Year ADT Max Day
Max Hour
10TH Hour
20TH Hour
30TH Hour
2003 *** *** *** *** *** *** 2004 *** *** *** *** *** *** 2005 *** *** *** *** *** *** 2006 *** *** *** *** *** *** 2007 *** *** *** *** *** *** 2008 *** *** *** *** *** *** 2009 *** *** *** *** *** *** 2010 20881 125 10.8 10.2 10.1 10.0 2011 20597 123 11.2 10.2 10.0 9.9 2012 20467 133 11.3 10.5 10.0 10.0
HISTORICAL ADT BY YEAR
0
5000
10000
15000
20000
25000
03 04 05 06 07 08 09 10 11 12
Year
ADT
2012 TRAFFIC DATA
Average Weekday Traffic
Percent of ADT
Average Daily
Traffic Percent of ADT
January 19221 94 18227 89 February 21049 103 20018 98 March 20345 99 19521 95 April 22480 110 21577 105 May 21640 106 21021 103 June 22153 108 21229 104 July 22014 108 21257 104 August 22876 112 21836 107 September 21945 107 21159 103 October 21437 105 20509 100 November 20785 102 19668 96 December 20494 100 19580 96
Classification Breakdown Percent of ADT
Motorcyles 0.86 Passenger cars 71.18 Light Trucks 17.93 Buses 0.57 Single unit trucks (2 axles) 3.04 Single unit trucks (3 axles) 1.02 Single unit trucks (4 or more axles) 0.03 Single trailer trucks (4 or less axles) 0.39 Single trailer trucks (5 axles) 2.31 Single trailer trucks (6 or more axles) 1.66 Multi trailer trucks (5 or less axles) 0.06 Multi trailer trucks (6 axles) 0.05 Multi trailer trucks (7 or more axles) 0.90
Location: OR74; MP 37.83; HEPPNER HIGHWAY NO. 52; 1.38 miles southeast of Lexington-
Echo Highway No. 320 (OR207) Site Name: Lexington (25-007)
Installed: August, 1957
HISTORICAL TRAFFIC DATA
Percent of ADT
Year ADT Max Day
Max Hour
10TH Hour
20TH Hour
30TH Hour
2003 1543 170 14.1 12.2 11.6 11.3 2004 1525 189 32.6 13.5 12.1 11.6 2005 1446 153 17.1 12.9 12.0 11.7 2006 1382 177 17.9 13.8 12.2 11.6 2007 1397 194 21.4 13.7 12.0 11.7 2008 1340 165 19.0 12.8 12.2 11.9 2009 1390 *** *** *** *** *** 2010 1379 174 16.9 13.2 12.4 12.0 2011 1392 158 15.2 12.9 12.1 11.7 2012 1327 160 16.5 12.9 12.1 11.8
HISTORICAL ADT BY YEAR
0
500
1000
1500
2000
03 04 05 06 07 08 09 10 11 12
Year
ADT
2012 TRAFFIC DATA
Average Weekday Traffic
Percent of ADT
Average Daily
Traffic Percent of ADT
January 1286 97 1150 87 February 1360 103 1220 92 March 1361 103 1274 96 April 1472 111 1325 100 May 1525 115 1409 106 June 1553 117 1435 108 July 1450 109 1357 102 August 1543 116 1441 109 September 1547 117 1456 110 October 1517 114 1397 105 November 1387 105 1268 96 December 1280 97 1186 89
Classification Breakdown Percent of ADT
Motorcyles 0.14 Passenger cars 55.70 Light Trucks 22.81 Buses 1.18 Single unit trucks (2 axles) 15.92 Single unit trucks (3 axles) 0.45 Single unit trucks (4 or more axles) 0.00 Single trailer trucks (4 or less axles) 2.75 Single trailer trucks (5 axles) 0.70 Single trailer trucks (6 or more axles) 0.14 Multi trailer trucks (5 or less axles) 0.07 Multi trailer trucks (6 axles) 0.00 Multi trailer trucks (7 or more axles) 0.14
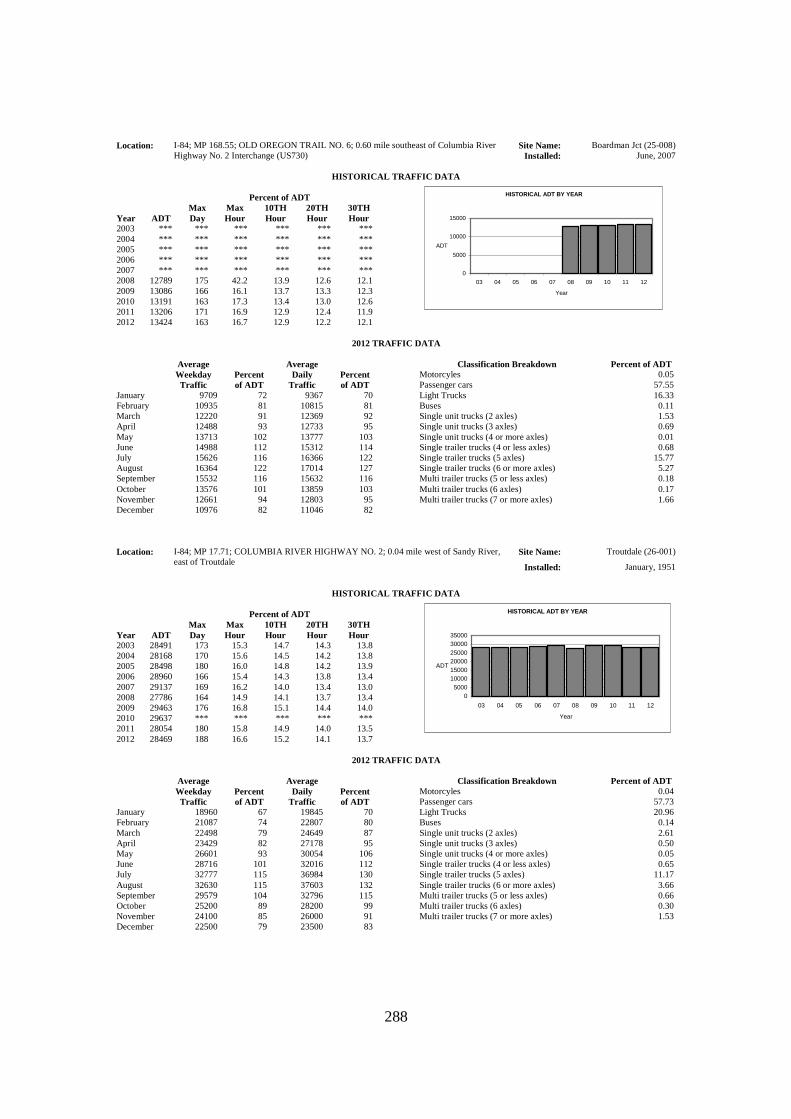
288
Location: I-84; MP 168.55; OLD OREGON TRAIL NO. 6; 0.60 mile southeast of Columbia River Highway No. 2 Interchange (US730)
Site Name: Boardman Jct (25-008) Installed: June, 2007
HISTORICAL TRAFFIC DATA
Percent of ADT
Year ADT Max Day
Max Hour
10TH Hour
20TH Hour
30TH Hour
2003 *** *** *** *** *** *** 2004 *** *** *** *** *** *** 2005 *** *** *** *** *** *** 2006 *** *** *** *** *** *** 2007 *** *** *** *** *** *** 2008 12789 175 42.2 13.9 12.6 12.1 2009 13086 166 16.1 13.7 13.3 12.3 2010 13191 163 17.3 13.4 13.0 12.6 2011 13206 171 16.9 12.9 12.4 11.9 2012 13424 163 16.7 12.9 12.2 12.1
HISTORICAL ADT BY YEAR
0
5000
10000
15000
03 04 05 06 07 08 09 10 11 12
Year
ADT
2012 TRAFFIC DATA
Average Weekday Traffic
Percent of ADT
Average Daily
Traffic Percent of ADT
January 9709 72 9367 70 February 10935 81 10815 81 March 12220 91 12369 92 April 12488 93 12733 95 May 13713 102 13777 103 June 14988 112 15312 114 July 15626 116 16366 122 August 16364 122 17014 127 September 15532 116 15632 116 October 13576 101 13859 103 November 12661 94 12803 95 December 10976 82 11046 82
Classification Breakdown Percent of ADT
Motorcyles 0.05 Passenger cars 57.55 Light Trucks 16.33 Buses 0.11 Single unit trucks (2 axles) 1.53 Single unit trucks (3 axles) 0.69 Single unit trucks (4 or more axles) 0.01 Single trailer trucks (4 or less axles) 0.68 Single trailer trucks (5 axles) 15.77 Single trailer trucks (6 or more axles) 5.27 Multi trailer trucks (5 or less axles) 0.18 Multi trailer trucks (6 axles) 0.17 Multi trailer trucks (7 or more axles) 1.66
Location: I-84; MP 17.71; COLUMBIA RIVER HIGHWAY NO. 2; 0.04 mile west of Sandy River,
east of Troutdale
Site Name: Troutdale (26-001)
Installed: January, 1951
HISTORICAL TRAFFIC DATA
Percent of ADT
Year ADT Max Day
Max Hour
10TH Hour
20TH Hour
30TH Hour
2003 28491 173 15.3 14.7 14.3 13.8 2004 28168 170 15.6 14.5 14.2 13.8 2005 28498 180 16.0 14.8 14.2 13.9 2006 28960 166 15.4 14.3 13.8 13.4 2007 29137 169 16.2 14.0 13.4 13.0 2008 27786 164 14.9 14.1 13.7 13.4 2009 29463 176 16.8 15.1 14.4 14.0 2010 29637 *** *** *** *** *** 2011 28054 180 15.8 14.9 14.0 13.5 2012 28469 188 16.6 15.2 14.1 13.7
HISTORICAL ADT BY YEAR
05000
100001500020000250003000035000
03 04 05 06 07 08 09 10 11 12
Year
ADT
2012 TRAFFIC DATA
Average Weekday Traffic
Percent of ADT
Average Daily
Traffic Percent of ADT
January 18960 67 19845 70 February 21087 74 22807 80 March 22498 79 24649 87 April 23429 82 27178 95 May 26601 93 30054 106 June 28716 101 32016 112 July 32777 115 36984 130 August 32630 115 37603 132 September 29579 104 32796 115 October 25200 89 28200 99 November 24100 85 26000 91 December 22500 79 23500 83
Classification Breakdown Percent of ADT
Motorcyles 0.04 Passenger cars 57.73 Light Trucks 20.96 Buses 0.14 Single unit trucks (2 axles) 2.61 Single unit trucks (3 axles) 0.50 Single unit trucks (4 or more axles) 0.05 Single trailer trucks (4 or less axles) 0.65 Single trailer trucks (5 axles) 11.17 Single trailer trucks (6 or more axles) 3.66 Multi trailer trucks (5 or less axles) 0.66 Multi trailer trucks (6 axles) 0.30 Multi trailer trucks (7 or more axles) 1.53

289
Location: US26; MP 73.75; SUNSET HIGHWAY NO. 47; 0.20 mile west of Stadium Freeway No. 61 (I-405), at the Vista Ridge Tunnels
Site Name: Vista Ridge Tunnel (26-002)
Installed: February, 1969
HISTORICAL TRAFFIC DATA
Percent of ADT
Year ADT Max Day
Max Hour
10TH Hour
20TH Hour
30TH Hour
2003 136942 *** *** *** *** *** 2004 135317 *** *** *** *** *** 2005 139325 *** *** *** *** *** 2006 141633 *** *** *** *** *** 2007 141408 *** *** *** *** *** 2008 137150 *** *** *** *** *** 2009 139800 *** *** *** *** *** 2010 138369 *** *** *** *** *** 2011 138937 115 7.9 7.8 7.8 7.7 2012 139387 115 8.1 7.9 7.9 7.8
HISTORICAL ADT BY YEAR
0
50000
100000
150000
03 04 05 06 07 08 09 10 11 12
Year
ADT
2012 TRAFFIC DATA
Average Weekday Traffic
Percent of ADT
Average Daily
Traffic Percent of ADT
January 139199 100 132277 95 February 146231 105 138906 100 March 145007 104 138751 100 April 149644 107 143938 103 May 148830 107 143356 103 June 151590 109 144499 104 July 149230 107 142431 102 August 150197 108 141970 102 September 145652 104 140128 101 October 146291 105 138617 99 November 142786 102 134439 96 December 137524 99 133335 96
Classification Breakdown Percent of ADT
Motorcyles 0.50 Passenger cars 63.44 Light Trucks 20.37 Buses 0.88 Single unit trucks (2 axles) 9.48 Single unit trucks (3 axles) 0.74 Single unit trucks (4 or more axles) 0.02 Single trailer trucks (4 or less axles) 1.57 Single trailer trucks (5 axles) 1.51 Single trailer trucks (6 or more axles) 0.90 Multi trailer trucks (5 or less axles) 0.07 Multi trailer trucks (6 axles) 0.03 Multi trailer trucks (7 or more axles) 0.52
Location: US26; MP 14.36; MT. HOOD HIGHWAY NO. 26; 0.18 mile southeast of SE Powell
Valley Road Site Name: Gresham (26-003)
Installed: March, 1951
HISTORICAL TRAFFIC DATA
Percent of ADT
Year ADT Max Day
Max Hour
10TH Hour
20TH Hour
30TH Hour
2003 39138 125 9.7 9.3 9.2 9.1 2004 37657 127 10.1 9.6 9.4 9.3 2005 33743 126 9.9 9.5 9.3 9.2 2006 33471 123 9.8 9.4 9.2 9.1 2007 33225 127 9.8 9.5 9.3 9.2 2008 31776 130 10.2 9.8 9.6 9.5 2009 32252 124 10.1 9.7 9.4 9.2 2010 32273 126 9.9 9.5 9.3 9.2 2011 30530 126 10.1 9.4 9.3 9.2 2012 29978 129 10.1 9.6 9.4 9.3
HISTORICAL ADT BY YEAR
0
10000
20000
30000
40000
50000
03 04 05 06 07 08 09 10 11 12
Year
ADT
2012 TRAFFIC DATA
Average Weekday Traffic
Percent of ADT
Average Daily
Traffic Percent of ADT
January 28156 94 28350 95 February 29691 99 29620 99 March 29220 97 29144 97 April 30006 100 30277 101 May 29996 100 29736 99 June 31265 104 30690 102 July 31917 106 31990 107 August 32773 109 32802 109 September 31238 104 30830 103 October 29836 100 29073 97 November 28310 94 27411 91 December 29677 99 29809 99
Classification Breakdown Percent of ADT
Motorcyles 1.02 Passenger cars 36.84 Light Trucks 57.40 Buses 0.71 Single unit trucks (2 axles) 2.39 Single unit trucks (3 axles) 0.30 Single unit trucks (4 or more axles) 0.06 Single trailer trucks (4 or less axles) 0.00 Single trailer trucks (5 axles) 0.65 Single trailer trucks (6 or more axles) 0.21 Multi trailer trucks (5 or less axles) 0.02 Multi trailer trucks (6 axles) 0.00 Multi trailer trucks (7 or more axles) 0.40

290
Location: I-5; MP 307.97; PACIFIC HIGHWAY NO. 1; 0.41 mile south of Oregon-Washington State Line
Site Name: Interstate Bridge (26-004)
Installed: January, 1953
HISTORICAL TRAFFIC DATA
Percent of ADT
Year ADT Max Day
Max Hour
10TH Hour
20TH Hour
30TH Hour
2003 124966 121 8.2 7.9 7.8 7.7 2004 124513 126 8.4 8.1 8.0 7.9 2005 127026 120 7.9 7.7 7.6 7.6 2006 127331 119 7.9 7.6 7.5 7.5 2007 126597 119 7.8 7.6 7.6 7.5 2008 121407 121 8.1 7.9 7.8 7.7 2009 121132 121 8.0 7.8 7.8 7.8 2010 123189 118 7.8 7.7 7.6 7.5 2011 123893 118 8.0 7.6 7.5 7.4 2012 124340 117 7.8 7.6 7.5 7.5
HISTORICAL ADT BY YEAR
020000400006000080000
100000120000140000
03 04 05 06 07 08 09 10 11 12
Year
ADT
2012 TRAFFIC DATA
Average Weekday Traffic
Percent of ADT
Average Daily
Traffic Percent of ADT
January 119080 96 114570 92 February 127950 103 122871 99 March 126848 102 123377 99 April 129948 105 125394 101 May 127600 103 123730 100 June 132617 107 128069 103 July 133826 108 129343 104 August 136039 109 130897 105 September 128052 103 125546 101 October 128334 103 124629 100 November 126465 102 122160 98 December 123722 100 121498 98
Classification Breakdown Percent of ADT
Motorcyles 0.36 Passenger cars 65.25 Light Trucks 23.88 Buses 0.42 Single unit trucks (2 axles) 1.94 Single unit trucks (3 axles) 0.88 Single unit trucks (4 or more axles) 0.06 Single trailer trucks (4 or less axles) 0.47 Single trailer trucks (5 axles) 4.78 Single trailer trucks (6 or more axles) 1.27 Multi trailer trucks (5 or less axles) 0.26 Multi trailer trucks (6 axles) 0.10 Multi trailer trucks (7 or more axles) 0.33
Location: I-405; MP 0.60; STADIUM FREEWAY HIGHWAY NO. 61; 0.64 mile northwest of
Pacific Highway No. 1 (I-5) Site Name: Stadium Freeway (26-005)
Installed: December, 1965
HISTORICAL TRAFFIC DATA
Percent of ADT
Year ADT Max Day
Max Hour
10TH Hour
20TH Hour
30TH Hour
2003 98467 119 8.1 8.0 8.0 7.9 2004 96283 120 8.3 8.1 8.1 8.0 2005 97087 119 8.1 8.0 7.9 7.9 2006 99309 117 8.1 7.9 7.9 7.9 2007 98229 118 8.1 8.0 7.9 7.9 2008 94266 120 8.3 8.1 8.1 8.0 2009 94769 *** *** *** *** *** 2010 95608 *** *** *** *** *** 2011 94175 *** *** *** *** *** 2012 91550 *** *** *** *** ***
HISTORICAL ADT BY YEAR
0
20000
40000
60000
80000
100000
120000
03 04 05 06 07 08 09 10 11 12
Year
ADT
2012 TRAFFIC DATA
Average Weekday Traffic
Percent of ADT
Average Daily
Traffic Percent of ADT
January 91800 100 86100 94 February 80900 88 86300 94 March 97600 107 92500 101 April 100000 109 94700 103 May 99200 108 93200 102 June 101800 111 95800 105 July 100800 110 91700 100 August 101600 111 95700 105 September 98300 107 93700 102 October 98500 108 93100 102 November 93600 102 88600 97 December 90100 98 87200 95
Classification Breakdown Percent of ADT
Motorcyles 0.52 Passenger cars 62.43 Light Trucks 27.08 Buses 0.35 Single unit trucks (2 axles) 3.12 Single unit trucks (3 axles) 1.20 Single unit trucks (4 or more axles) 0.16 Single trailer trucks (4 or less axles) 0.32 Single trailer trucks (5 axles) 2.31 Single trailer trucks (6 or more axles) 1.36 Multi trailer trucks (5 or less axles) 0.05 Multi trailer trucks (6 axles) 0.11 Multi trailer trucks (7 or more axles) 0.99

291
Location: MP 13.94; HISTORIC COLUMBIA RIVER HIGHWAY NO. 100; 0.10 mile west of Bridal Veil Falls State Park
Site Name: Bridal Veil (26-012) Installed: August, 1957
HISTORICAL TRAFFIC DATA
Percent of ADT
Year ADT Max Day
Max Hour
10TH Hour
20TH Hour
30TH Hour
2003 729 322 44.7 40.3 36.5 34.7 2004 697 309 59.0 40.5 38.2 36.9 2005 695 376 54.6 45.3 40.6 37.1 2006 691 355 77.9 43.4 40.1 38.4 2007 691 317 47.6 38.7 36.1 34.5 2008 695 320 46.4 38.3 34.8 33.5 2009 786 347 51.0 43.0 38.8 35.5 2010 782 303 44.4 39.4 37.5 35.3 2011 764 365 47.1 40.1 37.5 36.0 2012 697 382 54.3 43.2 39.2 37.2
HISTORICAL ADT BY YEAR
0
200
400
600
800
1000
03 04 05 06 07 08 09 10 11 12
Year
ADT
2012 TRAFFIC DATA
Average Weekday Traffic
Percent of ADT
Average Daily
Traffic Percent of ADT
January 237 34 336 48 February 276 40 429 62 March 345 50 512 73 April 418 60 771 111 May 649 93 957 137 June 727 104 955 137 July 1236 177 1441 207 August 1089 156 1351 194 September 580 83 705 101 October 324 47 391 56 November 232 33 285 41 December 189 27 224 32
Classification Breakdown Percent of ADT
Motorcyles 5.14 Passenger cars 79.84 Light Trucks 11.74 Buses 0.23 Single unit trucks (2 axles) 2.41 Single unit trucks (3 axles) 0.05 Single unit trucks (4 or more axles) 0.00 Single trailer trucks (4 or less axles) 0.50 Single trailer trucks (5 axles) 0.00 Single trailer trucks (6 or more axles) 0.00 Multi trailer trucks (5 or less axles) 0.09 Multi trailer trucks (6 axles) 0.00 Multi trailer trucks (7 or more axles) 0.00
Location: I-84; MP 3.35; COLUMBIA RIVER HIGHWAY NO. 2; At the N.E. 53rd Avenue
Undercrossing.
Site Name: Hoyt (26-014)
Installed: July, 1995
HISTORICAL TRAFFIC DATA
Percent of ADT
Year ADT Max Day
Max Hour
10TH Hour
20TH Hour
30TH Hour
2003 163193 116 7.6 7.4 7.4 7.4 2004 160956 117 7.7 7.5 7.5 7.4 2005 162360 118 7.6 7.4 7.3 7.3 2006 163241 115 7.3 7.2 7.2 7.1 2007 164509 116 7.3 7.2 7.1 7.1 2008 160306 117 7.5 7.4 7.3 7.3 2009 161495 116 7.6 7.4 7.4 7.3 2010 161572 115 7.5 7.3 7.3 7.3 2011 158377 *** *** *** *** *** 2012 154572 118 7.4 7.3 7.2 7.2
HISTORICAL ADT BY YEAR
0
50000
100000
150000
200000
03 04 05 06 07 08 09 10 11 12
Year
ADT
2012 TRAFFIC DATA
Average Weekday Traffic
Percent of ADT
Average Daily
Traffic Percent of ADT
January 151866 98 146376 95 February 161504 104 154765 100 March 160892 104 156240 101 April 163740 106 159262 103 May 162419 105 158131 102 June 166304 108 160003 104 July 160179 104 153876 100 August 161549 105 156124 101 September 162512 105 158437 103 October 158848 103 153280 99 November 154556 100 148790 96 December 152332 99 149582 97
Classification Breakdown Percent of ADT
Motorcyles 0.55 Passenger cars 78.07 Light Trucks 16.58 Buses 0.41 Single unit trucks (2 axles) 2.08 Single unit trucks (3 axles) 0.43 Single unit trucks (4 or more axles) 0.01 Single trailer trucks (4 or less axles) 0.21 Single trailer trucks (5 axles) 1.10 Single trailer trucks (6 or more axles) 0.17 Multi trailer trucks (5 or less axles) 0.05 Multi trailer trucks (6 axles) 0.01 Multi trailer trucks (7 or more axles) 0.33

292
Location: I-84; MP 0.49; COLUMBIA RIVER HIGHWAY NO. 2; 0.49 mile east of Pacific Highway No. 1 Interchange (I-5)
Site Name: West Banfield (26-015) Installed: May, 1998
HISTORICAL TRAFFIC DATA
Percent of ADT
Year ADT Max Day
Max Hour
10TH Hour
20TH Hour
30TH Hour
2003 143174 114 7.5 7.4 7.3 7.2 2004 141125 116 7.4 7.3 7.2 7.2 2005 142763 116 7.4 7.2 7.2 7.1 2006 143316 114 7.2 7.1 7.1 7.0 2007 143242 115 7.2 7.1 7.1 7.0 2008 140758 116 7.6 7.4 7.3 7.2 2009 142071 118 11.0 7.8 7.4 7.3 2010 146571 *** *** *** *** *** 2011 143160 115 7.5 7.4 7.3 7.3 2012 141433 114 7.5 7.3 7.3 7.2
HISTORICAL ADT BY YEAR
0
50000
100000
150000
200000
03 04 05 06 07 08 09 10 11 12
Year
ADT
2012 TRAFFIC DATA
Average Weekday Traffic
Percent of ADT
Average Daily
Traffic Percent of ADT
January 139455 99 133729 95 February 147972 105 141369 100 March 147578 104 142453 101 April 151402 107 146762 104 May 150323 106 145870 103 June 154779 109 148631 105 July 148304 105 138214 98 August 149656 106 142563 101 September 147947 105 143813 102 October 147031 104 141312 100 November 142808 101 136507 97 December 139047 98 135973 96
Classification Breakdown Percent of ADT
Motorcyles 0.10 Passenger cars 82.37 Light Trucks 12.97 Buses 0.35 Single unit trucks (2 axles) 1.59 Single unit trucks (3 axles) 0.41 Single unit trucks (4 or more axles) 0.06 Single trailer trucks (4 or less axles) 0.31 Single trailer trucks (5 axles) 1.19 Single trailer trucks (6 or more axles) 0.22 Multi trailer trucks (5 or less axles) 0.05 Multi trailer trucks (6 axles) 0.05 Multi trailer trucks (7 or more axles) 0.33
Location: I-5; MP 298.24; PACIFIC HIGHWAY NO. 1; 1.07 miles north of S.W. Terwilliger
Boulevard, in Portland
Site Name: Iowa Street (26-016)
Installed: December, 1961
HISTORICAL TRAFFIC DATA
Percent of ADT
Year ADT Max Day
Max Hour
10TH Hour
20TH Hour
30TH Hour
2003 144060 120 8.7 8.5 8.5 8.4 2004 142117 119 8.8 8.6 8.4 8.3 2005 143566 118 8.8 8.5 8.4 8.4 2006 144118 120 8.6 8.5 8.4 8.3 2007 145047 119 9.2 8.3 8.3 8.2 2008 139791 121 10.0 8.5 8.5 8.4 2009 140860 117 8.7 8.3 8.2 8.2 2010 141415 *** *** *** *** *** 2011 139332 *** *** *** *** *** 2012 137111 116 8.2 8.0 8.0 7.9
HISTORICAL ADT BY YEAR
0
50000
100000
150000
200000
03 04 05 06 07 08 09 10 11 12
Year
ADT
2012 TRAFFIC DATA
Average Weekday Traffic
Percent of ADT
Average Daily
Traffic Percent of ADT
January 136025 99 128326 94 February 145691 106 137304 100 March 145694 106 138060 101 April 149427 109 141319 103 May 142890 104 136566 100 June 149713 109 140955 103 July 146623 107 137272 100 August 150008 109 139809 102 September 144795 106 137731 100 October 148425 108 141058 103 November 144686 106 135785 99 December 135104 99 131152 96
Classification Breakdown Percent of ADT
Motorcyles 0.30 Passenger cars 75.33 Light Trucks 15.27 Buses 0.38 Single unit trucks (2 axles) 2.25 Single unit trucks (3 axles) 0.63 Single unit trucks (4 or more axles) 0.02 Single trailer trucks (4 or less axles) 0.36 Single trailer trucks (5 axles) 3.44 Single trailer trucks (6 or more axles) 1.00 Multi trailer trucks (5 or less axles) 0.12 Multi trailer trucks (6 axles) 0.03 Multi trailer trucks (7 or more axles) 0.87

293
Location: I-205; MP 20.35; EAST PORTLAND FREEWAY NO. 64; 0.22 mile south of S.E. Washington Street Undercrossing
Site Name: Yamhill (26-018) Installed: July, 1995
HISTORICAL TRAFFIC DATA
Percent of ADT
Year ADT Max Day
Max Hour
10TH Hour
20TH Hour
30TH Hour
2003 154332 119 8.5 8.1 8.0 8.0 2004 156809 123 8.1 8.0 7.9 7.8 2005 164804 *** *** *** *** *** 2006 149978 117 8.1 7.8 7.7 7.6 2007 148487 117 7.6 7.5 7.5 7.4 2008 144227 117 7.8 7.7 7.6 7.6 2009 146509 116 7.8 7.7 7.6 7.6 2010 146277 115 7.8 7.7 7.6 7.6 2011 145358 116 7.8 7.6 7.6 7.5 2012 145124 115 7.8 7.6 7.6 7.5
HISTORICAL ADT BY YEAR
0
50000
100000
150000
200000
03 04 05 06 07 08 09 10 11 12
Year
ADT
2012 TRAFFIC DATA
Average Weekday Traffic
Percent of ADT
Average Daily
Traffic Percent of ADT
January 140334 97 134073 92 February 148853 103 141742 98 March 148171 102 142401 98 April 152495 105 147281 101 May 153619 106 148205 102 June 158047 109 151397 104 July 156655 108 152112 105 August 158517 109 153327 106 September 153279 106 148046 102 October 150957 104 143725 99 November 146450 101 139881 96 December 143385 99 139304 96
Classification Breakdown Percent of ADT
Motorcyles 0.65 Passenger cars 76.99 Light Trucks 14.17 Buses 0.40 Single unit trucks (2 axles) 2.04 Single unit trucks (3 axles) 0.58 Single unit trucks (4 or more axles) 0.13 Single trailer trucks (4 or less axles) 0.70 Single trailer trucks (5 axles) 2.96 Single trailer trucks (6 or more axles) 0.90 Multi trailer trucks (5 or less axles) 0.09 Multi trailer trucks (6 axles) 0.06 Multi trailer trucks (7 or more axles) 0.33
Location: I-5; MP 304.66; PACIFIC HIGHWAY NO. 1; 0.03 mile south of N. Ainsworth Street
undercrossing Site Name: Minnesota Freeway
(26-019) Installed: December, 1964
HISTORICAL TRAFFIC DATA
Percent of ADT
Year ADT Max Day
Max Hour
10TH Hour
20TH Hour
30TH Hour
2003 137429 122 7.8 7.7 7.6 7.6 2004 136027 118 7.9 7.6 7.6 7.5 2005 136493 118 7.8 7.6 7.5 7.4 2006 135342 116 7.8 7.5 7.4 7.4 2007 134163 117 7.6 7.5 7.4 7.4 2008 129976 117 7.9 7.7 7.6 7.5 2009 129986 116 7.7 7.6 7.5 7.5 2010 130677 117 7.9 7.6 7.5 7.5 2011 129887 117 7.8 7.6 7.5 7.5 2012 129661 117 7.8 7.6 7.5 7.5
HISTORICAL ADT BY YEAR
0
50000
100000
150000
03 04 05 06 07 08 09 10 11 12
Year
ADT
2012 TRAFFIC DATA
Average Weekday Traffic
Percent of ADT
Average Daily
Traffic Percent of ADT
January 125993 97 121084 93 February 134994 104 129739 100 March 133880 103 130610 101 April 137629 106 134238 104 May 134731 104 131668 102 June 138892 107 134226 104 July 136545 105 131312 101 August 137761 106 132391 102 September 133563 103 131579 101 October 132511 102 129795 100 November 128771 99 125100 96 December 125617 97 124189 96
Classification Breakdown Percent of ADT
Motorcyles 0.17 Passenger cars 68.58 Light Trucks 18.33 Buses 0.62 Single unit trucks (2 axles) 3.24 Single unit trucks (3 axles) 1.09 Single unit trucks (4 or more axles) 0.03 Single trailer trucks (4 or less axles) 0.77 Single trailer trucks (5 axles) 4.68 Single trailer trucks (6 or more axles) 1.67 Multi trailer trucks (5 or less axles) 0.25 Multi trailer trucks (6 axles) 0.09 Multi trailer trucks (7 or more axles) 0.48
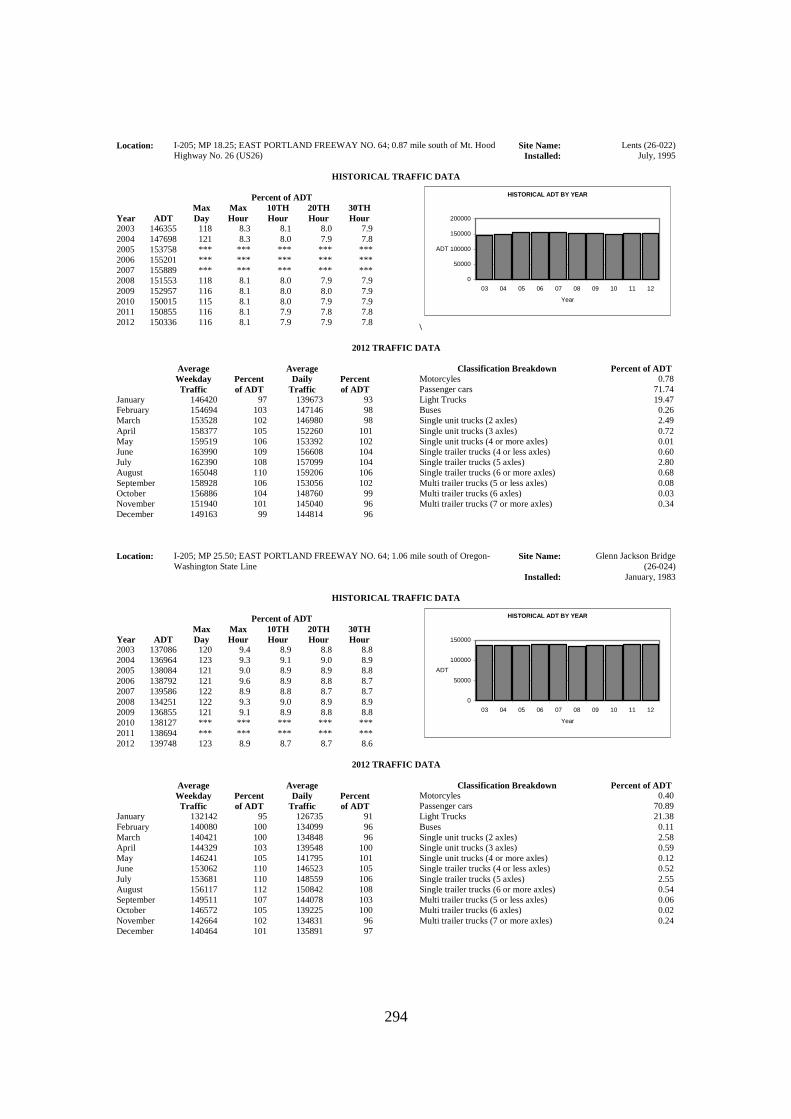
294
Location: I-205; MP 18.25; EAST PORTLAND FREEWAY NO. 64; 0.87 mile south of Mt. Hood Highway No. 26 (US26)
Site Name: Lents (26-022) Installed: July, 1995
HISTORICAL TRAFFIC DATA
Percent of ADT
Year ADT Max Day
Max Hour
10TH Hour
20TH Hour
30TH Hour
2003 146355 118 8.3 8.1 8.0 7.9 2004 147698 121 8.3 8.0 7.9 7.8 2005 153758 *** *** *** *** *** 2006 155201 *** *** *** *** *** 2007 155889 *** *** *** *** *** 2008 151553 118 8.1 8.0 7.9 7.9 2009 152957 116 8.1 8.0 8.0 7.9 2010 150015 115 8.1 8.0 7.9 7.9 2011 150855 116 8.1 7.9 7.8 7.8 2012 150336 116 8.1 7.9 7.9 7.8
HISTORICAL ADT BY YEAR
0
50000
100000
150000
200000
03 04 05 06 07 08 09 10 11 12
Year
ADT
\
2012 TRAFFIC DATA
Average Weekday Traffic
Percent of ADT
Average Daily
Traffic Percent of ADT
January 146420 97 139673 93 February 154694 103 147146 98 March 153528 102 146980 98 April 158377 105 152260 101 May 159519 106 153392 102 June 163990 109 156608 104 July 162390 108 157099 104 August 165048 110 159206 106 September 158928 106 153056 102 October 156886 104 148760 99 November 151940 101 145040 96 December 149163 99 144814 96
Classification Breakdown Percent of ADT
Motorcyles 0.78 Passenger cars 71.74 Light Trucks 19.47 Buses 0.26 Single unit trucks (2 axles) 2.49 Single unit trucks (3 axles) 0.72 Single unit trucks (4 or more axles) 0.01 Single trailer trucks (4 or less axles) 0.60 Single trailer trucks (5 axles) 2.80 Single trailer trucks (6 or more axles) 0.68 Multi trailer trucks (5 or less axles) 0.08 Multi trailer trucks (6 axles) 0.03 Multi trailer trucks (7 or more axles) 0.34
Location: I-205; MP 25.50; EAST PORTLAND FREEWAY NO. 64; 1.06 mile south of Oregon-
Washington State Line Site Name: Glenn Jackson Bridge
(26-024) Installed: January, 1983
HISTORICAL TRAFFIC DATA
Percent of ADT
Year ADT Max Day
Max Hour
10TH Hour
20TH Hour
30TH Hour
2003 137086 120 9.4 8.9 8.8 8.8 2004 136964 123 9.3 9.1 9.0 8.9 2005 138084 121 9.0 8.9 8.9 8.8 2006 138792 121 9.6 8.9 8.8 8.7 2007 139586 122 8.9 8.8 8.7 8.7 2008 134251 122 9.3 9.0 8.9 8.9 2009 136855 121 9.1 8.9 8.8 8.8 2010 138127 *** *** *** *** *** 2011 138694 *** *** *** *** *** 2012 139748 123 8.9 8.7 8.7 8.6
HISTORICAL ADT BY YEAR
0
50000
100000
150000
03 04 05 06 07 08 09 10 11 12
Year
ADT
2012 TRAFFIC DATA
Average Weekday Traffic
Percent of ADT
Average Daily
Traffic Percent of ADT
January 132142 95 126735 91 February 140080 100 134099 96 March 140421 100 134848 96 April 144329 103 139548 100 May 146241 105 141795 101 June 153062 110 146523 105 July 153681 110 148559 106 August 156117 112 150842 108 September 149511 107 144078 103 October 146572 105 139225 100 November 142664 102 134831 96 December 140464 101 135891 97
Classification Breakdown Percent of ADT
Motorcyles 0.40 Passenger cars 70.89 Light Trucks 21.38 Buses 0.11 Single unit trucks (2 axles) 2.58 Single unit trucks (3 axles) 0.59 Single unit trucks (4 or more axles) 0.12 Single trailer trucks (4 or less axles) 0.52 Single trailer trucks (5 axles) 2.55 Single trailer trucks (6 or more axles) 0.54 Multi trailer trucks (5 or less axles) 0.06 Multi trailer trucks (6 axles) 0.02 Multi trailer trucks (7 or more axles) 0.24
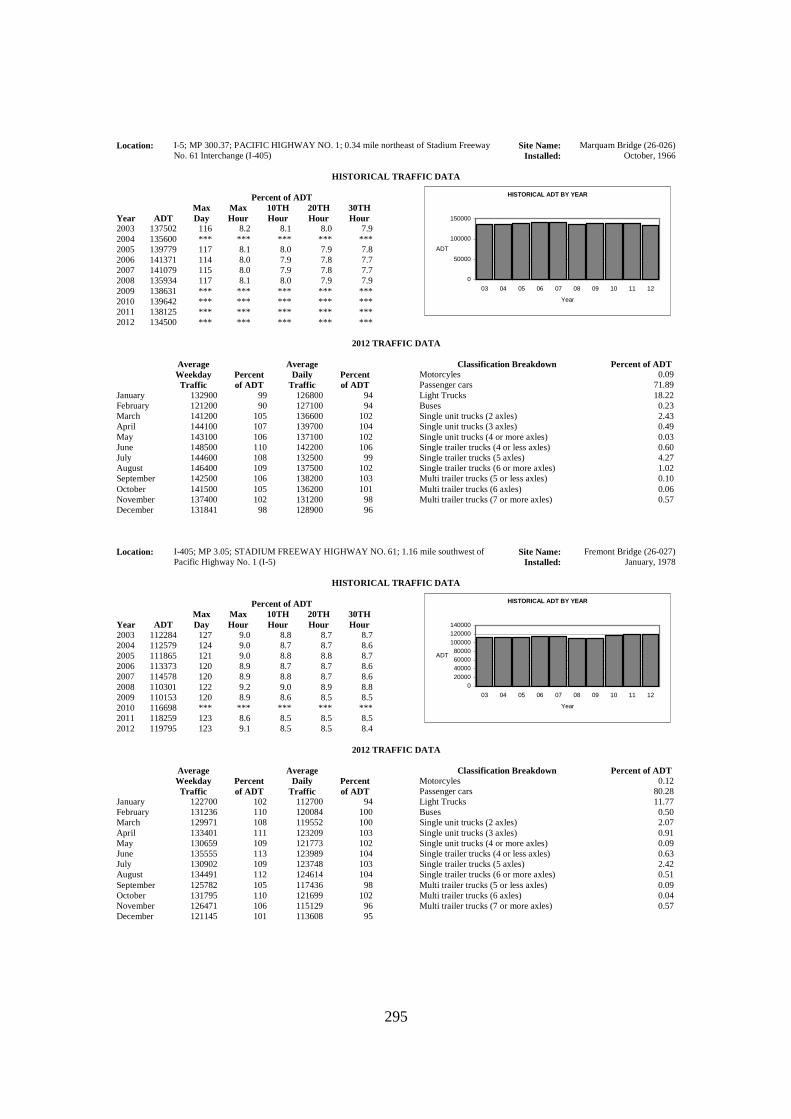
295
Location: I-5; MP 300.37; PACIFIC HIGHWAY NO. 1; 0.34 mile northeast of Stadium Freeway No. 61 Interchange (I-405)
Site Name: Marquam Bridge (26-026) Installed: October, 1966
HISTORICAL TRAFFIC DATA
Percent of ADT
Year ADT Max Day
Max Hour
10TH Hour
20TH Hour
30TH Hour
2003 137502 116 8.2 8.1 8.0 7.9 2004 135600 *** *** *** *** *** 2005 139779 117 8.1 8.0 7.9 7.8 2006 141371 114 8.0 7.9 7.8 7.7 2007 141079 115 8.0 7.9 7.8 7.7 2008 135934 117 8.1 8.0 7.9 7.9 2009 138631 *** *** *** *** *** 2010 139642 *** *** *** *** *** 2011 138125 *** *** *** *** *** 2012 134500 *** *** *** *** ***
HISTORICAL ADT BY YEAR
0
50000
100000
150000
03 04 05 06 07 08 09 10 11 12
Year
ADT
2012 TRAFFIC DATA
Average Weekday Traffic
Percent of ADT
Average Daily
Traffic Percent of ADT
January 132900 99 126800 94 February 121200 90 127100 94 March 141200 105 136600 102 April 144100 107 139700 104 May 143100 106 137100 102 June 148500 110 142200 106 July 144600 108 132500 99 August 146400 109 137500 102 September 142500 106 138200 103 October 141500 105 136200 101 November 137400 102 131200 98 December 131841 98 128900 96
Classification Breakdown Percent of ADT
Motorcyles 0.09 Passenger cars 71.89 Light Trucks 18.22 Buses 0.23 Single unit trucks (2 axles) 2.43 Single unit trucks (3 axles) 0.49 Single unit trucks (4 or more axles) 0.03 Single trailer trucks (4 or less axles) 0.60 Single trailer trucks (5 axles) 4.27 Single trailer trucks (6 or more axles) 1.02 Multi trailer trucks (5 or less axles) 0.10 Multi trailer trucks (6 axles) 0.06 Multi trailer trucks (7 or more axles) 0.57
Location: I-405; MP 3.05; STADIUM FREEWAY HIGHWAY NO. 61; 1.16 mile southwest of
Pacific Highway No. 1 (I-5) Site Name: Fremont Bridge (26-027)
Installed: January, 1978
HISTORICAL TRAFFIC DATA
Percent of ADT
Year ADT Max Day
Max Hour
10TH Hour
20TH Hour
30TH Hour
2003 112284 127 9.0 8.8 8.7 8.7 2004 112579 124 9.0 8.7 8.7 8.6 2005 111865 121 9.0 8.8 8.8 8.7 2006 113373 120 8.9 8.7 8.7 8.6 2007 114578 120 8.9 8.8 8.7 8.6 2008 110301 122 9.2 9.0 8.9 8.8 2009 110153 120 8.9 8.6 8.5 8.5 2010 116698 *** *** *** *** *** 2011 118259 123 8.6 8.5 8.5 8.5 2012 119795 123 9.1 8.5 8.5 8.4
HISTORICAL ADT BY YEAR
020000400006000080000
100000120000140000
03 04 05 06 07 08 09 10 11 12
Year
ADT
2012 TRAFFIC DATA
Average Weekday Traffic
Percent of ADT
Average Daily
Traffic Percent of ADT
January 122700 102 112700 94 February 131236 110 120084 100 March 129971 108 119552 100 April 133401 111 123209 103 May 130659 109 121773 102 June 135555 113 123989 104 July 130902 109 123748 103 August 134491 112 124614 104 September 125782 105 117436 98 October 131795 110 121699 102 November 126471 106 115129 96 December 121145 101 113608 95
Classification Breakdown Percent of ADT
Motorcyles 0.12 Passenger cars 80.28 Light Trucks 11.77 Buses 0.50 Single unit trucks (2 axles) 2.07 Single unit trucks (3 axles) 0.91 Single unit trucks (4 or more axles) 0.09 Single trailer trucks (4 or less axles) 0.63 Single trailer trucks (5 axles) 2.42 Single trailer trucks (6 or more axles) 0.51 Multi trailer trucks (5 or less axles) 0.09 Multi trailer trucks (6 axles) 0.04 Multi trailer trucks (7 or more axles) 0.57
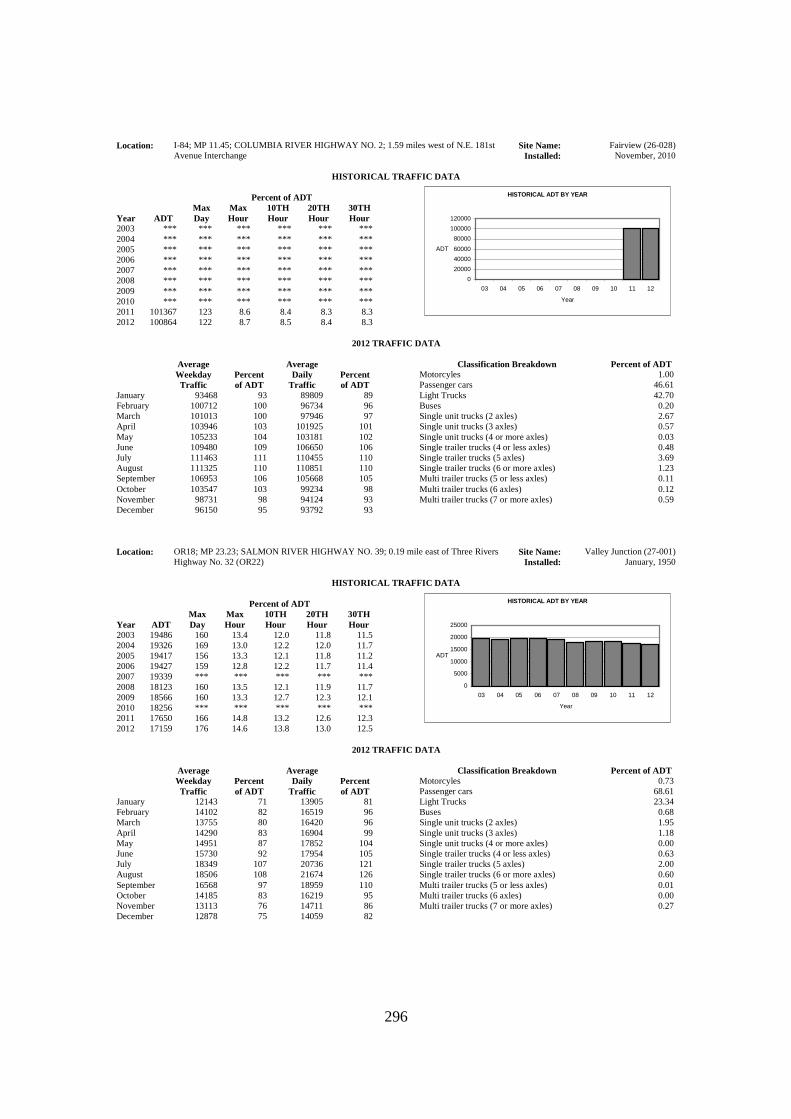
296
Location: I-84; MP 11.45; COLUMBIA RIVER HIGHWAY NO. 2; 1.59 miles west of N.E. 181st Avenue Interchange
Site Name: Fairview (26-028) Installed: November, 2010
HISTORICAL TRAFFIC DATA
Percent of ADT
Year ADT Max Day
Max Hour
10TH Hour
20TH Hour
30TH Hour
2003 *** *** *** *** *** *** 2004 *** *** *** *** *** *** 2005 *** *** *** *** *** *** 2006 *** *** *** *** *** *** 2007 *** *** *** *** *** *** 2008 *** *** *** *** *** *** 2009 *** *** *** *** *** *** 2010 *** *** *** *** *** *** 2011 101367 123 8.6 8.4 8.3 8.3 2012 100864 122 8.7 8.5 8.4 8.3
HISTORICAL ADT BY YEAR
0
20000
40000
60000
80000
100000
120000
03 04 05 06 07 08 09 10 11 12
Year
ADT
2012 TRAFFIC DATA
Average Weekday Traffic
Percent of ADT
Average Daily
Traffic Percent of ADT
January 93468 93 89809 89 February 100712 100 96734 96 March 101013 100 97946 97 April 103946 103 101925 101 May 105233 104 103181 102 June 109480 109 106650 106 July 111463 111 110455 110 August 111325 110 110851 110 September 106953 106 105668 105 October 103547 103 99234 98 November 98731 98 94124 93 December 96150 95 93792 93
Classification Breakdown Percent of ADT
Motorcyles 1.00 Passenger cars 46.61 Light Trucks 42.70 Buses 0.20 Single unit trucks (2 axles) 2.67 Single unit trucks (3 axles) 0.57 Single unit trucks (4 or more axles) 0.03 Single trailer trucks (4 or less axles) 0.48 Single trailer trucks (5 axles) 3.69 Single trailer trucks (6 or more axles) 1.23 Multi trailer trucks (5 or less axles) 0.11 Multi trailer trucks (6 axles) 0.12 Multi trailer trucks (7 or more axles) 0.59
Location: OR18; MP 23.23; SALMON RIVER HIGHWAY NO. 39; 0.19 mile east of Three Rivers
Highway No. 32 (OR22) Site Name: Valley Junction (27-001)
Installed: January, 1950
HISTORICAL TRAFFIC DATA
Percent of ADT
Year ADT Max Day
Max Hour
10TH Hour
20TH Hour
30TH Hour
2003 19486 160 13.4 12.0 11.8 11.5 2004 19326 169 13.0 12.2 12.0 11.7 2005 19417 156 13.3 12.1 11.8 11.2 2006 19427 159 12.8 12.2 11.7 11.4 2007 19339 *** *** *** *** *** 2008 18123 160 13.5 12.1 11.9 11.7 2009 18566 160 13.3 12.7 12.3 12.1 2010 18256 *** *** *** *** *** 2011 17650 166 14.8 13.2 12.6 12.3 2012 17159 176 14.6 13.8 13.0 12.5
HISTORICAL ADT BY YEAR
0
5000
10000
15000
20000
25000
03 04 05 06 07 08 09 10 11 12
Year
ADT
2012 TRAFFIC DATA
Average Weekday Traffic
Percent of ADT
Average Daily
Traffic Percent of ADT
January 12143 71 13905 81 February 14102 82 16519 96 March 13755 80 16420 96 April 14290 83 16904 99 May 14951 87 17852 104 June 15730 92 17954 105 July 18349 107 20736 121 August 18506 108 21674 126 September 16568 97 18959 110 October 14185 83 16219 95 November 13113 76 14711 86 December 12878 75 14059 82
Classification Breakdown Percent of ADT
Motorcyles 0.73 Passenger cars 68.61 Light Trucks 23.34 Buses 0.68 Single unit trucks (2 axles) 1.95 Single unit trucks (3 axles) 1.18 Single unit trucks (4 or more axles) 0.00 Single trailer trucks (4 or less axles) 0.63 Single trailer trucks (5 axles) 2.00 Single trailer trucks (6 or more axles) 0.60 Multi trailer trucks (5 or less axles) 0.01 Multi trailer trucks (6 axles) 0.00 Multi trailer trucks (7 or more axles) 0.27
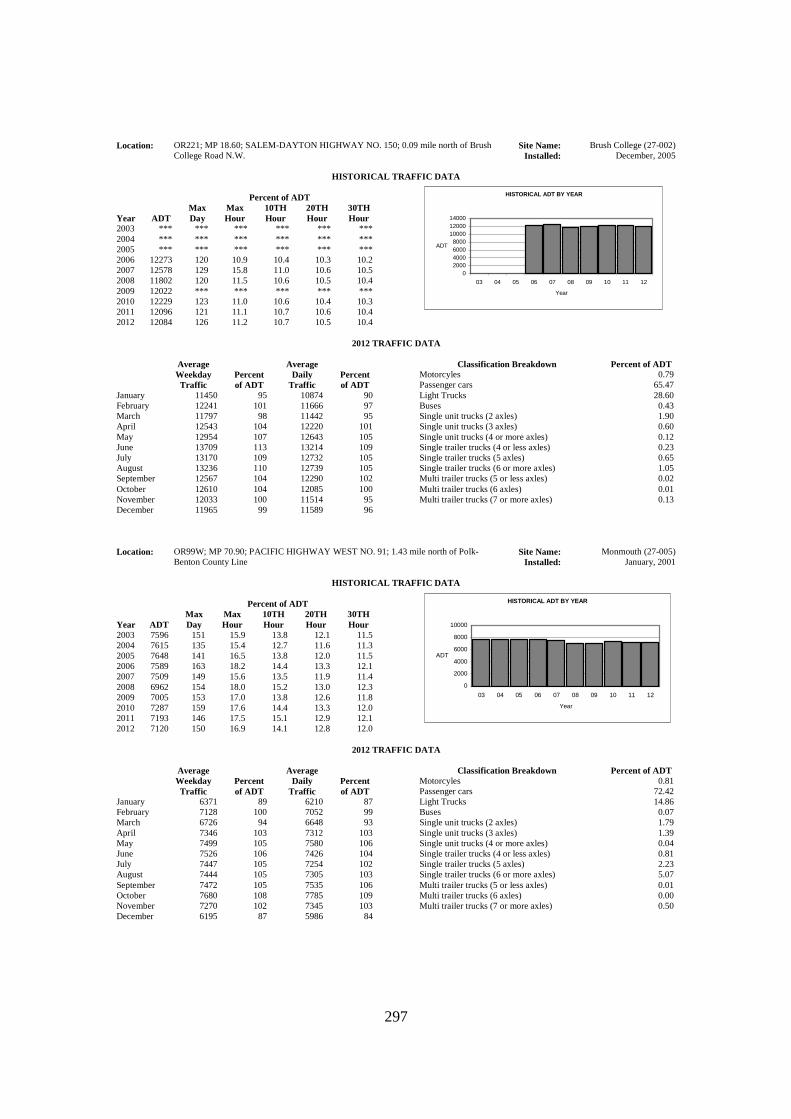
297
Location: OR221; MP 18.60; SALEM-DAYTON HIGHWAY NO. 150; 0.09 mile north of Brush College Road N.W.
Site Name: Brush College (27-002) Installed: December, 2005
HISTORICAL TRAFFIC DATA
Percent of ADT
Year ADT Max Day
Max Hour
10TH Hour
20TH Hour
30TH Hour
2003 *** *** *** *** *** *** 2004 *** *** *** *** *** *** 2005 *** *** *** *** *** *** 2006 12273 120 10.9 10.4 10.3 10.2 2007 12578 129 15.8 11.0 10.6 10.5 2008 11802 120 11.5 10.6 10.5 10.4 2009 12022 *** *** *** *** *** 2010 12229 123 11.0 10.6 10.4 10.3 2011 12096 121 11.1 10.7 10.6 10.4 2012 12084 126 11.2 10.7 10.5 10.4
HISTORICAL ADT BY YEAR
02000400060008000
100001200014000
03 04 05 06 07 08 09 10 11 12
Year
ADT
2012 TRAFFIC DATA
Average Weekday Traffic
Percent of ADT
Average Daily
Traffic Percent of ADT
January 11450 95 10874 90 February 12241 101 11666 97 March 11797 98 11442 95 April 12543 104 12220 101 May 12954 107 12643 105 June 13709 113 13214 109 July 13170 109 12732 105 August 13236 110 12739 105 September 12567 104 12290 102 October 12610 104 12085 100 November 12033 100 11514 95 December 11965 99 11589 96
Classification Breakdown Percent of ADT
Motorcyles 0.79 Passenger cars 65.47 Light Trucks 28.60 Buses 0.43 Single unit trucks (2 axles) 1.90 Single unit trucks (3 axles) 0.60 Single unit trucks (4 or more axles) 0.12 Single trailer trucks (4 or less axles) 0.23 Single trailer trucks (5 axles) 0.65 Single trailer trucks (6 or more axles) 1.05 Multi trailer trucks (5 or less axles) 0.02 Multi trailer trucks (6 axles) 0.01 Multi trailer trucks (7 or more axles) 0.13
Location: OR99W; MP 70.90; PACIFIC HIGHWAY WEST NO. 91; 1.43 mile north of Polk-
Benton County Line Site Name: Monmouth (27-005)
Installed: January, 2001
HISTORICAL TRAFFIC DATA
Percent of ADT
Year ADT Max Day
Max Hour
10TH Hour
20TH Hour
30TH Hour
2003 7596 151 15.9 13.8 12.1 11.5 2004 7615 135 15.4 12.7 11.6 11.3 2005 7648 141 16.5 13.8 12.0 11.5 2006 7589 163 18.2 14.4 13.3 12.1 2007 7509 149 15.6 13.5 11.9 11.4 2008 6962 154 18.0 15.2 13.0 12.3 2009 7005 153 17.0 13.8 12.6 11.8 2010 7287 159 17.6 14.4 13.3 12.0 2011 7193 146 17.5 15.1 12.9 12.1 2012 7120 150 16.9 14.1 12.8 12.0
HISTORICAL ADT BY YEAR
0
2000
4000
6000
8000
10000
03 04 05 06 07 08 09 10 11 12
Year
ADT
2012 TRAFFIC DATA
Average Weekday Traffic
Percent of ADT
Average Daily
Traffic Percent of ADT
January 6371 89 6210 87 February 7128 100 7052 99 March 6726 94 6648 93 April 7346 103 7312 103 May 7499 105 7580 106 June 7526 106 7426 104 July 7447 105 7254 102 August 7444 105 7305 103 September 7472 105 7535 106 October 7680 108 7785 109 November 7270 102 7345 103 December 6195 87 5986 84
Classification Breakdown Percent of ADT
Motorcyles 0.81 Passenger cars 72.42 Light Trucks 14.86 Buses 0.07 Single unit trucks (2 axles) 1.79 Single unit trucks (3 axles) 1.39 Single unit trucks (4 or more axles) 0.04 Single trailer trucks (4 or less axles) 0.81 Single trailer trucks (5 axles) 2.23 Single trailer trucks (6 or more axles) 5.07 Multi trailer trucks (5 or less axles) 0.01 Multi trailer trucks (6 axles) 0.00 Multi trailer trucks (7 or more axles) 0.50

298
Location: OR22; MP 19.47; WILLAMINA-SALEM HIGHWAY NO. 30; 0.90 mile west of Independence Highway No. 193 (OR51)
Site Name: Oak Knoll (27-006) Installed: January, 2001
HISTORICAL TRAFFIC DATA
Percent of ADT
Year ADT Max Day
Max Hour
10TH Hour
20TH Hour
30TH Hour
2003 26927 125 11.1 10.2 10.1 9.9 2004 27128 124 10.9 10.3 10.0 9.9 2005 27348 123 10.6 10.2 10.0 9.9 2006 28014 127 10.8 10.2 10.0 9.8 2007 27678 126 10.5 10.1 10.0 9.9 2008 25776 131 11.1 10.5 10.2 10.1 2009 26317 127 11.7 10.0 9.9 9.9 2010 26107 125 10.6 10.2 10.0 9.9 2011 25358 124 10.5 10.1 9.9 9.8 2012 24891 124 10.4 10.1 9.9 9.8
HISTORICAL ADT BY YEAR
0
5000
10000
15000
20000
25000
30000
03 04 05 06 07 08 09 10 11 12
Year
ADT
2012 TRAFFIC DATA
Average Weekday Traffic
Percent of ADT
Average Daily
Traffic Percent of ADT
January 24400 98 23400 94 February 25200 101 24700 99 March 23950 96 23660 95 April 25998 104 25503 102 May 25777 104 25727 103 June 26357 106 25804 104 July 26461 106 26180 105 August 26915 108 26934 108 September 26018 105 25837 104 October 25675 103 24962 100 November 24572 99 23594 95 December 22997 92 22387 90
Classification Breakdown Percent of ADT
Motorcyles 0.17 Passenger cars 72.13 Light Trucks 21.39 Buses 0.25 Single unit trucks (2 axles) 2.33 Single unit trucks (3 axles) 0.69 Single unit trucks (4 or more axles) 0.02 Single trailer trucks (4 or less axles) 0.67 Single trailer trucks (5 axles) 1.24 Single trailer trucks (6 or more axles) 0.81 Multi trailer trucks (5 or less axles) 0.02 Multi trailer trucks (6 axles) 0.01 Multi trailer trucks (7 or more axles) 0.27
Location: US97; MP 17.36; SHERMAN HIGHWAY NO. 42; 0.83 mile northwest of 1st Street Site Name: Wasco (28-001)
Installed: April, 1957
HISTORICAL TRAFFIC DATA
Percent of ADT
Year ADT Max Day
Max Hour
10TH Hour
20TH Hour
30TH Hour
2003 2585 165 16.0 13.4 12.8 12.3 2004 2554 157 15.4 12.8 12.4 12.1 2005 2579 174 15.2 13.0 12.4 12.1 2006 2627 165 15.4 12.9 12.2 12.0 2007 2731 166 14.9 13.1 12.3 12.1 2008 2389 157 14.9 13.4 12.5 12.3 2009 2657 162 16.8 13.4 12.8 12.5 2010 2706 161 14.6 13.2 12.6 12.3 2011 2632 171 16.2 13.5 13.0 12.3 2012 2638 160 15.0 13.3 12.8 12.5
HISTORICAL ADT BY YEAR
0
500
1000
1500
2000
2500
3000
03 04 05 06 07 08 09 10 11 12
Year
ADT
2012 TRAFFIC DATA
Average Weekday Traffic
Percent of ADT
Average Daily
Traffic Percent of ADT
January 1992 76 1911 72 February 2235 85 2136 81 March 2403 91 2330 88 April 2635 100 2583 98 May 2888 109 2818 107 June 3210 122 3230 122 July 3208 122 3311 126 August 3322 126 3403 129 September 2908 110 2891 110 October 2690 102 2614 99 November 2476 94 2396 91 December 2081 79 2033 77
Classification Breakdown Percent of ADT
Motorcyles 0.84 Passenger cars 39.25 Light Trucks 14.22 Buses 1.92 Single unit trucks (2 axles) 9.16 Single unit trucks (3 axles) 0.73 Single unit trucks (4 or more axles) 0.02 Single trailer trucks (4 or less axles) 10.50 Single trailer trucks (5 axles) 17.63 Single trailer trucks (6 or more axles) 2.01 Multi trailer trucks (5 or less axles) 0.62 Multi trailer trucks (6 axles) 0.62 Multi trailer trucks (7 or more axles) 2.48

299
Location: I-84; MP 109.51; COLUMBIA RIVER HIGHWAY NO. 2; 0.44 mile west of Rufus/John Day Dam Interchange
Site Name: Rufus (28-002) Installed: January, 2008
HISTORICAL TRAFFIC DATA
Percent of ADT
Year ADT Max Day
Max Hour
10TH Hour
20TH Hour
30TH Hour
2003 *** *** *** *** *** *** 2004 *** *** *** *** *** *** 2005 *** *** *** *** *** *** 2006 *** *** *** *** *** *** 2007 *** *** *** *** *** *** 2008 10506 205 22.8 16.7 14.9 13.9 2009 10774 189 20.1 16.5 15.3 14.3 2010 10831 179 19.9 16.1 15.2 14.8 2011 10583 190 20.9 15.8 15.0 14.2 2012 10811 146 16.0 11.7 11.1 10.9
0
2000
4000
6000
8000
10000
12000
03 04 05 06 07 08 09 10 11 12
ADT
Year
HISTORICAL ADT BY YEAR
2012 TRAFFIC DATA
Average Weekday Traffic
Percent of ADT
Average Daily
Traffic Percent of ADT
January 7135 66 7110 66 February 8013 74 8217 76 March 8988 83 9573 89 April 9279 86 9914 92 May 10500 97 10900 101 June 12100 112 12900 119 July 13017 120 14248 132 August 13288 123 14529 134 September 11754 109 12386 115 October 10139 94 10947 101 November 9728 90 10305 95 December 8363 77 8713 81
Classification Breakdown Percent of ADT
Motorcyles 0.46 Passenger cars 39.14 Light Trucks 23.43 Buses 0.42 Single unit trucks (2 axles) 6.95 Single unit trucks (3 axles) 0.75 Single unit trucks (4 or more axles) 0.15 Single trailer trucks (4 or less axles) 0.73 Single trailer trucks (5 axles) 19.87 Single trailer trucks (6 or more axles) 3.05 Multi trailer trucks (5 or less axles) 0.58 Multi trailer trucks (6 axles) 0.85 Multi trailer trucks (7 or more axles) 3.62
Location: US101; MP 53.55; OREGON COAST HIGHWAY NO. 9; 2.08 miles south of
Washington Street Site Name: Rockaway (29-001)
Installed: September, 1954
HISTORICAL TRAFFIC DATA
Percent of ADT
Year ADT Max Day
Max Hour
10TH Hour
20TH Hour
30TH Hour
2003 6482 210 20.0 17.1 16.4 15.9 2004 6542 205 20.2 17.8 16.3 15.5 2005 6487 179 18.0 16.4 15.6 15.3 2006 6508 194 19.0 17.1 16.3 15.8 2007 6481 182 19.4 16.5 15.5 15.2 2008 6028 203 20.9 17.6 16.3 15.7 2009 6215 214 20.7 18.4 17.5 16.5 2010 6173 208 20.8 18.6 17.3 16.2 2011 5879 208 22.3 19.3 18.0 16.9 2012 5818 214 20.8 18.1 17.4 17.0
HISTORICAL ADT BY YEAR
01000200030004000500060007000
03 04 05 06 07 08 09 10 11 12
Year
ADT
2012 TRAFFIC DATA
Average Weekday Traffic
Percent of ADT
Average Daily
Traffic Percent of ADT
January 3906 67 3976 68 February 4430 76 4663 80 March 4597 79 4848 83 April 5018 86 5334 92 May 5299 91 5985 103 June 6078 104 6373 110 July 8212 141 8595 148 August 8113 139 8840 152 September 6845 118 7350 126 October 5312 91 5528 95 November 4263 73 4381 75 December 3893 67 3944 68
Classification Breakdown Percent of ADT
Motorcyles 1.25 Passenger cars 31.54 Light Trucks 57.23 Buses 0.90 Single unit trucks (2 axles) 4.31 Single unit trucks (3 axles) 0.99 Single unit trucks (4 or more axles) 0.09 Single trailer trucks (4 or less axles) 1.84 Single trailer trucks (5 axles) 1.15 Single trailer trucks (6 or more axles) 0.57 Multi trailer trucks (5 or less axles) 0.00 Multi trailer trucks (6 axles) 0.00 Multi trailer trucks (7 or more axles) 0.13

300
Location: US730; MP 193.70; COLUMBIA RIVER HIGHWAY NO. 2; 0.24 mile east of Pendleton-Cold Springs Highway No. 36 (OR37)
Site Name: Cold Springs (30-002) Installed: October, 1962
HISTORICAL TRAFFIC DATA
Percent of ADT
Year ADT Max Day
Max Hour
10TH Hour
20TH Hour
30TH Hour
2003 2459 151 12.3 11.3 11.0 10.8 2004 2426 150 12.4 10.9 10.6 10.5 2005 2465 149 19.8 11.8 11.0 10.5 2006 2410 146 12.4 10.8 10.6 10.5 2007 2459 145 12.3 11.1 10.7 10.4 2008 2354 *** *** *** *** *** 2009 2491 165 12.7 11.4 10.9 10.6 2010 2452 162 14.3 11.5 11.0 10.8 2011 2547 *** *** *** *** *** 2012 2775 *** *** *** *** ***
HISTORICAL ADT BY YEAR
0
500
1000
1500
2000
2500
3000
03 04 05 06 07 08 09 10 11 12
Year
ADT
2012 TRAFFIC DATA
Average Weekday Traffic
Percent of ADT
Average Daily
Traffic Percent of ADT
January 2200 79 1950 70 February 2500 90 2350 85 March 2800 101 2650 95 April 2750 99 2700 97 May 2950 106 2850 103 June 3150 114 3100 112 July 3500 126 3500 126 August 3550 128 3500 126 September 3300 119 3100 112 October 3000 108 2850 103 November 2750 99 2600 94 December 2350 85 2150 77
Classification Breakdown Percent of ADT
Motorcyles 1.22 Passenger cars 37.11 Light Trucks 21.98 Buses 0.18 Single unit trucks (2 axles) 4.38 Single unit trucks (3 axles) 1.72 Single unit trucks (4 or more axles) 0.04 Single trailer trucks (4 or less axles) 2.26 Single trailer trucks (5 axles) 15.27 Single trailer trucks (6 or more axles) 10.38 Multi trailer trucks (5 or less axles) 0.43 Multi trailer trucks (6 axles) 0.54 Multi trailer trucks (7 or more axles) 4.49
Location: I-84; MP 203.34; OLD OREGON TRAIL NO. 6; 4.13 miles west of Pendleton Highway
No. 67 Interchange (US30) Site Name: Pendleton (30-004)
Installed: September, 1954
HISTORICAL TRAFFIC DATA
Percent of ADT
Year ADT Max Day
Max Hour
10TH Hour
20TH Hour
30TH Hour
2003 15114 150 13.4 11.5 10.7 10.4 2004 15061 152 12.8 11.6 10.7 10.2 2005 14926 163 13.4 11.5 10.8 10.5 2006 15011 157 13.4 11.3 10.7 10.4 2007 15185 147 13.1 11.4 10.8 10.5 2008 13781 151 14.4 12.3 11.2 10.8 2009 14574 149 13.2 11.9 11.2 10.9 2010 14977 *** *** *** *** *** 2011 14750 158 13.0 11.3 11.0 10.8 2012 14647 147 13.6 11.4 11.0 10.8
HISTORICAL ADT BY YEAR
0
5000
10000
15000
20000
03 04 05 06 07 08 09 10 11 12
Year
ADT
2012 TRAFFIC DATA
Average Weekday Traffic
Percent of ADT
Average Daily
Traffic Percent of ADT
January 11183 76 10789 74 February 12541 86 12365 84 March 13818 94 13966 95 April 14474 99 14561 99 May 15320 105 15219 104 June 16184 110 16411 112 July 16871 115 17324 118 August 17232 118 17594 120 September 16398 112 16451 112 October 14903 102 15074 103 November 13906 95 13885 95 December 12165 83 12123 83
Classification Breakdown Percent of ADT
Motorcyles 0.22 Passenger cars 51.50 Light Trucks 17.95 Buses 0.69 Single unit trucks (2 axles) 1.73 Single unit trucks (3 axles) 0.66 Single unit trucks (4 or more axles) 0.13 Single trailer trucks (4 or less axles) 0.17 Single trailer trucks (5 axles) 19.41 Single trailer trucks (6 or more axles) 3.58 Multi trailer trucks (5 or less axles) 0.16 Multi trailer trucks (6 axles) 1.13 Multi trailer trucks (7 or more axles) 2.67

301
Location: US395; MP 16.70; PENDLETON-JOHN DAY HIGHWAY NO. 28; 1.34 miles southwest of W. Main Street
Site Name: Pilot Rock (30-007) Installed: November, 1954
HISTORICAL TRAFFIC DATA
Percent of ADT
Year ADT Max Day
Max Hour
10TH Hour
20TH Hour
30TH Hour
2003 975 225 22.3 17.7 16.5 15.2 2004 942 229 18.9 15.7 14.7 13.6 2005 900 214 23.4 16.2 14.8 14.1 2006 856 226 20.7 17.4 15.4 14.4 2007 875 221 21.4 17.3 15.8 14.7 2008 787 220 21.9 17.2 15.6 14.9 2009 861 197 19.1 15.9 15.1 14.4 2010 840 204 19.8 17.0 15.1 14.5 2011 796 211 21.3 15.9 14.9 14.4 2012 788 199 23.0 17.4 15.6 14.5
HISTORICAL ADT BY YEAR
0
200
400
600
800
1000
1200
03 04 05 06 07 08 09 10 11 12
Year
ADT
2012 TRAFFIC DATA
Average Weekday Traffic
Percent of ADT
Average Daily
Traffic Percent of ADT
January 593 75 567 72 February 651 83 635 80 March 629 80 626 79 April 706 90 734 93 May 846 107 882 112 June 875 111 914 116 July 968 123 978 124 August 925 117 947 120 September 960 122 1009 128 October 852 108 896 114 November 696 88 720 91 December 562 71 553 70
Classification Breakdown Percent of ADT
Motorcyles 2.67 Passenger cars 42.48 Light Trucks 19.43 Buses 1.00 Single unit trucks (2 axles) 16.87 Single unit trucks (3 axles) 2.23 Single unit trucks (4 or more axles) 0.11 Single trailer trucks (4 or less axles) 5.74 Single trailer trucks (5 axles) 6.40 Single trailer trucks (6 or more axles) 2.90 Multi trailer trucks (5 or less axles) 0.00 Multi trailer trucks (6 axles) 0.06 Multi trailer trucks (7 or more axles) 0.11
Location: US395; MP 1.77; PENDLETON-JOHN DAY HIGHWAY NO. 28; 0.09 mile south of Old
Oregon Trail Highway No. 6 (I-84) Site Name: S. Pendleton (30-008)
Installed: April, 1999
HISTORICAL TRAFFIC DATA
Percent of ADT
Year ADT Max Day
Max Hour
10TH Hour
20TH Hour
30TH Hour
2003 23152 127 11.0 10.0 9.9 9.7 2004 22634 126 10.7 10.0 9.8 9.7 2005 22222 133 11.2 10.1 9.8 9.7 2006 22305 127 10.7 9.9 9.7 9.6 2007 22799 128 10.7 10.0 9.8 9.7 2008 22439 128 11.2 10.1 9.9 9.8 2009 22618 128 15.7 10.1 9.9 9.8 2010 *** *** *** *** *** *** 2011 22218 124 10.3 9.8 9.7 9.6 2012 22085 125 10.2 9.6 9.5 9.4
HISTORICAL ADT BY YEAR
0
5000
10000
15000
20000
25000
03 04 05 06 07 08 09 10 11 12
Year
ADT
2012 TRAFFIC DATA
Average Weekday Traffic
Percent of ADT
Average Daily
Traffic Percent of ADT
January 21188 96 19409 88 February 22813 103 21039 95 March 22906 104 21481 97 April 24698 112 23037 104 May 24577 111 22934 104 June 24115 109 22729 103 July 23712 107 22314 101 August 23972 109 22406 101 September 24047 109 22730 103 October 25520 116 23346 106 November 24000 109 22100 100 December 23000 104 21500 97
Classification Breakdown Percent of ADT
Motorcyles 0.90 Passenger cars 66.83 Light Trucks 29.84 Buses 0.61 Single unit trucks (2 axles) 1.00 Single unit trucks (3 axles) 0.35 Single unit trucks (4 or more axles) 0.00 Single trailer trucks (4 or less axles) 0.00 Single trailer trucks (5 axles) 0.27 Single trailer trucks (6 or more axles) 0.12 Multi trailer trucks (5 or less axles) 0.00 Multi trailer trucks (6 axles) 0.04 Multi trailer trucks (7 or more axles) 0.04

302
Location: OR204; MP 0.12; WESTON-ELGIN HIGHWAY NO. 330; 1.44 miles east of Oregon-Washington Highway No. 8 (OR11)
Site Name: Weston (30-012) Installed: January, 1968
HISTORICAL TRAFFIC DATA
Percent of ADT
Year ADT Max Day
Max Hour
10TH Hour
20TH Hour
30TH Hour
2003 1263 184 22.8 14.6 13.6 13.1 2004 1279 *** *** *** *** *** 2005 1208 181 18.1 15.3 14.7 14.4 2006 1154 172 17.4 14.1 13.7 13.4 2007 1198 167 17.8 15.3 14.8 14.4 2008 1118 182 19.0 17.4 15.8 15.1 2009 1124 *** *** *** *** *** 2010 1108 192 21.7 17.6 16.7 16.0 2011 1058 204 22.3 19.5 17.8 16.8 2012 1006 203 36.2 19.8 18.1 17.1
HISTORICAL ADT BY YEAR
0200400600800
100012001400
03 04 05 06 07 08 09 10 11 12
Year
ADT
2012 TRAFFIC DATA
Average Weekday Traffic
Percent of ADT
Average Daily
Traffic Percent of ADT
January 652 65 734 73 February 652 65 737 73 March 616 61 674 67 April 701 70 749 74 May 947 94 1049 104 June 1068 106 1181 117 July 1320 131 1509 150 August 1283 128 1510 150 September 1143 114 1258 125 October 967 96 1030 102 November 783 78 833 83 December 713 71 804 80
Classification Breakdown Percent of ADT
Motorcyles 1.82 Passenger cars 49.46 Light Trucks 24.52 Buses 0.62 Single unit trucks (2 axles) 12.17 Single unit trucks (3 axles) 1.24 Single unit trucks (4 or more axles) 0.00 Single trailer trucks (4 or less axles) 4.04 Single trailer trucks (5 axles) 2.93 Single trailer trucks (6 or more axles) 1.91 Multi trailer trucks (5 or less axles) 0.09 Multi trailer trucks (6 axles) 0.04 Multi trailer trucks (7 or more axles) 1.16
Location: US395; MP 8.70; UMATILLA-STANFIELD HIGHWAY NO. 54; 0.12 mile northwest of
Feedville Road (Northwest of Stanfield) Site Name: Stanfield (30-019)
Installed: June, 2005
HISTORICAL TRAFFIC DATA
Percent of ADT
Year ADT Max Day
Max Hour
10TH Hour
20TH Hour
30TH Hour
2003 *** *** *** *** *** *** 2004 *** *** *** *** *** *** 2005 *** *** *** *** *** *** 2006 7743 136 10.3 10.0 9.7 9.6 2007 7727 127 10.2 9.8 9.6 9.5 2008 7469 131 10.4 10.0 9.9 9.8 2009 7618 135 11.1 10.1 9.9 9.7 2010 7706 136 10.5 10.0 9.9 9.7 2011 7567 128 10.6 9.8 9.7 9.6 2012 7347 132 10.4 9.9 9.7 9.6
HISTORICAL ADT BY YEAR
0
2000
4000
6000
8000
10000
03 04 05 06 07 08 09 10 11 12
Year
ADT
2012 TRAFFIC DATA
Average Weekday Traffic
Percent of ADT
Average Daily
Traffic Percent of ADT
January 6707 91 6282 86 February 7627 104 7228 98 March 7450 101 7221 98 April 7758 106 7405 101 May 7990 109 7623 104 June 7980 109 7692 105 July 8134 111 7721 105 August 8220 112 7898 108 September 8066 110 7788 106 October 7826 107 7475 102 November 7417 101 7058 96 December 7019 96 6768 92
Classification Breakdown Percent of ADT
Motorcyles 0.48 Passenger cars 66.82 Light Trucks 25.08 Buses 0.15 Single unit trucks (2 axles) 1.84 Single unit trucks (3 axles) 1.21 Single unit trucks (4 or more axles) 0.00 Single trailer trucks (4 or less axles) 0.02 Single trailer trucks (5 axles) 2.52 Single trailer trucks (6 or more axles) 1.05 Multi trailer trucks (5 or less axles) 0.22 Multi trailer trucks (6 axles) 0.21 Multi trailer trucks (7 or more axles) 0.40

303
Location: OR11; MP 34.46; OREGON-WASHINGTON HIGHWAY NO. 8; 0.86 mile south of Oregon-Washington State Line
Site Name: Milton (30-021) Installed: September, 1957
HISTORICAL TRAFFIC DATA
Percent of ADT
Year ADT Max Day
Max Hour
10TH Hour
20TH Hour
30TH Hour
2003 14323 129 10.2 9.9 9.8 9.7 2004 14359 124 10.5 9.9 9.7 9.7 2005 14818 *** *** *** *** *** 2006 14881 126 10.4 9.9 9.8 9.6 2007 14863 127 11.2 10.2 10.0 9.9 2008 14310 128 10.6 10.3 10.0 9.9 2009 14717 *** *** *** *** *** 2010 14739 125 10.7 10.4 10.1 10.0 2011 14521 131 10.7 10.2 10.0 9.9 2012 14333 130 10.9 10.3 10.0 9.9
HISTORICAL ADT BY YEAR
0
5000
10000
15000
20000
03 04 05 06 07 08 09 10 11 12
Year
ADT
2012 TRAFFIC DATA
Average Weekday Traffic
Percent of ADT
Average Daily
Traffic Percent of ADT
January 12576 88 11981 84 February 13837 97 13342 93 March 14203 99 13827 96 April 15056 105 14776 103 May 15458 108 15302 107 June 15766 110 15428 108 July 15854 111 15455 108 August 15782 110 15319 107 September 15393 107 15038 105 October 15178 106 14675 102 November 14099 98 13580 95 December 13690 96 13274 93
Classification Breakdown Percent of ADT
Motorcyles 0.07 Passenger cars 60.70 Light Trucks 34.00 Buses 0.28 Single unit trucks (2 axles) 2.30 Single unit trucks (3 axles) 0.30 Single unit trucks (4 or more axles) 0.03 Single trailer trucks (4 or less axles) 0.28 Single trailer trucks (5 axles) 0.93 Single trailer trucks (6 or more axles) 0.97 Multi trailer trucks (5 or less axles) 0.01 Multi trailer trucks (6 axles) 0.02 Multi trailer trucks (7 or more axles) 0.11
Location: I-82; MP 0.58; McNARY HIGHWAY NO. 70; 0.58 mile south of Oregon-Washington
State Line Site Name: Umatilla Bridge (30-025)
Installed: April, 1977
HISTORICAL TRAFFIC DATA
Percent of ADT
Year ADT Max Day
Max Hour
10TH Hour
20TH Hour
30TH Hour
2003 16437 156 12.9 11.5 10.8 10.5 2004 16306 152 13.2 11.3 11.0 10.7 2005 16307 162 12.3 11.2 10.8 10.6 2006 16542 153 13.1 11.4 10.9 10.5 2007 16973 148 12.9 11.0 10.8 10.6 2008 16364 152 14.5 11.6 10.7 10.4 2009 17136 149 13.2 11.5 11.2 11.0 2010 17854 148 11.7 11.1 10.9 10.7 2011 18100 152 12.0 11.0 10.6 10.4 2012 17880 144 12.5 11.1 10.8 10.5
HISTORICAL ADT BY YEAR
0
5000
10000
15000
20000
03 04 05 06 07 08 09 10 11 12
Year
ADT
2012 TRAFFIC DATA
Average Weekday Traffic
Percent of ADT
Average Daily
Traffic Percent of ADT
January 13295 74 13031 73 February 15241 85 15280 85 March 16418 92 16884 94 April 17305 97 17702 99 May 17966 100 18232 102 June 19498 109 19902 111 July 20595 115 21304 119 August 21223 119 21877 122 September 19642 110 19792 111 October 18316 102 18661 104 November 16534 92 16789 94 December 14801 83 15109 85
Classification Breakdown Percent of ADT
Motorcyles 0.82 Passenger cars 53.09 Light Trucks 20.70 Buses 0.26 Single unit trucks (2 axles) 2.80 Single unit trucks (3 axles) 0.54 Single unit trucks (4 or more axles) 0.08 Single trailer trucks (4 or less axles) 0.07 Single trailer trucks (5 axles) 15.32 Single trailer trucks (6 or more axles) 2.58 Multi trailer trucks (5 or less axles) 0.60 Multi trailer trucks (6 axles) 1.30 Multi trailer trucks (7 or more axles) 1.84

304
Location: I-84; MP 216.81; OLD OREGON TRAIL NO. 6; 0.76 mile southeast of Umatilla-Mission Highway No. 331 Interchange
Site Name: Mission Jct (30-026) Installed: June, 2007
HISTORICAL TRAFFIC DATA
Percent of ADT
Year ADT Max Day
Max Hour
10TH Hour
20TH Hour
30TH Hour
2003 *** *** *** *** *** *** 2004 *** *** *** *** *** *** 2005 *** *** *** *** *** *** 2006 *** *** *** *** *** *** 2007 *** *** *** *** *** *** 2008 9207 163 18.0 14.5 13.1 12.6 2009 9493 165 17.7 15.0 14.0 13.3 2010 9863 167 17.2 14.5 13.7 13.0 2011 9615 176 16.8 13.9 13.1 12.8 2012 9516 222 17.4 14.4 13.5 13.1
HISTORICAL ADT BY YEAR
0
2000
4000
6000
8000
10000
12000
03 04 05 06 07 08 09 10 11 12
Year
ADT
2012 TRAFFIC DATA
Average Weekday Traffic
Percent of ADT
Average Daily
Traffic Percent of ADT
January 6548 69 6495 68 February 7309 77 7274 76 March 8600 90 8900 94 April 9000 95 9300 98 May 9761 103 9946 105 June 10721 113 11232 118 July 11403 120 12072 127 August 11657 122 12241 129 September 10400 109 10500 110 October 9510 100 9848 103 November 8638 91 8892 93 December 7325 77 7493 79
Classification Breakdown Percent of ADT
Motorcyles 0.14 Passenger cars 33.15 Light Trucks 19.27 Buses 0.32 Single unit trucks (2 axles) 2.65 Single unit trucks (3 axles) 0.50 Single unit trucks (4 or more axles) 0.02 Single trailer trucks (4 or less axles) 2.81 Single trailer trucks (5 axles) 32.17 Single trailer trucks (6 or more axles) 5.58 Multi trailer trucks (5 or less axles) 0.50 Multi trailer trucks (6 axles) 0.45 Multi trailer trucks (7 or more axles) 2.44
Location: I-84; MP 191.40; OLD OREGON TRAIL NO. 6; 2.56 miles east of Umatilla-Stanfield
Highway No. 54 Interchange (US395) Site Name: Echo (30-027)
Installed: June, 2007
HISTORICAL TRAFFIC DATA
Percent of ADT
Year ADT Max Day
Max Hour
10TH Hour
20TH Hour
30TH Hour
2003 *** *** *** *** *** *** 2004 *** *** *** *** *** *** 2005 *** *** *** *** *** *** 2006 *** *** *** *** *** *** 2007 *** *** *** *** *** *** 2008 14675 146 13.8 11.5 10.8 10.3 2009 14656 147 13.0 11.9 11.2 10.8 2010 14507 160 13.0 12.1 11.5 11.3 2011 14339 158 13.5 11.5 11.1 10.9 2012 14266 147 13.6 11.5 11.2 11.0
HISTORICAL ADT BY YEAR
0
5000
10000
15000
20000
03 04 05 06 07 08 09 10 11 12
Year
ADT
2012 TRAFFIC DATA
Average Weekday Traffic
Percent of ADT
Average Daily
Traffic Percent of ADT
January 10703 75 10399 73 February 12061 85 11949 84 March 13383 94 13573 95 April 13969 98 14127 99 May 14847 104 14812 104 June 15769 111 16029 112 July 16475 115 16970 119 August 16805 118 17213 121 September 15949 112 16002 112 October 14600 102 14900 104 November 13417 94 13474 94 December 11721 82 11742 82
Classification Breakdown Percent of ADT
Motorcyles 0.17 Passenger cars 51.20 Light Trucks 14.84 Buses 0.30 Single unit trucks (2 axles) 2.60 Single unit trucks (3 axles) 0.71 Single unit trucks (4 or more axles) 0.01 Single trailer trucks (4 or less axles) 1.77 Single trailer trucks (5 axles) 22.44 Single trailer trucks (6 or more axles) 3.14 Multi trailer trucks (5 or less axles) 0.28 Multi trailer trucks (6 axles) 0.30 Multi trailer trucks (7 or more axles) 2.24

305
Location: OR82; MP 1.74; WALLOWA LAKE HIGHWAY NO. 10; 0.82 mile east of Old Oregon Trail Highway No. 6 (I-84)
Site Name: Island City (31-003) Installed: April, 1999
HISTORICAL TRAFFIC DATA
Percent of ADT
Year ADT Max Day
Max Hour
10TH Hour
20TH Hour
30TH Hour
2003 13263 134 12.3 11.6 11.1 10.8 2004 13484 133 12.9 11.7 11.2 11.0 2005 12363 134 12.3 11.4 11.2 11.0 2006 12180 125 12.1 11.5 11.1 10.9 2007 12382 *** *** *** *** *** 2008 11892 *** *** *** *** *** 2009 11983 *** *** *** *** *** 2010 *** *** *** *** *** *** 2011 *** *** *** *** *** *** 2012 *** *** *** *** *** ***
HISTORICAL ADT BY YEAR
0
5000
10000
15000
03 04 05 06 07 08 09 10 11 12
Year
ADT
2012 TRAFFIC DATA
Average Weekday Traffic
Percent of ADT
Average Daily
Traffic Percent of ADT
January *** *** *** *** February *** *** *** *** March *** *** *** *** April *** *** *** *** May *** *** *** *** June *** *** *** *** July *** *** *** *** August *** *** *** *** September *** *** *** *** October *** *** *** *** November *** *** *** *** December *** *** *** ***
Classification Breakdown Percent of ADT
Motorcyles 0.20 Passenger cars 49.31 Light Trucks 27.90 Buses 1.56 Single unit trucks (2 axles) 14.87 Single unit trucks (3 axles) 0.67 Single unit trucks (4 or more axles) 0.06 Single trailer trucks (4 or less axles) 2.61 Single trailer trucks (5 axles) 1.19 Single trailer trucks (6 or more axles) 0.74 Multi trailer trucks (5 or less axles) 0.10 Multi trailer trucks (6 axles) 0.03 Multi trailer trucks (7 or more axles) 0.76
Location: OR82; MP 20.70; WALLOWA LAKE HIGHWAY NO. 10; 0.45 mile northeast of
Weston-Elgin Highway No. 330 (OR204) Site Name: Elgin (31-005)
Installed: April, 1957
HISTORICAL TRAFFIC DATA
Percent of ADT
Year ADT Max Day
Max Hour
10TH Hour
20TH Hour
30TH Hour
2003 2070 193 27.8 16.2 15.1 14.2 2004 2060 *** *** *** *** *** 2005 1972 183 19.9 14.8 14.0 13.6 2006 1955 190 20.0 14.4 13.9 13.5 2007 1959 195 22.0 15.3 14.4 13.9 2008 1768 187 29.1 16.6 15.3 14.5 2009 1847 *** *** *** *** *** 2010 1901 204 28.6 17.2 15.5 14.8 2011 1807 197 22.8 15.8 14.9 14.2 2012 1756 *** *** *** *** ***
HISTORICAL ADT BY YEAR
0
500
1000
1500
2000
2500
03 04 05 06 07 08 09 10 11 12
Year
ADT
2012 TRAFFIC DATA
Average Weekday Traffic
Percent of ADT
Average Daily
Traffic Percent of ADT
January 1329 76 1292 74 February 1430 81 1421 81 March 1341 76 1386 79 April 1417 81 1480 84 May 1688 96 1760 100 June 2013 115 2071 118 July 2432 138 2549 145 August 2230 127 2375 135 September 2087 119 2160 123 October 1787 102 1793 102 November 1542 88 1522 87 December 1247 71 1263 72
Classification Breakdown Percent of ADT
Motorcyles 0.10 Passenger cars 48.00 Light Trucks 28.11 Buses 0.78 Single unit trucks (2 axles) 16.14 Single unit trucks (3 axles) 0.37 Single unit trucks (4 or more axles) 0.00 Single trailer trucks (4 or less axles) 4.55 Single trailer trucks (5 axles) 1.48 Single trailer trucks (6 or more axles) 0.30 Multi trailer trucks (5 or less axles) 0.10 Multi trailer trucks (6 axles) 0.00 Multi trailer trucks (7 or more axles) 0.07

306
Location: I-84; MP 260.12; OLD OREGON TRAIL NO. 6; 1.05 miles east of La Grande-Baker Highway No. 66 (US30), North La Grande Interchange
Site Name: North La Grande (31-007) Installed: December, 2008
HISTORICAL TRAFFIC DATA
Percent of ADT
Year ADT Max Day
Max Hour
10TH Hour
20TH Hour
30TH Hour
2003 *** *** *** *** *** *** 2004 *** *** *** *** *** *** 2005 *** *** *** *** *** *** 2006 *** *** *** *** *** *** 2007 *** *** *** *** *** *** 2008 *** *** *** *** *** *** 2009 8464 164 17.7 14.4 13.5 13.2 2010 8721 167 16.8 14.5 13.4 12.8 2011 8868 182 16.1 14.1 13.5 13.1 2012 8589 156 17.6 13.8 13.2 12.8
HISTORICAL ADT BY YEAR
0
2000
4000
6000
8000
10000
03 04 05 06 07 08 09 10 11 12
Year
ADT
2012 TRAFFIC DATA
Average Weekday Traffic
Percent of ADT
Average Daily
Traffic Percent of ADT
January 6057 71 5913 69 February 6622 77 6544 76 March 7704 90 7952 93 April 8094 94 8283 96 May 8893 104 8981 105 June 9812 114 10180 119 July 10441 122 11020 128 August 10621 124 11085 129 September 9605 112 9658 112 October 8592 100 8799 102 November 7868 92 8018 93 December 6531 76 6633 77
Classification Breakdown Percent of ADT
Motorcyles 0.15 Passenger cars 36.46 Light Trucks 14.62 Buses 0.28 Single unit trucks (2 axles) 1.54 Single unit trucks (3 axles) 0.53 Single unit trucks (4 or more axles) 0.00 Single trailer trucks (4 or less axles) 1.53 Single trailer trucks (5 axles) 34.62 Single trailer trucks (6 or more axles) 4.90 Multi trailer trucks (5 or less axles) 0.46 Multi trailer trucks (6 axles) 1.17 Multi trailer trucks (7 or more axles) 3.74
Location: I-84; MP 272.19; OLD OREGON TRAIL NO. 6; 1.72 miles northwest of Ladd Canyon
Road Site Name: Ladd Summit (31-008)
Installed: July, 2008
HISTORICAL TRAFFIC DATA
Percent of ADT
Year ADT Max Day
Max Hour
10TH Hour
20TH Hour
30TH Hour
2003 *** *** *** *** *** *** 2004 *** *** *** *** *** *** 2005 *** *** *** *** *** *** 2006 *** *** *** *** *** *** 2007 *** *** *** *** *** *** 2008 *** *** *** *** *** *** 2009 9630 159 15.8 12.9 12.1 11.7 2010 9441 164 14.6 13.4 12.5 12.2 2011 9305 174 15.3 12.9 12.3 11.9 2012 9330 150 16.1 13.0 12.3 11.9
HISTORICAL ADT BY YEAR
0
2000
4000
6000
8000
10000
12000
03 04 05 06 07 08 09 10 11 12
Year
ADT
2012 TRAFFIC DATA
Average Weekday Traffic
Percent of ADT
Average Daily
Traffic Percent of ADT
January 6788 73 6686 72 February 7431 80 7363 79 March 8446 91 8703 93 April 8886 95 9071 97 May 9701 104 9736 104 June 10654 114 10914 117 July 11194 120 11721 126 August 11485 123 11822 127 September 10355 111 10293 110 October 9358 100 9476 102 November 8633 93 8712 93 December 7379 79 7466 80
Classification Breakdown Percent of ADT
Motorcyles 0.41 Passenger cars 43.75 Light Trucks 18.48 Buses 0.22 Single unit trucks (2 axles) 2.97 Single unit trucks (3 axles) 0.76 Single unit trucks (4 or more axles) 0.00 Single trailer trucks (4 or less axles) 2.89 Single trailer trucks (5 axles) 24.04 Single trailer trucks (6 or more axles) 4.00 Multi trailer trucks (5 or less axles) 0.38 Multi trailer trucks (6 axles) 0.11 Multi trailer trucks (7 or more axles) 1.99

307
Location: I-84; MP 75.93; COLUMBIA RIVER HIGHWAY NO. 2; 0.72 mile west of the Rowena Interchange
Site Name: Rowena (33-001) Installed: January, 1938
HISTORICAL TRAFFIC DATA
Percent of ADT
Year ADT Max Day
Max Hour
10TH Hour
20TH Hour
30TH Hour
2003 19728 167 16.1 14.0 13.1 12.5 2004 19455 165 14.7 13.1 12.4 12.1 2005 19879 170 14.8 13.8 12.6 12.2 2006 20518 169 15.3 13.3 12.3 11.9 2007 20867 163 15.3 13.3 12.3 12.0 2008 19453 164 15.8 13.4 12.4 12.0 2009 20662 159 14.5 13.5 12.9 12.4 2010 20760 158 13.3 12.8 12.5 12.1 2011 20322 165 14.7 12.9 12.5 12.1 2012 20162 158 16.0 12.9 12.4 12.2
HISTORICAL ADT BY YEAR
0
5000
10000
15000
20000
25000
03 04 05 06 07 08 09 10 11 12
Year
ADT
2012 TRAFFIC DATA
Average Weekday Traffic
Percent of ADT
Average Daily
Traffic Percent of ADT
January 14587 72 14182 70 February 16884 84 16909 84 March 18354 91 18792 93 April 18841 93 19560 97 May 20404 101 21083 105 June 21852 108 22775 113 July 23573 117 24985 124 August 23498 117 24884 123 September 21471 106 22214 110 October 19592 97 20394 101 November 18759 93 19039 94 December 16807 83 17124 85
Classification Breakdown Percent of ADT
Motorcyles 0.21 Passenger cars 27.47 Light Trucks 44.32 Buses 0.30 Single unit trucks (2 axles) 4.20 Single unit trucks (3 axles) 0.73 Single unit trucks (4 or more axles) 0.22 Single trailer trucks (4 or less axles) 1.45 Single trailer trucks (5 axles) 12.98 Single trailer trucks (6 or more axles) 3.65 Multi trailer trucks (5 or less axles) 0.48 Multi trailer trucks (6 axles) 0.32 Multi trailer trucks (7 or more axles) 3.67
Location: US197; MP 10.30; THE DALLES-CALIFORNIA HIGHWAY NO. 4; 0.84 mile south of
Boyd Market Road (North Jct) Site Name: Dufur (33-005)
Installed: April, 1957
HISTORICAL TRAFFIC DATA
Percent of ADT
Year ADT Max Day
Max Hour
10TH Hour
20TH Hour
30TH Hour
2003 2546 175 15.7 13.8 12.7 12.0 2004 2379 153 15.2 12.0 11.6 11.4 2005 2405 157 19.9 13.0 12.2 11.8 2006 2502 176 16.4 13.7 13.1 12.6 2007 2547 157 16.8 12.8 12.1 11.7 2008 2539 140 14.7 12.7 12.1 11.8 2009 2517 159 16.8 13.9 13.0 12.4 2010 2500 *** *** *** *** *** 2011 2402 169 17.4 14.4 13.2 12.6 2012 2397 178 20.1 13.9 13.1 12.6
HISTORICAL ADT BY YEAR
0
500
1000
1500
2000
2500
3000
03 04 05 06 07 08 09 10 11 12
Year
ADT
2012 TRAFFIC DATA
Average Weekday Traffic
Percent of ADT
Average Daily
Traffic Percent of ADT
January 1823 76 1756 73 February 2113 88 2046 85 March 2296 96 2227 93 April 2395 100 2413 101 May 2522 105 2629 110 June 2571 107 2569 107 July 2935 122 2970 124 August 3003 125 3095 129 September 2629 110 2599 108 October 2419 101 2295 96 November 2234 93 2112 88 December 2107 88 2052 86
Classification Breakdown Percent of ADT
Motorcyles 1.08 Passenger cars 63.37 Light Trucks 21.02 Buses 0.35 Single unit trucks (2 axles) 9.60 Single unit trucks (3 axles) 0.97 Single unit trucks (4 or more axles) 0.04 Single trailer trucks (4 or less axles) 2.05 Single trailer trucks (5 axles) 0.79 Single trailer trucks (6 or more axles) 0.44 Multi trailer trucks (5 or less axles) 0.06 Multi trailer trucks (6 axles) 0.04 Multi trailer trucks (7 or more axles) 0.19

308
Location: OR6; MP 38.55; WILSON RIVER HIGHWAY NO. 37; 0.75 mile west of Glenwood Lane
Site Name: Gales Creek (34-004) Installed: October, 1956
HISTORICAL TRAFFIC DATA
Percent of ADT
Year ADT Max Day
Max Hour
10TH Hour
20TH Hour
30TH Hour
2003 4871 230 23.8 20.9 20.0 19.3 2004 4811 210 29.3 23.3 20.5 19.8 2005 4706 239 24.0 21.7 20.6 19.8 2006 4791 264 26.5 22.7 21.3 20.5 2007 4937 221 24.7 20.6 19.6 19.0 2008 4575 273 27.7 23.1 21.4 20.9 2009 4851 279 30.0 25.2 22.4 21.3 2010 4733 286 27.5 24.8 22.9 21.5 2011 4512 266 29.7 24.6 23.1 22.4 2012 4553 336 32.7 25.6 23.3 22.2
HISTORICAL ADT BY YEAR
0
1000
2000
3000
4000
5000
6000
03 04 05 06 07 08 09 10 11 12
Year
ADT
2012 TRAFFIC DATA
Average Weekday Traffic
Percent of ADT
Average Daily
Traffic Percent of ADT
January 2150 47 2650 58 February 2823 62 3428 75 March 2781 61 3398 75 April 3011 66 4061 89 May 3700 81 4913 108 June 4011 88 4903 108 July 5490 121 6851 150 August 5476 120 7391 162 September 4570 100 5743 126 October 3683 81 4454 98 November 3341 73 3905 86 December 2571 56 2940 65
Classification Breakdown Percent of ADT
Motorcyles 1.33 Passenger cars 63.88 Light Trucks 15.76 Buses 2.06 Single unit trucks (2 axles) 7.40 Single unit trucks (3 axles) 1.30 Single unit trucks (4 or more axles) 0.01 Single trailer trucks (4 or less axles) 3.29 Single trailer trucks (5 axles) 2.36 Single trailer trucks (6 or more axles) 1.38 Multi trailer trucks (5 or less axles) 0.32 Multi trailer trucks (6 axles) 0.10 Multi trailer trucks (7 or more axles) 0.81
Location: US26; MP 37.67; SUNSET HIGHWAY NO. 47; 0.03 mile west of Vernonia Road Site Name: Timber Jct (34-005)
Installed: March, 2004
HISTORICAL TRAFFIC DATA
Percent of ADT
Year ADT Max Day
Max Hour
10TH Hour
20TH Hour
30TH Hour
2003 *** *** *** *** *** *** 2004 *** *** *** *** *** *** 2005 6575 269 24.2 22.6 21.3 20.5 2006 6682 295 26.6 22.8 21.8 21.3 2007 6755 243 24.3 20.6 19.8 19.3 2008 6440 269 24.6 22.6 21.3 20.8 2009 6943 268 25.1 22.0 20.9 20.1 2010 6950 286 27.7 22.1 20.0 19.3 2011 6426 290 28.2 23.9 22.5 21.4 2012 6487 286 28.8 24.1 23.3 21.9
HISTORICAL ADT BY YEAR
0
2000
4000
6000
8000
03 04 05 06 07 08 09 10 11 12
Year
ADT
2012 TRAFFIC DATA
Average Weekday Traffic
Percent of ADT
Average Daily
Traffic Percent of ADT
January 3033 47 3818 59 February 3703 57 4800 74 March 3745 58 4956 76 April 4137 64 5914 91 May 5216 80 7258 112 June 5867 90 7194 111 July 8407 130 10166 157 August 8323 128 11023 170 September 6501 100 8378 129 October 4435 68 5685 88 November 3860 60 4801 74 December 3206 49 3855 59
Classification Breakdown Percent of ADT
Motorcyles 0.67 Passenger cars 67.69 Light Trucks 23.25 Buses 0.12 Single unit trucks (2 axles) 2.31 Single unit trucks (3 axles) 0.91 Single unit trucks (4 or more axles) 0.06 Single trailer trucks (4 or less axles) 2.10 Single trailer trucks (5 axles) 2.04 Single trailer trucks (6 or more axles) 0.41 Multi trailer trucks (5 or less axles) 0.09 Multi trailer trucks (6 axles) 0.05 Multi trailer trucks (7 or more axles) 0.30

309
Location: US26; MP 56.23; SUNSET HIGHWAY NO. 47; 0.93 mile northwest of North Plains (Glencoe Road) Interchange
Site Name: North Plains (34-007) Installed: June, 2005
HISTORICAL TRAFFIC DATA
Percent of ADT
Year ADT Max Day
Max Hour
10TH Hour
20TH Hour
30TH Hour
2003 *** *** *** *** *** *** 2004 *** *** *** *** *** *** 2005 *** *** *** *** *** *** 2006 21274 182 15.0 13.9 13.3 12.9 2007 21394 160 14.9 13.5 13.0 12.7 2008 20927 190 16.1 14.4 13.5 13.3 2009 21017 181 16.2 14.7 14.0 13.6 2010 21010 195 16.5 15.0 13.6 13.4 2011 20135 191 17.2 15.6 14.8 14.3 2012 20051 *** *** *** *** ***
HISTORICAL ADT BY YEAR
0
5000
10000
15000
20000
25000
03 04 05 06 07 08 09 10 11 12
Year
ADT
2012 TRAFFIC DATA
Average Weekday Traffic
Percent of ADT
Average Daily
Traffic Percent of ADT
January 14048 70 14811 74 February 16195 81 17030 85 March 15814 79 16927 84 April 16962 85 19222 96 May 18761 94 21479 107 June 20020 100 21619 108 July 23899 119 26439 132 August 24201 121 28299 141 September 20922 104 23334 116 October 17973 90 19117 95 November 16567 83 17100 85 December 14470 72 15234 76
Classification Breakdown Percent of ADT
Motorcyles 0.11 Passenger cars 60.55 Light Trucks 32.66 Buses 0.18 Single unit trucks (2 axles) 2.31 Single unit trucks (3 axles) 0.75 Single unit trucks (4 or more axles) 0.08 Single trailer trucks (4 or less axles) 0.22 Single trailer trucks (5 axles) 1.41 Single trailer trucks (6 or more axles) 1.06 Multi trailer trucks (5 or less axles) 0.02 Multi trailer trucks (6 axles) 0.06 Multi trailer trucks (7 or more axles) 0.59
Location: I-5; MP 290.14; PACIFIC HIGHWAY NO. 1; 0.34 mile south of Boones Ferry Road
Interchange Site Name: Tigard (34-008)
Installed: September, 2007
HISTORICAL TRAFFIC DATA
Percent of ADT
Year ADT Max Day
Max Hour
10TH Hour
20TH Hour
30TH Hour
2003 *** *** *** *** *** *** 2004 *** *** *** *** *** *** 2005 *** *** *** *** *** *** 2006 *** *** *** *** *** *** 2007 *** *** *** *** *** *** 2008 151707 120 8.6 8.5 8.5 8.4 2009 153544 118 8.6 8.5 8.4 8.3 2010 155956 117 8.6 8.4 8.3 8.3 2011 154847 117 8.6 8.4 8.4 8.4 2012 153197 117 8.5 8.3 8.3 8.2
HISTORICAL ADT BY YEAR
0
50000
100000
150000
200000
03 04 05 06 07 08 09 10 11 12
Year
ADT
2012 TRAFFIC DATA
Average Weekday Traffic
Percent of ADT
Average Daily
Traffic Percent of ADT
January 144585 94 136331 89 February 156455 102 147679 96 March 155842 102 147477 96 April 162035 106 154546 101 May 164900 108 156900 102 June 171200 112 162000 106 July 169300 111 160300 105 August 173178 113 163107 106 September 164746 108 157730 103 October 161602 105 153684 100 November 158100 103 149340 97 December 155554 102 149272 97
Classification Breakdown Percent of ADT
Motorcyles 0.64 Passenger cars 75.40 Light Trucks 13.96 Buses 0.18 Single unit trucks (2 axles) 2.97 Single unit trucks (3 axles) 0.69 Single unit trucks (4 or more axles) 0.12 Single trailer trucks (4 or less axles) 0.33 Single trailer trucks (5 axles) 4.41 Single trailer trucks (6 or more axles) 0.61 Multi trailer trucks (5 or less axles) 0.04 Multi trailer trucks (6 axles) 0.03 Multi trailer trucks (7 or more axles) 0.62
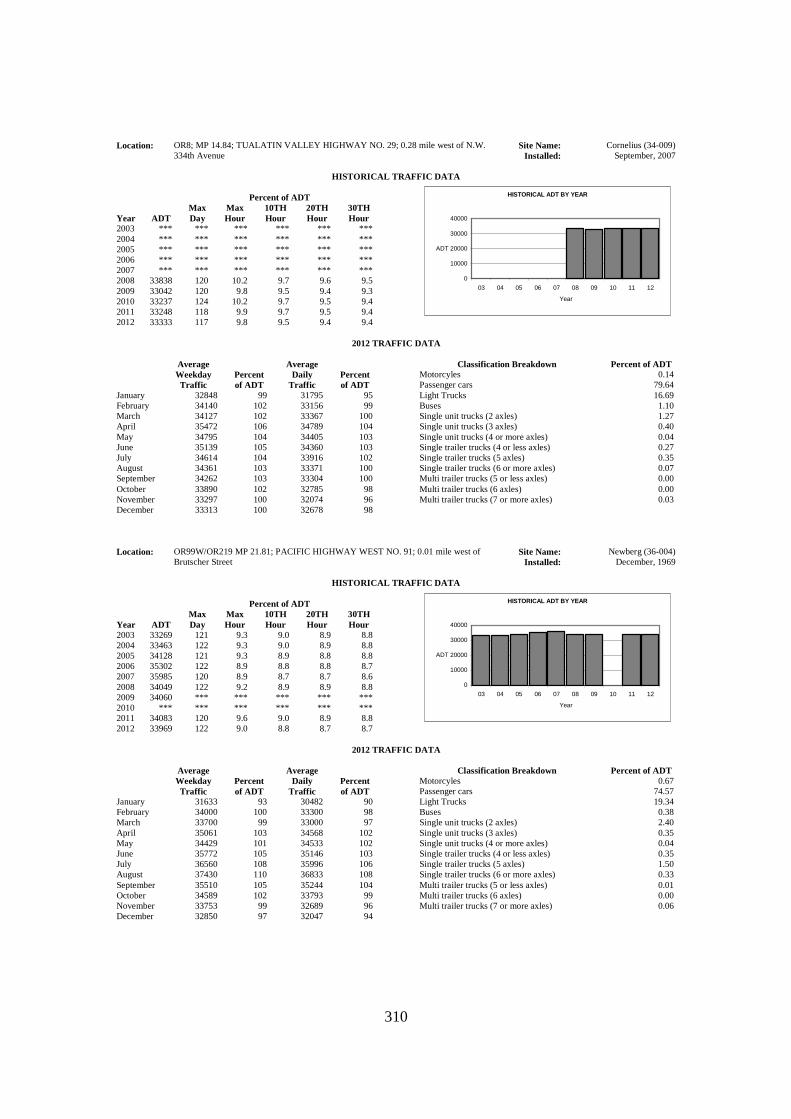
310
Location: OR8; MP 14.84; TUALATIN VALLEY HIGHWAY NO. 29; 0.28 mile west of N.W. 334th Avenue
Site Name: Cornelius (34-009) Installed: September, 2007
HISTORICAL TRAFFIC DATA
Percent of ADT
Year ADT Max Day
Max Hour
10TH Hour
20TH Hour
30TH Hour
2003 *** *** *** *** *** *** 2004 *** *** *** *** *** *** 2005 *** *** *** *** *** *** 2006 *** *** *** *** *** *** 2007 *** *** *** *** *** *** 2008 33838 120 10.2 9.7 9.6 9.5 2009 33042 120 9.8 9.5 9.4 9.3 2010 33237 124 10.2 9.7 9.5 9.4 2011 33248 118 9.9 9.7 9.5 9.4 2012 33333 117 9.8 9.5 9.4 9.4
HISTORICAL ADT BY YEAR
0
10000
20000
30000
40000
03 04 05 06 07 08 09 10 11 12
Year
ADT
2012 TRAFFIC DATA
Average Weekday Traffic
Percent of ADT
Average Daily
Traffic Percent of ADT
January 32848 99 31795 95 February 34140 102 33156 99 March 34127 102 33367 100 April 35472 106 34789 104 May 34795 104 34405 103 June 35139 105 34360 103 July 34614 104 33916 102 August 34361 103 33371 100 September 34262 103 33304 100 October 33890 102 32785 98 November 33297 100 32074 96 December 33313 100 32678 98
Classification Breakdown Percent of ADT
Motorcyles 0.14 Passenger cars 79.64 Light Trucks 16.69 Buses 1.10 Single unit trucks (2 axles) 1.27 Single unit trucks (3 axles) 0.40 Single unit trucks (4 or more axles) 0.04 Single trailer trucks (4 or less axles) 0.27 Single trailer trucks (5 axles) 0.35 Single trailer trucks (6 or more axles) 0.07 Multi trailer trucks (5 or less axles) 0.00 Multi trailer trucks (6 axles) 0.00 Multi trailer trucks (7 or more axles) 0.03
Location: OR99W/OR219 MP 21.81; PACIFIC HIGHWAY WEST NO. 91; 0.01 mile west of
Brutscher Street Site Name: Newberg (36-004)
Installed: December, 1969
HISTORICAL TRAFFIC DATA
Percent of ADT
Year ADT Max Day
Max Hour
10TH Hour
20TH Hour
30TH Hour
2003 33269 121 9.3 9.0 8.9 8.8 2004 33463 122 9.3 9.0 8.9 8.8 2005 34128 121 9.3 8.9 8.8 8.8 2006 35302 122 8.9 8.8 8.8 8.7 2007 35985 120 8.9 8.7 8.7 8.6 2008 34049 122 9.2 8.9 8.9 8.8 2009 34060 *** *** *** *** *** 2010 *** *** *** *** *** *** 2011 34083 120 9.6 9.0 8.9 8.8 2012 33969 122 9.0 8.8 8.7 8.7
HISTORICAL ADT BY YEAR
0
10000
20000
30000
40000
03 04 05 06 07 08 09 10 11 12
Year
ADT
2012 TRAFFIC DATA
Average Weekday Traffic
Percent of ADT
Average Daily
Traffic Percent of ADT
January 31633 93 30482 90 February 34000 100 33300 98 March 33700 99 33000 97 April 35061 103 34568 102 May 34429 101 34533 102 June 35772 105 35146 103 July 36560 108 35996 106 August 37430 110 36833 108 September 35510 105 35244 104 October 34589 102 33793 99 November 33753 99 32689 96 December 32850 97 32047 94
Classification Breakdown Percent of ADT
Motorcyles 0.67 Passenger cars 74.57 Light Trucks 19.34 Buses 0.38 Single unit trucks (2 axles) 2.40 Single unit trucks (3 axles) 0.35 Single unit trucks (4 or more axles) 0.04 Single trailer trucks (4 or less axles) 0.35 Single trailer trucks (5 axles) 1.50 Single trailer trucks (6 or more axles) 0.33 Multi trailer trucks (5 or less axles) 0.01 Multi trailer trucks (6 axles) 0.00 Multi trailer trucks (7 or more axles) 0.06

311
Location: OR99W; MP 47.45; PACIFIC HIGHWAY WEST NO. 91; 0.07 mile north of Yamhill-Polk County Line
Site Name: Amity (36-005) Installed: September, 1956
HISTORICAL TRAFFIC DATA
Percent of ADT
Year ADT Max Day
Max Hour
10TH Hour
20TH Hour
30TH Hour
2003 5571 140 13.2 11.5 11.0 10.9 2004 5731 132 13.3 11.4 11.1 10.9 2005 5858 *** *** *** *** *** 2006 5957 137 13.2 11.5 11.1 10.7 2007 5874 132 13.2 11.3 10.9 10.7 2008 5433 131 12.9 11.8 11.2 11.0 2009 5452 132 14.5 11.8 11.3 11.0 2010 5594 135 14.7 11.8 11.2 11.0 2011 5553 135 14.5 11.8 11.3 11.1 2012 5556 133 14.6 11.8 11.6 11.4
HISTORICAL ADT BY YEAR
01000200030004000500060007000
03 04 05 06 07 08 09 10 11 12
Year
ADT
2012 TRAFFIC DATA
Average Weekday Traffic
Percent of ADT
Average Daily
Traffic Percent of ADT
January 5004 90 4820 87 February 5524 99 5365 97 March 5330 96 5205 94 April 5688 102 5650 102 May 5869 106 5869 106 June 5977 108 5897 106 July 5901 106 5775 104 August 6017 108 5906 106 September 5789 104 5799 104 October 5931 107 5881 106 November 5709 103 5595 101 December 5090 92 4905 88
Classification Breakdown Percent of ADT
Motorcyles 0.67 Passenger cars 60.93 Light Trucks 31.34 Buses 0.29 Single unit trucks (2 axles) 2.81 Single unit trucks (3 axles) 0.74 Single unit trucks (4 or more axles) 0.10 Single trailer trucks (4 or less axles) 0.36 Single trailer trucks (5 axles) 1.38 Single trailer trucks (6 or more axles) 0.89 Multi trailer trucks (5 or less axles) 0.02 Multi trailer trucks (6 axles) 0.01 Multi trailer trucks (7 or more axles) 0.46
Location: OR18; MP 41.00; SALMON RIVER HIGHWAY NO. 39; 3.36 miles south of Pacific
Highway West No. 91 (OR99W) Site Name: Salmon River (36-006)
Installed: July, 2000
HISTORICAL TRAFFIC DATA
Percent of ADT
Year ADT Max Day
Max Hour
10TH Hour
20TH Hour
30TH Hour
2003 14113 134 10.9 10.3 10.1 9.9 2004 14237 141 10.8 10.3 10.1 10.0 2005 14230 135 10.6 10.0 9.9 9.7 2006 14298 *** *** *** *** *** 2007 14283 137 10.7 10.2 9.9 9.8 2008 13234 143 11.8 10.5 10.3 10.1 2009 13550 136 11.2 10.5 10.2 10.1 2010 13487 141 11.4 10.8 10.4 10.3 2011 13097 138 11.8 10.9 10.7 10.5 2012 12859 151 12.3 11.2 10.9 10.7
HISTORICAL ADT BY YEAR
0
5000
10000
15000
20000
03 04 05 06 07 08 09 10 11 12
Year
ADT
2012 TRAFFIC DATA
Average Weekday Traffic
Percent of ADT
Average Daily
Traffic Percent of ADT
January 10490 82 10922 85 February 11695 91 12403 96 March 11429 89 12313 96 April 11847 92 12703 99 May 12241 95 13306 103 June 12851 100 13532 105 July 14276 111 14972 116 August 14178 110 15328 119 September 13014 101 13796 107 October 11929 93 12417 97 November 11190 87 11510 90 December 10789 84 11101 86
Classification Breakdown Percent of ADT
Motorcyles 1.10 Passenger cars 76.75 Light Trucks 15.66 Buses 0.65 Single unit trucks (2 axles) 1.54 Single unit trucks (3 axles) 1.06 Single unit trucks (4 or more axles) 0.03 Single trailer trucks (4 or less axles) 0.42 Single trailer trucks (5 axles) 2.08 Single trailer trucks (6 or more axles) 0.27 Multi trailer trucks (5 or less axles) 0.01 Multi trailer trucks (6 axles) 0.02 Multi trailer trucks (7 or more axles) 0.41

312

313
GLOSSARY AADT: Annual Average Daily Traffic - The total traffic for the year divided by 365 (or
366 in a leap year). In most cases, the AADT is obtained by adjusting a 48-hour traffic count by applying four factors. The first two factors are seasonal and day of week factors, which account for temporal variations in traffic. They are developed from permanent traffic recording stations. The third factor is an axle factor, which is used to account for vehicles with more than two axles. This factor is obtained from vehicle classification counts. For counts not taken during the latest data year, the fourth factor is a growth factor.
ATR: Automatic Traffic Recorder – a permanently installed, continuous counting
device. Includes AVC and WIM sites. AVC: Automatic Vehicle Classifier – a permanently installed, continuous counting and
classification device. FHWA: Federal Highway Administration. VMT: Vehicle Miles of Travel (or Vehicle Miles Traveled) – the sum of distances
traveled by all motor vehicles in a specified system of highways for a given period of time.
WIM: Weigh-In-Motion – a permanently installed device for weighing vehicles in the
traveled lanes. In section I, an asterisk (*), appearing to the left of a count location description, indicates the location of an automatic traffic recorder station. Asterisks (***), appearing in Section II, under "Historical Traffic Data", indicates recorder was inoperative during those time periods or data is unrepresentative.
Prefixes to Milepoints T: Temporary Mileage – Mileage on a temporary traveled route, usually due to a
detour or highway under construction. Z: Overlapping Mileage – When a road is lengthened in the middle due
to realignment, Z-mileage is created.

314