2012 survey of u.s. health care consumers: five … health care consumerism over five years...
TRANSCRIPT
2012 Survey of U.S. Health Care Consumers: Five-Year Look BackKey findings, strategic implications
A Deloitte Center for Health Solutions report

Contents
Contents | 1
Foreword | 2
Introduction | 3
Survey methodology | 4
Highlights 2008–2012 | 6
Six segments of the health care consumer market | 9
Views on U.S. health care system performance | 10
Zone one: Wellness and healthy living | 15
Zone two: Information resources | 19
Zone three: Traditional health services | 24
Zone four: Alternative health services | 33
Zone five: Health insurance | 34
Zone six: Health policy | 39
Key findings | 41
Closing thoughts | 44
Key Findings, strategic implications
1
Foreword
1. Bureau of Economic Analysis. Gross Domestic Product: First Quarter 2012 (Advance Estimate). April 27, 2012.2. Bureau of Economic Analysis http://www.bea.gov, accessed April 2012 3. Each sample of up to 4,000 U.S. adults has been demographically representative of the U.S. population with respect to
age, gender, income, race/ethnicity, and geography.
ConSumerS are the foundation of the United States’ economy: 70 percent of our Gross Domestic Product (GDP) is dependent upon personal consumption;1 their needs and wants
drive innovation in every domain of daily life except, perhaps, health care. Recently, health policy experts and economists have challenged the health care industry’s
approach to consumerism; many reason that costs would be lower, service better, and quality sub-stantially improved if the industry repositioned itself as a consumer market. Among consumers, there is a widening gap between their unmet needs and the system’s performance. Still, many stake-holders doubt that the health care industry could function in a consumer economy, reasoning that health care can be too complicated for the “average Joe” to engage with it knowledgeably and appro-priately. Consumers’ decisions to purchase or utilize health care services and products often rely upon expert recommendations from medical professionals. In addition, many consumers’ choices are affected by health insurance, which can distort the true cost of health care services and products. Increasingly, consumers are bearing the costs of health care; expenditures for personal consump-tion of health care are the second-highest household expense after housing/utilities.2 Although the idiosyncrasies of the health care system are likely to characterize the market for a long time to come, there are signs that consumers are ready to become more active, informed decision-makers.
2012 marks the fifth year for the Deloitte Center for Health Solutions’ survey of U.S. adult health care consumers about their interest in and ability to operate in a consumer health care market.3 These annual online surveys have queried up to 4,000 adults per year in various age, health status, income, and insurance groups to identify the degree to which consumers are prepared to engage with the health care system. Five years ago, findings from Deloitte’s first consumer survey (2008) revealed that users of the health care system are “neither patient nor patients. They are consum-ers,” and this remains true in 2012. The distinctions between the two are stark; the implications are transformative—not only to the health care industry but to every U.S. household, company, and government agency.
This report provides data-driven insights gleaned from the Deloitte 2012 Survey of U.S. Health Care Consumers as well as a look back at five years of findings that point to untapped potential for increased health care industry engagement with consumers and, with that, new challenges and opportunities for providers, health plans, employers, and government.
Paul H. Keckley, PhDexecutive DirectorDeloitte Center for Health SolutionsWashington, D.C.
2012 Survey of U.S. Health Care Consumers: Five-Year Look Back
2
Conducted annually since 2008, Deloitte’s longitudinal study of heath care consum-ers seeks to provide a comprehensive view of health care consumerism, a view that goes beyond the conventional boundaries of what health and health care are commonly thought to encompass.
In addition to the traditional services that doctors and hospitals provide, the study’s framework takes into account the expanding spectrum of treatment alternatives, delivery settings, information sources, and programs that are coming into existence to promote well-ness and self-care, address health needs, and finance health care.
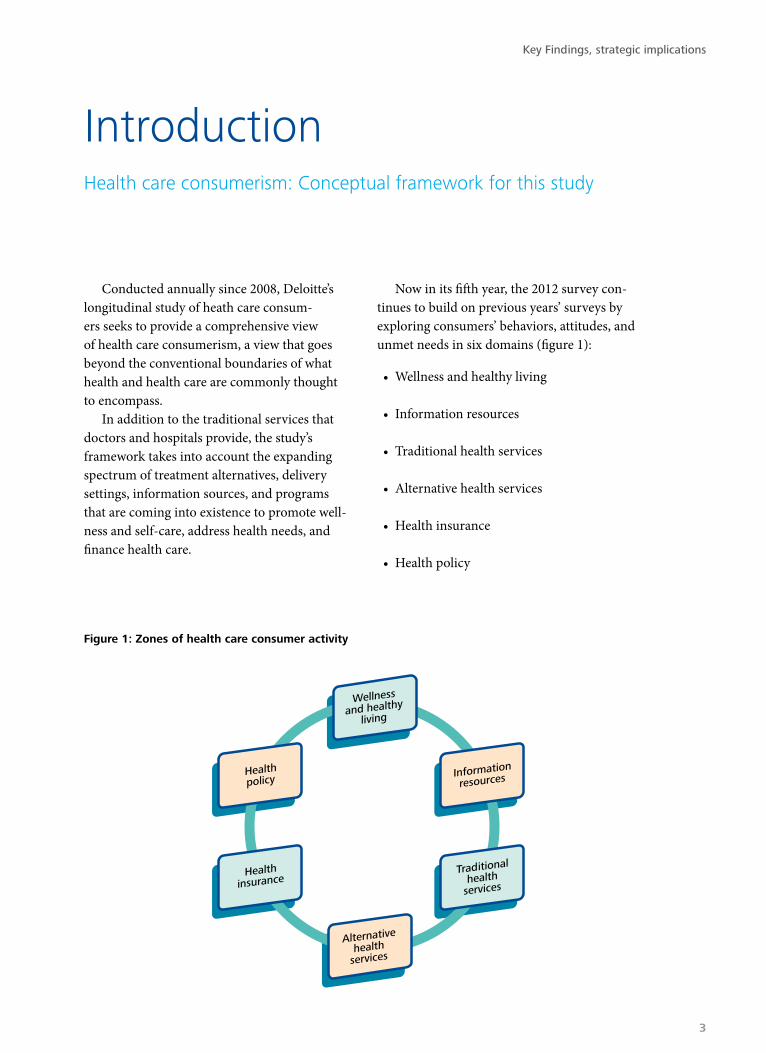
Now in its fifth year, the 2012 survey con-tinues to build on previous years’ surveys by exploring consumers’ behaviors, attitudes, and unmet needs in six domains (figure 1):
• Wellness and healthy living
• Information resources
• Traditional health services
• Alternative health services
• Health insurance
• Health policy
IntroductionHealth care consumerism: Conceptual framework for this study
Wellnessand healthy
living
Alternativehealth
services
Informationresources
Traditionalhealth
services
Healthpolicy
Healthinsurance
Wellness
and healthyliving
Alternativehealth
services
Information
resources
Traditional
healthservices
Healthpolicy
Healthinsurance
Figure 1: Zones of health care consumer activity
Key Findings, strategic implications
3
Since 2008, the Deloitte Center for Health Solutions has annually polled a nationally rep-resentative sample of the U.S. adult population (up to 4,000 U.S. consumers) about their expe-riences and attitudes related to six domains. These online surveys have queried adults in varied health status, income, and insurance cohorts to gauge the degree to which individu-als are engaging with the health care system as “patients” or “consumers.”
In February 2012, a nationally represen-tative sample of 4,012 U.S. adults, aged 18 and older, was surveyed, using a web-based questionnaire. The sampling frame was based upon quotas reflective of the 2010 U.S.Census to ensure proportional representation of the nation’s adult population with respect to age, gender, race/ethnicity, income, geography, insurance status (insured or uninsured), and primary insurance source (employer, direct purchase, Medicare, Medicaid, and other).4
This marks a change from 2008–2011, when fewer quotas were used and supplemented by cell weighting to achieve a representative sample. In those earlier years, the survey results were weighted with respect to basic demographics (age, gender, race/ethnicity, and income), but not additional variables such as insurance status and source. To achieve even closer sample alignment with insurance status and source distributions in the U.S. popula-tion, a more extensive set of quotas was used in 2012 and additional weighting was not necessary to achieve a representative sample. Differences reported in insurance status and source between 2008–2011 and 2012 are due largely to this adjustment in sampling.
The margin of error is +/- 1.6 percent at the .95 confidence level. The online survey
consisted of 65 questions addressing specific behaviors and attitudes, with 39 potential follow-up questions and an additional 20 ques-tions asking about demographic and health-related characteristics. English and Spanish versions were available. Participants were asked about behaviors before attitudes within each topic area to reduce response bias.
2012 brings a five-year milestone in the consumer survey (figure 2) and, where pos-sible, comparisons are made to the surveys conducted in 2008, 2009, 2010, and 2011. Differences in question wording and response scales—used in an effort to improve the survey instrument—preclude direct comparison in some cases. Core questions from the previ-ous years are repeated periodically to assess how health care consumerism is evolving in the United States. Data presented in this report will note if a question was not asked in a specific year and all data refers to the 2012 consumer survey unless specifically stated otherwise.
Perspective: The u.S. health care systemIn 2010, health care consumed 17.9
percent of the U.S. GDP, or $2.6 trillion in health care expenditures.5 As widely noted, the United States consistently spends more on health care per capita than do all other developed countries.6 Health care costs hover around $8,500 per capita7 and are expected to increase at an average annual growth rate of 5.8 percent for the next decade.8 This annual growth is anticipated to exceed that of the economy by 1.1 percentage points; by 2020, national health spending is expected to reach 19.8 percent of GDP, at $4.6 trillion in health care expenditures.9
Survey methodology
2012 Survey of U.S. Health Care Consumers: Five-Year Look Back
4
4. Quotas for insurance status and insurance source distributions were based on KCMU/Urban Institute analysis of the 2011 ASEC Supplement to the CPS, presented in slides published by the Kaiser Family Foundation http://slides.kff.org
5. Centers for Medicare & Medicaid Services, NHE Tables 2010. http://www.cms.gov/Research-Statistics-Data-and-Systems/ Statistics-Trends-and-Reports/NationalHealthExpendData/Downloads/tables.pdf. Accessed April, 2012.
6. Davis. K., C. Schoen, and K. Sremikis. Mirror, Mirror On the Wall: How the Performance of the U.S. Health Care System Compares Internationally: 2010 Update. Washington, DC: The Commonwealth Fund, 2010. Wyss. D., N.G. Swann and M. Mrsnik. Global Aging 2010: In the U.S., Going Gray will Cost a Lot More Green. Standard & Poor’s, October 25, 2010.
7. Centers for Medicare & Medicaid Services, NHE Tables 2010. http://www.cms.gov/Research-Statistics-Data-and-Systems/ Statistics-Trends-and-Reports/NationalHealthExpendData/Downloads/tables.pdf. Accessed April, 2012.
8. Centers for Medicare & Medicaid Services. National Health Expenditure Projections 2010-2020 https://www.cms.gov/ Research-Statistics-Data-and-Systems/Statistics-Trends-and-Reports/NationalHealthExpendData/downloads//proj2010.pdf. Accessed April, 2012.
9. Ibid.10. The Impact of Health Reform on Health Insurance Coverage: Projection Scenarios over 10 Years, Deloitte Center for
Health Solutions. September 2011. www.deloitte.com/us/coveragemodel.11. The Hidden Costs of U.S. Health Care, Deloitte Center for Health Solutions and Deloitte Center for Financial Solutions.
March 2011. Analysis based upon projected 2009 data.
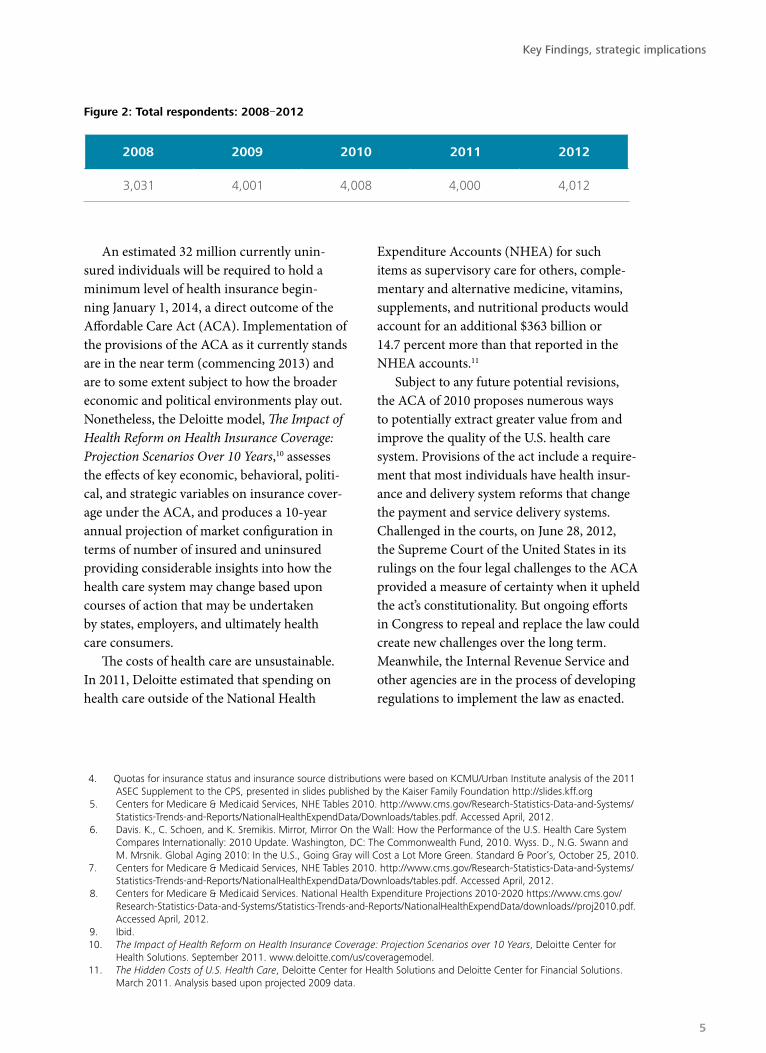
Figure 2: Total respondents: 2008–2012
2008 2009 2010 2011 2012
3,031 4,001 4,008 4,000 4,012
An estimated 32 million currently unin-sured individuals will be required to hold a minimum level of health insurance begin-ning January 1, 2014, a direct outcome of the Affordable Care Act (ACA). Implementation of the provisions of the ACA as it currently stands are in the near term (commencing 2013) and are to some extent subject to how the broader economic and political environments play out. Nonetheless, the Deloitte model, The Impact of Health Reform on Health Insurance Coverage: Projection Scenarios Over 10 Years,10 assesses the effects of key economic, behavioral, politi-cal, and strategic variables on insurance cover-age under the ACA, and produces a 10-year annual projection of market configuration in terms of number of insured and uninsured providing considerable insights into how the health care system may change based upon courses of action that may be undertaken by states, employers, and ultimately health care consumers.
The costs of health care are unsustainable. In 2011, Deloitte estimated that spending on health care outside of the National Health
Expenditure Accounts (NHEA) for such items as supervisory care for others, comple-mentary and alternative medicine, vitamins, supplements, and nutritional products would account for an additional $363 billion or 14.7 percent more than that reported in the NHEA accounts.11
Subject to any future potential revisions, the ACA of 2010 proposes numerous ways to potentially extract greater value from and improve the quality of the U.S. health care system. Provisions of the act include a require-ment that most individuals have health insur-ance and delivery system reforms that change the payment and service delivery systems. Challenged in the courts, on June 28, 2012, the Supreme Court of the United States in its rulings on the four legal challenges to the ACA provided a measure of certainty when it upheld the act’s constitutionality. But ongoing efforts in Congress to repeal and replace the law could create new challenges over the long term. Meanwhile, the Internal Revenue Service and other agencies are in the process of developing regulations to implement the law as enacted.
Key Findings, strategic implications
5
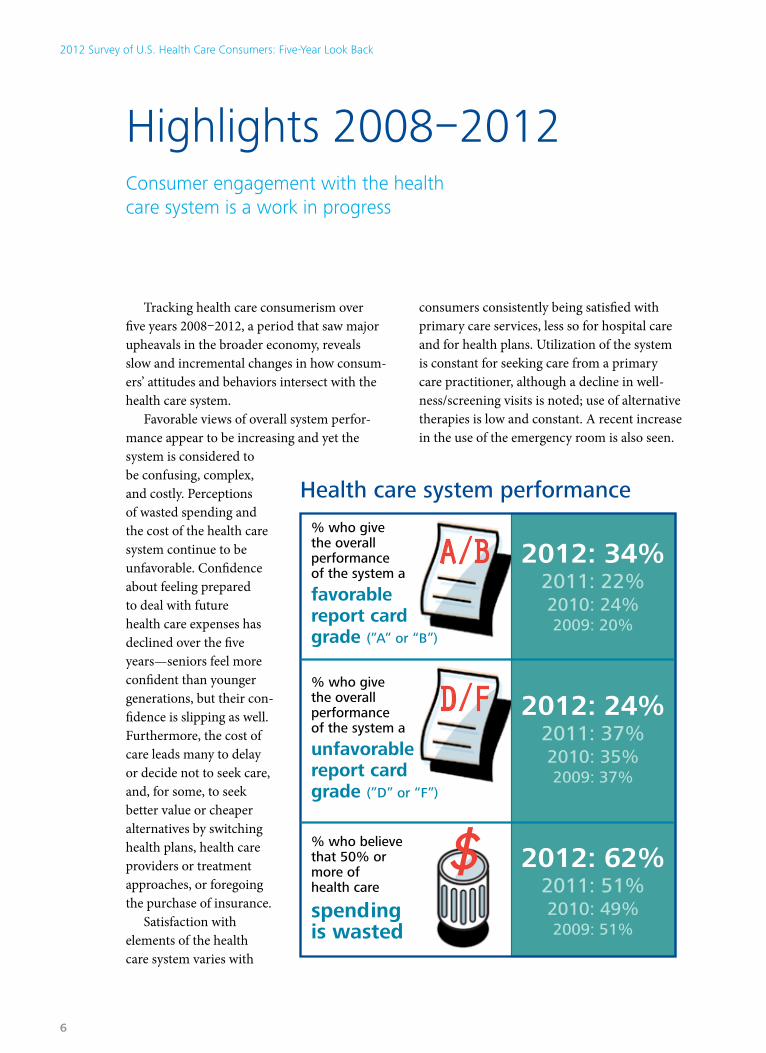
Tracking health care consumerism over five years 2008–2012, a period that saw major upheavals in the broader economy, reveals slow and incremental changes in how consum-ers’ attitudes and behaviors intersect with the health care system.
Favorable views of overall system perfor-mance appear to be increasing and yet the system is considered to be confusing, complex, and costly. Perceptions of wasted spending and the cost of the health care system continue to be unfavorable. Confidence about feeling prepared to deal with future health care expenses has declined over the five years—seniors feel more confident than younger generations, but their con-fidence is slipping as well. Furthermore, the cost of care leads many to delay or decide not to seek care, and, for some, to seek better value or cheaper alternatives by switching health plans, health care providers or treatment approaches, or foregoing the purchase of insurance.
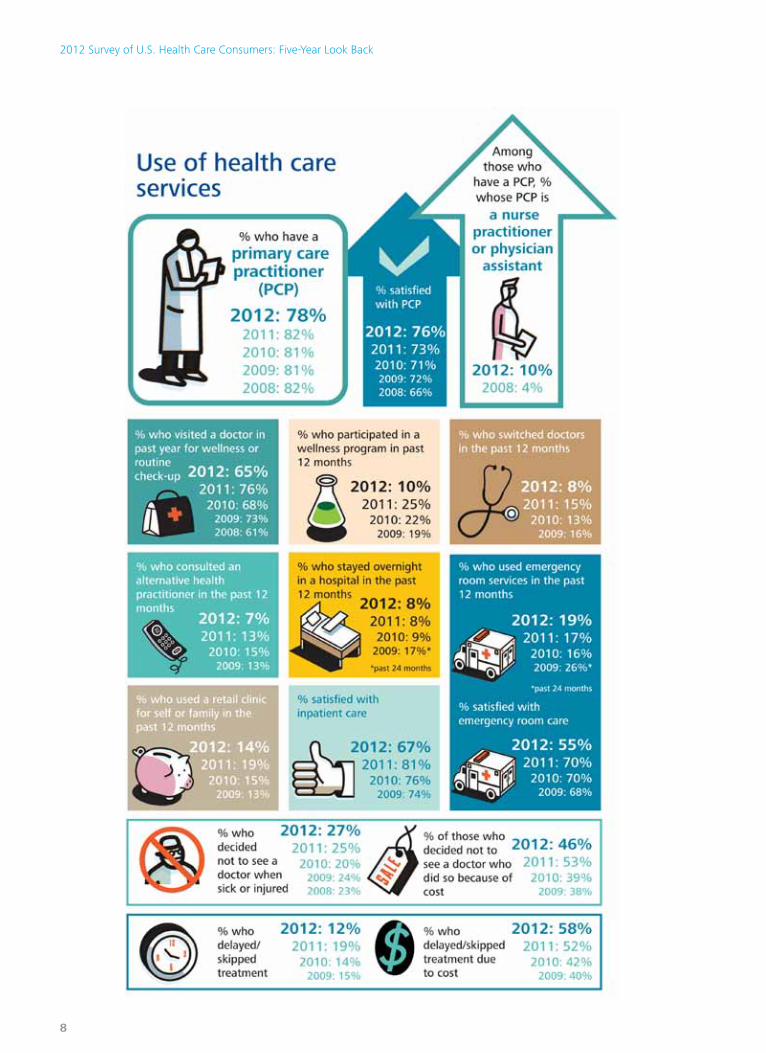
Satisfaction with elements of the health care system varies with
consumers consistently being satisfied with primary care services, less so for hospital care and for health plans. Utilization of the system is constant for seeking care from a primary care practitioner, although a decline in well-ness/screening visits is noted; use of alternative therapies is low and constant. A recent increase in the use of the emergency room is also seen.
Highlights 2008–2012Consumer engagement with the health care system is a work in progress
2012: 34%2011: 22%2010: 24%2009: 20%
% who givethe overallperformanceof the system a
favorablereport cardgrade (”A” or “B”)
% who givethe overallperformanceof the system a
unfavorablereport cardgrade (”D” or “F”)
% who believethat 50% ormore ofhealth care
spendingis wasted
2012: 24%2011: 37%2010: 35%2009: 37%
2012: 62%2011: 51%2010: 49%2009: 51%
Health care system performance
A/B
D/F
$
2012 Survey of U.S. Health Care Consumers: Five-Year Look Back
6
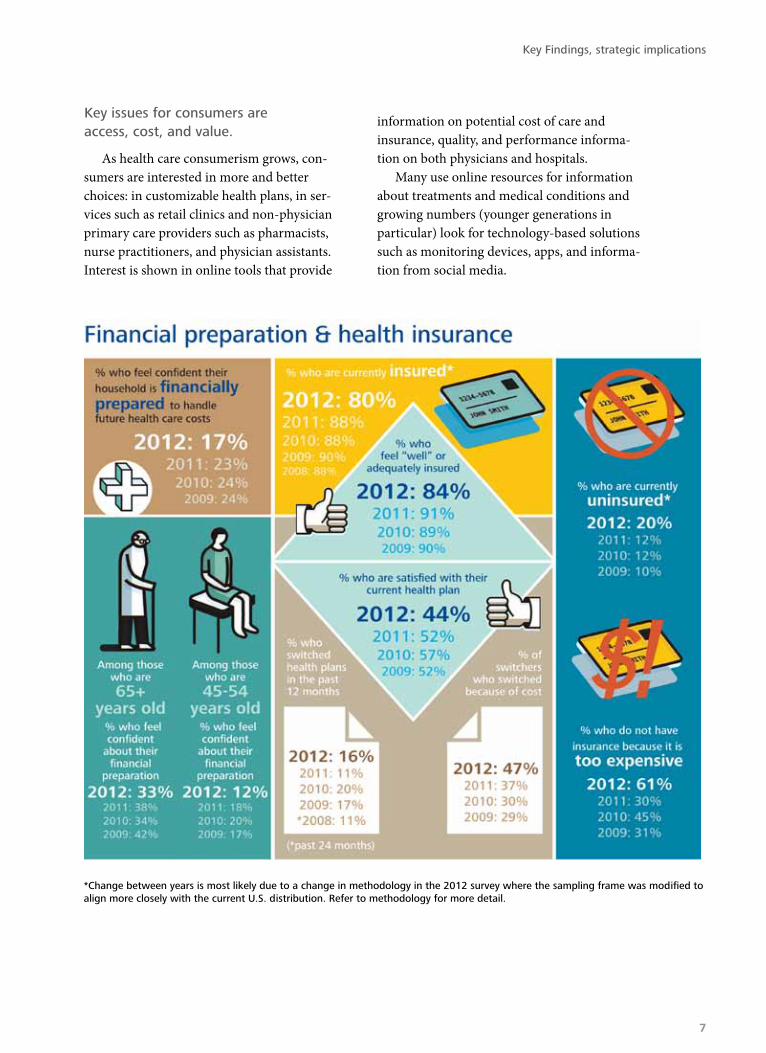
Key issues for consumers are access, cost, and value.
As health care consumerism grows, con-sumers are interested in more and better choices: in customizable health plans, in ser-vices such as retail clinics and non-physician primary care providers such as pharmacists, nurse practitioners, and physician assistants. Interest is shown in online tools that provide
information on potential cost of care and insurance, quality, and performance informa-tion on both physicians and hospitals.
Many use online resources for information about treatments and medical conditions and growing numbers (younger generations in particular) look for technology-based solutions such as monitoring devices, apps, and informa-tion from social media.
*Change between years is most likely due to a change in methodology in the 2012 survey where the sampling frame was modified to align more closely with the current u.S. distribution. refer to methodology for more detail.
Key Findings, strategic implications
7
2012 Survey of U.S. Health Care Consumers: Five-Year Look Back
8
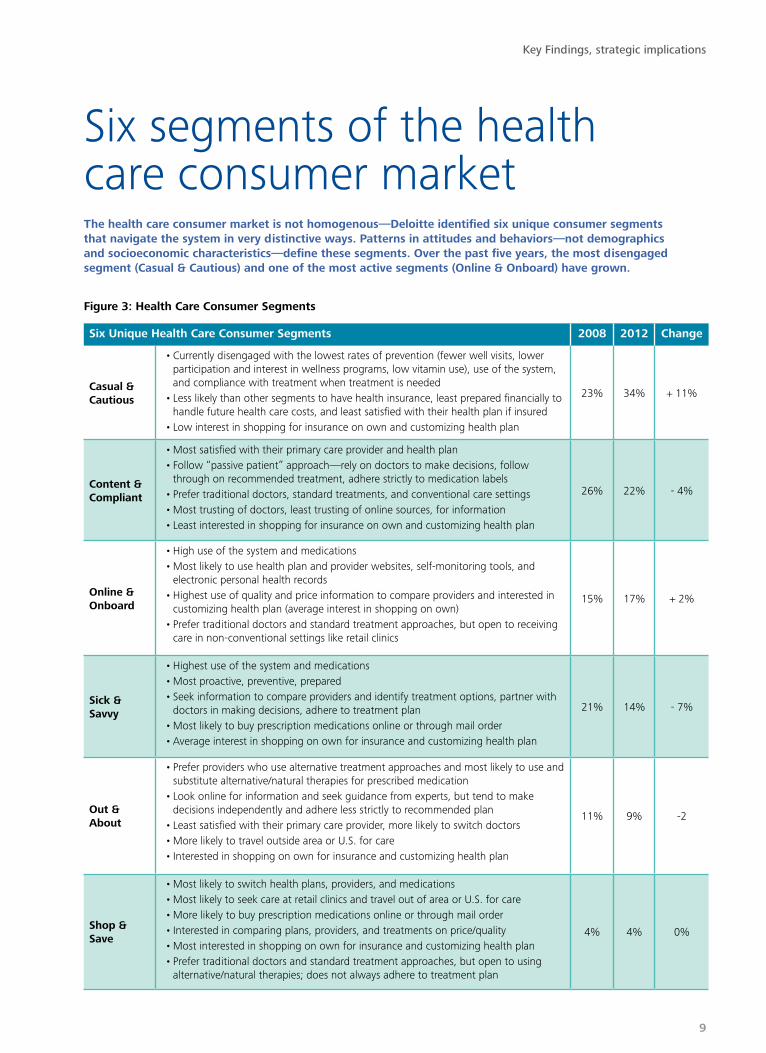
Six segments of the health care consumer marketThe health care consumer market is not homogenous —Deloitte identified six unique consumer segments that navigate the system in very distinctive ways. Patterns in attitudes and behaviors—not demographics and socioeconomic characteristics—define these segments. Over the past five years, the most disengaged segment (Casual & Cautious) and one of the most active segments (Online & Onboard) have grown.
Figure 3: Health Care Consumer Segments
Six Unique Health Care Consumer Segments 2008 2012 Change
Casual & Cautious
•Currently disengaged with the lowest rates of prevention (fewer well visits, lower participation and interest in wellness programs, low vitamin use), use of the system, and compliance with treatment when treatment is needed
•Less likely than other segments to have health insurance, least prepared financially to handle future health care costs, and least satisfied with their health plan if insured
•Low interest in shopping for insurance on own and customizing health plan
23% 34% + 11%
Content & Compliant
•Most satisfied with their primary care provider and health plan•Follow “passive patient” approach—rely on doctors to make decisions, follow
through on recommended treatment, adhere strictly to medication labels •Prefer traditional doctors, standard treatments, and conventional care settings•Most trusting of doctors, least trusting of online sources, for information•Least interested in shopping for insurance on own and customizing health plan
26% 22% - 4%
Online & Onboard
•High use of the system and medications•Most likely to use health plan and provider websites, self-monitoring tools, and
electronic personal health records •Highest use of quality and price information to compare providers and interested in
customizing health plan (average interest in shopping on own)•Prefer traditional doctors and standard treatment approaches, but open to receiving
care in non-conventional settings like retail clinics
15% 17% + 2%
Sick & Savvy
•Highest use of the system and medications•Most proactive, preventive, prepared•Seek information to compare providers and identify treatment options, partner with
doctors in making decisions, adhere to treatment plan•Most likely to buy prescription medications online or through mail order•Average interest in shopping on own for insurance and customizing health plan
21% 14% - 7%
Out & About
•Prefer providers who use alternative treatment approaches and most likely to use and substitute alternative/natural therapies for prescribed medication
•Look online for information and seek guidance from experts, but tend to make decisions independently and adhere less strictly to recommended plan
•Least satisfied with their primary care provider, more likely to switch doctors•More likely to travel outside area or U.S. for care•Interested in shopping on own for insurance and customizing health plan
11% 9% -2
Shop & Save
•Most likely to switch health plans, providers, and medications•Most likely to seek care at retail clinics and travel out of area or U.S. for care•More likely to buy prescription medications online or through mail order•Interested in comparing plans, providers, and treatments on price/quality•Most interested in shopping on own for insurance and customizing health plan•Prefer traditional doctors and standard treatment approaches, but open to using
alternative/natural therapies; does not always adhere to treatment plan
4% 4% 0%
Key Findings, strategic implications
9
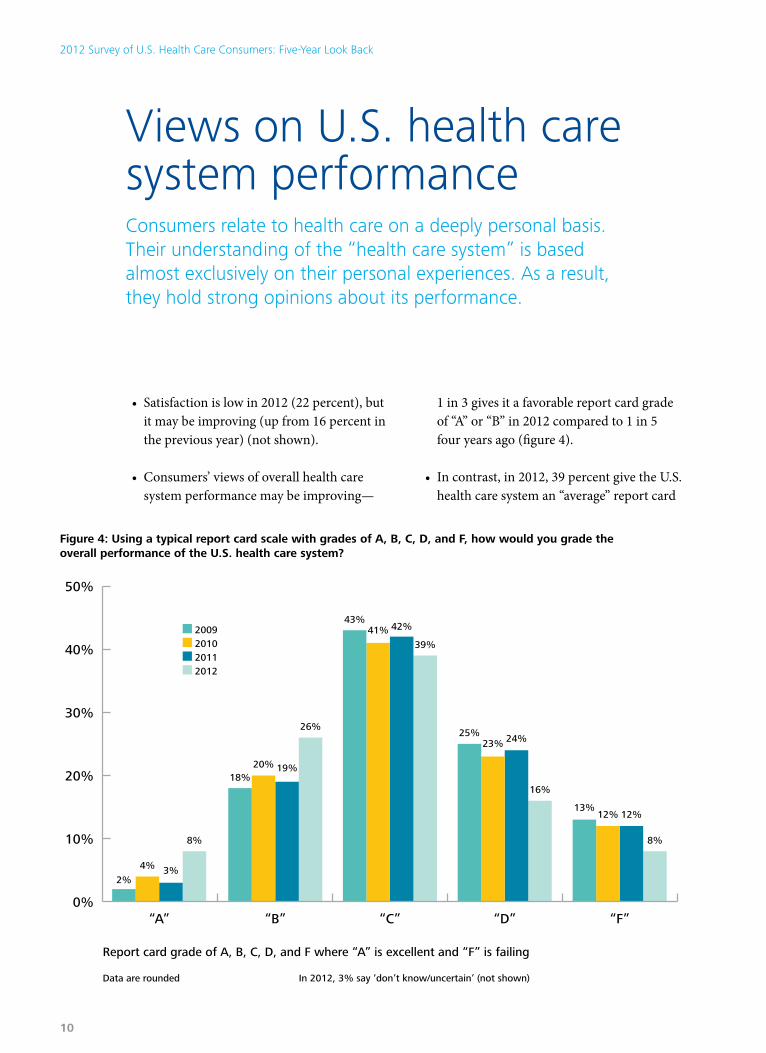
• Satisfaction is low in 2012 (22 percent), but it may be improving (up from 16 percent in the previous year) (not shown).
• Consumers’ views of overall health care system performance may be improving—
1 in 3 gives it a favorable report card grade of “A” or “B” in 2012 compared to 1 in 5 four years ago (figure 4).
• In contrast, in 2012, 39 percent give the U.S. health care system an “average” report card
Views on U.S. health care system performanceConsumers relate to health care on a deeply personal basis. Their understanding of the “health care system” is based almost exclusively on their personal experiences. As a result, they hold strong opinions about its performance.
0%
10%
20%
30%
40%
50%
“A”
2%
Data are rounded
2009201020112012
In 2012, 3% say ‘don’t know/uncertain’ (not shown)
4% 3%
8%
18%
Report card grade of A, B, C, D, and F where “A” is excellent and “F” is failing
20% 19%
26%
43%41% 42%
39%
25%23% 24%
16%
13%12% 12%
8%
“B” “C” “D” “F”
Figure 4: Using a typical report card scale with grades of A, B, C, D, and F, how would you grade the overall performance of the U.S. health care system?
2012 Survey of U.S. Health Care Consumers: Five-Year Look Back
10

61%: Having the newest innovations in treatments, services, andmedical technologies
56%: Up-to-date information technology
52%: Meeting the healthcare needs of me and my family
19%:Meeting the healthcare needs of the uninsured
54%: Meeting thehealth care needs
of the insured
25%: Getting the bestvalue for money spent
Figure 5: Using a typical report card scale with grades of A, B, C, D, and F, how would you grade the U.S. health care system on the following dimensions?
Grading system elements favorable (“A” or “B”) using a typical report card scale with grades of A, B, C, D, and F
grade of “C”, or a “failing” grade of “D” (16 percent) or “F” (8 percent). This finding is somewhat lower than in previous years, with 36 percent grading the system unfa-vorably in 2011, 35 percent in 2010, and 37 percent in 2009 (figure 4).
• The system gets high marks for clinical innovation (61 percent give it an “A” or a “B”) and use of technology (56 percent give it an “A” or a “B”) (figure 5).
• Fewer consumers give the system high marks for value and responding to the needs of the uninsured (figure 5).
• The system is considered to fail (rating performance as a “D” or “F”) those without insurance (53 percent) and to offer poor value for money spent on health care (44 percent) (not shown).
• In 2012, only 25 percent feel that the best value is obtained for the money spent (figure 5).
• Increasing perceptions of waste and lack of value may be contributing to dissatisfaction with the system; in 2012, 62 percent believe that 50 percent or more of the dollars spent on health care are wasted—up from 51 percent in 2009, 49 percent in 2010, and 51 percent in 2011 (not shown).
Key Findings, strategic implications
11
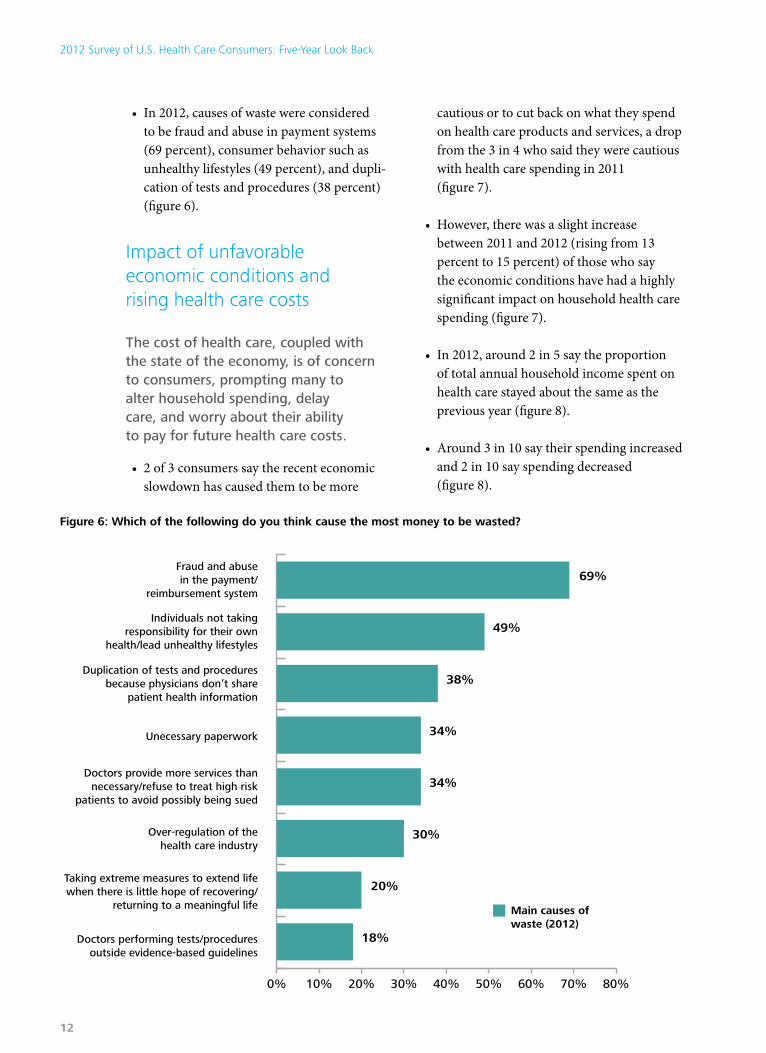
• In 2012, causes of waste were considered to be fraud and abuse in payment systems (69 percent), consumer behavior such as unhealthy lifestyles (49 percent), and dupli-cation of tests and procedures (38 percent) (figure 6).
Impact of unfavorable economic conditions and rising health care costs
The cost of health care, coupled with the state of the economy, is of concern to consumers, prompting many to alter household spending, delay care, and worry about their ability to pay for future health care costs.
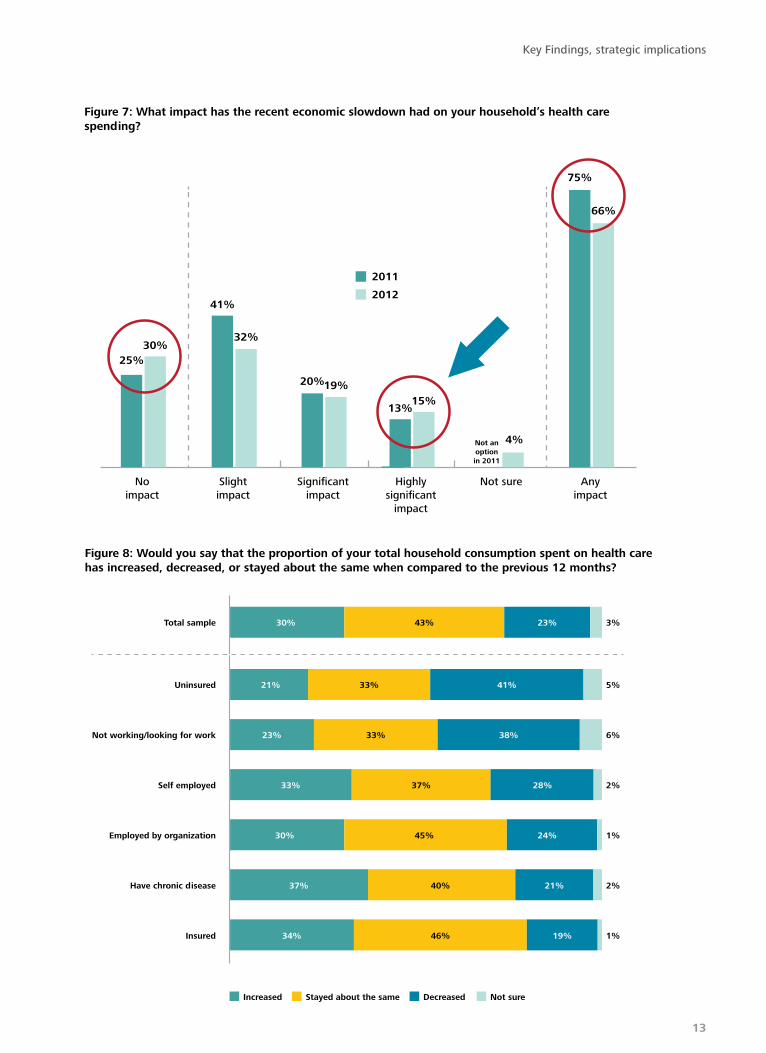
• 2 of 3 consumers say the recent economic slowdown has caused them to be more
cautious or to cut back on what they spend on health care products and services, a drop from the 3 in 4 who said they were cautious with health care spending in 2011 (figure 7).
• However, there was a slight increase between 2011 and 2012 (rising from 13 percent to 15 percent) of those who say the economic conditions have had a highly significant impact on household health care spending (figure 7).
• In 2012, around 2 in 5 say the proportion of total annual household income spent on health care stayed about the same as the previous year (figure 8).
• Around 3 in 10 say their spending increased and 2 in 10 say spending decreased (figure 8).
0% 10% 20% 30% 40% 50% 60% 70% 80%
69%Fraud and abusein the payment/
reimbursement system
Main causes ofwaste (2012)
Individuals not takingresponsibility for their own
health/lead unhealthy lifestyles
Duplication of tests and proceduresbecause physicians don’t share
patient health information
Unecessary paperwork
Doctors provide more services thannecessary/refuse to treat high risk
patients to avoid possibly being sued
Over-regulation of thehealth care industry
Taking extreme measures to extend lifewhen there is little hope of recovering/
returning to a meaningful life
Doctors performing tests/proceduresoutside evidence-based guidelines
49%
38%
34%
34%
30%
20%
18%
Figure 6: Which of the following do you think cause the most money to be wasted?
2012 Survey of U.S. Health Care Consumers: Five-Year Look Back
12
Noimpact
Slightimpact
Significantimpact
Highlysignificant
impact
Not sure Anyimpact
30%25%
32%
41%
19%20%
15%13%
4%
2011
2012
Not anoptionin 2011
66%
75%
Figure 7: What impact has the recent economic slowdown had on your household’s health care spending?
30% 43% 23% 3%
Increased
21% 33% 41% 5%
23% 33% 38% 6%
33% 37% 28% 2%
30% 45% 24% 1%
37% 40% 21% 2%
34% 46% 19% 1%
Total sample
Uninsured
Not working/looking for work
Self employed
Employed by organization
Have chronic disease
Insured
Stayed about the same Decreased Not sure
Figure 8: Would you say that the proportion of your total household consumption spent on health care has increased, decreased, or stayed about the same when compared to the previous 12 months?
Key Findings, strategic implications
13

• The proportion of household expenditures directed toward health care in the past year decreased among considerably more of the uninsured and unemployed than among other consumers (figure 8).
• There is a decline across all generations between 2011 and 2012 in consumer con-fidence about feeling prepared to handle future health care costs (figure 9).
• Of all the generations, Seniors feel the most secure financially; however, only 1 in 3 Seniors are confident about dealing with future health care costs (figure 9).
• Over the years, very few of those without insurance say they feel prepared to meet future health care costs.
• Between 2011 and 2012, the insured report a decreasing sense of confidence in meeting
future health care costs (26 percent in 2011 and 20 percent in 2012) (figure 9).
• In 2012, 1 in 4 consumers (27 percent) (1 in 3 (34 percent) among the uninsured) say they decided not to see a doctor when sick or injured in the last 12 months. 1 in 9 (12 percent) decided to delay or skip treatment recommended by a doctor.
• Among those who didn’t seek medical attention, the percentage citing cost as the reason decreased between 2011 and 2012 (from 53 percent to 46 percent) but remained higher than in 2010 (39 percent) and 2009 (38 percent). Those who say they delayed or skipped treatment for cost reasons rose from 52 percent in 2011 to 58 percent in 2012 (not shown), continuing an upward trend from previous years (40 percent in 2009, 42 percent in 2010).
60%
2009 2010 2011 2012
40%
20%
0%
42%
33%
20%
16%15%14%12%
5%
29%26%
18%17%
6%Uninsured
Insured
65+ years
Rating of 8, 9, or 10 on a 10-point scale where 10 is “completely prepared”Data are rounded
55–64 years
25–44 years
45–54 years
18–24 years
Figure 9: To what extent do you feel your household is financially prepared to handle future health care costs?
2012 Survey of U.S. Health Care Consumers: Five-Year Look Back
14
Zone one: Wellness and healthy livingConsumers augment health care with wellness checks, use of vitamins and healthier food choices, and some self-care programs—but overall engagement in wellness and preventive actions is low.
Key Findings, strategic implications
15
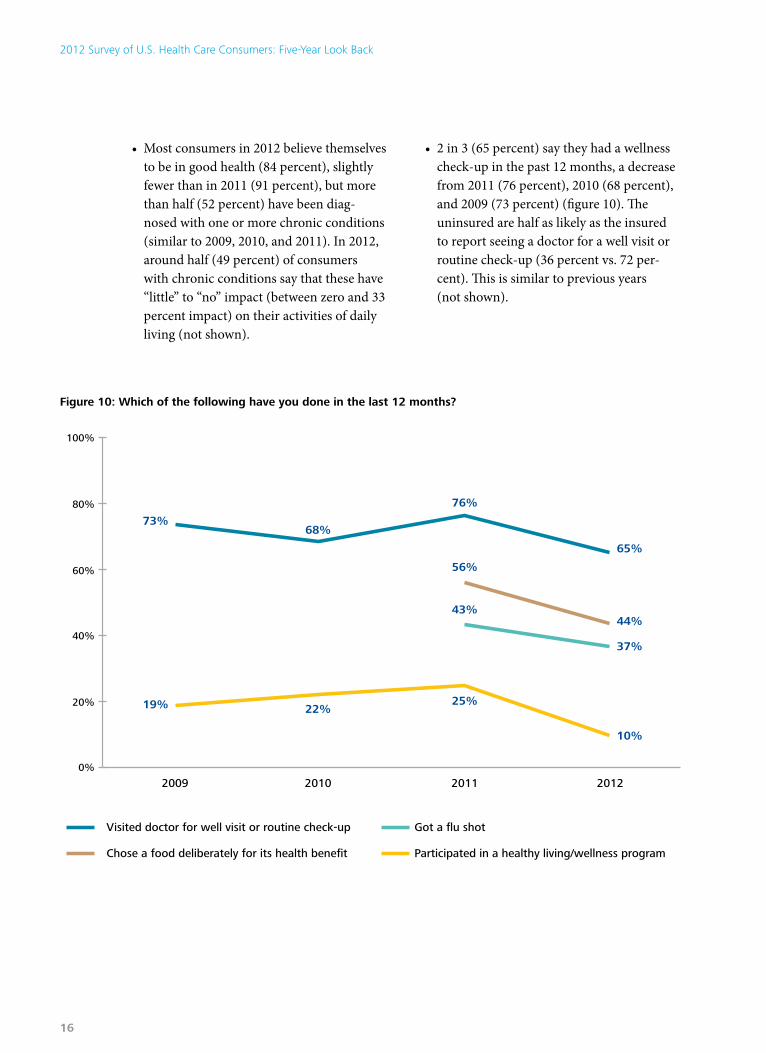
• Most consumers in 2012 believe themselves to be in good health (84 percent), slightly fewer than in 2011 (91 percent), but more than half (52 percent) have been diag-nosed with one or more chronic conditions (similar to 2009, 2010, and 2011). In 2012, around half (49 percent) of consumers with chronic conditions say that these have “little” to “no” impact (between zero and 33 percent impact) on their activities of daily living (not shown).
• 2 in 3 (65 percent) say they had a wellness check-up in the past 12 months, a decrease from 2011 (76 percent), 2010 (68 percent), and 2009 (73 percent) (figure 10). The uninsured are half as likely as the insured to report seeing a doctor for a well visit or routine check-up (36 percent vs. 72 per-cent). This is similar to previous years (not shown).
2009 2010 2011 2012
56%
65%
68%
22%19%
73%
100%
80%
60%
40%
20%
0%
44%
37%
10%
43%
25%
76%
Visited doctor for well visit or routine check-up Got a flu shot
Chose a food deliberately for its health benefit Participated in a healthy living/wellness program
Figure 10: Which of the following have you done in the last 12 months?
2012 Survey of U.S. Health Care Consumers: Five-Year Look Back
16
• Participation in healthy living/wellness pro-grams offered by employers, health plans, and other organizations declined between 2011 (25 percent) and 2012 (10 percent) (figure 10). Both insured and uninsured consumers reported lower rates of partici-pation in 2012 compared to previous years (not shown).
• Use of vitamins, minerals, and herbal supplements is relatively high. 60 percent report taking vitamins/minerals (68 percent in 2011) on a regular basis for health pur-poses; 18 percent take herbal supplements (not shown).
• 44 percent say they deliberately purchased food such as probiotic yogurts or choles-terol-reducing spreads for its perceived health benefits (figure 10).
• 37 percent of consumers say they received an influenza shot during the past year, com-pared with 43 percent in 2011 (figure 10).
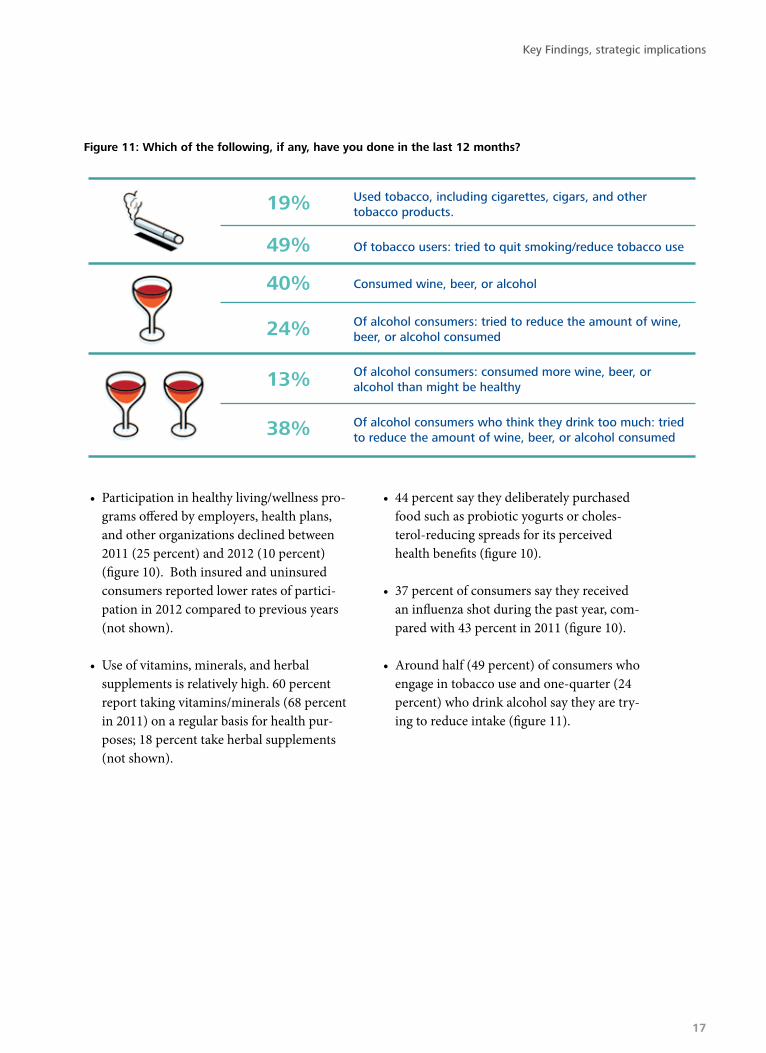
• Around half (49 percent) of consumers who engage in tobacco use and one-quarter (24 percent) who drink alcohol say they are try-ing to reduce intake (figure 11).
Used tobacco, including cigarettes, cigars, and othertobacco products.19%
49%
40%
24%
13%
38%
Of tobacco users: tried to quit smoking/reduce tobacco use
Consumed wine, beer, or alcohol
Of alcohol consumers: tried to reduce the amount of wine,beer, or alcohol consumed
Of alcohol consumers: consumed more wine, beer, oralcohol than might be healthy
Of alcohol consumers who think they drink too much: triedto reduce the amount of wine, beer, or alcohol consumed
Figure 11: Which of the following, if any, have you done in the last 12 months?
Key Findings, strategic implications
17
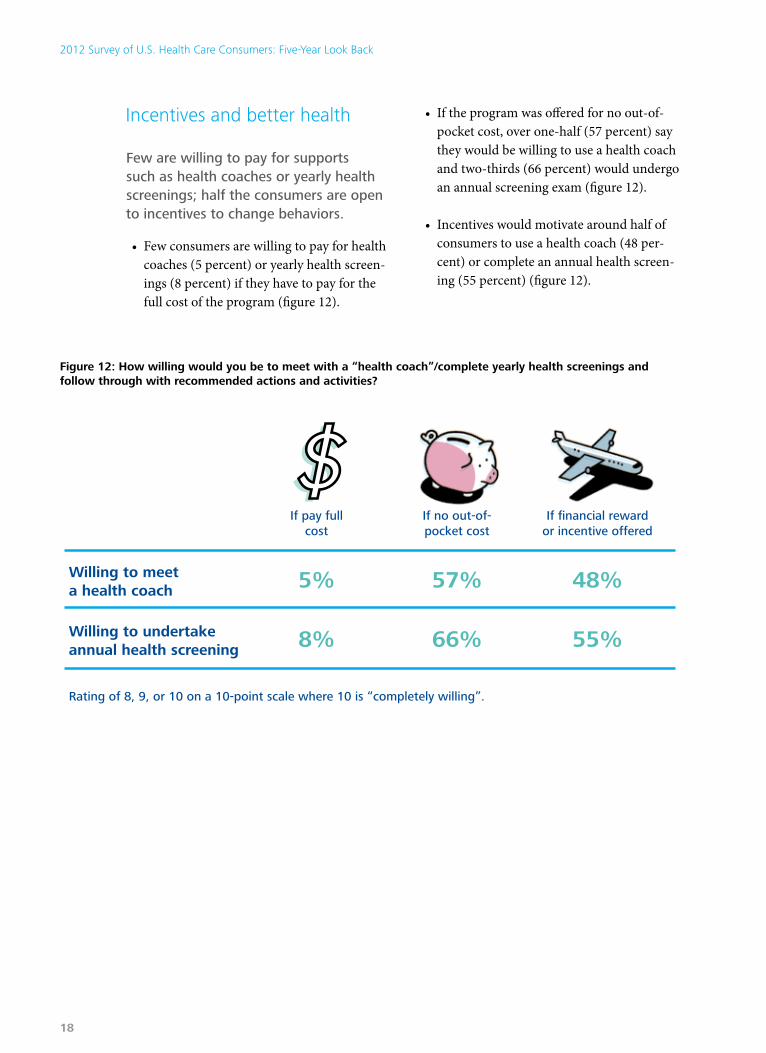
Incentives and better health
Few are willing to pay for supports such as health coaches or yearly health screenings; half the consumers are open to incentives to change behaviors.
• Few consumers are willing to pay for health coaches (5 percent) or yearly health screen-ings (8 percent) if they have to pay for the full cost of the program (figure 12).
• If the program was offered for no out-of-pocket cost, over one-half (57 percent) say they would be willing to use a health coach and two-thirds (66 percent) would undergo an annual screening exam (figure 12).
• Incentives would motivate around half of consumers to use a health coach (48 per-cent) or complete an annual health screen-ing (55 percent) (figure 12).
If pay fullcost
Willing to meeta health coach
Rating of 8, 9, or 10 on a 10-point scale where 10 is “completely willing”.
5%
If no out-of-pocket cost
57%
If financial rewardor incentive offered
48%
Willing to undertakeannual health screening 8% 66% 55%
Figure 12: How willing would you be to meet with a “health coach”/complete yearly health screenings and follow through with recommended actions and activities?
2012 Survey of U.S. Health Care Consumers: Five-Year Look Back
18
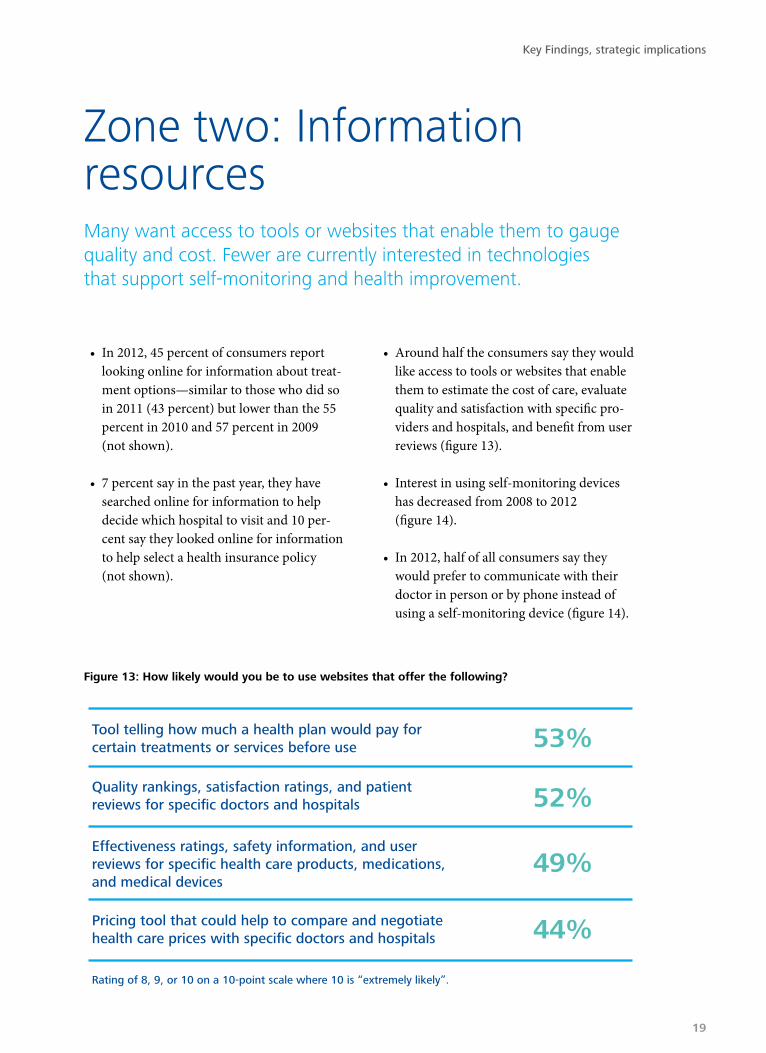
Zone two: Information resourcesMany want access to tools or websites that enable them to gauge quality and cost. Fewer are currently interested in technologies that support self-monitoring and health improvement.
• In 2012, 45 percent of consumers report looking online for information about treat-ment options—similar to those who did so in 2011 (43 percent) but lower than the 55 percent in 2010 and 57 percent in 2009 (not shown).
• 7 percent say in the past year, they have searched online for information to help decide which hospital to visit and 10 per-cent say they looked online for information to help select a health insurance policy (not shown).
• Around half the consumers say they would like access to tools or websites that enable them to estimate the cost of care, evaluate quality and satisfaction with specific pro-viders and hospitals, and benefit from user reviews (figure 13).
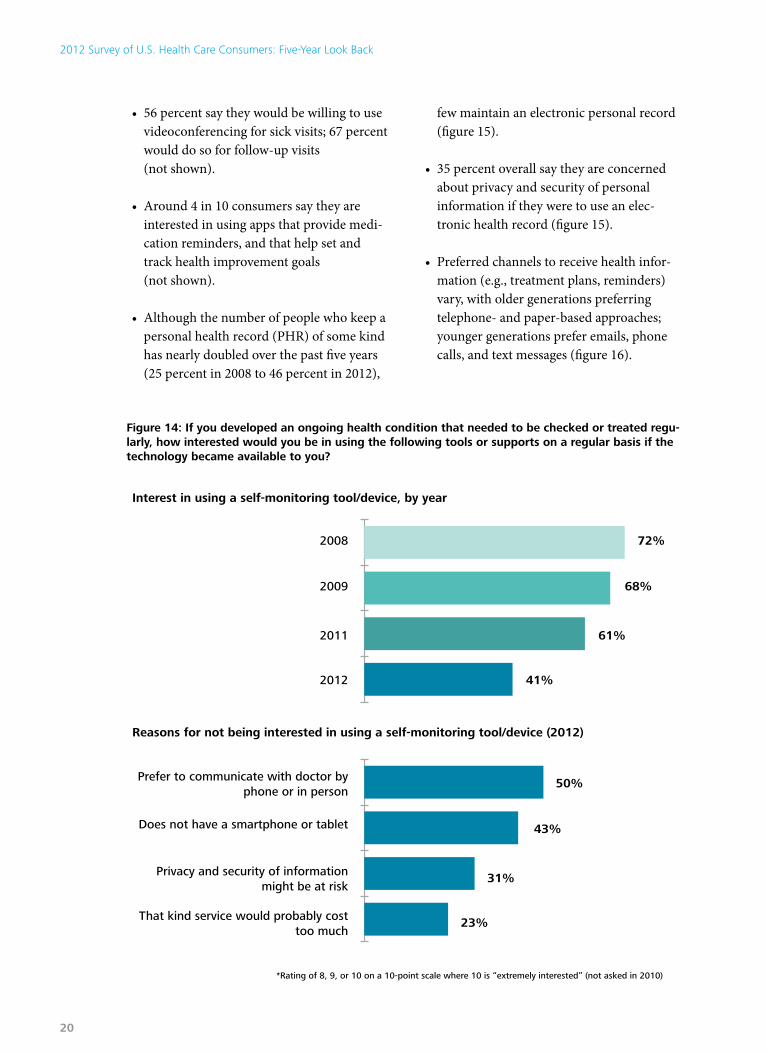
• Interest in using self-monitoring devices has decreased from 2008 to 2012 (figure 14).
• In 2012, half of all consumers say they would prefer to communicate with their doctor in person or by phone instead of using a self-monitoring device (figure 14).
Tool telling how much a health plan would pay forcertain treatments or services before use
Rating of 8, 9, or 10 on a 10-point scale where 10 is “extremely likely”.
53%
Quality rankings, satisfaction ratings, and patientreviews for specific doctors and hospitals 52%
Effectiveness ratings, safety information, and userreviews for specific health care products, medications,and medical devices
49%
Pricing tool that could help to compare and negotiatehealth care prices with specific doctors and hospitals 44%
Figure 13: How likely would you be to use websites that offer the following?
Key Findings, strategic implications
19
• 56 percent say they would be willing to use videoconferencing for sick visits; 67 percent would do so for follow-up visits (not shown).
• Around 4 in 10 consumers say they are interested in using apps that provide medi-cation reminders, and that help set and track health improvement goals (not shown).
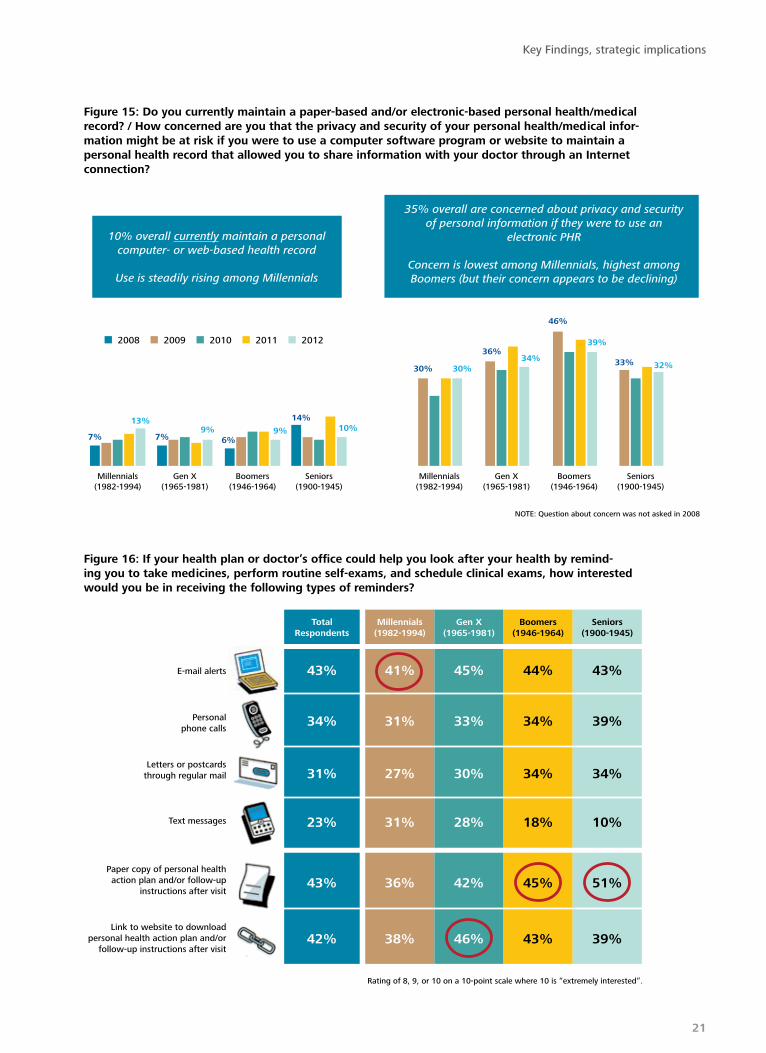
• Although the number of people who keep a personal health record (PHR) of some kind has nearly doubled over the past five years (25 percent in 2008 to 46 percent in 2012),
few maintain an electronic personal record (figure 15).
• 35 percent overall say they are concerned about privacy and security of personal information if they were to use an elec-tronic health record (figure 15).
• Preferred channels to receive health infor-mation (e.g., treatment plans, reminders) vary, with older generations preferring telephone- and paper-based approaches; younger generations prefer emails, phone calls, and text messages (figure 16).
*Rating of 8, 9, or 10 on a 10-point scale where 10 is “extremely interested” (not asked in 2010)
2008
2009
2011
2012
Prefer to communicate with doctor byphone or in person
Reasons for not being interested in using a self-monitoring tool/device (2012)
Interest in using a self-monitoring tool/device, by year
Does not have a smartphone or tablet
Privacy and security of informationmight be at risk
That kind service would probably costtoo much
72%
68%
61%
41%
50%
43%
31%
23%
Figure 14: If you developed an ongoing health condition that needed to be checked or treated regu-larly, how interested would you be in using the following tools or supports on a regular basis if the technology became available to you?
2012 Survey of U.S. Health Care Consumers: Five-Year Look Back
20
Seniors(1900-1945)
32%33%
39%
46%
34%36%
30%30%
2008
10%14%
9%6%
9%7%
13%
7%
Boomers(1946-1964)
Gen X(1965-1981)
Millennials(1982-1994)
Seniors(1900-1945)
Boomers(1946-1964)
Gen X(1965-1981)
Millennials(1982-1994)
NOTE: Question about concern was not asked in 2008
2009 2010 2011 2012
10% overall currently maintain a personalcomputer- or web-based health record
Use is steadily rising among Millennials
35% overall are concerned about privacy and securityof personal information if they were to use an
electronic PHR
Concern is lowest among Millennials, highest amongBoomers (but their concern appears to be declining)
Figure 15: Do you currently maintain a paper-based and/or electronic-based personal health/medical record? / How concerned are you that the privacy and security of your personal health/medical infor-mation might be at risk if you were to use a computer software program or website to maintain a personal health record that allowed you to share information with your doctor through an Internet connection?
E-mail alerts
Personalphone calls
Letters or postcardsthrough regular mail
Text messages
Paper copy of personal healthaction plan and/or follow-up
instructions after visit
Link to website to downloadpersonal health action plan and/or
follow-up instructions after visit
Rating of 8, 9, or 10 on a 10-point scale where 10 is “extremely interested”.
43% 41% 45% 44% 43%
34% 31% 33% 34% 39%
31% 27% 30% 34% 34%
23% 31% 28% 18% 10%
43% 36% 42% 45% 51%
42% 38% 46% 43% 39%
TotalRespondents
Millennials(1982-1994)
Gen X(1965-1981)
Boomers(1946-1964)
Seniors(1900-1945)
Figure 16: If your health plan or doctor’s office could help you look after your health by remind-ing you to take medicines, perform routine self-exams, and schedule clinical exams, how interested would you be in receiving the following types of reminders?
Key Findings, strategic implications
21

Social media
using social media for health care appeals to younger generations; older generations use it sparingly; all find that user-generated health information via social media needs additional verification.
• 26 percent of total respondents say they used social media for health-related purposes in the past year—use is highest among Millennials (40 percent) and Gen X (29 percent) (figure 17).
• Consumers primarily use social media for learning more about a specific illness/health problem/injury (figure 17).
• As trusted sources of information about the effectiveness and safety of specific treat-ments, consumers—especially Seniors (not shown)—prefer to rely on the medical com-munity more than other sources (figure 18).
• Independent health-related websites (24 percent) garner nearly as much trust as pharmacies (27 percent) and slightly more trust than the U.S. Food and Drug Administration (22 percent) (figure 18).
• Health plans, general Internet search engines, bio-pharma/medical device com-panies, employers, and social media are least preferred as trusted sources of infor-mation (figure 18).
• Reasons for lower levels of trust in manu-facturers include concern about full disclosure about products (60 percent), a preference to receive this type of infor-mation from a medical professional (54 percent), and a belief that more objective sources may be available (43 percent) (all not shown).
For any health-related purposes
Generational differencesin their use of social media forhealth care purposes
To learn more about specific illness/health problem/injury
To offer motivation or support to others battling an illness/injury/health problems
To learn more about prescription drugs
To comment about your own experiences using the healthcare system
Millennials(1982–1994)
Gen X(1965–1981)
Boomers(1946–1964)
Seniors(1900–1945)
17%29%40% 17%
8%12%16% 11%
6%12%14% 5%
7%8%10% 10%
3%4%8% 3%
Figure 17: In the last 12 months, have you used social me-dia (e.g., an online community support site, chat room, or social networking site) to do any of the following?
2012 Survey of U.S. Health Care Consumers: Five-Year Look Back
22
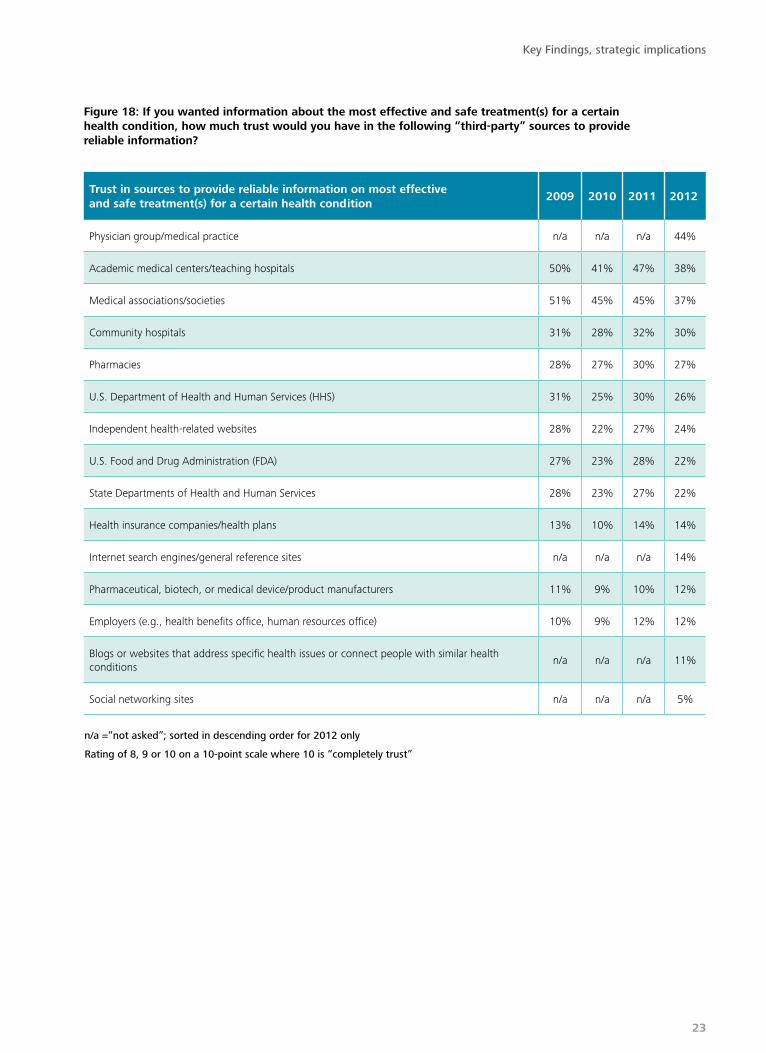
Figure 18: If you wanted information about the most effective and safe treatment(s) for a certain health condition, how much trust would you have in the following “third-party” sources to provide reliable information?
Trust in sources to provide reliable information on most effective and safe treatment(s) for a certain health condition
2009 2010 2011 2012
Physician group/medical practice n/a n/a n/a 44%
Academic medical centers/teaching hospitals 50% 41% 47% 38%
Medical associations/societies 51% 45% 45% 37%
Community hospitals 31% 28% 32% 30%
Pharmacies 28% 27% 30% 27%
U.S. Department of Health and Human Services (HHS) 31% 25% 30% 26%
Independent health-related websites 28% 22% 27% 24%
U.S. Food and Drug Administration (FDA) 27% 23% 28% 22%
State Departments of Health and Human Services 28% 23% 27% 22%
Health insurance companies/health plans 13% 10% 14% 14%
Internet search engines/general reference sites n/a n/a n/a 14%
Pharmaceutical, biotech, or medical device/product manufacturers 11% 9% 10% 12%
Employers (e.g., health benefits office, human resources office) 10% 9% 12% 12%
Blogs or websites that address specific health issues or connect people with similar health conditions
n/a n/a n/a 11%
Social networking sites n/a n/a n/a 5%
n/a =”not asked”; sorted in descending order for 2012 only
rating of 8, 9 or 10 on a 10-point scale where 10 is “completely trust”
Key Findings, strategic implications
23

Zone three: Traditional health services utilizationThe majority of consumers report accessing primary care—either for routine check-ups or injury/illness. Use of the emergency room is rising but satisfaction with this service is dropping.
• 76 percent of consumers (85 percent in 2011) say they visited a physician or other health care professional in the past year for some purpose (figure 19).
• 65 percent visited for a routine check-up (76 percent in 2011) and 39 percent for an injury or illness (54 percent in 2011) (figure 19).
• Around 2 in 5 consumers say they received care in a hospital in the last year, either as an outpatient (23 percent), emergency patient (19 percent), or inpatient (8 per-cent); use of emergency care is rising (from 13 percent in 2009 to 19 percent in 2012) (figure 19).
*Hospital service figures for 2008 and 2009 are 1 year estimates calculated ashalf the reported 24-month rates
Percentage reporting “Yes”
100%
2008 2009 2010 2011 2012
40%
60%
80%
20%
0%
Doctor visit (any purpose)
Have primary care provider
Doctor visit for well/check up
Prescription medications
Doctor visit for illness/injury
Over-the-counter medications
Hospital care (all types)*
Outpatient care*
Emergency care*
Inpatient care*8%8%
13%16%
26%
38%
53%
83%
60%
61%
82%
19%23%
31%
39%41%
51%
65%
76%78%
Figure 19: Which of the following have you done in the past 12 months?
2012 Survey of U.S. Health Care Consumers: Five-Year Look Back
24
• Half of all consumers (51 percent) in 2012 say they currently take prescription medica-tions: of those taking medication, 23 per-cent take one medication, 38 percent take two or three, and 35 percent take over four prescription medications (not shown).
Primary care
more consumers are using nurse practitioners (nP) or physician assistants (PA) for primary care.
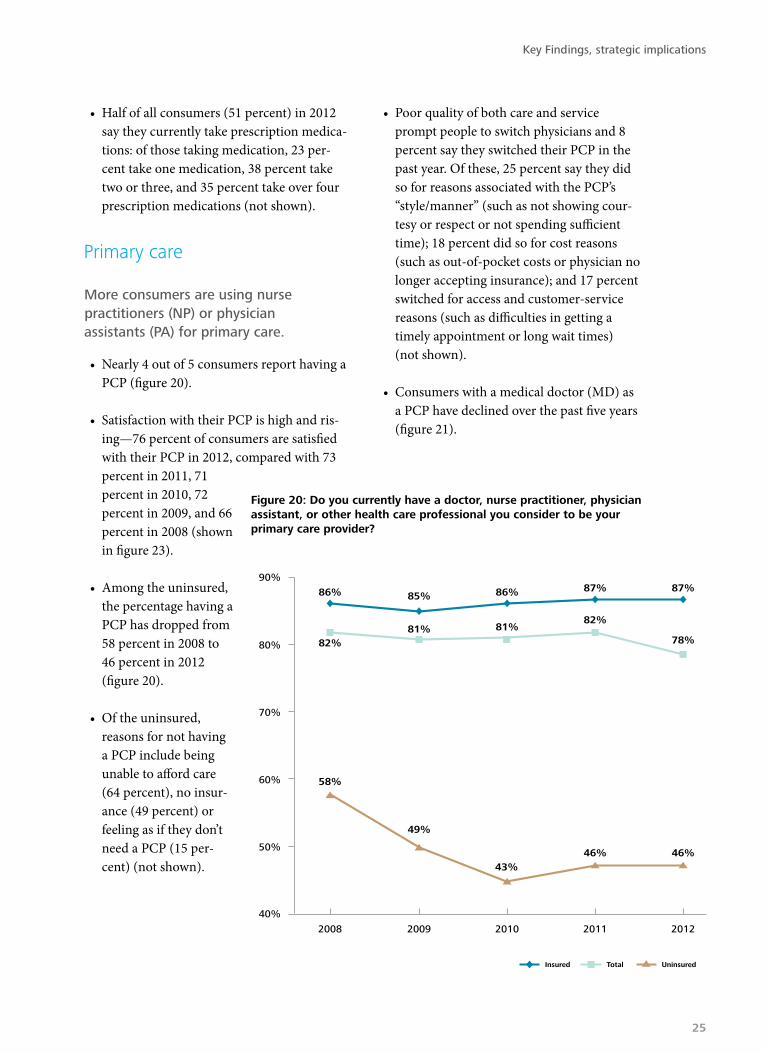
• Nearly 4 out of 5 consumers report having a PCP (figure 20).
• Satisfaction with their PCP is high and ris-ing—76 percent of consumers are satisfied with their PCP in 2012, compared with 73 percent in 2011, 71 percent in 2010, 72 percent in 2009, and 66 percent in 2008 (shown in figure 23).
• Among the uninsured, the percentage having a PCP has dropped from 58 percent in 2008 to 46 percent in 2012 (figure 20).
• Of the uninsured, reasons for not having a PCP include being unable to afford care (64 percent), no insur-ance (49 percent) or feeling as if they don’t need a PCP (15 per-cent) (not shown).
• Poor quality of both care and service prompt people to switch physicians and 8 percent say they switched their PCP in the past year. Of these, 25 percent say they did so for reasons associated with the PCP’s “style/manner” (such as not showing cour-tesy or respect or not spending sufficient time); 18 percent did so for cost reasons (such as out-of-pocket costs or physician no longer accepting insurance); and 17 percent switched for access and customer-service reasons (such as difficulties in getting a timely appointment or long wait times) (not shown).
• Consumers with a medical doctor (MD) as a PCP have declined over the past five years (figure 21).
Insured
2008
49%
81%
85%86%
82%
58%
86% 87% 87%
82%81%
78%
46%46%43%
2009 2010 2011 2012
Total Uninsured
40%
50%
60%
70%
80%
90%
Figure 20: Do you currently have a doctor, nurse practitioner, physician assistant, or other health care professional you consider to be your primary care provider?
Key Findings, strategic implications
25
*”Strongly agree’ or ‘agree”**Rating of 8, 9, or 10 on a 10-point scale where 10 is “extremely likely”
27%
20%
21%
A pharmacist can provide many of thesame services that a primary care
provider offers*
Used a pharmacist for treatmentinformation or advice for self or family
member instead of seeing a doctor(in the past year)
Asked a pharmacist for their opinionabout a medication that was prescribed
by a doctor (in the past year)
Would use a medical vending machineto fill a prescription**
14%
22%
14%
10%
6%
20%
17%
17%
22%
22%
24%
17%
11%
Millennials(1982–1994)
Gen X(1965–1981)
Boomers(1946–1964)
Seniors(1900–1945)
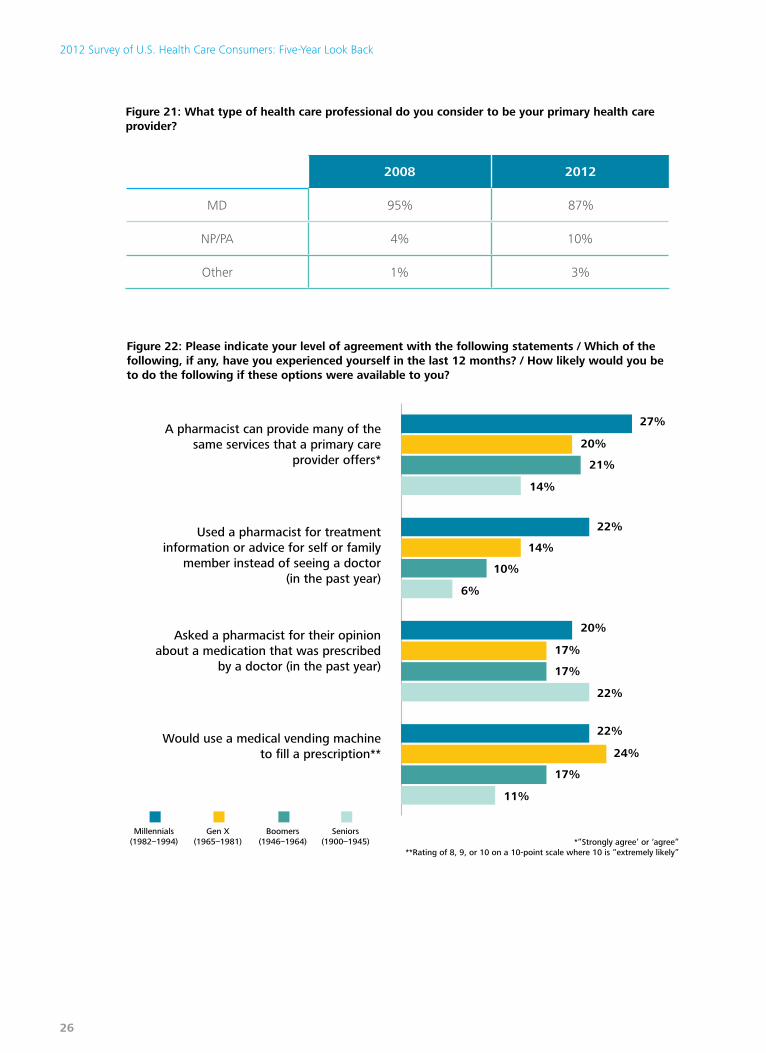
Figure 22: Please indicate your level of agreement with the following statements / Which of the following, if any, have you experienced yourself in the last 12 months? / How likely would you be to do the following if these options were available to you?
Figure 21: What type of health care professional do you consider to be your primary health care provider?
2008 2012
MD 95% 87%
NP/PA 4% 10%
Other 1% 3%
2012 Survey of U.S. Health Care Consumers: Five-Year Look Back
26
• During the same time period, use of a nurse practitioner (NP) or physician assistant (PA) as a PCP has increased from 4 percent to 10 percent (figure 21).
• 13 percent say they used a pharmacist for treatment or advice for themselves or a family member rather than consulting a doctor in 2012. Millennials seek out phar-macists more than older generations: 1 in 5 (22 percent) of Millennials (1982-1994) say they used pharmacists in this manner compared with 14 percent of Generation X (1965-1981), 10 percent of Baby Boomers (1946-1964), and 6 percent of Seniors (1900-1945) (figure 22).
• 1 in 4 Millennials believes that pharmacists could provide many primary care services similarly to a physician (figure 22).
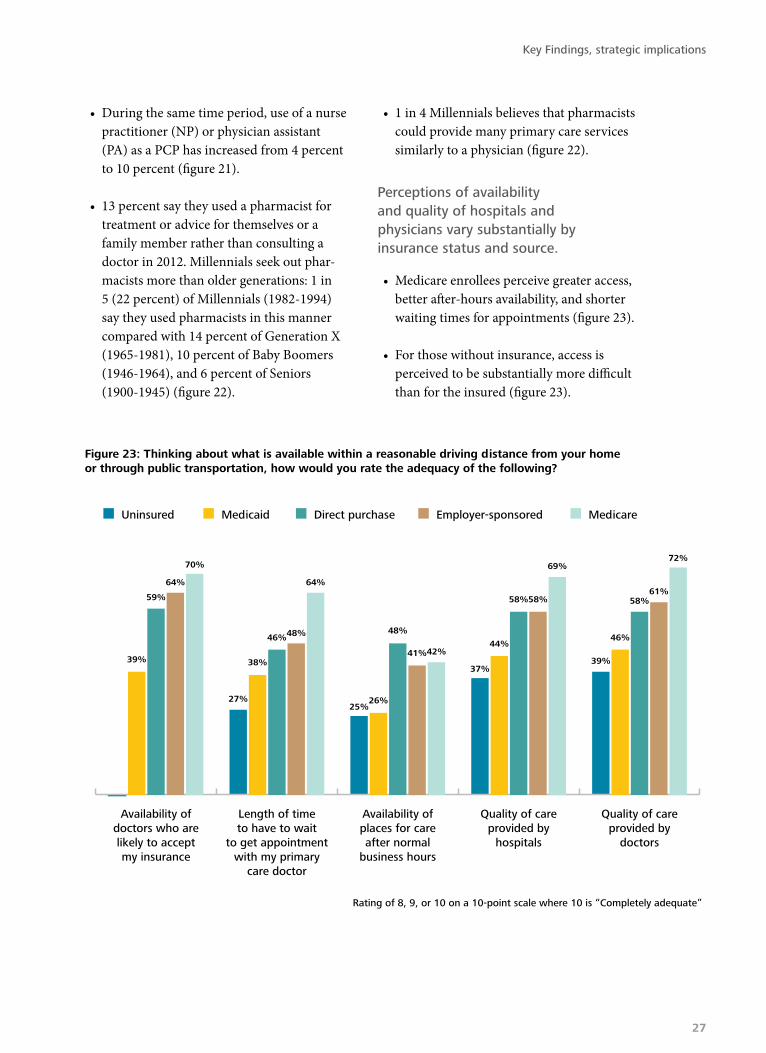
Perceptions of availability and quality of hospitals and physicians vary substantially by insurance status and source.
• Medicare enrollees perceive greater access, better after-hours availability, and shorter waiting times for appointments (figure 23).
• For those without insurance, access is perceived to be substantially more difficult than for the insured (figure 23).
Rating of 8, 9, or 10 on a 10-point scale where 10 is “Completely adequate”
72%
61%58%
46%
39%
69%
58%58%
44%
37%
42%41%
48%
26%25%
64%
48%46%
38%
27%
70%
64%
59%
39%
Quality of careprovided by
doctors
Quality of careprovided by
hospitals
Availability ofplaces for careafter normal
business hours
Length of timeto have to wait
to get appointmentwith my primary
care doctor
Availability ofdoctors who arelikely to acceptmy insurance
Uninsured Medicaid Direct purchase Employer-sponsored Medicare
Figure 23: Thinking about what is available within a reasonable driving distance from your home or through public transportation, how would you rate the adequacy of the following?
Key Findings, strategic implications
27
Hospital care
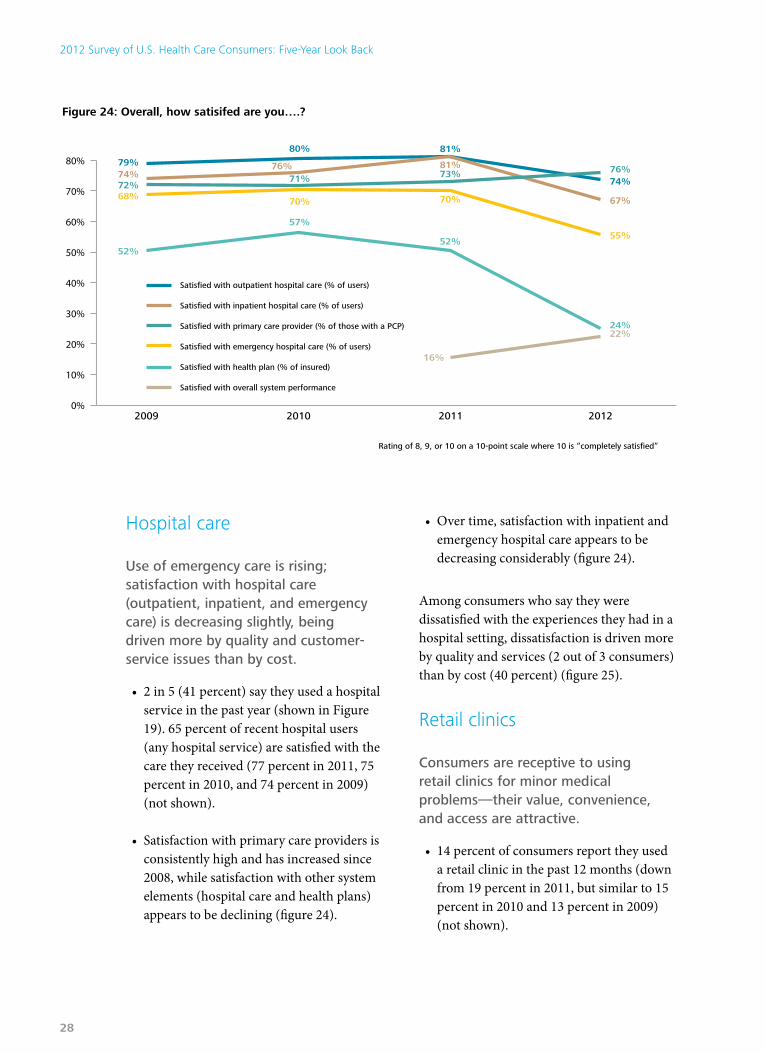
use of emergency care is rising; satisfaction with hospital care (outpatient, inpatient, and emergency care) is decreasing slightly, being driven more by quality and customer-service issues than by cost.
• 2 in 5 (41 percent) say they used a hospital service in the past year (shown in Figure 19). 65 percent of recent hospital users (any hospital service) are satisfied with the care they received (77 percent in 2011, 75 percent in 2010, and 74 percent in 2009) (not shown).
• Satisfaction with primary care providers is consistently high and has increased since 2008, while satisfaction with other system elements (hospital care and health plans) appears to be declining (figure 24).
• Over time, satisfaction with inpatient and emergency hospital care appears to be decreasing considerably (figure 24).
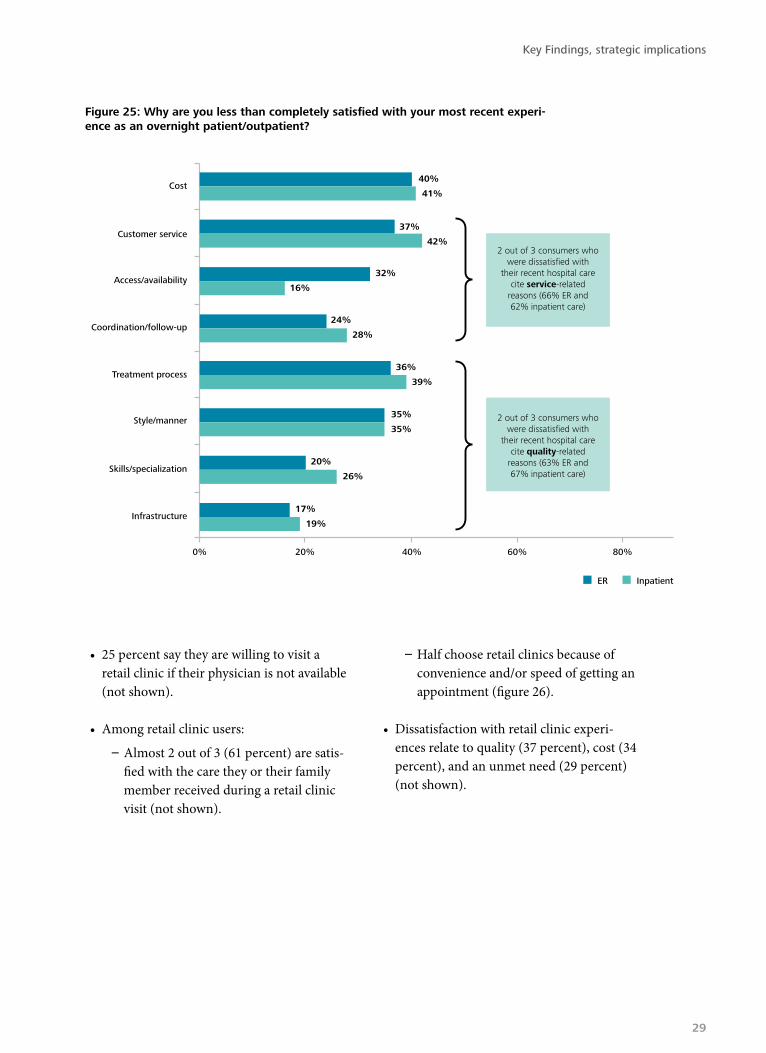
Among consumers who say they were dissatisfied with the experiences they had in a hospital setting, dissatisfaction is driven more by quality and services (2 out of 3 consumers) than by cost (40 percent) (figure 25).
Retail clinics
Consumers are receptive to using retail clinics for minor medical problems—their value, convenience, and access are attractive.
• 14 percent of consumers report they used a retail clinic in the past 12 months (down from 19 percent in 2011, but similar to 15 percent in 2010 and 13 percent in 2009) (not shown).
Rating of 8, 9, or 10 on a 10-point scale where 10 is “completely satisfied”
Satisfied with outpatient hospital care (% of users)
Satisfied with inpatient hospital care (% of users)
Satisfied with primary care provider (% of those with a PCP)
Satisfied with emergency hospital care (% of users)
Satisfied with health plan (% of insured)
Satisfied with overall system performance
2009 2010 2011 2012
79%74%72%68%
74%
67%
76%
55%
52%
57%
70% 70%
73%81%
81%
71%76%
80%
52%
24%22%
16%
0%
10%
20%
30%
40%
50%
60%
70%
80%
Figure 24: Overall, how satisifed are you….?
2012 Survey of U.S. Health Care Consumers: Five-Year Look Back
28
40%
41%
37%
42%
32%
16%
24%
28%
36%
39%
35%
35%
20%
26%
17%
19%
0% 20% 40% 60% 80%
ER Inpatient
Cost
Customer service
Access/availability
Coordination/follow-up
Treatment process
Style/manner
Skills/specialization
Infrastructure
2 out of 3 consumers whowere dissatisfied with
their recent hospital carecite service-related
reasons (66% ER and62% inpatient care)
2 out of 3 consumers whowere dissatisfied with
their recent hospital carecite quality-related
reasons (63% ER and67% inpatient care)
Figure 25: Why are you less than completely satisfied with your most recent experi-ence as an overnight patient/outpatient?
• 25 percent say they are willing to visit a retail clinic if their physician is not available (not shown).
• Among retail clinic users:
– Almost 2 out of 3 (61 percent) are satis-fied with the care they or their family member received during a retail clinic visit (not shown).
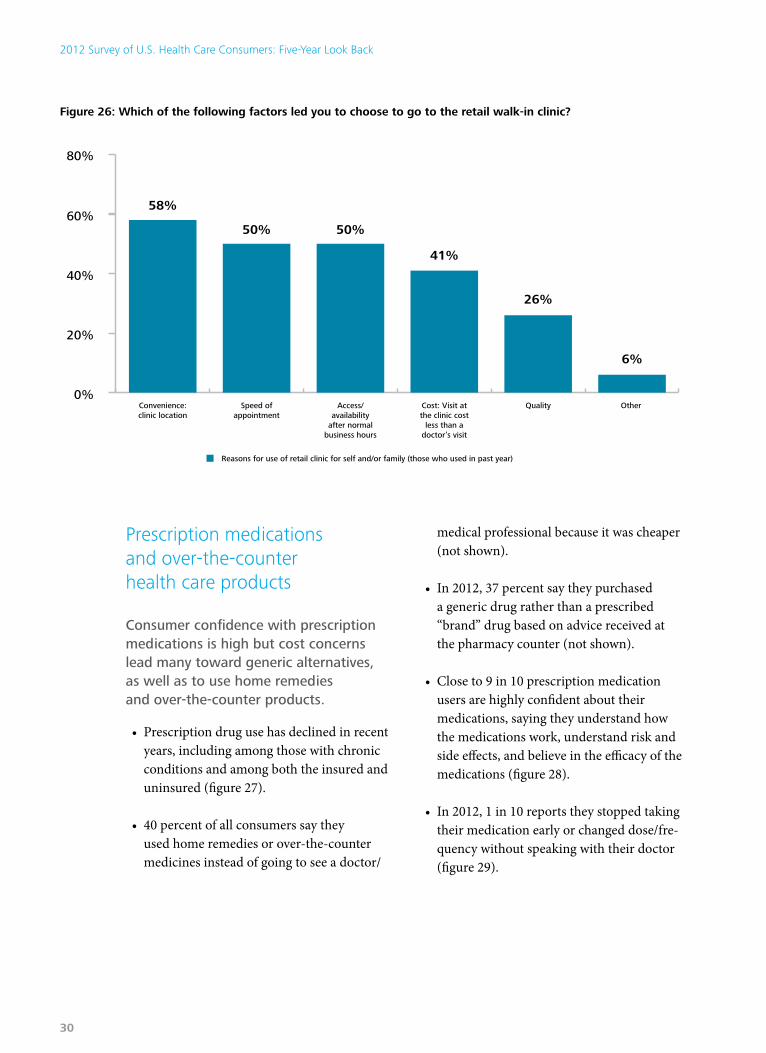
– Half choose retail clinics because of convenience and/or speed of getting an appointment (figure 26).
• Dissatisfaction with retail clinic experi-ences relate to quality (37 percent), cost (34 percent), and an unmet need (29 percent) (not shown).
Key Findings, strategic implications
29
Prescription medications and over-the-counter health care products
Consumer confidence with prescription medications is high but cost concerns lead many toward generic alternatives, as well as to use home remedies and over-the-counter products.
• Prescription drug use has declined in recent years, including among those with chronic conditions and among both the insured and uninsured (figure 27).
• 40 percent of all consumers say they used home remedies or over-the-counter medicines instead of going to see a doctor/
medical professional because it was cheaper (not shown).
• In 2012, 37 percent say they purchased a generic drug rather than a prescribed “brand” drug based on advice received at the pharmacy counter (not shown).
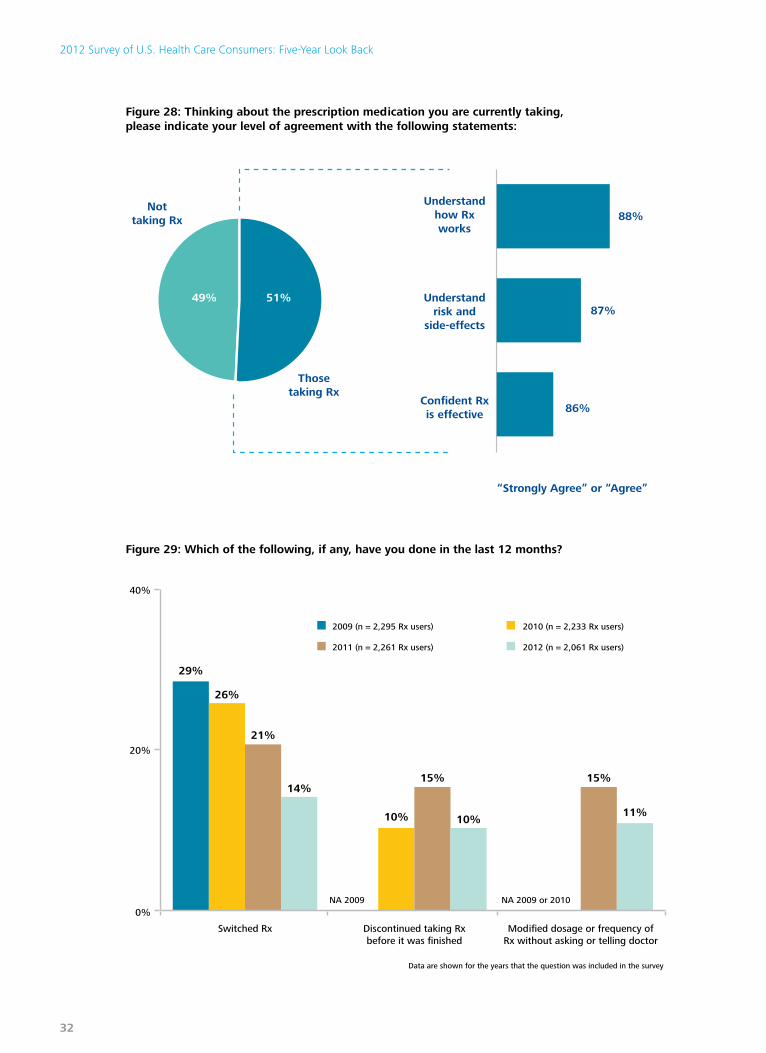
• Close to 9 in 10 prescription medication users are highly confident about their medications, saying they understand how the medications work, understand risk and side effects, and believe in the efficacy of the medications (figure 28).
• In 2012, 1 in 10 reports they stopped taking their medication early or changed dose/fre-quency without speaking with their doctor (figure 29).
Reasons for use of retail clinic for self and/or family (those who used in past year)
0%
20%
40%
60%
80%
58%
50% 50%
41%
26%
6%
Convenience:clinic location
Speed ofappointment
Access/availability
after normalbusiness hours
Cost: Visit atthe clinic cost
less than adoctor’s visit
Quality Other
Figure 26: Which of the following factors led you to choose to go to the retail walk-in clinic?
2012 Survey of U.S. Health Care Consumers: Five-Year Look Back
30

% of those with chronic condition(s)
% of insured
% of total sample currently taking prescription medications
% of uninsured
2008 2009 2010 2011 2012
95%
51%
28%
57%
73%
63%
60%
41%
100%
80%
60%
40%
20%
0%
Figure 27: Are you currently taking any of the following products to treat a health condition/problem or improve your health?
• Fewer prescription medication users report switching medications than in previous years—14 percent in 2012 compared with 29 percent in 2009 (figure 29).
• Few consumers switch medications, but those who do, switch in search of better effectiveness (42 percent), fewer side effects
(30 percent), and medicines that are easier to take (12 percent). 34 percent say they switched to a generic to save money and 16 percent say they switched for insurance-related reasons (not shown).
Key Findings, strategic implications
31
88%
87%
86%
Understandhow Rxworks
Thosetaking Rx
Nottaking Rx
“Strongly Agree” or “Agree”
Understandrisk and
side-effects
Confident Rxis effective
49% 51%
Figure 28: Thinking about the prescription medication you are currently taking, please indicate your level of agreement with the following statements:
2009 (n = 2,295 Rx users)
Switched Rx Discontinued taking Rxbefore it was finished
Modified dosage or frequency ofRx without asking or telling doctor
2011 (n = 2,261 Rx users)
2010 (n = 2,233 Rx users)
2012 (n = 2,061 Rx users)
0%
20%
40%
Data are shown for the years that the question was included in the survey
NA 2009
29%
26%
21%
14%
10%
15%
10%
15%
11%
NA 2009 or 2010
Figure 29: Which of the following, if any, have you done in the last 12 months?
2012 Survey of U.S. Health Care Consumers: Five-Year Look Back
32

Zone four: Alternative health services1 in 10 consumers integrates alternative therapies with traditional care.
• Nearly 1 in 10 respondents in 2012 says they treated a health problem with alter-native treatment approaches and natural remedies compared with around 1 in 5 who did so during 2008–2011 (figure 30).
• Few use alternative or natural therapies either in substitution for or in addition to prescription medications and use appears to be declining over the years (figure 30).
• 12 percent say they prefer doctors who take an alternative/holistic approach to treating health problems, down slightly from 15 percent in 2008. Over the same period, the per-centage stating a clear preference for doctors who take a standard medi-cal approach grew from 42 percent to 47 percent.
• To treat minor illnesses, 17 percent say they prefer to take natural remedies like herbal medicines rather than medicines prescribed in standard medical care. This has not changed in recent years, but is higher among the younger generations (22 percent of Millennials, 19 percent of Gen X) than the older generations (14 percent of Boomers, 11 percent of Seniors), suggest-ing use of natural remedies may increase in coming years.
Percentage whohad done so
in the past year
Treated a health problem with analternative approach or natural
therapy (e.g., acupuncture,chiropractic, homeopathic,naturopathic, bio-electric)
Used an alternative treatmentapproach or natural
therapy in addition to Rx
Substituted/used an alternativetreatment approach or
natural therapy instead of Rx
9%
18%
22%
19%
7%
13%
20%
16%
7%
8%
10%
9%
2012
2009
2010
2011
0% 5% 10% 15% 20% 25%
Figure 30: Which of the following, if any, have you done in the last 12 months?
Key Findings, strategic implications
33
Zone Five: Health insuranceFewer than half the consumers are satisfied with health plans—in particular, a shift from feeling “well-insured” to feeling either “adequately insured” or “under-insured” is evident.
2012 Survey of U.S. Health Care Consumers: Five-Year Look Back
34

• 80 percent of consumers in 2012 report having some kind of health insurance through a commercial plan or government-sponsored program (figure 31).*
• Most consumers have insurance from employers (47 percent), through govern-ment programs (27 percent) or purchased directly (6 percent) (figure 31).*
• Satisfaction with health plans has declined in recent years, from 52 percent in 2009 saying they are satisfied to 57 percent in
2010, 52 percent in 2011, and 44 percent in 2012 (shown in figure 24).
• 16 percent of the insured report switch-ing health plans in 2012 (11 percent did so in 2008, 17 percent in 2009, 20 percent in 2010, 11 percent in 2011). Many consumers are switching plans for cost-related reasons: 47 percent of those who switched in 2012 say they did so for cost-related reasons, including seeking to pay less, get better value, or reduce out-of-pocket costs; or an inability to afford premiums (not shown).
80%
Employer-basedinsurance
Governmentprogram
Direct purchase
20%
47%
Insured
Uninsured
27%
6%
Figure 31: Which of the following best describes your health insurance status during the past 12 months?*
* Quotas were used to ensure that the insurance status and source distributions of our sample match those observed in the u.S. adult population. Please see the methodology section for more information.
Key Findings, strategic implications
35
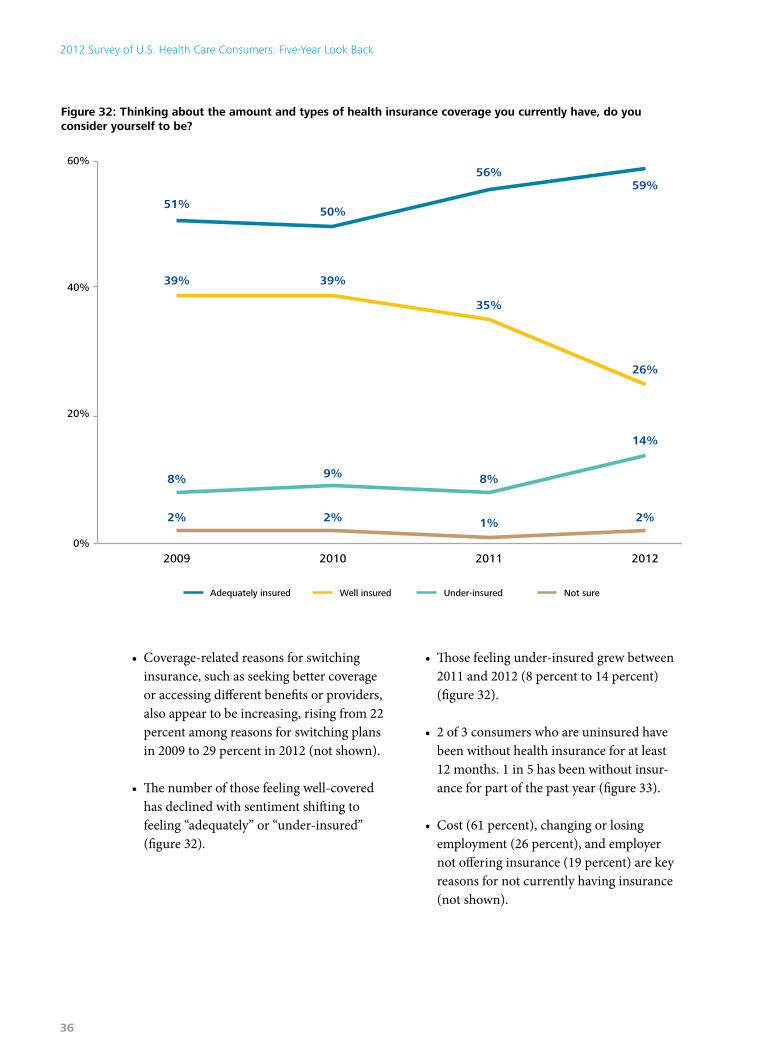
• Coverage-related reasons for switching insurance, such as seeking better coverage or accessing different benefits or providers, also appear to be increasing, rising from 22 percent among reasons for switching plans in 2009 to 29 percent in 2012 (not shown).
• The number of those feeling well-covered has declined with sentiment shifting to feeling “adequately” or “under-insured” (figure 32).
• Those feeling under-insured grew between 2011 and 2012 (8 percent to 14 percent) (figure 32).
• 2 of 3 consumers who are uninsured have been without health insurance for at least 12 months. 1 in 5 has been without insur-ance for part of the past year (figure 33).
• Cost (61 percent), changing or losing employment (26 percent), and employer not offering insurance (19 percent) are key reasons for not currently having insurance (not shown).
51%
39%
8%
2% 2% 1% 2%
14%
26%
59%
8%
35%
56%
9%
39%
50%
2009
Well insuredAdequately insured Under-insured Not sure
2010 2011 2012
40%
60%
20%
0%
Figure 32: Thinking about the amount and types of health insurance coverage you currently have, do you consider yourself to be?
2012 Survey of U.S. Health Care Consumers: Five-Year Look Back
36

Figure 33: Which of the following best describes your health insurance status during the past 12 months?
Of all consumers Of uninsured consumers
Uninsured 20% 100%
Uninsured for all of past 12 months 13% 68%
Uninsured, but had insurance for part of last 12 months
4% 23%
Uninsured , but not sure about status for past 12 months
2% 9%
Data are rounded
Consumers want choice and customization when purchasing health insurance.
many consumers are interested in taking a more active role when selecting and purchasing their health care coverage. Younger generations, in particular, show interest in customizing plans and having a choice of plan styles and options.
• Only 6 percent currently have insurance that they bought directly; however, 33 per-cent say they would prefer to obtain insur-ance that way (figures 34 and 35).
• Consumers show some interest in alterna-tive ways of obtaining insurance: interest is split between a preference for person-ally shopping for insurance and for taking advantage of employer offerings (figure 35).
• If given the choice, close to 3 in 5 consum-ers say they would prefer to customize their health plan rather than select from pre-defined options (figure 36).
• Interest in customizing is highest among the youngest generations: 64 percent of Millennials and 62 percent of Gen X say they are interested, whereas 41 percent of Seniors say they are interested (figure 36).
Key Findings, strategic implications
37

Direct purchase frominsurance company
or through exchange,connector, or website
6%
27%Government
program
47%Employer-
based
20%Uninsured
33%Shop onmy own
(through onlinesources or exchanges,
brokers, or directcontact with
insurers)
3%Do not wish toobtain a healthplan under anycircumstances
4%Some otherapproach
32%Select from
options offeredby an employer
17%Select from
options throughgovernment
programs
12%No opinion/preference
Figure 34: Thinking about your primary health insurance coverage (meaning the health insur-ance policy/health plan that currently provides the most coverage for medical care), how did you get this coverage?
Figure 35: There are many potential ways to obtain a health plan. If you were given the choice, which approach would you prefer?
TotalRespondents
Millennials(1982–1994)
Gen X(1965–1981)
Boomers(1946–1964)
Seniors(1900–1945)
Do not want a plan underany circumstances
Pre-defined plan wherebenefits, features, andassociated costs havebeen set
Customized plan where youcan select benefits andfeatures from a menu ofoptions knowing the costwill reflect what you choose
No opinion/preference
Some other kind of plan
5%
15%
5%
34%
41%
3%
13%
6%
24%
54%
3%
9%
4%
21%
62%
2%
8%
5%
21%
64%
3%
11%
5%
24%
57%
Figure 36: There are different ways to design a health plan such as the mix of benefits, features, and costs that might make up a particular health plan. If you were given the choice, which kind of health plan would you prefer?
2012 Survey of U.S. Health Care Consumers: Five-Year Look Back
38

Zone six: Health policyviews on health care reformA “good start” or a “step in the wrong direction”?
• Overall, consumer support for health care reform slipped from 2011: half felt posi-tively about health care reform in 2011 (49 percent) versus 38 percent in 2012 (figure 37). The strongest positive inclinations about the health care reform law are held by the Millennial generation (1982-1994) (41 percent in 2012).
• Uncertainty about reform increased, with 34 percent in 2012 either not knowing or expressing no opinion versus 21 percent in 2011 (figure 37).
• Seniors are more negative about reform than others: the percentage of consumers of all generations thinking that health care
Figure 37: Based on what you know or have heard about the health care reform law, is it a good start or a step in the wrong direction?
2011 2012 change 2011 2012 change 2011 2012 change
Total 49% 38% 30% 29% 21% 34%
Male 50% 39% 33% 32% 18% 29%
Female 50% 36% 26% 26% — 24% 38%
Millennials(1982-1994)
55% 41% 22% 20% 24% 39%
Generation X(1965-1981)
49% 37% 28% 27% 23% 36%
Baby Boomers(1946-1964)
49% 36% 34% 32% 17% 32%
Seniors(1900-1945)
46% 36% 35% 38% 20% 26%
Insured 49% 38% 31% 30% 21% 32%
Uninsured 55% 37% 24% 23% 22% 40%
note: Figures are rounded and may not total to 100%
“good start” “step in the wrong direction” Don’t know/uncertain
Key Findings, strategic implications
39
reform is a “step in the wrong direction” has remained relatively constant; however, positive views of reform have declined sub-stantially in all generational groups, shifting toward “don’t know/no opinion.”
What might be achieved by health care reform?
Consumers are unclear about the likely results of the Affordable Care Act (ACA): the majority is not sure it will increase access, reduce costs, or improve quality.
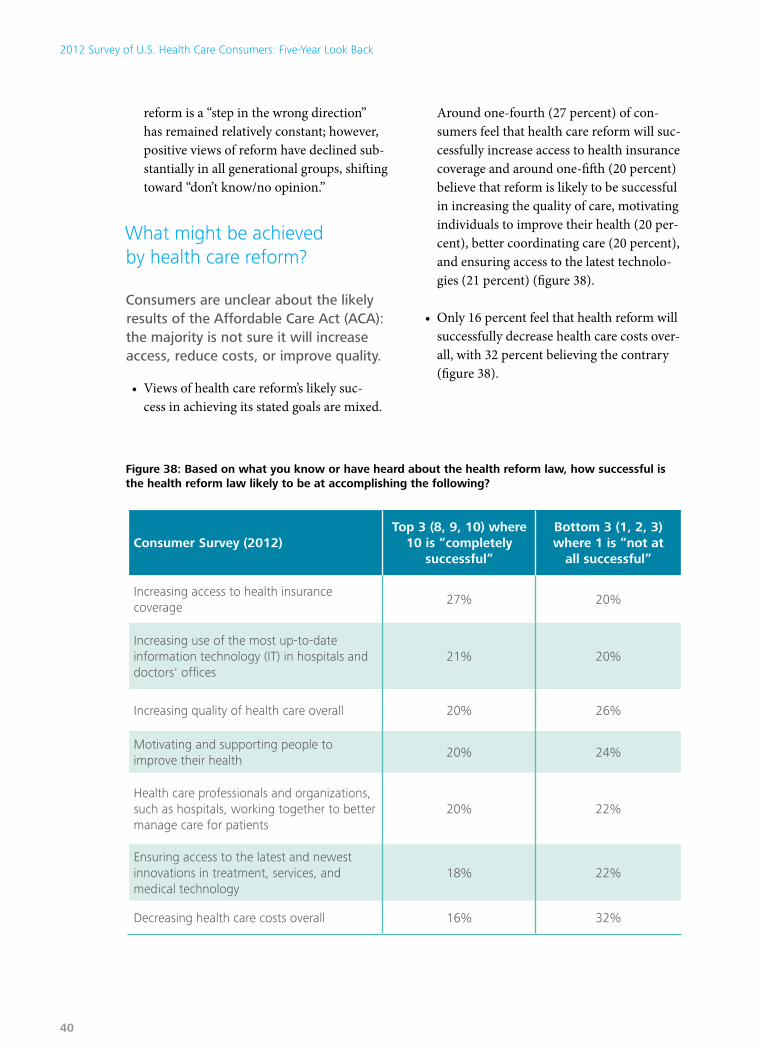
• Views of health care reform’s likely suc-cess in achieving its stated goals are mixed.
Around one-fourth (27 percent) of con-sumers feel that health care reform will suc-cessfully increase access to health insurance coverage and around one-fifth (20 percent) believe that reform is likely to be successful in increasing the quality of care, motivating individuals to improve their health (20 per-cent), better coordinating care (20 percent), and ensuring access to the latest technolo-gies (21 percent) (figure 38).
• Only 16 percent feel that health reform will successfully decrease health care costs over-all, with 32 percent believing the contrary (figure 38).
Figure 38: Based on what you know or have heard about the health reform law, how successful is the health reform law likely to be at accomplishing the following?
Consumer Survey (2012)Top 3 (8, 9, 10) where
10 is “completely successful”
Bottom 3 (1, 2, 3) where 1 is “not at
all successful”
Increasing access to health insurance coverage
27% 20%
Increasing use of the most up-to-date information technology (IT) in hospitals and doctors' offices
21% 20%
Increasing quality of health care overall 20% 26%
Motivating and supporting people to improve their health
20% 24%
Health care professionals and organizations, such as hospitals, working together to better manage care for patients
20% 22%
Ensuring access to the latest and newest innovations in treatment, services, and medical technology
18% 22%
Decreasing health care costs overall 16% 32%
2012 Survey of U.S. Health Care Consumers: Five-Year Look Back
40
Key findingsThe six major takeaways are:
1. Evident over the five years of this study, U.S. consumers recognize that the health care system is costly, confusing, and is perceived to deliver suboptimal service and value.
2. Most consumers have a touch point with the health care system through their pri-mary care practitioner, and satisfaction with this service is high. Consumers increasingly are open to primary care being delivered by a range of professionals including physi-cians, nurse practitioners, physician assis-tants, and pharmacists—and see potential for primary care to lower costs and improve quality of the health care system overall.
3. Consumer confidence in dealing with future health care costs is declining—anxi-ety and concern about future health care costs are prevalent. The cost of care coupled with the unfavorable economic conditions of the past few years are prompting con-sumers to scale back out-of-pocket spend-ing, delay or skip care, and consider using non-conventional options.
4. A solid base of “e-health consumers” is slowly grow-ing: over the past few years, comparatively low numbers of consum-ers have turned to online resources for health care when compared with use of online resources in other
industries. Generational differences in the use of technology for health care purposes are critical insights: the younger, healthy generations are the most interested and open to using technology but have the least need to do so. However, with the passage of time, utilization of health care by these groups will increase—either for themselves or as carers for family members and this group will expect smart-tools, ready access, and immediacy with respect to health care information and communications with providers and insurers.
5. Insurance is key to accessing the system, with disparities between those with and those without insurance clearly evident over the past five years. Insured consum-ers’ feelings of being adequately covered are declining.
6. Despite the fact that about half of consum-ers recognize that unhealthy lifestyles are
a substantial cost driver of the system, a low level of engagement is evident
in consumers’ pursuit of healthy behaviors, use of preventive care, and health maintenance activities. The reasons for this are unclear—they may be due, in part, to consumers’ cost-sensitivities but this highlights the need for a
greater focus on wellness in the system.
Key Findings, strategic implications
41
• How best can stakeholders (particu-larly health plans, medical device and bio-pharma companies, and health care providers) optimize the “customer experi-ence”? Effective customer-service strategies, including the relentless pursuit of quality, patient safety, and care coordination, will be required. Also, new and/or additional resources and structures will be needed to provide consumers with advice and infor-mation to help them successfully navigate the system and better manage/coordinate their health. In addition, drug and device manufacturers will need to increasingly consider their end users when positioning their value proposition.
• An engaged health care consumer is central to successful strategies to re-focus the current health care system. What “carrots and sticks” are necessary to motivate and incentivize consumers to manage their own health, and how can stakeholder organizations (provid-ers, health plans, bio-pharma companies) devise and implement effective consumer engagement strategies? What tools and systems need to be in place to encourage consumer engage-ment? What part do new technologies such as distance medicine and telemedicine, self-care, bio-monitoring, and physician e-visits, as well as allied health clinics and other ambulatory facilities, play in achieving this?
• Commercial health insurance companies will need to consider how best to structure products and shopping experiences for consumers who have been without health
insurance. An influx of newly insured will require business models that reinforce the need for real-time integration of clinical and claims data for better decision-making; payment systems that align with outcomes; a focus on enhanced clinical effectiveness; information and decision-support tools; consumer-oriented information, account-ability, and incentives that align with care goals; integration of care pathways; and the use of tools and technologies such as monitoring devices.
• Multi-channel information strategies will be necessary to reach consumers in a mar-ketplace that is fragmented with multiple opportunities, resources, and informa-
tion streams for consumers to use to access information and
facilitate decision-making about the health care they consume. Different media preferences and utiliza-tion behaviors are evident among generational age
groups; services and chan-nels should, therefore, be tar-
geted to take these differences into account. Emerging media formats,
tools, and apps offer consumers—particu-larly younger generational groups—consid-erable opportunities to use online resources and social media for motivation and health goal tracking, wellness, information gather-ing, support, and encouragement.
• Health care providers may need to posi-tion their core services, customer service strategies, and communications tools and techniques to take advantage of the myriad consumer-oriented, technologically based health care tools. Providers need to
Stakeholders in the U.S. health care system should consider the following implications, issues, and challenges:
2012 Survey of U.S. Health Care Consumers: Five-Year Look Back
42
meet the challenge of providing real-time, understandable health information, test results, and other relevant data for consum-ers in easy-to-access formats. Not every one has, or wants, a smartphone or tablet—nor is all health care information suitable for such platforms—so, what are the solutions going forward?
• Providers, regulators, and insurers should be alert to the changing landscape of pro-viding health care—particularly primary
care. New non-traditional sites/service models that offer high-quality care, con-venience, access, and affordability provide opportunities to capitalize on consumer interest. These new service delivery models will draw upon different skills and compe-tencies, as well as changing incentives in payment systems and increasing consumer demand for health care services, and will require a new and different mix in the skilled health care workforce.
Key Findings, strategic implications
43
Closing thoughts
To U.S. consumers, health care is intensely personal—opinions about the system’s per-
formance are based on individual, often local, sometimes painful and frustrating experiences. Nonetheless, there is considerable opportu-nity to engage consumers more effectively in decisions about their health and the care they utilize. For consumers, a less expensive and less complicated health care system, better coor-dinated services, improved delivery models (such as team-based care), and increased value are imperative.
For many industry stakeholders, consum-erism in health care is problematic. Although inevitable, it is disruptive to “standard oper-ating procedure”—in some cases, requiring a massive overhaul of business models and
personnel. Deloitte believes this transforma-tion is necessary and worth it.
As the health care marketplace moves toward one that is grounded in value-based competition, innovation, and consumer engagement, what has the industry learned about how consumers view their health and the health care system? More critically, what more do stakeholders need to know about health care consumers’ behaviors, expectations, and unmet needs? How best can consumers be reached? The challenge posed by decoding health care consumerism is to grasp where the end recipient fits into the “new normal” of health care and to identify what opportunities may be around the corner when consumer-ism is translated into a high-performing, consumer-centered system of care.
2012 Survey of U.S. Health Care Consumers: Five-Year Look Back
44
We would also like to thank Laura Eselius, Leslie Korenda, Elizabeth Stanley, Jennifer Bohn, Katrina Drake Hudson, Claire Boozer and the many others who contributed to the preparation of this report.
Paul H. Keckley, PhDExecutive DirectorDeloitte Center for Health SolutionsDeloitte [email protected]
Contact informationTo learn more about the Deloitte Center for Health Solutions, its projects and events, please visit www.deloitte.com/centerforhealthsolutions.
Deloitte Center for Health Solutions1001 G Street N.W. Suite 1200Washington, DC 20001Phone 202-220-2177 Fax 202-220-2178 Toll free 888-233-6169 Email [email protected] Web www.deloitte.com/centerforhealthsolutions
Companion reports to the Deloitte 2012 Survey of U.S. Health Care Consumers: Five Year Look Back include an INFOBriefs series that presents key findings about consumers and health informa-tion technology, social media and online resources; utilization of health care services; life sciences products and innovations; consumers and health plans. An additional report on health care con-sumer segments is also available. For more information and additional reports, visit www.deloitte.com/centerforhealthsolutions
Acknowledgements
ContactsSheryl Coughlin, PhD, mHAHead of ResearchDeloitte Center for Health SolutionsDeloitte [email protected]
Key Findings, strategic implications
About Deloitte University Press Deloitte University Press publishes original articles, reports and periodicals that provide insights for businesses, the public sector and NGOs. Our goal is to draw upon research and experience from throughout our professional services organization, and that of coauthors in academia and business, to advance the conversation on a broad spectrum of topics of interest to executives and government leaders.
Deloitte University Press is an imprint of Deloitte Development LLC.
This publication contains general information only, and none of Deloitte Touche Tohmatsu Limited, its member firms, or its and their affiliates are, by means of this publication, rendering accounting, business, financial, investment, legal, tax, or other professional advice or services. This publication is not a substitute for such professional advice or services, nor should it be used as a basis for any decision or action that may affect your finances or your business. Before making any decision or taking any action that may affect your finances or your business, you should consult a qualified professional adviser.
None of Deloitte Touche Tohmatsu Limited, its member firms, or its and their respective affiliates shall be responsible for any loss whatsoever sustained by any person who relies on this publication.
About Deloitte Deloitte refers to one or more of Deloitte Touche Tohmatsu Limited, a UK private company limited by guarantee, and its network of member firms, each of which is a legally separate and independent entity. Please see www.deloitte.com/about for a detailed description of the legal structure of Deloitte Touche Tohmatsu Limited and its member firms. Please see www.deloitte.com/us/about for a detailed description of the legal structure of Deloitte LLP and its subsidiaries. Certain services may not be available to attest clients under the rules and regulations of public accounting.
About the Deloitte Center for Health Solutions The Deloitte Center for Health Solutions is the health services research arm of Deloitte LLP. Our goal is to inform all stakeholders in the health care system about emerging trends, challenges, and opportunities using rigorous research. Through our research, roundtables, and other forms of engagement, we seek to be a trusted source for relevant, timely, and reliable insights
Copyright © 2012 Deloitte Development LLC. All rights reserved. Member of Deloitte Touche Tohmatsu Limited
Follow @DU_Press
Sign up for Deloitte University Press updates at www.dupress.com