2012 risk & capital report€¦ · the national australia bank group’s subsidiary in the...
TRANSCRIPT

2012 Risk &
Capital RepoRt
Incorporating the requirements of APS 330
Half Year Update as at 31 March 2012

half year risk and capital report
2020202012121212 This page has been left blank intentionally

Contents
2
half year risk and capital report
2020202012121212 Contents
1. Introduction 4 1.1 The Group’s Basel II Methodologies 4
1.2 APS 330 Disclosure Governance 4
2. Scope of Application 5
Disclosure 2A: Scope of Application 5
3. Regulatory Environment 6
4. Capital 7 4.1 Capital Adequacy 7
Table 4.1A: RWA 7
Table 4.1B: Capital Ratios 8
4.2 Capital Structure 9
Table 4.2A: Capital Structure 9
5. Credit Risk 10
5.1 Credit risk 10
Table 5.1A: Credit Risk Exposures Summary 10
Table 5.1B: Total and Average Credit Risk Exposures 12
Table 5.1C: Exposures by Geography 13
Table 5.1D: Exposures by Industry 14
Table 5.1E: Exposures by Maturity 16
Table 5.1F: Provisions by Asset Class 17
Table 5.1G: Loss Experience 20
Table 5.1H: Provisions by Industry 21
Table 5.1I: Provisions by Geography 22
Table 5.1J: Movement in Provisions 23
5.2 Standardised and Supervisory Slotting Portfolio s 24
Table 5.2A: Standardised Exposures by Risk Weight 24
Table 5.2B: Standardised Exposures by Risk Grade 24
Table 5.2C: Supervisory Slotting by Risk Weight 25
5.3 Internal Rating Based Portfolios 26
Table 5.3A: Non-Retail Exposure by Risk Grade 26
Table 5.3B: Retail Exposure by Risk Grade 28
5.4 Credit Risk Mitigation 30
Table 5.4A: Mitigation by Eligible Collateral 30
Table 5.4B: Mitigation by Guarantees and Derivatives 31
6. Securitisation 32 6.1 Third Party Securitisation 32
Table 6.1A: Total Securitisation Exposures 32
Table 6.1B: Type of Exposures 33
Table 6.1C: New Facilities Provided 33
Table 6.1D: Exposures by Risk Weight 34
Table 6.1E: Exposures Deducted from Capital 37
6.2 Group Owned Securitised Assets 38
Table 6.2A: Assets Securitised by the Group 38
Table 6.2B: Recent Securitisation Activity 39
Disclosure 6.2C: Securitisation Subject to Early Amortisation 39
Disclosure 6.2D: Forthcoming Securitisation Activity
by the Group 39
Disclosure 6.2E: Credit Risk Mitigation and
Guarantors 39
7. Market Risk 40
Table 7.1A: Standard Method Risk-Weighted Assets 40
Table 7.1B: Total Risk-Weighted Assets 40
Table 7.1C: Internal Model Approach Value at Risk 40
Table 7.1D: Back-testing Results 41
8. Operational Risk 42
Table 8A: Total Risk-Weighted Assets 42
9. Non-Traded Market Risk 43 9.1 Interest Rate Risk in the Banking Book 43
Table 9.1A: Interest Rate Risk in the Banking Book 43
Table 9.1B: Total Risk-Weighted Assets 43
9.2 Equities Banking Book Position 44
Table 9.2A: Equities Banking Book Position 44
Table 9.2B: Gains and Losses on Investments 44
Table 9.2C: Risk-Weighted Assets by Equity Asset Class 44
Disclosure 9.2D: Equity Investments Subject to Grandfathering Provisions 44
10. Glossary 45
11. Reference to APS 330 Tables 48

3
half year risk and capital report
2020202012121212 This page has been left blank intentionally
Introduction
4
half year risk and capital report
2020202012121212 1. Introduction
The Group, as defined in Section 2. Scope of Application, applies the Basel II framework as a cornerstone of its risk management framework and capital strategy, and recognises that it is critical for achieving the Group’s strategic agenda.
In Australia, the Australian Prudential Regulation Authority (APRA) has regulatory responsibility for the implementation of Basel II through the release of prudential standards.
This Report addresses the requirements of APRA’s Pillar 3 public disclosure standard, Prudential Standard APS 330 Capital Adequacy: Public Disclosure of Prudential Information (APS 330).
All figures in this report are in Australian dollars (AUD) unless otherwise noted.
Capital Ratio Summary
The Group’s Tier 1 capital ratio of 10.17% at 31 March 2012 is consistent with the Group’s objective of maintaining a strong capital position.
As at
31 Mar 12 30 Sep 11
Capital ratios % %
Level 2 Tier 1 capital ratio 10.17% 9.70%
Level 2 total capital ratio 11.52% 11.26%
The Group remains responsive to economic conditions and continues to maintain strong balance sheet settings. These settings enable the Group to manage through difficult market conditions and ensure that it is well positioned for future regulatory change and balance sheet growth.
1.1 The Group’s Basel II Methodologies
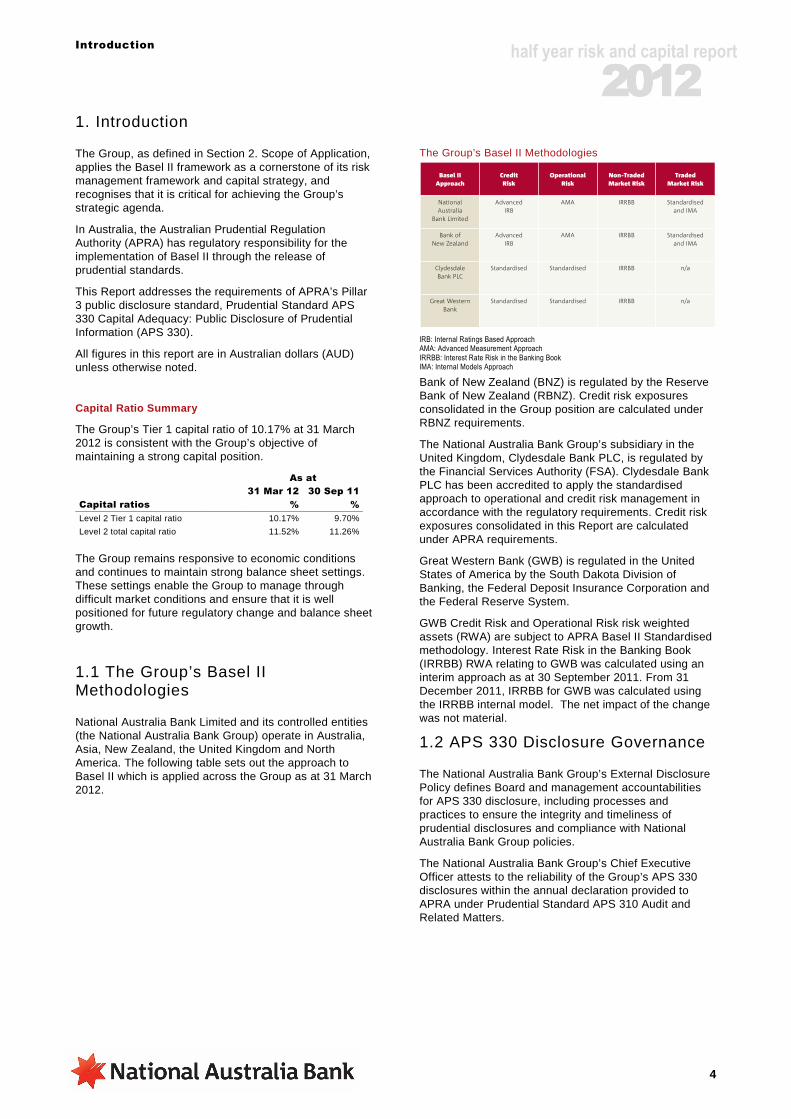
National Australia Bank Limited and its controlled entities (the National Australia Bank Group) operate in Australia, Asia, New Zealand, the United Kingdom and North America. The following table sets out the approach to Basel II which is applied across the Group as at 31 March 2012.
The Group’s Basel II Methodologies
IRB: Internal Ratings Based Approach AMA: Advanced Measurement Approach
IRRBB: Interest Rate Risk in the Banking Book IMA: Internal Models Approach
Bank of New Zealand (BNZ) is regulated by the Reserve Bank of New Zealand (RBNZ). Credit risk exposures consolidated in the Group position are calculated under RBNZ requirements.
The National Australia Bank Group’s subsidiary in the United Kingdom, Clydesdale Bank PLC, is regulated by the Financial Services Authority (FSA). Clydesdale Bank PLC has been accredited to apply the standardised approach to operational and credit risk management in accordance with the regulatory requirements. Credit risk exposures consolidated in this Report are calculated under APRA requirements.
Great Western Bank (GWB) is regulated in the United States of America by the South Dakota Division of Banking, the Federal Deposit Insurance Corporation and the Federal Reserve System.
GWB Credit Risk and Operational Risk risk weighted assets (RWA) are subject to APRA Basel II Standardised methodology. Interest Rate Risk in the Banking Book (IRRBB) RWA relating to GWB was calculated using an interim approach as at 30 September 2011. From 31 December 2011, IRRBB for GWB was calculated using the IRRBB internal model. The net impact of the change was not material.
1.2 APS 330 Disclosure Governance
The National Australia Bank Group’s External Disclosure Policy defines Board and management accountabilities for APS 330 disclosure, including processes and practices to ensure the integrity and timeliness of prudential disclosures and compliance with National Australia Bank Group policies.
The National Australia Bank Group’s Chief Executive Officer attests to the reliability of the Group’s APS 330 disclosures within the annual declaration provided to APRA under Prudential Standard APS 310 Audit and Related Matters.
Basel II Approach
Credit Risk
Operational Risk
Non-TradedMarket Risk
Traded Market Risk
National Australia
Bank Limited
Advanced IRB
AMA IRRBB Standardised and IMA
Bank of New Zealand
Advanced IRB
AMA IRRBB Standardised and IMA
Clydesdale Bank PLC
Standardised Standardised IRRBB n/a
Great Western Bank
Standardised Standardised IRRBB n/a

Scope of Application
5
half year risk and capital report
2020202012121212 2. Scope of Application
APRA measures the National Australia Bank Group’s capital adequacy by assessing financial strength at three levels:
- Level 1: comprises National Australia Bank Limited and its subsidiary entities approved by APRA as part of the Extended Licensed Entity (ELE);
- Level 2: comprises National Australia Bank Limited and the entities it controls, subject to certain exceptions set out below; and
- Level 3: comprises the Conglomerate Group.
This report applies to the Level 2 consolidated Group (the Group).
National Australia Bank Group Consolidation for Regulatory Purposes
The controlled entities in the Group include the Bank of New Zealand, Clydesdale Bank PLC, Great Western Bank and other financial entities (e.g. finance companies and leasing companies).
Life insurance and funds management entities are excluded from the calculation of Basel II RWA and the related controlled entities are deconsolidated from the National Australia Bank Group for the purposes of calculating capital adequacy. Capital adequacy deductions are applied to the investments in, and profits of, these activities.
In addition, certain securitisation special purpose vehicles (SPVs) to which assets have been transferred in accordance with APRA’s requirements as set out in Prudential Standard APS 120 Securitisation (APS 120) have been deconsolidated from the National Australia Bank Group for the purposes of this disclosure. For regulatory purposes credit risk is removed from the sold assets and there is no requirement to hold capital against them.
Differences in Consolidation Arising Between the Regulatory and Accounting Approaches
For financial reporting, the National Australia Bank Group applies the International Financial Reporting Standards (IFRS) and consolidates all entities in which it has the power to govern the financial and operating policies so as to obtain benefit from their activities. This includes life insurance, funds management and securitisation SPVs used to house securitised assets. As noted above, these entities receive a different treatment for Level 2 regulatory consolidation purposes.
A list of material controlled entities included in the consolidated National Australia Bank Group for financial reporting purposes can be found in the National Australia Bank Limited 30 September 2011 Annual Financial Report.
Restrictions on the Transfer of Funds and Regulatory Capital within the National Australia Bank Group
Limits are placed on the level of capital and funding transfers and on the level of exposure (debt and equity) that the National Australia Bank Group may have to a related entity. These limits are subject to the National Australia Bank Group Capital Policy which requires that contagion risk be managed under regulatory requirements (Prudential Standard APS 222 Associations with Related Entities) and the Board’s risk appetite for intra-group exposures.
Each major banking subsidiary works with the National Australia Bank Group to manage capital to target capital ranges recommended by Group Treasury and approved by their local Boards. Any capital transfer is subject to maintaining adequate subsidiary and National Australia Bank Limited capitalisation.
Disclosure 2A: Scope of Application
There were no capital deficiencies in non-consolidated subsidiaries of the Group as at 31 March 2012 or 30 September 2011.
Clydesdale Bank PLC
Clydesdale Bank PLC is a wholly owned subsidiary of National Australia Bank Limited and operates as a regionally autonomous retail and business bank in the United Kingdom. It applies the provisions laid down in the UK Financial Services Authority’s requirements BIPRU 2.1 Solo Consolidation Waiver. This enables some intra-group exposures and investments of Clydesdale Bank PLC in its subsidiaries to be eliminated and the free reserves of such subsidiaries to be aggregated when calculating capital resource requirements of Clydesdale Bank PLC.
Bank of New Zealand
BNZ is a wholly owned subsidiary of National Australia Bank Limited and operates as a regionally autonomous, full-service bank in New Zealand. The BNZ Board is responsible for corporate governance and derives its authority from the Constitution of Bank of New Zealand and applicable New Zealand legislation.
BNZ is subject to the Basel II capital adequacy requirements applicable in New Zealand, mandated by the RBNZ. The capital ratios for BNZ presented in this report have been derived under the RBNZ’s Capital Adequacy Framework (Internal Models Based Approach). Basel II disclosures for BNZ are published under the Disclosure Statement regime applicable to banks incorporated in New Zealand.
National Australia Bank Level 2
National Australia Bank Level 3
Bank of New Zealand
Clydesdale Bank PLC
Great Western Bank
Wealth Managementand Life Insurance
National Australia Bank Limited
Extended Licence Entity Subsidiaries
National Australia Bank Level 1

Regulatory Enviornment
6
half year risk and capital report
2020202012121212 3. Regulatory Environment
Basel Regulatory Reforms
In July 2009, the Basel Committee on Banking Supervision (BCBS) released a package of measures to enhance the Basel II Framework (Basel 2.5).
In support of the Basel II enhancements, APRA amended Prudential Standards APS 111 Capital Adequacy: Measurement of Capital, APS 116 Capital Adequacy Market Risk, APS120 Securitisation, APS 330 Capital Adequacy: Public Disclosure of Prudential Information, and APS 310: Audit and Related Matters, effective 1 January 2012.
The BCBS has also released its reform package for both capital and liquidity (Basel III).
Capital Reforms
In September 2011, APRA released a discussion paper outlining its proposed implementation of the Basel III capital reforms. This was followed by a Basel III response paper and updated draft capital standards in late March 2012. APRA’s broad approach to capital adequacy remains unchanged after the update. The proposals may be subject to amendment prior to final implementation.
As currently drafted, the reforms are estimated to have a net impact on the Group’s Core Tier 1 position of approximately 45 basis points as at 31 March 2012. The impact will vary on each balance date mainly due to accrued earnings and dividend payment dates. Further consultation is expected over 2012. APRA proposes to phase in changes to minimum capital levels from 1 January 2013.
Liquidity Reforms
APRA released its draft liquidity standard and discussion paper on the implementation of the Basel III liquidity reforms in Australia during November 2011. Consultation between APRA, industry and market participants continues.
The Group will gradually transition to the proposed liquidity metrics, including the Liquidity Coverage Ratio (LCR) by January 2015 and the Net Stable Funding Ratio (NSFR) by January 2018. In order to transition to Basel III, the Group will increasingly focus on the quality of the liquidity and stability of the funding that underpins these measures.
In addition, the RBA announced details of its Committed Liquidity Facility (CLF), which is designed to address the shortfall of Level 1 liquid assets within Australia. The CLF will cost participants a fee of 15bps for both drawn and undrawn commitments.
Other Reform Proposals
In addition to the Basel Committee reforms, the Group remains focused on other areas of regulatory change. Key reform proposals that may affect the Group’s capital and funding include:
- APRA’s Level 3 Conglomerate Supervision proposals, which consider capital requirements for the consolidated Banking and Wealth Management Group.
- APRA’s proposed changes to capital adequacy for life and general insurance businesses.
- The potential impacts of the US Dodd-Frank bill on the Group’s US operations and businesses with US connections.
- The UK Independent Commission on Banking, which may affect the structure of banks and the amount of capital held in the UK business.

Capital
7
half year risk and capital report
2020202012121212 4. Capital
Table 4.1A: RWA
The following table provides the Basel II RWA for the Group. As at
31 Mar 12 30 Sep 11
RWA RWA
$m $m
Credit risk (1)
IRB approach
Corporate (including SME) 109,312 112,620
Sovereign 1,290 1,170
Bank 8,179 7,617
Residential mortgage (2) 56,351 51,620
Qualifying revolving retail 4,055 4,377
Retail SME 7,318 8,227
Other retail 3,652 3,594
Total IRB approach 190,157 189,225
Specialised lending (SL) 45,439 41,752
Standardised approach
Australian and foreign governments 81 76
Bank 205 163
Residential mortgage (2) 18,823 23,202
Corporate 29,979 32,863
Other 3,165 3,618
Total standardised approach 52,253 59,922
Other
Securitisation (3) 4,314 9,049
Equity 2,006 1,949
Other (4) 6,016 6,751
Total other 12,336 17,749
Total credit risk 300,185 308,648
Market risk (5) 5,277 2,968
Operational risk 23,810 22,255
Interest rate risk in the banking book 6,281 7,198
Total risk-weighted assets 335,553 341,069
(1) Risk Weighted Assets which are calculated in accordance with APRA’s requirements under Basel II are required to incorporate a scaling factor of 1.06 to assets that are not subject to specific risk weights.
(2) As at 31 December 2011, the Advantedge portfolio was calculated under the APRA Basel II Advanced IRB approach. This resulted in RWA being reclassified from Standardised ‘Residential Mortgage’ to Advanced IRB ‘Residential Mortgage’.
(3) Following a change in treatment, the RWA percentages applied to the credit wrapped ABS exposures have been amended resulting in a reduction of RWA by $3.2 billion. The termination of the remaining two sold protection SCDO derivative exposures reduced RWA by $1.5 billion.
(4) ‘Other’ includes non-lending asset exposures that are not covered in the above categories. Non-lending assets are specifically excluded from credit risk exposures shown on pages 10 to 31 of this report.
(5) The increase in Market Risk RWA as at 31 March 2012 was predominantly driven by the implementation of the revised Prudential Standard APS 116, Capital Adequacy: Market Risk, which became effective 1 January 2012.
Capital
8
half year risk and capital report
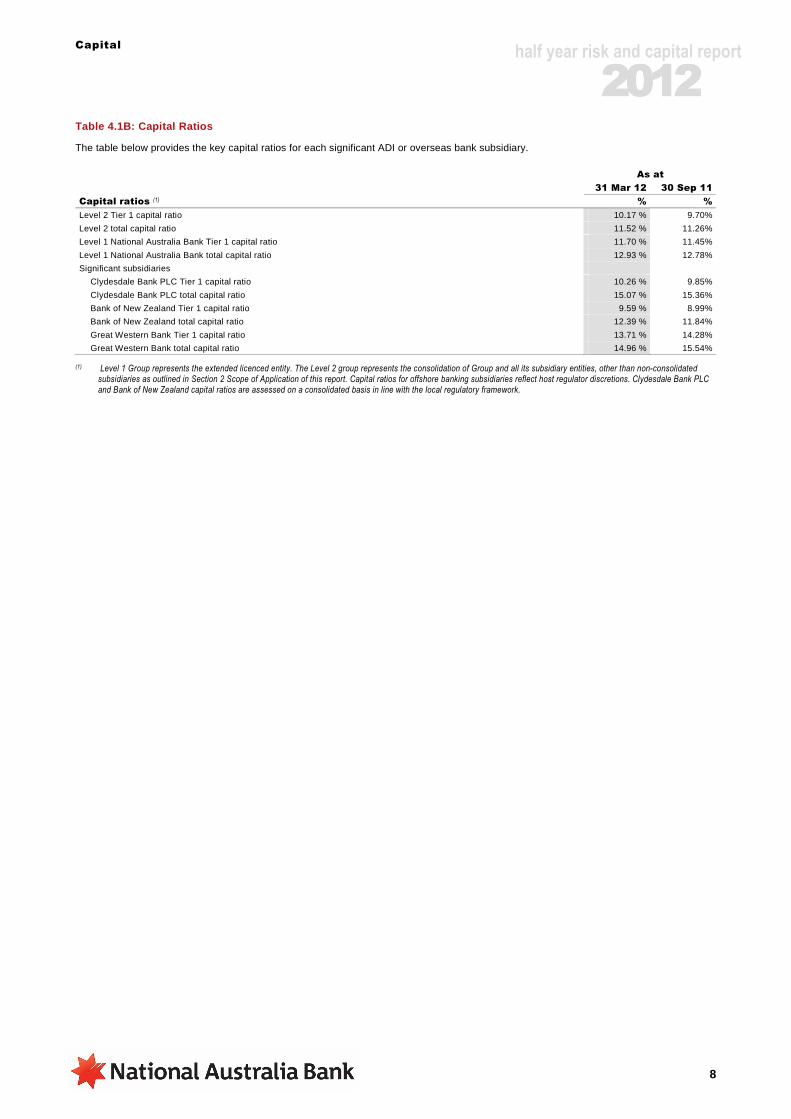
2020202012121212 Table 4.1B: Capital Ratios
The table below provides the key capital ratios for each significant ADI or overseas bank subsidiary. As at
31 Mar 12 30 Sep 11
Capital ratios (1) % %
Level 2 Tier 1 capital ratio 10.17 % 9.70%
Level 2 total capital ratio 11.52 % 11.26%
Level 1 National Australia Bank Tier 1 capital ratio 11.70 % 11.45%
Level 1 National Australia Bank total capital ratio 12.93 % 12.78%
Significant subsidiaries
Clydesdale Bank PLC Tier 1 capital ratio 10.26 % 9.85%
Clydesdale Bank PLC total capital ratio 15.07 % 15.36%
Bank of New Zealand Tier 1 capital ratio 9.59 % 8.99%
Bank of New Zealand total capital ratio 12.39 % 11.84%
Great Western Bank Tier 1 capital ratio 13.71 % 14.28%
Great Western Bank total capital ratio 14.96 % 15.54%
(1) Level 1 Group represents the extended licenced entity. The Level 2 group represents the consolidation of Group and all its subsidiary entities, other than non-consolidated subsidiaries as outlined in Section 2 Scope of Application of this report. Capital ratios for offshore banking subsidiaries reflect host regulator discretions. Clydesdale Bank PLC and Bank of New Zealand capital ratios are assessed on a consolidated basis in line with the local regulatory framework.

Capital
9
half year risk and capital report
2020202012121212 4.2 Capital Structure
Table 4.2A: Capital Structure (1)
As at
31 Mar 12 30 Sep 11
$m $m
Tier 1 capital
Paid-up ordinary share capital 22,361 21,470
Reserves (2,310) (1,612)
Retained earnings including current year earnings 16,282 15,972
Minority interests 38 20
Innovative Tier 1 capital 4,411 4,495
Non-innovative Tier 1 capital 2,742 2,742
Gross Tier 1 capital 43,524 43,087
Deductions from Tier 1 capital
Banking goodwill 1,321 1,695
Wealth management goodwill and other intangibles 4,230 4,253
Deferred tax assets 794 990
Other deductions from Tier 1 capital only 1,815 1,840
50/50 deductions from Tier 1 capital
Investment in non-consolidated controlled entities 827 801
Expected loss in excess of eligible provisions 282 348
Other 142 85
Total Tier 1 capital deductions 9,411 10,012
Net Tier 1 capital 34,113 33,075
Tier 2 capital
Upper Tier 2 capital 710 909
Lower Tier 2 capital 5,173 5,733
Gross Tier 2 capital 5,883 6,642
Deductions from Tier 2 capital
Deductions from Tier 2 capital only 75 75
50/50 deductions from Tier 2 capital
Investment in non-consolidated controlled entities 827 801
Expected loss in excess of eligible provisions 282 348
Other 142 85
Total Tier 2 capital deductions 1,326 1,309
Net Tier 2 capital 4,557 5,333
Total capital 38,670 38,408
(1) Regulatory Capital has been calculated in accordance with APRA definitions in Prudential Standard APS 111 Capital Adequacy: Measurement of Capital. The regulatory approach to calculating capital differs from the accounting approach as defined under IFRS.
Credit Risk
10
half year risk and capital report
2020202012121212 5. Credit Risk
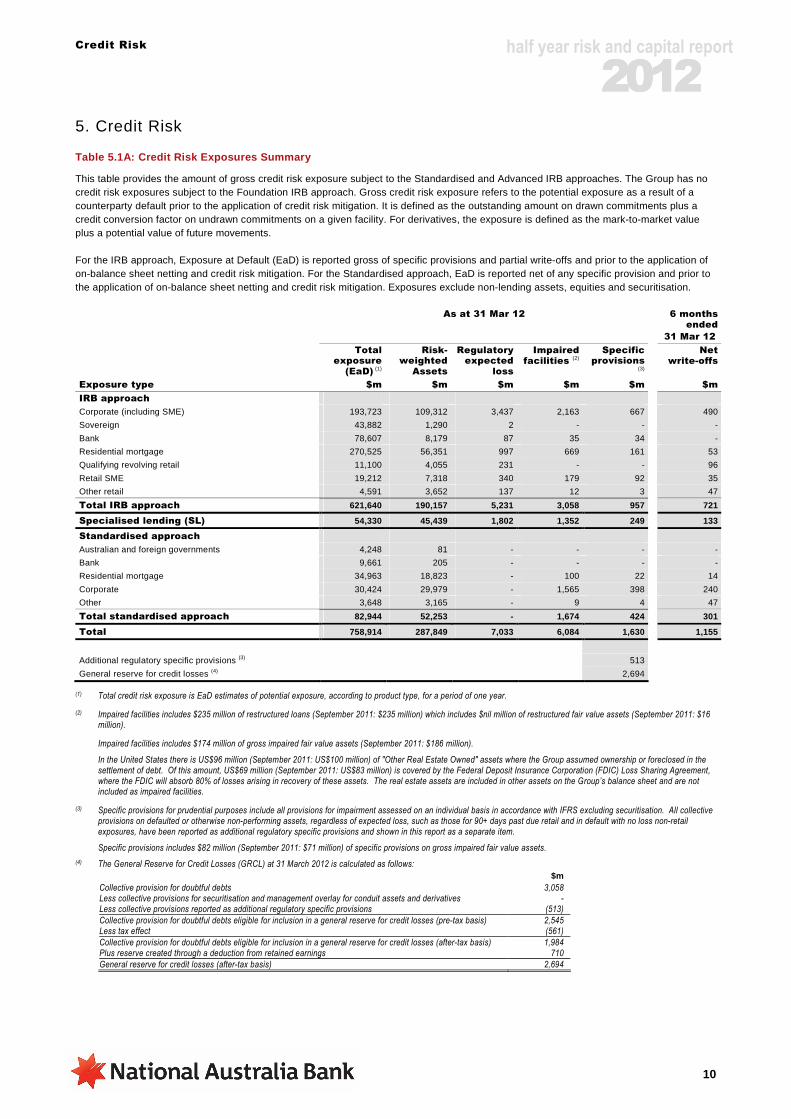
Table 5.1A: Credit Risk Exposures Summary
This table provides the amount of gross credit risk exposure subject to the Standardised and Advanced IRB approaches. The Group has no credit risk exposures subject to the Foundation IRB approach. Gross credit risk exposure refers to the potential exposure as a result of a counterparty default prior to the application of credit risk mitigation. It is defined as the outstanding amount on drawn commitments plus a credit conversion factor on undrawn commitments on a given facility. For derivatives, the exposure is defined as the mark-to-market value plus a potential value of future movements. For the IRB approach, Exposure at Default (EaD) is reported gross of specific provisions and partial write-offs and prior to the application of on-balance sheet netting and credit risk mitigation. For the Standardised approach, EaD is reported net of any specific provision and prior to the application of on-balance sheet netting and credit risk mitigation. Exposures exclude non-lending assets, equities and securitisation.
As at 31 Mar 12
6 months
ended
31 Mar 12
Total
exposure (EaD) (1)
Risk-weighted
Assets
Regulatory expected
loss
Impaired facilities (2)
Specific provisions
(3)
Net write-offs
Exposure type $m $m $m $m $m $m
IRB approach
Corporate (including SME) 193,723 109,312 3,437 2,163 667 490
Sovereign 43,882 1,290 2 - - -
Bank 78,607 8,179 87 35 34 -
Residential mortgage 270,525 56,351 997 669 161 53
Qualifying revolving retail 11,100 4,055 231 - - 96
Retail SME 19,212 7,318 340 179 92 35
Other retail 4,591 3,652 137 12 3 47
Total IRB approach 621,640 190,157 5,231 3,058 957 721
Specialised lending (SL) 54,330 45,439 1,802 1,352 249 133
Standardised approach
Australian and foreign governments 4,248 81 - - - -
Bank 9,661 205 - - - -
Residential mortgage 34,963 18,823 - 100 22 14
Corporate 30,424 29,979 - 1,565 398 240
Other 3,648 3,165 - 9 4 47
Total standardised approach 82,944 52,253 - 1,674 424 301
Total 758,914 287,849 7,033 6,084 1,630 1,155
Additional regulatory specific provisions (3) 513
General reserve for credit losses (4) 2,694
(1) Total credit risk exposure is EaD estimates of potential exposure, according to product type, for a period of one year.
(2) Impaired facilities includes $235 million of restructured loans (September 2011: $235 million) which includes $nil million of restructured fair value assets (September 2011: $16 million).
Impaired facilities includes $174 million of gross impaired fair value assets (September 2011: $186 million).
In the United States there is US$96 million (September 2011: US$100 million) of "Other Real Estate Owned" assets where the Group assumed ownership or foreclosed in the settlement of debt. Of this amount, US$69 million (September 2011: US$83 million) is covered by the Federal Deposit Insurance Corporation (FDIC) Loss Sharing Agreement, where the FDIC will absorb 80% of losses arising in recovery of these assets. The real estate assets are included in other assets on the Group’s balance sheet and are not included as impaired facilities.
(3) Specific provisions for prudential purposes include all provisions for impairment assessed on an individual basis in accordance with IFRS excluding securitisation. All collective provisions on defaulted or otherwise non-performing assets, regardless of expected loss, such as those for 90+ days past due retail and in default with no loss non-retail exposures, have been reported as additional regulatory specific provisions and shown in this report as a separate item.
Specific provisions includes $82 million (September 2011: $71 million) of specific provisions on gross impaired fair value assets.
(4) The General Reserve for Credit Losses (GRCL) at 31 March 2012 is calculated as follows: $m Collective provision for doubtful debts 3,058 Less collective provisions for securitisation and management overlay for conduit assets and derivatives - Less collective provisions reported as additional regulatory specific provisions (513)
Collective provision for doubtful debts eligible for inclusion in a general reserve for credit losses (pre-tax basis) 2,545 Less tax effect (561)
Collective provision for doubtful debts eligible for inclusion in a general reserve for credit losses (after-tax basis) 1,984 Plus reserve created through a deduction from retained earnings 710
General reserve for credit losses (after-tax basis) 2,694

Credit Risk
11
half year risk and capital report
2020202012121212
As at 30 Sep 11
6 months
ended
30 Sep 11
Total
exposure (EaD)
Risk-weighted
Assets
Regulatory expected
loss
Impaired facilities
Specific provisions
Net write-offs
Exposure type $m $m $m $m $m $m
IRB approach
Corporate (including SME) 189,882 112,620 3,345 2,430 691 255
Sovereign 35,881 1,170 41 - - -
Bank 71,438 7,617 88 34 34 -
Residential mortgage 250,960 51,620 828 667 161 69
Qualifying revolving retail 10,978 4,377 240 - - 96
Retail SME 19,656 8,227 352 177 87 43
Other retail 4,590 3,594 143 9 4 50
Total IRB approach 583,385 189,225 5,037 3,317 977 513
Specialised lending (SL) 49,406 41,752 1,703 1,463 287 192
Standardised approach
Australian and foreign governments 4,412 76 - - - -
Bank 10,508 163 - - - -
Residential mortgage 45,533 23,202 - 117 31 10
Corporate 33,202 32,863 - 1,472 243 221
Other 4,095 3,618 - 8 4 22
Total standardised approach 97,750 59,922 - 1,597 278 253
Total 730,541 290,899 6,740 6,377 1,542 958
Additional regulatory specific provisions 454
General reserve for credit losses (1) 2,805
(1) The General Reserve for Credit Losses (GRCL) at 30 September 2011 is calculated as follows: $m Collective provision for doubtful debts 3,398 Less collective provisions for securitisation and management overlay for conduit assets and derivatives (160) Less collective provisions reported as additional regulatory specific provisions (454)
Collective provision for doubtful debts eligible for inclusion in a general reserve for credit losses (pre-tax basis) 2,784 Less tax effect (695)
Collective provision for doubtful debts eligible for inclusion in a general reserve for credit losses (after-tax basis) 2,089 Plus reserve created through a deduction from retained earnings 716
General reserve for credit losses (after-tax basis) 2,805

Credit Risk
12
half year risk and capital report
2020202012121212 Credit Exposures by Measurement Approach
Table 5.1B: Total and Average Credit Risk Exposures
This table provides the amount of credit risk exposures subject to the Standardised and Advanced IRB approaches. Exposures exclude non-lending assets, equities and securitisation. The average credit risk exposure is the sum of the gross credit risk exposure at the beginning of the reporting period plus the gross credit risk exposure at the end of the reporting period divided by two.
As at 31 Mar 12 6 months ended 31
Mar 12
On-balance
sheet exposure
Non-market related
off-balance sheet
Market related
off-balance sheet
Total exposure
Average total
exposure
Exposure type $m $m $m $m
IRB approach
Corporate (including SME) 117,718 45,742 30,263 193,723 191,803
Sovereign 28,033 693 15,156 43,882 39,881
Bank 31,549 935 46,123 78,607 75,023
Residential mortgage 233,896 36,629 - 270,525 260,742
Qualifying revolving retail 5,682 5,418 - 11,100 11,039
Retail SME 15,267 3,945 - 19,212 19,434
Other retail 3,376 1,215 - 4,591 4,591
Total IRB approach 435,521 94,577 91,542 621,640 602,513
Specialised lending (SL) 45,865 6,959 1,506 54,330 51,868
Standardised approach
Australian and foreign governments 4,077 171 - 4,248 4,330
Bank 9,160 26 475 9,661 10,084
Residential mortgage 32,648 2,315 - 34,963 40,248
Corporate 26,269 3,732 423 30,424 31,813
Other 3,479 169 - 3,648 3,872
Total standardised approach 75,633 6,413 898 82,944 90,347
Total 557,019 107,949 93,946 758,914 744,728
As at 30 Sep 11 6 months ended 30
Sep 11
On-balance
sheet exposure
Non-market related
off-balance sheet
Market related
off-balance sheet
Total exposure
Average total
exposure
Exposure type $m $m $m $m
IRB approach
Corporate (including SME) 115,493 45,225 29,164 189,882 183,727
Sovereign 27,104 631 8,146 35,881 31,397
Bank 27,995 920 42,523 71,438 64,831
Residential mortgage 217,224 33,736 - 250,960 245,000
Qualifying revolving retail 5,597 5,381 - 10,978 10,835
Retail SME 15,696 3,960 - 19,656 19,681
Other retail 3,376 1,214 - 4,590 4,566
Total IRB approach 412,485 91,067 79,833 583,385 560,037
Specialised lending (SL) 42,389 5,516 1,501 49,406 48,124
Standardised approach
Australian and foreign governments 4,215 197 - 4,412 3,681
Bank 8,841 13 1,654 10,508 8,631
Residential mortgage 42,904 2,629 - 45,533 43,278
Corporate 28,278 4,370 554 33,202 30,634
Other 3,918 177 - 4,095 6,909
Total standardised approach 88,156 7,386 2,208 97,750 93,133
Total 543,030 103,969 83,542 730,541
701,294

Credit Risk
13
half year risk and capital report
2020202012121212 Table 5.1C: Exposures by Geography
This table provides the total Exposure at Default by booking office where the exposure was transacted. Exposures exclude non-lending assets, equities and securitisation. As at 31 Mar 12
Australia United Kingdom
New Zealand
Other (1) Total exposure
Exposure type $m $m $m $m $m
IRB approach
Corporate (including SME) 143,925 19,630 23,427 6,741 193,723
Sovereign 27,179 2,742 3,910 10,051 43,882
Bank 47,491 18,171 2,817 10,128 78,607
Residential mortgage 246,385 - 24,140 - 270,525
Qualifying revolving retail 11,100 - - - 11,100
Retail SME 17,444 - 1,768 - 19,212
Other retail 2,514 - 2,077 - 4,591
Total IRB approach 496,038 40,543 58,139 26,920 621,640
Specialised lending (SL) 47,141 1,455 4,364 1,370 54,330
Standardised approach
Australian and foreign governments - 1,774 - 2,474 4,248
Bank - 9,405 - 256 9,661
Residential mortgage 1,158 31,798 5 2,002 34,963
Corporate 3,985 22,079 21 4,339 30,424
Other 1,131 2,337 - 180 3,648
Total standardised approach 6,274 67,393 26 9,251 82,944
Total exposure (EaD) 549,453 109,391 62,529 37,541 758,914
(1) ‘Other’ comprises North America and Asia.
As at 30 Sep 11
Australia United Kingdom
New Zealand
Other Total exposure
Exposure type $m $m $m $m $m
IRB approach
Corporate (including SME) 139,772 21,228 23,469 5,413 189,882
Sovereign 22,839 2,002 3,756 7,284 35,881
Bank 41,480 17,534 3,128 9,296 71,438
Residential mortgage 227,342 - 23,618 - 250,960
Qualifying revolving retail 10,978 - - - 10,978
Retail SME 17,821 - 1,835 - 19,656
Other retail 2,527 - 2,063 - 4,590
Total IRB approach 462,759 40,764 57,869 21,993 583,385
Specialised lending (SL) 43,073 1,553 3,407 1,373 49,406
Standardised approach
Australian and foreign governments - 1,983 - 2,429 4,412
Bank - 10,181 - 327 10,508
Residential mortgage 11,970 31,637 4 1,922 45,533
Corporate 4,074 24,819 23 4,286 33,202
Other 1,217 2,685 - 193 4,095
Total standardised approach 17,261 71,305 27 9,157 97,750
Total exposure (EaD) 523,093 113,622 61,303 32,523 730,541

Credit Risk
14
half year risk and capital report
2020202012121212 Table 5.1D: Exposures by Industry
This table provides the distribution of gross credit risk exposures, excluding non-lending assets, equities and securitisation exposures, by major industry type. Industry classifications follow ANZSIC Level 1 classifications (1). As at 31 Mar 12
Accommodation cafes, pubs and
restaurants
Agriculture, forestry,
fishing and mining
Business services
and property services
Commercial property
Construction Finance and
insurance
Manufacturing Personal Residential mortgages
Retail and wholesale
trade
Transport and
storage
Other (2) Total
Exposure type $m $m $m $m $m $m $m $m $m $m $m $m $m
IRB approach
Corporate (including SME) 7,811 33,468 11,230 13,335 7,097 42,983 19,098 388 - 23,371 11,170 23,772 193,723
Sovereign - - - - - 25,798 - - - - - 18,084 43,882
Bank - - - - - 77,703 - - - - - 904 78,607
Residential mortgage - - - - - - - - 270,525 - - - 270,525
Qualifying revolving retail - - - - - - - 11,100 - - - - 11,100
Retail SME 1,058 3,975 2,163 2,261 1,950 757 1,118 106 - 3,286 858 1,680 19,212
Other retail - - - - - - - 4,591 - - - - 4,591
Total IRB approach 8,869 37,443 13,393 15,596 9,047 147,241 20,216 16,185 270,525 26,657 12,028 44,440 621,640
Specialised lending (SL) - 423 132 47,162 503 125 167 - - - 1,560 4,258 54,330
Standardised approach
Australian and foreign governments
- - - 19 - 1,768 - - - - - 2,461 4,248
Bank - - - - - 9,661 - - - - - - 9,661
Residential mortgage - - - - - - - - 34,963 - - - 34,963
Corporate 2,095 3,938 3,104 5,904 834 971 2,919 44 - 3,324 1,201 6,090 30,424
Other 3 5 18 3 9 1 6 3,536 - 13 2 52 3,648
Total standardised approach
2,098 3,943 3,122 5,926 843 12,401 2,925 3,580 34,963 3,337 1,203 8,603 82,944
Total exposure (EaD) 10,967 41,809 16,647 68,684 10,393 159,767 23,308 19,765 305,488 29,994 14,791 57,301 758,914
(1) Exposures are disclosed based on the counterparty to which the Group is exposed to for credit risk, including guarantors and derivative counterparties.
(2) Immaterial categories are grouped collectively under ‘Other’.

Credit Risk
15
half year risk and capital report
2020202012121212 As at 30 Sep 11
Accommodation cafes, pubs and
restaurants
Agriculture, forestry,
fishing and mining
Business services
and property services
Commercial property
Construction Finance and
insurance
Manufacturing Personal Residential mortgages
Retail and wholesale
trade
Transport and
storage
Other Total
Exposure type $m $m $m $m $m $m $m $m $m $m $m $m $m
IRB approach
Corporate (including SME) 7,684 32,363 10,629 17,120 7,076 40,883 18,944 430 - 22,122 10,314 22,317 189,882
Sovereign - - - - - 16,323 - - - - - 19,558 35,881
Bank - - - - - 70,583 - - - - - 855 71,438
Residential mortgage - - - - - - - - 250,960 - - - 250,960
Qualifying revolving retail - - - - - - - 10,978 - - - - 10,978
Retail SME 1,088 3,999 2,213 2,430 1,984 726 1,138 111 - 3,390 880 1,697 19,656
Other retail - - - - - - - 4,590 - - - - 4,590
Total IRB approach 8,772 36,362 12,842 19,550 9,060 128,515 20,082 16,109 250,960 25,512 11,194 44,427 583,385
Specialised lending (SL) 3 239 233 42,789 286 198 173 - - - 1,218 4,267 49,406
Standardised approach
Australian and foreign governments
- - - 36 - 1,536 - - - - - 2,840 4,412
Bank - - - - - 10,508 - - - - - - 10,508
Residential mortgage - - - - - - - - 45,533 - - - 45,533
Corporate 2,314 4,112 3,399 7,087 1,015 1,004 3,257 60 - 3,513 1,257 6,184 33,202
Other 1 2 5 4 3 1 1 3,973 - 5 1 99 4,095
Total standardised approach
2,315 4,114 3,404 7,127 1,018 13,049 3,258 4,033 45,533 3,518 1,258 9,123 97,750
Total exposure (EaD) 11,090 40,715 16,479 69,466 10,364 141,762 23,513 20,142 296,493 29,030 13,670 57,817 730,541
Credit Risk
16
half year risk and capital report
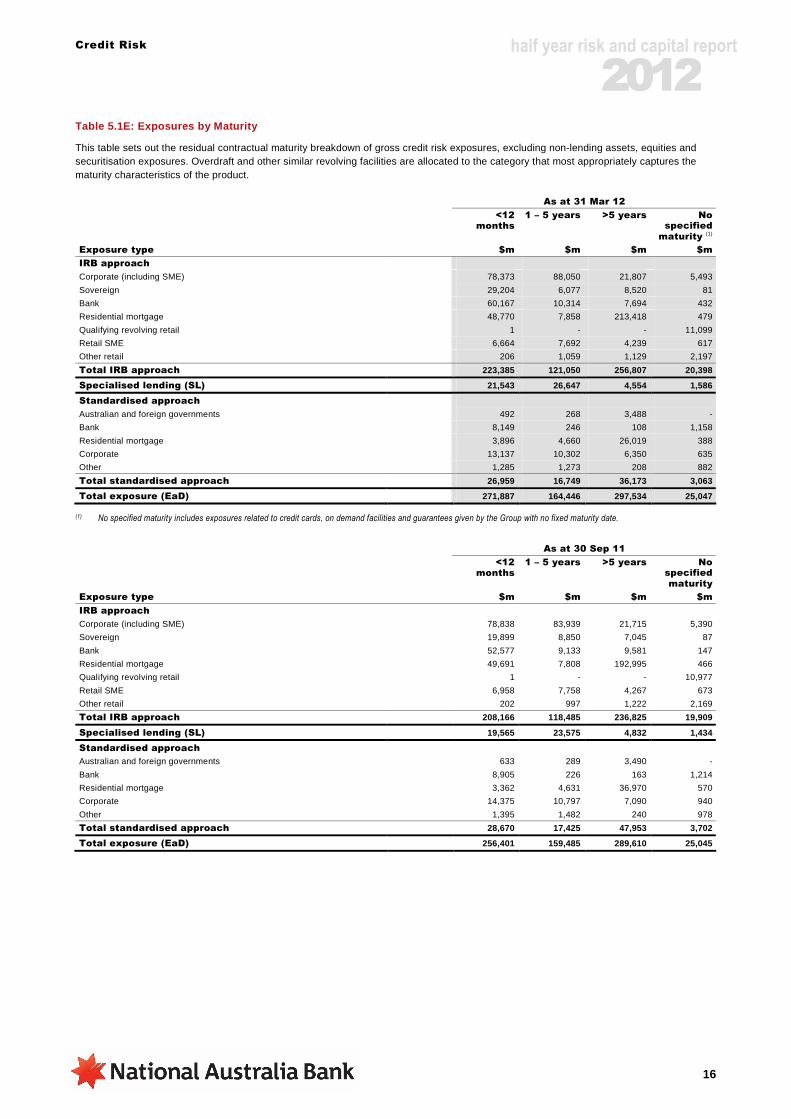
2020202012121212 Table 5.1E: Exposures by Maturity
This table sets out the residual contractual maturity breakdown of gross credit risk exposures, excluding non-lending assets, equities and securitisation exposures. Overdraft and other similar revolving facilities are allocated to the category that most appropriately captures the maturity characteristics of the product. As at 31 Mar 12
<12 months
1 – 5 years >5 years No specified
maturity (1)
Exposure type $m $m $m $m
IRB approach
Corporate (including SME) 78,373 88,050 21,807 5,493
Sovereign 29,204 6,077 8,520 81
Bank 60,167 10,314 7,694 432
Residential mortgage 48,770 7,858 213,418 479
Qualifying revolving retail 1 - - 11,099
Retail SME 6,664 7,692 4,239 617
Other retail 206 1,059 1,129 2,197
Total IRB approach 223,385 121,050 256,807 20,398
Specialised lending (SL) 21,543 26,647 4,554 1,586
Standardised approach
Australian and foreign governments 492 268 3,488 -
Bank 8,149 246 108 1,158
Residential mortgage 3,896 4,660 26,019 388
Corporate 13,137 10,302 6,350 635
Other 1,285 1,273 208 882
Total standardised approach 26,959 16,749 36,173 3,063
Total exposure (EaD) 271,887 164,446 297,534 25,047
(1) No specified maturity includes exposures related to credit cards, on demand facilities and guarantees given by the Group with no fixed maturity date.
As at 30 Sep 11
<12 months
1 – 5 years >5 years No specified maturity
Exposure type $m $m $m $m
IRB approach
Corporate (including SME) 78,838 83,939 21,715 5,390
Sovereign 19,899 8,850 7,045 87
Bank 52,577 9,133 9,581 147
Residential mortgage 49,691 7,808 192,995 466
Qualifying revolving retail 1 - - 10,977
Retail SME 6,958 7,758 4,267 673
Other retail 202 997 1,222 2,169
Total IRB approach 208,166 118,485 236,825 19,909
Specialised lending (SL) 19,565 23,575 4,832 1,434
Standardised approach
Australian and foreign governments 633 289 3,490 -
Bank 8,905 226 163 1,214
Residential mortgage 3,362 4,631 36,970 570
Corporate 14,375 10,797 7,090 940
Other 1,395 1,482 240 978
Total standardised approach 28,670 17,425 47,953 3,702
Total exposure (EaD) 256,401 159,485 289,610 25,045
Credit Risk
17
half year risk and capital report
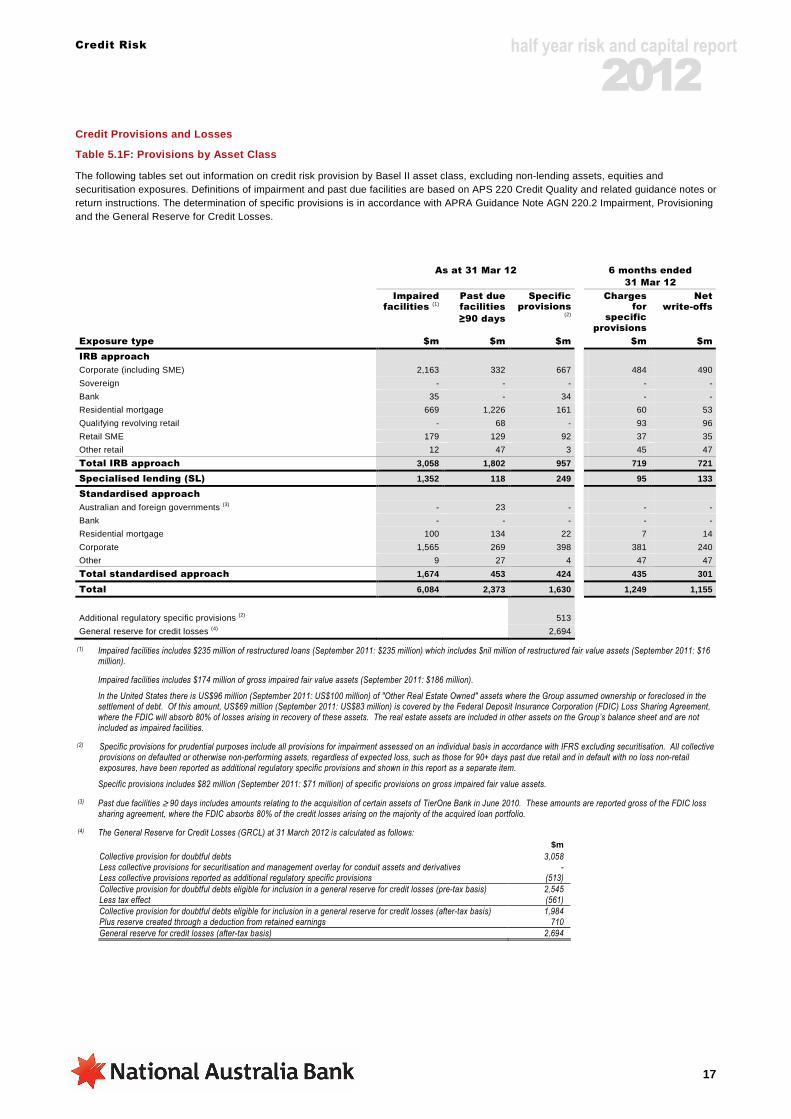
2020202012121212 Credit Provisions and Losses
Table 5.1F: Provisions by Asset Class
The following tables set out information on credit risk provision by Basel II asset class, excluding non-lending assets, equities and securitisation exposures. Definitions of impairment and past due facilities are based on APS 220 Credit Quality and related guidance notes or return instructions. The determination of specific provisions is in accordance with APRA Guidance Note AGN 220.2 Impairment, Provisioning and the General Reserve for Credit Losses. As at 31 Mar 12 6 months ended
31 Mar 12
Impaired facilities (1)
Past due facilities
≥90 days
Specific provisions
(2)
Charges for
specific provisions
Net write-offs
Exposure type $m $m $m $m $m
IRB approach
Corporate (including SME) 2,163 332 667 484 490
Sovereign - - - - -
Bank 35 - 34 - -
Residential mortgage 669 1,226 161 60 53
Qualifying revolving retail - 68 - 93 96
Retail SME 179 129 92 37 35
Other retail 12 47 3 45 47
Total IRB approach 3,058 1,802 957 719 721
Specialised lending (SL) 1,352 118 249 95 133
Standardised approach
Australian and foreign governments (3) - 23 - - -
Bank - - - - -
Residential mortgage 100 134 22 7 14
Corporate 1,565 269 398 381 240
Other 9 27 4 47 47
Total standardised approach 1,674 453 424 435 301
Total 6,084 2,373 1,630 1,249 1,155
Additional regulatory specific provisions (2) 513
General reserve for credit losses (4) 2,694
(1) Impaired facilities includes $235 million of restructured loans (September 2011: $235 million) which includes $nil million of restructured fair value assets (September 2011: $16 million).
Impaired facilities includes $174 million of gross impaired fair value assets (September 2011: $186 million).
In the United States there is US$96 million (September 2011: US$100 million) of "Other Real Estate Owned" assets where the Group assumed ownership or foreclosed in the settlement of debt. Of this amount, US$69 million (September 2011: US$83 million) is covered by the Federal Deposit Insurance Corporation (FDIC) Loss Sharing Agreement, where the FDIC will absorb 80% of losses arising in recovery of these assets. The real estate assets are included in other assets on the Group’s balance sheet and are not included as impaired facilities.
(2) Specific provisions for prudential purposes include all provisions for impairment assessed on an individual basis in accordance with IFRS excluding securitisation. All collective provisions on defaulted or otherwise non-performing assets, regardless of expected loss, such as those for 90+ days past due retail and in default with no loss non-retail exposures, have been reported as additional regulatory specific provisions and shown in this report as a separate item.
Specific provisions includes $82 million (September 2011: $71 million) of specific provisions on gross impaired fair value assets.
(3) Past due facilities ≥ 90 days includes amounts relating to the acquisition of certain assets of TierOne Bank in June 2010. These amounts are reported gross of the FDIC loss sharing agreement, where the FDIC absorbs 80% of the credit losses arising on the majority of the acquired loan portfolio.
(4) The General Reserve for Credit Losses (GRCL) at 31 March 2012 is calculated as follows: $m Collective provision for doubtful debts 3,058 Less collective provisions for securitisation and management overlay for conduit assets and derivatives - Less collective provisions reported as additional regulatory specific provisions (513)
Collective provision for doubtful debts eligible for inclusion in a general reserve for credit losses (pre-tax basis) 2,545 Less tax effect (561)
Collective provision for doubtful debts eligible for inclusion in a general reserve for credit losses (after-tax basis) 1,984 Plus reserve created through a deduction from retained earnings 710
General reserve for credit losses (after-tax basis) 2,694
Credit Risk
18
half year risk and capital report
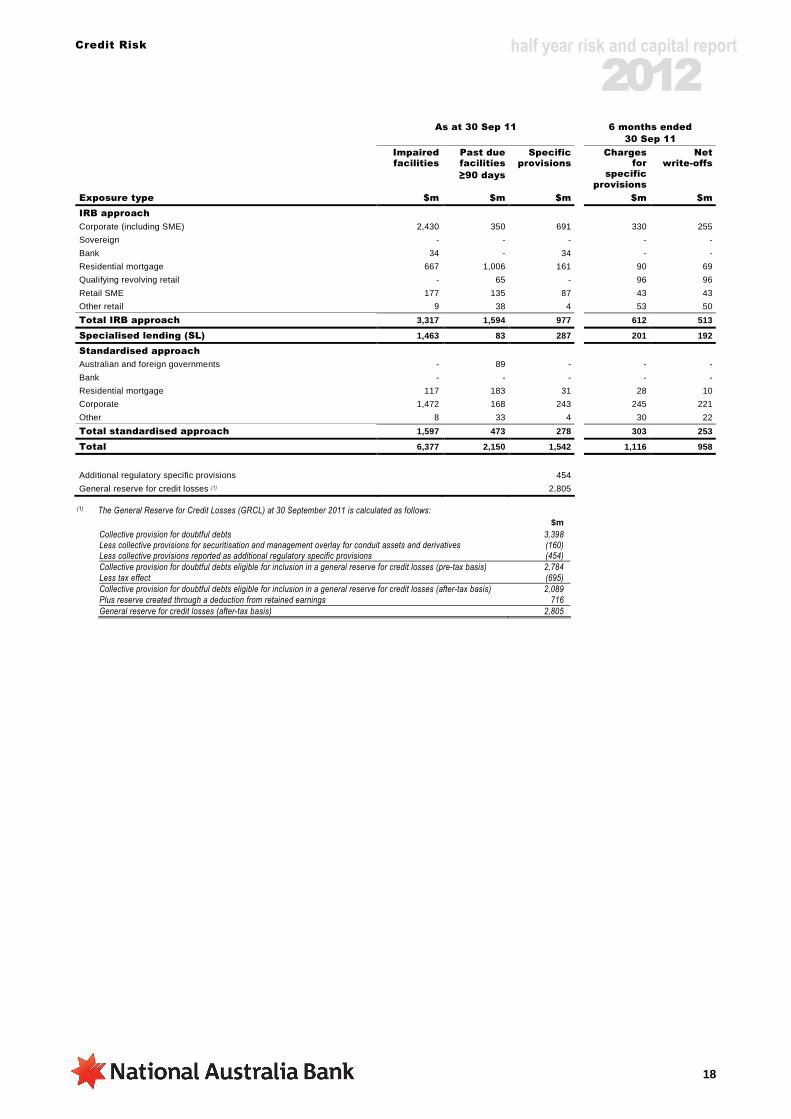
2020202012121212 As at 30 Sep 11 6 months ended
30 Sep 11
Impaired facilities
Past due facilities
≥90 days
Specific provisions
Charges for
specific provisions
Net write-offs
Exposure type $m $m $m $m $m
IRB approach
Corporate (including SME) 2,430 350 691 330 255
Sovereign - - - - -
Bank 34 - 34 - -
Residential mortgage 667 1,006 161 90 69
Qualifying revolving retail - 65 - 96 96
Retail SME 177 135 87 43 43
Other retail 9 38 4 53 50
Total IRB approach 3,317 1,594 977 612 513
Specialised lending (SL) 1,463 83 287 201 192
Standardised approach
Australian and foreign governments - 89 - - -
Bank - - - - -
Residential mortgage 117 183 31 28 10
Corporate 1,472 168 243 245 221
Other 8 33 4 30 22
Total standardised approach 1,597 473 278 303 253
Total 6,377 2,150 1,542 1,116 958
Additional regulatory specific provisions 454
General reserve for credit losses (1) 2,805
(1) The General Reserve for Credit Losses (GRCL) at 30 September 2011 is calculated as follows: $m Collective provision for doubtful debts 3,398 Less collective provisions for securitisation and management overlay for conduit assets and derivatives (160) Less collective provisions reported as additional regulatory specific provisions (454) Collective provision for doubtful debts eligible for inclusion in a general reserve for credit losses (pre-tax basis) 2,784 Less tax effect (695) Collective provision for doubtful debts eligible for inclusion in a general reserve for credit losses (after-tax basis) 2,089 Plus reserve created through a deduction from retained earnings 716
General reserve for credit losses (after-tax basis) 2,805

Credit Risk
19
half year risk and capital report
2020202012121212 Factors Impacting Loss Experience in the Preceding Period
Non-Impaired facilities 90+ Days Past Due
90+ days past due facilities increased modestly during the March 2012 half year, and volumes increased across most divisions.
The increase in 90+ days past due facilities was evident within the IRB Residential Mortgages portfolio, mainly within the Australian geography. The increase was partially driven by the transfer of Advantedge (mortgages) from Basel II Standardised to the Advanced IRB approach.
An increase in 90+ days past due facilities was also observed in the Standardised Corporate portfolio predominately due to the default of UK Banking commercial property facilities.
There was a reduction in 90+ days past due facilities in the Standardised Australian and Foreign Governments portfolio due to the continued work-out strategies and the run-off of the acquired TierOne Bank assets in GWB. All of the 90+ days past due facilities relate to the acquired TierOne Bank assets which are covered by the loss share agreement with the Federal Deposit Insurance Corporation (FDIC).
Impaired facilities
Impaired facilities decreased during the March 2012 half year. The decrease was mainly across all divisions, apart from UK Banking, while Wholesale Banking remained stable.
The largest decrease was experienced in the IRB Corporate (including SME) portfolio predominately driven by the write-offs of large specific defaults in Specialised Group Assets (SGA), Business Banking and BNZ, combined with loans returning to performing or repaid in SGA.
A decrease in impaired facilities was observed in the Specialised Lending portfolio, mainly due to the large write-off and repayment of property facilities in Business Banking and in NAB Wealth.
In the Standardised Corporate portfolio, the increase in impaired facilities reflected the weak market conditions in the UK economy, which have continued to adversely impact the UK property sector.
Charges for specific provisions
In the March 2012 half year, the total charge for specific provisions was higher when compared to the September 2011 half year. This was primarily due to the difficult conditions in the UK economy which has adversely affected performance in the Standardised Corporate and IRB Corporate (including SME) portfolio.
Net Write-Offs
Net write-offs increased from $958 million for the September 2011 half year to $1,155 million for the March 2012 half year. This was largely due to UK related facilities under the IRB Corporate (including SME) portfolio.

Credit Risk
20
half year risk and capital report
2020202012121212 Table 5.1G: Loss Experience
This table represents the regulatory expected loss (which are forward-looking loss estimates) compared to the realised actual losses calculated as an exposure weighted average since Basel II advanced accreditation at 30 September 2008. The table is calculated on an annual basis in the September full year disclosures. Actual losses (net write-offs) measured over the short-term will differ to regulatory expected loss estimates as actual losses are a lag indicator of the quality of the assets in prior periods. Other differences between these measures are: - Actual losses do not take into account modelled economic costs such as internal workout costs factored into estimates of loss;
- Regulatory expected loss is based on the quality of exposures at a point-in-time using long run PDs and stressed LGDs. In most years actual losses would be below the regulatory expected loss estimate; and
- Regulatory expected loss includes expected losses on non-defaulted assets which is a function of long-run PD and downturn stressed LGD. For defaulted exposures, regulatory expected loss is based on the Bank’s best estimate of expected loss.
30 Sep 11
Exposure weighted
average actual loss (net write-
offs) (1)
Exposure weighted
average regulatory expected
loss (2)
$m $m
IRB approach
Corporate 780 2,620
Sovereign - 2
Bank 9 55
Residential mortgage 123 712
Qualifying revolving retail 179 222
Retail SME 85 293
Other retail 104 164
Total IRB approach 1,280 4,068
(1) Calculated as an exposure weighted average of actual losses (net write-offs) experienced through each respective financial year since 30 September 2008.
(2) Calculated as an exposure weighted average of regulatory expected loss at the beginning of each financial year since 30 September 2008.

Credit Risk
21
half year risk and capital report
2020202012121212 Table 5.1H: Provisions by Industry
This table shows provisioning information by industry. Industry classifications follow ANZSIC Level 1 classifications. Totals do not include amounts relating to non-lending assets, equities or securitisation. As at 31 Mar 12 6 months ended
31 Mar 12
Impaired facilities
Past due facilities
≥90 days
Specific provisions
Charges for
specific provisions
Net write-offs
$m $m $m $m $m
Industry sector
Accommodation, cafes, pubs and restaurants 305 63 78 65 63
Agriculture, forestry, fishing and mining 727 84 148 42 33
Business services and property services 234 67 102 39 51
Commercial property 2,564 380 552 410 277
Construction 171 38 58 36 67
Finance and insurance 192 21 101 31 18
Manufacturing 220 43 60 101 107
Personal 20 145 9 172 191
Residential mortgages 769 1,360 183 67 67
Retail and wholesale trade 428 75 187 133 140
Transport and storage 141 38 51 44 37
Other 313 59 101 109 104
Total 6,084 2,373 1,630 1,249 1,155
Additional regulatory specific provision 513
As at 30 Sep 11 6 months ended
30 Sep 11
Impaired facilities
Past due facilities
≥90 days
Specific provisions
Charges for
specific provisions
Net write-offs
$m $m $m $m $m
Industry sector
Accommodation, cafes, pubs and restaurants 322 49 79 90 83
Agriculture, forestry, fishing and mining 706 111 141 (17) (1)
Business services and property services 270 60 98 81 80
Commercial property 2,656 275 450 323 309
Construction 263 44 93 81 41
Finance and insurance 197 100 97 5 6
Manufacturing 218 37 65 29 11
Personal 17 143 10 163 198
Residential mortgages 784 1,189 192 118 79
Retail and wholesale trade 535 81 190 136 79
Transport and storage 110 24 44 40 10
Other 299 37 83 67 63
Total 6,377 2,150 1,542 1,116 958
Additional regulatory specific provision 454

Credit Risk
22
half year risk and capital report
2020202012121212 Table 5.1I: Provisions by Geography
As at 31 Mar 12
Impaired facilities
Past due facilities
≥90 days
Specific provisions
General reserve for
credit losses
$m $m $m $m
Geographic region
Australia 3,687 1,751 991 1,723
United Kingdom 1,827 408 463 1,033
New Zealand 417 169 152 239
Other (1) 153 45 24 63
Total 6,084 2,373 1,630 3,058
Regulatory specific provisions 513 (513)
Less tax effect (561)
Plus reserve created through retained earnings 710
General reserve for credit losses (2) 2,694
(1) ‘Other’ comprises North America and Asia.
(2) The GRCL balance allocated across geographic regions of $3,058 million includes $2,333 million of provisions on loans at amortised cost and $725 million of provisions held on assets at fair value.
As at 30 Sep 11
Impaired facilities
Past due facilities
≥90 days
Specific provisions
General reserve for
credit losses
$m $m $m $m
Geographic region
Australia 3,836 1,547 942 2,069
United Kingdom 1,869 318 397 865
New Zealand 516 158 178 226
Other 156 127 25 78
Total 6,377 2,150 1,542 3,238
Regulatory specific provisions 454 (454)
Less tax effect (695)
Plus reserve created through retained earnings 716
General reserve for credit losses (1) 2,805
(1) The GRCL balance allocated across geographic regions of $3,238 million includes $2,505 million of provisions on loans at amortised cost and $733 million of provisions held on assets at fair value.

Credit Risk
23
half year risk and capital report
2020202012121212 Table 5.1J: Movement in Provisions
This table discloses the movements in the balance of provisions over the reporting period for both specific provisions and the general reserve for credit losses. Totals do not include amounts relating to non-lending assets, equities or securitisation.
6 months
ended
31 Mar 12
6 months ended
30 Sep 11
$m $m
General reserve for credit losses
Collective provision balance at start of period 2,505 2,781
Total charge to income statement for impairment loss 1,107 819
Net transfer to specific provision (1,249) (1,116)
Recoveries - -
Balances written off - -
Acquisition of controlled entities - -
Foreign currency translation and other adjustments (30) 21
Collective provision on loans at amortised cost 2,333 2,505
Plus provisions held on assets at fair value (1) 725 733
Less additional regulatory specific provisions (513) (454)
Less tax effect (561) (695)
Plus reserve created through retained earnings 710 716
General reserve for credit losses 2,694 2,805
Specific provisions
Balance at start of period 1,471 1,295
Net transfer from general reserve for credit losses 1,249 1,116
Bad debts recovered 79 91
Bad debts written off (1,234) (1,049)
Acquisition of controlled entities - -
Foreign currency translation and other adjustments (17) 18
Specific provisions excluding provisions for assets at fair value 1,548 1,471
Specific provisions held on assets at fair value 82 71
Additional regulatory specific provisions 513 454
Total regulatory specific provisions 2,143 1,996
Total provisions 4,837 4,801
(1) Provisions held on assets at fair value are presented gross of $10 million regulatory specific provisions for assets held at fair value (September 2011: $18 million). .

Credit Risk
24
half year risk and capital report
2020202012121212 5.2 Standardised and Supervisory Slotting Portfolios
Table 5.2A: Standardised Exposures by Risk Weight
The following table shows the credit exposure amount before and after risk mitigation in each risk category, subject to the standardised approach. As at 31 Mar 12 As at 30 Sep 11
Credit exposure
before risk mitigation
Credit exposure after risk
mitigation
Credit exposure
before risk mitigation
Credit exposure after risk
mitigation
$m $m $m $m
Standardised approach – risk weights
0% 12,132 12,668 12,550 12,543
20% 1,394 1,370 2,849 1,924
35% 21,363 21,077 27,991 27,965
50% 4,389 4,277 6,957 6,955
75% 2,770 2,762 3,512 3,510
100% 39,440 38,228 42,288 41,241
150% 1,456 1,442 1,603 1,598
Total standardised approach (EaD) (1) 82,944 81,824 97,750 95,736
(1) The Group recognises the mitigation of credit risk as a result of eligible financial collateral and mitigation providers. Eligible financial collateral refers to cash and cash equivalents as defined in APS 112.
Table 5.2B: Standardised Exposures by Risk Grade As at 31 Mar 12 As at 30 Sep 11
Credit exposure
before risk mitigation
Credit exposure after risk
mitigation
Credit exposure
before risk mitigation
Credit exposure after risk
mitigation
Asset class by rating grade $m $m $m $m
Australian and foreign governments
Credit rating grade 1 3,652 4,020 3,702 4,241
Credit rating grade 2 47 47 12 12
Unrated 549 8 698 9
Sub-total 4,248 4,075 4,412 4,262
Bank
Credit rating grade 1 9,018 9,025 9,294 9,171
Credit rating grade 2 386 315 19 19
Credit rating grade 3 39 39 10 10
Unrated 218 24 1,185 161
Sub-total 9,661 9,403 10,508 9,361
Residential mortgage
Unrated 34,963 34,893 45,533 45,457
Sub-total 34,963 34,893 45,533 45,457
Corporate
Credit rating grade 2 48 48 35 35
Unrated 30,376 29,824 33,167 32,591
Sub-total 30,424 29,872 33,202 32,626
Other
Unrated 3,648 3,581 4,095 4,030
Sub-total 3,648 3,581 4,095 4,030
Total standardised approach (EaD) 82,944 81,824 97,750 95,736
Credit Risk
25
half year risk and capital report
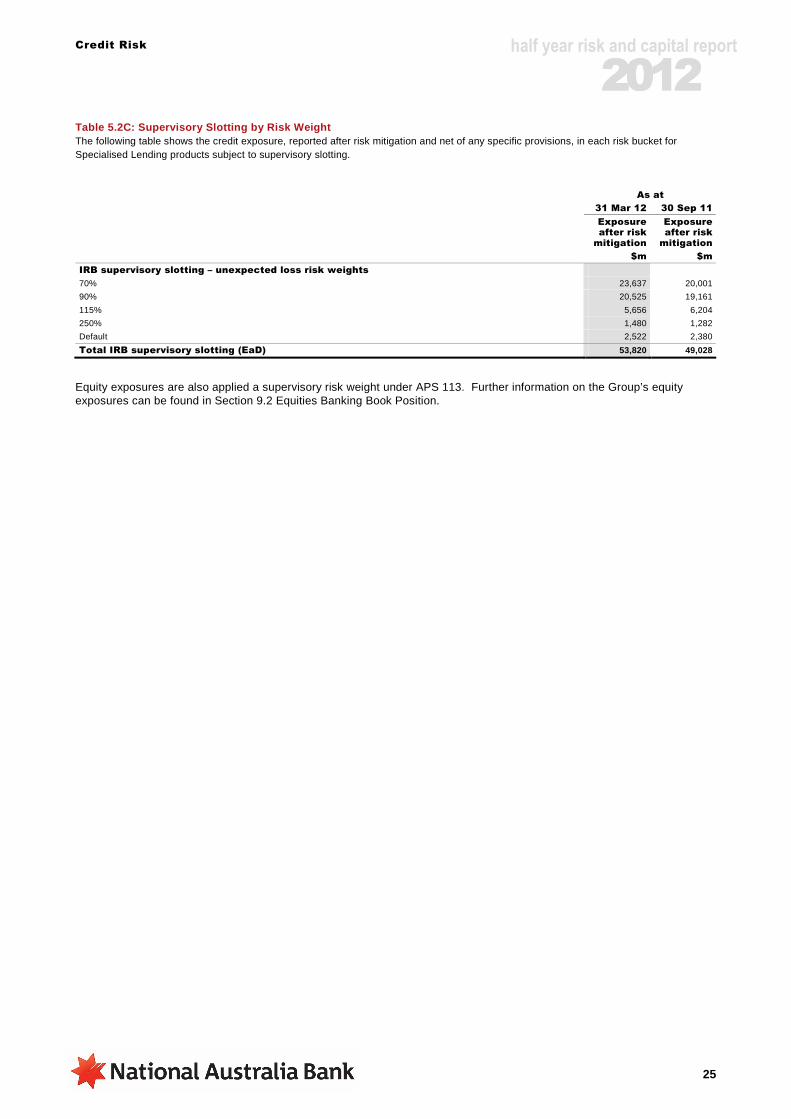
2020202012121212 Table 5.2C: Supervisory Slotting by Risk Weight The following table shows the credit exposure, reported after risk mitigation and net of any specific provisions, in each risk bucket for Specialised Lending products subject to supervisory slotting. As at
31 Mar 12 30 Sep 11
Exposure after risk
mitigation
Exposure after risk
mitigation
$m $m
IRB supervisory slotting – unexpected loss risk weights
70% 23,637 20,001
90% 20,525 19,161
115% 5,656 6,204
250% 1,480 1,282
Default 2,522 2,380
Total IRB supervisory slotting (EaD) 53,820 49,028
Equity exposures are also applied a supervisory risk weight under APS 113. Further information on the Group’s equity exposures can be found in Section 9.2 Equities Banking Book Position.

Credit Risk
26
half year risk and capital report
2020202012121212 5.3 Internal Ratings Based Portfolios
Portfolios Subject to IRB Approach
Table 5.3A: Non-Retail Exposure by Risk Grade
This table provides a breakdown of gross non-retail credit exposures by PD risk grade, categorised into bands that broadly correspond to externally recognised risk grades. Moody’s risk grades have been included as a reference point. Exposures have been categorised into PD grades as assessed by the Group’s own internal ratings system and exclude non-lending assets, equities, securitisation and specialised lending. As at 31 Mar 12
PD risk grade mapping
External credit rating equivalent Aa3 and above
A1, A2, A3 Baa1, Baa2, Baa3
Ba1, Ba2, Ba3
B1, B2 B2 and below
Default
0<0.03% 0.03<0.15% 0.15<0.5% 0.5<3.0% 3.0<10.0% 10.0<100% 100%
IRB approach $m $m $m $m $m $m $m
Total exposure
Corporate 1,734 37,153 59,468 70,513 18,594 1,252 5,009
Sovereign 39,856 3,917 71 25 13 - -
Bank 30,323 44,245 2,736 1,203 20 9 71
Total exposure (EaD) 71,913 85,315 62,275 71,741 18,627 1,261 5,080
Undrawn commitments
Corporate 1,119 10,189 14,358 11,407 1,990 80 278
Sovereign 417 242 20 7 2 - -
Bank 359 326 89 21 - - -
Total undrawn commitments (1) 1,895 10,757 14,467 11,435 1,992 80 278
IRB approach
Exposure weighted average EaD ($m) (2)
Corporate 0.71 1.24 0.59 0.28 0.23 0.18 0.58
Sovereign 24.71 1.64 0.40 0.04 0.19 - -
Bank 3.81 1.85 1.55 1.98 0.33 5.68 5.88
Exposure weighted average LGD (%)
Corporate 51.0 % 39.7 % 35.6 % 33.6 % 34.7 % 38.9 % 45.5 %
Sovereign 4.4 % 27.2 % 53.9 % 44.2 % 44.4 % - -
Bank 36.7 % 27.4 % 35.6 % 21.0 % 42.0 % - 59.6 %
Exposure weighted average risk weight (%)
Corporate 20.9 % 25.4 % 42.6 % 67.5 % 97.6 % 189.9 % 120.7 %
Sovereign 0.9 % 21.9 % 65.8 % 95.6 % 154.5 % - -
Bank 8.2 % 9.3 % 40.7 % 34.8 % 164.8 % - 2.3 %
(1) Total undrawn commitments are included in the calculation of Total Exposures (EaD) shown above.
(2) Simple average of exposure by number of arrangements.

Credit Risk
27
half year risk and capital report
2020202012121212 As at 30 Sep 11
PD risk grade mapping
External credit rating equivalent
Aa3 and above
A1, A2, A3 Baa1, Baa2, Baa3
Ba1, Ba2, Ba3
B1, B2 B2 and below
Default
0<0.03% 0.03<0.15% 0.15<0.5% 0.5<3.0% 3.0<10.0% 10.0<100% 100%
IRB approach $m $m $m $m $m $m $m
Total exposure
Corporate 1,229 32,353 58,105 70,078 21,352 1,868 4,897
Sovereign 32,414 3,326 17 27 10 - 87
Bank 26,864 39,683 4,183 589 40 9 70
Total exposure (EaD) 60,507 75,362 62,305 70,694 21,402 1,877 5,054
Undrawn commitments
Corporate 374 10,496 14,147 10,626 2,475 197 245
Sovereign 381 234 3 6 - - 1
Bank 367 363 103 8 - - -
Total undrawn commitments 1,122 11,093 14,253 10,640 2,475 197 246
IRB approach
Exposure weighted average EaD
($m)
Corporate 0.55 1.03 0.60 0.28 0.25 0.25 0.56
Sovereign 20.69 1.37 0.10 0.04 0.17 - 3.02
Bank 2.37 1.90 2.18 1.33 0.81 1.96 4.14
Exposure weighted average LGD (%)
Corporate 52.4 % 43.0 % 34.7 % 34.2 % 36.3 % 40.1 % 46.1 %
Sovereign 4.9 % 34.1 % 44.5 % 44.2 % 44.6 % - 45.0 %
Bank 38.3 % 28.9 % 30.8 % 40.6 % 59.6 % - 59.6 %
Exposure weighted average risk weight (%)
Corporate 19.7 % 27.0 % 40.7 % 68.5 % 103.6 % 195.7 % 126.5 %
Sovereign 1.0 % 24.3 % 45.0 % 97.0 % 154.7 % - -
Bank 8.4 % 8.6 % 34.1 % 76.9 % 188.5 % - 2.6 %

Credit Risk
28
half year risk and capital report
2020202012121212 Table 5.3B: Retail Exposure by Risk Grade
This table provides a break down of gross retail credit exposures by PD risk grade, categorised into bands that broadly correspond to externally recognised risk grades, ranging from Super Senior Investment Grade to Defaulted exposures. Exposures exclude non-lending assets, equities and securitisation.
As at 31 Mar 12
PD risk grade mapping
0<0.1% 0.1<0.3% 0.3<0.5% 0.5<3.0% 3.0<10.0% 10.0<100% 100%
IRB approach $m $m $m $m $m $m $m
Total exposure
Residential mortgage 51,950 76,596 32,513 85,720 17,535 3,939 2,272
Qualifying revolving retail 3,499 2,617 744 2,396 1,436 341 67
Retail SME 131 821 3,109 11,382 2,729 463 577
Other retail 796 809 310 1,451 953 204 68
Total exposure (EaD) 56,376 80,843 36,676 100,949 22,653 4,947 2,984
Undrawn commitments
Residential mortgage 14,147 12,674 4,570 4,889 327 16 6
Qualifying revolving retail 2,687 1,696 311 538 165 20 1
Retail SME 105 234 1,022 1,841 242 26 55
Other retail 562 261 73 215 92 11 1
Total undrawn commitments (1) 17,501 14,865 5,976 7,483 826 73 63
IRB approach
Exposure weighted average EaD ($m) (2)
Residential mortgage 0.05 0.25 0.26 0.24 0.29 0.32 0.19
Qualifying revolving retail 0.01 0.01 0.01 0.01 0.01 0.01 0.01
Retail SME 0.01 0.04 0.04 0.04 0.03 0.04 0.03
Other retail small 0.01 0.01 0.01 0.01 small 0.01
Exposure weighted average LGD (%)
Residential mortgage 20.0 % 20.0 % 19.9 % 20.4 % 20.0 % 20.0 % 20.8 %
Qualifying revolving retail 83.4 % 84.1 % 85.4 % 86.5 % 87.1 % 87.4 % 89.1 %
Retail SME 30.5 % 22.4 % 26.9 % 30.5 % 32.5 % 34.7 % 41.9 %
Other retail 83.1 % 80.8 % 80.8 % 79.2 % 77.8 % 76.8 % 75.4 %
Exposure weighted average risk weight (%)
Residential mortgage 3.6 % 7.8 % 14.7 % 27.9 % 67.1 % 105.9 % 169.5 %
Qualifying revolving retail 3.9 % 9.0 % 18.0 % 41.6 % 112.2 % 230.2 % 228.7 %
Retail SME 6.3 % 10.9 % 19.5 % 33.8 % 50.5 % 78.3 % 178.2 %
Other retail 12.7 % 30.0 % 56.5 % 92.9 % 121.2 % 176.6 % 397.2 %
(1) Total undrawn commitments are included in the calculation of Total Exposures (EaD) shown above.
(2) Simple average of exposure by number of arrangements.

Credit Risk
29
half year risk and capital report
2020202012121212
As at 30 Sep 11
PD risk grade mapping
0<0.1% 0.1<0.3% 0.3<0.5% 0.5<3.0% 3.0<10.0% 10.0<100% 100%
IRB approach $m $m $m $m $m $m $m
Total exposure
Residential mortgage 36,895 75,579 30,323 89,625 14,411 2,145 1,982
Qualifying revolving retail 3,300 2,276 1,079 2,343 1,444 478 58
Retail SME 70 505 2,897 11,932 3,246 455 551
Other retail 771 803 270 1,366 1,068 249 63
Total exposure (EaD) 41,036 79,163 34,569 105,266 20,169 3,327 2,654
Undrawn commitments
Residential mortgage 11,459 12,644 3,671 5,727 224 4 7
Qualifying revolving retail 2,570 1,356 669 570 182 33 1
Retail SME 13 161 985 1,972 312 28 52
Other retail 549 267 71 212 86 28 1
Total undrawn commitments 14,591 14,428 5,396 8,481 804 93 61
IRB approach
Exposure weighted average EaD
($m)
Residential mortgage 0.04 0.26 0.23 0.25 0.30 0.36 0.19
Qualifying revolving retail 0.01 0.01 0.01 0.01 0.01 0.01 0.01
Retail SME 0.04 0.04 0.04 0.04 0.03 0.04 0.03
Other retail small 0.01 small 0.01 0.01 small 0.01
Exposure weighted average LGD (%)
Residential mortgage 20.0 % 20.0 % 19.9 % 20.3 % 19.9 % 20.0 % 21.1 %
Qualifying revolving retail 83.4 % 84.2 % 84.6 % 86.5 % 87.2 % 87.6 % 88.4 %
Retail SME 24.2 % 26.4 % 30.3 % 33.2 % 34.9 % 36.8 % 43.4 %
Other retail 79.8 % 78.4 % 78.8 % 78.3 % 76.7 % 71.4 % 66.2 %
Exposure weighted average risk weight (%)
Residential mortgage 3.6 % 8.2 % 14.9 % 27.4 % 66.1 % 105.9 % 163.5 %
Qualifying revolving retail 4.0 % 8.5 % 17.1 % 42.0 % 112.7 % 226.9 % 297.1 %
Retail SME 5.7 % 13.5 % 22.1 % 36.8 % 54.2 % 83.4 % 177.9 %
Other retail 12.4 % 29.5 % 54.8 % 92.0 % 119.9 % 161.6 % 276.2 %

Credit Risk
30
half year risk and capital report
2020202012121212 5.4 Credit Risk MitigationTable 5.4A: Mitigation by Eligible Collateral
This table discloses the total credit exposures subject to the standardised and supervisory slotting criteria approaches which are covered by eligible financial collateral. Exposures exclude non-lending assets, equities and securitisation. As at 31 Mar 12
Total exposure
of which is covered by
eligible financial
collateral (1)
$m $m
Specialised lending (SL) 54,330 510
Standardised approach
Australian and foreign governments 4,248 173
Bank 9,661 258
Residential mortgage 34,963 70
Corporate 30,424 552
Other 3,648 67
Total standardised approach 82,944 1,120
(1) Eligible financial collateral, when used to reduce levels of exposure, refers to cash and cash equivalents as defined in APS 112. Exposures covered by eligible financial collateral are measured after the application of regulatory haircuts.
As at 30 Sep 11
Total exposure
of which is covered by
eligible financial
collateral
$m $m
Specialised lending (SL) 49,406 378
Standardised approach
Australian and foreign governments 4,412 150
Bank 10,508 1,147
Residential mortgage 45,533 76
Corporate 33,202 576
Other 4,095 65
Total standardised approach 97,750 2,014

Credit Risk
31
half year risk and capital report
2020202012121212
Table 5.4B: Mitigation by Guarantees and Credit Der ivatives
This table discloses the total credit exposures which are covered by the guarantees and credit derivatives relating to each portfolio. Exposures exclude non-lending assets, equities and securitisation. As at 31 Mar 12
Total exposure
of which is covered by guarantees
of which is covered by
credit derivatives
$m $m $m
IRB approach
Corporate (including SME) 193,723 23,003 -
Sovereign 43,882 2 -
Bank 78,607 221 713
Residential mortgage 270,525 - -
Qualifying revolving retail 11,100 - -
Retail SME 19,212 - -
Other retail 4,591 - -
Total IRB approach 621,640 23,226 713
Specialised lending (SL) 54,330 - -
Standardised approach
Australian and foreign governments 4,248 541 -
Bank 9,661 195 -
Residential mortgage 34,963 - -
Corporate 30,424 - -
Other 3,648 - -
Total standardised approach 82,944 736 -
As at 30 Sep 11
Total exposure
of which is covered by guarantees
of which is covered by
credit derivatives
$m $m $m
IRB approach
Corporate (including SME) 189,882 21,277 -
Sovereign 35,881 2 -
Bank 71,438 264 1,331
Residential mortgage 250,960 - -
Qualifying revolving retail 10,978 - -
Retail SME 19,656 - -
Other retail 4,590 - -
Total IRB approach 583,385 21,543 1,331
Specialised lending (SL) 49,406 - -
Standardised approach
Australian and foreign governments 4,412 689 -
Bank 10,508 227 -
Residential mortgage 45,533 - -
Corporate 33,202 - -
Other 4,095 - -
Total standardised approach 97,750 916 -

Securitisation
32
half year risk and capital report
2020202012121212 6. Securitisation
The format of this section has been updated since 30 September 2011 to reflect the requirements of the revised Prudential Standard APS 330 which became effective 1 January 2012.
Trading book securitisation exposures are not material at a Group level. As such, these exposures are included in the tables below and are not separately disclosed within this document.
6.1 Third Party Securitisation This section provides information about assets that the Group manages as securitisations for third parties (clients) and for any retained exposure to assets securitised by the Group.
Table 6.1A: Total Securitisation Exposures
This table shows the amount of securitisation exposures by facility and provides an indication of the relative extent to which the Group has exposure to each type of asset within the securitisation SPV. This table does not provide information on Group assets that have been sold to securitisations. As at 31 Mar 12
Total outstanding exposures
Originating ADI
Non-originating
ADI exposures
Directly originated
assets
Indirectly originated
assets
ABCP facilities provided
Other (manager services)
$m $m $m $m $m
Underlying asset
Residential mortgage 10,018 25 - 1,006 1,535
Credit cards and other personal loans - - - 47 -
Auto and equipment finance 668 - - 13 -
CDOs/CLOs (1) - - - - 1,317
Commercial loans - - - - -
Commercial mortgages 22 - - - 513
Corporate bonds - - - - 716
Other 650 - - - 461
Total underlying asset 11,358 25 - 1,066 4,542
(1) As at 31 March 2012, all exposures are traditional securitisations, where the pool of assets is assigned to an SPV, usually by a sale.
As at 30 Sep 11
Total outstanding exposures
Originating ADI
Non-originating
ADI exposures
Directly originated
assets
Indirectly originated
assets
ABCP facilities provided
Other (manager services)
$m $m $m $m $m
Underlying asset
Residential mortgage 9,609 60 - 1,210 1,915
Credit cards and other personal loans - - - 47 -
Auto and equipment finance 154 - - 23 -
CDOs/CLOs (1) 600 - - - 1,528
Commercial loans - - - - -
Commercial mortgages 54 - - - 587
Corporate bonds - - - - 714
Other 1,096 - - - 606
Total underlying asset 11,513 60 - 1,280 5,350
(1) The CDO/CLO non-originating ADI exposures are synthetic securitisations, where the risk of the pool of assets is transferred to an SPV through a derivative, usually a credit default swap. These exposures were terminated in March 2012. All other exposures are traditional securitisations, where the pool of assets is assigned to an SPV, usually by a sale.

Securitisation
33
half year risk and capital report
2020202011112222 Table 6.1B: Type of Exposure
The table below breaks down the securitisation exposures by type of facility as defined in the Glossary.
As at 31 Mar 12 As at 30 Sept 11
On-balance
sheet
Off-balance
sheet Total
On-balance
sheet
Off-balance
sheet Total
$m $m $m $m $m $m
Securitisation exposure type
Liquidity facilities 23 1,944 1,967 41 1,556 1,597
Warehouse facilities 9,952 1,002 10,954 10,200 1,495 11,695
Credit enhancements 12 56 68 - - -
Derivative transactions 236 - 236 133 - 133
Securities 32 - 32 278 - 278
Credit derivatives transactions - - - 600 - 600
Other 3,764 - 3,764 3,235 699 3,934
Total securitisation exposures 14,019 3,002 17,021 14,487 3,750 18,237
Table 6.1C: New Facilities Provided
The table below shows new securitisation facilities provided in the six months to reporting date.
Notional amount of facilities provided
6 months ended
31 Mar 12
6 months ended
30 Sep 11
$m $m
Securitisation exposure type
Liquidity facilities 23 133
Warehouse facilities 815 1,949
Credit enhancements 66 -
Derivative transactions 104 14
Securities - 231
Credit derivatives transactions - -
Other 932 1,347
Total new facilities provided 1,940 3,674
Securitisation
34
half year risk and capital report
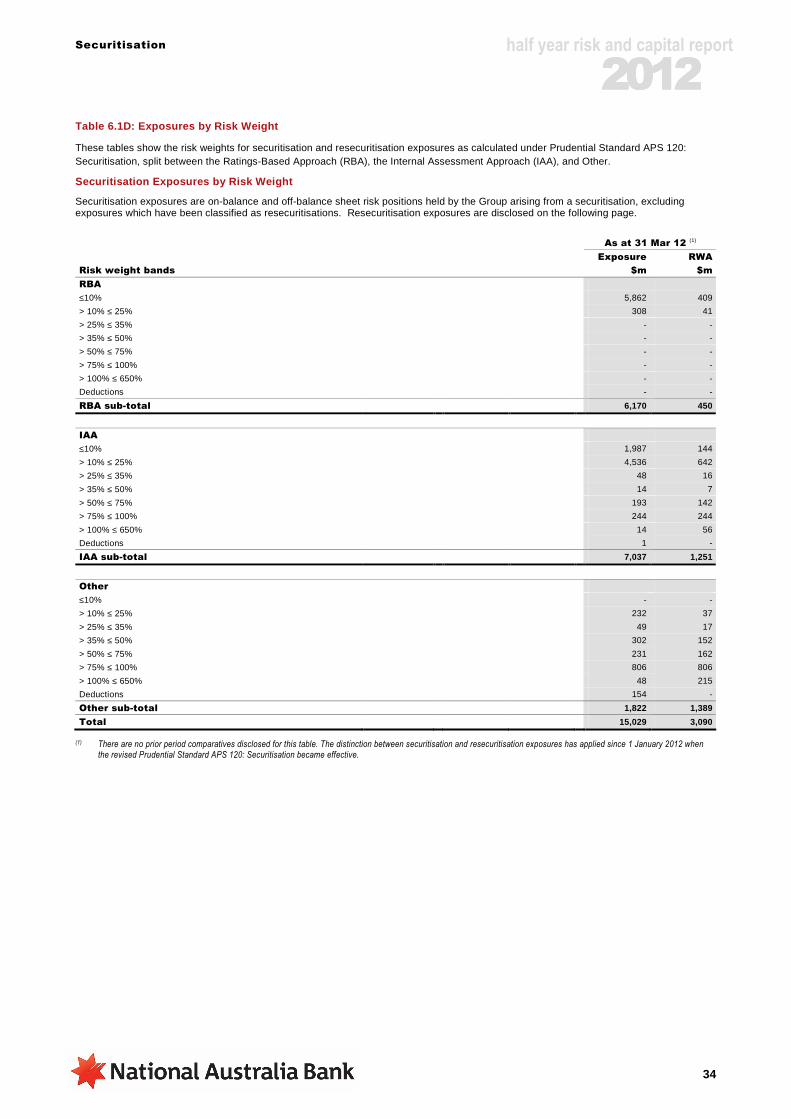
2020202011112222 Table 6.1D: Exposures by Risk Weight
These tables show the risk weights for securitisation and resecuritisation exposures as calculated under Prudential Standard APS 120: Securitisation, split between the Ratings-Based Approach (RBA), the Internal Assessment Approach (IAA), and Other.
Securitisation Exposures by Risk Weight
Securitisation exposures are on-balance and off-balance sheet risk positions held by the Group arising from a securitisation, excluding exposures which have been classified as resecuritisations. Resecuritisation exposures are disclosed on the following page.
As at 31 Mar 12 (1)
Exposure RWA
Risk weight bands $m $m
RBA
≤10% 5,862 409
> 10% ≤ 25% 308 41
> 25% ≤ 35% - -
> 35% ≤ 50% - -
> 50% ≤ 75% - -
> 75% ≤ 100% - -
> 100% ≤ 650% - -
Deductions - -
RBA sub-total 6,170 450
IAA
≤10% 1,987 144
> 10% ≤ 25% 4,536 642
> 25% ≤ 35% 48 16
> 35% ≤ 50% 14 7
> 50% ≤ 75% 193 142
> 75% ≤ 100% 244 244
> 100% ≤ 650% 14 56
Deductions 1 -
IAA sub-total 7,037 1,251
Other
≤10% - -
> 10% ≤ 25% 232 37
> 25% ≤ 35% 49 17
> 35% ≤ 50% 302 152
> 50% ≤ 75% 231 162
> 75% ≤ 100% 806 806
> 100% ≤ 650% 48 215
Deductions 154 -
Other sub-total 1,822 1,389
Total 15,029 3,090
(1) There are no prior period comparatives disclosed for this table. The distinction between securitisation and resecuritisation exposures has applied since 1 January 2012 when the revised Prudential Standard APS 120: Securitisation became effective.
Securitisation
35
half year risk and capital report
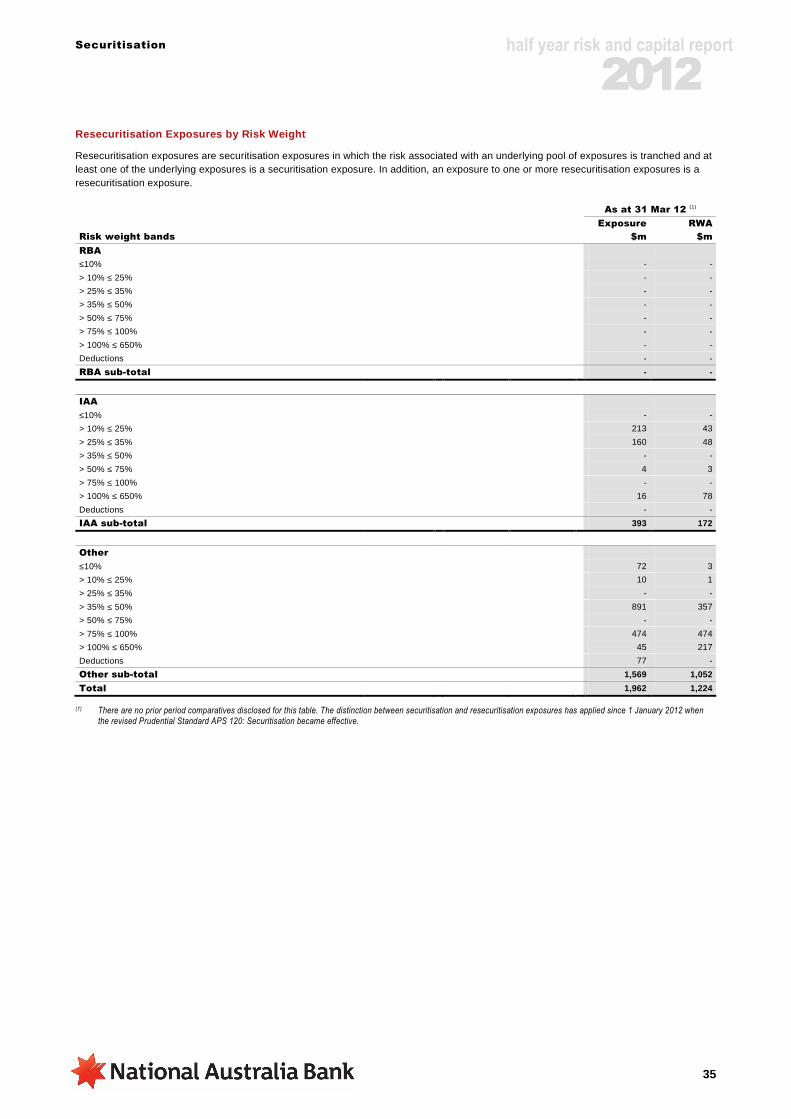
2020202011112222 Resecuritisation Exposures by Risk Weight
Resecuritisation exposures are securitisation exposures in which the risk associated with an underlying pool of exposures is tranched and at least one of the underlying exposures is a securitisation exposure. In addition, an exposure to one or more resecuritisation exposures is a resecuritisation exposure. As at 31 Mar 12 (1)
Exposure RWA
Risk weight bands $m $m
RBA
≤10% - -
> 10% ≤ 25% - -
> 25% ≤ 35% - -
> 35% ≤ 50% - -
> 50% ≤ 75% - -
> 75% ≤ 100% - -
> 100% ≤ 650% - -
Deductions - -
RBA sub-total - -
IAA
≤10% - -
> 10% ≤ 25% 213 43
> 25% ≤ 35% 160 48
> 35% ≤ 50% - -
> 50% ≤ 75% 4 3
> 75% ≤ 100% - -
> 100% ≤ 650% 16 78
Deductions - -
IAA sub-total 393 172
Other
≤10% 72 3
> 10% ≤ 25% 10 1
> 25% ≤ 35% - -
> 35% ≤ 50% 891 357
> 50% ≤ 75% - -
> 75% ≤ 100% 474 474
> 100% ≤ 650% 45 217
Deductions 77 -
Other sub-total 1,569 1,052
Total 1,962 1,224
(1) There are no prior period comparatives disclosed for this table. The distinction between securitisation and resecuritisation exposures has applied since 1 January 2012 when the revised Prudential Standard APS 120: Securitisation became effective.

Securitisation
36
half year risk and capital report
2020202011112222 Total Exposures by Risk Weight
This table is the sum of the tables ‘Securitisation Exposures by Risk Weight’ and ‘Resecuritisation Exposures by Risk Weight’ disclosed on the previous pages. As at 31 Mar 12 As at 30 Sep 11
Exposure RWA Exposure RWA
Risk weight bands (1) $m $m $m $m
RBA
≤10% 5,862 409 6,245 437
> 10% ≤ 25% 308 41 311 37
> 25% ≤ 35% - - - -
> 35% ≤ 50% - - - -
> 50% ≤ 75% - - - -
> 75% ≤ 100% - - - -
> 100% ≤ 650% - - - -
Deductions - - - -
RBA sub-total 6,170 450 6,556 474
IAA
≤10% 1,987 144 1,782 126
> 10% ≤ 25% 4,749 685 4,646 658
> 25% ≤ 35% 208 64 38 12
> 35% ≤ 50% 14 7 14 7
> 50% ≤ 75% 197 145 235 168
> 75% ≤ 100% 244 244 249 249
> 100% ≤ 650% 30 134 20 55
Deductions 1 - 5 -
IAA sub-total 7,430 1,423 6,989 1,275
Other
≤10% 72 3 - -
> 10% ≤ 25% 242 38 844 167
> 25% ≤ 35% 49 17 134 47
> 35% ≤ 50% 1,193 509 901 452
> 50% ≤ 75% 231 162 176 130
> 75% ≤ 100% 1,280 1,280 1,298 1,298
> 100% ≤ 650% 93 432 1,170 5,206
Deductions 231 - 135 -
Other sub-total 3,391 2,441 4,658 7,300
Total 16,991 4,314 18,203 9,049
(1) 31 March 2012 balances are calculated under the revised Prudential Standard APS 120: Securitisation, which became effective 1 January 2012. 30 September 2011 prior period comparatives are calculated under the previous version of Prudential Standard APS 120: Securitisation.

Securitisation
37
half year risk and capital report
2020202011112222 Table 6.1E: Exposures Deducted from Capital
The table below shows securitisation exposures that have been deducted from capital, divided into those that relate to securitisations of Group assets and other securitisations. As at 31 Mar 12
Deductions relating to ADI-originated assets
securitised
Residential mortgage
Credit cards and
other personal
loans
Commercial loans
Other
Deductions relating to
other securitisation
exposures
Total
$m $m $m $m $m $m
Securitisation exposures deducted from capital (1) (2)
Deductions from Tier 1 capital - - - 116 - 116
Deductions from Tier 2 capital - - - 116 - 116
Total securitisation exposures deducted from capital
- - - 232 - 232
(1) These exposures fall into three categories: - Exposures that have an internal rating below an equivalent Standard & Poor's rating of BB- or are unrated (deducted 50/50 from Tier 1 and Tier 2 capital). - First loss facilities (deducted 50/50 from Tier 1 and Tier 2 capital). - Capitalised securitisation start up costs (deducted from Tier 1 capital).
All exposures are net of specific provisions.
(2) A change in treatment of the credit wrapped ABS exposure resulted in an increase in deductions of $229 million. This was partially offset by the sale of the remaining ABS CDO in March 2012, which reduced deductions by $116 million.
As at 30 Sep 11
Deductions relating to ADI-originated assets
securitised
Residential mortgage
Credit cards and
other personal
loans
Commercial loans
Other
Deductions relating to
other securitisation
exposures
Total
$m $m $m $m $m $m
Securitisation exposures deducted from capital
Deductions from Tier 1 capital - - - - 70 70
Deductions from Tier 2 capital - - - - 70 70
Total securitisation exposures deducted from capital
- - - - 140 140

Securitisation
38
half year risk and capital report
2020202012121212 6.2 Group Owned Securitised Assets This section provides information about assets that the Group has securitised. The Group may or may not retain an exposure to securitisation SPVs to which the Group has sold assets. As such the information in this section is not related to the information in Section 6.1 Third Party Securitisation.
As a result of the revised Prudential Standard APS 330 becoming effective January 2012, this section has been updated to include assets securitised regardless of whether there is a capital charge under Prudential Standard APS 120: Securitisation. This includes securitisations undertaken solely for funding and liquidity purposes and not for capital relief.
Table 6.2A: Assets Securitised by the Group
This table shows the classes of assets that have been securitised by the Group. This table includes assets originated by the NAB in which NAB acts as a sponsor. There are no third party securitisation exposures where NAB acts only as a sponsor.
As at 31 Mar 12
Total outstanding exposures securitised
assets originated
by ADI
Traditional Synthetic
Impaired assets
relating to exposures
securitised
Total past due assets
from exposures
securitised
ADI recognised
loss from exposures
securitised
$m $m $m $m $m
Underlying asset (1)
Residential mortgage 31,427 - 42 59 -
Credit cards - - - - -
Auto and equipment finance - - - - -
Commercial loans - - - - -
Other - - - - -
Total underlying asset 31,427 - 42 59 -
(1) The definition of impaired and past due assets are consistent with the definitions provided in the Glossary of this report.
As at 30 Sep 11
Total outstanding exposures securitised
assets originated
by ADI
Traditional Synthetic
Impaired assets
relating to exposures
securitised
Total past due assets
from exposures
securitised
ADI recognised
loss from exposures
securitised
$m $m $m $m $m
Underlying asset (1)
Residential mortgage 32,282 - 50 68 -
Credit cards - - - - -
Auto and equipment finance - - - - -
Commercial loans - - - - -
Other - - - - -
Total underlying asset 32,282 - 50 68 -
(1) 30 September 2011 prior period comparatives have been re-presented to include own asset securitisation exposures, regardless of whether there is a capital charge under Prudential Standard APS 120: Securitisation.

Securitisation
39
half year risk and capital report
2020202012121212 Table 6.2B: Recent Securitisation Activity
This table shows the amount of assets sold by the Group to securitisation SPVs and any gain or loss on sale.
6 months ended 31 Mar 12 6 months ended 30 Sep 11
Amount securitised
during period directly
originated
Amount securitised
during period
indirectly originated
Recognised gain or loss
on sale
Amount securitised
during period
directly originated
Amount securitised
during period
indirectly originated
Recognised gain or loss
on sale
$m $m $m $m $m $m
Underlying asset (1) (2)
Residential mortgage 2,857 - - 3,096 - -
Credit cards - - - - - -
Auto and equipment finance - - - - - -
Commercial loans - - - - - -
Other - - - - - -
Total underlying asset 2,857 - - 3,096 - -
(1) The amount securitised during the period is securitisation undertaken for funding purposes, where no significant risk transfer has occurred.
(2) 30 September 2011 prior period comparatives have been re-presented to include own asset securitisation exposures, regardless of whether there is a capital charge under Prudential Standard APS 120: Securitisation.
Disclosure 6.2C: Securitisation Subject to Early Am ortisation
Attachment G of APS 120 provides for specific regulatory treatment for securitisations of certain types of assets. As at 31 March 2012 and 30 September 2011 none of these securitisations have been undertaken by the Group.
Disclosure 6.2D: Forthcoming Securitisation Activit y by the Group
The Group has a securitisation strategy, and sets funding indices and securitisation targets as part of its Annual Funding Plan. The aim of the securitisation program is to ensure that the group is capital efficient and has diversity of funding sources.
To support this strategy, NAB has a business practice that pools of assets originated by NAB are available to be internally securitised (as a source of contingent liquidity) or externally securitised when market opportunities arise. The Group continually assesses opportunities for securitisation of these assets.
As at 31 March 2012, there are no exposures identified for specific external securitisation deals in the next six months.
Disclosure 6.2E: Credit Risk Mitigation and Guarant ors
APS 330 Table 9n requires disclosure of resecuritisation exposures retained or purchased, broken down according to the application of credit risk mitigation and exposures to guarantors. As at 31 March 2012, the Group did not have any resecuritisation exposures to which credit risk mitigation is applied or exposures to guarantors.
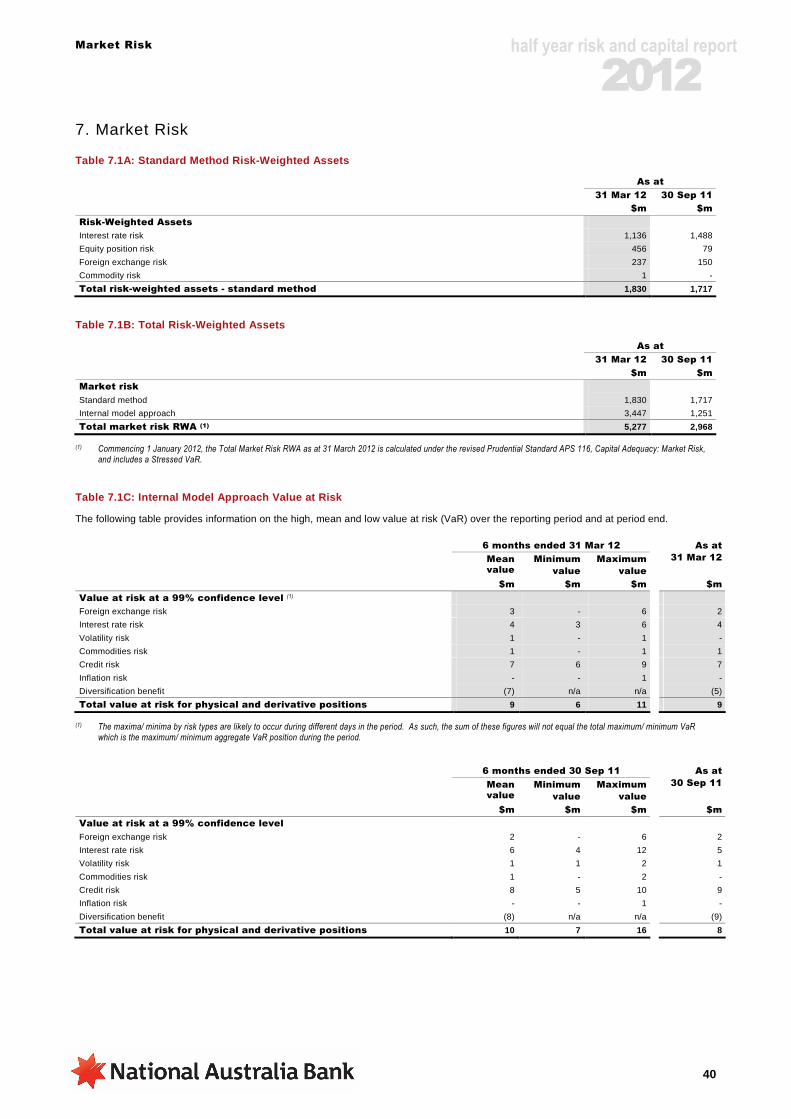
Market Risk
40
half year risk and capital report
2020202012121212 7. Market Risk
Table 7.1A: Standard Method Risk-Weighted Assets
As at
31 Mar 12 30 Sep 11
$m $m
Risk-Weighted Assets
Interest rate risk 1,136 1,488
Equity position risk 456 79
Foreign exchange risk 237 150
Commodity risk 1 -
Total risk-weighted assets - standard method 1,830 1,717
Table 7.1B: Total Risk-Weighted Assets
As at
31 Mar 12 30 Sep 11
$m $m
Market risk
Standard method 1,830 1,717
Internal model approach 3,447 1,251
Total market risk RWA (1) 5,277 2,968
(1) Commencing 1 January 2012, the Total Market Risk RWA as at 31 March 2012 is calculated under the revised Prudential Standard APS 116, Capital Adequacy: Market Risk, and includes a Stressed VaR.
Table 7.1C: Internal Model Approach Value at Risk
The following table provides information on the high, mean and low value at risk (VaR) over the reporting period and at period end. 6 months ended 31 Mar 12
Mean value
Minimum
value
Maximum
value
As at
31 Mar 12
$m $m $m $m
Value at risk at a 99% confidence level (1)
Foreign exchange risk 3 - 6 2
Interest rate risk 4 3 6 4
Volatility risk 1 - 1 -
Commodities risk 1 - 1 1
Credit risk 7 6 9 7
Inflation risk - - 1 -
Diversification benefit (7) n/a n/a (5)
Total value at risk for physical and derivative positions 9 6 11 9
(1) The maxima/ minima by risk types are likely to occur during different days in the period. As such, the sum of these figures will not equal the total maximum/ minimum VaR which is the maximum/ minimum aggregate VaR position during the period.
6 months ended 30 Sep 11
Mean value
Minimum
value
Maximum
value
As at
30 Sep 11
$m $m $m $m
Value at risk at a 99% confidence level
Foreign exchange risk 2 - 6 2
Interest rate risk 6 4 12 5
Volatility risk 1 1 2 1
Commodities risk 1 - 2 -
Credit risk 8 5 10 9
Inflation risk - - 1 -
Diversification benefit (8) n/a n/a (9)
Total value at risk for physical and derivative positions 10 7 16 8
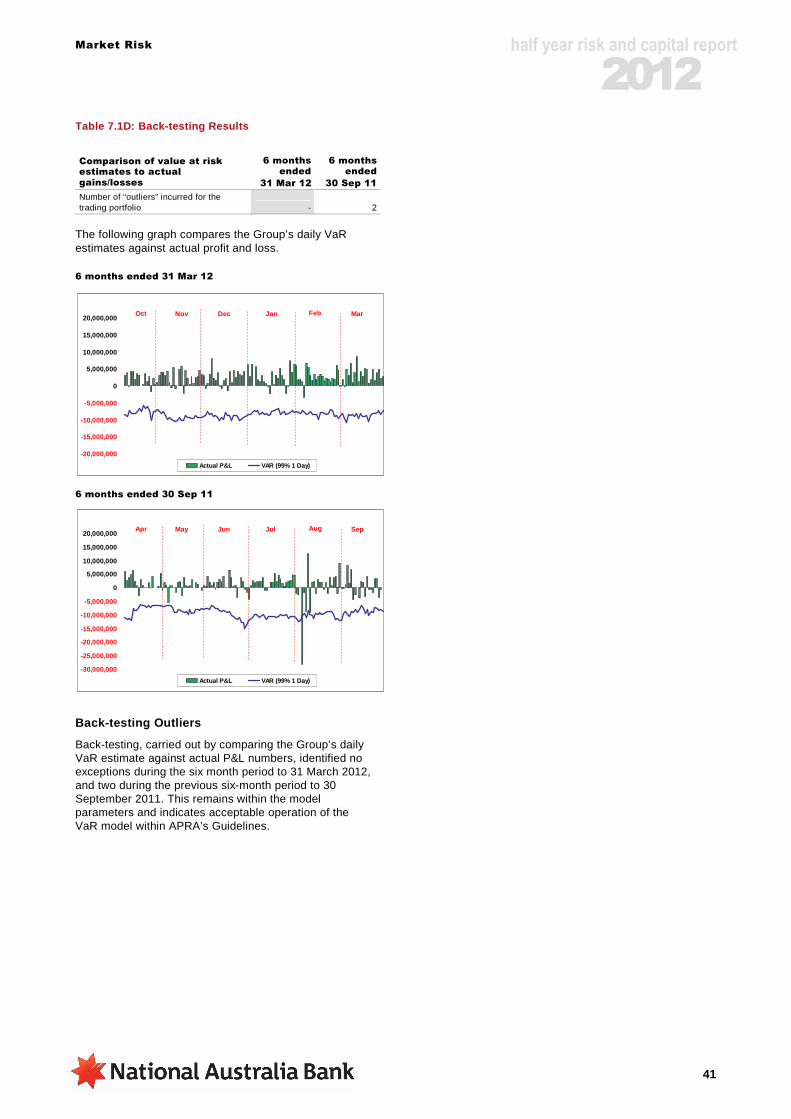
Market Risk
41
half year risk and capital report
2020202012121212 Table 7.1D: Back-testing Results
Comparison of value at risk estimates to actual gains/losses
6 months ended
31 Mar 12.
6 months ended
30 Sep 11
Number of “outliers” incurred for the trading portfolio - 2
The following graph compares the Group’s daily VaR estimates against actual profit and loss. 6 months ended 31 Mar 12
6 months ended 30 Sep 11
Back-testing Outliers
Back-testing, carried out by comparing the Group’s daily VaR estimate against actual P&L numbers, identified no exceptions during the six month period to 31 March 2012, and two during the previous six-month period to 30 September 2011. This remains within the model parameters and indicates acceptable operation of the VaR model within APRA’s Guidelines.
-30,000,000
-25,000,000
-20,000,000
-15,000,000
-10,000,000
-5,000,000
0
5,000,000
10,000,000
15,000,000
20,000,000
Actual P&L VAR (99% 1 Day)
Apr May Jun Jul Aug Sep
-20,000,000
-15,000,000
-10,000,000
-5,000,000
0
5,000,000
10,000,000
15,000,000
20,000,000
Actual P&L VAR (99% 1 Day)
Oct Nov Dec Jan Feb Mar
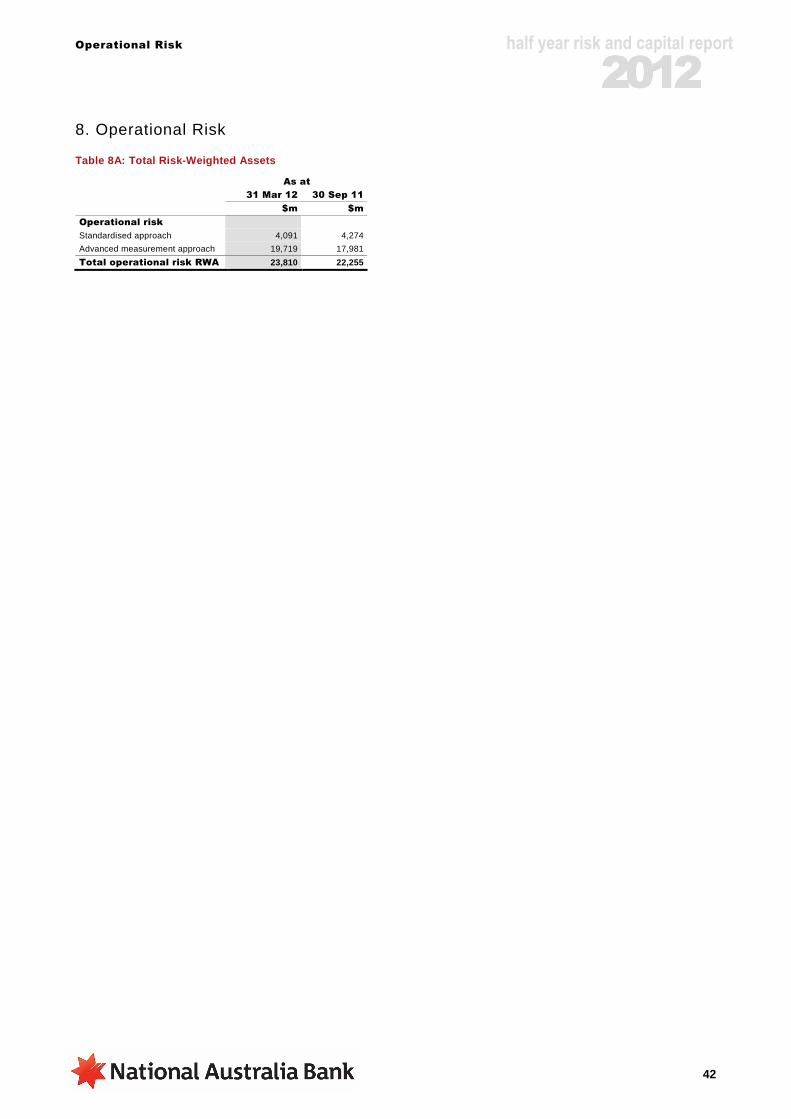
Operational Risk
42
half year risk and capital report
2020202012121212 8. Operational Risk
Table 8A: Total Risk-Weighted Assets
As at
31 Mar 12 30 Sep 11
$m $m
Operational risk
Standardised approach 4,091 4,274
Advanced measurement approach 19,719 17,981
Total operational risk RWA 23,810 22,255

Non-Traded Market Risk
43
half year risk and capital report
2020202012121212 9. Non-Traded Market Risk
9.1 Interest Rate Risk in the Banking Book Table 9.1A: Interest Rate Risk in the Banking Book
This table provides the increase or decrease in economic value for upward and downward rate shocks broken down by currency. As at 31 Mar 12 As at 30 Sep 11
200 bp
parallel increase
200 bp parallel
decrease
200 bp parallel
increase
200 bp parallel
decrease
$m $m $m $m
Change in economic value (1)
AUD 12 (6) 56 (46)
CAD - - - -
CHF - - - -
EUR (4) 4 (4) 5
GBP (2) 8 3 4
HKD 1 - 1 (1)
JPY (1) 1 (1) 1
NZD 35 (37) (12) 13
USD 59 (66) (10) 10
Other 19 (21) 6 (6)
Total change in economic value 119 (117) 39 (20)
(1) The Group’s 9 major currencies are modelled on an individual basis. The remaining immaterial currencies are aggregated and modelled using a single yield curve. The 200 basis point interest rate shock results include earnings offset.
Table 9.1B: Total Risk-Weighted Assets
As at
31 Mar 12 30 Sep 11
$m $m
IRRBB risk-weighted assets 6,281 7,198
All components of IRRBB regulatory capital are calculated using a historical VaR simulation using at least eight years of historical data at a 99% confidence level, one-year investment term of capital, and a 12-month holding period.

Non-traded Market Risk
44
half year risk and capital report
2020202012121212 9.2 Equities Banking Book Position
Table 9.2A: Equities Banking Book Position
This table provides the value of investments disclosed in the balance sheet, as well as the fair value of those investments. As at 31 Mar 12 As at 30 Sep 11
Carrying
value (1) Fair value
(2)
Carrying value
Fair value
$m $m $m $m
Total listed equities (publicly traded) 68 68 55 55
Total unlisted equities 502 502 446 446
(1) Carrying value as recorded in the Balance Sheet, in accordance with accounting standards.
(2) The best evidence of fair value is quoted prices in an active market. If the market for a financial instrument is not active, fair value is established by using a valuation technique.
Table 9.2B: Gains and Losses on Equity Investments
This table provides the realised (actual) gains/losses arising from sales and liquidations in the reporting period recognised through the profit and loss account. Unrealised (expected) gains/losses included in Tier 1 and Tier 2 capital are gains/losses recognised in the balance sheet but not through the profit and loss account. 6 months ended
31 Mar 12 30 Sep 11
$m $m
Gains (losses) on equity investments
Cumulative realised gains (losses) in reporting period 2 39
Total unrealised gains (losses) 7 20
Total unrealised gains (losses) included in Tier 1/Tier 2 capital 3 9
Table 9.2C: Risk-Weighted Assets by Equity Asset Class
This table shows RWA by equity asset class. Equity investments subject to a 300% risk-weight are those exposures that fall within the equity IRB asset class that are not deducted from capital and that are listed on a recognised exchange. Equity investments subject to a 400% risk-weight are those exposures that fall within the equity IRB asset class that are not deducted from capital and that are not listed on a recognised exchange. As at
31 Mar 12 30 Sep 11
$m $m
Risk-weighted Assets
Equities subject to 300% RW 205 166
Equities subject to 400% RW 1,801 1,783
Total risk-weighted assets 2,006 1,949
Disclosure 9.2D: Equity Investments Subject to Grandfathering Provision
The Group does not have any equity investments that are subject to grandfathering provisions.

Glossary
45
half year risk and capital report
2020202012121212 10. Glossary
Term Description
ADI Authorised Deposit-taking Institution (ADI).
Advanced IRB approach The advanced Internal Ratings Based (IRB) approach refers to the processes employed by the Group to estimate credit risk. This is achieved through the use of internally developed models to assess potential credit losses using the outputs from the PD, LGD and EaD models.
AMA Advanced Measurement Approach (AMA) is the risk estimation process used for the Group’s operational risk. It combines internally developed risk estimation processes with an integrated risk management process, embedded within the business with loss event management.
APRA Australian Prudential Regulation Authority (APRA).
Back-testing Back-testing refers to the process undertaken to monitor performance of the Group’s risk models. Historical data is used to compare the actual outcomes to the expected outcomes. Theoretical (or hypothetical) back-testing refers to the process whereby the trading positions at the end of the preceding day are revalued using the end-of-day rates for that day and then again at the succeeding day’s closing rates. The difference between the two mark-to-market values of the portfolio which represents the profit and loss that would have occurred had there been no transactions on the day, is compared with the VaR. VaR is also compared with the actual daily traded profit and loss as a cross-check of the reasonableness of the theoretical portfolio movement.
BIPRU BIPRU refers to the UK Financial Services Authority’s requirements and guidance for accreditation under Basel II. It refers to the Prudential Sourcebook for Banks, Building Societies and Investment Firms.
Board Principal Board of Directors of NAB
Capital adequacy Capital adequacy is the outcome of identifying and quantifying the major risks the Group is exposed to, and the capital that the Group determines as an appropriate level to hold for these risks, as well as its strategic and operational objectives, including its target credit rating.
CDO Collateralised Debt Obligation
CLO Collateralised Loan Obligation
Company National Australia Bank Limited ABN 12 004 044 937
Credit derivatives Credit derivatives include single-name credit default and certain total rate of return swaps, cash funded credit linked notes and first-to-default and second-to-default credit derivative basket products. ADIs may also recognise many more complex credit derivatives that do not fall into the list above, that have been approved by APRA.
Credit derivative transactions In relation to securitisation exposures, credit derivative transactions are those in which the credit risk of a pool of assets is transferred to the Group, usually through the use of credit default swaps.
Credit enhancements Credit enhancements are arrangements in which the Group holds a securitisation exposure that is able to absorb losses in the pool, providing credit protection to investors or other parties to the securitisation. A first loss credit enhancement is available to absorb losses in the first instance. A second loss credit enhancement is available to absorb losses after first loss credit enhancements have been exhausted.
The Credit Risk function All areas reporting directly to the Chief Credit Officer including Credit Insight & Appetite, Credit Frameworks, Credit Oversight, Counterparty Credit and Strategic Business Services.
Derivative transactions In relation to securitisation exposures, derivative transactions include interest rate and currency derivatives provided to securitisation SPVs, but do not include credit derivative transactions.
EaD Exposure at Default (EaD) is an estimate of the total committed credit exposure expected to be drawn at the time of default for a customer or facility that the Group would incur in the event of a default. It is used in the calculation of RWA.
Economic capital Economic capital represents the Group’s internal assessment of the amount of capital required to protect against potential unexpected future losses arising from its business activities, in line with its target credit rating.
ELE The Extended License Entity (ELE) comprises the ADI itself and any APRA approved subsidiary entities assessed as effectively part of a single ‘stand-alone’ entity, as defined in APS 110.
Eligible financial collateral Eligible financial collateral, under the standardised approach, will be the amount of cash collateral, netting and eligible bonds and equities. Eligible financial collateral, under the IRB approach, for corporate, sovereign and bank portfolios, is limited to the collateral items detailed in paragraphs 4 and 23 of Attachment G of APS 112. Recognition of eligible financial collateral is subject to the minimum conditions detailed in that same Attachment, paragraph 6.
Economic value sensitivities Economic value sensitivities (EVS) refer to a modelling technique whereby the value of an asset is assessed through a number of different scenarios, such as different interest rates or period in time for loan repayment. This allows the Group to establish a price with some degree of certainty across the various scenarios and develop risk management techniques to protect the assets value.
Foundation IRB (FIRB) Foundation Internal Ratings Based (FIRB) approach refers to an alternative approach to advanced IRB defined under Basel II where a Group develops its own PD models and seeks approval from its regulator to use these in the calculation of regulatory capital, and the regulator provides a supervisory estimate for LGD and EaD.
Group The Level 2 Group, being the Company and the entities it controls subject to certain exceptions set out in Section 2 Scope of Application of this report.
Guarantees Guarantors under the standardised approach are recognised according to APS 112 Attachment F paragraph 3. The secured portion of an exposure is weighted according to the risk weight appropriate to the guarantor and the unsecured portion is weighted according to the risk weight applicable to the original counterparty (Refer to Attachment A for the appropriate risk weights). Under the IRB approach, for corporate, sovereign and bank portfolios, the ADI may recognise credit risk mitigation in the form of guarantees and credit derivatives according to the FIRB substitution approach where an ADI uses supervisory estimates of LGD (refer to APS 113 Attachment B paragraph 49), an AIRB substitution approach where the ADI has approval from APRA to use its own estimates of LGD (refer to APS 113 Attachment B paragraph 60) and, for certain exposures, a double default approach (refer to APS 113 Attachment B paragraph 67). An ADI may decide, separately for each eligible exposure, to apply either the relevant substitution approach or the double default approach. For retail portfolios there are two approaches for the recognition of credit risk mitigation in the form of guarantees and credit derivatives under the retail IRB approach, a substitution approach (refer to APS 113 Attachment C paragraph 19) and, for certain exposures, a double default approach (refer to APS 113 Attachment C paragraph 28). An ADI may decide separately for each eligible exposure to apply either the substitution approach or the double default approach.
IAA Internal Assessment Approach.

Glossary
46
half year risk and capital report
2020202012121212 Term Description
ICAAP Internal Capital Adequacy Assessment Process (ICAAP) is the mechanism developed and used by the Group to determine capital requirements as outlined under Basel II. It results in the Group identifying and assessing all risks to which it is exposed and allocating an appropriate level of capital to each.
IFRS International Financial Reporting Standards.
ISDA International Swaps & Derivatives Association.
IMA Internal Model Approach (IMA) describes the approach used in the assessment of traded market risk. The Group uses, under approval from APRA, the IMA to calculate general market risk for all transactions in the trading book other than those covered by the Standard Method.
Impaired facilities Impaired facilities consist of Retail loans (excluding unsecured portfolio-managed facilities) which are contractually 90 days or more past due with security insufficient to cover principal and arrears of interest revenue. Unsecured portfolio managed facilities are classified as impaired assets when they become 180 days past due (if not written off) as per ARF 220 instructions; Non-retail loans that are contractually 90 days or more past due and/or sufficient doubt exists about the ultimate ability to collect principal and interest; and Impaired off-balance sheet credit exposures, where current circumstances indicate that losses may be incurred.
IRB
Internal Ratings Based (IRB) describes the approach used in the assessment of credit risk. Within this document it is used interchangeably with the term advanced Internal Ratings Based approach. This reflects the Group’s development of internal credit risk estimation models covering both retail and non-retail credit.
IRRBB Interest rate risk in the banking book (IRRBB).
Level 3 Conglomerate Group
Contains APRA-regulated entities with material operations across more than one APRA-regulated industry and/or in unregulated entities.
LGD Loss Given Default (LGD) is an estimate of the expected severity of loss for a credit exposure following a default event. Regulatory LGDs reflect a stressed economic condition at the time of default. It is used in the calculation of RWA.
LGR Loss Given Realisation (LGR) is a parameter used for estimating LGD.
Liquidity facilities Liquidity facilities are provided by the Group to an SPV for the primary purpose of funding any timing mismatches between receipts of funds on underlying exposures and payments on securities issued by the SPV (asset liquidity facilities), or to cover the inability of the SPV to roll over ABCP (standby liquidity facilities).
Loan to value ratio Loan to Value Ratio (LVR) is the ratio between the loan and value of the security provided.
Masterscale Masterscale is a consistent series of grades applied to credit exposures that allows the Group to place every credit exposure into a specific grade or range that represents the likelihood of a credit default. This allows comparison of customers and portfolios.
NAB National Australia Bank Limited ABN 12 004 044 937
National Australia Bank Group NAB and its controlled entities
Net write-offs Write-offs on loans at amortised cost net of recoveries.
Non-retail credit Non-retail credit broadly refers to credit exposure to business customers. It excludes retail credit defined below.
Non-traded book Non-traded book refers to the investment in securities held by the Group through to maturity.
The Operational Risk function All areas reporting directly to the Executive General Manager, Operational Risk.
Past due facilities ≥ 90 days Past due facilities ≥ 90 days consist of well-secured assets that are more than 90 days past due and portfolio-managed facilities that are not well secured and between 90 and 180 days past due.
PD Probability of Default (PD) is an estimate of the likelihood of a customer defaulting or not repaying their borrowings and other obligations to the Group in the next 12 months.
Point in time Point in Time (PiT) within this document refers to risk models that estimate the likelihood of default and resulting loss over a 12-month period having regard to the current economic conditions.
Qualifying revolving retail exposures For the purposes of regulatory reporting, credit cards are referred to as qualifying revolving retail.
RBA Ratings-Based Approach.
Regulatory capital
Regulatory capital is the total capital held by the Group as a buffer against potential losses arising from the business the Group operates in. Unlike economic capital, it is calculated based on guidance and standards provided by the Group’s regulators, including APRA. It is designed to support stability in the banking system and protect depositors.
Regulatory expected loss Regulatory Expected Loss (EL) is a calculation of the estimated loss that may be experienced by the Group over the next 12 months. Regulatory EL calculations are based on the PD, LGD and EAD values of the portfolio at the time of the estimate which include stressed LGDs for economic conditions. As such, regulatory EL is not an estimate of long-run average expected loss (as was the case previously under dynamic provisioning).
Resecuritisation Resecuritisation exposures are securitisation exposures in which the risk associated with an underlying pool of exposures is tranched and at least one of the underlying exposures is a securitisation exposure. In addition, an exposure to one or more resecuritisation exposures is a resecuritisation exposure.
Retail credit For the purposes of managing credit, two broad categories are used: retail credit and non-retail credit. This reflects the different approaches to the sales and ongoing management of credit and is consistent with the approach taken by Basel II. Retail credit refers to the credit provided to retail or personal customers. For the purposes of regulatory capital, retail credit is categorised into four groups: residential mortgages, credit cards (or qualifying revolving credit), retail SME and other.
Risk appetite Risk appetite defines the level of risk the Group is prepared to accept as part of its business. The resulting level of risk is a direct input into the Group’s capital requirements.
RWA Risk-Weighted Assets.
Securities Securities include the purchase of securitisation debt securities for either trading or banking book purposes.
SME Small and medium sized enterprises
SGA Specialised Group Assets
Specific provisions Specific provisions for prudential purposes include all provisions for impairment assessed on an individual basis in accordance with IFRS excluding securitisation; all collective provisions on defaulted or otherwise non-performing assets, regardless of expected loss, are reported as additional regulatory specific provisions.
Sponsor The entity that establishes the securitisation SPVs including ABCP conduits and often provides other services.
Standardised approach Standardised refers to an alternative approach to the assessment of risk (notably credit and operational) whereby the institution uses external rating agencies to assist in assessing credit risk and/or the application of specific values provided by regulators to determine RWA.
Glossary
47
half year risk and capital report
2020202012121212 Term Description
Stress testing Stress testing refers to a technique whereby the Group’s capital position is assessed against a number of different scenarios used to determine the movement on expected losses and subsequent impact on capital.
Through the cycle Through the Cycle (TtC) within this document refers to risk models that estimate the likelihood of default and resulting loss over a 12-month period having regard to the impact of an economic downturn.
Tier 1 capital Tier 1 capital comprises the highest quality components of capital that fully satisfy all of the following essential characteristics: provide a permanent and unrestricted commitment of funds; are freely available to absorb losses; do not impose any unavoidable servicing charge against earnings; and rank behind the claims of depositors and other creditors in the event of winding-up.
Tier 1 capital ratio Tier 1 regulatory capital, as defined by APRA, divided by RWA.
Tier 2 capital Tier 2 capital includes other components of capital that, to varying degrees, fall short of the quality of Tier 1 capital but nonetheless contribute to the overall strength of an entity as a going concern. It is divided into: Upper Tier 2 capital comprising components of capital that are essentially permanent in nature, including some forms of hybrid capital instrument; and Lower Tier 2 capital comprising components of capital that are not permanent.
Traded book Traded book refers to the Group’s investment portfolio that is traded or exchanged in the market from time to time that reflects market opportunities.
Value at Risk Value at Risk (VaR) is a mathematical technique that uses statistical analysis of historical data to estimate the likelihood that a given portfolio’s losses will exceed a certain amount.
Warehouse facilities Warehouse facilities are lending facilities provided by the Group to an SPV for the financing of exposures in a pool. These may be on a temporary basis pending the issue of securities or on an on-going basis.
Write-offs Write-offs represent credit losses in accordance with accounting rules.

Reference to APS 330 Tables
48
half year risk and capital report
2020202011112222 11. Reference to APS 330 Tables
Table of Contents Reference Title APS 330 Reference
Disclosure 2A Scope of Application APS 330 Table 1d
Table 4.1A RWAs APS 330 Table 3b-f
Table 4.1B Capital Ratios APS 330 Table 3g
Table 4.2A Capital Structure APS 330 Table 2b-d
Table 5.1A Credit Risk Exposures Summary APS 330 Table 4i & 4j
Table 5.1B Total and Average Credit Risk Exposures APS 330 Table 4b
Table 5.1C Exposures by Geography APS 330 Table 4c
Table 5.1D Exposures by Industry APS 330 Table 4d
Table 5.1E Exposures by Maturity APS 330 Table 4e
Table 5.1F Provisions by Asset Class APS 330 Table 6e
Table 5.1G Loss Experience APS 330 Table 6f
Table 5.1H Provisions by Industry APS 330 Table 4f
Table 5.1I Provisions by Geography APS 330 Table 4g
Table 5.1J Movement in Provisions APS 330 Table 4h
Table 5.2A Standardised Exposures by Risk Weight APS 330 Table 5b
Table 5.2B Standardised Exposures by Risk Grade n/a
Table 5.2C Supervisory Slotting by Risk Weight APS 330 Table 5b
Table 5.3A Non-Retail Exposure by Risk Grade APS 330 Table 6d
Table 5.3B Retail Exposure by Risk Grade APS 330 Table 6d
Table 5.4A Mitigation by Eligible Collateral APS 330 Table 7b
Table 5.4B Mitigation by Guarantees and Credit Derivatives APS 330 Table 7c
Table 6.1A Total Securitisation Exposures n/a
Table 6.1B Type of Exposure APS 330 Table 9k
Table 6.1C New Facilities Provided n/a
Table 6.1D Exposures by Risk Weight APS 330 Table 9l
Table 6.1E Exposures Deducted from Capital APS 330 Table 9l
Table 6.2A Assets Securitised by the Group APS 330 Table 9g & h
Table 6.2B Recent Securitisation Activity APS 330 Table 9j
Disclosure 6.2C Securitisation Subject to Early Amortisation APS 330 Table 9m
Disclosure 6.2D Forthcoming Securitisation Activity by the Group APS 330 Table 9i
Disclosure 6.2E Credit Risk Mitigation and Guarantors APS 330 Table 9n
n/a n/a APS 330 Table 9o – w (1)
Table 7.1A Standard Method Risk-Weighted Assets APS 330 Table 10b
Table 7.1B Total Risk-Weighted Assets APS 330 Table 3d
Table 7.1C Internal Model Approach Value at Risk APS 330 Table 11d
Table 7.1D Back-testing Results APS 330 Table 11d
Table 8A Total Risk-Weighted Assets APS 330 Table 3e
Table 9.1A Interest Rate Risk in the Banking Book APS 330 Table 14b
Table 9.1B Total Risk-Weighted Assets n/a
Table 9.2A Equities Banking Book Position APS 330 Table 13b-c
Table 9.2B Gains and Losses on Equities Investments APS 330 Table 13d-e
Table 9.2C Risk-Weighted Assets by Equity Class APS 330 Table 13f
Disclosure 9.2D Equity Investments Subject to Grandfathering Provision APS 330 Table 13f
(1) Trading book securitisation exposures are not separately disclosed within this document as they are not material at a Group level.

49
half year risk and capital report
2020202012121212
www.nab.com.au

half year risk and capital report
2020202012121212 This page has been left blank intentionally

www.nabgroup.com
©2012 National Australia Bank Limited ABN 12 004 044 937 AFSL and Australian Credit Licence 230686 86624A0512