2012 pumpkin patch case study
TRANSCRIPT
Page 1
How to use the NZICA template
Welcome to the 2012 NZICA template case study.
This case study is to help with the assessment of 90504 „prepare a report that analyses and interprets a company‟s financial report for external users‟. For version 3 of 90504 the standard allows teachers to assess students against a case study or an annual report.
The questions (and suggested answers) provided in this pumpkin patch limited resource form the basis of a case study, and can be used as one.
Our NZQA moderator, who put together this case study for us, has suggested some techniques that you could use with students to help them engage with the wider aspects of the firm. They have also provided some suggested methods to help the students use the financial ratios effectively to make a decision about seeking employment with the firm or purchasing shares.
You could:
Brainstorm as a class using the headings (and the annual report) outlined in questions 1-7 of the non-financial section. Try and encourage students to ask: „what does this mean for our specified end-user (shareholder/employee)?‟
Teachers may choose to focus on the end user. Potential lenders may also be a topic of choice, if the focus is “expanding into a new market.”
Conduct group or individual research to provide a story about the firm (based on questions 1-7 of the non-financial section), prior to reviewing the relevant data.
Have students share their findings with the class. Groups could do a subsection each to create a depository of findings. Students should use the answers found to engage with the firm, and use specific trends and examples as the basis for their individual reports, as per the financial analysis (p.p.12-21).
Please note:
Teachers can provide students with relevant rations, as the standard does not require students to calculate these. The rations chosen by the author reflects the effects on the finances of decisions made by the firm given the NZ retail and global business environment (and the firm‟s past).
Much of the latter commentaries regarding the financial analysis is carried on from earlier sections. Students should use the relevant notes to reinforce their opinion for the end-user‟s decision.

Page 2
Pumpkin Patch Ltd. Analysis and interpretation of the 2011 Annual Report
PLANNING TEMPLATE 1: NARRATIVE QUESTIONS
Q1 What are the core business area(s) and geographic locations that Pumpkin Patch Ltd operates in?
Pumpkin Patch Ltd is retail brand that was founded in 1990 and wholesales and retails children‘s
clothing through its own stores in NZ, Australia, and UK and US (until mid-way through 2011)
The clothing range it designs is known for high quality and encompasses clothes that are resilient to
children‘s activities.
It is known for having a good ―fashion‖ brand image, and competes with other children‘s designer
brands such as Witchery Kids, Levis Kids, flo, Motion, EllieB, fresh, Papoose, Le Bon, Elfwear, Osh
Kosh (which is sold through Farmers, Smith & Caugheys etc.).
In 2010 the launch of the brand, ―Charlie and Me‖, occurred and was seen as an opportunity for
Pumpkin Patch Limited (PPL) to use its brand image to enter the ―everyday‖ market (that includes,
in New Zealand, t&t, Cotton On for Kids, JK Kids gear, The Baby Factory, Kmart and the
Warehouse) that encompasses 75% of the global chi ldrenswear sales. (Chairman‘s letter p.8,
2010)
In the 2011 year, Charlie & Me had 11 stores open across Australasia and a dedicated onli ne
trading website was created for this brand.
Since balance day 2011, Pumpkin Patch has launched a new brand called Pumpkin Patch General,
which is a part of PPL that sells non-clothing items for babies, nurseries and school aged children
(and is signalled by the Chairperson‘s letter where she states “We are currently assessing a number
of initiatives to leverage our existing online and supply chain capabilities. We hope to launch some
of these in the coming year.”) (Chairman‘s letter p.9, 2011). Pumpkin Patch General is an online
shop, currently.
The target market for the brand has, historically, been middle-income parents and grandparents
earners, and the growth of PPL since being listed has been based on the consistent growth of the
economies in which it has operated throughout the 2000s. The company has historically performed
well in all the markets it operated in except for the USA and the UK where the brand has been a
consistent money loser for PPL shareholders.
Simply put, 2011 has been a main departure from these foci.
The past three years have been challenging as global market conditions, the capital intensive
structure and restructures have had their impacts.
There are 5 main revenue centres (p.11, 2011 Annual Report):
Retail markets:
Australia (51% - down 1% from 2010); New Zealand (15% - unchanged from 2010) UK (14% - unchanged from 2010) US (5% – to be closed in 2012 year) Wholesale/Direct(website) (14% - up 1% from 2010)
Page 3
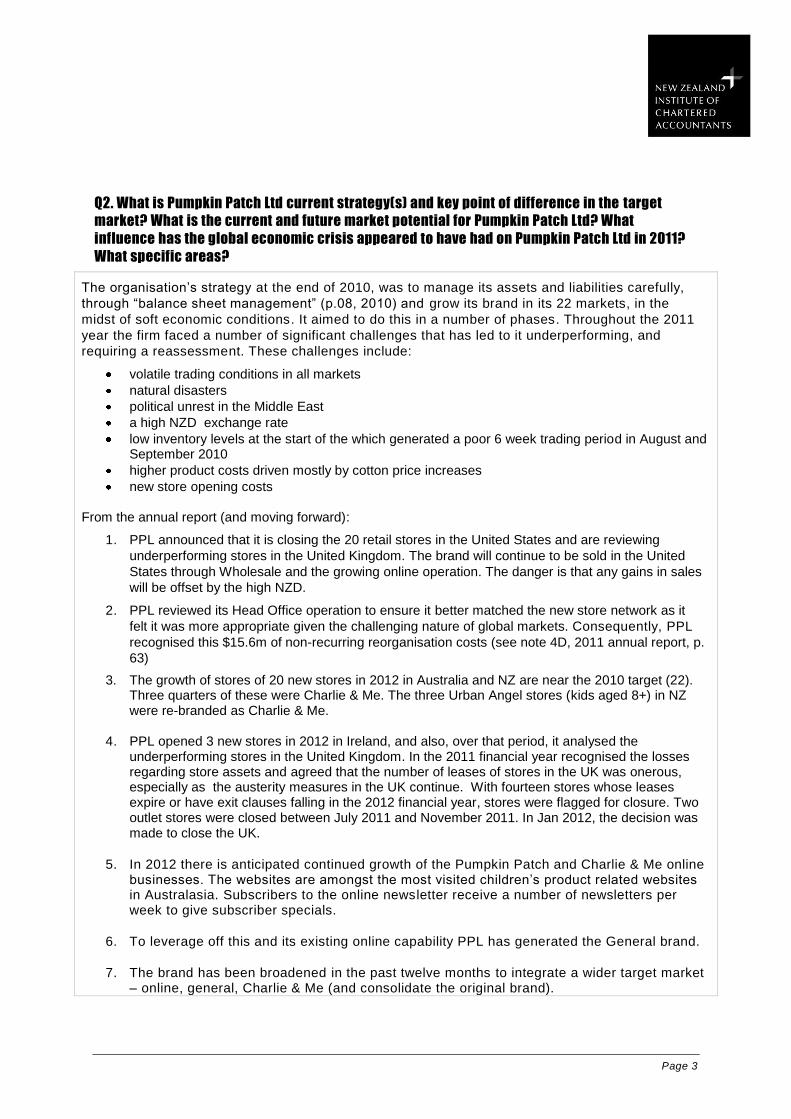
Q2. What is Pumpkin Patch Ltd current strategy(s) and key point of difference in the target
market? What is the current and future market potential for Pumpkin Patch Ltd? What
influence has the global economic crisis appeared to have had on Pumpkin Patch Ltd in 2011?
What specific areas?
The organisation‘s strategy at the end of 2010, was to manage its assets and liabilities carefully,
through ―balance sheet management‖ (p.08, 2010) and grow its brand in its 22 markets, in the
midst of soft economic conditions. It aimed to do this in a number of phases. Throughout the 2011
year the firm faced a number of significant challenges that has led to it underperforming, and
requiring a reassessment. These challenges include:
volatile trading conditions in all markets
natural disasters
political unrest in the Middle East
a high NZD exchange rate
low inventory levels at the start of the which generated a poor 6 week trading period in August and September 2010
higher product costs driven mostly by cotton price increases
new store opening costs From the annual report (and moving forward):
1. PPL announced that it is closing the 20 retail stores in the United States and are reviewing
underperforming stores in the United Kingdom. The brand will continue to be sold in the United
States through Wholesale and the growing online operation. The danger is that any gains in sales
will be offset by the high NZD.
2. PPL reviewed its Head Office operation to ensure it better matched the new store network as it
felt it was more appropriate given the challenging nature of global markets. Consequently, PPL
recognised this $15.6m of non-recurring reorganisation costs (see note 4D, 2011 annual report, p.
63)
3. The growth of stores of 20 new stores in 2012 in Australia and NZ are near the 2010 target (22). Three quarters of these were Charlie & Me. The three Urban Angel stores (kids aged 8+) in NZ were re-branded as Charlie & Me.
4. PPL opened 3 new stores in 2012 in Ireland, and also, over that period, it analysed the underperforming stores in the United Kingdom. In the 2011 financial year recognised the losses regarding store assets and agreed that the number of leases of stores in the UK was onerous, especially as the austerity measures in the UK continue. With fourteen stores whose leases expire or have exit clauses falling in the 2012 financial year, stores were flagged for closure. Two outlet stores were closed between July 2011 and November 2011. In Jan 2012, the decision was made to close the UK.
5. In 2012 there is anticipated continued growth of the Pumpkin Patch and Charlie & Me online
businesses. The websites are amongst the most visited children‘s product related websites in Australasia. Subscribers to the online newsletter receive a number of newsletters per week to give subscriber specials.
6. To leverage off this and its existing online capability PPL has generated the General brand.
7. The brand has been broadened in the past twelve months to integrate a wider target market
– online, general, Charlie & Me (and consolidate the original brand).
Page 4
8. The brand itself in the Australasian markets remains very strong.
From its investor relations website it states: Pumpkin Patch intends to continue increasing its sales and earnings by using strategies similar to those that it has successfully used during the past ten years. Pumpkin Patch's strategy is based around selling leading edge kids' fashion through a range of channels including its own retail stores, selected department stores, wholesale distribution arrangements, the internet and via mail order catalogues. Through these avenues, Pumpkin Patch sees its key growth coming from the following:
Continued development of its markets particularly in Australia.
Continued expansion of overseas third party retailing through department stores in Australia, the United States, Europe, the Middle East, South Africa and Asia
Continued expansion of online revenues through its websites in New Zealand, Australia, The United Kingdom, Ireland and The United States.
Source: http://www.pumpkinpatch.biz/ourcompany_ourfuture.html
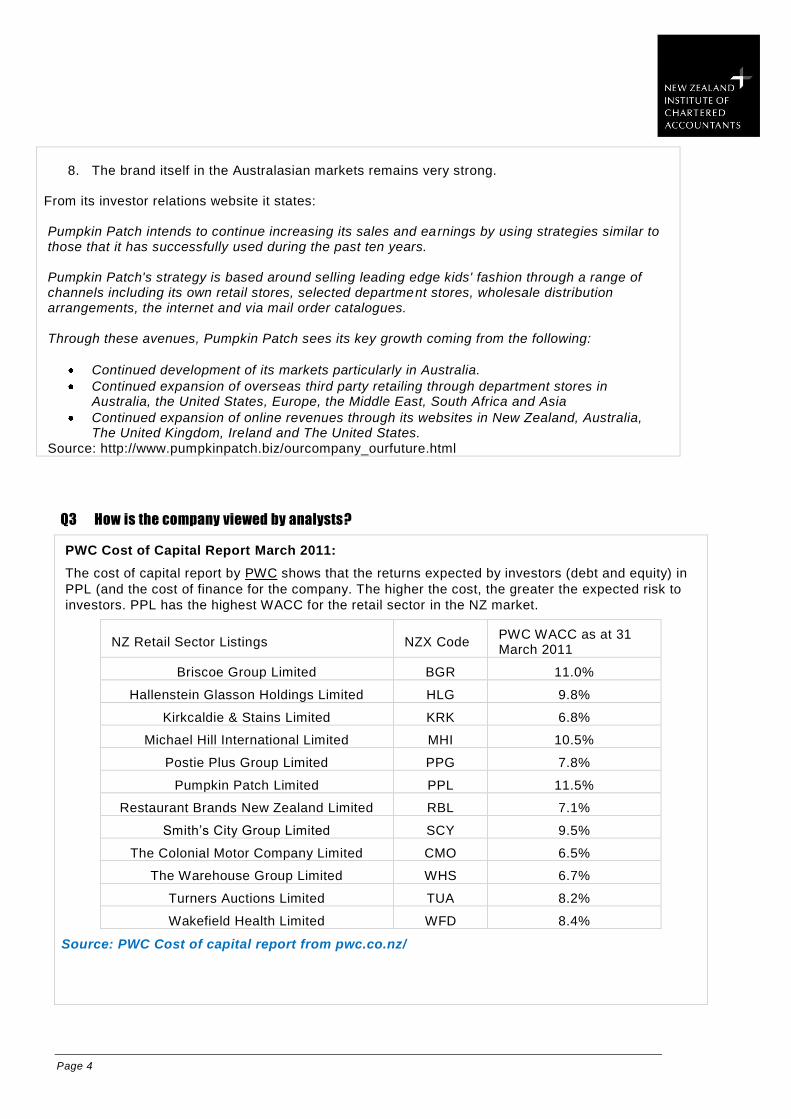
Q3 How is the company viewed by analysts?
PWC Cost of Capital Report March 2011:
The cost of capital report by PWC shows that the returns expected by investors (debt and equity) in
PPL (and the cost of finance for the company. The higher the cost, the greater the expected risk to
investors. PPL has the highest WACC for the retail sector in the NZ market.
NZ Retail Sector Listings NZX Code PWC WACC as at 31 March 2011
Briscoe Group Limited BGR 11.0%
Hallenstein Glasson Holdings Limited HLG 9.8%
Kirkcaldie & Stains Limited KRK 6.8%
Michael Hill International Limited MHI 10.5%
Postie Plus Group Limited PPG 7.8%
Pumpkin Patch Limited PPL 11.5%
Restaurant Brands New Zealand Limited RBL 7.1%
Smith‘s City Group Limited SCY 9.5%
The Colonial Motor Company Limited CMO 6.5%
The Warehouse Group Limited WHS 6.7%
Turners Auctions Limited TUA 8.2%
Wakefield Health Limited WFD 8.4%
Source: PWC Cost of capital report from pwc.co.nz/
Page 5
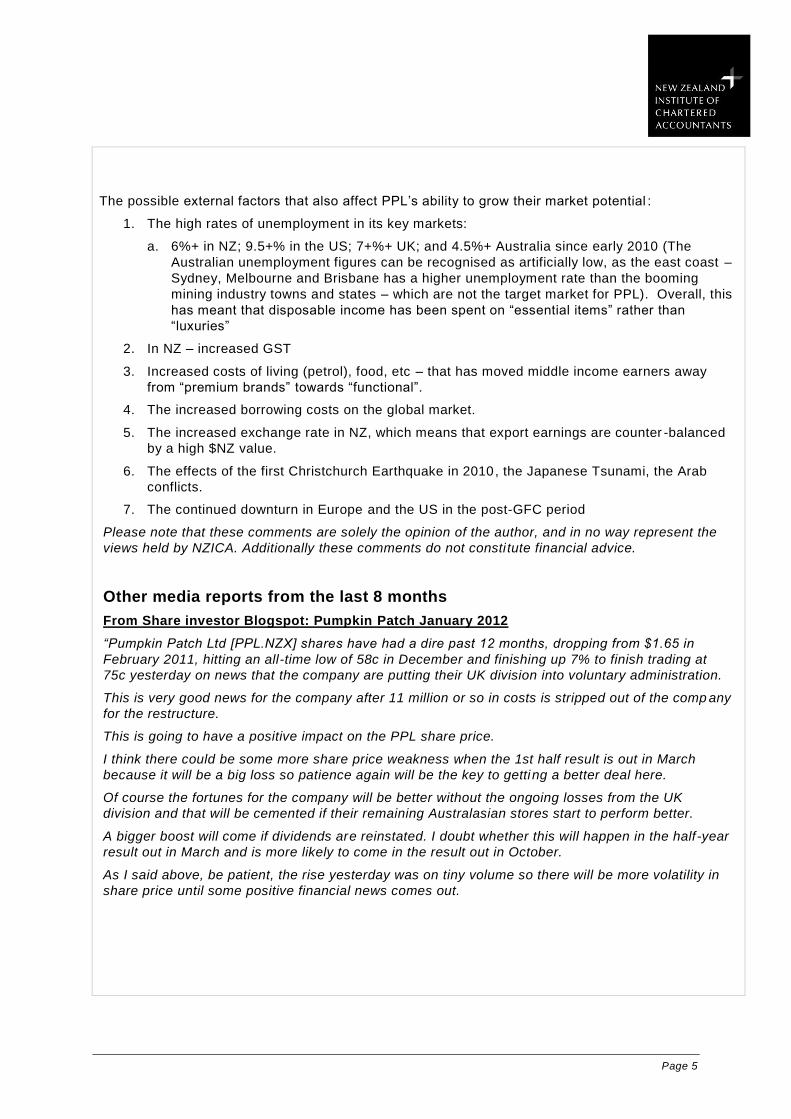
The possible external factors that also affect PPL‘s ability to grow their market potential :
1. The high rates of unemployment in its key markets:
a. 6%+ in NZ; 9.5+% in the US; 7+%+ UK; and 4.5%+ Australia since early 2010 (The
Australian unemployment figures can be recognised as artificially low, as the east coast –
Sydney, Melbourne and Brisbane has a higher unemployment rate than the booming
mining industry towns and states – which are not the target market for PPL). Overall, this
has meant that disposable income has been spent on ―essential items‖ rather than
―luxuries‖
2. In NZ – increased GST
3. Increased costs of living (petrol), food, etc – that has moved middle income earners away
from ―premium brands‖ towards ―functional‖.
4. The increased borrowing costs on the global market.
5. The increased exchange rate in NZ, which means that export earnings are counter -balanced
by a high $NZ value.
6. The effects of the first Christchurch Earthquake in 2010, the Japanese Tsunami, the Arab
conflicts.
7. The continued downturn in Europe and the US in the post-GFC period
Please note that these comments are solely the opinion of the author, and in no way represent the
views held by NZICA. Additionally these comments do not consti tute financial advice.
Other media reports from the last 8 months
From Share investor Blogspot: Pumpkin Patch January 2012
“Pumpkin Patch Ltd [PPL.NZX] shares have had a dire past 12 months, dropping from $1.65 in
February 2011, hitting an all-time low of 58c in December and finishing up 7% to finish trading at
75c yesterday on news that the company are putting their UK division into voluntary administration.
This is very good news for the company after 11 million or so in costs is stripped out of the comp any
for the restructure.
This is going to have a positive impact on the PPL share price.
I think there could be some more share price weakness when the 1st half result is out in March
because it will be a big loss so patience again will be the key to getting a better deal here.
Of course the fortunes for the company will be better without the ongoing losses from the UK
division and that will be cemented if their remaining Australasian stores start to perform better.
A bigger boost will come if dividends are reinstated. I doubt whether this will happen in the half -year
result out in March and is more likely to come in the result out in October.
As I said above, be patient, the rise yesterday was on tiny volume so there will be more volatility in
share price until some positive financial news comes out.
Page 6
Milford Asset Management (20/6/2011):
(Source: http://milfordkiwisaver.co.nz/blog/pumpkin-patch-back-on-home-soil/)
“Pumpkin Patch back on home soil
Last week Pumpkin Patch updated earnings guidance as well as announcing that it was going to
close the US operations and address the underperforming United Kingdom business. The earnings
guidance was downgraded to $12m- $14m (from $16m – $18m previously), the downgrade was
attributed to the continuing “challenging and volatile” conditions intensified by rising input costs.
While most retailers have been finding it difficult at present, it has been especially treacherous for
Australasian children‟s apparel retailers of late as the competition heats up with inter national brands
venturing down under and depressed consumers staying away from shops. By closing the US
operations Pumpkin Patch has decided that the bulk of its future opportunities are closer to home.
Even though there are opportunities for Pumpkin Patch to further expand its footprint in Australia
this will be difficult with the increasing level of competition. Pumpkin Patch needs to re -establish a
niche position for itself and its brand lest it follow the path of The Warehouse, which capitulated in
Australia only to focus on NZ and then lose market share to the evermore agile and energetic
specialist retailers.
We believe that for a company to continue to succeed in both international and domestic markets it
needs to have strong management with interes ts firmly aligned to the shareholders‟ in addition to a
solid strategic plan implemented by an independent board. The first cut is always the deepest and
we admire people who are able to admit they were wrong and move forward looking for the next
opportunity. Hopefully, Pumpkin Patch is able to get back on track and reclaim their position as
Australasia‟s premier children‟s apparel retailer.”
Brian Gaynor's NZ Herald Articles, Economy on 31 Mar 2012
Excerpt from “Retail success at home attracting investors”
Some listed retailers have performed remarkably well in a difficult economic environment.
This environment includes intense competition, rising property costs, the Christchurch earthquakes,
competition from internet retailers and cautious consumers.
Seven NZX listed retailers have made profit announcements covering the important Christmas
period, Briscoe Group, Hallenstein Glasson and Michael Hill producing particularly good results …
…Pumpkin Patch reported an accounting loss of $30 million for the six months to January 31. But
when discontinued activities and reorganisation costs are excluded, the company had net earnings
of $7.2 million compared with $8.6 million for the first half of its 2010/11 year.
It is not paying a dividend as the group has debts of $70 million and only $3.3 million in cash.
Pumpkin Patch is closing its United States and United Kingdom retail operations and newly -
appointed chief executive Neil Cowie said that as far as its continuing operations were concerned
“gross margins were impacted by increased promotional activity and higher production costs, mostly
cotton”.
The children‟s clothing retailer expects Australia to remain challenging and no material improvement
is expected in New Zealand in the short term.
It will also be affected by the high New Zealand dollar but borrowings are expected to decrease to
$50 million by year end.
Page 7
It is also forecasting reduced costs because of improved procurement processes, lower cotton
prices and higher average import foreign exchange rates…
…This is a rather cautious outlook but domestic listed retailers continue to attract investor interest
because several companies, particularly Briscoe, Hallenstein Glasson and Michael Hill, are
performing well in an extremely difficult and competitive environment.
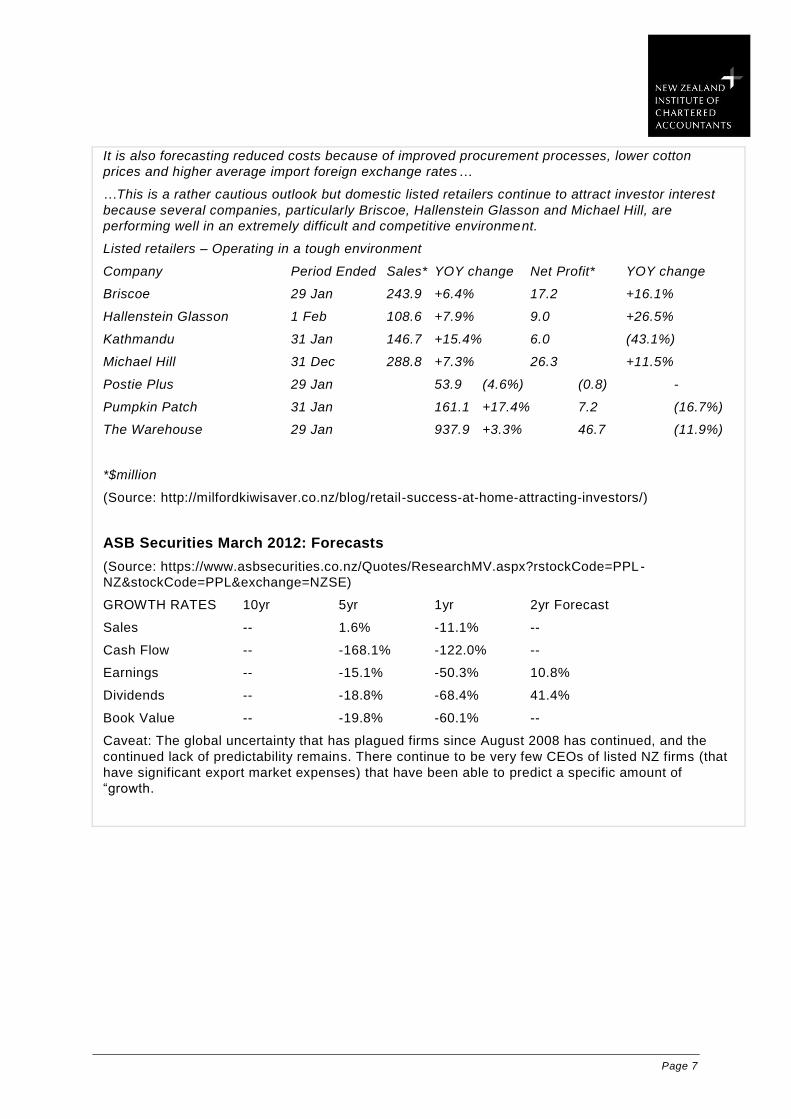
Listed retailers – Operating in a tough environment
Company Period Ended Sales* YOY change Net Profit* YOY change
Briscoe 29 Jan 243.9 +6.4% 17.2 +16.1%
Hallenstein Glasson 1 Feb 108.6 +7.9% 9.0 +26.5%
Kathmandu 31 Jan 146.7 +15.4% 6.0 (43.1%)
Michael Hill 31 Dec 288.8 +7.3% 26.3 +11.5%
Postie Plus 29 Jan 53.9 (4.6%) (0.8) -
Pumpkin Patch 31 Jan 161.1 +17.4% 7.2 (16.7%)
The Warehouse 29 Jan 937.9 +3.3% 46.7 (11.9%)
*$million
(Source: http://milfordkiwisaver.co.nz/blog/retail-success-at-home-attracting-investors/)
ASB Securities March 2012: Forecasts
(Source: https://www.asbsecurities.co.nz/Quotes/ResearchMV.aspx?rstockCode=PPL-
NZ&stockCode=PPL&exchange=NZSE)
GROWTH RATES 10yr 5yr 1yr 2yr Forecast
Sales -- 1.6% -11.1% --
Cash Flow -- -168.1% -122.0% --
Earnings -- -15.1% -50.3% 10.8%
Dividends -- -18.8% -68.4% 41.4%
Book Value -- -19.8% -60.1% --
Caveat: The global uncertainty that has plagued firms since August 2008 has continued, and the
continued lack of predictability remains. There continue to be very few CEOs of listed NZ firms (that
have significant export market expenses) that have been able to predict a specific amount of
―growth.
Page 8
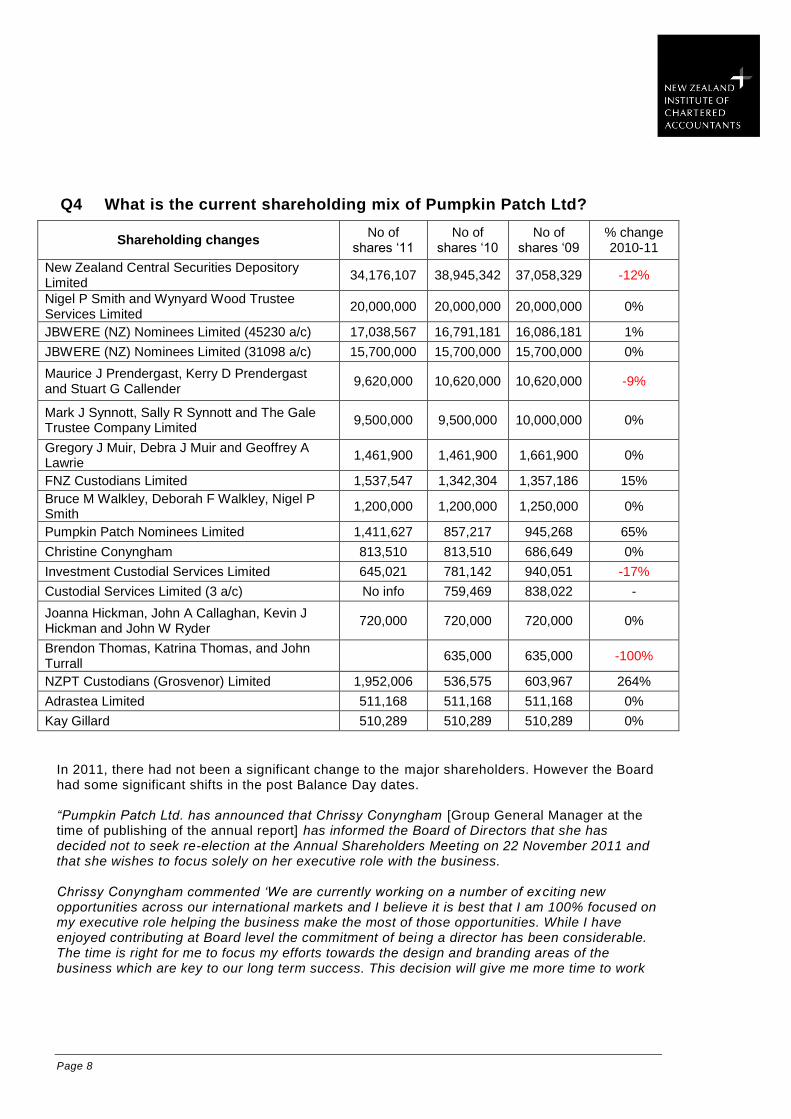
Q4 What is the current shareholding mix of Pumpkin Patch Ltd?
Shareholding changes No of
shares ‗11 No of
shares ‗10 No of
shares ‗09 % change 2010-11
New Zealand Central Securities Depository Limited
34,176,107 38,945,342 37,058,329 -12%
Nigel P Smith and Wynyard Wood Trustee Services Limited
20,000,000 20,000,000 20,000,000 0%
JBWERE (NZ) Nominees Limited (45230 a/c) 17,038,567 16,791,181 16,086,181 1%
JBWERE (NZ) Nominees Limited (31098 a/c) 15,700,000 15,700,000 15,700,000 0%
Maurice J Prendergast, Kerry D Prendergast and Stuart G Callender
9,620,000 10,620,000 10,620,000 -9%
Mark J Synnott, Sally R Synnott and The Gale Trustee Company Limited
9,500,000 9,500,000 10,000,000 0%
Gregory J Muir, Debra J Muir and Geoffrey A Lawrie
1,461,900 1,461,900 1,661,900 0%
FNZ Custodians Limited 1,537,547 1,342,304 1,357,186 15%
Bruce M Walkley, Deborah F Walkley, Nigel P Smith
1,200,000 1,200,000 1,250,000 0%
Pumpkin Patch Nominees Limited 1,411,627 857,217 945,268 65%
Christine Conyngham 813,510 813,510 686,649 0%
Investment Custodial Services Limited 645,021 781,142 940,051 -17%
Custodial Services Limited (3 a/c) No info 759,469 838,022 -
Joanna Hickman, John A Callaghan, Kevin J Hickman and John W Ryder
720,000 720,000 720,000 0%
Brendon Thomas, Katrina Thomas, and John Turrall
635,000 635,000 -100%
NZPT Custodians (Grosvenor) Limited 1,952,006 536,575 603,967 264%
Adrastea Limited 511,168 511,168 511,168 0%
Kay Gillard 510,289 510,289 510,289 0%
In 2011, there had not been a significant change to the major shareholders. However the Board had some significant shifts in the post Balance Day dates. “Pumpkin Patch Ltd. has announced that Chrissy Conyngham [Group General Manager at the time of publishing of the annual report] has informed the Board of Directors that she has decided not to seek re-election at the Annual Shareholders Meeting on 22 November 2011 and that she wishes to focus solely on her executive role with the business. Chrissy Conyngham commented „We are currently working on a number of exciting new opportunities across our international markets and I believe it is best that I am 100% focused on my executive role helping the business make the most of those opportunities. While I have enjoyed contributing at Board level the commitment of being a director has been considerable. The time is right for me to focus my efforts towards the design and branding areas of the business which are key to our long term success. This decision will give me more time to work
Page 9
with Neil and the wider executive team developing and executing strategies that will take us into the future‟.” (Source: http://www.findata.co.nz/Markets/NZX/51855/Director_announcement.htm ) The most significant shift from 2010 to 2011 was the purchase of shares by NZPT Custodians (Grosvenor) Limited, which is a company that has a significant stake in a number of NZ firms, such as NZ Steel and Tube. PPL may have represented a ―bargain‖. However, in the latter part of 2011, the share price went from $1.15 to $0.58c.
The 2nd
most significant shift in the share portfolio was that Pumpkin Patch Nominees Limited
was issued 150,000 shares and has grown its stake by 65%. This is the company‘s employee share
scheme. Maurice Prendergast and Sally Synnott are Directors and shareholders of Pumpkin Patch
Nominees Limited which acts as Trustee for various employee share ownership plans. (p.35, 2011)
Page 10
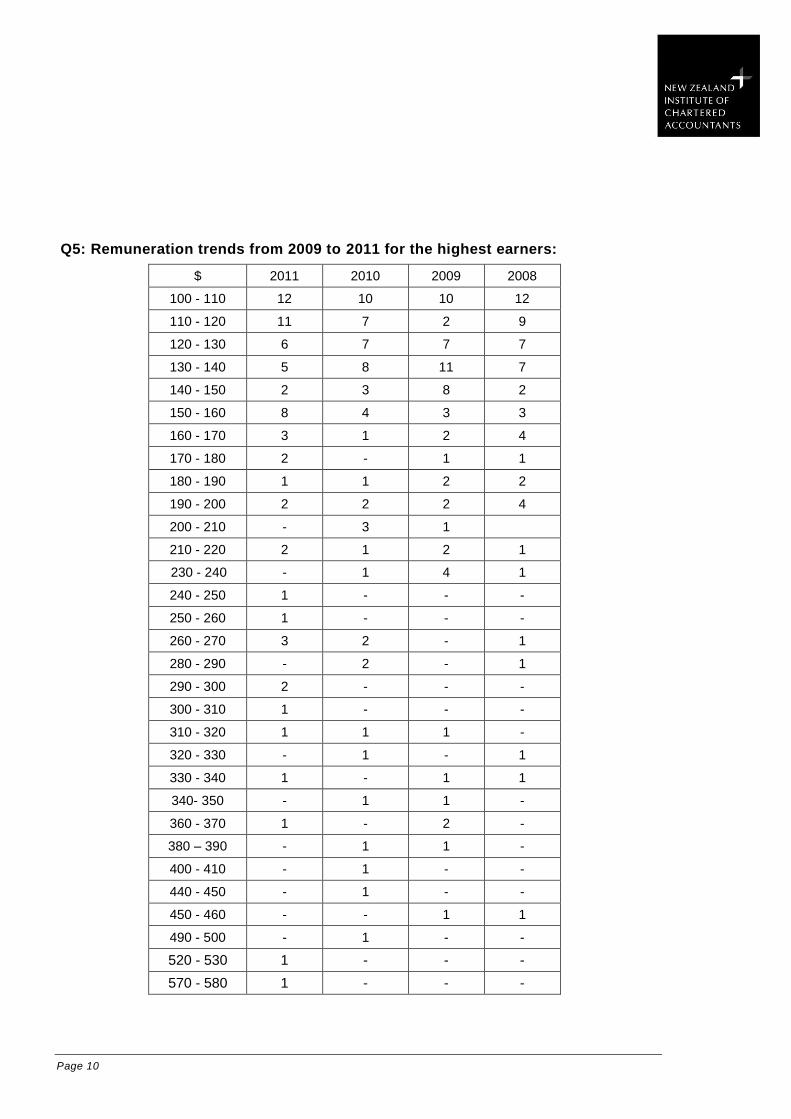
Q5: Remuneration trends from 2009 to 2011 for the highest earners:
$ 2011 2010 2009 2008
100 - 110 12 10 10 12
110 - 120 11 7 2 9
120 - 130 6 7 7 7
130 - 140 5 8 11 7
140 - 150 2 3 8 2
150 - 160 8 4 3 3
160 - 170 3 1 2 4
170 - 180 2 - 1 1
180 - 190 1 1 2 2
190 - 200 2 2 2 4
200 - 210 - 3 1
210 - 220 2 1 2 1
230 - 240 - 1 4 1
240 - 250 1 - - -
250 - 260 1 - - -
260 - 270 3 2 - 1
280 - 290 - 2 - 1
290 - 300 2 - - -
300 - 310 1 - - -
310 - 320 1 1 1 -
320 - 330 - 1 - 1
330 - 340 1 - 1 1
340- 350 - 1 1 -
360 - 370 1 - 2 -
380 – 390 - 1 1 -
400 - 410 - 1 - -
440 - 450 - 1 - -
450 - 460 - - 1 1
490 - 500 - 1 - -
520 - 530 1 - - -
570 - 580 1 - - -

Page 11
580 - 590 - 1 - -
600 - 610 - 1 - -
Total > $100K
67 61 62 58
AS at the end of the financial year, there had been a growth in the number of people earning
$100K+.
But given the results in the financial sections (below), there has been a major shift in wages
policy. At the 2011 AGM for Shareholders announced that PPL had “shaved $130,000 or 35%
off directors‟ fees as its board warns hard times are continuing at the children's wear retailer .‟
The Chairperson, Jane Freeman, has decreased her fee to $85,000 (from $128K)
Additionally, PPL decreased its fees to the other 4 (non-executive) directors to $50k each.
‗The move follows a decision to freeze salaries at the Pumpkin Patch head office this year
and cut 55 jobs at across the company.
“Some hard decisions were made in 2011 and we believe some more hard decisions will need
to be made in 2012,” Ms Freeman said.
(Italics from NBR at: http://www.nbr.co.nz/article/pumpkin-patch-cuts-directors-fees-warns-
hard-times-ahead-gb-104852)
Q6 What are the strengths of the management team at Pumpkin Patch Ltd and how will these potentially benefit the company in the coming periods?
There have to be some questions asked about the strength of the management team in the company
over the last few years that culminated in an entry into the United States in 2005 to test the market.
PPL continued to roll out US stores even though the existing stores were not succeeding. In 2009 the
company made a decision to abandon 20 US stores that were incurring heavy losses and kept 15 that
they saw as promising. In 2009/10 the company even opened an additional 5 stores in that market.
From the website, it states that
“Pumpkin Patch's strong management team has the expertise and capabilities to ensure that the
complex apparel, design, manufacture and retail business that is Pumpkin Patch will continue to grow.
The Pumpkin Patch Board of Directors has extensive retail, apparel and corporate experience which
complements the skills of the management team.”
(Source: http://www.pumpkinpatch.biz/ourcompany_ourpeople.html)
Management‘s exposure to global retail environments (especially the US and UK) is unclear here, and
questionable – especially in a downturn of the magnitude the retail industry has suffered over the past
three years (in the high-end brand) may be the reason for the lack of awareness shown in the face of
the 2008-11 periods.
Store based retailing has been suffering globally over the last 4 years, especially in the United States.
Management should (potentially) have seen that after three years of attempting to infiltrate the US
market, in 2009 it should have closed all operations. It has taken more than 2 years to decide to close
the entire operation. This has led to another bout of ―discontinuing operations‖ expenditure and
losses. The costs have been significant.
Moving forward, the replacement and the resignation of key directors including CEO Maurice
Prendergast may turn around the result of failed expansion plans which have cost investors hundreds
of millions in lost share value and close to $50 million off the book value.
Page 12
The January 2012 announcement about the closure of UK retail stores has further dented the
expansion undertaken over the past six years. The focus seems to be clearly focused on NZ, Australia
and wholesaling to US direct and department stores (like the high end brands trade in NZ) and
cyberspace.
Please note that these are solely the opinion of the author, and in no way represent the views held by
NZICA. Additionally these comments do not constitute management advice.
Q7 What are the benefits of being an employee at PPL?
1. Up to the financial year ended 31 July 2011, the opportunity to earn well in the Head office is well
publicised. However, the only people who lost their jobs in the last financial year (2011) were at
head office in Auckland, direct store management (a growth sector) and workers in the United
States.
2. Pumpkin Patch Nominees Limited (as per Q. 4 above) acts as a Trustee for the Company‘s
employee share purchase plans. The Company advances the Trustee an interest free loan to
enable it to purchase the shares issued to it for the plans.
At regular intervals the Trustee offers shares to those permanent employees of the Company with
in excess of six months continuous service. The shares are offered at a discount to market price.
Employees purchasing shares are provided financial assistance on an interest free basis,
repayable in regular instalments. Dividends paid on allocated shares during the qualifying period
are paid to employees.
3. From PPL website; Pumpkin Patch states that “family life and strong family values are integral to
the wellbeing of the people and therefore our Company.
Family-friendly work policies encourage flexibility, adaptability and balance. People are rewarded for
loyalty and long service, and families with young children are supported with in -house crèche facilities
or childcare subsidies.
Pumpkin Patch employs approximately 2,800 people.
Approximately 66% of Pumpkin Patch's staff work part time. When hiring staff Pumpkin Patch
endeavours to identify people who share its vision and who are passionate about kids wear and
committed to meeting, and exceeding, customers' expectations of excellent service.
One of Pumpkin Patch's core philosophies is integrity - within the Pumpkin Patch team, with suppliers,
and towards customers. This integrity is intended to create a platform of trust and commi tment, and a
foundation for all of Pumpkin Patch's business relationships. Pumpkin Patch recognises that employee
retention and succession planning are vital to a successful organisation.
As such the Company has always ensured that key employees with long service have been rewarded
with equity interests in the Company and the Company has established a number of employee share
schemes which have allowed employees to share in our success.

Page 13
The team at Pumpkin Patch has demonstrated its ability to grow the business over successive years.
The design team has a consistent history of producing exceptional ranges that are at the forefront of
children's fashion.” (Source: http://www.pumpkinpatch.biz/ourcompany_ourpeople.html)
PUMPKIN PATCH LTD FINANCIAL ANALYSIS AND INTERPRETATION
Please note that these figures have been generated from a number of sources, and have been kindly reproduced here.
There may be other ratios not referred to that would also be an acceptable method to use in analysing the information. Therefore, be sure to state any assumptions.
PROFITABILITY (INCLUDING DISCONTINUED)
31/07/2011 31/07/2010 31/07/2009
Gross Margin GP/Sales 62.8% 61.4% 57.5%
Net Margin NPAT/Sales - 0.05% 6.68% 4.50%
Return on Assets EBIT/Total Assets -0.9% 14.3% 9.9%
Return on Equity NPAT/Equity -5.8% 31.5% 20.9%
Note that all discussions are based on Net (loss)/profit after tax and before other
Comprehensive Income.
Page 14
Profitability summary and conclusions
The results coming from Charlie & Me [were] pleasing and gave the board encouragement about that specific brand‘s potential (Chairperson‘s report p.11, 2011). From the segment report (page 65) of the report 1% growth in sales in the Wholesale/Direct segment translates to a change of revenue from $53.22 Million to $54.14 Million. This has provided $10 M of the profit to the firm.
Overall, the Group profits tell two stories, (including and excluding the proposed closure of the
US stores). Excluding the closures, the firm has had a positive Net profit after tax of more than
$15 Million. This is, however, STILL a decrease of $10 Million. The NPAT accounting for the
discontinued/ items resulted in a loss of $1.9 million.
Overall group revenues slid further in 2011, from $362 Million to $338 Million. This has resulted
in a two year decrease from $412 (2009) of $74 Million. In 2010, the result was attributed to the
‘softening of the general retail environment in the second half of the year ‘ (CEO comments,
2010). In 2011, the Chairperson stated that this year has been ―one of the most challenging
years the Company has ever encountered. Not only did we face difficult trading conditions in all
our markets and a continuation of the higher New Zealand dollar, we also had to deal with a
number of other challenges such as a series of natural disasters and civil unrest in key markets
around the world.” (p.8, 2011)
The strongest sales sector of the organisation, Australia, also had subdued results as the year
progressed. This, combined with the Queensland floods resulted in a $144.8 Million decrease;
down 8% on 2010. The majority of the decline occurred in the first half which was down 14% on
the same period last year following the poor August and September trading period. AUD sales in
the second half of the year were down 1% when compared to the same period last year.
Therefore, the 2009 losses attributed to discontinuing operations (when the US stores were
initially re-organised) had been turned around in 2010, but these have now been wiped away by
a finalised discontinuing the US operations. At the end of the financial year 2011, a number of
issues regarding profitability may need to be asked:
1. In the annual report, a number of key issues in 2009 (and 2011) were classified as ―non-
recurring‘ items. If these occur in two out of three years – is it still reasonable to class
them as ‗non-recurring‘? (If one looks at the UK announcement in Jan 2012 – flagged in
the Chairperson‘s report where she stated, “we continue to develop strategies for the
United Kingdom stores which are currently facing very challenging trading conditions as
Europe as a whole deals with some major economic issues” , it seems that there may be
some more ‗discontinued/non-recurring items‘ in the 2012 annual report). In January
2012, this was confirmed.
2. The high New Zealand dollar has been attributed to the significant effect on the results
from the wholesale/direct markets (p.8)
3. The Australian sector was the strongest in the 2010 year, but in 2011, consumers
‗tightened their belts‘.
4. The NZICA toolkit suggested in 2011 that moving forward:
“if the markets do not rebound and
if another re-organisation (say in UK, or full closure of the US were to occur) in
2010-11
This would have severe effects on PPL‟s income statements again. The company is not set up
in this manner.” This seems to have come to fruition. Is the firm now set up to keep growing?

Page 15
EFFICIENCY
31/07/2011* 31/07/2010 31/07/2009
Inventory Turnover (times) COS/Inventory 4.01 5.35 5.14
Fixed Asset Turnover (times) Net Sales/Fixed Assets
(PPE) 3.94 5.21 5.75
Accounts Receivable Turnover
(times) Sales/Acc Rec 18.6 x 18.43 x 21.08 x
Accounts Receivable (days) 365/Acc Rec. Turnover 19.63 days 19.80 days 17.31 days
*Including discontinued stores
Note that Accounts Receivable Turnover (times) calculation ignores non-current Accounts
Receivable.
Efficiency summary and conclusions
Overall the inventory management has flowed alongside the decrease in sales revenue. There has
been a 20+% deterioration in inventory turnover. This may due to the need to re-stock after an
inventory shortage in the initial stages of the financial year and the decrease in sales revenue.
The new branding for Charlie & Me would also have contributed to the slow-down in inventory
management.
The more realistic option is that the overseas sales have translated poorly to the reports due to high
NZD.
The Accounts Receivable management is not significant in itself, given that there would be very little in
the form of AR (other than delays of payments from credit card companies to PPL).
The AR might being offered to customers of its wholesale division stores. This may be a sign of the
times, where customers of the wholesale division are offered extended credit terms. The new markets
may be afforded longer repayment plans to increase the overall sales output, and ensure that a
partnership ensues.
LIQUIDITY AND THE BALANCE SHEET
31/07/2011 31/07/2010 31/07
/2009
Current ratio CA/CL 1.28 1.42 1.99
Quick ratio (CA-Inv)/CL 0.25 0.35 0.51
Net working capital ratio (CA-CL)/Total Assets 0.12 0.17 0.31
% Change in cash +140% -44.7% N/A
Page 16
Liquidity summary and the Balance Sheet Summary
The 2010 decrease has continued to slide in 2011. This is a decreasing and worsening trend
for Pumpkin Patch Ltd.
In the Current Assets section, there has been a significant growth, on balance day, of inventory valued at an additional $13 M. The cash position has also grown, but this is, due in the main to a large loan to offset the forward exchange contracts (below) . Linking the cash position to the cash flow statement, one sees the $10M is as a result of cash borrowings of $38,000,00 in the 2011 year
The Current Liabilities is a mix of positive and negative, as the overdraft organised in 2010
has been reduced by $5M to $20 Million (from $25M).
The bulk of the $19.5 Million increase in CL (and consequent decrease in the ratios above)
is due to the value of the forward foreign exchange contracts due to expire in the upcoming
year.
Exporting companies like PPL cannot ignore the impact of currency, changes on cash flows,
profitability, and their asset and liability position. No company is immune—the cash received
from exporting is affected by the relationship between the currency used by the customer to
pay and the currency in which the cost of providing the product or service is denominated.
A forward contract allows PPL to arrange for delivery (or sale) of a specific amount of
currency on a specified future date, at the current market price.
The past two decades has seen a significant increase in the types and complexity of financial
instruments offered in the market place. Users of financial statements need detailed
information on financial assets, liabilities and equity instruments in order to better understand
the risk profile of the entity. Because the effects are as material (significant) as they are to
the PPL‘s balance sheet, they need to be reported.
Because Forward FOREX contracts fix the exchange rate over different periods to try and
reduce the volatility of exchange rate fluctuations, PPL has these liabilities over the current &
non-current period.
From the CEO report , post-balance-date there was ―significant exchange rate volatility which
led to an improvement in the after tax value of those derivatives and a corresponding
increase in total shareholders‘ funds of around $21m (based on exchange rates in early
October.)‖ Post Balance Date, measurements reduce the liability by $21M.
The reason for recognising the liability on Balance Day is that IAS requires that the contract
is priced at fair value on the date the contract is entered into and remeasured to fair value
(on Balance Date).

Page 17
CASH FLOW RATIOS
31/07/2011* 31/07/2010 31/07/2009**
Free Cash Flow
(FCF)
Net Cash from Operating—
Capital Expenditures -$15,846 $8,775 $48,551
Cash Debt
Coverage
Net Cash from Operating
Average Total Liabilities -0.03 0.21 0.61
Cash Return on
Sales
Net Cash from Operating Net Sales
-0.01 0.05 0.15
Net cash flow from operating activities -$4,574 $20,801 $60,577
Net cash flow from investing activities -$17,144 -$13,379 -$11,796
Net cash flow from financing activities $24,803** -$15,041 -$51,880
Net cash flow for period $3,085 -$7,619 $62,901
Net bank debt at period end -$60,970 -$26,055 -$18,436
Cashflow gearing
ratio
Total Bank Debt : EBITDA
4.54 times 0.81 times 0.75 times
* Including discontinued store provisions ** Excluding discontinued stores *** Includes Cash Borrowings of $38,000,00 in 2011 **** Note that the FCF calculations are based on PPE only
Page 18
Cashflow summary and conclusions
Free cash flow (FCF)
FCF represents the cash that a company is able to generate after laying out the money required
to maintain or expand its asset base. (Investopedia) Free cash flow is important because it
allows a company to pursue opportunities that enhance shareholder value. Without cash, it's
tough to develop new products, make acquisitions, pay dividends and reduce debt.
It was flagged in the 2011 iteration of this analysis “the 2010 decrease in FCF for PPL was
concerning as the strategy is focused on new stores, and growth, but there may be insufficient
free cash available for this, without going to the market for more equity or more debt.
The cash debt coverage is also concerning for PPL, as there are still liabilities in the balance
sheet (they are now simply current). The cash generated is only sufficient to cover 20% of the
average liabilities in the balance sheet.”
Cash flow analysis:
Overall cash in the bank balance increased $3 M, which resulted in a closing bank balance of
$10 M..
The main reason for the increase in the is the amount of the loan ($38,000,000) The growth of
the loan book, and the path of red cash flow figures in operations, investments is concerning,
but the debt has been locked in until December 2013, so there is 2.5 years of opportunity for
rebounding from this.
The loans have funded the new stores, and also the discontinued operations, but the Cash Debt
Coverage and Cash Return on Sales amounts, on balance day, may deter the bank to afford any
further credit. The CEO states that ―Based on current trading conditions and expected working
capital and capital expenditure requirements net bank debt is expected to be between $40m and
$50m at July 2012.‖
Cash from Financing:
The major inflow was the loan, but this is offset by $13M in dividends. The shareholders have
received some rewards for being loyal to the firm, especially in light of the erosion of the share
price. It was predicted in 2011 that ―Given the large decrease in bank balance and weak liquid
ratio, it might be unlikely that Pumpkin Patch can maintain this level of dividend pay -outs in the
future, although it does have a history of this”. This has been confirmed in the interim 2012 year,
as PPL is ‗tightening its belts‘.
With limited cash available for the dividends, and the fair value of the derivatives having an
impact on the balance sheet, it is suggested that PPL would have been unable to fulfil the tests
surrounding dividend payments.
Page 19
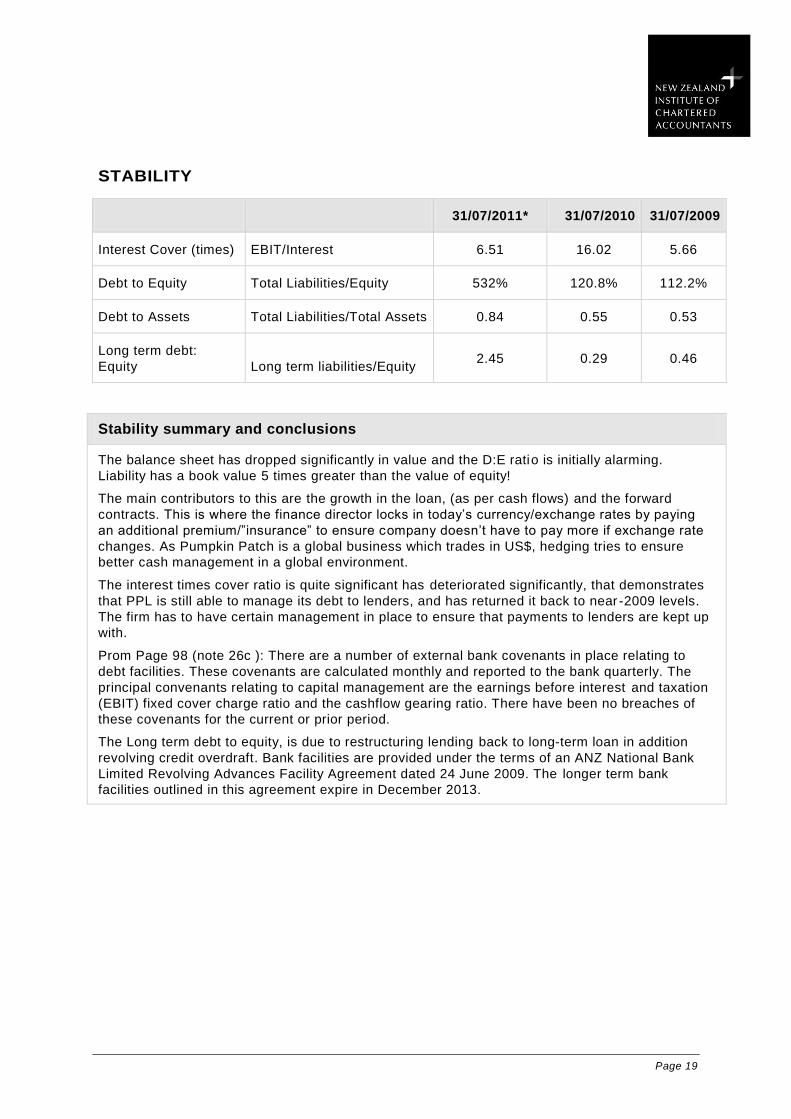
STABILITY
31/07/2011* 31/07/2010 31/07/2009
Interest Cover (times) EBIT/Interest 6.51 16.02 5.66
Debt to Equity Total Liabilities/Equity 532% 120.8% 112.2%
Debt to Assets Total Liabilities/Total Assets 0.84 0.55 0.53
Long term debt:
Equity Long term liabilities/Equity 2.45 0.29 0.46
Stability summary and conclusions
The balance sheet has dropped significantly in value and the D:E ratio is initially alarming.
Liability has a book value 5 times greater than the value of equity!
The main contributors to this are the growth in the loan, (as per cash flows) and the forward
contracts. This is where the finance director locks in today‘s currency/exchange rates by paying
an additional premium/‖insurance‖ to ensure company doesn‘t have to pay more if exchange rate
changes. As Pumpkin Patch is a global business which trades in US$, hedging tries to ensure
better cash management in a global environment.
The interest times cover ratio is quite significant has deteriorated significantly, that demonstrates
that PPL is still able to manage its debt to lenders, and has returned it back to near -2009 levels.
The firm has to have certain management in place to ensure that payments to lenders are kept up
with.
Prom Page 98 (note 26c ): There are a number of external bank covenants in place relating to
debt facilities. These covenants are calculated monthly and reported to the bank quarterly. The
principal convenants relating to capital management are the earnings before interest and taxation
(EBIT) fixed cover charge ratio and the cashflow gearing ratio. There have been no breaches of
these covenants for the current or prior period.
The Long term debt to equity, is due to restructuring lending back to long-term loan in addition
revolving credit overdraft. Bank facilities are provided under the terms of an ANZ National Bank
Limited Revolving Advances Facility Agreement dated 24 June 2009. The longer term bank
facilities outlined in this agreement expire in December 2013.

Page 20
INVESTMENT RETURN
31/07/2011 31/07/2010 31/07/2009
Basic EPS (cents/share)* NPAT/no. of shares -1.12 15.3 1.10
Price Earnings ratio Market Price**/EPS -9.5 12.03 -14.4
Dividend ratio
Dividend paid
p.s./EPS
- 0.09
0.58 5.90
* Negative EPS numbers are usually reported as "not applicable" for periods in which a
company reported a loss. Investors buying a company with a negative P/E should be aware
that they are buying a share of a company that has been losing money per share.
Note that the EPS is based on NPAT before ‗other comprehensive income‘ and using the year
end number of shares.
** Market Price As at 31/7/2011
Investment return summary and conclusions
These figures seem to reflect the comments by the market analysts.
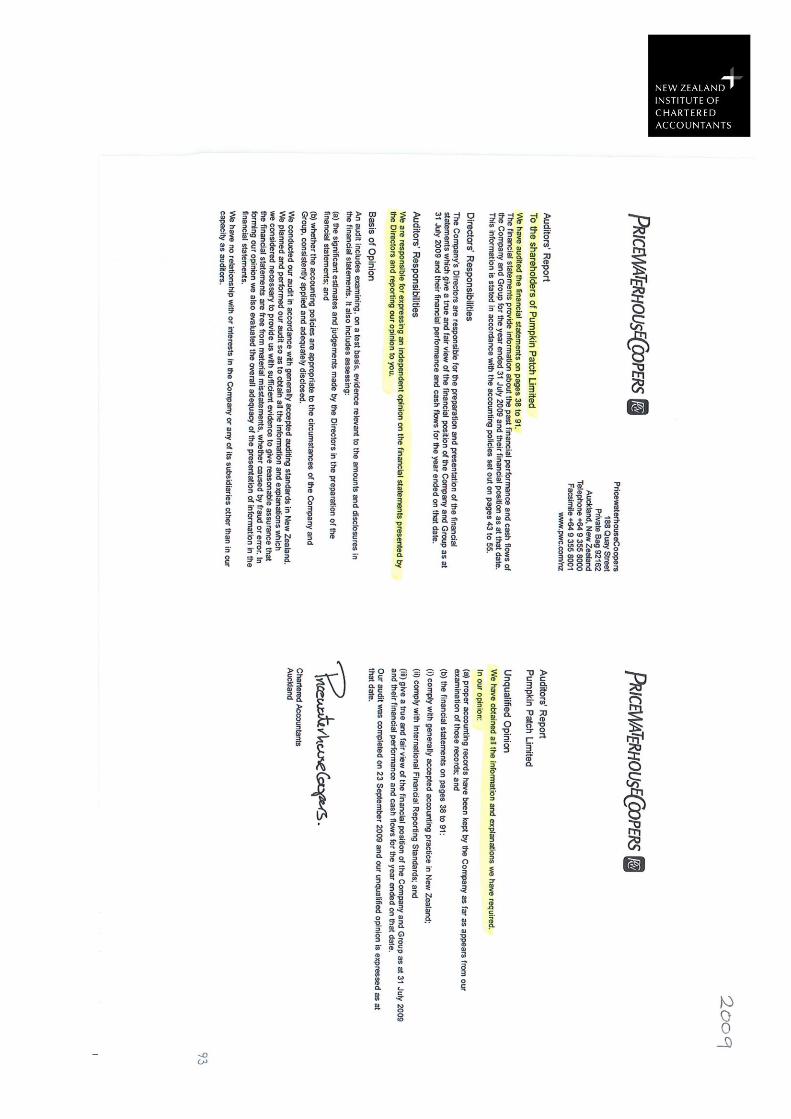
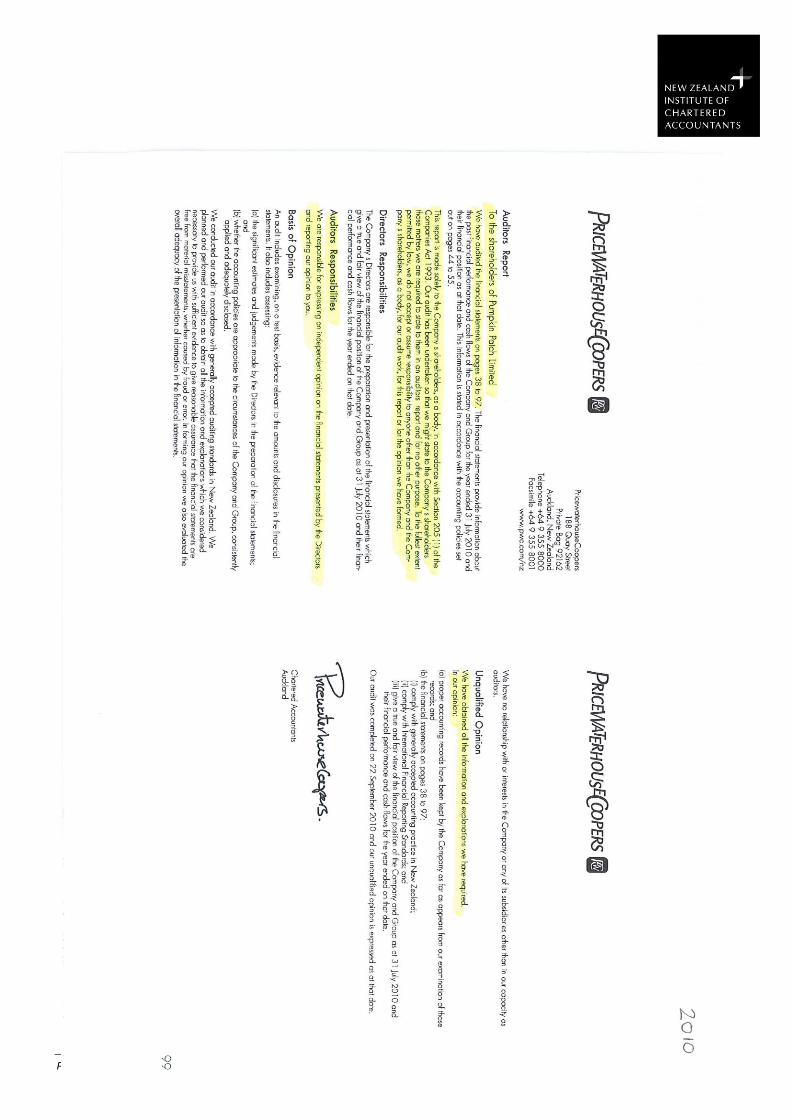
Limitations of just using an annual report:
Auditing engagements have changed significantly in the face of company financial in the past
few years. The following three pages relate to this. Please note the shift from the purpose of the
audit report and the clarity of what the Auditor‘s responsibilities were from 2009-2011.
Additionally the purpose of the audit and the breadth of the audit is very specific now in 2011.
It is important to note that none of the comments made outside the financial report audited.
Page 21
Page 22

Page 23