2012 npdb annual report...report to the npdb adverse actions taken against physicians and dentists....
TRANSCRIPT

National Practitioner Data Bank
2012 Annual Report
February 2014
U.S. Department of Health and Human Services Health Resources and Services Administration
Bureau of Health Professions Division of Practitioner Data Banks

Contents EXECUTIVE SUMMARY ............................................................................................................ 2
PART I ............................................................................................................................................ 3
CHAPTER 1: NATIONAL PRACTITIONER DATA BANK DESCRIPTION ........................... 4 Purpose of the National Practitioner Data Bank ......................................................................... 4 Annual Reporting ........................................................................................................................ 4
CHAPTER 2: NATIONAL PRACTITIONER DATA BANK STATUTES AND REGULATIONS............................................................................................................................. 5
Health Care Quality Improvement Act ....................................................................................... 5 Section 1921 of the Social Security Act ..................................................................................... 5 Reports ........................................................................................................................................ 5
PART II ......................................................................................................................................... 10
CHAPTER 3: ADMINISTERING THE NATIONAL PRACTITIONER DATA BANK ........... 11 Health Resources and Services Administration ........................................................................ 11 Bureau of Health Professions ................................................................................................... 11 Division of Practitioner Data Banks ......................................................................................... 11 Contractor ................................................................................................................................. 13 Executive Committee ................................................................................................................ 13 Operations and Administration Branch .................................................................................... 15 Policy and Disputes Branch ...................................................................................................... 15 Research Branch ....................................................................................................................... 17 Compliance Branch ................................................................................................................... 18
PART III ....................................................................................................................................... 21
CHAPTER 4: REPORTING AND QUERYING ......................................................................... 22 Reporting to the NPDB ............................................................................................................. 22 Querying the NPDB .................................................................................................................. 22 One Time Queries ..................................................................................................................... 24 Continuous Query ..................................................................................................................... 25
CHAPTER 5: WHO AND WHAT IS REPORTED ..................................................................... 28
PART IV ....................................................................................................................................... 36
CHAPTER 6: FUTURE ENDEAVORS AND PROJECTS ......................................................... 37
APPENDICES .............................................................................................................................. 40 Appendix A: Milestones ........................................................................................................... 41 Appendix B: Queries and Reports by Entity Type and Year .................................................... 46 Appendix C: Practitioner Reports by Type, State, and Year .................................................... 52 Appendix D: Medical Malpractice Payment Adjustments by State, Amount, and Delay ....... 63 Appendix E: Summary Tables .................................................................................................. 75
1

2
EXECUTIVE SUMMARY
The National Practitioner Data Bank (NPDB) was created by Title IV of the Health Care Quality Improvement Act of 1986, Public Law 99-660 (HCQIA), as amended, and was implemented in 1990. The NPDB is overseen by the Health Resources and Services Administration (HRSA), Bureau of Health Professions (BHPr), Division of Practitioner Data Banks (DPDB).
The NPDB’s initial purposes were to (1) collect and disseminate information about physicians and dentists to prevent incompetent or unprofessional practitioners from moving from one jurisdiction to another without disclosure or discovery of previously damaging or incompetent performance, and (2) promote professional peer review activities. The overarching intent was to improve patient safety and quality of care. Therefore, Title IV requires medical malpractice payers, hospitals, medical and dental licensing boards, and certain other health care entities to report to the NPDB adverse actions taken against physicians and dentists. The implementation of Section 1921 of the Social Security Act on March 1, 2010, expanded state licensure reporting requirements to include all health care practitioners, not just physicians and dentists.
This Annual Report describes HRSA’s increased efforts during 2012 to educate NPDB reporters about new reporting requirements. The report also highlights data for 2012, and it provides trend data covering the past 10 years.
In 2012, the NPDB expanded its research offerings to include a new Data Analysis Tool that resides on the NPDB’s website. This statistical application permits users to perform specific data analyses and create customized data tables. The website also was updated to include 10 years of statistical data in tabular and graphical form.
The NPDB continued to implement system enhancements throughout 2012. During this time, several Federal Register notices were released. One notice announced changes to the Privacy Act exemption for the NPDB, another invited comments regarding the merger of the Health Integrity and Protection Data Bank (HIPDB) with the NPDB, and a third requested comments on the proposed Survey of Eligible Users of the NPDB, a project launched that same year.
As part of a strategic planning effort, the NPDB began several key initiatives to identify specific high-value opportunities for technology enhancements. The NPDB also launched feasibility studies of new technologies that have the potential to generate significant efficiencies for customers and internal staff.
Also in 2012, the NPDB released the National Practitioner Data Bank 2010 Annual Report, which is available on the NPDB website. HRSA will sunset the NPDB Annual Report, in its current format in 2012. All information contained in the NPDB Annual Report can be found at http://www.npdb.hrsa.gov.

PART I
3

CHAPTER 1: NATIONAL PRACTITIONER DATA BANK DESCRIPTION
Purpose of the National Practitioner Data Bank The National Practitioner Data Bank (NPDB) was established by the Health Care Quality Improvement Act of 1986 (HCQIA) to protect the public by restricting the ability of practitioners to move from State to State or hospital to hospital without disclosing medical malpractice payments or adverse action histories at the time of credentialing, employment, licensing, or monitoring. Implemented in September 1990, the NPDB serves as an electronic repository to collect and release information related to the professional competence and conduct of physicians, dentists, and other health care practitioners. Establishing the NPDB represented an important step by the Department of Health and Human Services (HHS) to promote patient safety and improve the quality of health care for all Americans.
State licensing boards, hospitals, health care entities, and professional societies are expected to identify, discipline, and report on those who engage in unprofessional behavior. The NPDB plays an important role in ensuring quality health care and a skilled health care workforce by providing critical information to health care entities about practitioners. The NPDB serves as an alert or flagging system intended to facilitate a comprehensive review of health care practitioners’ professional credentials. The information contained in the NPDB directs discrete inquiry into, and scrutiny of, a practitioner’s licensure, clinical privileges, professional society memberships, and medical malpractice payment history.
Annual Reporting This edition of the NPDB Annual Report is available on the NPDB website. Previous editions are also accessible on the website.
Aggregated data gleaned from the NPDB are depicted in graphic and tabular forms. Information covering calendar years 2003 through 2012 is presented.
Additional detailed information about the NPDB is provided in the NPDB Guidebook. The Guidebook is available on the NPDB website.
4

CHAPTER 2: NATIONAL PRACTITIONER DATA BANK STATUTES AND REGULATIONS
Health Care Quality Improvement Act Title IV of Public Law 99-660 (42 USC § 11101 et seq.), the Health Care Quality Improvement Act of 1986 (HCQIA), created the NPDB. Issues that led to the adoption of HCQIA included:
♦ An increasing occurrence of medical malpractice and the need to improve the quality of medical care;
♦ A need to restrict the ability of incompetent physicians to move from State to State without disclosure or discovery of the physician’s previous damaging or incompetent performance;
♦ A need for effective professional peer review to protect the public; ♦ The threat of private monetary damages liability discouraging physicians from participating in
effective professional peer review; and ♦ The need to provide incentives and protection for physicians engaging in effective
professional peer review.
The NPDB, implemented in 1990, serves as an electronic repository to collect and release information related to the professional competence and conduct of physicians, dentists, and, in some cases, other health care practitioners. The NPDB is primarily an alert or flagging system intended to facilitate a comprehensive review of health care practitioners’ professional credentials. The information contained in the NPDB is intended to direct discrete inquiry into, and scrutiny of, a practitioner’s licensure, clinical privileges, professional society memberships, and medical malpractice payment history.
Section 1921 of the Social Security Act Initially, the NPDB collected and released information only under HCQIA. However, in 1987, Section 5(b) of the Medicare and Medicaid Patient and Program Protection Act (Section 1921 of the Social Security Act), Public Law 100-93, was enacted. It authorized the Federal Government to collect information concerning sanctions taken by State licensing authorities against all health care practitioners and entities.
On March 1, 2010, regulations went into effect that implemented Section 1921, which expanded the information the NPDB collects and disseminates. The intent of this expansion is to protect the public from any and all unfit health care practitioners and to improve the antifraud provisions of the Social Security Act’s health care programs.
Reports
HCQIA Reporting HCQIA requires NPDB reporters to report medical malpractice payments and adverse actions taken on or after September 1, 1990. With the exception of reports on Medicare or Medicaid exclusions, the NPDB cannot accept any report with a date of payment or a date of action prior to September 1, 1990. State licensing boards, hospitals, other health care entities, and professional societies are expected to identify, discipline, and report on those who engage in
5

unprofessional behavior. With the addition of Section 1921, HCQIA reporting requirements did not change for hospitals, other health care entities, medical malpractice payers and insurers, professional societies with formal peer review processes, the Drug Enforcement Administration (DEA), or the HHS Office of Inspector General (OIG) (See below).
Exclusions from certain Federal Government health care programs are also part of the NPDB. In 1997, an interagency agreement between HHS’ Health Resources and Services Administration (HRSA), the Centers for Medicare & Medicaid Services (CMS), and the HHS OIG included Medicaid and Medicare exclusions in the NPDB. Later that same year, the NPDB made CMS reinstatement reports available to registered users. Thus, Adverse Action Reports submitted to the NPDB expanded to include practitioner exclusions from Medicare and Medicaid in addition to adverse licensure and professional review actions related to clinical privileges and professional society memberships.
Section 1921 Reporting Section 1921 added State licensure actions taken against all types of health care practitioners, not just physicians and dentists, to the NPDB. The section also expanded NPDB reporting requirements to include negative actions or findings by State licensing agencies, peer review organizations, and private accreditation organizations against all health care practitioners and organizations. The following is a description of the reporting requirements under Section 1921.
NPDB Reporters with New Responsibilities under Section 1921 ♦ Boards of medical or dental examiners report:
● Adverse licensure actions against a health care practitioner (not just actions related to competence or conduct against physicians and dentists).
● Any negative action or finding by a State licensing authority against a health care practitioner or entity.1
1 The term “entity” refers to an organization that is licensed or otherwise authorized by a State to provide health care services. This includes, but is not limited to, skilled nursing facilities, ambulatory surgical centers, pharmacies, residential treatment facilities, mental health centers, and ambulance services.
New NPDB Reporters under Section 1921 ♦ Other State practitioner licensing boards report:
○ Adverse licensure actions against a health care practitioner. Any negative action or finding by a State licensing authority against a health care practitioner.
♦ State health care entity licensing authorities report: ○ Adverse licensure actions against a health care entity. Any negative action or finding by a
State licensing authority against a health care entity.
♦ Private accreditation organizations report: ○ Certain final actions taken by the private accreditation organization against a health care
entity.
♦ Peer review organizations report: ○ Recommendations by the peer review organization to sanction a health care practitioner.
6

Combined HCQIA and Section 1921 Reporting
In summary, the following entities are required to report to the NPDB: ♦ State medical and dental boards; ♦ State licensing boards for all other health care practitioners; ♦ State agencies that license health care entities; ♦ Hospitals; ♦ Other health care entities or organizations; ♦ Professional societies that follow a formal peer review process; ♦ Medical malpractice payers; ♦ Private accreditation organizations; and ♦ Peer review organizations.
Government Reporting Reports are collected from private and government entities, including the Armed Services, located in the 50 states and U.S. territories.2
2In addition to the 50 States, the District of Columbia, and Armed Forces installations throughout the world, entities eligible to report and query are located in Puerto Rico, the Virgin Islands, American Samoa, Palau, Guam, the Northern Mariana Islands, the Federated States of Micronesia, and the Marshall Islands.
To obtain information from government entities, the Secretary of HHS entered into memorandums of agreement (MOA) with all relevant Federal agencies and departments. Section 432(b) of the Social Security Act required the Secretary to establish an MOA with the Secretaries of Defense and Veterans Affairs to apply provisions of the SSA to hospitals, other facilities, and health care providers under their jurisdictions. Section 432(c) stipulated that the Secretary also enter into an MOA with the administrator of the Department of Justice, Drug Enforcement Administration (DEA) to ensure the reporting of practitioners whose registrations to dispense controlled substances are suspended or revoked under section 304 of the Controlled Substances Act.
The Secretary of HHS has government agreements in place with the following agencies to ensure compliance with all NPDB-related laws.
♦ Centers for Medicare & Medicaid Services (Interagency Agreement); ♦ Department of Defense (MOA); ♦ Department of Justice, which includes the Bureau of Prisons and the DEA (MOA); ♦ Department of Veterans Affairs (MOA); and ♦ Public Health Service contractors and employees (HHS Policy Directive).
Queries HCQIA requires NPDB reports to be available to hospitals, health care entities with formal peer review, professional societies with formal peer review, state licensing authorities, health care practitioners (self-query only), researchers (non-identifiable data for statistical purposes only), and, in limited circumstances, plaintiff’s attorneys. However, this same information must not be disclosed to the general public. NPDB information should be considered together with other relevant data in evaluating a practitioner’s credentials. The NPDB does not collect full records of reported incidents or actions and is not designed to be the sole source of information about a practitioner or entity. For example, an NPDB medical malpractice payment report does not
7

necessarily indicate negligence on the part of a practitioner because a medical malpractice payment may be made for reasons other than negligence.
Access to NPDB information is available to entities that meet the eligibility requirements defined in the provisions of HCQIA, Section 1921, and NPDB regulations. Medical malpractice insurers cannot query the NPDB.3
3Self-insured health care entities may query for peer review but not for “insurance” purposes.
In order to access NPDB data about practitioners, entities that meet the eligibility requirements must first register with the NPDB.
Queriers under HCQIA also receive Section 1921 information. Hospitals, including their human resources departments and nurse recruitment offices, have access to Section 1921 licensure actions to assist with hiring, privileging, and re-credentialing decisions.
NPDB information is available to the following queriers under HCQIA and Section 1921:
♦ Hospitals (required to query); ♦ Other health care entities (optional query); ♦ State medical and dental boards (optional query); ♦ State licensing boards for other health care practitioners (optional query); ♦ Professional societies that follow a formal peer review process (optional query); ♦ Health care practitioners (self-query only); ♦ Plaintiff’s attorneys (under certain circumstances); and ♦ Researchers requesting aggregated information that does not identify any particular entity or
practitioner (non-identifiable data).
The following queriers have access to information reported to the NPDB under Section 1921 only:
♦ Agencies administering Federal health care programs, including private sector entities administering such programs under contract;
♦ State agencies administering or supervising the administration of State health care programs; ♦ Authorities of a State or its political subdivisions responsible for licensing health care
entities; ♦ State Medicaid fraud control units; ♦ U.S. Attorney General and other law enforcement officials; ♦ U.S. Comptroller General; and ♦ Utilization and quality control peer review organizations (now known as quality
improvement organizations).
Health care practitioners may self-query the NPDB at any time. A plaintiff or an attorney for a plaintiff in a civil action against a hospital may query the NPDB about a specific practitioner in limited circumstances. This is possible only when independently obtained evidence, submitted to HHS, discloses that the hospital did not make a required query on the practitioner. If this is proven, the attorney or plaintiff is provided with information that the hospital would have received if it had queried the practitioner as mandated. This information may be used only against the hospital, not against the practitioner.
8

Fees As mandated by law, user fees, not congressionally appropriated funds, are used to pay for all costs of NPDB operations. The query fee in 2012 was $4.75 for each One-Time Query. The Continuous Query fee was $3.25 per practitioner for an enrollment in the service for one year. The Self-Query fee was $8.00. Queries must be paid for by credit card or via automatic electronic funds transfer.
Confidentiality of NPDB Information Under HCQIA, information reported to the NPDB is considered confidential and cannot be disclosed except as specified in the NPDB regulations. The Privacy Act of 1974 protects from disclosure the contents of Federal records, such as those contained in the NPDB. Authorized queriers must use NPDB information solely for the purposes for which it was provided. The HHS OIG can impose civil monetary penalties on those who violate the confidentiality provisions. Persons, organizations, or entities that receive NPDB information either directly or indirectly are subject to the confidentiality provisions and the imposition of a civil monetary penalty of up to $11,000 for each offense if they violate these provisions. In this Annual Report, data from the records are aggregated and do not disclose the identity of the practitioners or entities in the NPDB.
Civil Liability Protection To encourage and support professional review activity of physicians and dentists, Part A of HCQIA provides that the professional review bodies of hospitals and other health care entities, and persons serving on or otherwise assisting such bodies, are offered immunity from private damages in civil suits under Federal or State law. Immunity provisions apply when professional review responsibilities are conducted with the reasonable belief that they are furthering the quality of health care and with proper regard for due process.
9

PART II
10

CHAPTER 3: ADMINISTERING THE NATIONAL PRACTITIONER DATA BANK
The NPDB is administered by staff members of the Division of Practitioner Data Banks (DPDB). The DPDB resides in HRSA’s Bureau of Health Professions (BHPr), within HHS. Descriptions of HRSA, BHPr, and DPDB are provided below.
Health Resources and Services Administration HRSA, an agency of HHS, is the primary federal agency for improving access to health care services for people who are uninsured, isolated, or medically vulnerable.
Comprising six bureaus and ten offices, HRSA provides leadership and financial support to health care providers in every State and U.S. territory. HRSA grantees provide health care to uninsured people, people living with HIV/AIDS, pregnant women, mothers, and children. Additionally, HRSA grantees train health professionals and improve systems of care in rural communities.
HRSA oversees organ, bone marrow, and cord blood donation. It supports programs that prepare against bioterrorism, compensates individuals harmed by vaccination, and maintains the NPDB and the Health Integrity and Protection Data Bank (HIPDB), collectively known as the Data Bank.
Since 1943, the agencies that were HRSA precursors have worked to improve the health of needy people. HRSA was created in 1982, when the Health Resources Administration and the Health Services Administration were merged.
Bureau of Health Professions The Bureau of Health Professions increases the Nation’s access to quality health care, especially for underserved people, by developing, distributing and retaining a diverse, culturally competent health workforce that can adapt to the population’s changing health care needs and provide the highest quality of care for all.
Division of Practitioner Data Banks DPDB, a component of BHPr, operates the NPDB and the HIPDB. DPDB is committed to developing and operating cost-effective and efficient systems that offer accurate, reliable, and timely information on practitioners, providers, and suppliers to credentialing, privileging, and government authorities.
DPDB actively addresses its mission by working closely with stakeholders – such as State licensing boards and health care entities – to ensure that all disciplinary actions are reported to the Data Bank, by monitoring data entry accuracy and completeness, and by making presentations to a variety of audiences representing State licensing boards and professionals in the health care and private sector industries.
11

In 2012, DPDB presented information about the Data Bank to stakeholders and constituents across the country (Figure 1).
Figure 1: Presentations by DPDB
▪ Anchorage, AK ▪ Tuscaloosa, AL ▪ Sacramento, San Diego, and San Francisco, CA ▪ Denver, CO ▪ Washington, DC ▪ Orlando and Seminole, FL ▪ Des Moines, IA ▪ Chicago, IL ▪ New Orleans, LA ▪ Boston, MA ▪ Annapolis, MD ▪ Bangor, ME ▪ Jackson, MS ▪ Las Vegas, NV ▪ Bend, OR ▪ Nashville, TN ▪ Fort Worth, TX ▪ Charlottesville and Hot Springs, VA ▪ Green Bay, WI
12
Contractor The NPDB information technology system is operated by a contractor, SRA International, Inc. (SRA), which began doing so in June 1995. SRA replaced Unisys Corp., which operated the NPDB from its opening on September 1, 1990. SRA created the Integrated Querying and Reporting Service (IQRS), an Internet reporting and querying system for the NPDB and the HIPDB.
Executive Committee The NPDB Executive Committee was established in February 1989 to provide from individual members guidance, recommendations for improvement, and health care expertise to the NPDB contractor on NPDB operations. No consensus advice or recommendations from group deliberation are provided. However, the committee, through its work with DPDB, provides valued, individual feedback on NPDB processes.
The committee is composed of 32 organizational representatives from HRSA and other Federal agencies, various health professions, national health organizations, State professional licensing agencies, medical malpractice insurers, and public advocacy organizations. The committee serves as a forum for these organizations that share a stake in the NPDB to discuss NPDB operations and policy. A chair and vice chair of the committee are elected for 2-year terms by Executive Committee members. Committee members from private organizations have 3-year renewable, staggered terms. Federal agencies, such as the Department of Defense and the HHS OIG, participate on the committee without term limits. The Executive Committee meets periodically with the contractor and DPDB. A webinar was held with the Executive Committee on May 2, 2012. The committee met in person on November 8, 2012, in Washington, DC, where an election of officers took place. The new incoming chair is Ralph W. Hale, M.D., F.A.C.O.G., of the American College of Obstetricians and Gynecologists, and the new incoming vice chair is Lisa A. Robin, M.L.A., of the Federation of State Medical Boards.
13

Figure 2: Organizational Structure of the DPDB
DPDB Office of the
Director
Compliance Branch
Operations and Administration
Branch
Policy and Disputes Branch
Research Branch
14

Branch Highlights and Activities The DPDB is composed of four branches – Operations and Administration, Policy and Disputes, Research, and Compliance. Major branch activities in 2012 are listed below.
Operations and Administration Branch The Operations and Administration Branch is primarily responsible for managing the technological, financial, administrative, and contractual functions that support DPDB’s mission. The branch is also responsible for formulating and maintaining DPDB’s budget, and for other administrative functions. To support the needs of the Data Bank user base, the branch oversees operational aspects of the Data Bank, including a customer service center, system maintenance and enhancements, query fee processing, document management, and the publication of newsletters. Branch employees plan and manage system enhancements to make the Data Bank system more user-friendly, to improve data quality, and to ensure reliability. Additionally, the branch completed the selection process for the fifth generation Data Bank contract.
The Operations and Administration Branch provided oversight of the following:
♦ Streamlined the entity registration process, allowing users to correctly choose their statutory authorities using a wizard-like tool.
♦ Enabled online registration renewal, allowing entities to bypass the 2-week paper process and renew online instantly.
♦ Eliminated mailing paper reports, thereby reducing paper consumption by 200,000 sheets annually and boosting data security.
♦ Created an electronic process to automatically forward reports directly to licensing boards, to facilitate improved information sharing.
♦ Improved overall system performance for reports, reducing response time from between 2 hours and 4 hours down to a few seconds.
♦ Reduced the risk of downtime and improved overall system responsiveness, especially during periods of peak use.
♦ Introduced enhancements to boost data integrity and compliance. ♦ Enabled a new approach that helps users see connections between different reports, helping to
tell the story of an incident or action. ♦ Prepared the behind-the-scenes database changes needed to merge the HIPDB with the
NPDB, expected during 2013. ♦ Improved Data Bank Customer Service Center operations by leveraging new cloud-based
customer relationship management software.
In addition, the Data Bank newsletter was converted from a traditional printed version to an electronic-only format. This effort is saving the Federal Government more than $50,000 in printing and postage costs and reducing paper consumption by 256,000 pages annually. The electronic newsletter is now delivered monthly, rather than quarterly, giving Data Bank users information in a more timely manner.
Policy and Disputes Branch The Policy and Disputes Branch writes policy guidelines for the Data Bank; answers policy questions from health care entities, attorneys, government officials, and practitioners; educates
15

users about Data Bank programs; makes presentations at health care conferences and meetings; ensures compliance with reporting and querying requirements; and creates fact sheets, articles, and other texts for the Data Bank’s website and other locations. The branch also facilitates a Dispute Resolution process, which results from practitioners disputing reports in the Data Bank. If a reporting entity does not resolve a practitioner’s concerns, the practitioner may ask for Dispute Resolution. A final determination is then made on whether a report should remain unchanged, be modified, or be voided.
Branch highlights for 2012 included the following:
♦ DPDB staff coordinated and conducted 37 professional presentations or exhibits for Data Bank users and stakeholders across the country, including five webinars.
♦ The DPDB hosted two educational forums in the United States – Nashville, September 26-27, and Denver, October 10-11. The purpose of these forums was to help attendees understand their Data Bank reporting and querying requirements and to inform them about the latest Data Bank initiatives. Forums included educational briefings on the following: overview of the Data Bank, Data Bank reporting and querying requirements, Data Bank system enhancements and security, and new and upcoming Data Bank features.
♦ A Notice of Proposed Rulemaking was published in the Federal Register on February 15, 2012, announcing the merger of the HIPDB with the NPDB.
♦ The System of Records Notice for the NPDB was updated to reflect changes in the Privacy Act exemptions for the NPDB. A final notice was published in the Federal Register on March 30, 2012.
♦ Policy staff worked with the Department of Veterans Affairs, CMS, and the HHS OIG to ensure that Federal partners were prepared for changes that will go into effect after the merger of the NPDB and the HIPDB.
♦ In 2012, a total of 103 reports were elevated to Dispute Resolution and 113 cases were closed. Both the elevations and closures were the highest in Data Bank history. Several reports closed in 2012 were elevated prior to 2012.
♦ The Disputes staff continued to build and use an electronic Disputes Tracker system to rely less on paper files, including developing an electronic workflow, secure messaging, and a repository of cases.
♦ Weekly disputes reports were eliminated due to automatically generated data tables from the Disputes Tracker.
♦ Innovative training materials were developed by Dispute team members, including a video on how to put together dispute case materials and a PowerPoint tutorial on how to use the Disputes Tracker.
♦ Practitioners who elevated their reports to Dispute Resolution now have a more user-friendly Report Response Service, developed in 2012, allowing them to see where they are in the process.
♦ An article for the National Council of State Boards of Examiners for Speech-Language Pathology and Audiology (NCSB) was written and published in the NCSB newsletter. It included information on the Data Bank and Section 1921, and tables showing the reporting of speech-language pathologists and audiologists. The NCSB called it “just what NCSB needs to get out to member boards and licensees.”
♦ Several Data Bank fact sheets for allied professions were created in 2012. Fact sheets have been developed for nurses, chiropractors, and pharmacists. Each fact sheet contains
16

information on who can be reported to the Data Bank for what actions, as well as instructions on how to dispute a report. Completed fact sheets were posted on the Data Bank website.
♦ The Policy team responded to inquiries elevated from the Data Bank Customer Service Center, correspondence from the White House, and policy-related emails and phone calls. Types of inquiries and correspondence included complaints against practitioners, attorney access, State and Federal subpoenas, State board issues, and policy clarifications.
Research Branch The Research Branch is responsible for creating in-house research files and Public Use Files by selecting, merging, and recoding variables from the NPDB and the HIPDB. The Research Branch also creates and updates web-based statistics and produces the NPDB Annual Report. Other functions of the Research Branch include providing aggregated data to internal and external stakeholders and performing quality control checks for data accuracy. The Research Branch also provides information to other DPDB branches to support their work.
Branch highlights for 2012 include the following:
♦ A web-based Data Analysis Tool was developed and implemented to facilitate independent analysis of information relating to medical malpractice payments and adverse actions. The new tool allows a wide range of users to perform unique analyses that can be customized by State or region, making it possible for stakeholders to identify trends of interest and to target their resources on areas of concern. The Research Branch was recognized with an Outstanding Performance Award at the HRSA level for this effort.
♦ The Research Branch also developed NPDB statistics by State that are available in table and trend plot formats that can be accessed using an interactive map of the United States.
♦ The Research Branch used NPDB administrative data and information from an external data source to begin the process of validating existing NPDB system information. Combining the NPDB data with information from an outside data source is also providing answers to more research questions than would have been possible using NPDB data alone.
♦ The Research Branch examined information residing in the Data Bank that is collected in non-mandatory fields by the reporting system.
♦ The Research Branch procured a contract to administer a survey of eligible Data Bank users to obtain a comprehensive view of the usability and customer satisfaction with Data Bank products and services. Work on this contract began in the fall of 2012 and is expected to continue for 2 years.
♦ The Public Use File was downloaded an average of three to four times per day. ♦ Data Requests
○ The Research Branch responded to 70 data requests and inquiries from external users and more than 25 requests from other DPDB branches and other HHS staff.
○ The Research Branch completed 23 reports for 20 medical boards and boards of osteopathic medicine from 19 states (Alabama, Arkansas, California, Delaware, Florida, Hawaii, Kansas, Missouri, Montana, Nebraska, Nevada, New Jersey, New York, North Carolina, Ohio, Oklahoma, Utah, Washington, and Wisconsin). For this project, the Research staff verified the number of physicians with one or more clinical privilege action in the Data Bank but no licensure action in those states.
17

♦ The Research Branch conducted a session that was open to all HRSA employees to introduce research that combined NPBD data with physician specialty information from an external data source.
Compliance Branch The Compliance Branch acts to improve the completeness and accuracy of data reported to the HIPDB and the NPDB. The Compliance Branch works actively with State agencies on an Adverse Action Comparison Project and a Never Reported Professions Compliance Effort. The web-based technologies supporting these State agency compliance efforts were significantly improved, reducing the number of manual steps in various compliance processes. In addition, the results of these efforts can now be viewed on a U.S. map of compliance statistics by State.
Specific compliance efforts in 2012 included:
♦ Never Reported Professions: Compliance staff continued to work with licensing boards that never reported disciplinary actions to the Data Bank. For this effort, staff identified specific professions and contacted the State licensing boards for those professions. Data Bank staff continued to work closely with these agencies to ensure they (1) understood the Data Bank reporting requirements, (2) registered with the Data Bank (if they were previously unregistered), (3) reported all reportable disciplinary actions they had taken, and (4) attested that they would continue to report in the future. At the end of 2012, 88 percent of the professions reviewed were compliant with reporting requirements. Table 1 details the compliant professions through the 2011 and 2012 public postings, as well as new reports to the Data Bank and the number of disclosures of these new reports from the Data Bank as a direct result of this effort.
♦ Adverse Licensure Action Comparison Project: For this effort, Data Bank staff compared publicly available disciplinary action data against reports contained in the Data Bank to verify that the disciplinary actions were reported as required by law. When data were not publicly available, staff requested data from State licensing boards. Staff continued efforts to verify, by a one-to-one match, that all licensure actions taken by State licensing boards had been reported to the Data Bank when required by law. In 2012, staff continued working with the State licensing boards that regulate nurses, pharmacists, physician assistants, podiatrists, psychologists, social workers, physicians, dentists, chiropractors, optometrists, and physical therapists, and it added behavioral health professions to the effort. By the end of 2012, 96 percent of all professions in the effort were compliant with Data Bank reporting requirements. Table 1 details the compliant professions by public posting and profession.
♦ Compliance efforts resulted in 3,919 new reports added to the Data Bank that may not have been submitted otherwise. In addition, there were 6,331 disclosures of these new reports.
♦ Communications: To assist States in their efforts to comply with Data Bank reporting requirements, staff conducted or participated in a variety of outreach education activities, including webinars, teleconferences, and presentations to State and national organizations. Staff provided a webinar for State licensing boards focusing on a new 2-year cycle of compliance activities for the 12 most-queried professions: physicians, dentists, nurses, pharmacists, physician assistants, podiatrists, psychologists, social workers, chiropractors, optometrists, physical therapists, and the behavioral health professions. The first compliance status posting (approximately one-quarter of the boards in this review) for this new effort will be April 1, 2013. The webinar also demonstrated new web-based technology available to all
18

State licensing boards when involved in a Data Bank compliance activity. Staff used the Data Bank Customer Service Center, email, telephone, and secure messaging to provide ongoing technical assistance to various stakeholder groups.
♦ Technological Improvements: In November 2012, DPDB released a web-based technology solution for compliance, directly linked to the Data Bank database. This system introduced innovative applications, allowing staff and users to manage, organize, and communicate about missing licensure action data. The new system consolidates information into one location for users, and it improves the efficiency, accuracy, retention, and security of compliance-related data.
♦ The Data Bank began a hospital compliance initiative in 2012 to better understand and improve querying activity and the completeness and accuracy of reports submitted to the Data Bank. This effort included: ● Convening a variety of Data Bank stakeholder groups with the intent to obtain the
viewpoints from individual attendees to better understand the role the Data Bank plays relative to individual users and health care organizations. The results of the group discussions concerning individual experiences will serve to inform the development of the Data Bank hospital compliance framework.
● Beginning a comparative analysis to identify eligible hospitals and health care entities that may not be registered with the Data Bank and to determine reporting and querying activity trends.
19

Table 1: Adverse Licensure Action Comparison Project Compliance Status by Profession Compliance Status Public Posting
Number of Compliant Professions
Profession July 1 2010
Oct 1 2010
Apr 1 2011
July 1 2011
Oct 1 2011
Dec 1 2011
July 1 2012
New Reports Disclosures
Nurse 7 22 46 49 50 50 51 476 185 Pharmacist 0 19 39 41 41 41 48 1,039 283 Physician Assistant 5 43 46 48 48 48 48 31 125 Podiatrist 3 38 43 45 45 45 45 14 84 Psychologist 1 33 44 46 47 48 50 78 107 Social Worker 0 29 45 46 46 48 50 226 134 Physician - - 68 87 95 99 102 776 3,397 Dentist - - 41 47 48 49 50 467 1,474 Chiropractor - - - - 50 51 51 288 270 Optometrist - - - - 50 51 51 41 91 Physical Therapist - - - - 82 83 85 83 22 Behavioral Health - - - - - - 286 400 159 Never Reported Professions 261 415 493 490 494 494 413 16,349 753
Adverse Licensure Total
3,919 6,331
Grand Total 20,258 7,084 Percent Compliant
Profession July 1 2010
Oct 1 2010
Apr 1 2011
July 1 2011
Oct 1 2011
Dec 1 2011
July 1 2012
New Reports Disclosures
Nurse 13% 43% 90% 96% 98% 98% 98% Pharmacist 0 40 83 87 87 87 94 Physician Assistant 10 90 96 100 100 100 100 Podiatrist 7 83 93 98 98 98 98 Psychologist 2 65 86 90 92 94 98 Social Worker 0 59 92 94 94 98 98 Physician - - 67 86 94 98 100 Dentist - - 80 92 94 96 98 Chiropractor - - - - 98 100 100 Optometrist - - - - 98 100 100 Physical Therapist - - - - 82 83 85 Behavioral Health - - - - - - 89 Never Reported Professions 39 63 74 74 77 77 88 Note: Grand Total includes Never Reported. Behavioral Health includes professions related to mental or behavioral health other than those listed separately; includes various types of counselors, therapists, and addiction professionals. For some professions, DPDB separated out groupings for the public posting. New Reports are the number of new reports in the Data Bank as a result of the compliance effort. Disclosures are the total number of times the New Reports were viewed by a registered Data Bank entity or seen as a result of a self-query. A search on a practitioner that does not result in a matched Data Bank report is not counted as a disclosure. One report may account for more than one disclosure – i.e., a report that is disclosed to five different queriers is counted as five disclosures.
20

PART III
21

CHAPTER 4: REPORTING AND QUERYING
Reporting to the NPDB The statutes and regulations governing the information and types of entities (Table 2) that are required to submit reports to the NPDB were described in Chapter 1.
Table 2: Entities that Report to the NPDB Entity Report
State Medical and Dental Boards
Required to report on licensure disciplinary actions, e.g., revocation, suspension, voluntary surrender while under investigation, license restriction, and any negative action or finding.
State Licensing Boards for Other Health Care Practitioners
Required to report in generally the same manner as State medical and dental boards.
Hospitals
Required to report on adverse professional review actions related to professional competence or conduct that impact physician or dentist privileges or panel memberships for more than 30 days. Required to report a physician’s or dentist’s voluntary surrender or restriction of clinical privileges or panel memberships while being investigated for possible professional incompetence or improper professional conduct or in return for an entity not conducting an investigation or taking a reportable professional review action.
Health Care Entities* Required to report in the same manner as hospitals. Professional Societies that Follow a Formal Peer Review Process
Required to report on adverse professional review actions based on reasons related to professional competence or professional conduct that adversely affects a physician’s or a dentist’s membership.
Medical Malpractice Payers
Required to report all medical malpractice payments when an entity makes a payment for the benefit of a health care practitioner in settlement or in satisfaction, in whole or in part, of a claim or judgment against that practitioner.
Peer Review Organizations Required to report recommendations to sanction a health care practitioner.
Private Accreditation Organizations
Required to report certain final actions taken by the private accreditation organization against a health care entity that is licensed or otherwise authorized by a State to provide health care services.
State Agencies that License Health Care Entities
Required to report in the same manner as State medical and dental boards.
*Health care entities or organizations must provide health care services, directly or indirectly, and follow a formal peer review process for the purpose of furthering quality health care.
Querying the NPDB The statutes and regulations authorizing entities to query the NPDB were described in Chapter 2 (See Table 3 for details).
The NPDB can be queried using a One-Time Query or Continuous Query. When using the One-Time Query method, entities submit individual queries on a practitioner or entity and receive a copy of reports stored on the practitioner or entity at the time of the query.
To use Continuous Query, entities must first enroll their practitioners in this service. Entities with enrolled practitioners receive copies of reports stored on their practitioner(s) and 22

automatically receive notice of new and updated reports in real time. Entities enroll practitioners for one year and may renew that enrollment annually.
Queries submitted by either method may or may not receive a matched report. Matched reports are generated when the information on the query matches information on an active report stored in the Data Bank.
Table 3: Entities that Query the National Practitioner Data Bank Entity Query
State Medical and Dental Boards Optional. State Licensing Boards for Other Health Care Practitioners Optional.
Hospitals
Required to query on all applicants for medical staff appointments or when granting, adding to, or expanding clinical privileges, and every two years to review clinical privileges, and as needed.
Health Care Entities* Optional. Professional Societies that Follow a Formal Peer Review Process Optional.
Health Care Practitioners May self-query. Medical Malpractice Payers Prohibited. Peer Review Organizations Prohibited. Quality Improvement Organizations Optional.** Private Accreditation Organizations Prohibited. State Medicaid Fraud Control Units and Law Enforcement Agencies Optional.**
Agencies Administering Federal Health Care Programs and their Contractors Optional.**
State Agencies Administering State Health Care Programs Optional.**
State Agencies that License Health Care Entities Optional.** U.S. Comptroller General Optional.**
Plaintiff’s Attorneys May query when a hospital failed to make a mandatory query of a practitioner and both the hospital and practitioner are named in a medical malpractice action.
*Health care entities or organizations must provide health care services, directly or indirectly, and follow a formal peer review process for the purpose of furthering quality health care. **These organizations and agencies may receive only information reported to the NPDB under Section 1921.
23

One Time Queries Between 2003 and 2012, the number of One-Time Queries increased from 3.3 million to 4.3 million (Figure 3). The number of One-Time Queries that matched to reports increased from 445,004 in 2003 to 604,889 in 2010; the number declined in 2011 and then increased in 2012 (577,565 and 592,230 respectively).
Figure 3: One-Time Queries, 2003 - 2012
0
500,000
1,000,000
1,500,000
2,000,000
2,500,000
3,000,000
3,500,000
4,000,000
4,500,000
2003 2004 2005 2006 2007 2008 2009 2010 2011 2012
Num
ber
of q
ueri
es
Year
Total Queries Queries Matched to Reports
24

Continuous Query The Data Bank introduced Continuous Query in May 2007 in response to growing interest from the health care community for ongoing practitioner monitoring. Organizations that enroll their practitioners in Continuous Query receive an initial query response, followed by continuous, around-the-clock monitoring on their practitioners. Continuous Query is popular with users for its prompt and automatic notices of new information, its ease of use, and the time it saves by effectively automating querying. As a result, Continuous Query usage among all types of organizations, big and small, has grown substantially since 2007.
Between 2008 and 2012, the number of Continuous Query enrollees increased dramatically from 206,128 to 1,202,472 (Figure 4). At the same time, the number of enrollees that matched to reports increased from 22,695 to 165,743 for the same time period.
Figure 4: Continuous Query Enrollees, 2008 - 2012
0
200,000
400,000
600,000
800,000
1,000,000
1,200,000
1,400,000
2008 2009 2010 2011 2012
Num
ber
of e
nrol
lees
Year
Total Enrollees Enrollees Matched to Reports
25

Figure 5: Queries Matched to Data Bank Reports by Query Type, 2008 - 2012
11.0% 12.8% 13.1% 13.0% 13.8%
14.1% 14.0% 14.1% 13.8% 13.7%
0%
5%
10%
15%
2008 2009 2010 2011 2012
Continuous One Time
Between 2008 and 2012, the trend in the match rates for One-Time Queries and Continuous Queries did not differ substantially (Figure 5). The match rate for One-Time Queries showed a slow decline from 14.1 percent to 13.7 percent. For the same time period, match rates for Continuous Queries increased slightly from 11 percent to 13.8 percent.
26
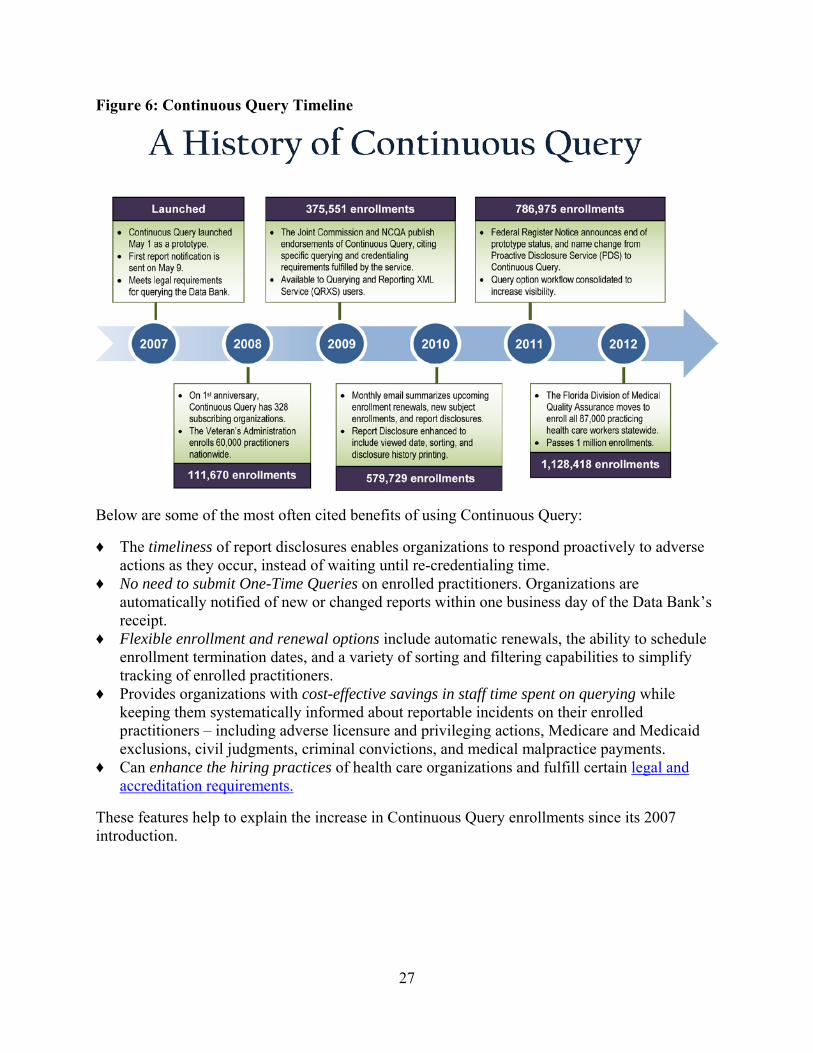
Figure 6: Continuous Query Timeline
Below are some of the most often cited benefits of using Continuous Query:
♦ The timeliness of report disclosures enables organizations to respond proactively to adverse actions as they occur, instead of waiting until re-credentialing time.
♦ No need to submit One-Time Queries on enrolled practitioners. Organizations are automatically notified of new or changed reports within one business day of the Data Bank’s receipt.
♦ Flexible enrollment and renewal options include automatic renewals, the ability to schedule enrollment termination dates, and a variety of sorting and filtering capabilities to simplify tracking of enrolled practitioners.
♦ Provides organizations with cost-effective savings in staff time spent on querying while keeping them systematically informed about reportable incidents on their enrolled practitioners – including adverse licensure and privileging actions, Medicare and Medicaid exclusions, civil judgments, criminal convictions, and medical malpractice payments.
♦ Can enhance the hiring practices of health care organizations and fulfill certain legal and accreditation requirements.
These features help to explain the increase in Continuous Query enrollments since its 2007 introduction.
27

CHAPTER 5: WHO AND WHAT IS REPORTED
The types of practitioners reported to the NPDB include, but are not limited to, the following:
♦ Physicians (MDs and DOs) ♦ Dentists ♦ Professional nurses (RNs and APRNs) ♦ Para-professionals ♦ Assisted devices services practitioners ♦ Chiropractors ♦ Complementary medicine practitioners ♦ Counselors and marriage or family therapists ♦ Dental assistants and hygienists ♦ Dietitians and nutritionists ♦ Emergency medical technicians ♦ Medical assistants ♦ Occupational therapists and assistants ♦ Optometrists ♦ Pharmacists and assistants ♦ Physical therapists and assistants ♦ Physician assistants ♦ Podiatrists and assistants ♦ Psychologists and assistants and associates ♦ Respiratory therapists and technologists ♦ Speech and language pathologists and audiologists ♦ Social workers ♦ Other technologists and technicians ♦ Other rehab or restorative service practitioners ♦ Lay midwives (non-nurse) ♦ Health care facility administrators
28

Over the years, the number of reports processed annually by the NPDB has increased substantially. Between 2009 and 2010, the number of reports submitted annually to the NPDB more than doubled (Table 4). This dramatic increase may, in part, represent the impact of implementing Section 1921 as well as the submission of several multi-year report files. The implementation of Section 1921 coupled with the increased efforts on the part of the DPDB’s Compliance Branch produced large numbers of Adverse Action Reports processed in 2010.
Table 4: NPDB Reports by Type and Processed Year, 1990 - 2012
Number of Reports Percent of All Reports Processed
Year All Malpractice Adverse Action Malpractice
Adverse Action
1990 2,320 2,108 212 90.9% 9.1% 1991 21,086 17,772 3,314 84.3 15.7 1992 23,498 19,751 3,747 84.1 15.9 1993 23,284 19,242 4,042 82.6 17.4 1994 24,295 19,647 4,648 80.9 19.1 1995 22,197 17,677 4,520 79.6 20.4 1996 23,940 18,897 5,043 78.9 21.1 1997 23,126 18,264 4,862 79.0 21.0 1998 22,348 17,296 5,052 77.4 22.6 1999 24,787 18,677 6,110 75.3 24.7 2000 61,832 19,131 42,701 30.9 69.1 2001 36,784 20,353 16,431 55.3 44.7 2002 39,319 18,817 20,502 47.9 52.1 2003 42,173 18,683 23,490 44.3 55.7 2004 38,627 17,549 21,078 45.4 54.6 2005 39,395 17,150 22,245 43.5 56.5 2006 40,041 15,703 24,338 39.2 60.8 2007 39,953 14,457 25,496 36.2 63.8 2008 52,746 14,095 38,651 26.7 73.3 2009 43,344 14,590 28,754 33.7 66.3 2010 115,521 14,399 101,122 12.5 87.5 2011 85,554 13,308 72,246 15.6 84.4 2012 76,839 12,598 64,241 16.4 83.6
Total 923,009 380,164 542,845 41.2% 58.8% Note: Processed Year is the year the report was submitted to the NPDB. 1990 is a partial year, September – December. Totals include reports from the 50 States, the District of Columbia, Armed Forces installations, and the territories.
29
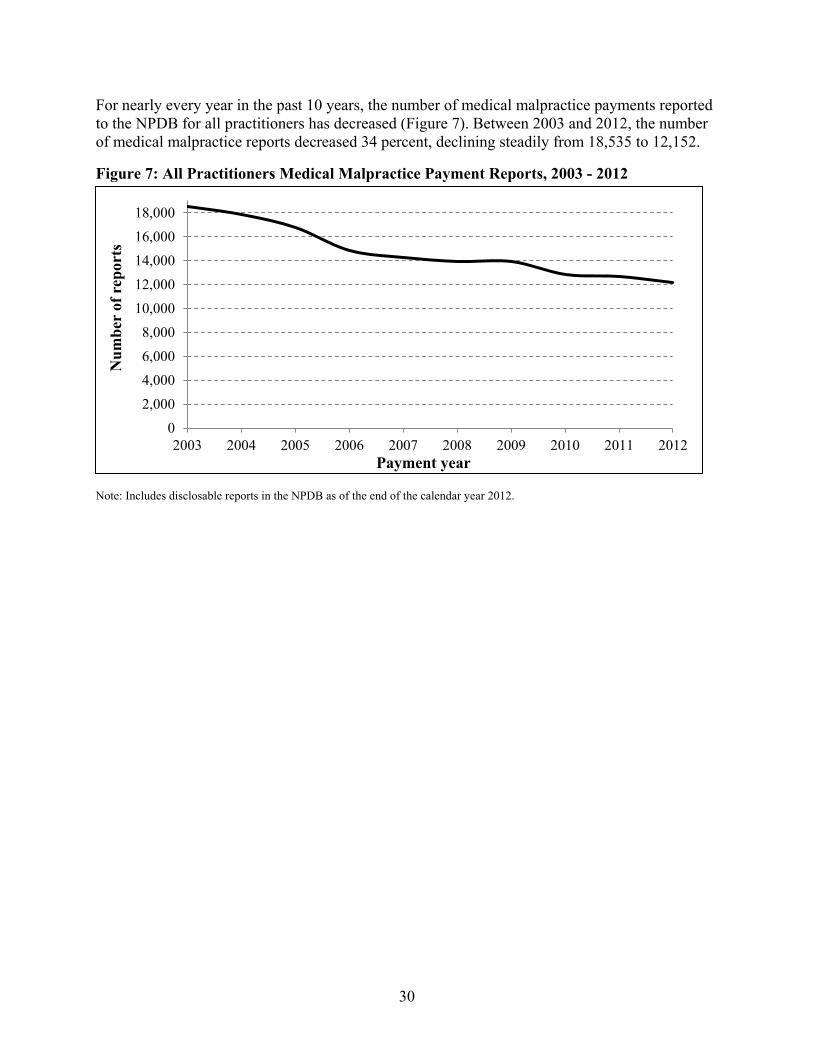
For nearly every year in the past 10 years, the number of medical malpractice payments reported to the NPDB for all practitioners has decreased (Figure 7). Between 2003 and 2012, the number of medical malpractice reports decreased 34 percent, declining steadily from 18,535 to 12,152.
Figure 7: All Practitioners Medical Malpractice Payment Reports, 2003 - 2012
02,0004,0006,0008,000
10,00012,00014,00016,00018,000
2003 2004 2005 2006 2007 2008 2009 2010 2011 2012
Num
ber
of r
epor
ts
Payment year
Note: Includes disclosable reports in the NPDB as of the end of the calendar year 2012.
30

In contrast to medical malpractice payment reporting, the number of Adverse Action Reports for all practitioners has increased nearly every year in the past 10 years (Figure 8). Between 2003 and 2012, the number of Adverse Action Reports increased 65 percent, from 27,780 to 45,830.
Figure 8: All Practitioner Adverse Action Reports, 2003 - 2012
Note: Includes disclosable reports in the NPDB as of the end of calendar year 2012; voided reports have been excluded. Adverse Action Reports include reinstatements, restorations, state licensure, clinical privilege, and professional society membership actions, Medicare and Medicaid exclusions, and DEA actions. Since the implementation of Section 1921 in September 2010, state licensure reports include reports for both practitioners and organizations.
05,000
10,00015,00020,00025,00030,00035,00040,00045,00050,000
2003 2004 2005 2006 2007 2008 2009 2010 2011 2012
Num
ber
of r
epor
ts
Action year
31

In the past 10 years, the number of medical malpractice payments reported to the NPDB attributed to physicians and dentists has decreased steadily from 17,088 to 10,585, representing a 38 percent decline (Figure 9).
Figure 9: Physician and Dentist Medical Malpractice Payment Reports, 2003 - 2012
02,0004,0006,0008,000
10,00012,00014,00016,00018,000
2003 2004 2005 2006 2007 2008 2009 2010 2011 2012
Num
ber
of r
epor
ts
Payment year
Note: Includes disclosable reports in the NPDB as of the end of calendar year 2012; voided reports have been excluded.
32

In the past 10 years, the number of Adverse Action Reports attributed to physicians and dentists presented a different trend from that of medical malpractice payments. Between 2003 and 2012, the number of adverse actions reported to the NPDB related to physicians and dentists increased from 6,149 to 7,765, representing a 26 percent increase (Figure 10).
Figure 10: Physician and Dentist Adverse Action Reports, 2003 - 2012
01,0002,0003,0004,0005,0006,0007,0008,0009,000
2003 2004 2005 2006 2007 2008 2009 2010 2011 2012
Num
ber
of r
epor
ts
Action year Note: Includes disclosable reports in the NPDB as of the end of calendar year 2012; voided reports have been excluded. Adverse Action Reports include reinstatements, restorations, state licensure, clinical privilege, and professional society membership actions, Medicare and Medicaid exclusions, and DEA actions.
33

The number of adverse actions reported to NPDB related to nurses in 2012 was nearly double that for 2003 (22,741 and 12,289 respectively). The number of reports increased steadily between 2003 and 2005 and then remained relatively stable through 2009 (Figure 11). Between 2009 and 2011, the number of adverse actions reported to NPDB related to nurses increased 25 percent (from 16,951 to 22,597) reflecting the implementation of Section 1921.
Figure 11: Nurses Adverse Action Reports 2003 - 2012
0
5,000
10,000
15,000
20,000
25,000
2003 2004 2005 2006 2007 2008 2009 2010 2011 2012
Num
ber
of r
epor
ts
Action year Note: Includes disclosable reports in the NPDB as of the end of calendar year 2012; voided reports have been excluded. Adverse Action Reports include reinstatements, restorations, state licensure, clinical privilege, and professional society membership actions, Medicare and Medicaid exclusions, and DEA actions.
34

Between 2003 and 2012, the number of adverse actions reported to NPDB related to practitioners other than physicians, dentists, and nurses increased 64 percent (Figure 12). After increasing steadily between 2003 and 2011 (from 9,342 to 16,175), the number of adverse actions reported to NPDB related to practitioners other than physicians, dentists, and nurses declined in 2012 (15,324).
Figure 12: Other Practitioner Adverse Action Reports 2003 - 2012
02,0004,0006,0008,000
10,00012,00014,00016,00018,000
2003 2004 2005 2006 2007 2008 2009 2010 2011 2012
Num
ber
of r
epor
ts
Action year Note: Includes disclosable reports in the NPDB as of the end of calendar year 2012; voided reports have been excluded. Adverse Action Reports include reinstatements, restorations, state licensure, clinical privilege, and professional society membership actions, Medicare and Medicaid exclusions, and DEA actions.
Practitioners on whom reports were filed have the right to dispute the accuracy and the validity of the reports filed on them. Information about the process of disputing reports submitted to the NPDB is available on NPDB’s website. The number of disputed Adverse Action Reports and Medical Malpractice Payment Reports is provided in Appendix E.
35

PART IV
36

CHAPTER 6: FUTURE ENDEAVORS AND PROJECTS
This Annual Report concludes with projects and activities planned for 2013.
Policy and Law ♦ Affordable Care Act: Section 6403 of the Patient Protection and Affordable Care Act requires
the Secretary of HHS to establish a transition period to transfer all data in the HIPDB to the NPDB and, once completed, to cease HIPDB operations. Information previously collected and disclosed through the HIPDB will then be collected and disclosed through the NPDB. The statute’s intent is to transition HIPDB operations to the NPDB while maintaining reporting and querying requirements, to eliminate duplicative data reporting and access requirements between the NPDB and the HIPDB, and to streamline Data Bank operations.
♦ Final Rule: In 2013, HRSA will publish a Final Rule in the Federal Register to implement Section 6403.
♦ Privacy Act: In 2013, the Data Bank will publish a technical Final Rule revising a cross-reference cited in the Privacy Act to reflect changes made by the Final Rule merging the HIPDB and the NPDB.
♦ Disputes Tracker: Disputes activities for 2013 include building features into the Disputes Tracker to cut down on paper files and reduce turnaround time. One such feature will be secure messaging, which will allow practitioners, entities, their respective representatives, and Dispute team members to communicate electronically, including sending and receiving supporting documentation. Team members also will be able to communicate electronically with each other in a secure Disputes system because a workflow feature will be established. Additionally, data reports will be generated electronically and in real time, with accompanying graphs and charts for use in presentations. A repository of closed cases with keyword search functionality will be built to group similar cases. The use of paper and postal mail will be reduced, as will time spent on cases, while increasing efficiency in the Dispute Resolution process.
♦ Presentations: DPDB staff will conduct professional presentations, educational forums, and exhibits for Data Bank users and stakeholders across the country.
♦ NPDB Guidebook: The Data Bank staff is developing an updated NPDB Guidebook, which will reflect the policy outlined in the statute and regulations that merged the NPDB and the HIPDB. The Guidebook is expected to be completed in 2013. This online version of the Guidebook will be primarily a policy document with hyperlinks to operations information on the NPDB website. This approach will facilitate periodic updates of information.
Compliance, Outreach, and Information Dissemination ♦ Compliance Portal: Following the successful launch of a compliance website feature in 2012,
the implementation of the new compliance framework will continue in 2013. The 12 most-queried professions will continue to be part of a one to one adverse licensure action matching process, whereby reportable licensure actions taken by an entity are compared to actual Data Bank reports. The reporting entities are divided by State into 4 semesters that are reviewed every 6 months. Half of the States will undergo a compliance review each year. This schedule results in each entity participating in compliance review activities for the 12 most-queried
37

professions every 2 years. The compliance status for each reporting entity will be posted on the Data Bank public website each April and October.
♦ State Licensing Board Attestation: Professions outside the 12 most-queried professions will be transitioned to a new attestation process that asks State licensing and certification boards to attest that they have submitted all reportable actions to the Data Bank as part of the entities’ registration renewal process. The new process will be done electronically through a compliance attestation website feature, available when the entity signs in to the nonpublic Data Bank website. The entity may attest that it has met the reporting requirements; not attest that it has met the reporting requirements; or fail to attest, if the entity does not complete the new attestation process. The entity status will be posted on the Data Bank public website as received.
♦ Hospital Compliance Initiative: The hospital compliance initiative will continue: Staff will complete the analysis of hospital data and conduct the necessary outreach to reach the goal of 100 percent compliance with hospital registration. Staff will develop an attestation process to use with hospitals to monitor compliance with querying and reporting requirements. Staff will develop a robust plan to conduct educational outreach activities targeted at specific audiences associated with hospital compliance involving querying and reporting to the Data Bank.
♦ Medicaid Fraud Control Unit Compliance Outreach: A Medicaid Fraud Control Unit (MFCU) compliance initiative is being developed in coordination with the HHS OIG in the OIG’s effort to conduct onsite performance reviews of MFCUs. Staff will develop a plan to conduct educational outreach activities targeted at MFCUs reporting to the Data Bank.
♦ Criminal Convictions Compliance Framework: A health care-related criminal convictions compliance initiative is being developed to evaluate the completeness and accuracy of criminal convictions reported to the Data Bank by Federal, State, and local prosecutors.
♦ Data Integrity: DPDB staff will continue to identify and address data integrity issues as they relate to information reported to and accessed from the Data Bank. Specific efforts will streamline various processes to promote accurate and complete data entry.
System-Level Enhancements ♦ As part of DPDB’s strategic planning effort, several key initiatives will be started in 2013,
including usability studies and business process modeling analyses. These efforts will identify specific high-value opportunities for technology enhancements. Feasibility studies will be conducted on new technologies, such as business intelligence and dashboard software, geographic information system mapping software, document management tools, and cloud-based services. In 2013, internal process changes and software enhancements will be explored. Examples include streamlining the Dispute Resolution process, adding new point-of-entry data validation rules to improve data integrity, and improving screen design to help agents perform transactions faster and easier. These leading-edge solutions have the potential to generate significant efficiencies for customers and internal staff.
Research Efforts ♦ Data Validation Project: The Research Branch is currently writing the statement of objectives
to procure contracting services to examine the accuracy of information submitted to the NPDB. The project will evaluate the accuracy, completeness, and timeliness of NPDB data and assess DPDB’s efforts to address potential underreporting to the Data Bank. The
38

Research Branch is interested in using existing NPDB transactional administrative data in conjunction with outside data sources to obtain national estimates of potential transactions that would reside in the Data Bank in the absence of underreporting, non-reporting, and the use of practices such as corporate shield to avoid reporting medical malpractice payments to the NPDB. Given that unreported data are disproportionately distributed relative to State, report type, and reporter type, the branch is particularly interested in identifying innovative approaches (including statistical methodologies and modeling) to validate the completeness of the DPDB transactional administrative data, calculating national estimates of potential transactions that would reside in the Data Bank in the absence of loopholes, and computing national point estimates and their confidence intervals while controlling for the differences in State policies and regulations that affect both current and potential reporting of adverse actions and medical malpractice payments.
♦ FSMB Data Project: The Research Branch has entered into an agreement with the Federation of State Medical Boards (FSMB) to receive data to use for research purposes. Merging these data with the NPDB administrative data will provide a robust data file that will be used to answer many research questions that cannot be answered using NPDB data alone. While the American Medical Association file that DPDB is using already contains physician-specific information, the FSMB data contains information on a wider range of topics – specifically, information about adverse actions against physicians.
♦ New Coding Schemes for Adverse Action and Malpractice Payment Reports: The purpose of this study is to examine how reporting to the NPDB can be improved, particularly as it relates to coding of the reason (i.e., allegation code) for a malpractice payment or the type of and reason for (i.e., basis of action) an adverse action was taken. Entities submitting reports to the NPDB must provide a narrative description of the acts or omissions and injuries or illnesses for malpractice payments and the basis for the action when filing Adverse Action Reports. In addition to the descriptions, reporters must use a specified set of codes to classify the reason for a malpractice payment and the types of and reasons for a licensure or clinical privilege adverse action. Presently, a significant portion of reports of malpractice payments and adverse actions are classified as “Not otherwise classified (NOC).” This study will examine how the use of NOC and similar categories without specific reasons can be reduced.
♦ Matching Algorithm: This project will improve data integrity of the NPDB by enhancing the algorithm used to match reports to reports, and queries to reports, on health care practitioners. Hospitals are required to query the NPDB when credentialing physicians and other practitioners. The NPDB uses an algorithm to score queries based on how closely the practitioner’s name, date of birth, license number, and other data match existing NPDB records. For 97 percent of queries, the algorithm matches successfully. However, manually resolving the unmatched 3 percent (139,000 annually) is labor intensive and expensive. The Research Branch (in conjunction with the NPDB contractor) will develop a more sophisticated and precise algorithm based on prior data, using Bayesian statistics. The objective is to increase the match rate to 99.8 percent or higher, strengthen NPDB’s confidence in the data, and lower contract costs.
39

APPENDICES
40

Appendix A: Milestones
41

Table 5: NPDB Milestones
YEAR MILESTONES 1994 Practitioner Statement Added to Reports
♦ A practitioner with a report in the NPDB could add his or her own statement, which is available to queriers, to the report.
♦ NPDB implemented automated fee collection through electronic funds transfer. Individuals and entities that query could preauthorize the NPDB to debit their bank accounts directly for query fees.
♦ QPRAC version 2.0 was introduced, allowing the NPDB to respond electronically to queries.
♦ HRSA contracted with its second contractor to develop and operate the second-generation NPDB.
♦ More than 1.5 million queries were processed, an average of 30,000 per week. More than half of all queries became electronic.
♦ Average query response time was 2 to 3 days. 1995 NPDB Collected Its 100,000th Report
♦ Since its implementation in 1990, the NPDB collected its 100,000th report. ♦ All paper queries, except practitioner self-queries, were eliminated. ♦ Voluntary queries, submitted by entities not mandated by law, outnumbered
mandated queries for the first time. ♦ Responses to queries became more comprehensive. If the subject of a report
requested a Secretarial Review (now called Dispute Review), the response for each query included this information as well as the status of the Secretarial Review.
1996 Health Insurance Portability and Accountability Act Enacted ♦ The Secretary of HHS, acting through the OIG, was directed by the Health
Insurance Portability and Accountability Act of 1996 to create the HIPDB to combat fraud and abuse in health insurance and health care delivery.
♦ NPDB users could submit reports and update registration information electronically using QPRAC version 3.0.
♦ A blizzard blanketed the Washington, DC, area with 20 inches of snow. Although employees of DPDB’s forerunner, the Division of Quality Assurance, were not able to get to work, the NPDB received and processed more than 20,000 queries during the blizzard.
♦ More than 2.7 million queries were processed, an average of 52,000 per week. ♦ Average query response time was 6 hours or less.
1997 HRSA Coordinated NPDB with HIPDB ♦ Because of the NPDB’s success, the HHS OIG asked BHPr’s Division of Quality
Assurance to design, develop, and operate the new HIPDB. By law, the operations of the NPDB and HIPDB were required to be coordinated.
♦ NPDB queries generated information about Medicare and Medicaid exclusions. 1998 Health Care Entities Queried More than 15 Million Times
♦ State licensing boards, hospitals, and other health care entities queried the NPDB more than 15 million times since 1990.
♦ The NPDB collected its 200,000th report.
42

YEAR MILESTONES 1999 NPDB and HIPDB Became Web Based
♦ Final regulations governing the HIPDB were codified as 45 CFR Part 61. ♦ For the first time, the NPDB and the HIPDB began accepting reports and single-
name queries using a secure Internet site. This was made possible with the Integrated Querying and Reporting Service (IQRS).
♦ More than 3.2 million NPDB queries were processed during the year, an average of 6 queries a minute, 24 hours a day, 365 days a year, or a query every 10 seconds.
2000 NPDB Turned 10 Years Old ♦ NPDB celebrated 10 years of successful operations. ♦ NPDB entered the new millennium Y2K-trouble free. ♦ HIPDB opened for querying. ♦ Average query response time was 4 hours. ♦ The Data Bank introduced the Interface Control Document Transfer Program, an
alternative to the IQRS for large-volume users. This change allowed interoperability between the computer systems of those that query and report and the Data Bank.
2001 Web-Based Self-Query Service Began ♦ Improvements were made to the self-query service so that practitioners were able to
submit self-query data electronically through the Data Bank’s secure website. After transmitting a self-query, the process was completed by printing and mailing a notarized self-query application to the Data Bank. Self-queries were processed within 48 hours and self-query status could be tracked online.
♦ BHPr’s Division of Quality Assurance was renamed the Division of Practitioner Data Banks.
2002 NPDB Received Recognition ♦ The DPDB received an Electronic Government Trailblazer Award for the Data
Bank. This award highlighted Federal, State, local, and international government programs that had successfully implemented the most innovative information systems in e-Government.
♦ The Data Bank introduced the online Report Response Service for efficient processing of self-queries, while maintaining strict security standards. The Report Response Service allowed report subjects to electronically maintain current address information with the Data Bank; add, modify, or remove Subject Statements; initiate or withdraw disputes; and elevate or withdraw requests for Secretarial Review online. Previously, subjects performed these functions via paper correspondence.
2003 IQRS Introduced Web-Based Entity and Agent Registration ♦ The Data Bank introduced online entity and authorized agent registration, replacing
the paper registration forms and paper-based registration process. On-screen instructions and help file information provided immediate assistance, enabling simplified online registration.
♦ The number of registered users of the Data Bank reached 16,000.
43

YEAR MILESTONES 2004 Data Bank Won Excellence.Gov Award
♦ The Data Bank program was awarded the 2004 Excellence.Gov Award. In addition, the Data Bank also was recognized as one of the "Top Five" Federal E-Government Programs of 2004. The awards were bestowed on Federal organizations with outstanding information technology achievements in the public service arena. The Excellence.Gov Award focused on governance models used in e-Government projects that cross organizations.
♦ The Data Bank made IQRS report and query histories available to users, enabling them to obtain a summary of subjects queried or reported on over the previous 4 years.
2005 Querying and Reporting XML Service Introduced ♦ The Data Bank introduced the Querying and Reporting XML Service (QRXS), an
alternative to the IQRS and the ITP for users who want their computer systems to interface directly with the Data Bank.
♦ Average query response time was less than 2 hours. ♦ The NPDB processed more than 36 million queries since 1991 and maintained
more than 375,000 reports. 2006 IQRS Query Workflow Streamlined
♦ The IQRS query workflow was streamlined, making submitting queries easier and more intuitive.
♦ Average query response time was less than 1 hour. ♦ An improved registration renewal process was completed. More than 16,500
entities and agents updated their registrations with the Data Bank using the new procedure.
2007 Proactive Disclosure Service Prototype Launched ♦ The Proactive Disclosure Service (PDS) (now called Continuous Query) was
implemented on April 30. ♦ PDS subscribers received notification of new reports within one business day.
2008 PDS Became a Permanent Service ♦ The PDS became a permanent service for automatic and continuous querying of
enrolled practitioners in the NPDB and the HIPDB. ♦ The PDS successfully completed a full monitoring cycle, including the opportunity
for entities to renew their PDS registration. The renewal rate after the first year was 97 percent.
2009 Interface Control Document Transfer Program Phased Out for Querying and Reporting XML Service ♦ The QRXS, the next generation interface for high-volume users, started replacing
and phasing out the Interface Control Document Transfer Program (ICD ITP). ♦ The QRXS uses an industry standard XML format that improves the exchange of
data between users and the Data Bank, providing real-time data validation.
44

YEAR MILESTONES 2010 Section 1921 of the Social Security Act
♦ NPDB began accepting reports and queries required by Section 1921 on March 1. Section 1921 expanded the information collected and disseminated through the NPDB to include reports on all licensure actions taken against all health care practitioners, not just physicians and dentists.
♦ The Compliance Branch initiated a rigorous review of adverse or disciplinary actions reporting by State licensing boards and agencies.
♦ The Secretary of HHS published for the first time a list of State agencies that failed to meet Data Bank reporting requirements. She also took the unprecedented step of calling on State governors to do their part to assure that State reports to the Data Bank are complete and accurate.
♦ DPDB continued to provide State boards with technical assistance to ensure compliance.
2011 PDS Becomes Continuous Query ♦ The prototype status for PDS was removed and the name formally changed from
PDS to Continuous Query to better capture the true nature of the service, which is the continuous monitoring of enrolled practitioners.
♦ By the end of 2011, more than 94 percent of all professions reviewed in the Adverse Licensure Comparison Project were compliant with Data Bank reporting requirements for years 2006 thru 2009. The reviewed professions were nurses, pharmacists, physicians, dentists, physician assistants, podiatrists, psychologists, social workers, chiropractors, optometrists, and physical therapists.
♦ DPDB established a dedicated email account for receiving data requests and inquiries, resulting in a more streamlined process for handling inquiries from users and shortening the time for staff to respond.
♦ A data use agreement policy was instituted to protect the anonymity of practitioners on whom reports were filed and to establish guidelines regarding how the Public Use File is to be used.
2012 Preparation Activities for Merger ♦ Several preparation activities took place in 2012 to get ready for the publication of
a Final Rule in 2013 concerning the merger of the HIPDB with the NPDB. These activities included outreach to Federal partners and other users of the Data Bank, technical assistance, revising Privacy Act notices, and updating systems and forms.
Began Providing Web-based Statistical Information ♦ A web-based Data Analysis Tool was developed and implemented to facilitate
independent analysis of information relating to medical malpractice payments and adverse actions. The tool allows a wide range of users to perform unique analyses that can be customized by State or region, making it possible for stakeholders to identify trends of interest and to target their resources on areas of concern.
♦ The Research Branch developed NPDB statistics by State that are available in table and trend plot formats that can be accessed using an interactive map of the United States.
45

Appendix B: Queries and Reports by Entity Type and Year
46

Table 6: Querying Entities by Type, 2003 - 2012
Entity Type 2003 2004 2005 2006 2007 2008 2009 2010 2011 2012 Required Queriers
Hospital 5,934 6,020 6,035 6,080 6,075 6,040 5,908 5,913 5,746 5,363 Voluntary Queriers
State Licensing Board 77 83 89 86 85 82 79 96 90 92 Managed Care Organization 860 820 813 780 744 724 702 681 664 635 Professional Society 61 63 62 58 52 52 51 49 45 43 Other Health Care Entity 4,501 5,286 5,849 6,383 6,681 6,972 7,265 7,496 7,680 7,327
Total Voluntary Queriers 5,499 6,252 6,813 7,307 7,562 7,830 8,097 8,322 8,479 8,097
Total Queriers 11,433 12,272 12,848 13,387 13,637 13,870 14,005 14,235 14,225 13,460 Note: Entity type is based on registration as of December 31, 2012. An entity may have more than one registration.
47

Table 7: Queries by Entity Type, 2003 - 2012
Entity Type 2003 2004 2005 2006 2007 2008 2009 2010 2011 2012 Number
Required Queries Hospital 1,148,202 1,194,888 1,224,436 1,288,694 1,291,420 1,296,473 1,214,600 1,199,310 1,121,401 1,027,303
Voluntary Queries State Licensing Board 19,431 23,421 23,584 56,072 68,878 72,837 56,038 69,469 60,138 32,454 Managed Care Organization 1,375,293 1,472,191 1,449,788 1,412,282 1,448,328 1,604,983 1,635,812 1,648,250 1,640,079 1,743,803 Professional Society 4,886 4,280 6,277 4,444 4,400 4,809 4,991 5,222 5,887 6,399 Other Health Care Entity 666,245 753,723 799,831 925,775 1,000,096 1,078,310 1,191,896 1,313,508 1,296,513 1,449,178
Voluntary Queries Total 2,065,855 2,253,615 2,279,480 2,398,573 2,521,702 2,760,939 2,888,737 3,036,449 3,002,617 3,231,834 Total Queries 3,214,057 3,448,503 3,503,916 3,687,267 3,813,122 4,057,412 4,103,337 4,235,759 4,124,018 4,259,137
Percent Required Queries Hospital 35.7% 34.6% 34.9% 34.9% 33.9% 32.0% 29.6% 28.3% 27.2% 24.1%
Voluntary Queries State Licensing Board 0.6% 0.7% 0.7% 1.5% 1.8% 1.8% 1.4% 1.6% 1.5% 0.8% Managed Care Organization 42.8 42.7 41.4 38.3 38.0 39.6 39.9 38.9 39.8 40.9 Professional Society 0.2 0.1 0.2 0.1 0.1 0.1 0.1 0.1 0.1 0.2 Other Health Care Entity 20.7 21.9 22.8 25.1 26.2 26.6 29.0 31.0 31.4 34.0
Voluntary Queries Total 64.3 65.4 65.1 65.1 66.1 68.0 70.4 71.7 72.8 75.9 Total Queries 100.0 100.0 100.0 100.0 100.0 100.0 100.0 100.0 100.0 100.0 Note: Entity type is based on registration as of December 31, 2012. An entity may have more than one registration.
48

Table 8: Reports by Entity Type, 2003 - 2012
Entity Type 2003 2004 2005 2006 2007 2008 2009 2010 2011 2012 Number
Hospital 1,128 1,157 1,125 1,008 1,031 1,099 1,185 1,193 1,082 905 State Licensing Board 23,783 26,458 29,487 31,351 30,874 32,091 34,712 40,770 42,382 41,864 Managed Care Organization 173 166 140 136 129 145 169 146 187 183 Professional Society 54 42 62 32 48 84 69 88 61 58 Malpractice Payer Organization 15,123 14,769 13,859 12,192 12,076 11,590 11,409 10,627 10,543 9,976 Other Health Care Entity 6,054 5,885 5,717 5,462 4,885 4,856 4,974 4,929 4,804 4,996
Total 46,315 48,477 50,390 50,181 49,043 49,865 52,518 57,753 59,059 57,982 Percent
Hospital 2.4% 2.4% 2.2% 2.0% 2.1% 2.2% 2.3% 2.1% 1.8% 1.6% State Licensing Board 51.4 54.6 58.5 62.5 63.0 64.4 66.1 70.6 71.8 72.2 Managed Care Organization 0.4 0.3 0.3 0.3 0.3 0.3 0.3 0.3 0.3 0.3 Professional Society 0.1 0.1 0.1 0.1 0.1 0.2 0.1 0.2 0.1 0.1 Malpractice Payer Organization 32.7 30.5 27.5 24.3 24.6 23.2 21.7 18.4 17.9 17.2 Other Health Care Entity 13.1 12.1 11.3 10.9 10.0 9.7 9.5 8.5 8.1 8.6
Total 100.0 100.0 100.0 100.0 100.0 100.0 100.0 100.0 100.0 100.0 Note: Entity type is based on registration as of December 31, 2012. An entity may have more than one registration.
49

Table 9: Continuous Query Subscribers by Entity Type, 2008 - 2012
Entity Type 2008 2009 2010 2011 2012 Number
Required Queriers Hospital 408 800 980 1,513 1,819
Voluntary Queriers Managed Care Organizations 7 29 48 86 108 Other Health Care Entities 121 462 518 1,099 1,505 Professional Societies 0 0 2 7 6 State Licensing Boards 1 3 5 9 10
Total Voluntary Queriers 129 494 573 1,201 1,629
Total Queriers 537 1,294 1,553 2,714 3,448
50

Table 10: Continuous Query Enrollments by Entity Type, 2007 - 2012 Entity Type 2007 2008 2009 2010 2011 2012 Number Required Queriers
Hospital 71,054 172,445 291,520 391,909 519,387 675,807 Voluntary Queriers
Managed Care Organizations 3,016 6,305 26,895 61,473 142,481 201,384 Other Health Care Entities 7,957 27,322 75,854 101,685 152,430 237,125 Professional Societies 38 35 47 1,471 1,762 1,361 State Licensing Boards 35 21 77 784 9,341 86,795
Total Voluntary Queriers 11,046 33,683 102,873 165,413 306,014 526,665
Total 82,100 206,128 394,393 557,322 825,401 1,202,472 Percent
Required Queriers Hospital 86.5% 83.7% 73.9% 70.3% 62.9% 56.2%
Voluntary Queriers Managed Care Organizations 3.7% 3.1% 6.8% 11.0% 17.3% 16.7% Other Health Care Entities 9.7 13.3 19.2 18.2 18.5 19.7 Professional Societies 0.0 0.0 0.0 0.3 0.2 0.1 State Licensing Boards 0.0 0.0 0.0 0.1 1.1 7.2
Total Voluntary Queriers 13.5% 16.3% 26.1% 29.7% 37.1% 43.8%
Total 100.0% 100.0% 100.0% 100.0% 100.0% 100.0%
51

Appendix C: Practitioner Reports by Type, State, and Year
52

Table 11: Medical Malpractice Payment Reports by Practitioner Type, 2003 - 2012 Payment Year
Practitioner Type 2003 2004 2005 2006 2007 2008 2009 2010 2011 2012 Total Number Physicians and Dentists 17,088 16,359 15,293 13,347 12,726 12,311 12,365 11,359 11,080 10,585 132,513 Professional Nurse 483 531 596 586 625 687 680 609 659 711 6,167 All Other Practitioners 964 992 882 908 935 930 912 891 920 856 9,190 Total 18,535 17,882 16,771 14,841 14,286 13,928 13,957 12,859 12,659 12,152 147,870 Percent Physicians and Dentists 92.2% 91.5% 91.2% 89.9% 89.1% 88.4% 88.6% 88.3% 87.5% 87.1% 89.6% Professional Nurse 2.6 3.0 3.6 3.9 4.4 4.9 4.9 4.7 5.2 5.9 4.2 All Other Practitioners 5.2 5.5 5.3 6.1 6.5 6.7 6.5 6.9 7.3 7.0 6.2 Total 100.0 100.0 100.0 100.0 100.0 100.0 100.0 100.0 100.0 100.0 100.0 Note: Includes reports for the 50 U.S. States, the District of Columbia, American Samoa, Guam, Federated States of Micronesia, Northern Mariana Islands, Palau, Puerto Rico, U.S. Virgin Islands, and Armed Forces locations overseas. Includes disclosable reports in the NPDB as of December 31, 2012; voided reports are excluded. “Physicians and Dentists” includes allopathic (M.D.) physicians, interns, and residents; osteopathic (D.O.) physicians, interns, and residents; and dentists and dental residents. “Professional Nurses” includes registered nurses, licensed practical nurses, licensed vocational nurses, nurse practitioners, nurse anesthetists, nurse midwives, clinical nurse specialists, advanced nurse practitioners, and doctors of nursing practice. “All Other Practitioners” includes all other health care practitioners, non-health care professionals, and nonspecified professionals.
53

Table 12: Adverse Action Reports by Practitioner Type, 2003 - 2012
Action Year Practitioner Type 2003 2004 2005 2006 2007 2008 2009 2010 2011 2012 Total Number Physicians and Dentists 5,441 5,812 5,792 5,948 5,675 5,631 6,282 6,312 6,757 6,949 60,599 Professional Nurse 10,430 11,682 13,779 13,740 13,402 14,240 15,085 18,628 19,404 19,115 149,505 All Other Practitioners 8,780 9,538 10,144 11,485 11,611 11,986 13,402 14,879 14,961 13,892 120,678 Total 24,651 27,032 29,715 31,173 30,688 31,857 34,769 39,819 41,122 39,956 330,782 Percent Physicians and Dentists 22.1% 21.5% 19.5% 19.1% 18.5% 17.7% 18.1% 15.9% 16.4% 17.4% 18.3% Professional Nurse 42.3 43.2 46.4 44.1 43.7 44.7 43.4 46.8 47.2 47.8 45.2 All Other Practitioners 35.6 35.3 34.1 36.8 37.8 37.6 38.5 37.4 36.4 34.8 36.5 Total 100.0 100.0 100.0 100.0 100.0 100.0 100.0 100.0 100.0 100.0 100.0 Note: Includes reports for the 50 U.S. States, the District of Columbia, American Samoa, Guam, Federated States of Micronesia, Northern Mariana Islands, Palau, Puerto Rico, U.S. Virgin Islands, and Armed Forces locations overseas. Includes disclosable reports in the NPDB as of December 31, 2012; voided reports are excluded. “Physicians and Dentists” includes allopathic (M.D.) physicians, interns, and residents; osteopathic (D.O.) physicians, interns, and residents; and dentists and dental residents. “Professional Nurse” includes registered nurses, licensed practical nurses, licensed vocational nurses, nurse practitioners, nurse anesthetists, nurse midwives, clinical nurse specialists, advanced nurse practitioners, and doctors of nursing practice. “All Other Practitioners” includes all other health care practitioners, non-health care professionals, and nonspecified professionals.
54

Table 13: Reinstatement and Restoration Reports by Practitioner Type, 2003 - 2012
Action Year Practitioner Type 2003 2004 2005 2006 2007 2008 2009 2010 2011 2012 Total Number Physicians and Dentists 708 790 919 857 939 1,051 991 908 871 816 8,850 Professional Nurse 1,859 2,175 2,223 2,425 2,236 2,100 1,866 3,035 3,193 3,626 24,738 All Other Practitioners 562 598 762 885 894 929 935 1,132 1,214 1,432 9,343 Total 3,129 3,563 3,904 4,167 4,069 4,080 3,792 5,075 5,278 5,874 42,931 Percent Physicians and Dentists 22.6% 22.2% 23.5% 20.6% 23.1% 25.8% 26.1% 17.9% 16.5% 13.9% 20.6% Professional Nurse 59.4 61.0 56.9 58.2 55.0 51.5 49.2 59.8 60.5 61.7 57.6 All Other Practitioners 18.0 16.8 19.5 21.2 22.0 22.8 24.7 22.3 23.0 24.4 21.8 Total 100.0 100.0 100.0 100.0 100.0 100.0 100.0 100.0 100.0 100.0 100.0 Note: Includes reports for the 50 U.S. States, the District of Columbia, American Samoa, Guam, Federated States of Micronesia, Northern Mariana Islands, Palau, Puerto Rico, U.S. Virgin Islands, and Armed Forces locations overseas. Includes disclosable reports in the NPDB as of December 31, 2012; voided reports are excluded. “Physicians and Dentists” includes allopathic (M.D.) physicians, interns, and residents; osteopathic (D.O.) physicians, interns, and residents; and dentists and dental residents. “Professional Nurse” includes registered nurses, licensed practical nurses, licensed vocational nurses, nurse practitioners, nurse anesthetists, nurse midwives, clinical nurse specialists, advanced nurse practitioners, and doctors of nursing practice. “All Other Practitioners” includes all other health care practitioners, non-health care professionals, and nonspecified professionals.
55

Table 14: All Reports by Type, 2003 - 2012
2003 2004 2005 2006 2007 2008 2009 2010 2011 2012 Total Number
Malpractice Payment Reports 18,535 17,882 16,771 14,841 14,286 13,928 13,957 12,859 12,659 12,152 147,870 All Adverse Action Reports 27,780 30,595 33,619 35,340 34,757 35,937 38,561 44,894 46,400 45,830 373,713
State Licensure Action 23,879 26,537 29,597 31,408 30,966 32,205 34,825 41,122 42,743 41,956 335,238 Clinical Priv./Panel Membership Action 1,005 993 867 806 822 802 868 878 821 778 8,640 Prof. Society Membership Action 54 42 62 32 48 84 70 91 62 60 605 Drug Enforcement Admin. Action 37 48 26 18 12 19 382 139 102 280 1,063 HHS OIG Exclusion 2,805 2,975 3,067 3,076 2,909 2,827 2,416 2,664 2,667 2,752 28,158 Accreditation Action 0 0 0 0 0 0 0 0 5 4 9
All Reports 46,315 48,477 50,390 50,181 49,043 49,865 52,518 57,753 59,059 57,982 521,583 Percent Malpractice Payment Reports 40.0% 36.9% 33.3% 29.6% 29.1% 27.9% 26.6% 22.3% 21.4% 21.0% 28.4% All Adverse Action Reports 60.0 63.1 66.7 70.4 70.9 72.1 73.4 77.7 78.6 79.0 71.6
State Licensure Action 51.6 54.7 58.7 62.6 63.1 64.6 66.3 71.2 72.4 72.4 64.3 Clinical Priv./Panel Membership Action 2.2 2.0 1.7 1.6 1.7 1.6 1.7 1.5 1.4 1.3 1.7 Prof. Society Membership Action 0.1 0.1 0.1 0.1 0.1 0.2 0.1 0.2 0.1 0.1 0.1 Drug Enforcement Admin. Action 0.1 0.1 0.1 0.0 0.0 0.0 0.7 0.2 0.2 0.5 0.2 HHS OIG Exclusion 6.1 6.1 6.1 6.1 5.9 5.7 4.6 4.6 4.5 4.7 5.4 Accreditation Action 0.0 0.0 0.0 0.0 0.0 0.0 0.0 0.0 0.0 0.0 0.0
All Reports 100.0 100.0 100.0 100.0 100.0 100.0 100.0 100.0 100.0 100.0 100.0 Note: Includes reports for the 50 U.S. States, the District of Columbia, American Samoa, Guam, Federated States of Micronesia, Northern Mariana Islands, Palau, Puerto Rico, U.S. Virgin Islands, and Armed Forces locations overseas. Payment year is used for Medical Malpractice Payment Reports; action year is used for Adverse Action Reports. Adverse Action Reports include reinstatements, restorations, state licensure actions, clinical privilege actions, professional society membership actions, Medicare and Medicaid exclusions, and DEA actions.
56

Table 15: Reports for Physicians, 2003 - 2012
2003 2004 2005 2006 2007 2008 2009 2010 2011 2012 Total Number Malpractice Payment Reports 15,124 14,525 13,626 11,739 11,246 10,851 10,761 9,795 9,615 9,194 116,476 All Adverse Action Reports 4,941 5,340 5,350 5,400 5,244 5,265 5,911 5,733 6,215 6,306 55,705
State Licensure Action 3,687 4,094 4,192 4,357 4,195 4,231 4,546 4,534 5,102 5,093 44,031 Clinical Priv./Panel Membership Action 891 905 797 692 720 672 723 757 683 649 7,489 Prof. Society Membership Action 48 37 47 26 41 79 60 65 41 33 477 Drug Enforcement Admin. Action 30 40 23 14 12 12 302 110 88 227 858 HHS OIG Exclusion 285 264 291 311 276 271 280 267 301 304 2,850
All Reports 20,065 19,865 18,976 17,139 16,490 16,116 16,672 15,528 15,830 15,500 172,181 Percent Malpractice Payment Reports 75.4% 73.1% 71.8% 68.5% 68.2% 67.3% 64.5% 63.1% 60.7% 59.3% 67.6% All Adverse Action Reports 24.6 26.9 28.2 31.5 31.8 32.7 35.5 36.9 39.3 40.7 32.4
State Licensure Action 18.4 20.6 22.1 25.4 25.4 26.3 27.3 29.2 32.2 32.9 25.6 Clinical Priv./Panel Membership Action 4.4 4.6 4.2 4.0 4.4 4.2 4.3 4.9 4.3 4.2 4.3 Prof. Society Membership Action 0.2 0.2 0.2 0.2 0.2 0.5 0.4 0.4 0.3 0.2 0.3 Drug Enforcement Admin. Action 0.1 0.2 0.1 0.1 0.1 0.1 1.8 0.7 0.6 1.5 0.5 HHS OIG Exclusion 1.4 1.3 1.5 1.8 1.7 1.7 1.7 1.7 1.9 2.0 1.7
All Reports 100.0 100.0 100.0 100.0 100.0 100.0 100.0 100.0 100.0 100.0 100.0 Note: Includes reports for the 50 U.S. States, the District of Columbia, American Samoa, Guam, Federated States of Micronesia, Northern Mariana Islands, Palau, Puerto Rico, U.S. Virgin Islands, and Armed Forces locations overseas. Payment year is used for Medical Malpractice Payment Reports; action year is used for Adverse Action Reports. Adverse Action Reports include reinstatements, restorations, state licensure actions, clinical privilege actions, professional society membership actions, Medicare and Medicaid exclusions, and DEA actions.
57

Table 16: Reports for Nurses, 2003 - 2012 2003 2004 2005 2006 2007 2008 2009 2010 2011 2012 Total Number Malpractice Payment Reports 483 531 596 586 625 687 680 609 659 711 6,167 All Adverse Action Reports 12,289 13,857 16,002 16,165 15,638 16,340 16,951 21,663 22,597 22,741 174,243
State Licensure Action 12,272 13,827 15,984 16,149 15,627 16,321 16,924 21,636 22,582 22,709 174,031 Clinical Priv./Panel Membership Action 15 27 18 16 11 18 16 20 11 19 171 Prof. Society Membership Action 0 0 0 0 0 0 0 1 0 0 1 Drug Enforcement Admin. Action 0 1 0 0 0 1 11 6 4 13 36 HHS OIG Exclusion 2 2 0 0 0 0 0 0 0 0 4
All Reports 12,772 14,388 16,598 16,751 16,263 17,027 17,631 22,272 23,256 23,452 180,410 Percent Malpractice Payment Reports 3.8% 3.7% 3.6% 3.5% 3.8% 4.0% 3.9% 2.7% 2.8% 3.0% 3.4% All Adverse Action Reports 96.2 96.3 96.4 96.5 96.2 96.0 96.1 97.3 97.2 97.0 96.6
State Licensure Action 96.1 96.1 96.3 96.4 96.1 95.9 96.0 97.1 97.1 96.8 96.5 Clinical Priv./Panel Membership Action 0.1 0.2 0.1 0.1 0.1 0.1 0.1 0.1 0.0 0.1 0.1 Prof. Society Membership Action 0.0 0.0 0.0 0.0 0.0 0.0 0.0 0.0 0.0 0.0 0.0 Drug Enforcement Admin. Action 0.0 0.0 0.0 0.0 0.0 0.0 0.1 0.0 0.0 0.1 0.0 HHS OIG Exclusion 0.0 0.0 0.0 0.0 0.0 0.0 0.0 0.0 0.0 0.0 0.0
All Reports 100.0 100.0 100.0 100.0 100.0 100.0 100.0 100.0 100.0 100.0 100.0 Note: Includes reports for the 50 U.S. States, the District of Columbia, American Samoa, Guam, Federated States of Micronesia, Northern Mariana Islands, Palau, Puerto Rico, U.S. Virgin Islands, and Armed Forces locations overseas. Payment year is used for Medical Malpractice Payment Reports; action year is used for Adverse Action Reports. Adverse Action Reports include reinstatements, restorations, state licensure actions, clinical privilege actions, professional society membership actions, Medicare and Medicaid exclusions, and DEA actions.
58

Table 17: Number of Reports by Practitioner Type, September 1990 - December 2012
Number of Reports
Physicians Dentists Professional Nurses N % N % N %
1 116,222 57.8% 25,805 64.5% 69,129 53.0% 2 42,365 21.1 7,634 19.1 39,209 21.1 3 18,011 9.0 3,063 7.7 12,112 9.0 4 9,411 4.7 1,485 3.7 5,549 4.7 5 5,343 2.7 764 1.9 2,369 2.7 6 3,161 1.6 435 1.1 1,085 1.6 7 2,001 1.0 259 0.6 496 1.0 8 1,316 0.7 164 0.4 269 0.7 9 871 0.4 88 0.2 111 0.4 10 604 0.3 78 0.2 67 0.3
>10 1,728 0.9 217 0.5 91 0.9 “Physicians” includes allopathic (M.D.) physicians, interns, and residents and osteopathic (D.O.) physicians, interns, and residents. “Dentists” includes dentists and dental residents. “Professional Nurses” includes registered nurses, licensed practical nurses, licensed vocational nurses, nurse practitioners, nurse anesthetists, nurse midwives, clinical nurse specialists, advanced nurse practitioners, and doctors of nursing practice.
59
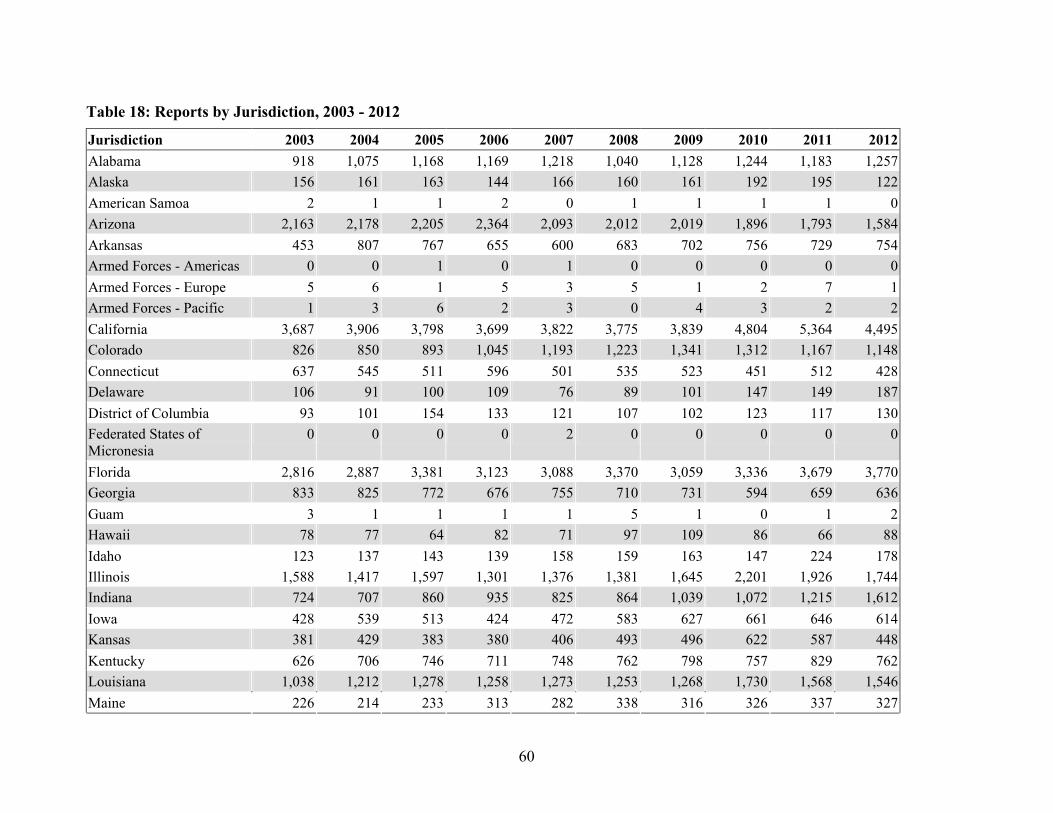
Table 18: Reports by Jurisdiction, 2003 - 2012
Jurisdiction 2003 2004 2005 2006 2007 2008 2009 2010 2011 2012 Alabama 918 1,075 1,168 1,169 1,218 1,040 1,128 1,244 1,183 1,257 Alaska 156 161 163 144 166 160 161 192 195 122 American Samoa 2 1 1 2 0 1 1 1 1 0 Arizona 2,163 2,178 2,205 2,364 2,093 2,012 2,019 1,896 1,793 1,584 Arkansas 453 807 767 655 600 683 702 756 729 754 Armed Forces - Americas 0 0 1 0 1 0 0 0 0 0 Armed Forces - Europe 5 6 1 5 3 5 1 2 7 1 Armed Forces - Pacific 1 3 6 2 3 0 4 3 2 2 California 3,687 3,906 3,798 3,699 3,822 3,775 3,839 4,804 5,364 4,495 Colorado 826 850 893 1,045 1,193 1,223 1,341 1,312 1,167 1,148 Connecticut 637 545 511 596 501 535 523 451 512 428 Delaware 106 91 100 109 76 89 101 147 149 187 District of Columbia 93 101 154 133 121 107 102 123 117 130 Federated States of Micronesia
0 0 0 0 2 0 0 0 0 0
Florida 2,816 2,887 3,381 3,123 3,088 3,370 3,059 3,336 3,679 3,770 Georgia 833 825 772 676 755 710 731 594 659 636 Guam 3 1 1 1 1 5 1 0 1 2 Hawaii 78 77 64 82 71 97 109 86 66 88 Idaho 123 137 143 139 158 159 163 147 224 178 Illinois 1,588 1,417 1,597 1,301 1,376 1,381 1,645 2,201 1,926 1,744 Indiana 724 707 860 935 825 864 1,039 1,072 1,215 1,612 Iowa 428 539 513 424 472 583 627 661 646 614 Kansas 381 429 383 380 406 493 496 622 587 448 Kentucky 626 706 746 711 748 762 798 757 829 762 Louisiana 1,038 1,212 1,278 1,258 1,273 1,253 1,268 1,730 1,568 1,546 Maine 226 214 233 313 282 338 316 326 337 327
60

Jurisdiction 2003 2004 2005 2006 2007 2008 2009 2010 2011 2012 Maryland 665 665 629 676 735 676 768 824 918 953 Massachusetts 930 1,031 1,001 1,029 941 1,009 1,073 1,093 1,057 1,025 Michigan 1,494 1,526 1,426 1,457 1,380 1,381 1,558 1,480 1,639 1,701 Minnesota 599 621 600 610 713 561 628 905 740 857 Mississippi 866 851 801 891 650 795 663 778 718 757 Missouri 838 1,069 1,501 938 1,091 949 1,262 2,021 1,407 1,412 Montana 186 152 187 172 238 251 176 242 218 194 Nebraska 284 371 499 352 378 433 352 569 543 669 Nevada 532 537 450 473 548 590 592 530 567 559 New Hampshire 225 289 219 235 206 195 192 223 216 251 New Jersey 1,387 1,419 1,726 1,447 1,340 1,428 1,636 1,640 1,988 1,568 New Mexico 277 311 286 307 335 318 388 431 408 427 New York 3,307 3,306 3,173 3,217 2,866 2,721 2,759 2,731 2,855 2,730 North Carolina 904 1,030 1,009 1,027 1,143 1,307 1,296 1,425 1,454 1,406 North Dakota 117 108 126 115 143 126 136 159 146 186 Northern Marianas 0 0 0 1 0 0 0 0 0 0 Ohio 1,790 2,041 2,304 2,127 2,000 2,435 2,428 2,377 2,497 2,282 Oklahoma 1,592 1,458 1,504 1,300 1,105 1,319 1,177 1,554 1,779 1,696 Oregon 581 544 597 643 773 1,011 1,266 1,247 1,041 1,070 Pennsylvania 2,342 2,432 21,33 2,515 2,312 2,106 2,204 2,292 2,301 2,279 Puerto Rico 198 240 265 209 251 299 282 308 297 318 Rhode Island 182 151 168 184 177 192 196 174 194 153 South Carolina 613 584 541 598 604 637 659 836 646 763 South Dakota 83 85 105 92 109 146 99 145 130 171 Tennessee 452 610 742 755 715 786 997 1,094 1,069 1,129 Texas 3,794 4,112 4,527 5,012 4,465 3,684 4,402 4,985 5,315 5,870 Utah 389 376 399 398 360 373 370 398 379 458 Vermont 190 240 252 251 213 203 251 233 213 209
61

Jurisdiction 2003 2004 2005 2006 2007 2008 2009 2010 2011 2012 Virgin Islands 3 2 3 2 5 1 5 1 0 5 Virginia 1,148 1,251 1,299 1,161 1,194 1,619 1,675 1,630 1,927 1,958 Washington 1,433 1,243 1,170 1,720 1,719 1,635 1,812 1,733 1,965 1938 West Virginia 383 373 405 364 411 365 402 445 485 348 Wisconsin 520 502 522 553 597 581 530 616 788 659 Wyoming 98 71 80 82 71 86 110 170 200 145
62

Appendix D: Medical Malpractice Payment Adjustments by State, Amount, and Delay
63

Table 19: Medical Malpractice and Adjusted Payment Reports, by State, 2003 - 2012
Physicians Dentists Ratios
State Total Adjusted Total Adjusted Physician/
Dentist Dentist/
Physician Florida 9,455 9,401 941 941 10.0 0.10 Indiana 2,190 1,630 150 146 11.2 0.09
Kansas 1,472 936 104 103 9.1 0.11 Louisiana 3,012 1,756 170 145 12.1 0.08
Nebraska 733 512 58 58 8.8 0.11 New Mexico 991 798 124 124 6.4 0.16
Pennsylvania 9,341 6,644 843 843 7.9 0.13 South Carolina 1,586 1,204 105 101 11.9 0.08
Wisconsin 712 657 187 187 3.5 0.28 Note: Includes States that provide additional patient compensation. Adjusted columns exclude reports from State funds that make payments in addition to primary malpractice carrier payments for the same case. State funds occasionally make payments on behalf of a practitioner practicing in another State.
64

Table 20: Medical Malpractice Payment and Adjusted Reports for Physicians and Dentists, by State, 2003 - 2012
State 2003 2004 2005 2006 2007 2008 2009 2010 2011 2012 Total Reports Florida 1,415 1,326 1,157 916 927 1,047 1,023 920 858 807 10,396 Indiana 323 265 209 240 234 226 293 182 182 186 2,340 Kansas 165 183 194 161 160 146 128 160 142 137 1,576 Louisiana 314 332 294 378 334 360 312 313 281 264 3,182 Nebraska 97 120 181 69 69 57 57 44 50 47 791 New Mexico 113 111 120 126 104 83 100 107 101 150 1,115 Pennsylvania 1,384 1,334 1,145 1,011 901 935 933 863 859 819 10,184 South Carolina 190 178 195 216 210 165 134 131 134 138 1691 Wisconsin 150 123 100 79 79 85 92 58 77 56 899 Adjusted Florida 1,407 1,316 1,154 913 919 1,040 1,018 916 855 804 10,342 Indiana 209 165 135 162 182 171 220 164 182 186 1,776 Kansas 110 116 138 105 115 95 80 107 94 79 1,039 Louisiana 202 221 201 212 187 212 167 178 158 163 1,901 Nebraska 72 93 103 44 52 42 46 37 43 38 570 New Mexico 97 92 95 96 84 66 79 87 85 141 922 Pennsylvania 938 933 843 749 675 714 686 691 655 603 7,487 South Carolina 143 127 139 164 160 133 113 103 106 117 1,305 Wisconsin 141 119 94 71 74 80 82 53 75 55 844 Note: Includes States that provide additional patient compensation. Adjusted columns exclude reports from State funds that make payments in addition to primary malpractice carrier payments for the same case. State funds occasionally make payments on behalf of a practitioner practicing in another State.
65

Table 21: Medical Malpractice Payment and Adjusted Reports for Physicians, by State, 2003 - 2012
State 2003 2004 2005 2006 2007 2008 2009 2010 2011 2012 Total Reports Florida 1,325 1,244 1,069 841 851 963 921 803 735 703 9,455 Indiana 309 246 191 229 219 210 272 172 169 173 2,190 Kansas 155 167 181 149 146 137 122 157 129 129 1,472 Louisiana 288 308 279 355 317 343 298 302 275 247 3,012 Nebraska 89 112 171 66 62 54 53 42 45 39 733 New Mexico 103 101 104 109 94 73 88 96 85 138 991 Pennsylvania 1,290 1,252 1,060 899 827 848 853 778 784 750 9,341 South Carolina 180 164 186 210 202 155 126 121 120 122 1,586 Wisconsin 122 86 86 72 63 71 74 39 58 41 712 Adjusted Florida 1,317 1,234 1,066 838 843 956 916 799 732 700 9,401 Indiana 195 146 121 151 167 155 199 154 169 173 1,630 Kansas 100 100 125 93 102 86 74 104 81 71 936 Louisiana 181 200 187 193 171 196 156 169 154 149 1,756 Nebraska 64 85 93 41 45 39 42 35 38 30 512 New Mexico 87 82 79 79 74 56 67 76 69 129 798 Pennsylvania 844 851 758 637 601 627 606 606 580 534 6,644 South Carolina 133 113 131 158 153 124 106 93 92 101 1,204 Wisconsin 113 82 80 64 58 66 64 34 56 40 657 Note: Includes States that provide additional patient compensation. Adjusted columns exclude reports from State funds that make payments in addition to primary malpractice carrier payments for the same case. State funds occasionally make payments on behalf of a practitioner practicing in another State.
66

Table 22: Medical Malpractice Payment and Adjusted Reports for Dentists, by State, 2003 - 2012
State 2003 2004 2005 2006 2007 2008 2009 2010 2011 2012 Total Reports Florida 90 82 88 75 76 84 102 117 123 104 941 Indiana 14 19 18 11 15 16 21 10 13 13 150 Kansas 10 16 13 12 14 9 6 3 13 8 104 Louisiana 26 24 15 23 17 17 14 11 6 17 170 Nebraska 8 8 10 3 7 3 4 2 5 8 58 New Mexico 10 10 16 17 10 10 12 11 16 12 124 Pennsylvania 94 82 85 112 74 87 80 85 75 69 843 South Carolina 10 14 9 6 8 10 8 10 14 16 105 Wisconsin 28 37 14 7 16 14 18 19 19 15 187 Adjusted Florida 90 82 88 75 76 84 102 117 123 104 941 Indiana 14 19 14 11 15 16 21 10 13 13 146 Kansas 10 16 13 12 13 9 6 3 13 8 103 Louisiana 21 21 14 19 16 16 11 9 4 14 145 Nebraska 8 8 10 3 7 3 4 2 5 8 58 New Mexico 10 10 16 17 10 10 12 11 16 12 124 Pennsylvania 94 82 85 112 74 87 80 85 75 69 843 South Carolina 10 14 8 6 7 9 7 10 14 16 101 Wisconsin 28 37 14 7 16 14 18 19 19 15 187 Note: Includes States that provide additional patient compensation. Adjusted columns exclude reports from State funds that make payments in addition to primary malpractice carrier payments for the same case. State funds occasionally make payments on behalf of a practitioner practicing in another State.
67

Table 23: Median Malpractice Payments and Rank by Jurisdiction, Physicians 2003 - 2012
Payment Ranks Median Payment State 2012 2003-2012 2012 Alabama 32 24 $150,000 Alaska 12 39 $250,000
Arizona 18 14 $229,101 Arkansas 35 22 $137,500
California 47 51 $85,000 Colorado 41 30 $115,000
Connecticut 4 3 $400,000 Delaware 8 6 $319,000
District of Columbia 42 10 $110,000 Florida 22 19 $200,000
Georgia 12 12 $250,000 Hawaii 1 14 $555,000
Idaho 29 27 $185,000 Illinois 3 1 $418,440
Indiana 45 43 $93,501 Iowa 22 40 $200,000
Kansas 22 27 $200,000 Kentucky 30 37 $176,750
Louisiana 46 44 $90,000 Maine 12 7 $250,000 Maryland 20 13 $205,000 Massachusetts 2 2 $424,736
Michigan 38 44 $120,000 Minnesota 6 14 $375,000
Mississippi 50 40 $70,000 Missouri 22 14 $200,000 Montana 12 14 $250,000
Nebraska 11 38 $275,000 Nevada 31 24 $157,500
New Hampshire 9 7 $312,500 New Jersey 10 7 $300,000
New Mexico 51 30 $56,250 New York 7 5 $344,625 North Carolina 37 24 $125,000
North Dakota 36 30 $130,000
68

Payment Ranks Median Payment State 2012 2003-2012 2012 Ohio 22 20 $200,000 Oklahoma 32 30 $150,000
Oregon 43 30 $100,000 Pennsylvania 4 3 $400,000
Rhode Island 21 23 $202,500 South Carolina 40 44 $115,903
South Dakota 12 44 $250,000 Tennessee 38 30 $120,000
Texas 44 40 $99,000 Utah 48 44 $80,000
Vermont 49 44 $71,250 Virginia 12 11 $250,000
Washington 22 30 $200,000 West Virginia 32 50 $150,000
Wisconsin 19 21 $225,000 Wyoming 22 29 $200,000 Note: Year is malpractice payment year.
69

Table 24: Median and Mean Medical Malpractice Payment Delay, in Years, Between Incident and Payment, by Jurisdiction, 2003 - 2012
Median
Rank Median
Delay Mean Delay
State 2012 2003-2012 2012 2003-2012 2012 2003-2012 Alabama 17 17 4.1 4.1 5.0 4.5 Alaska 14 36 4.4 3.6 4.4 5.3
Arizona 25 33 3.9 3.7 4.0 4.0 Arkansas 23 35 4.0 3.7 5.4 4.2
California 50 51 2.8 2.7 3.3 3.2 Colorado 49 50 3.2 3.1 3.3 3.5
Connecticut 8 7 5.5 5.1 5.9 5.4 Delaware 45 26 3.3 3.8 3.5 4.3
District of Columbia 20 23 4.0 3.9 5.5 4.5 Florida 47 32 3.2 3.7 3.7 4.1
Georgia 33 28 3.7 3.8 4.0 4.3 Hawaii 3 15 5.9 4.2 5.6 4.3
Idaho 43 31 3.3 3.7 3.8 4.2 Illinois 7 5 5.6 5.3 6.0 5.8
Indiana 5 1 5.8 6.0 6.0 6.3 Iowa 39 45 3.4 3.4 3.6 3.8
Kansas 32 40 3.7 3.5 4.6 3.9 Kentucky 44 24 3.3 3.9 4.1 4.5 Louisiana 2 4 5.9 5.3 7.0 6.0 Maine 37 13 3.6 4.2 4.0 4.8
Maryland 16 18 4.1 4.1 4.3 4.3
Massachusetts 6 2 5.7 6.0 6.0 6.1
70

Median
Rank Median
Delay Mean Delay
State 2012 2003-2012 2012 2003-2012 2012 2003-2012 Michigan 31 25 3.7 3.9 4.3 4.3 Minnesota 24 47 4.0 3.4 4.1 3.8
Mississippi 1 12 6.1 4.3 7.6 5.2 Missouri 34 22 3.7 3.9 5.0 4.4
Montana 42 38 3.3 3.6 6.2 4.1 Nebraska 21 19 4.0 4.0 3.9 4.3
Nevada 22 10 4.0 4.5 4.3 4.7 New Hampshire 36 16 3.7 4.1 3.8 4.4
New Jersey 10 8 5.0 5.1 5.5 5.9 New Mexico 12 21 4.5 3.9 4.4 4.0
New York 9 6 5.4 5.2 6.0 5.8 North Carolina 18 27 4.1 3.8 4.5 4.3
North Dakota 27 43 3.9 3.5 3.6 3.6 Ohio 46 37 3.2 3.6 4.1 4.4
Oklahoma 18 34 4.1 3.7 4.8 4.2 Oregon 47 49 3.2 3.2 3.9 3.5 Pennsylvania 11 9 4.7 4.8 5.4 5.6
Rhode Island 3 3 5.9 5.8 5.9 6.0
South Carolina 13 11 4.4 4.4 4.8 4.8 South Dakota 51 48 2.5 3.2 3.2 3.7 Tennessee 26 29 3.9 3.8 4.4 4.3 Texas 38 46 3.4 3.4 3.9 3.8 Utah 30 30 3.7 3.7 4.3 4.1
Vermont 29 20 3.8 4.0 3.5 4.5
71

Median
Rank Median
Delay Mean Delay
State 2012 2003-2012 2012 2003-2012 2012 2003-2012 Virginia 15 44 4.3 3.4 6.6 4.3
Washington 28 38 3.8 3.6 4.2 3.9 West Virginia 41 41 3.4 3.5 3.7 4.0
Wisconsin 40 14 3.4 4.2 3.9 4.5 Wyoming 35 42 3.7 3.5 4.2 3.7
72

Table 25: Mean and Median Physician Malpractice Payments, 2003 - 2012
Median Payment Number of Payments Mean Payment Payment Reason 2012 2003-2012 2012 2003-2012 2012 2003-2012 Obstetrics Related $350,000 $300,000 585 9,321 $572,199 $548,733 Anesthesia Related $239,980 $200,000 2,872 37,836 $373,476 $340,667 Diagnosis Related $227,500 $200,000 222 3,298 $388,892 $378,730 Monitoring Related $170,000 $152,500 323 3,306 $293,769 $315,952 IV & Blood Products Related $169,400 $150,000 2,559 30,782 $319,332 $271,443 Treatment Related $150,000 $140,000 1,804 22,331 $286,892 $264,929 Surgery Related $140,000 $150,000 21 247 $205,203 $241,172 Medication Related $125,000 $125,000 511 5942 $246,756 $241,885 Behavioral Health Related $75,000 $75,000 222 2407 $278,249 $211,332 Other Miscellaneous $65,625 $100,000 26 379 $282,567 $236,656 Equipment/Product Related $30,000 $55,000 49 627 $160,323 $145,413 Note: Year is malpractice payment year.
73

Table 26: Median and Mean Physician Medical Malpractice Delay, in Years, Between Incident and Payment, by Payment Reason, 2003 - 2012
Number of Payments Mean Delay Median Delay Payment Reason 2012 2003-2012 2012 2003-2012 2012 2003-2012 Obstetrics Related 585 9,321 6.6 6.1 5.4 5.1 Diagnosis Related 2,872 37,836 5.2 5.0 4.5 4.4
Monitoring Related 323 3,306 4.7 4.6 4.2 4.1 IV & Blood Products Related 1,804 22,331 4.9 4.7 4.2 4.1
Treatment Related 21 247 4.6 4.5 4.1 3.6 Medication Related 511 5,942 4.6 4.4 3.8 3.8
Surgery Related 2,559 30,782 4.4 4.3 3.8 3.9 Anesthesia Related 26 379 5.2 5.5 3.5 4.6
Equipment/Product Related 222 3,298 4.0 4.0 3.5 3.6 Behavioral Health Related 49 627 4.2 3.8 3.4 3.2
Other Miscellaneous 222 2,407 3.7 4.3 3.0 3.5 Note: Year is malpractice payment year.
74

Appendix E: Summary Tables
75

Table 27: Adverse Action and Medical Malpractice Payment Reports in Dispute Resolution, 2003 - 2012
Report Type 2003 2004 2005 2006 2007 2008 2009 2010 2011 2012 Number
Adverse Action Reports 56 56 61 58 39 49 41 59 65 53 State Licensure Actions 18 14 20 17 8 13 10 23 32 26 Clinical Privileges Actions 36 41 39 40 30 36 30 35 33 25 Professional Society Actions 1 0 0 1 1 0 1 0 0 1 Medicare/Medicaid exclusions 1 1 2 0 0 0 0 1 0 1 Medical Malpractice Payment Reports 5 16 12 14 11 11 9 5 9 12
Total 61 72 73 72 50 60 50 64 74 65 Percent
Adverse Action Reports 91.8 77.8 83.6 80.6 78.0 81.7 82.0 92.2 87.8 81.5 State Licensure Actions 32.1 25.0 35.7 30.4 14.3 23.2 17.9 41.1 57.1 46.4 Clinical Privileges Actions 64.3 73.2 69.6 71.4 53.6 64.3 53.6 62.5 58.9 44.6 Professional Society Actions 1.8 0.0 0.0 1.8 1.8 0.0 1.8 0.0 0.0 1.8 Medicare/Medicaid exclusions 1.8 1.8 3.6 0.0 0.0 0.0 0.0 1.8 0.0 1.8 Medical malpractice payment reports 8.2 22.2 16.4 19.4 22.0 18.3 18.0 7.8 12.2 18.5
Total 100.0 100.0 100.0 100.0 100.0 100.0 100.0 100.0 100.0 100.0 Note: Includes disclosable reports in the NPDB as of December 31, 2012.
76

Table 28: Outcomes of Dispute Resolution Adverse Action and Medical Malpractice Payment Reports, 2003 - 2012
2003 2004 2005 2006 2007 2008 2009 2010 2011 2012 Number
Total 61 72 73 72 50 60 50 64 74 65 Beyond Scope of Secretary 39 46 49 42 33 45 40 33 53 27 Voided by Secretary 1 2 3 3 0 0 0 3 1 0 Closed by Intervening Action 17 23 20 27 5 13 7 19 10 14 Closed by Practitioner 4 1 1 0 12 1 2 4 1 1 Unresolved as of December 31, 2012 0 0 0 0 0 1 1 5 9 23
Note: Includes disclosable reports in the NPDB as of December 31, 2012.
77