2012 national health interview survey (nhis) 1 sample
TRANSCRIPT

2012 National Health Interview Survey (NHIS) 1 Sample Adult Public Use File (samadult)
IDN Variables Thursday May 16 2013Unweighted Frequencies
Continuous variables in the frequency
report only show the range of valid numbers
IDN000_00000 File type identifier
RECTYPE Frequency Percent ------------------------------------------------------------10 Household 0 000 20 Person 0 000 25 Income Imputation 0 000 30 Sample Adult 34525 10000 31 Sample Adult Cancer 0 000 34 Adult Alternative Medicine 0 000 38 Functioning and Disability 0 000 39 Adult Disability Questions Test 0 000 40 Sample Child 0 000 44 Child Alternative Medicine 0 000 49 Child Disability Questions Test 0 000 60 Family 0 000 63 Family Disability Questions Test 0 000 65 Paradata 0 000 70 InjuryPoisoning Episode 0 000 75 InjuryPoisoning Verbatim 0 000
IDN000_02000 Year of National Health Interview Survey
SRVY_YR Frequency Percent ------------------------------------Survey Year 34525 10000
IDN000_04000 Household Number
HHX Frequency Percent ----------------------------------------Range of Values 34525 10000
IDN000_25000 Interview Quarter
INTV_QRT Frequency Percent ------------------------------------1 Quarter 1 7608 2204 2 Quarter 2 9187 2661 3 Quarter 3 8779 2543 4 Quarter 4 8951 2593
2
2012 National Health Interview Survey (NHIS)Sample Adult Public Use File (samadult)
IDN Variables Thursday May 16 2013Unweighted Frequencies
IDN000_30000 Interview Month
INTV_MON Frequency Percent -------------------------------------01 January 2545 737 02 February 2492 722 03 March 2571 745 04 April 3200 927 05 May 3027 877 06 June 2960 857 07 July 3084 893 08 August 2899 840 09 September 2796 810 10 October 2954 856 11 November 2965 859 12 December 3032 878
IDN000_35000 Family Number
FMX Frequency Percent ---------------------------------------------------01-25 Family number 1 - 25 34525 10000
IDN000_40000 Person Number (Within family)
FPX Frequency Percent ------------------------------------------------------01-25 Person number 1 thru 25 34525 10000
IDN000_65000 Weight - Interim Annual
WTIA_SA Frequency Percent ----------------------------------------Range of Values 34525 10000
IDN000_70000 Weight - Final Annual
WTFA_SA Frequency Percent ----------------------------------------Range of Values 34525 10000
3
2012 National Health Interview Survey (NHIS)Sample Adult Public Use File (samadult)
UCF Variables Thursday May 16 2013Unweighted Frequencies
UCF000_00000 Region
REGION Frequency Percent ------------------------------------1 Northeast 5774 1672 2 Midwest 7193 2083 3 South 12536 3631 4 West 9022 2613
UCF000_00000 Pseudo-stratum for public use file variance estimation
STRAT_P Frequency Percent --------------------------------001-300 34525 10000
UCF000_00000 Pseudo-PSU for public use file variance estimation
PSU_P Frequency Percent ------------------------------01-02 34525 10000
4
2012 National Health Interview Survey (NHIS)Sample Adult Public Use File (samadult)
HHC Variables Thursday May 16 2013Unweighted Frequencies
HHC110_00000 Sex
SEX Frequency Percent ---------------------------------1 Male 15273 4424 2 Female 19252 5576
HHC180_00000 Hispanic subgroup detail
HISPAN_I Frequency Percent -------------------------------------------------------------------------00 Multiple Hispanic 110 032 01 Puerto Rico 578 167 02 Mexican 2226 645 03 Mexican-American 1358 393 04 CubanCuban American 291 084 05 Dominican (Republic) 189 055 06 Central or South American 945 274 07 Other Latin American type not specified 10 003 08 Other Spanish 152 044 09 HispanicLatinoSpanish non-specific type 0 000 10 HispanicLatinoSpanish type refused 0 000 11 HispanicLatinoSpanish type not ascertained 0 000 12 Not HispanicSpanish origin 28666 8303
HHC200_01000 OMB groups wmultiple race
RACERPI2 Frequency Percent -----------------------------------------------------------------------01 White only 25939 7513 02 BlackAfrican American only 5319 1541 03 AIAN only 349 101 04 Asian only 2183 632 05 Race group not releasable (See file layout) 76 022 06 Multiple race 659 191
HHC200_01000 Race coded to singlemultiple race group
MRACRPI2 Frequency Percent -------------------------------------------------------------------------01 White 26214 7593 02 BlackAfrican American 5452 1579 03 Indian (American) Alaska Native 413 120 09 Asian Indian 408 118 10 Chinese 449 130 11 Filipino 518 150 15 Other Asian (See file layout) 849 246 16 Primary race not releasable (See file layout) 102 030 17 Multiple race no primary race selected 120 035
5
2012 National Health Interview Survey (NHIS)Sample Adult Public Use File (samadult)
HHC Variables Thursday May 16 2013Unweighted Frequencies
HHC200_01000 Race coded to singlemultiple race group
MRACBPI2 Frequency Percent ----------------------------------------------------------------------01 White 24345 7051 02 BlackAfrican American 5340 1547 03 Indian (American) (includes Eskimo Aleut) 355 103 06 Chinese 448 130 07 Filipino 498 144 12 Asian Indian 405 117 16 Other race (See file layout) 2963 858 17 Multiple race no primary race selected 171 050
HHC420_00000 Age
AGE_P Frequency Percent -----------------------------------------00 Under 1 year 0 000 01-84 1-84 years 33566 9722 85 85+ years 959 278
6
2012 National Health Interview Survey (NHIS)Sample Adult Public Use File (samadult)
FRT Variables Thursday May 16 2013Unweighted Frequencies
FRT002_00000 Adult Functioning and Disability flag
AFD_FLG Frequency Percent ---------------------------------------------------------------------------1 Sample Adult selected to receive AFD section 8781 5053 2 Sample Adult not selected to receive AFD section 8597 4947
Frequency Missing = 17147
7
2012 National Health Interview Survey (NHIS)Sample Adult Public Use File (samadult)
FID Variables Thursday May 16 2013Unweighted Frequencies
FID250_00000 Marital Status
R_MARITL Frequency Percent ----------------------------------------------------------------0 Under 14 years 0 000 1 Married - spouse in household 14371 4162 2 Married - spouse not in household 559 162 3 Married - spouse in household unknown 0 000 4 Widowed 3285 951 5 Divorced 4798 1390 6 Separated 1041 302 7 Never married 8270 2395 8 Living with partner 2123 615 9 Unknown marital status 78 023
8
2012 National Health Interview Survey (NHIS)Sample Adult Public Use File (samadult)
AID Variables Thursday May 16 2013Unweighted Frequencies
AID005_00000 Sample adult status
PROXYSA Frequency Percent ----------------------------------------------------------------------------1 Physical or mental condition prohibits responding 468 136 2 Sample adult is able to respond 33413 9678 3 Unknown 644 187
AID010_00000 Knowledgeable proxy for Sample Adult available
PROX1 Frequency Percent ------------------------------1 Yes 468 10000 2 No 0 000
Frequency Missing = 34057
AID015_00000 Relationship of SA proxy to SA
PROX2 Frequency Percent -----------------------------------------------------------------1 Relative who lives in household 383 8184 2 Relative who doesnt live in household 51 1090 3 Other caregiver 18 385 4 Other 16 342 7 Refused 0 000 8 Not ascertained 0 000 9 Dont know 0 000
Frequency Missing = 34057
AID550_00000 Late Sample Adult interviews
LATEINTA -------------------------------------------------------------------------1 Started Sample Adult Core 2+ weeks after the initial interview2 Started Sample Adult Core less than 2 weeks after the initial interview
AID550_00000 Late Sample Adult interviews
Frequency Percent ---------------------
2262 655 32263 9345
--------------------------------------------------------------------------------
9
2012 National Health Interview Survey (NHIS)Sample Adult Public Use File (samadult)
FDB Variables Thursday May 16 2013Unweighted Frequencies
FDB001_00000 Disability Questions Test flag
FDRN_FLG Frequency Percent
1 Families selected to receive ADB (sample adults) and CDB 17147 4967 (sample children 1-17 years) sections2 Families selected to receive FDB (all persons 1 year and 17378 5033 older) sections
2012 National Health Interview Survey (NHIS) 10 Sample Adult Public Use File (samadult)
ASD Variables Thursday May 16 2013Unweighted Frequencies
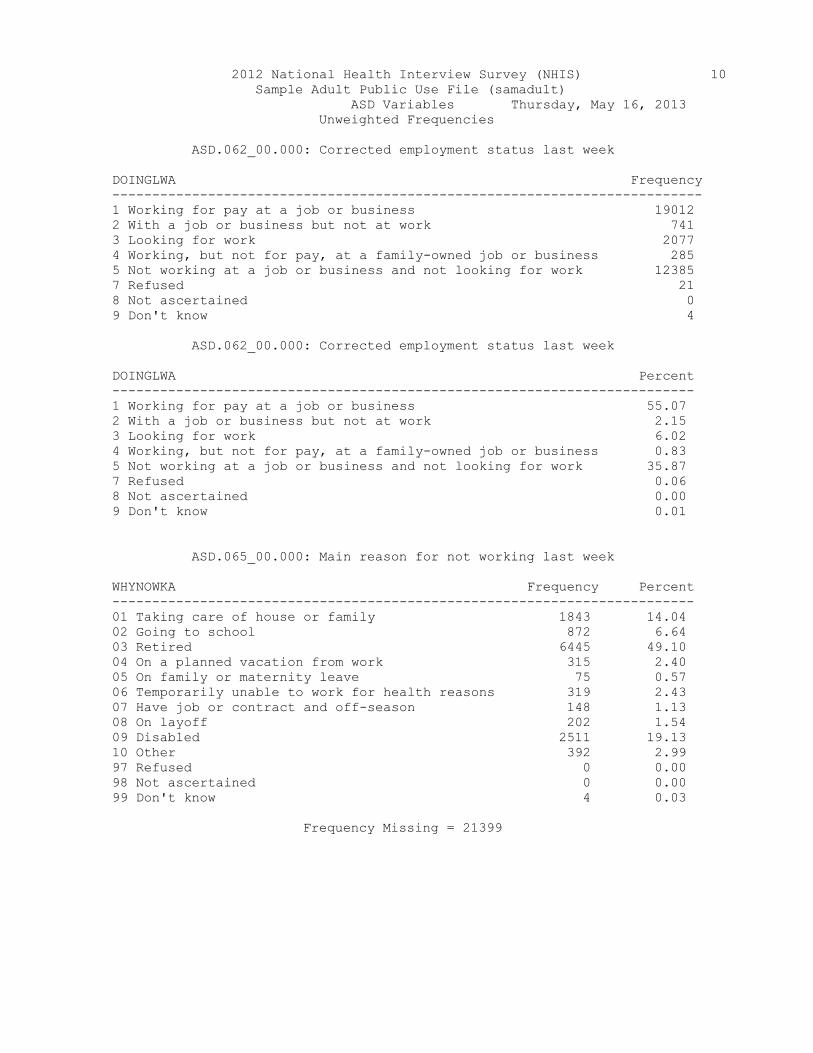
ASD062_00000 Corrected employment status last week
DOINGLWA Frequency--------------------------------------------------------------------------1 Working for pay at a job or business 19012 2 With a job or business but not at work 741 3 Looking for work 2077 4 Working but not for pay at a family-owned job or business 285 5 Not working at a job or business and not looking for work 12385 7 Refused 21 8 Not ascertained 0 9 Dont know 4
ASD062_00000 Corrected employment status last week
DOINGLWA Percent -------------------------------------------------------------------------1 Working for pay at a job or business 5507 2 With a job or business but not at work 215 3 Looking for work 602 4 Working but not for pay at a family-owned job or business 083 5 Not working at a job or business and not looking for work 3587 7 Refused 006 8 Not ascertained 000 9 Dont know 001
ASD065_00000 Main reason for not working last week
WHYNOWKA Frequency Percent -------------------------------------------------------------------------01 Taking care of house or family 1843 1404 02 Going to school 872 664 03 Retired 6445 4910 04 On a planned vacation from work 315 240 05 On family or maternity leave 75 057 06 Temporarily unable to work for health reasons 319 243 07 Have job or contract and off-season 148 113 08 On layoff 202 154 09 Disabled 2511 1913 10 Other 392 299 97 Refused 0 000 98 Not ascertained 0 000 99 Dont know 4 003
Frequency Missing = 21399
--------------------------------------------------------------------------------
--------------------------------------------------------------------------------
--------------------------------------------------------------------------------
--------------------------------------------------------------------------------
11
2012 National Health Interview Survey (NHIS)Sample Adult Public Use File (samadult)
ASD Variables Thursday May 16 2013Unweighted Frequencies
ASD066_00000 Ever worked
EVERWRK Frequency Percent ------------------------------------------1 Yes 12529 8648 2 No 1940 1339 7 Refused 13 009 8 Not ascertained 0 000 9 Dont know 5 003
Frequency Missing = 20038
ASD080_00000 Detailed industry classification(based on 2007 NAICS codes from Census)
INDSTRN1 Frequency Percent
See Industry Appendix in file layout at the end of the 32567 10000 Sample Adult Documentation
Frequency Missing = 1958
ASD080_00000 Simple industry classification(based on 2007 NAICS Codes from Census)
INDSTRN2 Frequency Percent
See Industry Appendix in file layout at the end of the 32567 10000 Sample Adult Documentation
Frequency Missing = 1958
ASD090_00000 Detailed occupation classification(based on 2010 SOC codes from Census)
OCCUPN1 Frequency Percent
See Occupation Appendix in file layout at the end of the 32567 10000 Sample Adult documentation
Frequency Missing = 1958
ASD090_00000 Simple occupation classification(based on 2010 SOC codes from Census)
OCCUPN2 Frequency Percent
See Occupation Appendix in file layout at the end of the 32567 10000 Sample Adult documentation
Frequency Missing = 1958
2012 National Health Interview Survey (NHIS) 12 Sample Adult Public Use File (samadult)
ASD Variables Thursday May 16 2013Unweighted Frequencies
ASD110_00000 Class of worker
WRKCATA Frequency---------------------------------------------------------------------------1 Employee of a PRIVATE company for wages 24009 2 A FEDERAL government employee 1267 3 A STATE government employee 2222 4 A LOCAL government employee 2164 5 Self-employed in OWN business professional practice or farm 2563 6 Working WITHOUT PAY in a family-owned business or farm 117 7 Refused 100 8 Not ascertained 0 9 Dont know 125
Frequency Missing = 1958
ASD110_00000 Class of worker
WRKCATA Percent --------------------------------------------------------------------------1 Employee of a PRIVATE company for wages 7372 2 A FEDERAL government employee 389 3 A STATE government employee 682 4 A LOCAL government employee 664 5 Self-employed in OWN business professional practice or farm 787 6 Working WITHOUT PAY in a family-owned business or farm 036 7 Refused 031 8 Not ascertained 000 9 Dont know 038
Frequency Missing = 1958
ASD112_00000 Current job an incorporated business
BUSINC1A Frequency Percent ------------------------------------------1 Yes 657 2563 2 No 1884 7351 7 Refused 5 020 8 Not ascertained 0 000 9 Dont know 17 066
Frequency Missing = 31962
13
2012 National Health Interview Survey (NHIS)Sample Adult Public Use File (samadult)
ASD Variables Thursday May 16 2013Unweighted Frequencies
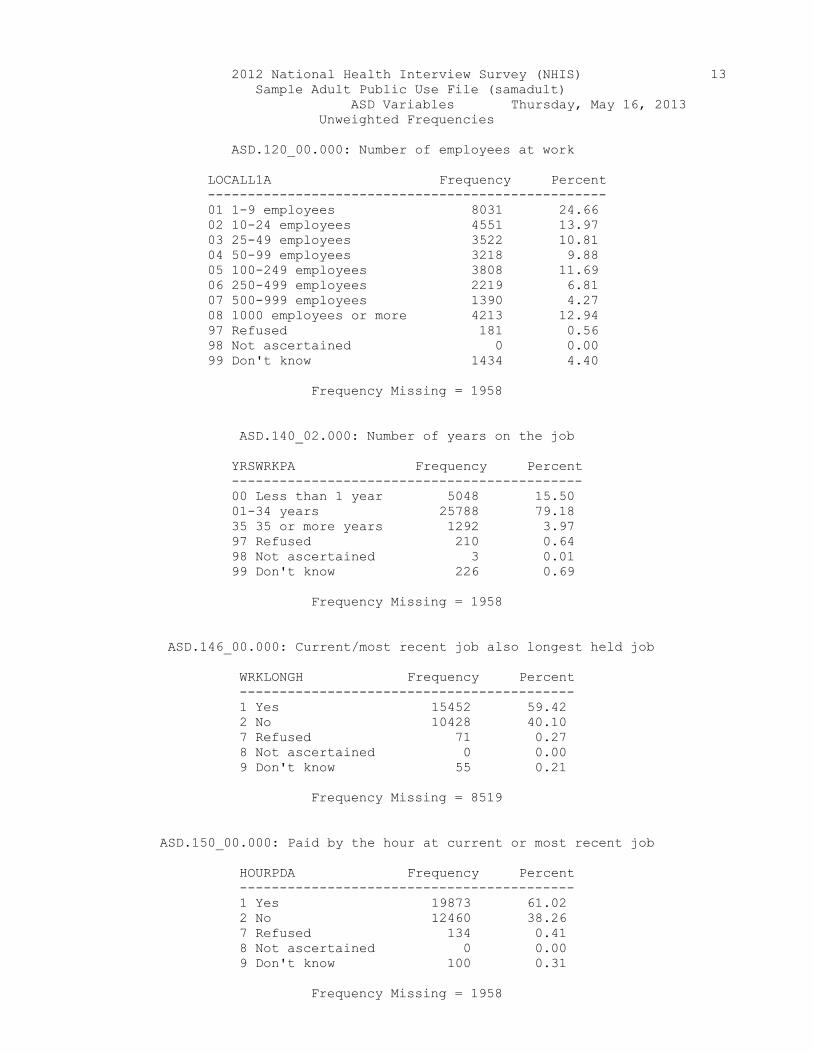
ASD120_00000 Number of employees at work
LOCALL1A Frequency Percent --------------------------------------------------01 1-9 employees 8031 2466 02 10-24 employees 4551 1397 03 25-49 employees 3522 1081 04 50-99 employees 3218 988 05 100-249 employees 3808 1169 06 250-499 employees 2219 681 07 500-999 employees 1390 427 08 1000 employees or more 4213 1294 97 Refused 181 056 98 Not ascertained 0 000 99 Dont know 1434 440
Frequency Missing = 1958
ASD140_02000 Number of years on the job
YRSWRKPA Frequency Percent --------------------------------------------00 Less than 1 year 5048 1550 01-34 years 25788 7918 35 35 or more years 1292 397 97 Refused 210 064 98 Not ascertained 3 001 99 Dont know 226 069
Frequency Missing = 1958
ASD146_00000 Currentmost recent job also longest held job
WRKLONGH Frequency Percent ------------------------------------------1 Yes 15452 5942 2 No 10428 4010 7 Refused 71 027 8 Not ascertained 0 000 9 Dont know 55 021
Frequency Missing = 8519
ASD150_00000 Paid by the hour at current or most recent job
HOURPDA Frequency Percent ------------------------------------------1 Yes 19873 6102 2 No 12460 3826 7 Refused 134 041 8 Not ascertained 0 000 9 Dont know 100 031
Frequency Missing = 1958
14
2012 National Health Interview Survey (NHIS)Sample Adult Public Use File (samadult)
ASD Variables Thursday May 16 2013Unweighted Frequencies
ASD160_00000 Paid sick leave at current or most recent job
PDSICKA Frequency Percent ------------------------------------------1 Yes 16949 5204 2 No 15140 4649 7 Refused 117 036 8 Not ascertained 0 000 9 Dont know 361 111
Frequency Missing = 1958
ASD170_00000 Have more than one job
ONEJOB Frequency Percent ------------------------------------------1 Yes 1842 919 2 No 18152 9059 7 Refused 42 021 8 Not ascertained 0 000 9 Dont know 2 001
Frequency Missing = 14487
ASD210_00000 Work status last week past 12 months
WRKLYR4 Frequency Percent -------------------------------------------------------------------0 Had job last week 20038 5804 1 No job last week had job past 12 months 2275 659 2 No job last week no job past 12 months 10195 2953 3 Never worked 1939 562 7 Refused 53 015 8 Not ascertained 0 000 9 Dont know 25 007
ASD215_00010 Attended any kind of school past 12 months
SCHOOLYR Frequency Percent ------------------------------------------1 Yes 5705 1652 2 No 28802 8342 7 Refused 16 005 8 Not ascertained 0 000 9 Dont know 2 001
15
2012 National Health Interview Survey (NHIS)Sample Adult Public Use File (samadult)
ACN Variables Thursday May 16 2013Unweighted Frequencies
ACN010_00000 Ever been told you have hypertension
HYPEV Frequency Percent ------------------------------------------1 Yes 11298 3272 2 No 23195 6718 7 Refused 14 004 8 Not ascertained 0 000 9 Dont know 18 005
ACN020_00000 Ever had hypertension on 2+ visits
HYPDIFV Frequency Percent ------------------------------------------1 Yes 9748 8628 2 No 1523 1348 7 Refused 4 004 8 Not ascertained 0 000 9 Dont know 23 020
Frequency Missing = 23227
ACN020_00010 Had hypertension past 12 months
HYPYR Frequency Percent ------------------------------------------1 Yes 8326 8541 2 No 1376 1412 7 Refused 0 000 8 Not ascertained 0 000 9 Dont know 46 047
Frequency Missing = 24777
ACN031_01000 Ever been told you had coronary heart disease
CHDEV Frequency Percent ------------------------------------------1 Yes 1813 525 2 No 32660 9460 7 Refused 8 002 8 Not ascertained 0 000 9 Dont know 44 013
16
2012 National Health Interview Survey (NHIS)Sample Adult Public Use File (samadult)
ACN Variables Thursday May 16 2013Unweighted Frequencies
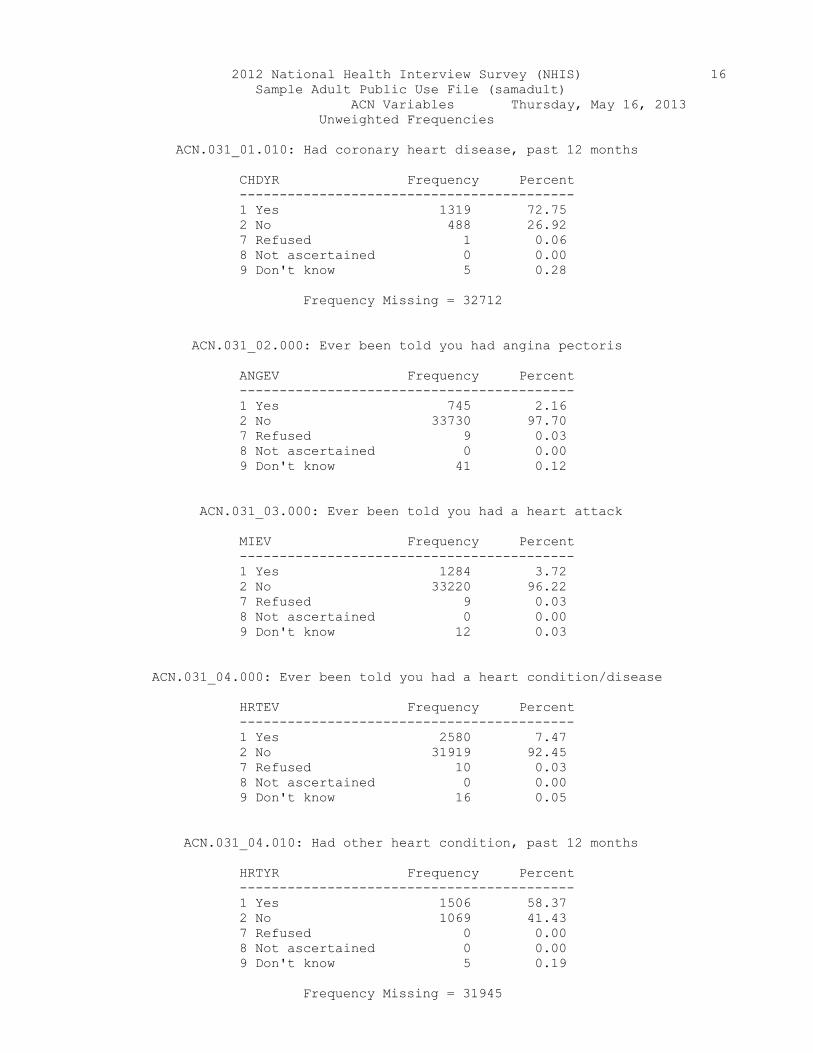
ACN031_01010 Had coronary heart disease past 12 months
CHDYR Frequency Percent ------------------------------------------1 Yes 1319 7275 2 No 488 2692 7 Refused 1 006 8 Not ascertained 0 000 9 Dont know 5 028
Frequency Missing = 32712
ACN031_02000 Ever been told you had angina pectoris
ANGEV Frequency Percent ------------------------------------------1 Yes 745 216 2 No 33730 9770 7 Refused 9 003 8 Not ascertained 0 000 9 Dont know 41 012
ACN031_03000 Ever been told you had a heart attack
MIEV Frequency Percent ------------------------------------------1 Yes 1284 372 2 No 33220 9622 7 Refused 9 003 8 Not ascertained 0 000 9 Dont know 12 003
ACN031_04000 Ever been told you had a heart conditiondisease
HRTEV Frequency Percent ------------------------------------------1 Yes 2580 747 2 No 31919 9245 7 Refused 10 003 8 Not ascertained 0 000 9 Dont know 16 005
ACN031_04010 Had other heart condition past 12 months
HRTYR Frequency Percent ------------------------------------------1 Yes 1506 5837 2 No 1069 4143 7 Refused 0 000 8 Not ascertained 0 000 9 Dont know 5 019
Frequency Missing = 31945
17
2012 National Health Interview Survey (NHIS)Sample Adult Public Use File (samadult)
ACN Variables Thursday May 16 2013Unweighted Frequencies
ACN031_05000 Ever been told you had a stroke
STREV Frequency Percent ------------------------------------------1 Yes 1113 322 2 No 33388 9671 7 Refused 9 003 8 Not ascertained 0 000 9 Dont know 15 004
ACN031_06000 Ever been told you had emphysema
EPHEV Frequency Percent ------------------------------------------1 Yes 663 192 2 No 33844 9803 7 Refused 9 003 8 Not ascertained 0 000 9 Dont know 9 003
ACN035_00000 Ever been told you had COPD
COPDEV Frequency Percent ------------------------------------------1 Yes 1114 323 2 No 33377 9667 7 Refused 7 002 8 Not ascertained 0 000 9 Dont know 27 008
ACN040_00010 Ever been told to take low-dose aspirin
ASPMEDEV Frequency Percent ------------------------------------------1 Yes 7336 3321 2 No 14724 6665 7 Refused 5 002 8 Not ascertained 0 000 9 Dont know 26 012
Frequency Missing = 12434
ACN040_00020 Following low-dose aspirin advice
ASPMEDAD Frequency Percent ------------------------------------------1 Yes 6058 8258 2 No 1275 1738 7 Refused 1 001 8 Not ascertained 0 000 9 Dont know 2 003
Frequency Missing = 27189
18
2012 National Health Interview Survey (NHIS)Sample Adult Public Use File (samadult)
ACN Variables Thursday May 16 2013Unweighted Frequencies
ACN040_00030 Advised to stop taking low-dose aspirin
ASPMDMED Frequency Percent ------------------------------------------1 Yes 427 3349 2 No 842 6604 7 Refused 0 000 8 Not ascertained 0 000 9 Dont know 6 047
Frequency Missing = 33250
ACN040_00040 Taking low-dose aspirin on own
ASPONOWN Frequency Percent ------------------------------------------1 Yes 1308 886 2 No 13434 9105 7 Refused 6 004 8 Not ascertained 0 000 9 Dont know 7 005
Frequency Missing = 19770
ACN080_00000 Ever been told you had asthma
AASMEV Frequency Percent ------------------------------------------1 Yes 4387 1271 2 No 30118 8724 7 Refused 8 002 8 Not ascertained 0 000 9 Dont know 12 003
ACN085_00000 Still have asthma
AASSTILL Frequency Percent ------------------------------------------1 Yes 2865 6531 2 No 1485 3385 7 Refused 0 000 8 Not ascertained 0 000 9 Dont know 37 084
Frequency Missing = 30138
19
2012 National Health Interview Survey (NHIS)Sample Adult Public Use File (samadult)
ACN Variables Thursday May 16 2013Unweighted Frequencies
ACN090_00000 Had an asthma episodeattack past 12 m
AASMYR Frequency Percent ------------------------------------------1 Yes 1432 3264 2 No 2952 6729 7 Refused 0 000 8 Not ascertained 0 000 9 Dont know 3 007
Frequency Missing = 30138
ACN100_00000 Had visit to ER due to asthma past 12 m
AASERYR1 Frequency Percent ------------------------------------------1 Yes 394 898 2 No 3991 9097 7 Refused 0 000 8 Not ascertained 0 000 9 Dont know 2 005
Frequency Missing = 30138
ACN110_00000 Ever been told you have an ulcer
ULCEV Frequency Percent ------------------------------------------1 Yes 2423 702 2 No 32075 9290 7 Refused 11 003 8 Not ascertained 0 000 9 Dont know 16 005
ACN120_00000 Had ulcer in past 12 m
ULCYR Frequency Percent ------------------------------------------1 Yes 675 2786 2 No 1734 7156 7 Refused 0 000 8 Not ascertained 0 000 9 Dont know 14 058
Frequency Missing = 32102
20
2012 National Health Interview Survey (NHIS)Sample Adult Public Use File (samadult)
ACN Variables Thursday May 16 2013Unweighted Frequencies
ACN121_00010 Ever told you had high cholesterol
CHLEV Frequency Percent ------------------------------------------1 Yes 9489 2748 2 No 24944 7225 7 Refused 10 003 8 Not ascertained 0 000 9 Dont know 82 024
ACN121_00020 Had high cholesterol past 12 months
CHLYR Frequency Percent ------------------------------------------1 Yes 6708 7069 2 No 2612 2753 7 Refused 0 000 8 Not ascertained 0 000 9 Dont know 169 178
Frequency Missing = 25036
ACN121_00030 Ever told you had influenzapneumonia
AFLUPNEV Frequency Percent ------------------------------------------1 Yes 8133 2356 2 No 26349 7632 7 Refused 9 003 8 Not ascertained 0 000 9 Dont know 34 010
ACN121_00040 Had influenzapneumonia past 12 months
AFLUPNYR Frequency Percent ------------------------------------------1 Yes 1416 1741 2 No 6711 8252 7 Refused 0 000 8 Not ascertained 0 000 9 Dont know 6 007
Frequency Missing = 26392
ACN121_00050 Ever told you had strep throattonsillitis
ASTREPEV Frequency Percent ------------------------------------------1 Yes 11068 3206 2 No 23371 6769 7 Refused 10 003 8 Not ascertained 0 000 9 Dont know 76 022
21
2012 National Health Interview Survey (NHIS)Sample Adult Public Use File (samadult)
ACN Variables Thursday May 16 2013Unweighted Frequencies
ACN121_00060 Had strep throattonsillitis past 12 months
ASTREPYR Frequency Percent ------------------------------------------1 Yes 1121 1013 2 No 9941 8982 7 Refused 0 000 8 Not ascertained 0 000 9 Dont know 6 005
Frequency Missing = 23457
ACN121_00070 Ever told you had poor circulation
PRCIREV Frequency Percent ------------------------------------------1 Yes 3807 1103 2 No 30675 8885 7 Refused 9 003 8 Not ascertained 0 000 9 Dont know 34 010
ACN121_00080 Had poor circulation past 12 months
PRCIRYR Frequency Percent ------------------------------------------1 Yes 3184 8364 2 No 613 1610 7 Refused 0 000 8 Not ascertained 0 000 9 Dont know 10 026
Frequency Missing = 30718
ACN121_00090 Ever told you had urinary problems
UREV Frequency Percent ------------------------------------------1 Yes 4432 1284 2 No 30071 8710 7 Refused 13 004 8 Not ascertained 0 000 9 Dont know 9 003
22
2012 National Health Interview Survey (NHIS)Sample Adult Public Use File (samadult)
ACN Variables Thursday May 16 2013Unweighted Frequencies
ACN121_00100 Had urinary problems past 12 months
URYR Frequency Percent ------------------------------------------1 Yes 2896 6534 2 No 1534 3461 7 Refused 0 000 8 Not ascertained 0 000 9 Dont know 2 005
Frequency Missing = 30093
ACN121_00110 Ever told you had phobia or fears
PHOBIAEV Frequency Percent ------------------------------------------1 Yes 1833 531 2 No 32659 9460 7 Refused 14 004 8 Not ascertained 0 000 9 Dont know 19 006
ACN121_00120 Had phobia or fears past 12 months
PHOBIAYR Frequency Percent ------------------------------------------1 Yes 1408 7681 2 No 423 2308 7 Refused 0 000 8 Not ascertained 0 000 9 Dont know 2 011
Frequency Missing = 32692
ACN121_00130 Ever told you had ADDADHD
ADDHYP1 Frequency Percent ------------------------------------------1 Yes 1237 358 2 No 33248 9630 7 Refused 9 003 8 Not ascertained 0 000 9 Dont know 31 009
ACN121_00140 Ever told you had Bipolar Disorder
BIPDIS Frequency Percent ------------------------------------------1 Yes 837 242 2 No 33658 9749 7 Refused 11 003 8 Not ascertained 0 000 9 Dont know 19 006
23
2012 National Health Interview Survey (NHIS)Sample Adult Public Use File (samadult)
ACN Variables Thursday May 16 2013Unweighted Frequencies
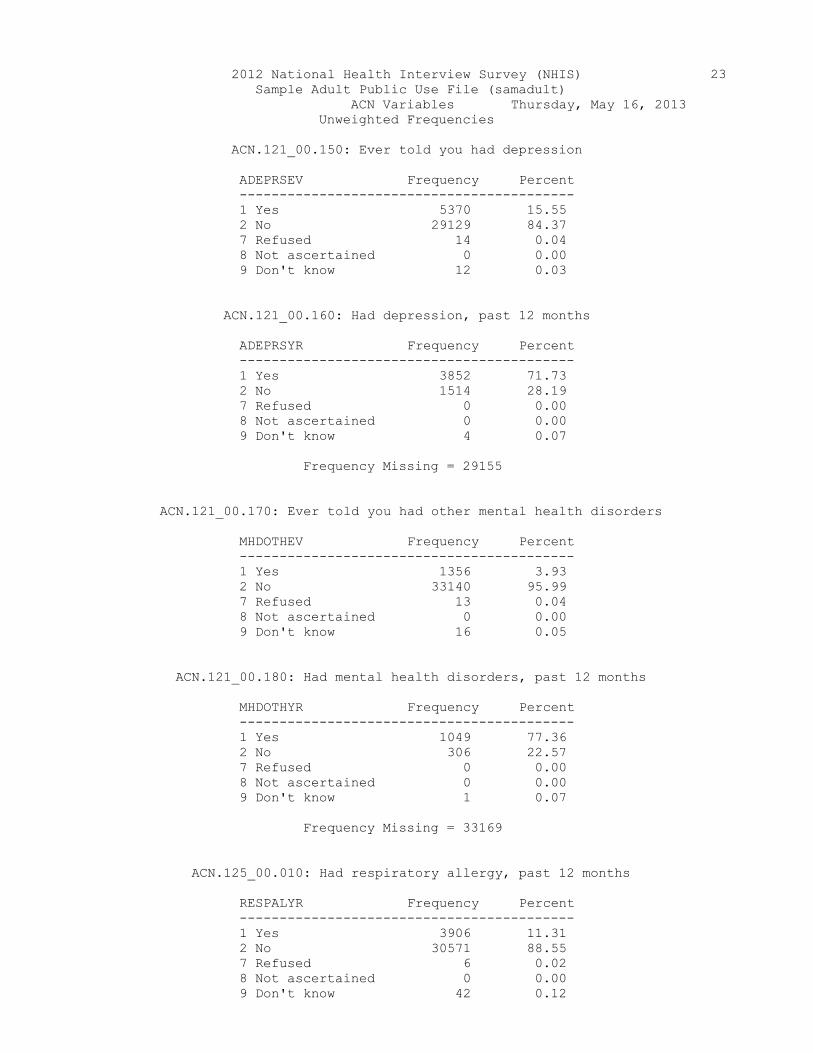
ACN121_00150 Ever told you had depression
ADEPRSEV Frequency Percent ------------------------------------------1 Yes 5370 1555 2 No 29129 8437 7 Refused 14 004 8 Not ascertained 0 000 9 Dont know 12 003
ACN121_00160 Had depression past 12 months
ADEPRSYR Frequency Percent ------------------------------------------1 Yes 3852 7173 2 No 1514 2819 7 Refused 0 000 8 Not ascertained 0 000 9 Dont know 4 007
Frequency Missing = 29155
ACN121_00170 Ever told you had other mental health disorders
MHDOTHEV Frequency Percent ------------------------------------------1 Yes 1356 393 2 No 33140 9599 7 Refused 13 004 8 Not ascertained 0 000 9 Dont know 16 005
ACN121_00180 Had mental health disorders past 12 months
MHDOTHYR Frequency Percent ------------------------------------------1 Yes 1049 7736 2 No 306 2257 7 Refused 0 000 8 Not ascertained 0 000 9 Dont know 1 007
Frequency Missing = 33169
ACN125_00010 Had respiratory allergy past 12 months
RESPALYR Frequency Percent ------------------------------------------1 Yes 3906 1131 2 No 30571 8855 7 Refused 6 002 8 Not ascertained 0 000 9 Dont know 42 012
24
2012 National Health Interview Survey (NHIS)Sample Adult Public Use File (samadult)
ACN Variables Thursday May 16 2013Unweighted Frequencies
ACN125_00020 Had digestive allergy past 12 months
DGSTALYR Frequency Percent ------------------------------------------1 Yes 1420 411 2 No 33068 9578 7 Refused 7 002 8 Not ascertained 0 000 9 Dont know 30 009
ACN125_00030 Had eczemaskin allergy past 12 months
SKNALYR Frequency Percent ------------------------------------------1 Yes 2477 717 2 No 32023 9275 7 Refused 7 002 8 Not ascertained 0 000 9 Dont know 18 005
ACN125_00040 Had other allergy past 12 months
OTHALYR Frequency Percent ------------------------------------------1 Yes 2146 622 2 No 32355 9371 7 Refused 7 002 8 Not ascertained 0 000 9 Dont know 17 005
ACN125_00050 Had acid refluxheartburn past 12 months
ACIDRYR Frequency Percent ------------------------------------------1 Yes 7903 2289 2 No 26596 7703 7 Refused 6 002 8 Not ascertained 0 000 9 Dont know 20 006
ACN125_00060 Had fever more than one day past 12 months
AFEVRYR Frequency Percent ------------------------------------------1 Yes 3886 1126 2 No 30587 8859 7 Refused 6 002 8 Not ascertained 0 000 9 Dont know 46 013
25
2012 National Health Interview Survey (NHIS)Sample Adult Public Use File (samadult)
ACN Variables Thursday May 16 2013Unweighted Frequencies
ACN125_00070 Had headchest cold past 12 months
ACOLDYR Frequency Percent ------------------------------------------1 Yes 14170 4104 2 No 20309 5882 7 Refused 5 001 8 Not ascertained 0 000 9 Dont know 41 012
ACN125_00080 Had nauseavomiting past 12 months
ANAUSYR Frequency Percent ------------------------------------------1 Yes 6741 1952 2 No 27763 8041 7 Refused 5 001 8 Not ascertained 0 000 9 Dont know 16 005
ACN125_00090 Had sore throat past 12 months
ATHOTHYR Frequency Percent ------------------------------------------1 Yes 8689 2517 2 No 25809 7475 7 Refused 6 002 8 Not ascertained 0 000 9 Dont know 21 006
ACN125_00100 Had infectious diseases past 12 months
IMMOTHYR Frequency Percent ------------------------------------------1 Yes 1105 320 2 No 33377 9667 7 Refused 7 002 8 Not ascertained 0 000 9 Dont know 36 010
ACN125_00110 Had recurring headache past 12 months
AHEADYR Frequency Percent ------------------------------------------1 Yes 4382 1269 2 No 30131 8727 7 Refused 8 002 8 Not ascertained 0 000 9 Dont know 4 001
26
2012 National Health Interview Survey (NHIS)Sample Adult Public Use File (samadult)
ACN Variables Thursday May 16 2013Unweighted Frequencies
ACN125_00120 Had memory loss past 12 months
MEMLOSYR Frequency Percent ------------------------------------------1 Yes 2055 595 2 No 32441 9396 7 Refused 6 002 8 Not ascertained 0 000 9 Dont know 23 007
ACN125_00130 Had neurological problems past 12 months
NEUROYR Frequency Percent ------------------------------------------1 Yes 1503 435 2 No 32952 9544 7 Refused 6 002 8 Not ascertained 0 000 9 Dont know 64 019
ACN125_00140 Had abdominal pain past 12 months
AABDOMYR Frequency Percent ------------------------------------------1 Yes 3516 1018 2 No 30998 8978 7 Refused 5 001 8 Not ascertained 0 000 9 Dont know 6 002
ACN125_00150 Had sprainsstrains past 12 months
SPNYR Frequency Percent ------------------------------------------1 Yes 2380 689 2 No 32127 9305 7 Refused 6 002 8 Not ascertained 0 000 9 Dont know 12 003
ACN125_00160 Had dental pain past 12 months
DENYR Frequency Percent ------------------------------------------1 Yes 5273 1527 2 No 29242 8470 7 Refused 5 001 8 Not ascertained 0 000 9 Dont know 5 001
27
2012 National Health Interview Survey (NHIS)Sample Adult Public Use File (samadult)
ACN Variables Thursday May 16 2013Unweighted Frequencies
ACN125_00170 Had musclebone pain past 12 months
AMUSCLYR Frequency Percent ------------------------------------------1 Yes 8130 2355 2 No 26380 7641 7 Refused 5 001 8 Not ascertained 0 000 9 Dont know 10 003
ACN125_00180 Had other chronic pain past 12 months
APNOTHYR Frequency Percent ------------------------------------------1 Yes 4205 1218 2 No 30302 8777 7 Refused 7 002 8 Not ascertained 0 000 9 Dont know 11 003
ACN125_00190 Excessive alcoholtobacco past 12 months
ALCTOBYR Frequency Percent ------------------------------------------1 Yes 2143 621 2 No 32361 9373 7 Refused 13 004 8 Not ascertained 0 000 9 Dont know 8 002
ACN125_00200 Substance abuse past 12 months
SUBABYR Frequency Percent ------------------------------------------1 Yes 253 073 2 No 34257 9922 7 Refused 13 004 8 Not ascertained 0 000 9 Dont know 2 001
ACN125_00210 Had problems being overweight past 12 months
AOVRWTYR Frequency Percent ------------------------------------------1 Yes 7534 2182 2 No 26966 7811 7 Refused 10 003 8 Not ascertained 0 000 9 Dont know 15 004
28
2012 National Health Interview Survey (NHIS)Sample Adult Public Use File (samadult)
ACN Variables Thursday May 16 2013Unweighted Frequencies
ACN125_00220 Skin problems past 12 months
SKNYR1 Frequency Percent ------------------------------------------1 Yes 2086 604 2 No 32424 9391 7 Refused 7 002 8 Not ascertained 0 000 9 Dont know 8 002
ACN125_00230 Had fatiguelack of energy past 12 months
FATIGYR Frequency Percent ------------------------------------------1 Yes 5550 1608 2 No 28955 8387 7 Refused 7 002 8 Not ascertained 0 000 9 Dont know 13 004
ACN125_00240 Excessive sleepiness past 12 months
FATYR Frequency Percent ------------------------------------------1 Yes 4585 1328 2 No 29926 8668 7 Refused 6 002 8 Not ascertained 0 000 9 Dont know 8 002
ACN125_00250 Insomnia past 12 months
INSYR Frequency Percent ------------------------------------------1 Yes 7075 2049 2 No 27441 7948 7 Refused 7 002 8 Not ascertained 0 000 9 Dont know 2 001
ACN125_00260 Frequently anxious past 12 months
ANXNWYR Frequency Percent ------------------------------------------1 Yes 6943 2011 2 No 27560 7983 7 Refused 9 003 8 Not ascertained 0 000 9 Dont know 13 004
29
2012 National Health Interview Survey (NHIS)Sample Adult Public Use File (samadult)
ACN Variables Thursday May 16 2013Unweighted Frequencies
ACN125_00270 Frequently stressed past 12 months
ASTRESYR Frequency Percent ------------------------------------------1 Yes 10130 2934 2 No 24366 7057 7 Refused 11 003 8 Not ascertained 0 000 9 Dont know 18 005
ACN130_00000 Ever told by a doctor you had cancer
CANEV Frequency Percent ------------------------------------------1 Yes 3118 903 2 No 31387 9091 7 Refused 10 003 8 Not ascertained 0 000 9 Dont know 10 003
ACN140_01000 What kind of cancer Bladder
CNKIND1 Frequency Percent ------------------------------------------1 Mentioned 77 247 2 Not mentioned 3029 9715 7 Refused 5 016 8 Not ascertained 0 000 9 Dont know 7 022
Frequency Missing = 31407
ACN140_02000 What kind of cancer Blood
CNKIND2 Frequency Percent ------------------------------------------1 Mentioned 14 045 2 Not mentioned 3092 9917 7 Refused 5 016 8 Not ascertained 0 000 9 Dont know 7 022
Frequency Missing = 31407
30
2012 National Health Interview Survey (NHIS)Sample Adult Public Use File (samadult)
ACN Variables Thursday May 16 2013Unweighted Frequencies
ACN140_03000 What kind of cancer Bone
CNKIND3 Frequency Percent ------------------------------------------1 Mentioned 37 119 2 Not mentioned 3069 9843 7 Refused 5 016 8 Not ascertained 0 000 9 Dont know 7 022
Frequency Missing = 31407
ACN140_04000 What kind of cancer Brain
CNKIND4 Frequency Percent ------------------------------------------1 Mentioned 31 099 2 Not mentioned 3075 9862 7 Refused 5 016 8 Not ascertained 0 000 9 Dont know 7 022
Frequency Missing = 31407
ACN140_05000 What kind of cancer Breast
CNKIND5 Frequency Percent ------------------------------------------1 Mentioned 572 1835 2 Not mentioned 2534 8127 7 Refused 5 016 8 Not ascertained 0 000 9 Dont know 7 022
Frequency Missing = 31407
ACN140_06000 What kind of cancer Cervix
CNKIND6 Frequency Percent ------------------------------------------1 Mentioned 226 1197 2 Not mentioned 1652 8750 7 Refused 4 021 8 Not ascertained 0 000 9 Dont know 6 032
Frequency Missing = 32637
31
2012 National Health Interview Survey (NHIS)Sample Adult Public Use File (samadult)
ACN Variables Thursday May 16 2013Unweighted Frequencies
ACN140_07000 What kind of cancer Colon
CNKIND7 Frequency Percent ------------------------------------------1 Mentioned 184 590 2 Not mentioned 2922 9371 7 Refused 5 016 8 Not ascertained 0 000 9 Dont know 7 022
Frequency Missing = 31407
ACN140_08000 What kind of cancer Esophagus
CNKIND8 Frequency Percent ------------------------------------------1 Mentioned 16 051 2 Not mentioned 3090 9910 7 Refused 5 016 8 Not ascertained 0 000 9 Dont know 7 022
Frequency Missing = 31407
ACN140_09000 What kind of cancer Gallbladder
CNKIND9 Frequency Percent ------------------------------------------1 Mentioned 2 006 2 Not mentioned 3104 9955 7 Refused 5 016 8 Not ascertained 0 000 9 Dont know 7 022
Frequency Missing = 31407
ACN140_10000 What kind of cancer Kidney
CNKIND10 Frequency Percent ------------------------------------------1 Mentioned 70 225 2 Not mentioned 3036 9737 7 Refused 5 016 8 Not ascertained 0 000 9 Dont know 7 022
Frequency Missing = 31407
32
2012 National Health Interview Survey (NHIS)Sample Adult Public Use File (samadult)
ACN Variables Thursday May 16 2013Unweighted Frequencies
ACN140_11000 What kind of cancer larynx-windpipe
CNKIND11 Frequency Percent ------------------------------------------1 Mentioned 10 032 2 Not mentioned 3096 9929 7 Refused 5 016 8 Not ascertained 0 000 9 Dont know 7 022
Frequency Missing = 31407
ACN140_12000 What kind of cancer Leukemia
CNKIND12 Frequency Percent ------------------------------------------1 Mentioned 34 109 2 Not mentioned 3072 9852 7 Refused 5 016 8 Not ascertained 0 000 9 Dont know 7 022
Frequency Missing = 31407
ACN140_13000 What kind of cancer Liver
CNKIND13 Frequency Percent ------------------------------------------1 Mentioned 12 038 2 Not mentioned 3094 9923 7 Refused 5 016 8 Not ascertained 0 000 9 Dont know 7 022
Frequency Missing = 31407
ACN140_14000 What kind of cancer Lung
CNKIND14 Frequency Percent ------------------------------------------1 Mentioned 66 212 2 Not mentioned 3040 9750 7 Refused 5 016 8 Not ascertained 0 000 9 Dont know 7 022
Frequency Missing = 31407
33
2012 National Health Interview Survey (NHIS)Sample Adult Public Use File (samadult)
ACN Variables Thursday May 16 2013Unweighted Frequencies
ACN140_15000 What kind of cancer Lymphoma
CNKIND15 Frequency Percent ------------------------------------------1 Mentioned 92 295 2 Not mentioned 3014 9666 7 Refused 5 016 8 Not ascertained 0 000 9 Dont know 7 022
Frequency Missing = 31407
ACN140_16000 What kind of cancer Melanoma
CNKIND16 Frequency Percent ------------------------------------------1 Mentioned 245 786 2 Not mentioned 2861 9176 7 Refused 5 016 8 Not ascertained 0 000 9 Dont know 7 022
Frequency Missing = 31407
ACN140_17000 What kind of cancer mouthtonguelip
CNKIND17 Frequency Percent ------------------------------------------1 Mentioned 20 064 2 Not mentioned 3086 9897 7 Refused 5 016 8 Not ascertained 0 000 9 Dont know 7 022
Frequency Missing = 31407
ACN140_18000 What kind of cancer Ovary
CNKIND18 Frequency Percent ------------------------------------------1 Mentioned 66 350 2 Not mentioned 1812 9597 7 Refused 4 021 8 Not ascertained 0 000 9 Dont know 6 032
Frequency Missing = 32637
34
2012 National Health Interview Survey (NHIS)Sample Adult Public Use File (samadult)
ACN Variables Thursday May 16 2013Unweighted Frequencies
ACN140_19000 What kind of cancer Pancreas
CNKIND19 Frequency Percent ------------------------------------------1 Mentioned 11 035 2 Not mentioned 3095 9926 7 Refused 5 016 8 Not ascertained 0 000 9 Dont know 7 022
Frequency Missing = 31407
ACN140_20000 What kind of cancer Prostate
CNKIND20 Frequency Percent ------------------------------------------1 Mentioned 362 2943 2 Not mentioned 866 7041 7 Refused 1 008 8 Not ascertained 0 000 9 Dont know 1 008
Frequency Missing = 33295
ACN140_21000 What kind of cancer Rectum
CNKIND21 Frequency Percent ------------------------------------------1 Mentioned 17 055 2 Not mentioned 3089 9907 7 Refused 5 016 8 Not ascertained 0 000 9 Dont know 7 022
Frequency Missing = 31407
ACN140_22000 What kind of cancer skin (non-melanoma)
CNKIND22 Frequency Percent ------------------------------------------1 Mentioned 640 2053 2 Not mentioned 2466 7909 7 Refused 5 016 8 Not ascertained 0 000 9 Dont know 7 022
Frequency Missing = 31407
35
2012 National Health Interview Survey (NHIS)Sample Adult Public Use File (samadult)
ACN Variables Thursday May 16 2013Unweighted Frequencies
ACN140_23000 What kind of cancer skin (DK kind)
CNKIND23 Frequency Percent ------------------------------------------1 Mentioned 271 869 2 Not mentioned 2835 9092 7 Refused 5 016 8 Not ascertained 0 000 9 Dont know 7 022
Frequency Missing = 31407
ACN140_24000 What kind of cancer soft tissue (muscle or fat)
CNKIND24 Frequency Percent ------------------------------------------1 Mentioned 13 042 2 Not mentioned 3093 9920 7 Refused 5 016 8 Not ascertained 0 000 9 Dont know 7 022
Frequency Missing = 31407
ACN140_25000 What kind of cancer Stomach
CNKIND25 Frequency Percent ------------------------------------------1 Mentioned 25 080 2 Not mentioned 3081 9881 7 Refused 5 016 8 Not ascertained 0 000 9 Dont know 7 022
Frequency Missing = 31407
ACN140_26000 What kind of cancer Testis
CNKIND26 Frequency Percent ------------------------------------------1 Mentioned 24 195 2 Not mentioned 1204 9789 7 Refused 1 008 8 Not ascertained 0 000 9 Dont know 1 008
Frequency Missing = 33295
36
2012 National Health Interview Survey (NHIS)Sample Adult Public Use File (samadult)
ACN Variables Thursday May 16 2013Unweighted Frequencies
ACN140_27000 What kind of cancer throat - pharynx
CNKIND27 Frequency Percent ------------------------------------------1 Mentioned 43 138 2 Not mentioned 3063 9824 7 Refused 5 016 8 Not ascertained 0 000 9 Dont know 7 022
Frequency Missing = 31407
ACN140_28000 What kind of cancer Thyroid
CNKIND28 Frequency Percent ------------------------------------------1 Mentioned 79 253 2 Not mentioned 3027 9708 7 Refused 5 016 8 Not ascertained 0 000 9 Dont know 7 022
Frequency Missing = 31407
ACN140_29000 What kind of cancer Uterus
CNKIND29 Frequency Percent ------------------------------------------1 Mentioned 142 752 2 Not mentioned 1736 9195 7 Refused 4 021 8 Not ascertained 0 000 9 Dont know 6 032
Frequency Missing = 32637
ACN140_30000 What kind of cancer Other
CNKIND30 Frequency Percent ------------------------------------------1 Mentioned 140 449 2 Not mentioned 2966 9513 7 Refused 5 016 8 Not ascertained 0 000 9 Dont know 7 022
Frequency Missing = 31407
37
2012 National Health Interview Survey (NHIS)Sample Adult Public Use File (samadult)
ACN Variables Thursday May 16 2013Unweighted Frequencies
ACN140_31000 What kind of cancer more than 3 kinds
CNKIND31 Frequency Percent ------------------------------------------1 Mentioned 2 526 2 Not mentioned 36 9474 7 Refused 0 000 8 Not ascertained 0 000 9 Dont know 0 000
Frequency Missing = 34487
ACN150_01000 Age first diagnosed wbladder cancer
CANAGE1 Frequency Percent -------------------------------------------01-84 1-84 years 73 9481 85 85+ years 3 390 97 Refused 0 000 98 Not ascertained 0 000 99 Dont know 1 130
Frequency Missing = 34448
ACN150_02000 Age first diagnosed wblood cancer
CANAGE2 Frequency Percent -------------------------------------------01-84 1-84 years 13 9286 85 85+ years 1 714 97 Refused 0 000 98 Not ascertained 0 000 99 Dont know 0 000
Frequency Missing = 34511
ACN150_03000 Age first diagnosed wbone cancer
CANAGE3 Frequency Percent -------------------------------------------01-84 1-84 years 35 9459 85 85+ years 2 541 97 Refused 0 000 98 Not ascertained 0 000 99 Dont know 0 000
Frequency Missing = 34488
38
2012 National Health Interview Survey (NHIS)Sample Adult Public Use File (samadult)
ACN Variables Thursday May 16 2013Unweighted Frequencies
ACN150_04000 Age first diagnosed wbrain cancer
CANAGE4 Frequency Percent -------------------------------------------01-84 1-84 years 30 9677 85 85+ years 0 000 97 Refused 1 323 98 Not ascertained 0 000 99 Dont know 0 000
Frequency Missing = 34494
ACN150_05000 Age first diagnosed wbreast cancer
CANAGE5 Frequency Percent -------------------------------------------01-84 1-84 years 556 9720 85 85+ years 5 087 97 Refused 4 070 98 Not ascertained 0 000 99 Dont know 7 122
Frequency Missing = 33953
ACN150_06000 Age first diagnosed wcervical cancer
CANAGE6 Frequency Percent -------------------------------------------01-84 1-84 years 223 9867 85 85+ years 0 000 97 Refused 1 044 98 Not ascertained 0 000 99 Dont know 2 088
Frequency Missing = 34299
ACN150_07000 Age first diagnosed wcolon cancer
CANAGE7 Frequency Percent -------------------------------------------01-84 1-84 years 176 9565 85 85+ years 5 272 97 Refused 1 054 98 Not ascertained 0 000 99 Dont know 2 109
Frequency Missing = 34341
39
2012 National Health Interview Survey (NHIS)Sample Adult Public Use File (samadult)
ACN Variables Thursday May 16 2013Unweighted Frequencies
ACN150_08000 Age first diagnosed wesophageal cancer
CANAGE8 Frequency Percent -------------------------------------------01-84 1-84 years 16 10000 85 85+ years 0 000 97 Refused 0 000 98 Not ascertained 0 000 99 Dont know 0 000
Frequency Missing = 34509
ACN150_09000 Age first diagnosed wgallbladder cancer
CANAGE9 Frequency Percent -------------------------------------------01-84 1-84 years 2 10000 85 85+ years 0 000 97 Refused 0 000 98 Not ascertained 0 000 99 Dont know 0 000
Frequency Missing = 34523
ACN150_10000 Age first diagnosed wkidney cancer
CANAGE10 Frequency Percent -------------------------------------------01-84 1-84 years 68 9714 85 85+ years 1 143 97 Refused 0 000 98 Not ascertained 0 000 99 Dont know 1 143
Frequency Missing = 34455
ACN150_11000 Age first diagnosed wlarynx-windpipe cancer
CANAGE11 Frequency Percent -------------------------------------------01-84 1-84 years 10 10000 85 85+ years 0 000 97 Refused 0 000 98 Not ascertained 0 000 99 Dont know 0 000
Frequency Missing = 34515
40
2012 National Health Interview Survey (NHIS)Sample Adult Public Use File (samadult)
ACN Variables Thursday May 16 2013Unweighted Frequencies
ACN150_12000 Age first diagnosed wleukemia
CANAGE12 Frequency Percent -------------------------------------------01-84 1-84 years 34 10000 85 85+ years 0 000 97 Refused 0 000 98 Not ascertained 0 000 99 Dont know 0 000
Frequency Missing = 34491
ACN150_13000 Age first diagnosed wliver cancer
CANAGE13 Frequency Percent -------------------------------------------01-84 1-84 years 12 10000 85 85+ years 0 000 97 Refused 0 000 98 Not ascertained 0 000 99 Dont know 0 000
Frequency Missing = 34513
ACN150_14000 Age first diagnosed wlung cancer
CANAGE14 Frequency Percent -------------------------------------------01-84 1-84 years 65 9848 85 85+ years 1 152 97 Refused 0 000 98 Not ascertained 0 000 99 Dont know 0 000
Frequency Missing = 34459
ACN150_15000 Age first diagnosed wlymphoma
CANAGE15 Frequency Percent -------------------------------------------01-84 1-84 years 90 9783 85 85+ years 2 217 97 Refused 0 000 98 Not ascertained 0 000 99 Dont know 0 000
Frequency Missing = 34433
41
2012 National Health Interview Survey (NHIS)Sample Adult Public Use File (samadult)
ACN Variables Thursday May 16 2013Unweighted Frequencies
ACN150_16000 Age first diagnosed wmelanoma
CANAGE16 Frequency Percent -------------------------------------------01-84 1-84 years 236 9633 85 85+ years 6 245 97 Refused 0 000 98 Not ascertained 0 000 99 Dont know 3 122
Frequency Missing = 34280
ACN150_17000 Age first diagnosed wmouthtonguelip cancer
CANAGE17 Frequency Percent -------------------------------------------01-84 1-84 years 20 10000 85 85+ years 0 000 97 Refused 0 000 98 Not ascertained 0 000 99 Dont know 0 000
Frequency Missing = 34505
ACN150_18000 Age first diagnosed wovarian cancer
CANAGE18 Frequency Percent -------------------------------------------01-84 1-84 years 66 10000 85 85+ years 0 000 97 Refused 0 000 98 Not ascertained 0 000 99 Dont know 0 000
Frequency Missing = 34459
ACN150_19000 Age first diagnosed wpancreatic cancer
CANAGE19 Frequency Percent -------------------------------------------01-84 1-84 years 10 9091 85 85+ years 1 909 97 Refused 0 000 98 Not ascertained 0 000 99 Dont know 0 000
Frequency Missing = 34514
42
2012 National Health Interview Survey (NHIS)Sample Adult Public Use File (samadult)
ACN Variables Thursday May 16 2013Unweighted Frequencies
ACN150_20000 Age first diagnosed wprostate cancer
CANAGE20 Frequency Percent -------------------------------------------01-84 1-84 years 357 9862 85 85+ years 4 110 97 Refused 0 000 98 Not ascertained 0 000 99 Dont know 1 028
Frequency Missing = 34163
ACN150_21000 Age first diagnosed wrectal cancer
CANAGE21 Frequency Percent -------------------------------------------01-84 1-84 years 16 9412 85 85+ years 1 588 97 Refused 0 000 98 Not ascertained 0 000 99 Dont know 0 000
Frequency Missing = 34508
ACN150_22000 Age first diagnosed wskin (non-melanoma) cancer
CANAGE22 Frequency Percent -------------------------------------------01-84 1-84 years 618 9656 85 85+ years 13 203 97 Refused 0 000 98 Not ascertained 0 000 99 Dont know 9 141
Frequency Missing = 33885
ACN150_23000 Age first diagnosed wskin (DK kind) cancer
CANAGE23 Frequency Percent -------------------------------------------01-84 1-84 years 252 9299 85 85+ years 15 554 97 Refused 0 000 98 Not ascertained 0 000 99 Dont know 4 148
Frequency Missing = 34254
43
2012 National Health Interview Survey (NHIS)Sample Adult Public Use File (samadult)
ACN Variables Thursday May 16 2013Unweighted Frequencies
ACN150_24000 Age first diagnosed wsoft tissue cancer
CANAGE24 Frequency Percent -------------------------------------------01-84 1-84 years 13 10000 85 85+ years 0 000 97 Refused 0 000 98 Not ascertained 0 000 99 Dont know 0 000
Frequency Missing = 34512
ACN150_25000 Age first diagnosed wstomach cancer
CANAGE25 Frequency Percent -------------------------------------------01-84 1-84 years 24 9600 85 85+ years 1 400 97 Refused 0 000 98 Not ascertained 0 000 99 Dont know 0 000
Frequency Missing = 34500
ACN150_26000 Age first diagnosed wtesticular cancer
CANAGE26 Frequency Percent -------------------------------------------01-84 1-84 years 24 10000 85 85+ years 0 000 97 Refused 0 000 98 Not ascertained 0 000 99 Dont know 0 000
Frequency Missing = 34501
ACN150_27000 Age first diagnosed wthroatpharynx cancer
CANAGE27 Frequency Percent -------------------------------------------01-84 1-84 years 43 10000 85 85+ years 0 000 97 Refused 0 000 98 Not ascertained 0 000 99 Dont know 0 000
Frequency Missing = 34482
44
2012 National Health Interview Survey (NHIS)Sample Adult Public Use File (samadult)
ACN Variables Thursday May 16 2013Unweighted Frequencies
ACN150_28000 Age first diagnosed wthyroid cancer
CANAGE28 Frequency Percent -------------------------------------------01-84 1-84 years 76 9620 85 85+ years 1 127 97 Refused 1 127 98 Not ascertained 0 000 99 Dont know 1 127
Frequency Missing = 34446
ACN150_29000 Age first diagnosed wuterine cancer
CANAGE29 Frequency Percent -------------------------------------------01-84 1-84 years 141 9930 85 85+ years 0 000 97 Refused 0 000 98 Not ascertained 0 000 99 Dont know 1 070
Frequency Missing = 34383
ACN150_30000 Age first diagnosed wother cancer
CANAGE30 Frequency Percent -------------------------------------------01-84 1-84 years 136 9714 85 85+ years 2 143 97 Refused 0 000 98 Not ascertained 0 000 99 Dont know 2 143
Frequency Missing = 34385
ACN160_00000 Ever been told that you have diabetes
DIBEV Frequency Percent ------------------------------------------1 Yes 3528 1022 2 No 30479 8828 3 Borderline 493 143 7 Refused 13 004 8 Not ascertained 0 000 9 Dont know 12 003
45
2012 National Health Interview Survey (NHIS)Sample Adult Public Use File (samadult)
ACN Variables Thursday May 16 2013Unweighted Frequencies
ACN165_00000 Ever had prediabetes or other symptoms
DIBPRE1 Frequency Percent ------------------------------------------1 Yes 1536 496 2 No 29431 9495 7 Refused 13 004 8 Not ascertained 0 000 9 Dont know 17 005
Frequency Missing = 3528
ACN170_00000 Age first diagnosed wdiabetes
DIBAGE Frequency Percent -------------------------------------------01-84 1-84 years 3447 9770 85 85+ years 22 062 97 Refused 0 000 98 Not ascertained 0 000 99 Dont know 59 167
Frequency Missing = 30997
ACN170_00000 Years since first diagnosed wdiabetes
DIFAGE2 Frequency Percent -------------------------------------------------------------------00 Within past year 142 402 01-84 1-84 years 3307 9374 85 85+ years 0 000 96 1+ year(s) with diabetes and age is 85+ 20 057 97 Refused 0 000 98 Not ascertained 0 000 99 Dont know 59 167
Frequency Missing = 30997
ACN180_00000 NOW taking insulin
INSLN Frequency Percent ------------------------------------------1 Yes 1057 2087 2 No 4006 7911 7 Refused 0 000 8 Not ascertained 0 000 9 Dont know 1 002
Frequency Missing = 29461
46
2012 National Health Interview Survey (NHIS)Sample Adult Public Use File (samadult)
ACN Variables Thursday May 16 2013Unweighted Frequencies
ACN190_00000 NOW taking diabetic pills
DIBPILL Frequency Percent ------------------------------------------1 Yes 2746 5423 2 No 2311 4564 7 Refused 1 002 8 Not ascertained 0 000 9 Dont know 6 012
Frequency Missing = 29461
ACN201_01000 Told that you had hay fever past 12 m
AHAYFYR Frequency Percent ------------------------------------------1 Yes 2564 743 2 No 31936 9250 7 Refused 10 003 8 Not ascertained 0 000 9 Dont know 15 004
ACN201_02000 Told that you had sinusitis past 12 m
SINYR Frequency Percent ------------------------------------------1 Yes 4232 1226 2 No 30264 8766 7 Refused 9 003 8 Not ascertained 0 000 9 Dont know 20 006
ACN201_03000 Told you had chronic bronchitis 12 m
CBRCHYR Frequency Percent ------------------------------------------1 Yes 1338 388 2 No 33161 9605 7 Refused 8 002 8 Not ascertained 0 000 9 Dont know 18 005
ACN201_04000 Told you had weakfailing kidneys 12 m
KIDWKYR Frequency Percent ------------------------------------------1 Yes 684 198 2 No 33819 9796 7 Refused 11 003 8 Not ascertained 0 000 9 Dont know 11 003
47
2012 National Health Interview Survey (NHIS)Sample Adult Public Use File (samadult)
ACN Variables Thursday May 16 2013Unweighted Frequencies
ACN201_05000 Told you had liver condition past 12 m
LIVYR Frequency Percent ------------------------------------------1 Yes 505 146 2 No 33999 9848 7 Refused 11 003 8 Not ascertained 0 000 9 Dont know 10 003
ACN250_00000 Symptoms of joint painachingstiffness past 30 d
JNTSYMP Frequency Percent ------------------------------------------1 Yes 10978 3180 2 No 23528 6815 7 Refused 9 003 8 Not ascertained 0 000 9 Dont know 10 003
ACN260_01000 Which joint affectedshoulder-right
JMTHP1 Frequency Percent ------------------------------------------1 Mentioned 2659 2422 2 Not mentioned 8305 7565 7 Refused 2 002 8 Not ascertained 0 000 9 Dont know 12 011
Frequency Missing = 23547
ACN260_02000 Which joint affectedshoulder-left
JMTHP2 Frequency Percent ------------------------------------------1 Mentioned 2362 2152 2 Not mentioned 8602 7836 7 Refused 2 002 8 Not ascertained 0 000 9 Dont know 12 011
Frequency Missing = 23547
48
2012 National Health Interview Survey (NHIS)Sample Adult Public Use File (samadult)
ACN Variables Thursday May 16 2013Unweighted Frequencies
ACN260_03000 Which joint affectedelbow-right
JMTHP3 Frequency Percent ------------------------------------------1 Mentioned 1382 1259 2 Not mentioned 9582 8728 7 Refused 2 002 8 Not ascertained 0 000 9 Dont know 12 011
Frequency Missing = 23547
ACN260_04000 Which joint affectedelbow-left
JMTHP4 Frequency Percent ------------------------------------------1 Mentioned 1289 1174 2 Not mentioned 9675 8813 7 Refused 2 002 8 Not ascertained 0 000 9 Dont know 12 011
Frequency Missing = 23547
ACN260_05000 Which joint affectedhip-right
JMTHP5 Frequency Percent ------------------------------------------1 Mentioned 2147 1956 2 Not mentioned 8817 8032 7 Refused 2 002 8 Not ascertained 0 000 9 Dont know 12 011
Frequency Missing = 23547
ACN260_06000 Which joint affectedhip-left
JMTHP6 Frequency Percent ------------------------------------------1 Mentioned 2026 1846 2 Not mentioned 8938 8142 7 Refused 2 002 8 Not ascertained 0 000 9 Dont know 12 011
Frequency Missing = 23547
49
2012 National Health Interview Survey (NHIS)Sample Adult Public Use File (samadult)
ACN Variables Thursday May 16 2013Unweighted Frequencies
ACN260_07000 Which joint affectedwrist-right
JMTHP7 Frequency Percent ------------------------------------------1 Mentioned 1646 1499 2 Not mentioned 9318 8488 7 Refused 2 002 8 Not ascertained 0 000 9 Dont know 12 011
Frequency Missing = 23547
ACN260_08000 Which joint affectedwrist-left
JMTHP8 Frequency Percent ------------------------------------------1 Mentioned 1542 1405 2 Not mentioned 9422 8583 7 Refused 2 002 8 Not ascertained 0 000 9 Dont know 12 011
Frequency Missing = 23547
ACN260_09000 Which joint affectedknee-right
JMTHP9 Frequency Percent ------------------------------------------1 Mentioned 5664 5159 2 Not mentioned 5300 4828 7 Refused 2 002 8 Not ascertained 0 000 9 Dont know 12 011
Frequency Missing = 23547
ACN260_10000 Which joint affectedknee-left
JMTHP10 Frequency Percent ------------------------------------------1 Mentioned 5507 5016 2 Not mentioned 5457 4971 7 Refused 2 002 8 Not ascertained 0 000 9 Dont know 12 011
Frequency Missing = 23547
50
2012 National Health Interview Survey (NHIS)Sample Adult Public Use File (samadult)
ACN Variables Thursday May 16 2013Unweighted Frequencies
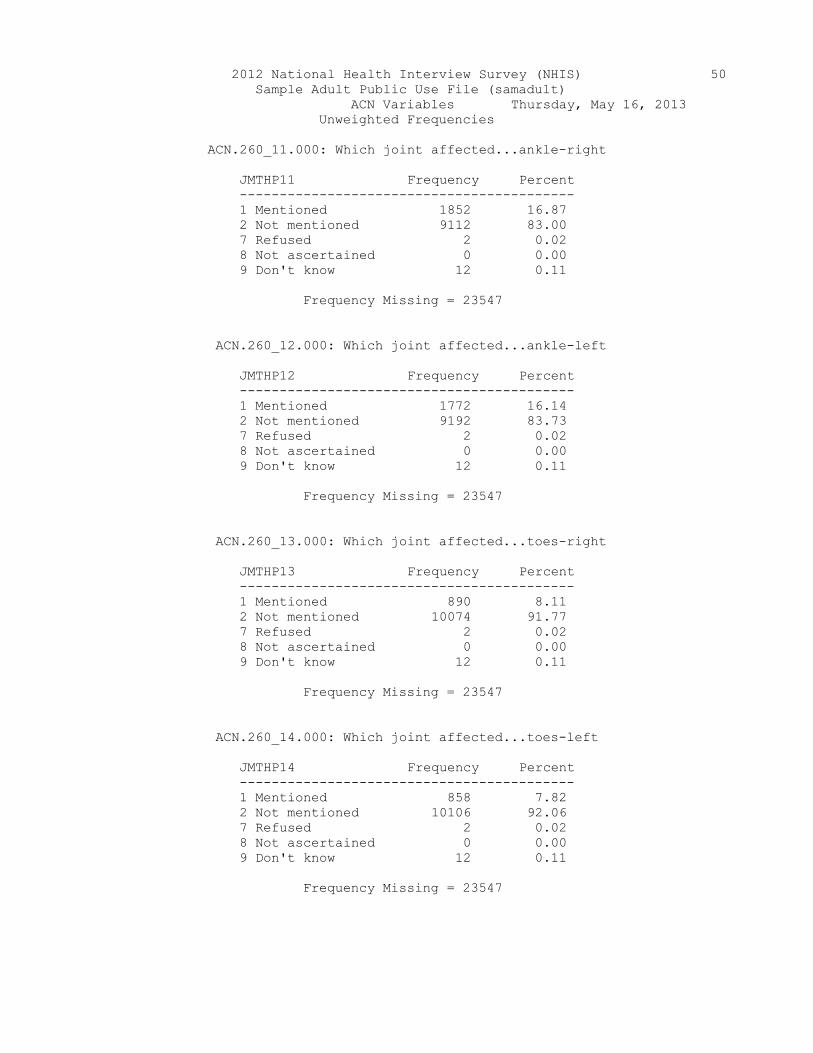
ACN260_11000 Which joint affectedankle-right
JMTHP11 Frequency Percent ------------------------------------------1 Mentioned 1852 1687 2 Not mentioned 9112 8300 7 Refused 2 002 8 Not ascertained 0 000 9 Dont know 12 011
Frequency Missing = 23547
ACN260_12000 Which joint affectedankle-left
JMTHP12 Frequency Percent ------------------------------------------1 Mentioned 1772 1614 2 Not mentioned 9192 8373 7 Refused 2 002 8 Not ascertained 0 000 9 Dont know 12 011
Frequency Missing = 23547
ACN260_13000 Which joint affectedtoes-right
JMTHP13 Frequency Percent ------------------------------------------1 Mentioned 890 811 2 Not mentioned 10074 9177 7 Refused 2 002 8 Not ascertained 0 000 9 Dont know 12 011
Frequency Missing = 23547
ACN260_14000 Which joint affectedtoes-left
JMTHP14 Frequency Percent ------------------------------------------1 Mentioned 858 782 2 Not mentioned 10106 9206 7 Refused 2 002 8 Not ascertained 0 000 9 Dont know 12 011
Frequency Missing = 23547
51
2012 National Health Interview Survey (NHIS)Sample Adult Public Use File (samadult)
ACN Variables Thursday May 16 2013Unweighted Frequencies
ACN260_15000 Which joint affectedfingersthumb-right
JMTHP15 Frequency Percent ------------------------------------------1 Mentioned 2264 2062 2 Not mentioned 8700 7925 7 Refused 2 002 8 Not ascertained 0 000 9 Dont know 12 011
Frequency Missing = 23547
ACN260_16000 Which joint affectedfingersthumb-left
JMTHP16 Frequency Percent ------------------------------------------1 Mentioned 2084 1898 2 Not mentioned 8880 8089 7 Refused 2 002 8 Not ascertained 0 000 9 Dont know 12 011
Frequency Missing = 23547
ACN260_17000 Which joint affectedother joint not listed
JMTHP17 Frequency Percent ------------------------------------------1 Mentioned 616 561 2 Not mentioned 10348 9426 7 Refused 2 002 8 Not ascertained 0 000 9 Dont know 12 011
Frequency Missing = 23547
ACN270_00000 Joint symptoms begin more than 3 months ago
JNTCHR Frequency Percent ------------------------------------------1 Yes 9686 8823 2 No 1281 1167 7 Refused 0 000 8 Not ascertained 0 000 9 Dont know 11 010
Frequency Missing = 23547
52
2012 National Health Interview Survey (NHIS)Sample Adult Public Use File (samadult)
ACN Variables Thursday May 16 2013Unweighted Frequencies
ACN280_00000 Ever seen doctor or health professional for joint symptoms
JNTHP Frequency Percent ------------------------------------------1 Yes 7974 7264 2 No 3001 2734 7 Refused 0 000 8 Not ascertained 0 000 9 Dont know 3 003
Frequency Missing = 23547
ACN290_00000 Ever been told you had arthritis
ARTH1 Frequency Percent ------------------------------------------1 Yes 8229 2383 2 No 26256 7605 7 Refused 10 003 8 Not ascertained 0 000 9 Dont know 30 009
ACN295_00000 Limited due to arthritis or joint symptoms
ARTHLMT Frequency Percent ------------------------------------------1 Yes 4954 3712 2 No 8384 6283 7 Refused 0 000 8 Not ascertained 0 000 9 Dont know 7 005
Frequency Missing = 21180
ACN297_01010 Ever told you had arthritis
ARTHTYP1 Frequency Percent ------------------------------------------1 Mentioned 6437 7822 2 Not mentioned 1740 2114 7 Refused 0 000 8 Not ascertained 0 000 9 Dont know 52 063
Frequency Missing = 26296
53
2012 National Health Interview Survey (NHIS)Sample Adult Public Use File (samadult)
ACN Variables Thursday May 16 2013Unweighted Frequencies
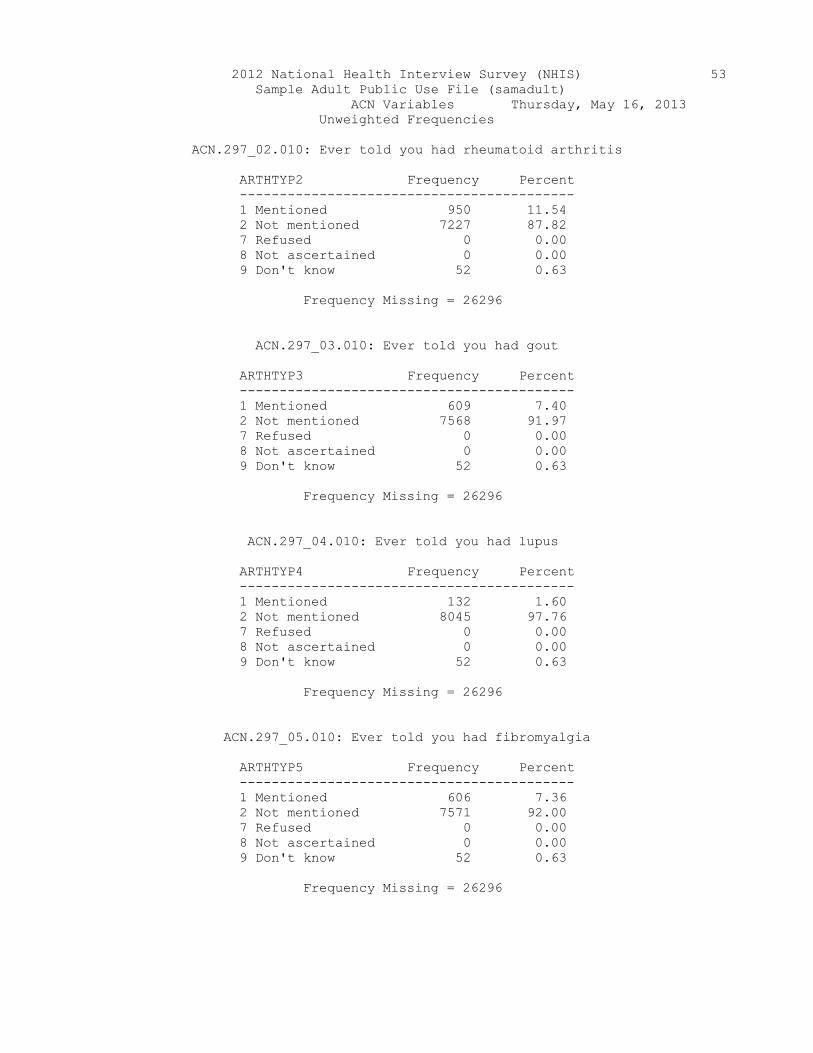
ACN297_02010 Ever told you had rheumatoid arthritis
ARTHTYP2 Frequency Percent ------------------------------------------1 Mentioned 950 1154 2 Not mentioned 7227 8782 7 Refused 0 000 8 Not ascertained 0 000 9 Dont know 52 063
Frequency Missing = 26296
ACN297_03010 Ever told you had gout
ARTHTYP3 Frequency Percent ------------------------------------------1 Mentioned 609 740 2 Not mentioned 7568 9197 7 Refused 0 000 8 Not ascertained 0 000 9 Dont know 52 063
Frequency Missing = 26296
ACN297_04010 Ever told you had lupus
ARTHTYP4 Frequency Percent ------------------------------------------1 Mentioned 132 160 2 Not mentioned 8045 9776 7 Refused 0 000 8 Not ascertained 0 000 9 Dont know 52 063
Frequency Missing = 26296
ACN297_05010 Ever told you had fibromyalgia
ARTHTYP5 Frequency Percent ------------------------------------------1 Mentioned 606 736 2 Not mentioned 7571 9200 7 Refused 0 000 8 Not ascertained 0 000 9 Dont know 52 063
Frequency Missing = 26296
54
2012 National Health Interview Survey (NHIS)Sample Adult Public Use File (samadult)
ACN Variables Thursday May 16 2013Unweighted Frequencies
ACN297_06010 Ever told you had other joint condition
ARTHTYP6 Frequency Percent ------------------------------------------1 Mentioned 506 615 2 Not mentioned 7671 9322 7 Refused 0 000 8 Not ascertained 0 000 9 Dont know 52 063
Frequency Missing = 26296
ACN300_00000 Had neck pain past 3 months
PAINECK Frequency Percent ------------------------------------------1 Yes 5222 1513 2 No 29285 8482 7 Refused 7 002 8 Not ascertained 2 001 9 Dont know 9 003
ACN310_00000 Had low back pain past 3 months
PAINLB Frequency Percent ------------------------------------------1 Yes 10078 2919 2 No 24427 7075 7 Refused 7 002 8 Not ascertained 2 001 9 Dont know 11 003
ACN320_00000 Pain spread down legbelow knees
PAINLEG Frequency Percent ------------------------------------------1 Yes 3676 3648 2 No 6378 6329 7 Refused 0 000 8 Not ascertained 0 000 9 Dont know 24 024
Frequency Missing = 24447
ACN331_01000 Had pain in jawfront of ear past 3 months
PAINFACE Frequency Percent ------------------------------------------1 Yes 1780 516 2 No 32725 9479 7 Refused 7 002 8 Not ascertained 2 001 9 Dont know 11 003
55
2012 National Health Interview Survey (NHIS)Sample Adult Public Use File (samadult)
ACN Variables Thursday May 16 2013Unweighted Frequencies
ACN331_02000 Had severe headachemigraine past 3 m
AMIGR Frequency Percent ------------------------------------------1 Yes 4846 1404 2 No 29661 8591 7 Refused 7 002 8 Not ascertained 3 001 9 Dont know 8 002
ACN350_00000 Had a headchest cold past 2 w
ACOLD2W Frequency Percent ------------------------------------------1 Yes 3210 930 2 No 31302 9066 7 Refused 5 001 8 Not ascertained 3 001 9 Dont know 5 001
ACN360_00000 Had stomach prob wvomitdiarrhea 2 w
AINTIL2W Frequency Percent ------------------------------------------1 Yes 1526 442 2 No 32986 9554 7 Refused 6 002 8 Not ascertained 3 001 9 Dont know 4 001
ACN370_00000 Currently pregnant
PREGNOW Frequency Percent ------------------------------------------1 Yes 335 335 2 No 9652 9650 7 Refused 3 003 8 Not ascertained 3 003 9 Dont know 9 009
Frequency Missing = 24523
ACN370_00010 Recently pregnant
PREGFLYR Frequency Percent ------------------------------------------1 Yes 488 499 2 No 9280 9497 7 Refused 3 003 8 Not ascertained 0 000 9 Dont know 1 001
Frequency Missing = 24753
56
2012 National Health Interview Survey (NHIS)Sample Adult Public Use File (samadult)
ACN Variables Thursday May 16 2013Unweighted Frequencies
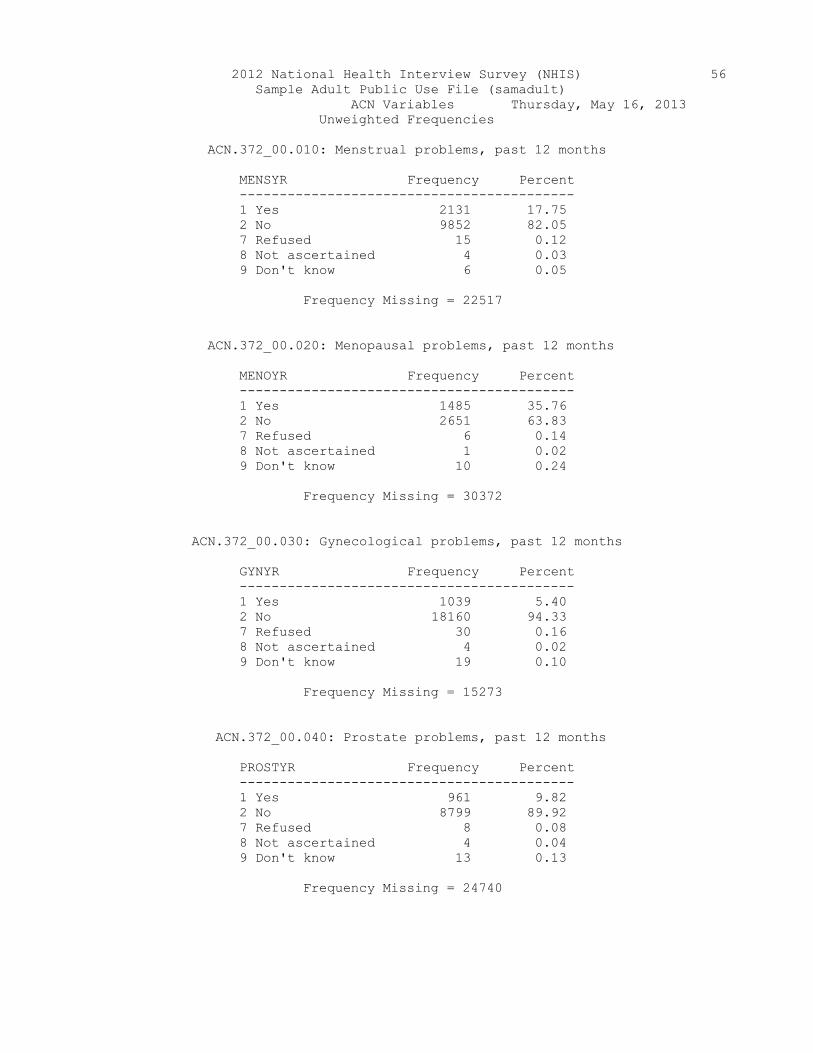
ACN372_00010 Menstrual problems past 12 months
MENSYR Frequency Percent ------------------------------------------1 Yes 2131 1775 2 No 9852 8205 7 Refused 15 012 8 Not ascertained 4 003 9 Dont know 6 005
Frequency Missing = 22517
ACN372_00020 Menopausal problems past 12 months
MENOYR Frequency Percent ------------------------------------------1 Yes 1485 3576 2 No 2651 6383 7 Refused 6 014 8 Not ascertained 1 002 9 Dont know 10 024
Frequency Missing = 30372
ACN372_00030 Gynecological problems past 12 months
GYNYR Frequency Percent ------------------------------------------1 Yes 1039 540 2 No 18160 9433 7 Refused 30 016 8 Not ascertained 4 002 9 Dont know 19 010
Frequency Missing = 15273
ACN372_00040 Prostate problems past 12 months
PROSTYR Frequency Percent ------------------------------------------1 Yes 961 982 2 No 8799 8992 7 Refused 8 008 8 Not ascertained 4 004 9 Dont know 13 013
Frequency Missing = 24740
57
2012 National Health Interview Survey (NHIS)Sample Adult Public Use File (samadult)
ACN Variables Thursday May 16 2013Unweighted Frequencies
ACN400_00000 Now use a hearing aid
HRAIDNOW Frequency Percent ------------------------------------------1 Yes 1093 317 2 No 33423 9681 7 Refused 5 001 8 Not ascertained 4 001 9 Dont know 0 000
ACN410_00000 Ever used a hearing aid if not now using
HRAIDEV Frequency Percent ------------------------------------------1 Yes 321 096 2 No 33099 9902 7 Refused 6 002 8 Not ascertained 0 000 9 Dont know 2 001
Frequency Missing = 1097
ACN420_00000 Hearing wo hearing aid
AHEARST1 Frequency Percent ---------------------------------------------------1 Excellent 15817 4581 2 Good 12888 3733 3 A little trouble hearing 3721 1078 4 Moderate trouble 1310 379 5 A lot of trouble 675 196 6 Deaf 101 029 7 Refused 4 001 8 Not ascertained 4 001 9 Dont know 5 001
ACN430_00000 Trouble seeing even wglasseslenses
AVISION Frequency Percent ------------------------------------------1 Yes 3387 981 2 No 31122 9014 7 Refused 3 001 8 Not ascertained 4 001 9 Dont know 9 003
58
2012 National Health Interview Survey (NHIS)Sample Adult Public Use File (samadult)
ACN Variables Thursday May 16 2013Unweighted Frequencies
ACN440_00000 Blind or unable to see at all
ABLIND Frequency Percent ------------------------------------------1 Yes 168 496 2 No 3218 9501 7 Refused 0 000 8 Not ascertained 0 000 9 Dont know 1 003
Frequency Missing = 31138
ACN451_00000 Lost all upper amp lower natural teeth
LUPPRT Frequency Percent ------------------------------------------1 Yes 3200 927 2 No 31306 9068 7 Refused 12 003 8 Not ascertained 4 001 9 Dont know 3 001
ACN471_01000 So sad nothing cheers you up past 30 days
SAD Frequency Percent -----------------------------------------------1 ALL of the time 283 082 2 MOST of the time 770 223 3 SOME of the time 2842 823 4 A LITTLE of the time 4475 1296 5 NONE of the time 26021 7537 7 Refused 65 019 8 Not ascertained 14 004 9 Dont know 55 016
ACN471_02000 How often felt nervous past 30 days
NERVOUS Frequency Percent -----------------------------------------------1 ALL of the time 501 145 2 MOST of the time 974 282 3 SOME of the time 4029 1167 4 A LITTLE of the time 6081 1761 5 NONE of the time 22813 6608 7 Refused 62 018 8 Not ascertained 15 004 9 Dont know 50 014
59
2012 National Health Interview Survey (NHIS)Sample Adult Public Use File (samadult)
ACN Variables Thursday May 16 2013Unweighted Frequencies
ACN471_03000 How often restlessfidgety past 30 days
RESTLESS Frequency Percent -----------------------------------------------1 ALL of the time 678 196 2 MOST of the time 1093 317 3 SOME of the time 3819 1106 4 A LITTLE of the time 4839 1402 5 NONE of the time 23970 6943 7 Refused 61 018 8 Not ascertained 16 005 9 Dont know 49 014
ACN471_04000 How often felt hopeless past 30 days
HOPELESS Frequency Percent -----------------------------------------------1 ALL of the time 304 088 2 MOST of the time 486 141 3 SOME of the time 1578 457 4 A LITTLE of the time 2087 604 5 NONE of the time 29928 8669 7 Refused 65 019 8 Not ascertained 16 005 9 Dont know 61 018
ACN471_05000 How often felt everything was an effort past 30 days
EFFORT Frequency Percent -----------------------------------------------1 ALL of the time 884 256 2 MOST of the time 1120 324 3 SOME of the time 2896 839 4 A LITTLE of the time 3387 981 5 NONE of the time 26073 7552 7 Refused 64 019 8 Not ascertained 17 005 9 Dont know 84 024
ACN471_06000 How often felt worthless past 30 days
WORTHLS Frequency Percent -----------------------------------------------1 ALL of the time 288 083 2 MOST of the time 407 118 3 SOME of the time 1254 363 4 A LITTLE of the time 1518 440 5 NONE of the time 30907 8952 7 Refused 65 019 8 Not ascertained 18 005 9 Dont know 68 020
60
2012 National Health Interview Survey (NHIS)Sample Adult Public Use File (samadult)
ACN Variables Thursday May 16 2013Unweighted Frequencies
ACN530_00000 Feelings interfered wlife past 30 days
MHAMTMO Frequency Percent ------------------------------------------1 A lot 1341 1350 2 Some 2345 2361 3 A little 2856 2875 4 Not at all 3381 3404 7 Refused 2 002 8 Not ascertained 2 002 9 Dont know 6 006
Frequency Missing = 24592
61
2012 National Health Interview Survey (NHIS)Sample Adult Public Use File (samadult)
ACD Variables Thursday May 16 2013Unweighted Frequencies
ACD010_00000 Voice problem past 12 months
VSLVYR Frequency Percent ------------------------------------------1 Yes 2746 795 2 No 31734 9192 7 Refused 7 002 8 Not ascertained 30 009 9 Dont know 8 002
ACD015_00000 Swallowing problem past 12 months
VSLSWYR Frequency Percent ------------------------------------------1 Yes 1554 450 2 No 32925 9537 7 Refused 9 003 8 Not ascertained 32 009 9 Dont know 5 001
ACD020_00000 Speech problem past 12 months
VSLSPYR Frequency Percent ------------------------------------------1 Yes 1061 307 2 No 33422 9681 7 Refused 7 002 8 Not ascertained 33 010 9 Dont know 2 001
ACD025_00000 Language problem past 12 months
VSLLGYR Frequency Percent ------------------------------------------1 Yes 592 171 2 No 33884 9814 7 Refused 7 002 8 Not ascertained 34 010 9 Dont know 8 002
ACD030_00000 Special services or instruction for problem(s)
VSLSPEC Frequency Percent ------------------------------------------1 Yes 1605 465 2 No 32834 9510 7 Refused 9 003 8 Not ascertained 34 010 9 Dont know 43 012
62
2012 National Health Interview Survey (NHIS)Sample Adult Public Use File (samadult)
ACD Variables Thursday May 16 2013Unweighted Frequencies
ACD035_00000 Ever had voice swallowingspeech or language problem lasting 1+ weeks
VSLEVER Frequency Percent ------------------------------------------1 Yes 787 260 2 No 29435 9733 7 Refused 9 003 8 Not ascertained 1 000 9 Dont know 12 004
Frequency Missing = 4281
ACD040_00000 Given diagnosis for voice swallowing speech language problem
VSLHPD Frequency Percent ------------------------------------------1 Yes 1438 2856 2 No 3564 7078 7 Refused 1 002 8 Not ascertained 2 004 9 Dont know 30 060
Frequency Missing = 29490
ACD045_01000 Given diagnosis for voice problem
VSLDGTP1 Frequency Percent ------------------------------------------1 Mentioned 623 4332 2 Not mentioned 811 5640 7 Refused 0 000 8 Not ascertained 0 000 9 Dont know 4 028
Frequency Missing = 33087
ACD045_02000 Given diagnosis for swallowing problem
VSLDGTP2 Frequency Percent ------------------------------------------1 Mentioned 587 4082 2 Not mentioned 847 5890 7 Refused 0 000 8 Not ascertained 0 000 9 Dont know 4 028
Frequency Missing = 33087
63
2012 National Health Interview Survey (NHIS)Sample Adult Public Use File (samadult)
ACD Variables Thursday May 16 2013Unweighted Frequencies
ACD045_03000 Given diagnosis for speech problem
VSLDGTP3 Frequency Percent ------------------------------------------1 Mentioned 527 3665 2 Not mentioned 907 6307 7 Refused 0 000 8 Not ascertained 0 000 9 Dont know 4 028
Frequency Missing = 33087
ACD045_04000 Given diagnosis for language problem
VSLDGTP4 Frequency Percent ------------------------------------------1 Mentioned 165 1147 2 Not mentioned 1269 8825 7 Refused 0 000 8 Not ascertained 0 000 9 Dont know 4 028
Frequency Missing = 33087
ACD050_01000 Laryngitis caused by voicemisuse abuse overuse caused voice problem
VSLVDG01 Frequency Percent ------------------------------------------1 Mentioned 38 610 2 Not mentioned 581 9326 7 Refused 0 000 8 Not ascertained 0 000 9 Dont know 4 064
Frequency Missing = 33902
ACD050_02000 Laryngitis caused by coldsstrep caused voice problem
VSLVDG02 Frequency Percent ------------------------------------------1 Mentioned 109 1750 2 Not mentioned 510 8186 7 Refused 0 000 8 Not ascertained 0 000 9 Dont know 4 064
Frequency Missing = 33902
64
2012 National Health Interview Survey (NHIS)Sample Adult Public Use File (samadult)
ACD Variables Thursday May 16 2013Unweighted Frequencies
ACD050_03000 Vocal nodules or polyps caused voice problem
VSLVDG03 Frequency Percent ------------------------------------------1 Mentioned 56 899 2 Not mentioned 563 9037 7 Refused 0 000 8 Not ascertained 0 000 9 Dont know 4 064
Frequency Missing = 33902
ACD050_04000 Gastro-esophageal reflux disease (GERD) caused voice problem
VSLVDG04 Frequency Percent ------------------------------------------1 Mentioned 51 819 2 Not mentioned 568 9117 7 Refused 0 000 8 Not ascertained 0 000 9 Dont know 4 064
Frequency Missing = 33902
ACD050_05000 Allergies caused voice problem
VSLVDG05 Frequency Percent ------------------------------------------1 Mentioned 64 1027 2 Not mentioned 555 8909 7 Refused 0 000 8 Not ascertained 0 000 9 Dont know 4 064
Frequency Missing = 33902
ACD050_06000 Airborne irritants or environmental pollutants caused voice problem
VSLVDG06 Frequency Percent ------------------------------------------1 Mentioned 6 096 2 Not mentioned 613 9839 7 Refused 0 000 8 Not ascertained 0 000 9 Dont know 4 064
Frequency Missing = 33902
65
2012 National Health Interview Survey (NHIS)Sample Adult Public Use File (samadult)
ACD Variables Thursday May 16 2013Unweighted Frequencies
ACD050_07000 Headneck injury caused voice problem
VSLVDG07 Frequency Percent ------------------------------------------1 Mentioned 11 177 2 Not mentioned 608 9759 7 Refused 0 000 8 Not ascertained 0 000 9 Dont know 4 064
Frequency Missing = 33902
ACD050_08000 Cancer anywhere in the headneck or throat caused voice problem
VSLVDG08 Frequency Percent ------------------------------------------1 Mentioned 28 449 2 Not mentioned 591 9486 7 Refused 0 000 8 Not ascertained 0 000 9 Dont know 4 064
Frequency Missing = 33902
ACD050_09000 Neurological cause (AlzheimersParkinsons dementia etc) caused voice problem
VSLVDG09 Frequency Percent ------------------------------------------1 Mentioned 29 465 2 Not mentioned 590 9470 7 Refused 0 000 8 Not ascertained 0 000 9 Dont know 4 064
Frequency Missing = 33902
ACD050_10000 Prescription medication or drugs caused voice problem
VSLVDG10 Frequency Percent ------------------------------------------1 Mentioned 26 417 2 Not mentioned 593 9518 7 Refused 0 000 8 Not ascertained 0 000 9 Dont know 4 064
Frequency Missing = 33902
66
2012 National Health Interview Survey (NHIS)Sample Adult Public Use File (samadult)
ACD Variables Thursday May 16 2013Unweighted Frequencies
ACD050_11000 Something else caused voice problem
VSLVDG11 Frequency Percent ------------------------------------------1 Mentioned 263 4222 2 Not mentioned 356 5714 7 Refused 0 000 8 Not ascertained 0 000 9 Dont know 4 064
Frequency Missing = 33902
ACD060_01000 Stroke caused swallowing problem
VSLSWD01 Frequency Percent ------------------------------------------1 Mentioned 60 1022 2 Not mentioned 522 8893 7 Refused 0 000 8 Not ascertained 0 000 9 Dont know 5 085
Frequency Missing = 33938
ACD060_02000 Neurological cause (Alzheimers Parkinsonspost-polio syndrome dementia etc) caused swallowing problem
VSLSWD02 Frequency Percent ------------------------------------------1 Mentioned 36 613 2 Not mentioned 546 9302 7 Refused 0 000 8 Not ascertained 0 000 9 Dont know 5 085
Frequency Missing = 33938
ACD060_03000 Cancer anywhere in the headneck or throat caused swallowing problem
VSLSWD03 Frequency Percent ------------------------------------------1 Mentioned 33 562 2 Not mentioned 549 9353 7 Refused 0 000 8 Not ascertained 0 000 9 Dont know 5 085
Frequency Missing = 33938
67
2012 National Health Interview Survey (NHIS)Sample Adult Public Use File (samadult)
ACD Variables Thursday May 16 2013Unweighted Frequencies
ACD060_04000 Chronic obstructive pulmonarydisease (COPD) caused swallowing problem
VSLSWD04 Frequency Percent ------------------------------------------1 Mentioned 5 085 2 Not mentioned 577 9830 7 Refused 0 000 8 Not ascertained 0 000 9 Dont know 5 085
Frequency Missing = 33938
ACD060_05000 Congestive heart failure (CHF) caused swallowing problem
VSLSWD05 Frequency Percent ------------------------------------------1 Mentioned 7 119 2 Not mentioned 575 9796 7 Refused 0 000 8 Not ascertained 0 000 9 Dont know 5 085
Frequency Missing = 33938
ACD060_06000 Headneck injury caused swallowing problem
VSLSWD06 Frequency Percent ------------------------------------------1 Mentioned 16 273 2 Not mentioned 566 9642 7 Refused 0 000 8 Not ascertained 0 000 9 Dont know 5 085
Frequency Missing = 33938
ACD060_07000 Arthritic changes in the neck (arthritiscervical osteophyte) caused swallowing problem
VSLSWD07 Frequency Percent ------------------------------------------1 Mentioned 7 119 2 Not mentioned 575 9796 7 Refused 0 000 8 Not ascertained 0 000 9 Dont know 5 085
Frequency Missing = 33938
68
2012 National Health Interview Survey (NHIS)Sample Adult Public Use File (samadult)
ACD Variables Thursday May 16 2013Unweighted Frequencies
ACD060_08000 Advancing age (deterioration of musclefunction with agehellipsarcopenia) caused swallowing problem
VSLSWD08 Frequency Percent ------------------------------------------1 Mentioned 20 341 2 Not mentioned 562 9574 7 Refused 0 000 8 Not ascertained 0 000 9 Dont know 5 085
Frequency Missing = 33938
ACD060_09000 Prescription medication or drugs caused swallowing problem
VSLSWD09 Frequency Percent ------------------------------------------1 Mentioned 17 290 2 Not mentioned 565 9625 7 Refused 0 000 8 Not ascertained 0 000 9 Dont know 5 085
Frequency Missing = 33938
ACD060_10000 Something else caused swallowing problem
VSLSWD10 Frequency Percent ------------------------------------------1 Mentioned 407 6934 2 Not mentioned 175 2981 7 Refused 0 000 8 Not ascertained 0 000 9 Dont know 5 085
Frequency Missing = 33938
ACD065_01000 Hearing loss or deafness caused speech problem
VSLSPD01 Frequency Percent ------------------------------------------1 Mentioned 46 873 2 Not mentioned 467 8861 7 Refused 0 000 8 Not ascertained 0 000 9 Dont know 14 266
Frequency Missing = 33998
69
2012 National Health Interview Survey (NHIS)Sample Adult Public Use File (samadult)
ACD Variables Thursday May 16 2013Unweighted Frequencies
ACD065_02000 Developmental speech sound disorder (phonologicalarticulatory dyspraxia) caused speech problem
VSLSPD02 Frequency Percent ------------------------------------------1 Mentioned 79 1499 2 Not mentioned 434 8235 7 Refused 0 000 8 Not ascertained 0 000 9 Dont know 14 266
Frequency Missing = 33998
ACD065_03000 Cerebral palsy caused speech problem
VSLSPD03 Frequency Percent ------------------------------------------1 Mentioned 9 171 2 Not mentioned 504 9564 7 Refused 0 000 8 Not ascertained 0 000 9 Dont know 14 266
Frequency Missing = 33998
ACD065_04000 Cleft lippalate cranial-facialanomaly (structural cause) caused speech problem
VSLSPD04 Frequency Percent ------------------------------------------1 Mentioned 11 209 2 Not mentioned 502 9526 7 Refused 0 000 8 Not ascertained 0 000 9 Dont know 14 266
Frequency Missing = 33998
ACD065_05000 Headneck injury caused speech problem
VSLSPD05 Frequency Percent ------------------------------------------1 Mentioned 14 266 2 Not mentioned 499 9469 7 Refused 0 000 8 Not ascertained 0 000 9 Dont know 14 266
Frequency Missing = 33998
70
2012 National Health Interview Survey (NHIS)Sample Adult Public Use File (samadult)
ACD Variables Thursday May 16 2013Unweighted Frequencies
ACD065_06000 Stuttering caused speech problem
VSLSPD06 Frequency Percent ------------------------------------------1 Mentioned 52 987 2 Not mentioned 461 8748 7 Refused 0 000 8 Not ascertained 0 000 9 Dont know 14 266
Frequency Missing = 33998
ACD065_07000 Cancer anywhere in the headneck or throat caused speech problem
VSLSPD07 Frequency Percent ------------------------------------------1 Mentioned 8 152 2 Not mentioned 505 9583 7 Refused 0 000 8 Not ascertained 0 000 9 Dont know 14 266
Frequency Missing = 33998
ACD065_08000 Neurological causedysarthria (Alzheimers ParkinsonsALS multiple sclerosis dementia etc) caused speech problem
VSLSPD08 Frequency Percent ------------------------------------------1 Mentioned 53 1006 2 Not mentioned 460 8729 7 Refused 0 000 8 Not ascertained 0 000 9 Dont know 14 266
Frequency Missing = 33998
ACD065_09000 Prescription medication or drugs caused speech problem
VSLSPD09 Frequency Percent ------------------------------------------1 Mentioned 9 171 2 Not mentioned 504 9564 7 Refused 0 000 8 Not ascertained 0 000 9 Dont know 14 266
Frequency Missing = 33998
71
2012 National Health Interview Survey (NHIS)Sample Adult Public Use File (samadult)
ACD Variables Thursday May 16 2013Unweighted Frequencies
ACD065_10000 Something else caused speech problem
VSLSPD10 Frequency Percent ------------------------------------------1 Mentioned 265 5028 2 Not mentioned 248 4706 7 Refused 0 000 8 Not ascertained 0 000 9 Dont know 14 266
Frequency Missing = 33998
ACD070_01000 Hearing loss or deafness caused problemsusing or understanding words or sentences
VSLLGD01 Frequency Percent ------------------------------------------1 Mentioned 13 788 2 Not mentioned 148 8970 7 Refused 0 000 8 Not ascertained 0 000 9 Dont know 4 242
Frequency Missing = 34360
ACD070_02000 Genetic syndrome Down Syndrome Fragile X Syndromeetc cause problems using or understanding words or sentences
VSLLGD02 Frequency Percent ------------------------------------------1 Mentioned 7 424 2 Not mentioned 154 9333 7 Refused 0 000 8 Not ascertained 0 000 9 Dont know 4 242
Frequency Missing = 34360
ACD070_03000 Intellectual disability also known as mental retardationcaused problem using or understanding words or sentences
VSLLGD03 Frequency Percent ------------------------------------------1 Mentioned 18 1091 2 Not mentioned 143 8667 7 Refused 0 000 8 Not ascertained 0 000 9 Dont know 4 242
Frequency Missing = 34360
72
2012 National Health Interview Survey (NHIS)Sample Adult Public Use File (samadult)
ACD Variables Thursday May 16 2013Unweighted Frequencies
ACD070_04000 Autism spectrum disorder caused problemusing or understanding words or sentences
VSLLGD04 Frequency Percent ------------------------------------------1 Mentioned 8 485 2 Not mentioned 153 9273 7 Refused 0 000 8 Not ascertained 0 000 9 Dont know 4 242
Frequency Missing = 34360
ACD070_05000 Developmental Language-Learning Disorder (egSpecific Language Impairment (SLI) learning disability or dyslexia)
cause problem using or understanding words or sentences
VSLLGD05 Frequency Percent ------------------------------------------1 Mentioned 24 1455 2 Not mentioned 137 8303 7 Refused 0 000 8 Not ascertained 0 000 9 Dont know 4 242
Frequency Missing = 34360
ACD070_06000 Other developmental delay causedproblem using or understanding words or sentences
VSLLGD06 Frequency Percent ------------------------------------------1 Mentioned 7 424 2 Not mentioned 154 9333 7 Refused 0 000 8 Not ascertained 0 000 9 Dont know 4 242
Frequency Missing = 34360
ACD070_07000 Head injury traumatic brain injury (TBI)caused problem using or understanding words or sentences
VSLLGD07 Frequency Percent ------------------------------------------1 Mentioned 12 727 2 Not mentioned 149 9030 7 Refused 0 000 8 Not ascertained 0 000 9 Dont know 4 242
Frequency Missing = 34360
73
2012 National Health Interview Survey (NHIS)Sample Adult Public Use File (samadult)
ACD Variables Thursday May 16 2013Unweighted Frequencies
ACD070_08000 Strokeaphasia caused problemusing or understanding words or sentences
VSLLGD08 Frequency Percent ------------------------------------------1 Mentioned 37 2242 2 Not mentioned 124 7515 7 Refused 0 000 8 Not ascertained 0 000 9 Dont know 4 242
Frequency Missing = 34360
ACD070_09000 Dementia or other neurological cause (Alzheimers Parkinsonsetc) caused problem using or understanding words or sentences
VSLLGD09 Frequency Percent ------------------------------------------1 Mentioned 13 788 2 Not mentioned 148 8970 7 Refused 0 000 8 Not ascertained 0 000 9 Dont know 4 242
Frequency Missing = 34360
ACD070_10000 Prescription medication or drugs causedproblem using or understanding words or sentences
VSLLGD10 Frequency Percent ------------------------------------------1 Mentioned 8 485 2 Not mentioned 153 9273 7 Refused 0 000 8 Not ascertained 0 000 9 Dont know 4 242
Frequency Missing = 34360
ACD070_11000 Something else caused problemusing or understanding words or sentences
VSLLGD11 Frequency Percent ------------------------------------------1 Mentioned 49 2970 2 Not mentioned 112 6788 7 Refused 0 000 8 Not ascertained 0 000 9 Dont know 4 242
Frequency Missing = 34360
74
2012 National Health Interview Survey (NHIS)Sample Adult Public Use File (samadult)
ACD Variables Thursday May 16 2013Unweighted Frequencies
ACD075_00000 Number of days had voice problems in past year
VSLVDYS Frequency Percent --------------------------------------------001-365 1-365 2612 9512 997 Refused 3 011 998 Not ascertained 3 011 999 Dont know 128 466
Frequency Missing = 31779
ACD080_00000 Number of days had swallowing problems in past year
VSLSWDYS Frequency Percent --------------------------------------------001-365 1-365 1473 9479 997 Refused 2 013 998 Not ascertained 3 019 999 Dont know 76 489
Frequency Missing = 32971
ACD082_00000 Number of days had speech problems in past year
VSLSPDYS Frequency Percent --------------------------------------------001-365 1-365 959 9039 997 Refused 3 028 998 Not ascertained 0 000 999 Dont know 99 933
Frequency Missing = 33464
ACD085_00000 Number of days had problemsusing or understanding words or sentences
VSLLGDYS Frequency Percent --------------------------------------------001-365 1-365 526 8885 997 Refused 4 068 998 Not ascertained 0 000 999 Dont know 62 1047
Frequency Missing = 33933
75
2012 National Health Interview Survey (NHIS)Sample Adult Public Use File (samadult)
ACD Variables Thursday May 16 2013Unweighted Frequencies
ACD090_00000 Voice problems last 1+ weeks
VSLV1WK Frequency Percent ------------------------------------------1 Yes 44 3438 2 No 75 5859 7 Refused 0 000 8 Not ascertained 1 078 9 Dont know 8 625
Frequency Missing = 34397
ACD095_00000 Swallowing problems last 1+ weeks
VSLSW1WK Frequency Percent ------------------------------------------1 Yes 32 4211 2 No 39 5132 7 Refused 0 000 8 Not ascertained 0 000 9 Dont know 5 658
Frequency Missing = 34449
ACD100_00000 Speech problems last 1+ weeks
VSLSP1WK Frequency Percent ------------------------------------------1 Yes 35 3535 2 No 59 5960 7 Refused 0 000 8 Not ascertained 0 000 9 Dont know 5 505
Frequency Missing = 34426
ACD105_00000 Problems using or understanding words or sentences last 1+ weeks
VSLLG1WK Frequency Percent ------------------------------------------1 Yes 28 4516 2 No 28 4516 7 Refused 0 000 8 Not ascertained 0 000 9 Dont know 6 968
Frequency Missing = 34463
76
2012 National Health Interview Survey (NHIS)Sample Adult Public Use File (samadult)
ACD Variables Thursday May 16 2013Unweighted Frequencies
ACD110_00000 Stammering or stuttering problem in past 12 months
VSLSTUTT Frequency Percent ------------------------------------------1 Yes 332 4456 2 No 411 5517 7 Refused 0 000 8 Not ascertained 0 000 9 Dont know 2 027
Frequency Missing = 33780
ACD115_00000 Degree of stammering or stuttering problem
VSLSTDEG Frequency Percent ------------------------------------------1 Mild 215 6476 2 Moderate 87 2620 3 Severe 28 843 7 Refused 1 030 8 Not ascertained 0 000 9 Dont know 1 030
Frequency Missing = 34193
ACD120_00000 Family friends associates had troubleunderstanding what you say in past 12 months
VSLLGFAM Frequency Percent ------------------------------------------1 Yes 283 6139 2 No 176 3818 7 Refused 0 000 8 Not ascertained 0 000 9 Donrsquot know 2 043
Frequency Missing = 34064
ACD125_00000 Age first had voice problems
VSLVAGE Frequency Percent --------------------------------------------000-120 Current Age 1391 9380 997 Refused 3 020 998 Not ascertained 0 000 999 Dont know 89 600
Frequency Missing = 33042
77
2012 National Health Interview Survey (NHIS)Sample Adult Public Use File (samadult)
ACD Variables Thursday May 16 2013Unweighted Frequencies
ACD130_00000 Age first had swallowing problems
VSLSWAGE Frequency Percent --------------------------------------------000-120 Current Age 951 9587 997 Refused 2 020 998 Not ascertained 0 000 999 Dont know 39 393
Frequency Missing = 33533
ACD135_00000 Age first had speech problems
VSLSPAGE Frequency Percent --------------------------------------------000-120 Current Age 703 9436 997 Refused 0 000 998 Not ascertained 0 000 999 Dont know 42 564
Frequency Missing = 33780
ACD140_00000 Age first had problems using or understanding words or sentences
VSLLGAGE Frequency Percent --------------------------------------------000-120 Current Age 429 9306 997 Refused 0 000 998 Not ascertained 0 000 999 Dont know 32 694
Frequency Missing = 34064
ACD145_00000 How much of a problem with your voice in past 12 months
VSLVPRB Frequency Percent ---------------------------------------------1 No problem 207 1396 2 A small problem 748 5044 3 A moderate problem 345 2326 4 A big problem 99 668 5 A very big problem 77 519 7 Refused 2 013 8 Not ascertained 2 013 9 Dont know 3 020
Frequency Missing = 33042
78
2012 National Health Interview Survey (NHIS)Sample Adult Public Use File (samadult)
ACD Variables Thursday May 16 2013Unweighted Frequencies
ACD150_00000 How much of a problem with swallowing in past 12 months
VSLSWPRB Frequency Percent ---------------------------------------------1 No problem 40 403 2 A small problem 387 3901 3 A moderate problem 323 3256 4 A big problem 157 1583 5 A very big problem 82 827 7 Refused 1 010 8 Not ascertained 0 000 9 Dont know 2 020
Frequency Missing = 33533
ACD155_00000 How much of a problem with speech in the past 12 months
VSLSPPRB Frequency Percent ---------------------------------------------1 No problem 79 1060 2 A small problem 336 4510 3 A moderate problem 184 2470 4 A big problem 75 1007 5 A very big problem 65 872 7 Refused 0 000 8 Not ascertained 1 013 9 Dont know 5 067
Frequency Missing = 33780
ACD160_00000 How much of a problem using or understandingwords or sentences in the past 12 months
VSLLGPRB Frequency Percent ---------------------------------------------1 No problem 30 651 2 A small problem 154 3341 3 A moderate problem 129 2798 4 A big problem 79 1714 5 A very big problem 64 1388 7 Refused 0 000 8 Not ascertained 1 022 9 Dont know 4 087
Frequency Missing = 34064
79
2012 National Health Interview Survey (NHIS)Sample Adult Public Use File (samadult)
ACD Variables Thursday May 16 2013Unweighted Frequencies
ACD165_00000 Seen speech-language pathologist (SLP) or otherhealth care professional for voice problem in past 12 months
VSLVSLP Frequency Percent ------------------------------------------1 Yes 148 998 2 No 1330 8968 7 Refused 1 007 8 Not ascertained 2 013 9 Dont know 2 013
Frequency Missing = 33042
ACD170_00000 Ever seen speech-language pathologist (SLP)or other health care professional about voice problem
VSLVPEV Frequency Percent ------------------------------------------1 Yes 155 1165 2 No 1171 8805 7 Refused 1 008 8 Not ascertained 1 008 9 Dont know 2 015
Frequency Missing = 33195
ACD175_00000 Seen speech-language pathologist (SLP) or other healthcare professional for swallowing problem in past 12 months
VSLSWSLP Frequency Percent ------------------------------------------1 Yes 219 2208 2 No 772 7782 7 Refused 1 010 8 Not ascertained 0 000 9 Dont know 0 000
Frequency Missing = 33533
ACD180_00000 Ever seen speech-language pathologist (SLP)or other health care professional about swallowing problem
VSLSWPEV Frequency Percent ------------------------------------------1 Yes 96 1244 2 No 676 8756 7 Refused 0 000 8 Not ascertained 0 000 9 Dont know 0 000
Frequency Missing = 33753
80
2012 National Health Interview Survey (NHIS)Sample Adult Public Use File (samadult)
ACD Variables Thursday May 16 2013Unweighted Frequencies
ACD185_00000 Seen speech-language pathologist (SLP) or otherhealth professional for speech problem in past 12 months
VSLSPSLP Frequency Percent ------------------------------------------1 Yes 100 1342 2 No 640 8591 7 Refused 0 000 8 Not ascertained 1 013 9 Dont know 4 054
Frequency Missing = 33780
ACD190_00000 Ever seen speech-language pathologist (SLP) or otherhealth care professional about speech problem in past 12 months
VSLSPPEV Frequency Percent ------------------------------------------1 Yes 163 2547 2 No 472 7375 7 Refused 0 000 8 Not ascertained 0 000 9 Dont know 5 078
Frequency Missing = 33885
ACD195_00000 Seen speech-language pathologist (SLP) or other health careprofessional for problem using or understanding
words or sentences in past 12 months
VSLLGSLP Frequency Percent ------------------------------------------1 Yes 64 1388 2 No 393 8525 7 Refused 0 000 8 Not ascertained 1 022 9 Dont know 3 065
Frequency Missing = 34064
ACD200_00000 Ever seen speech-language pathologist (SLP)or other health care professional about problem usingor understanding words or sentences in past 12 months
VSLLGPEV Frequency Percent ------------------------------------------1 Yes 98 2494 2 No 293 7455 7 Refused 0 000 8 Not ascertained 0 000 9 Dont know 2 051
Frequency Missing = 34132
81
2012 National Health Interview Survey (NHIS)Sample Adult Public Use File (samadult)
ACD Variables Thursday May 16 2013Unweighted Frequencies
ACD205_00000 Received treatments therapy or other rehabilitationservices for voice problems in past 12 months
VSLVTRT Frequency Percent ------------------------------------------1 Yes 144 971 2 No 1333 8989 7 Refused 2 013 8 Not ascertained 3 020 9 Dont know 1 007
Frequency Missing = 33042
ACD210_01000 Speech-language pathologist provided voice services
VSLVTR01 Frequency Percent ------------------------------------------1 Mentioned 30 2083 2 Not mentioned 114 7917 7 Refused 0 000 8 Not ascertained 0 000 9 Dont know 0 000
Frequency Missing = 34381
ACD210_02000 Family physician General Practitioneror Osteopath provided voice services
VSLVTR02 Frequency Percent ------------------------------------------1 Mentioned 56 3889 2 Not mentioned 88 6111 7 Refused 0 000 8 Not ascertained 0 000 9 Dont know 0 000
Frequency Missing = 34381
ACD210_03000 Rehabilitation Specialist (Occupationalor Physical Therapist) provided voices services
VSLVTR03 Frequency Percent ------------------------------------------1 Mentioned 15 1042 2 Not mentioned 129 8958 7 Refused 0 000 8 Not ascertained 0 000 9 Dont know 0 000
Frequency Missing = 34381
82
2012 National Health Interview Survey (NHIS)Sample Adult Public Use File (samadult)
ACD Variables Thursday May 16 2013Unweighted Frequencies
ACD210_04000 Ear Nose Throat Doctor (Otolaryngologist)provided voice services
VSLVTR04 Frequency Percent ------------------------------------------1 Mentioned 32 2222 2 Not mentioned 112 7778 7 Refused 0 000 8 Not ascertained 0 000 9 Dont know 0 000
Frequency Missing = 34381
ACD210_05000 Audiologist Hearing Specialistor Hearing Aid Technician provided voice services
VSLVTR05 Frequency Percent ------------------------------------------1 Mentioned 3 208 2 Not mentioned 141 9792 7 Refused 0 000 8 Not ascertained 0 000 9 Dont know 0 000
Frequency Missing = 34381
ACD210_06000 Specialty doctor in Internal MedicineGeriatrics Neurology etc provided voice services
VSLVTR06 Frequency Percent ------------------------------------------1 Mentioned 13 903 2 Not mentioned 131 9097 7 Refused 0 000 8 Not ascertained 0 000 9 Dont know 0 000
Frequency Missing = 34381
ACD210_07000 Nutritionist or Dietician provided voice services
VSLVTR07 Frequency Percent ------------------------------------------1 Mentioned 0 000 2 Not mentioned 144 10000 7 Refused 0 000 8 Not ascertained 0 000 9 Dont know 0 000
Frequency Missing = 34381
83
2012 National Health Interview Survey (NHIS)Sample Adult Public Use File (samadult)
ACD Variables Thursday May 16 2013Unweighted Frequencies
ACD210_08000 Psychiatrist or Psychologist provided voice services
VSLVTR08 Frequency Percent ------------------------------------------1 Mentioned 3 208 2 Not mentioned 141 9792 7 Refused 0 000 8 Not ascertained 0 000 9 Dont know 0 000
Frequency Missing = 34381
ACD210_09000 Nurse or Nurse Practitioner provided voice services
VSLVTR09 Frequency Percent ------------------------------------------1 Mentioned 2 139 2 Not mentioned 142 9861 7 Refused 0 000 8 Not ascertained 0 000 9 Dont know 0 000
Frequency Missing = 34381
ACD210_10000 Dentist Orthodontist or Oral Surgeon provided voice services
VSLVTR10 Frequency Percent ------------------------------------------1 Mentioned 1 069 2 Not mentioned 143 9931 7 Refused 0 000 8 Not ascertained 0 000 9 Dont know 0 000
Frequency Missing = 34381
ACD210_11000 Some other health professional provided voice services
VSLVTR11 Frequency Percent ------------------------------------------1 Mentioned 13 903 2 Not mentioned 131 9097 7 Refused 0 000 8 Not ascertained 0 000 9 Dont know 0 000
Frequency Missing = 34381
84
2012 National Health Interview Survey (NHIS)Sample Adult Public Use File (samadult)
ACD Variables Thursday May 16 2013Unweighted Frequencies
ACD215_00000 Received treatments therapy or other rehabilitationservices for swallowing problems in past 12 months
VSLSWTRT Frequency Percent ------------------------------------------1 Yes 188 1895 2 No 803 8095 7 Refused 1 010 8 Not ascertained 0 000 9 Dont know 0 000
Frequency Missing = 33533
ACD220_01000 Speech-language pathologist provided swallowing services
VSLSWT01 Frequency Percent ------------------------------------------1 Mentioned 20 1064 2 Not mentioned 166 8830 7 Refused 0 000 8 Not ascertained 0 000 9 Dont know 2 106
Frequency Missing = 34337
ACD220_02000 Family physician General Practitioneror Osteopath provided swallowing services
VSLSWT02 Frequency Percent ------------------------------------------1 Mentioned 57 3032 2 Not mentioned 129 6862 7 Refused 0 000 8 Not ascertained 0 000 9 Dont know 2 106
Frequency Missing = 34337
ACD220_03000 Rehabilitation Specialist (Occupationalor Physical Therapist) provided swallowing services
VSLSWT03 Frequency Percent ------------------------------------------1 Mentioned 19 1011 2 Not mentioned 167 8883 7 Refused 0 000 8 Not ascertained 0 000 9 Dont know 2 106
Frequency Missing = 34337
85
2012 National Health Interview Survey (NHIS)Sample Adult Public Use File (samadult)
ACD Variables Thursday May 16 2013Unweighted Frequencies
ACD220_04000 Ear Nose Throat Doctor (Otolaryngologist)provided swallowing services
VSLSWT04 Frequency Percent ------------------------------------------1 Mentioned 40 2128 2 Not mentioned 146 7766 7 Refused 0 000 8 Not ascertained 0 000 9 Dont know 2 106
Frequency Missing = 34337
ACD220_05000 Audiologist Hearing Specialist orHearing Aid Technician provided swallowing services
VSLSWT05 Frequency Percent ------------------------------------------1 Mentioned 0 000 2 Not mentioned 186 9894 7 Refused 0 000 8 Not ascertained 0 000 9 Dont know 2 106
Frequency Missing = 34337
ACD220_06000 Specialty doctor in Internal Medicine GeriatricsNeurology etc provided swallowing services
VSLSWT06 Frequency Percent ------------------------------------------1 Mentioned 46 2447 2 Not mentioned 140 7447 7 Refused 0 000 8 Not ascertained 0 000 9 Dont know 2 106
Frequency Missing = 34337
ACD220_07000 Nutritionist or Dietician provided swallowing services
VSLSWT07 Frequency Percent ------------------------------------------1 Mentioned 3 160 2 Not mentioned 183 9734 7 Refused 0 000 8 Not ascertained 0 000 9 Dont know 2 106
Frequency Missing = 34337
86
2012 National Health Interview Survey (NHIS)Sample Adult Public Use File (samadult)
ACD Variables Thursday May 16 2013Unweighted Frequencies
ACD220_08000 Psychiatrist or Psychologist provided swallowing services
VSLSWT08 Frequency Percent ------------------------------------------1 Mentioned 3 160 2 Not mentioned 183 9734 7 Refused 0 000 8 Not ascertained 0 000 9 Dont know 2 106
Frequency Missing = 34337
ACD220_09000 Nurse or Nurse Practitioner provided swallowing services
VSLSWT09 Frequency Percent ------------------------------------------1 Mentioned 3 160 2 Not mentioned 183 9734 7 Refused 0 000 8 Not ascertained 0 000 9 Dont know 2 106
Frequency Missing = 34337
ACD220_10000 Dentist Orthodontist orOral Surgeon provided swallowing services
VSLSWT10 Frequency Percent ------------------------------------------1 Mentioned 1 053 2 Not mentioned 185 9840 7 Refused 0 000 8 Not ascertained 0 000 9 Dont know 2 106
Frequency Missing = 34337
ACD220_11000 Some other health professional provided swallowing services
VSLSWT11 Frequency Percent ------------------------------------------1 Mentioned 16 851 2 Not mentioned 170 9043 7 Refused 0 000 8 Not ascertained 0 000 9 Dont know 2 106
Frequency Missing = 34337
87
2012 National Health Interview Survey (NHIS)Sample Adult Public Use File (samadult)
ACD Variables Thursday May 16 2013Unweighted Frequencies
ACD225_00000 Received treatments therapy or other rehabilitationservices for speech problems in past 12 months
VSLSPTRT Frequency Percent ------------------------------------------1 Yes 60 805 2 No 682 9154 7 Refused 0 000 8 Not ascertained 1 013 9 Dont know 2 027
Frequency Missing = 33780
ACD230_01000 Speech-language pathologist provided speech services
VSLSPT01 Frequency Percent ------------------------------------------1 Mentioned 31 5167 2 Not mentioned 29 4833 7 Refused 0 000 8 Not ascertained 0 000 9 Dont know 0 000
Frequency Missing = 34465
ACD230_02000 Family physician General Practitioneror Osteopath provided speech services
VSLSPT02 Frequency Percent ------------------------------------------1 Mentioned 11 1833 2 Not mentioned 49 8167 7 Refused 0 000 8 Not ascertained 0 000 9 Dont know 0 000
Frequency Missing = 34465
ACD230_03000 Rehabilitation Specialist (Occupationalor Physical Therapist) provided speech services
VSLSPT03 Frequency Percent ------------------------------------------1 Mentioned 18 3000 2 Not mentioned 42 7000 7 Refused 0 000 8 Not ascertained 0 000 9 Dont know 0 000
Frequency Missing = 34465
88
2012 National Health Interview Survey (NHIS)Sample Adult Public Use File (samadult)
ACD Variables Thursday May 16 2013Unweighted Frequencies
ACD230_04000 Ear Nose Throat Doctor (Otolaryngologist)provided speech services
VSLSPT04 Frequency Percent ------------------------------------------1 Mentioned 3 500 2 Not mentioned 57 9500 7 Refused 0 000 8 Not ascertained 0 000 9 Dont know 0 000
Frequency Missing = 34465
ACD230_05000 Audiologist Hearing Specialist orHearing Aid Technician provided speech services
VSLSPT05 Frequency Percent ------------------------------------------1 Mentioned 1 167 2 Not mentioned 59 9833 7 Refused 0 000 8 Not ascertained 0 000 9 Dont know 0 000
Frequency Missing = 34465
ACD230_06000 Specialty doctor in Internal MedicineGeriatrics Neurology etc provided speech services
VSLSPT06 Frequency Percent ------------------------------------------1 Mentioned 5 833 2 Not mentioned 55 9167 7 Refused 0 000 8 Not ascertained 0 000 9 Dont know 0 000
Frequency Missing = 34465
ACD230_07000 Nutritionist or Dietician provided speech services
VSLSPT07 Frequency Percent ------------------------------------------1 Mentioned 0 000 2 Not mentioned 60 10000 7 Refused 0 000 8 Not ascertained 0 000 9 Dont know 0 000
Frequency Missing = 34465
89
2012 National Health Interview Survey (NHIS)Sample Adult Public Use File (samadult)
ACD Variables Thursday May 16 2013Unweighted Frequencies
ACD230_08000 Psychiatrist or Psychologist provided speech services
VSLSPT08 Frequency Percent ------------------------------------------1 Mentioned 1 167 2 Not mentioned 59 9833 7 Refused 0 000 8 Not ascertained 0 000 9 Dont know 0 000
Frequency Missing = 34465
ACD230_09000 Nurse or Nurse Practitioner provided speech services
VSLSPT09 Frequency Percent ------------------------------------------1 Mentioned 0 000 2 Not mentioned 60 10000 7 Refused 0 000 8 Not ascertained 0 000 9 Dont know 0 000
Frequency Missing = 34465
ACD230_10000 Dentist Orthodontist or Oral Surgeon provided speech services
VSLSPT10 Frequency Percent ------------------------------------------1 Mentioned 0 000 2 Not mentioned 60 10000 7 Refused 0 000 8 Not ascertained 0 000 9 Dont know 0 000
Frequency Missing = 34465
ACD230_11000 Some other health professional provided speech services
VSLSPT11 Frequency Percent ------------------------------------------1 Mentioned 4 667 2 Not mentioned 56 9333 7 Refused 0 000 8 Not ascertained 0 000 9 Dont know 0 000
Frequency Missing = 34465
90
2012 National Health Interview Survey (NHIS)Sample Adult Public Use File (samadult)
ACD Variables Thursday May 16 2013Unweighted Frequencies
ACD235_00000 Received treatments therapy or other rehabilitation servicesfor problems using or understanding words or sentences in past 12 months
VSLLGTRT Frequency Percent ------------------------------------------1 Yes 40 868 2 No 417 9046 7 Refused 0 000 8 Not ascertained 2 043 9 Dont know 2 043
Frequency Missing = 34064
ACD240_01000 Speech-language pathologist provided language services
VSLLGT01 Frequency Percent ------------------------------------------1 Mentioned 21 5250 2 Not mentioned 18 4500 7 Refused 0 000 8 Not ascertained 0 000 9 Dont know 1 250
Frequency Missing = 34485
ACD240_02000 Family physician General Practitioneror Osteopath provided language services
VSLLGT02 Frequency Percent ------------------------------------------1 Mentioned 9 2250 2 Not mentioned 30 7500 7 Refused 0 000 8 Not ascertained 0 000 9 Dont know 1 250
Frequency Missing = 34485
ACD240_03000 Rehabilitation Specialist (Occupationalor Physical Therapist) provided language services
VSLLGT03 Frequency Percent ------------------------------------------1 Mentioned 11 2750 2 Not mentioned 28 7000 7 Refused 0 000 8 Not ascertained 0 000 9 Dont know 1 250
Frequency Missing = 34485
91
2012 National Health Interview Survey (NHIS)Sample Adult Public Use File (samadult)
ACD Variables Thursday May 16 2013Unweighted Frequencies
ACD240_04000 Ear Nose Throat Doctor (Otolaryngologist)provided language services
VSLLGT04 Frequency Percent ------------------------------------------1 Mentioned 1 250 2 Not mentioned 38 9500 7 Refused 0 000 8 Not ascertained 0 000 9 Dont know 1 250
Frequency Missing = 34485
ACD240_05000 Audiologist Hearing Specialist orHearing Aid Technician provided language services
VSLLGT05 Frequency Percent ------------------------------------------1 Mentioned 1 250 2 Not mentioned 38 9500 7 Refused 0 000 8 Not ascertained 0 000 9 Dont know 1 250
Frequency Missing = 34485
ACD240_06000 Specialty doctor in Internal MedicineGeriatrics Neurology etc provided language services
VSLLGT06 Frequency Percent ------------------------------------------1 Mentioned 2 500 2 Not mentioned 37 9250 7 Refused 0 000 8 Not ascertained 0 000 9 Dont know 1 250
Frequency Missing = 34485
ACD240_07000 Nutritionist or Dietician provided language services
VSLLGT07 Frequency Percent ------------------------------------------1 Mentioned 0 000 2 Not mentioned 39 9750 7 Refused 0 000 8 Not ascertained 0 000 9 Dont know 1 250
Frequency Missing = 34485
92
2012 National Health Interview Survey (NHIS)Sample Adult Public Use File (samadult)
ACD Variables Thursday May 16 2013Unweighted Frequencies
ACD240_08000 Psychiatrist or Psychologist provided language services
VSLLGT08 Frequency Percent ------------------------------------------1 Mentioned 1 250 2 Not mentioned 38 9500 7 Refused 0 000 8 Not ascertained 0 000 9 Dont know 1 250
Frequency Missing = 34485
ACD240_09000 Nurse or Nurse Practitioner provided language services
VSLLGT09 Frequency Percent ------------------------------------------1 Mentioned 0 000 2 Not mentioned 39 9750 7 Refused 0 000 8 Not ascertained 0 000 9 Dont know 1 250
Frequency Missing = 34485
ACD240_10000 Dentist Orthodontist orOral Surgeon provided language services
VSLLGT10 Frequency Percent ------------------------------------------1 Mentioned 0 000 2 Not mentioned 39 9750 7 Refused 0 000 8 Not ascertained 0 000 9 Dont know 1 250
Frequency Missing = 34485
ACD240_11000 Some other health professional provided language services
VSLLGT11 Frequency Percent ------------------------------------------1 Mentioned 3 750 2 Not mentioned 36 9000 7 Refused 0 000 8 Not ascertained 0 000 9 Dont know 1 250
Frequency Missing = 34485
93
2012 National Health Interview Survey (NHIS)Sample Adult Public Use File (samadult)
ACD Variables Thursday May 16 2013Unweighted Frequencies
ACD245_00000 Did treatments or other rehabilitation services for voice problem make personal or social life better
VSLVSOC Frequency Percent ------------------------------------------1 Yes 89 6181 2 No 53 3681 7 Refused 0 000 8 Not ascertained 0 000 9 Dont know 2 139
Frequency Missing = 34381
ACD250_00000 Did treatments or other rehabilitation services for swallowing problem make personal or social life better
VSLSWSOC Frequency Percent ------------------------------------------1 Yes 113 6011 2 No 73 3883 7 Refused 0 000 8 Not ascertained 0 000 9 Dont know 2 106
Frequency Missing = 34337
ACD255_00000 Did treatments or other rehabilitation services for speech problem make personal or social life better
VSLSPSOC Frequency Percent ------------------------------------------1 Yes 36 6000 2 No 21 3500 7 Refused 0 000 8 Not ascertained 0 000 9 Dont know 3 500
Frequency Missing = 34465
ACD260_00000 Did treatments or other rehabilitation services for problemusing or understanding words or sentences make personal or social life better
VSLLGSOC Frequency Percent ------------------------------------------1 Yes 24 6000 2 No 13 3250 7 Refused 0 000 8 Not ascertained 0 000 9 Dont know 3 750
Frequency Missing = 34485
94
2012 National Health Interview Survey (NHIS)Sample Adult Public Use File (samadult)
ACD Variables Thursday May 16 2013Unweighted Frequencies
ACD265_00000 Did treatments or other rehabilitation services for voice problem make school or work life better
VSLVSW Frequency Percent ------------------------------------------1 Yes 52 6842 2 No 24 3158 7 Refused 0 000 8 Not ascertained 0 000 9 Dont know 0 000
Frequency Missing = 34449
ACD270_00000 Did treatments or other rehabilitation services for swallowing problem make school or work life better
VSLSWSW Frequency Percent ------------------------------------------1 Yes 57 6628 2 No 27 3140 7 Refused 0 000 8 Not ascertained 0 000 9 Dont know 2 233
Frequency Missing = 34439
ACD275_00000 Did treatments or other rehabilitation services for speech problem make school or work life better
VSLSPSW Frequency Percent ------------------------------------------1 Yes 9 5000 2 No 9 5000 7 Refused 0 000 8 Not ascertained 0 000 9 Dont know 0 000
Frequency Missing = 34507
ACD280_00000 Did treatments or other rehabilitation services for problemsusing or understanding words or sentences make school or work life better
VSLLGSW Frequency Percent ------------------------------------------1 Yes 5 4545 2 No 6 5455 7 Refused 0 000 8 Not ascertained 0 000 9 Dont know 0 000
Frequency Missing = 34514
95
2012 National Health Interview Survey (NHIS)Sample Adult Public Use File (samadult)
ACD Variables Thursday May 16 2013Unweighted Frequencies
ACD285_00000 Voice problems better or worse compared to 12 months ago
VSLVCOM Frequency Percent ------------------------------------------1 Better 408 2751 2 Worse 207 1396 3 About the same 860 5799 7 Refused 1 007 8 Not ascertained 3 020 9 Dont know 4 027
Frequency Missing = 33042
ACD290_00000 Swallowing problems better or worse compared to 12 months ago
VSLSWCOM Frequency Percent ------------------------------------------1 Better 287 2893 2 Worse 168 1694 3 About the same 534 5383 7 Refused 1 010 8 Not ascertained 0 000 9 Dont know 2 020
Frequency Missing = 33533
ACD295_00000 Speech problems better or worse compared to 12 months ago
VSLSPCOM Frequency Percent ------------------------------------------1 Better 131 1758 2 Worse 97 1302 3 About the same 514 6899 7 Refused 0 000 8 Not ascertained 1 013 9 Dont know 2 027
Frequency Missing = 33780
ACD300_00000 Problems using or understanding wordsor sentences better or worse compared to 12 months ago
VSLLGCOM Frequency Percent ------------------------------------------1 Better 81 1757 2 Worse 71 1540 3 About the same 306 6638 7 Refused 0 000 8 Not ascertained 2 043 9 Dont know 1 022
Frequency Missing = 34064
96
2012 National Health Interview Survey (NHIS)Sample Adult Public Use File (samadult)
ACD Variables Thursday May 16 2013Unweighted Frequencies
ACD305_00000 Get information from Internet about health medicaltreatments or rehabilitation services in past 12 months
VSLINTYR Frequency Percent ------------------------------------------1 Yes 7769 2250 2 No 26673 7726 7 Refused 11 003 8 Not ascertained 51 015 9 Donrsquot know 21 006
ACD310_00000 Did you get information on (voiceswallowingspeechproblemsusing or understanding words or sentences problems in the past 12 months
VSLINTCN Frequency Percent ------------------------------------------1 Yes 272 2231 2 No 943 7736 7 Refused 0 000 8 Not ascertained 0 000 9 Donrsquot know 4 033
Frequency Missing = 33306
ACD315_00000 Was this information written by a doctor other healthprofessional medical associations or other health-related organization
VSLINTPR Frequency Percent ------------------------------------------1 Yes 218 8015 2 No 38 1397 7 Refused 0 000 8 Not ascertained 0 000 9 Donrsquot know 16 588
Frequency Missing = 34253
ACD320_00000 How helpful was the information on the Internet
VSLINTHP Frequency Percent -------------------------------------------1 Very helpful 134 4926 2 Somewhat helpful 120 4412 3 Not helpful 18 662 7 Refused 0 000 8 Not ascertained 0 000 9 Donrsquot know 0 000
Frequency Missing = 34253
97
2012 National Health Interview Survey (NHIS)Sample Adult Public Use File (samadult)
AHS Variables Thursday May 16 2013Unweighted Frequencies
AHS040_00000 Number of work loss days past 12 months
WKDAYR Frequency Percent --------------------------------------------000 None 12536 5618 001-366 1-366 days 9649 4324 997 Refused 19 009 998 Not ascertained 26 012 999 Dont know 83 037
Frequency Missing = 12212
AHS050_00000 Number of bed days past 12 months
BEDDAYR Frequency Percent --------------------------------------------000 None 21974 6365 001-366 1-366 days 12269 3554 997 Refused 28 008 998 Not ascertained 58 017 999 Dont know 196 057
AHS060_00000 Health betterworsesame compared w 12 months ago
AHSTATYR Frequency Percent ------------------------------------------1 Better 6639 1923 2 Worse 2849 825 3 About the same 24947 7226 7 Refused 10 003 8 Not ascertained 60 017 9 Dont know 20 006
AHS070_00000 Have health problem that requires special equipment
SPECEQ Frequency Percent ------------------------------------------1 Yes 2882 835 2 No 31574 9145 7 Refused 5 001 8 Not ascertained 62 018 9 Dont know 2 001
98
2012 National Health Interview Survey (NHIS)Sample Adult Public Use File (samadult)
AHS Variables Thursday May 16 2013Unweighted Frequencies
AHS091_01000 How difficult to walk 14 mile without special equipment
FLWALK Frequency Percent --------------------------------------------------0 Not at all difficult 1 Only a little difficult2 Somewhat difficult 3 Very difficult4 Cant do at all 6 Do not do this activity7 Refused 8 Not ascertained 9 Dont know
27323 7914 1748 506 1547 448 1188 344 1803 522 799 231 7 002 97 028 13 004
AHS091_02000 How difficult to climb 10 steps without special equipment
FLCLIMB Frequency Percent --------------------------------------------------0 Not at all difficult 1 Only a little difficult2 Somewhat difficult 3 Very difficult4 Cant do at all 6 Do not do this activity7 Refused 8 Not ascertained 9 Dont know
28985 8395 1529 443 1235 358 1077 312 1221 354 356 103 8 002 99 029 15 004
AHS091_03000 How difficult to stand 2 hours without special equipment
FLSTAND Frequency Percent --------------------------------------------------0 Not at all difficult 1 Only a little difficult2 Somewhat difficult 3 Very difficult4 Cant do at all 6 Do not do this activity7 Refused 8 Not ascertained 9 Dont know
26367 7637 2069 599 1595 462 1410 408 2345 679 602 174 10 003 99 029 28 008
99
2012 National Health Interview Survey (NHIS)Sample Adult Public Use File (samadult)
AHS Variables Thursday May 16 2013Unweighted Frequencies
AHS091_04000 How difficult to sit 2 hours without special equipment
FLSIT Frequency Percent --------------------------------------------------0 Not at all difficult 1 Only a little difficult2 Somewhat difficult 3 Very difficult4 Cant do at all 6 Do not do this activity7 Refused 8 Not ascertained 9 Dont know
30082 8713 1645 476 1305 378 721 209 516 149 143 041 7 002
100 029 6 002
AHS091_05000 How difficult to stoop bend or kneel without special equipment
FLSTOOP Frequency Percent --------------------------------------------------0 Not at all difficult 1 Only a little difficult2 Somewhat difficult 3 Very difficult4 Cant do at all 6 Do not do this activity7 Refused 8 Not ascertained 9 Dont know
24935 7222 2947 854 2572 745 1980 573 1672 484 302 087 9 003
100 029 8 002
AHS091_06000 How difficult to reach over head without special equipment
FLREACH Frequency Percent --------------------------------------------------0 Not at all difficult 1 Only a little difficult2 Somewhat difficult 3 Very difficult4 Cant do at all 6 Do not do this activity7 Refused 8 Not ascertained 9 Dont know
30967 8969 1191 345 1085 314 660 191 406 118 103 030 7 002
100 029 6 002
100
2012 National Health Interview Survey (NHIS)Sample Adult Public Use File (samadult)
AHS Variables Thursday May 16 2013Unweighted Frequencies
AHS141_01000 How difficult to grasp small objects without special equipment
FLGRASP Frequency Percent --------------------------------------------------0 Not at all difficult 1 Only a little difficult2 Somewhat difficult 3 Very difficult4 Cant do at all 6 Do not do this activity7 Refused 8 Not ascertained 9 Dont know
31310 9069 1323 383 1041 302 540 156 158 046 39 011 8 002
103 030 3 001
AHS141_02000 How difficult to liftcarry 10 lbs without special equipment
FLCARRY Frequency Percent --------------------------------------------------0 Not at all difficult 1 Only a little difficult2 Somewhat difficult 3 Very difficult4 Cant do at all 6 Do not do this activity7 Refused 8 Not ascertained 9 Dont know
29870 8652 1259 365 1118 324 712 206 1079 313 364 105 8 002
103 030 12 003
AHS141_03000 How difficult to push large objects without special equipment
FLPUSH Frequency Percent --------------------------------------------------0 Not at all difficult 1 Only a little difficult2 Somewhat difficult 3 Very difficult4 Cant do at all 6 Do not do this activity7 Refused 8 Not ascertained 9 Dont know
28122 8145 1522 441 1324 383 896 260 1726 500 806 233 10 003 103 030 16 005
101
2012 National Health Interview Survey (NHIS)Sample Adult Public Use File (samadult)
AHS Variables Thursday May 16 2013Unweighted Frequencies
AHS171_01000 How difficult to go out to events without special equipment
FLSHOP Frequency Percent --------------------------------------------------0 Not at all difficult 1 Only a little difficult2 Somewhat difficult 3 Very difficult4 Cant do at all 6 Do not do this activity7 Refused 8 Not ascertained 9 Dont know
30078 8712 1099 318 1201 348 645 187 710 206 673 195 9 003
105 030 5 001
AHS171_02000 How difficult to participate insocial activities without special equipment
FLSOCL Frequency Percent --------------------------------------------------0 Not at all difficult 1 Only a little difficult2 Somewhat difficult 3 Very difficult4 Cant do at all 6 Do not do this activity7 Refused 8 Not ascertained 9 Dont know
30363 8794 935 271 974 282 509 147 597 173 1026 297 10 003 106 031 5 001
AHS171_03000 How difficult to relax at home without special equipment
FLRELAX Frequency Percent --------------------------------------------------0 Not at all difficult 1 Only a little difficult2 Somewhat difficult 3 Very difficult4 Cant do at all 6 Do not do this activity7 Refused 8 Not ascertained 9 Dont know
32932 9539 634 184 544 158 151 044 77 022 70 020 8 002
107 031 2 001
AHS171_00000 Any functional limitation all conditions
FLA1AR Frequency Percent -------------------------------------------------1 Limited in any way 12891 3734 2 Not limited in any way 21501 6228 3 Unknown if limited 133 039
102
2012 National Health Interview Survey (NHIS)Sample Adult Public Use File (samadult)
AHS Variables Thursday May 16 2013Unweighted Frequencies
AHS200_01000 Visionproblem seeing causes difficulty with activity
AFLHCA1 Frequency Percent ------------------------------------------1 Mentioned 458 355 2 Not mentioned 12254 9506 7 Refused 21 016 8 Not ascertained 33 026 9 Dont know 125 097
Frequency Missing = 21634
AHS200_02000 Hearing problem causes difficulty with activity
AFLHCA2 Frequency Percent ------------------------------------------1 Mentioned 267 207 2 Not mentioned 12445 9654 7 Refused 21 016 8 Not ascertained 33 026 9 Dont know 125 097
Frequency Missing = 21634
AHS200_03000 Arthritisrheumatism causes difficulty with activity
AFLHCA3 Frequency Percent ------------------------------------------1 Mentioned 4465 3464 2 Not mentioned 8247 6397 7 Refused 21 016 8 Not ascertained 33 026 9 Dont know 125 097
Frequency Missing = 21634
AHS200_04000 Back or neck problem causes difficulty with activity
AFLHCA4 Frequency Percent ------------------------------------------1 Mentioned 3595 2789 2 Not mentioned 9117 7072 7 Refused 21 016 8 Not ascertained 33 026 9 Dont know 125 097
Frequency Missing = 21634
103
2012 National Health Interview Survey (NHIS)Sample Adult Public Use File (samadult)
AHS Variables Thursday May 16 2013Unweighted Frequencies
AHS200_05000 Fracture bonejoint injury causes difficulty with activity
AFLHCA5 Frequency Percent ------------------------------------------1 Mentioned 1349 1046 2 Not mentioned 11363 8815 7 Refused 21 016 8 Not ascertained 33 026 9 Dont know 125 097
Frequency Missing = 21634
AHS200_06000 Other injury causes difficulty with activity
AFLHCA6 Frequency Percent ------------------------------------------1 Mentioned 480 372 2 Not mentioned 12232 9489 7 Refused 21 016 8 Not ascertained 33 026 9 Dont know 125 097
Frequency Missing = 21634
AHS200_07000 Heart problem causes difficulty with activity
AFLHCA7 Frequency Percent ------------------------------------------1 Mentioned 742 576 2 Not mentioned 11970 9286 7 Refused 21 016 8 Not ascertained 33 026 9 Dont know 125 097
Frequency Missing = 21634
AHS200_08000 Stroke problem causes difficulty with activity
AFLHCA8 Frequency Percent ------------------------------------------1 Mentioned 336 261 2 Not mentioned 12376 9600 7 Refused 21 016 8 Not ascertained 33 026 9 Dont know 125 097
Frequency Missing = 21634
104
2012 National Health Interview Survey (NHIS)Sample Adult Public Use File (samadult)
AHS Variables Thursday May 16 2013Unweighted Frequencies
AHS200_09000 Hypertensionhigh blood pressure causes difficulty with activity
AFLHCA9 Frequency Percent ------------------------------------------1 Mentioned 757 587 2 Not mentioned 11955 9274 7 Refused 21 016 8 Not ascertained 33 026 9 Dont know 125 097
Frequency Missing = 21634
AHS200_10000 Diabetes causes difficulty with activity
AFLHCA10 Frequency Percent ------------------------------------------1 Mentioned 665 516 2 Not mentioned 12047 9345 7 Refused 21 016 8 Not ascertained 33 026 9 Dont know 125 097
Frequency Missing = 21634
AHS200_11000 Lungbreathing problem (eg asthmaand emphysema) causes difficulty with activity
AFLHCA11 Frequency Percent ------------------------------------------1 Mentioned 821 637 2 Not mentioned 11891 9224 7 Refused 21 016 8 Not ascertained 33 026 9 Dont know 125 097
Frequency Missing = 21634
AHS200_12000 Cancer causes difficulty with activity
AFLHCA12 Frequency Percent ------------------------------------------1 Mentioned 184 143 2 Not mentioned 12528 9718 7 Refused 21 016 8 Not ascertained 33 026 9 Dont know 125 097
Frequency Missing = 21634
105
2012 National Health Interview Survey (NHIS)Sample Adult Public Use File (samadult)
AHS Variables Thursday May 16 2013Unweighted Frequencies
AHS200_13000 Birth defect causes difficulty with activity
AFLHCA13 Frequency Percent ------------------------------------------1 Mentioned 59 046 2 Not mentioned 12653 9815 7 Refused 21 016 8 Not ascertained 33 026 9 Dont know 125 097
Frequency Missing = 21634
AHS200_14000 Intellectual disability also known asmental retardation causes difficulty with activity
ALHCA14A Frequency Percent ------------------------------------------1 Mentioned 62 048 2 Not mentioned 12650 9813 7 Refused 21 016 8 Not ascertained 33 026 9 Dont know 125 097
Frequency Missing = 21634
AHS200_15000 Other developmental problem (egcerebral palsy) causes difficulty with activity
AFLHCA15 Frequency Percent ------------------------------------------1 Mentioned 51 040 2 Not mentioned 12661 9822 7 Refused 21 016 8 Not ascertained 33 026 9 Dont know 125 097
Frequency Missing = 21634
AHS200_16000 Senility causes difficulty with activity
AFLHCA16 Frequency Percent ------------------------------------------1 Mentioned 112 087 2 Not mentioned 12600 9774 7 Refused 21 016 8 Not ascertained 33 026 9 Dont know 125 097
Frequency Missing = 21634
106
2012 National Health Interview Survey (NHIS)Sample Adult Public Use File (samadult)
AHS Variables Thursday May 16 2013Unweighted Frequencies
AHS200_17000 Depressionanxietyemotionalproblem causes difficulty with activity
AFLHCA17 Frequency Percent ------------------------------------------1 Mentioned 1052 816 2 Not mentioned 11660 9045 7 Refused 21 016 8 Not ascertained 33 026 9 Dont know 125 097
Frequency Missing = 21634
AHS200_18000 Weight problem causes difficulty with activity
AFLHCA18 Frequency Percent ------------------------------------------1 Mentioned 830 644 2 Not mentioned 11882 9217 7 Refused 21 016 8 Not ascertained 33 026 9 Dont know 125 097
Frequency Missing = 21634
AHS200_00000 Missing or amputated limbfingerdigitcauses difficulty with activity
AFLHC19_ Frequency Percent ------------------------------------------1 Mentioned 74 057 2 Not mentioned 12638 9804 7 Refused 21 016 8 Not ascertained 33 026 9 Dont know 125 097
Frequency Missing = 21634
AHS200_00000 Musculoskeletalconnective tissueproblem causes difficulty with activity
AFLHC20_ Frequency Percent ------------------------------------------1 Mentioned 2375 1842 2 Not mentioned 10337 8019 7 Refused 21 016 8 Not ascertained 33 026 9 Dont know 125 097
Frequency Missing = 21634
107
2012 National Health Interview Survey (NHIS)Sample Adult Public Use File (samadult)
AHS Variables Thursday May 16 2013Unweighted Frequencies
AHS200_00000 Circulation problems (includingblood clots) cause difficulty with activity
AFLHC21_ Frequency Percent ------------------------------------------1 Mentioned 396 307 2 Not mentioned 12316 9554 7 Refused 21 016 8 Not ascertained 33 026 9 Dont know 125 097
Frequency Missing = 21634
AHS200_00000 Endocrinenutritionalmetabolicproblem causes difficulty with activity
AFLHC22_ Frequency Percent ------------------------------------------1 Mentioned 134 104 2 Not mentioned 12578 9757 7 Refused 21 016 8 Not ascertained 33 026 9 Dont know 125 097
Frequency Missing = 21634
AHS200_00000 Nervous systemsensory organcondition causes difficulty with activity
AFLHC23_ Frequency Percent ------------------------------------------1 Mentioned 683 530 2 Not mentioned 12029 9331 7 Refused 21 016 8 Not ascertained 33 026 9 Dont know 125 097
Frequency Missing = 21634
AHS200_00000 Digestive system problem causes difficulty with activity
AFLHC24_ Frequency Percent ------------------------------------------1 Mentioned 179 139 2 Not mentioned 12533 9722 7 Refused 21 016 8 Not ascertained 33 026 9 Dont know 125 097
Frequency Missing = 21634
108
2012 National Health Interview Survey (NHIS)Sample Adult Public Use File (samadult)
AHS Variables Thursday May 16 2013Unweighted Frequencies
AHS200_00000 Genitourinary system problem causes difficulty with activity
AFLHC25_ Frequency Percent ------------------------------------------1 Mentioned 170 132 2 Not mentioned 12542 9729 7 Refused 21 016 8 Not ascertained 33 026 9 Dont know 125 097
Frequency Missing = 21634
AHS200_00000 Skinsubcutaneous system problem causes difficulty with activity
AFLHC26_ Frequency Percent ------------------------------------------1 Mentioned 12 009 2 Not mentioned 12700 9852 7 Refused 21 016 8 Not ascertained 33 026 9 Dont know 125 097
Frequency Missing = 21634
AHS200_00000 Blood or blood-forming organproblem causes difficulty with activity
AFLHC27_ Frequency Percent ------------------------------------------1 Mentioned 15 012 2 Not mentioned 12697 9850 7 Refused 21 016 8 Not ascertained 33 026 9 Dont know 125 097
Frequency Missing = 21634
AHS200_00000 Benign tumorcyst causes difficulty with activity
AFLHC28_ Frequency Percent ------------------------------------------1 Mentioned 31 024 2 Not mentioned 12681 9837 7 Refused 21 016 8 Not ascertained 33 026 9 Dont know 125 097
Frequency Missing = 21634
109
2012 National Health Interview Survey (NHIS)Sample Adult Public Use File (samadult)
AHS Variables Thursday May 16 2013Unweighted Frequencies
AHS200_00000 Alcoholdrugsubstance abuseproblem causes difficulty with activity
AFLHC29_ Frequency Percent ------------------------------------------1 Mentioned 3 002 2 Not mentioned 12709 9859 7 Refused 21 016 8 Not ascertained 33 026 9 Dont know 125 097
Frequency Missing = 21634
AHS200_00000 Other mental problemADDBipolarSchizophreniacauses difficulty with activity
AFLHC30_ Frequency Percent ------------------------------------------1 Mentioned 58 045 2 Not mentioned 12654 9816 7 Refused 21 016 8 Not ascertained 33 026 9 Dont know 125 097
Frequency Missing = 21634
AHS200_00000 Surgical after-effectsmedicaltreatment causes difficulty with activity
AFLHC31_ Frequency Percent ------------------------------------------1 Mentioned 63 049 2 Not mentioned 12649 9812 7 Refused 21 016 8 Not ascertained 33 026 9 Dont know 125 097
Frequency Missing = 21634
AHS200_00000 Old ageelderlyaging-relatedproblem causes difficulty with activity
AFLHC32_ Frequency Percent ------------------------------------------1 Mentioned 274 213 2 Not mentioned 12438 9649 7 Refused 21 016 8 Not ascertained 33 026 9 Dont know 125 097
Frequency Missing = 21634
110
2012 National Health Interview Survey (NHIS)Sample Adult Public Use File (samadult)
AHS Variables Thursday May 16 2013Unweighted Frequencies
AHS200_00000 Fatiguetirednessweakness causes difficulty with activity
AFLHC33_ Frequency Percent ------------------------------------------1 Mentioned 109 085 2 Not mentioned 12603 9777 7 Refused 21 016 8 Not ascertained 33 026 9 Dont know 125 097
Frequency Missing = 21634
AHS200_00000 Pregnancy-related problem causes difficulty with activity
AFLHC34_ Frequency Percent ------------------------------------------1 Mentioned 36 028 2 Not mentioned 12676 9833 7 Refused 21 016 8 Not ascertained 33 026 9 Dont know 125 097
Frequency Missing = 21634
AHS200_90000 Other impairmentproblem (1) causes difficulty with activity
AFLHCA90 Frequency Percent ------------------------------------------1 Mentioned 334 259 2 Not mentioned 12378 9602 7 Refused 21 016 8 Not ascertained 33 026 9 Dont know 125 097
Frequency Missing = 21634
AHS200_91000 Other impairmentproblem (2) causes difficulty with activity
AFLHCA91 Frequency Percent ------------------------------------------1 Mentioned 4 003 2 Not mentioned 12708 9858 7 Refused 21 016 8 Not ascertained 33 026 9 Dont know 125 097
Frequency Missing = 21634
111
2012 National Health Interview Survey (NHIS)Sample Adult Public Use File (samadult)
AHS Variables Thursday May 16 2013Unweighted Frequencies
AHS300_01000 Duration of vision problem Number of units
ALTIME1 Frequency Percent -------------------------------------------01-94 1-94 422 9214 95 95+ 0 000 96 Since birth 26 568 97 Refused 0 000 98 Not ascertained 1 022 99 Dont know 9 197
Frequency Missing = 34067
AHS300_02000 Duration of vision problem Time unit
ALUNIT1 Frequency Percent ------------------------------------------1 Day(s) 3 066 2 Week(s) 1 022 3 Month(s) 23 502 4 Year(s) 400 8734 6 Since birth 26 568 7 Refused 0 000 8 Not ascertained 1 022 9 Dont know 4 087
Frequency Missing = 34067
AHS300_02000 Duration (in years) of vision problem recode 1
ALDURA1 Frequency Percent ---------------------------------------------------00 Less than 1 year 22 480 01-84 years 425 9279 85 85+ years 1 022 96 Unknown number of years 5 109 97 Refused 0 000 98 Not ascertained 1 022 99 Dont know 4 087
Frequency Missing = 34067
112
2012 National Health Interview Survey (NHIS)Sample Adult Public Use File (samadult)
AHS Variables Thursday May 16 2013Unweighted Frequencies
AHS300_02000 Duration of vision problem recode 2
ALDURB1 Frequency Percent ---------------------------------------------1 Less than 3 months 6 131 2 3-5 months 5 109 3 6-12 months 45 983 4 More than 1 year 397 8668 7 Refused 0 000 8 Not ascertained 1 022 9 Dont know 4 087
Frequency Missing = 34067
AHS300_02000 Vision problem condition status recode
ALCHRC1 Frequency Percent ---------------------------------------------1 Chronic 447 9760 2 Not chronic 6 131 9 Unknown if chronic 5 109
Frequency Missing = 34067
AHS301_01000 Duration of hearing problem Number of units
ALTIME2 Frequency Percent -------------------------------------------01-94 1-94 244 9139 95 95+ 1 037 96 Since birth 16 599 97 Refused 0 000 98 Not ascertained 2 075 99 Dont know 4 150
Frequency Missing = 34258
AHS301_02000 Duration of hearing problem Time unit
ALUNIT2 Frequency Percent ------------------------------------------1 Day(s) 1 037 2 Week(s) 0 000 3 Month(s) 4 150 4 Year(s) 241 9026 6 Since birth 16 599 7 Refused 0 000 8 Not ascertained 2 075 9 Dont know 3 112
Frequency Missing = 34258
113
2012 National Health Interview Survey (NHIS)Sample Adult Public Use File (samadult)
AHS Variables Thursday May 16 2013Unweighted Frequencies
AHS301_02000 Duration (in years) of hearing problem recode 1
ALDURA2 Frequency Percent ---------------------------------------------------00 Less than 1 year 3 112 01-84 years 256 9588 85 85+ years 2 075 96 Unknown number of years 1 037 97 Refused 0 000 98 Not ascertained 2 075 99 Dont know 3 112
Frequency Missing = 34258
AHS301_02000 Duration of hearing problem recode 2
ALDURB2 Frequency Percent ---------------------------------------------1 Less than 3 months 0 000 2 3-5 months 2 075 3 6-12 months 18 674 4 More than 1 year 242 9064 7 Refused 0 000 8 Not ascertained 2 075 9 Dont know 3 112
Frequency Missing = 34258
AHS301_02000 Hearing problem condition status recode
ALCHRC2 Frequency Percent ---------------------------------------------1 Chronic 262 9813 2 Not chronic 0 000 9 Unknown if chronic 5 187
Frequency Missing = 34258
AHS302_01000 Duration of arthritisrheumatism Number of units
ALTIME3 Frequency Percent -------------------------------------------01-94 1-94 4350 9742 95 95+ 1 002 96 Since birth 23 052 97 Refused 3 007 98 Not ascertained 7 016 99 Dont know 81 181
Frequency Missing = 30060
114
2012 National Health Interview Survey (NHIS)Sample Adult Public Use File (samadult)
AHS Variables Thursday May 16 2013Unweighted Frequencies
AHS302_02000 Duration of arthritisrheumatism Time unit
ALUNIT3 Frequency Percent ------------------------------------------1 Day(s) 4 009 2 Week(s) 7 016 3 Month(s) 143 320 4 Year(s) 4243 9503 6 Since birth 23 052 7 Refused 3 007 8 Not ascertained 7 016 9 Dont know 35 078
Frequency Missing = 30060
AHS302_02000 Duration (in years) of arthritisrheumatism recode 1
ALDURA3 Frequency Percent ---------------------------------------------------00 Less than 1 year 124 278 01-84 years 4248 9514 85 85+ years 2 004 96 Unknown number of years 46 103 97 Refused 3 007 98 Not ascertained 7 016 99 Dont know 35 078
Frequency Missing = 30060
AHS302_02000 Duration of arthritisrheumatism recode 2
ALDURB3 Frequency Percent ---------------------------------------------1 Less than 3 months 34 076 2 3-5 months 47 105 3 6-12 months 235 526 4 More than 1 year 4104 9191 7 Refused 3 007 8 Not ascertained 7 016 9 Dont know 35 078
Frequency Missing = 30060
AHS302_02000 Arthritisrheumatism condition status recode
ALCHRC3 Frequency Percent ---------------------------------------------1 Chronic 4465 10000 2 Not chronic 0 000 9 Unknown if chronic 0 000
Frequency Missing = 30060
115
2012 National Health Interview Survey (NHIS)Sample Adult Public Use File (samadult)
AHS Variables Thursday May 16 2013Unweighted Frequencies
AHS303_01000 Duration of back or neck problem Number of units
ALTIME4 Frequency Percent -------------------------------------------01-94 1-94 3477 9672 95 95+ 3 008 96 Since birth 57 159 97 Refused 5 014 98 Not ascertained 4 011 99 Dont know 49 136
Frequency Missing = 30930
AHS303_02000 Duration of back or neck problem Time unit
ALUNIT4 Frequency Percent ------------------------------------------1 Day(s) 13 036 2 Week(s) 28 078 3 Month(s) 241 670 4 Year(s) 3220 8957 6 Since birth 57 159 7 Refused 5 014 8 Not ascertained 4 011 9 Dont know 27 075
Frequency Missing = 30930
AHS303_02000 Duration (in years) of back or neck problem recode 1
ALDURA4 Frequency Percent ---------------------------------------------------00 Less than 1 year 239 665 01-84 years 3297 9171 85 85+ years 1 003 96 Unknown number of years 22 061 97 Refused 5 014 98 Not ascertained 4 011 99 Dont know 27 075
Frequency Missing = 30930
116
2012 National Health Interview Survey (NHIS)Sample Adult Public Use File (samadult)
AHS Variables Thursday May 16 2013Unweighted Frequencies
AHS303_02000 Duration of back or neck problem recode 2
ALDURB4 Frequency Percent ---------------------------------------------1 Less than 3 months 79 220 2 3-5 months 69 192 3 6-12 months 238 662 4 More than 1 year 3173 8826 7 Refused 5 014 8 Not ascertained 4 011 9 Dont know 27 075
Frequency Missing = 30930
AHS303_02000 Back or neck problem condition status recode
ALCHRC4 Frequency Percent ---------------------------------------------1 Chronic 3480 9680 2 Not chronic 79 220 9 Unknown if chronic 36 100
Frequency Missing = 30930
AHS304_01000 Duration of fracture bonejoint injury Number of units
ALTIME5 Frequency Percent -------------------------------------------01-94 1-94 1329 9852 95 95+ 0 000 96 Since birth 6 044 97 Refused 1 007 98 Not ascertained 4 030 99 Dont know 9 067
Frequency Missing = 33176
AHS304_02000 Duration of fracture bonejoint injury Time unit
ALUNIT5 Frequency Percent ------------------------------------------1 Day(s) 11 082 2 Week(s) 28 208 3 Month(s) 229 1698 4 Year(s) 1066 7902 6 Since birth 6 044 7 Refused 1 007 8 Not ascertained 4 030 9 Dont know 4 030
Frequency Missing = 33176
117
2012 National Health Interview Survey (NHIS)Sample Adult Public Use File (samadult)
AHS Variables Thursday May 16 2013Unweighted Frequencies
AHS304_02000 Duration (in years) of fracture bonejoint injury recode 1
ALDURA5 Frequency Percent ---------------------------------------------------00 Less than 1 year 230 1705 01-84 years 1105 8191 85 85+ years 0 000 96 Unknown number of years 5 037 97 Refused 1 007 98 Not ascertained 4 030 99 Dont know 4 030
Frequency Missing = 33176
AHS304_02000 Duration of fracture bonejoint injury recode 2
ALDURB5 Frequency Percent ---------------------------------------------1 Less than 3 months 74 549 2 3-5 months 84 623 3 6-12 months 161 1193 4 More than 1 year 1021 7569 7 Refused 1 007 8 Not ascertained 4 030 9 Dont know 4 030
Frequency Missing = 33176
AHS304_02000 Fracture bonejoint injury condition status recode
ALCHRC5 Frequency Percent ---------------------------------------------1 Chronic 1266 9385 2 Not chronic 74 549 9 Unknown if chronic 9 067
Frequency Missing = 33176
AHS305_01000 Duration of other injury Number of units
ALTIME6 Frequency Percent -------------------------------------------01-94 1-94 465 9688 95 95+ 1 021 96 Since birth 3 063 97 Refused 1 021 98 Not ascertained 0 000 99 Dont know 10 208
Frequency Missing = 34045
118
2012 National Health Interview Survey (NHIS)Sample Adult Public Use File (samadult)
AHS Variables Thursday May 16 2013Unweighted Frequencies
AHS305_02000 Duration of other injury Time unit
ALUNIT6 Frequency Percent ------------------------------------------1 Day(s) 5 104 2 Week(s) 13 271 3 Month(s) 83 1729 4 Year(s) 371 7729 6 Since birth 3 063 7 Refused 1 021 8 Not ascertained 0 000 9 Dont know 4 083
Frequency Missing = 34045
AHS305_02000 Duration (in years) of other injury recode 1
ALDURA6 Frequency Percent ---------------------------------------------------00 Less than 1 year 88 1833 01-84 years 381 7938 85 85+ years 0 000 96 Unknown number of years 6 125 97 Refused 1 021 98 Not ascertained 0 000 99 Dont know 4 083
Frequency Missing = 34045
AHS305_02000 Duration of other injury recode 2
ALDURB6 Frequency Percent ---------------------------------------------1 Less than 3 months 34 708 2 3-5 months 26 542 3 6-12 months 60 1250 4 More than 1 year 355 7396 7 Refused 1 021 8 Not ascertained 0 000 9 Dont know 4 083
Frequency Missing = 34045
AHS305_02000 Other injury condition status recode
ALCHRC6 Frequency Percent ---------------------------------------------1 Chronic 441 9188 2 Not chronic 34 708 9 Unknown if chronic 5 104
Frequency Missing = 34045
119
2012 National Health Interview Survey (NHIS)Sample Adult Public Use File (samadult)
AHS Variables Thursday May 16 2013Unweighted Frequencies
AHS306_01000 Duration of heart problem Number of units
ALTIME7 Frequency Percent -------------------------------------------01-94 1-94 706 9515 95 95+ 0 000 96 Since birth 26 350 97 Refused 2 027 98 Not ascertained 0 000 99 Dont know 8 108
Frequency Missing = 33783
AHS306_02000 Duration of heart problem Time unit
ALUNIT7 Frequency Percent ------------------------------------------1 Day(s) 1 013 2 Week(s) 6 081 3 Month(s) 37 499 4 Year(s) 665 8962 6 Since birth 26 350 7 Refused 2 027 8 Not ascertained 0 000 9 Dont know 5 067
Frequency Missing = 33783
AHS306_02000 Duration (in years) of heart problem recode 1
ALDURA7 Frequency Percent ---------------------------------------------------00 Less than 1 year 35 472 01-84 years 697 9394 85 85+ years 0 000 96 Unknown number of years 3 040 97 Refused 2 027 98 Not ascertained 0 000 99 Dont know 5 067
Frequency Missing = 33783
120
2012 National Health Interview Survey (NHIS)Sample Adult Public Use File (samadult)
AHS Variables Thursday May 16 2013Unweighted Frequencies
AHS306_02000 Duration of heart problem recode 2
ALDURB7 Frequency Percent ---------------------------------------------1 Less than 3 months 13 175 2 3-5 months 10 135 3 6-12 months 44 593 4 More than 1 year 668 9003 7 Refused 2 027 8 Not ascertained 0 000 9 Dont know 5 067
Frequency Missing = 33783
AHS306_02000 Heart problem condition status recode
ALCHRC7 Frequency Percent ---------------------------------------------1 Chronic 742 10000 2 Not chronic 0 000 9 Unknown if chronic 0 000
Frequency Missing = 33783
AHS307_01000 Duration of stroke problem Number of units
ALTIME8 Frequency Percent -------------------------------------------01-94 1-94 330 9821 95 95+ 0 000 96 Since birth 2 060 97 Refused 0 000 98 Not ascertained 0 000 99 Dont know 4 119
Frequency Missing = 34189
AHS307_02000 Duration of stroke problem Time unit
ALUNIT8 Frequency Percent ------------------------------------------1 Day(s) 1 030 2 Week(s) 2 060 3 Month(s) 39 1161 4 Year(s) 291 8661 6 Since birth 2 060 7 Refused 0 000 8 Not ascertained 0 000 9 Dont know 1 030
Frequency Missing = 34189
121
2012 National Health Interview Survey (NHIS)Sample Adult Public Use File (samadult)
AHS Variables Thursday May 16 2013Unweighted Frequencies
AHS307_02000 Duration (in years) of stroke problem recode 1
ALDURA8 Frequency Percent ---------------------------------------------------00 Less than 1 year 32 952 01-84 years 300 8929 85 85+ years 0 000 96 Unknown number of years 3 089 97 Refused 0 000 98 Not ascertained 0 000 99 Dont know 1 030
Frequency Missing = 34189
AHS307_02000 Duration of stroke problem recode 2
ALDURB8 Frequency Percent ---------------------------------------------1 Less than 3 months 8 238 2 3-5 months 7 208 3 6-12 months 34 1012 4 More than 1 year 286 8512 7 Refused 0 000 8 Not ascertained 0 000 9 Dont know 1 030
Frequency Missing = 34189
AHS307_02000 Stroke problem condition status recode
ALCHRC8 Frequency Percent ---------------------------------------------1 Chronic 336 10000 2 Not chronic 0 000 9 Unknown if chronic 0 000
Frequency Missing = 34189
AHS308_01000 Duration of hypertension or high blood pressure Number of units
ALTIME9 Frequency Percent -------------------------------------------01-94 1-94 728 9617 95 95+ 0 000 96 Since birth 6 079 97 Refused 0 000 98 Not ascertained 4 053 99 Dont know 19 251
Frequency Missing = 33768
122
2012 National Health Interview Survey (NHIS)Sample Adult Public Use File (samadult)
AHS Variables Thursday May 16 2013Unweighted Frequencies
AHS308_02000 Duration of hypertension or high blood pressure Time unit
ALUNIT9 Frequency Percent ------------------------------------------1 Day(s)2 Week(s)3 Month(s)4 Year(s)6 Since birth
0 4 13 723 6
000 053 172 9551 079
7 Refused 0 000 8 Not ascertained 4 053 9 Dont know 7 092
Frequency Missing = 33768
AHS308_02000 Duration (in years) of hypertensionor high blood pressure recode 1
ALDURA9 Frequency Percent ---------------------------------------------------00 Less than 1 year 16 211 01-84 years 718 9485 85 85+ years 0 000 96 Unknown number of years 12 159 97 Refused 0 000 98 Not ascertained 4 053 99 Dont know 7 092
Frequency Missing = 33768
AHS308_02000 Duration of hypertension or high blood pressure recode 2
ALDURB9 Frequency Percent ---------------------------------------------1 Less than 3 months 6 079 2 3-5 months 5 066 3 6-12 months 29 383 4 More than 1 year 706 9326 7 Refused 0 000 8 Not ascertained 4 053 9 Dont know 7 092
Frequency Missing = 33768
AHS308_02000 Hypertension or high blood pressure condition status recode
ALCHRC9 Frequency Percent ---------------------------------------------1 Chronic 757 10000 2 Not chronic 0 000 9 Unknown if chronic 0 000
Frequency Missing = 33768
123
2012 National Health Interview Survey (NHIS)Sample Adult Public Use File (samadult)
AHS Variables Thursday May 16 2013Unweighted Frequencies
AHS309_01000 Duration of diabetes Number of units
ALTIME10 Frequency Percent -------------------------------------------01-94 1-94 651 9789 95 95+ 0 000 96 Since birth 2 030 97 Refused 1 015 98 Not ascertained 2 030 99 Dont know 9 135
Frequency Missing = 33860
AHS309_02000 Duration of diabetes Time unit
ALUNIT10 Frequency Percent ------------------------------------------1 Day(s) 0 000 2 Week(s) 3 045 3 Month(s) 13 195 4 Year(s) 642 9654 6 Since birth 2 030 7 Refused 1 015 8 Not ascertained 2 030 9 Dont know 2 030
Frequency Missing = 33860
AHS309_02000 Duration (in years) of diabetes recode 1
ALDURA10 Frequency Percent ---------------------------------------------------00 Less than 1 year 15 226 01-84 years 638 9594 85 85+ years 0 000 96 Unknown number of years 7 105 97 Refused 1 015 98 Not ascertained 2 030 99 Dont know 2 030
Frequency Missing = 33860
124
2012 National Health Interview Survey (NHIS)Sample Adult Public Use File (samadult)
AHS Variables Thursday May 16 2013Unweighted Frequencies
AHS309_02000 Duration of diabetes recode 2
ALDURB10 Frequency Percent ---------------------------------------------1 Less than 3 months 8 120 2 3-5 months 1 015 3 6-12 months 27 406 4 More than 1 year 624 9383 7 Refused 1 015 8 Not ascertained 2 030 9 Dont know 2 030
Frequency Missing = 33860
AHS309_02000 Diabetes condition status recode
ALCHRC10 Frequency Percent ---------------------------------------------1 Chronic 665 10000 2 Not chronic 0 000 9 Unknown if chronic 0 000
Frequency Missing = 33860
AHS310_01000 Duration of lungbreathing problem(eg asthma and emphysema) Number of units
ALTIME11 Frequency Percent -------------------------------------------01-94 1-94 750 9135 95 95+ 0 000 96 Since birth 56 682 97 Refused 0 000 98 Not ascertained 3 037 99 Dont know 12 146
Frequency Missing = 33704
AHS310_02000 Duration of lungbreathing problem(eg asthma and emphysema) Time unit
ALUNIT11 Frequency Percent ------------------------------------------1 Day(s) 3 037 2 Week(s) 2 024 3 Month(s) 36 438 4 Year(s) 715 8709 6 Since birth 56 682 7 Refused 0 000 8 Not ascertained 3 037 9 Dont know 6 073
Frequency Missing = 33704
125
2012 National Health Interview Survey (NHIS)Sample Adult Public Use File (samadult)
AHS Variables Thursday May 16 2013Unweighted Frequencies
AHS310_02000 Duration (in years) of lungbreathingproblem (eg asthma and emphysema) recode 1
ALDURA11 Frequency Percent ---------------------------------------------------00 Less than 1 year 29 353 01-84 years 775 9440 85 85+ years 2 024 96 Unknown number of years 6 073 97 Refused 0 000 98 Not ascertained 3 037 99 Dont know 6 073
Frequency Missing = 33704
AHS310_02000 Duration of lungbreathing problem(eg asthma and emphysema) recode 2
ALDURB11 Frequency Percent ---------------------------------------------1 Less than 3 months 8 097 2 3-5 months 6 073 3 6-12 months 65 792 4 More than 1 year 733 8928 7 Refused 0 000 8 Not ascertained 3 037 9 Dont know 6 073
Frequency Missing = 33704
AHS310_02000 Lungbreathing problem (egasthma and emphysema) condition status recode
ALCHRC11 Frequency Percent ---------------------------------------------1 Chronic 804 9793 2 Not chronic 8 097 9 Unknown if chronic 9 110
Frequency Missing = 33704
AHS311_01000 Duration of cancer Number of units
ALTIME12 Frequency Percent -------------------------------------------01-94 1-94 182 9891 95 95+ 0 000 96 Since birth 0 000 97 Refused 0 000 98 Not ascertained 0 000 99 Dont know 2 109
Frequency Missing = 34341
126
2012 National Health Interview Survey (NHIS)Sample Adult Public Use File (samadult)
AHS Variables Thursday May 16 2013Unweighted Frequencies
AHS311_02000 Duration of cancer Time unit
ALUNIT12 Frequency Percent ------------------------------------------1 Day(s) 0 000 2 Week(s) 3 163 3 Month(s) 30 1630 4 Year(s) 150 8152 6 Since birth 0 000 7 Refused 0 000 8 Not ascertained 0 000 9 Dont know 1 054
Frequency Missing = 34341
AHS311_02000 Duration (in years) of cancer recode 1
ALDURA12 Frequency Percent ---------------------------------------------------00 Less than 1 year 30 1630 01-84 years 152 8261 85 85+ years 0 000 96 Unknown number of years 1 054 97 Refused 0 000 98 Not ascertained 0 000 99 Dont know 1 054
Frequency Missing = 34341
AHS311_02000 Duration of cancer recode 2
ALDURB12 Frequency Percent ---------------------------------------------1 Less than 3 months 7 380 2 3-5 months 8 435 3 6-12 months 31 1685 4 More than 1 year 137 7446 7 Refused 0 000 8 Not ascertained 0 000 9 Dont know 1 054
Frequency Missing = 34341
AHS311_02000 Cancer condition status recode
ALCHRC12 Frequency Percent ---------------------------------------------1 Chronic 184 10000 2 Not chronic 0 000 9 Unknown if chronic 0 000
Frequency Missing = 34341
127
2012 National Health Interview Survey (NHIS)Sample Adult Public Use File (samadult)
AHS Variables Thursday May 16 2013Unweighted Frequencies
AHS312_01000 Duration of birth defect Number of units
ALTIME13 Frequency Percent -------------------------------------------01-94 1-94 0 000 95 95+ 0 000 96 Since birth 59 10000 97 Refused 0 000 98 Not ascertained 0 000 99 Dont know 0 000
Frequency Missing = 34466
AHS312_02000 Duration of birth defect Time unit
ALUNIT13 Frequency Percent ------------------------------------------1 Day(s) 0 000 2 Week(s) 0 000 3 Month(s) 0 000 4 Year(s) 0 000 6 Since birth 59 10000 7 Refused 0 000 8 Not ascertained 0 000 9 Dont know 0 000
Frequency Missing = 34466
AHS312_02000 Duration (in years) of birth defect recode 1
ALDURA13 Frequency Percent ---------------------------------------------------00 Less than 1 year 0 000 01-84 years 57 9661 85 85+ years 2 339 96 Unknown number of years 0 000 97 Refused 0 000 98 Not ascertained 0 000 99 Dont know 0 000
Frequency Missing = 34466
128
2012 National Health Interview Survey (NHIS)Sample Adult Public Use File (samadult)
AHS Variables Thursday May 16 2013Unweighted Frequencies
AHS312_02000 Duration of birth defect recode 2
ALDURB13 Frequency Percent ---------------------------------------------1 Less than 3 months 0 000 2 3-5 months 0 000 3 6-12 months 0 000 4 More than 1 year 59 10000 7 Refused 0 000 8 Not ascertained 0 000 9 Dont know 0 000
Frequency Missing = 34466
AHS312_02000 Birth defect condition status recode
ALCHRC13 Frequency Percent ---------------------------------------------1 Chronic 59 10000 2 Not chronic 0 000 9 Unknown if chronic 0 000
Frequency Missing = 34466
AHS313_01000 Duration of intellectual disabilityalso known as mental retardation Number of units
ATIME14A Frequency Percent -------------------------------------------01-94 1-94 24 3871 95 95+ 0 000 96 Since birth 35 5645 97 Refused 0 000 98 Not ascertained 0 000 99 Dont know 3 484
Frequency Missing = 34463
AHS313_02000 Duration of intellectual disabilityalso know as mental retardation Time unit
AUNIT14A Frequency Percent ------------------------------------------1 Day(s) 0 000 2 Week(s) 0 000 3 Month(s) 0 000 4 Year(s) 25 4032 6 Since birth 35 5645 7 Refused 0 000 8 Not ascertained 0 000 9 Dont know 2 323
Frequency Missing = 34463
129
2012 National Health Interview Survey (NHIS)Sample Adult Public Use File (samadult)
AHS Variables Thursday May 16 2013Unweighted Frequencies
AHS313_02000 Duration (in years) of intellectual disabilityalso known as mental retardation recode 1
ADURA14A Frequency Percent ---------------------------------------------------00 Less than 1 year 0 000 01-84 years 58 9355 85 85+ years 1 161 96 Unknown number of years 1 161 97 Refused 0 000 98 Not ascertained 0 000 99 Dont know 2 323
Frequency Missing = 34463
AHS313_02000 Duration of intellectual disabilityalso known as mental retardation recode 2
ADURB14A Frequency Percent ---------------------------------------------1 Less than 3 months 0 000 2 3-5 months 0 000 3 6-12 months 2 323 4 More than 1 year 58 9355 7 Refused 0 000 8 Not ascertained 0 000 9 Dont know 2 323
Frequency Missing = 34463
AHS313_02000 Intellectual disability also knownas mental retardation condition status recode
ACHRC14A Frequency Percent ---------------------------------------------1 Chronic 62 10000 2 Not chronic 0 000 9 Unknown if chronic 0 000
Frequency Missing = 34463
AHS314_01000 Duration of other developmentalproblem (eg cerebral palsy) Number of units
ALTIME15 Frequency Percent -------------------------------------------01-94 1-94 20 3922 95 95+ 0 000 96 Since birth 31 6078 97 Refused 0 000 98 Not ascertained 0 000 99 Dont know 0 000
Frequency Missing = 34474
130
2012 National Health Interview Survey (NHIS)Sample Adult Public Use File (samadult)
AHS Variables Thursday May 16 2013Unweighted Frequencies
AHS314_02000 Duration of other developmentalproblem (eg cerebral palsy) Time unit
ALUNIT15 Frequency Percent ------------------------------------------1 Day(s) 0 000 2 Week(s) 0 000 3 Month(s) 0 000 4 Year(s) 20 3922 6 Since birth 31 6078 7 Refused 0 000 8 Not ascertained 0 000 9 Dont know 0 000
Frequency Missing = 34474
AHS314_02000 Duration (in years) of other developmentalproblem (eg cerebral palsy) recode 1
ALDURA15 Frequency Percent ---------------------------------------------------00 Less than 1 year 0 000 01-84 years 51 10000 85 85+ years 0 000 96 Unknown number of years 0 000 97 Refused 0 000 98 Not ascertained 0 000 99 Dont know 0 000
Frequency Missing = 34474
AHS314_02000 Duration of other developmentalproblem (eg cerebral palsy) recode 2
ALDURB15 Frequency Percent ---------------------------------------------1 Less than 3 months 0 000 2 3-5 months 0 000 3 6-12 months 0 000 4 More than 1 year 51 10000 7 Refused 0 000 8 Not ascertained 0 000 9 Dont know 0 000
Frequency Missing = 34474
131
2012 National Health Interview Survey (NHIS)Sample Adult Public Use File (samadult)
AHS Variables Thursday May 16 2013Unweighted Frequencies
AHS314_02000 Other developmental problem (egcerebral palsy) condition status recode
ALCHRC15 Frequency Percent ---------------------------------------------1 Chronic 51 10000 2 Not chronic 0 000 9 Unknown if chronic 0 000
Frequency Missing = 34474
AHS315_01000 Duration of senility Number of units
ALTIME16 Frequency Percent -------------------------------------------01-94 1-94 101 9018 95 95+ 0 000 96 Since birth 0 000 97 Refused 0 000 98 Not ascertained 0 000 99 Dont know 11 982
Frequency Missing = 34413
AHS315_02000 Duration of senility Time unit
ALUNIT16 Frequency Percent ------------------------------------------1 Day(s) 0 000 2 Week(s) 0 000 3 Month(s) 4 357 4 Year(s) 101 9018 6 Since birth 0 000 7 Refused 0 000 8 Not ascertained 0 000 9 Dont know 7 625
Frequency Missing = 34413
AHS315_02000 Duration (in years) of senility recode 1
ALDURA16 Frequency Percent ---------------------------------------------------00 Less than 1 year 1 089 01-84 years 100 8929 85 85+ years 0 000 96 Unknown number of years 4 357 97 Refused 0 000 98 Not ascertained 0 000 99 Dont know 7 625
Frequency Missing = 34413
132
2012 National Health Interview Survey (NHIS)Sample Adult Public Use File (samadult)
AHS Variables Thursday May 16 2013Unweighted Frequencies
AHS315_02000 Duration of senility recode 2
ALDURB16 Frequency Percent ---------------------------------------------1 Less than 3 months 0 000 2 3-5 months 0 000 3 6-12 months 11 982 4 More than 1 year 94 8393 7 Refused 0 000 8 Not ascertained 0 000 9 Dont know 7 625
Frequency Missing = 34413
AHS315_02000 Senility condition status recode
ALCHRC16 Frequency Percent ---------------------------------------------1 Chronic 112 10000 2 Not chronic 0 000 9 Unknown if chronic 0 000
Frequency Missing = 34413
AHS316_01000 Duration of depressionanxietyemotionalproblem Number of units
ALTIME17 Frequency Percent -------------------------------------------01-94 1-94 938 8916 95 95+ 1 010 96 Since birth 93 884 97 Refused 4 038 98 Not ascertained 2 019 99 Dont know 14 133
Frequency Missing = 33473
AHS316_02000 Duration of depressionanxietyemotional problem Time unit
ALUNIT17 Frequency Percent ------------------------------------------1 Day(s) 1 010 2 Week(s) 6 057 3 Month(s) 36 342 4 Year(s) 903 8584 6 Since birth 93 884 7 Refused 4 038 8 Not ascertained 2 019 9 Dont know 7 067
Frequency Missing = 33473
133
2012 National Health Interview Survey (NHIS)Sample Adult Public Use File (samadult)
AHS Variables Thursday May 16 2013Unweighted Frequencies
AHS316_02000 Duration (in years) of depressionanxietyemotionalproblem recode 1
ALDURA17 Frequency Percent ---------------------------------------------------00 Less than 1 year 34 323 01-84 years 997 9477 85 85+ years 1 010 96 Unknown number of years 7 067 97 Refused 4 038 98 Not ascertained 2 019 99 Dont know 7 067
Frequency Missing = 33473
AHS316_02000 Duration of depressionanxietyemotional problem recode 2
ALDURB17 Frequency Percent ---------------------------------------------1 Less than 3 months 12 114 2 3-5 months 7 067 3 6-12 months 62 589 4 More than 1 year 958 9106 7 Refused 4 038 8 Not ascertained 2 019 9 Dont know 7 067
Frequency Missing = 33473
AHS316_02000 Depressionanxietyemotional problem condition status recode
ALCHRC17 Frequency Percent ---------------------------------------------1 Chronic 1027 9762 2 Not chronic 12 114 9 Unknown if chronic 13 124
Frequency Missing = 33473
AHS317_01000 Duration of weight problem Number of units
ALTIME18 Frequency Percent -------------------------------------------01-94 1-94 726 8747 95 95+ 1 012 96 Since birth 78 940 97 Refused 6 072 98 Not ascertained 1 012 99 Dont know 18 217
Frequency Missing = 33695
134
2012 National Health Interview Survey (NHIS)Sample Adult Public Use File (samadult)
AHS Variables Thursday May 16 2013Unweighted Frequencies
AHS317_02000 Duration of weight problem Time unit
ALUNIT18 Frequency Percent ------------------------------------------1 Day(s) 1 012 2 Week(s) 1 012 3 Month(s) 14 169 4 Year(s) 721 8687 6 Since birth 78 940 7 Refused 6 072 8 Not ascertained 1 012 9 Dont know 8 096
Frequency Missing = 33695
AHS317_02000 Duration (in years) of weight problem recode 1
ALDURA18 Frequency Percent ---------------------------------------------------00 Less than 1 year 12 145 01-84 years 793 9554 85 85+ years 0 000 96 Unknown number of years 10 120 97 Refused 6 072 98 Not ascertained 1 012 99 Dont know 8 096
Frequency Missing = 33695
AHS317_02000 Duration of weight problem recode 2
ALDURB18 Frequency Percent ---------------------------------------------1 Less than 3 months 2 024 2 3-5 months 3 036 3 6-12 months 48 578 4 More than 1 year 762 9181 7 Refused 6 072 8 Not ascertained 1 012 9 Dont know 8 096
Frequency Missing = 33695
AHS317_02000 Weight problem condition status recode
ALCHRC18 Frequency Percent ---------------------------------------------1 Chronic 813 9795 2 Not chronic 2 024 9 Unknown if chronic 15 181
Frequency Missing = 33695
135
2012 National Health Interview Survey (NHIS)Sample Adult Public Use File (samadult)
AHS Variables Thursday May 16 2013Unweighted Frequencies
AHS318_01000 RECOD Duration of missing limbs (fingerstoes or digits) amputation Number of units
ALTIME19 Frequency Percent -------------------------------------------01-94 1-94 72 9730 95 95+ 0 000 96 Since birth 2 270 97 Refused 0 000 98 Not ascertained 0 000 99 Dont know 0 000
Frequency Missing = 34451
AHS318_02000 RECOD Duration of missing limbs (fingerstoes or digits) amputation Time unit
ALUNIT19 Frequency Percent ------------------------------------------1 Day(s) 2 270 2 Week(s) 0 000 3 Month(s) 7 946 4 Year(s) 63 8514 6 Since birth 2 270 7 Refused 0 000 8 Not ascertained 0 000 9 Dont know 0 000
Frequency Missing = 34451
AHS318_02000 Duration (in years) of missing limbs(fingers toes or digits) amputation recode 1
ALDURA19 Frequency Percent ---------------------------------------------------00 Less than 1 year 5 676 01-84 years 69 9324 85 85+ years 0 000 96 Unknown number of years 0 000 97 Refused 0 000 98 Not ascertained 0 000 99 Dont know 0 000
Frequency Missing = 34451
136
2012 National Health Interview Survey (NHIS)Sample Adult Public Use File (samadult)
AHS Variables Thursday May 16 2013Unweighted Frequencies
AHS318_02000 Duration of missing limbs (fingerstoes or digits) amputation recode 2
ALDURB19 Frequency Percent ---------------------------------------------1 Less than 3 months 3 405 2 3-5 months 0 000 3 6-12 months 5 676 4 More than 1 year 66 8919 7 Refused 0 000 8 Not ascertained 0 000 9 Dont know 0 000
Frequency Missing = 34451
AHS318_02000 Missing limbs (fingers toesor digits) amputation condition status recode
ALCHRC19 Frequency Percent ---------------------------------------------1 Chronic 74 10000 2 Not chronic 0 000 9 Unknown if chronic 0 000
Frequency Missing = 34451
AHS319_01000 RECOD Duration of musculoskeletalconnectivetissue problem Number of units
ALTIME20 Frequency Percent -------------------------------------------01-94 1-94 2294 9659 95 95+ 1 004 96 Since birth 37 156 97 Refused 2 008 98 Not ascertained 3 013 99 Dont know 38 160
Frequency Missing = 32150
137
2012 National Health Interview Survey (NHIS)Sample Adult Public Use File (samadult)
AHS Variables Thursday May 16 2013Unweighted Frequencies
AHS319_02000 RECOD Duration of musculoskeletalconnectivetissue problem Time unit
ALUNIT20 Frequency Percent ------------------------------------------1 Day(s)2 Week(s)3 Month(s)4 Year(s)6 Since birth
10 27 234 2042 37
042 114 985 8598 156
7 Refused 2 008 8 Not ascertained 3 013 9 Dont know 20 084
Frequency Missing = 32150
AHS319_02000 Duration (in years) of musculoskeletalconnectivetissue problem recode 1
ALDURA20 Frequency Percent ---------------------------------------------------00 Less than 1 year 237 998 01-84 years 2095 8821 85 85+ years 0 000 96 Unknown number of years 18 076 97 Refused 2 008 98 Not ascertained 3 013 99 Dont know 20 084
Frequency Missing = 32150
AHS319_02000 Duration of musculoskeletalconnective tissue problem recode 2
ALDURB20 Frequency Percent ---------------------------------------------1 Less than 3 months 83 349 2 3-5 months 69 291 3 6-12 months 287 1208 4 More than 1 year 1911 8046 7 Refused 2 008 8 Not ascertained 3 013 9 Dont know 20 084
Frequency Missing = 32150
138
2012 National Health Interview Survey (NHIS)Sample Adult Public Use File (samadult)
AHS Variables Thursday May 16 2013Unweighted Frequencies
AHS319_02000 Musculoskeletalconnectivetissue problem condition status recode
ALCHRC20 Frequency Percent ---------------------------------------------1 Chronic 2267 9545 2 Not chronic 83 349 9 Unknown if chronic 25 105
Frequency Missing = 32150
AHS320_01000 RECOD Duration of circulation problems(including blood clots) Number of units
ALTIME21 Frequency Percent -------------------------------------------01-94 1-94 384 9697 95 95+ 0 000 96 Since birth 7 177 97 Refused 0 000 98 Not ascertained 0 000 99 Dont know 5 126
Frequency Missing = 34129
AHS320_02000 RECOD Duration of circulation problems (including blood clots) Time unit
ALUNIT21 Frequency Percent ------------------------------------------1 Day(s) 2 051 2 Week(s) 0 000 3 Month(s) 26 657 4 Year(s) 357 9015 6 Since birth 7 177 7 Refused 0 000 8 Not ascertained 0 000 9 Dont know 4 101
Frequency Missing = 34129
139
2012 National Health Interview Survey (NHIS)Sample Adult Public Use File (samadult)
AHS Variables Thursday May 16 2013Unweighted Frequencies
AHS320_02000 Duration (in years) of circulationproblems (including blood clots) recode 1
ALDURA21 Frequency Percent ---------------------------------------------------00 Less than 1 year 19 480 01-84 years 371 9369 85 85+ years 1 025 96 Unknown number of years 1 025 97 Refused 0 000 98 Not ascertained 0 000 99 Dont know 4 101
Frequency Missing = 34129
AHS320_02000 Duration of circulation problems(including blood clots) recode 2
ALDURB21 Frequency Percent ---------------------------------------------1 Less than 3 months 8 202 2 3-5 months 2 051 3 6-12 months 34 859 4 More than 1 year 348 8788 7 Refused 0 000 8 Not ascertained 0 000 9 Dont know 4 101
Frequency Missing = 34129
AHS320_02000 Circulation problems (includingblood clots) condition status recode
ALCHRC21 Frequency Percent ---------------------------------------------1 Chronic 384 9697 2 Not chronic 8 202 9 Unknown if chronic 4 101
Frequency Missing = 34129
AHS321_01000 RECOD Duration of endocrinenutritionalmetabolicproblem Number of units
ALTIME22 Frequency Percent -------------------------------------------01-94 1-94 126 9403 95 95+ 0 000 96 Since birth 6 448 97 Refused 1 075 98 Not ascertained 0 000 99 Dont know 1 075
Frequency Missing = 34391
140
2012 National Health Interview Survey (NHIS)Sample Adult Public Use File (samadult)
AHS Variables Thursday May 16 2013Unweighted Frequencies
AHS321_02000 RECOD Duration of endocrinenutritionalmetabolicproblem Time unit
ALUNIT22 Frequency Percent ------------------------------------------1 Day(s)2 Week(s)3 Month(s)4 Year(s)6 Since birth
0 0 7
120 6
000 000 522 8955 448
7 Refused 1 075 8 Not ascertained 0 000 9 Dont know 0 000
Frequency Missing = 34391
AHS321_02000 Duration (in years) of endocrinenutritionalmetabolicproblem recode 1
ALDURA22 Frequency Percent ---------------------------------------------------00 Less than 1 year 7 522 01-84 years 125 9328 85 85+ years 0 000 96 Unknown number of years 1 075 97 Refused 1 075 98 Not ascertained 0 000 99 Dont know 0 000
Frequency Missing = 34391
AHS321_02000 Duration of endocrinenutritionalmetabolic problem recode 2
ALDURB22 Frequency Percent ---------------------------------------------1 Less than 3 months 1 075 2 3-5 months 3 224 3 6-12 months 11 821 4 More than 1 year 118 8806 7 Refused 1 075 8 Not ascertained 0 000 9 Dont know 0 000
Frequency Missing = 34391
AHS321_02000 Endocrinenutritionalmetabolic problem condition status recode
ALCHRC22 Frequency Percent ---------------------------------------------1 Chronic 132 9851 2 Not chronic 1 075 9 Unknown if chronic 1 075
Frequency Missing = 34391
141
2012 National Health Interview Survey (NHIS)Sample Adult Public Use File (samadult)
AHS Variables Thursday May 16 2013Unweighted Frequencies
AHS322_01000 RECOD Duration of nervous systemsensoryorgan condition Number of units
ALTIME23 Frequency Percent -------------------------------------------01-94 1-94 647 9473 95 95+ 0 000 96 Since birth 27 395 97 Refused 2 029 98 Not ascertained 1 015 99 Dont know 6 088
Frequency Missing = 33842
AHS322_02000 RECOD Duration of nervous systemsensory organ condition Time unit
ALUNIT23 Frequency Percent ------------------------------------------1 Day(s) 4 059 2 Week(s) 3 044 3 Month(s) 35 512 4 Year(s) 607 8887 6 Since birth 27 395 7 Refused 2 029 8 Not ascertained 1 015 9 Dont know 4 059
Frequency Missing = 33842
AHS322_02000 Duration (in years) of nervoussystemsensory organ condition recode 1
ALDURA23 Frequency Percent ---------------------------------------------------00 Less than 1 year 35 512 01-84 years 637 9327 85 85+ years 2 029 96 Unknown number of years 2 029 97 Refused 2 029 98 Not ascertained 1 015 99 Dont know 4 059
Frequency Missing = 33842
142
2012 National Health Interview Survey (NHIS)Sample Adult Public Use File (samadult)
AHS Variables Thursday May 16 2013Unweighted Frequencies
AHS322_02000 Duration of nervous systemsensory organ condition recode 2
ALDURB23 Frequency Percent ---------------------------------------------1 Less than 3 months 9 132 2 3-5 months 10 146 3 6-12 months 57 835 4 More than 1 year 600 8785 7 Refused 2 029 8 Not ascertained 1 015 9 Dont know 4 059
Frequency Missing = 33842
AHS322_02000 Nervous systemsensory organ condition status recode
ALCHRC23 Frequency Percent ---------------------------------------------1 Chronic 667 9766 2 Not chronic 9 132 9 Unknown if chronic 7 102
Frequency Missing = 33842
AHS323_01000 RECOD Duration of digestive system problems Number of units
ALTIME24 Frequency Percent -------------------------------------------01-94 1-94 174 9721 95 95+ 0 000 96 Since birth 2 112 97 Refused 0 000 98 Not ascertained 0 000 99 Dont know 3 168
Frequency Missing = 34346
AHS323_02000 RECOD Duration of digestive system problems Time unit
ALUNIT24 Frequency Percent ------------------------------------------1 Day(s) 1 056 2 Week(s) 1 056 3 Month(s) 18 1006 4 Year(s) 156 8715 6 Since birth 2 112 7 Refused 0 000 8 Not ascertained 0 000 9 Dont know 1 056
Frequency Missing = 34346
143
2012 National Health Interview Survey (NHIS)Sample Adult Public Use File (samadult)
AHS Variables Thursday May 16 2013Unweighted Frequencies
AHS323_02000 Duration (in years) of digestive system problems recode 1
ALDURA24 Frequency Percent ---------------------------------------------------00 Less than 1 year 17 950 01-84 years 159 8883 85 85+ years 0 000 96 Unknown number of years 2 112 97 Refused 0 000 98 Not ascertained 0 000 99 Dont know 1 056
Frequency Missing = 34346
AHS323_02000 Duration of digestive system problems recode 2
ALDURB24 Frequency Percent ---------------------------------------------1 Less than 3 months 7 391 2 3-5 months 3 168 3 6-12 months 23 1285 4 More than 1 year 145 8101 7 Refused 0 000 8 Not ascertained 0 000 9 Dont know 1 056
Frequency Missing = 34346
AHS323_02000 Digestive system problems condition status recode
ALCHRC24 Frequency Percent ---------------------------------------------1 Chronic 171 9553 2 Not chronic 7 391 9 Unknown if chronic 1 056
Frequency Missing = 34346
AHS324_01000 RECOD Duration of genitourinary system problem Number of units
ALTIME25 Frequency Percent -------------------------------------------01-94 1-94 165 9706 95 95+ 0 000 96 Since birth 4 235 97 Refused 0 000 98 Not ascertained 0 000 99 Dont know 1 059
Frequency Missing = 34355
144
2012 National Health Interview Survey (NHIS)Sample Adult Public Use File (samadult)
AHS Variables Thursday May 16 2013Unweighted Frequencies
AHS324_02000 RECOD Duration of genitourinary system problem Time unit
ALUNIT25 Frequency Percent ------------------------------------------1 Day(s) 1 059 2 Week(s) 1 059 3 Month(s) 23 1353 4 Year(s) 141 8294 6 Since birth 4 235 7 Refused 0 000 8 Not ascertained 0 000 9 Dont know 0 000
Frequency Missing = 34355
AHS324_02000 Duration (in years) of genitourinary system problem recode 1
ALDURA25 Frequency Percent ---------------------------------------------------00 Less than 1 year 21 1235 01-84 years 148 8706 85 85+ years 0 000 96 Unknown number of years 1 059 97 Refused 0 000 98 Not ascertained 0 000 99 Dont know 0 000
Frequency Missing = 34355
AHS324_02000 Duration of genitourinary system problem recode 2
ALDURB25 Frequency Percent ---------------------------------------------1 Less than 3 months 5 294 2 3-5 months 5 294 3 6-12 months 30 1765 4 More than 1 year 130 7647 7 Refused 0 000 8 Not ascertained 0 000 9 Dont know 0 000
Frequency Missing = 34355
AHS324_02000 Genitourinary system problem condition status recode
ALCHRC25 Frequency Percent ---------------------------------------------1 Chronic 165 9706 2 Not chronic 5 294 9 Unknown if chronic 0 000
Frequency Missing = 34355
145
2012 National Health Interview Survey (NHIS)Sample Adult Public Use File (samadult)
AHS Variables Thursday May 16 2013Unweighted Frequencies
AHS325_01000 RECOD Duration of skinsubcutaneoussystem problems Number of units
ALTIME26 Frequency Percent -------------------------------------------01-94 1-94 12 10000 95 95+ 0 000 96 Since birth 0 000 97 Refused 0 000 98 Not ascertained 0 000 99 Dont know 0 000
Frequency Missing = 34513
AHS325_02000 RECOD Duration of skinsubcutaneous system problems Time unit
ALUNIT26 Frequency Percent ------------------------------------------1 Day(s) 0 000 2 Week(s) 1 833 3 Month(s) 2 1667 4 Year(s) 9 7500 6 Since birth 0 000 7 Refused 0 000 8 Not ascertained 0 000 9 Dont know 0 000
Frequency Missing = 34513
AHS325_02000 Duration (in years) of skinsubcutaneoussystem problems recode 1
ALDURA26 Frequency Percent ---------------------------------------------------00 Less than 1 year 2 1667 01-84 years 10 8333 85 85+ years 0 000 96 Unknown number of years 0 000 97 Refused 0 000 98 Not ascertained 0 000 99 Dont know 0 000
Frequency Missing = 34513
146
2012 National Health Interview Survey (NHIS)Sample Adult Public Use File (samadult)
AHS Variables Thursday May 16 2013Unweighted Frequencies
AHS325_02000 Duration of skinsubcutaneous system problems recode 2
ALDURB26 Frequency Percent ---------------------------------------------1 Less than 3 months 1 833 2 3-5 months 1 833 3 6-12 months 0 000 4 More than 1 year 10 8333 7 Refused 0 000 8 Not ascertained 0 000 9 Dont know 0 000
Frequency Missing = 34513
AHS325_02000 Skinsubcutaneous system problems condition status recode
ALCHRC26 Frequency Percent ---------------------------------------------1 Chronic 11 9167 2 Not chronic 1 833 9 Unknown if chronic 0 000
Frequency Missing = 34513
AHS326_01000 RECOD Duration of blood or blood-formingorgan problem Number of units
ALTIME27 Frequency Percent -------------------------------------------01-94 1-94 13 8667 95 95+ 0 000 96 Since birth 2 1333 97 Refused 0 000 98 Not ascertained 0 000 99 Dont know 0 000
Frequency Missing = 34510
AHS326_02000 RECOD Duration of blood or blood-forming organ problem Time unit
ALUNIT27 Frequency Percent ------------------------------------------1 Day(s) 0 000 2 Week(s) 1 667 3 Month(s) 2 1333 4 Year(s) 10 6667 6 Since birth 2 1333 7 Refused 0 000 8 Not ascertained 0 000 9 Dont know 0 000
Frequency Missing = 34510
147
2012 National Health Interview Survey (NHIS)Sample Adult Public Use File (samadult)
AHS Variables Thursday May 16 2013Unweighted Frequencies
AHS326_02000 Duration (in years) of bloodor blood-forming organ problem recode 1
ALDURA27 Frequency Percent ---------------------------------------------------00 Less than 1 year 2 1333 01-84 years 13 8667 85 85+ years 0 000 96 Unknown number of years 0 000 97 Refused 0 000 98 Not ascertained 0 000 99 Dont know 0 000
Frequency Missing = 34510
AHS326_02000 Duration of blood or blood-forming organ problem recode 2
ALDURB27 Frequency Percent ---------------------------------------------1 Less than 3 months 1 667 2 3-5 months 0 000 3 6-12 months 1 667 4 More than 1 year 13 8667 7 Refused 0 000 8 Not ascertained 0 000 9 Dont know 0 000
Frequency Missing = 34510
AHS326_02000 Blood or blood-forming organ problem condition status recode
ALCHRC27 Frequency Percent ---------------------------------------------1 Chronic 14 9333 2 Not chronic 1 667 9 Unknown if chronic 0 000
Frequency Missing = 34510
AHS327_01000 RECOD Duration of benign tumorcyst Number of units
ALTIME28 Frequency Percent -------------------------------------------01-94 1-94 28 9032 95 95+ 0 000 96 Since birth 2 645 97 Refused 0 000 98 Not ascertained 1 323 99 Dont know 0 000
Frequency Missing = 34494
148
2012 National Health Interview Survey (NHIS)Sample Adult Public Use File (samadult)
AHS Variables Thursday May 16 2013Unweighted Frequencies
AHS327_02000 RECOD Duration of benign tumorcyst Time unit
ALUNIT28 Frequency Percent ------------------------------------------1 Day(s) 0 000 2 Week(s) 0 000 3 Month(s) 4 1290 4 Year(s) 24 7742 6 Since birth 2 645 7 Refused 0 000 8 Not ascertained 1 323 9 Dont know 0 000
Frequency Missing = 34494
AHS327_02000 Duration (in years) of benign tumorcyst recode 1
ALDURA28 Frequency Percent ---------------------------------------------------00 Less than 1 year 4 1290 01-84 years 26 8387 85 85+ years 0 000 96 Unknown number of years 0 000 97 Refused 0 000 98 Not ascertained 1 323 99 Dont know 0 000
Frequency Missing = 34494
AHS327_02000 Duration of benign tumorcyst recode 2
ALDURB28 Frequency Percent ---------------------------------------------1 Less than 3 months 2 645 2 3-5 months 1 323 3 6-12 months 3 968 4 More than 1 year 24 7742 7 Refused 0 000 8 Not ascertained 1 323 9 Dont know 0 000
Frequency Missing = 34494
AHS327_02000 Benign tumorcyst condition status recode
ALCHRC28 Frequency Percent ---------------------------------------------1 Chronic 28 9032 2 Not chronic 2 645 9 Unknown if chronic 1 323
Frequency Missing = 34494
149
2012 National Health Interview Survey (NHIS)Sample Adult Public Use File (samadult)
AHS Variables Thursday May 16 2013Unweighted Frequencies
AHS328_01000 RECOD Duration of alcohol drugsubstanceabuse problem Number of units
ALTIME29 Frequency Percent -------------------------------------------01-94 1-94 3 10000 95 95+ 0 000 96 Since birth 0 000 97 Refused 0 000 98 Not ascertained 0 000 99 Dont know 0 000
Frequency Missing = 34522
AHS328_02000 RECOD Duration of alcoholdrugsubstanceabuse problem Time unit
ALUNIT29 Frequency Percent ------------------------------------------1 Day(s) 0 000 2 Week(s) 0 000 3 Month(s) 0 000 4 Year(s) 3 10000 6 Since birth 0 000 7 Refused 0 000 8 Not ascertained 0 000 9 Dont know 0 000
Frequency Missing = 34522
AHS328_02000 Duration (in years) of alcoholdrugsubstanceabuse problem recode 1
ALDURA29 Frequency Percent ---------------------------------------------------00 Less than 1 year 0 000 01-84 years 3 10000 85 85+ years 0 000 96 Unknown number of years 0 000 97 Refused 0 000 98 Not ascertained 0 000 99 Dont know 0 000
Frequency Missing = 34522
150
2012 National Health Interview Survey (NHIS)Sample Adult Public Use File (samadult)
AHS Variables Thursday May 16 2013Unweighted Frequencies
AHS328_02000 Duration of alcoholdrugsubstance abuse problem recode 2
ALDURB29 Frequency Percent ---------------------------------------------1 Less than 3 months 0 000 2 3-5 months 0 000 3 6-12 months 0 000 4 More than 1 year 3 10000 7 Refused 0 000 8 Not ascertained 0 000 9 Dont know 0 000
Frequency Missing = 34522
AHS328_02000 Alcohol drugsubstance abuse problem condition status recode
ALCHRC29 Frequency Percent ---------------------------------------------1 Chronic 3 10000 2 Not chronic 0 000 9 Unknown if chronic 0 000
Frequency Missing = 34522
AHS329_01000 RECOD Duration of other mental problemADDBipolarSchizophrenia Number of units
ALTIME30 Frequency Percent -------------------------------------------01-94 1-94 44 7586 95 95+ 0 000 96 Since birth 14 2414 97 Refused 0 000 98 Not ascertained 0 000 99 Dont know 0 000
Frequency Missing = 34467
AHS329_02000 RECOD Duration of other mental problemADDBipolarSchizophrenia Time unit
ALUNIT30 Frequency Percent ------------------------------------------1 Day(s) 0 000 2 Week(s) 0 000 3 Month(s) 0 000 4 Year(s) 44 7586 6 Since birth 14 2414 7 Refused 0 000 8 Not ascertained 0 000 9 Dont know 0 000
Frequency Missing = 34467
151
2012 National Health Interview Survey (NHIS)Sample Adult Public Use File (samadult)
AHS Variables Thursday May 16 2013Unweighted Frequencies
AHS329_02000 Duration (in years) of other mentalproblemADDBipolarSchizophrenia recode 1
ALDURA30 Frequency Percent ---------------------------------------------------00 Less than 1 year01-84 years85 85+ years96 Unknown number of years97 Refused
0 58 0 0 0
000 10000 000 000 000
98 Not ascertained 0 000 99 Dont know 0 000
Frequency Missing = 34467
AHS329_02000 Duration of other mental problemADDBipolarSchizophreniarecode 2
ALDURB30 Frequency Percent ---------------------------------------------1 Less than 3 months 0 000 2 3-5 months 0 000 3 6-12 months 1 172 4 More than 1 year 57 9828 7 Refused 0 000 8 Not ascertained 0 000 9 Dont know 0 000
Frequency Missing = 34467
AHS329_02000 Other mental problemADDBipolarSchizophreniacondition status recode
ALCHRC30 Frequency Percent ---------------------------------------------1 Chronic 58 10000 2 Not chronic 0 000 9 Unknown if chronic 0 000
Frequency Missing = 34467
AHS330_01000 RECOD Duration of surgical after-effectsmedicaltreatment problems Number of units
ALTIME31 Frequency Percent -------------------------------------------01-94 1-94 63 10000 95 95+ 0 000 96 Since birth 0 000 97 Refused 0 000 98 Not ascertained 0 000 99 Dont know 0 000
Frequency Missing = 34462
152
2012 National Health Interview Survey (NHIS)Sample Adult Public Use File (samadult)
AHS Variables Thursday May 16 2013Unweighted Frequencies
AHS330_02000 RECOD Duration of surgical after-effectsmedicaltreatment problems Time unit
ALUNIT31 Frequency Percent ------------------------------------------1 Day(s) 7 1111 2 Week(s) 6 952 3 Month(s) 19 3016 4 Year(s) 31 4921 6 Since birth 0 000 7 Refused 0 000 8 Not ascertained 0 000 9 Dont know 0 000
Frequency Missing = 34462
AHS330_02000 Duration (in years) of surgical after-effectsmedicaltreatment problems recode 1
ALDURA31 Frequency Percent ---------------------------------------------------00 Less than 1 year 31 4921 01-84 years 32 5079 85 85+ years 0 000 96 Unknown number of years 0 000 97 Refused 0 000 98 Not ascertained 0 000 99 Dont know 0 000
Frequency Missing = 34462
AHS330_02000 Duration of surgical after-effectsmedicaltreatment problems recode 2
ALDURB31 Frequency Percent ---------------------------------------------1 Less than 3 months 18 2857 2 3-5 months 6 952 3 6-12 months 14 2222 4 More than 1 year 25 3968 7 Refused 0 000 8 Not ascertained 0 000 9 Dont know 0 000
Frequency Missing = 34462
153
2012 National Health Interview Survey (NHIS)Sample Adult Public Use File (samadult)
AHS Variables Thursday May 16 2013Unweighted Frequencies
AHS330_02000 Surgical after-effectsmedicaltreatment problems condition status recode
ALCHRC31 Frequency Percent ---------------------------------------------1 Chronic 45 7143 2 Not chronic 18 2857 9 Unknown if chronic 0 000
Frequency Missing = 34462
AHS331_01000 RECOD Duration of old ageelderlyaging-relatedproblems Number of units
ALTIME32 Frequency Percent -------------------------------------------01-94 1-94 225 8212 95 95+ 0 000 96 Since birth 0 000 97 Refused 7 255 98 Not ascertained 8 292 99 Dont know 34 1241
Frequency Missing = 34251
AHS331_02000 RECOD Duration of old ageelderlyaging-relatedproblems Time unit
ALUNIT32 Frequency Percent ------------------------------------------1 Day(s) 2 073 2 Week(s) 0 000 3 Month(s) 12 438 4 Year(s) 224 8175 6 Since birth 0 000 7 Refused 7 255 8 Not ascertained 8 292 9 Dont know 21 766
Frequency Missing = 34251
154
2012 National Health Interview Survey (NHIS)Sample Adult Public Use File (samadult)
AHS Variables Thursday May 16 2013Unweighted Frequencies
AHS331_02000 Duration (in years) of old ageelderlyaging-relatedproblems recode 1
ALDURA32 Frequency Percent ---------------------------------------------------00 Less than 1 year 14 511 01-84 years 206 7518 85 85+ years 5 182 96 Unknown number of years 13 474 97 Refused 7 255 98 Not ascertained 8 292 99 Dont know 21 766
Frequency Missing = 34251
AHS331_02000 Duration of old ageelderlyaging-related problems recode 2
ALDURB32 Frequency Percent ---------------------------------------------1 Less than 3 months 4 146 2 3-5 months 1 036 3 6-12 months 29 1058 4 More than 1 year 204 7445 7 Refused 7 255 8 Not ascertained 8 292 9 Dont know 21 766
Frequency Missing = 34251
AHS331_02000 Old ageelderlyaging-related problems condition status recode
ALCHRC32 Frequency Percent ---------------------------------------------1 Chronic 274 10000 2 Not chronic 0 000 9 Unknown if chronic 0 000
Frequency Missing = 34251
AHS332_01000 RECOD Duration of fatiguetirednessweaknessproblem Number of units
ALTIME33 Frequency Percent -------------------------------------------01-94 1-94 89 8165 95 95+ 0 000 96 Since birth 12 1101 97 Refused 0 000 98 Not ascertained 0 000 99 Dont know 8 734
Frequency Missing = 34416
155
2012 National Health Interview Survey (NHIS)Sample Adult Public Use File (samadult)
AHS Variables Thursday May 16 2013Unweighted Frequencies
AHS332_02000 RECOD Duration of fatiguetirednessweakness problem Time unit
ALUNIT33 Frequency Percent ------------------------------------------1 Day(s)2 Week(s)3 Month(s)4 Year(s)6 Since birth
2 2 11 78 12
183 183 1009 7156 1101
7 Refused 0 000 8 Not ascertained 0 000 9 Dont know 4 367
Frequency Missing = 34416
AHS332_02000 Duration (in years) of fatiguetirednessweaknessproblem recode 1
ALDURA33 Frequency Percent ---------------------------------------------------00 Less than 1 year 14 1284 01-84 years 87 7982 85 85+ years 0 000 96 Unknown number of years 4 367 97 Refused 0 000 98 Not ascertained 0 000 99 Dont know 4 367
Frequency Missing = 34416
AHS332_02000 Duration of fatiguetirednessweakness problem recode 2
ALDURB33 Frequency Percent ---------------------------------------------1 Less than 3 months 8 734 2 3-5 months 0 000 3 6-12 months 24 2202 4 More than 1 year 73 6697 7 Refused 0 000 8 Not ascertained 0 000 9 Dont know 4 367
Frequency Missing = 34416
AHS332_02000 Fatiguetirednessweakness problem condition status recode
ALCHRC33 Frequency Percent ---------------------------------------------1 Chronic 97 8899 2 Not chronic 8 734 9 Unknown if chronic 4 367
Frequency Missing = 34416
156
2012 National Health Interview Survey (NHIS)Sample Adult Public Use File (samadult)
AHS Variables Thursday May 16 2013Unweighted Frequencies
AHS333_01000 RECOD Duration of pregnancy-related problem Number of units
ALTIME34 Frequency Percent -------------------------------------------01-94 1-94 36 10000 95 95+ 0 000 96 Since birth 0 000 97 Refused 0 000 98 Not ascertained 0 000 99 Dont know 0 000
Frequency Missing = 34489
AHS333_02000 RECOD Duration of pregnancy-related problem Time unit
ALUNIT34 Frequency Percent ------------------------------------------1 Day(s) 0 000 2 Week(s) 5 1389 3 Month(s) 29 8056 4 Year(s) 2 556 6 Since birth 0 000 7 Refused 0 000 8 Not ascertained 0 000 9 Dont know 0 000
Frequency Missing = 34489
AHS333_02000 Duration (in years) of pregnancy-related problem recode 1
ALDURA34 Frequency Percent ---------------------------------------------------00 Less than 1 year 34 9444 01-84 years 2 556 85 85+ years 0 000 96 Unknown number of years 0 000 97 Refused 0 000 98 Not ascertained 0 000 99 Dont know 0 000
Frequency Missing = 34489
157
2012 National Health Interview Survey (NHIS)Sample Adult Public Use File (samadult)
AHS Variables Thursday May 16 2013Unweighted Frequencies
AHS333_02000 Duration of pregnancy-related problem recode 2
ALDURB34 Frequency Percent ---------------------------------------------1 Less than 3 months 5 1389 2 3-5 months 6 1667 3 6-12 months 23 6389 4 More than 1 year 2 556 7 Refused 0 000 8 Not ascertained 0 000 9 Dont know 0 000
Frequency Missing = 34489
AHS333_02000 Pregnancy-related condition status recode
ALCHRC34 Frequency Percent ---------------------------------------------1 Chronic 0 000 2 Not chronic 36 10000 9 Unknown if chronic 0 000
Frequency Missing = 34489
AHS335_01000 Duration of other impairmentproblem NEC (1) Number of units
ALTIME90 Frequency Percent -------------------------------------------01-94 1-94 270 8084 95 95+ 3 090 96 Since birth 38 1138 97 Refused 3 090 98 Not ascertained 0 000 99 Dont know 20 599
Frequency Missing = 34191
AHS335_02000 Duration of other impairmentproblem NEC (1) Time unit
ALUNIT90 Frequency Percent ------------------------------------------1 Day(s) 9 269 2 Week(s) 3 090 3 Month(s) 37 1108 4 Year(s) 228 6826 6 Since birth 38 1138 7 Refused 3 090 8 Not ascertained 0 000 9 Dont know 16 479
Frequency Missing = 34191
158
2012 National Health Interview Survey (NHIS)Sample Adult Public Use File (samadult)
AHS Variables Thursday May 16 2013Unweighted Frequencies
AHS335_02000 Duration (in years) of otherimpairmentproblem NEC (1) recode 1
ALDURA90 Frequency Percent ---------------------------------------------------00 Less than 1 year 44 1317 01-84 years 267 7994 85 85+ years 0 000 96 Unknown number of years 4 120 97 Refused 3 090 98 Not ascertained 0 000 99 Dont know 16 479
Frequency Missing = 34191
AHS335_02000 Duration of other impairmentproblem NEC (1) recode 2
ALDURB90 Frequency Percent ---------------------------------------------1 Less than 3 months 17 509 2 3-5 months 11 329 3 6-12 months 41 1228 4 More than 1 year 246 7365 7 Refused 3 090 8 Not ascertained 0 000 9 Dont know 16 479
Frequency Missing = 34191
AHS335_02000 Other impairmentproblem NEC (1) condition status recode
ALCHRC90 Frequency Percent ---------------------------------------------1 Chronic 298 8922 2 Not chronic 17 509 9 Unknown if chronic 19 569
Frequency Missing = 34191
AHS336_01000 Duration of other impairmentproblem NEC (2) Number of units
ALTIME91 Frequency Percent -------------------------------------------01-94 1-94 4 10000 95 95+ 0 000 96 Since birth 0 000 97 Refused 0 000 98 Not ascertained 0 000 99 Dont know 0 000
Frequency Missing = 34521
159
2012 National Health Interview Survey (NHIS)Sample Adult Public Use File (samadult)
AHS Variables Thursday May 16 2013Unweighted Frequencies
AHS336_02000 Duration of other impairmentproblem NEC (2) Time unit
ALUNIT91 Frequency Percent ------------------------------------------1 Day(s)2 Week(s)3 Month(s)4 Year(s)6 Since birth
0 0 0 4 0
000 000 000
10000 000
7 Refused 0 000 8 Not ascertained 0 000 9 Dont know 0 000
Frequency Missing = 34521
AHS336_02000 Duration (in years) of otherimpairment problem NEC (2) recode 1
ALDURA91 Frequency Percent ---------------------------------------------------00 Less than 1 year 0 000 01-84 years 4 10000 85 85+ years 0 000 96 Unknown number of years 0 000 97 Refused 0 000 98 Not ascertained 0 000 99 Dont know 0 000
Frequency Missing = 34521
AHS336_02000 Duration of other impairmentproblem NEC (2) recode 2
ALDURB91 Frequency Percent ---------------------------------------------1 Less than 3 months 0 000 2 3-5 months 0 000 3 6-12 months 0 000 4 More than 1 year 4 10000 7 Refused 0 000 8 Not ascertained 0 000 9 Dont know 0 000
Frequency Missing = 34521
AHS336_02000 Other impairmentproblem NEC (2) condition status recode
ALCHRC91 Frequency Percent ---------------------------------------------1 Chronic 4 10000 2 Not chronic 0 000 9 Unknown if chronic 0 000
Frequency Missing = 34521
--------------------------------------------------------------------------------
-------------------------------------------------------------------------------
--------------------------------------------------------------------------------
2012 National Health Interview Survey (NHIS) 160 Sample Adult Public Use File (samadult)
AHS Variables Thursday May 16 2013Unweighted Frequencies
AHS336_02000 Chronic condition recode for individual with functional limitation
ALCNDRT Frequency
1 At least one condition causing functional limitation is chronic 12350 2 No condition causing functional limitation 268 9 Unknown if any condition causing functional limitation is chronic 273
Frequency Missing = 21634
AHS336_02000 Chronic condition recode for individual with functional limitation
ALCNDRT Percent
1 At least one condition causing functional limitation is chronic 9580 2 No condition causing functional limitation 208 9 Unknown if any condition causing functional limitation is chronic 212
Frequency Missing = 21634
AHS336_02000 Overall functional limitation recode by condition status
ALCHRONR Frequency Percent
0 Not limited in any way (including unknown if limited) 21634 6266 1 Limited caused by at least one chronic condition 12350 3577 2 Limited not caused by chronic condition 268 078 3 Limited unknown if condition is chronic 273 079
161
2012 National Health Interview Survey (NHIS)Sample Adult Public Use File (samadult)
AHB Variables Thursday May 16 2013Unweighted Frequencies
AHB010_00000 Ever smoked 100 cigarettes
SMKEV Frequency Percent ------------------------------------------1 Yes 14031 4064 2 No 20236 5861 7 Refused 59 017 8 Not ascertained 173 050 9 Dont know 26 008
AHB020_00000 Age first smoked fairly regularly
SMKREG Frequency Percent --------------------------------------------------06-84 6 - 84 years 13590 9686 85 85 years or older 0 000 96 Never smoked regularly 265 189 97 Refused 20 014 98 Not ascertained 4 003 99 Dont know 152 108
Frequency Missing = 20494
AHB030_00000 Smoke freq everydaysome daysnot at all
SMKNOW Frequency Percent ------------------------------------------1 Every day 4954 3531 2 Some days 1482 1056 3 Not at all 7584 5405 7 Refused 8 006 8 Not ascertained 3 002 9 Dont know 0 000
Frequency Missing = 20494
AHB030_00000 Smoking Status Recode
SMKSTAT2 Frequency Percent ---------------------------------------------------------1 Current every day smoker 4954 1435 2 Current some day smoker 1482 429 3 Former smoker 7584 2197 4 Never smoker 20236 5861 5 Smoker current status unknown 11 003 9 Unknown if ever smoked 258 075
162
2012 National Health Interview Survey (NHIS)Sample Adult Public Use File (samadult)
AHB Variables Thursday May 16 2013Unweighted Frequencies
AHB040_01000 Time since quit of units
SMKQTNO Frequency Percent -------------------------------------------01-94 1 - 94 7508 9900 95 95+ 1 001 97 Refused 5 007 98 Not ascertained 0 000 99 Dont know 70 092
Frequency Missing = 26941
AHB040_02000 Time since quit time period
SMKQTTP Frequency Percent ------------------------------------------1 Day(s) 59 078 2 Week(s) 67 088 3 Month(s) 551 727 4 Year(s) 6832 9008 7 Refused 5 007 8 Not ascertained 0 000 9 Dont know 70 092
Frequency Missing = 26941
AHB040_02000 Time since quit smoking (in years)
SMKQTY Frequency Percent --------------------------------------------00 Less than 1 year 562 741 01-69 1-69 years 6938 9148 70 70+ years 9 012 97 Refused 5 007 98 Not ascertained 0 000 99 Dont know 70 092
Frequency Missing = 26941
AHB050_00000 Number cigs per day (daily smokers)
CIGSDA1 Frequency Percent ------------------------------------------------01-94 1 - 94 cigarettes 4920 9931 95 95+ cigarettes 1 002 97 Refused 7 014 98 Not ascertained 0 000 99 Dont know 26 052
Frequency Missing = 29571
163
2012 National Health Interview Survey (NHIS)Sample Adult Public Use File (samadult)
AHB Variables Thursday May 16 2013Unweighted Frequencies
AHB060_00000 Number days smoked in past 30 days
CIGDAMO Frequency Percent -------------------------------------------00 None 57 385 01-30 1-30 days 1388 9366 97 Refused 0 000 98 Not ascertained 0 000 99 Dont know 37 250
Frequency Missing = 33043
AHB070_00000 Number cigs per day (some day smokers)
CIGSDA2 Frequency Percent ------------------------------------------------01-94 1 - 94 cigarettes 1404 9853 95 95+ cigarettes 0 000 97 Refused 2 014 98 Not ascertained 0 000 99 Dont know 19 133
Frequency Missing = 33100
AHB070_00000 Number of cigarettes a day (all current smokers)
CIGSDAY Frequency Percent ------------------------------------------------01-94 1 - 94 cigarettes 6324 9914 95 95+ cigarettes 1 002 97 Refused 9 014 98 Not ascertained 0 000 99 Dont know 45 071
Frequency Missing = 28146
AHB080_00000 Tried quit smoking 1+ days past 12 m
CIGQTYR Frequency Percent ------------------------------------------1 Yes 2961 4601 2 No 3467 5387 7 Refused 2 003 8 Not ascertained 0 000 9 Dont know 6 009
Frequency Missing = 28089
164
2012 National Health Interview Survey (NHIS)Sample Adult Public Use File (samadult)
AHB Variables Thursday May 16 2013Unweighted Frequencies
AHB085_00010 Ever smoked tobacco products OTHER than cigarettes
OTHCIGEV Frequency Percent ------------------------------------------1 Yes 7181 2080 2 No 27076 7842 7 Refused 62 018 8 Not ascertained 183 053 9 Dont know 23 007
AHB085_00020 Smoke freq everydaysome daysrarelynotat all (other than cigarettes)
OTHCIGED Frequency Percent ------------------------------------------1 Every day 258 359 2 Some days 377 525 3 Rarely 1232 1716 4 Not at all 5312 7397 7 Refused 0 000 8 Not ascertained 1 001 9 Dont know 1 001
Frequency Missing = 27344
AHB085_00030 Ever used smokeless tobacco products
SMKLESEV Frequency Percent ------------------------------------------1 Yes 3440 996 2 No 30826 8929 7 Refused 55 016 8 Not ascertained 187 054 9 Dont know 17 005
AHB085_00040 Smokeless tobacco freq everydaysome daysrarelynot at all
SMKLESED Frequency Percent ------------------------------------------1 Every day 448 1302 2 Some days 219 637 3 Rarely 232 674 4 Not at all 2541 7387 7 Refused 0 000 8 Not ascertained 0 000 9 Dont know 0 000
Frequency Missing = 31085
165
2012 National Health Interview Survey (NHIS)Sample Adult Public Use File (samadult)
AHB Variables Thursday May 16 2013Unweighted Frequencies
AHB085_00050 Using any tobacco product around this time last year
TOBLASYR Frequency Percent ------------------------------------------1 Yes 6676 3844 2 No 10669 6143 7 Refused 9 005 8 Not ascertained 9 005 9 Dont know 6 003
Frequency Missing = 17156
AHB085_00060 Tried quit all tobacco products 1+ days past 12 m
TOBQTYR Frequency Percent ------------------------------------------1 Yes 3207 3766 2 No 5296 6220 7 Refused 2 002 8 Not ascertained 2 002 9 Dont know 8 009
Frequency Missing = 26010
AHB090_01000 Freq vigorous activity of units
VIGNO Frequency Percent ------------------------------------------------------------000 Never 18386 5325 001-995 1-995 time(s) 14895 4314 996 Unable to do this type activity 752 218 997 Refused 31 009 998 Not ascertained 402 116 999 Dont know 59 017
AHB090_02000 Freq vigorous activity Time units
VIGTP Frequency Percent -----------------------------------------------------0 Never 18386 5325 1 Per day 2425 702 2 Per week 11204 3245 3 Per month 1018 295 4 Per year 248 072 6 Unable to do this activity 752 218 7 Refused 31 009 8 Not ascertained 402 116 9 Dont know 59 017
166
2012 National Health Interview Survey (NHIS)Sample Adult Public Use File (samadult)
AHB Variables Thursday May 16 2013Unweighted Frequencies
AHB090_02000 Freq vigorous activity (times per wk)
VIGFREQW Frequency Percent ----------------------------------------------------------00 Less than once per week 914 265 01-28 1-28 times per week 13981 4050 95 Never 18386 5325 96 Unable to do vigorous activity 752 218 97 Refused 31 009 98 Not ascertained 402 116 99 Dont know 59 017
AHB100_01000 Duration vigorous activity units
VIGLNGNO Frequency Percent --------------------------------------------001-995 1-995 14834 9959 997 Refused 0 000 998 Not ascertained 14 009 999 Dont know 47 032
Frequency Missing = 19630
AHB100_02000 Duration vigorous activity Time unit
VIGLNGTP Frequency Percent ------------------------------------------1 Minutes 9517 6389 2 Hours 5317 3570 7 Refused 0 000 8 Not ascertained 14 009 9 Dont know 47 032
Frequency Missing = 19630
AHB100_02000 Duration vigorous activity (in minutes)
VIGMIN Frequency Percent -----------------------------------------------010-720 10-720 minutes 14834 9959 997 Refused 0 000 998 Not ascertained 14 009 999 Dont know 47 032
Frequency Missing = 19630
167
2012 National Health Interview Survey (NHIS)Sample Adult Public Use File (samadult)
AHB Variables Thursday May 16 2013Unweighted Frequencies
AHB110_01000 Freq moderate activity of units
MODNO Frequency Percent ------------------------------------------------------------000 Never 13555 3926 001-995 1-995 time(s) 19727 5714 996 Unable to do this type activity 524 152 997 Refused 35 010 998 Not ascertained 537 156 999 Dont know 147 043
AHB110_02000 Freq moderate activity Time units
MODTP Frequency Percent -----------------------------------------------------0 Never 13555 3926 1 Per day 5256 1522 2 Per week 13369 3872 3 Per month 899 260 4 Per year 203 059 6 Unable to do this activity 524 152 7 Refused 35 010 8 Not ascertained 537 156 9 Dont know 147 043
AHB110_02000 Freq lightmoderate activity (times per wk)
MODFREQW Frequency Percent -------------------------------------------------------------------00 Less than once per week 706 204 01-28 1-28 times per week 19021 5509 95 Never 13555 3926 96 Unable to do light or moderate activity 524 152 97 Refused 35 010 98 Not ascertained 537 156 99 Dont know 147 043
AHB120_01000 Duration moderate activity of units
MODLNGNO Frequency Percent --------------------------------------------001-995 1-995 19611 9941 997 Refused 1 001 998 Not ascertained 10 005 999 Dont know 105 053
Frequency Missing = 14798
168
2012 National Health Interview Survey (NHIS)Sample Adult Public Use File (samadult)
AHB Variables Thursday May 16 2013Unweighted Frequencies
AHB120_02000 Duration moderate activity Time unit
MODLNGTP Frequency Percent ------------------------------------------1 Minutes 14362 7280 2 Hours 5249 2661 7 Refused 1 001 8 Not ascertained 10 005 9 Dont know 105 053
Frequency Missing = 14798
AHB120_02000 Duration lightmoderate activity (in minutes)
MODMIN Frequency Percent -----------------------------------------------010-720 10-720 minutes 19611 9941 997 Refused 1 001 998 Not ascertained 10 005 999 Dont know 105 053
Frequency Missing = 14798
AHB130_01000 Strength activity freq of units
STRNGNO Frequency Percent ------------------------------------------------------------000 Never 24308 7041 001-995 1-995 time(s) 9241 2677 996 Unable to do this type activity 574 166 997 Refused 35 010 998 Not ascertained 316 092 999 Dont know 51 015
AHB130_02000 Strength activity freq Time units
STRNGTP Frequency Percent -----------------------------------------------------0 Never 24308 7041 1 Per day 1359 394 2 Per week 7163 2075 3 Per month 572 166 4 Per year 147 043 6 Unable to do this activity 574 166 7 Refused 35 010 8 Not ascertained 316 092 9 Dont know 51 015
169
2012 National Health Interview Survey (NHIS)Sample Adult Public Use File (samadult)
AHB Variables Thursday May 16 2013Unweighted Frequencies
AHB130_02000 Freq strength activity (times per wk)
STRFREQW Frequency Percent ----------------------------------------------------------00 Less than once per week 510 148 01-28 1-28 times per week 8731 2529 95 Never 24308 7041 96 Unable to do strength activity 574 166 97 Refused 35 010 98 Not ascertained 316 092 99 Dont know 51 015
AHB140_00000 Ever had 12+ drinks in any one year
ALC1YR Frequency Percent ------------------------------------------1 Yes 21343 6182 2 No 12841 3719 7 Refused 70 020 8 Not ascertained 254 074 9 Dont know 17 005
AHB150_00000 Had 12+ drinks in ENTIRE LIFE
ALCLIFE Frequency Percent ------------------------------------------1 Yes 5380 4081 2 No 7451 5652 7 Refused 67 051 8 Not ascertained 257 195 9 Dont know 27 020
Frequency Missing = 21343
AHB160_01000 Freq drank alcohol pst yr of units
ALC12MNO Frequency Percent --------------------------------------------000 Never 5400 2021 001-365 1-365 days 21049 7877 997 Refused 48 018 998 Not ascertained 3 001 999 Dont know 223 083
Frequency Missing = 7802
170
2012 National Health Interview Survey (NHIS)Sample Adult Public Use File (samadult)
AHB Variables Thursday May 16 2013Unweighted Frequencies
AHB160_02000 Freq drank alcohol pst yr Time unit
ALC12MTP Frequency Percent ------------------------------------------0 NeverNone 5400 2021 1 Week 9172 3432 2 Month 5304 1985 3 Year 6572 2459 7 Refused 48 018 8 Not ascertained 4 001 9 Dont know 223 083
Frequency Missing = 7802
AHB160_02000 Freq drank alcohol Days per week
ALC12MWK Frequency Percent ------------------------------------------------------00 Less than one day per week 10224 3826 01-07 1-7 days per week 10825 4051 95 Did not drink in past year 5400 2021 97 Refused 48 018 98 Not ascertained 3 001 99 Dont know 223 083
Frequency Missing = 7802
AHB160_02000 Freq drank alcohol Days in past year
ALC12MYR Frequency Percent --------------------------------------------000 Nevernone 5400 2021 001-365 1-365 days 21049 7877 997 Refused 48 018 998 Not ascertained 3 001 999 Dont know 223 083
Frequency Missing = 7802
AHB170_00000 Average drinks on days drank
ALCAMT Frequency Percent -------------------------------------------01-94 1-94 drinks 20939 9948 95 95+ drinks 3 001 97 Refused 15 007 98 Not ascertained 2 001 99 Dont know 89 042
Frequency Missing = 13477
171
2012 National Health Interview Survey (NHIS)Sample Adult Public Use File (samadult)
AHB Variables Thursday May 16 2013Unweighted Frequencies
AHB170_00000 Alcohol drinking status Recode
ALCSTAT Frequency Percent --------------------------------------------------------------------01 Lifetime abstainer 7451 2158 02 Former infrequent 3087 894 03 Former regular 2309 669 04 Former unknown frequency 4 001 05 Current infrequent 4322 1252 06 Current light 9945 2881 07 Current moderate 4916 1424 08 Current heavier 1759 509 09 Current drinker frequencylevel unknown 107 031 10 Drinking status unknown 625 181
AHB180_01000 Days 5+ drinks past yr days
ALC5UPNO Frequency Percent --------------------------------------------000 Nevernone 13557 6441 001-365 1-365 days 7227 3434 997 Refused 17 008 998 Not ascertained 5 002 999 Dont know 242 115
Frequency Missing = 13477
AHB180_02000 Days 5+ drinks past yr Time unit
ALC5UPTP Frequency Percent ------------------------------------------0 NeverNone 13557 6441 1 Per week 678 322 2 Per month 519 247 3 Per year 6030 2865 7 Refused 17 008 8 Not ascertained 5 002 9 Dont know 242 115
Frequency Missing = 13477
AHB180_02000 Number of days had 5+ drinks past year
ALC5UPYR Frequency Percent --------------------------------------------000 Nevernone 13557 6441 001-365 1-365 days 7227 3434 997 Refused 17 008 998 Not ascertained 5 002 999 Dont know 242 115
Frequency Missing = 13477
172
2012 National Health Interview Survey (NHIS)Sample Adult Public Use File (samadult)
AHB Variables Thursday May 16 2013Unweighted Frequencies
AHB190_04000 Total height in inches
AHEIGHT Frequency Percent -------------------------------------------59-76 59-76 inches 31959 9257 96 Not available 2080 602 97 Refused 62 018 98 Not ascertained 311 090 99 Dont know 113 033
AHB200_02000 Weight without shoes (pounds)
AWEIGHTP Frequency Percent -----------------------------------------------100-299 100-299 pounds 31211 9040 996 Not available 2080 602 997 Refused 546 158 998 Not ascertained 289 084 999 Dont know 399 116
AHB200_02000 Body Mass Index (BMI)
BMI Frequency Percent ----------------------------------------------0001-9994 0001-9994 33170 9608 9995 9995+ 0 000 9999 Unknown 1355 392
AHB210_00000 Hours of sleep
SLEEP Frequency Percent -------------------------------------------01-24 1-24 hours 34032 9857 97 Refused 49 014 98 Not ascertained 293 085 99 Dont know 151 044
173
2012 National Health Interview Survey (NHIS)Sample Adult Public Use File (samadult)
AAU Variables Thursday May 16 2013Unweighted Frequencies
AAU020_00000 Place USUALLY go when sick
AUSUALPL Frequency Percent -------------------------------------------------------1 Yes 28167 8158 2 There is NO place 5642 1634 3 There is MORE THAN ONE place 364 105 7 Refused 12 003 8 Not ascertained 334 097 9 Dont know 6 002
AAU030_00000 Place to go when sick (most often)
APLKIND Frequency Percent -------------------------------------------------------------1 Clinic or health center 7091 2485 2 Doctors office or HMO 19994 7008 3 Hospital emergency room 410 144 4 Hospital outpatient department 474 166 5 Some other place 339 119 6 Doesnt go to one place most often 204 072 7 Refused 7 002 8 Not ascertained 4 001 9 Dont know 8 003
Frequency Missing = 5994
AAU035_00000 USUALLY go there for routinepreventive care
AHCPLROU Frequency Percent ------------------------------------------1 Yes 26616 9402 2 No 1668 589 7 Refused 5 002 8 Not ascertained 2 001 9 Dont know 17 006
Frequency Missing = 6217
174
2012 National Health Interview Survey (NHIS)Sample Adult Public Use File (samadult)
AAU Variables Thursday May 16 2013Unweighted Frequencies
AAU037_00000 Place USUALLY go for routinepreventive care
AHCPLKND Frequency Percent ---------------------------------------------------------------0 Doesnt get preventive care anywhere 3928 4966 1 Clinic or health center 1069 1352 2 Doctors office or HMO 1637 2070 3 Hospital emergency room 150 190 4 Hospital outpatient department 86 109 5 Some other place 161 204 6 Doesnt go to one place most often 493 623 7 Refused 24 030 8 Not ascertained 344 435 9 Dont know 17 021
Frequency Missing = 26616
AAU040_00000 Change health care place past 12 m
AHCCHGYR Frequency Percent ------------------------------------------1 Yes 2345 822 2 No 26166 9171 7 Refused 6 002 8 Not ascertained 9 003 9 Dont know 5 002
Frequency Missing = 5994
AAU050_00000 Change related to health insurance
AHCCHGHI Frequency Percent ------------------------------------------1 Yes 630 2687 2 No 1714 7309 7 Refused 0 000 8 Not ascertained 0 000 9 Dont know 1 004
Frequency Missing = 32180
AAU050_01010 Doesnt need doctorhavent had problems
ANOUSPL1 Frequency Percent ------------------------------------------1 Mentioned 2735 4848 2 Not mentioned 2888 5119 7 Refused 3 005 8 Not ascertained 5 009 9 Donrsquot know 11 019
Frequency Missing = 28883
175
2012 National Health Interview Survey (NHIS)Sample Adult Public Use File (samadult)
AAU Variables Thursday May 16 2013Unweighted Frequencies
AAU050_02010 Doesnt liketrustbelieve in doctors
ANOUSPL2 Frequency Percent ------------------------------------------1 Mentioned 204 362 2 Not mentioned 5419 9605 7 Refused 3 005 8 Not ascertained 5 009 9 Donrsquot know 11 019
Frequency Missing = 28883
AAU050_03010 Doesnt know where to go
ANOUSPL3 Frequency Percent ------------------------------------------1 Mentioned 135 239 2 Not mentioned 5488 9727 7 Refused 3 005 8 Not ascertained 5 009 9 Donrsquot know 11 019
Frequency Missing = 28883
AAU050_04010 Previous doctor is not availablemoved
ANOUSPL4 Frequency Percent ------------------------------------------1 Mentioned 171 303 2 Not mentioned 5452 9663 7 Refused 3 005 8 Not ascertained 5 009 9 Donrsquot know 11 019
Frequency Missing = 28883
AAU050_05010 Too expensiveno insurancecost
ANOUSPL5 Frequency Percent ------------------------------------------1 Mentioned 2165 3837 2 Not mentioned 3458 6129 7 Refused 3 005 8 Not ascertained 5 009 9 Donrsquot know 11 019
Frequency Missing = 28883
176
2012 National Health Interview Survey (NHIS)Sample Adult Public Use File (samadult)
AAU Variables Thursday May 16 2013Unweighted Frequencies
AAU050_06010 Speak a different language
ANOUSPL6 Frequency Percent ------------------------------------------1 Mentioned 19 034 2 Not mentioned 5604 9933 7 Refused 3 005 8 Not ascertained 5 009 9 Donrsquot know 11 019
Frequency Missing = 28883
AAU050_07010 No care availabletoo far awaynot convenient
ANOUSPL7 Frequency Percent ------------------------------------------1 Mentioned 55 097 2 Not mentioned 5568 9869 7 Refused 3 005 8 Not ascertained 5 009 9 Donrsquot know 11 019
Frequency Missing = 28883
AAU050_08010 Put if offdidnt get around to it
ANOUSPL8 Frequency Percent ------------------------------------------1 Mentioned 314 557 2 Not mentioned 5309 9410 7 Refused 3 005 8 Not ascertained 5 009 9 Donrsquot know 11 019
Frequency Missing = 28883
AAU050_09010 Other reason no usual place of care
ANOUSPL9 Frequency Percent ------------------------------------------1 Mentioned 404 716 2 Not mentioned 5219 9250 7 Refused 3 005 8 Not ascertained 5 009 9 Donrsquot know 11 019
Frequency Missing = 28883
177
2012 National Health Interview Survey (NHIS)Sample Adult Public Use File (samadult)
AAU Variables Thursday May 16 2013Unweighted Frequencies
AAU051_00010 Trouble finding a doctorprovider past 12 m
APRVTRYR Frequency Percent ------------------------------------------1 Yes 1037 300 2 No 33096 9586 7 Refused 15 004 8 Not ascertained 359 104 9 Dont know 18 005
AAU053_00010 Able to find doctorprovider past 12 m
APRVTRFD Frequency Percent ------------------------------------------1 Yes 683 6586 2 No 347 3346 7 Refused 0 000 8 Not ascertained 0 000 9 Donrsquot know 7 068
Frequency Missing = 33488
AAU057_00010 Doctors office not accept you as new patient past 12 m
ADRNANP Frequency Percent ------------------------------------------1 Yes 807 234 2 No 33317 9650 7 Refused 15 004 8 Not ascertained 361 105 9 Donrsquot know 25 007
AAU059_00010 Doctors office not accept your health insurance past 12 m
ADRNAI Frequency Percent ------------------------------------------1 Yes 1062 308 2 No 33051 9573 7 Refused 16 005 8 Not ascertained 365 106 9 Donrsquot know 31 009
AAU061_01000 Couldnt get through on phone past 12 m
AHCDLYR1 Frequency Percent ------------------------------------------1 Yes 809 234 2 No 33304 9646 7 Refused 18 005 8 Not ascertained 378 109 9 Dont know 16 005
178
2012 National Health Interview Survey (NHIS)Sample Adult Public Use File (samadult)
AAU Variables Thursday May 16 2013Unweighted Frequencies
AAU061_02000 Couldnt get appointment soon enough past 12 m
AHCDLYR2 Frequency Percent ------------------------------------------1 Yes 1961 568 2 No 32151 9312 7 Refused 19 006 8 Not ascertained 378 109 9 Dont know 16 005
AAU061_03000 Wait too long in doctors office past 12 m
AHCDLYR3 Frequency Percent ------------------------------------------1 Yes 1506 436 2 No 32600 9442 7 Refused 20 006 8 Not ascertained 381 110 9 Dont know 18 005
AAU061_04000 Not open when you could go past 12 m
AHCDLYR4 Frequency Percent ------------------------------------------1 Yes 973 282 2 No 33132 9597 7 Refused 20 006 8 Not ascertained 382 111 9 Dont know 18 005
AAU061_05000 No transportation past 12 m
AHCDLYR5 Frequency Percent ------------------------------------------1 Yes 794 230 2 No 33317 9650 7 Refused 19 006 8 Not ascertained 383 111 9 Dont know 12 003
AAU111_01000 Couldnt afford prescription medicine past 12 m
AHCAFYR1 Frequency Percent ------------------------------------------1 Yes 3040 881 2 No 31056 8995 7 Refused 17 005 8 Not ascertained 398 115 9 Dont know 14 004
179
2012 National Health Interview Survey (NHIS)Sample Adult Public Use File (samadult)
AAU Variables Thursday May 16 2013Unweighted Frequencies
AAU111_02000 Couldnt afford mental health carecounseling past 12 m
AHCAFYR2 Frequency Percent ------------------------------------------1 Yes 944 273 2 No 33146 9601 7 Refused 18 005 8 Not ascertained 405 117 9 Dont know 12 003
AAU111_03000 Couldnt afford dental care past 12 m
AHCAFYR3 Frequency Percent ------------------------------------------1 Yes 4776 1383 2 No 29313 8490 7 Refused 16 005 8 Not ascertained 407 118 9 Dont know 13 004
AAU111_04000 Couldnt afford eyeglasses past 12 m
AHCAFYR4 Frequency Percent ------------------------------------------1 Yes 2860 828 2 No 31231 9046 7 Refused 16 005 8 Not ascertained 407 118 9 Dont know 11 003
AAU111_05010 Couldnt afford to see a specialist past 12 m
AHCAFYR5 Frequency Percent ------------------------------------------1 Yes 1853 537 2 No 32232 9336 7 Refused 16 005 8 Not ascertained 408 118 9 Donrsquot know 16 005
AAU111_06010 Couldnt afford follow-up care past 12 m
AHCAFYR6 Frequency Percent ------------------------------------------1 Yes 1697 492 2 No 32389 9381 7 Refused 17 005 8 Not ascertained 409 118 9 Donrsquot know 13 004
180
2012 National Health Interview Survey (NHIS)Sample Adult Public Use File (samadult)
AAU Variables Thursday May 16 2013Unweighted Frequencies
AAU113_00010 Get sick or have accident worried about paying medical bills
AWORPAY Frequency Percent ---------------------------------------------1 Very worried2 Somewhat worried
6934 10303
2008 2984
3 Not at all worried 16771 4858 7 Refused 24 007 8 Not ascertained 416 120 9 Dont know 77 022
AAU113_00020 Health insurance coverage compared to a year ago
AHICOMP Frequency Percent ------------------------------------------1 Better 2711 785 2 Worse 4490 1301 3 About the same 26681 7728 7 Refused 29 008 8 Not ascertained 419 121 9 Dont know 195 056
AAU127_01010 Skipped medication doses to save money past 12 m
ARXPR_1 Frequency Percent ------------------------------------------1 Yes 2293 664 2 No 31765 9201 7 Refused 22 006 8 Not ascertained 434 126 9 Dont know 11 003
AAU127_02010 Took less medicine to save money past 12 m
ARXPR_2 Frequency Percent ------------------------------------------1 Yes 2418 700 2 No 31635 9163 7 Refused 24 007 8 Not ascertained 439 127 9 Donrsquot know 9 003
AAU127_03010 Delayed filling a prescription to save money past 12 m
ARXPR_3 Frequency Percent ------------------------------------------1 Yes 2960 857 2 No 31089 9005 7 Refused 23 007 8 Not ascertained 440 127 9 Dont know 13 004
181
2012 National Health Interview Survey (NHIS)Sample Adult Public Use File (samadult)
AAU Variables Thursday May 16 2013Unweighted Frequencies
AAU127_04010 Asked doctor for lower cost medication to save money past 12 m
ARXPR_4 Frequency Percent ------------------------------------------1 Yes 6320 1831 2 No 27721 8029 7 Refused 22 006 8 Not ascertained 442 128 9 Dont know 20 006
AAU127_05010 Bought prescription drugs fromanother country to save money past 12 m
ARXPR_5 Frequency Percent ------------------------------------------1 Yes 663 192 2 No 33389 9671 7 Refused 22 006 8 Not ascertained 442 128 9 Dont know 9 003
AAU127_06010 Used alternative therapies to save money past 12 m
ARXPR_6 Frequency Percent ------------------------------------------1 Yes 1454 421 2 No 32591 9440 7 Refused 21 006 8 Not ascertained 442 128 9 Dont know 17 005
AAU135_00000 Time since last saw a dentist
ADNLONG2 Frequency Percent -----------------------------------------------------------------------0 Never 331 096 1 6 months or less 14370 4162 2 More than 6 mos but not more than 1 yr ago 5705 1652 3 More than 1 yr but not more than 2 yrs ago 4498 1303 4 More than 2 yrs but not more than 5 yrs ago 4163 1206 5 More than 5 years ago 4874 1412 7 Refused 31 009 8 Not ascertained 459 133 9 Dont know 94 027
182
2012 National Health Interview Survey (NHIS)Sample Adult Public Use File (samadult)
AAU Variables Thursday May 16 2013Unweighted Frequencies
AAU141_01000 Seentalked to mental health professional past 12 m
AHCSYR1 Frequency Percent ------------------------------------------1 Yes 2766 801 2 No 31240 9049 7 Refused 23 007 8 Not ascertained 480 139 9 Dont know 16 005
AAU141_02000 Seentalked to eye doctor past 12 m
AHCSYR2 Frequency Percent ------------------------------------------1 Yes 13051 3780 2 No 20947 6067 7 Refused 20 006 8 Not ascertained 484 140 9 Dont know 23 007
AAU141_03000 Seentalked to foot doctor past 12 m
AHCSYR3 Frequency Percent ------------------------------------------1 Yes 2656 769 2 No 31350 9080 7 Refused 19 006 8 Not ascertained 485 140 9 Dont know 15 004
AAU141_04000 Seentalked to a chiropractor past 12 m
AHCSYR4 Frequency Percent ------------------------------------------1 Yes 3112 901 2 No 30893 8948 7 Refused 20 006 8 Not ascertained 485 140 9 Dont know 15 004
AAU141_05000 Seentalked to therapist (PTOTetc) past 12 m
AHCSYR5 Frequency Percent ------------------------------------------1 Yes 2985 865 2 No 31014 8983 7 Refused 21 006 8 Not ascertained 486 141 9 Dont know 19 006
183
2012 National Health Interview Survey (NHIS)Sample Adult Public Use File (samadult)
AAU Variables Thursday May 16 2013Unweighted Frequencies
AAU141_06000 Seentalked to a NPPAmidwife past 12 m
AHCSYR6 Frequency Percent ------------------------------------------1 Yes 6561 1900 2 No 27412 7940 7 Refused 22 006 8 Not ascertained 487 141 9 Dont know 43 012
AAU200_00000 Seentalked to OBGYN past 12 m
AHCSYR7 Frequency Percent ------------------------------------------1 Yes 7151 3714 2 No 11787 6122 7 Refused 13 007 8 Not ascertained 280 145 9 Dont know 21 011
Frequency Missing = 15273
AAU211_01000 Seentalked to a medical specialist past 12 m
AHCSYR8 Frequency Percent ------------------------------------------1 Yes 8799 2549 2 No 25189 7296 7 Refused 23 007 8 Not ascertained 490 142 9 Dont know 24 007
AAU211_02000 Seentalked to a general doctor past 12 m
AHCSYR9 Frequency Percent ------------------------------------------1 Yes 22774 6596 2 No 11205 3245 7 Refused 23 007 8 Not ascertained 494 143 9 Dont know 29 008
AAU230_00000 Doctor treats both kids and adults
AHCSYR10 Frequency Percent ------------------------------------------1 Yes 12192 5353 2 No 8494 3730 7 Refused 1 000 8 Not ascertained 1 000 9 Dont know 2086 916
Frequency Missing = 11751
184
2012 National Health Interview Survey (NHIS)Sample Adult Public Use File (samadult)
AAU Variables Thursday May 16 2013Unweighted Frequencies
AAU240_00000 times in ERED past 12 m
AHERNOY2 Frequency Percent -------------------------------------------00 None 26978 7814 01 1 4344 1258 02 2-3 1941 562 03 4-5 404 117 04 6-7 130 038 05 8-9 51 015 06 10-12 72 021 07 13-15 17 005 08 16 or more 38 011 97 Refused 21 006 98 Not ascertained 504 146 99 Dont know 25 007
AAU243_00010 ER visit at night or on weekend
AERVISND Frequency Percent ------------------------------------------1 Yes 4442 6348 2 No 2472 3533 7 Refused 1 001 8 Not ascertained 2 003 9 Dont know 80 114
Frequency Missing = 27528
AAU245_00010 ER visit resulted in hospital admission
AERHOS Frequency Percent ------------------------------------------1 Yes 2300 3287 2 No 4690 6703 7 Refused 1 001 8 Not ascertained 2 003 9 Dont know 4 006
Frequency Missing = 27528
AAU248_01010 ER visit because didnt have another place to go
AERREAS1 Frequency Percent ------------------------------------------1 Yes 462 4442 2 No 578 5558 7 Refused 0 000 8 Not ascertained 0 000 9 Dont know 0 000
Frequency Missing = 33485
185
2012 National Health Interview Survey (NHIS)Sample Adult Public Use File (samadult)
AAU Variables Thursday May 16 2013Unweighted Frequencies
AAU248_02020 ER visit because doctors office or clinic was not open
AERREAS2 Frequency Percent ------------------------------------------1 Yes 486 4673 2 No 551 5298 7 Refused 0 000 8 Not ascertained 0 000 9 Dont know 3 029
Frequency Missing = 33485
AAU248_03030 ER visit because advised by health provider to go
AERREAS3 Frequency Percent ------------------------------------------1 Yes 178 1712 2 No 860 8269 7 Refused 0 000 8 Not ascertained 0 000 9 Dont know 2 019
Frequency Missing = 33485
AAU248_04040 ER visit because problem too serious for doctors officeclinic
AERREAS4 Frequency Percent ------------------------------------------1 Yes 445 4279 2 No 587 5644 7 Refused 0 000 8 Not ascertained 0 000 9 Dont know 8 077
Frequency Missing = 33485
AAU248_05050 ER visit because only hospital could help
AERREAS5 Frequency Percent ------------------------------------------1 Yes 570 5481 2 No 463 4452 7 Refused 0 000 8 Not ascertained 0 000 9 Dont know 7 067
Frequency Missing = 33485
186
2012 National Health Interview Survey (NHIS)Sample Adult Public Use File (samadult)
AAU Variables Thursday May 16 2013Unweighted Frequencies
AAU248_06060 ER visit because it is closest provider
AERREAS6 Frequency Percent ------------------------------------------1 Yes 433 4163 2 No 606 5827 7 Refused 0 000 8 Not ascertained 1 010 9 Dont know 0 000
Frequency Missing = 33485
AAU248_07070 ER visit because it is usual place to get care
AERREAS7 Frequency Percent ------------------------------------------1 Yes 155 1490 2 No 884 8500 7 Refused 0 000 8 Not ascertained 1 010 9 Donrsquot know 0 000
Frequency Missing = 33485
AAU248_08080 Arrived at ER by ambulanceother emergency vehicle
AERREAS8 Frequency Percent ------------------------------------------1 Yes 126 1212 2 No 912 8769 7 Refused 0 000 8 Not ascertained 2 019 9 Donrsquot know 0 000
Frequency Missing = 33485
AAU248_01010 ER visit because didnt have another place to go
AERREA1R Frequency Percent ------------------------------------------1 Yes 2316 4250 2 No 3121 5727 7 Refused 1 002 8 Not ascertained 5 009 9 Dont know 7 013
Frequency Missing = 29075
187
2012 National Health Interview Survey (NHIS)Sample Adult Public Use File (samadult)
AAU Variables Thursday May 16 2013Unweighted Frequencies
AAU248_02020 ER visit because doctors office or clinic was not open
AERREA2R Frequency Percent ------------------------------------------1 Yes 2492 4572 2 No 2936 5387 7 Refused 1 002 8 Not ascertained 6 011 9 Dont know 15 028
Frequency Missing = 29075
AAU248_03030 ER visit because advised by health provider to go
AERREA3R Frequency Percent ------------------------------------------1 Yes 1295 2376 2 No 4143 7602 7 Refused 2 004 8 Not ascertained 6 011 9 Dont know 4 007
Frequency Missing = 29075
AAU248_04040 ER visit because problem too serious for doctors officeclinic
AERREA4R Frequency Percent ------------------------------------------1 Yes 2899 5319 2 No 2521 4626 7 Refused 2 004 8 Not ascertained 6 011 9 Dont know 22 040
Frequency Missing = 29075
AAU248_05050 ER visit because only hospital could help
AERREA5R Frequency Percent ------------------------------------------1 Yes 3510 6440 2 No 1913 3510 7 Refused 2 004 8 Not ascertained 6 011 9 Dont know 19 035
Frequency Missing = 29075
188
2012 National Health Interview Survey (NHIS)Sample Adult Public Use File (samadult)
AAU Variables Thursday May 16 2013Unweighted Frequencies
AAU248_06060 ER visit because it is closest provider
AERREA6R Frequency Percent ------------------------------------------1 Yes 2150 3945 2 No 3281 6020 7 Refused 2 004 8 Not ascertained 6 011 9 Dont know 11 020
Frequency Missing = 29075
AAU248_07070 ER visit because it is usual place to get care
AERREA7R Frequency Percent ------------------------------------------1 Yes 793 1455 2 No 4645 8523 7 Refused 3 006 8 Not ascertained 6 011 9 Donrsquot know 3 006
Frequency Missing = 29075
AAU248_08080 Arrived at ER by ambulanceother emergency vehicle
AERREA8R Frequency Percent ------------------------------------------1 Yes 1011 1855 2 No 4427 8123 7 Refused 2 004 8 Not ascertained 7 013 9 Donrsquot know 3 006
Frequency Missing = 29075
AAU250_00000 Received home care from health professional past 12 m
AHCHYR Frequency Percent ------------------------------------------1 Yes 976 283 2 No 33010 9561 7 Refused 16 005 8 Not ascertained 516 149 9 Dont know 7 002
189
2012 National Health Interview Survey (NHIS)Sample Adult Public Use File (samadult)
AAU Variables Thursday May 16 2013Unweighted Frequencies
AAU260_00000 months of home care past 12 m
AHCHMOYR Frequency Percent -------------------------------------------01-12 months 963 9867 97 Refused 0 000 98 Not ascertained 0 000 99 Dont know 13 133
Frequency Missing = 33549
AAU270_00000 Total number of home visits
AHCHNOY2 Frequency Percent -------------------------------------------01 1 100 1025 02 2-3 116 1189 03 4-5 82 840 04 6-7 69 707 05 8-9 65 666 06 10-12 98 1004 07 13-15 40 410 08 16 or more 392 4016 97 Refused 0 000 98 Not ascertained 1 010 99 Dont know 13 133
Frequency Missing = 33549
AAU280_00000 Total number of office visits past 12 m
AHCNOYR2 Frequency Percent -------------------------------------------00 None 6724 1948 01 1 5860 1697 02 2-3 8492 2460 03 4-5 4670 1353 04 6-7 2275 659 05 8-9 1160 336 06 10-12 2057 596 07 13-15 675 196 08 16 or more 1937 561 97 Refused 35 010 98 Not ascertained 526 152 99 Dont know 114 033
190
2012 National Health Interview Survey (NHIS)Sample Adult Public Use File (samadult)
AAU Variables Thursday May 16 2013Unweighted Frequencies
AAU290_00000 Surgerysurgical procedure past 12 m
ASRGYR Frequency Percent ------------------------------------------1 Yes 4292 1243 2 No 29671 8594 7 Refused 21 006 8 Not ascertained 532 154 9 Dont know 9 003
AAU300_00000 of surgeries past 12 m
ASRGNOYR Frequency Percent -------------------------------------------01-94 1-94 times 4288 9991 95 95+ times 0 000 97 Refused 0 000 98 Not ascertained 1 002 99 Dont know 3 007
Frequency Missing = 30233
AAU305_00000 Time since last seentalked to health professional
AMDLONGR Frequency Percent -----------------------------------------------------------------------0 Never 496 144 1 6 months or less 23040 6673 2 More than 6 mos but not more than 1 yr ago 4858 1407 3 More than 1 yr but not more than 2 yrs ago 2758 799 4 More than 2 yrs but not more than 5 yrs ago 1694 491 5 More than 5 years ago 1045 303 7 Refused 32 009 8 Not ascertained 549 159 9 Dont know 53 015
AAU306_00010 Place of last medical visit
AVISLAST Frequency Percent ---------------------------------------------------------1 Clinic or health center 8056 2412 2 Doctors office or HMO 21739 6510 3 Hospital emergency room 1601 479 4 Hospital outpatient department 820 246 5 Urgent care center 412 123 6 Some other place 624 187 7 Refused 17 005 8 Not ascertained 7 002 9 Dont know 119 036
Frequency Missing = 1130
191
2012 National Health Interview Survey (NHIS)Sample Adult Public Use File (samadult)
AAU Variables Thursday May 16 2013Unweighted Frequencies
AAU306_00021 General doctor seen on last visit
ALASTYP1 Frequency Percent ------------------------------------------1 Mentioned 22438 7183 2 Not mentioned 8729 2794 7 Refused 3 001 8 Not ascertained 3 001 9 Dont know 66 021
Frequency Missing = 3286
AAU306_00022 Specialist seen on last visit
ALASTYP2 Frequency Percent ------------------------------------------1 Mentioned 6946 2224 2 Not mentioned 24221 7753 7 Refused 3 001 8 Not ascertained 3 001 9 Dont know 66 021
Frequency Missing = 3286
AAU306_00023 Nurse practitionerphysician assistant seen on last visit
ALASTYP3 Frequency Percent ------------------------------------------1 Mentioned 2207 706 2 Not mentioned 28960 9270 7 Refused 3 001 8 Not ascertained 3 001 9 Dont know 66 021
Frequency Missing = 3286
AAU306_00024 Other health provider seen on last visit
ALASTYP4 Frequency Percent ------------------------------------------1 Mentioned 516 165 2 Not mentioned 30651 9812 7 Refused 3 001 8 Not ascertained 3 001 9 Dont know 66 021
Frequency Missing = 3286
192
2012 National Health Interview Survey (NHIS)Sample Adult Public Use File (samadult)
AAU Variables Thursday May 16 2013Unweighted Frequencies
AAU306_00025 Other Health professional seen (verbatim)
ALASTVRB Frequency Percent ------------------------------------------Verbatim response 516 10000
Frequency Missing = 34009
AAU307_01010 Appointment wait time-number
AVISAPN2 ------------------------------------------------------------------------00 Same daywalk-in apptno appt made01-95 1-95 96 Routine apptappt arranged on previous visitrecd appt reminder card97 Refused 98 Not ascertained 99 Dont know
Frequency Missing = 3286
AAU307_01010 Appointment wait time-number
Frequency Percent ---------------------
6545 2095 19302 6179 3810 1220 37 012 15 005
1530 490
Frequency Missing= 3286
AAU307_02020 Appointment wait time-time period
AVISAPT2 Frequency Percent ------------------------------------------1 Days 11067 5309 2 Weeks 6153 2952 3 Months 2441 1171 7 Refused 2 001 8 Not ascertained 15 007 9 Donrsquot know 1169 561
Frequency Missing = 13678
193
2012 National Health Interview Survey (NHIS)Sample Adult Public Use File (samadult)
AAU Variables Thursday May 16 2013Unweighted Frequencies
AAU308_01010 Time in waiting room-number
AWAITRMN Frequency Percent -------------------------------------------00 No time 2110 635 01-96 1-96 30004 9023 97 Refused 30 009 98 Not ascertained 20 006 99 Donrsquot know 1088 327
Frequency Missing = 1273
AAU308_02020 Time in waiting room-time period
AWAITRMT Frequency Percent ------------------------------------------1 Minutes 26795 8612 2 Hours 3451 1109 7 Refused 0 000 8 Not ascertained 20 006 9 Donrsquot know 846 272
Frequency Missing = 3413
AAU309_00010 Looked up health information on Internet past 12 m
HIT1A Frequency Percent ------------------------------------------1 Yes 13621 3945 2 No 20265 5870 7 Refused 32 009 8 Not ascertained 589 171 9 Donrsquot know 18 005
AAU309_00020 Filled a prescription on Internet past 12 m
HIT2A Frequency Percent ------------------------------------------1 Yes 2094 607 2 No 31799 9210 7 Refused 28 008 8 Not ascertained 594 172 9 Dont know 10 003
AAU309_00030 Scheduled medical appointment on Internet past 12 m
HIT3A Frequency Percent ------------------------------------------1 Yes 1463 424 2 No 32428 9393 7 Refused 29 008 8 Not ascertained 596 173 9 Dont know 9 003
194
2012 National Health Interview Survey (NHIS)Sample Adult Public Use File (samadult)
AAU Variables Thursday May 16 2013Unweighted Frequencies
AAU309_00040 Communicated with health care provider by email past 12 m
HIT4A Frequency Percent ------------------------------------------1 Yes 1800 521 2 No 32087 9294 7 Refused 28 008 8 Not ascertained 596 173 9 Donrsquot know 14 004
AAU309_00050 Used chat groups to learn about health topics past 12 m
HIT5A Frequency Percent ------------------------------------------1 Yes 982 284 2 No 32908 9532 7 Refused 28 008 8 Not ascertained 596 173 9 Donrsquot know 11 003
AAU310_00000 Flu shot past 12 m
SHTFLU2 Frequency Percent ------------------------------------------1 Yes 12996 3764 2 No 20794 6023 7 Refused 36 010 8 Not ascertained 621 180 9 Dont know 78 023
AAU312_01000 Month of most recent flu shot
ASHFLUM2 Frequency Percent -------------------------------------------01 January02 February03 March 04 April05 May06 June 07 July08 August09 September10 October 11 November 12 December 97 Refused 98 Not ascertained 99 Dont know
416 320 251 193 140 108 69 053 64 049 60 046 71 055 311 239 2106 1620 5748 4423 2656 2044 617 475 6 005 2 002
479 369
Frequency Missing = 21529
195
2012 National Health Interview Survey (NHIS)Sample Adult Public Use File (samadult)
AAU Variables Thursday May 16 2013Unweighted Frequencies
AAU312_02000 Year of most recent flu shot
ASHFLUY2 Frequency Percent ---------------------------------------------Year 12956 9969 9997 Refused 6 005 9998 Not ascertained 3 002 9999 Dont know 31 024
Frequency Missing = 21529
AAU313_00000 Flu shot beforeduring your currentpregnancy interviewed Jan-Mar or Aug-Dec 2012
FLUSHPG1 Frequency Percent ------------------------------------------------1 Before this pregnancy 29 3816 2 During this pregnancy 47 6184 7 Refused 0 000 8 Not ascertained 0 000 9 Dont know 0 000
Frequency Missing = 34449
AAU314_00000 Flu shot beforeduringafter a pregnancy
FLUSHPG2 Frequency Percent ------------------------------------------------1 Before this pregnancy 32 1633 2 During this pregnancy 104 5306 3 After this pregnancy 58 2959 7 Refused 0 000 8 Not ascertained 1 051 9 Dont know 1 051
Frequency Missing = 34329
AAU315_00000 Flu nasal spray past 12 m
SPRFLU2 Frequency Percent ------------------------------------------1 Yes 221 064 2 No 33592 9730 7 Refused 32 009 8 Not ascertained 630 182 9 Dont know 50 014
196
2012 National Health Interview Survey (NHIS)Sample Adult Public Use File (samadult)
AAU Variables Thursday May 16 2013Unweighted Frequencies
AAU318_01000 Month of most recent flu nasal spray
ASPFLUM2 Frequency Percent -------------------------------------------01 January 10 452 02 February 8 362 03 March 6 271 04 April 3 136 05 May 3 136 06 June 6 271 07 July 4 181 08 August 13 588 09 September 23 1041 10 October 59 2670 11 November 62 2805 12 December 12 543 97 Refused 0 000 98 Not ascertained 0 000 99 Dont know 12 543
Frequency Missing = 34304
AAU318_02000 Year of most recent flu nasal spray
ASPFLUY2 Frequency Percent ---------------------------------------------Year 219 9910 9997 Refused 0 000 9998 Not ascertained 0 000 9999 Dont know 2 090
Frequency Missing = 34304
AAU320_00000 Pneumonia shot (EVER)
SHTPNUYR Frequency Percent ------------------------------------------1 Yes 7454 2159 2 No 25540 7398 7 Refused 33 010 8 Not ascertained 641 186 9 Dont know 857 248
AAU330_00000 Ever had chickenpox
APOX Frequency Percent ------------------------------------------1 Yes 25573 7407 2 No 6853 1985 7 Refused 33 010 8 Not ascertained 654 189 9 Dont know 1412 409
197
2012 National Health Interview Survey (NHIS)Sample Adult Public Use File (samadult)
AAU Variables Thursday May 16 2013Unweighted Frequencies
AAU340_00000 Chickenpox past 12 m
APOX12MO Frequency Percent ------------------------------------------1 Yes 104 041 2 No 25466 9958 7 Refused 0 000 8 Not ascertained 0 000 9 Dont know 3 001
Frequency Missing = 8952
AAU350_00000 Ever had hepatitis
AHEP Frequency Percent ------------------------------------------1 Yes 1047 303 2 No 32681 9466 7 Refused 39 011 8 Not ascertained 660 191 9 Dont know 98 028
AAU360_00000 Ever lived w someone w hepatitis
AHEPLIV Frequency Percent ------------------------------------------1 Yes 1291 386 2 No 31326 9357 7 Refused 37 011 8 Not ascertained 663 198 9 Dont know 161 048
Frequency Missing = 1047
AAU370_00000 Hepatitis B vaccine (EVER)
SHTHEPB Frequency Percent ------------------------------------------1 Yes 10242 2967 2 No 21637 6267 7 Refused 42 012 8 Not ascertained 668 193 9 Dont know 1936 561
198
2012 National Health Interview Survey (NHIS)Sample Adult Public Use File (samadult)
AAU Variables Thursday May 16 2013Unweighted Frequencies
AAU380_00000 doses of hepatitis B vaccine received
SHEPDOS Frequency Percent -----------------------------------------------------1 Received at least 3 doses 8099 7908 2 Received less than 3 doses 1234 1205 7 Refused 1 001 8 Not ascertained 0 000 9 Dont know 908 887
Frequency Missing = 24283
AAU390_00010 Hepatitis A vaccine (EVER)
SHTHEPA Frequency Percent ------------------------------------------1 Yes 4546 1317 2 No 26432 7656 7 Refused 44 013 8 Not ascertained 672 195 9 Dont know 2831 820
AAU400_00010 shots of hepatitis A vaccine received
SHEPANUM Frequency Percent ----------------------------------------------01-95 shots 2848 6265 96 Received all shots 655 1441 97 Refused 6 013 98 Not ascertained 0 000 99 Dont know 1037 2281
Frequency Missing = 29979
AAU410_00010 Ever had the Zoster or Shingles vaccine
SHINGLES Frequency Percent ------------------------------------------1 Yes 2229 1362 2 No 13612 8320 7 Refused 15 009 8 Not ascertained 325 199 9 Dont know 179 109
Frequency Missing = 18165
199
2012 National Health Interview Survey (NHIS)Sample Adult Public Use File (samadult)
AAU Variables Thursday May 16 2013Unweighted Frequencies
AAU420_00010 Tetanus shot in the past 10 years
SHTTD Frequency Percent ------------------------------------------1 Yes 19723 5713 2 No 12920 3742 7 Refused 36 010 8 Not ascertained 677 196 9 Dont know 1169 339
AAU430_00010 Tetanus shot given in 2005 or later
SHTTD05 Frequency Percent ------------------------------------------1 Yes 13285 6736 2 No 5161 2617 7 Refused 3 002 8 Not ascertained 2 001 9 Dont know 1272 645
Frequency Missing = 14802
AAU440_00010 Vaccine included pertussiswhooping cough
SHTTDAP2 Frequency Percent -------------------------------------------------------1 Yes-included pertussis 3142 2365 2 No-did not include pertussis 1613 1214 3 Doctor did not say 7057 5311 7 Refused 4 003 8 Not ascertained 2 002 9 Dont know 1470 1106
Frequency Missing = 21237
AAU442_00010 Ever heard of HPV
HPVHRD Frequency Percent ------------------------------------------1 Yes 16593 6113 2 No 9899 3647 7 Refused 31 011 8 Not ascertained 542 200 9 Dont know 78 029
Frequency Missing = 7382
200
2012 National Health Interview Survey (NHIS)Sample Adult Public Use File (samadult)
AAU Variables Thursday May 16 2013Unweighted Frequencies
AAU444_00010 Ever heard of HPV vaccines or shots
SHHPVHD1 Frequency Percent ------------------------------------------1 Yes 13701 5048 2 No 12774 4706 7 Refused 30 011 8 Not ascertained 547 202 9 Dont know 91 034
Frequency Missing = 7382
AAU446_00010 Ever received HPV shotvaccine
SHTHPV1 Frequency Percent ----------------------------------------------------1 Yes 1273 469 2 No 24985 9205 3 Doctor refused when asked 39 014 7 Refused 33 012 8 Not Ascertained 548 202 9 Dont know 265 098
Frequency Missing = 7382
AAU448_00010 Number of HPV shots received
SHHPVDOS Frequency Percent -------------------------------------------01-49 1-49 shots 1095 8602 50 50+ 2 016 96 All shots 95 746 97 Refused 1 008 98 Not Ascertained 0 000 99 Dont know 80 628
Frequency Missing = 33252
AAU450_00010 Ever told you had any kind of chroniclong-term liver condition
LIVEV Frequency Percent ------------------------------------------1 Yes 415 120 2 No 33342 9657 7 Refused 35 010 8 Not ascertained 698 202 9 Dont know 35 010
201
2012 National Health Interview Survey (NHIS)Sample Adult Public Use File (samadult)
AAU Variables Thursday May 16 2013Unweighted Frequencies
AAU460_00010 Ever traveled outside USA since 1995 (ExcludingEurope Japan Australia New Zealand and Canada)
TRAVEL Frequency Percent ------------------------------------------1 Yes 10808 3130 2 No 22924 6640 7 Refused 46 013 8 Not ascertained 709 205 9 Dont know 38 011
AAU465_00010 Work or volunteer in a health care setting
WRKHLTH2 Frequency Percent ------------------------------------------1 Yes 2918 845 2 No 30855 8937 7 Refused 32 009 8 Not ascertained 712 206 9 Dont know 8 002
AAU470_00010 Direct contact with patients
WRKDIR Frequency Percent ------------------------------------------1 Yes 1838 6299 2 No 1079 3698 7 Refused 0 000 8 Not ascertained 0 000 9 Dont know 1 003
Frequency Missing = 31607
AAU500_00010 Blood pressure checked by doctornursehealthprofessional past 12 m
APSBPCHK Frequency Percent ------------------------------------------1 Yes 27638 8005 2 No 6110 1770 7 Refused 32 009 8 Not ascertained 716 207 9 Dont know 29 008
202
2012 National Health Interview Survey (NHIS)Sample Adult Public Use File (samadult)
AAU Variables Thursday May 16 2013Unweighted Frequencies
AAU510_00010 Cholesterol checked by doctornursehealthprofessional past 12 m
APSCHCHK Frequency Percent ------------------------------------------1 Yes 21254 6156 2 No 12225 3541 7 Refused 34 010 8 Not ascertained 716 207 9 Dont know 296 086
AAU520_00010 Fasting test for high blood sugardiabetes past 12 m
APSBSCHK Frequency Percent ------------------------------------------1 Yes 15353 4447 2 No 18118 5248 7 Refused 34 010 8 Not ascertained 719 208 9 Dont know 301 087
AAU530_00010 Pap smeartest past 12 m
APSPAP Frequency Percent ------------------------------------------1 Yes 9460 4914 2 No 9266 4813 7 Refused 33 017 8 Not ascertained 423 220 9 Dont know 70 036
Frequency Missing = 15273
AAU540_00010 Mammogram past 12 m
APSMAM Frequency Percent ------------------------------------------1 Yes 7028 4483 2 No 8234 5253 7 Refused 30 019 8 Not ascertained 341 218 9 Dont know 43 027
Frequency Missing = 18849
203
2012 National Health Interview Survey (NHIS)Sample Adult Public Use File (samadult)
AAU Variables Thursday May 16 2013Unweighted Frequencies
AAU550_00010 Test for colon cancer past 12 m
APSCOL Frequency Percent ------------------------------------------1 Yes 4040 1829 2 No 17471 7909 7 Refused 30 014 8 Not ascertained 475 215 9 Donrsquot know 75 034
Frequency Missing = 12434
AAU560_00010 Doctorhealth professional talked to you about diet past 12 m
APSDIET Frequency Percent ------------------------------------------1 Yes 8902 2578 2 No 24813 7187 7 Refused 39 011 8 Not ascertained 731 212 9 Dont know 40 012
AAU570_00010 Doctorhealth professionaltalked to you about smoking past 12 m
APSSMKC Frequency Percent ------------------------------------------1 Yes 3243 5039 2 No 3058 4751 7 Refused 5 008 8 Not ascertained 121 188 9 Donrsquot know 9 014
Frequency Missing = 28089
AAU580_00010 Have family member who needed ADL help for 1+ yrs
LTCFAM Frequency Percent ------------------------------------------1 Yes 1641 1071 2 No 13287 8672 7 Refused 24 016 8 Not ascertained 348 227 9 Donrsquot know 21 014
Frequency Missing = 19204
204
2012 National Health Interview Survey (NHIS)Sample Adult Public Use File (samadult)
AAU Variables Thursday May 16 2013Unweighted Frequencies
AAU582_00010 How likely you will need ADL help
LTCHELP Frequency Percent --------------------------------------------1 Very likely 1882 1228 2 Somewhat likely 3684 2405 3 Somewhat unlikely 3277 2139 4 Very unlikely 4917 3209 7 Refused 45 029 8 Not ascertained 355 232 9 Dont know 1161 758
Frequency Missing = 19204
AAU584_01010 Family would provide ADL help
LTCWHO1 Frequency Percent ------------------------------------------1 Mentioned 9956 6498 2 Not mentioned 3527 2302 7 Refused 41 027 8 Not ascertained 360 235 9 Donrsquot know 1437 938
Frequency Missing = 19204
AAU584_02010 Hire someone to provide ADL help
LTCWHO2 Frequency Percent ------------------------------------------1 Mentioned 1495 976 2 Not mentioned 11988 7825 7 Refused 41 027 8 Not ascertained 360 235 9 Donrsquot know 1437 938
Frequency Missing = 19204
AAU584_03010 Home health care organization would provide ADL help
LTCWHO3 Frequency Percent ------------------------------------------1 Mentioned 1446 944 2 Not mentioned 12037 7857 7 Refused 41 027 8 Not ascertained 360 235 9 Donrsquot know 1437 938
Frequency Missing = 19204
205
2012 National Health Interview Survey (NHIS)Sample Adult Public Use File (samadult)
AAU Variables Thursday May 16 2013Unweighted Frequencies
AAU584_04010 Nursing homeassisted living would provide ADL help
LTCWHO4 Frequency Percent ------------------------------------------1 Mentioned 1382 902 2 Not mentioned 12101 7898 7 Refused 41 027 8 Not ascertained 360 235 9 Donrsquot know 1437 938
Frequency Missing = 19204
AAU584_05010 Other would provide ADL help
LTCWHO5 Frequency Percent ------------------------------------------1 Mentioned 609 397 2 Not mentioned 12874 8403 7 Refused 41 027 8 Not ascertained 360 235 9 Donrsquot know 1437 938
Frequency Missing = 19204
AAU600_00010 Tried to purchase health insurance directly past 3 yrs
AINDINS Frequency Percent ------------------------------------------1 Yes 2785 807 2 No 30912 8954 7 Refused 35 010 8 Not ascertained 757 219 9 Donrsquot know 36 010
AAU600_00020 Purchased health insurance directly past 3 yrs
AINDPRCH Frequency Percent ------------------------------------------1 Yes 1705 6122 2 No 1078 3871 7 Refused 0 000 8 Not ascertained 0 000 9 Donrsquot know 2 007
Frequency Missing = 31740
206
2012 National Health Interview Survey (NHIS)Sample Adult Public Use File (samadult)
AAU Variables Thursday May 16 2013Unweighted Frequencies
AAU600_00030 For whom was health insurance purchased past 3 yrs
AINDWHO Frequency Percent -------------------------------------------------1 Self 1143 6704 2 Someone else in family 51 299 3 Both 511 2997 7 Refused 0 000 8 Not ascertained 0 000 9 Donrsquot know 0 000
Frequency Missing = 32820
AAU600_00040 How difficult to find health insurance for coverage needed past 3 yrs
AINDDIF1 Frequency Percent -----------------------------------------------1 Very difficult 245 1437 2 Somewhat difficult 390 2287 3 Not at all difficult 1062 6229 7 Refused 1 006 8 Not ascertained 1 006 9 Donrsquot know 6 035
Frequency Missing = 32820
AAU600_00050 How difficult to find affordable health insurance past 3 yrs
AINDDIF2 Frequency Percent -----------------------------------------------1 Very difficult 400 2346 2 Somewhat difficult 508 2979 3 Not at all difficult 788 4622 7 Refused 1 006 8 Not ascertained 1 006 9 Dont know 7 041
Frequency Missing = 32820
AAU600_01060 Turned down for coverage past 3 yrs
AINDENY1 Frequency Percent ------------------------------------------1 Yes 145 850 2 No 1547 9073 7 Refused 1 006 8 Not ascertained 1 006 9 Donrsquot know 11 065
Frequency Missing = 32820
207
2012 National Health Interview Survey (NHIS)Sample Adult Public Use File (samadult)
AAU Variables Thursday May 16 2013Unweighted Frequencies
AAU600_02060 Charged higher price for coverage because of health past 3 yrs
AINDENY2 Frequency Percent ------------------------------------------1 Yes 232 1361 2 No 1437 8428 7 Refused 1 006 8 Not ascertained 1 006 9 Donrsquot know 34 199
Frequency Missing = 32820
AAU600_03060 Specific health problem excluded from coverage past 3 yrs
AINDENY3 Frequency Percent ------------------------------------------1 Yes 183 1073 2 No 1482 8692 7 Refused 3 018 8 Not ascertained 1 006 9 Donrsquot know 36 211
Frequency Missing = 32820
AAU601_01070 Didnrsquot buy plan because turned down
AINDNOT1 Frequency Percent ------------------------------------------1 Mentioned 124 1150 2 Not mentioned 952 8831 7 Refused 1 009 8 Not ascertained 0 000 9 Donrsquot know 1 009
Frequency Missing = 33447
AAU601_02070 Didnrsquot buy plan because of cost
AINDNOT2 Frequency Percent ------------------------------------------1 Mentioned 805 7468 2 Not mentioned 271 2514 7 Refused 1 009 8 Not ascertained 0 000 9 Donrsquot know 1 009
Frequency Missing = 33447
208
2012 National Health Interview Survey (NHIS)Sample Adult Public Use File (samadult)
AAU Variables Thursday May 16 2013Unweighted Frequencies
AAU601_03070 Didnrsquot buy plan because of pre-existing condition
AINDNOT3 Frequency Percent ------------------------------------------1 Mentioned 114 1058 2 Not mentioned 962 8924 7 Refused 1 009 8 Not ascertained 0 000 9 Donrsquot know 1 009
Frequency Missing = 33447
AAU601_04070 Didnrsquot buy plan because got health insurance from other source
AINDNOT4 Frequency Percent ------------------------------------------1 Mentioned 51 473 2 Not mentioned 1025 9508 7 Refused 1 009 8 Not ascertained 0 000 9 Donrsquot know 1 009
Frequency Missing = 33447
AAU601_05070 Other reason didnt buy plan
AINDNOT5 Frequency Percent ------------------------------------------1 Mentioned 64 594 2 Not mentioned 1012 9388 7 Refused 1 009 8 Not ascertained 0 000 9 Donrsquot know 1 009
Frequency Missing = 33447
AAU700_00000 Ever been tested for HIV
HIVTST1 Frequency Percent ------------------------------------------1 Yes 11974 3468 2 No 21228 6149 7 Refused 63 018 8 Not ascertained 773 224 9 Dont know 487 141
209
2012 National Health Interview Survey (NHIS)Sample Adult Public Use File (samadult)
AWB Variables Thursday May 16 2013Unweighted Frequencies
AWB010_00000 Internet use
AWEBUSE Frequency Percent ------------------------------------------1 Yes 21967 6363 2 No 11250 3259 7 Refused 76 022 8 Not ascertained 1225 355 9 Dont know 7 002
AWB020_01000 Frequency internet use of units
AWEBOFNO Frequency Percent --------------------------------------------001-995 1-995 21708 9882 997 Refused 81 037 998 Not ascertained 6 003 999 Dont know 172 078
Frequency Missing = 12558
AWB020_02000 Frequency internet use Time units
AWEBOFTP Frequency Percent ------------------------------------------1 Per day 17129 7798 2 Per week 3834 1745 3 Per month 623 284 4 Per year 120 055 7 Refused 81 037 8 Not ascertained 6 003 9 Dont know 174 079
Frequency Missing = 12558
AWB030_00000 Email use
AWEBEML Frequency Percent ------------------------------------------1 Yes 20038 5804 2 No 13094 3793 7 Refused 141 041 8 Not ascertained 1235 358 9 Dont know 17 005
210
2012 National Health Interview Survey (NHIS)Sample Adult Public Use File (samadult)
AWB Variables Thursday May 16 2013Unweighted Frequencies
AWB050_01000 Frequency email use of units
AWEBMNO Frequency Percent --------------------------------------------001-995 1-995 11557 9966 997 Refused 6 005 998 Not ascertained 1 001 999 Dont know 33 028
Frequency Missing = 22928
AWB050_02000 Frequency email use Time units
AWEBMTP Frequency Percent ------------------------------------------1 Per day 9019 7777 2 Per week 2174 1875 3 Per month 319 275 4 Per year 45 039 7 Refused 6 005 8 Not ascertained 1 001 9 Dont know 33 028
Frequency Missing = 22928
- IDN - P 1-2
- UCF - P 3
- HHC - P 4-5
- FRT - P 6
- FID - P 7
- AID - P 8
- FDB - P 9
- ASD - P 10-14
- ACN - P 15-60
- ACD - P 61-96
- AHS - P 97-160
- AHB - P 161-172
- AAU - P 173-208
- AWB - P 209-210
-

2
2012 National Health Interview Survey (NHIS)Sample Adult Public Use File (samadult)
IDN Variables Thursday May 16 2013Unweighted Frequencies
IDN000_30000 Interview Month
INTV_MON Frequency Percent -------------------------------------01 January 2545 737 02 February 2492 722 03 March 2571 745 04 April 3200 927 05 May 3027 877 06 June 2960 857 07 July 3084 893 08 August 2899 840 09 September 2796 810 10 October 2954 856 11 November 2965 859 12 December 3032 878
IDN000_35000 Family Number
FMX Frequency Percent ---------------------------------------------------01-25 Family number 1 - 25 34525 10000
IDN000_40000 Person Number (Within family)
FPX Frequency Percent ------------------------------------------------------01-25 Person number 1 thru 25 34525 10000
IDN000_65000 Weight - Interim Annual
WTIA_SA Frequency Percent ----------------------------------------Range of Values 34525 10000
IDN000_70000 Weight - Final Annual
WTFA_SA Frequency Percent ----------------------------------------Range of Values 34525 10000
3
2012 National Health Interview Survey (NHIS)Sample Adult Public Use File (samadult)
UCF Variables Thursday May 16 2013Unweighted Frequencies
UCF000_00000 Region
REGION Frequency Percent ------------------------------------1 Northeast 5774 1672 2 Midwest 7193 2083 3 South 12536 3631 4 West 9022 2613
UCF000_00000 Pseudo-stratum for public use file variance estimation
STRAT_P Frequency Percent --------------------------------001-300 34525 10000
UCF000_00000 Pseudo-PSU for public use file variance estimation
PSU_P Frequency Percent ------------------------------01-02 34525 10000
4
2012 National Health Interview Survey (NHIS)Sample Adult Public Use File (samadult)
HHC Variables Thursday May 16 2013Unweighted Frequencies
HHC110_00000 Sex
SEX Frequency Percent ---------------------------------1 Male 15273 4424 2 Female 19252 5576
HHC180_00000 Hispanic subgroup detail
HISPAN_I Frequency Percent -------------------------------------------------------------------------00 Multiple Hispanic 110 032 01 Puerto Rico 578 167 02 Mexican 2226 645 03 Mexican-American 1358 393 04 CubanCuban American 291 084 05 Dominican (Republic) 189 055 06 Central or South American 945 274 07 Other Latin American type not specified 10 003 08 Other Spanish 152 044 09 HispanicLatinoSpanish non-specific type 0 000 10 HispanicLatinoSpanish type refused 0 000 11 HispanicLatinoSpanish type not ascertained 0 000 12 Not HispanicSpanish origin 28666 8303
HHC200_01000 OMB groups wmultiple race
RACERPI2 Frequency Percent -----------------------------------------------------------------------01 White only 25939 7513 02 BlackAfrican American only 5319 1541 03 AIAN only 349 101 04 Asian only 2183 632 05 Race group not releasable (See file layout) 76 022 06 Multiple race 659 191
HHC200_01000 Race coded to singlemultiple race group
MRACRPI2 Frequency Percent -------------------------------------------------------------------------01 White 26214 7593 02 BlackAfrican American 5452 1579 03 Indian (American) Alaska Native 413 120 09 Asian Indian 408 118 10 Chinese 449 130 11 Filipino 518 150 15 Other Asian (See file layout) 849 246 16 Primary race not releasable (See file layout) 102 030 17 Multiple race no primary race selected 120 035
5
2012 National Health Interview Survey (NHIS)Sample Adult Public Use File (samadult)
HHC Variables Thursday May 16 2013Unweighted Frequencies
HHC200_01000 Race coded to singlemultiple race group
MRACBPI2 Frequency Percent ----------------------------------------------------------------------01 White 24345 7051 02 BlackAfrican American 5340 1547 03 Indian (American) (includes Eskimo Aleut) 355 103 06 Chinese 448 130 07 Filipino 498 144 12 Asian Indian 405 117 16 Other race (See file layout) 2963 858 17 Multiple race no primary race selected 171 050
HHC420_00000 Age
AGE_P Frequency Percent -----------------------------------------00 Under 1 year 0 000 01-84 1-84 years 33566 9722 85 85+ years 959 278
6
2012 National Health Interview Survey (NHIS)Sample Adult Public Use File (samadult)
FRT Variables Thursday May 16 2013Unweighted Frequencies
FRT002_00000 Adult Functioning and Disability flag
AFD_FLG Frequency Percent ---------------------------------------------------------------------------1 Sample Adult selected to receive AFD section 8781 5053 2 Sample Adult not selected to receive AFD section 8597 4947
Frequency Missing = 17147
7
2012 National Health Interview Survey (NHIS)Sample Adult Public Use File (samadult)
FID Variables Thursday May 16 2013Unweighted Frequencies
FID250_00000 Marital Status
R_MARITL Frequency Percent ----------------------------------------------------------------0 Under 14 years 0 000 1 Married - spouse in household 14371 4162 2 Married - spouse not in household 559 162 3 Married - spouse in household unknown 0 000 4 Widowed 3285 951 5 Divorced 4798 1390 6 Separated 1041 302 7 Never married 8270 2395 8 Living with partner 2123 615 9 Unknown marital status 78 023
8
2012 National Health Interview Survey (NHIS)Sample Adult Public Use File (samadult)
AID Variables Thursday May 16 2013Unweighted Frequencies
AID005_00000 Sample adult status
PROXYSA Frequency Percent ----------------------------------------------------------------------------1 Physical or mental condition prohibits responding 468 136 2 Sample adult is able to respond 33413 9678 3 Unknown 644 187
AID010_00000 Knowledgeable proxy for Sample Adult available
PROX1 Frequency Percent ------------------------------1 Yes 468 10000 2 No 0 000
Frequency Missing = 34057
AID015_00000 Relationship of SA proxy to SA
PROX2 Frequency Percent -----------------------------------------------------------------1 Relative who lives in household 383 8184 2 Relative who doesnt live in household 51 1090 3 Other caregiver 18 385 4 Other 16 342 7 Refused 0 000 8 Not ascertained 0 000 9 Dont know 0 000
Frequency Missing = 34057
AID550_00000 Late Sample Adult interviews
LATEINTA -------------------------------------------------------------------------1 Started Sample Adult Core 2+ weeks after the initial interview2 Started Sample Adult Core less than 2 weeks after the initial interview
AID550_00000 Late Sample Adult interviews
Frequency Percent ---------------------
2262 655 32263 9345
--------------------------------------------------------------------------------
9
2012 National Health Interview Survey (NHIS)Sample Adult Public Use File (samadult)
FDB Variables Thursday May 16 2013Unweighted Frequencies
FDB001_00000 Disability Questions Test flag
FDRN_FLG Frequency Percent
1 Families selected to receive ADB (sample adults) and CDB 17147 4967 (sample children 1-17 years) sections2 Families selected to receive FDB (all persons 1 year and 17378 5033 older) sections
2012 National Health Interview Survey (NHIS) 10 Sample Adult Public Use File (samadult)
ASD Variables Thursday May 16 2013Unweighted Frequencies
ASD062_00000 Corrected employment status last week
DOINGLWA Frequency--------------------------------------------------------------------------1 Working for pay at a job or business 19012 2 With a job or business but not at work 741 3 Looking for work 2077 4 Working but not for pay at a family-owned job or business 285 5 Not working at a job or business and not looking for work 12385 7 Refused 21 8 Not ascertained 0 9 Dont know 4
ASD062_00000 Corrected employment status last week
DOINGLWA Percent -------------------------------------------------------------------------1 Working for pay at a job or business 5507 2 With a job or business but not at work 215 3 Looking for work 602 4 Working but not for pay at a family-owned job or business 083 5 Not working at a job or business and not looking for work 3587 7 Refused 006 8 Not ascertained 000 9 Dont know 001
ASD065_00000 Main reason for not working last week
WHYNOWKA Frequency Percent -------------------------------------------------------------------------01 Taking care of house or family 1843 1404 02 Going to school 872 664 03 Retired 6445 4910 04 On a planned vacation from work 315 240 05 On family or maternity leave 75 057 06 Temporarily unable to work for health reasons 319 243 07 Have job or contract and off-season 148 113 08 On layoff 202 154 09 Disabled 2511 1913 10 Other 392 299 97 Refused 0 000 98 Not ascertained 0 000 99 Dont know 4 003
Frequency Missing = 21399
--------------------------------------------------------------------------------
--------------------------------------------------------------------------------
--------------------------------------------------------------------------------
--------------------------------------------------------------------------------
11
2012 National Health Interview Survey (NHIS)Sample Adult Public Use File (samadult)
ASD Variables Thursday May 16 2013Unweighted Frequencies
ASD066_00000 Ever worked
EVERWRK Frequency Percent ------------------------------------------1 Yes 12529 8648 2 No 1940 1339 7 Refused 13 009 8 Not ascertained 0 000 9 Dont know 5 003
Frequency Missing = 20038
ASD080_00000 Detailed industry classification(based on 2007 NAICS codes from Census)
INDSTRN1 Frequency Percent
See Industry Appendix in file layout at the end of the 32567 10000 Sample Adult Documentation
Frequency Missing = 1958
ASD080_00000 Simple industry classification(based on 2007 NAICS Codes from Census)
INDSTRN2 Frequency Percent
See Industry Appendix in file layout at the end of the 32567 10000 Sample Adult Documentation
Frequency Missing = 1958
ASD090_00000 Detailed occupation classification(based on 2010 SOC codes from Census)
OCCUPN1 Frequency Percent
See Occupation Appendix in file layout at the end of the 32567 10000 Sample Adult documentation
Frequency Missing = 1958
ASD090_00000 Simple occupation classification(based on 2010 SOC codes from Census)
OCCUPN2 Frequency Percent
See Occupation Appendix in file layout at the end of the 32567 10000 Sample Adult documentation
Frequency Missing = 1958
2012 National Health Interview Survey (NHIS) 12 Sample Adult Public Use File (samadult)
ASD Variables Thursday May 16 2013Unweighted Frequencies
ASD110_00000 Class of worker
WRKCATA Frequency---------------------------------------------------------------------------1 Employee of a PRIVATE company for wages 24009 2 A FEDERAL government employee 1267 3 A STATE government employee 2222 4 A LOCAL government employee 2164 5 Self-employed in OWN business professional practice or farm 2563 6 Working WITHOUT PAY in a family-owned business or farm 117 7 Refused 100 8 Not ascertained 0 9 Dont know 125
Frequency Missing = 1958
ASD110_00000 Class of worker
WRKCATA Percent --------------------------------------------------------------------------1 Employee of a PRIVATE company for wages 7372 2 A FEDERAL government employee 389 3 A STATE government employee 682 4 A LOCAL government employee 664 5 Self-employed in OWN business professional practice or farm 787 6 Working WITHOUT PAY in a family-owned business or farm 036 7 Refused 031 8 Not ascertained 000 9 Dont know 038
Frequency Missing = 1958
ASD112_00000 Current job an incorporated business
BUSINC1A Frequency Percent ------------------------------------------1 Yes 657 2563 2 No 1884 7351 7 Refused 5 020 8 Not ascertained 0 000 9 Dont know 17 066
Frequency Missing = 31962
13
2012 National Health Interview Survey (NHIS)Sample Adult Public Use File (samadult)
ASD Variables Thursday May 16 2013Unweighted Frequencies
ASD120_00000 Number of employees at work
LOCALL1A Frequency Percent --------------------------------------------------01 1-9 employees 8031 2466 02 10-24 employees 4551 1397 03 25-49 employees 3522 1081 04 50-99 employees 3218 988 05 100-249 employees 3808 1169 06 250-499 employees 2219 681 07 500-999 employees 1390 427 08 1000 employees or more 4213 1294 97 Refused 181 056 98 Not ascertained 0 000 99 Dont know 1434 440
Frequency Missing = 1958
ASD140_02000 Number of years on the job
YRSWRKPA Frequency Percent --------------------------------------------00 Less than 1 year 5048 1550 01-34 years 25788 7918 35 35 or more years 1292 397 97 Refused 210 064 98 Not ascertained 3 001 99 Dont know 226 069
Frequency Missing = 1958
ASD146_00000 Currentmost recent job also longest held job
WRKLONGH Frequency Percent ------------------------------------------1 Yes 15452 5942 2 No 10428 4010 7 Refused 71 027 8 Not ascertained 0 000 9 Dont know 55 021
Frequency Missing = 8519
ASD150_00000 Paid by the hour at current or most recent job
HOURPDA Frequency Percent ------------------------------------------1 Yes 19873 6102 2 No 12460 3826 7 Refused 134 041 8 Not ascertained 0 000 9 Dont know 100 031
Frequency Missing = 1958
14
2012 National Health Interview Survey (NHIS)Sample Adult Public Use File (samadult)
ASD Variables Thursday May 16 2013Unweighted Frequencies
ASD160_00000 Paid sick leave at current or most recent job
PDSICKA Frequency Percent ------------------------------------------1 Yes 16949 5204 2 No 15140 4649 7 Refused 117 036 8 Not ascertained 0 000 9 Dont know 361 111
Frequency Missing = 1958
ASD170_00000 Have more than one job
ONEJOB Frequency Percent ------------------------------------------1 Yes 1842 919 2 No 18152 9059 7 Refused 42 021 8 Not ascertained 0 000 9 Dont know 2 001
Frequency Missing = 14487
ASD210_00000 Work status last week past 12 months
WRKLYR4 Frequency Percent -------------------------------------------------------------------0 Had job last week 20038 5804 1 No job last week had job past 12 months 2275 659 2 No job last week no job past 12 months 10195 2953 3 Never worked 1939 562 7 Refused 53 015 8 Not ascertained 0 000 9 Dont know 25 007
ASD215_00010 Attended any kind of school past 12 months
SCHOOLYR Frequency Percent ------------------------------------------1 Yes 5705 1652 2 No 28802 8342 7 Refused 16 005 8 Not ascertained 0 000 9 Dont know 2 001
15
2012 National Health Interview Survey (NHIS)Sample Adult Public Use File (samadult)
ACN Variables Thursday May 16 2013Unweighted Frequencies
ACN010_00000 Ever been told you have hypertension
HYPEV Frequency Percent ------------------------------------------1 Yes 11298 3272 2 No 23195 6718 7 Refused 14 004 8 Not ascertained 0 000 9 Dont know 18 005
ACN020_00000 Ever had hypertension on 2+ visits
HYPDIFV Frequency Percent ------------------------------------------1 Yes 9748 8628 2 No 1523 1348 7 Refused 4 004 8 Not ascertained 0 000 9 Dont know 23 020
Frequency Missing = 23227
ACN020_00010 Had hypertension past 12 months
HYPYR Frequency Percent ------------------------------------------1 Yes 8326 8541 2 No 1376 1412 7 Refused 0 000 8 Not ascertained 0 000 9 Dont know 46 047
Frequency Missing = 24777
ACN031_01000 Ever been told you had coronary heart disease
CHDEV Frequency Percent ------------------------------------------1 Yes 1813 525 2 No 32660 9460 7 Refused 8 002 8 Not ascertained 0 000 9 Dont know 44 013
16
2012 National Health Interview Survey (NHIS)Sample Adult Public Use File (samadult)
ACN Variables Thursday May 16 2013Unweighted Frequencies
ACN031_01010 Had coronary heart disease past 12 months
CHDYR Frequency Percent ------------------------------------------1 Yes 1319 7275 2 No 488 2692 7 Refused 1 006 8 Not ascertained 0 000 9 Dont know 5 028
Frequency Missing = 32712
ACN031_02000 Ever been told you had angina pectoris
ANGEV Frequency Percent ------------------------------------------1 Yes 745 216 2 No 33730 9770 7 Refused 9 003 8 Not ascertained 0 000 9 Dont know 41 012
ACN031_03000 Ever been told you had a heart attack
MIEV Frequency Percent ------------------------------------------1 Yes 1284 372 2 No 33220 9622 7 Refused 9 003 8 Not ascertained 0 000 9 Dont know 12 003
ACN031_04000 Ever been told you had a heart conditiondisease
HRTEV Frequency Percent ------------------------------------------1 Yes 2580 747 2 No 31919 9245 7 Refused 10 003 8 Not ascertained 0 000 9 Dont know 16 005
ACN031_04010 Had other heart condition past 12 months
HRTYR Frequency Percent ------------------------------------------1 Yes 1506 5837 2 No 1069 4143 7 Refused 0 000 8 Not ascertained 0 000 9 Dont know 5 019
Frequency Missing = 31945
17
2012 National Health Interview Survey (NHIS)Sample Adult Public Use File (samadult)
ACN Variables Thursday May 16 2013Unweighted Frequencies
ACN031_05000 Ever been told you had a stroke
STREV Frequency Percent ------------------------------------------1 Yes 1113 322 2 No 33388 9671 7 Refused 9 003 8 Not ascertained 0 000 9 Dont know 15 004
ACN031_06000 Ever been told you had emphysema
EPHEV Frequency Percent ------------------------------------------1 Yes 663 192 2 No 33844 9803 7 Refused 9 003 8 Not ascertained 0 000 9 Dont know 9 003
ACN035_00000 Ever been told you had COPD
COPDEV Frequency Percent ------------------------------------------1 Yes 1114 323 2 No 33377 9667 7 Refused 7 002 8 Not ascertained 0 000 9 Dont know 27 008
ACN040_00010 Ever been told to take low-dose aspirin
ASPMEDEV Frequency Percent ------------------------------------------1 Yes 7336 3321 2 No 14724 6665 7 Refused 5 002 8 Not ascertained 0 000 9 Dont know 26 012
Frequency Missing = 12434
ACN040_00020 Following low-dose aspirin advice
ASPMEDAD Frequency Percent ------------------------------------------1 Yes 6058 8258 2 No 1275 1738 7 Refused 1 001 8 Not ascertained 0 000 9 Dont know 2 003
Frequency Missing = 27189
18
2012 National Health Interview Survey (NHIS)Sample Adult Public Use File (samadult)
ACN Variables Thursday May 16 2013Unweighted Frequencies
ACN040_00030 Advised to stop taking low-dose aspirin
ASPMDMED Frequency Percent ------------------------------------------1 Yes 427 3349 2 No 842 6604 7 Refused 0 000 8 Not ascertained 0 000 9 Dont know 6 047
Frequency Missing = 33250
ACN040_00040 Taking low-dose aspirin on own
ASPONOWN Frequency Percent ------------------------------------------1 Yes 1308 886 2 No 13434 9105 7 Refused 6 004 8 Not ascertained 0 000 9 Dont know 7 005
Frequency Missing = 19770
ACN080_00000 Ever been told you had asthma
AASMEV Frequency Percent ------------------------------------------1 Yes 4387 1271 2 No 30118 8724 7 Refused 8 002 8 Not ascertained 0 000 9 Dont know 12 003
ACN085_00000 Still have asthma
AASSTILL Frequency Percent ------------------------------------------1 Yes 2865 6531 2 No 1485 3385 7 Refused 0 000 8 Not ascertained 0 000 9 Dont know 37 084
Frequency Missing = 30138
19
2012 National Health Interview Survey (NHIS)Sample Adult Public Use File (samadult)
ACN Variables Thursday May 16 2013Unweighted Frequencies
ACN090_00000 Had an asthma episodeattack past 12 m
AASMYR Frequency Percent ------------------------------------------1 Yes 1432 3264 2 No 2952 6729 7 Refused 0 000 8 Not ascertained 0 000 9 Dont know 3 007
Frequency Missing = 30138
ACN100_00000 Had visit to ER due to asthma past 12 m
AASERYR1 Frequency Percent ------------------------------------------1 Yes 394 898 2 No 3991 9097 7 Refused 0 000 8 Not ascertained 0 000 9 Dont know 2 005
Frequency Missing = 30138
ACN110_00000 Ever been told you have an ulcer
ULCEV Frequency Percent ------------------------------------------1 Yes 2423 702 2 No 32075 9290 7 Refused 11 003 8 Not ascertained 0 000 9 Dont know 16 005
ACN120_00000 Had ulcer in past 12 m
ULCYR Frequency Percent ------------------------------------------1 Yes 675 2786 2 No 1734 7156 7 Refused 0 000 8 Not ascertained 0 000 9 Dont know 14 058
Frequency Missing = 32102
20
2012 National Health Interview Survey (NHIS)Sample Adult Public Use File (samadult)
ACN Variables Thursday May 16 2013Unweighted Frequencies
ACN121_00010 Ever told you had high cholesterol
CHLEV Frequency Percent ------------------------------------------1 Yes 9489 2748 2 No 24944 7225 7 Refused 10 003 8 Not ascertained 0 000 9 Dont know 82 024
ACN121_00020 Had high cholesterol past 12 months
CHLYR Frequency Percent ------------------------------------------1 Yes 6708 7069 2 No 2612 2753 7 Refused 0 000 8 Not ascertained 0 000 9 Dont know 169 178
Frequency Missing = 25036
ACN121_00030 Ever told you had influenzapneumonia
AFLUPNEV Frequency Percent ------------------------------------------1 Yes 8133 2356 2 No 26349 7632 7 Refused 9 003 8 Not ascertained 0 000 9 Dont know 34 010
ACN121_00040 Had influenzapneumonia past 12 months
AFLUPNYR Frequency Percent ------------------------------------------1 Yes 1416 1741 2 No 6711 8252 7 Refused 0 000 8 Not ascertained 0 000 9 Dont know 6 007
Frequency Missing = 26392
ACN121_00050 Ever told you had strep throattonsillitis
ASTREPEV Frequency Percent ------------------------------------------1 Yes 11068 3206 2 No 23371 6769 7 Refused 10 003 8 Not ascertained 0 000 9 Dont know 76 022
21
2012 National Health Interview Survey (NHIS)Sample Adult Public Use File (samadult)
ACN Variables Thursday May 16 2013Unweighted Frequencies
ACN121_00060 Had strep throattonsillitis past 12 months
ASTREPYR Frequency Percent ------------------------------------------1 Yes 1121 1013 2 No 9941 8982 7 Refused 0 000 8 Not ascertained 0 000 9 Dont know 6 005
Frequency Missing = 23457
ACN121_00070 Ever told you had poor circulation
PRCIREV Frequency Percent ------------------------------------------1 Yes 3807 1103 2 No 30675 8885 7 Refused 9 003 8 Not ascertained 0 000 9 Dont know 34 010
ACN121_00080 Had poor circulation past 12 months
PRCIRYR Frequency Percent ------------------------------------------1 Yes 3184 8364 2 No 613 1610 7 Refused 0 000 8 Not ascertained 0 000 9 Dont know 10 026
Frequency Missing = 30718
ACN121_00090 Ever told you had urinary problems
UREV Frequency Percent ------------------------------------------1 Yes 4432 1284 2 No 30071 8710 7 Refused 13 004 8 Not ascertained 0 000 9 Dont know 9 003
22
2012 National Health Interview Survey (NHIS)Sample Adult Public Use File (samadult)
ACN Variables Thursday May 16 2013Unweighted Frequencies
ACN121_00100 Had urinary problems past 12 months
URYR Frequency Percent ------------------------------------------1 Yes 2896 6534 2 No 1534 3461 7 Refused 0 000 8 Not ascertained 0 000 9 Dont know 2 005
Frequency Missing = 30093
ACN121_00110 Ever told you had phobia or fears
PHOBIAEV Frequency Percent ------------------------------------------1 Yes 1833 531 2 No 32659 9460 7 Refused 14 004 8 Not ascertained 0 000 9 Dont know 19 006
ACN121_00120 Had phobia or fears past 12 months
PHOBIAYR Frequency Percent ------------------------------------------1 Yes 1408 7681 2 No 423 2308 7 Refused 0 000 8 Not ascertained 0 000 9 Dont know 2 011
Frequency Missing = 32692
ACN121_00130 Ever told you had ADDADHD
ADDHYP1 Frequency Percent ------------------------------------------1 Yes 1237 358 2 No 33248 9630 7 Refused 9 003 8 Not ascertained 0 000 9 Dont know 31 009
ACN121_00140 Ever told you had Bipolar Disorder
BIPDIS Frequency Percent ------------------------------------------1 Yes 837 242 2 No 33658 9749 7 Refused 11 003 8 Not ascertained 0 000 9 Dont know 19 006
23
2012 National Health Interview Survey (NHIS)Sample Adult Public Use File (samadult)
ACN Variables Thursday May 16 2013Unweighted Frequencies
ACN121_00150 Ever told you had depression
ADEPRSEV Frequency Percent ------------------------------------------1 Yes 5370 1555 2 No 29129 8437 7 Refused 14 004 8 Not ascertained 0 000 9 Dont know 12 003
ACN121_00160 Had depression past 12 months
ADEPRSYR Frequency Percent ------------------------------------------1 Yes 3852 7173 2 No 1514 2819 7 Refused 0 000 8 Not ascertained 0 000 9 Dont know 4 007
Frequency Missing = 29155
ACN121_00170 Ever told you had other mental health disorders
MHDOTHEV Frequency Percent ------------------------------------------1 Yes 1356 393 2 No 33140 9599 7 Refused 13 004 8 Not ascertained 0 000 9 Dont know 16 005
ACN121_00180 Had mental health disorders past 12 months
MHDOTHYR Frequency Percent ------------------------------------------1 Yes 1049 7736 2 No 306 2257 7 Refused 0 000 8 Not ascertained 0 000 9 Dont know 1 007
Frequency Missing = 33169
ACN125_00010 Had respiratory allergy past 12 months
RESPALYR Frequency Percent ------------------------------------------1 Yes 3906 1131 2 No 30571 8855 7 Refused 6 002 8 Not ascertained 0 000 9 Dont know 42 012
24
2012 National Health Interview Survey (NHIS)Sample Adult Public Use File (samadult)
ACN Variables Thursday May 16 2013Unweighted Frequencies
ACN125_00020 Had digestive allergy past 12 months
DGSTALYR Frequency Percent ------------------------------------------1 Yes 1420 411 2 No 33068 9578 7 Refused 7 002 8 Not ascertained 0 000 9 Dont know 30 009
ACN125_00030 Had eczemaskin allergy past 12 months
SKNALYR Frequency Percent ------------------------------------------1 Yes 2477 717 2 No 32023 9275 7 Refused 7 002 8 Not ascertained 0 000 9 Dont know 18 005
ACN125_00040 Had other allergy past 12 months
OTHALYR Frequency Percent ------------------------------------------1 Yes 2146 622 2 No 32355 9371 7 Refused 7 002 8 Not ascertained 0 000 9 Dont know 17 005
ACN125_00050 Had acid refluxheartburn past 12 months
ACIDRYR Frequency Percent ------------------------------------------1 Yes 7903 2289 2 No 26596 7703 7 Refused 6 002 8 Not ascertained 0 000 9 Dont know 20 006
ACN125_00060 Had fever more than one day past 12 months
AFEVRYR Frequency Percent ------------------------------------------1 Yes 3886 1126 2 No 30587 8859 7 Refused 6 002 8 Not ascertained 0 000 9 Dont know 46 013
25
2012 National Health Interview Survey (NHIS)Sample Adult Public Use File (samadult)
ACN Variables Thursday May 16 2013Unweighted Frequencies
ACN125_00070 Had headchest cold past 12 months
ACOLDYR Frequency Percent ------------------------------------------1 Yes 14170 4104 2 No 20309 5882 7 Refused 5 001 8 Not ascertained 0 000 9 Dont know 41 012
ACN125_00080 Had nauseavomiting past 12 months
ANAUSYR Frequency Percent ------------------------------------------1 Yes 6741 1952 2 No 27763 8041 7 Refused 5 001 8 Not ascertained 0 000 9 Dont know 16 005
ACN125_00090 Had sore throat past 12 months
ATHOTHYR Frequency Percent ------------------------------------------1 Yes 8689 2517 2 No 25809 7475 7 Refused 6 002 8 Not ascertained 0 000 9 Dont know 21 006
ACN125_00100 Had infectious diseases past 12 months
IMMOTHYR Frequency Percent ------------------------------------------1 Yes 1105 320 2 No 33377 9667 7 Refused 7 002 8 Not ascertained 0 000 9 Dont know 36 010
ACN125_00110 Had recurring headache past 12 months
AHEADYR Frequency Percent ------------------------------------------1 Yes 4382 1269 2 No 30131 8727 7 Refused 8 002 8 Not ascertained 0 000 9 Dont know 4 001
26
2012 National Health Interview Survey (NHIS)Sample Adult Public Use File (samadult)
ACN Variables Thursday May 16 2013Unweighted Frequencies
ACN125_00120 Had memory loss past 12 months
MEMLOSYR Frequency Percent ------------------------------------------1 Yes 2055 595 2 No 32441 9396 7 Refused 6 002 8 Not ascertained 0 000 9 Dont know 23 007
ACN125_00130 Had neurological problems past 12 months
NEUROYR Frequency Percent ------------------------------------------1 Yes 1503 435 2 No 32952 9544 7 Refused 6 002 8 Not ascertained 0 000 9 Dont know 64 019
ACN125_00140 Had abdominal pain past 12 months
AABDOMYR Frequency Percent ------------------------------------------1 Yes 3516 1018 2 No 30998 8978 7 Refused 5 001 8 Not ascertained 0 000 9 Dont know 6 002
ACN125_00150 Had sprainsstrains past 12 months
SPNYR Frequency Percent ------------------------------------------1 Yes 2380 689 2 No 32127 9305 7 Refused 6 002 8 Not ascertained 0 000 9 Dont know 12 003
ACN125_00160 Had dental pain past 12 months
DENYR Frequency Percent ------------------------------------------1 Yes 5273 1527 2 No 29242 8470 7 Refused 5 001 8 Not ascertained 0 000 9 Dont know 5 001
27
2012 National Health Interview Survey (NHIS)Sample Adult Public Use File (samadult)
ACN Variables Thursday May 16 2013Unweighted Frequencies
ACN125_00170 Had musclebone pain past 12 months
AMUSCLYR Frequency Percent ------------------------------------------1 Yes 8130 2355 2 No 26380 7641 7 Refused 5 001 8 Not ascertained 0 000 9 Dont know 10 003
ACN125_00180 Had other chronic pain past 12 months
APNOTHYR Frequency Percent ------------------------------------------1 Yes 4205 1218 2 No 30302 8777 7 Refused 7 002 8 Not ascertained 0 000 9 Dont know 11 003
ACN125_00190 Excessive alcoholtobacco past 12 months
ALCTOBYR Frequency Percent ------------------------------------------1 Yes 2143 621 2 No 32361 9373 7 Refused 13 004 8 Not ascertained 0 000 9 Dont know 8 002
ACN125_00200 Substance abuse past 12 months
SUBABYR Frequency Percent ------------------------------------------1 Yes 253 073 2 No 34257 9922 7 Refused 13 004 8 Not ascertained 0 000 9 Dont know 2 001
ACN125_00210 Had problems being overweight past 12 months
AOVRWTYR Frequency Percent ------------------------------------------1 Yes 7534 2182 2 No 26966 7811 7 Refused 10 003 8 Not ascertained 0 000 9 Dont know 15 004
28
2012 National Health Interview Survey (NHIS)Sample Adult Public Use File (samadult)
ACN Variables Thursday May 16 2013Unweighted Frequencies
ACN125_00220 Skin problems past 12 months
SKNYR1 Frequency Percent ------------------------------------------1 Yes 2086 604 2 No 32424 9391 7 Refused 7 002 8 Not ascertained 0 000 9 Dont know 8 002
ACN125_00230 Had fatiguelack of energy past 12 months
FATIGYR Frequency Percent ------------------------------------------1 Yes 5550 1608 2 No 28955 8387 7 Refused 7 002 8 Not ascertained 0 000 9 Dont know 13 004
ACN125_00240 Excessive sleepiness past 12 months
FATYR Frequency Percent ------------------------------------------1 Yes 4585 1328 2 No 29926 8668 7 Refused 6 002 8 Not ascertained 0 000 9 Dont know 8 002
ACN125_00250 Insomnia past 12 months
INSYR Frequency Percent ------------------------------------------1 Yes 7075 2049 2 No 27441 7948 7 Refused 7 002 8 Not ascertained 0 000 9 Dont know 2 001
ACN125_00260 Frequently anxious past 12 months
ANXNWYR Frequency Percent ------------------------------------------1 Yes 6943 2011 2 No 27560 7983 7 Refused 9 003 8 Not ascertained 0 000 9 Dont know 13 004
29
2012 National Health Interview Survey (NHIS)Sample Adult Public Use File (samadult)
ACN Variables Thursday May 16 2013Unweighted Frequencies
ACN125_00270 Frequently stressed past 12 months
ASTRESYR Frequency Percent ------------------------------------------1 Yes 10130 2934 2 No 24366 7057 7 Refused 11 003 8 Not ascertained 0 000 9 Dont know 18 005
ACN130_00000 Ever told by a doctor you had cancer
CANEV Frequency Percent ------------------------------------------1 Yes 3118 903 2 No 31387 9091 7 Refused 10 003 8 Not ascertained 0 000 9 Dont know 10 003
ACN140_01000 What kind of cancer Bladder
CNKIND1 Frequency Percent ------------------------------------------1 Mentioned 77 247 2 Not mentioned 3029 9715 7 Refused 5 016 8 Not ascertained 0 000 9 Dont know 7 022
Frequency Missing = 31407
ACN140_02000 What kind of cancer Blood
CNKIND2 Frequency Percent ------------------------------------------1 Mentioned 14 045 2 Not mentioned 3092 9917 7 Refused 5 016 8 Not ascertained 0 000 9 Dont know 7 022
Frequency Missing = 31407
30
2012 National Health Interview Survey (NHIS)Sample Adult Public Use File (samadult)
ACN Variables Thursday May 16 2013Unweighted Frequencies
ACN140_03000 What kind of cancer Bone
CNKIND3 Frequency Percent ------------------------------------------1 Mentioned 37 119 2 Not mentioned 3069 9843 7 Refused 5 016 8 Not ascertained 0 000 9 Dont know 7 022
Frequency Missing = 31407
ACN140_04000 What kind of cancer Brain
CNKIND4 Frequency Percent ------------------------------------------1 Mentioned 31 099 2 Not mentioned 3075 9862 7 Refused 5 016 8 Not ascertained 0 000 9 Dont know 7 022
Frequency Missing = 31407
ACN140_05000 What kind of cancer Breast
CNKIND5 Frequency Percent ------------------------------------------1 Mentioned 572 1835 2 Not mentioned 2534 8127 7 Refused 5 016 8 Not ascertained 0 000 9 Dont know 7 022
Frequency Missing = 31407
ACN140_06000 What kind of cancer Cervix
CNKIND6 Frequency Percent ------------------------------------------1 Mentioned 226 1197 2 Not mentioned 1652 8750 7 Refused 4 021 8 Not ascertained 0 000 9 Dont know 6 032
Frequency Missing = 32637
31
2012 National Health Interview Survey (NHIS)Sample Adult Public Use File (samadult)
ACN Variables Thursday May 16 2013Unweighted Frequencies
ACN140_07000 What kind of cancer Colon
CNKIND7 Frequency Percent ------------------------------------------1 Mentioned 184 590 2 Not mentioned 2922 9371 7 Refused 5 016 8 Not ascertained 0 000 9 Dont know 7 022
Frequency Missing = 31407
ACN140_08000 What kind of cancer Esophagus
CNKIND8 Frequency Percent ------------------------------------------1 Mentioned 16 051 2 Not mentioned 3090 9910 7 Refused 5 016 8 Not ascertained 0 000 9 Dont know 7 022
Frequency Missing = 31407
ACN140_09000 What kind of cancer Gallbladder
CNKIND9 Frequency Percent ------------------------------------------1 Mentioned 2 006 2 Not mentioned 3104 9955 7 Refused 5 016 8 Not ascertained 0 000 9 Dont know 7 022
Frequency Missing = 31407
ACN140_10000 What kind of cancer Kidney
CNKIND10 Frequency Percent ------------------------------------------1 Mentioned 70 225 2 Not mentioned 3036 9737 7 Refused 5 016 8 Not ascertained 0 000 9 Dont know 7 022
Frequency Missing = 31407
32
2012 National Health Interview Survey (NHIS)Sample Adult Public Use File (samadult)
ACN Variables Thursday May 16 2013Unweighted Frequencies
ACN140_11000 What kind of cancer larynx-windpipe
CNKIND11 Frequency Percent ------------------------------------------1 Mentioned 10 032 2 Not mentioned 3096 9929 7 Refused 5 016 8 Not ascertained 0 000 9 Dont know 7 022
Frequency Missing = 31407
ACN140_12000 What kind of cancer Leukemia
CNKIND12 Frequency Percent ------------------------------------------1 Mentioned 34 109 2 Not mentioned 3072 9852 7 Refused 5 016 8 Not ascertained 0 000 9 Dont know 7 022
Frequency Missing = 31407
ACN140_13000 What kind of cancer Liver
CNKIND13 Frequency Percent ------------------------------------------1 Mentioned 12 038 2 Not mentioned 3094 9923 7 Refused 5 016 8 Not ascertained 0 000 9 Dont know 7 022
Frequency Missing = 31407
ACN140_14000 What kind of cancer Lung
CNKIND14 Frequency Percent ------------------------------------------1 Mentioned 66 212 2 Not mentioned 3040 9750 7 Refused 5 016 8 Not ascertained 0 000 9 Dont know 7 022
Frequency Missing = 31407
33
2012 National Health Interview Survey (NHIS)Sample Adult Public Use File (samadult)
ACN Variables Thursday May 16 2013Unweighted Frequencies
ACN140_15000 What kind of cancer Lymphoma
CNKIND15 Frequency Percent ------------------------------------------1 Mentioned 92 295 2 Not mentioned 3014 9666 7 Refused 5 016 8 Not ascertained 0 000 9 Dont know 7 022
Frequency Missing = 31407
ACN140_16000 What kind of cancer Melanoma
CNKIND16 Frequency Percent ------------------------------------------1 Mentioned 245 786 2 Not mentioned 2861 9176 7 Refused 5 016 8 Not ascertained 0 000 9 Dont know 7 022
Frequency Missing = 31407
ACN140_17000 What kind of cancer mouthtonguelip
CNKIND17 Frequency Percent ------------------------------------------1 Mentioned 20 064 2 Not mentioned 3086 9897 7 Refused 5 016 8 Not ascertained 0 000 9 Dont know 7 022
Frequency Missing = 31407
ACN140_18000 What kind of cancer Ovary
CNKIND18 Frequency Percent ------------------------------------------1 Mentioned 66 350 2 Not mentioned 1812 9597 7 Refused 4 021 8 Not ascertained 0 000 9 Dont know 6 032
Frequency Missing = 32637
34
2012 National Health Interview Survey (NHIS)Sample Adult Public Use File (samadult)
ACN Variables Thursday May 16 2013Unweighted Frequencies
ACN140_19000 What kind of cancer Pancreas
CNKIND19 Frequency Percent ------------------------------------------1 Mentioned 11 035 2 Not mentioned 3095 9926 7 Refused 5 016 8 Not ascertained 0 000 9 Dont know 7 022
Frequency Missing = 31407
ACN140_20000 What kind of cancer Prostate
CNKIND20 Frequency Percent ------------------------------------------1 Mentioned 362 2943 2 Not mentioned 866 7041 7 Refused 1 008 8 Not ascertained 0 000 9 Dont know 1 008
Frequency Missing = 33295
ACN140_21000 What kind of cancer Rectum
CNKIND21 Frequency Percent ------------------------------------------1 Mentioned 17 055 2 Not mentioned 3089 9907 7 Refused 5 016 8 Not ascertained 0 000 9 Dont know 7 022
Frequency Missing = 31407
ACN140_22000 What kind of cancer skin (non-melanoma)
CNKIND22 Frequency Percent ------------------------------------------1 Mentioned 640 2053 2 Not mentioned 2466 7909 7 Refused 5 016 8 Not ascertained 0 000 9 Dont know 7 022
Frequency Missing = 31407
35
2012 National Health Interview Survey (NHIS)Sample Adult Public Use File (samadult)
ACN Variables Thursday May 16 2013Unweighted Frequencies
ACN140_23000 What kind of cancer skin (DK kind)
CNKIND23 Frequency Percent ------------------------------------------1 Mentioned 271 869 2 Not mentioned 2835 9092 7 Refused 5 016 8 Not ascertained 0 000 9 Dont know 7 022
Frequency Missing = 31407
ACN140_24000 What kind of cancer soft tissue (muscle or fat)
CNKIND24 Frequency Percent ------------------------------------------1 Mentioned 13 042 2 Not mentioned 3093 9920 7 Refused 5 016 8 Not ascertained 0 000 9 Dont know 7 022
Frequency Missing = 31407
ACN140_25000 What kind of cancer Stomach
CNKIND25 Frequency Percent ------------------------------------------1 Mentioned 25 080 2 Not mentioned 3081 9881 7 Refused 5 016 8 Not ascertained 0 000 9 Dont know 7 022
Frequency Missing = 31407
ACN140_26000 What kind of cancer Testis
CNKIND26 Frequency Percent ------------------------------------------1 Mentioned 24 195 2 Not mentioned 1204 9789 7 Refused 1 008 8 Not ascertained 0 000 9 Dont know 1 008
Frequency Missing = 33295
36
2012 National Health Interview Survey (NHIS)Sample Adult Public Use File (samadult)
ACN Variables Thursday May 16 2013Unweighted Frequencies
ACN140_27000 What kind of cancer throat - pharynx
CNKIND27 Frequency Percent ------------------------------------------1 Mentioned 43 138 2 Not mentioned 3063 9824 7 Refused 5 016 8 Not ascertained 0 000 9 Dont know 7 022
Frequency Missing = 31407
ACN140_28000 What kind of cancer Thyroid
CNKIND28 Frequency Percent ------------------------------------------1 Mentioned 79 253 2 Not mentioned 3027 9708 7 Refused 5 016 8 Not ascertained 0 000 9 Dont know 7 022
Frequency Missing = 31407
ACN140_29000 What kind of cancer Uterus
CNKIND29 Frequency Percent ------------------------------------------1 Mentioned 142 752 2 Not mentioned 1736 9195 7 Refused 4 021 8 Not ascertained 0 000 9 Dont know 6 032
Frequency Missing = 32637
ACN140_30000 What kind of cancer Other
CNKIND30 Frequency Percent ------------------------------------------1 Mentioned 140 449 2 Not mentioned 2966 9513 7 Refused 5 016 8 Not ascertained 0 000 9 Dont know 7 022
Frequency Missing = 31407
37
2012 National Health Interview Survey (NHIS)Sample Adult Public Use File (samadult)
ACN Variables Thursday May 16 2013Unweighted Frequencies
ACN140_31000 What kind of cancer more than 3 kinds
CNKIND31 Frequency Percent ------------------------------------------1 Mentioned 2 526 2 Not mentioned 36 9474 7 Refused 0 000 8 Not ascertained 0 000 9 Dont know 0 000
Frequency Missing = 34487
ACN150_01000 Age first diagnosed wbladder cancer
CANAGE1 Frequency Percent -------------------------------------------01-84 1-84 years 73 9481 85 85+ years 3 390 97 Refused 0 000 98 Not ascertained 0 000 99 Dont know 1 130
Frequency Missing = 34448
ACN150_02000 Age first diagnosed wblood cancer
CANAGE2 Frequency Percent -------------------------------------------01-84 1-84 years 13 9286 85 85+ years 1 714 97 Refused 0 000 98 Not ascertained 0 000 99 Dont know 0 000
Frequency Missing = 34511
ACN150_03000 Age first diagnosed wbone cancer
CANAGE3 Frequency Percent -------------------------------------------01-84 1-84 years 35 9459 85 85+ years 2 541 97 Refused 0 000 98 Not ascertained 0 000 99 Dont know 0 000
Frequency Missing = 34488
38
2012 National Health Interview Survey (NHIS)Sample Adult Public Use File (samadult)
ACN Variables Thursday May 16 2013Unweighted Frequencies
ACN150_04000 Age first diagnosed wbrain cancer
CANAGE4 Frequency Percent -------------------------------------------01-84 1-84 years 30 9677 85 85+ years 0 000 97 Refused 1 323 98 Not ascertained 0 000 99 Dont know 0 000
Frequency Missing = 34494
ACN150_05000 Age first diagnosed wbreast cancer
CANAGE5 Frequency Percent -------------------------------------------01-84 1-84 years 556 9720 85 85+ years 5 087 97 Refused 4 070 98 Not ascertained 0 000 99 Dont know 7 122
Frequency Missing = 33953
ACN150_06000 Age first diagnosed wcervical cancer
CANAGE6 Frequency Percent -------------------------------------------01-84 1-84 years 223 9867 85 85+ years 0 000 97 Refused 1 044 98 Not ascertained 0 000 99 Dont know 2 088
Frequency Missing = 34299
ACN150_07000 Age first diagnosed wcolon cancer
CANAGE7 Frequency Percent -------------------------------------------01-84 1-84 years 176 9565 85 85+ years 5 272 97 Refused 1 054 98 Not ascertained 0 000 99 Dont know 2 109
Frequency Missing = 34341
39
2012 National Health Interview Survey (NHIS)Sample Adult Public Use File (samadult)
ACN Variables Thursday May 16 2013Unweighted Frequencies
ACN150_08000 Age first diagnosed wesophageal cancer
CANAGE8 Frequency Percent -------------------------------------------01-84 1-84 years 16 10000 85 85+ years 0 000 97 Refused 0 000 98 Not ascertained 0 000 99 Dont know 0 000
Frequency Missing = 34509
ACN150_09000 Age first diagnosed wgallbladder cancer
CANAGE9 Frequency Percent -------------------------------------------01-84 1-84 years 2 10000 85 85+ years 0 000 97 Refused 0 000 98 Not ascertained 0 000 99 Dont know 0 000
Frequency Missing = 34523
ACN150_10000 Age first diagnosed wkidney cancer
CANAGE10 Frequency Percent -------------------------------------------01-84 1-84 years 68 9714 85 85+ years 1 143 97 Refused 0 000 98 Not ascertained 0 000 99 Dont know 1 143
Frequency Missing = 34455
ACN150_11000 Age first diagnosed wlarynx-windpipe cancer
CANAGE11 Frequency Percent -------------------------------------------01-84 1-84 years 10 10000 85 85+ years 0 000 97 Refused 0 000 98 Not ascertained 0 000 99 Dont know 0 000
Frequency Missing = 34515
40
2012 National Health Interview Survey (NHIS)Sample Adult Public Use File (samadult)
ACN Variables Thursday May 16 2013Unweighted Frequencies
ACN150_12000 Age first diagnosed wleukemia
CANAGE12 Frequency Percent -------------------------------------------01-84 1-84 years 34 10000 85 85+ years 0 000 97 Refused 0 000 98 Not ascertained 0 000 99 Dont know 0 000
Frequency Missing = 34491
ACN150_13000 Age first diagnosed wliver cancer
CANAGE13 Frequency Percent -------------------------------------------01-84 1-84 years 12 10000 85 85+ years 0 000 97 Refused 0 000 98 Not ascertained 0 000 99 Dont know 0 000
Frequency Missing = 34513
ACN150_14000 Age first diagnosed wlung cancer
CANAGE14 Frequency Percent -------------------------------------------01-84 1-84 years 65 9848 85 85+ years 1 152 97 Refused 0 000 98 Not ascertained 0 000 99 Dont know 0 000
Frequency Missing = 34459
ACN150_15000 Age first diagnosed wlymphoma
CANAGE15 Frequency Percent -------------------------------------------01-84 1-84 years 90 9783 85 85+ years 2 217 97 Refused 0 000 98 Not ascertained 0 000 99 Dont know 0 000
Frequency Missing = 34433
41
2012 National Health Interview Survey (NHIS)Sample Adult Public Use File (samadult)
ACN Variables Thursday May 16 2013Unweighted Frequencies
ACN150_16000 Age first diagnosed wmelanoma
CANAGE16 Frequency Percent -------------------------------------------01-84 1-84 years 236 9633 85 85+ years 6 245 97 Refused 0 000 98 Not ascertained 0 000 99 Dont know 3 122
Frequency Missing = 34280
ACN150_17000 Age first diagnosed wmouthtonguelip cancer
CANAGE17 Frequency Percent -------------------------------------------01-84 1-84 years 20 10000 85 85+ years 0 000 97 Refused 0 000 98 Not ascertained 0 000 99 Dont know 0 000
Frequency Missing = 34505
ACN150_18000 Age first diagnosed wovarian cancer
CANAGE18 Frequency Percent -------------------------------------------01-84 1-84 years 66 10000 85 85+ years 0 000 97 Refused 0 000 98 Not ascertained 0 000 99 Dont know 0 000
Frequency Missing = 34459
ACN150_19000 Age first diagnosed wpancreatic cancer
CANAGE19 Frequency Percent -------------------------------------------01-84 1-84 years 10 9091 85 85+ years 1 909 97 Refused 0 000 98 Not ascertained 0 000 99 Dont know 0 000
Frequency Missing = 34514
42
2012 National Health Interview Survey (NHIS)Sample Adult Public Use File (samadult)
ACN Variables Thursday May 16 2013Unweighted Frequencies
ACN150_20000 Age first diagnosed wprostate cancer
CANAGE20 Frequency Percent -------------------------------------------01-84 1-84 years 357 9862 85 85+ years 4 110 97 Refused 0 000 98 Not ascertained 0 000 99 Dont know 1 028
Frequency Missing = 34163
ACN150_21000 Age first diagnosed wrectal cancer
CANAGE21 Frequency Percent -------------------------------------------01-84 1-84 years 16 9412 85 85+ years 1 588 97 Refused 0 000 98 Not ascertained 0 000 99 Dont know 0 000
Frequency Missing = 34508
ACN150_22000 Age first diagnosed wskin (non-melanoma) cancer
CANAGE22 Frequency Percent -------------------------------------------01-84 1-84 years 618 9656 85 85+ years 13 203 97 Refused 0 000 98 Not ascertained 0 000 99 Dont know 9 141
Frequency Missing = 33885
ACN150_23000 Age first diagnosed wskin (DK kind) cancer
CANAGE23 Frequency Percent -------------------------------------------01-84 1-84 years 252 9299 85 85+ years 15 554 97 Refused 0 000 98 Not ascertained 0 000 99 Dont know 4 148
Frequency Missing = 34254
43
2012 National Health Interview Survey (NHIS)Sample Adult Public Use File (samadult)
ACN Variables Thursday May 16 2013Unweighted Frequencies
ACN150_24000 Age first diagnosed wsoft tissue cancer
CANAGE24 Frequency Percent -------------------------------------------01-84 1-84 years 13 10000 85 85+ years 0 000 97 Refused 0 000 98 Not ascertained 0 000 99 Dont know 0 000
Frequency Missing = 34512
ACN150_25000 Age first diagnosed wstomach cancer
CANAGE25 Frequency Percent -------------------------------------------01-84 1-84 years 24 9600 85 85+ years 1 400 97 Refused 0 000 98 Not ascertained 0 000 99 Dont know 0 000
Frequency Missing = 34500
ACN150_26000 Age first diagnosed wtesticular cancer
CANAGE26 Frequency Percent -------------------------------------------01-84 1-84 years 24 10000 85 85+ years 0 000 97 Refused 0 000 98 Not ascertained 0 000 99 Dont know 0 000
Frequency Missing = 34501
ACN150_27000 Age first diagnosed wthroatpharynx cancer
CANAGE27 Frequency Percent -------------------------------------------01-84 1-84 years 43 10000 85 85+ years 0 000 97 Refused 0 000 98 Not ascertained 0 000 99 Dont know 0 000
Frequency Missing = 34482
44
2012 National Health Interview Survey (NHIS)Sample Adult Public Use File (samadult)
ACN Variables Thursday May 16 2013Unweighted Frequencies
ACN150_28000 Age first diagnosed wthyroid cancer
CANAGE28 Frequency Percent -------------------------------------------01-84 1-84 years 76 9620 85 85+ years 1 127 97 Refused 1 127 98 Not ascertained 0 000 99 Dont know 1 127
Frequency Missing = 34446
ACN150_29000 Age first diagnosed wuterine cancer
CANAGE29 Frequency Percent -------------------------------------------01-84 1-84 years 141 9930 85 85+ years 0 000 97 Refused 0 000 98 Not ascertained 0 000 99 Dont know 1 070
Frequency Missing = 34383
ACN150_30000 Age first diagnosed wother cancer
CANAGE30 Frequency Percent -------------------------------------------01-84 1-84 years 136 9714 85 85+ years 2 143 97 Refused 0 000 98 Not ascertained 0 000 99 Dont know 2 143
Frequency Missing = 34385
ACN160_00000 Ever been told that you have diabetes
DIBEV Frequency Percent ------------------------------------------1 Yes 3528 1022 2 No 30479 8828 3 Borderline 493 143 7 Refused 13 004 8 Not ascertained 0 000 9 Dont know 12 003
45
2012 National Health Interview Survey (NHIS)Sample Adult Public Use File (samadult)
ACN Variables Thursday May 16 2013Unweighted Frequencies
ACN165_00000 Ever had prediabetes or other symptoms
DIBPRE1 Frequency Percent ------------------------------------------1 Yes 1536 496 2 No 29431 9495 7 Refused 13 004 8 Not ascertained 0 000 9 Dont know 17 005
Frequency Missing = 3528
ACN170_00000 Age first diagnosed wdiabetes
DIBAGE Frequency Percent -------------------------------------------01-84 1-84 years 3447 9770 85 85+ years 22 062 97 Refused 0 000 98 Not ascertained 0 000 99 Dont know 59 167
Frequency Missing = 30997
ACN170_00000 Years since first diagnosed wdiabetes
DIFAGE2 Frequency Percent -------------------------------------------------------------------00 Within past year 142 402 01-84 1-84 years 3307 9374 85 85+ years 0 000 96 1+ year(s) with diabetes and age is 85+ 20 057 97 Refused 0 000 98 Not ascertained 0 000 99 Dont know 59 167
Frequency Missing = 30997
ACN180_00000 NOW taking insulin
INSLN Frequency Percent ------------------------------------------1 Yes 1057 2087 2 No 4006 7911 7 Refused 0 000 8 Not ascertained 0 000 9 Dont know 1 002
Frequency Missing = 29461
46
2012 National Health Interview Survey (NHIS)Sample Adult Public Use File (samadult)
ACN Variables Thursday May 16 2013Unweighted Frequencies
ACN190_00000 NOW taking diabetic pills
DIBPILL Frequency Percent ------------------------------------------1 Yes 2746 5423 2 No 2311 4564 7 Refused 1 002 8 Not ascertained 0 000 9 Dont know 6 012
Frequency Missing = 29461
ACN201_01000 Told that you had hay fever past 12 m
AHAYFYR Frequency Percent ------------------------------------------1 Yes 2564 743 2 No 31936 9250 7 Refused 10 003 8 Not ascertained 0 000 9 Dont know 15 004
ACN201_02000 Told that you had sinusitis past 12 m
SINYR Frequency Percent ------------------------------------------1 Yes 4232 1226 2 No 30264 8766 7 Refused 9 003 8 Not ascertained 0 000 9 Dont know 20 006
ACN201_03000 Told you had chronic bronchitis 12 m
CBRCHYR Frequency Percent ------------------------------------------1 Yes 1338 388 2 No 33161 9605 7 Refused 8 002 8 Not ascertained 0 000 9 Dont know 18 005
ACN201_04000 Told you had weakfailing kidneys 12 m
KIDWKYR Frequency Percent ------------------------------------------1 Yes 684 198 2 No 33819 9796 7 Refused 11 003 8 Not ascertained 0 000 9 Dont know 11 003
47
2012 National Health Interview Survey (NHIS)Sample Adult Public Use File (samadult)
ACN Variables Thursday May 16 2013Unweighted Frequencies
ACN201_05000 Told you had liver condition past 12 m
LIVYR Frequency Percent ------------------------------------------1 Yes 505 146 2 No 33999 9848 7 Refused 11 003 8 Not ascertained 0 000 9 Dont know 10 003
ACN250_00000 Symptoms of joint painachingstiffness past 30 d
JNTSYMP Frequency Percent ------------------------------------------1 Yes 10978 3180 2 No 23528 6815 7 Refused 9 003 8 Not ascertained 0 000 9 Dont know 10 003
ACN260_01000 Which joint affectedshoulder-right
JMTHP1 Frequency Percent ------------------------------------------1 Mentioned 2659 2422 2 Not mentioned 8305 7565 7 Refused 2 002 8 Not ascertained 0 000 9 Dont know 12 011
Frequency Missing = 23547
ACN260_02000 Which joint affectedshoulder-left
JMTHP2 Frequency Percent ------------------------------------------1 Mentioned 2362 2152 2 Not mentioned 8602 7836 7 Refused 2 002 8 Not ascertained 0 000 9 Dont know 12 011
Frequency Missing = 23547
48
2012 National Health Interview Survey (NHIS)Sample Adult Public Use File (samadult)
ACN Variables Thursday May 16 2013Unweighted Frequencies
ACN260_03000 Which joint affectedelbow-right
JMTHP3 Frequency Percent ------------------------------------------1 Mentioned 1382 1259 2 Not mentioned 9582 8728 7 Refused 2 002 8 Not ascertained 0 000 9 Dont know 12 011
Frequency Missing = 23547
ACN260_04000 Which joint affectedelbow-left
JMTHP4 Frequency Percent ------------------------------------------1 Mentioned 1289 1174 2 Not mentioned 9675 8813 7 Refused 2 002 8 Not ascertained 0 000 9 Dont know 12 011
Frequency Missing = 23547
ACN260_05000 Which joint affectedhip-right
JMTHP5 Frequency Percent ------------------------------------------1 Mentioned 2147 1956 2 Not mentioned 8817 8032 7 Refused 2 002 8 Not ascertained 0 000 9 Dont know 12 011
Frequency Missing = 23547
ACN260_06000 Which joint affectedhip-left
JMTHP6 Frequency Percent ------------------------------------------1 Mentioned 2026 1846 2 Not mentioned 8938 8142 7 Refused 2 002 8 Not ascertained 0 000 9 Dont know 12 011
Frequency Missing = 23547
49
2012 National Health Interview Survey (NHIS)Sample Adult Public Use File (samadult)
ACN Variables Thursday May 16 2013Unweighted Frequencies
ACN260_07000 Which joint affectedwrist-right
JMTHP7 Frequency Percent ------------------------------------------1 Mentioned 1646 1499 2 Not mentioned 9318 8488 7 Refused 2 002 8 Not ascertained 0 000 9 Dont know 12 011
Frequency Missing = 23547
ACN260_08000 Which joint affectedwrist-left
JMTHP8 Frequency Percent ------------------------------------------1 Mentioned 1542 1405 2 Not mentioned 9422 8583 7 Refused 2 002 8 Not ascertained 0 000 9 Dont know 12 011
Frequency Missing = 23547
ACN260_09000 Which joint affectedknee-right
JMTHP9 Frequency Percent ------------------------------------------1 Mentioned 5664 5159 2 Not mentioned 5300 4828 7 Refused 2 002 8 Not ascertained 0 000 9 Dont know 12 011
Frequency Missing = 23547
ACN260_10000 Which joint affectedknee-left
JMTHP10 Frequency Percent ------------------------------------------1 Mentioned 5507 5016 2 Not mentioned 5457 4971 7 Refused 2 002 8 Not ascertained 0 000 9 Dont know 12 011
Frequency Missing = 23547
50
2012 National Health Interview Survey (NHIS)Sample Adult Public Use File (samadult)
ACN Variables Thursday May 16 2013Unweighted Frequencies
ACN260_11000 Which joint affectedankle-right
JMTHP11 Frequency Percent ------------------------------------------1 Mentioned 1852 1687 2 Not mentioned 9112 8300 7 Refused 2 002 8 Not ascertained 0 000 9 Dont know 12 011
Frequency Missing = 23547
ACN260_12000 Which joint affectedankle-left
JMTHP12 Frequency Percent ------------------------------------------1 Mentioned 1772 1614 2 Not mentioned 9192 8373 7 Refused 2 002 8 Not ascertained 0 000 9 Dont know 12 011
Frequency Missing = 23547
ACN260_13000 Which joint affectedtoes-right
JMTHP13 Frequency Percent ------------------------------------------1 Mentioned 890 811 2 Not mentioned 10074 9177 7 Refused 2 002 8 Not ascertained 0 000 9 Dont know 12 011
Frequency Missing = 23547
ACN260_14000 Which joint affectedtoes-left
JMTHP14 Frequency Percent ------------------------------------------1 Mentioned 858 782 2 Not mentioned 10106 9206 7 Refused 2 002 8 Not ascertained 0 000 9 Dont know 12 011
Frequency Missing = 23547
51
2012 National Health Interview Survey (NHIS)Sample Adult Public Use File (samadult)
ACN Variables Thursday May 16 2013Unweighted Frequencies
ACN260_15000 Which joint affectedfingersthumb-right
JMTHP15 Frequency Percent ------------------------------------------1 Mentioned 2264 2062 2 Not mentioned 8700 7925 7 Refused 2 002 8 Not ascertained 0 000 9 Dont know 12 011
Frequency Missing = 23547
ACN260_16000 Which joint affectedfingersthumb-left
JMTHP16 Frequency Percent ------------------------------------------1 Mentioned 2084 1898 2 Not mentioned 8880 8089 7 Refused 2 002 8 Not ascertained 0 000 9 Dont know 12 011
Frequency Missing = 23547
ACN260_17000 Which joint affectedother joint not listed
JMTHP17 Frequency Percent ------------------------------------------1 Mentioned 616 561 2 Not mentioned 10348 9426 7 Refused 2 002 8 Not ascertained 0 000 9 Dont know 12 011
Frequency Missing = 23547
ACN270_00000 Joint symptoms begin more than 3 months ago
JNTCHR Frequency Percent ------------------------------------------1 Yes 9686 8823 2 No 1281 1167 7 Refused 0 000 8 Not ascertained 0 000 9 Dont know 11 010
Frequency Missing = 23547
52
2012 National Health Interview Survey (NHIS)Sample Adult Public Use File (samadult)
ACN Variables Thursday May 16 2013Unweighted Frequencies
ACN280_00000 Ever seen doctor or health professional for joint symptoms
JNTHP Frequency Percent ------------------------------------------1 Yes 7974 7264 2 No 3001 2734 7 Refused 0 000 8 Not ascertained 0 000 9 Dont know 3 003
Frequency Missing = 23547
ACN290_00000 Ever been told you had arthritis
ARTH1 Frequency Percent ------------------------------------------1 Yes 8229 2383 2 No 26256 7605 7 Refused 10 003 8 Not ascertained 0 000 9 Dont know 30 009
ACN295_00000 Limited due to arthritis or joint symptoms
ARTHLMT Frequency Percent ------------------------------------------1 Yes 4954 3712 2 No 8384 6283 7 Refused 0 000 8 Not ascertained 0 000 9 Dont know 7 005
Frequency Missing = 21180
ACN297_01010 Ever told you had arthritis
ARTHTYP1 Frequency Percent ------------------------------------------1 Mentioned 6437 7822 2 Not mentioned 1740 2114 7 Refused 0 000 8 Not ascertained 0 000 9 Dont know 52 063
Frequency Missing = 26296
53
2012 National Health Interview Survey (NHIS)Sample Adult Public Use File (samadult)
ACN Variables Thursday May 16 2013Unweighted Frequencies
ACN297_02010 Ever told you had rheumatoid arthritis
ARTHTYP2 Frequency Percent ------------------------------------------1 Mentioned 950 1154 2 Not mentioned 7227 8782 7 Refused 0 000 8 Not ascertained 0 000 9 Dont know 52 063
Frequency Missing = 26296
ACN297_03010 Ever told you had gout
ARTHTYP3 Frequency Percent ------------------------------------------1 Mentioned 609 740 2 Not mentioned 7568 9197 7 Refused 0 000 8 Not ascertained 0 000 9 Dont know 52 063
Frequency Missing = 26296
ACN297_04010 Ever told you had lupus
ARTHTYP4 Frequency Percent ------------------------------------------1 Mentioned 132 160 2 Not mentioned 8045 9776 7 Refused 0 000 8 Not ascertained 0 000 9 Dont know 52 063
Frequency Missing = 26296
ACN297_05010 Ever told you had fibromyalgia
ARTHTYP5 Frequency Percent ------------------------------------------1 Mentioned 606 736 2 Not mentioned 7571 9200 7 Refused 0 000 8 Not ascertained 0 000 9 Dont know 52 063
Frequency Missing = 26296
54
2012 National Health Interview Survey (NHIS)Sample Adult Public Use File (samadult)
ACN Variables Thursday May 16 2013Unweighted Frequencies
ACN297_06010 Ever told you had other joint condition
ARTHTYP6 Frequency Percent ------------------------------------------1 Mentioned 506 615 2 Not mentioned 7671 9322 7 Refused 0 000 8 Not ascertained 0 000 9 Dont know 52 063
Frequency Missing = 26296
ACN300_00000 Had neck pain past 3 months
PAINECK Frequency Percent ------------------------------------------1 Yes 5222 1513 2 No 29285 8482 7 Refused 7 002 8 Not ascertained 2 001 9 Dont know 9 003
ACN310_00000 Had low back pain past 3 months
PAINLB Frequency Percent ------------------------------------------1 Yes 10078 2919 2 No 24427 7075 7 Refused 7 002 8 Not ascertained 2 001 9 Dont know 11 003
ACN320_00000 Pain spread down legbelow knees
PAINLEG Frequency Percent ------------------------------------------1 Yes 3676 3648 2 No 6378 6329 7 Refused 0 000 8 Not ascertained 0 000 9 Dont know 24 024
Frequency Missing = 24447
ACN331_01000 Had pain in jawfront of ear past 3 months
PAINFACE Frequency Percent ------------------------------------------1 Yes 1780 516 2 No 32725 9479 7 Refused 7 002 8 Not ascertained 2 001 9 Dont know 11 003
55
2012 National Health Interview Survey (NHIS)Sample Adult Public Use File (samadult)
ACN Variables Thursday May 16 2013Unweighted Frequencies
ACN331_02000 Had severe headachemigraine past 3 m
AMIGR Frequency Percent ------------------------------------------1 Yes 4846 1404 2 No 29661 8591 7 Refused 7 002 8 Not ascertained 3 001 9 Dont know 8 002
ACN350_00000 Had a headchest cold past 2 w
ACOLD2W Frequency Percent ------------------------------------------1 Yes 3210 930 2 No 31302 9066 7 Refused 5 001 8 Not ascertained 3 001 9 Dont know 5 001
ACN360_00000 Had stomach prob wvomitdiarrhea 2 w
AINTIL2W Frequency Percent ------------------------------------------1 Yes 1526 442 2 No 32986 9554 7 Refused 6 002 8 Not ascertained 3 001 9 Dont know 4 001
ACN370_00000 Currently pregnant
PREGNOW Frequency Percent ------------------------------------------1 Yes 335 335 2 No 9652 9650 7 Refused 3 003 8 Not ascertained 3 003 9 Dont know 9 009
Frequency Missing = 24523
ACN370_00010 Recently pregnant
PREGFLYR Frequency Percent ------------------------------------------1 Yes 488 499 2 No 9280 9497 7 Refused 3 003 8 Not ascertained 0 000 9 Dont know 1 001
Frequency Missing = 24753
56
2012 National Health Interview Survey (NHIS)Sample Adult Public Use File (samadult)
ACN Variables Thursday May 16 2013Unweighted Frequencies
ACN372_00010 Menstrual problems past 12 months
MENSYR Frequency Percent ------------------------------------------1 Yes 2131 1775 2 No 9852 8205 7 Refused 15 012 8 Not ascertained 4 003 9 Dont know 6 005
Frequency Missing = 22517
ACN372_00020 Menopausal problems past 12 months
MENOYR Frequency Percent ------------------------------------------1 Yes 1485 3576 2 No 2651 6383 7 Refused 6 014 8 Not ascertained 1 002 9 Dont know 10 024
Frequency Missing = 30372
ACN372_00030 Gynecological problems past 12 months
GYNYR Frequency Percent ------------------------------------------1 Yes 1039 540 2 No 18160 9433 7 Refused 30 016 8 Not ascertained 4 002 9 Dont know 19 010
Frequency Missing = 15273
ACN372_00040 Prostate problems past 12 months
PROSTYR Frequency Percent ------------------------------------------1 Yes 961 982 2 No 8799 8992 7 Refused 8 008 8 Not ascertained 4 004 9 Dont know 13 013
Frequency Missing = 24740
57
2012 National Health Interview Survey (NHIS)Sample Adult Public Use File (samadult)
ACN Variables Thursday May 16 2013Unweighted Frequencies
ACN400_00000 Now use a hearing aid
HRAIDNOW Frequency Percent ------------------------------------------1 Yes 1093 317 2 No 33423 9681 7 Refused 5 001 8 Not ascertained 4 001 9 Dont know 0 000
ACN410_00000 Ever used a hearing aid if not now using
HRAIDEV Frequency Percent ------------------------------------------1 Yes 321 096 2 No 33099 9902 7 Refused 6 002 8 Not ascertained 0 000 9 Dont know 2 001
Frequency Missing = 1097
ACN420_00000 Hearing wo hearing aid
AHEARST1 Frequency Percent ---------------------------------------------------1 Excellent 15817 4581 2 Good 12888 3733 3 A little trouble hearing 3721 1078 4 Moderate trouble 1310 379 5 A lot of trouble 675 196 6 Deaf 101 029 7 Refused 4 001 8 Not ascertained 4 001 9 Dont know 5 001
ACN430_00000 Trouble seeing even wglasseslenses
AVISION Frequency Percent ------------------------------------------1 Yes 3387 981 2 No 31122 9014 7 Refused 3 001 8 Not ascertained 4 001 9 Dont know 9 003
58
2012 National Health Interview Survey (NHIS)Sample Adult Public Use File (samadult)
ACN Variables Thursday May 16 2013Unweighted Frequencies
ACN440_00000 Blind or unable to see at all
ABLIND Frequency Percent ------------------------------------------1 Yes 168 496 2 No 3218 9501 7 Refused 0 000 8 Not ascertained 0 000 9 Dont know 1 003
Frequency Missing = 31138
ACN451_00000 Lost all upper amp lower natural teeth
LUPPRT Frequency Percent ------------------------------------------1 Yes 3200 927 2 No 31306 9068 7 Refused 12 003 8 Not ascertained 4 001 9 Dont know 3 001
ACN471_01000 So sad nothing cheers you up past 30 days
SAD Frequency Percent -----------------------------------------------1 ALL of the time 283 082 2 MOST of the time 770 223 3 SOME of the time 2842 823 4 A LITTLE of the time 4475 1296 5 NONE of the time 26021 7537 7 Refused 65 019 8 Not ascertained 14 004 9 Dont know 55 016
ACN471_02000 How often felt nervous past 30 days
NERVOUS Frequency Percent -----------------------------------------------1 ALL of the time 501 145 2 MOST of the time 974 282 3 SOME of the time 4029 1167 4 A LITTLE of the time 6081 1761 5 NONE of the time 22813 6608 7 Refused 62 018 8 Not ascertained 15 004 9 Dont know 50 014
59
2012 National Health Interview Survey (NHIS)Sample Adult Public Use File (samadult)
ACN Variables Thursday May 16 2013Unweighted Frequencies
ACN471_03000 How often restlessfidgety past 30 days
RESTLESS Frequency Percent -----------------------------------------------1 ALL of the time 678 196 2 MOST of the time 1093 317 3 SOME of the time 3819 1106 4 A LITTLE of the time 4839 1402 5 NONE of the time 23970 6943 7 Refused 61 018 8 Not ascertained 16 005 9 Dont know 49 014
ACN471_04000 How often felt hopeless past 30 days
HOPELESS Frequency Percent -----------------------------------------------1 ALL of the time 304 088 2 MOST of the time 486 141 3 SOME of the time 1578 457 4 A LITTLE of the time 2087 604 5 NONE of the time 29928 8669 7 Refused 65 019 8 Not ascertained 16 005 9 Dont know 61 018
ACN471_05000 How often felt everything was an effort past 30 days
EFFORT Frequency Percent -----------------------------------------------1 ALL of the time 884 256 2 MOST of the time 1120 324 3 SOME of the time 2896 839 4 A LITTLE of the time 3387 981 5 NONE of the time 26073 7552 7 Refused 64 019 8 Not ascertained 17 005 9 Dont know 84 024
ACN471_06000 How often felt worthless past 30 days
WORTHLS Frequency Percent -----------------------------------------------1 ALL of the time 288 083 2 MOST of the time 407 118 3 SOME of the time 1254 363 4 A LITTLE of the time 1518 440 5 NONE of the time 30907 8952 7 Refused 65 019 8 Not ascertained 18 005 9 Dont know 68 020
60
2012 National Health Interview Survey (NHIS)Sample Adult Public Use File (samadult)
ACN Variables Thursday May 16 2013Unweighted Frequencies
ACN530_00000 Feelings interfered wlife past 30 days
MHAMTMO Frequency Percent ------------------------------------------1 A lot 1341 1350 2 Some 2345 2361 3 A little 2856 2875 4 Not at all 3381 3404 7 Refused 2 002 8 Not ascertained 2 002 9 Dont know 6 006
Frequency Missing = 24592
61
2012 National Health Interview Survey (NHIS)Sample Adult Public Use File (samadult)
ACD Variables Thursday May 16 2013Unweighted Frequencies
ACD010_00000 Voice problem past 12 months
VSLVYR Frequency Percent ------------------------------------------1 Yes 2746 795 2 No 31734 9192 7 Refused 7 002 8 Not ascertained 30 009 9 Dont know 8 002
ACD015_00000 Swallowing problem past 12 months
VSLSWYR Frequency Percent ------------------------------------------1 Yes 1554 450 2 No 32925 9537 7 Refused 9 003 8 Not ascertained 32 009 9 Dont know 5 001
ACD020_00000 Speech problem past 12 months
VSLSPYR Frequency Percent ------------------------------------------1 Yes 1061 307 2 No 33422 9681 7 Refused 7 002 8 Not ascertained 33 010 9 Dont know 2 001
ACD025_00000 Language problem past 12 months
VSLLGYR Frequency Percent ------------------------------------------1 Yes 592 171 2 No 33884 9814 7 Refused 7 002 8 Not ascertained 34 010 9 Dont know 8 002
ACD030_00000 Special services or instruction for problem(s)
VSLSPEC Frequency Percent ------------------------------------------1 Yes 1605 465 2 No 32834 9510 7 Refused 9 003 8 Not ascertained 34 010 9 Dont know 43 012
62
2012 National Health Interview Survey (NHIS)Sample Adult Public Use File (samadult)
ACD Variables Thursday May 16 2013Unweighted Frequencies
ACD035_00000 Ever had voice swallowingspeech or language problem lasting 1+ weeks
VSLEVER Frequency Percent ------------------------------------------1 Yes 787 260 2 No 29435 9733 7 Refused 9 003 8 Not ascertained 1 000 9 Dont know 12 004
Frequency Missing = 4281
ACD040_00000 Given diagnosis for voice swallowing speech language problem
VSLHPD Frequency Percent ------------------------------------------1 Yes 1438 2856 2 No 3564 7078 7 Refused 1 002 8 Not ascertained 2 004 9 Dont know 30 060
Frequency Missing = 29490
ACD045_01000 Given diagnosis for voice problem
VSLDGTP1 Frequency Percent ------------------------------------------1 Mentioned 623 4332 2 Not mentioned 811 5640 7 Refused 0 000 8 Not ascertained 0 000 9 Dont know 4 028
Frequency Missing = 33087
ACD045_02000 Given diagnosis for swallowing problem
VSLDGTP2 Frequency Percent ------------------------------------------1 Mentioned 587 4082 2 Not mentioned 847 5890 7 Refused 0 000 8 Not ascertained 0 000 9 Dont know 4 028
Frequency Missing = 33087
63
2012 National Health Interview Survey (NHIS)Sample Adult Public Use File (samadult)
ACD Variables Thursday May 16 2013Unweighted Frequencies
ACD045_03000 Given diagnosis for speech problem
VSLDGTP3 Frequency Percent ------------------------------------------1 Mentioned 527 3665 2 Not mentioned 907 6307 7 Refused 0 000 8 Not ascertained 0 000 9 Dont know 4 028
Frequency Missing = 33087
ACD045_04000 Given diagnosis for language problem
VSLDGTP4 Frequency Percent ------------------------------------------1 Mentioned 165 1147 2 Not mentioned 1269 8825 7 Refused 0 000 8 Not ascertained 0 000 9 Dont know 4 028
Frequency Missing = 33087
ACD050_01000 Laryngitis caused by voicemisuse abuse overuse caused voice problem
VSLVDG01 Frequency Percent ------------------------------------------1 Mentioned 38 610 2 Not mentioned 581 9326 7 Refused 0 000 8 Not ascertained 0 000 9 Dont know 4 064
Frequency Missing = 33902
ACD050_02000 Laryngitis caused by coldsstrep caused voice problem
VSLVDG02 Frequency Percent ------------------------------------------1 Mentioned 109 1750 2 Not mentioned 510 8186 7 Refused 0 000 8 Not ascertained 0 000 9 Dont know 4 064
Frequency Missing = 33902
64
2012 National Health Interview Survey (NHIS)Sample Adult Public Use File (samadult)
ACD Variables Thursday May 16 2013Unweighted Frequencies
ACD050_03000 Vocal nodules or polyps caused voice problem
VSLVDG03 Frequency Percent ------------------------------------------1 Mentioned 56 899 2 Not mentioned 563 9037 7 Refused 0 000 8 Not ascertained 0 000 9 Dont know 4 064
Frequency Missing = 33902
ACD050_04000 Gastro-esophageal reflux disease (GERD) caused voice problem
VSLVDG04 Frequency Percent ------------------------------------------1 Mentioned 51 819 2 Not mentioned 568 9117 7 Refused 0 000 8 Not ascertained 0 000 9 Dont know 4 064
Frequency Missing = 33902
ACD050_05000 Allergies caused voice problem
VSLVDG05 Frequency Percent ------------------------------------------1 Mentioned 64 1027 2 Not mentioned 555 8909 7 Refused 0 000 8 Not ascertained 0 000 9 Dont know 4 064
Frequency Missing = 33902
ACD050_06000 Airborne irritants or environmental pollutants caused voice problem
VSLVDG06 Frequency Percent ------------------------------------------1 Mentioned 6 096 2 Not mentioned 613 9839 7 Refused 0 000 8 Not ascertained 0 000 9 Dont know 4 064
Frequency Missing = 33902
65
2012 National Health Interview Survey (NHIS)Sample Adult Public Use File (samadult)
ACD Variables Thursday May 16 2013Unweighted Frequencies
ACD050_07000 Headneck injury caused voice problem
VSLVDG07 Frequency Percent ------------------------------------------1 Mentioned 11 177 2 Not mentioned 608 9759 7 Refused 0 000 8 Not ascertained 0 000 9 Dont know 4 064
Frequency Missing = 33902
ACD050_08000 Cancer anywhere in the headneck or throat caused voice problem
VSLVDG08 Frequency Percent ------------------------------------------1 Mentioned 28 449 2 Not mentioned 591 9486 7 Refused 0 000 8 Not ascertained 0 000 9 Dont know 4 064
Frequency Missing = 33902
ACD050_09000 Neurological cause (AlzheimersParkinsons dementia etc) caused voice problem
VSLVDG09 Frequency Percent ------------------------------------------1 Mentioned 29 465 2 Not mentioned 590 9470 7 Refused 0 000 8 Not ascertained 0 000 9 Dont know 4 064
Frequency Missing = 33902
ACD050_10000 Prescription medication or drugs caused voice problem
VSLVDG10 Frequency Percent ------------------------------------------1 Mentioned 26 417 2 Not mentioned 593 9518 7 Refused 0 000 8 Not ascertained 0 000 9 Dont know 4 064
Frequency Missing = 33902
66
2012 National Health Interview Survey (NHIS)Sample Adult Public Use File (samadult)
ACD Variables Thursday May 16 2013Unweighted Frequencies
ACD050_11000 Something else caused voice problem
VSLVDG11 Frequency Percent ------------------------------------------1 Mentioned 263 4222 2 Not mentioned 356 5714 7 Refused 0 000 8 Not ascertained 0 000 9 Dont know 4 064
Frequency Missing = 33902
ACD060_01000 Stroke caused swallowing problem
VSLSWD01 Frequency Percent ------------------------------------------1 Mentioned 60 1022 2 Not mentioned 522 8893 7 Refused 0 000 8 Not ascertained 0 000 9 Dont know 5 085
Frequency Missing = 33938
ACD060_02000 Neurological cause (Alzheimers Parkinsonspost-polio syndrome dementia etc) caused swallowing problem
VSLSWD02 Frequency Percent ------------------------------------------1 Mentioned 36 613 2 Not mentioned 546 9302 7 Refused 0 000 8 Not ascertained 0 000 9 Dont know 5 085
Frequency Missing = 33938
ACD060_03000 Cancer anywhere in the headneck or throat caused swallowing problem
VSLSWD03 Frequency Percent ------------------------------------------1 Mentioned 33 562 2 Not mentioned 549 9353 7 Refused 0 000 8 Not ascertained 0 000 9 Dont know 5 085
Frequency Missing = 33938
67
2012 National Health Interview Survey (NHIS)Sample Adult Public Use File (samadult)
ACD Variables Thursday May 16 2013Unweighted Frequencies
ACD060_04000 Chronic obstructive pulmonarydisease (COPD) caused swallowing problem
VSLSWD04 Frequency Percent ------------------------------------------1 Mentioned 5 085 2 Not mentioned 577 9830 7 Refused 0 000 8 Not ascertained 0 000 9 Dont know 5 085
Frequency Missing = 33938
ACD060_05000 Congestive heart failure (CHF) caused swallowing problem
VSLSWD05 Frequency Percent ------------------------------------------1 Mentioned 7 119 2 Not mentioned 575 9796 7 Refused 0 000 8 Not ascertained 0 000 9 Dont know 5 085
Frequency Missing = 33938
ACD060_06000 Headneck injury caused swallowing problem
VSLSWD06 Frequency Percent ------------------------------------------1 Mentioned 16 273 2 Not mentioned 566 9642 7 Refused 0 000 8 Not ascertained 0 000 9 Dont know 5 085
Frequency Missing = 33938
ACD060_07000 Arthritic changes in the neck (arthritiscervical osteophyte) caused swallowing problem
VSLSWD07 Frequency Percent ------------------------------------------1 Mentioned 7 119 2 Not mentioned 575 9796 7 Refused 0 000 8 Not ascertained 0 000 9 Dont know 5 085
Frequency Missing = 33938
68
2012 National Health Interview Survey (NHIS)Sample Adult Public Use File (samadult)
ACD Variables Thursday May 16 2013Unweighted Frequencies
ACD060_08000 Advancing age (deterioration of musclefunction with agehellipsarcopenia) caused swallowing problem
VSLSWD08 Frequency Percent ------------------------------------------1 Mentioned 20 341 2 Not mentioned 562 9574 7 Refused 0 000 8 Not ascertained 0 000 9 Dont know 5 085
Frequency Missing = 33938
ACD060_09000 Prescription medication or drugs caused swallowing problem
VSLSWD09 Frequency Percent ------------------------------------------1 Mentioned 17 290 2 Not mentioned 565 9625 7 Refused 0 000 8 Not ascertained 0 000 9 Dont know 5 085
Frequency Missing = 33938
ACD060_10000 Something else caused swallowing problem
VSLSWD10 Frequency Percent ------------------------------------------1 Mentioned 407 6934 2 Not mentioned 175 2981 7 Refused 0 000 8 Not ascertained 0 000 9 Dont know 5 085
Frequency Missing = 33938
ACD065_01000 Hearing loss or deafness caused speech problem
VSLSPD01 Frequency Percent ------------------------------------------1 Mentioned 46 873 2 Not mentioned 467 8861 7 Refused 0 000 8 Not ascertained 0 000 9 Dont know 14 266
Frequency Missing = 33998
69
2012 National Health Interview Survey (NHIS)Sample Adult Public Use File (samadult)
ACD Variables Thursday May 16 2013Unweighted Frequencies
ACD065_02000 Developmental speech sound disorder (phonologicalarticulatory dyspraxia) caused speech problem
VSLSPD02 Frequency Percent ------------------------------------------1 Mentioned 79 1499 2 Not mentioned 434 8235 7 Refused 0 000 8 Not ascertained 0 000 9 Dont know 14 266
Frequency Missing = 33998
ACD065_03000 Cerebral palsy caused speech problem
VSLSPD03 Frequency Percent ------------------------------------------1 Mentioned 9 171 2 Not mentioned 504 9564 7 Refused 0 000 8 Not ascertained 0 000 9 Dont know 14 266
Frequency Missing = 33998
ACD065_04000 Cleft lippalate cranial-facialanomaly (structural cause) caused speech problem
VSLSPD04 Frequency Percent ------------------------------------------1 Mentioned 11 209 2 Not mentioned 502 9526 7 Refused 0 000 8 Not ascertained 0 000 9 Dont know 14 266
Frequency Missing = 33998
ACD065_05000 Headneck injury caused speech problem
VSLSPD05 Frequency Percent ------------------------------------------1 Mentioned 14 266 2 Not mentioned 499 9469 7 Refused 0 000 8 Not ascertained 0 000 9 Dont know 14 266
Frequency Missing = 33998
70
2012 National Health Interview Survey (NHIS)Sample Adult Public Use File (samadult)
ACD Variables Thursday May 16 2013Unweighted Frequencies
ACD065_06000 Stuttering caused speech problem
VSLSPD06 Frequency Percent ------------------------------------------1 Mentioned 52 987 2 Not mentioned 461 8748 7 Refused 0 000 8 Not ascertained 0 000 9 Dont know 14 266
Frequency Missing = 33998
ACD065_07000 Cancer anywhere in the headneck or throat caused speech problem
VSLSPD07 Frequency Percent ------------------------------------------1 Mentioned 8 152 2 Not mentioned 505 9583 7 Refused 0 000 8 Not ascertained 0 000 9 Dont know 14 266
Frequency Missing = 33998
ACD065_08000 Neurological causedysarthria (Alzheimers ParkinsonsALS multiple sclerosis dementia etc) caused speech problem
VSLSPD08 Frequency Percent ------------------------------------------1 Mentioned 53 1006 2 Not mentioned 460 8729 7 Refused 0 000 8 Not ascertained 0 000 9 Dont know 14 266
Frequency Missing = 33998
ACD065_09000 Prescription medication or drugs caused speech problem
VSLSPD09 Frequency Percent ------------------------------------------1 Mentioned 9 171 2 Not mentioned 504 9564 7 Refused 0 000 8 Not ascertained 0 000 9 Dont know 14 266
Frequency Missing = 33998
71
2012 National Health Interview Survey (NHIS)Sample Adult Public Use File (samadult)
ACD Variables Thursday May 16 2013Unweighted Frequencies
ACD065_10000 Something else caused speech problem
VSLSPD10 Frequency Percent ------------------------------------------1 Mentioned 265 5028 2 Not mentioned 248 4706 7 Refused 0 000 8 Not ascertained 0 000 9 Dont know 14 266
Frequency Missing = 33998
ACD070_01000 Hearing loss or deafness caused problemsusing or understanding words or sentences
VSLLGD01 Frequency Percent ------------------------------------------1 Mentioned 13 788 2 Not mentioned 148 8970 7 Refused 0 000 8 Not ascertained 0 000 9 Dont know 4 242
Frequency Missing = 34360
ACD070_02000 Genetic syndrome Down Syndrome Fragile X Syndromeetc cause problems using or understanding words or sentences
VSLLGD02 Frequency Percent ------------------------------------------1 Mentioned 7 424 2 Not mentioned 154 9333 7 Refused 0 000 8 Not ascertained 0 000 9 Dont know 4 242
Frequency Missing = 34360
ACD070_03000 Intellectual disability also known as mental retardationcaused problem using or understanding words or sentences
VSLLGD03 Frequency Percent ------------------------------------------1 Mentioned 18 1091 2 Not mentioned 143 8667 7 Refused 0 000 8 Not ascertained 0 000 9 Dont know 4 242
Frequency Missing = 34360
72
2012 National Health Interview Survey (NHIS)Sample Adult Public Use File (samadult)
ACD Variables Thursday May 16 2013Unweighted Frequencies
ACD070_04000 Autism spectrum disorder caused problemusing or understanding words or sentences
VSLLGD04 Frequency Percent ------------------------------------------1 Mentioned 8 485 2 Not mentioned 153 9273 7 Refused 0 000 8 Not ascertained 0 000 9 Dont know 4 242
Frequency Missing = 34360
ACD070_05000 Developmental Language-Learning Disorder (egSpecific Language Impairment (SLI) learning disability or dyslexia)
cause problem using or understanding words or sentences
VSLLGD05 Frequency Percent ------------------------------------------1 Mentioned 24 1455 2 Not mentioned 137 8303 7 Refused 0 000 8 Not ascertained 0 000 9 Dont know 4 242
Frequency Missing = 34360
ACD070_06000 Other developmental delay causedproblem using or understanding words or sentences
VSLLGD06 Frequency Percent ------------------------------------------1 Mentioned 7 424 2 Not mentioned 154 9333 7 Refused 0 000 8 Not ascertained 0 000 9 Dont know 4 242
Frequency Missing = 34360
ACD070_07000 Head injury traumatic brain injury (TBI)caused problem using or understanding words or sentences
VSLLGD07 Frequency Percent ------------------------------------------1 Mentioned 12 727 2 Not mentioned 149 9030 7 Refused 0 000 8 Not ascertained 0 000 9 Dont know 4 242
Frequency Missing = 34360
73
2012 National Health Interview Survey (NHIS)Sample Adult Public Use File (samadult)
ACD Variables Thursday May 16 2013Unweighted Frequencies
ACD070_08000 Strokeaphasia caused problemusing or understanding words or sentences
VSLLGD08 Frequency Percent ------------------------------------------1 Mentioned 37 2242 2 Not mentioned 124 7515 7 Refused 0 000 8 Not ascertained 0 000 9 Dont know 4 242
Frequency Missing = 34360
ACD070_09000 Dementia or other neurological cause (Alzheimers Parkinsonsetc) caused problem using or understanding words or sentences
VSLLGD09 Frequency Percent ------------------------------------------1 Mentioned 13 788 2 Not mentioned 148 8970 7 Refused 0 000 8 Not ascertained 0 000 9 Dont know 4 242
Frequency Missing = 34360
ACD070_10000 Prescription medication or drugs causedproblem using or understanding words or sentences
VSLLGD10 Frequency Percent ------------------------------------------1 Mentioned 8 485 2 Not mentioned 153 9273 7 Refused 0 000 8 Not ascertained 0 000 9 Dont know 4 242
Frequency Missing = 34360
ACD070_11000 Something else caused problemusing or understanding words or sentences
VSLLGD11 Frequency Percent ------------------------------------------1 Mentioned 49 2970 2 Not mentioned 112 6788 7 Refused 0 000 8 Not ascertained 0 000 9 Dont know 4 242
Frequency Missing = 34360
74
2012 National Health Interview Survey (NHIS)Sample Adult Public Use File (samadult)
ACD Variables Thursday May 16 2013Unweighted Frequencies
ACD075_00000 Number of days had voice problems in past year
VSLVDYS Frequency Percent --------------------------------------------001-365 1-365 2612 9512 997 Refused 3 011 998 Not ascertained 3 011 999 Dont know 128 466
Frequency Missing = 31779
ACD080_00000 Number of days had swallowing problems in past year
VSLSWDYS Frequency Percent --------------------------------------------001-365 1-365 1473 9479 997 Refused 2 013 998 Not ascertained 3 019 999 Dont know 76 489
Frequency Missing = 32971
ACD082_00000 Number of days had speech problems in past year
VSLSPDYS Frequency Percent --------------------------------------------001-365 1-365 959 9039 997 Refused 3 028 998 Not ascertained 0 000 999 Dont know 99 933
Frequency Missing = 33464
ACD085_00000 Number of days had problemsusing or understanding words or sentences
VSLLGDYS Frequency Percent --------------------------------------------001-365 1-365 526 8885 997 Refused 4 068 998 Not ascertained 0 000 999 Dont know 62 1047
Frequency Missing = 33933
75
2012 National Health Interview Survey (NHIS)Sample Adult Public Use File (samadult)
ACD Variables Thursday May 16 2013Unweighted Frequencies
ACD090_00000 Voice problems last 1+ weeks
VSLV1WK Frequency Percent ------------------------------------------1 Yes 44 3438 2 No 75 5859 7 Refused 0 000 8 Not ascertained 1 078 9 Dont know 8 625
Frequency Missing = 34397
ACD095_00000 Swallowing problems last 1+ weeks
VSLSW1WK Frequency Percent ------------------------------------------1 Yes 32 4211 2 No 39 5132 7 Refused 0 000 8 Not ascertained 0 000 9 Dont know 5 658
Frequency Missing = 34449
ACD100_00000 Speech problems last 1+ weeks
VSLSP1WK Frequency Percent ------------------------------------------1 Yes 35 3535 2 No 59 5960 7 Refused 0 000 8 Not ascertained 0 000 9 Dont know 5 505
Frequency Missing = 34426
ACD105_00000 Problems using or understanding words or sentences last 1+ weeks
VSLLG1WK Frequency Percent ------------------------------------------1 Yes 28 4516 2 No 28 4516 7 Refused 0 000 8 Not ascertained 0 000 9 Dont know 6 968
Frequency Missing = 34463
76
2012 National Health Interview Survey (NHIS)Sample Adult Public Use File (samadult)
ACD Variables Thursday May 16 2013Unweighted Frequencies
ACD110_00000 Stammering or stuttering problem in past 12 months
VSLSTUTT Frequency Percent ------------------------------------------1 Yes 332 4456 2 No 411 5517 7 Refused 0 000 8 Not ascertained 0 000 9 Dont know 2 027
Frequency Missing = 33780
ACD115_00000 Degree of stammering or stuttering problem
VSLSTDEG Frequency Percent ------------------------------------------1 Mild 215 6476 2 Moderate 87 2620 3 Severe 28 843 7 Refused 1 030 8 Not ascertained 0 000 9 Dont know 1 030
Frequency Missing = 34193
ACD120_00000 Family friends associates had troubleunderstanding what you say in past 12 months
VSLLGFAM Frequency Percent ------------------------------------------1 Yes 283 6139 2 No 176 3818 7 Refused 0 000 8 Not ascertained 0 000 9 Donrsquot know 2 043
Frequency Missing = 34064
ACD125_00000 Age first had voice problems
VSLVAGE Frequency Percent --------------------------------------------000-120 Current Age 1391 9380 997 Refused 3 020 998 Not ascertained 0 000 999 Dont know 89 600
Frequency Missing = 33042
77
2012 National Health Interview Survey (NHIS)Sample Adult Public Use File (samadult)
ACD Variables Thursday May 16 2013Unweighted Frequencies
ACD130_00000 Age first had swallowing problems
VSLSWAGE Frequency Percent --------------------------------------------000-120 Current Age 951 9587 997 Refused 2 020 998 Not ascertained 0 000 999 Dont know 39 393
Frequency Missing = 33533
ACD135_00000 Age first had speech problems
VSLSPAGE Frequency Percent --------------------------------------------000-120 Current Age 703 9436 997 Refused 0 000 998 Not ascertained 0 000 999 Dont know 42 564
Frequency Missing = 33780
ACD140_00000 Age first had problems using or understanding words or sentences
VSLLGAGE Frequency Percent --------------------------------------------000-120 Current Age 429 9306 997 Refused 0 000 998 Not ascertained 0 000 999 Dont know 32 694
Frequency Missing = 34064
ACD145_00000 How much of a problem with your voice in past 12 months
VSLVPRB Frequency Percent ---------------------------------------------1 No problem 207 1396 2 A small problem 748 5044 3 A moderate problem 345 2326 4 A big problem 99 668 5 A very big problem 77 519 7 Refused 2 013 8 Not ascertained 2 013 9 Dont know 3 020
Frequency Missing = 33042
78
2012 National Health Interview Survey (NHIS)Sample Adult Public Use File (samadult)
ACD Variables Thursday May 16 2013Unweighted Frequencies
ACD150_00000 How much of a problem with swallowing in past 12 months
VSLSWPRB Frequency Percent ---------------------------------------------1 No problem 40 403 2 A small problem 387 3901 3 A moderate problem 323 3256 4 A big problem 157 1583 5 A very big problem 82 827 7 Refused 1 010 8 Not ascertained 0 000 9 Dont know 2 020
Frequency Missing = 33533
ACD155_00000 How much of a problem with speech in the past 12 months
VSLSPPRB Frequency Percent ---------------------------------------------1 No problem 79 1060 2 A small problem 336 4510 3 A moderate problem 184 2470 4 A big problem 75 1007 5 A very big problem 65 872 7 Refused 0 000 8 Not ascertained 1 013 9 Dont know 5 067
Frequency Missing = 33780
ACD160_00000 How much of a problem using or understandingwords or sentences in the past 12 months
VSLLGPRB Frequency Percent ---------------------------------------------1 No problem 30 651 2 A small problem 154 3341 3 A moderate problem 129 2798 4 A big problem 79 1714 5 A very big problem 64 1388 7 Refused 0 000 8 Not ascertained 1 022 9 Dont know 4 087
Frequency Missing = 34064
79
2012 National Health Interview Survey (NHIS)Sample Adult Public Use File (samadult)
ACD Variables Thursday May 16 2013Unweighted Frequencies
ACD165_00000 Seen speech-language pathologist (SLP) or otherhealth care professional for voice problem in past 12 months
VSLVSLP Frequency Percent ------------------------------------------1 Yes 148 998 2 No 1330 8968 7 Refused 1 007 8 Not ascertained 2 013 9 Dont know 2 013
Frequency Missing = 33042
ACD170_00000 Ever seen speech-language pathologist (SLP)or other health care professional about voice problem
VSLVPEV Frequency Percent ------------------------------------------1 Yes 155 1165 2 No 1171 8805 7 Refused 1 008 8 Not ascertained 1 008 9 Dont know 2 015
Frequency Missing = 33195
ACD175_00000 Seen speech-language pathologist (SLP) or other healthcare professional for swallowing problem in past 12 months
VSLSWSLP Frequency Percent ------------------------------------------1 Yes 219 2208 2 No 772 7782 7 Refused 1 010 8 Not ascertained 0 000 9 Dont know 0 000
Frequency Missing = 33533
ACD180_00000 Ever seen speech-language pathologist (SLP)or other health care professional about swallowing problem
VSLSWPEV Frequency Percent ------------------------------------------1 Yes 96 1244 2 No 676 8756 7 Refused 0 000 8 Not ascertained 0 000 9 Dont know 0 000
Frequency Missing = 33753
80
2012 National Health Interview Survey (NHIS)Sample Adult Public Use File (samadult)
ACD Variables Thursday May 16 2013Unweighted Frequencies
ACD185_00000 Seen speech-language pathologist (SLP) or otherhealth professional for speech problem in past 12 months
VSLSPSLP Frequency Percent ------------------------------------------1 Yes 100 1342 2 No 640 8591 7 Refused 0 000 8 Not ascertained 1 013 9 Dont know 4 054
Frequency Missing = 33780
ACD190_00000 Ever seen speech-language pathologist (SLP) or otherhealth care professional about speech problem in past 12 months
VSLSPPEV Frequency Percent ------------------------------------------1 Yes 163 2547 2 No 472 7375 7 Refused 0 000 8 Not ascertained 0 000 9 Dont know 5 078
Frequency Missing = 33885
ACD195_00000 Seen speech-language pathologist (SLP) or other health careprofessional for problem using or understanding
words or sentences in past 12 months
VSLLGSLP Frequency Percent ------------------------------------------1 Yes 64 1388 2 No 393 8525 7 Refused 0 000 8 Not ascertained 1 022 9 Dont know 3 065
Frequency Missing = 34064
ACD200_00000 Ever seen speech-language pathologist (SLP)or other health care professional about problem usingor understanding words or sentences in past 12 months
VSLLGPEV Frequency Percent ------------------------------------------1 Yes 98 2494 2 No 293 7455 7 Refused 0 000 8 Not ascertained 0 000 9 Dont know 2 051
Frequency Missing = 34132
81
2012 National Health Interview Survey (NHIS)Sample Adult Public Use File (samadult)
ACD Variables Thursday May 16 2013Unweighted Frequencies
ACD205_00000 Received treatments therapy or other rehabilitationservices for voice problems in past 12 months
VSLVTRT Frequency Percent ------------------------------------------1 Yes 144 971 2 No 1333 8989 7 Refused 2 013 8 Not ascertained 3 020 9 Dont know 1 007
Frequency Missing = 33042
ACD210_01000 Speech-language pathologist provided voice services
VSLVTR01 Frequency Percent ------------------------------------------1 Mentioned 30 2083 2 Not mentioned 114 7917 7 Refused 0 000 8 Not ascertained 0 000 9 Dont know 0 000
Frequency Missing = 34381
ACD210_02000 Family physician General Practitioneror Osteopath provided voice services
VSLVTR02 Frequency Percent ------------------------------------------1 Mentioned 56 3889 2 Not mentioned 88 6111 7 Refused 0 000 8 Not ascertained 0 000 9 Dont know 0 000
Frequency Missing = 34381
ACD210_03000 Rehabilitation Specialist (Occupationalor Physical Therapist) provided voices services
VSLVTR03 Frequency Percent ------------------------------------------1 Mentioned 15 1042 2 Not mentioned 129 8958 7 Refused 0 000 8 Not ascertained 0 000 9 Dont know 0 000
Frequency Missing = 34381
82
2012 National Health Interview Survey (NHIS)Sample Adult Public Use File (samadult)
ACD Variables Thursday May 16 2013Unweighted Frequencies
ACD210_04000 Ear Nose Throat Doctor (Otolaryngologist)provided voice services
VSLVTR04 Frequency Percent ------------------------------------------1 Mentioned 32 2222 2 Not mentioned 112 7778 7 Refused 0 000 8 Not ascertained 0 000 9 Dont know 0 000
Frequency Missing = 34381
ACD210_05000 Audiologist Hearing Specialistor Hearing Aid Technician provided voice services
VSLVTR05 Frequency Percent ------------------------------------------1 Mentioned 3 208 2 Not mentioned 141 9792 7 Refused 0 000 8 Not ascertained 0 000 9 Dont know 0 000
Frequency Missing = 34381
ACD210_06000 Specialty doctor in Internal MedicineGeriatrics Neurology etc provided voice services
VSLVTR06 Frequency Percent ------------------------------------------1 Mentioned 13 903 2 Not mentioned 131 9097 7 Refused 0 000 8 Not ascertained 0 000 9 Dont know 0 000
Frequency Missing = 34381
ACD210_07000 Nutritionist or Dietician provided voice services
VSLVTR07 Frequency Percent ------------------------------------------1 Mentioned 0 000 2 Not mentioned 144 10000 7 Refused 0 000 8 Not ascertained 0 000 9 Dont know 0 000
Frequency Missing = 34381
83
2012 National Health Interview Survey (NHIS)Sample Adult Public Use File (samadult)
ACD Variables Thursday May 16 2013Unweighted Frequencies
ACD210_08000 Psychiatrist or Psychologist provided voice services
VSLVTR08 Frequency Percent ------------------------------------------1 Mentioned 3 208 2 Not mentioned 141 9792 7 Refused 0 000 8 Not ascertained 0 000 9 Dont know 0 000
Frequency Missing = 34381
ACD210_09000 Nurse or Nurse Practitioner provided voice services
VSLVTR09 Frequency Percent ------------------------------------------1 Mentioned 2 139 2 Not mentioned 142 9861 7 Refused 0 000 8 Not ascertained 0 000 9 Dont know 0 000
Frequency Missing = 34381
ACD210_10000 Dentist Orthodontist or Oral Surgeon provided voice services
VSLVTR10 Frequency Percent ------------------------------------------1 Mentioned 1 069 2 Not mentioned 143 9931 7 Refused 0 000 8 Not ascertained 0 000 9 Dont know 0 000
Frequency Missing = 34381
ACD210_11000 Some other health professional provided voice services
VSLVTR11 Frequency Percent ------------------------------------------1 Mentioned 13 903 2 Not mentioned 131 9097 7 Refused 0 000 8 Not ascertained 0 000 9 Dont know 0 000
Frequency Missing = 34381
84
2012 National Health Interview Survey (NHIS)Sample Adult Public Use File (samadult)
ACD Variables Thursday May 16 2013Unweighted Frequencies
ACD215_00000 Received treatments therapy or other rehabilitationservices for swallowing problems in past 12 months
VSLSWTRT Frequency Percent ------------------------------------------1 Yes 188 1895 2 No 803 8095 7 Refused 1 010 8 Not ascertained 0 000 9 Dont know 0 000
Frequency Missing = 33533
ACD220_01000 Speech-language pathologist provided swallowing services
VSLSWT01 Frequency Percent ------------------------------------------1 Mentioned 20 1064 2 Not mentioned 166 8830 7 Refused 0 000 8 Not ascertained 0 000 9 Dont know 2 106
Frequency Missing = 34337
ACD220_02000 Family physician General Practitioneror Osteopath provided swallowing services
VSLSWT02 Frequency Percent ------------------------------------------1 Mentioned 57 3032 2 Not mentioned 129 6862 7 Refused 0 000 8 Not ascertained 0 000 9 Dont know 2 106
Frequency Missing = 34337
ACD220_03000 Rehabilitation Specialist (Occupationalor Physical Therapist) provided swallowing services
VSLSWT03 Frequency Percent ------------------------------------------1 Mentioned 19 1011 2 Not mentioned 167 8883 7 Refused 0 000 8 Not ascertained 0 000 9 Dont know 2 106
Frequency Missing = 34337
85
2012 National Health Interview Survey (NHIS)Sample Adult Public Use File (samadult)
ACD Variables Thursday May 16 2013Unweighted Frequencies
ACD220_04000 Ear Nose Throat Doctor (Otolaryngologist)provided swallowing services
VSLSWT04 Frequency Percent ------------------------------------------1 Mentioned 40 2128 2 Not mentioned 146 7766 7 Refused 0 000 8 Not ascertained 0 000 9 Dont know 2 106
Frequency Missing = 34337
ACD220_05000 Audiologist Hearing Specialist orHearing Aid Technician provided swallowing services
VSLSWT05 Frequency Percent ------------------------------------------1 Mentioned 0 000 2 Not mentioned 186 9894 7 Refused 0 000 8 Not ascertained 0 000 9 Dont know 2 106
Frequency Missing = 34337
ACD220_06000 Specialty doctor in Internal Medicine GeriatricsNeurology etc provided swallowing services
VSLSWT06 Frequency Percent ------------------------------------------1 Mentioned 46 2447 2 Not mentioned 140 7447 7 Refused 0 000 8 Not ascertained 0 000 9 Dont know 2 106
Frequency Missing = 34337
ACD220_07000 Nutritionist or Dietician provided swallowing services
VSLSWT07 Frequency Percent ------------------------------------------1 Mentioned 3 160 2 Not mentioned 183 9734 7 Refused 0 000 8 Not ascertained 0 000 9 Dont know 2 106
Frequency Missing = 34337
86
2012 National Health Interview Survey (NHIS)Sample Adult Public Use File (samadult)
ACD Variables Thursday May 16 2013Unweighted Frequencies
ACD220_08000 Psychiatrist or Psychologist provided swallowing services
VSLSWT08 Frequency Percent ------------------------------------------1 Mentioned 3 160 2 Not mentioned 183 9734 7 Refused 0 000 8 Not ascertained 0 000 9 Dont know 2 106
Frequency Missing = 34337
ACD220_09000 Nurse or Nurse Practitioner provided swallowing services
VSLSWT09 Frequency Percent ------------------------------------------1 Mentioned 3 160 2 Not mentioned 183 9734 7 Refused 0 000 8 Not ascertained 0 000 9 Dont know 2 106
Frequency Missing = 34337
ACD220_10000 Dentist Orthodontist orOral Surgeon provided swallowing services
VSLSWT10 Frequency Percent ------------------------------------------1 Mentioned 1 053 2 Not mentioned 185 9840 7 Refused 0 000 8 Not ascertained 0 000 9 Dont know 2 106
Frequency Missing = 34337
ACD220_11000 Some other health professional provided swallowing services
VSLSWT11 Frequency Percent ------------------------------------------1 Mentioned 16 851 2 Not mentioned 170 9043 7 Refused 0 000 8 Not ascertained 0 000 9 Dont know 2 106
Frequency Missing = 34337
87
2012 National Health Interview Survey (NHIS)Sample Adult Public Use File (samadult)
ACD Variables Thursday May 16 2013Unweighted Frequencies
ACD225_00000 Received treatments therapy or other rehabilitationservices for speech problems in past 12 months
VSLSPTRT Frequency Percent ------------------------------------------1 Yes 60 805 2 No 682 9154 7 Refused 0 000 8 Not ascertained 1 013 9 Dont know 2 027
Frequency Missing = 33780
ACD230_01000 Speech-language pathologist provided speech services
VSLSPT01 Frequency Percent ------------------------------------------1 Mentioned 31 5167 2 Not mentioned 29 4833 7 Refused 0 000 8 Not ascertained 0 000 9 Dont know 0 000
Frequency Missing = 34465
ACD230_02000 Family physician General Practitioneror Osteopath provided speech services
VSLSPT02 Frequency Percent ------------------------------------------1 Mentioned 11 1833 2 Not mentioned 49 8167 7 Refused 0 000 8 Not ascertained 0 000 9 Dont know 0 000
Frequency Missing = 34465
ACD230_03000 Rehabilitation Specialist (Occupationalor Physical Therapist) provided speech services
VSLSPT03 Frequency Percent ------------------------------------------1 Mentioned 18 3000 2 Not mentioned 42 7000 7 Refused 0 000 8 Not ascertained 0 000 9 Dont know 0 000
Frequency Missing = 34465
88
2012 National Health Interview Survey (NHIS)Sample Adult Public Use File (samadult)
ACD Variables Thursday May 16 2013Unweighted Frequencies
ACD230_04000 Ear Nose Throat Doctor (Otolaryngologist)provided speech services
VSLSPT04 Frequency Percent ------------------------------------------1 Mentioned 3 500 2 Not mentioned 57 9500 7 Refused 0 000 8 Not ascertained 0 000 9 Dont know 0 000
Frequency Missing = 34465
ACD230_05000 Audiologist Hearing Specialist orHearing Aid Technician provided speech services
VSLSPT05 Frequency Percent ------------------------------------------1 Mentioned 1 167 2 Not mentioned 59 9833 7 Refused 0 000 8 Not ascertained 0 000 9 Dont know 0 000
Frequency Missing = 34465
ACD230_06000 Specialty doctor in Internal MedicineGeriatrics Neurology etc provided speech services
VSLSPT06 Frequency Percent ------------------------------------------1 Mentioned 5 833 2 Not mentioned 55 9167 7 Refused 0 000 8 Not ascertained 0 000 9 Dont know 0 000
Frequency Missing = 34465
ACD230_07000 Nutritionist or Dietician provided speech services
VSLSPT07 Frequency Percent ------------------------------------------1 Mentioned 0 000 2 Not mentioned 60 10000 7 Refused 0 000 8 Not ascertained 0 000 9 Dont know 0 000
Frequency Missing = 34465
89
2012 National Health Interview Survey (NHIS)Sample Adult Public Use File (samadult)
ACD Variables Thursday May 16 2013Unweighted Frequencies
ACD230_08000 Psychiatrist or Psychologist provided speech services
VSLSPT08 Frequency Percent ------------------------------------------1 Mentioned 1 167 2 Not mentioned 59 9833 7 Refused 0 000 8 Not ascertained 0 000 9 Dont know 0 000
Frequency Missing = 34465
ACD230_09000 Nurse or Nurse Practitioner provided speech services
VSLSPT09 Frequency Percent ------------------------------------------1 Mentioned 0 000 2 Not mentioned 60 10000 7 Refused 0 000 8 Not ascertained 0 000 9 Dont know 0 000
Frequency Missing = 34465
ACD230_10000 Dentist Orthodontist or Oral Surgeon provided speech services
VSLSPT10 Frequency Percent ------------------------------------------1 Mentioned 0 000 2 Not mentioned 60 10000 7 Refused 0 000 8 Not ascertained 0 000 9 Dont know 0 000
Frequency Missing = 34465
ACD230_11000 Some other health professional provided speech services
VSLSPT11 Frequency Percent ------------------------------------------1 Mentioned 4 667 2 Not mentioned 56 9333 7 Refused 0 000 8 Not ascertained 0 000 9 Dont know 0 000
Frequency Missing = 34465
90
2012 National Health Interview Survey (NHIS)Sample Adult Public Use File (samadult)
ACD Variables Thursday May 16 2013Unweighted Frequencies
ACD235_00000 Received treatments therapy or other rehabilitation servicesfor problems using or understanding words or sentences in past 12 months
VSLLGTRT Frequency Percent ------------------------------------------1 Yes 40 868 2 No 417 9046 7 Refused 0 000 8 Not ascertained 2 043 9 Dont know 2 043
Frequency Missing = 34064
ACD240_01000 Speech-language pathologist provided language services
VSLLGT01 Frequency Percent ------------------------------------------1 Mentioned 21 5250 2 Not mentioned 18 4500 7 Refused 0 000 8 Not ascertained 0 000 9 Dont know 1 250
Frequency Missing = 34485
ACD240_02000 Family physician General Practitioneror Osteopath provided language services
VSLLGT02 Frequency Percent ------------------------------------------1 Mentioned 9 2250 2 Not mentioned 30 7500 7 Refused 0 000 8 Not ascertained 0 000 9 Dont know 1 250
Frequency Missing = 34485
ACD240_03000 Rehabilitation Specialist (Occupationalor Physical Therapist) provided language services
VSLLGT03 Frequency Percent ------------------------------------------1 Mentioned 11 2750 2 Not mentioned 28 7000 7 Refused 0 000 8 Not ascertained 0 000 9 Dont know 1 250
Frequency Missing = 34485
91
2012 National Health Interview Survey (NHIS)Sample Adult Public Use File (samadult)
ACD Variables Thursday May 16 2013Unweighted Frequencies
ACD240_04000 Ear Nose Throat Doctor (Otolaryngologist)provided language services
VSLLGT04 Frequency Percent ------------------------------------------1 Mentioned 1 250 2 Not mentioned 38 9500 7 Refused 0 000 8 Not ascertained 0 000 9 Dont know 1 250
Frequency Missing = 34485
ACD240_05000 Audiologist Hearing Specialist orHearing Aid Technician provided language services
VSLLGT05 Frequency Percent ------------------------------------------1 Mentioned 1 250 2 Not mentioned 38 9500 7 Refused 0 000 8 Not ascertained 0 000 9 Dont know 1 250
Frequency Missing = 34485
ACD240_06000 Specialty doctor in Internal MedicineGeriatrics Neurology etc provided language services
VSLLGT06 Frequency Percent ------------------------------------------1 Mentioned 2 500 2 Not mentioned 37 9250 7 Refused 0 000 8 Not ascertained 0 000 9 Dont know 1 250
Frequency Missing = 34485
ACD240_07000 Nutritionist or Dietician provided language services
VSLLGT07 Frequency Percent ------------------------------------------1 Mentioned 0 000 2 Not mentioned 39 9750 7 Refused 0 000 8 Not ascertained 0 000 9 Dont know 1 250
Frequency Missing = 34485
92
2012 National Health Interview Survey (NHIS)Sample Adult Public Use File (samadult)
ACD Variables Thursday May 16 2013Unweighted Frequencies
ACD240_08000 Psychiatrist or Psychologist provided language services
VSLLGT08 Frequency Percent ------------------------------------------1 Mentioned 1 250 2 Not mentioned 38 9500 7 Refused 0 000 8 Not ascertained 0 000 9 Dont know 1 250
Frequency Missing = 34485
ACD240_09000 Nurse or Nurse Practitioner provided language services
VSLLGT09 Frequency Percent ------------------------------------------1 Mentioned 0 000 2 Not mentioned 39 9750 7 Refused 0 000 8 Not ascertained 0 000 9 Dont know 1 250
Frequency Missing = 34485
ACD240_10000 Dentist Orthodontist orOral Surgeon provided language services
VSLLGT10 Frequency Percent ------------------------------------------1 Mentioned 0 000 2 Not mentioned 39 9750 7 Refused 0 000 8 Not ascertained 0 000 9 Dont know 1 250
Frequency Missing = 34485
ACD240_11000 Some other health professional provided language services
VSLLGT11 Frequency Percent ------------------------------------------1 Mentioned 3 750 2 Not mentioned 36 9000 7 Refused 0 000 8 Not ascertained 0 000 9 Dont know 1 250
Frequency Missing = 34485
93
2012 National Health Interview Survey (NHIS)Sample Adult Public Use File (samadult)
ACD Variables Thursday May 16 2013Unweighted Frequencies
ACD245_00000 Did treatments or other rehabilitation services for voice problem make personal or social life better
VSLVSOC Frequency Percent ------------------------------------------1 Yes 89 6181 2 No 53 3681 7 Refused 0 000 8 Not ascertained 0 000 9 Dont know 2 139
Frequency Missing = 34381
ACD250_00000 Did treatments or other rehabilitation services for swallowing problem make personal or social life better
VSLSWSOC Frequency Percent ------------------------------------------1 Yes 113 6011 2 No 73 3883 7 Refused 0 000 8 Not ascertained 0 000 9 Dont know 2 106
Frequency Missing = 34337
ACD255_00000 Did treatments or other rehabilitation services for speech problem make personal or social life better
VSLSPSOC Frequency Percent ------------------------------------------1 Yes 36 6000 2 No 21 3500 7 Refused 0 000 8 Not ascertained 0 000 9 Dont know 3 500
Frequency Missing = 34465
ACD260_00000 Did treatments or other rehabilitation services for problemusing or understanding words or sentences make personal or social life better
VSLLGSOC Frequency Percent ------------------------------------------1 Yes 24 6000 2 No 13 3250 7 Refused 0 000 8 Not ascertained 0 000 9 Dont know 3 750
Frequency Missing = 34485
94
2012 National Health Interview Survey (NHIS)Sample Adult Public Use File (samadult)
ACD Variables Thursday May 16 2013Unweighted Frequencies
ACD265_00000 Did treatments or other rehabilitation services for voice problem make school or work life better
VSLVSW Frequency Percent ------------------------------------------1 Yes 52 6842 2 No 24 3158 7 Refused 0 000 8 Not ascertained 0 000 9 Dont know 0 000
Frequency Missing = 34449
ACD270_00000 Did treatments or other rehabilitation services for swallowing problem make school or work life better
VSLSWSW Frequency Percent ------------------------------------------1 Yes 57 6628 2 No 27 3140 7 Refused 0 000 8 Not ascertained 0 000 9 Dont know 2 233
Frequency Missing = 34439
ACD275_00000 Did treatments or other rehabilitation services for speech problem make school or work life better
VSLSPSW Frequency Percent ------------------------------------------1 Yes 9 5000 2 No 9 5000 7 Refused 0 000 8 Not ascertained 0 000 9 Dont know 0 000
Frequency Missing = 34507
ACD280_00000 Did treatments or other rehabilitation services for problemsusing or understanding words or sentences make school or work life better
VSLLGSW Frequency Percent ------------------------------------------1 Yes 5 4545 2 No 6 5455 7 Refused 0 000 8 Not ascertained 0 000 9 Dont know 0 000
Frequency Missing = 34514
95
2012 National Health Interview Survey (NHIS)Sample Adult Public Use File (samadult)
ACD Variables Thursday May 16 2013Unweighted Frequencies
ACD285_00000 Voice problems better or worse compared to 12 months ago
VSLVCOM Frequency Percent ------------------------------------------1 Better 408 2751 2 Worse 207 1396 3 About the same 860 5799 7 Refused 1 007 8 Not ascertained 3 020 9 Dont know 4 027
Frequency Missing = 33042
ACD290_00000 Swallowing problems better or worse compared to 12 months ago
VSLSWCOM Frequency Percent ------------------------------------------1 Better 287 2893 2 Worse 168 1694 3 About the same 534 5383 7 Refused 1 010 8 Not ascertained 0 000 9 Dont know 2 020
Frequency Missing = 33533
ACD295_00000 Speech problems better or worse compared to 12 months ago
VSLSPCOM Frequency Percent ------------------------------------------1 Better 131 1758 2 Worse 97 1302 3 About the same 514 6899 7 Refused 0 000 8 Not ascertained 1 013 9 Dont know 2 027
Frequency Missing = 33780
ACD300_00000 Problems using or understanding wordsor sentences better or worse compared to 12 months ago
VSLLGCOM Frequency Percent ------------------------------------------1 Better 81 1757 2 Worse 71 1540 3 About the same 306 6638 7 Refused 0 000 8 Not ascertained 2 043 9 Dont know 1 022
Frequency Missing = 34064
96
2012 National Health Interview Survey (NHIS)Sample Adult Public Use File (samadult)
ACD Variables Thursday May 16 2013Unweighted Frequencies
ACD305_00000 Get information from Internet about health medicaltreatments or rehabilitation services in past 12 months
VSLINTYR Frequency Percent ------------------------------------------1 Yes 7769 2250 2 No 26673 7726 7 Refused 11 003 8 Not ascertained 51 015 9 Donrsquot know 21 006
ACD310_00000 Did you get information on (voiceswallowingspeechproblemsusing or understanding words or sentences problems in the past 12 months
VSLINTCN Frequency Percent ------------------------------------------1 Yes 272 2231 2 No 943 7736 7 Refused 0 000 8 Not ascertained 0 000 9 Donrsquot know 4 033
Frequency Missing = 33306
ACD315_00000 Was this information written by a doctor other healthprofessional medical associations or other health-related organization
VSLINTPR Frequency Percent ------------------------------------------1 Yes 218 8015 2 No 38 1397 7 Refused 0 000 8 Not ascertained 0 000 9 Donrsquot know 16 588
Frequency Missing = 34253
ACD320_00000 How helpful was the information on the Internet
VSLINTHP Frequency Percent -------------------------------------------1 Very helpful 134 4926 2 Somewhat helpful 120 4412 3 Not helpful 18 662 7 Refused 0 000 8 Not ascertained 0 000 9 Donrsquot know 0 000
Frequency Missing = 34253
97
2012 National Health Interview Survey (NHIS)Sample Adult Public Use File (samadult)
AHS Variables Thursday May 16 2013Unweighted Frequencies
AHS040_00000 Number of work loss days past 12 months
WKDAYR Frequency Percent --------------------------------------------000 None 12536 5618 001-366 1-366 days 9649 4324 997 Refused 19 009 998 Not ascertained 26 012 999 Dont know 83 037
Frequency Missing = 12212
AHS050_00000 Number of bed days past 12 months
BEDDAYR Frequency Percent --------------------------------------------000 None 21974 6365 001-366 1-366 days 12269 3554 997 Refused 28 008 998 Not ascertained 58 017 999 Dont know 196 057
AHS060_00000 Health betterworsesame compared w 12 months ago
AHSTATYR Frequency Percent ------------------------------------------1 Better 6639 1923 2 Worse 2849 825 3 About the same 24947 7226 7 Refused 10 003 8 Not ascertained 60 017 9 Dont know 20 006
AHS070_00000 Have health problem that requires special equipment
SPECEQ Frequency Percent ------------------------------------------1 Yes 2882 835 2 No 31574 9145 7 Refused 5 001 8 Not ascertained 62 018 9 Dont know 2 001
98
2012 National Health Interview Survey (NHIS)Sample Adult Public Use File (samadult)
AHS Variables Thursday May 16 2013Unweighted Frequencies
AHS091_01000 How difficult to walk 14 mile without special equipment
FLWALK Frequency Percent --------------------------------------------------0 Not at all difficult 1 Only a little difficult2 Somewhat difficult 3 Very difficult4 Cant do at all 6 Do not do this activity7 Refused 8 Not ascertained 9 Dont know
27323 7914 1748 506 1547 448 1188 344 1803 522 799 231 7 002 97 028 13 004
AHS091_02000 How difficult to climb 10 steps without special equipment
FLCLIMB Frequency Percent --------------------------------------------------0 Not at all difficult 1 Only a little difficult2 Somewhat difficult 3 Very difficult4 Cant do at all 6 Do not do this activity7 Refused 8 Not ascertained 9 Dont know
28985 8395 1529 443 1235 358 1077 312 1221 354 356 103 8 002 99 029 15 004
AHS091_03000 How difficult to stand 2 hours without special equipment
FLSTAND Frequency Percent --------------------------------------------------0 Not at all difficult 1 Only a little difficult2 Somewhat difficult 3 Very difficult4 Cant do at all 6 Do not do this activity7 Refused 8 Not ascertained 9 Dont know
26367 7637 2069 599 1595 462 1410 408 2345 679 602 174 10 003 99 029 28 008
99
2012 National Health Interview Survey (NHIS)Sample Adult Public Use File (samadult)
AHS Variables Thursday May 16 2013Unweighted Frequencies
AHS091_04000 How difficult to sit 2 hours without special equipment
FLSIT Frequency Percent --------------------------------------------------0 Not at all difficult 1 Only a little difficult2 Somewhat difficult 3 Very difficult4 Cant do at all 6 Do not do this activity7 Refused 8 Not ascertained 9 Dont know
30082 8713 1645 476 1305 378 721 209 516 149 143 041 7 002
100 029 6 002
AHS091_05000 How difficult to stoop bend or kneel without special equipment
FLSTOOP Frequency Percent --------------------------------------------------0 Not at all difficult 1 Only a little difficult2 Somewhat difficult 3 Very difficult4 Cant do at all 6 Do not do this activity7 Refused 8 Not ascertained 9 Dont know
24935 7222 2947 854 2572 745 1980 573 1672 484 302 087 9 003
100 029 8 002
AHS091_06000 How difficult to reach over head without special equipment
FLREACH Frequency Percent --------------------------------------------------0 Not at all difficult 1 Only a little difficult2 Somewhat difficult 3 Very difficult4 Cant do at all 6 Do not do this activity7 Refused 8 Not ascertained 9 Dont know
30967 8969 1191 345 1085 314 660 191 406 118 103 030 7 002
100 029 6 002
100
2012 National Health Interview Survey (NHIS)Sample Adult Public Use File (samadult)
AHS Variables Thursday May 16 2013Unweighted Frequencies
AHS141_01000 How difficult to grasp small objects without special equipment
FLGRASP Frequency Percent --------------------------------------------------0 Not at all difficult 1 Only a little difficult2 Somewhat difficult 3 Very difficult4 Cant do at all 6 Do not do this activity7 Refused 8 Not ascertained 9 Dont know
31310 9069 1323 383 1041 302 540 156 158 046 39 011 8 002
103 030 3 001
AHS141_02000 How difficult to liftcarry 10 lbs without special equipment
FLCARRY Frequency Percent --------------------------------------------------0 Not at all difficult 1 Only a little difficult2 Somewhat difficult 3 Very difficult4 Cant do at all 6 Do not do this activity7 Refused 8 Not ascertained 9 Dont know
29870 8652 1259 365 1118 324 712 206 1079 313 364 105 8 002
103 030 12 003
AHS141_03000 How difficult to push large objects without special equipment
FLPUSH Frequency Percent --------------------------------------------------0 Not at all difficult 1 Only a little difficult2 Somewhat difficult 3 Very difficult4 Cant do at all 6 Do not do this activity7 Refused 8 Not ascertained 9 Dont know
28122 8145 1522 441 1324 383 896 260 1726 500 806 233 10 003 103 030 16 005
101
2012 National Health Interview Survey (NHIS)Sample Adult Public Use File (samadult)
AHS Variables Thursday May 16 2013Unweighted Frequencies
AHS171_01000 How difficult to go out to events without special equipment
FLSHOP Frequency Percent --------------------------------------------------0 Not at all difficult 1 Only a little difficult2 Somewhat difficult 3 Very difficult4 Cant do at all 6 Do not do this activity7 Refused 8 Not ascertained 9 Dont know
30078 8712 1099 318 1201 348 645 187 710 206 673 195 9 003
105 030 5 001
AHS171_02000 How difficult to participate insocial activities without special equipment
FLSOCL Frequency Percent --------------------------------------------------0 Not at all difficult 1 Only a little difficult2 Somewhat difficult 3 Very difficult4 Cant do at all 6 Do not do this activity7 Refused 8 Not ascertained 9 Dont know
30363 8794 935 271 974 282 509 147 597 173 1026 297 10 003 106 031 5 001
AHS171_03000 How difficult to relax at home without special equipment
FLRELAX Frequency Percent --------------------------------------------------0 Not at all difficult 1 Only a little difficult2 Somewhat difficult 3 Very difficult4 Cant do at all 6 Do not do this activity7 Refused 8 Not ascertained 9 Dont know
32932 9539 634 184 544 158 151 044 77 022 70 020 8 002
107 031 2 001
AHS171_00000 Any functional limitation all conditions
FLA1AR Frequency Percent -------------------------------------------------1 Limited in any way 12891 3734 2 Not limited in any way 21501 6228 3 Unknown if limited 133 039
102
2012 National Health Interview Survey (NHIS)Sample Adult Public Use File (samadult)
AHS Variables Thursday May 16 2013Unweighted Frequencies
AHS200_01000 Visionproblem seeing causes difficulty with activity
AFLHCA1 Frequency Percent ------------------------------------------1 Mentioned 458 355 2 Not mentioned 12254 9506 7 Refused 21 016 8 Not ascertained 33 026 9 Dont know 125 097
Frequency Missing = 21634
AHS200_02000 Hearing problem causes difficulty with activity
AFLHCA2 Frequency Percent ------------------------------------------1 Mentioned 267 207 2 Not mentioned 12445 9654 7 Refused 21 016 8 Not ascertained 33 026 9 Dont know 125 097
Frequency Missing = 21634
AHS200_03000 Arthritisrheumatism causes difficulty with activity
AFLHCA3 Frequency Percent ------------------------------------------1 Mentioned 4465 3464 2 Not mentioned 8247 6397 7 Refused 21 016 8 Not ascertained 33 026 9 Dont know 125 097
Frequency Missing = 21634
AHS200_04000 Back or neck problem causes difficulty with activity
AFLHCA4 Frequency Percent ------------------------------------------1 Mentioned 3595 2789 2 Not mentioned 9117 7072 7 Refused 21 016 8 Not ascertained 33 026 9 Dont know 125 097
Frequency Missing = 21634
103
2012 National Health Interview Survey (NHIS)Sample Adult Public Use File (samadult)
AHS Variables Thursday May 16 2013Unweighted Frequencies
AHS200_05000 Fracture bonejoint injury causes difficulty with activity
AFLHCA5 Frequency Percent ------------------------------------------1 Mentioned 1349 1046 2 Not mentioned 11363 8815 7 Refused 21 016 8 Not ascertained 33 026 9 Dont know 125 097
Frequency Missing = 21634
AHS200_06000 Other injury causes difficulty with activity
AFLHCA6 Frequency Percent ------------------------------------------1 Mentioned 480 372 2 Not mentioned 12232 9489 7 Refused 21 016 8 Not ascertained 33 026 9 Dont know 125 097
Frequency Missing = 21634
AHS200_07000 Heart problem causes difficulty with activity
AFLHCA7 Frequency Percent ------------------------------------------1 Mentioned 742 576 2 Not mentioned 11970 9286 7 Refused 21 016 8 Not ascertained 33 026 9 Dont know 125 097
Frequency Missing = 21634
AHS200_08000 Stroke problem causes difficulty with activity
AFLHCA8 Frequency Percent ------------------------------------------1 Mentioned 336 261 2 Not mentioned 12376 9600 7 Refused 21 016 8 Not ascertained 33 026 9 Dont know 125 097
Frequency Missing = 21634
104
2012 National Health Interview Survey (NHIS)Sample Adult Public Use File (samadult)
AHS Variables Thursday May 16 2013Unweighted Frequencies
AHS200_09000 Hypertensionhigh blood pressure causes difficulty with activity
AFLHCA9 Frequency Percent ------------------------------------------1 Mentioned 757 587 2 Not mentioned 11955 9274 7 Refused 21 016 8 Not ascertained 33 026 9 Dont know 125 097
Frequency Missing = 21634
AHS200_10000 Diabetes causes difficulty with activity
AFLHCA10 Frequency Percent ------------------------------------------1 Mentioned 665 516 2 Not mentioned 12047 9345 7 Refused 21 016 8 Not ascertained 33 026 9 Dont know 125 097
Frequency Missing = 21634
AHS200_11000 Lungbreathing problem (eg asthmaand emphysema) causes difficulty with activity
AFLHCA11 Frequency Percent ------------------------------------------1 Mentioned 821 637 2 Not mentioned 11891 9224 7 Refused 21 016 8 Not ascertained 33 026 9 Dont know 125 097
Frequency Missing = 21634
AHS200_12000 Cancer causes difficulty with activity
AFLHCA12 Frequency Percent ------------------------------------------1 Mentioned 184 143 2 Not mentioned 12528 9718 7 Refused 21 016 8 Not ascertained 33 026 9 Dont know 125 097
Frequency Missing = 21634
105
2012 National Health Interview Survey (NHIS)Sample Adult Public Use File (samadult)
AHS Variables Thursday May 16 2013Unweighted Frequencies
AHS200_13000 Birth defect causes difficulty with activity
AFLHCA13 Frequency Percent ------------------------------------------1 Mentioned 59 046 2 Not mentioned 12653 9815 7 Refused 21 016 8 Not ascertained 33 026 9 Dont know 125 097
Frequency Missing = 21634
AHS200_14000 Intellectual disability also known asmental retardation causes difficulty with activity
ALHCA14A Frequency Percent ------------------------------------------1 Mentioned 62 048 2 Not mentioned 12650 9813 7 Refused 21 016 8 Not ascertained 33 026 9 Dont know 125 097
Frequency Missing = 21634
AHS200_15000 Other developmental problem (egcerebral palsy) causes difficulty with activity
AFLHCA15 Frequency Percent ------------------------------------------1 Mentioned 51 040 2 Not mentioned 12661 9822 7 Refused 21 016 8 Not ascertained 33 026 9 Dont know 125 097
Frequency Missing = 21634
AHS200_16000 Senility causes difficulty with activity
AFLHCA16 Frequency Percent ------------------------------------------1 Mentioned 112 087 2 Not mentioned 12600 9774 7 Refused 21 016 8 Not ascertained 33 026 9 Dont know 125 097
Frequency Missing = 21634
106
2012 National Health Interview Survey (NHIS)Sample Adult Public Use File (samadult)
AHS Variables Thursday May 16 2013Unweighted Frequencies
AHS200_17000 Depressionanxietyemotionalproblem causes difficulty with activity
AFLHCA17 Frequency Percent ------------------------------------------1 Mentioned 1052 816 2 Not mentioned 11660 9045 7 Refused 21 016 8 Not ascertained 33 026 9 Dont know 125 097
Frequency Missing = 21634
AHS200_18000 Weight problem causes difficulty with activity
AFLHCA18 Frequency Percent ------------------------------------------1 Mentioned 830 644 2 Not mentioned 11882 9217 7 Refused 21 016 8 Not ascertained 33 026 9 Dont know 125 097
Frequency Missing = 21634
AHS200_00000 Missing or amputated limbfingerdigitcauses difficulty with activity
AFLHC19_ Frequency Percent ------------------------------------------1 Mentioned 74 057 2 Not mentioned 12638 9804 7 Refused 21 016 8 Not ascertained 33 026 9 Dont know 125 097
Frequency Missing = 21634
AHS200_00000 Musculoskeletalconnective tissueproblem causes difficulty with activity
AFLHC20_ Frequency Percent ------------------------------------------1 Mentioned 2375 1842 2 Not mentioned 10337 8019 7 Refused 21 016 8 Not ascertained 33 026 9 Dont know 125 097
Frequency Missing = 21634
107
2012 National Health Interview Survey (NHIS)Sample Adult Public Use File (samadult)
AHS Variables Thursday May 16 2013Unweighted Frequencies
AHS200_00000 Circulation problems (includingblood clots) cause difficulty with activity
AFLHC21_ Frequency Percent ------------------------------------------1 Mentioned 396 307 2 Not mentioned 12316 9554 7 Refused 21 016 8 Not ascertained 33 026 9 Dont know 125 097
Frequency Missing = 21634
AHS200_00000 Endocrinenutritionalmetabolicproblem causes difficulty with activity
AFLHC22_ Frequency Percent ------------------------------------------1 Mentioned 134 104 2 Not mentioned 12578 9757 7 Refused 21 016 8 Not ascertained 33 026 9 Dont know 125 097
Frequency Missing = 21634
AHS200_00000 Nervous systemsensory organcondition causes difficulty with activity
AFLHC23_ Frequency Percent ------------------------------------------1 Mentioned 683 530 2 Not mentioned 12029 9331 7 Refused 21 016 8 Not ascertained 33 026 9 Dont know 125 097
Frequency Missing = 21634
AHS200_00000 Digestive system problem causes difficulty with activity
AFLHC24_ Frequency Percent ------------------------------------------1 Mentioned 179 139 2 Not mentioned 12533 9722 7 Refused 21 016 8 Not ascertained 33 026 9 Dont know 125 097
Frequency Missing = 21634
108
2012 National Health Interview Survey (NHIS)Sample Adult Public Use File (samadult)
AHS Variables Thursday May 16 2013Unweighted Frequencies
AHS200_00000 Genitourinary system problem causes difficulty with activity
AFLHC25_ Frequency Percent ------------------------------------------1 Mentioned 170 132 2 Not mentioned 12542 9729 7 Refused 21 016 8 Not ascertained 33 026 9 Dont know 125 097
Frequency Missing = 21634
AHS200_00000 Skinsubcutaneous system problem causes difficulty with activity
AFLHC26_ Frequency Percent ------------------------------------------1 Mentioned 12 009 2 Not mentioned 12700 9852 7 Refused 21 016 8 Not ascertained 33 026 9 Dont know 125 097
Frequency Missing = 21634
AHS200_00000 Blood or blood-forming organproblem causes difficulty with activity
AFLHC27_ Frequency Percent ------------------------------------------1 Mentioned 15 012 2 Not mentioned 12697 9850 7 Refused 21 016 8 Not ascertained 33 026 9 Dont know 125 097
Frequency Missing = 21634
AHS200_00000 Benign tumorcyst causes difficulty with activity
AFLHC28_ Frequency Percent ------------------------------------------1 Mentioned 31 024 2 Not mentioned 12681 9837 7 Refused 21 016 8 Not ascertained 33 026 9 Dont know 125 097
Frequency Missing = 21634
109
2012 National Health Interview Survey (NHIS)Sample Adult Public Use File (samadult)
AHS Variables Thursday May 16 2013Unweighted Frequencies
AHS200_00000 Alcoholdrugsubstance abuseproblem causes difficulty with activity
AFLHC29_ Frequency Percent ------------------------------------------1 Mentioned 3 002 2 Not mentioned 12709 9859 7 Refused 21 016 8 Not ascertained 33 026 9 Dont know 125 097
Frequency Missing = 21634
AHS200_00000 Other mental problemADDBipolarSchizophreniacauses difficulty with activity
AFLHC30_ Frequency Percent ------------------------------------------1 Mentioned 58 045 2 Not mentioned 12654 9816 7 Refused 21 016 8 Not ascertained 33 026 9 Dont know 125 097
Frequency Missing = 21634
AHS200_00000 Surgical after-effectsmedicaltreatment causes difficulty with activity
AFLHC31_ Frequency Percent ------------------------------------------1 Mentioned 63 049 2 Not mentioned 12649 9812 7 Refused 21 016 8 Not ascertained 33 026 9 Dont know 125 097
Frequency Missing = 21634
AHS200_00000 Old ageelderlyaging-relatedproblem causes difficulty with activity
AFLHC32_ Frequency Percent ------------------------------------------1 Mentioned 274 213 2 Not mentioned 12438 9649 7 Refused 21 016 8 Not ascertained 33 026 9 Dont know 125 097
Frequency Missing = 21634
110
2012 National Health Interview Survey (NHIS)Sample Adult Public Use File (samadult)
AHS Variables Thursday May 16 2013Unweighted Frequencies
AHS200_00000 Fatiguetirednessweakness causes difficulty with activity
AFLHC33_ Frequency Percent ------------------------------------------1 Mentioned 109 085 2 Not mentioned 12603 9777 7 Refused 21 016 8 Not ascertained 33 026 9 Dont know 125 097
Frequency Missing = 21634
AHS200_00000 Pregnancy-related problem causes difficulty with activity
AFLHC34_ Frequency Percent ------------------------------------------1 Mentioned 36 028 2 Not mentioned 12676 9833 7 Refused 21 016 8 Not ascertained 33 026 9 Dont know 125 097
Frequency Missing = 21634
AHS200_90000 Other impairmentproblem (1) causes difficulty with activity
AFLHCA90 Frequency Percent ------------------------------------------1 Mentioned 334 259 2 Not mentioned 12378 9602 7 Refused 21 016 8 Not ascertained 33 026 9 Dont know 125 097
Frequency Missing = 21634
AHS200_91000 Other impairmentproblem (2) causes difficulty with activity
AFLHCA91 Frequency Percent ------------------------------------------1 Mentioned 4 003 2 Not mentioned 12708 9858 7 Refused 21 016 8 Not ascertained 33 026 9 Dont know 125 097
Frequency Missing = 21634
111
2012 National Health Interview Survey (NHIS)Sample Adult Public Use File (samadult)
AHS Variables Thursday May 16 2013Unweighted Frequencies
AHS300_01000 Duration of vision problem Number of units
ALTIME1 Frequency Percent -------------------------------------------01-94 1-94 422 9214 95 95+ 0 000 96 Since birth 26 568 97 Refused 0 000 98 Not ascertained 1 022 99 Dont know 9 197
Frequency Missing = 34067
AHS300_02000 Duration of vision problem Time unit
ALUNIT1 Frequency Percent ------------------------------------------1 Day(s) 3 066 2 Week(s) 1 022 3 Month(s) 23 502 4 Year(s) 400 8734 6 Since birth 26 568 7 Refused 0 000 8 Not ascertained 1 022 9 Dont know 4 087
Frequency Missing = 34067
AHS300_02000 Duration (in years) of vision problem recode 1
ALDURA1 Frequency Percent ---------------------------------------------------00 Less than 1 year 22 480 01-84 years 425 9279 85 85+ years 1 022 96 Unknown number of years 5 109 97 Refused 0 000 98 Not ascertained 1 022 99 Dont know 4 087
Frequency Missing = 34067
112
2012 National Health Interview Survey (NHIS)Sample Adult Public Use File (samadult)
AHS Variables Thursday May 16 2013Unweighted Frequencies
AHS300_02000 Duration of vision problem recode 2
ALDURB1 Frequency Percent ---------------------------------------------1 Less than 3 months 6 131 2 3-5 months 5 109 3 6-12 months 45 983 4 More than 1 year 397 8668 7 Refused 0 000 8 Not ascertained 1 022 9 Dont know 4 087
Frequency Missing = 34067
AHS300_02000 Vision problem condition status recode
ALCHRC1 Frequency Percent ---------------------------------------------1 Chronic 447 9760 2 Not chronic 6 131 9 Unknown if chronic 5 109
Frequency Missing = 34067
AHS301_01000 Duration of hearing problem Number of units
ALTIME2 Frequency Percent -------------------------------------------01-94 1-94 244 9139 95 95+ 1 037 96 Since birth 16 599 97 Refused 0 000 98 Not ascertained 2 075 99 Dont know 4 150
Frequency Missing = 34258
AHS301_02000 Duration of hearing problem Time unit
ALUNIT2 Frequency Percent ------------------------------------------1 Day(s) 1 037 2 Week(s) 0 000 3 Month(s) 4 150 4 Year(s) 241 9026 6 Since birth 16 599 7 Refused 0 000 8 Not ascertained 2 075 9 Dont know 3 112
Frequency Missing = 34258
113
2012 National Health Interview Survey (NHIS)Sample Adult Public Use File (samadult)
AHS Variables Thursday May 16 2013Unweighted Frequencies
AHS301_02000 Duration (in years) of hearing problem recode 1
ALDURA2 Frequency Percent ---------------------------------------------------00 Less than 1 year 3 112 01-84 years 256 9588 85 85+ years 2 075 96 Unknown number of years 1 037 97 Refused 0 000 98 Not ascertained 2 075 99 Dont know 3 112
Frequency Missing = 34258
AHS301_02000 Duration of hearing problem recode 2
ALDURB2 Frequency Percent ---------------------------------------------1 Less than 3 months 0 000 2 3-5 months 2 075 3 6-12 months 18 674 4 More than 1 year 242 9064 7 Refused 0 000 8 Not ascertained 2 075 9 Dont know 3 112
Frequency Missing = 34258
AHS301_02000 Hearing problem condition status recode
ALCHRC2 Frequency Percent ---------------------------------------------1 Chronic 262 9813 2 Not chronic 0 000 9 Unknown if chronic 5 187
Frequency Missing = 34258
AHS302_01000 Duration of arthritisrheumatism Number of units
ALTIME3 Frequency Percent -------------------------------------------01-94 1-94 4350 9742 95 95+ 1 002 96 Since birth 23 052 97 Refused 3 007 98 Not ascertained 7 016 99 Dont know 81 181
Frequency Missing = 30060
114
2012 National Health Interview Survey (NHIS)Sample Adult Public Use File (samadult)
AHS Variables Thursday May 16 2013Unweighted Frequencies
AHS302_02000 Duration of arthritisrheumatism Time unit
ALUNIT3 Frequency Percent ------------------------------------------1 Day(s) 4 009 2 Week(s) 7 016 3 Month(s) 143 320 4 Year(s) 4243 9503 6 Since birth 23 052 7 Refused 3 007 8 Not ascertained 7 016 9 Dont know 35 078
Frequency Missing = 30060
AHS302_02000 Duration (in years) of arthritisrheumatism recode 1
ALDURA3 Frequency Percent ---------------------------------------------------00 Less than 1 year 124 278 01-84 years 4248 9514 85 85+ years 2 004 96 Unknown number of years 46 103 97 Refused 3 007 98 Not ascertained 7 016 99 Dont know 35 078
Frequency Missing = 30060
AHS302_02000 Duration of arthritisrheumatism recode 2
ALDURB3 Frequency Percent ---------------------------------------------1 Less than 3 months 34 076 2 3-5 months 47 105 3 6-12 months 235 526 4 More than 1 year 4104 9191 7 Refused 3 007 8 Not ascertained 7 016 9 Dont know 35 078
Frequency Missing = 30060
AHS302_02000 Arthritisrheumatism condition status recode
ALCHRC3 Frequency Percent ---------------------------------------------1 Chronic 4465 10000 2 Not chronic 0 000 9 Unknown if chronic 0 000
Frequency Missing = 30060
115
2012 National Health Interview Survey (NHIS)Sample Adult Public Use File (samadult)
AHS Variables Thursday May 16 2013Unweighted Frequencies
AHS303_01000 Duration of back or neck problem Number of units
ALTIME4 Frequency Percent -------------------------------------------01-94 1-94 3477 9672 95 95+ 3 008 96 Since birth 57 159 97 Refused 5 014 98 Not ascertained 4 011 99 Dont know 49 136
Frequency Missing = 30930
AHS303_02000 Duration of back or neck problem Time unit
ALUNIT4 Frequency Percent ------------------------------------------1 Day(s) 13 036 2 Week(s) 28 078 3 Month(s) 241 670 4 Year(s) 3220 8957 6 Since birth 57 159 7 Refused 5 014 8 Not ascertained 4 011 9 Dont know 27 075
Frequency Missing = 30930
AHS303_02000 Duration (in years) of back or neck problem recode 1
ALDURA4 Frequency Percent ---------------------------------------------------00 Less than 1 year 239 665 01-84 years 3297 9171 85 85+ years 1 003 96 Unknown number of years 22 061 97 Refused 5 014 98 Not ascertained 4 011 99 Dont know 27 075
Frequency Missing = 30930
116
2012 National Health Interview Survey (NHIS)Sample Adult Public Use File (samadult)
AHS Variables Thursday May 16 2013Unweighted Frequencies
AHS303_02000 Duration of back or neck problem recode 2
ALDURB4 Frequency Percent ---------------------------------------------1 Less than 3 months 79 220 2 3-5 months 69 192 3 6-12 months 238 662 4 More than 1 year 3173 8826 7 Refused 5 014 8 Not ascertained 4 011 9 Dont know 27 075
Frequency Missing = 30930
AHS303_02000 Back or neck problem condition status recode
ALCHRC4 Frequency Percent ---------------------------------------------1 Chronic 3480 9680 2 Not chronic 79 220 9 Unknown if chronic 36 100
Frequency Missing = 30930
AHS304_01000 Duration of fracture bonejoint injury Number of units
ALTIME5 Frequency Percent -------------------------------------------01-94 1-94 1329 9852 95 95+ 0 000 96 Since birth 6 044 97 Refused 1 007 98 Not ascertained 4 030 99 Dont know 9 067
Frequency Missing = 33176
AHS304_02000 Duration of fracture bonejoint injury Time unit
ALUNIT5 Frequency Percent ------------------------------------------1 Day(s) 11 082 2 Week(s) 28 208 3 Month(s) 229 1698 4 Year(s) 1066 7902 6 Since birth 6 044 7 Refused 1 007 8 Not ascertained 4 030 9 Dont know 4 030
Frequency Missing = 33176
117
2012 National Health Interview Survey (NHIS)Sample Adult Public Use File (samadult)
AHS Variables Thursday May 16 2013Unweighted Frequencies
AHS304_02000 Duration (in years) of fracture bonejoint injury recode 1
ALDURA5 Frequency Percent ---------------------------------------------------00 Less than 1 year 230 1705 01-84 years 1105 8191 85 85+ years 0 000 96 Unknown number of years 5 037 97 Refused 1 007 98 Not ascertained 4 030 99 Dont know 4 030
Frequency Missing = 33176
AHS304_02000 Duration of fracture bonejoint injury recode 2
ALDURB5 Frequency Percent ---------------------------------------------1 Less than 3 months 74 549 2 3-5 months 84 623 3 6-12 months 161 1193 4 More than 1 year 1021 7569 7 Refused 1 007 8 Not ascertained 4 030 9 Dont know 4 030
Frequency Missing = 33176
AHS304_02000 Fracture bonejoint injury condition status recode
ALCHRC5 Frequency Percent ---------------------------------------------1 Chronic 1266 9385 2 Not chronic 74 549 9 Unknown if chronic 9 067
Frequency Missing = 33176
AHS305_01000 Duration of other injury Number of units
ALTIME6 Frequency Percent -------------------------------------------01-94 1-94 465 9688 95 95+ 1 021 96 Since birth 3 063 97 Refused 1 021 98 Not ascertained 0 000 99 Dont know 10 208
Frequency Missing = 34045
118
2012 National Health Interview Survey (NHIS)Sample Adult Public Use File (samadult)
AHS Variables Thursday May 16 2013Unweighted Frequencies
AHS305_02000 Duration of other injury Time unit
ALUNIT6 Frequency Percent ------------------------------------------1 Day(s) 5 104 2 Week(s) 13 271 3 Month(s) 83 1729 4 Year(s) 371 7729 6 Since birth 3 063 7 Refused 1 021 8 Not ascertained 0 000 9 Dont know 4 083
Frequency Missing = 34045
AHS305_02000 Duration (in years) of other injury recode 1
ALDURA6 Frequency Percent ---------------------------------------------------00 Less than 1 year 88 1833 01-84 years 381 7938 85 85+ years 0 000 96 Unknown number of years 6 125 97 Refused 1 021 98 Not ascertained 0 000 99 Dont know 4 083
Frequency Missing = 34045
AHS305_02000 Duration of other injury recode 2
ALDURB6 Frequency Percent ---------------------------------------------1 Less than 3 months 34 708 2 3-5 months 26 542 3 6-12 months 60 1250 4 More than 1 year 355 7396 7 Refused 1 021 8 Not ascertained 0 000 9 Dont know 4 083
Frequency Missing = 34045
AHS305_02000 Other injury condition status recode
ALCHRC6 Frequency Percent ---------------------------------------------1 Chronic 441 9188 2 Not chronic 34 708 9 Unknown if chronic 5 104
Frequency Missing = 34045
119
2012 National Health Interview Survey (NHIS)Sample Adult Public Use File (samadult)
AHS Variables Thursday May 16 2013Unweighted Frequencies
AHS306_01000 Duration of heart problem Number of units
ALTIME7 Frequency Percent -------------------------------------------01-94 1-94 706 9515 95 95+ 0 000 96 Since birth 26 350 97 Refused 2 027 98 Not ascertained 0 000 99 Dont know 8 108
Frequency Missing = 33783
AHS306_02000 Duration of heart problem Time unit
ALUNIT7 Frequency Percent ------------------------------------------1 Day(s) 1 013 2 Week(s) 6 081 3 Month(s) 37 499 4 Year(s) 665 8962 6 Since birth 26 350 7 Refused 2 027 8 Not ascertained 0 000 9 Dont know 5 067
Frequency Missing = 33783
AHS306_02000 Duration (in years) of heart problem recode 1
ALDURA7 Frequency Percent ---------------------------------------------------00 Less than 1 year 35 472 01-84 years 697 9394 85 85+ years 0 000 96 Unknown number of years 3 040 97 Refused 2 027 98 Not ascertained 0 000 99 Dont know 5 067
Frequency Missing = 33783
120
2012 National Health Interview Survey (NHIS)Sample Adult Public Use File (samadult)
AHS Variables Thursday May 16 2013Unweighted Frequencies
AHS306_02000 Duration of heart problem recode 2
ALDURB7 Frequency Percent ---------------------------------------------1 Less than 3 months 13 175 2 3-5 months 10 135 3 6-12 months 44 593 4 More than 1 year 668 9003 7 Refused 2 027 8 Not ascertained 0 000 9 Dont know 5 067
Frequency Missing = 33783
AHS306_02000 Heart problem condition status recode
ALCHRC7 Frequency Percent ---------------------------------------------1 Chronic 742 10000 2 Not chronic 0 000 9 Unknown if chronic 0 000
Frequency Missing = 33783
AHS307_01000 Duration of stroke problem Number of units
ALTIME8 Frequency Percent -------------------------------------------01-94 1-94 330 9821 95 95+ 0 000 96 Since birth 2 060 97 Refused 0 000 98 Not ascertained 0 000 99 Dont know 4 119
Frequency Missing = 34189
AHS307_02000 Duration of stroke problem Time unit
ALUNIT8 Frequency Percent ------------------------------------------1 Day(s) 1 030 2 Week(s) 2 060 3 Month(s) 39 1161 4 Year(s) 291 8661 6 Since birth 2 060 7 Refused 0 000 8 Not ascertained 0 000 9 Dont know 1 030
Frequency Missing = 34189
121
2012 National Health Interview Survey (NHIS)Sample Adult Public Use File (samadult)
AHS Variables Thursday May 16 2013Unweighted Frequencies
AHS307_02000 Duration (in years) of stroke problem recode 1
ALDURA8 Frequency Percent ---------------------------------------------------00 Less than 1 year 32 952 01-84 years 300 8929 85 85+ years 0 000 96 Unknown number of years 3 089 97 Refused 0 000 98 Not ascertained 0 000 99 Dont know 1 030
Frequency Missing = 34189
AHS307_02000 Duration of stroke problem recode 2
ALDURB8 Frequency Percent ---------------------------------------------1 Less than 3 months 8 238 2 3-5 months 7 208 3 6-12 months 34 1012 4 More than 1 year 286 8512 7 Refused 0 000 8 Not ascertained 0 000 9 Dont know 1 030
Frequency Missing = 34189
AHS307_02000 Stroke problem condition status recode
ALCHRC8 Frequency Percent ---------------------------------------------1 Chronic 336 10000 2 Not chronic 0 000 9 Unknown if chronic 0 000
Frequency Missing = 34189
AHS308_01000 Duration of hypertension or high blood pressure Number of units
ALTIME9 Frequency Percent -------------------------------------------01-94 1-94 728 9617 95 95+ 0 000 96 Since birth 6 079 97 Refused 0 000 98 Not ascertained 4 053 99 Dont know 19 251
Frequency Missing = 33768
122
2012 National Health Interview Survey (NHIS)Sample Adult Public Use File (samadult)
AHS Variables Thursday May 16 2013Unweighted Frequencies
AHS308_02000 Duration of hypertension or high blood pressure Time unit
ALUNIT9 Frequency Percent ------------------------------------------1 Day(s)2 Week(s)3 Month(s)4 Year(s)6 Since birth
0 4 13 723 6
000 053 172 9551 079
7 Refused 0 000 8 Not ascertained 4 053 9 Dont know 7 092
Frequency Missing = 33768
AHS308_02000 Duration (in years) of hypertensionor high blood pressure recode 1
ALDURA9 Frequency Percent ---------------------------------------------------00 Less than 1 year 16 211 01-84 years 718 9485 85 85+ years 0 000 96 Unknown number of years 12 159 97 Refused 0 000 98 Not ascertained 4 053 99 Dont know 7 092
Frequency Missing = 33768
AHS308_02000 Duration of hypertension or high blood pressure recode 2
ALDURB9 Frequency Percent ---------------------------------------------1 Less than 3 months 6 079 2 3-5 months 5 066 3 6-12 months 29 383 4 More than 1 year 706 9326 7 Refused 0 000 8 Not ascertained 4 053 9 Dont know 7 092
Frequency Missing = 33768
AHS308_02000 Hypertension or high blood pressure condition status recode
ALCHRC9 Frequency Percent ---------------------------------------------1 Chronic 757 10000 2 Not chronic 0 000 9 Unknown if chronic 0 000
Frequency Missing = 33768
123
2012 National Health Interview Survey (NHIS)Sample Adult Public Use File (samadult)
AHS Variables Thursday May 16 2013Unweighted Frequencies
AHS309_01000 Duration of diabetes Number of units
ALTIME10 Frequency Percent -------------------------------------------01-94 1-94 651 9789 95 95+ 0 000 96 Since birth 2 030 97 Refused 1 015 98 Not ascertained 2 030 99 Dont know 9 135
Frequency Missing = 33860
AHS309_02000 Duration of diabetes Time unit
ALUNIT10 Frequency Percent ------------------------------------------1 Day(s) 0 000 2 Week(s) 3 045 3 Month(s) 13 195 4 Year(s) 642 9654 6 Since birth 2 030 7 Refused 1 015 8 Not ascertained 2 030 9 Dont know 2 030
Frequency Missing = 33860
AHS309_02000 Duration (in years) of diabetes recode 1
ALDURA10 Frequency Percent ---------------------------------------------------00 Less than 1 year 15 226 01-84 years 638 9594 85 85+ years 0 000 96 Unknown number of years 7 105 97 Refused 1 015 98 Not ascertained 2 030 99 Dont know 2 030
Frequency Missing = 33860
124
2012 National Health Interview Survey (NHIS)Sample Adult Public Use File (samadult)
AHS Variables Thursday May 16 2013Unweighted Frequencies
AHS309_02000 Duration of diabetes recode 2
ALDURB10 Frequency Percent ---------------------------------------------1 Less than 3 months 8 120 2 3-5 months 1 015 3 6-12 months 27 406 4 More than 1 year 624 9383 7 Refused 1 015 8 Not ascertained 2 030 9 Dont know 2 030
Frequency Missing = 33860
AHS309_02000 Diabetes condition status recode
ALCHRC10 Frequency Percent ---------------------------------------------1 Chronic 665 10000 2 Not chronic 0 000 9 Unknown if chronic 0 000
Frequency Missing = 33860
AHS310_01000 Duration of lungbreathing problem(eg asthma and emphysema) Number of units
ALTIME11 Frequency Percent -------------------------------------------01-94 1-94 750 9135 95 95+ 0 000 96 Since birth 56 682 97 Refused 0 000 98 Not ascertained 3 037 99 Dont know 12 146
Frequency Missing = 33704
AHS310_02000 Duration of lungbreathing problem(eg asthma and emphysema) Time unit
ALUNIT11 Frequency Percent ------------------------------------------1 Day(s) 3 037 2 Week(s) 2 024 3 Month(s) 36 438 4 Year(s) 715 8709 6 Since birth 56 682 7 Refused 0 000 8 Not ascertained 3 037 9 Dont know 6 073
Frequency Missing = 33704
125
2012 National Health Interview Survey (NHIS)Sample Adult Public Use File (samadult)
AHS Variables Thursday May 16 2013Unweighted Frequencies
AHS310_02000 Duration (in years) of lungbreathingproblem (eg asthma and emphysema) recode 1
ALDURA11 Frequency Percent ---------------------------------------------------00 Less than 1 year 29 353 01-84 years 775 9440 85 85+ years 2 024 96 Unknown number of years 6 073 97 Refused 0 000 98 Not ascertained 3 037 99 Dont know 6 073
Frequency Missing = 33704
AHS310_02000 Duration of lungbreathing problem(eg asthma and emphysema) recode 2
ALDURB11 Frequency Percent ---------------------------------------------1 Less than 3 months 8 097 2 3-5 months 6 073 3 6-12 months 65 792 4 More than 1 year 733 8928 7 Refused 0 000 8 Not ascertained 3 037 9 Dont know 6 073
Frequency Missing = 33704
AHS310_02000 Lungbreathing problem (egasthma and emphysema) condition status recode
ALCHRC11 Frequency Percent ---------------------------------------------1 Chronic 804 9793 2 Not chronic 8 097 9 Unknown if chronic 9 110
Frequency Missing = 33704
AHS311_01000 Duration of cancer Number of units
ALTIME12 Frequency Percent -------------------------------------------01-94 1-94 182 9891 95 95+ 0 000 96 Since birth 0 000 97 Refused 0 000 98 Not ascertained 0 000 99 Dont know 2 109
Frequency Missing = 34341
126
2012 National Health Interview Survey (NHIS)Sample Adult Public Use File (samadult)
AHS Variables Thursday May 16 2013Unweighted Frequencies
AHS311_02000 Duration of cancer Time unit
ALUNIT12 Frequency Percent ------------------------------------------1 Day(s) 0 000 2 Week(s) 3 163 3 Month(s) 30 1630 4 Year(s) 150 8152 6 Since birth 0 000 7 Refused 0 000 8 Not ascertained 0 000 9 Dont know 1 054
Frequency Missing = 34341
AHS311_02000 Duration (in years) of cancer recode 1
ALDURA12 Frequency Percent ---------------------------------------------------00 Less than 1 year 30 1630 01-84 years 152 8261 85 85+ years 0 000 96 Unknown number of years 1 054 97 Refused 0 000 98 Not ascertained 0 000 99 Dont know 1 054
Frequency Missing = 34341
AHS311_02000 Duration of cancer recode 2
ALDURB12 Frequency Percent ---------------------------------------------1 Less than 3 months 7 380 2 3-5 months 8 435 3 6-12 months 31 1685 4 More than 1 year 137 7446 7 Refused 0 000 8 Not ascertained 0 000 9 Dont know 1 054
Frequency Missing = 34341
AHS311_02000 Cancer condition status recode
ALCHRC12 Frequency Percent ---------------------------------------------1 Chronic 184 10000 2 Not chronic 0 000 9 Unknown if chronic 0 000
Frequency Missing = 34341
127
2012 National Health Interview Survey (NHIS)Sample Adult Public Use File (samadult)
AHS Variables Thursday May 16 2013Unweighted Frequencies
AHS312_01000 Duration of birth defect Number of units
ALTIME13 Frequency Percent -------------------------------------------01-94 1-94 0 000 95 95+ 0 000 96 Since birth 59 10000 97 Refused 0 000 98 Not ascertained 0 000 99 Dont know 0 000
Frequency Missing = 34466
AHS312_02000 Duration of birth defect Time unit
ALUNIT13 Frequency Percent ------------------------------------------1 Day(s) 0 000 2 Week(s) 0 000 3 Month(s) 0 000 4 Year(s) 0 000 6 Since birth 59 10000 7 Refused 0 000 8 Not ascertained 0 000 9 Dont know 0 000
Frequency Missing = 34466
AHS312_02000 Duration (in years) of birth defect recode 1
ALDURA13 Frequency Percent ---------------------------------------------------00 Less than 1 year 0 000 01-84 years 57 9661 85 85+ years 2 339 96 Unknown number of years 0 000 97 Refused 0 000 98 Not ascertained 0 000 99 Dont know 0 000
Frequency Missing = 34466
128
2012 National Health Interview Survey (NHIS)Sample Adult Public Use File (samadult)
AHS Variables Thursday May 16 2013Unweighted Frequencies
AHS312_02000 Duration of birth defect recode 2
ALDURB13 Frequency Percent ---------------------------------------------1 Less than 3 months 0 000 2 3-5 months 0 000 3 6-12 months 0 000 4 More than 1 year 59 10000 7 Refused 0 000 8 Not ascertained 0 000 9 Dont know 0 000
Frequency Missing = 34466
AHS312_02000 Birth defect condition status recode
ALCHRC13 Frequency Percent ---------------------------------------------1 Chronic 59 10000 2 Not chronic 0 000 9 Unknown if chronic 0 000
Frequency Missing = 34466
AHS313_01000 Duration of intellectual disabilityalso known as mental retardation Number of units
ATIME14A Frequency Percent -------------------------------------------01-94 1-94 24 3871 95 95+ 0 000 96 Since birth 35 5645 97 Refused 0 000 98 Not ascertained 0 000 99 Dont know 3 484
Frequency Missing = 34463
AHS313_02000 Duration of intellectual disabilityalso know as mental retardation Time unit
AUNIT14A Frequency Percent ------------------------------------------1 Day(s) 0 000 2 Week(s) 0 000 3 Month(s) 0 000 4 Year(s) 25 4032 6 Since birth 35 5645 7 Refused 0 000 8 Not ascertained 0 000 9 Dont know 2 323
Frequency Missing = 34463
129
2012 National Health Interview Survey (NHIS)Sample Adult Public Use File (samadult)
AHS Variables Thursday May 16 2013Unweighted Frequencies
AHS313_02000 Duration (in years) of intellectual disabilityalso known as mental retardation recode 1
ADURA14A Frequency Percent ---------------------------------------------------00 Less than 1 year 0 000 01-84 years 58 9355 85 85+ years 1 161 96 Unknown number of years 1 161 97 Refused 0 000 98 Not ascertained 0 000 99 Dont know 2 323
Frequency Missing = 34463
AHS313_02000 Duration of intellectual disabilityalso known as mental retardation recode 2
ADURB14A Frequency Percent ---------------------------------------------1 Less than 3 months 0 000 2 3-5 months 0 000 3 6-12 months 2 323 4 More than 1 year 58 9355 7 Refused 0 000 8 Not ascertained 0 000 9 Dont know 2 323
Frequency Missing = 34463
AHS313_02000 Intellectual disability also knownas mental retardation condition status recode
ACHRC14A Frequency Percent ---------------------------------------------1 Chronic 62 10000 2 Not chronic 0 000 9 Unknown if chronic 0 000
Frequency Missing = 34463
AHS314_01000 Duration of other developmentalproblem (eg cerebral palsy) Number of units
ALTIME15 Frequency Percent -------------------------------------------01-94 1-94 20 3922 95 95+ 0 000 96 Since birth 31 6078 97 Refused 0 000 98 Not ascertained 0 000 99 Dont know 0 000
Frequency Missing = 34474
130
2012 National Health Interview Survey (NHIS)Sample Adult Public Use File (samadult)
AHS Variables Thursday May 16 2013Unweighted Frequencies
AHS314_02000 Duration of other developmentalproblem (eg cerebral palsy) Time unit
ALUNIT15 Frequency Percent ------------------------------------------1 Day(s) 0 000 2 Week(s) 0 000 3 Month(s) 0 000 4 Year(s) 20 3922 6 Since birth 31 6078 7 Refused 0 000 8 Not ascertained 0 000 9 Dont know 0 000
Frequency Missing = 34474
AHS314_02000 Duration (in years) of other developmentalproblem (eg cerebral palsy) recode 1
ALDURA15 Frequency Percent ---------------------------------------------------00 Less than 1 year 0 000 01-84 years 51 10000 85 85+ years 0 000 96 Unknown number of years 0 000 97 Refused 0 000 98 Not ascertained 0 000 99 Dont know 0 000
Frequency Missing = 34474
AHS314_02000 Duration of other developmentalproblem (eg cerebral palsy) recode 2
ALDURB15 Frequency Percent ---------------------------------------------1 Less than 3 months 0 000 2 3-5 months 0 000 3 6-12 months 0 000 4 More than 1 year 51 10000 7 Refused 0 000 8 Not ascertained 0 000 9 Dont know 0 000
Frequency Missing = 34474
131
2012 National Health Interview Survey (NHIS)Sample Adult Public Use File (samadult)
AHS Variables Thursday May 16 2013Unweighted Frequencies
AHS314_02000 Other developmental problem (egcerebral palsy) condition status recode
ALCHRC15 Frequency Percent ---------------------------------------------1 Chronic 51 10000 2 Not chronic 0 000 9 Unknown if chronic 0 000
Frequency Missing = 34474
AHS315_01000 Duration of senility Number of units
ALTIME16 Frequency Percent -------------------------------------------01-94 1-94 101 9018 95 95+ 0 000 96 Since birth 0 000 97 Refused 0 000 98 Not ascertained 0 000 99 Dont know 11 982
Frequency Missing = 34413
AHS315_02000 Duration of senility Time unit
ALUNIT16 Frequency Percent ------------------------------------------1 Day(s) 0 000 2 Week(s) 0 000 3 Month(s) 4 357 4 Year(s) 101 9018 6 Since birth 0 000 7 Refused 0 000 8 Not ascertained 0 000 9 Dont know 7 625
Frequency Missing = 34413
AHS315_02000 Duration (in years) of senility recode 1
ALDURA16 Frequency Percent ---------------------------------------------------00 Less than 1 year 1 089 01-84 years 100 8929 85 85+ years 0 000 96 Unknown number of years 4 357 97 Refused 0 000 98 Not ascertained 0 000 99 Dont know 7 625
Frequency Missing = 34413
132
2012 National Health Interview Survey (NHIS)Sample Adult Public Use File (samadult)
AHS Variables Thursday May 16 2013Unweighted Frequencies
AHS315_02000 Duration of senility recode 2
ALDURB16 Frequency Percent ---------------------------------------------1 Less than 3 months 0 000 2 3-5 months 0 000 3 6-12 months 11 982 4 More than 1 year 94 8393 7 Refused 0 000 8 Not ascertained 0 000 9 Dont know 7 625
Frequency Missing = 34413
AHS315_02000 Senility condition status recode
ALCHRC16 Frequency Percent ---------------------------------------------1 Chronic 112 10000 2 Not chronic 0 000 9 Unknown if chronic 0 000
Frequency Missing = 34413
AHS316_01000 Duration of depressionanxietyemotionalproblem Number of units
ALTIME17 Frequency Percent -------------------------------------------01-94 1-94 938 8916 95 95+ 1 010 96 Since birth 93 884 97 Refused 4 038 98 Not ascertained 2 019 99 Dont know 14 133
Frequency Missing = 33473
AHS316_02000 Duration of depressionanxietyemotional problem Time unit
ALUNIT17 Frequency Percent ------------------------------------------1 Day(s) 1 010 2 Week(s) 6 057 3 Month(s) 36 342 4 Year(s) 903 8584 6 Since birth 93 884 7 Refused 4 038 8 Not ascertained 2 019 9 Dont know 7 067
Frequency Missing = 33473
133
2012 National Health Interview Survey (NHIS)Sample Adult Public Use File (samadult)
AHS Variables Thursday May 16 2013Unweighted Frequencies
AHS316_02000 Duration (in years) of depressionanxietyemotionalproblem recode 1
ALDURA17 Frequency Percent ---------------------------------------------------00 Less than 1 year 34 323 01-84 years 997 9477 85 85+ years 1 010 96 Unknown number of years 7 067 97 Refused 4 038 98 Not ascertained 2 019 99 Dont know 7 067
Frequency Missing = 33473
AHS316_02000 Duration of depressionanxietyemotional problem recode 2
ALDURB17 Frequency Percent ---------------------------------------------1 Less than 3 months 12 114 2 3-5 months 7 067 3 6-12 months 62 589 4 More than 1 year 958 9106 7 Refused 4 038 8 Not ascertained 2 019 9 Dont know 7 067
Frequency Missing = 33473
AHS316_02000 Depressionanxietyemotional problem condition status recode
ALCHRC17 Frequency Percent ---------------------------------------------1 Chronic 1027 9762 2 Not chronic 12 114 9 Unknown if chronic 13 124
Frequency Missing = 33473
AHS317_01000 Duration of weight problem Number of units
ALTIME18 Frequency Percent -------------------------------------------01-94 1-94 726 8747 95 95+ 1 012 96 Since birth 78 940 97 Refused 6 072 98 Not ascertained 1 012 99 Dont know 18 217
Frequency Missing = 33695
134
2012 National Health Interview Survey (NHIS)Sample Adult Public Use File (samadult)
AHS Variables Thursday May 16 2013Unweighted Frequencies
AHS317_02000 Duration of weight problem Time unit
ALUNIT18 Frequency Percent ------------------------------------------1 Day(s) 1 012 2 Week(s) 1 012 3 Month(s) 14 169 4 Year(s) 721 8687 6 Since birth 78 940 7 Refused 6 072 8 Not ascertained 1 012 9 Dont know 8 096
Frequency Missing = 33695
AHS317_02000 Duration (in years) of weight problem recode 1
ALDURA18 Frequency Percent ---------------------------------------------------00 Less than 1 year 12 145 01-84 years 793 9554 85 85+ years 0 000 96 Unknown number of years 10 120 97 Refused 6 072 98 Not ascertained 1 012 99 Dont know 8 096
Frequency Missing = 33695
AHS317_02000 Duration of weight problem recode 2
ALDURB18 Frequency Percent ---------------------------------------------1 Less than 3 months 2 024 2 3-5 months 3 036 3 6-12 months 48 578 4 More than 1 year 762 9181 7 Refused 6 072 8 Not ascertained 1 012 9 Dont know 8 096
Frequency Missing = 33695
AHS317_02000 Weight problem condition status recode
ALCHRC18 Frequency Percent ---------------------------------------------1 Chronic 813 9795 2 Not chronic 2 024 9 Unknown if chronic 15 181
Frequency Missing = 33695
135
2012 National Health Interview Survey (NHIS)Sample Adult Public Use File (samadult)
AHS Variables Thursday May 16 2013Unweighted Frequencies
AHS318_01000 RECOD Duration of missing limbs (fingerstoes or digits) amputation Number of units
ALTIME19 Frequency Percent -------------------------------------------01-94 1-94 72 9730 95 95+ 0 000 96 Since birth 2 270 97 Refused 0 000 98 Not ascertained 0 000 99 Dont know 0 000
Frequency Missing = 34451
AHS318_02000 RECOD Duration of missing limbs (fingerstoes or digits) amputation Time unit
ALUNIT19 Frequency Percent ------------------------------------------1 Day(s) 2 270 2 Week(s) 0 000 3 Month(s) 7 946 4 Year(s) 63 8514 6 Since birth 2 270 7 Refused 0 000 8 Not ascertained 0 000 9 Dont know 0 000
Frequency Missing = 34451
AHS318_02000 Duration (in years) of missing limbs(fingers toes or digits) amputation recode 1
ALDURA19 Frequency Percent ---------------------------------------------------00 Less than 1 year 5 676 01-84 years 69 9324 85 85+ years 0 000 96 Unknown number of years 0 000 97 Refused 0 000 98 Not ascertained 0 000 99 Dont know 0 000
Frequency Missing = 34451
136
2012 National Health Interview Survey (NHIS)Sample Adult Public Use File (samadult)
AHS Variables Thursday May 16 2013Unweighted Frequencies
AHS318_02000 Duration of missing limbs (fingerstoes or digits) amputation recode 2
ALDURB19 Frequency Percent ---------------------------------------------1 Less than 3 months 3 405 2 3-5 months 0 000 3 6-12 months 5 676 4 More than 1 year 66 8919 7 Refused 0 000 8 Not ascertained 0 000 9 Dont know 0 000
Frequency Missing = 34451
AHS318_02000 Missing limbs (fingers toesor digits) amputation condition status recode
ALCHRC19 Frequency Percent ---------------------------------------------1 Chronic 74 10000 2 Not chronic 0 000 9 Unknown if chronic 0 000
Frequency Missing = 34451
AHS319_01000 RECOD Duration of musculoskeletalconnectivetissue problem Number of units
ALTIME20 Frequency Percent -------------------------------------------01-94 1-94 2294 9659 95 95+ 1 004 96 Since birth 37 156 97 Refused 2 008 98 Not ascertained 3 013 99 Dont know 38 160
Frequency Missing = 32150
137
2012 National Health Interview Survey (NHIS)Sample Adult Public Use File (samadult)
AHS Variables Thursday May 16 2013Unweighted Frequencies
AHS319_02000 RECOD Duration of musculoskeletalconnectivetissue problem Time unit
ALUNIT20 Frequency Percent ------------------------------------------1 Day(s)2 Week(s)3 Month(s)4 Year(s)6 Since birth
10 27 234 2042 37
042 114 985 8598 156
7 Refused 2 008 8 Not ascertained 3 013 9 Dont know 20 084
Frequency Missing = 32150
AHS319_02000 Duration (in years) of musculoskeletalconnectivetissue problem recode 1
ALDURA20 Frequency Percent ---------------------------------------------------00 Less than 1 year 237 998 01-84 years 2095 8821 85 85+ years 0 000 96 Unknown number of years 18 076 97 Refused 2 008 98 Not ascertained 3 013 99 Dont know 20 084
Frequency Missing = 32150
AHS319_02000 Duration of musculoskeletalconnective tissue problem recode 2
ALDURB20 Frequency Percent ---------------------------------------------1 Less than 3 months 83 349 2 3-5 months 69 291 3 6-12 months 287 1208 4 More than 1 year 1911 8046 7 Refused 2 008 8 Not ascertained 3 013 9 Dont know 20 084
Frequency Missing = 32150
138
2012 National Health Interview Survey (NHIS)Sample Adult Public Use File (samadult)
AHS Variables Thursday May 16 2013Unweighted Frequencies
AHS319_02000 Musculoskeletalconnectivetissue problem condition status recode
ALCHRC20 Frequency Percent ---------------------------------------------1 Chronic 2267 9545 2 Not chronic 83 349 9 Unknown if chronic 25 105
Frequency Missing = 32150
AHS320_01000 RECOD Duration of circulation problems(including blood clots) Number of units
ALTIME21 Frequency Percent -------------------------------------------01-94 1-94 384 9697 95 95+ 0 000 96 Since birth 7 177 97 Refused 0 000 98 Not ascertained 0 000 99 Dont know 5 126
Frequency Missing = 34129
AHS320_02000 RECOD Duration of circulation problems (including blood clots) Time unit
ALUNIT21 Frequency Percent ------------------------------------------1 Day(s) 2 051 2 Week(s) 0 000 3 Month(s) 26 657 4 Year(s) 357 9015 6 Since birth 7 177 7 Refused 0 000 8 Not ascertained 0 000 9 Dont know 4 101
Frequency Missing = 34129
139
2012 National Health Interview Survey (NHIS)Sample Adult Public Use File (samadult)
AHS Variables Thursday May 16 2013Unweighted Frequencies
AHS320_02000 Duration (in years) of circulationproblems (including blood clots) recode 1
ALDURA21 Frequency Percent ---------------------------------------------------00 Less than 1 year 19 480 01-84 years 371 9369 85 85+ years 1 025 96 Unknown number of years 1 025 97 Refused 0 000 98 Not ascertained 0 000 99 Dont know 4 101
Frequency Missing = 34129
AHS320_02000 Duration of circulation problems(including blood clots) recode 2
ALDURB21 Frequency Percent ---------------------------------------------1 Less than 3 months 8 202 2 3-5 months 2 051 3 6-12 months 34 859 4 More than 1 year 348 8788 7 Refused 0 000 8 Not ascertained 0 000 9 Dont know 4 101
Frequency Missing = 34129
AHS320_02000 Circulation problems (includingblood clots) condition status recode
ALCHRC21 Frequency Percent ---------------------------------------------1 Chronic 384 9697 2 Not chronic 8 202 9 Unknown if chronic 4 101
Frequency Missing = 34129
AHS321_01000 RECOD Duration of endocrinenutritionalmetabolicproblem Number of units
ALTIME22 Frequency Percent -------------------------------------------01-94 1-94 126 9403 95 95+ 0 000 96 Since birth 6 448 97 Refused 1 075 98 Not ascertained 0 000 99 Dont know 1 075
Frequency Missing = 34391
140
2012 National Health Interview Survey (NHIS)Sample Adult Public Use File (samadult)
AHS Variables Thursday May 16 2013Unweighted Frequencies
AHS321_02000 RECOD Duration of endocrinenutritionalmetabolicproblem Time unit
ALUNIT22 Frequency Percent ------------------------------------------1 Day(s)2 Week(s)3 Month(s)4 Year(s)6 Since birth
0 0 7
120 6
000 000 522 8955 448
7 Refused 1 075 8 Not ascertained 0 000 9 Dont know 0 000
Frequency Missing = 34391
AHS321_02000 Duration (in years) of endocrinenutritionalmetabolicproblem recode 1
ALDURA22 Frequency Percent ---------------------------------------------------00 Less than 1 year 7 522 01-84 years 125 9328 85 85+ years 0 000 96 Unknown number of years 1 075 97 Refused 1 075 98 Not ascertained 0 000 99 Dont know 0 000
Frequency Missing = 34391
AHS321_02000 Duration of endocrinenutritionalmetabolic problem recode 2
ALDURB22 Frequency Percent ---------------------------------------------1 Less than 3 months 1 075 2 3-5 months 3 224 3 6-12 months 11 821 4 More than 1 year 118 8806 7 Refused 1 075 8 Not ascertained 0 000 9 Dont know 0 000
Frequency Missing = 34391
AHS321_02000 Endocrinenutritionalmetabolic problem condition status recode
ALCHRC22 Frequency Percent ---------------------------------------------1 Chronic 132 9851 2 Not chronic 1 075 9 Unknown if chronic 1 075
Frequency Missing = 34391
141
2012 National Health Interview Survey (NHIS)Sample Adult Public Use File (samadult)
AHS Variables Thursday May 16 2013Unweighted Frequencies
AHS322_01000 RECOD Duration of nervous systemsensoryorgan condition Number of units
ALTIME23 Frequency Percent -------------------------------------------01-94 1-94 647 9473 95 95+ 0 000 96 Since birth 27 395 97 Refused 2 029 98 Not ascertained 1 015 99 Dont know 6 088
Frequency Missing = 33842
AHS322_02000 RECOD Duration of nervous systemsensory organ condition Time unit
ALUNIT23 Frequency Percent ------------------------------------------1 Day(s) 4 059 2 Week(s) 3 044 3 Month(s) 35 512 4 Year(s) 607 8887 6 Since birth 27 395 7 Refused 2 029 8 Not ascertained 1 015 9 Dont know 4 059
Frequency Missing = 33842
AHS322_02000 Duration (in years) of nervoussystemsensory organ condition recode 1
ALDURA23 Frequency Percent ---------------------------------------------------00 Less than 1 year 35 512 01-84 years 637 9327 85 85+ years 2 029 96 Unknown number of years 2 029 97 Refused 2 029 98 Not ascertained 1 015 99 Dont know 4 059
Frequency Missing = 33842
142
2012 National Health Interview Survey (NHIS)Sample Adult Public Use File (samadult)
AHS Variables Thursday May 16 2013Unweighted Frequencies
AHS322_02000 Duration of nervous systemsensory organ condition recode 2
ALDURB23 Frequency Percent ---------------------------------------------1 Less than 3 months 9 132 2 3-5 months 10 146 3 6-12 months 57 835 4 More than 1 year 600 8785 7 Refused 2 029 8 Not ascertained 1 015 9 Dont know 4 059
Frequency Missing = 33842
AHS322_02000 Nervous systemsensory organ condition status recode
ALCHRC23 Frequency Percent ---------------------------------------------1 Chronic 667 9766 2 Not chronic 9 132 9 Unknown if chronic 7 102
Frequency Missing = 33842
AHS323_01000 RECOD Duration of digestive system problems Number of units
ALTIME24 Frequency Percent -------------------------------------------01-94 1-94 174 9721 95 95+ 0 000 96 Since birth 2 112 97 Refused 0 000 98 Not ascertained 0 000 99 Dont know 3 168
Frequency Missing = 34346
AHS323_02000 RECOD Duration of digestive system problems Time unit
ALUNIT24 Frequency Percent ------------------------------------------1 Day(s) 1 056 2 Week(s) 1 056 3 Month(s) 18 1006 4 Year(s) 156 8715 6 Since birth 2 112 7 Refused 0 000 8 Not ascertained 0 000 9 Dont know 1 056
Frequency Missing = 34346
143
2012 National Health Interview Survey (NHIS)Sample Adult Public Use File (samadult)
AHS Variables Thursday May 16 2013Unweighted Frequencies
AHS323_02000 Duration (in years) of digestive system problems recode 1
ALDURA24 Frequency Percent ---------------------------------------------------00 Less than 1 year 17 950 01-84 years 159 8883 85 85+ years 0 000 96 Unknown number of years 2 112 97 Refused 0 000 98 Not ascertained 0 000 99 Dont know 1 056
Frequency Missing = 34346
AHS323_02000 Duration of digestive system problems recode 2
ALDURB24 Frequency Percent ---------------------------------------------1 Less than 3 months 7 391 2 3-5 months 3 168 3 6-12 months 23 1285 4 More than 1 year 145 8101 7 Refused 0 000 8 Not ascertained 0 000 9 Dont know 1 056
Frequency Missing = 34346
AHS323_02000 Digestive system problems condition status recode
ALCHRC24 Frequency Percent ---------------------------------------------1 Chronic 171 9553 2 Not chronic 7 391 9 Unknown if chronic 1 056
Frequency Missing = 34346
AHS324_01000 RECOD Duration of genitourinary system problem Number of units
ALTIME25 Frequency Percent -------------------------------------------01-94 1-94 165 9706 95 95+ 0 000 96 Since birth 4 235 97 Refused 0 000 98 Not ascertained 0 000 99 Dont know 1 059
Frequency Missing = 34355
144
2012 National Health Interview Survey (NHIS)Sample Adult Public Use File (samadult)
AHS Variables Thursday May 16 2013Unweighted Frequencies
AHS324_02000 RECOD Duration of genitourinary system problem Time unit
ALUNIT25 Frequency Percent ------------------------------------------1 Day(s) 1 059 2 Week(s) 1 059 3 Month(s) 23 1353 4 Year(s) 141 8294 6 Since birth 4 235 7 Refused 0 000 8 Not ascertained 0 000 9 Dont know 0 000
Frequency Missing = 34355
AHS324_02000 Duration (in years) of genitourinary system problem recode 1
ALDURA25 Frequency Percent ---------------------------------------------------00 Less than 1 year 21 1235 01-84 years 148 8706 85 85+ years 0 000 96 Unknown number of years 1 059 97 Refused 0 000 98 Not ascertained 0 000 99 Dont know 0 000
Frequency Missing = 34355
AHS324_02000 Duration of genitourinary system problem recode 2
ALDURB25 Frequency Percent ---------------------------------------------1 Less than 3 months 5 294 2 3-5 months 5 294 3 6-12 months 30 1765 4 More than 1 year 130 7647 7 Refused 0 000 8 Not ascertained 0 000 9 Dont know 0 000
Frequency Missing = 34355
AHS324_02000 Genitourinary system problem condition status recode
ALCHRC25 Frequency Percent ---------------------------------------------1 Chronic 165 9706 2 Not chronic 5 294 9 Unknown if chronic 0 000
Frequency Missing = 34355
145
2012 National Health Interview Survey (NHIS)Sample Adult Public Use File (samadult)
AHS Variables Thursday May 16 2013Unweighted Frequencies
AHS325_01000 RECOD Duration of skinsubcutaneoussystem problems Number of units
ALTIME26 Frequency Percent -------------------------------------------01-94 1-94 12 10000 95 95+ 0 000 96 Since birth 0 000 97 Refused 0 000 98 Not ascertained 0 000 99 Dont know 0 000
Frequency Missing = 34513
AHS325_02000 RECOD Duration of skinsubcutaneous system problems Time unit
ALUNIT26 Frequency Percent ------------------------------------------1 Day(s) 0 000 2 Week(s) 1 833 3 Month(s) 2 1667 4 Year(s) 9 7500 6 Since birth 0 000 7 Refused 0 000 8 Not ascertained 0 000 9 Dont know 0 000
Frequency Missing = 34513
AHS325_02000 Duration (in years) of skinsubcutaneoussystem problems recode 1
ALDURA26 Frequency Percent ---------------------------------------------------00 Less than 1 year 2 1667 01-84 years 10 8333 85 85+ years 0 000 96 Unknown number of years 0 000 97 Refused 0 000 98 Not ascertained 0 000 99 Dont know 0 000
Frequency Missing = 34513
146
2012 National Health Interview Survey (NHIS)Sample Adult Public Use File (samadult)
AHS Variables Thursday May 16 2013Unweighted Frequencies
AHS325_02000 Duration of skinsubcutaneous system problems recode 2
ALDURB26 Frequency Percent ---------------------------------------------1 Less than 3 months 1 833 2 3-5 months 1 833 3 6-12 months 0 000 4 More than 1 year 10 8333 7 Refused 0 000 8 Not ascertained 0 000 9 Dont know 0 000
Frequency Missing = 34513
AHS325_02000 Skinsubcutaneous system problems condition status recode
ALCHRC26 Frequency Percent ---------------------------------------------1 Chronic 11 9167 2 Not chronic 1 833 9 Unknown if chronic 0 000
Frequency Missing = 34513
AHS326_01000 RECOD Duration of blood or blood-formingorgan problem Number of units
ALTIME27 Frequency Percent -------------------------------------------01-94 1-94 13 8667 95 95+ 0 000 96 Since birth 2 1333 97 Refused 0 000 98 Not ascertained 0 000 99 Dont know 0 000
Frequency Missing = 34510
AHS326_02000 RECOD Duration of blood or blood-forming organ problem Time unit
ALUNIT27 Frequency Percent ------------------------------------------1 Day(s) 0 000 2 Week(s) 1 667 3 Month(s) 2 1333 4 Year(s) 10 6667 6 Since birth 2 1333 7 Refused 0 000 8 Not ascertained 0 000 9 Dont know 0 000
Frequency Missing = 34510
147
2012 National Health Interview Survey (NHIS)Sample Adult Public Use File (samadult)
AHS Variables Thursday May 16 2013Unweighted Frequencies
AHS326_02000 Duration (in years) of bloodor blood-forming organ problem recode 1
ALDURA27 Frequency Percent ---------------------------------------------------00 Less than 1 year 2 1333 01-84 years 13 8667 85 85+ years 0 000 96 Unknown number of years 0 000 97 Refused 0 000 98 Not ascertained 0 000 99 Dont know 0 000
Frequency Missing = 34510
AHS326_02000 Duration of blood or blood-forming organ problem recode 2
ALDURB27 Frequency Percent ---------------------------------------------1 Less than 3 months 1 667 2 3-5 months 0 000 3 6-12 months 1 667 4 More than 1 year 13 8667 7 Refused 0 000 8 Not ascertained 0 000 9 Dont know 0 000
Frequency Missing = 34510
AHS326_02000 Blood or blood-forming organ problem condition status recode
ALCHRC27 Frequency Percent ---------------------------------------------1 Chronic 14 9333 2 Not chronic 1 667 9 Unknown if chronic 0 000
Frequency Missing = 34510
AHS327_01000 RECOD Duration of benign tumorcyst Number of units
ALTIME28 Frequency Percent -------------------------------------------01-94 1-94 28 9032 95 95+ 0 000 96 Since birth 2 645 97 Refused 0 000 98 Not ascertained 1 323 99 Dont know 0 000
Frequency Missing = 34494
148
2012 National Health Interview Survey (NHIS)Sample Adult Public Use File (samadult)
AHS Variables Thursday May 16 2013Unweighted Frequencies
AHS327_02000 RECOD Duration of benign tumorcyst Time unit
ALUNIT28 Frequency Percent ------------------------------------------1 Day(s) 0 000 2 Week(s) 0 000 3 Month(s) 4 1290 4 Year(s) 24 7742 6 Since birth 2 645 7 Refused 0 000 8 Not ascertained 1 323 9 Dont know 0 000
Frequency Missing = 34494
AHS327_02000 Duration (in years) of benign tumorcyst recode 1
ALDURA28 Frequency Percent ---------------------------------------------------00 Less than 1 year 4 1290 01-84 years 26 8387 85 85+ years 0 000 96 Unknown number of years 0 000 97 Refused 0 000 98 Not ascertained 1 323 99 Dont know 0 000
Frequency Missing = 34494
AHS327_02000 Duration of benign tumorcyst recode 2
ALDURB28 Frequency Percent ---------------------------------------------1 Less than 3 months 2 645 2 3-5 months 1 323 3 6-12 months 3 968 4 More than 1 year 24 7742 7 Refused 0 000 8 Not ascertained 1 323 9 Dont know 0 000
Frequency Missing = 34494
AHS327_02000 Benign tumorcyst condition status recode
ALCHRC28 Frequency Percent ---------------------------------------------1 Chronic 28 9032 2 Not chronic 2 645 9 Unknown if chronic 1 323
Frequency Missing = 34494
149
2012 National Health Interview Survey (NHIS)Sample Adult Public Use File (samadult)
AHS Variables Thursday May 16 2013Unweighted Frequencies
AHS328_01000 RECOD Duration of alcohol drugsubstanceabuse problem Number of units
ALTIME29 Frequency Percent -------------------------------------------01-94 1-94 3 10000 95 95+ 0 000 96 Since birth 0 000 97 Refused 0 000 98 Not ascertained 0 000 99 Dont know 0 000
Frequency Missing = 34522
AHS328_02000 RECOD Duration of alcoholdrugsubstanceabuse problem Time unit
ALUNIT29 Frequency Percent ------------------------------------------1 Day(s) 0 000 2 Week(s) 0 000 3 Month(s) 0 000 4 Year(s) 3 10000 6 Since birth 0 000 7 Refused 0 000 8 Not ascertained 0 000 9 Dont know 0 000
Frequency Missing = 34522
AHS328_02000 Duration (in years) of alcoholdrugsubstanceabuse problem recode 1
ALDURA29 Frequency Percent ---------------------------------------------------00 Less than 1 year 0 000 01-84 years 3 10000 85 85+ years 0 000 96 Unknown number of years 0 000 97 Refused 0 000 98 Not ascertained 0 000 99 Dont know 0 000
Frequency Missing = 34522
150
2012 National Health Interview Survey (NHIS)Sample Adult Public Use File (samadult)
AHS Variables Thursday May 16 2013Unweighted Frequencies
AHS328_02000 Duration of alcoholdrugsubstance abuse problem recode 2
ALDURB29 Frequency Percent ---------------------------------------------1 Less than 3 months 0 000 2 3-5 months 0 000 3 6-12 months 0 000 4 More than 1 year 3 10000 7 Refused 0 000 8 Not ascertained 0 000 9 Dont know 0 000
Frequency Missing = 34522
AHS328_02000 Alcohol drugsubstance abuse problem condition status recode
ALCHRC29 Frequency Percent ---------------------------------------------1 Chronic 3 10000 2 Not chronic 0 000 9 Unknown if chronic 0 000
Frequency Missing = 34522
AHS329_01000 RECOD Duration of other mental problemADDBipolarSchizophrenia Number of units
ALTIME30 Frequency Percent -------------------------------------------01-94 1-94 44 7586 95 95+ 0 000 96 Since birth 14 2414 97 Refused 0 000 98 Not ascertained 0 000 99 Dont know 0 000
Frequency Missing = 34467
AHS329_02000 RECOD Duration of other mental problemADDBipolarSchizophrenia Time unit
ALUNIT30 Frequency Percent ------------------------------------------1 Day(s) 0 000 2 Week(s) 0 000 3 Month(s) 0 000 4 Year(s) 44 7586 6 Since birth 14 2414 7 Refused 0 000 8 Not ascertained 0 000 9 Dont know 0 000
Frequency Missing = 34467
151
2012 National Health Interview Survey (NHIS)Sample Adult Public Use File (samadult)
AHS Variables Thursday May 16 2013Unweighted Frequencies
AHS329_02000 Duration (in years) of other mentalproblemADDBipolarSchizophrenia recode 1
ALDURA30 Frequency Percent ---------------------------------------------------00 Less than 1 year01-84 years85 85+ years96 Unknown number of years97 Refused
0 58 0 0 0
000 10000 000 000 000
98 Not ascertained 0 000 99 Dont know 0 000
Frequency Missing = 34467
AHS329_02000 Duration of other mental problemADDBipolarSchizophreniarecode 2
ALDURB30 Frequency Percent ---------------------------------------------1 Less than 3 months 0 000 2 3-5 months 0 000 3 6-12 months 1 172 4 More than 1 year 57 9828 7 Refused 0 000 8 Not ascertained 0 000 9 Dont know 0 000
Frequency Missing = 34467
AHS329_02000 Other mental problemADDBipolarSchizophreniacondition status recode
ALCHRC30 Frequency Percent ---------------------------------------------1 Chronic 58 10000 2 Not chronic 0 000 9 Unknown if chronic 0 000
Frequency Missing = 34467
AHS330_01000 RECOD Duration of surgical after-effectsmedicaltreatment problems Number of units
ALTIME31 Frequency Percent -------------------------------------------01-94 1-94 63 10000 95 95+ 0 000 96 Since birth 0 000 97 Refused 0 000 98 Not ascertained 0 000 99 Dont know 0 000
Frequency Missing = 34462
152
2012 National Health Interview Survey (NHIS)Sample Adult Public Use File (samadult)
AHS Variables Thursday May 16 2013Unweighted Frequencies
AHS330_02000 RECOD Duration of surgical after-effectsmedicaltreatment problems Time unit
ALUNIT31 Frequency Percent ------------------------------------------1 Day(s) 7 1111 2 Week(s) 6 952 3 Month(s) 19 3016 4 Year(s) 31 4921 6 Since birth 0 000 7 Refused 0 000 8 Not ascertained 0 000 9 Dont know 0 000
Frequency Missing = 34462
AHS330_02000 Duration (in years) of surgical after-effectsmedicaltreatment problems recode 1
ALDURA31 Frequency Percent ---------------------------------------------------00 Less than 1 year 31 4921 01-84 years 32 5079 85 85+ years 0 000 96 Unknown number of years 0 000 97 Refused 0 000 98 Not ascertained 0 000 99 Dont know 0 000
Frequency Missing = 34462
AHS330_02000 Duration of surgical after-effectsmedicaltreatment problems recode 2
ALDURB31 Frequency Percent ---------------------------------------------1 Less than 3 months 18 2857 2 3-5 months 6 952 3 6-12 months 14 2222 4 More than 1 year 25 3968 7 Refused 0 000 8 Not ascertained 0 000 9 Dont know 0 000
Frequency Missing = 34462
153
2012 National Health Interview Survey (NHIS)Sample Adult Public Use File (samadult)
AHS Variables Thursday May 16 2013Unweighted Frequencies
AHS330_02000 Surgical after-effectsmedicaltreatment problems condition status recode
ALCHRC31 Frequency Percent ---------------------------------------------1 Chronic 45 7143 2 Not chronic 18 2857 9 Unknown if chronic 0 000
Frequency Missing = 34462
AHS331_01000 RECOD Duration of old ageelderlyaging-relatedproblems Number of units
ALTIME32 Frequency Percent -------------------------------------------01-94 1-94 225 8212 95 95+ 0 000 96 Since birth 0 000 97 Refused 7 255 98 Not ascertained 8 292 99 Dont know 34 1241
Frequency Missing = 34251
AHS331_02000 RECOD Duration of old ageelderlyaging-relatedproblems Time unit
ALUNIT32 Frequency Percent ------------------------------------------1 Day(s) 2 073 2 Week(s) 0 000 3 Month(s) 12 438 4 Year(s) 224 8175 6 Since birth 0 000 7 Refused 7 255 8 Not ascertained 8 292 9 Dont know 21 766
Frequency Missing = 34251
154
2012 National Health Interview Survey (NHIS)Sample Adult Public Use File (samadult)
AHS Variables Thursday May 16 2013Unweighted Frequencies
AHS331_02000 Duration (in years) of old ageelderlyaging-relatedproblems recode 1
ALDURA32 Frequency Percent ---------------------------------------------------00 Less than 1 year 14 511 01-84 years 206 7518 85 85+ years 5 182 96 Unknown number of years 13 474 97 Refused 7 255 98 Not ascertained 8 292 99 Dont know 21 766
Frequency Missing = 34251
AHS331_02000 Duration of old ageelderlyaging-related problems recode 2
ALDURB32 Frequency Percent ---------------------------------------------1 Less than 3 months 4 146 2 3-5 months 1 036 3 6-12 months 29 1058 4 More than 1 year 204 7445 7 Refused 7 255 8 Not ascertained 8 292 9 Dont know 21 766
Frequency Missing = 34251
AHS331_02000 Old ageelderlyaging-related problems condition status recode
ALCHRC32 Frequency Percent ---------------------------------------------1 Chronic 274 10000 2 Not chronic 0 000 9 Unknown if chronic 0 000
Frequency Missing = 34251
AHS332_01000 RECOD Duration of fatiguetirednessweaknessproblem Number of units
ALTIME33 Frequency Percent -------------------------------------------01-94 1-94 89 8165 95 95+ 0 000 96 Since birth 12 1101 97 Refused 0 000 98 Not ascertained 0 000 99 Dont know 8 734
Frequency Missing = 34416
155
2012 National Health Interview Survey (NHIS)Sample Adult Public Use File (samadult)
AHS Variables Thursday May 16 2013Unweighted Frequencies
AHS332_02000 RECOD Duration of fatiguetirednessweakness problem Time unit
ALUNIT33 Frequency Percent ------------------------------------------1 Day(s)2 Week(s)3 Month(s)4 Year(s)6 Since birth
2 2 11 78 12
183 183 1009 7156 1101
7 Refused 0 000 8 Not ascertained 0 000 9 Dont know 4 367
Frequency Missing = 34416
AHS332_02000 Duration (in years) of fatiguetirednessweaknessproblem recode 1
ALDURA33 Frequency Percent ---------------------------------------------------00 Less than 1 year 14 1284 01-84 years 87 7982 85 85+ years 0 000 96 Unknown number of years 4 367 97 Refused 0 000 98 Not ascertained 0 000 99 Dont know 4 367
Frequency Missing = 34416
AHS332_02000 Duration of fatiguetirednessweakness problem recode 2
ALDURB33 Frequency Percent ---------------------------------------------1 Less than 3 months 8 734 2 3-5 months 0 000 3 6-12 months 24 2202 4 More than 1 year 73 6697 7 Refused 0 000 8 Not ascertained 0 000 9 Dont know 4 367
Frequency Missing = 34416
AHS332_02000 Fatiguetirednessweakness problem condition status recode
ALCHRC33 Frequency Percent ---------------------------------------------1 Chronic 97 8899 2 Not chronic 8 734 9 Unknown if chronic 4 367
Frequency Missing = 34416
156
2012 National Health Interview Survey (NHIS)Sample Adult Public Use File (samadult)
AHS Variables Thursday May 16 2013Unweighted Frequencies
AHS333_01000 RECOD Duration of pregnancy-related problem Number of units
ALTIME34 Frequency Percent -------------------------------------------01-94 1-94 36 10000 95 95+ 0 000 96 Since birth 0 000 97 Refused 0 000 98 Not ascertained 0 000 99 Dont know 0 000
Frequency Missing = 34489
AHS333_02000 RECOD Duration of pregnancy-related problem Time unit
ALUNIT34 Frequency Percent ------------------------------------------1 Day(s) 0 000 2 Week(s) 5 1389 3 Month(s) 29 8056 4 Year(s) 2 556 6 Since birth 0 000 7 Refused 0 000 8 Not ascertained 0 000 9 Dont know 0 000
Frequency Missing = 34489
AHS333_02000 Duration (in years) of pregnancy-related problem recode 1
ALDURA34 Frequency Percent ---------------------------------------------------00 Less than 1 year 34 9444 01-84 years 2 556 85 85+ years 0 000 96 Unknown number of years 0 000 97 Refused 0 000 98 Not ascertained 0 000 99 Dont know 0 000
Frequency Missing = 34489
157
2012 National Health Interview Survey (NHIS)Sample Adult Public Use File (samadult)
AHS Variables Thursday May 16 2013Unweighted Frequencies
AHS333_02000 Duration of pregnancy-related problem recode 2
ALDURB34 Frequency Percent ---------------------------------------------1 Less than 3 months 5 1389 2 3-5 months 6 1667 3 6-12 months 23 6389 4 More than 1 year 2 556 7 Refused 0 000 8 Not ascertained 0 000 9 Dont know 0 000
Frequency Missing = 34489
AHS333_02000 Pregnancy-related condition status recode
ALCHRC34 Frequency Percent ---------------------------------------------1 Chronic 0 000 2 Not chronic 36 10000 9 Unknown if chronic 0 000
Frequency Missing = 34489
AHS335_01000 Duration of other impairmentproblem NEC (1) Number of units
ALTIME90 Frequency Percent -------------------------------------------01-94 1-94 270 8084 95 95+ 3 090 96 Since birth 38 1138 97 Refused 3 090 98 Not ascertained 0 000 99 Dont know 20 599
Frequency Missing = 34191
AHS335_02000 Duration of other impairmentproblem NEC (1) Time unit
ALUNIT90 Frequency Percent ------------------------------------------1 Day(s) 9 269 2 Week(s) 3 090 3 Month(s) 37 1108 4 Year(s) 228 6826 6 Since birth 38 1138 7 Refused 3 090 8 Not ascertained 0 000 9 Dont know 16 479
Frequency Missing = 34191
158
2012 National Health Interview Survey (NHIS)Sample Adult Public Use File (samadult)
AHS Variables Thursday May 16 2013Unweighted Frequencies
AHS335_02000 Duration (in years) of otherimpairmentproblem NEC (1) recode 1
ALDURA90 Frequency Percent ---------------------------------------------------00 Less than 1 year 44 1317 01-84 years 267 7994 85 85+ years 0 000 96 Unknown number of years 4 120 97 Refused 3 090 98 Not ascertained 0 000 99 Dont know 16 479
Frequency Missing = 34191
AHS335_02000 Duration of other impairmentproblem NEC (1) recode 2
ALDURB90 Frequency Percent ---------------------------------------------1 Less than 3 months 17 509 2 3-5 months 11 329 3 6-12 months 41 1228 4 More than 1 year 246 7365 7 Refused 3 090 8 Not ascertained 0 000 9 Dont know 16 479
Frequency Missing = 34191
AHS335_02000 Other impairmentproblem NEC (1) condition status recode
ALCHRC90 Frequency Percent ---------------------------------------------1 Chronic 298 8922 2 Not chronic 17 509 9 Unknown if chronic 19 569
Frequency Missing = 34191
AHS336_01000 Duration of other impairmentproblem NEC (2) Number of units
ALTIME91 Frequency Percent -------------------------------------------01-94 1-94 4 10000 95 95+ 0 000 96 Since birth 0 000 97 Refused 0 000 98 Not ascertained 0 000 99 Dont know 0 000
Frequency Missing = 34521
159
2012 National Health Interview Survey (NHIS)Sample Adult Public Use File (samadult)
AHS Variables Thursday May 16 2013Unweighted Frequencies
AHS336_02000 Duration of other impairmentproblem NEC (2) Time unit
ALUNIT91 Frequency Percent ------------------------------------------1 Day(s)2 Week(s)3 Month(s)4 Year(s)6 Since birth
0 0 0 4 0
000 000 000
10000 000
7 Refused 0 000 8 Not ascertained 0 000 9 Dont know 0 000
Frequency Missing = 34521
AHS336_02000 Duration (in years) of otherimpairment problem NEC (2) recode 1
ALDURA91 Frequency Percent ---------------------------------------------------00 Less than 1 year 0 000 01-84 years 4 10000 85 85+ years 0 000 96 Unknown number of years 0 000 97 Refused 0 000 98 Not ascertained 0 000 99 Dont know 0 000
Frequency Missing = 34521
AHS336_02000 Duration of other impairmentproblem NEC (2) recode 2
ALDURB91 Frequency Percent ---------------------------------------------1 Less than 3 months 0 000 2 3-5 months 0 000 3 6-12 months 0 000 4 More than 1 year 4 10000 7 Refused 0 000 8 Not ascertained 0 000 9 Dont know 0 000
Frequency Missing = 34521
AHS336_02000 Other impairmentproblem NEC (2) condition status recode
ALCHRC91 Frequency Percent ---------------------------------------------1 Chronic 4 10000 2 Not chronic 0 000 9 Unknown if chronic 0 000
Frequency Missing = 34521
--------------------------------------------------------------------------------
-------------------------------------------------------------------------------
--------------------------------------------------------------------------------
2012 National Health Interview Survey (NHIS) 160 Sample Adult Public Use File (samadult)
AHS Variables Thursday May 16 2013Unweighted Frequencies
AHS336_02000 Chronic condition recode for individual with functional limitation
ALCNDRT Frequency
1 At least one condition causing functional limitation is chronic 12350 2 No condition causing functional limitation 268 9 Unknown if any condition causing functional limitation is chronic 273
Frequency Missing = 21634
AHS336_02000 Chronic condition recode for individual with functional limitation
ALCNDRT Percent
1 At least one condition causing functional limitation is chronic 9580 2 No condition causing functional limitation 208 9 Unknown if any condition causing functional limitation is chronic 212
Frequency Missing = 21634
AHS336_02000 Overall functional limitation recode by condition status
ALCHRONR Frequency Percent
0 Not limited in any way (including unknown if limited) 21634 6266 1 Limited caused by at least one chronic condition 12350 3577 2 Limited not caused by chronic condition 268 078 3 Limited unknown if condition is chronic 273 079
161
2012 National Health Interview Survey (NHIS)Sample Adult Public Use File (samadult)
AHB Variables Thursday May 16 2013Unweighted Frequencies
AHB010_00000 Ever smoked 100 cigarettes
SMKEV Frequency Percent ------------------------------------------1 Yes 14031 4064 2 No 20236 5861 7 Refused 59 017 8 Not ascertained 173 050 9 Dont know 26 008
AHB020_00000 Age first smoked fairly regularly
SMKREG Frequency Percent --------------------------------------------------06-84 6 - 84 years 13590 9686 85 85 years or older 0 000 96 Never smoked regularly 265 189 97 Refused 20 014 98 Not ascertained 4 003 99 Dont know 152 108
Frequency Missing = 20494
AHB030_00000 Smoke freq everydaysome daysnot at all
SMKNOW Frequency Percent ------------------------------------------1 Every day 4954 3531 2 Some days 1482 1056 3 Not at all 7584 5405 7 Refused 8 006 8 Not ascertained 3 002 9 Dont know 0 000
Frequency Missing = 20494
AHB030_00000 Smoking Status Recode
SMKSTAT2 Frequency Percent ---------------------------------------------------------1 Current every day smoker 4954 1435 2 Current some day smoker 1482 429 3 Former smoker 7584 2197 4 Never smoker 20236 5861 5 Smoker current status unknown 11 003 9 Unknown if ever smoked 258 075
162
2012 National Health Interview Survey (NHIS)Sample Adult Public Use File (samadult)
AHB Variables Thursday May 16 2013Unweighted Frequencies
AHB040_01000 Time since quit of units
SMKQTNO Frequency Percent -------------------------------------------01-94 1 - 94 7508 9900 95 95+ 1 001 97 Refused 5 007 98 Not ascertained 0 000 99 Dont know 70 092
Frequency Missing = 26941
AHB040_02000 Time since quit time period
SMKQTTP Frequency Percent ------------------------------------------1 Day(s) 59 078 2 Week(s) 67 088 3 Month(s) 551 727 4 Year(s) 6832 9008 7 Refused 5 007 8 Not ascertained 0 000 9 Dont know 70 092
Frequency Missing = 26941
AHB040_02000 Time since quit smoking (in years)
SMKQTY Frequency Percent --------------------------------------------00 Less than 1 year 562 741 01-69 1-69 years 6938 9148 70 70+ years 9 012 97 Refused 5 007 98 Not ascertained 0 000 99 Dont know 70 092
Frequency Missing = 26941
AHB050_00000 Number cigs per day (daily smokers)
CIGSDA1 Frequency Percent ------------------------------------------------01-94 1 - 94 cigarettes 4920 9931 95 95+ cigarettes 1 002 97 Refused 7 014 98 Not ascertained 0 000 99 Dont know 26 052
Frequency Missing = 29571
163
2012 National Health Interview Survey (NHIS)Sample Adult Public Use File (samadult)
AHB Variables Thursday May 16 2013Unweighted Frequencies
AHB060_00000 Number days smoked in past 30 days
CIGDAMO Frequency Percent -------------------------------------------00 None 57 385 01-30 1-30 days 1388 9366 97 Refused 0 000 98 Not ascertained 0 000 99 Dont know 37 250
Frequency Missing = 33043
AHB070_00000 Number cigs per day (some day smokers)
CIGSDA2 Frequency Percent ------------------------------------------------01-94 1 - 94 cigarettes 1404 9853 95 95+ cigarettes 0 000 97 Refused 2 014 98 Not ascertained 0 000 99 Dont know 19 133
Frequency Missing = 33100
AHB070_00000 Number of cigarettes a day (all current smokers)
CIGSDAY Frequency Percent ------------------------------------------------01-94 1 - 94 cigarettes 6324 9914 95 95+ cigarettes 1 002 97 Refused 9 014 98 Not ascertained 0 000 99 Dont know 45 071
Frequency Missing = 28146
AHB080_00000 Tried quit smoking 1+ days past 12 m
CIGQTYR Frequency Percent ------------------------------------------1 Yes 2961 4601 2 No 3467 5387 7 Refused 2 003 8 Not ascertained 0 000 9 Dont know 6 009
Frequency Missing = 28089
164
2012 National Health Interview Survey (NHIS)Sample Adult Public Use File (samadult)
AHB Variables Thursday May 16 2013Unweighted Frequencies
AHB085_00010 Ever smoked tobacco products OTHER than cigarettes
OTHCIGEV Frequency Percent ------------------------------------------1 Yes 7181 2080 2 No 27076 7842 7 Refused 62 018 8 Not ascertained 183 053 9 Dont know 23 007
AHB085_00020 Smoke freq everydaysome daysrarelynotat all (other than cigarettes)
OTHCIGED Frequency Percent ------------------------------------------1 Every day 258 359 2 Some days 377 525 3 Rarely 1232 1716 4 Not at all 5312 7397 7 Refused 0 000 8 Not ascertained 1 001 9 Dont know 1 001
Frequency Missing = 27344
AHB085_00030 Ever used smokeless tobacco products
SMKLESEV Frequency Percent ------------------------------------------1 Yes 3440 996 2 No 30826 8929 7 Refused 55 016 8 Not ascertained 187 054 9 Dont know 17 005
AHB085_00040 Smokeless tobacco freq everydaysome daysrarelynot at all
SMKLESED Frequency Percent ------------------------------------------1 Every day 448 1302 2 Some days 219 637 3 Rarely 232 674 4 Not at all 2541 7387 7 Refused 0 000 8 Not ascertained 0 000 9 Dont know 0 000
Frequency Missing = 31085
165
2012 National Health Interview Survey (NHIS)Sample Adult Public Use File (samadult)
AHB Variables Thursday May 16 2013Unweighted Frequencies
AHB085_00050 Using any tobacco product around this time last year
TOBLASYR Frequency Percent ------------------------------------------1 Yes 6676 3844 2 No 10669 6143 7 Refused 9 005 8 Not ascertained 9 005 9 Dont know 6 003
Frequency Missing = 17156
AHB085_00060 Tried quit all tobacco products 1+ days past 12 m
TOBQTYR Frequency Percent ------------------------------------------1 Yes 3207 3766 2 No 5296 6220 7 Refused 2 002 8 Not ascertained 2 002 9 Dont know 8 009
Frequency Missing = 26010
AHB090_01000 Freq vigorous activity of units
VIGNO Frequency Percent ------------------------------------------------------------000 Never 18386 5325 001-995 1-995 time(s) 14895 4314 996 Unable to do this type activity 752 218 997 Refused 31 009 998 Not ascertained 402 116 999 Dont know 59 017
AHB090_02000 Freq vigorous activity Time units
VIGTP Frequency Percent -----------------------------------------------------0 Never 18386 5325 1 Per day 2425 702 2 Per week 11204 3245 3 Per month 1018 295 4 Per year 248 072 6 Unable to do this activity 752 218 7 Refused 31 009 8 Not ascertained 402 116 9 Dont know 59 017
166
2012 National Health Interview Survey (NHIS)Sample Adult Public Use File (samadult)
AHB Variables Thursday May 16 2013Unweighted Frequencies
AHB090_02000 Freq vigorous activity (times per wk)
VIGFREQW Frequency Percent ----------------------------------------------------------00 Less than once per week 914 265 01-28 1-28 times per week 13981 4050 95 Never 18386 5325 96 Unable to do vigorous activity 752 218 97 Refused 31 009 98 Not ascertained 402 116 99 Dont know 59 017
AHB100_01000 Duration vigorous activity units
VIGLNGNO Frequency Percent --------------------------------------------001-995 1-995 14834 9959 997 Refused 0 000 998 Not ascertained 14 009 999 Dont know 47 032
Frequency Missing = 19630
AHB100_02000 Duration vigorous activity Time unit
VIGLNGTP Frequency Percent ------------------------------------------1 Minutes 9517 6389 2 Hours 5317 3570 7 Refused 0 000 8 Not ascertained 14 009 9 Dont know 47 032
Frequency Missing = 19630
AHB100_02000 Duration vigorous activity (in minutes)
VIGMIN Frequency Percent -----------------------------------------------010-720 10-720 minutes 14834 9959 997 Refused 0 000 998 Not ascertained 14 009 999 Dont know 47 032
Frequency Missing = 19630
167
2012 National Health Interview Survey (NHIS)Sample Adult Public Use File (samadult)
AHB Variables Thursday May 16 2013Unweighted Frequencies
AHB110_01000 Freq moderate activity of units
MODNO Frequency Percent ------------------------------------------------------------000 Never 13555 3926 001-995 1-995 time(s) 19727 5714 996 Unable to do this type activity 524 152 997 Refused 35 010 998 Not ascertained 537 156 999 Dont know 147 043
AHB110_02000 Freq moderate activity Time units
MODTP Frequency Percent -----------------------------------------------------0 Never 13555 3926 1 Per day 5256 1522 2 Per week 13369 3872 3 Per month 899 260 4 Per year 203 059 6 Unable to do this activity 524 152 7 Refused 35 010 8 Not ascertained 537 156 9 Dont know 147 043
AHB110_02000 Freq lightmoderate activity (times per wk)
MODFREQW Frequency Percent -------------------------------------------------------------------00 Less than once per week 706 204 01-28 1-28 times per week 19021 5509 95 Never 13555 3926 96 Unable to do light or moderate activity 524 152 97 Refused 35 010 98 Not ascertained 537 156 99 Dont know 147 043
AHB120_01000 Duration moderate activity of units
MODLNGNO Frequency Percent --------------------------------------------001-995 1-995 19611 9941 997 Refused 1 001 998 Not ascertained 10 005 999 Dont know 105 053
Frequency Missing = 14798
168
2012 National Health Interview Survey (NHIS)Sample Adult Public Use File (samadult)
AHB Variables Thursday May 16 2013Unweighted Frequencies
AHB120_02000 Duration moderate activity Time unit
MODLNGTP Frequency Percent ------------------------------------------1 Minutes 14362 7280 2 Hours 5249 2661 7 Refused 1 001 8 Not ascertained 10 005 9 Dont know 105 053
Frequency Missing = 14798
AHB120_02000 Duration lightmoderate activity (in minutes)
MODMIN Frequency Percent -----------------------------------------------010-720 10-720 minutes 19611 9941 997 Refused 1 001 998 Not ascertained 10 005 999 Dont know 105 053
Frequency Missing = 14798
AHB130_01000 Strength activity freq of units
STRNGNO Frequency Percent ------------------------------------------------------------000 Never 24308 7041 001-995 1-995 time(s) 9241 2677 996 Unable to do this type activity 574 166 997 Refused 35 010 998 Not ascertained 316 092 999 Dont know 51 015
AHB130_02000 Strength activity freq Time units
STRNGTP Frequency Percent -----------------------------------------------------0 Never 24308 7041 1 Per day 1359 394 2 Per week 7163 2075 3 Per month 572 166 4 Per year 147 043 6 Unable to do this activity 574 166 7 Refused 35 010 8 Not ascertained 316 092 9 Dont know 51 015
169
2012 National Health Interview Survey (NHIS)Sample Adult Public Use File (samadult)
AHB Variables Thursday May 16 2013Unweighted Frequencies
AHB130_02000 Freq strength activity (times per wk)
STRFREQW Frequency Percent ----------------------------------------------------------00 Less than once per week 510 148 01-28 1-28 times per week 8731 2529 95 Never 24308 7041 96 Unable to do strength activity 574 166 97 Refused 35 010 98 Not ascertained 316 092 99 Dont know 51 015
AHB140_00000 Ever had 12+ drinks in any one year
ALC1YR Frequency Percent ------------------------------------------1 Yes 21343 6182 2 No 12841 3719 7 Refused 70 020 8 Not ascertained 254 074 9 Dont know 17 005
AHB150_00000 Had 12+ drinks in ENTIRE LIFE
ALCLIFE Frequency Percent ------------------------------------------1 Yes 5380 4081 2 No 7451 5652 7 Refused 67 051 8 Not ascertained 257 195 9 Dont know 27 020
Frequency Missing = 21343
AHB160_01000 Freq drank alcohol pst yr of units
ALC12MNO Frequency Percent --------------------------------------------000 Never 5400 2021 001-365 1-365 days 21049 7877 997 Refused 48 018 998 Not ascertained 3 001 999 Dont know 223 083
Frequency Missing = 7802
170
2012 National Health Interview Survey (NHIS)Sample Adult Public Use File (samadult)
AHB Variables Thursday May 16 2013Unweighted Frequencies
AHB160_02000 Freq drank alcohol pst yr Time unit
ALC12MTP Frequency Percent ------------------------------------------0 NeverNone 5400 2021 1 Week 9172 3432 2 Month 5304 1985 3 Year 6572 2459 7 Refused 48 018 8 Not ascertained 4 001 9 Dont know 223 083
Frequency Missing = 7802
AHB160_02000 Freq drank alcohol Days per week
ALC12MWK Frequency Percent ------------------------------------------------------00 Less than one day per week 10224 3826 01-07 1-7 days per week 10825 4051 95 Did not drink in past year 5400 2021 97 Refused 48 018 98 Not ascertained 3 001 99 Dont know 223 083
Frequency Missing = 7802
AHB160_02000 Freq drank alcohol Days in past year
ALC12MYR Frequency Percent --------------------------------------------000 Nevernone 5400 2021 001-365 1-365 days 21049 7877 997 Refused 48 018 998 Not ascertained 3 001 999 Dont know 223 083
Frequency Missing = 7802
AHB170_00000 Average drinks on days drank
ALCAMT Frequency Percent -------------------------------------------01-94 1-94 drinks 20939 9948 95 95+ drinks 3 001 97 Refused 15 007 98 Not ascertained 2 001 99 Dont know 89 042
Frequency Missing = 13477
171
2012 National Health Interview Survey (NHIS)Sample Adult Public Use File (samadult)
AHB Variables Thursday May 16 2013Unweighted Frequencies
AHB170_00000 Alcohol drinking status Recode
ALCSTAT Frequency Percent --------------------------------------------------------------------01 Lifetime abstainer 7451 2158 02 Former infrequent 3087 894 03 Former regular 2309 669 04 Former unknown frequency 4 001 05 Current infrequent 4322 1252 06 Current light 9945 2881 07 Current moderate 4916 1424 08 Current heavier 1759 509 09 Current drinker frequencylevel unknown 107 031 10 Drinking status unknown 625 181
AHB180_01000 Days 5+ drinks past yr days
ALC5UPNO Frequency Percent --------------------------------------------000 Nevernone 13557 6441 001-365 1-365 days 7227 3434 997 Refused 17 008 998 Not ascertained 5 002 999 Dont know 242 115
Frequency Missing = 13477
AHB180_02000 Days 5+ drinks past yr Time unit
ALC5UPTP Frequency Percent ------------------------------------------0 NeverNone 13557 6441 1 Per week 678 322 2 Per month 519 247 3 Per year 6030 2865 7 Refused 17 008 8 Not ascertained 5 002 9 Dont know 242 115
Frequency Missing = 13477
AHB180_02000 Number of days had 5+ drinks past year
ALC5UPYR Frequency Percent --------------------------------------------000 Nevernone 13557 6441 001-365 1-365 days 7227 3434 997 Refused 17 008 998 Not ascertained 5 002 999 Dont know 242 115
Frequency Missing = 13477
172
2012 National Health Interview Survey (NHIS)Sample Adult Public Use File (samadult)
AHB Variables Thursday May 16 2013Unweighted Frequencies
AHB190_04000 Total height in inches
AHEIGHT Frequency Percent -------------------------------------------59-76 59-76 inches 31959 9257 96 Not available 2080 602 97 Refused 62 018 98 Not ascertained 311 090 99 Dont know 113 033
AHB200_02000 Weight without shoes (pounds)
AWEIGHTP Frequency Percent -----------------------------------------------100-299 100-299 pounds 31211 9040 996 Not available 2080 602 997 Refused 546 158 998 Not ascertained 289 084 999 Dont know 399 116
AHB200_02000 Body Mass Index (BMI)
BMI Frequency Percent ----------------------------------------------0001-9994 0001-9994 33170 9608 9995 9995+ 0 000 9999 Unknown 1355 392
AHB210_00000 Hours of sleep
SLEEP Frequency Percent -------------------------------------------01-24 1-24 hours 34032 9857 97 Refused 49 014 98 Not ascertained 293 085 99 Dont know 151 044
173
2012 National Health Interview Survey (NHIS)Sample Adult Public Use File (samadult)
AAU Variables Thursday May 16 2013Unweighted Frequencies
AAU020_00000 Place USUALLY go when sick
AUSUALPL Frequency Percent -------------------------------------------------------1 Yes 28167 8158 2 There is NO place 5642 1634 3 There is MORE THAN ONE place 364 105 7 Refused 12 003 8 Not ascertained 334 097 9 Dont know 6 002
AAU030_00000 Place to go when sick (most often)
APLKIND Frequency Percent -------------------------------------------------------------1 Clinic or health center 7091 2485 2 Doctors office or HMO 19994 7008 3 Hospital emergency room 410 144 4 Hospital outpatient department 474 166 5 Some other place 339 119 6 Doesnt go to one place most often 204 072 7 Refused 7 002 8 Not ascertained 4 001 9 Dont know 8 003
Frequency Missing = 5994
AAU035_00000 USUALLY go there for routinepreventive care
AHCPLROU Frequency Percent ------------------------------------------1 Yes 26616 9402 2 No 1668 589 7 Refused 5 002 8 Not ascertained 2 001 9 Dont know 17 006
Frequency Missing = 6217
174
2012 National Health Interview Survey (NHIS)Sample Adult Public Use File (samadult)
AAU Variables Thursday May 16 2013Unweighted Frequencies
AAU037_00000 Place USUALLY go for routinepreventive care
AHCPLKND Frequency Percent ---------------------------------------------------------------0 Doesnt get preventive care anywhere 3928 4966 1 Clinic or health center 1069 1352 2 Doctors office or HMO 1637 2070 3 Hospital emergency room 150 190 4 Hospital outpatient department 86 109 5 Some other place 161 204 6 Doesnt go to one place most often 493 623 7 Refused 24 030 8 Not ascertained 344 435 9 Dont know 17 021
Frequency Missing = 26616
AAU040_00000 Change health care place past 12 m
AHCCHGYR Frequency Percent ------------------------------------------1 Yes 2345 822 2 No 26166 9171 7 Refused 6 002 8 Not ascertained 9 003 9 Dont know 5 002
Frequency Missing = 5994
AAU050_00000 Change related to health insurance
AHCCHGHI Frequency Percent ------------------------------------------1 Yes 630 2687 2 No 1714 7309 7 Refused 0 000 8 Not ascertained 0 000 9 Dont know 1 004
Frequency Missing = 32180
AAU050_01010 Doesnt need doctorhavent had problems
ANOUSPL1 Frequency Percent ------------------------------------------1 Mentioned 2735 4848 2 Not mentioned 2888 5119 7 Refused 3 005 8 Not ascertained 5 009 9 Donrsquot know 11 019
Frequency Missing = 28883
175
2012 National Health Interview Survey (NHIS)Sample Adult Public Use File (samadult)
AAU Variables Thursday May 16 2013Unweighted Frequencies
AAU050_02010 Doesnt liketrustbelieve in doctors
ANOUSPL2 Frequency Percent ------------------------------------------1 Mentioned 204 362 2 Not mentioned 5419 9605 7 Refused 3 005 8 Not ascertained 5 009 9 Donrsquot know 11 019
Frequency Missing = 28883
AAU050_03010 Doesnt know where to go
ANOUSPL3 Frequency Percent ------------------------------------------1 Mentioned 135 239 2 Not mentioned 5488 9727 7 Refused 3 005 8 Not ascertained 5 009 9 Donrsquot know 11 019
Frequency Missing = 28883
AAU050_04010 Previous doctor is not availablemoved
ANOUSPL4 Frequency Percent ------------------------------------------1 Mentioned 171 303 2 Not mentioned 5452 9663 7 Refused 3 005 8 Not ascertained 5 009 9 Donrsquot know 11 019
Frequency Missing = 28883
AAU050_05010 Too expensiveno insurancecost
ANOUSPL5 Frequency Percent ------------------------------------------1 Mentioned 2165 3837 2 Not mentioned 3458 6129 7 Refused 3 005 8 Not ascertained 5 009 9 Donrsquot know 11 019
Frequency Missing = 28883
176
2012 National Health Interview Survey (NHIS)Sample Adult Public Use File (samadult)
AAU Variables Thursday May 16 2013Unweighted Frequencies
AAU050_06010 Speak a different language
ANOUSPL6 Frequency Percent ------------------------------------------1 Mentioned 19 034 2 Not mentioned 5604 9933 7 Refused 3 005 8 Not ascertained 5 009 9 Donrsquot know 11 019
Frequency Missing = 28883
AAU050_07010 No care availabletoo far awaynot convenient
ANOUSPL7 Frequency Percent ------------------------------------------1 Mentioned 55 097 2 Not mentioned 5568 9869 7 Refused 3 005 8 Not ascertained 5 009 9 Donrsquot know 11 019
Frequency Missing = 28883
AAU050_08010 Put if offdidnt get around to it
ANOUSPL8 Frequency Percent ------------------------------------------1 Mentioned 314 557 2 Not mentioned 5309 9410 7 Refused 3 005 8 Not ascertained 5 009 9 Donrsquot know 11 019
Frequency Missing = 28883
AAU050_09010 Other reason no usual place of care
ANOUSPL9 Frequency Percent ------------------------------------------1 Mentioned 404 716 2 Not mentioned 5219 9250 7 Refused 3 005 8 Not ascertained 5 009 9 Donrsquot know 11 019
Frequency Missing = 28883
177
2012 National Health Interview Survey (NHIS)Sample Adult Public Use File (samadult)
AAU Variables Thursday May 16 2013Unweighted Frequencies
AAU051_00010 Trouble finding a doctorprovider past 12 m
APRVTRYR Frequency Percent ------------------------------------------1 Yes 1037 300 2 No 33096 9586 7 Refused 15 004 8 Not ascertained 359 104 9 Dont know 18 005
AAU053_00010 Able to find doctorprovider past 12 m
APRVTRFD Frequency Percent ------------------------------------------1 Yes 683 6586 2 No 347 3346 7 Refused 0 000 8 Not ascertained 0 000 9 Donrsquot know 7 068
Frequency Missing = 33488
AAU057_00010 Doctors office not accept you as new patient past 12 m
ADRNANP Frequency Percent ------------------------------------------1 Yes 807 234 2 No 33317 9650 7 Refused 15 004 8 Not ascertained 361 105 9 Donrsquot know 25 007
AAU059_00010 Doctors office not accept your health insurance past 12 m
ADRNAI Frequency Percent ------------------------------------------1 Yes 1062 308 2 No 33051 9573 7 Refused 16 005 8 Not ascertained 365 106 9 Donrsquot know 31 009
AAU061_01000 Couldnt get through on phone past 12 m
AHCDLYR1 Frequency Percent ------------------------------------------1 Yes 809 234 2 No 33304 9646 7 Refused 18 005 8 Not ascertained 378 109 9 Dont know 16 005
178
2012 National Health Interview Survey (NHIS)Sample Adult Public Use File (samadult)
AAU Variables Thursday May 16 2013Unweighted Frequencies
AAU061_02000 Couldnt get appointment soon enough past 12 m
AHCDLYR2 Frequency Percent ------------------------------------------1 Yes 1961 568 2 No 32151 9312 7 Refused 19 006 8 Not ascertained 378 109 9 Dont know 16 005
AAU061_03000 Wait too long in doctors office past 12 m
AHCDLYR3 Frequency Percent ------------------------------------------1 Yes 1506 436 2 No 32600 9442 7 Refused 20 006 8 Not ascertained 381 110 9 Dont know 18 005
AAU061_04000 Not open when you could go past 12 m
AHCDLYR4 Frequency Percent ------------------------------------------1 Yes 973 282 2 No 33132 9597 7 Refused 20 006 8 Not ascertained 382 111 9 Dont know 18 005
AAU061_05000 No transportation past 12 m
AHCDLYR5 Frequency Percent ------------------------------------------1 Yes 794 230 2 No 33317 9650 7 Refused 19 006 8 Not ascertained 383 111 9 Dont know 12 003
AAU111_01000 Couldnt afford prescription medicine past 12 m
AHCAFYR1 Frequency Percent ------------------------------------------1 Yes 3040 881 2 No 31056 8995 7 Refused 17 005 8 Not ascertained 398 115 9 Dont know 14 004
179
2012 National Health Interview Survey (NHIS)Sample Adult Public Use File (samadult)
AAU Variables Thursday May 16 2013Unweighted Frequencies
AAU111_02000 Couldnt afford mental health carecounseling past 12 m
AHCAFYR2 Frequency Percent ------------------------------------------1 Yes 944 273 2 No 33146 9601 7 Refused 18 005 8 Not ascertained 405 117 9 Dont know 12 003
AAU111_03000 Couldnt afford dental care past 12 m
AHCAFYR3 Frequency Percent ------------------------------------------1 Yes 4776 1383 2 No 29313 8490 7 Refused 16 005 8 Not ascertained 407 118 9 Dont know 13 004
AAU111_04000 Couldnt afford eyeglasses past 12 m
AHCAFYR4 Frequency Percent ------------------------------------------1 Yes 2860 828 2 No 31231 9046 7 Refused 16 005 8 Not ascertained 407 118 9 Dont know 11 003
AAU111_05010 Couldnt afford to see a specialist past 12 m
AHCAFYR5 Frequency Percent ------------------------------------------1 Yes 1853 537 2 No 32232 9336 7 Refused 16 005 8 Not ascertained 408 118 9 Donrsquot know 16 005
AAU111_06010 Couldnt afford follow-up care past 12 m
AHCAFYR6 Frequency Percent ------------------------------------------1 Yes 1697 492 2 No 32389 9381 7 Refused 17 005 8 Not ascertained 409 118 9 Donrsquot know 13 004
180
2012 National Health Interview Survey (NHIS)Sample Adult Public Use File (samadult)
AAU Variables Thursday May 16 2013Unweighted Frequencies
AAU113_00010 Get sick or have accident worried about paying medical bills
AWORPAY Frequency Percent ---------------------------------------------1 Very worried2 Somewhat worried
6934 10303
2008 2984
3 Not at all worried 16771 4858 7 Refused 24 007 8 Not ascertained 416 120 9 Dont know 77 022
AAU113_00020 Health insurance coverage compared to a year ago
AHICOMP Frequency Percent ------------------------------------------1 Better 2711 785 2 Worse 4490 1301 3 About the same 26681 7728 7 Refused 29 008 8 Not ascertained 419 121 9 Dont know 195 056
AAU127_01010 Skipped medication doses to save money past 12 m
ARXPR_1 Frequency Percent ------------------------------------------1 Yes 2293 664 2 No 31765 9201 7 Refused 22 006 8 Not ascertained 434 126 9 Dont know 11 003
AAU127_02010 Took less medicine to save money past 12 m
ARXPR_2 Frequency Percent ------------------------------------------1 Yes 2418 700 2 No 31635 9163 7 Refused 24 007 8 Not ascertained 439 127 9 Donrsquot know 9 003
AAU127_03010 Delayed filling a prescription to save money past 12 m
ARXPR_3 Frequency Percent ------------------------------------------1 Yes 2960 857 2 No 31089 9005 7 Refused 23 007 8 Not ascertained 440 127 9 Dont know 13 004
181
2012 National Health Interview Survey (NHIS)Sample Adult Public Use File (samadult)
AAU Variables Thursday May 16 2013Unweighted Frequencies
AAU127_04010 Asked doctor for lower cost medication to save money past 12 m
ARXPR_4 Frequency Percent ------------------------------------------1 Yes 6320 1831 2 No 27721 8029 7 Refused 22 006 8 Not ascertained 442 128 9 Dont know 20 006
AAU127_05010 Bought prescription drugs fromanother country to save money past 12 m
ARXPR_5 Frequency Percent ------------------------------------------1 Yes 663 192 2 No 33389 9671 7 Refused 22 006 8 Not ascertained 442 128 9 Dont know 9 003
AAU127_06010 Used alternative therapies to save money past 12 m
ARXPR_6 Frequency Percent ------------------------------------------1 Yes 1454 421 2 No 32591 9440 7 Refused 21 006 8 Not ascertained 442 128 9 Dont know 17 005
AAU135_00000 Time since last saw a dentist
ADNLONG2 Frequency Percent -----------------------------------------------------------------------0 Never 331 096 1 6 months or less 14370 4162 2 More than 6 mos but not more than 1 yr ago 5705 1652 3 More than 1 yr but not more than 2 yrs ago 4498 1303 4 More than 2 yrs but not more than 5 yrs ago 4163 1206 5 More than 5 years ago 4874 1412 7 Refused 31 009 8 Not ascertained 459 133 9 Dont know 94 027
182
2012 National Health Interview Survey (NHIS)Sample Adult Public Use File (samadult)
AAU Variables Thursday May 16 2013Unweighted Frequencies
AAU141_01000 Seentalked to mental health professional past 12 m
AHCSYR1 Frequency Percent ------------------------------------------1 Yes 2766 801 2 No 31240 9049 7 Refused 23 007 8 Not ascertained 480 139 9 Dont know 16 005
AAU141_02000 Seentalked to eye doctor past 12 m
AHCSYR2 Frequency Percent ------------------------------------------1 Yes 13051 3780 2 No 20947 6067 7 Refused 20 006 8 Not ascertained 484 140 9 Dont know 23 007
AAU141_03000 Seentalked to foot doctor past 12 m
AHCSYR3 Frequency Percent ------------------------------------------1 Yes 2656 769 2 No 31350 9080 7 Refused 19 006 8 Not ascertained 485 140 9 Dont know 15 004
AAU141_04000 Seentalked to a chiropractor past 12 m
AHCSYR4 Frequency Percent ------------------------------------------1 Yes 3112 901 2 No 30893 8948 7 Refused 20 006 8 Not ascertained 485 140 9 Dont know 15 004
AAU141_05000 Seentalked to therapist (PTOTetc) past 12 m
AHCSYR5 Frequency Percent ------------------------------------------1 Yes 2985 865 2 No 31014 8983 7 Refused 21 006 8 Not ascertained 486 141 9 Dont know 19 006
183
2012 National Health Interview Survey (NHIS)Sample Adult Public Use File (samadult)
AAU Variables Thursday May 16 2013Unweighted Frequencies
AAU141_06000 Seentalked to a NPPAmidwife past 12 m
AHCSYR6 Frequency Percent ------------------------------------------1 Yes 6561 1900 2 No 27412 7940 7 Refused 22 006 8 Not ascertained 487 141 9 Dont know 43 012
AAU200_00000 Seentalked to OBGYN past 12 m
AHCSYR7 Frequency Percent ------------------------------------------1 Yes 7151 3714 2 No 11787 6122 7 Refused 13 007 8 Not ascertained 280 145 9 Dont know 21 011
Frequency Missing = 15273
AAU211_01000 Seentalked to a medical specialist past 12 m
AHCSYR8 Frequency Percent ------------------------------------------1 Yes 8799 2549 2 No 25189 7296 7 Refused 23 007 8 Not ascertained 490 142 9 Dont know 24 007
AAU211_02000 Seentalked to a general doctor past 12 m
AHCSYR9 Frequency Percent ------------------------------------------1 Yes 22774 6596 2 No 11205 3245 7 Refused 23 007 8 Not ascertained 494 143 9 Dont know 29 008
AAU230_00000 Doctor treats both kids and adults
AHCSYR10 Frequency Percent ------------------------------------------1 Yes 12192 5353 2 No 8494 3730 7 Refused 1 000 8 Not ascertained 1 000 9 Dont know 2086 916
Frequency Missing = 11751
184
2012 National Health Interview Survey (NHIS)Sample Adult Public Use File (samadult)
AAU Variables Thursday May 16 2013Unweighted Frequencies
AAU240_00000 times in ERED past 12 m
AHERNOY2 Frequency Percent -------------------------------------------00 None 26978 7814 01 1 4344 1258 02 2-3 1941 562 03 4-5 404 117 04 6-7 130 038 05 8-9 51 015 06 10-12 72 021 07 13-15 17 005 08 16 or more 38 011 97 Refused 21 006 98 Not ascertained 504 146 99 Dont know 25 007
AAU243_00010 ER visit at night or on weekend
AERVISND Frequency Percent ------------------------------------------1 Yes 4442 6348 2 No 2472 3533 7 Refused 1 001 8 Not ascertained 2 003 9 Dont know 80 114
Frequency Missing = 27528
AAU245_00010 ER visit resulted in hospital admission
AERHOS Frequency Percent ------------------------------------------1 Yes 2300 3287 2 No 4690 6703 7 Refused 1 001 8 Not ascertained 2 003 9 Dont know 4 006
Frequency Missing = 27528
AAU248_01010 ER visit because didnt have another place to go
AERREAS1 Frequency Percent ------------------------------------------1 Yes 462 4442 2 No 578 5558 7 Refused 0 000 8 Not ascertained 0 000 9 Dont know 0 000
Frequency Missing = 33485
185
2012 National Health Interview Survey (NHIS)Sample Adult Public Use File (samadult)
AAU Variables Thursday May 16 2013Unweighted Frequencies
AAU248_02020 ER visit because doctors office or clinic was not open
AERREAS2 Frequency Percent ------------------------------------------1 Yes 486 4673 2 No 551 5298 7 Refused 0 000 8 Not ascertained 0 000 9 Dont know 3 029
Frequency Missing = 33485
AAU248_03030 ER visit because advised by health provider to go
AERREAS3 Frequency Percent ------------------------------------------1 Yes 178 1712 2 No 860 8269 7 Refused 0 000 8 Not ascertained 0 000 9 Dont know 2 019
Frequency Missing = 33485
AAU248_04040 ER visit because problem too serious for doctors officeclinic
AERREAS4 Frequency Percent ------------------------------------------1 Yes 445 4279 2 No 587 5644 7 Refused 0 000 8 Not ascertained 0 000 9 Dont know 8 077
Frequency Missing = 33485
AAU248_05050 ER visit because only hospital could help
AERREAS5 Frequency Percent ------------------------------------------1 Yes 570 5481 2 No 463 4452 7 Refused 0 000 8 Not ascertained 0 000 9 Dont know 7 067
Frequency Missing = 33485
186
2012 National Health Interview Survey (NHIS)Sample Adult Public Use File (samadult)
AAU Variables Thursday May 16 2013Unweighted Frequencies
AAU248_06060 ER visit because it is closest provider
AERREAS6 Frequency Percent ------------------------------------------1 Yes 433 4163 2 No 606 5827 7 Refused 0 000 8 Not ascertained 1 010 9 Dont know 0 000
Frequency Missing = 33485
AAU248_07070 ER visit because it is usual place to get care
AERREAS7 Frequency Percent ------------------------------------------1 Yes 155 1490 2 No 884 8500 7 Refused 0 000 8 Not ascertained 1 010 9 Donrsquot know 0 000
Frequency Missing = 33485
AAU248_08080 Arrived at ER by ambulanceother emergency vehicle
AERREAS8 Frequency Percent ------------------------------------------1 Yes 126 1212 2 No 912 8769 7 Refused 0 000 8 Not ascertained 2 019 9 Donrsquot know 0 000
Frequency Missing = 33485
AAU248_01010 ER visit because didnt have another place to go
AERREA1R Frequency Percent ------------------------------------------1 Yes 2316 4250 2 No 3121 5727 7 Refused 1 002 8 Not ascertained 5 009 9 Dont know 7 013
Frequency Missing = 29075
187
2012 National Health Interview Survey (NHIS)Sample Adult Public Use File (samadult)
AAU Variables Thursday May 16 2013Unweighted Frequencies
AAU248_02020 ER visit because doctors office or clinic was not open
AERREA2R Frequency Percent ------------------------------------------1 Yes 2492 4572 2 No 2936 5387 7 Refused 1 002 8 Not ascertained 6 011 9 Dont know 15 028
Frequency Missing = 29075
AAU248_03030 ER visit because advised by health provider to go
AERREA3R Frequency Percent ------------------------------------------1 Yes 1295 2376 2 No 4143 7602 7 Refused 2 004 8 Not ascertained 6 011 9 Dont know 4 007
Frequency Missing = 29075
AAU248_04040 ER visit because problem too serious for doctors officeclinic
AERREA4R Frequency Percent ------------------------------------------1 Yes 2899 5319 2 No 2521 4626 7 Refused 2 004 8 Not ascertained 6 011 9 Dont know 22 040
Frequency Missing = 29075
AAU248_05050 ER visit because only hospital could help
AERREA5R Frequency Percent ------------------------------------------1 Yes 3510 6440 2 No 1913 3510 7 Refused 2 004 8 Not ascertained 6 011 9 Dont know 19 035
Frequency Missing = 29075
188
2012 National Health Interview Survey (NHIS)Sample Adult Public Use File (samadult)
AAU Variables Thursday May 16 2013Unweighted Frequencies
AAU248_06060 ER visit because it is closest provider
AERREA6R Frequency Percent ------------------------------------------1 Yes 2150 3945 2 No 3281 6020 7 Refused 2 004 8 Not ascertained 6 011 9 Dont know 11 020
Frequency Missing = 29075
AAU248_07070 ER visit because it is usual place to get care
AERREA7R Frequency Percent ------------------------------------------1 Yes 793 1455 2 No 4645 8523 7 Refused 3 006 8 Not ascertained 6 011 9 Donrsquot know 3 006
Frequency Missing = 29075
AAU248_08080 Arrived at ER by ambulanceother emergency vehicle
AERREA8R Frequency Percent ------------------------------------------1 Yes 1011 1855 2 No 4427 8123 7 Refused 2 004 8 Not ascertained 7 013 9 Donrsquot know 3 006
Frequency Missing = 29075
AAU250_00000 Received home care from health professional past 12 m
AHCHYR Frequency Percent ------------------------------------------1 Yes 976 283 2 No 33010 9561 7 Refused 16 005 8 Not ascertained 516 149 9 Dont know 7 002
189
2012 National Health Interview Survey (NHIS)Sample Adult Public Use File (samadult)
AAU Variables Thursday May 16 2013Unweighted Frequencies
AAU260_00000 months of home care past 12 m
AHCHMOYR Frequency Percent -------------------------------------------01-12 months 963 9867 97 Refused 0 000 98 Not ascertained 0 000 99 Dont know 13 133
Frequency Missing = 33549
AAU270_00000 Total number of home visits
AHCHNOY2 Frequency Percent -------------------------------------------01 1 100 1025 02 2-3 116 1189 03 4-5 82 840 04 6-7 69 707 05 8-9 65 666 06 10-12 98 1004 07 13-15 40 410 08 16 or more 392 4016 97 Refused 0 000 98 Not ascertained 1 010 99 Dont know 13 133
Frequency Missing = 33549
AAU280_00000 Total number of office visits past 12 m
AHCNOYR2 Frequency Percent -------------------------------------------00 None 6724 1948 01 1 5860 1697 02 2-3 8492 2460 03 4-5 4670 1353 04 6-7 2275 659 05 8-9 1160 336 06 10-12 2057 596 07 13-15 675 196 08 16 or more 1937 561 97 Refused 35 010 98 Not ascertained 526 152 99 Dont know 114 033
190
2012 National Health Interview Survey (NHIS)Sample Adult Public Use File (samadult)
AAU Variables Thursday May 16 2013Unweighted Frequencies
AAU290_00000 Surgerysurgical procedure past 12 m
ASRGYR Frequency Percent ------------------------------------------1 Yes 4292 1243 2 No 29671 8594 7 Refused 21 006 8 Not ascertained 532 154 9 Dont know 9 003
AAU300_00000 of surgeries past 12 m
ASRGNOYR Frequency Percent -------------------------------------------01-94 1-94 times 4288 9991 95 95+ times 0 000 97 Refused 0 000 98 Not ascertained 1 002 99 Dont know 3 007
Frequency Missing = 30233
AAU305_00000 Time since last seentalked to health professional
AMDLONGR Frequency Percent -----------------------------------------------------------------------0 Never 496 144 1 6 months or less 23040 6673 2 More than 6 mos but not more than 1 yr ago 4858 1407 3 More than 1 yr but not more than 2 yrs ago 2758 799 4 More than 2 yrs but not more than 5 yrs ago 1694 491 5 More than 5 years ago 1045 303 7 Refused 32 009 8 Not ascertained 549 159 9 Dont know 53 015
AAU306_00010 Place of last medical visit
AVISLAST Frequency Percent ---------------------------------------------------------1 Clinic or health center 8056 2412 2 Doctors office or HMO 21739 6510 3 Hospital emergency room 1601 479 4 Hospital outpatient department 820 246 5 Urgent care center 412 123 6 Some other place 624 187 7 Refused 17 005 8 Not ascertained 7 002 9 Dont know 119 036
Frequency Missing = 1130
191
2012 National Health Interview Survey (NHIS)Sample Adult Public Use File (samadult)
AAU Variables Thursday May 16 2013Unweighted Frequencies
AAU306_00021 General doctor seen on last visit
ALASTYP1 Frequency Percent ------------------------------------------1 Mentioned 22438 7183 2 Not mentioned 8729 2794 7 Refused 3 001 8 Not ascertained 3 001 9 Dont know 66 021
Frequency Missing = 3286
AAU306_00022 Specialist seen on last visit
ALASTYP2 Frequency Percent ------------------------------------------1 Mentioned 6946 2224 2 Not mentioned 24221 7753 7 Refused 3 001 8 Not ascertained 3 001 9 Dont know 66 021
Frequency Missing = 3286
AAU306_00023 Nurse practitionerphysician assistant seen on last visit
ALASTYP3 Frequency Percent ------------------------------------------1 Mentioned 2207 706 2 Not mentioned 28960 9270 7 Refused 3 001 8 Not ascertained 3 001 9 Dont know 66 021
Frequency Missing = 3286
AAU306_00024 Other health provider seen on last visit
ALASTYP4 Frequency Percent ------------------------------------------1 Mentioned 516 165 2 Not mentioned 30651 9812 7 Refused 3 001 8 Not ascertained 3 001 9 Dont know 66 021
Frequency Missing = 3286
192
2012 National Health Interview Survey (NHIS)Sample Adult Public Use File (samadult)
AAU Variables Thursday May 16 2013Unweighted Frequencies
AAU306_00025 Other Health professional seen (verbatim)
ALASTVRB Frequency Percent ------------------------------------------Verbatim response 516 10000
Frequency Missing = 34009
AAU307_01010 Appointment wait time-number
AVISAPN2 ------------------------------------------------------------------------00 Same daywalk-in apptno appt made01-95 1-95 96 Routine apptappt arranged on previous visitrecd appt reminder card97 Refused 98 Not ascertained 99 Dont know
Frequency Missing = 3286
AAU307_01010 Appointment wait time-number
Frequency Percent ---------------------
6545 2095 19302 6179 3810 1220 37 012 15 005
1530 490
Frequency Missing= 3286
AAU307_02020 Appointment wait time-time period
AVISAPT2 Frequency Percent ------------------------------------------1 Days 11067 5309 2 Weeks 6153 2952 3 Months 2441 1171 7 Refused 2 001 8 Not ascertained 15 007 9 Donrsquot know 1169 561
Frequency Missing = 13678
193
2012 National Health Interview Survey (NHIS)Sample Adult Public Use File (samadult)
AAU Variables Thursday May 16 2013Unweighted Frequencies
AAU308_01010 Time in waiting room-number
AWAITRMN Frequency Percent -------------------------------------------00 No time 2110 635 01-96 1-96 30004 9023 97 Refused 30 009 98 Not ascertained 20 006 99 Donrsquot know 1088 327
Frequency Missing = 1273
AAU308_02020 Time in waiting room-time period
AWAITRMT Frequency Percent ------------------------------------------1 Minutes 26795 8612 2 Hours 3451 1109 7 Refused 0 000 8 Not ascertained 20 006 9 Donrsquot know 846 272
Frequency Missing = 3413
AAU309_00010 Looked up health information on Internet past 12 m
HIT1A Frequency Percent ------------------------------------------1 Yes 13621 3945 2 No 20265 5870 7 Refused 32 009 8 Not ascertained 589 171 9 Donrsquot know 18 005
AAU309_00020 Filled a prescription on Internet past 12 m
HIT2A Frequency Percent ------------------------------------------1 Yes 2094 607 2 No 31799 9210 7 Refused 28 008 8 Not ascertained 594 172 9 Dont know 10 003
AAU309_00030 Scheduled medical appointment on Internet past 12 m
HIT3A Frequency Percent ------------------------------------------1 Yes 1463 424 2 No 32428 9393 7 Refused 29 008 8 Not ascertained 596 173 9 Dont know 9 003
194
2012 National Health Interview Survey (NHIS)Sample Adult Public Use File (samadult)
AAU Variables Thursday May 16 2013Unweighted Frequencies
AAU309_00040 Communicated with health care provider by email past 12 m
HIT4A Frequency Percent ------------------------------------------1 Yes 1800 521 2 No 32087 9294 7 Refused 28 008 8 Not ascertained 596 173 9 Donrsquot know 14 004
AAU309_00050 Used chat groups to learn about health topics past 12 m
HIT5A Frequency Percent ------------------------------------------1 Yes 982 284 2 No 32908 9532 7 Refused 28 008 8 Not ascertained 596 173 9 Donrsquot know 11 003
AAU310_00000 Flu shot past 12 m
SHTFLU2 Frequency Percent ------------------------------------------1 Yes 12996 3764 2 No 20794 6023 7 Refused 36 010 8 Not ascertained 621 180 9 Dont know 78 023
AAU312_01000 Month of most recent flu shot
ASHFLUM2 Frequency Percent -------------------------------------------01 January02 February03 March 04 April05 May06 June 07 July08 August09 September10 October 11 November 12 December 97 Refused 98 Not ascertained 99 Dont know
416 320 251 193 140 108 69 053 64 049 60 046 71 055 311 239 2106 1620 5748 4423 2656 2044 617 475 6 005 2 002
479 369
Frequency Missing = 21529
195
2012 National Health Interview Survey (NHIS)Sample Adult Public Use File (samadult)
AAU Variables Thursday May 16 2013Unweighted Frequencies
AAU312_02000 Year of most recent flu shot
ASHFLUY2 Frequency Percent ---------------------------------------------Year 12956 9969 9997 Refused 6 005 9998 Not ascertained 3 002 9999 Dont know 31 024
Frequency Missing = 21529
AAU313_00000 Flu shot beforeduring your currentpregnancy interviewed Jan-Mar or Aug-Dec 2012
FLUSHPG1 Frequency Percent ------------------------------------------------1 Before this pregnancy 29 3816 2 During this pregnancy 47 6184 7 Refused 0 000 8 Not ascertained 0 000 9 Dont know 0 000
Frequency Missing = 34449
AAU314_00000 Flu shot beforeduringafter a pregnancy
FLUSHPG2 Frequency Percent ------------------------------------------------1 Before this pregnancy 32 1633 2 During this pregnancy 104 5306 3 After this pregnancy 58 2959 7 Refused 0 000 8 Not ascertained 1 051 9 Dont know 1 051
Frequency Missing = 34329
AAU315_00000 Flu nasal spray past 12 m
SPRFLU2 Frequency Percent ------------------------------------------1 Yes 221 064 2 No 33592 9730 7 Refused 32 009 8 Not ascertained 630 182 9 Dont know 50 014
196
2012 National Health Interview Survey (NHIS)Sample Adult Public Use File (samadult)
AAU Variables Thursday May 16 2013Unweighted Frequencies
AAU318_01000 Month of most recent flu nasal spray
ASPFLUM2 Frequency Percent -------------------------------------------01 January 10 452 02 February 8 362 03 March 6 271 04 April 3 136 05 May 3 136 06 June 6 271 07 July 4 181 08 August 13 588 09 September 23 1041 10 October 59 2670 11 November 62 2805 12 December 12 543 97 Refused 0 000 98 Not ascertained 0 000 99 Dont know 12 543
Frequency Missing = 34304
AAU318_02000 Year of most recent flu nasal spray
ASPFLUY2 Frequency Percent ---------------------------------------------Year 219 9910 9997 Refused 0 000 9998 Not ascertained 0 000 9999 Dont know 2 090
Frequency Missing = 34304
AAU320_00000 Pneumonia shot (EVER)
SHTPNUYR Frequency Percent ------------------------------------------1 Yes 7454 2159 2 No 25540 7398 7 Refused 33 010 8 Not ascertained 641 186 9 Dont know 857 248
AAU330_00000 Ever had chickenpox
APOX Frequency Percent ------------------------------------------1 Yes 25573 7407 2 No 6853 1985 7 Refused 33 010 8 Not ascertained 654 189 9 Dont know 1412 409
197
2012 National Health Interview Survey (NHIS)Sample Adult Public Use File (samadult)
AAU Variables Thursday May 16 2013Unweighted Frequencies
AAU340_00000 Chickenpox past 12 m
APOX12MO Frequency Percent ------------------------------------------1 Yes 104 041 2 No 25466 9958 7 Refused 0 000 8 Not ascertained 0 000 9 Dont know 3 001
Frequency Missing = 8952
AAU350_00000 Ever had hepatitis
AHEP Frequency Percent ------------------------------------------1 Yes 1047 303 2 No 32681 9466 7 Refused 39 011 8 Not ascertained 660 191 9 Dont know 98 028
AAU360_00000 Ever lived w someone w hepatitis
AHEPLIV Frequency Percent ------------------------------------------1 Yes 1291 386 2 No 31326 9357 7 Refused 37 011 8 Not ascertained 663 198 9 Dont know 161 048
Frequency Missing = 1047
AAU370_00000 Hepatitis B vaccine (EVER)
SHTHEPB Frequency Percent ------------------------------------------1 Yes 10242 2967 2 No 21637 6267 7 Refused 42 012 8 Not ascertained 668 193 9 Dont know 1936 561
198
2012 National Health Interview Survey (NHIS)Sample Adult Public Use File (samadult)
AAU Variables Thursday May 16 2013Unweighted Frequencies
AAU380_00000 doses of hepatitis B vaccine received
SHEPDOS Frequency Percent -----------------------------------------------------1 Received at least 3 doses 8099 7908 2 Received less than 3 doses 1234 1205 7 Refused 1 001 8 Not ascertained 0 000 9 Dont know 908 887
Frequency Missing = 24283
AAU390_00010 Hepatitis A vaccine (EVER)
SHTHEPA Frequency Percent ------------------------------------------1 Yes 4546 1317 2 No 26432 7656 7 Refused 44 013 8 Not ascertained 672 195 9 Dont know 2831 820
AAU400_00010 shots of hepatitis A vaccine received
SHEPANUM Frequency Percent ----------------------------------------------01-95 shots 2848 6265 96 Received all shots 655 1441 97 Refused 6 013 98 Not ascertained 0 000 99 Dont know 1037 2281
Frequency Missing = 29979
AAU410_00010 Ever had the Zoster or Shingles vaccine
SHINGLES Frequency Percent ------------------------------------------1 Yes 2229 1362 2 No 13612 8320 7 Refused 15 009 8 Not ascertained 325 199 9 Dont know 179 109
Frequency Missing = 18165
199
2012 National Health Interview Survey (NHIS)Sample Adult Public Use File (samadult)
AAU Variables Thursday May 16 2013Unweighted Frequencies
AAU420_00010 Tetanus shot in the past 10 years
SHTTD Frequency Percent ------------------------------------------1 Yes 19723 5713 2 No 12920 3742 7 Refused 36 010 8 Not ascertained 677 196 9 Dont know 1169 339
AAU430_00010 Tetanus shot given in 2005 or later
SHTTD05 Frequency Percent ------------------------------------------1 Yes 13285 6736 2 No 5161 2617 7 Refused 3 002 8 Not ascertained 2 001 9 Dont know 1272 645
Frequency Missing = 14802
AAU440_00010 Vaccine included pertussiswhooping cough
SHTTDAP2 Frequency Percent -------------------------------------------------------1 Yes-included pertussis 3142 2365 2 No-did not include pertussis 1613 1214 3 Doctor did not say 7057 5311 7 Refused 4 003 8 Not ascertained 2 002 9 Dont know 1470 1106
Frequency Missing = 21237
AAU442_00010 Ever heard of HPV
HPVHRD Frequency Percent ------------------------------------------1 Yes 16593 6113 2 No 9899 3647 7 Refused 31 011 8 Not ascertained 542 200 9 Dont know 78 029
Frequency Missing = 7382
200
2012 National Health Interview Survey (NHIS)Sample Adult Public Use File (samadult)
AAU Variables Thursday May 16 2013Unweighted Frequencies
AAU444_00010 Ever heard of HPV vaccines or shots
SHHPVHD1 Frequency Percent ------------------------------------------1 Yes 13701 5048 2 No 12774 4706 7 Refused 30 011 8 Not ascertained 547 202 9 Dont know 91 034
Frequency Missing = 7382
AAU446_00010 Ever received HPV shotvaccine
SHTHPV1 Frequency Percent ----------------------------------------------------1 Yes 1273 469 2 No 24985 9205 3 Doctor refused when asked 39 014 7 Refused 33 012 8 Not Ascertained 548 202 9 Dont know 265 098
Frequency Missing = 7382
AAU448_00010 Number of HPV shots received
SHHPVDOS Frequency Percent -------------------------------------------01-49 1-49 shots 1095 8602 50 50+ 2 016 96 All shots 95 746 97 Refused 1 008 98 Not Ascertained 0 000 99 Dont know 80 628
Frequency Missing = 33252
AAU450_00010 Ever told you had any kind of chroniclong-term liver condition
LIVEV Frequency Percent ------------------------------------------1 Yes 415 120 2 No 33342 9657 7 Refused 35 010 8 Not ascertained 698 202 9 Dont know 35 010
201
2012 National Health Interview Survey (NHIS)Sample Adult Public Use File (samadult)
AAU Variables Thursday May 16 2013Unweighted Frequencies
AAU460_00010 Ever traveled outside USA since 1995 (ExcludingEurope Japan Australia New Zealand and Canada)
TRAVEL Frequency Percent ------------------------------------------1 Yes 10808 3130 2 No 22924 6640 7 Refused 46 013 8 Not ascertained 709 205 9 Dont know 38 011
AAU465_00010 Work or volunteer in a health care setting
WRKHLTH2 Frequency Percent ------------------------------------------1 Yes 2918 845 2 No 30855 8937 7 Refused 32 009 8 Not ascertained 712 206 9 Dont know 8 002
AAU470_00010 Direct contact with patients
WRKDIR Frequency Percent ------------------------------------------1 Yes 1838 6299 2 No 1079 3698 7 Refused 0 000 8 Not ascertained 0 000 9 Dont know 1 003
Frequency Missing = 31607
AAU500_00010 Blood pressure checked by doctornursehealthprofessional past 12 m
APSBPCHK Frequency Percent ------------------------------------------1 Yes 27638 8005 2 No 6110 1770 7 Refused 32 009 8 Not ascertained 716 207 9 Dont know 29 008
202
2012 National Health Interview Survey (NHIS)Sample Adult Public Use File (samadult)
AAU Variables Thursday May 16 2013Unweighted Frequencies
AAU510_00010 Cholesterol checked by doctornursehealthprofessional past 12 m
APSCHCHK Frequency Percent ------------------------------------------1 Yes 21254 6156 2 No 12225 3541 7 Refused 34 010 8 Not ascertained 716 207 9 Dont know 296 086
AAU520_00010 Fasting test for high blood sugardiabetes past 12 m
APSBSCHK Frequency Percent ------------------------------------------1 Yes 15353 4447 2 No 18118 5248 7 Refused 34 010 8 Not ascertained 719 208 9 Dont know 301 087
AAU530_00010 Pap smeartest past 12 m
APSPAP Frequency Percent ------------------------------------------1 Yes 9460 4914 2 No 9266 4813 7 Refused 33 017 8 Not ascertained 423 220 9 Dont know 70 036
Frequency Missing = 15273
AAU540_00010 Mammogram past 12 m
APSMAM Frequency Percent ------------------------------------------1 Yes 7028 4483 2 No 8234 5253 7 Refused 30 019 8 Not ascertained 341 218 9 Dont know 43 027
Frequency Missing = 18849
203
2012 National Health Interview Survey (NHIS)Sample Adult Public Use File (samadult)
AAU Variables Thursday May 16 2013Unweighted Frequencies
AAU550_00010 Test for colon cancer past 12 m
APSCOL Frequency Percent ------------------------------------------1 Yes 4040 1829 2 No 17471 7909 7 Refused 30 014 8 Not ascertained 475 215 9 Donrsquot know 75 034
Frequency Missing = 12434
AAU560_00010 Doctorhealth professional talked to you about diet past 12 m
APSDIET Frequency Percent ------------------------------------------1 Yes 8902 2578 2 No 24813 7187 7 Refused 39 011 8 Not ascertained 731 212 9 Dont know 40 012
AAU570_00010 Doctorhealth professionaltalked to you about smoking past 12 m
APSSMKC Frequency Percent ------------------------------------------1 Yes 3243 5039 2 No 3058 4751 7 Refused 5 008 8 Not ascertained 121 188 9 Donrsquot know 9 014
Frequency Missing = 28089
AAU580_00010 Have family member who needed ADL help for 1+ yrs
LTCFAM Frequency Percent ------------------------------------------1 Yes 1641 1071 2 No 13287 8672 7 Refused 24 016 8 Not ascertained 348 227 9 Donrsquot know 21 014
Frequency Missing = 19204
204
2012 National Health Interview Survey (NHIS)Sample Adult Public Use File (samadult)
AAU Variables Thursday May 16 2013Unweighted Frequencies
AAU582_00010 How likely you will need ADL help
LTCHELP Frequency Percent --------------------------------------------1 Very likely 1882 1228 2 Somewhat likely 3684 2405 3 Somewhat unlikely 3277 2139 4 Very unlikely 4917 3209 7 Refused 45 029 8 Not ascertained 355 232 9 Dont know 1161 758
Frequency Missing = 19204
AAU584_01010 Family would provide ADL help
LTCWHO1 Frequency Percent ------------------------------------------1 Mentioned 9956 6498 2 Not mentioned 3527 2302 7 Refused 41 027 8 Not ascertained 360 235 9 Donrsquot know 1437 938
Frequency Missing = 19204
AAU584_02010 Hire someone to provide ADL help
LTCWHO2 Frequency Percent ------------------------------------------1 Mentioned 1495 976 2 Not mentioned 11988 7825 7 Refused 41 027 8 Not ascertained 360 235 9 Donrsquot know 1437 938
Frequency Missing = 19204
AAU584_03010 Home health care organization would provide ADL help
LTCWHO3 Frequency Percent ------------------------------------------1 Mentioned 1446 944 2 Not mentioned 12037 7857 7 Refused 41 027 8 Not ascertained 360 235 9 Donrsquot know 1437 938
Frequency Missing = 19204
205
2012 National Health Interview Survey (NHIS)Sample Adult Public Use File (samadult)
AAU Variables Thursday May 16 2013Unweighted Frequencies
AAU584_04010 Nursing homeassisted living would provide ADL help
LTCWHO4 Frequency Percent ------------------------------------------1 Mentioned 1382 902 2 Not mentioned 12101 7898 7 Refused 41 027 8 Not ascertained 360 235 9 Donrsquot know 1437 938
Frequency Missing = 19204
AAU584_05010 Other would provide ADL help
LTCWHO5 Frequency Percent ------------------------------------------1 Mentioned 609 397 2 Not mentioned 12874 8403 7 Refused 41 027 8 Not ascertained 360 235 9 Donrsquot know 1437 938
Frequency Missing = 19204
AAU600_00010 Tried to purchase health insurance directly past 3 yrs
AINDINS Frequency Percent ------------------------------------------1 Yes 2785 807 2 No 30912 8954 7 Refused 35 010 8 Not ascertained 757 219 9 Donrsquot know 36 010
AAU600_00020 Purchased health insurance directly past 3 yrs
AINDPRCH Frequency Percent ------------------------------------------1 Yes 1705 6122 2 No 1078 3871 7 Refused 0 000 8 Not ascertained 0 000 9 Donrsquot know 2 007
Frequency Missing = 31740
206
2012 National Health Interview Survey (NHIS)Sample Adult Public Use File (samadult)
AAU Variables Thursday May 16 2013Unweighted Frequencies
AAU600_00030 For whom was health insurance purchased past 3 yrs
AINDWHO Frequency Percent -------------------------------------------------1 Self 1143 6704 2 Someone else in family 51 299 3 Both 511 2997 7 Refused 0 000 8 Not ascertained 0 000 9 Donrsquot know 0 000
Frequency Missing = 32820
AAU600_00040 How difficult to find health insurance for coverage needed past 3 yrs
AINDDIF1 Frequency Percent -----------------------------------------------1 Very difficult 245 1437 2 Somewhat difficult 390 2287 3 Not at all difficult 1062 6229 7 Refused 1 006 8 Not ascertained 1 006 9 Donrsquot know 6 035
Frequency Missing = 32820
AAU600_00050 How difficult to find affordable health insurance past 3 yrs
AINDDIF2 Frequency Percent -----------------------------------------------1 Very difficult 400 2346 2 Somewhat difficult 508 2979 3 Not at all difficult 788 4622 7 Refused 1 006 8 Not ascertained 1 006 9 Dont know 7 041
Frequency Missing = 32820
AAU600_01060 Turned down for coverage past 3 yrs
AINDENY1 Frequency Percent ------------------------------------------1 Yes 145 850 2 No 1547 9073 7 Refused 1 006 8 Not ascertained 1 006 9 Donrsquot know 11 065
Frequency Missing = 32820
207
2012 National Health Interview Survey (NHIS)Sample Adult Public Use File (samadult)
AAU Variables Thursday May 16 2013Unweighted Frequencies
AAU600_02060 Charged higher price for coverage because of health past 3 yrs
AINDENY2 Frequency Percent ------------------------------------------1 Yes 232 1361 2 No 1437 8428 7 Refused 1 006 8 Not ascertained 1 006 9 Donrsquot know 34 199
Frequency Missing = 32820
AAU600_03060 Specific health problem excluded from coverage past 3 yrs
AINDENY3 Frequency Percent ------------------------------------------1 Yes 183 1073 2 No 1482 8692 7 Refused 3 018 8 Not ascertained 1 006 9 Donrsquot know 36 211
Frequency Missing = 32820
AAU601_01070 Didnrsquot buy plan because turned down
AINDNOT1 Frequency Percent ------------------------------------------1 Mentioned 124 1150 2 Not mentioned 952 8831 7 Refused 1 009 8 Not ascertained 0 000 9 Donrsquot know 1 009
Frequency Missing = 33447
AAU601_02070 Didnrsquot buy plan because of cost
AINDNOT2 Frequency Percent ------------------------------------------1 Mentioned 805 7468 2 Not mentioned 271 2514 7 Refused 1 009 8 Not ascertained 0 000 9 Donrsquot know 1 009
Frequency Missing = 33447
208
2012 National Health Interview Survey (NHIS)Sample Adult Public Use File (samadult)
AAU Variables Thursday May 16 2013Unweighted Frequencies
AAU601_03070 Didnrsquot buy plan because of pre-existing condition
AINDNOT3 Frequency Percent ------------------------------------------1 Mentioned 114 1058 2 Not mentioned 962 8924 7 Refused 1 009 8 Not ascertained 0 000 9 Donrsquot know 1 009
Frequency Missing = 33447
AAU601_04070 Didnrsquot buy plan because got health insurance from other source
AINDNOT4 Frequency Percent ------------------------------------------1 Mentioned 51 473 2 Not mentioned 1025 9508 7 Refused 1 009 8 Not ascertained 0 000 9 Donrsquot know 1 009
Frequency Missing = 33447
AAU601_05070 Other reason didnt buy plan
AINDNOT5 Frequency Percent ------------------------------------------1 Mentioned 64 594 2 Not mentioned 1012 9388 7 Refused 1 009 8 Not ascertained 0 000 9 Donrsquot know 1 009
Frequency Missing = 33447
AAU700_00000 Ever been tested for HIV
HIVTST1 Frequency Percent ------------------------------------------1 Yes 11974 3468 2 No 21228 6149 7 Refused 63 018 8 Not ascertained 773 224 9 Dont know 487 141
209
2012 National Health Interview Survey (NHIS)Sample Adult Public Use File (samadult)
AWB Variables Thursday May 16 2013Unweighted Frequencies
AWB010_00000 Internet use
AWEBUSE Frequency Percent ------------------------------------------1 Yes 21967 6363 2 No 11250 3259 7 Refused 76 022 8 Not ascertained 1225 355 9 Dont know 7 002
AWB020_01000 Frequency internet use of units
AWEBOFNO Frequency Percent --------------------------------------------001-995 1-995 21708 9882 997 Refused 81 037 998 Not ascertained 6 003 999 Dont know 172 078
Frequency Missing = 12558
AWB020_02000 Frequency internet use Time units
AWEBOFTP Frequency Percent ------------------------------------------1 Per day 17129 7798 2 Per week 3834 1745 3 Per month 623 284 4 Per year 120 055 7 Refused 81 037 8 Not ascertained 6 003 9 Dont know 174 079
Frequency Missing = 12558
AWB030_00000 Email use
AWEBEML Frequency Percent ------------------------------------------1 Yes 20038 5804 2 No 13094 3793 7 Refused 141 041 8 Not ascertained 1235 358 9 Dont know 17 005
210
2012 National Health Interview Survey (NHIS)Sample Adult Public Use File (samadult)
AWB Variables Thursday May 16 2013Unweighted Frequencies
AWB050_01000 Frequency email use of units
AWEBMNO Frequency Percent --------------------------------------------001-995 1-995 11557 9966 997 Refused 6 005 998 Not ascertained 1 001 999 Dont know 33 028
Frequency Missing = 22928
AWB050_02000 Frequency email use Time units
AWEBMTP Frequency Percent ------------------------------------------1 Per day 9019 7777 2 Per week 2174 1875 3 Per month 319 275 4 Per year 45 039 7 Refused 6 005 8 Not ascertained 1 001 9 Dont know 33 028
Frequency Missing = 22928
- IDN - P 1-2
- UCF - P 3
- HHC - P 4-5
- FRT - P 6
- FID - P 7
- AID - P 8
- FDB - P 9
- ASD - P 10-14
- ACN - P 15-60
- ACD - P 61-96
- AHS - P 97-160
- AHB - P 161-172
- AAU - P 173-208
- AWB - P 209-210
-
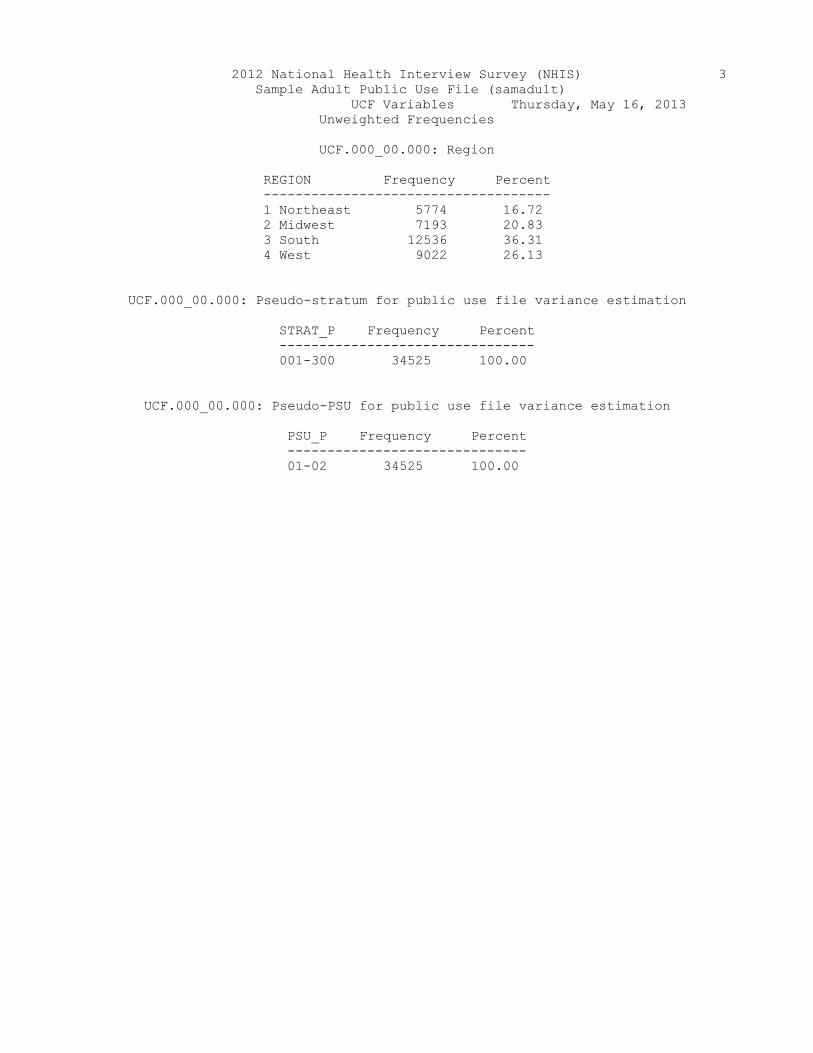
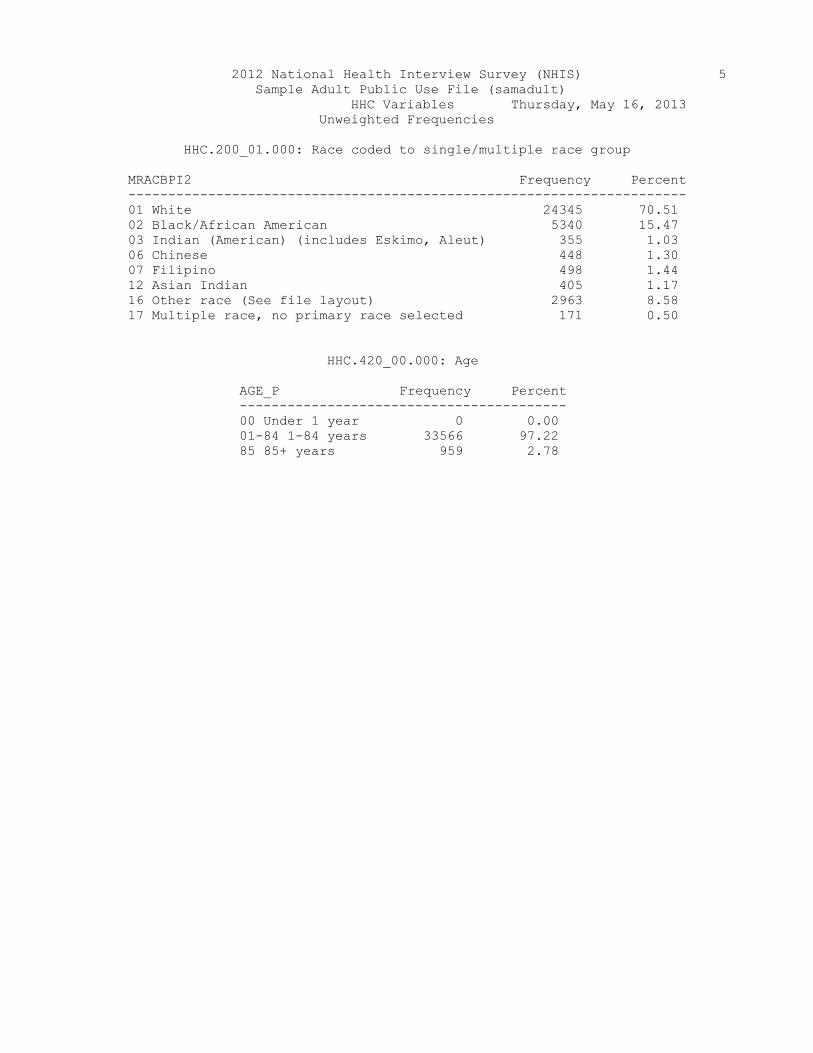
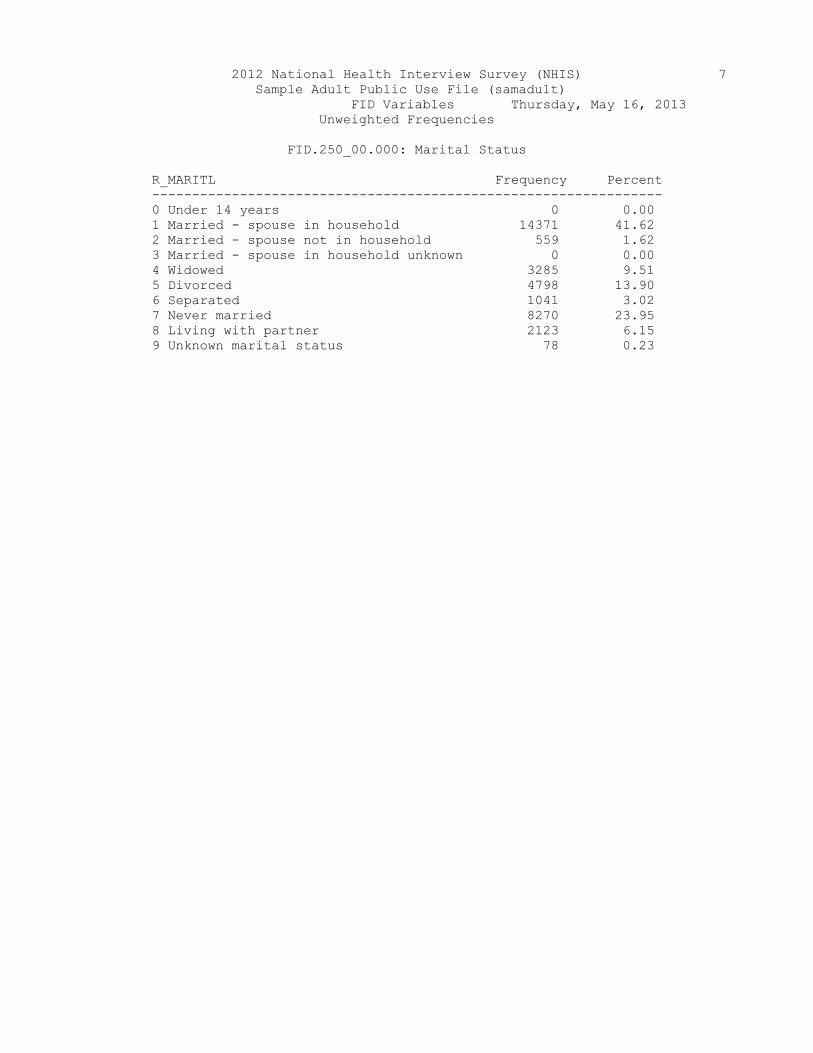