2012 - fluorometric detection of total dissolved zinc in the southern indian ocean
TRANSCRIPT

8112019 2012 - Fluorometric Detection of Total Dissolved Zinc in the Southern Indian Ocean
httpslidepdfcomreaderfull2012-fluorometric-detection-of-total-dissolved-zinc-in-the-southern-indian 19
Fluorometric detection of total dissolved zinc in the southern Indian Ocean
Kathleen J Gosnell ab William M Landing b Angela Milne c
a University of Connecticut Department of Marine Sciences 1080 Shennecossett Road Groton CT 06340-6048 USAb Florida State University Department of Earth Ocean and Atmospheric Science Tallahassee FL 32306-3048 USAc University of Plymouth School of Geography Earth and Environmental Sciences Plymouth PL4 8AA England United Kingdom
a b s t r a c ta r t i c l e i n f o
Article history
Received 10 June 2011
Received in revised form 4 November 2011Accepted 9 January 2012
Available online 16 January 2012
Keywords
Dissolved zinc
Silicate
Flow injection analysis
Southern Indian Ocean
Zinc acts as a micronutrient in the ocean capable of in1047298uencing and potentially controlling phytoplankton
productivity and community structure Thus it is important to quantify the distribution of dissolved Zn in
the oceans in addition to understanding the biogeochemical behavior of this important element Meeting
this objective has been elusive since dissolved Zn concentrations in the upper water column can be extremely
low and it is dif 1047297cult to eliminate contamination during sample collection and analysis Our approach to this
problem was to utilize a Flow Injection Analysis (FIA) method initially described by Nowicki et al (1994) and
collecting uncontaminated seawater using a trace-metal clean rosette system (Measures et al 2008)
Samples for total dissolved Zn analysis were during the 2009 CLIVAR I5 cruise across the southern Indian
Ocean (from Cape Town South Africa to Fremantle Australia) Dissolved Zn concentrations have not been
previously reported for this region Extremely low dissolved Zn concentrations (002 nM) were observed in
surface waters of the central Indian Ocean gyre documenting the extreme biological depletion of Zn typical
of the open ocean Concentrations of Zn and Si both increased with depth The highest concentrations mea-
sured for dissolved Zn (gt35 nM) were collected at 1300 m off western Australian Total dissolved Zn concen-
trations were observed to be oceanographically consistent and well correlated with dissolved silicate across
thetransect The linear regression of total dissolved Zn vsSi for all of thedata yielded a slope of 0059plusmn0003
(nM Zn μ M Si) which is consistent with the values reported for the north Paci 1047297c and thus support the pre-
viously reported nutrient-type Znndashsilicate relationship The zonal section of the dissolved ZnSi ratios also ex-
hibit broad maxima and minima consistent with variable sources for Zn and different recycling rates for Znvs Si
copy 2012 Elsevier BV All rights reserved
1 Introduction
Trace metals operate as either potential toxicants or nutrients in
aquatic systems Several essential metals such as iron (Fe) manga-
nese (Mn) and zinc (Zn) are typically found in surface waters of
the open ocean at concentrations that have been shown to be bio-
limiting in laboratory cultures (Brand et al 1983 Morel et al
1994 Sunda and Huntsman 1992)
Zinc is essential for phytoplankton growth as a cofactor for nearly
300 different enzyme systems such as carbonic anhydrase carboxy-
peptidase alkaline phosphatase and alcohol dehydrogenase (Morel
et al 1994) Carbonic anhydrase catalyzes the reversible dehydration
of H2CO3 and as a result is utilized for inorganic carbon acquisition by
phytoplankton during photosynthesis (Badger and Price 1994) Some
studies report that low-dissolved Zn concentrations in the open ocean
could possibly limit phytoplankton growth and carbon dioxide acqui-
sition (Anderson et al 1978 Morel et al 1994 Ibrahim et al 2008)
However limited data are available on the relationships between
dissolved Zn biological activity and inorganic carbon (Morel et al
1994 Schulz et al 2004)
Based on the ionic composition of seawater in combination with
inorganic Zn complexes (Brand et al 1983) low concentrations of
Zn found in the open ocean could theoretically limit the growth of
some phytoplankton species While laboratory studies have investi-
gated biological limitations by dissolved zinc (Sunda and Huntsman
1992 Ellwood and Hunter 1999 Anderson et al 1978 Schulz et
al 2004) understanding the impacts dissolved Zn might have on pri-
mary production and phytoplankton community structure in the
open ocean has been hampered by a relative lack of reliable data for
dissolved Zn concentrations In addition we are not aware of any
published experimental results from an in-situ Zn fertilization exper-
iment in contrast to the many Fe fertilization experiments where the
effects from Fe addition on phytoplankton productivity have been
quanti1047297ed Crawford et al (2003) reported slight chlorophyll enrich-
ment from Zn additions during bottle incubation experiments in the
subarctic Paci1047297c on the other hand Coale et al (2003) did not 1047297nd
that incubations including Zn affected chlorophyll growth for the
Antarctic Circumpolar Current (ACC) region As Zn is not found at
Marine Chemistry 132ndash133 (2012) 68ndash76
Corresponding author University of Connecticut Department of Marine Sciences
1080 Shennecossett Road Groton CT 06340-6048 USA
E-mail address kathleengosnelluconnedu (KJ Gosnell)
0304-4203$ ndash see front matter copy 2012 Elsevier BV All rights reserved
doi101016jmarchem201201004
Contents lists available at SciVerse ScienceDirect
Marine Chemistry
j o u r n a l h o m e p a g e w w w e l s e v i e r c o m l o c a t e m a r c h e m
8112019 2012 - Fluorometric Detection of Total Dissolved Zinc in the Southern Indian Ocean
httpslidepdfcomreaderfull2012-fluorometric-detection-of-total-dissolved-zinc-in-the-southern-indian 29
limiting concentrations for the ACC (gt2 nM) it is likely that these
ship board incubation experiments were not conducted with Zn-
starved phytoplankton Hence these studies only represent the start
of what necessitates further investigation There are still many mys-
teries to unravel about the biogeochemical cycle of Zn in the oceans
Although trace metal sampling and handling techniques have ad-
vanced immensely in the last 35 years there are still many obstacles
to overcome in order to collect samples that are uncontaminated for
Zn and to make accurate analytical measurements Zinc is a notori-ously pervasive contaminant as it is used frequently on marine ves-
sels and equipment Additionally Zn contamination can result from
unexpected sources such as Kimwipes and nitrile gloves Accordingly
accurate measurements can only be made by using strict safeguards
during sample collection and analysis (Bruland et al 1979 Ellwood
and Van den Berg 2000) These sampling and analytical techniques
are labor-intensive and require some level of expertise As a result
there are only a few reliable pro1047297les of dissolved zinc from the open
ocean Currently only Morley et al (1993) have reported dissolved
Zn pro1047297les for the southwestern Indian Ocean In other regions
such as the northeast Paci1047297c Ocean data has primarily been acquired
at only a few stations (Bruland 1989 Lohan et al 2002) yet these re-
sults have provided strong support for theories on biolimitation by
Zn in addition to demonstrating the importance of trace metals in
marine ecosystems
Vertical and horizontal distributions of chemical tracers in the
oceansare in1047298uencedby a myriad of chemical biological andphysical
processes and the resulting distributions must be consistent with the
effects of those processes The relationship between dissolved Zn and
Si has been recognized since the mid-1970s when contamination-free
sampling and analytical methods were publicized (Bruland et al
1979) The original work that demonstrated the strong correlation
between dissolved Zn and silicate (Bruland et al 1978) has been
expanded to include a few pro1047297les from the Atlantic (Bruland and
Franks 1983 Ellwood and Van den Berg 2000) the Paci1047297c (Bruland
1980 1989 Lohan et al 2002) and the southwestern Indian Ocean
(Morley et al 1993)
Here we report on 42 pro1047297les (0ndash1000 m) of total dissolved Zn
from the 2009 I5 CLIVAR Repeat Hydrography cruise in the southernIndian Ocean which were measured using a 1047298ow-injection (FIA)
scheme utilizing 1047298uorescence detection The concentration range
the strong correlation with dissolved silicate and overall oceano-
graphic consistency of the data illustrate the suitability of the analyt-
ical method (adapted from Nowicki et al 1994) as well as the
accuracy and reliability of the data By combining careful sample col-
lection with a sensitive analytical method our goal was to expand the
database for dissolved Zn in the oceans and to help inform future
studies of the biogeochemical cycling of Zn in the oceans
2 Methods
21 Sample collection
Seawater samples were collected and analyzed on board the RV
Revelle during the 2009 I5 CLIVAR Repeat Hydrography cruise
(March 23 2009 to May 14 2009) The I5 cruise track from 2009 is
displayed in Fig 1 The I5 transect primarily followed approximately
30deg S latitude from Cape Town South Africa to Fremantle Australia
with an occasional deviation away from the 30deg S track to obtain
physical and chemical data from prominent submarine ridges in the
region The CLIVAR lsquoTrace Metalsrsquo rosette was deployed at approxi-
mately every other station yielding 97 pro1047297les for trace metals Dis-
solved zinc samples were collected about every fourth station
resulting in 42 pro1047297les for dissolved Zn out of the 97 stations sampled
for trace metals Due to the stern positioning of the rosette on the ves-
sel station sampling frequency was dependent on weather and ocean
conditions We collect 12-depth pro1047297les to 1000 m at each station for
two reasons In general the majority of the cycling activity for bioac-
tive trace elements occurs in the upper 1000 m Furthermore the
Trace Metals component of CLIVAR is limited by ship time con-
straints we chose to collect more pro1047297les from the upper 1000 m
rather than to have collected fewer pro1047297les extending deeper into
the water column At two stations samples were likewise collected
from 0 to 1300 m
Subsamples for total dissolved Zn were 1047297ltered through 04 μ m
acid-washed 47 mm polycarbonate track-etched 1047297
lters (GE-PoreticsK04CP04700) directly into 125 mL polyethylene sample bottles Sub-
sampling was conducted in a HEPA 1047297ltered air environment in a lab-
oratory van (Measures et al 2008)
22 Analytical preparation
All plastic labware was handled and acid washedusing trace metal
clean techniques Bottles used for samples and analysis were made of
low density polyethylene Reagent and subsample bottles were dou-
ble bagged and shipped in sealed coolers to minimize contamination
Reagents were used as received unless otherwise speci1047297ed All work-
ing reagents were prepared using puri1047297ed 18 Mohm cm3 water (UHP
water) drawn from a Barnstead UHP deionization system in the clean
van The clean van (Measures et al 2008) has been used successfully
on over 17 research cruises since 2003 with no signi1047297cant contamina-
tion issues as was the case for the I5 cruise
Inside the main laboratory of the ship a lab table was transformed
into a clean workspace by means of completely covering it with plas-
tic sheeting A MAC-10 HEPA blower (ENVIRCO Inc) was suspended
from the ceiling several feet above the table then more plastic sheet-
ing was draped from the back and sides of the HEPA blower and tight-
ly sealed to the plastic covered table with duct tape creating a clean
air environment The 1047298ow-injection manifold was set up inside this
clean air environment The 1047298uorometer and software control comput-
er were placed outside the 1047298ow hood and connected to the FIA pump
through the plastic
The critical reagent in this method is p-Tosyl-8-aminoquinoline
(pTAQ Chemica Inc Gardena CA) which forms a stable 1047298uorescent
complex with dissolved Zn(II) The 005 M pTAQ stock was preparedby dissolving 0291 g of pTAQ into 20 mL of nonionic surfactant base
Triton X-100 (poly(oxyethylene)isooctylphenol) Several individual
bottles of this pTAQ stock were prepared and bagged separately in
the event that one was to leak or spill These stock solutions were pre-
pared 1ndash2 months in advance and shipped to the starting port (Cape
Town SA) so that they were ready to use at the onset of the cruise
The previous study by Nowicki et al (1994) indicated that the pTAQ
concentration in the mixed reagent could be varied from 40 μ M to
120 μ M depending on expected concentrations of Zn in the water
being analyzed For the trace amounts of zinc expected in the south-
ern Indian Ocean 40 μ M was chosen
The 10 M boric acid solution was made by dissolving approxi-
mately 31 g of H3BO3 (Mallinkrodt Chemicals) into 500 mL of micro-
wave warmed (~90 degC) UHP water The H3BO3 was weighed out intoseveral individual vials for easier shipping and ship-board prepara-
tion of the solution The 20 M NaOH solution is commercially avail-
able (VWR BDH3223-1)
The 40 μ M pTAQ 1047298uorometric mixed reagent was prepared by
adding 25 mL of 20 M NaOH and 100 mL of 10 M boric acid to UHP
water subsequently bringing the solution up to approximately
1000 mL with UHP water then 1047297nally adding 800 μ L of the 005 M
pTAQ stock to the buffered solution Due to the viscous nature of
the triton the 005 M pTAQTriton solution was shaken vigorously
to ensure thorough mixing
Quartz distilled 6 M HCl was used to prepare the eluent and acid
rinse The 008 M Q-HCl eluent carrier was made up by adding
133 mL of 6 M Q-HCl to UHP water and bringing the mixture to a
total volume of 1000 mL with UHP water The 10 M Q-HCl acid
69KJ Gosnell et al Marine Chemistry 132ndash133 (2012) 68ndash76
8112019 2012 - Fluorometric Detection of Total Dissolved Zinc in the Southern Indian Ocean
httpslidepdfcomreaderfull2012-fluorometric-detection-of-total-dissolved-zinc-in-the-southern-indian 39
rinse was prepared by pouring 833 mL 6 M Q-HCl into some UHP
water then bringing the volume up to 500 mL with UHP water
Due to the minute quantities of Zn being measured it was neces-
sary to remove interfering cations primarily calcium (Ca) and mag-
nesium (Mg) from the column prior to the elution of Zn This was
accomplished by using diluted ammonium acetate buffer in the col-
umn rinse step The buffer rinse was made by mixing 40 mL of
20 M ammonium acetate buffer (pH 68) with 460 mL of UHP
water yielding a solution of 016 M NH4Ac (pH 577)
Primary and secondary zinc standards were made every week in
125 mL polyethylene bottles Initially a 40 μ M zinc standard was pre-
pared by adding 262 μ L of 1000 ppm atomic absorption zinc standardsolution (Fisher Scienti1047297c) into 100 mL of UHP water The 40 μ M Zn
standard was further diluted to produce a 200 nM Zn standard All
standards and samples were acidi1047297ed with 6 M Q-HCl to a concentra-
tion of 0024 M HCl to keep dissolved Zn(II) in solution
Working standards were made prior to each sample run in 30 mL
polyethylene bottles These working standards were prepared daily
using ldquolow-Znrdquo surface seawater to ensure that the standard matrix
remained consistent with the sample matrix Seawater was collected
from the ldquotrace metal cleanrdquo rosette system (Measures et al 2008)
1047297ltered through a 02 μ m AcroPak (Pall) capsule 1047297lter into 1 L poly-
ethylene bottles and quickly acidi1047297ed to 0024 M with 6 M Q-HCl
This bulk seawater solution was stored acidi1047297ed for a minimum of
24 h prior to being used in standard preparation Working standards
of +0 +1 +2 and occasionally +4 nM Zn(II) were made by adding150 300 and 600 μ L of the 200 nM secondary standard into 30 mL of
low-Zn surface seawater Samples and standards were buffered prior
to extraction to a pH of 505 (0067 M NH4Ac) using 10 mL of 2 M
ammonium acetate per 30 mL of sample or working standard
All solutions were driven through the FIA system by a Rainin
Rabbit-Plus eight-channel peristaltic pump Fisher 2-stop PVC tubing
measuring 152-mm id (coded blueyellow) was used for the buff-
ered pTAQ reagent and also for the sample and column rinse lines
(1047298ow rate=11 mLmin) Fisher 2-stop PVC pump tubing diameter
07-mm id (coded whitewhite) was used for the eluent acid carrier
(1047298ow rate=09 mLmin) All remaining manifold lines were FEP Tef-
lon tubing of 08-mm id
A cation exchange column of 8-hydroxyquinoline (8-HQ) resin
was used to extract and preconcentrate Zn from seawater (Landing
et al 1986) The column consisted of 200 μ L of 8-HQ slurry packed
into a 2 cm polyethylene column (Global FIA) The resin was secured
in the column with porous polyethylene frits and attached as a ldquosam-
ple looprdquo in the injection valve
The FIA manifold diagram is displayed in Fig 2 All data acquisition
and valve positions were controlled with a Dell Latitude 131L laptop
Valve switching was controlled with VICIcom port software A ten-
port multi-position valve (MP Cheminert 04R-0251L VICI Valco In-
struments Co Inc) was used for selecting the sequence of solutions
1047298owing to the injection valve (IV Cheminert 04Q-0014L VICI Valco
Instruments Co Inc)
The IV valve begins in the ldquoLoadrdquo position with a strong acid rinse(10 M HCl) for 10 s (~02 mL) in order to wash all trace elements
from the manifold tubing and the resin column This is followed by a
40 min sample loading period (~41 mL total) in which Zn is accumu-
lated on the 8-HQ resin as the buffered sample (pH 505 0067 M
NH4Ac) 1047298ows through the column During the load period the 008 M
HCl eluent bypasses the column 1047298owing directly towards the detector
mixing with the pTAQ reagent and establishing the signal baseline Fol-
lowing sample loading the column receives a 15 min rinse of the
buffered-UHP water (~16 mL) in order to elute calcium and magne-
sium cations Immediately after the column rinse the IV valve switches
to the ldquoInjectrdquo position for a 10 min elution period and approximately
09 mL of the 008 M Q-HCl eluent 1047298ows in the reverse direction
through the column releasing Zn into the eluent stream Zinc cations
mix with the pTAQ reagent at a Te1047298on mixing-T prior to 1047298owing to-wards the FIAlab PMT-FL 1047298uorometer Once column elution has ceased
the IV valve switches back to the load position for a 10 s column wash
with 10 M Q-HCl after which the cycle starts over again A complete
cycle takes approximately 68 min Valve timing and positioning for
this method is summarized in Table 1
Fluorometer wavelengths were controlled by internal wavelength
1047297lters inserted into the 1047298uorometer Wavelength 1047297lters were cen-
tered near the maximum excitation (377 nm) and emission
(495 nm) wavelengths of the pTAQ-Zn(II) 1047298uorescent complex as
reported by Nowicki et al (1994) The excitation 1047297lter used was
365 nm (narrow band-pass 358ndash372 nm) and the emission 1047297lter
used was 500 nm (broad band-pass 465ndash535 nm)
Fluorescence was monitored continuously during the load and in-
ject cycles using FIAlab 5 Analysis software Zinc concentrations were
Fig 1 Station locations for the 2009 CLIVAR I5 cruise transect in the southern Indian Ocean Stations began off the east coast of South Africa (Station 1) and ended off the west coast
of Australia (Station 195)
70 KJ Gosnell et al Marine Chemistry 132ndash133 (2012) 68ndash76
8112019 2012 - Fluorometric Detection of Total Dissolved Zinc in the Southern Indian Ocean
httpslidepdfcomreaderfull2012-fluorometric-detection-of-total-dissolved-zinc-in-the-southern-indian 49
assessed by measuring the peak height of the 1047298uorescence signal
Peak values (in units of relative ldquocountsrdquo) were recorded via FIAlab
software and extracted into Excel for further data processing The
1047298uorescent response was linear from 0 to at least 4 nM total dissolved
Zn The standard deviation averaged 0018 nM (n=5) and the detec-
tion limit was 006 nM (3SD) Standard SAFe S1 (006 nM Zn Johnson
et al 2007) standards were repeatedly and routinely analyzed for
each station in order to assure that there was a consistent signal
from the Zn-FIA method and measured values resided within the
reported range (005plusmn002 nM Zn) The Zn-FIA accuracy was also
veri1047297ed during the inter-calibration GEOTRACES 2008 cruise Bermu-
da Area Time Series station (BATS) samples were measured at
0024 nM Zn for 10 m (GS) while 1000 m (GD) was measured as
136 nM Zn both results are comparable to other laboratory resultsduring the trials of GEOTRACES 2008
23 Cadmium interference
Since pTAQ forms a 1047298uorescent complex with Cd(II) dissolved Cd
can yield a positive interference Based on laboratory tests using UHP
water and low-Zn seawater it appears that Cd 1047298uorescence is approx-
imately 30 that of Zn 1047298uorescence The interference we observed is
lower than the 70 reported by Nowicki et al (1994) Since total dis-
solved Cd concentrations found in the ocean tend to be about 10 of
the dissolved Zn concentrations (Bruland 1980) any corrections for
the presence of Cd would be about minus3 Calculated Cd interference
levels were below the detection limit (b0006 nM) as a result theseawater Zn concentrations we report were not corrected for Cd
interference
3 Results and discussion
31 Zinc measurements
A zonal section of total dissolved zinc concentrations from the
2009 CLIVAR I5 cruise prepared using Ocean Data View (Schlitzer
2011) is displayed in Fig 3 All of the station pro1047297les determined
from Zn-FIA appear to be oceanographically consistent displaying
the expected nutrient-like pro1047297le associated with zinc dynamics
Zinc pro1047297les tend to be surface depleted with concentrations around
005 nM throughout the euphotic zone Zinc remains depleted
throughout the upper 200 m of the southern Indian Ocean before
the deeper remineralization yields a steady increase in concentration
with depth Concentrations in the upper 200 m ranged from 002 nMto 027 nM including the coastal stations which both exhibited higher
Zn concentrations in surface waters
Coastal water is typically enriched with trace metals compared to
the open ocean therefore it is no surprise that Station 1 and Station
195 both have elevated Zn in the upper 200 m Station 1 collected
just off the eastern South African coast had 025 nM Zn in the surface
and remained below 05 nM Zn until the deepest sample at 285 m
where Zn was measured at 078 nM Station 195 was sampled off
the western coast of Australia and displayed a similar trend to that
seen at Station 1 with surface zinc levels of 027 nM Zinc values for
station 195 did not exceed 04 nM which was the concentration mea-
sured in the deepest sample at that station (183 m) Both coastal sta-
tions were affected by minor scatter throughout the Zn pro1047297le
possibly due to anthropogenic input (ie ship or beach runoff) orvia benthic 1047298ux enrichment from coastal sediments
Three typical Zn pro1047297les are displayed in Fig 4 representing sam-
ples from the beginning middle and end of the I5 transect Station 9
displayed higher surface concentrations than station 71 representing
possible coastal anthropogenic Zn input while station 177 demon-
strates the increased deep water concentrations typical of stations
collected closer to Australia There is a notable increase in deep
water Zn levels sloping up towards both the South African and Aus-
tralian coastlines with the deeper Zn concentrations showing a mod-
est increase east of South Africa at stations 1 through 17 (30deg 35prime E to
33deg 76prime E) and west of Australia for stations 170 through 195 (104deg
82prime E to 114deg 84prime E) We sampled to 1300 m at two stations The
two deeper stations 179 and 185 both displayed higher concentra-
tions of Zn than those collected up to 1000 m ( Fig 5) The highest
10-port
multi-position
Valve (MP)
wastemixing-T
(2) Buffered sample
(3) Buffered UHP water rinse
(1) 10 M HCl column wash
FIAlab PMT
fluorometer
008 M HCl
Elution acid
40 microM p-TAQ
10-portinjection
Valve (IV)
8-HQ resin
Load
Elute
Fig 2 Flow-injection manifold diagram for total dissolved zinc analysis The ten-port injection valve (IV) rotates sending solution (1) (2) or (3) through the column The injection
valve (IV) switches from ldquoLoadrdquo to ldquo Injectrdquo after the sample has been loaded and the column has been rinsed (see Table 2 for the analytical cycle time steps)
Table 1
Valve timing and position for the Zn-FIA method Thirty seconds is added to the actual
rinse time period of10 minin orderto account for1047298ow timeof the rinse to thecolumn
Time (min) Inject valve (IV) Multi-position val ve (MP)
010 Load 10 M HCl
410 Load Buffered sample
540 Load Buffered wash
640 Inject 008 M eluent (to waste)
650 Load 10 M HCl
71KJ Gosnell et al Marine Chemistry 132ndash133 (2012) 68ndash76
8112019 2012 - Fluorometric Detection of Total Dissolved Zinc in the Southern Indian Ocean
httpslidepdfcomreaderfull2012-fluorometric-detection-of-total-dissolved-zinc-in-the-southern-indian 59
measured Zn concentration was 386 nM from 1300 m at Station 185
(111deg 76prime E) Throughout the rest of the transect samples collected
from 200 m to 1000 m ranged from 007 nM to 275 nM Zn All zinc
pro1047297les exhibited a nutrient-type shape with the highest concentra-
tion of Zn always at the deepest depth collected for that pro1047297le
Table 2 presents Zn concentrations for a range of stations across
the section Levels are relatively consistent and low in surface waters
Morley et al (1993) reported surface water concentrations of Zn
closer to 05 nM while our surface samples had dissolved Zn concen-
trations (002ndash014 nM) more typical of the open northeast Paci1047297c
Ocean (Lohan et al 2002) Since Morley et al (1993) measured dis-
solved Zn between the Seychelles and Madagascar it is possible that
the surface concentration they reported could have been subjected
to more dust or anthropogenic input (via atmospheric aerosol depo-
sition) as opposed to the CLIVAR I5 section occupied much farther
to the south
Values from Morley et al (1993) agree well with the Zn concen-
trations we observed for the deeper samples during the CLIVAR I5transect as concentrations approached 1 to 3 nM Zn at 1000 m Sam-
ples were also taken by Morley et al (1993) down to depths of
5000 m and exhibited a steady increase in dissolved Zn up to 6 or
7 nM for that region Unfortunately the CLIVAR Trace Metals Rosette
system was limited to sampling depths of only 1300 m for this cruise
thus we are unable to compare with the deeper samples from Morley
et al (1993)
32 Zinc ndashsilicate relationship
The parallel vertical distributions of Zn and Si have been reported
for the western Indian Ocean (Morley et al 1993) northeast Paci1047297c
(Martin et al 1989 Lohan et al 2002) as well as the Atlantic
(Bruland and Franks 1983) Bruland et al (1994) observed that zinc
is distributed by an internal cycle based on a combination of rapid
surface removal with the effective recycling to dissolved forms in
the deeper ocean Despite its association with many different en-
zymes Zn does not appear to remineralize around mid-depth oxygen
minimum zones as nitrogen (N) and phosphate (P) do but rather at
the deeper depths that silicate dissolves back into the water column
The ZnndashSi relationship is slightly mysterious due to the strong corre-
lation of Cd and P as Cd has been shown to be incorporated similarly
to Zn in carbonic anhydrase (Xu et al 2008)
Zinc has been determined necessary for diatom silici1047297cation by De
La Rocha et al (2000) Biogenic opal Si does not dissolve quickly and
shell dissolution is subject to the type thickness and diameter of dia-tom shells thus the regeneration of dissolved Si and associated Zn
resolution occurs at deeper depths than N and P (Bruland and
Franks 1983) Collier and Edmond (1984) found that the fraction of
planktonic organic matter that degrades rapidly is associated with N
and P (and Cd) while Zn is associated with tissue which degrades
slowly suggesting that associations of Zn with recalcitrant POC may
also contribute to its deep regeneration cycle
Fig 3 Total dissolved zinc concentrations for the entire CLIVAR I5 transect measured using Zn-FIA The large white patch represents the area where samples were not obtained
below 1000 m thus there is no data for that section of the transect Zonal Zn section was prepared using Ocean Data View ( Schlitzer 2011)
Station 9 [Zn] nM Station 71 [Zn] nM Station 177 [Zn] nM
0 000 05 10 15 20 00 05 10 15 20 00 05 10 15 20
0
CA B
200
400
200
400
200
400
D e p t h ( m )
D e p t h ( m )
D e p t h ( m )
600 600 600
800
1000
800
1000
800
1000
Fig 4 Measured Zn pro1047297les for three stations from near the beginning (A) middle (B) and towards the end (C) of the CLIVAR I5 transect Error bars represent the standard
deviation of Zn measurements based on the detection limit of the FIA system The zinc concentration scale for station 177 is higher than for stations 9 and 71
72 KJ Gosnell et al Marine Chemistry 132ndash133 (2012) 68ndash76
8112019 2012 - Fluorometric Detection of Total Dissolved Zinc in the Southern Indian Ocean
httpslidepdfcomreaderfull2012-fluorometric-detection-of-total-dissolved-zinc-in-the-southern-indian 69
Typical pro1047297les collected on the I5 transect for Zn and Si repre-
sented by stations 166 and 120 are displayed in Fig 6 Silicate and
zinc are very strongly correlated at these stations The strong linear
relationship between dissolved Zn and Si 1047297rst reported by Bruland
et al (1978) has led to speculation that dissolved Zn might be a lim-
iting nutrient in HNLC areas (Coale 1991) However there is limited
data investigating ZnndashSi relationships in surface waters as Zn can be
severely depleted in surface waters (b005 nM) thus posing a serious
sampling and analytical challenge
Sections of dissolved Zn and Si also match up beautifully through-
out the southern Indian Ocean (Fig 7) Both Zn and Si sections were
created using Ocean Data View (Schlitzer 2011) Surface waters
from stations 124ndash179 (84deg 37prime E to 108deg 4prime E) had the lowest Zn
and Si concentrations of the entire transect Concentrations of both
Zn and Si increased dramatically below 800 m
The highest concentrations for both nutrient-like elements were
located at 1300 m along the coast of Australia (102deg 99prime E to 114deg
84prime E) These higher Zn concentrations are more of a result of thephysics of the subtropical southern gyre circulation rather than en-
richment from benthic sources on the continental slope The isopyc-
nal surfaces begin to shoal approaching the shelf bringing the
deeper water with higher concentrations of Zn and Si up to shallower
depths This contrasts with the situation in the central gyre where
downwelling pushes Zn depleted water to deeper depths
As we focused our study on the biogeochemical cycling of trace el-
ements in the upper water column the majority of our samples were
collected at depths shallower than 300 m with very low Zn concen-
trations This in turn produces an unbalanced distribution of data in
a plot of dissolved Zn versus Si The linear correlation between Zn
and Si for all measured stations is displayed in Fig 8 The overall re-
gression slope is 0059plusmn 0003 nM Zn per μ M Si (nMμ M)
(R 2=09187) The regression slope found for the southern Indian
Ocean presented here is consistent with the ratio of 006 nM Zn per
μ M silicate reported for the Paci1047297c Ocean by Bruland (1980) The lin-
ear relationship between Zn and Si was much stronger for this region
of the southern Indian Ocean (30 to 115deg E 30 to 35deg S) than the rel-
atively more scattered relationship found in the southwestern IndianOcean (56deg E 7 to 27deg S) by Morley et al (1993)
The ZnSi ratios for the entire I5 transect were produced with
Ocean Data View (Schlitzer 2011) and are displayed in Fig 9 Elevat-
ed ZnSi ratios (gt01 nM μ M) were observed in the upper 250 m at
coastal stations off western Australia perhaps as a result of benthic
regeneration on the shelf or from anthropogenic Zn enrichment
Two dissolved ZnSi ldquohot spotsrdquo seen in surface waters far offshore
are associated with extremely low Zn and Si concentrations thus
the slightest change in concentration for either element will yield a
large difference in the ratio These two ZnSi ldquohot spotsrdquo are due to
very slight Zn enrichment via atmospheric input or ship contamina-
tion The ZnSi ratios for surface waters across the rest of the section
are between 005 and 0075 nM μ M consistent with the 006 nM μ M
ratio reported for the northeastern Paci1047297c (Bruland 1980) and with
data shown in Fig 8
Decoupling of Zn and Si was observed for some stations though
samples in the middle of the I5 transect did not appear to be
signi1047297cantly decoupled compared to coastal samples possibly be-
cause upwelling is not prominent for this study region Signi1047297cant
decoupling of the ZnSi relationship was observed at offshore stations
in the Paci1047297c by Lohan et al (2002) however coastal stations in that
study region exhibited elevated dissolved Zn concentrations from re-
gional upwelling and enhanced coastal Zn input while at the same
time containing lower dissolved Si concentrations due to signi1047297cant
diatom productivity
The broad parcel of lower ZnSi ratios between 100 and 400 m for
the western 23 of the section are due to dissolved silicate enrichment
in these waters This zone lies between the depth ranges of the sea-
sonal and the permanent thermoclines but does not appear to be as-sociated with the Indian Ocean Subtropical Mode Water or the
Subantarctic Mode Water as reviewed by Koch-Larrouy et al
(2010) Thus it does not appear to be the result of water mass trans-
port from an area with unusually low ldquopre-formedrdquo ZnSi ratios If this
zone of low ZnSi ratios is not due to horizontal water mass move-
ment and if it is a steady-state feature then it may be re1047298ecting a
two-fold decoupling of the ZnSi relationship As waters from the sur-
face mixed layer (with high ZnSi ratios but very low concentrations
of Zn and Si) mix downward into waters with lower ZnSi ratios but
higher concentrations slightly preferential regeneration of silicate
[Zn] (nM)
0 1 2 3 40
200
400
Station 185Station 179
600
D e p t h
( m )
800
1000
1200
1400
Fig 5 Dissolved Zn pro1047297les for stations where slightly deeper samples were collected
showing that dissolved Zn continues to increase smoothly at intermediate depths
Table 2
Zinc concentrations (nM) from several stations across the CLIVAR I5 transect Concentrations were relatively consistent throughout the transect before beginning to increase at
depth towards Australia
Depth (m) Station 9
31deg 2primeE
31deg 6primeS
Station 30
39deg 3primeE
32deg 9primeS
Station 71
57deg 5primeE
34deg 0primeS
Station 91
68deg 5primeE
33deg 9primeS
Station 124
84deg 4primeE
31deg 2primeS
Station 145
94deg 9primeE
34deg 0primeS
Station 177
107deg 2primeE
31deg 3primeS
20 014 012 004 004 002 005 011
35 020 022 004 011 016 009 016
60 013 008 003 010 014 008 011
85 016 022 002 004 003 007 010
115 006 022 003 009 007 008 012
135 012 016 003 004 006 012 010
165 012 020 003 012 018 007 012
265 012 015 007 009 011 010 017
440 019 017 015 014 011 021 032
650 025 027 018 023 032 066 074
860 031 051 039 026 015 053 185
950 097 141 116 129 162 240 224
73KJ Gosnell et al Marine Chemistry 132ndash133 (2012) 68ndash76
8112019 2012 - Fluorometric Detection of Total Dissolved Zinc in the Southern Indian Ocean
httpslidepdfcomreaderfull2012-fluorometric-detection-of-total-dissolved-zinc-in-the-southern-indian 79
relative to Zn would yield lower ZnSi ratios and higher concentra-tions of both elements On the other hand as waters from the main
thermocline (with high ZnSi ratios and higher concentrations of Zn
and Si) mix upward into the zone with lower ZnSi ratios and concen-
trations the only way to maintain lower ratios in this zone is for dis-
solved Zn to be preferentially removed relative to silicate from the
waters as they mix upward
Areas in the southern Indian Ocean exhibiting variable ZnSi ra-tios hence de-coupling appeared to be more from a result of de-
creased atmospheric Zn inputs or more effective surface removal of
essential metals such as Zn and Fe by primary productivity Our
data support the conclusion that dissolved Zn is actively incorporated
by phytoplankton in the upper water column resulting in very low
dissolved Zn concentrations in the upper 200 m Also since Zn is
Zn (nM)Zn (nM)
0
Si (uM)
0
Si (uM)
00 05 10 15 20 25
0 5 10 15 20 25 30
00 02 04 06 08 10 12 14
0 5 10 15 20
200Zn (nM)
Si (uM)200
Zn (nM)
Si (uM)
d e p t h ( m ) 400
600 d e p t h ( m ) 400
600
800800
10001000
BA
Fig 6 Typical pro1047297les for total dissolved zinc (o) and silicate (x) Station pro1047297les presented are station 120 (A) and station 166 (B)
Fig 7 Total dissolved zinc (top) and silicate (bottom) concentrations for the entire CLIVAR I5 transect Both zonal sections were produced with Ocean Data View (Schlitzer 2011)
The displayed dissolved Si concentrations were collected via the main rosette during CLIVAR I5 Dissolved Si concentrations in the upper 1000 m using the main rosette were
essentially identical to dissolved Si samples collected from the ldquo
Trace Metalsrdquo
rosette
74 KJ Gosnell et al Marine Chemistry 132ndash133 (2012) 68ndash76
8112019 2012 - Fluorometric Detection of Total Dissolved Zinc in the Southern Indian Ocean
httpslidepdfcomreaderfull2012-fluorometric-detection-of-total-dissolved-zinc-in-the-southern-indian 89
associated with organic matter that is less easily remineralised
(Collier and Edmond 1984) then silicate is more effectively recycled
in the upper water column when compared to Zn Hence a more con-
sistent supply of dissolved Si than dissolved Zn is available to some
regions and the Zn to Si cycle can be notably decoupled
Below this zone of low ZnSi ratios the values become very uni-
form (005ndash0075 nM μ M) across the entire section suggesting that
there was no signi1047297cant decoupling of the ZnSi relationship during
deep regeneration
33 Biological association with zinc and silicate
Differences between the mechanisms of Zn intercellular incorpo-
ration and Zn absorbed to the outside of diatoms are still not entirely
resolved It has been reported that Zn can be adsorbed onto diatom
shells and frustules (Sunda and Huntsman 1992) however if opal in-
corporation of Zn was purely a passive adsorption process then it
would be expected that other trace metals would also be incorporat-
ed into the opal structure via the same processes As other biologically
essential metals such as Fe and Mn do not follow the same reminera-lization trends as Si then simple passive adsorption of metals is un-
likely the only source of the ZnSi association
The relationship between ZnSi implies that Zn is more likely in-
corporated into the opal structure through an internal cellular origin
rather than an external adsorption source (Ellwood and Hunter
1999) Laboratory culture experiments performed by Ellwood and
Hunter (1999) using Thalassiosira pseudonana indicated that zinc in-
corporation into the opal structure was directly related to amounts
of dissolved Zn(II) as the ZnSi ratio in the frustules increased with
greater Zn(II) concentrations However Zn incorporation into opal
still represented only 1ndash3 of the total Zn uptake and the amount
of Zn incorporated into biogenic opal was less than expected based
on the dissolved ZnSi relationship reported in the water column
Ellwood and Hunter (1999) did not report metals other than Zn and
Fe to be present in the opal structure for diatoms grown in culture
Species of phytoplankton will have various responses to organical-
ly complexed Zn Lohan et al (2005) found that the assemblage and
speciation of Zn-binding ligands experienced considerably changeover an 8 day bottle incubation experiment in the subarctic Paci1047297c
Thus the production and destruction of ligands produced by different
phytoplankton and bacteria should in1047298uence Zn uptakerates and per-
haps exert control on phytoplankton productivity and community
structure Unfortunately phytoplankton community structure was
not measured or assessed during our study therefore we are unable
to directly correlate zinc to phytoplankton biomass
Though phytoplankton effects were not investigated during I5 the
measured ZnSi relationship could provide theoretical evidence that
the phytoplankton community was in1047298uenced by limiting Zn concen-
trations De La Rocha et al (2000) reported that laboratory cultures of
diatoms would increase Si concentrationsin their shellswhen Zn con-
centrations were limiting Depleted Zn levels would result in thicker
heavier diatom shells as the Si built up Theoretically when these or-
ganisms die and sink the Si tests would re-dissolve back into the wa-
ters releasing enriched Si concentrations As a result subsurface
water measurements would contain enriched Si in comparison to Zn
concentrations Ratios of ZnSi for the subsurface western 23 section
of the I5 transect contained enriched dissolved Si and slightly deplet-
ed dissolved Zn concentrations resulting in signi1047297cantly lower ratios
than the rest of the transect (ZnSib005 nMμ M) This patch was spa-
tial enough to indicate that these ratios could be a result of undi-
sclosed biogeochemistry interactions Hypothetically the ratio
values were an indication of depleted surface concentrations of Zn
in1047298uencing the Si concentrations of the diatom shells However as
no in situ phytoplankton investigation was preformed this result
could not be con1047297rmed for this study Since these are the 1047297rst total
dissolved Zn values measured for the southern Indian Ocean further
work is needed to determine the in situ mechanisms controlling theZnSi relationships for this ocean region
4 Conclusion
This work may be the 1047297rst effort to utilize on a large scale the dis-
solved Zn FIA method published by Nowicki et al (1994) many years
ago The opportunity to participate on the CLIVAR I5 cruise enabled
us to collect and analyze nearly 500 discrete water samples for dis-
solved Zn from the southern Indian Ocean where no dissolved Zn
Fig 8 Individual values for Zn vs Si for the entire CLIVAR I5 transect Least squares
linear regression yields a slope of 0059 (plusmn0003)
Fig 9 ZnSi ratios from the CLIVAR I5 transect created with Ocean Data View (Schlitzer 2011) Higher ratios off the Australian coast may re1047298ect natural or anthropogenic terrestrial
input since the higher ratios are caused by elevated Zn concentrations
75KJ Gosnell et al Marine Chemistry 132ndash133 (2012) 68ndash76
8112019 2012 - Fluorometric Detection of Total Dissolved Zinc in the Southern Indian Ocean
httpslidepdfcomreaderfull2012-fluorometric-detection-of-total-dissolved-zinc-in-the-southern-indian 99
measurements had previously been reported We followed strict pro-
tocols during sample collection processing and analysis to minimize
contamination and overall the dissolved Zn data set appears oceano-
graphically consistent and credible These measurements helped to
establisha ratio of 0059plusmn 0003 forZnSi(nMμ M) in thesouthernIn-
dian Ocean In combination with Morley et al (1993) and numerous
studies reporting Zn concentrations for the Paci1047297c (Bruland et al
1978 Lohan et al 2002 Martin and Gordon 1988) and Atlantic
(Ellwood and Van den Berg 2000) the database of dissolved Zn isexpanding for the worlds oceans
Despite the overall very strong correlation between dissolved Zn
and Si Lohan et al (2002) suggested that variations in the ZnSi ratios
could allow one to detect a decoupling of Zn and Si biogeochemical
cycles in the upper ocean In our study area elevated ZnSi ratios in
surface waters and coastal areas were generally due to higher Zn con-
centrations while variations in the ZnSi ratios from 100 to 800 m
were associated more with minor variations in the silicate concentra-
tions Whether these variations are due to in-situ decoupling of the
Zn and Si cycles biological in1047298uences or whether they re1047298ect hori-
zontal intrusion of watermasses with different ldquopre-formedrdquo ZnSi ra-
tios remains to be determined
The very low total dissolved Zn concentrations we found in the
photic zone along the CLIVAR I5 transect (b20 pM) would correspond
to bioavailable Znprime concentrations approaching 1 pM if the strong Zn-
binding ligand concentrations are similar in this region to those
reported by Bruland (1989) for the north Paci1047297c The extremely oligo-
trophic conditions and particularly low levels of natural and anthro-
pogenic atmospheric input one 1047297nds across the I5 subtropical gyre
transect represents an intriguing opportunity to test theories regard-
ing macro and micro nutrient co-limitation The macro nutrients and
micro nutrient trace metals have been stripped from the upper water
column to their detection limits and the anti-cyclonic circulation
keeps the isopycnal surfaces depressed nearly eliminating any up-
welling along the central portion of the transect Ideally these mea-
sured dissolved Zn concentrations reported for the region could
provide a starting point from which future projects related to Zn bio-
availability and Zn limitations in phytoplankton growth and produc-
tivity could be established
Acknowledgments
We would like to thank all of the trace metal scientists who aided
with this research whether it was by helping collect samples or coax-
ing me away from 1047297ghting with the system and throwing it over-
board namely Chris Measures Mariko Hatta Maxime Grand
William Hiscock and Peter Morton We would also like to thank the
chief scientists for the GEOTRACES 2008 and CLIVAR I5 2009 cruises
Greg Cutter and Jim Swift Additionally a lot of gratitude goes to the
captains and crews for both the RV Knorr and RV Revelle Because
of all their hard work and dedication this research was possible
and the long cruises were more pleasure than pain This research
was supported by NSF-OCE 0649639
References
Anderson MA Morel FM Guillard RRL 1978 Growth limitation of a coastal dia-tom by low zinc ion activity Nature 276 70ndash71
Badger MR Price GD 1994 The role of carbonic anhydrase in photosynthesis AnnuRev Plant Physiol Plant Mol Biol 45 369ndash392
Brand LE Sunda WG Guillard RRL 1983 Limitation of marine-phytoplankton re-productive rates by zinc manganese and iron Limnol Oceanogr 28 1182 ndash1198
Bruland KW 1980 Oceanographic distributions of cadmium zinc nickel and copperin the North Paci1047297c Earth Planet Sci Lett 47 176ndash198
Bruland KW 1989 Complexation of zinc by natural organic ligands in the centralNorth Paci1047297c Limnol Oceanogr 37 269ndash285
Bruland KW Franks RP 1983 Trace elements in seawater Chemical Oceanographyvol 8 Academic Press London pp 157ndash215
Bruland KW Franks RP Knauer GA Martin JH 1979 Sampling and analyticalmethods for the determination of copper cadmium zinc and nickel at thenanogram per liter level in sea water Anal Chem Acta 105 233ndash245
Bruland KW Knauer GA Martin JH 1978 Zinc in north-east Paci1047297c waters Nature271 741ndash743Bruland KW Orians KJ Cowen JP 1994 Reactive trace metals in the strati1047297ed central
North Paci1047297c Geochim Cosmochim Acta 58 3171ndash3182Coale KH 1991 Effects of iron manganese copper and zinc enrichments on produc-
tivity and biomass in the subarctic Paci1047297c Limnol Oceanogr 36 1851ndash1864Coale KH Want X Tanner SJ Johnson KS 2003 Phytoplankton growth and bio-
logical response to iron and zinc addition in the Ross Sea and Antarctic Circumpo-lar Current along 170degW Deep-Sea Res Part II 50 635ndash653
Collier R Edmond J 1984 The trace element geochemistry of marine biogenicparticulatematter Prog Oceanogr 13 113ndash199
Crawford DW Lipsen MSPurdie DA Lohan MCStatham PJWhitney FAPutland JNJohnson WKSutherland N Peterson TD Harrison PJ Wong CS 2003In1047298u-ence of Zinc andiron enrichments on phytoplankton growthin thenortheastern Sub-arctic Paci1047297c Limnol Oceanogr 48 1583ndash1600
De La Rocha CL Hutchins DA Brzezinski MA Zhang Y 2000 Effects of iron andzinc de1047297ciency on elemental composition and silica production by diatoms MarEcol Prog Ser 195 71ndash79
Ellwood MJ Hunter KA 1999 Determination of the ZnSi ratio in diatom opal a
method for the separation cleaning and dissolution of diatoms Mar Chem 66149ndash160
Ellwood MJ Van den Berg CMG 2000 Zinc speciation in the Northeastern AtlanticOcean Mar Chem 68 295ndash306
Ibrahim M Shaban S Ichikawa K 2008 A promising structural zinc enzyme modelfor CO2 1047297xation and calci1047297cation Tetrahedron Lett 49 7303ndash7306
Johnson KS Boyle E Bruland K Coale K Measures C Moffett J Aguilarislas ABarbeau K Bergquist B Bowie A Buck K Cai Y Chase Z Cullen J Doi TElrod V Fitzwater S Gordon M King A Laan P Laglera-Baquer L LandingW Lohan M Mendez J Milne A Obata H Ossiander L Plant J Sarthou GSedwick P Smith GJ Sohst B Tanner S Van Den Berg S Wu J 2007 Devel-oping standards for dissolved iron in seawater Eos 88 (11) 131ndash132
Koch-Larrouy A Morrow R Penduff T Juza M 2010 Origin and mechanism of Sub-antarctic Mode Water formation and transformation in the Southern Indian OceanOcean Dyn 60 563ndash583
Landing WM Haraldsson C Paxeus N 1986 Vinyl polymer agglomerate based transi-tion metal cation chelating ion-exchange resin containing the 8-Hydroxyquinolinefunctional group Anal Chem 58 3031ndash3035
Lohan MC Statham PJ Crawford DW 2002 Total dissolved zinc in the upper watercolumn of the subarctic North East Paci1047297c Deep-Sea Res II 49 5793ndash5808
Lohan MC Crawford DW Purdie DA Statham PJ 2005 Iron andzinc enrichmentsin the northeastern subarctic Paci1047297c ligand production and zinc availability in re-sponse to phytoplankton growth Limnol Oceanogr 50 1427ndash1437
Martin JH Gordon RM 1988 Northeast Paci1047297c iron distributions in relation tophytoplankton productivity Deep-Sea Res 35 177ndash196
Martin JH Gordon RM Fitzwater S Broenkow WW 1989 VERTEX phytoplankton iron studies in the Gulf of Alaska Deep-Sea Res 36 649 ndash680
Measures CI Landing WM Brown MT Buck CS 2008 A commercially availablerosette system for trace metal-clean sampling Limnol Oceanogr Methods 6384ndash394
Morel FMM Reinfelder JR Roberts SB Chamberlain CP Lee JG Yee D 1994Zinc and carbon co-limitation of marine-phytoplankton Nature 369 740ndash742
Morley NH Statham PJ Burton JD 1993 Dissolved trace metals in the southwesternIndian Ocean Deep-Sea Res 30 (5) 1043ndash1062
Nowicki J Johnson K Coale K Elrod V Lieberman S 1994 Determination of zincinseawater using 1047298ow injection analysis with 1047298uorometric detection Anal Chem 662732ndash2738
Schlitzer R 2011 Ocean Data View 4 httpodvawide2011Schulz KG Zondervan I Gerringa LJ Timmermans KR Veldhuis MJ Riebesell U
2004 Effects of trace metal availability on coccolithophorid calci1047297cation Nature403 673ndash676
Sunda WG Huntsman SA 1992 Feedback interactions between zinc and phyto-plankton in seawater Limnol Oceanogr 37 25ndash40
Xu Y Feng L Jeffrey P Shi Y Morel FMM 2008 Structure and metal exchange inthe cadmium carbonic anhydrase of marine diatoms Nature 452 56ndash62
76 KJ Gosnell et al Marine Chemistry 132ndash133 (2012) 68ndash76

8112019 2012 - Fluorometric Detection of Total Dissolved Zinc in the Southern Indian Ocean
httpslidepdfcomreaderfull2012-fluorometric-detection-of-total-dissolved-zinc-in-the-southern-indian 49
assessed by measuring the peak height of the 1047298uorescence signal
Peak values (in units of relative ldquocountsrdquo) were recorded via FIAlab
software and extracted into Excel for further data processing The
1047298uorescent response was linear from 0 to at least 4 nM total dissolved
Zn The standard deviation averaged 0018 nM (n=5) and the detec-
tion limit was 006 nM (3SD) Standard SAFe S1 (006 nM Zn Johnson
et al 2007) standards were repeatedly and routinely analyzed for
each station in order to assure that there was a consistent signal
from the Zn-FIA method and measured values resided within the
reported range (005plusmn002 nM Zn) The Zn-FIA accuracy was also
veri1047297ed during the inter-calibration GEOTRACES 2008 cruise Bermu-
da Area Time Series station (BATS) samples were measured at
0024 nM Zn for 10 m (GS) while 1000 m (GD) was measured as
136 nM Zn both results are comparable to other laboratory resultsduring the trials of GEOTRACES 2008
23 Cadmium interference
Since pTAQ forms a 1047298uorescent complex with Cd(II) dissolved Cd
can yield a positive interference Based on laboratory tests using UHP
water and low-Zn seawater it appears that Cd 1047298uorescence is approx-
imately 30 that of Zn 1047298uorescence The interference we observed is
lower than the 70 reported by Nowicki et al (1994) Since total dis-
solved Cd concentrations found in the ocean tend to be about 10 of
the dissolved Zn concentrations (Bruland 1980) any corrections for
the presence of Cd would be about minus3 Calculated Cd interference
levels were below the detection limit (b0006 nM) as a result theseawater Zn concentrations we report were not corrected for Cd
interference
3 Results and discussion
31 Zinc measurements
A zonal section of total dissolved zinc concentrations from the
2009 CLIVAR I5 cruise prepared using Ocean Data View (Schlitzer
2011) is displayed in Fig 3 All of the station pro1047297les determined
from Zn-FIA appear to be oceanographically consistent displaying
the expected nutrient-like pro1047297le associated with zinc dynamics
Zinc pro1047297les tend to be surface depleted with concentrations around
005 nM throughout the euphotic zone Zinc remains depleted
throughout the upper 200 m of the southern Indian Ocean before
the deeper remineralization yields a steady increase in concentration
with depth Concentrations in the upper 200 m ranged from 002 nMto 027 nM including the coastal stations which both exhibited higher
Zn concentrations in surface waters
Coastal water is typically enriched with trace metals compared to
the open ocean therefore it is no surprise that Station 1 and Station
195 both have elevated Zn in the upper 200 m Station 1 collected
just off the eastern South African coast had 025 nM Zn in the surface
and remained below 05 nM Zn until the deepest sample at 285 m
where Zn was measured at 078 nM Station 195 was sampled off
the western coast of Australia and displayed a similar trend to that
seen at Station 1 with surface zinc levels of 027 nM Zinc values for
station 195 did not exceed 04 nM which was the concentration mea-
sured in the deepest sample at that station (183 m) Both coastal sta-
tions were affected by minor scatter throughout the Zn pro1047297le
possibly due to anthropogenic input (ie ship or beach runoff) orvia benthic 1047298ux enrichment from coastal sediments
Three typical Zn pro1047297les are displayed in Fig 4 representing sam-
ples from the beginning middle and end of the I5 transect Station 9
displayed higher surface concentrations than station 71 representing
possible coastal anthropogenic Zn input while station 177 demon-
strates the increased deep water concentrations typical of stations
collected closer to Australia There is a notable increase in deep
water Zn levels sloping up towards both the South African and Aus-
tralian coastlines with the deeper Zn concentrations showing a mod-
est increase east of South Africa at stations 1 through 17 (30deg 35prime E to
33deg 76prime E) and west of Australia for stations 170 through 195 (104deg
82prime E to 114deg 84prime E) We sampled to 1300 m at two stations The
two deeper stations 179 and 185 both displayed higher concentra-
tions of Zn than those collected up to 1000 m ( Fig 5) The highest
10-port
multi-position
Valve (MP)
wastemixing-T
(2) Buffered sample
(3) Buffered UHP water rinse
(1) 10 M HCl column wash
FIAlab PMT
fluorometer
008 M HCl
Elution acid
40 microM p-TAQ
10-portinjection
Valve (IV)
8-HQ resin
Load
Elute
Fig 2 Flow-injection manifold diagram for total dissolved zinc analysis The ten-port injection valve (IV) rotates sending solution (1) (2) or (3) through the column The injection
valve (IV) switches from ldquoLoadrdquo to ldquo Injectrdquo after the sample has been loaded and the column has been rinsed (see Table 2 for the analytical cycle time steps)
Table 1
Valve timing and position for the Zn-FIA method Thirty seconds is added to the actual
rinse time period of10 minin orderto account for1047298ow timeof the rinse to thecolumn
Time (min) Inject valve (IV) Multi-position val ve (MP)
010 Load 10 M HCl
410 Load Buffered sample
540 Load Buffered wash
640 Inject 008 M eluent (to waste)
650 Load 10 M HCl
71KJ Gosnell et al Marine Chemistry 132ndash133 (2012) 68ndash76
8112019 2012 - Fluorometric Detection of Total Dissolved Zinc in the Southern Indian Ocean
httpslidepdfcomreaderfull2012-fluorometric-detection-of-total-dissolved-zinc-in-the-southern-indian 59
measured Zn concentration was 386 nM from 1300 m at Station 185
(111deg 76prime E) Throughout the rest of the transect samples collected
from 200 m to 1000 m ranged from 007 nM to 275 nM Zn All zinc
pro1047297les exhibited a nutrient-type shape with the highest concentra-
tion of Zn always at the deepest depth collected for that pro1047297le
Table 2 presents Zn concentrations for a range of stations across
the section Levels are relatively consistent and low in surface waters
Morley et al (1993) reported surface water concentrations of Zn
closer to 05 nM while our surface samples had dissolved Zn concen-
trations (002ndash014 nM) more typical of the open northeast Paci1047297c
Ocean (Lohan et al 2002) Since Morley et al (1993) measured dis-
solved Zn between the Seychelles and Madagascar it is possible that
the surface concentration they reported could have been subjected
to more dust or anthropogenic input (via atmospheric aerosol depo-
sition) as opposed to the CLIVAR I5 section occupied much farther
to the south
Values from Morley et al (1993) agree well with the Zn concen-
trations we observed for the deeper samples during the CLIVAR I5transect as concentrations approached 1 to 3 nM Zn at 1000 m Sam-
ples were also taken by Morley et al (1993) down to depths of
5000 m and exhibited a steady increase in dissolved Zn up to 6 or
7 nM for that region Unfortunately the CLIVAR Trace Metals Rosette
system was limited to sampling depths of only 1300 m for this cruise
thus we are unable to compare with the deeper samples from Morley
et al (1993)
32 Zinc ndashsilicate relationship
The parallel vertical distributions of Zn and Si have been reported
for the western Indian Ocean (Morley et al 1993) northeast Paci1047297c
(Martin et al 1989 Lohan et al 2002) as well as the Atlantic
(Bruland and Franks 1983) Bruland et al (1994) observed that zinc
is distributed by an internal cycle based on a combination of rapid
surface removal with the effective recycling to dissolved forms in
the deeper ocean Despite its association with many different en-
zymes Zn does not appear to remineralize around mid-depth oxygen
minimum zones as nitrogen (N) and phosphate (P) do but rather at
the deeper depths that silicate dissolves back into the water column
The ZnndashSi relationship is slightly mysterious due to the strong corre-
lation of Cd and P as Cd has been shown to be incorporated similarly
to Zn in carbonic anhydrase (Xu et al 2008)
Zinc has been determined necessary for diatom silici1047297cation by De
La Rocha et al (2000) Biogenic opal Si does not dissolve quickly and
shell dissolution is subject to the type thickness and diameter of dia-tom shells thus the regeneration of dissolved Si and associated Zn
resolution occurs at deeper depths than N and P (Bruland and
Franks 1983) Collier and Edmond (1984) found that the fraction of
planktonic organic matter that degrades rapidly is associated with N
and P (and Cd) while Zn is associated with tissue which degrades
slowly suggesting that associations of Zn with recalcitrant POC may
also contribute to its deep regeneration cycle
Fig 3 Total dissolved zinc concentrations for the entire CLIVAR I5 transect measured using Zn-FIA The large white patch represents the area where samples were not obtained
below 1000 m thus there is no data for that section of the transect Zonal Zn section was prepared using Ocean Data View ( Schlitzer 2011)
Station 9 [Zn] nM Station 71 [Zn] nM Station 177 [Zn] nM
0 000 05 10 15 20 00 05 10 15 20 00 05 10 15 20
0
CA B
200
400
200
400
200
400
D e p t h ( m )
D e p t h ( m )
D e p t h ( m )
600 600 600
800
1000
800
1000
800
1000
Fig 4 Measured Zn pro1047297les for three stations from near the beginning (A) middle (B) and towards the end (C) of the CLIVAR I5 transect Error bars represent the standard
deviation of Zn measurements based on the detection limit of the FIA system The zinc concentration scale for station 177 is higher than for stations 9 and 71
72 KJ Gosnell et al Marine Chemistry 132ndash133 (2012) 68ndash76
8112019 2012 - Fluorometric Detection of Total Dissolved Zinc in the Southern Indian Ocean
httpslidepdfcomreaderfull2012-fluorometric-detection-of-total-dissolved-zinc-in-the-southern-indian 69
Typical pro1047297les collected on the I5 transect for Zn and Si repre-
sented by stations 166 and 120 are displayed in Fig 6 Silicate and
zinc are very strongly correlated at these stations The strong linear
relationship between dissolved Zn and Si 1047297rst reported by Bruland
et al (1978) has led to speculation that dissolved Zn might be a lim-
iting nutrient in HNLC areas (Coale 1991) However there is limited
data investigating ZnndashSi relationships in surface waters as Zn can be
severely depleted in surface waters (b005 nM) thus posing a serious
sampling and analytical challenge
Sections of dissolved Zn and Si also match up beautifully through-
out the southern Indian Ocean (Fig 7) Both Zn and Si sections were
created using Ocean Data View (Schlitzer 2011) Surface waters
from stations 124ndash179 (84deg 37prime E to 108deg 4prime E) had the lowest Zn
and Si concentrations of the entire transect Concentrations of both
Zn and Si increased dramatically below 800 m
The highest concentrations for both nutrient-like elements were
located at 1300 m along the coast of Australia (102deg 99prime E to 114deg
84prime E) These higher Zn concentrations are more of a result of thephysics of the subtropical southern gyre circulation rather than en-
richment from benthic sources on the continental slope The isopyc-
nal surfaces begin to shoal approaching the shelf bringing the
deeper water with higher concentrations of Zn and Si up to shallower
depths This contrasts with the situation in the central gyre where
downwelling pushes Zn depleted water to deeper depths
As we focused our study on the biogeochemical cycling of trace el-
ements in the upper water column the majority of our samples were
collected at depths shallower than 300 m with very low Zn concen-
trations This in turn produces an unbalanced distribution of data in
a plot of dissolved Zn versus Si The linear correlation between Zn
and Si for all measured stations is displayed in Fig 8 The overall re-
gression slope is 0059plusmn 0003 nM Zn per μ M Si (nMμ M)
(R 2=09187) The regression slope found for the southern Indian
Ocean presented here is consistent with the ratio of 006 nM Zn per
μ M silicate reported for the Paci1047297c Ocean by Bruland (1980) The lin-
ear relationship between Zn and Si was much stronger for this region
of the southern Indian Ocean (30 to 115deg E 30 to 35deg S) than the rel-
atively more scattered relationship found in the southwestern IndianOcean (56deg E 7 to 27deg S) by Morley et al (1993)
The ZnSi ratios for the entire I5 transect were produced with
Ocean Data View (Schlitzer 2011) and are displayed in Fig 9 Elevat-
ed ZnSi ratios (gt01 nM μ M) were observed in the upper 250 m at
coastal stations off western Australia perhaps as a result of benthic
regeneration on the shelf or from anthropogenic Zn enrichment
Two dissolved ZnSi ldquohot spotsrdquo seen in surface waters far offshore
are associated with extremely low Zn and Si concentrations thus
the slightest change in concentration for either element will yield a
large difference in the ratio These two ZnSi ldquohot spotsrdquo are due to
very slight Zn enrichment via atmospheric input or ship contamina-
tion The ZnSi ratios for surface waters across the rest of the section
are between 005 and 0075 nM μ M consistent with the 006 nM μ M
ratio reported for the northeastern Paci1047297c (Bruland 1980) and with
data shown in Fig 8
Decoupling of Zn and Si was observed for some stations though
samples in the middle of the I5 transect did not appear to be
signi1047297cantly decoupled compared to coastal samples possibly be-
cause upwelling is not prominent for this study region Signi1047297cant
decoupling of the ZnSi relationship was observed at offshore stations
in the Paci1047297c by Lohan et al (2002) however coastal stations in that
study region exhibited elevated dissolved Zn concentrations from re-
gional upwelling and enhanced coastal Zn input while at the same
time containing lower dissolved Si concentrations due to signi1047297cant
diatom productivity
The broad parcel of lower ZnSi ratios between 100 and 400 m for
the western 23 of the section are due to dissolved silicate enrichment
in these waters This zone lies between the depth ranges of the sea-
sonal and the permanent thermoclines but does not appear to be as-sociated with the Indian Ocean Subtropical Mode Water or the
Subantarctic Mode Water as reviewed by Koch-Larrouy et al
(2010) Thus it does not appear to be the result of water mass trans-
port from an area with unusually low ldquopre-formedrdquo ZnSi ratios If this
zone of low ZnSi ratios is not due to horizontal water mass move-
ment and if it is a steady-state feature then it may be re1047298ecting a
two-fold decoupling of the ZnSi relationship As waters from the sur-
face mixed layer (with high ZnSi ratios but very low concentrations
of Zn and Si) mix downward into waters with lower ZnSi ratios but
higher concentrations slightly preferential regeneration of silicate
[Zn] (nM)
0 1 2 3 40
200
400
Station 185Station 179
600
D e p t h
( m )
800
1000
1200
1400
Fig 5 Dissolved Zn pro1047297les for stations where slightly deeper samples were collected
showing that dissolved Zn continues to increase smoothly at intermediate depths
Table 2
Zinc concentrations (nM) from several stations across the CLIVAR I5 transect Concentrations were relatively consistent throughout the transect before beginning to increase at
depth towards Australia
Depth (m) Station 9
31deg 2primeE
31deg 6primeS
Station 30
39deg 3primeE
32deg 9primeS
Station 71
57deg 5primeE
34deg 0primeS
Station 91
68deg 5primeE
33deg 9primeS
Station 124
84deg 4primeE
31deg 2primeS
Station 145
94deg 9primeE
34deg 0primeS
Station 177
107deg 2primeE
31deg 3primeS
20 014 012 004 004 002 005 011
35 020 022 004 011 016 009 016
60 013 008 003 010 014 008 011
85 016 022 002 004 003 007 010
115 006 022 003 009 007 008 012
135 012 016 003 004 006 012 010
165 012 020 003 012 018 007 012
265 012 015 007 009 011 010 017
440 019 017 015 014 011 021 032
650 025 027 018 023 032 066 074
860 031 051 039 026 015 053 185
950 097 141 116 129 162 240 224
73KJ Gosnell et al Marine Chemistry 132ndash133 (2012) 68ndash76
8112019 2012 - Fluorometric Detection of Total Dissolved Zinc in the Southern Indian Ocean
httpslidepdfcomreaderfull2012-fluorometric-detection-of-total-dissolved-zinc-in-the-southern-indian 79
relative to Zn would yield lower ZnSi ratios and higher concentra-tions of both elements On the other hand as waters from the main
thermocline (with high ZnSi ratios and higher concentrations of Zn
and Si) mix upward into the zone with lower ZnSi ratios and concen-
trations the only way to maintain lower ratios in this zone is for dis-
solved Zn to be preferentially removed relative to silicate from the
waters as they mix upward
Areas in the southern Indian Ocean exhibiting variable ZnSi ra-tios hence de-coupling appeared to be more from a result of de-
creased atmospheric Zn inputs or more effective surface removal of
essential metals such as Zn and Fe by primary productivity Our
data support the conclusion that dissolved Zn is actively incorporated
by phytoplankton in the upper water column resulting in very low
dissolved Zn concentrations in the upper 200 m Also since Zn is
Zn (nM)Zn (nM)
0
Si (uM)
0
Si (uM)
00 05 10 15 20 25
0 5 10 15 20 25 30
00 02 04 06 08 10 12 14
0 5 10 15 20
200Zn (nM)
Si (uM)200
Zn (nM)
Si (uM)
d e p t h ( m ) 400
600 d e p t h ( m ) 400
600
800800
10001000
BA
Fig 6 Typical pro1047297les for total dissolved zinc (o) and silicate (x) Station pro1047297les presented are station 120 (A) and station 166 (B)
Fig 7 Total dissolved zinc (top) and silicate (bottom) concentrations for the entire CLIVAR I5 transect Both zonal sections were produced with Ocean Data View (Schlitzer 2011)
The displayed dissolved Si concentrations were collected via the main rosette during CLIVAR I5 Dissolved Si concentrations in the upper 1000 m using the main rosette were
essentially identical to dissolved Si samples collected from the ldquo
Trace Metalsrdquo
rosette
74 KJ Gosnell et al Marine Chemistry 132ndash133 (2012) 68ndash76
8112019 2012 - Fluorometric Detection of Total Dissolved Zinc in the Southern Indian Ocean
httpslidepdfcomreaderfull2012-fluorometric-detection-of-total-dissolved-zinc-in-the-southern-indian 89
associated with organic matter that is less easily remineralised
(Collier and Edmond 1984) then silicate is more effectively recycled
in the upper water column when compared to Zn Hence a more con-
sistent supply of dissolved Si than dissolved Zn is available to some
regions and the Zn to Si cycle can be notably decoupled
Below this zone of low ZnSi ratios the values become very uni-
form (005ndash0075 nM μ M) across the entire section suggesting that
there was no signi1047297cant decoupling of the ZnSi relationship during
deep regeneration
33 Biological association with zinc and silicate
Differences between the mechanisms of Zn intercellular incorpo-
ration and Zn absorbed to the outside of diatoms are still not entirely
resolved It has been reported that Zn can be adsorbed onto diatom
shells and frustules (Sunda and Huntsman 1992) however if opal in-
corporation of Zn was purely a passive adsorption process then it
would be expected that other trace metals would also be incorporat-
ed into the opal structure via the same processes As other biologically
essential metals such as Fe and Mn do not follow the same reminera-lization trends as Si then simple passive adsorption of metals is un-
likely the only source of the ZnSi association
The relationship between ZnSi implies that Zn is more likely in-
corporated into the opal structure through an internal cellular origin
rather than an external adsorption source (Ellwood and Hunter
1999) Laboratory culture experiments performed by Ellwood and
Hunter (1999) using Thalassiosira pseudonana indicated that zinc in-
corporation into the opal structure was directly related to amounts
of dissolved Zn(II) as the ZnSi ratio in the frustules increased with
greater Zn(II) concentrations However Zn incorporation into opal
still represented only 1ndash3 of the total Zn uptake and the amount
of Zn incorporated into biogenic opal was less than expected based
on the dissolved ZnSi relationship reported in the water column
Ellwood and Hunter (1999) did not report metals other than Zn and
Fe to be present in the opal structure for diatoms grown in culture
Species of phytoplankton will have various responses to organical-
ly complexed Zn Lohan et al (2005) found that the assemblage and
speciation of Zn-binding ligands experienced considerably changeover an 8 day bottle incubation experiment in the subarctic Paci1047297c
Thus the production and destruction of ligands produced by different
phytoplankton and bacteria should in1047298uence Zn uptakerates and per-
haps exert control on phytoplankton productivity and community
structure Unfortunately phytoplankton community structure was
not measured or assessed during our study therefore we are unable
to directly correlate zinc to phytoplankton biomass
Though phytoplankton effects were not investigated during I5 the
measured ZnSi relationship could provide theoretical evidence that
the phytoplankton community was in1047298uenced by limiting Zn concen-
trations De La Rocha et al (2000) reported that laboratory cultures of
diatoms would increase Si concentrationsin their shellswhen Zn con-
centrations were limiting Depleted Zn levels would result in thicker
heavier diatom shells as the Si built up Theoretically when these or-
ganisms die and sink the Si tests would re-dissolve back into the wa-
ters releasing enriched Si concentrations As a result subsurface
water measurements would contain enriched Si in comparison to Zn
concentrations Ratios of ZnSi for the subsurface western 23 section
of the I5 transect contained enriched dissolved Si and slightly deplet-
ed dissolved Zn concentrations resulting in signi1047297cantly lower ratios
than the rest of the transect (ZnSib005 nMμ M) This patch was spa-
tial enough to indicate that these ratios could be a result of undi-
sclosed biogeochemistry interactions Hypothetically the ratio
values were an indication of depleted surface concentrations of Zn
in1047298uencing the Si concentrations of the diatom shells However as
no in situ phytoplankton investigation was preformed this result
could not be con1047297rmed for this study Since these are the 1047297rst total
dissolved Zn values measured for the southern Indian Ocean further
work is needed to determine the in situ mechanisms controlling theZnSi relationships for this ocean region
4 Conclusion
This work may be the 1047297rst effort to utilize on a large scale the dis-
solved Zn FIA method published by Nowicki et al (1994) many years
ago The opportunity to participate on the CLIVAR I5 cruise enabled
us to collect and analyze nearly 500 discrete water samples for dis-
solved Zn from the southern Indian Ocean where no dissolved Zn
Fig 8 Individual values for Zn vs Si for the entire CLIVAR I5 transect Least squares
linear regression yields a slope of 0059 (plusmn0003)
Fig 9 ZnSi ratios from the CLIVAR I5 transect created with Ocean Data View (Schlitzer 2011) Higher ratios off the Australian coast may re1047298ect natural or anthropogenic terrestrial
input since the higher ratios are caused by elevated Zn concentrations
75KJ Gosnell et al Marine Chemistry 132ndash133 (2012) 68ndash76
8112019 2012 - Fluorometric Detection of Total Dissolved Zinc in the Southern Indian Ocean
httpslidepdfcomreaderfull2012-fluorometric-detection-of-total-dissolved-zinc-in-the-southern-indian 99
measurements had previously been reported We followed strict pro-
tocols during sample collection processing and analysis to minimize
contamination and overall the dissolved Zn data set appears oceano-
graphically consistent and credible These measurements helped to
establisha ratio of 0059plusmn 0003 forZnSi(nMμ M) in thesouthernIn-
dian Ocean In combination with Morley et al (1993) and numerous
studies reporting Zn concentrations for the Paci1047297c (Bruland et al
1978 Lohan et al 2002 Martin and Gordon 1988) and Atlantic
(Ellwood and Van den Berg 2000) the database of dissolved Zn isexpanding for the worlds oceans
Despite the overall very strong correlation between dissolved Zn
and Si Lohan et al (2002) suggested that variations in the ZnSi ratios
could allow one to detect a decoupling of Zn and Si biogeochemical
cycles in the upper ocean In our study area elevated ZnSi ratios in
surface waters and coastal areas were generally due to higher Zn con-
centrations while variations in the ZnSi ratios from 100 to 800 m
were associated more with minor variations in the silicate concentra-
tions Whether these variations are due to in-situ decoupling of the
Zn and Si cycles biological in1047298uences or whether they re1047298ect hori-
zontal intrusion of watermasses with different ldquopre-formedrdquo ZnSi ra-
tios remains to be determined
The very low total dissolved Zn concentrations we found in the
photic zone along the CLIVAR I5 transect (b20 pM) would correspond
to bioavailable Znprime concentrations approaching 1 pM if the strong Zn-
binding ligand concentrations are similar in this region to those
reported by Bruland (1989) for the north Paci1047297c The extremely oligo-
trophic conditions and particularly low levels of natural and anthro-
pogenic atmospheric input one 1047297nds across the I5 subtropical gyre
transect represents an intriguing opportunity to test theories regard-
ing macro and micro nutrient co-limitation The macro nutrients and
micro nutrient trace metals have been stripped from the upper water
column to their detection limits and the anti-cyclonic circulation
keeps the isopycnal surfaces depressed nearly eliminating any up-
welling along the central portion of the transect Ideally these mea-
sured dissolved Zn concentrations reported for the region could
provide a starting point from which future projects related to Zn bio-
availability and Zn limitations in phytoplankton growth and produc-
tivity could be established
Acknowledgments
We would like to thank all of the trace metal scientists who aided
with this research whether it was by helping collect samples or coax-
ing me away from 1047297ghting with the system and throwing it over-
board namely Chris Measures Mariko Hatta Maxime Grand
William Hiscock and Peter Morton We would also like to thank the
chief scientists for the GEOTRACES 2008 and CLIVAR I5 2009 cruises
Greg Cutter and Jim Swift Additionally a lot of gratitude goes to the
captains and crews for both the RV Knorr and RV Revelle Because
of all their hard work and dedication this research was possible
and the long cruises were more pleasure than pain This research
was supported by NSF-OCE 0649639
References
Anderson MA Morel FM Guillard RRL 1978 Growth limitation of a coastal dia-tom by low zinc ion activity Nature 276 70ndash71
Badger MR Price GD 1994 The role of carbonic anhydrase in photosynthesis AnnuRev Plant Physiol Plant Mol Biol 45 369ndash392
Brand LE Sunda WG Guillard RRL 1983 Limitation of marine-phytoplankton re-productive rates by zinc manganese and iron Limnol Oceanogr 28 1182 ndash1198
Bruland KW 1980 Oceanographic distributions of cadmium zinc nickel and copperin the North Paci1047297c Earth Planet Sci Lett 47 176ndash198
Bruland KW 1989 Complexation of zinc by natural organic ligands in the centralNorth Paci1047297c Limnol Oceanogr 37 269ndash285
Bruland KW Franks RP 1983 Trace elements in seawater Chemical Oceanographyvol 8 Academic Press London pp 157ndash215
Bruland KW Franks RP Knauer GA Martin JH 1979 Sampling and analyticalmethods for the determination of copper cadmium zinc and nickel at thenanogram per liter level in sea water Anal Chem Acta 105 233ndash245
Bruland KW Knauer GA Martin JH 1978 Zinc in north-east Paci1047297c waters Nature271 741ndash743Bruland KW Orians KJ Cowen JP 1994 Reactive trace metals in the strati1047297ed central
North Paci1047297c Geochim Cosmochim Acta 58 3171ndash3182Coale KH 1991 Effects of iron manganese copper and zinc enrichments on produc-
tivity and biomass in the subarctic Paci1047297c Limnol Oceanogr 36 1851ndash1864Coale KH Want X Tanner SJ Johnson KS 2003 Phytoplankton growth and bio-
logical response to iron and zinc addition in the Ross Sea and Antarctic Circumpo-lar Current along 170degW Deep-Sea Res Part II 50 635ndash653
Collier R Edmond J 1984 The trace element geochemistry of marine biogenicparticulatematter Prog Oceanogr 13 113ndash199
Crawford DW Lipsen MSPurdie DA Lohan MCStatham PJWhitney FAPutland JNJohnson WKSutherland N Peterson TD Harrison PJ Wong CS 2003In1047298u-ence of Zinc andiron enrichments on phytoplankton growthin thenortheastern Sub-arctic Paci1047297c Limnol Oceanogr 48 1583ndash1600
De La Rocha CL Hutchins DA Brzezinski MA Zhang Y 2000 Effects of iron andzinc de1047297ciency on elemental composition and silica production by diatoms MarEcol Prog Ser 195 71ndash79
Ellwood MJ Hunter KA 1999 Determination of the ZnSi ratio in diatom opal a
method for the separation cleaning and dissolution of diatoms Mar Chem 66149ndash160
Ellwood MJ Van den Berg CMG 2000 Zinc speciation in the Northeastern AtlanticOcean Mar Chem 68 295ndash306
Ibrahim M Shaban S Ichikawa K 2008 A promising structural zinc enzyme modelfor CO2 1047297xation and calci1047297cation Tetrahedron Lett 49 7303ndash7306
Johnson KS Boyle E Bruland K Coale K Measures C Moffett J Aguilarislas ABarbeau K Bergquist B Bowie A Buck K Cai Y Chase Z Cullen J Doi TElrod V Fitzwater S Gordon M King A Laan P Laglera-Baquer L LandingW Lohan M Mendez J Milne A Obata H Ossiander L Plant J Sarthou GSedwick P Smith GJ Sohst B Tanner S Van Den Berg S Wu J 2007 Devel-oping standards for dissolved iron in seawater Eos 88 (11) 131ndash132
Koch-Larrouy A Morrow R Penduff T Juza M 2010 Origin and mechanism of Sub-antarctic Mode Water formation and transformation in the Southern Indian OceanOcean Dyn 60 563ndash583
Landing WM Haraldsson C Paxeus N 1986 Vinyl polymer agglomerate based transi-tion metal cation chelating ion-exchange resin containing the 8-Hydroxyquinolinefunctional group Anal Chem 58 3031ndash3035
Lohan MC Statham PJ Crawford DW 2002 Total dissolved zinc in the upper watercolumn of the subarctic North East Paci1047297c Deep-Sea Res II 49 5793ndash5808
Lohan MC Crawford DW Purdie DA Statham PJ 2005 Iron andzinc enrichmentsin the northeastern subarctic Paci1047297c ligand production and zinc availability in re-sponse to phytoplankton growth Limnol Oceanogr 50 1427ndash1437
Martin JH Gordon RM 1988 Northeast Paci1047297c iron distributions in relation tophytoplankton productivity Deep-Sea Res 35 177ndash196
Martin JH Gordon RM Fitzwater S Broenkow WW 1989 VERTEX phytoplankton iron studies in the Gulf of Alaska Deep-Sea Res 36 649 ndash680
Measures CI Landing WM Brown MT Buck CS 2008 A commercially availablerosette system for trace metal-clean sampling Limnol Oceanogr Methods 6384ndash394
Morel FMM Reinfelder JR Roberts SB Chamberlain CP Lee JG Yee D 1994Zinc and carbon co-limitation of marine-phytoplankton Nature 369 740ndash742
Morley NH Statham PJ Burton JD 1993 Dissolved trace metals in the southwesternIndian Ocean Deep-Sea Res 30 (5) 1043ndash1062
Nowicki J Johnson K Coale K Elrod V Lieberman S 1994 Determination of zincinseawater using 1047298ow injection analysis with 1047298uorometric detection Anal Chem 662732ndash2738
Schlitzer R 2011 Ocean Data View 4 httpodvawide2011Schulz KG Zondervan I Gerringa LJ Timmermans KR Veldhuis MJ Riebesell U
2004 Effects of trace metal availability on coccolithophorid calci1047297cation Nature403 673ndash676
Sunda WG Huntsman SA 1992 Feedback interactions between zinc and phyto-plankton in seawater Limnol Oceanogr 37 25ndash40
Xu Y Feng L Jeffrey P Shi Y Morel FMM 2008 Structure and metal exchange inthe cadmium carbonic anhydrase of marine diatoms Nature 452 56ndash62
76 KJ Gosnell et al Marine Chemistry 132ndash133 (2012) 68ndash76
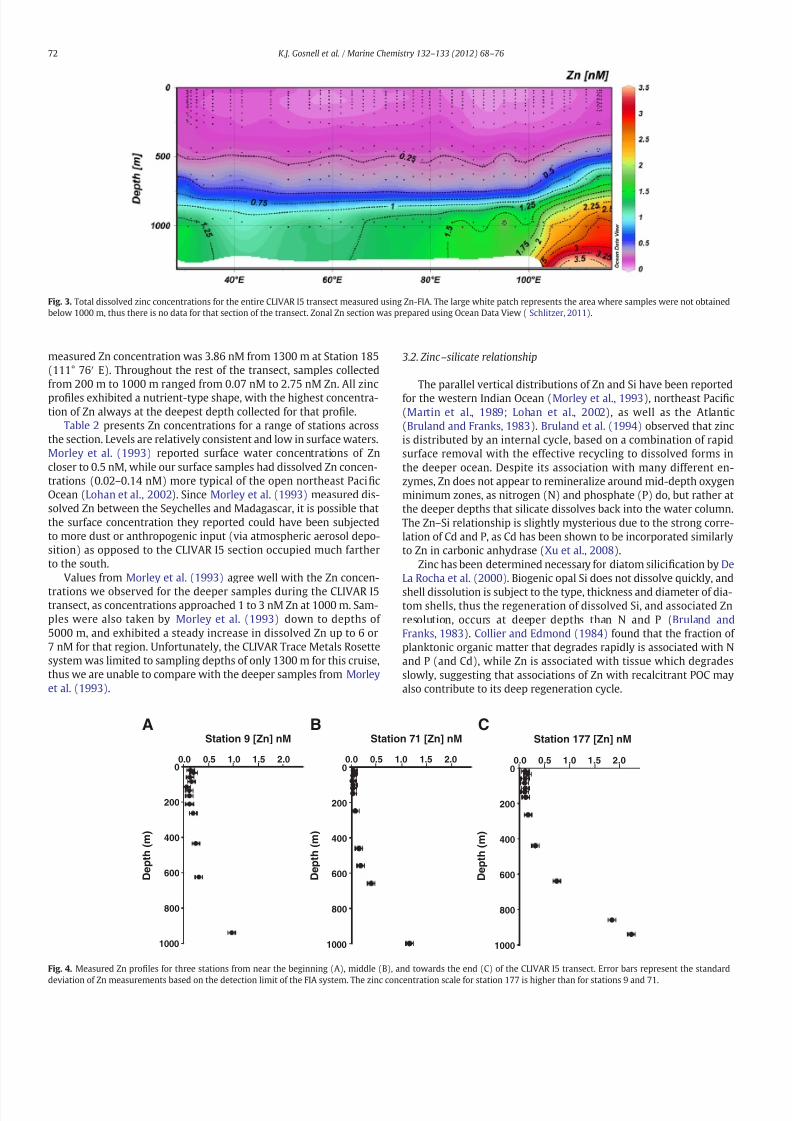
8112019 2012 - Fluorometric Detection of Total Dissolved Zinc in the Southern Indian Ocean
httpslidepdfcomreaderfull2012-fluorometric-detection-of-total-dissolved-zinc-in-the-southern-indian 69
Typical pro1047297les collected on the I5 transect for Zn and Si repre-
sented by stations 166 and 120 are displayed in Fig 6 Silicate and
zinc are very strongly correlated at these stations The strong linear
relationship between dissolved Zn and Si 1047297rst reported by Bruland
et al (1978) has led to speculation that dissolved Zn might be a lim-
iting nutrient in HNLC areas (Coale 1991) However there is limited
data investigating ZnndashSi relationships in surface waters as Zn can be
severely depleted in surface waters (b005 nM) thus posing a serious
sampling and analytical challenge
Sections of dissolved Zn and Si also match up beautifully through-
out the southern Indian Ocean (Fig 7) Both Zn and Si sections were
created using Ocean Data View (Schlitzer 2011) Surface waters
from stations 124ndash179 (84deg 37prime E to 108deg 4prime E) had the lowest Zn
and Si concentrations of the entire transect Concentrations of both
Zn and Si increased dramatically below 800 m
The highest concentrations for both nutrient-like elements were
located at 1300 m along the coast of Australia (102deg 99prime E to 114deg
84prime E) These higher Zn concentrations are more of a result of thephysics of the subtropical southern gyre circulation rather than en-
richment from benthic sources on the continental slope The isopyc-
nal surfaces begin to shoal approaching the shelf bringing the
deeper water with higher concentrations of Zn and Si up to shallower
depths This contrasts with the situation in the central gyre where
downwelling pushes Zn depleted water to deeper depths
As we focused our study on the biogeochemical cycling of trace el-
ements in the upper water column the majority of our samples were
collected at depths shallower than 300 m with very low Zn concen-
trations This in turn produces an unbalanced distribution of data in
a plot of dissolved Zn versus Si The linear correlation between Zn
and Si for all measured stations is displayed in Fig 8 The overall re-
gression slope is 0059plusmn 0003 nM Zn per μ M Si (nMμ M)
(R 2=09187) The regression slope found for the southern Indian
Ocean presented here is consistent with the ratio of 006 nM Zn per
μ M silicate reported for the Paci1047297c Ocean by Bruland (1980) The lin-
ear relationship between Zn and Si was much stronger for this region
of the southern Indian Ocean (30 to 115deg E 30 to 35deg S) than the rel-
atively more scattered relationship found in the southwestern IndianOcean (56deg E 7 to 27deg S) by Morley et al (1993)
The ZnSi ratios for the entire I5 transect were produced with
Ocean Data View (Schlitzer 2011) and are displayed in Fig 9 Elevat-
ed ZnSi ratios (gt01 nM μ M) were observed in the upper 250 m at
coastal stations off western Australia perhaps as a result of benthic
regeneration on the shelf or from anthropogenic Zn enrichment
Two dissolved ZnSi ldquohot spotsrdquo seen in surface waters far offshore
are associated with extremely low Zn and Si concentrations thus
the slightest change in concentration for either element will yield a
large difference in the ratio These two ZnSi ldquohot spotsrdquo are due to
very slight Zn enrichment via atmospheric input or ship contamina-
tion The ZnSi ratios for surface waters across the rest of the section
are between 005 and 0075 nM μ M consistent with the 006 nM μ M
ratio reported for the northeastern Paci1047297c (Bruland 1980) and with
data shown in Fig 8
Decoupling of Zn and Si was observed for some stations though
samples in the middle of the I5 transect did not appear to be
signi1047297cantly decoupled compared to coastal samples possibly be-
cause upwelling is not prominent for this study region Signi1047297cant
decoupling of the ZnSi relationship was observed at offshore stations
in the Paci1047297c by Lohan et al (2002) however coastal stations in that
study region exhibited elevated dissolved Zn concentrations from re-
gional upwelling and enhanced coastal Zn input while at the same
time containing lower dissolved Si concentrations due to signi1047297cant
diatom productivity
The broad parcel of lower ZnSi ratios between 100 and 400 m for
the western 23 of the section are due to dissolved silicate enrichment
in these waters This zone lies between the depth ranges of the sea-
sonal and the permanent thermoclines but does not appear to be as-sociated with the Indian Ocean Subtropical Mode Water or the
Subantarctic Mode Water as reviewed by Koch-Larrouy et al
(2010) Thus it does not appear to be the result of water mass trans-
port from an area with unusually low ldquopre-formedrdquo ZnSi ratios If this
zone of low ZnSi ratios is not due to horizontal water mass move-
ment and if it is a steady-state feature then it may be re1047298ecting a
two-fold decoupling of the ZnSi relationship As waters from the sur-
face mixed layer (with high ZnSi ratios but very low concentrations
of Zn and Si) mix downward into waters with lower ZnSi ratios but
higher concentrations slightly preferential regeneration of silicate
[Zn] (nM)
0 1 2 3 40
200
400
Station 185Station 179
600
D e p t h
( m )
800
1000
1200
1400
Fig 5 Dissolved Zn pro1047297les for stations where slightly deeper samples were collected
showing that dissolved Zn continues to increase smoothly at intermediate depths
Table 2
Zinc concentrations (nM) from several stations across the CLIVAR I5 transect Concentrations were relatively consistent throughout the transect before beginning to increase at
depth towards Australia
Depth (m) Station 9
31deg 2primeE
31deg 6primeS
Station 30
39deg 3primeE
32deg 9primeS
Station 71
57deg 5primeE
34deg 0primeS
Station 91
68deg 5primeE
33deg 9primeS
Station 124
84deg 4primeE
31deg 2primeS
Station 145
94deg 9primeE
34deg 0primeS
Station 177
107deg 2primeE
31deg 3primeS
20 014 012 004 004 002 005 011
35 020 022 004 011 016 009 016
60 013 008 003 010 014 008 011
85 016 022 002 004 003 007 010
115 006 022 003 009 007 008 012
135 012 016 003 004 006 012 010
165 012 020 003 012 018 007 012
265 012 015 007 009 011 010 017
440 019 017 015 014 011 021 032
650 025 027 018 023 032 066 074
860 031 051 039 026 015 053 185
950 097 141 116 129 162 240 224
73KJ Gosnell et al Marine Chemistry 132ndash133 (2012) 68ndash76
8112019 2012 - Fluorometric Detection of Total Dissolved Zinc in the Southern Indian Ocean
httpslidepdfcomreaderfull2012-fluorometric-detection-of-total-dissolved-zinc-in-the-southern-indian 79
relative to Zn would yield lower ZnSi ratios and higher concentra-tions of both elements On the other hand as waters from the main
thermocline (with high ZnSi ratios and higher concentrations of Zn
and Si) mix upward into the zone with lower ZnSi ratios and concen-
trations the only way to maintain lower ratios in this zone is for dis-
solved Zn to be preferentially removed relative to silicate from the
waters as they mix upward
Areas in the southern Indian Ocean exhibiting variable ZnSi ra-tios hence de-coupling appeared to be more from a result of de-
creased atmospheric Zn inputs or more effective surface removal of
essential metals such as Zn and Fe by primary productivity Our
data support the conclusion that dissolved Zn is actively incorporated
by phytoplankton in the upper water column resulting in very low
dissolved Zn concentrations in the upper 200 m Also since Zn is
Zn (nM)Zn (nM)
0
Si (uM)
0
Si (uM)
00 05 10 15 20 25
0 5 10 15 20 25 30
00 02 04 06 08 10 12 14
0 5 10 15 20
200Zn (nM)
Si (uM)200
Zn (nM)
Si (uM)
d e p t h ( m ) 400
600 d e p t h ( m ) 400
600
800800
10001000
BA
Fig 6 Typical pro1047297les for total dissolved zinc (o) and silicate (x) Station pro1047297les presented are station 120 (A) and station 166 (B)
Fig 7 Total dissolved zinc (top) and silicate (bottom) concentrations for the entire CLIVAR I5 transect Both zonal sections were produced with Ocean Data View (Schlitzer 2011)
The displayed dissolved Si concentrations were collected via the main rosette during CLIVAR I5 Dissolved Si concentrations in the upper 1000 m using the main rosette were
essentially identical to dissolved Si samples collected from the ldquo
Trace Metalsrdquo
rosette
74 KJ Gosnell et al Marine Chemistry 132ndash133 (2012) 68ndash76
8112019 2012 - Fluorometric Detection of Total Dissolved Zinc in the Southern Indian Ocean
httpslidepdfcomreaderfull2012-fluorometric-detection-of-total-dissolved-zinc-in-the-southern-indian 89
associated with organic matter that is less easily remineralised
(Collier and Edmond 1984) then silicate is more effectively recycled
in the upper water column when compared to Zn Hence a more con-
sistent supply of dissolved Si than dissolved Zn is available to some
regions and the Zn to Si cycle can be notably decoupled
Below this zone of low ZnSi ratios the values become very uni-
form (005ndash0075 nM μ M) across the entire section suggesting that
there was no signi1047297cant decoupling of the ZnSi relationship during
deep regeneration
33 Biological association with zinc and silicate
Differences between the mechanisms of Zn intercellular incorpo-
ration and Zn absorbed to the outside of diatoms are still not entirely
resolved It has been reported that Zn can be adsorbed onto diatom
shells and frustules (Sunda and Huntsman 1992) however if opal in-
corporation of Zn was purely a passive adsorption process then it
would be expected that other trace metals would also be incorporat-
ed into the opal structure via the same processes As other biologically
essential metals such as Fe and Mn do not follow the same reminera-lization trends as Si then simple passive adsorption of metals is un-
likely the only source of the ZnSi association
The relationship between ZnSi implies that Zn is more likely in-
corporated into the opal structure through an internal cellular origin
rather than an external adsorption source (Ellwood and Hunter
1999) Laboratory culture experiments performed by Ellwood and
Hunter (1999) using Thalassiosira pseudonana indicated that zinc in-
corporation into the opal structure was directly related to amounts
of dissolved Zn(II) as the ZnSi ratio in the frustules increased with
greater Zn(II) concentrations However Zn incorporation into opal
still represented only 1ndash3 of the total Zn uptake and the amount
of Zn incorporated into biogenic opal was less than expected based
on the dissolved ZnSi relationship reported in the water column
Ellwood and Hunter (1999) did not report metals other than Zn and
Fe to be present in the opal structure for diatoms grown in culture
Species of phytoplankton will have various responses to organical-
ly complexed Zn Lohan et al (2005) found that the assemblage and
speciation of Zn-binding ligands experienced considerably changeover an 8 day bottle incubation experiment in the subarctic Paci1047297c
Thus the production and destruction of ligands produced by different
phytoplankton and bacteria should in1047298uence Zn uptakerates and per-
haps exert control on phytoplankton productivity and community
structure Unfortunately phytoplankton community structure was
not measured or assessed during our study therefore we are unable
to directly correlate zinc to phytoplankton biomass
Though phytoplankton effects were not investigated during I5 the
measured ZnSi relationship could provide theoretical evidence that
the phytoplankton community was in1047298uenced by limiting Zn concen-
trations De La Rocha et al (2000) reported that laboratory cultures of
diatoms would increase Si concentrationsin their shellswhen Zn con-
centrations were limiting Depleted Zn levels would result in thicker
heavier diatom shells as the Si built up Theoretically when these or-
ganisms die and sink the Si tests would re-dissolve back into the wa-
ters releasing enriched Si concentrations As a result subsurface
water measurements would contain enriched Si in comparison to Zn
concentrations Ratios of ZnSi for the subsurface western 23 section
of the I5 transect contained enriched dissolved Si and slightly deplet-
ed dissolved Zn concentrations resulting in signi1047297cantly lower ratios
than the rest of the transect (ZnSib005 nMμ M) This patch was spa-
tial enough to indicate that these ratios could be a result of undi-
sclosed biogeochemistry interactions Hypothetically the ratio
values were an indication of depleted surface concentrations of Zn
in1047298uencing the Si concentrations of the diatom shells However as
no in situ phytoplankton investigation was preformed this result
could not be con1047297rmed for this study Since these are the 1047297rst total
dissolved Zn values measured for the southern Indian Ocean further
work is needed to determine the in situ mechanisms controlling theZnSi relationships for this ocean region
4 Conclusion
This work may be the 1047297rst effort to utilize on a large scale the dis-
solved Zn FIA method published by Nowicki et al (1994) many years
ago The opportunity to participate on the CLIVAR I5 cruise enabled
us to collect and analyze nearly 500 discrete water samples for dis-
solved Zn from the southern Indian Ocean where no dissolved Zn
Fig 8 Individual values for Zn vs Si for the entire CLIVAR I5 transect Least squares
linear regression yields a slope of 0059 (plusmn0003)
Fig 9 ZnSi ratios from the CLIVAR I5 transect created with Ocean Data View (Schlitzer 2011) Higher ratios off the Australian coast may re1047298ect natural or anthropogenic terrestrial
input since the higher ratios are caused by elevated Zn concentrations
75KJ Gosnell et al Marine Chemistry 132ndash133 (2012) 68ndash76
8112019 2012 - Fluorometric Detection of Total Dissolved Zinc in the Southern Indian Ocean
httpslidepdfcomreaderfull2012-fluorometric-detection-of-total-dissolved-zinc-in-the-southern-indian 99
measurements had previously been reported We followed strict pro-
tocols during sample collection processing and analysis to minimize
contamination and overall the dissolved Zn data set appears oceano-
graphically consistent and credible These measurements helped to
establisha ratio of 0059plusmn 0003 forZnSi(nMμ M) in thesouthernIn-
dian Ocean In combination with Morley et al (1993) and numerous
studies reporting Zn concentrations for the Paci1047297c (Bruland et al
1978 Lohan et al 2002 Martin and Gordon 1988) and Atlantic
(Ellwood and Van den Berg 2000) the database of dissolved Zn isexpanding for the worlds oceans
Despite the overall very strong correlation between dissolved Zn
and Si Lohan et al (2002) suggested that variations in the ZnSi ratios
could allow one to detect a decoupling of Zn and Si biogeochemical
cycles in the upper ocean In our study area elevated ZnSi ratios in
surface waters and coastal areas were generally due to higher Zn con-
centrations while variations in the ZnSi ratios from 100 to 800 m
were associated more with minor variations in the silicate concentra-
tions Whether these variations are due to in-situ decoupling of the
Zn and Si cycles biological in1047298uences or whether they re1047298ect hori-
zontal intrusion of watermasses with different ldquopre-formedrdquo ZnSi ra-
tios remains to be determined
The very low total dissolved Zn concentrations we found in the
photic zone along the CLIVAR I5 transect (b20 pM) would correspond
to bioavailable Znprime concentrations approaching 1 pM if the strong Zn-
binding ligand concentrations are similar in this region to those
reported by Bruland (1989) for the north Paci1047297c The extremely oligo-
trophic conditions and particularly low levels of natural and anthro-
pogenic atmospheric input one 1047297nds across the I5 subtropical gyre
transect represents an intriguing opportunity to test theories regard-
ing macro and micro nutrient co-limitation The macro nutrients and
micro nutrient trace metals have been stripped from the upper water
column to their detection limits and the anti-cyclonic circulation
keeps the isopycnal surfaces depressed nearly eliminating any up-
welling along the central portion of the transect Ideally these mea-
sured dissolved Zn concentrations reported for the region could
provide a starting point from which future projects related to Zn bio-
availability and Zn limitations in phytoplankton growth and produc-
tivity could be established
Acknowledgments
We would like to thank all of the trace metal scientists who aided
with this research whether it was by helping collect samples or coax-
ing me away from 1047297ghting with the system and throwing it over-
board namely Chris Measures Mariko Hatta Maxime Grand
William Hiscock and Peter Morton We would also like to thank the
chief scientists for the GEOTRACES 2008 and CLIVAR I5 2009 cruises
Greg Cutter and Jim Swift Additionally a lot of gratitude goes to the
captains and crews for both the RV Knorr and RV Revelle Because
of all their hard work and dedication this research was possible
and the long cruises were more pleasure than pain This research
was supported by NSF-OCE 0649639
References
Anderson MA Morel FM Guillard RRL 1978 Growth limitation of a coastal dia-tom by low zinc ion activity Nature 276 70ndash71
Badger MR Price GD 1994 The role of carbonic anhydrase in photosynthesis AnnuRev Plant Physiol Plant Mol Biol 45 369ndash392
Brand LE Sunda WG Guillard RRL 1983 Limitation of marine-phytoplankton re-productive rates by zinc manganese and iron Limnol Oceanogr 28 1182 ndash1198
Bruland KW 1980 Oceanographic distributions of cadmium zinc nickel and copperin the North Paci1047297c Earth Planet Sci Lett 47 176ndash198
Bruland KW 1989 Complexation of zinc by natural organic ligands in the centralNorth Paci1047297c Limnol Oceanogr 37 269ndash285
Bruland KW Franks RP 1983 Trace elements in seawater Chemical Oceanographyvol 8 Academic Press London pp 157ndash215
Bruland KW Franks RP Knauer GA Martin JH 1979 Sampling and analyticalmethods for the determination of copper cadmium zinc and nickel at thenanogram per liter level in sea water Anal Chem Acta 105 233ndash245
Bruland KW Knauer GA Martin JH 1978 Zinc in north-east Paci1047297c waters Nature271 741ndash743Bruland KW Orians KJ Cowen JP 1994 Reactive trace metals in the strati1047297ed central
North Paci1047297c Geochim Cosmochim Acta 58 3171ndash3182Coale KH 1991 Effects of iron manganese copper and zinc enrichments on produc-
tivity and biomass in the subarctic Paci1047297c Limnol Oceanogr 36 1851ndash1864Coale KH Want X Tanner SJ Johnson KS 2003 Phytoplankton growth and bio-
logical response to iron and zinc addition in the Ross Sea and Antarctic Circumpo-lar Current along 170degW Deep-Sea Res Part II 50 635ndash653
Collier R Edmond J 1984 The trace element geochemistry of marine biogenicparticulatematter Prog Oceanogr 13 113ndash199
Crawford DW Lipsen MSPurdie DA Lohan MCStatham PJWhitney FAPutland JNJohnson WKSutherland N Peterson TD Harrison PJ Wong CS 2003In1047298u-ence of Zinc andiron enrichments on phytoplankton growthin thenortheastern Sub-arctic Paci1047297c Limnol Oceanogr 48 1583ndash1600
De La Rocha CL Hutchins DA Brzezinski MA Zhang Y 2000 Effects of iron andzinc de1047297ciency on elemental composition and silica production by diatoms MarEcol Prog Ser 195 71ndash79
Ellwood MJ Hunter KA 1999 Determination of the ZnSi ratio in diatom opal a
method for the separation cleaning and dissolution of diatoms Mar Chem 66149ndash160
Ellwood MJ Van den Berg CMG 2000 Zinc speciation in the Northeastern AtlanticOcean Mar Chem 68 295ndash306
Ibrahim M Shaban S Ichikawa K 2008 A promising structural zinc enzyme modelfor CO2 1047297xation and calci1047297cation Tetrahedron Lett 49 7303ndash7306
Johnson KS Boyle E Bruland K Coale K Measures C Moffett J Aguilarislas ABarbeau K Bergquist B Bowie A Buck K Cai Y Chase Z Cullen J Doi TElrod V Fitzwater S Gordon M King A Laan P Laglera-Baquer L LandingW Lohan M Mendez J Milne A Obata H Ossiander L Plant J Sarthou GSedwick P Smith GJ Sohst B Tanner S Van Den Berg S Wu J 2007 Devel-oping standards for dissolved iron in seawater Eos 88 (11) 131ndash132
Koch-Larrouy A Morrow R Penduff T Juza M 2010 Origin and mechanism of Sub-antarctic Mode Water formation and transformation in the Southern Indian OceanOcean Dyn 60 563ndash583
Landing WM Haraldsson C Paxeus N 1986 Vinyl polymer agglomerate based transi-tion metal cation chelating ion-exchange resin containing the 8-Hydroxyquinolinefunctional group Anal Chem 58 3031ndash3035
Lohan MC Statham PJ Crawford DW 2002 Total dissolved zinc in the upper watercolumn of the subarctic North East Paci1047297c Deep-Sea Res II 49 5793ndash5808
Lohan MC Crawford DW Purdie DA Statham PJ 2005 Iron andzinc enrichmentsin the northeastern subarctic Paci1047297c ligand production and zinc availability in re-sponse to phytoplankton growth Limnol Oceanogr 50 1427ndash1437
Martin JH Gordon RM 1988 Northeast Paci1047297c iron distributions in relation tophytoplankton productivity Deep-Sea Res 35 177ndash196
Martin JH Gordon RM Fitzwater S Broenkow WW 1989 VERTEX phytoplankton iron studies in the Gulf of Alaska Deep-Sea Res 36 649 ndash680
Measures CI Landing WM Brown MT Buck CS 2008 A commercially availablerosette system for trace metal-clean sampling Limnol Oceanogr Methods 6384ndash394
Morel FMM Reinfelder JR Roberts SB Chamberlain CP Lee JG Yee D 1994Zinc and carbon co-limitation of marine-phytoplankton Nature 369 740ndash742
Morley NH Statham PJ Burton JD 1993 Dissolved trace metals in the southwesternIndian Ocean Deep-Sea Res 30 (5) 1043ndash1062
Nowicki J Johnson K Coale K Elrod V Lieberman S 1994 Determination of zincinseawater using 1047298ow injection analysis with 1047298uorometric detection Anal Chem 662732ndash2738
Schlitzer R 2011 Ocean Data View 4 httpodvawide2011Schulz KG Zondervan I Gerringa LJ Timmermans KR Veldhuis MJ Riebesell U
2004 Effects of trace metal availability on coccolithophorid calci1047297cation Nature403 673ndash676
Sunda WG Huntsman SA 1992 Feedback interactions between zinc and phyto-plankton in seawater Limnol Oceanogr 37 25ndash40
Xu Y Feng L Jeffrey P Shi Y Morel FMM 2008 Structure and metal exchange inthe cadmium carbonic anhydrase of marine diatoms Nature 452 56ndash62
76 KJ Gosnell et al Marine Chemistry 132ndash133 (2012) 68ndash76
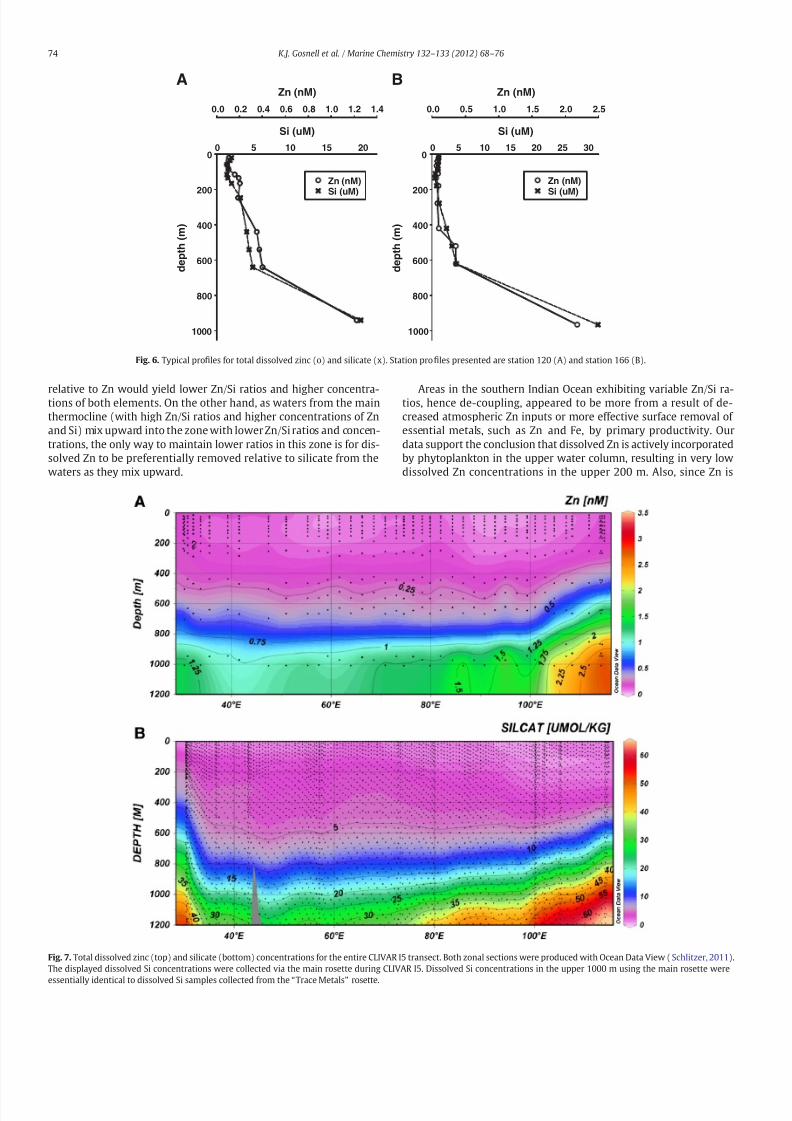
8112019 2012 - Fluorometric Detection of Total Dissolved Zinc in the Southern Indian Ocean
httpslidepdfcomreaderfull2012-fluorometric-detection-of-total-dissolved-zinc-in-the-southern-indian 89
associated with organic matter that is less easily remineralised
(Collier and Edmond 1984) then silicate is more effectively recycled
in the upper water column when compared to Zn Hence a more con-
sistent supply of dissolved Si than dissolved Zn is available to some
regions and the Zn to Si cycle can be notably decoupled
Below this zone of low ZnSi ratios the values become very uni-
form (005ndash0075 nM μ M) across the entire section suggesting that
there was no signi1047297cant decoupling of the ZnSi relationship during
deep regeneration
33 Biological association with zinc and silicate
Differences between the mechanisms of Zn intercellular incorpo-
ration and Zn absorbed to the outside of diatoms are still not entirely
resolved It has been reported that Zn can be adsorbed onto diatom
shells and frustules (Sunda and Huntsman 1992) however if opal in-
corporation of Zn was purely a passive adsorption process then it
would be expected that other trace metals would also be incorporat-
ed into the opal structure via the same processes As other biologically
essential metals such as Fe and Mn do not follow the same reminera-lization trends as Si then simple passive adsorption of metals is un-
likely the only source of the ZnSi association
The relationship between ZnSi implies that Zn is more likely in-
corporated into the opal structure through an internal cellular origin
rather than an external adsorption source (Ellwood and Hunter
1999) Laboratory culture experiments performed by Ellwood and
Hunter (1999) using Thalassiosira pseudonana indicated that zinc in-
corporation into the opal structure was directly related to amounts
of dissolved Zn(II) as the ZnSi ratio in the frustules increased with
greater Zn(II) concentrations However Zn incorporation into opal
still represented only 1ndash3 of the total Zn uptake and the amount
of Zn incorporated into biogenic opal was less than expected based
on the dissolved ZnSi relationship reported in the water column
Ellwood and Hunter (1999) did not report metals other than Zn and
Fe to be present in the opal structure for diatoms grown in culture
Species of phytoplankton will have various responses to organical-
ly complexed Zn Lohan et al (2005) found that the assemblage and
speciation of Zn-binding ligands experienced considerably changeover an 8 day bottle incubation experiment in the subarctic Paci1047297c
Thus the production and destruction of ligands produced by different
phytoplankton and bacteria should in1047298uence Zn uptakerates and per-
haps exert control on phytoplankton productivity and community
structure Unfortunately phytoplankton community structure was
not measured or assessed during our study therefore we are unable
to directly correlate zinc to phytoplankton biomass
Though phytoplankton effects were not investigated during I5 the
measured ZnSi relationship could provide theoretical evidence that
the phytoplankton community was in1047298uenced by limiting Zn concen-
trations De La Rocha et al (2000) reported that laboratory cultures of
diatoms would increase Si concentrationsin their shellswhen Zn con-
centrations were limiting Depleted Zn levels would result in thicker
heavier diatom shells as the Si built up Theoretically when these or-
ganisms die and sink the Si tests would re-dissolve back into the wa-
ters releasing enriched Si concentrations As a result subsurface
water measurements would contain enriched Si in comparison to Zn
concentrations Ratios of ZnSi for the subsurface western 23 section
of the I5 transect contained enriched dissolved Si and slightly deplet-
ed dissolved Zn concentrations resulting in signi1047297cantly lower ratios
than the rest of the transect (ZnSib005 nMμ M) This patch was spa-
tial enough to indicate that these ratios could be a result of undi-
sclosed biogeochemistry interactions Hypothetically the ratio
values were an indication of depleted surface concentrations of Zn
in1047298uencing the Si concentrations of the diatom shells However as
no in situ phytoplankton investigation was preformed this result
could not be con1047297rmed for this study Since these are the 1047297rst total
dissolved Zn values measured for the southern Indian Ocean further
work is needed to determine the in situ mechanisms controlling theZnSi relationships for this ocean region
4 Conclusion
This work may be the 1047297rst effort to utilize on a large scale the dis-
solved Zn FIA method published by Nowicki et al (1994) many years
ago The opportunity to participate on the CLIVAR I5 cruise enabled
us to collect and analyze nearly 500 discrete water samples for dis-
solved Zn from the southern Indian Ocean where no dissolved Zn
Fig 8 Individual values for Zn vs Si for the entire CLIVAR I5 transect Least squares
linear regression yields a slope of 0059 (plusmn0003)
Fig 9 ZnSi ratios from the CLIVAR I5 transect created with Ocean Data View (Schlitzer 2011) Higher ratios off the Australian coast may re1047298ect natural or anthropogenic terrestrial
input since the higher ratios are caused by elevated Zn concentrations
75KJ Gosnell et al Marine Chemistry 132ndash133 (2012) 68ndash76
8112019 2012 - Fluorometric Detection of Total Dissolved Zinc in the Southern Indian Ocean
httpslidepdfcomreaderfull2012-fluorometric-detection-of-total-dissolved-zinc-in-the-southern-indian 99
measurements had previously been reported We followed strict pro-
tocols during sample collection processing and analysis to minimize
contamination and overall the dissolved Zn data set appears oceano-
graphically consistent and credible These measurements helped to
establisha ratio of 0059plusmn 0003 forZnSi(nMμ M) in thesouthernIn-
dian Ocean In combination with Morley et al (1993) and numerous
studies reporting Zn concentrations for the Paci1047297c (Bruland et al
1978 Lohan et al 2002 Martin and Gordon 1988) and Atlantic
(Ellwood and Van den Berg 2000) the database of dissolved Zn isexpanding for the worlds oceans
Despite the overall very strong correlation between dissolved Zn
and Si Lohan et al (2002) suggested that variations in the ZnSi ratios
could allow one to detect a decoupling of Zn and Si biogeochemical
cycles in the upper ocean In our study area elevated ZnSi ratios in
surface waters and coastal areas were generally due to higher Zn con-
centrations while variations in the ZnSi ratios from 100 to 800 m
were associated more with minor variations in the silicate concentra-
tions Whether these variations are due to in-situ decoupling of the
Zn and Si cycles biological in1047298uences or whether they re1047298ect hori-
zontal intrusion of watermasses with different ldquopre-formedrdquo ZnSi ra-
tios remains to be determined
The very low total dissolved Zn concentrations we found in the
photic zone along the CLIVAR I5 transect (b20 pM) would correspond
to bioavailable Znprime concentrations approaching 1 pM if the strong Zn-
binding ligand concentrations are similar in this region to those
reported by Bruland (1989) for the north Paci1047297c The extremely oligo-
trophic conditions and particularly low levels of natural and anthro-
pogenic atmospheric input one 1047297nds across the I5 subtropical gyre
transect represents an intriguing opportunity to test theories regard-
ing macro and micro nutrient co-limitation The macro nutrients and
micro nutrient trace metals have been stripped from the upper water
column to their detection limits and the anti-cyclonic circulation
keeps the isopycnal surfaces depressed nearly eliminating any up-
welling along the central portion of the transect Ideally these mea-
sured dissolved Zn concentrations reported for the region could
provide a starting point from which future projects related to Zn bio-
availability and Zn limitations in phytoplankton growth and produc-
tivity could be established
Acknowledgments
We would like to thank all of the trace metal scientists who aided
with this research whether it was by helping collect samples or coax-
ing me away from 1047297ghting with the system and throwing it over-
board namely Chris Measures Mariko Hatta Maxime Grand
William Hiscock and Peter Morton We would also like to thank the
chief scientists for the GEOTRACES 2008 and CLIVAR I5 2009 cruises
Greg Cutter and Jim Swift Additionally a lot of gratitude goes to the
captains and crews for both the RV Knorr and RV Revelle Because
of all their hard work and dedication this research was possible
and the long cruises were more pleasure than pain This research
was supported by NSF-OCE 0649639
References
Anderson MA Morel FM Guillard RRL 1978 Growth limitation of a coastal dia-tom by low zinc ion activity Nature 276 70ndash71
Badger MR Price GD 1994 The role of carbonic anhydrase in photosynthesis AnnuRev Plant Physiol Plant Mol Biol 45 369ndash392
Brand LE Sunda WG Guillard RRL 1983 Limitation of marine-phytoplankton re-productive rates by zinc manganese and iron Limnol Oceanogr 28 1182 ndash1198
Bruland KW 1980 Oceanographic distributions of cadmium zinc nickel and copperin the North Paci1047297c Earth Planet Sci Lett 47 176ndash198
Bruland KW 1989 Complexation of zinc by natural organic ligands in the centralNorth Paci1047297c Limnol Oceanogr 37 269ndash285
Bruland KW Franks RP 1983 Trace elements in seawater Chemical Oceanographyvol 8 Academic Press London pp 157ndash215
Bruland KW Franks RP Knauer GA Martin JH 1979 Sampling and analyticalmethods for the determination of copper cadmium zinc and nickel at thenanogram per liter level in sea water Anal Chem Acta 105 233ndash245
Bruland KW Knauer GA Martin JH 1978 Zinc in north-east Paci1047297c waters Nature271 741ndash743Bruland KW Orians KJ Cowen JP 1994 Reactive trace metals in the strati1047297ed central
North Paci1047297c Geochim Cosmochim Acta 58 3171ndash3182Coale KH 1991 Effects of iron manganese copper and zinc enrichments on produc-
tivity and biomass in the subarctic Paci1047297c Limnol Oceanogr 36 1851ndash1864Coale KH Want X Tanner SJ Johnson KS 2003 Phytoplankton growth and bio-
logical response to iron and zinc addition in the Ross Sea and Antarctic Circumpo-lar Current along 170degW Deep-Sea Res Part II 50 635ndash653
Collier R Edmond J 1984 The trace element geochemistry of marine biogenicparticulatematter Prog Oceanogr 13 113ndash199
Crawford DW Lipsen MSPurdie DA Lohan MCStatham PJWhitney FAPutland JNJohnson WKSutherland N Peterson TD Harrison PJ Wong CS 2003In1047298u-ence of Zinc andiron enrichments on phytoplankton growthin thenortheastern Sub-arctic Paci1047297c Limnol Oceanogr 48 1583ndash1600
De La Rocha CL Hutchins DA Brzezinski MA Zhang Y 2000 Effects of iron andzinc de1047297ciency on elemental composition and silica production by diatoms MarEcol Prog Ser 195 71ndash79
Ellwood MJ Hunter KA 1999 Determination of the ZnSi ratio in diatom opal a
method for the separation cleaning and dissolution of diatoms Mar Chem 66149ndash160
Ellwood MJ Van den Berg CMG 2000 Zinc speciation in the Northeastern AtlanticOcean Mar Chem 68 295ndash306
Ibrahim M Shaban S Ichikawa K 2008 A promising structural zinc enzyme modelfor CO2 1047297xation and calci1047297cation Tetrahedron Lett 49 7303ndash7306
Johnson KS Boyle E Bruland K Coale K Measures C Moffett J Aguilarislas ABarbeau K Bergquist B Bowie A Buck K Cai Y Chase Z Cullen J Doi TElrod V Fitzwater S Gordon M King A Laan P Laglera-Baquer L LandingW Lohan M Mendez J Milne A Obata H Ossiander L Plant J Sarthou GSedwick P Smith GJ Sohst B Tanner S Van Den Berg S Wu J 2007 Devel-oping standards for dissolved iron in seawater Eos 88 (11) 131ndash132
Koch-Larrouy A Morrow R Penduff T Juza M 2010 Origin and mechanism of Sub-antarctic Mode Water formation and transformation in the Southern Indian OceanOcean Dyn 60 563ndash583
Landing WM Haraldsson C Paxeus N 1986 Vinyl polymer agglomerate based transi-tion metal cation chelating ion-exchange resin containing the 8-Hydroxyquinolinefunctional group Anal Chem 58 3031ndash3035
Lohan MC Statham PJ Crawford DW 2002 Total dissolved zinc in the upper watercolumn of the subarctic North East Paci1047297c Deep-Sea Res II 49 5793ndash5808
Lohan MC Crawford DW Purdie DA Statham PJ 2005 Iron andzinc enrichmentsin the northeastern subarctic Paci1047297c ligand production and zinc availability in re-sponse to phytoplankton growth Limnol Oceanogr 50 1427ndash1437
Martin JH Gordon RM 1988 Northeast Paci1047297c iron distributions in relation tophytoplankton productivity Deep-Sea Res 35 177ndash196
Martin JH Gordon RM Fitzwater S Broenkow WW 1989 VERTEX phytoplankton iron studies in the Gulf of Alaska Deep-Sea Res 36 649 ndash680
Measures CI Landing WM Brown MT Buck CS 2008 A commercially availablerosette system for trace metal-clean sampling Limnol Oceanogr Methods 6384ndash394
Morel FMM Reinfelder JR Roberts SB Chamberlain CP Lee JG Yee D 1994Zinc and carbon co-limitation of marine-phytoplankton Nature 369 740ndash742
Morley NH Statham PJ Burton JD 1993 Dissolved trace metals in the southwesternIndian Ocean Deep-Sea Res 30 (5) 1043ndash1062
Nowicki J Johnson K Coale K Elrod V Lieberman S 1994 Determination of zincinseawater using 1047298ow injection analysis with 1047298uorometric detection Anal Chem 662732ndash2738
Schlitzer R 2011 Ocean Data View 4 httpodvawide2011Schulz KG Zondervan I Gerringa LJ Timmermans KR Veldhuis MJ Riebesell U
2004 Effects of trace metal availability on coccolithophorid calci1047297cation Nature403 673ndash676
Sunda WG Huntsman SA 1992 Feedback interactions between zinc and phyto-plankton in seawater Limnol Oceanogr 37 25ndash40
Xu Y Feng L Jeffrey P Shi Y Morel FMM 2008 Structure and metal exchange inthe cadmium carbonic anhydrase of marine diatoms Nature 452 56ndash62
76 KJ Gosnell et al Marine Chemistry 132ndash133 (2012) 68ndash76
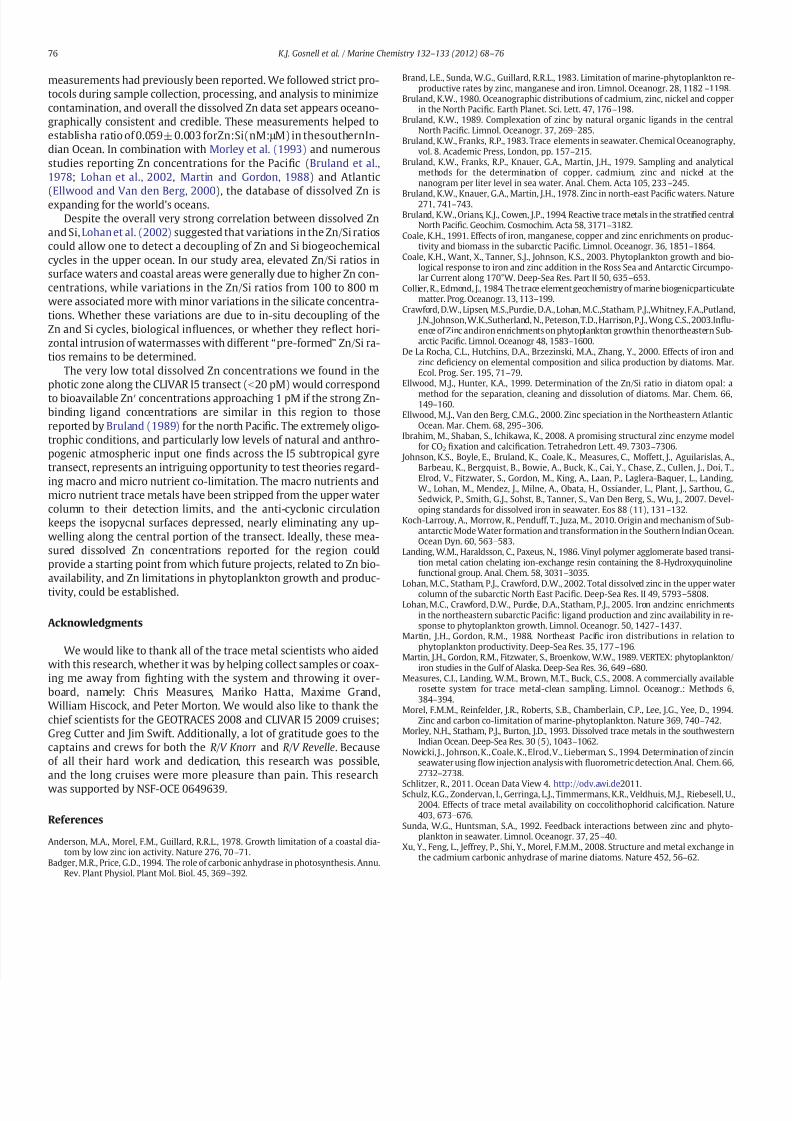
8112019 2012 - Fluorometric Detection of Total Dissolved Zinc in the Southern Indian Ocean
httpslidepdfcomreaderfull2012-fluorometric-detection-of-total-dissolved-zinc-in-the-southern-indian 99
measurements had previously been reported We followed strict pro-
tocols during sample collection processing and analysis to minimize
contamination and overall the dissolved Zn data set appears oceano-
graphically consistent and credible These measurements helped to
establisha ratio of 0059plusmn 0003 forZnSi(nMμ M) in thesouthernIn-
dian Ocean In combination with Morley et al (1993) and numerous
studies reporting Zn concentrations for the Paci1047297c (Bruland et al
1978 Lohan et al 2002 Martin and Gordon 1988) and Atlantic
(Ellwood and Van den Berg 2000) the database of dissolved Zn isexpanding for the worlds oceans
Despite the overall very strong correlation between dissolved Zn
and Si Lohan et al (2002) suggested that variations in the ZnSi ratios
could allow one to detect a decoupling of Zn and Si biogeochemical
cycles in the upper ocean In our study area elevated ZnSi ratios in
surface waters and coastal areas were generally due to higher Zn con-
centrations while variations in the ZnSi ratios from 100 to 800 m
were associated more with minor variations in the silicate concentra-
tions Whether these variations are due to in-situ decoupling of the
Zn and Si cycles biological in1047298uences or whether they re1047298ect hori-
zontal intrusion of watermasses with different ldquopre-formedrdquo ZnSi ra-
tios remains to be determined
The very low total dissolved Zn concentrations we found in the
photic zone along the CLIVAR I5 transect (b20 pM) would correspond
to bioavailable Znprime concentrations approaching 1 pM if the strong Zn-
binding ligand concentrations are similar in this region to those
reported by Bruland (1989) for the north Paci1047297c The extremely oligo-
trophic conditions and particularly low levels of natural and anthro-
pogenic atmospheric input one 1047297nds across the I5 subtropical gyre
transect represents an intriguing opportunity to test theories regard-
ing macro and micro nutrient co-limitation The macro nutrients and
micro nutrient trace metals have been stripped from the upper water
column to their detection limits and the anti-cyclonic circulation
keeps the isopycnal surfaces depressed nearly eliminating any up-
welling along the central portion of the transect Ideally these mea-
sured dissolved Zn concentrations reported for the region could
provide a starting point from which future projects related to Zn bio-
availability and Zn limitations in phytoplankton growth and produc-
tivity could be established
Acknowledgments
We would like to thank all of the trace metal scientists who aided
with this research whether it was by helping collect samples or coax-
ing me away from 1047297ghting with the system and throwing it over-
board namely Chris Measures Mariko Hatta Maxime Grand
William Hiscock and Peter Morton We would also like to thank the
chief scientists for the GEOTRACES 2008 and CLIVAR I5 2009 cruises
Greg Cutter and Jim Swift Additionally a lot of gratitude goes to the
captains and crews for both the RV Knorr and RV Revelle Because
of all their hard work and dedication this research was possible
and the long cruises were more pleasure than pain This research
was supported by NSF-OCE 0649639
References
Anderson MA Morel FM Guillard RRL 1978 Growth limitation of a coastal dia-tom by low zinc ion activity Nature 276 70ndash71
Badger MR Price GD 1994 The role of carbonic anhydrase in photosynthesis AnnuRev Plant Physiol Plant Mol Biol 45 369ndash392
Brand LE Sunda WG Guillard RRL 1983 Limitation of marine-phytoplankton re-productive rates by zinc manganese and iron Limnol Oceanogr 28 1182 ndash1198
Bruland KW 1980 Oceanographic distributions of cadmium zinc nickel and copperin the North Paci1047297c Earth Planet Sci Lett 47 176ndash198
Bruland KW 1989 Complexation of zinc by natural organic ligands in the centralNorth Paci1047297c Limnol Oceanogr 37 269ndash285
Bruland KW Franks RP 1983 Trace elements in seawater Chemical Oceanographyvol 8 Academic Press London pp 157ndash215
Bruland KW Franks RP Knauer GA Martin JH 1979 Sampling and analyticalmethods for the determination of copper cadmium zinc and nickel at thenanogram per liter level in sea water Anal Chem Acta 105 233ndash245
Bruland KW Knauer GA Martin JH 1978 Zinc in north-east Paci1047297c waters Nature271 741ndash743Bruland KW Orians KJ Cowen JP 1994 Reactive trace metals in the strati1047297ed central
North Paci1047297c Geochim Cosmochim Acta 58 3171ndash3182Coale KH 1991 Effects of iron manganese copper and zinc enrichments on produc-
tivity and biomass in the subarctic Paci1047297c Limnol Oceanogr 36 1851ndash1864Coale KH Want X Tanner SJ Johnson KS 2003 Phytoplankton growth and bio-
logical response to iron and zinc addition in the Ross Sea and Antarctic Circumpo-lar Current along 170degW Deep-Sea Res Part II 50 635ndash653
Collier R Edmond J 1984 The trace element geochemistry of marine biogenicparticulatematter Prog Oceanogr 13 113ndash199
Crawford DW Lipsen MSPurdie DA Lohan MCStatham PJWhitney FAPutland JNJohnson WKSutherland N Peterson TD Harrison PJ Wong CS 2003In1047298u-ence of Zinc andiron enrichments on phytoplankton growthin thenortheastern Sub-arctic Paci1047297c Limnol Oceanogr 48 1583ndash1600
De La Rocha CL Hutchins DA Brzezinski MA Zhang Y 2000 Effects of iron andzinc de1047297ciency on elemental composition and silica production by diatoms MarEcol Prog Ser 195 71ndash79
Ellwood MJ Hunter KA 1999 Determination of the ZnSi ratio in diatom opal a
method for the separation cleaning and dissolution of diatoms Mar Chem 66149ndash160
Ellwood MJ Van den Berg CMG 2000 Zinc speciation in the Northeastern AtlanticOcean Mar Chem 68 295ndash306
Ibrahim M Shaban S Ichikawa K 2008 A promising structural zinc enzyme modelfor CO2 1047297xation and calci1047297cation Tetrahedron Lett 49 7303ndash7306
Johnson KS Boyle E Bruland K Coale K Measures C Moffett J Aguilarislas ABarbeau K Bergquist B Bowie A Buck K Cai Y Chase Z Cullen J Doi TElrod V Fitzwater S Gordon M King A Laan P Laglera-Baquer L LandingW Lohan M Mendez J Milne A Obata H Ossiander L Plant J Sarthou GSedwick P Smith GJ Sohst B Tanner S Van Den Berg S Wu J 2007 Devel-oping standards for dissolved iron in seawater Eos 88 (11) 131ndash132
Koch-Larrouy A Morrow R Penduff T Juza M 2010 Origin and mechanism of Sub-antarctic Mode Water formation and transformation in the Southern Indian OceanOcean Dyn 60 563ndash583
Landing WM Haraldsson C Paxeus N 1986 Vinyl polymer agglomerate based transi-tion metal cation chelating ion-exchange resin containing the 8-Hydroxyquinolinefunctional group Anal Chem 58 3031ndash3035
Lohan MC Statham PJ Crawford DW 2002 Total dissolved zinc in the upper watercolumn of the subarctic North East Paci1047297c Deep-Sea Res II 49 5793ndash5808
Lohan MC Crawford DW Purdie DA Statham PJ 2005 Iron andzinc enrichmentsin the northeastern subarctic Paci1047297c ligand production and zinc availability in re-sponse to phytoplankton growth Limnol Oceanogr 50 1427ndash1437
Martin JH Gordon RM 1988 Northeast Paci1047297c iron distributions in relation tophytoplankton productivity Deep-Sea Res 35 177ndash196
Martin JH Gordon RM Fitzwater S Broenkow WW 1989 VERTEX phytoplankton iron studies in the Gulf of Alaska Deep-Sea Res 36 649 ndash680
Measures CI Landing WM Brown MT Buck CS 2008 A commercially availablerosette system for trace metal-clean sampling Limnol Oceanogr Methods 6384ndash394
Morel FMM Reinfelder JR Roberts SB Chamberlain CP Lee JG Yee D 1994Zinc and carbon co-limitation of marine-phytoplankton Nature 369 740ndash742
Morley NH Statham PJ Burton JD 1993 Dissolved trace metals in the southwesternIndian Ocean Deep-Sea Res 30 (5) 1043ndash1062
Nowicki J Johnson K Coale K Elrod V Lieberman S 1994 Determination of zincinseawater using 1047298ow injection analysis with 1047298uorometric detection Anal Chem 662732ndash2738
Schlitzer R 2011 Ocean Data View 4 httpodvawide2011Schulz KG Zondervan I Gerringa LJ Timmermans KR Veldhuis MJ Riebesell U
2004 Effects of trace metal availability on coccolithophorid calci1047297cation Nature403 673ndash676
Sunda WG Huntsman SA 1992 Feedback interactions between zinc and phyto-plankton in seawater Limnol Oceanogr 37 25ndash40
Xu Y Feng L Jeffrey P Shi Y Morel FMM 2008 Structure and metal exchange inthe cadmium carbonic anhydrase of marine diatoms Nature 452 56ndash62
76 KJ Gosnell et al Marine Chemistry 132ndash133 (2012) 68ndash76