2012 energy benchmarking report - minneapolis
TRANSCRIPT

2012 Energy Benchmarking Report
City of Minneapolis
November 2013
Public Buildings

Cover Photos:
Minneapolis City Hall (Credit: Photo Phiend/flickr) Richard Green Central School (Credit: mpls jenny / flickr) Minneapolis Parks and Recreation Board headquarters (Credit: Innotata/Wikimedia Commons) Minneapolis Central Library (Credit: Adam Fagen/flickr)

Minneapolis skyline (Credit: Doug Wallick / flickr) More information on the Commercial Building Rating and Disclosure Policy available at: http://www.ci.minneapolis.mn.us/environment/energy/ Please email any questions about this report to: [email protected]
Acknowledgements Collecting the data for this report relied on the time and expertise of staff from various city departments and partnership with other public agencies and non-profit organizations. This is the first report of its kind for the City of Minneapolis and its partners. Special thanks to the organizations and staff listed below.
Minneapolis Finance & Property Services Greg Goeke Brian Millberg
Minneapolis Health Department Patrick Hanlon Nadia Khan Jenni Lansing
Minneapolis Sustainability Julia Eagles Brendon Slotterback
Hennepin County Leah Hiniker
Minneapolis Park & Recreation Board Jennifer Ringold
Minneapolis Public Schools Kenneth Karr David Opoien
Center for Energy and the Environment Jenny Edwards Chris Plum

1
Totals may not add up to 100 percent due to rounding and exclusion of small sources.
Executive Summary
In February of 2013 the Minneapolis City Council unanimously adopted ordinance 47.190 requiring commercial buildings over 50,000 square feet and public buildings over 25,000 square feet to annually benchmark their energy and water consumption and report this information to the City. Minneapolis is the first city in the Midwest to adopt a benchmarking and disclosure policy, and the seventh in the nation. Building energy disclosure is intended to increase energy performance awareness among building owners, tenants, energy experts, policymakers and the general public.
This first annual report includes benchmarking results for calendar year 2012 from over 21.3 million square feet in 102 publicly-owned buildings, including those owned by the City of Minneapolis, the Minneapolis Park and Recreation Board, Minneapolis Public Schools and Hennepin County. Beginning in 2014, commercial buildings over 100,000 square feet will be required to report their benchmarking results to the City, with buildings over 50,000 square feet required to begin benchmarking in 2015.
The results of this report can be used to save taxpayers money on energy costs in public buildings. Research has shown that benchmarking can result in cost savings for building owners, managers and tenants, and can inject money back into the local economy. If all 102 buildings in this report reduced their energy use 10 percent, over $2.5 million in energy costs and over 15,000 metric tons of greenhouse gas emissions would be avoided.
According to the 2010 greenhouse gas emissions inventory for Minneapolis, energy use in commercial and industrial buildings accounts
for 46% of the community-wide emissions in the city. In 2012 the City Council adopted goals to reduce citywide greenhouse gases 15 percent by 2015 and 30 percent by 2025, from a 2006 baseline. The City also has a goal to reduce greenhouse gas emissions from municipal operations by 1.5 percent annually. The commercial building benchmarking and disclosure ordinance was among a set of strategies aimed at increasing energy efficiency in buildings that was part of the Minneapolis Climate Action Plan, adopted in June of 2013. The plan provides a roadmap for meeting those emissions reductions goals, and outlines a goal to achieve 20 percent energy efficiency in commercial/industrial buildings by 2025.
Commercial and Industrial Buildings, 46%
Residential Buildings, 20%
Road Transportation,
25%
Air Travel, 7%
Solid Waste, 3%
Wastewater, 1%
Greenhouse gas emissions from community-wide activities, 2010

2
Benchmarking results for 2012 reveal a large range in building types and energy usage patterns, often reflecting the unique uses, operating conditions, and schedules found in public buildings. This data will be useful as public entities analyze opportunities for energy efficiency improvements and, in the case that a public entity has an energy efficiency or climate protection goal, help them track progress.
Because this is the first year of reporting, the process to collect this data is considered a learning experience, both in the mechanism to benchmark and report the data, and in the scores that resulted. The expanded use of benchmarking and public accountability means that opportunities to improve these scores – increase the energy efficiency of buildings – can be pursued.
Key Findings
102 public buildings were included in this report from the portfolios of the City of Minneapolis, Minneapolis Park & Recreation Board, Minneapolis Public Schools and Hennepin County. The City secured voluntary agreements with these other public entities to report the energy performance on their buildings over 25,000 square feet. Each entity chose which buildings to include in the report.
Benchmarking and efficiency improvements are already leading to significant savings. From 2009 – 2012, energy efficiency investments in City buildings have saved more than $6 million in energy costs. Hennepin County’s tune-up of the Central Library is saving over $102,000 in energy costs every year.
Additional energy efficiency improvements could lead to significant cost and emissions savings. If all 102 buildings reduced their energy use 10 percent, over $2.5 million in energy costs and over 15,000 metric
tons of greenhouse gas emissions would be avoided. If the top quartile of buildings ranked by energy use intensity (the most energy intensive buildings) reduced energy use 10 percent, the public would save over $900,000 in energy costs and over 4,500 metric tons of greenhouse gas emissions would be avoided.
The correlation between building age and energy use intensity is not as strong as might be expected. The age of a building accounts for only 11% of the variability in energy intensity between buildings of different
About ENERGY STAR Scores
The 1 – 100 ENERGY STAR score shows how a building’s energy consumption measures up against similar buildings nationwide. A score of 50 represents median energy performance, while a score of 75 or better indicates a building is a top performer.
The U.S. Department of Energy conducts a national survey to gather data on building characteristics and energy use from thousands of buildings across the United States. This survey data is used to develop ENERGY STAR scores.
Based on the information entered about a building, such as its size, location, number of occupants, number of PCs, etc., the score’s algorithm estimates how much energy the building would use if it were the best performing, the worst performing, and every level in between. It then compares the actual energy data entered to the estimate to determine where the building ranks relative to its peers.
All of the calculations are based on source energy and account for the impact of weather variations, as well as changes in key property use details.
3
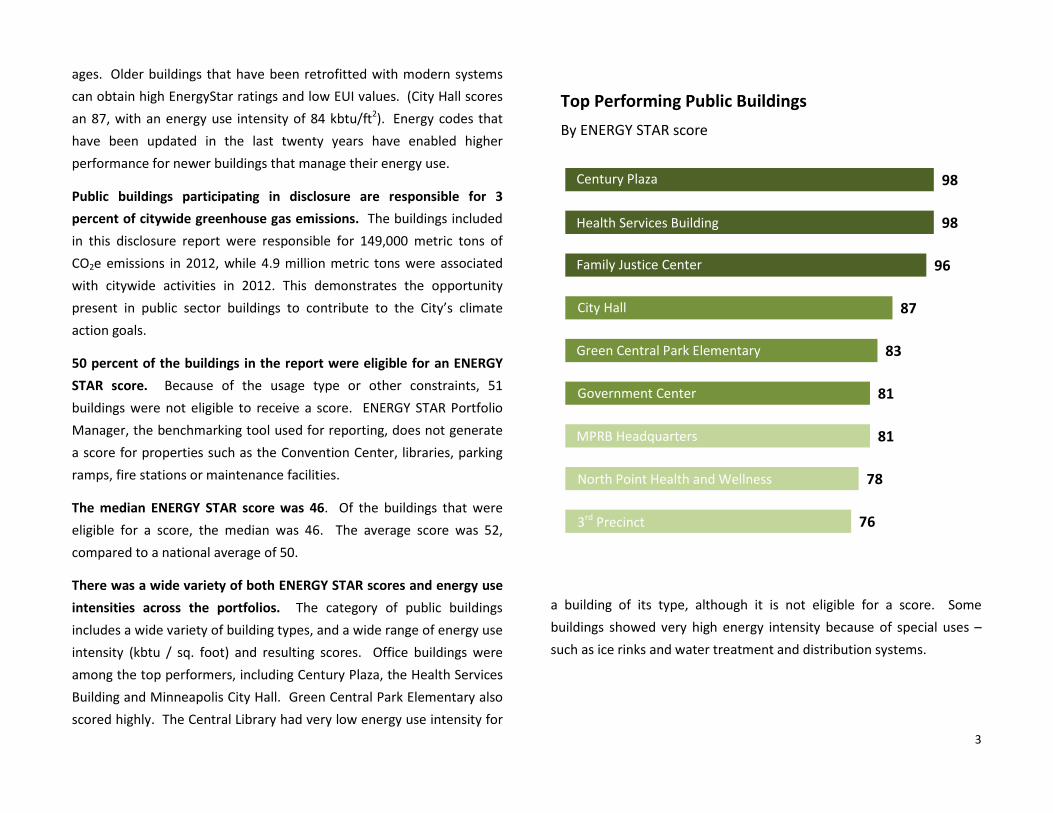
Top Performing Public Buildings By ENERGY STAR score
ages. Older buildings that have been retrofitted with modern systems can obtain high EnergyStar ratings and low EUI values. (City Hall scores an 87, with an energy use intensity of 84 kbtu/ft2). Energy codes that have been updated in the last twenty years have enabled higher performance for newer buildings that manage their energy use.
Public buildings participating in disclosure are responsible for 3 percent of citywide greenhouse gas emissions. The buildings included in this disclosure report were responsible for 149,000 metric tons of CO2e emissions in 2012, while 4.9 million metric tons were associated with citywide activities in 2012. This demonstrates the opportunity present in public sector buildings to contribute to the City’s climate action goals.
50 percent of the buildings in the report were eligible for an ENERGY STAR score. Because of the usage type or other constraints, 51 buildings were not eligible to receive a score. ENERGY STAR Portfolio Manager, the benchmarking tool used for reporting, does not generate a score for properties such as the Convention Center, libraries, parking ramps, fire stations or maintenance facilities.
The median ENERGY STAR score was 46. Of the buildings that were eligible for a score, the median was 46. The average score was 52, compared to a national average of 50.
There was a wide variety of both ENERGY STAR scores and energy use intensities across the portfolios. The category of public buildings includes a wide variety of building types, and a wide range of energy use intensity (kbtu / sq. foot) and resulting scores. Office buildings were among the top performers, including Century Plaza, the Health Services Building and Minneapolis City Hall. Green Central Park Elementary also scored highly. The Central Library had very low energy use intensity for
a building of its type, although it is not eligible for a score. Some buildings showed very high energy intensity because of special uses – such as ice rinks and water treatment and distribution systems.
76
78
81
81
83
87
96
98
98 Century Plaza
Health Services Building
Family Justice Center
City Hall
Green Central Park Elementary
Government Center
MPRB Headquarters
North Point Health and Wellness
3rd Precinct

4
Background on Building Benchmarking &
Disclosure
In February of 2013 the Minneapolis City Council unanimously adopted ordinance 47.190 requiring commercial buildings over 50,000 square feet and publicly-owned buildings over 25,000 square feet to annually benchmark their energy and water consumption and report this information to the City. The purpose of the ordinance is to use market forces – not performance or design mandates – to build energy performance awareness and motivate building owners and tenants to invest in energy efficiency improvements. Buildings are the largest source of greenhouse gas pollution in Minneapolis. Promoting the benefits of energy efficiency improvements to building owners – and connecting them to resources – can reduce energy use and air pollution. Cities where rating and disclosure policies are already in place are motivating investment in existing buildings and showing an increased demand for energy efficiency services, creating more local green jobs.
This ordinance requires public buildings to benchmark and disclose their energy use before any private buildings. The City of Minneapolis sought partnerships with Hennepin County, the Minneapolis Park & Recreation Board, and the Minneapolis Public Schools, who all voluntarily submitted benchmarking results for many of their buildings for public disclosure. Disclosure of these scores will help these public entities show how they are stewarding public resources.
Commercial Benchmarking and Disclosure Ordinance
Compliance Schedule
Publicly-owned over 25,000 ft2
2013: First year data will be published on City’s website (annually thereafter).
Privately owned commercial use over 100,000 ft2
• June 1st, 2014 – first date data must be sent to the City (annually thereafter)
• August 30th, 2015 – first year data will be published on City’s Website.
Privately owned commercial use over
50,000 ft2
• June 1st, 2015 – first date data must be sent to the City (annually thereafter)
• August 30th, 2016 – first year data will be published on City’s Website.
5
Benefits of benchmarking
Green Jobs. A Rating and Disclosure Policy has the potential to motivate investment in existing buildings and create jobs in the energy management, benchmarking, auditing and installation/retrofit industries. Examples from cities where policies are in place, such as New York, show increased demand for energy services and growth in energy management companies. Minneapolis has adopted specific targets for increasing green jobs and green companies in the city, and green building policies may help the city reach these goals.
Environmental Benefit. The Minneapolis City Council has adopted targets for community-wide greenhouse gas reduction of 15% by 2015 and 30% by 2025. In 2010, energy use in commercial and industrial buildings accounted for over 46% of Minneapolis’ community-wide emissions. Policies focused on these building types, like Rating and Disclosure, are critical to achieving the City’s goals.
Benefits to the local economy. While most of the dollars spent on energy leave the community (to pay for energy resources), savings realized for energy efficiency mean dollars can be redirected to other purposes, like reinvesting in businesses or hiring more workers. The energy efficiency retrofit industry also cannot be “outsourced”, energy efficiency investments can provide local jobs.
Energy savings in existing buildings. In any given year, existing buildings represent over 90% of the building stock in Minneapolis, and a similar amount of the energy consumption from the buildings sector. Rating and disclosure is a tool that can promote energy efficiency in the existing building sector.
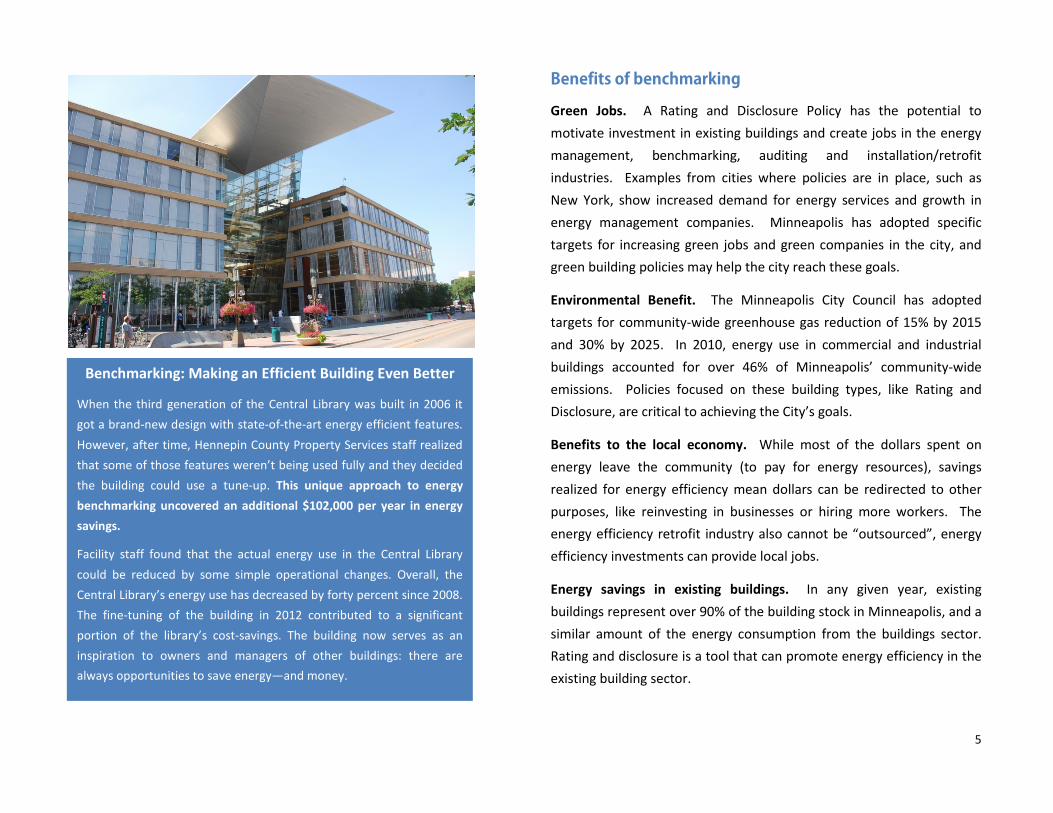
Benchmarking: Making an Efficient Building Even Better
When the third generation of the Central Library was built in 2006 it got a brand-new design with state-of-the-art energy efficient features. However, after time, Hennepin County Property Services staff realized that some of those features weren’t being used fully and they decided the building could use a tune-up. This unique approach to energy benchmarking uncovered an additional $102,000 per year in energy savings.
Facility staff found that the actual energy use in the Central Library could be reduced by some simple operational changes. Overall, the Central Library’s energy use has decreased by forty percent since 2008. The fine-tuning of the building in 2012 contributed to a significant portion of the library’s cost-savings. The building now serves as an inspiration to owners and managers of other buildings: there are always opportunities to save energy—and money.

6
Characteristics of Covered Properties
102 buildings are included in the 2012 report. They include buildings owned by the City of Minneapolis, Hennepin County, Minneapolis Public Schools, and the Minneapolis Park and Recreation Board.
Minneapolis Public Schools buildings make up the largest percentage of buildings in the report, with 50 buildings, or 49 percent of the total. Schools are also the most geographically dispersed building type, while most other public buildings are located near downtown.
Minneapolis also owns a number of parking ramps, which are included in the report. After schools, there are more parking ramps than any other building type in the report. Parking ramps also constitute the greatest total square footage among the building types, with the square footage of schools second.
The median year built of the buildings in the report is 1976 and the average is 1970. 15 buildings, or 15 percent of the total, were built in 1925.
Energy Use
The report contains information on the energy use of covered buildings for the report year including total greenhouse gas emissions, site and source energy use intensity (EUI).
In public buildings, energy use intensity can vary substantially. Public buildings often contain unique uses, such as drinking water treatment facilities, ice rinks or jails. Many facilities operate around the clock, unlike office buildings, which see significantly less use at night.
0 10 20 30 40 50 60
Drinking Water Treatment &…
Medical Office
Convention Center
Library
Courthouse
Maintenance Facility
Other
Office
Parking
K-12 School
Count of Property Types
0 2 4 6 8
Medical Office
Maintenance Facility
Library
Other
Courthouse
Drinking Water Treatment &…
Convention Center
Office
K-12 School
Parking
Millions of square feet
Total square footage of property types

7
Many public facilities are also not eligible for ENERGY STAR scores given their unique usage types. Convention centers, libraries, parking ramps and public safety facilities are examples of buildings in this report that did not receive a score1.
The City’s water treatment and distribution campus was one of the highest users of energy per square foot, along with the Park Board’s Parade Ice Garden and some public schools. Treating and pumping water and maintaining ice rinks are very energy-intensive activities, mostly unique to public buildings. The buildings using the lowest amount of energy per square foot included the Central Library at 44.9 kbtu/square foot, schools like Anwatin Middle School and Lyndale School (45 and 46 kbtu/square foot), the City’s LEED platinum-certified Hiawatha Maintenance Facility (49.3 kbtu/square foot), and some of the City’s parking ramps.
The highest performing buildings by ENERGY STAR score2 include three owned by Hennepin County at the top of the list – Century Plaza (98), the Health Services Building (98), and the Family Justice Center (96). City hall, managed jointly by the City and Hennepin County, scored an 87. The Park and Recreation Board Headquarters scored an 81, and the highest scoring school was Green Central Park Elementary with an 83.
1 For a full list of building types eligible for an ENERGY STAR score visit: http://1.usa.gov/1gCiZuj 2 ENERGY STAR scores take into account other characteristics of a building besides total energy use including age, use and performance of similar buildings nationwide. See the info box on page 4.
0 20 40 60 80 100 120 140 160
Parking
Library
Medical Office
Courthouse
Convention Center
Maintenance Facility
K-12 School
Other
Office
Drinking Water Treatment & Distribution
Average Weather-Normalized Site EUI (kbtu/sq ft)
K-12 School, 520,278 , 38%
Drinking Water Treatment & Distribution,
199,652 , 14%
Office, 146,386 , 11%
Convention Center, 122,761
, 9%
Courthouse, 116,223 , 8%
Parking, 110,853 , 8%
Other, 110,748 , 8%
Maintenance Facility, 34,408 ,
2%
Library, 21,471 , 2%
Medical Office, 4,597 , 0%
Benchmarked Energy Use by Building Type 2012, MMbtu
8
Conclusion
This report provides an initial snapshot of the energy performance of public buildings in Minneapolis for the year 2012. As the first full year of the implementation of the Commercial Building Benchmarking and Disclosure Policy, this will provide a baseline of data from which to compare future results. In addition to complying with city ordinance, the intention of the report is to bring more transparency to energy use in the public sector, and to help inform building owners, managers and decision makers about what properties have the most opportunity for cost and energy savings. Those public entities who’ve reported their energy data will continue to refine their scores and identify opportunities to make their buildings more energy efficient.
In this first year of reporting, there were some challenges in collecting and interpreting data. In some cases, best estimates were necessary
for inputs like square footage. ENERGY STAR scores were not available for all buildings, due to the unique nature and uses of some public buildings. The City will continue to refine and verify data about its own buildings for future reports, as well as work with partner entities and organizations to fill in the gaps and make corrections to the data where necessary.
This policy is part of comprehensive strategy by the City of Minneapolis to reduce greenhouse gas emissions and improve the efficiency of public and private buildings. Minneapolis will continue to implement energy-saving strategies in city buildings and operations to make progress towards adopted goals. Subsequent reports and multiple years of data will allow the tracking of performance over time, in publicly- and privately-owned buildings across the city.
9
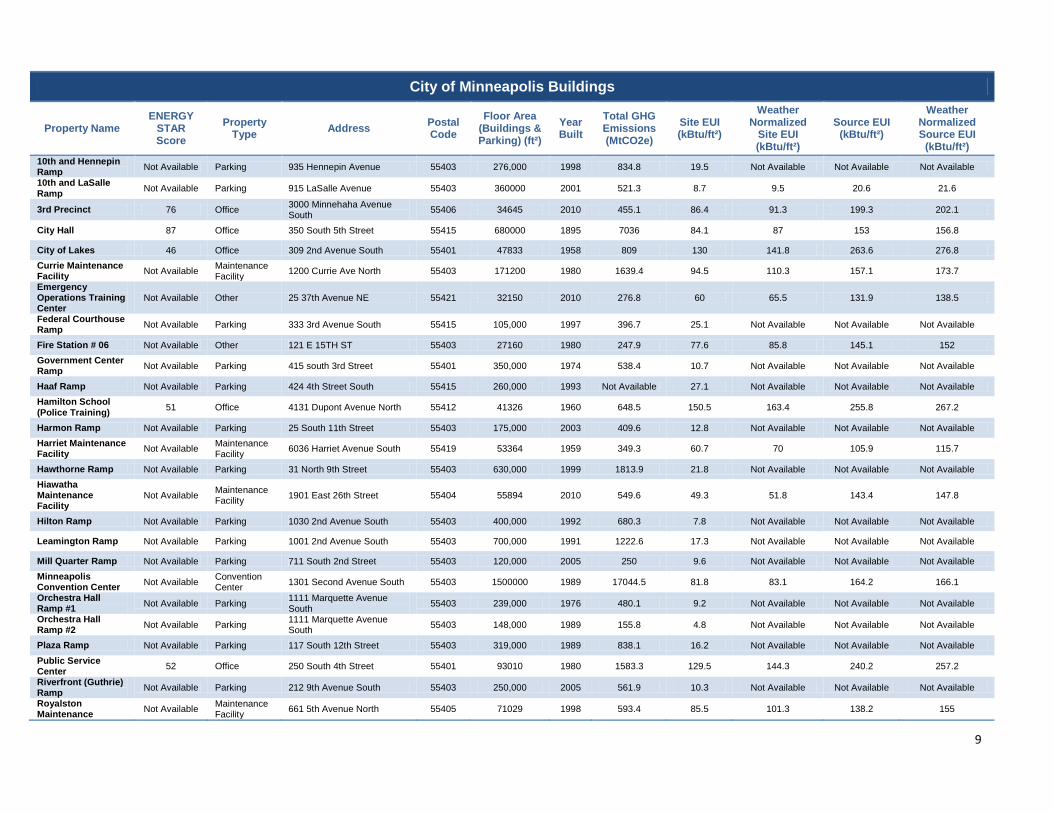
City of Minneapolis Buildings
Property Name ENERGY
STAR Score
Property Type Address Postal
Code Floor Area
(Buildings & Parking) (ft²)
Year Built
Total GHG Emissions (MtCO2e)
Site EUI (kBtu/ft²)
Weather Normalized
Site EUI (kBtu/ft²)
Source EUI (kBtu/ft²)
Weather Normalized Source EUI
(kBtu/ft²) 10th and Hennepin Ramp Not Available Parking 935 Hennepin Avenue 55403 276,000 1998 834.8 19.5 Not Available Not Available Not Available
10th and LaSalle Ramp Not Available Parking 915 LaSalle Avenue 55403 360000 2001 521.3 8.7 9.5 20.6 21.6
3rd Precinct 76 Office 3000 Minnehaha Avenue South 55406 34645 2010 455.1 86.4 91.3 199.3 202.1
City Hall 87 Office 350 South 5th Street 55415 680000 1895 7036 84.1 87 153 156.8
City of Lakes 46 Office 309 2nd Avenue South 55401 47833 1958 809 130 141.8 263.6 276.8 Currie Maintenance Facility Not Available Maintenance
Facility 1200 Currie Ave North 55403 171200 1980 1639.4 94.5 110.3 157.1 173.7
Emergency Operations Training Center
Not Available Other 25 37th Avenue NE 55421 32150 2010 276.8 60 65.5 131.9 138.5
Federal Courthouse Ramp Not Available Parking 333 3rd Avenue South 55415 105,000 1997 396.7 25.1 Not Available Not Available Not Available
Fire Station # 06 Not Available Other 121 E 15TH ST 55403 27160 1980 247.9 77.6 85.8 145.1 152 Government Center Ramp Not Available Parking 415 south 3rd Street 55401 350,000 1974 538.4 10.7 Not Available Not Available Not Available
Haaf Ramp Not Available Parking 424 4th Street South 55415 260,000 1993 Not Available 27.1 Not Available Not Available Not Available Hamilton School (Police Training) 51 Office 4131 Dupont Avenue North 55412 41326 1960 648.5 150.5 163.4 255.8 267.2
Harmon Ramp Not Available Parking 25 South 11th Street 55403 175,000 2003 409.6 12.8 Not Available Not Available Not Available Harriet Maintenance Facility Not Available Maintenance
Facility 6036 Harriet Avenue South 55419 53364 1959 349.3 60.7 70 105.9 115.7
Hawthorne Ramp Not Available Parking 31 North 9th Street 55403 630,000 1999 1813.9 21.8 Not Available Not Available Not Available Hiawatha Maintenance Facility
Not Available Maintenance Facility 1901 East 26th Street 55404 55894 2010 549.6 49.3 51.8 143.4 147.8
Hilton Ramp Not Available Parking 1030 2nd Avenue South 55403 400,000 1992 680.3 7.8 Not Available Not Available Not Available
Leamington Ramp Not Available Parking 1001 2nd Avenue South 55403 700,000 1991 1222.6 17.3 Not Available Not Available Not Available
Mill Quarter Ramp Not Available Parking 711 South 2nd Street 55403 120,000 2005 250 9.6 Not Available Not Available Not Available Minneapolis Convention Center Not Available Convention
Center 1301 Second Avenue South 55403 1500000 1989 17044.5 81.8 83.1 164.2 166.1
Orchestra Hall Ramp #1 Not Available Parking 1111 Marquette Avenue
South 55403 239,000 1976 480.1 9.2 Not Available Not Available Not Available
Orchestra Hall Ramp #2 Not Available Parking 1111 Marquette Avenue
South 55403 148,000 1989 155.8 4.8 Not Available Not Available Not Available
Plaza Ramp Not Available Parking 117 South 12th Street 55403 319,000 1989 838.1 16.2 Not Available Not Available Not Available Public Service Center 52 Office 250 South 4th Street 55401 93010 1980 1583.3 129.5 144.3 240.2 257.2
Riverfront (Guthrie) Ramp Not Available Parking 212 9th Avenue South 55403 250,000 2005 561.9 10.3 Not Available Not Available Not Available
Royalston Maintenance Not Available Maintenance
Facility 661 5th Avenue North 55405 71029 1998 593.4 85.5 101.3 138.2 155

10
City of Minneapolis Buildings
Property Name ENERGY
STAR Score
Property Type Address Postal
Code Floor Area
(Buildings & Parking) (ft²)
Year Built
Total GHG Emissions (MtCO2e)
Site EUI (kBtu/ft²)
Weather Normalized
Site EUI (kBtu/ft²)
Source EUI (kBtu/ft²)
Weather Normalized Source EUI
(kBtu/ft²) Facility
TAD 4 and 4 to 5 Skyway Not Available Parking 318 2nd Avenue North 55403 450,000 1993 1832.8 27.4 Not Available Not Available Not Available
TAD 5 and 5-7 Skyway Not Available Parking 516 2nd Avenue North 55403 618,000 1989 2010.8 21.3 Not Available Not Available Not Available
TAD 7 and C/L Skyway Not Available Parking 101 North 9th Street 55403 1,650,000 1991 3032.7 10.6 Not Available Not Available Not Available
Traffic Maintenance Facility (300 Border) Not Available Maintenance
Facility 300 Border Avenue 55405 61416 1962 660.8 100.3 109.4 174.3 182.7
Vineland (Walker) Ramp Not Available Parking 727 Vineland 55403 115,000 2004 542 25.7 Not Available Not Available Not Available
Water Treatment and Distribution Campus
Not Available
Drinking Water Treatment & Distribution
4500 Marshall Street NE 55421 1500000 1930 32014.4 133.1 140.9 321 328.1
Hennepin County Buildings
Property Name ENERGY
STAR Score
Property Type Address Postal
Code Floor Area
(Buildings & Parking) (ft²)
Year Built
Total GHG Emissions (MtCO2e)
Site EUI (kBtu/ft²)
Weather Normalized
Site EUI (kBtu/ft²)
Source EUI (kBtu/ft²)
Weather Normalized Source EUI
(kBtu/ft²)
1800 Chicago Not Available Office 1800 Chicago S. 55404 102815 1996 1275 114.9 123 201.7 206.3 Minneapolis Central Library Not Available Library 300 Nicolet Mall 55401 426374 2004 3427.57 44.9 46.3 117.6 117.6
Century Plaza 98 Office 330 south 12th st 55404 297650 1934 2730.29 53.5 55.5 137.9 138.5 Family Justice Center 96 Courthouse 110 S. 4th St. 55415 227422 1956 1778.49 53.6 56.6 120.4 122
Forensic Sciences Building Not Available Office 530 Chicago Avenue South 55415 62602 1974 Not Available 229.9 248.4 362.8 385.1
Government Center 81 Courthouse 300 S. Sixth 55487 1086239 1974 Not Available 95.8 101.5 200.7 209.2
Health Services Building 98 Office 525 Portland Ave South 55415 198739 1989 Not Available 50.9 52.8 109.4 111
Juvenile Justice Center/Detention Center
Not Available Other 626 S. Sixth 55415 199219 1983 Not Available 77.7 82.2 157.8 163.3
North Point Health and Wellness 78 Medical
Office 1313 Penn Ave N 55411 67205 1995 793.89 68.4 70.3 177.5 176.2
North Regional Library Not Available Library 1315 Lowry Avenue North 55411 38993 1971 316.91 60.1 63.8 126.8 128.1
Public Safety Facility Not Available Other 401 4 Ave South 55415 381568 2001 Not Available 121.9 127.7 227.5 234.5

11
Minneapolis Public School Buildings
Property Name ENERGY
STAR Score
Property Type Address Postal
Code Floor Area
(Buildings & Parking) (ft²)
Year Built
Total GHG Emissions (MtCO2e)
Site EUI (kBtu/ft²)
Weather Normalized Site
EUI (kBtu/ft²) Source EUI
(kBtu/ft²)
Weather Normalized Source EUI
(kBtu/ft²) Andersen Elementary 44 K-12 School 2727 10th Ave S 55407 233252 1976 403.41 64.7 69.5 141.4 146.5
Anishinabe Elementary 30 Office 2225 East Lake Street 55407 51000 1975 109.88 97.7 107.5 233.4 252.3
Anthony Middle School 30 K-12 School 5757 Irving Ave S 55419 139806 1957 913.6 70.1 78.8 109.7 120.2
Anwatin Middle School 59 K-12 School 256 Upton Ave S 55405 144157 1960 727.45 45 49.8 81.5 86.9
Armatage Elementary 46 K-12 School 2501 West 56th Street 55410 91500 1952 619.18 73.6 84.1 114 129.3
Bancroft Elementary 45 K-12 School 1315 East 38th Street 55407 72176 1925 546 83.3 93.5 127.8 139.2
Barton Elementary 44 K-12 School 4237 Colfax Ave S 55409 80464 1925 739.91 75.2 82.1 146 153.2 Bryn Mawr Elementary 37 K-12 School 252 Upton Avenue
South 55405 99669 1962 910.83 89.9 99.7 150.5 160.8
Burroughs Elementary 58 K-12 School 1601 West 50th Street 55419 162320 2002 1166.37 55.6 60.3 112.9 117.9
City View Elementary Not Available K-12 School 3350 4th Street North 55412 132372 1999 1179.78 66.7 72.2 139.3 145
Dowling Elementary 30 K-12 School 3900 West River Parkway 55406 90776 2007 1077.97 130.1 146.2 200.4 218.8
Edison Senior High 52 K-12 School 700 22nd Ave NE 55418 257922 1925 1896.7 77.5 86.4 123 132.3 Emerson Elementary 38 K-12 School 1421 Spruce Place 55403 57061 1925 663.17 134.2 149.2 198.6 211
Field Elementary Not Available K-12 School 4645 4th Ave South 55409 69530 1925 666.43 97.9 109.5 159.2 172.7 Green Central Park Elementary 83 K-12 School 3416 4th Ave S 55408 112715 1993 530.56 53.8 59.9 80.2 85.7
Hale Elementary 42 K-12 School 1220 East 54th Street 55417 74619 1930 270.58 93.7 103.1 156.5 164.6
Hall Elementary 40 K-12 School 1601 Aldrich Ave N 55411 79840 1960 705.19 82.2 90.8 143.8 152.8
Harrison -other Not Available Other 501 Irving Ave N 55405 52802 1998 478.57 78.3 86 145.4 153.4
Henry Senior High 65 K-12 School 4320 Newton Ave N 55412 227525 1926 1667.81 75 84.1 121.8 132.9 Hiawatha Elementary Not Available K-12 School 4201 42nd Ave S 55406 39042 1925 353.2 136.7 155.7 166.1 185.8
Jefferson Elementary 38 K-12 School 1200 West 26th Street 55405 133451 1925 892.06 72.6 81.1 112.5 121.4
Jordan Park Not Available K-12 School 1501 30th Ave N 55430 123293 1999 1970.46 120.8 118.6 250.2 242.9 Keewaydin Elementary Not Available K-12 School 5209 30th Ave S 55417 44050 1934 556.73 145.2 162.8 215.6 234.1
Kenny Elementary 39 K-12 School 5720 Emerson Ave S 55419 61776 1954 504.73 91 101.8 138.4 149.7 Kenwood Elementary 43 K-12 School 2013 Penn Ave S 55405 61300 1925 445.82 71.3 79.1 119.7 127.8
Lake Harriet Lower Campus (Audubon) Not Available K-12 School 4030 Chowen Ave S 55410 37540 1925 395.79 116.4 130.2 178.2 192.6
Lake Harriet Upper Campus (Fulton) 49 K-12 School 4912 Vincent Ave S 55410 77238 1925 636.47 81.5 90.5 135.9 145.2

12
Minneapolis Public School Buildings
Property Name ENERGY
STAR Score
Property Type Address Postal
Code Floor Area
(Buildings & Parking) (ft²)
Year Built
Total GHG Emissions (MtCO2e)
Site EUI (kBtu/ft²)
Weather Normalized Site
EUI (kBtu/ft²) Source EUI
(kBtu/ft²)
Weather Normalized Source EUI
(kBtu/ft²) Longfellow Elementary Not Available K-12 School 3017 E 31st Street 55406 44813 1925 485.69 133.3 150.1 188.1 205.7
Loring Elementary 49 K-12 School 2600 44th Ave N 55412 60096 1928 433.87 82.8 92.8 123.1 133.6 Lucy Laney Elementary 35 K-12 School 3333 Penn Ave N 55412 111726 2000 1198.83 82.1 88.2 168.3 172.8
Lyndale Elementary 70 K-12 School 3333 Grand Ave S 55408 91786 1966 545.06 46.3 50.3 93.5 97.7
Marcy Elementary 51 K-12 School 415 4th Ave SE 55414 76906 1992 710.59 68.8 73.7 144.3 147.9 Nellie Stone Johnson Elementary
36 K-12 School 807 27th Ave N 55411 123000 2001 1201.94 76.5 82.2 153.9 157.8
North Senior High Not Available K-12 School 1500 James Ave N 55411 283568 1972 3855.72 114.9 125.8 217.2 228.6
Northeast Middle Not Available K-12 School 2955 Hayes Street NE 55418 176336 1956 1880.56 107.9 119.9 176.7 189.3 Northrop at Ericsson 36 K-12 School 4315 31st Ave S 55406 57874 2007 283.25 38.7 39.2 77.2 78.9
Olson Middle School Not Available K-12 School 1607 51st Ave N 55430 117825 1962 1407.74 114.5 126.7 195.7 208.5
Pillsbury Elementary 50 K-12 School 2250 Garfield Street
NE 55418 83906 1991 671.04 61.2 66.4 125.5 130.9
Pratt Community Center 66 K-12 School 66 Malcom Street SE 55414 42032 1925 214.62 46.4 51.1 82.7 87.7
Ramsey Elem / Washburn Senior 45 K-12 School 201 West 49th Street 55409 403234 1925 3880.6 87.1 96 155.8 165.1
Roosevelt Senior High 37 K-12 School 4029 28th Ave S 55406 307029 1925 2790.75 92.5 102.8 150.8 161.6
Sanford Middle School 32 K-12 School 3524 42nd Ave S 55406 122380 1926 760.22 86.3 97.8 111.3 123.4
Seward Elementary 69 K-12 School 2309 28th Ave S 55406 77300 1965 724.8 76.6 84.4 148.8 159 Sheridan Elementary Not Available K-12 School 1201 University Ave
NE 55413 126286 1932 1264.72 120.6 135.9 172.9 189.5
South Senior High 35 K-12 School 3131 19th Ave S 55407 278843 1968 3060.16 84.5 91.6 172.3 179.9 Southwest Senior High 47 K-12 School 3414 West 47th street 55410 254560 1939 2556.77 99.3 112.8 165.6 186
Sullivan Elementary 30 K-12 School 3100 E 28th Street 55406 204925 1991 1931.46 80.8 88.6 151 159.1
W. Harry Davis Academy Elementary
36 K-12 School 1510 Glenwood Ave 55405 94282 1995 680.77 63.2 69.4 116.1 122.6
Waite Park Elementary Not Available K-12 School 1800 34th Ave S 55418 59085 1950 670.02 101.5 110.8 183.2 191
Wenonah Elementary 45 K-12 School 5625 23rd Ave S 55417 42648 1952 442.2 107.5 119.7 172.8 185.5
Whittier Elementary 50 K-12 School 315 West 26th Street 55404 129998 1997 998.39 55.5 59.8 119.3 123.9 Wilder / Transition Plus Not Available Other 3345 Chicago Ave 55407 193000 1975 1841.75 106.2 111.8 161.6 167.5
Windom Elementary 34 K-12 School 5821 Wentworth Ave S 55419 67466 1925 650.28 81.7 89.5 154.1 162.2

13
Minneapolis Park and Recreation Buildings
Property Name ENERGY
STAR Score
Property Type Address Postal
Code Floor Area
(Buildings & Parking) (ft²)
Year Built
Total GHG Emissions (MtCO2e)
Site EUI (kBtu/ft²)
Weather Normalized
Site EUI (kBtu/ft²)
Source EUI (kBtu/ft²)
Weather Normalized Source EUI
(kBtu/ft²) MPRB
Headquarters 81 Office 2117 W River Rd 55411 75327 2001 833.29 59.9 63.1 164.7 170
Northeast Ice Arena Not Available Other 1306 Central Ave N 55411 32772 1996 377.48 91.5 99.6 181.9 190.4
Parade Park Ice - North Not Available Other 610 Kenwood Parkway 55403 40195 1988 Not Available Not
Available Not Available Not Available Not Available
Parade Park Ice - South Not Available Other 600 Kenwood Pkwy 55403 34351 1988 1113.8 262.4 286.1 513.8 538.6
Phillips Pool & Gym Park Not Available Other 2323 11th Ave S 55404 41395 1978 426.48 73 77.1 159.5 160.6
Southside Operations Center Not Available Other 3800 Bryant Ave S 55409 58683 1986 642.76 86.5 95.7 172.8 186.1
14
Glossary of terms Btu - British Thermal Unit A unit of energy, which can represent both thermal energy and electricity. One BTU is the amount of energy required to raise one pound of water one degree Fahrenheit. These are some Btu conversions for other units of energy:
1 kWh of electricity = 3413 Btu 1 therm of natural gas = 100,000 Btu kBtu = 1,000 Btus mmBtu = 1,000,000 Btus
ENERGY STAR Rating The 1-100 ENERGY STAR score was developed by the Environmental Protection Agency (EPA) and provides a metric for comparison with other similar buildings across the country. The score accounts for differences in climate, occupancy and operating hours. A score of 50 represents median energy performance, while a score of 75 or better indicates a building is a top performer. For more information, read How the 1-100 ENERGY STAR score is calculated.
Energy Auditing An evaluation of a building’s energy performance, to assess how much energy is being used and to identify opportunities to improve efficiency. The process typically involves a review of energy bills as well as a site visit to examine the building shell and mechanical systems.
Energy Benchmarking The process of comparing a building’s energy performance to other similar properties, based on a standard metric. Energy Star Portfolio Manager was the software used to benchmark the public buildings in this report, and the metric for comparison is Energy Use Intensity (EUI).
Energy Use Intensity (EUI) The metric used for comparing buildings in Energy Star, EUI expresses a building’s energy use relative to its size. In this report it is expressed as kBtu/ft², and is calculated by taking the total energy consumed in a year (in kBtu) and dividing it by the floor area of the building (in ft²).
Source EUI Source energy represents the total amount of raw fuel that is required to operate the building. It incorporates all transmission, delivery, and production losses. By taking all energy use into account, the metric provides a complete assessment of energy efficiency in a building.
Site EUI Site energy represents the amount of heat and electricity consumed by a building as reflected in your utility bills. This is a relevant metric for facility managers, to understand how a building’s energy use has changed over time. Site EUI does not, however, account for the environmental impacts of transmission and delivery of energy. Site energy sources for public buildings in this report include: electricity, natural gas, chilled water and steam.
This report includes both the Site and Source EUI for all buildings reported.
Total GHG Emissions (MtCO2e) The metric used in this report for greenhouse gas emissions, which represent a million metric tons of carbon dioxide equivalents. Equivalent CO2 (CO2e) is a universal standard measurement for greenhouse gasses and their ability to trap heat in the atmosphere. These greenhouse gasses include carbon dioxide, methane, nitrous oxide and chloroflouro-carbons. Greenhouse gas emissions for individual buildings are calculated using the ENERGY STAR Portfolio Manager Methodology for Greenhouse Gas Inventory and Tracking Calculations.
Weather normalized When energy use is adjusted to account year-to-year weather differences, allowing for comparison of a building to itself over time. Through this procedure, the energy in a given year is adjusted to express the energy that would have been consumed under 30-year average weather conditions.