2012 elections: nation, state and county
DESCRIPTION
2012 Elections: Nation, State and County. Dan Nataf, Ph.D. Director, Center for the Study of Local Issues Anne Arundel Community College www2.aacc.edu/csli. Goals. Presidential Election – overview of 2012 results Raw vote count, Electoral College Change from 2008 - PowerPoint PPT PresentationTRANSCRIPT

2012 Elections: Nation, State and
CountyDan Nataf, Ph.D.
Director, Center for the Study of Local IssuesAnne Arundel Community College
www2.aacc.edu/csli

Goals• Presidential Election – overview of 2012 results
− Raw vote count, Electoral College− Change from 2008− Pollster tracking polls and predictions− Exit polls – voter coalitions for Obama and Romney− Lessons – Democratic Lean…
• Maryland− Presidential vote− Referenda results− Lessons: Blue Maryland
• Anne Arundel County− Presidential vote− Referenda vote− Lessons: Purple County

National ResultsPopular Vote
Electoral College
Obama 51 332
Romney 47 206
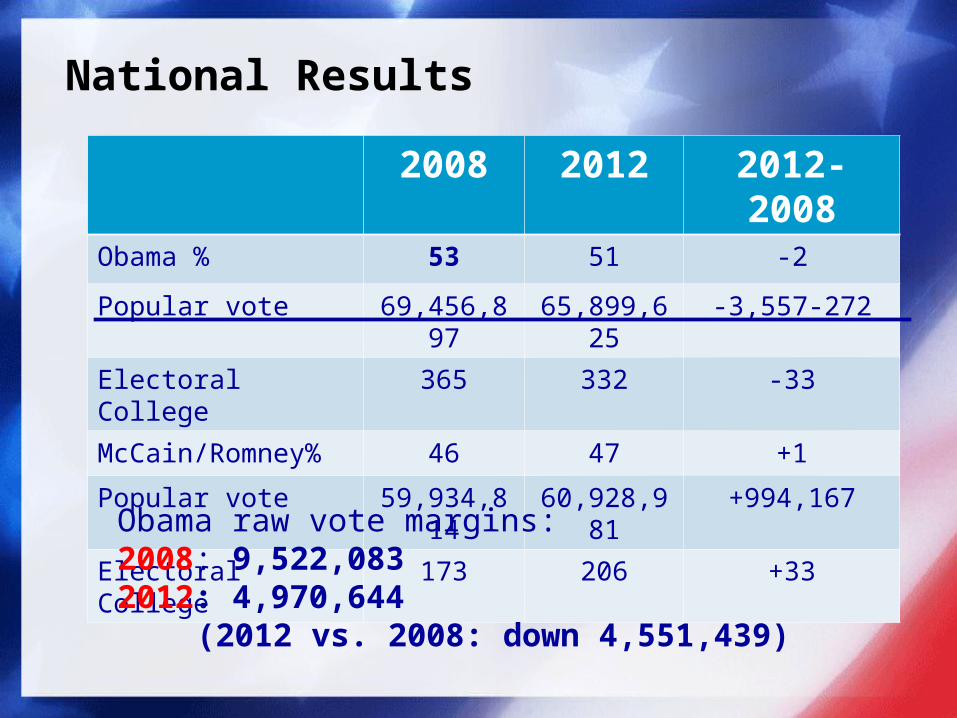
National Results
2008 2012 2012-2008
Obama % 53 51 -2
Popular vote 69,456,897
65,899,625
-3,557-272
Electoral College 365 332 -33
McCain/Romney% 46 47 +1
Popular vote 59,934,814
60,928,981
+994,167
Electoral College 173 206 +33Obama raw vote margins: 2008: 9,522,083 2012: 4,970,644
(2012 vs. 2008: down 4,551,439)

Popular Vote: 1952-2012

Electoral College Percentages: 1952-2012
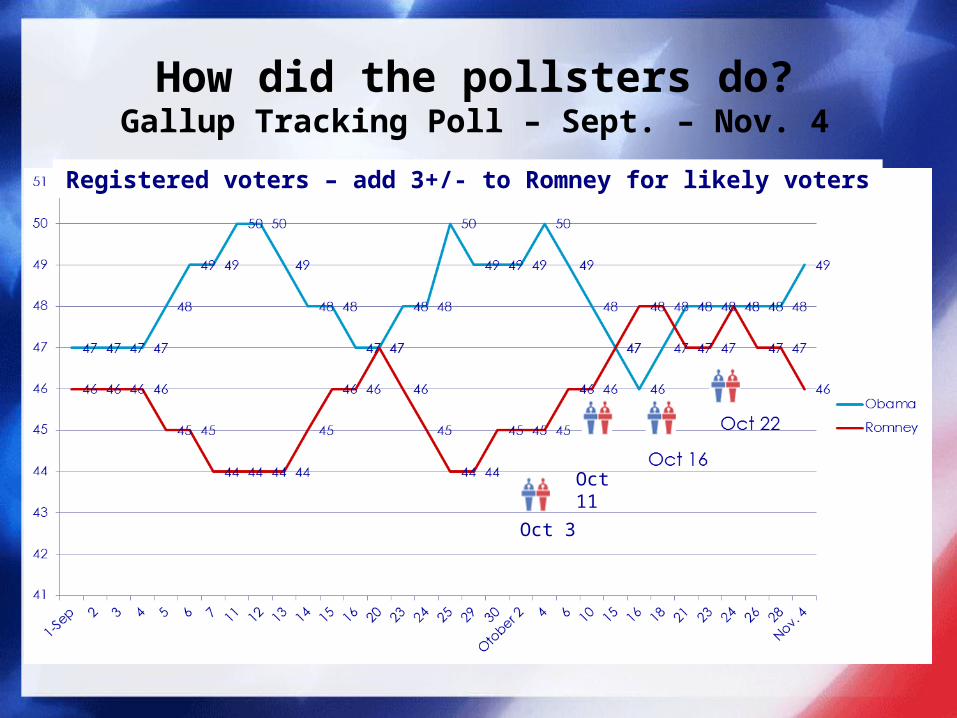
How did the pollsters do?Gallup Tracking Poll – Sept. – Nov. 4
Oct 3
Oct 11
Registered voters – add 3+/- to Romney for likely voters

How did the pollsters do:Washington Post/ABC Daily Tracking Poll
(Likely voters)

Battleground Vote Estimates 11-1
Colorado Obama RomneyVotamatic Drew Linzer votamatic.org/ (+8) 51 49Nate Silver fivethirtyeight.blogs.nytimes.com/author/nate-silver/ (+3) 50.1 48.9RCP www.realclearpolitics.com/ 48.6 47.7
Average 49.9 48.5Actual results 51 47
FloridaVotamatic 50 50Silver 49.4 50.1RCP 47.9 49.1
Average 49.1 49.7Actual results 50 49
IowaVotamatic 51.7 48.3Silver 51 48RCP 48.2 46.2
Average 50.3 47.5Actual results 52 46
NevadaVotamatic 52 48Silver 51.3 47.8RCP 50 47.3
Average 51.1 47.7Actual results 52 46
New HampshireVotamatic 51.7 48.3Silver 51 48.2RCP 48.8 47.5
Average 50.5 48Actual results 52 46
Obama RomneyNorth Carolina
Votamatic 49 51Silver 48.4 51RCP 46 49.8
Average 47.8 50.6Actual results 48 51
OhioVotamatic 51.6 48.4
Silver 50.7 48.1RCP 48.9 46.6
Average 50.4 47.7Actual results 50 48
VirginiaVotamatic 51 49
Silver 50.1 49.2RCP 47.9 47.4
Average 49.7 48.5Actual results 51 48
WisconsinVotamatic 52.4 47.6
Silver 51.6 47.6RCP 50 45
Average 51.3 46.7Actual results 53 46
Total Votamatic None None
Silver 50.5 48.6RCP 47.4 47.3
Average 49 4850 48
Electoral CollegeVotamatic (and actual results) 332 206Silver 300 237RCP 290 248Average 307 230

Exit Poll: DemographicsTrait Obama Romne
y
Men (47% ) 45 52
Women (53%) 55 44
18-29 (19%) 60 37
30-44 (27%) 52 45
45-64 (38%) 47 51
65+ (16%) 44 56
Urban (32%) 62 36
Suburban (47%)
48 50
Rural (21%) 39 59
White (72%) 39 59
Black (13%) 93 7
Latino (10%) 71 27
Trait Obama Romney
Liberal (25%) 86 14
Moderate (41%) 56 41
Conservative (35% )
17 82
Republican (32%)
7 93
Independent (29%)
45 50
Democrat (38% ) 92 8
<$100k (72%) 54 44
>$100 (28%) 44 54
Protestant (53%)
42 57
Catholic (25%) 50 48
None (12%)
70 26

Exit Poll: IssuesIssue Obama Romne
y
Abortion legal (59%)
67 31
Abortion illegal (36%)
22 77
Health Care (18%) 75 24
Housing market (8%)
63 32
Foreign Policy (5%) 56 33
Unemployment (38%)
54 44
Taxes (14%) 32 66
Deficit (15%) 32 66
Economy (59%) 47 51
Rising Prices (37%)
49 49
Issue Obama Romney
Don’t repeal HC reform (44%)
87 13
Repeal (49%) 15 83
Increase taxes for all (13%)
52 44
Increase taxes for rich (47%)
70 29
No tax increase (35%)
23 75
Most illegal immigrants should be offered legal status (65%)
61 37
Deport (28%) 24 73
More in touch - Obama/Romney (53%)/(43%)
91 98

National Lessons• Presidential elections: Trending Democratic, regional
divide, maximize base turnout
• Democratic issues: pro-choice, health reform, foreign policy, tax rich, immigration reform
• Solid Democratic voters: Liberals, African-Americans, Latinos, seculars, single, under 30
• Lean Democratic: moderates, 30-44, women,
• Uncertain: Suburbanites, Catholics (economy/inflation)
• Republican issues: pro-life, no tax increases, less spending/deficit, no immigration reform
• Lean Republican: unaffiliated/indep., Protestants, married, males, 45-64, 65+
• Solid Republican: Conservatives, rural, white, southern

Maryland: Presidential Results – Solidly Democratic
2008 (%) 2012 (%) 2012-2008
Obama 61.9 62 +.1
McCain/Romney 36.5 35.9 -.6
Actual votes
2008 2012 2012-2008
Obama 1,629,467 1,677,844 +48347
McCain/Romney
959,862 971,869 +12007

Presidential Vote by County, % Supporting

Redistricting by County, % Supporting
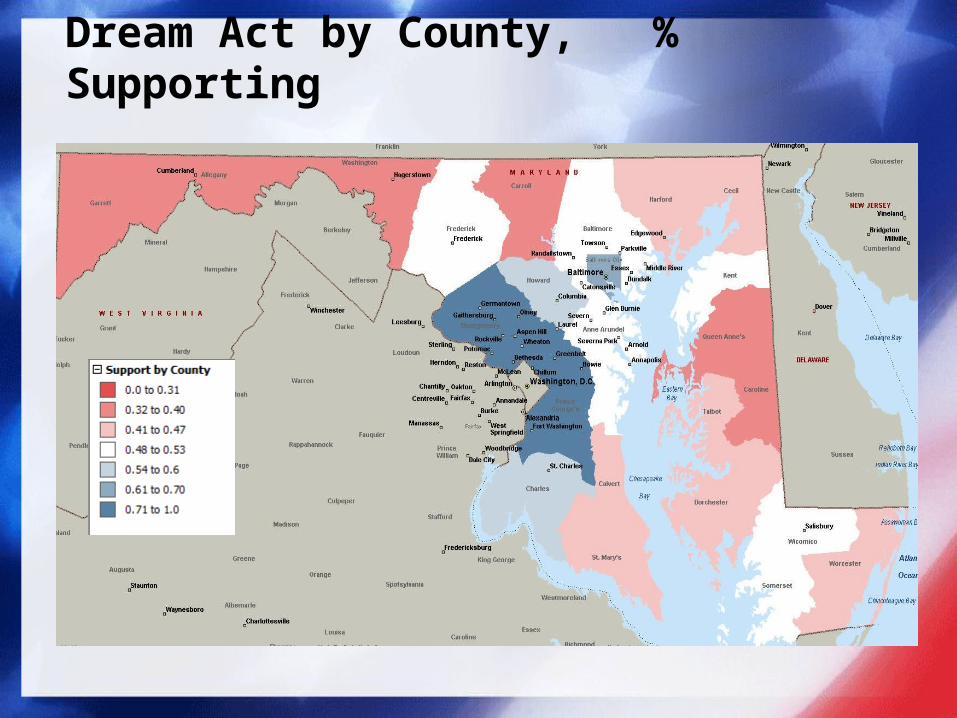
Dream Act by County, % Supporting

Casino Approval by County
Support by County0.0 to 0.31
0.32 to 0.40
0.41 to 0.47
0.48 to 0.53
0.54 to 0.6
0.61 to 0.70
0.71 to 1.0
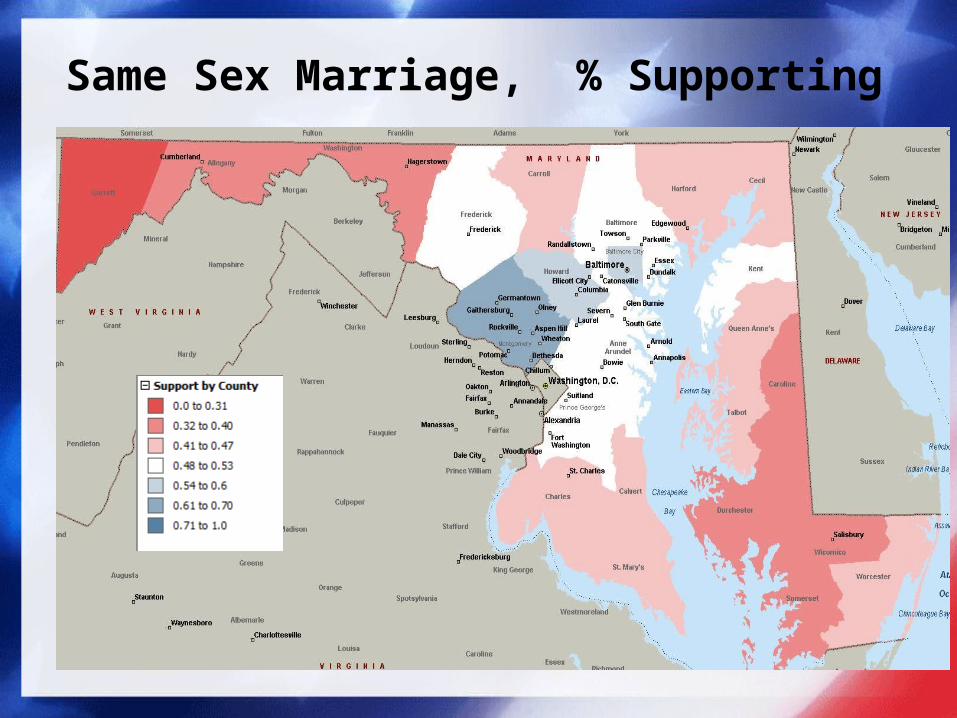
Same Sex Marriage, % Supporting

Lessons for State Elections
• Democratic hegemony remains unchanging
• Solid Democratic jurisdictions – Montgomery, PG, Charles, Baltimore City
• Lean Democratic - Howard, Baltimore County
• Battleground Counties: Anne Arundel, Kent, Somerset, Wicomico, Dorchester

Anne Arundel County – Council Districts

Anne Arundel County State Legislative Districts

Anne Arundel County:Presidential Vote: 2008 vs. 2012

AA County Election Lessons• County has purple qualities – support some
Democratic initiatives (SSM, redistricting) but less so others (Dream Act, Casinos)
• Maximum turnout election results in very closely divided electorate
• Local Democratic candidates – can they run as liberal as state/national party/candidates?
• Local Republican candidates – how conservative can they be?
• Council districts seem evenly split: Dem: 1, 4, 6; Rep: 3,5, 7. Battleground district is 2

AAC: Obama Vote by Demographics
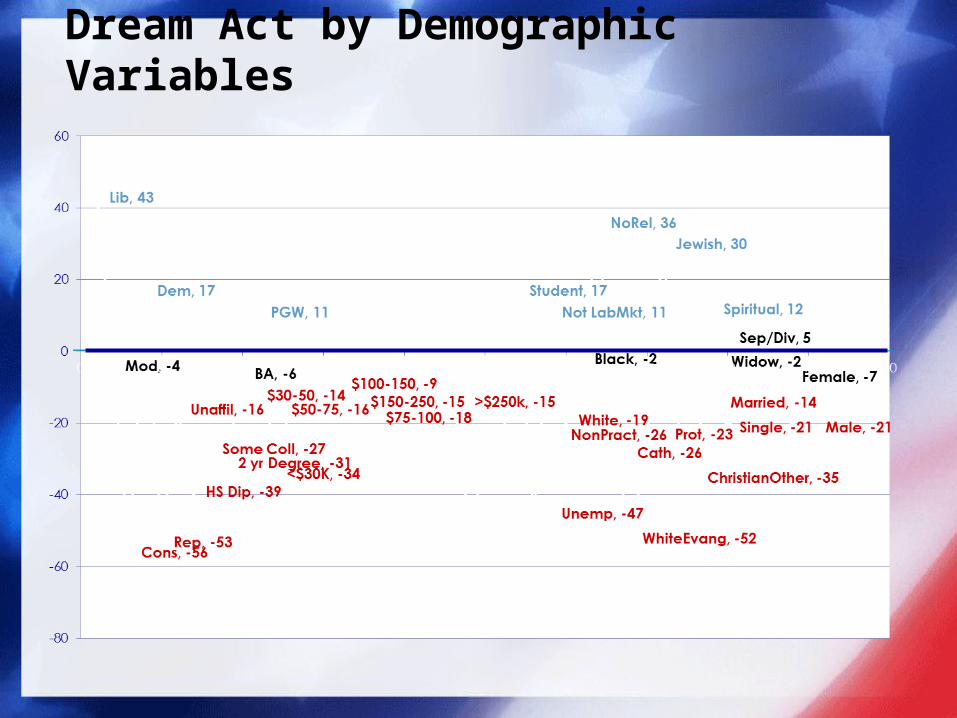
Dream Act by Demographic Variables

Same Sex Marriage by Demographics

Dream Act by Demographic Variables
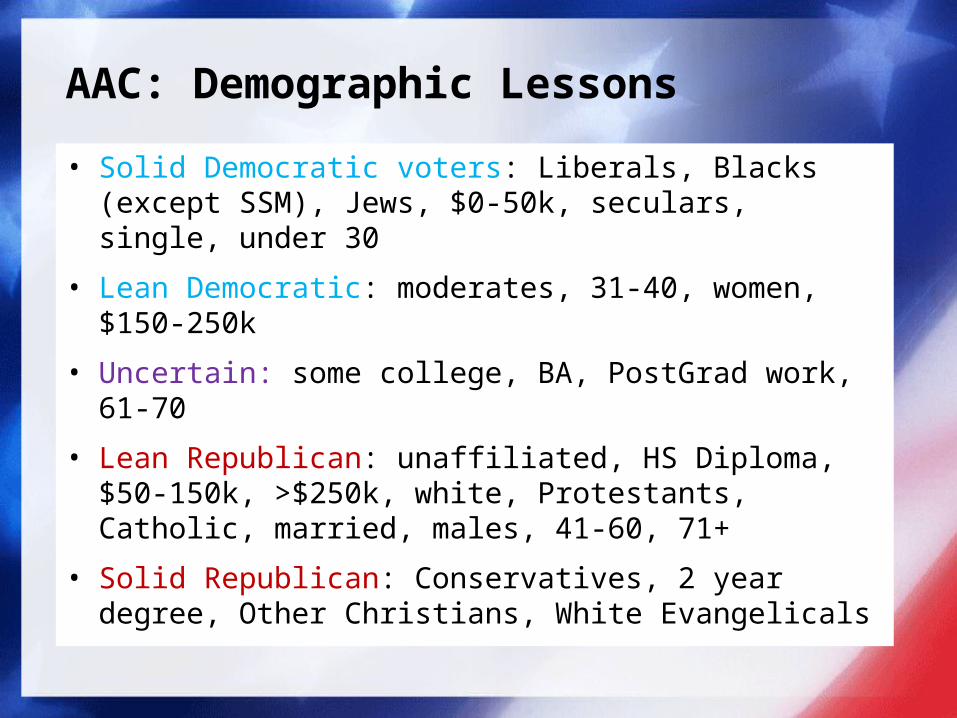
AAC: Demographic Lessons
• Solid Democratic voters: Liberals, Blacks (except SSM), Jews, $0-50k, seculars, single, under 30
• Lean Democratic: moderates, 31-40, women, $150-250k
• Uncertain: some college, BA, PostGrad work, 61-70
• Lean Republican: unaffiliated, HS Diploma, $50-150k, >$250k, white, Protestants, Catholic, married, males, 41-60, 71+
• Solid Republican: Conservatives, 2 year degree, Other Christians, White Evangelicals