2012 crash summary - north dakota department of transportation
TRANSCRIPT

North Dakota Crash Summary2017

A Message fromthe NDDOT Director
Motor vehicle crashes are the leading cause of injury-related death in North Dakota While the North Dakota Department of Transportation (NDDOT) is continually making highway improvements, there is still work to be done In January 2018, the NDDOT, North Dakota Highway Patrol, North Dakota Department of Health and the Governor’s Offi ce, came together to launch Vision Zero: Zero fatalities. Zero excuses. The Vision Zero strategy aims to establish a culture of personal responsibility where motor vehicle fatalities and serious injuries are recognized as preventable and not tolerated
Vision Zero will be implemented through various safety strategies including: (1) widespread public education/outreach, (2) working with the legislature to ensure state laws represent best practices in traffi c safety, (3) high visibility enforcement of existing laws, (4) technology advancements and (5) infrastructure/road safety improvements
We are asking every driver and vehicle occupant in North Dakota to help us meet the Vision Zero goal of zero motor vehicle fatalities and serious injuries on North Dakota roads by taking personal responsibility when traveling This means always wearing a seat belt, transporting children in child passenger safety seats appropriate for the child’s age, height, and weight, driving distraction free, driving sober (i.e. not under the infl uence of alcohol and/or drugs), and obeying all posted speed limits and all other traffi c laws.
The Vision Zero goal of zero fatalities and serious injuries is attainable and vital When it comes to your life and the lives of your family and friends, is any other number acceptable? Let us all arrive at our destination safely by each taking a role in Vision Zero
Thomas SorelNDDOT Director
About This Document
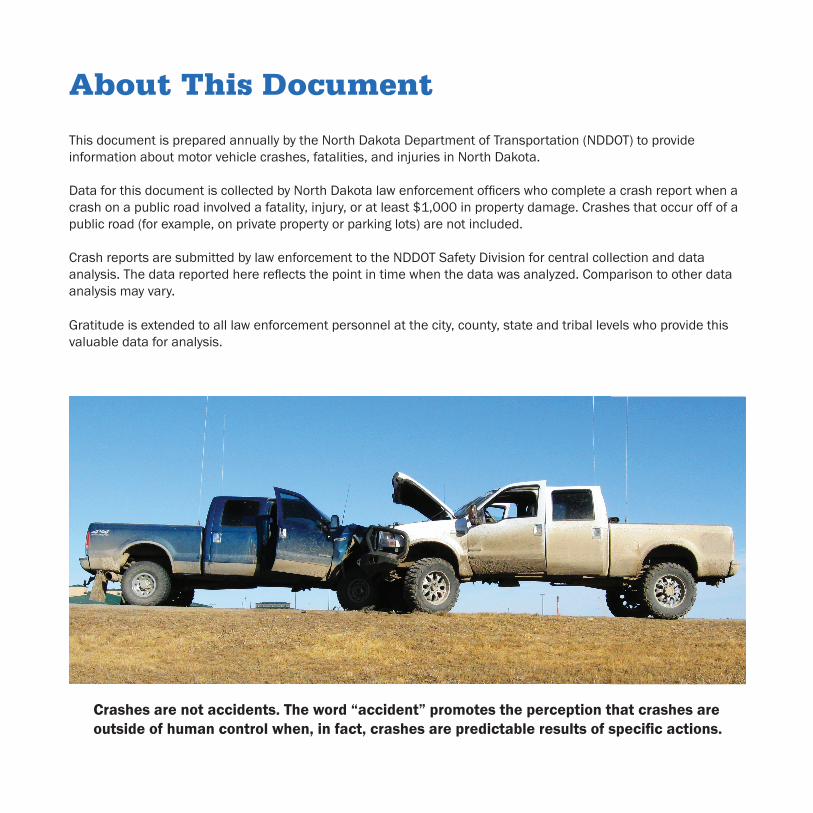
This document is prepared annually by the North Dakota Department of Transportation (NDDOT) to provide information about motor vehicle crashes, fatalities, and injuries in North Dakota
Data for this document is collected by North Dakota law enforcement offi cers who complete a crash report when a crash on a public road involved a fatality, injury, or at least $1,000 in property damage Crashes that occur off of a public road (for example, on private property or parking lots) are not included
Crash reports are submitted by law enforcement to the NDDOT Safety Division for central collection and data analysis. The data reported here refl ects the point in time when the data was analyzed. Comparison to other data analysis may vary
Gratitude is extended to all law enforcement personnel at the city, county, state and tribal levels who provide this valuable data for analysis
Crashes are not accidents. The word “accident” promotes the perception that crashes are outside of human control when, in fact, crashes are predictable results of specifi c actions.

Table of Contents
Executive Summary 1
Vehicle Crashes, Fatalities & Injuries in North Dakota: 2-3 A Decade in Review (2008-2017)
2017 Vehicle Crashes, Fatalities & Injuries in North Dakota 4-7
Occupant Protection 8-9
Impaired Driving 10
Distracted Driving 11
Speed 12
Teen Drivers 13
Bicycles and Pedestrians 14
Motorcycles and Off-Highway Vehicles 15
Preventing Vehicle Crashes, Fatalities & Injuries 16
Do you want to get involved in motor vehicle crash prevention? 17
North Dakota Crash Memorial Wall 18
1
Executive Summary
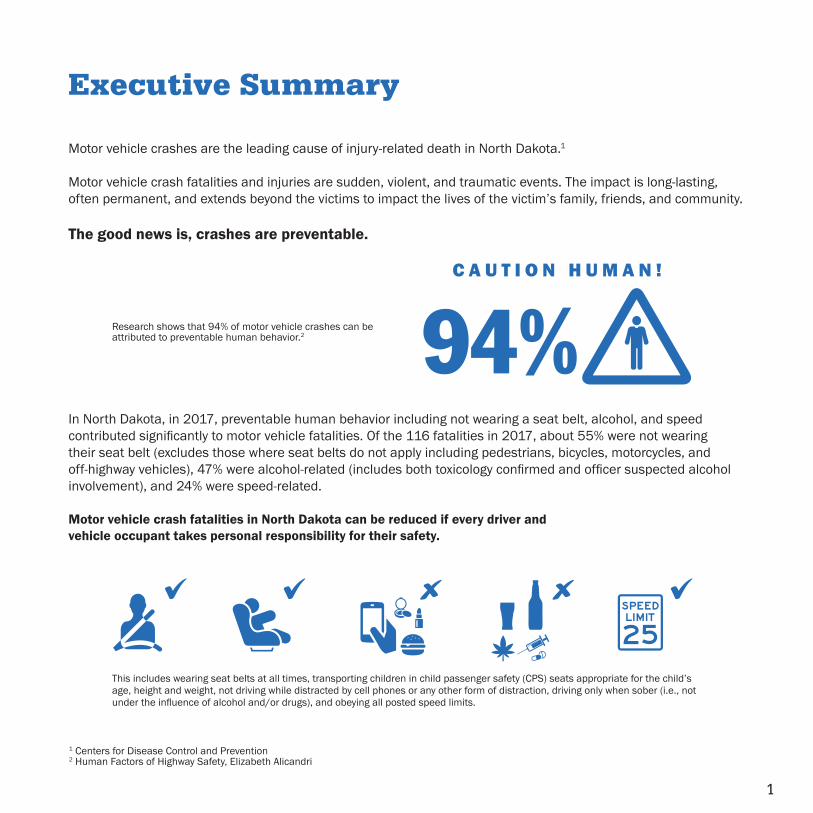
Motor vehicle crashes are the leading cause of injury-related death in North Dakota 1
Motor vehicle crash fatalities and injuries are sudden, violent, and traumatic events The impact is long-lasting, often permanent, and extends beyond the victims to impact the lives of the victim’s family, friends, and community
The good news is, crashes are preventable.
In North Dakota, in 2017, preventable human behavior including not wearing a seat belt, alcohol, and speed contributed significantly to motor vehicle fatalities. Of the 116 fatalities in 2017, about 55% were not wearing their seat belt (excludes those where seat belts do not apply including pedestrians, bicycles, motorcycles, and off-highway vehicles), 47% were alcohol-related (includes both toxicology confirmed and officer suspected alcohol involvement), and 24% were speed-related.
Motor vehicle crash fatalities in North Dakota can be reduced if every driver and vehicle occupant takes personal responsibility for their safety.
1 Centers for Disease Control and Prevention 2 Human Factors of Highway Safety, Elizabeth Alicandri
Research shows that 94% of motor vehicle crashes can be attributed to preventable human behavior 2
This includes wearing seat belts at all times, transporting children in child passenger safety (CPS) seats appropriate for the child’s age, height and weight, not driving while distracted by cell phones or any other form of distraction, driving only when sober (i e , not under the influence of alcohol and/or drugs), and obeying all posted speed limits.

2
There are more than 15,000 vehicle crashes in North Dakota each year resulting in fatalities, injuries, and property damage
The highest number of fatalities over this 10-year period occurred in 2012 (170), followed by a steady decrease in fatalities through 2016. There was a 2.7% increase in fatalities from 2016 to 2017.
In the United States (U.S.), more than 30,000 lives are lost to vehicle crashes each year compared to more than 100 lives lost to crashes each year in North Dakota
Year Crashes Fatalities Injuries
2008 16,387 104 4,247
2009 17,673 140 4,462
2010 17,076 105 4,687
2011 18,823 148 5,018
2012 18,356 170 5,311
2013 18,977 148 5,365
2014 16,134 135 5,278
2015 15,077 131 4,917
2016 15,017 113 4,614
2017 15,280 116 4,432
North Dakota Motor Vehicle Crashes, Fatalities and Injuries, 2008-2017
North Dakota Motor Vehicle Fatalities 2008-2017
Vehicle Crashes, Fatalities & Injuries in North Dakota:A Decade in Review (2008-2017)
30,000+ /YEAR
100+ /YEAR

3
However, with the exception of 2016, North Dakota’s fatality rate per 100 million vehicle miles traveled (VMT) is consistently higher than the national rate VMT is a measure of crash exposure - the more vehicle miles driven, the greater the exposure to the risk of a crash
North Dakota vs. United StatesMotor Vehicle Fatality Rate, 2008-2017
North Dakota People, Drivers and Vehicles, 2008-2017
North Dakota vs. United States Motor Vehicle Fatalities and Vehicle
Fatality Rate, 2008-2017
Year ND Fatalities
ND Fatality Rate*
U.S. Fatalities
U.S. Fatality Rate*
2008 104 1.37 37,423 1.26
2009 140 1.76 33,883 1 15
2010 105 1.26 32,999 1 11
2011 148 1.61 32,479 1 10
2012 170 1.68 33,782 1 14
2013 148 1 47 32,893 1 10
2014 135 1 29 32,744 1 08
2015 131 1.30 35,485 1 15
2016 113 1.16 37,461 1 18
2017 116 1 20 37,150** 1.17**
*Number of fatalities per 100 million vehicle miles traveled.**2017 fi gures are preliminary (NHTSA, May 2018).
According to the U S Census Bureau, North Dakota’s population increased by nearly 114,000 people over the past 10 years
+114,000
2008 2017

4
In 2017, there were 116 individuals who lost their lives in motor vehicle crashes in North Dakota Those who died ranged in age from 3 to 90. The majority (84%) were North Dakota residents
Of the motor vehicle fatalities, 90 (78%) were in a passenger vehicle, 13 (11%) were motorcyclists, 5 (4%) were pedestrians, 3 (3%) were individuals on all-terrain vehicles (ATVs) and other miscellaneous vehicle types(such as snowmobiles, farm equipment and horse drawn wagons), 2 (2%) were bicyclists and 3 (3%) involved a motor vehicle and a train
Fatalities occurred in 36 (68%) of North Dakota’s 53 counties.
2017 Vehicle Crashes, Fatalities & Injuries in North Dakota
County Crashes Fatalities InjuriesAdams 42 2 10Barnes 211 3 62Benson 42 1 25Billings 36 0 7
Bottineau 87 4 32Bowman 27 0 11
Burke 33 1 12Burleigh 2,841 4 775
Cass 3,916 8 1,133Cavalier 35 1 17Dickey 58 0 13Divide 16 0 9Dunn 103 3 23Eddy 32 0 7
Emmons 57 0 14Foster 41 0 18
Golden Valley 16 0 5Grand Forks 1,591 7 423
Grant 16 1 7Griggs 21 0 5
Hettinger 26 0 6Kidder 49 0 29
Lamoure 48 2 22Logan 25 0 9
McHenry 83 1 19McIntosh 36 0 15McKenzie 393 10 145McLean 147 4 69Mercer 98 2 38Morton 637 1 157
Mountrail 133 8 65
North Dakota Motor Vehicle Crashes, Fatalities and Injuries by County, 2017
0 1 2 3 4 5 6 7 8 9 10
5
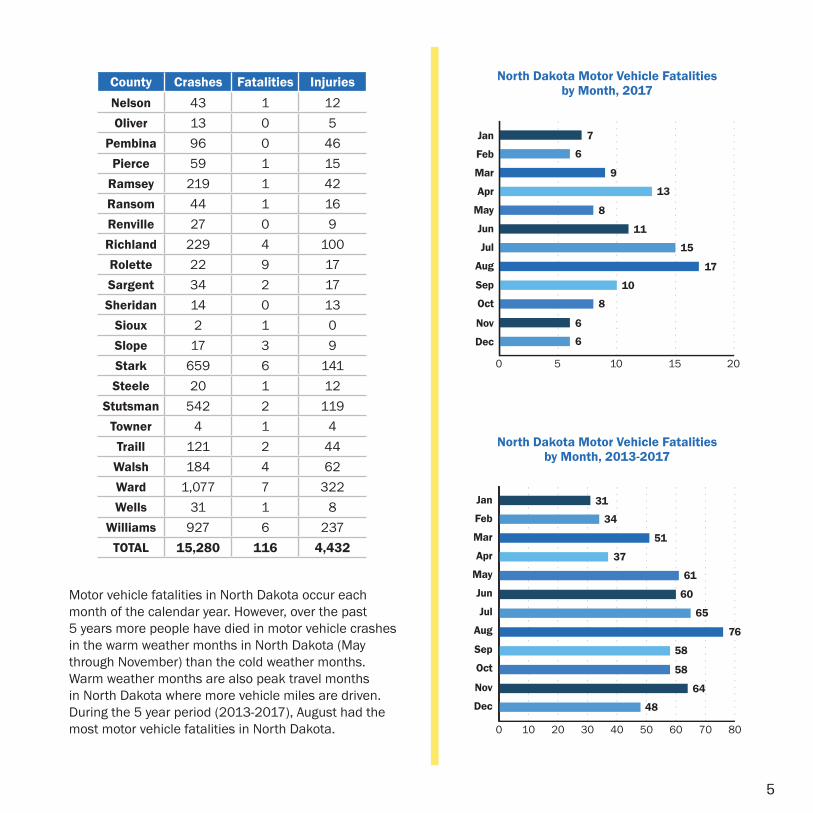
Motor vehicle fatalities in North Dakota occur each month of the calendar year However, over the past 5 years more people have died in motor vehicle crashes in the warm weather months in North Dakota (May through November) than the cold weather months Warm weather months are also peak travel months in North Dakota where more vehicle miles are driven During the 5 year period (2013-2017), August had the most motor vehicle fatalities in North Dakota
County Crashes Fatalities InjuriesNelson 43 1 12Oliver 13 0 5
Pembina 96 0 46Pierce 59 1 15
Ramsey 219 1 42Ransom 44 1 16Renville 27 0 9Richland 229 4 100Rolette 22 9 17Sargent 34 2 17Sheridan 14 0 13
Sioux 2 1 0Slope 17 3 9Stark 659 6 141Steele 20 1 12
Stutsman 542 2 119Towner 4 1 4Traill 121 2 44
Walsh 184 4 62Ward 1,077 7 322Wells 31 1 8
Williams 927 6 237TOTAL 15,280 116 4,432
North Dakota Motor Vehicle Fatalities by Month, 2017
North Dakota Motor Vehicle Fatalities by Month, 2013-2017

6
2017 Vehicle Crashes, Fatalities & Injuries in North Dakota (continued)
In 2017, males died in motor vehicle crashes 4 times more than females
Just over half, 51%, of those who died in motor vehicle crashes in North Dakota over the past 5 years were between the ages of 25 and 54
North Dakota Motor Vehicle Fatalities by Gender, 2017
North Dakota Motor Vehicle Fatalities by Gender, 2013-2017
80%
77%
20%
23%
North Dakota Motor Vehicle Fatalities by Age, 2017
North Dakota Motor Vehicle Fatalities by Age, 2013-2017

7
Over the past 5 years, drivers in fatal crashes in North Dakota were primarily between the ages of 25 and 64.
Historically, more fatalities occur during Memorial Day, Labor Day and Thanksgiving than other holidays. (Note: Data refl ects a multiple day period that varies per holiday and the day of the week on which the holiday falls )North Dakota Age of Drivers Involved in
Fatal Motor Vehicle Crashes, 2017
North Dakota Age of Drivers Involved in Fatal Motor Vehicle Crashes, 2013-2017
North Dakota Holiday Motor Vehicle Fatalities, 2017
North Dakota Holiday Motor Vehicle Fatalities, 2013-2017
New Years (1)
Labor Day(0)
(2)
(6)
(7)
(5)
(8)
(11)
Thanksgiving(1)
Christmas(0)
Memorial Day (1)
Independence Day (0)
8
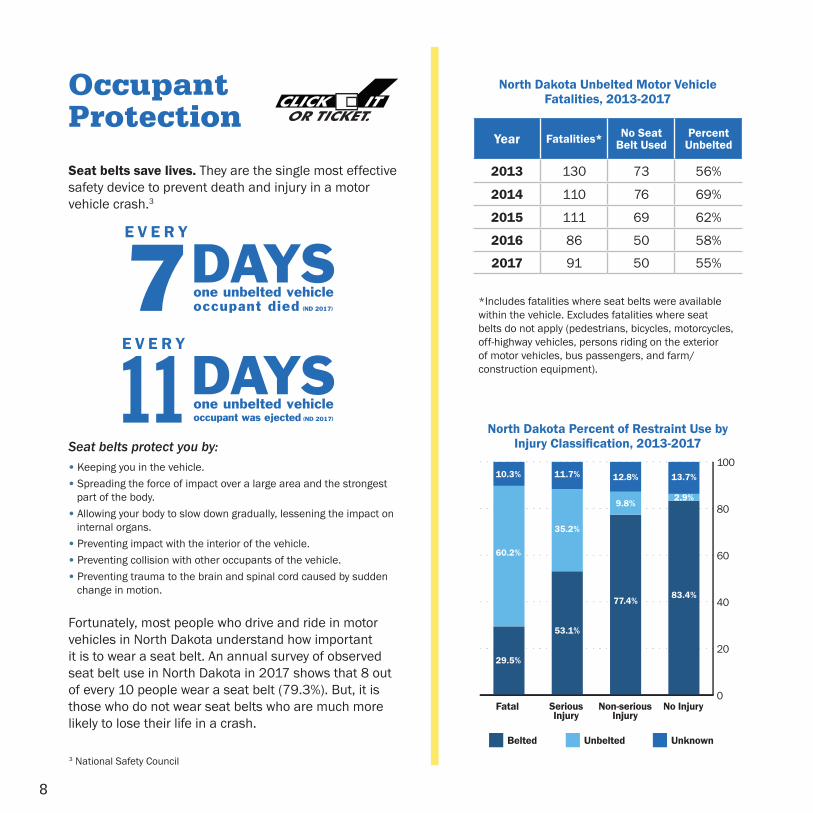
Seat belts save lives. They are the single most effective safety device to prevent death and injury in a motor vehicle crash 3
Seat belts protect you by:∙ Keeping you in the vehicle ∙ Spreading the force of impact over a large area and the strongest part of the body ∙ Allowing your body to slow down gradually, lessening the impact on internal organs ∙ Preventing impact with the interior of the vehicle ∙ Preventing collision with other occupants of the vehicle ∙ Preventing trauma to the brain and spinal cord caused by sudden change in motion
Fortunately, most people who drive and ride in motor vehicles in North Dakota understand how important it is to wear a seat belt An annual survey of observed seat belt use in North Dakota in 2017 shows that 8 out of every 10 people wear a seat belt (79.3%). But, it is those who do not wear seat belts who are much more likely to lose their life in a crash
Occupant Protection
Year Fatalities* No Seat Belt Used
Percent Unbelted
2013 130 73 56%
2014 110 76 69%
2015 111 69 62%
2016 86 50 58%
2017 91 50 55%
North Dakota Unbelted Motor Vehicle Fatalities, 2013-2017
North Dakota Percent of Restraint Use by Injury Classifi cation, 2013-2017
*Includes fatalities where seat belts were available within the vehicle Excludes fatalities where seat belts do not apply (pedestrians, bicycles, motorcycles, off-highway vehicles, persons riding on the exterior of motor vehicles, bus passengers, and farm/construction equipment)
3 National Safety Council
9
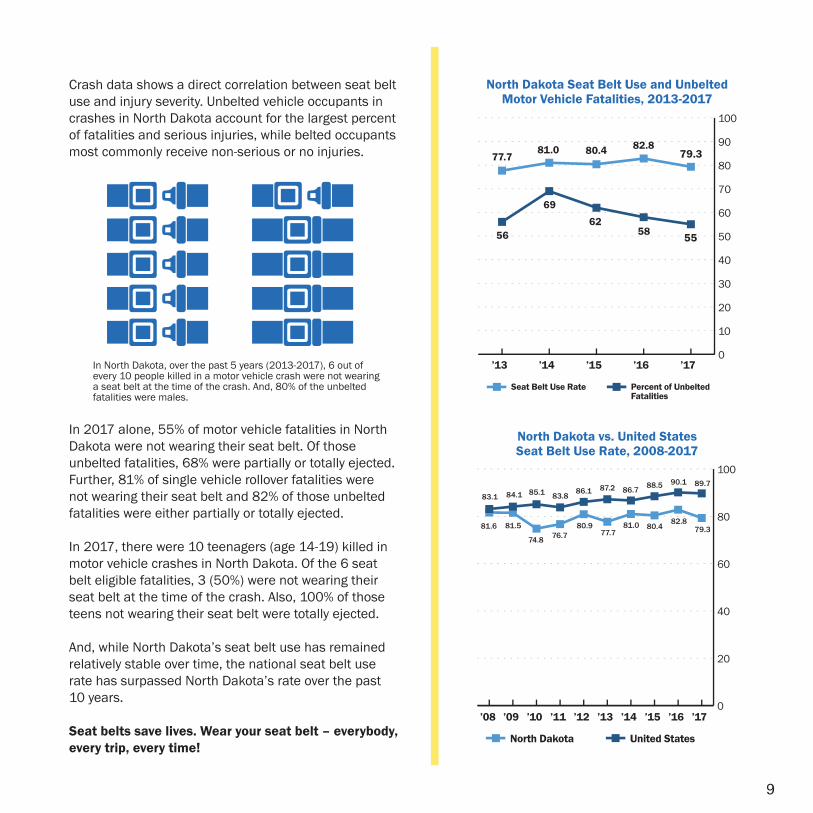
Crash data shows a direct correlation between seat belt use and injury severity Unbelted vehicle occupants in crashes in North Dakota account for the largest percent of fatalities and serious injuries, while belted occupants most commonly receive non-serious or no injuries
In North Dakota, over the past 5 years (2013-2017), 6 out of every 10 people killed in a motor vehicle crash were not wearing a seat belt at the time of the crash. And, 80% of the unbelted fatalities were males
In 2017 alone, 55% of motor vehicle fatalities in North Dakota were not wearing their seat belt Of those unbelted fatalities, 68% were partially or totally ejected. Further, 81% of single vehicle rollover fatalities were not wearing their seat belt and 82% of those unbelted fatalities were either partially or totally ejected
In 2017, there were 10 teenagers (age 14-19) killed in motor vehicle crashes in North Dakota. Of the 6 seat belt eligible fatalities, 3 (50%) were not wearing their seat belt at the time of the crash. Also, 100% of those teens not wearing their seat belt were totally ejected
And, while North Dakota’s seat belt use has remained relatively stable over time, the national seat belt use rate has surpassed North Dakota’s rate over the past 10 years
Seat belts save lives. Wear your seat belt – everybody, every trip, every time!
North Dakota Seat Belt Use and Unbelted Motor Vehicle Fatalities, 2013-2017
North Dakota vs. United States Seat Belt Use Rate, 2008-2017

10
Alcohol and drug-related crashes are 100% preventable. Many lives would be saved in North Dakota each year if every driver consistently makes the choice to drive sober and not while under the infl uence of alcohol and/or drugs
Yet, 295 people have died in alcohol-related crashes in North Dakota over the past 5 years Alcohol is a factor in about 40-50% of fatal crashes in North Dakota annually. The percent of alcohol-related crashes decreased annually between 2013 and 2016 but increased in 2017.
Approximately 1 in 6 (16%) adult arrests in North Dakota in 2017 were for Driving Under the Infl uence (DUI).4
The average blood alcohol content among DUI offenders in North Dakota is 15 – nearly twice the legal limit of 08
Drive sober.
ImpairedDriving
4 North Dakota Offi ce of Attorney General, Bureau of Criminal Investigation, Crime in North Dakota, 2017
Year Total Fatal Crashes Fatalities Injuries
2013 64 71 624
2014 53 63 564
2015 48 57 496
2016 43 49 446
2017 52 55 472
North Dakota Motor Vehicle Crashes, Fatalities and Injuries Involving Alcohol, 2013-2017
North Dakota Percent Alcohol-RelatedFatal Motor Vehicle Crashes, 2013-2017
11
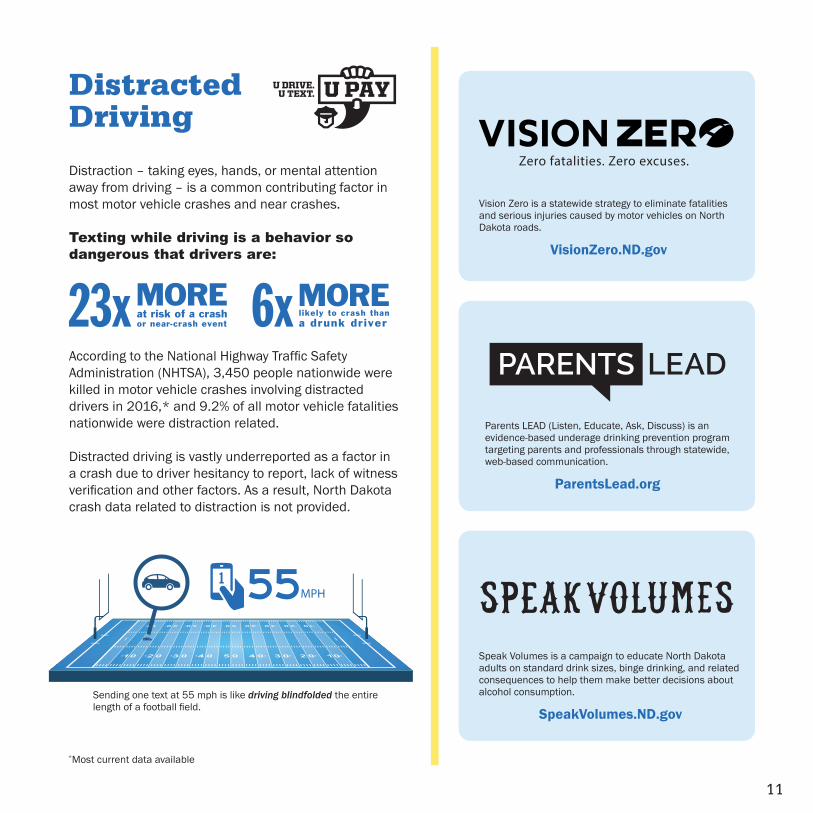
DistractedDriving
Distraction – taking eyes, hands, or mental attention away from driving – is a common contributing factor in most motor vehicle crashes and near crashes
Texting while driving is a behavior so dangerous that drivers are:
According to the National Highway Traffi c Safety Administration (NHTSA), 3,450 people nationwide were killed in motor vehicle crashes involving distracted drivers in 2016,* and 9.2% of all motor vehicle fatalities nationwide were distraction related
Distracted driving is vastly underreported as a factor in a crash due to driver hesitancy to report, lack of witness verifi cation and other factors. As a result, North Dakota crash data related to distraction is not provided
Vision Zero is a statewide strategy to eliminate fatalities and serious injuries caused by motor vehicles on North Dakota roads
VisionZero.ND.gov
Parents LEAD (Listen, Educate, Ask, Discuss) is an evidence-based underage drinking prevention program targeting parents and professionals through statewide, web-based communication
ParentsLead.org
Speak Volumes is a campaign to educate North Dakota adults on standard drink sizes, binge drinking, and related consequences to help them make better decisions about alcohol consumption
SpeakVolumes.ND.govSending one text at 55 mph is like driving blindfolded the entire length of a football fi eld.
*Most current data available
12
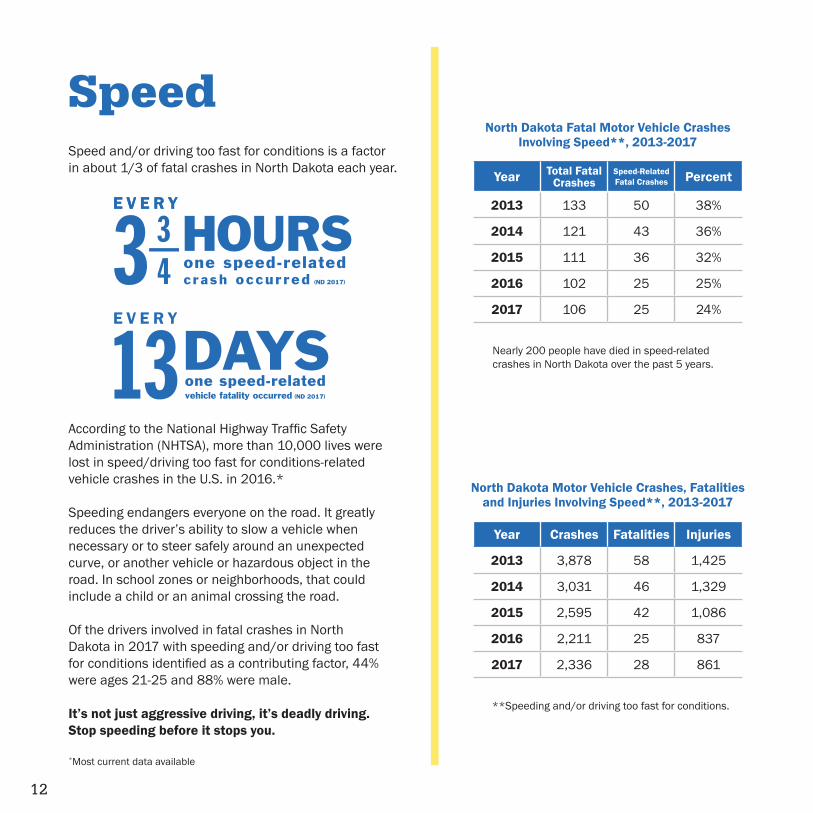
Speed and/or driving too fast for conditions is a factor in about 1/3 of fatal crashes in North Dakota each year.
According to the National Highway Traffi c Safety Administration (NHTSA), more than 10,000 lives were lost in speed/driving too fast for conditions-related vehicle crashes in the U.S. in 2016.*
Speeding endangers everyone on the road It greatly reduces the driver’s ability to slow a vehicle when necessary or to steer safely around an unexpected curve, or another vehicle or hazardous object in the road In school zones or neighborhoods, that could include a child or an animal crossing the road
Of the drivers involved in fatal crashes in North Dakota in 2017 with speeding and/or driving too fast for conditions identifi ed as a contributing factor, 44% were ages 21-25 and 88% were male.
It’s not just aggressive driving, it’s deadly driving. Stop speeding before it stops you.
Speed
Year Total Fatal Crashes
Speed-RelatedFatal Crashes Percent
2013 133 50 38%
2014 121 43 36%
2015 111 36 32%
2016 102 25 25%
2017 106 25 24%
North Dakota Fatal Motor Vehicle Crashes Involving Speed**, 2013-2017
**Speeding and/or driving too fast for conditions.
Year Crashes Fatalities Injuries
2013 3,878 58 1,425
2014 3,031 46 1,329
2015 2,595 42 1,086
2016 2,211 25 837
2017 2,336 28 861
North Dakota Motor Vehicle Crashes, Fatalities and Injuries Involving Speed**, 2013-2017
*Most current data available
Nearly 200 people have died in speed-related crashes in North Dakota over the past 5 years

13
Motor vehicle crashes are the leading cause of injury-related death for North Dakota teens 5 Teen driver inexperience, coupled with immaturity, often results in risk-taking behaviors such as speeding, alcohol use, and not wearing a seat belt – all of which contribute to an increased death rate 6
In North Dakota, teen drivers age 14-19 account for 5% of all licensed drivers but are behind the wheel in nearly 20% of all crashes.
Teen drivers were involved in 12% of fatal crashes in North Dakota And, over the past 5 years in North Dakota, 53 teens have died in vehicle crashes.
TeenDrivers
Year Total Fatal Crashes
Teen DriverFatal Crashes Percent
2013 133 11 8%
2014 121 16 13%
2015 111 14 13%
2016 102 11 11%
2017 106 13 12%
Year Total Crashes
Teen DriverCrashes Percent
2013 18,977 3,330 18%
2014 16,134 2,862 18%
2015 15,077 2,794 19%
2016 15,017 2,853 19%
2017 15,280 3,075 20%
North Dakota Teen Driver Involvement in Fatal Crashes, 2013-2017
North Dakota Teen Fatalities from Motor Vehicle Crashes, 2013-2017
North Dakota Teen Driver Involvement in All Crashes, 2013-2017
5 Centers for Disease Control and Prevention6 Governor’s Highway Safety Administration

14
Everyone has different preferences when it comes to transportation Regardless of mode of transport, being safe on the road is a responsibility shared by all Bicyclists and pedestrians have the same rights, privileges, and responsibilities as every motorist; however, they are more vulnerable since they do not have the protection provided by a vehicle
Pedestrians are at a disadvantage when crossing streets, intersections, and standing on corners, as they are not always visible to drivers Tips to keep safe when walking from one destination to another: watch walkways – make sure the driver sees you by making eye contact with them, don’t be a distracted walker, make yourself visible, watch for wide loads, and be aware of blind spots
As a bicyclist, you need to take extra precautions to protect yourself Tips to help keep you riding safely – wear a helmet, be aware of traffi c, check your brakes, ride with traffi c, and be aware of blind spots.
Bicycles and Pedestrians
Year Crashes Fatalities Injuries
2013 95 1 93
2014 85 3 78
2015 96 1 90
2016 94 3 88
2017 93 2 79
Year Crashes Fatalities Injuries
2013 87 2 93
2014 109 9 101
2015 108 7 96
2016 132 7 100
2017 138 5 106
North Dakota Crashes, Fatalities and Injuries Involving Bicycles, 2013-2017
North Dakota Crashes, Fatalities and Injuries Involving Pedestrians, 2013-2017
In 2017, 80% of pedestrian-related fatalities involving a motor vehicle were male
In 2017, the bicycle-related fatalities involving a motor vehicle included 1 male and 1 female

15
Since 2008 in North Dakota, the number of motorcycle licensed drivers has increased by 41%, and motorcycle registrations have also increased by 36%.
Motorcyclists can increase their safety on the roads by wearing All the Gear, All the Time (ATGATT), taking a training course, and obeying all traffi c laws.
Motorcycles andOff-Highway Vehicles
Motorcycle Fatality Facts, ND 2017
Year Crashes Fatalities Injuries
2013 239 9 192
2014 219 10 191
2015 282 8 220
2016 247 12 187
2017 260 13 201
Year Crashes Fatalities Injuries
2013 36 4 43
2014 46 1 46
2015 54 1 38
2016 52 3 51
2017 64 2 59
North Dakota Crashes, Fatalities and Injuries Involving Motorcycles, 2013-2017
North Dakota Crashes, Fatalities and Injuries Involving Off-Highway Vehicles**, 2013-2017
**Off-highway vehicles include all-terrain vehicles (ATV) and snowmobiles
*Fatalities with known alcohol test results
Last year in North Dakota, 82% (214) of all reported motorcycle crashes resulted in injury or death In the past 5 years, speed has been a contributing factor in 31% of motorcycle fatalities in North Dakota.
Motorists can prevent a crash with motorcyclists by checking all mirrors and blind spots, staying back, and looking for motorcyclists, especially at intersections

16
Preventing Vehicle Crashes, Fatalities & Injuries
The North Dakota Vision Zero Plan (formerly the North Dakota Strategic Highway Safety Plan) identifies partners and “E” strategies to reduce motor vehicle fatalities and injuries in the state The “E” strategies are described below
Education. All North Dakotans should know that they can save their lives, and the lives of others, from motor vehicle crashes by taking personal responsibility This includes wearing seat belts at all times, transporting children in child passenger safety seats appropriate for the child’s age and height, not driving while distracted by cell phones or any other form of distraction, driving only when sober (i e , not under the influence of alcohol and/or drugs), and obeying all posted speed limits.
Environment. Behavior change can occur through changing the environment in which the behavior occurs. This is done through strengthening traffic safety policies and laws such as mandating seat belt use for all vehicle occupants at all times, increasing the fines associated with speed violations, eliminating cell phone use in vehicles and mandating alcohol beverage server training to prevent overconsumption of alcohol by consumers
Enforcement. Regular enforcement of traffic safety laws deters unsafe driver and occupant behavior.
Engineering. State and local North Dakota roads are designed, constructed, and maintained with safety as a priority
Emergency Medical Services. In the event that a motor vehicle crash does occur, assure that crash victims are transported to an appropriate level of health care for their injuries, in the shortest amount of time possible
17
Do you want to get involved in motor vehicle crash prevention?
The NDDOT and our traffic safety partners invite you to join the Vision Zero Partner Network for resources and ideas to help reduce risky driver and occupant behaviors to save lives
Risky behaviors cause hundreds of preventable crashes in North Dakota every year By joining the Vision Zero Partner Network, you can help prevent motor vehicle crash fatalities and serious injuries on North Dakota roads Marketing and resource materials are free and all contributions are voluntary
Benefits of VZPN:• Protect your organization’s human and financial resources• Guard against potential liabilities associated with work-related crashes• Demonstrate your company, school or organization’s commitment to the community• Show your students or employees you care about them and their families• Address the problems of distracted driving, impaired driving, speed and lack of seat belt use
What partners will receive from NDDOT:• Education tools and materials bundled for each campaign• Help getting a driver and occupant safety program started• Opportunities to collaborate with other network organizations and agencies• Technical support for local opportunities such as media interviews
To sign up, go to VisionZero.ND.gov and click on “Partners ”
Working together, we can save lives.

18
The North Dakota Crash Memorial Wall
The North Dakota Crash Memorial Wall is an online space to safely honor someone you love who lost their life in a motor vehicle crash on a North Dakota road Memorials are public in the hope that sharing their stories will offer comfort to families and friends and remind visitors about the devastating impact of motor vehicle fatalities
The Crash Memorial Wall was developed by the North Dakota Department of Transportation and launched in August 2015. In 2016, the American Association of Motor Vehicle Administrators (AAMVA) recognized the North Dakota Crash Memorial Wall with a Public Affairs and Consumer Education Award (PACE) for outstanding website
Immediate family members are invited to create a memorial at VisionZero.ND.gov Extended family and friends can comment on the memorials All submissions are reviewed by the North Dakota Department of Transportation within 10 business days
Even one life lost in a motor vehicle crash is too many; every life is precious.
“”

