2012 city park facts - the trust for public landcloud.tpl.org/pubs/ccpe-cityparkfacts-2012.pdfthe...
TRANSCRIPT
2012 City Park Facts
TO COME
© 2012 The Trust for Public Land
Cover photos: left, Wikimedia Commons/Jorgeinthewater; right, Darcy Kiefel.
The Trust for Public Land conserves land for people
to enjoy as parks, gardens, and other natural places,
ensuring livable communities for generations to come.
Our Center for City Park Excellence helps make cities more successful
through the renewal and creation of parks
for their social, ecological, and economic benefits
to residents and visitors alike.
The 2012 City Park Facts report was created by:
Peter Harnik, Director, Center for City Park Excellence
Ryan Donahue, Research Director
Linden Weiswerda, Intern
2012 City Park Facts
Center for City Park ExcellenceThe Trust for Public Land
ii CITY PARK FACTS :: THE TRUST FOR PUBLIC LAND
Data is knowledge, and knowledge is power. Over the past decade, the city parks movement has gained tremendous power, and one reason is the dramatic increase in the amount of information available about almost every aspect of urban park and recreation systems.
The latest manifestation of this power was the unveiling in May 2012 of The Trust for Public Land’s ParkScore ProjectTM (parkscore.org), the most complete ranking of the park systems of the nation’s 40 largest cities. Based on data collected and generated by The Trust for Public Land (and reported in this publication), ParkScore has proven immensely valuable not only for urban residents but also for the park managers, park planners, and local politicians who must look ahead to the development and upkeep of their systems.
The 2012 City Park Facts has a number of new reports: one on daytime population, showing the impact of commuters on park resources; one on spending that takes into consideration differences in the cost of living of the various cities; and one that tabulates the amount of agency parkland that is owned outside city limits—something not previously reported. Perhaps most exciting, for planners interested in park access, this year’s City Park Facts reveals for the 40 largest U.S. cities the percentage of residents who live within a half-mile (ten-minute walk) of a park.
How to Use tHis BookletWhen we say “city,” we mean only the municipality, not the metropolitan region. Thus, “Los Angeles” means the city of Los Angeles, not greater Los Angeles, nor Los Angeles County. However, several cities that are included in greater Los Angeles—Long Beach, Anaheim, Santa Ana, and Irvine—happen to be large enough to merit separate inclusion in this booklet and are listed under their own names.
When we say “largest” we are referring to the 2010 population of the city. (City area is also based on 2010 census numbers.) For certain reports, we categorize cities based on their average population density (population divided by municipal land area); the density categories are based on standard deviations from the mean.
When we say “park” we are referring to publicly owned and operated parks. In Report #1, we count every kind of park within the municipal boundary of the city, including national, state, county, regional, and municipal parks. We do not count private golf or other clubs, nor do we count parks in gated communities. In most reports we combine the data from all the different park agencies in the city; in a few reports we separate parks by their management agency.
When we say “operational spending” we mean year-in, year-out work such as landscape and tree mainte-nance, facility maintenance, trash removal, recreational programming, planning, administration, policing, lighting, marketing, etc. “Capital spending” refers to one-time items such as land acquisition, construction, and major road or structural repairs. In order to provide greater uniformity between agencies, we do not count the expenses associated with zoos, aquariums, professional sports stadiums, museums, and cemeteries, which exist in some cities’ parks but not others’. In Report #5, total spending includes both operational spending and capital spending.
The reports published here constitute only a portion of the data available from the Center for City Park Excellence. For more reports, see tpl.org/cityparkfacts. For other studies carried out by the center, go to tpl.org/ccpe.
wHy city park facts?
1THE TRUST FOR PUBLIC LAND :: CITY PARK FACTS
taBle of coNteNts
reference Map: the 100 Most populous cities 14
2012 reports
1. acres of parkland by city and agency 2
2. acres of parkland per 1,000 residents by city 9
3. acres of parkland as percentage of city area 10
4. park playgrounds per 10,000 residents by city 13
5. total spending on parks and recreation per resident by city 16
grapH: total spending on parks and recreation per resident by city 18
6. employees per 10,000 residents by Major city agency 20
7. sNapsHot reports: the top ten
Ball Diamonds per 10,000 Residents by City 22
Basketball Hoops per 10,000 Residents by City 22
Off-Leash Dog Parks per 100,000 Residents by City 22
Recreation and Senior Centers per 20,000 Residents by City 22
Skateboard Parks per 100,000 Residents by City 22
Swimming Pools per 100,000 Residents by City 22
8. the 50 largest parks in the U.s. 23
9. the 50 oldest parks in the U.s. 24
10. the 50 Most-Visited parks in the U.s. 25
11. percent of city population with walkable park access new 26
12. acres of parkland outside city limits, by Major city agency new 27
13. spending on parks and recreation by city, adjusted for the cost of living index new 28
14. acres of parkland by Daytime population, by city new 30
2 CITY PARK FACTS :: THE TRUST FOR PUBLIC LAND
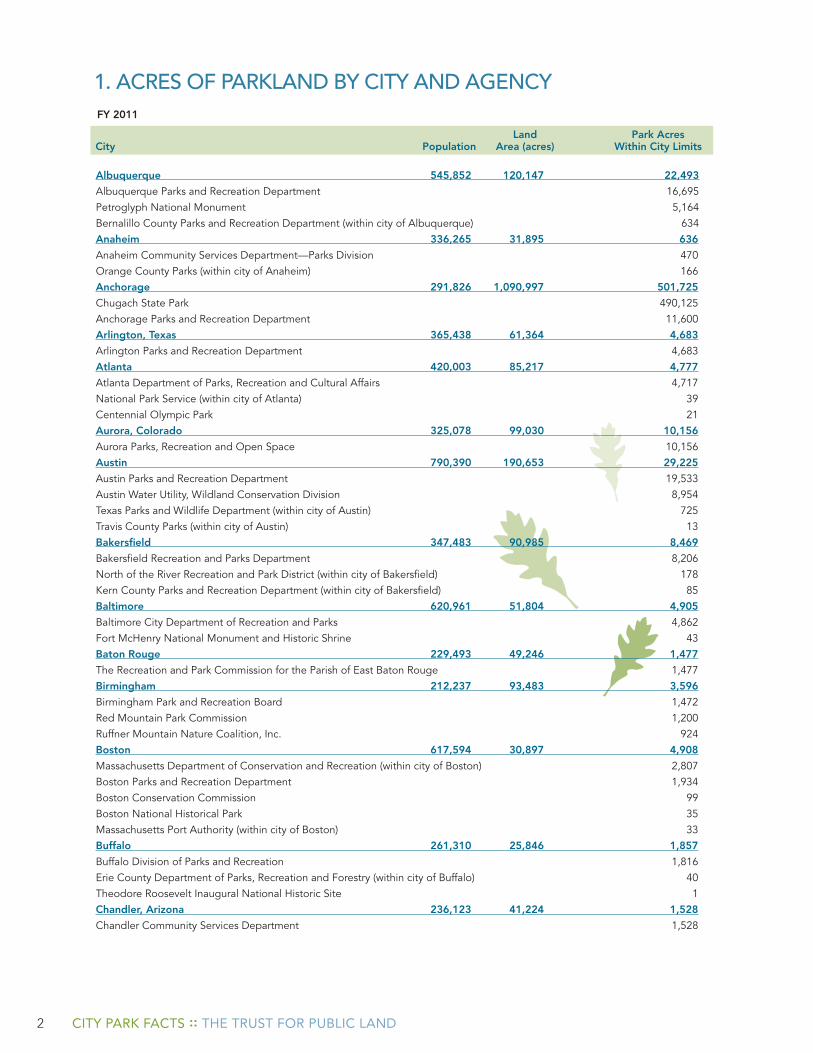
1. acres of parklaND By city aND ageNcyFY 2011
Land Park Acres City Population Area (acres) Within City Limits
Albuquerque 545,852 120,147 22,493
Albuquerque Parks and Recreation Department 16,695Petroglyph National Monument 5,164Bernalillo County Parks and Recreation Department (within city of Albuquerque) 634Anaheim 336,265 31,895 636
Anaheim Community Services Department—Parks Division 470Orange County Parks (within city of Anaheim) 166Anchorage 291,826 1,090,997 501,725
Chugach State Park 490,125Anchorage Parks and Recreation Department 11,600Arlington, Texas 365,438 61,364 4,683
Arlington Parks and Recreation Department 4,683Atlanta 420,003 85,217 4,777
Atlanta Department of Parks, Recreation and Cultural Affairs 4,717National Park Service (within city of Atlanta) 39Centennial Olympic Park 21Aurora, Colorado 325,078 99,030 10,156
Aurora Parks, Recreation and Open Space 10,156Austin 790,390 190,653 29,225
Austin Parks and Recreation Department 19,533Austin Water Utility, Wildland Conservation Division 8,954Texas Parks and Wildlife Department (within city of Austin) 725Travis County Parks (within city of Austin) 13Bakersfield 347,483 90,985 8,469
Bakersfield Recreation and Parks Department 8,206North of the River Recreation and Park District (within city of Bakersfield) 178Kern County Parks and Recreation Department (within city of Bakersfield) 85Baltimore 620,961 51,804 4,905
Baltimore City Department of Recreation and Parks 4,862Fort McHenry National Monument and Historic Shrine 43Baton Rouge 229,493 49,246 1,477
The Recreation and Park Commission for the Parish of East Baton Rouge 1,477Birmingham 212,237 93,483 3,596
Birmingham Park and Recreation Board 1,472Red Mountain Park Commission 1,200Ruffner Mountain Nature Coalition, Inc. 924 Boston 617,594 30,897 4,908
Massachusetts Department of Conservation and Recreation (within city of Boston) 2,807Boston Parks and Recreation Department 1,934Boston Conservation Commission 99Boston National Historical Park 35Massachusetts Port Authority (within city of Boston) 33Buffalo 261,310 25,846 1,857
Buffalo Division of Parks and Recreation 1,816Erie County Department of Parks, Recreation and Forestry (within city of Buffalo) 40Theodore Roosevelt Inaugural National Historic Site 1Chandler, Arizona 236,123 41,224 1,528
Chandler Community Services Department 1,528
3THE TRUST FOR PUBLIC LAND :: CITY PARK FACTS
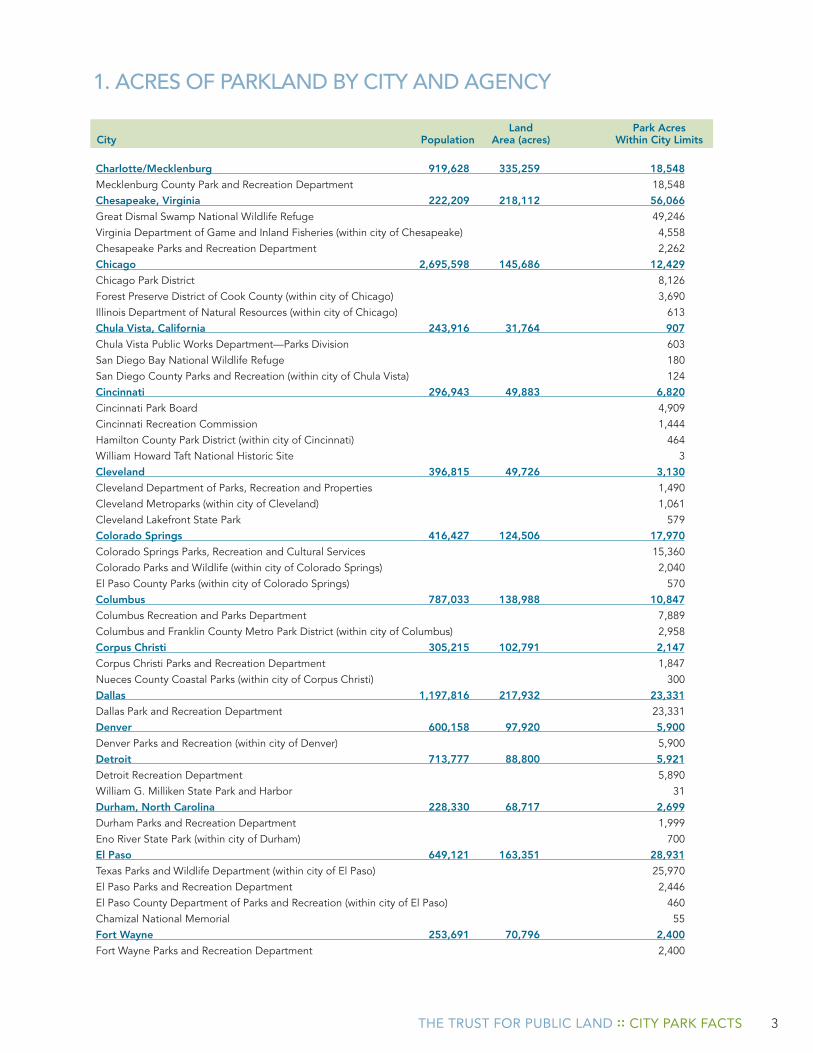
1. acres of parklaND By city aND ageNcy
Charlotte/Mecklenburg 919,628 335,259 18,548
Mecklenburg County Park and Recreation Department 18,548Chesapeake, Virginia 222,209 218,112 56,066
Great Dismal Swamp National Wildlife Refuge 49,246Virginia Department of Game and Inland Fisheries (within city of Chesapeake) 4,558Chesapeake Parks and Recreation Department 2,262Chicago 2,695,598 145,686 12,429
Chicago Park District 8,126Forest Preserve District of Cook County (within city of Chicago) 3,690Illinois Department of Natural Resources (within city of Chicago) 613Chula Vista, California 243,916 31,764 907
Chula Vista Public Works Department—Parks Division 603San Diego Bay National Wildlife Refuge 180San Diego County Parks and Recreation (within city of Chula Vista) 124Cincinnati 296,943 49,883 6,820
Cincinnati Park Board 4,909Cincinnati Recreation Commission 1,444Hamilton County Park District (within city of Cincinnati) 464William Howard Taft National Historic Site 3Cleveland 396,815 49,726 3,130
Cleveland Department of Parks, Recreation and Properties 1,490Cleveland Metroparks (within city of Cleveland) 1,061Cleveland Lakefront State Park 579Colorado Springs 416,427 124,506 17,970
Colorado Springs Parks, Recreation and Cultural Services 15,360Colorado Parks and Wildlife (within city of Colorado Springs) 2,040El Paso County Parks (within city of Colorado Springs) 570Columbus 787,033 138,988 10,847
Columbus Recreation and Parks Department 7,889Columbus and Franklin County Metro Park District (within city of Columbus) 2,958Corpus Christi 305,215 102,791 2,147
Corpus Christi Parks and Recreation Department 1,847Nueces County Coastal Parks (within city of Corpus Christi) 300Dallas 1,197,816 217,932 23,331
Dallas Park and Recreation Department 23,331Denver 600,158 97,920 5,900
Denver Parks and Recreation (within city of Denver) 5,900Detroit 713,777 88,800 5,921
Detroit Recreation Department 5,890William G. Milliken State Park and Harbor 31Durham, North Carolina 228,330 68,717 2,699
Durham Parks and Recreation Department 1,999 Eno River State Park (within city of Durham) 700El Paso 649,121 163,351 28,931
Texas Parks and Wildlife Department (within city of El Paso) 25,970El Paso Parks and Recreation Department 2,446El Paso County Department of Parks and Recreation (within city of El Paso) 460Chamizal National Memorial 55Fort Wayne 253,691 70,796 2,400
Fort Wayne Parks and Recreation Department 2,400
Land Park Acres City Population Area (acres) Within City Limits
4 CITY PARK FACTS :: THE TRUST FOR PUBLIC LAND
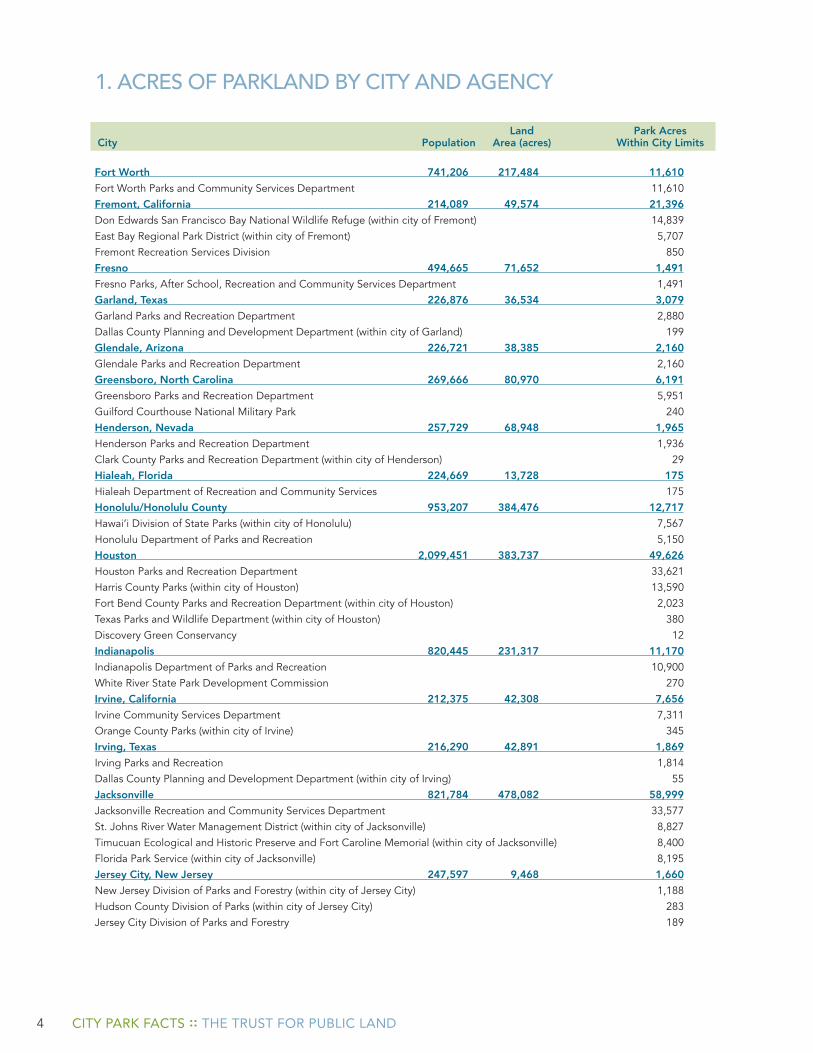
1. acres of parklaND By city aND ageNcy
Fort Worth 741,206 217,484 11,610
Fort Worth Parks and Community Services Department 11,610Fremont, California 214,089 49,574 21,396
Don Edwards San Francisco Bay National Wildlife Refuge (within city of Fremont) 14,839East Bay Regional Park District (within city of Fremont) 5,707Fremont Recreation Services Division 850Fresno 494,665 71,652 1,491
Fresno Parks, After School, Recreation and Community Services Department 1,491Garland, Texas 226,876 36,534 3,079
Garland Parks and Recreation Department 2,880Dallas County Planning and Development Department (within city of Garland) 199Glendale, Arizona 226,721 38,385 2,160
Glendale Parks and Recreation Department 2,160Greensboro, North Carolina 269,666 80,970 6,191
Greensboro Parks and Recreation Department 5,951Guilford Courthouse National Military Park 240Henderson, Nevada 257,729 68,948 1,965
Henderson Parks and Recreation Department 1,936Clark County Parks and Recreation Department (within city of Henderson) 29Hialeah, Florida 224,669 13,728 175
Hialeah Department of Recreation and Community Services 175Honolulu/Honolulu County 953,207 384,476 12,717
Hawai’i Division of State Parks (within city of Honolulu) 7,567Honolulu Department of Parks and Recreation 5,150Houston 2,099,451 383,737 49,626
Houston Parks and Recreation Department 33,621Harris County Parks (within city of Houston) 13,590Fort Bend County Parks and Recreation Department (within city of Houston) 2,023Texas Parks and Wildlife Department (within city of Houston) 380Discovery Green Conservancy 12Indianapolis 820,445 231,317 11,170
Indianapolis Department of Parks and Recreation 10,900White River State Park Development Commission 270Irvine, California 212,375 42,308 7,656
Irvine Community Services Department 7,311Orange County Parks (within city of Irvine) 345Irving, Texas 216,290 42,891 1,869
Irving Parks and Recreation 1,814Dallas County Planning and Development Department (within city of Irving) 55Jacksonville 821,784 478,082 58,999
Jacksonville Recreation and Community Services Department 33,577St. Johns River Water Management District (within city of Jacksonville) 8,827Timucuan Ecological and Historic Preserve and Fort Caroline Memorial (within city of Jacksonville) 8,400Florida Park Service (within city of Jacksonville) 8,195Jersey City, New Jersey 247,597 9,468 1,660
New Jersey Division of Parks and Forestry (within city of Jersey City) 1,188Hudson County Division of Parks (within city of Jersey City) 283Jersey City Division of Parks and Forestry 189
Land Park Acres City Population Area (acres) Within City Limits
5THE TRUST FOR PUBLIC LAND :: CITY PARK FACTS
1. acres of parklaND By city aND ageNcy
Kansas City, Missouri 459,787 201,568 17,424
Kansas City Parks and Recreation Department 12,034Jackson County Parks and Recreation (within city of Kansas City) 5,390Laredo, Texas 236,091 56,901 1,552
Laredo Parks and Leisure Services Department 1,041Texas Parks and Wildlife Department (within city of Laredo) 371Webb County Community Action Agency (within city of Laredo) 140Las Vegas 583,756 86,921 3,072
Las Vegas Department of Parks, Recreation and Neighborhood Services 3,069Nevada Division of State Parks (within city of Las Vegas) 3Lexington/Fayette 295,803 181,536 6,077
Lexington-Fayette Urban County Government Division of Parks and Recreation 6,058Kentucky Department of Parks (within city of Lexington) 19Lincoln, Nebraska 258,379 57,033 6,304
Lincoln Parks and Recreation Department 6,304Long Beach, California 462,257 32,188 3,118
Long Beach Department of Parks, Recreation and Marine 3,118Los Angeles 3,792,621 299,949 42,278
Los Angeles Department of Recreation and Parks 15,914California Department of Parks and Recreation (within city of Los Angeles) 12,585Los Angeles County Department of Parks and Recreation (within city of Los Angeles) 7,430Los Angeles Department of Water and Power (within city of Los Angeles) 2,322Mountains Recreation and Conservation Authority (within city of Los Angeles) 2,230Santa Monica Mountains Conservancy (within city of Los Angeles) 1,720Port of Los Angeles 77Louisville 714,501 237,115 16,778
Louisville Metro Parks 12,49621st Century Parks 3,684E.P. Tom Sawyer State Park 513Waterfront Development Corporation 85Lubbock, Texas 229,573 78,343 2,224
Lubbock Parks and Recreation 2,224Madison, Wisconsin 233,209 49,145 5,404
Madison Parks Division 4,534Dane County Parks Division (within city of Madison) 870Memphis 646,889 201,635 9,140
Memphis Division of Park Services 4,802Shelby Farms Park Conservancy 3,200T.O. Fuller State Park 1,138Mesa, Arizona 439,041 87,330 2,287
Mesa Parks, Recreation and Commercial Facilities Department 2,287Miami 399,457 22,957 1,198
Miami Department of Parks and Recreation 1,037Miami-Dade County Park and Recreation Department (within city of Miami) 100Bayfront Park Management Trust 61Milwaukee/Milwaukee County 947,735 154,497 16,085
Milwaukee County Department of Parks, Recreation and Culture 15,224Milwaukee Department of Public Works 516Wisconsin Department of Natural Resources 345Minneapolis 382,578 34,543 5,121
Minneapolis Park and Recreation Board 5,121
Land Park Acres City Population Area (acres) Within City Limits
6 CITY PARK FACTS :: THE TRUST FOR PUBLIC LAND
Nashville/Davidson 601,222 304,080 22,699
Nashville/Davidson Metropolitan Board of Parks and Recreation 10,765Tennessee Department of Environment and Conservation (within Davidson County) 4,892U.S. Army Corps of Engineers (within Davidson County) 4,878Tennessee Wildlife Resource Agency (within Davidson County) 2,164New Orleans 343,829 108,431 29,851
Bayou Sauvage National Wildlife Refuge (within city of New Orleans) 24,293Audubon Nature Institute 1,600New Orleans Department of Parks and Parkways 1,414New Orleans City Park Improvement Association 1,300New Orleans Recreation Department 1,076Louisiana Office of State Parks (within city of New Orleans) 105New Orleans Building Corporation 54Municipal Yacht Harbor 9New York 8,175,133 193,692 38,201
New York City Department of Parks and Recreation 29,322Gateway National Recreation Area (within city of New York) 7,138New York State Department of Environmental Conservation (within city of New York) 1,039New York State Office of Parks, Recreation and Historic Preservation (within city of New York) 665Governors Island National Monument 22Statue of Liberty and Ellis Island National Monuments 15Newark, New Jersey 277,140 15,480 846
Essex County Department of Parks, Recreation and Cultural Affairs (within city of Newark) 757Newark Department of Neighborhood and Recreational Services 89Norfolk 242,803 34,637 602
Norfolk Department of Recreation, Parks and Open Space 602North Las Vegas, Nevada 216,961 64,861 859
North Las Vegas Parks and Recreation Department 859Oakland 390,724 35,703 5,937
Oakland Office of Parks and Recreation 4,101East Bay Regional Park District (within city of Oakland) 1,836Oklahoma City 579,999 388,103 21,841
Oklahoma City Parks and Recreation Department 21,841Omaha 408,958 81,337 9,560
Omaha Department of Parks, Recreation and Public Property 9,560Orlando 238,300 65,533 2,993
Orlando Families, Parks and Recreation Department 2,969Orange County Parks and Recreation Division (within city of Orlando) 24Philadelphia 1,526,006 85,825 11,187
Philadelphia Parks and Recreation Department 10,550John Heinz National Wildlife Refuge at Tinicum (within city of Philadelphia) 300Benjamin Rush State Park 282Independence National Historical Park 55Phoenix 1,445,632 330,690 47,082
Phoenix Parks and Recreation Department 45,440Maricopa County Parks and Recreation Department (within city of Phoenix) 1,642Pittsburgh 305,704 35,435 3,122
Pittsburgh Public Works 3,086Point State Park 36Plano, Texas 259,841 45,812 4,243
Plano Parks and Recreation Department 4,243
1. acres of parklaND By city aND ageNcy
Land Park Acres City Population Area (acres) Within City Limits
7THE TRUST FOR PUBLIC LAND :: CITY PARK FACTS
1. acres of parklaND By city aND ageNcy
Portland, Oregon 583,776 85,393 13,937
Portland Parks and Recreation 11,210Metro Regional Parks and Greenspaces (within city of Portland) 2,263Tryon Creek State Natural Area 464Raleigh 403,892 91,458 12,571
Raleigh Parks and Recreation Department 6,801William B. Umstead State Park 5,579Wake County Parks, Recreation and Open Space (within city of Raleigh) 191Reno, Nevada 225,221 65,926 2,481
Reno Parks, Recreation and Community Services Department 2,424Washoe County Regional Parks and Open Space (within city of Reno) 57Riverside, California 303,871 51,930 4,667
Riverside Parks, Recreation and Community Services Department 2,874Riverside County Regional Park and Open-Space District (within city of Riverside) 1,545California Department of Parks and Recreation (within city of Riverside) 248Rochester, New York 210,565 22,900 1,501
Rochester Bureau of Operations and Parks 933Monroe County Department of Parks (within city of Rochester) 568Sacramento 466,488 62,666 5,069
Sacramento Department of Parks and Recreation 2,418Sacramento County Department of Regional Parks (within city of Sacramento city) 1,746Sacramento Department of Convention, Culture and Leisure 604California Department of Parks and Recreation (within city of Sacramento) 301San Antonio 1,327,407 294,997 23,369
San Antonio Parks and Recreation Department 13,689Texas Parks and Wildlife Department (within city of San Antonio) 8,620San Antonio Missions National Historical Park 835Bexar County Infrastructure Services Department (within city of San Antonio) 225San Bernardino, California 209,924 37,889 570
San Bernardino Parks, Recreation and Community Services 570San Diego 1,307,402 208,120 46,909
San Diego Park and Recreation Department 39,996San Diego County Parks and Recreation (within city of San Diego) 4,094California Department of Parks and Recreation (within city of San Diego) 1,508San Diego National Wildlife Refuge Complex 900The Port of San Diego 249Cabrillo National Monument 162San Francisco 805,235 29,999 5,384
San Francisco Recreation and Park Department 3,466The Presidio Trust 1,491California Department of Parks and Recreation (within city of San Francisco) 252Golden Gate National Recreation Area (within city of San Francisco) 175San Jose 945,942 112,977 15,950
Don Edwards San Francisco Bay National Wildlife Refuge (within city of San Jose) 6,800Santa Clara County Parks and Recreation (within city of San Jose) 3,910San Jose Department of Parks, Recreation and Neighborhood Services 3,417Santa Clara County Open Space Authority (within city of San Jose) 1,823Santa Ana, California 324,528 17,453 324
Santa Ana Parks, Recreation and Community Services 324Scottsdale, Arizona 217,385 117,709 17,172
Scottsdale Parks and Recreation Division 17,172
Land Park Acres City Population Area (acres) Within City Limits
8 CITY PARK FACTS :: THE TRUST FOR PUBLIC LAND
1. acres of parklaND By city aND ageNcy
Seattle 608,660 53,723 5,546
Seattle Parks and Recreation 5,546Spokane 208,916 37,918 3,124
Spokane Parks and Recreation Department 3,124St. Louis 319,294 39,622 3,665
St. Louis Department of Parks, Recreation and Forestry 3,252Tower Grove Park Commission 289Jefferson National Expansion Memorial 91The Great Rivers Greenway District 33St. Paul, Minnesota 285,068 33,266 4,546
Saint Paul Parks and Recreation Department 2,814Ramsey County Parks and Recreation Department (within city of St. Paul) 1,232Minnesota DNR Division of Parks and Recreation (within city of St. Paul) 500St. Petersburg 244,769 39,515 6,663
Pinellas County Parks and Conservation Resources (within city of St. Petersburg) 3,702St. Petersburg Parks Department 2,961Stockton 291,707 39,469 674
Stockton Public Works Department 674Tampa 335,709 72,582 3,434
Tampa Parks and Recreation Department 3,044Tampa Sports Authority 390Toledo 287,208 51,643 2,232
Toledo Department of Public Service 2,232Tucson 520,116 145,094 3,892
Tucson Parks and Recreation Department 3,319Pima County Natural Resources, Parks and Recreation Department (within city of Tucson) 415Kino Sports Complex 158Tulsa 391,906 125,923 7,566
Tulsa Park and Recreation Department 5,995River Parks Authority 1,116Tulsa County Parks (within city of Tulsa) 455Virginia Beach 437,994 159,370 25,326
Back Bay National Wildlife Refuge 9,180Virginia Department of Conservation and Recreation (within city of Virginia Beach) 7,731Virginia Beach Department of Parks and Recreation 6,065Princess Anne Wildlife Management Area 1,546Mackay Island National Wildlife Refuge 804Washington, District of Columbia 601,723 39,071 7,679
National Park Service (within city of Washington) 6,776District of Columbia Department of Parks and Recreation 903Wichita 382,368 101,949 4,629
Wichita Park and Recreation Department 4,629Winston-Salem, North Carolina 229,617 84,767 3,450
Winston-Salem Recreation and Parks 3,450
Total 61,124,120 11,911,182 1,559,660
Land Park Acres City Population Area (acres) Within City Limits
9THE TRUST FOR PUBLIC LAND :: CITY PARK FACTS
San Jose 15,950 16.9St. Paul, Minnesota 4,546 15.9St. Louis 3,665 11.5Pittsburgh 3,122 10.2Detroit 5,921 8.3Cleveland 3,130 7.9Buffalo 1,857 7.1Rochester, New York 1,501 7.1Las Vegas 3,072 5.3Stockton 674 2.3
Median, This Density: 8.1
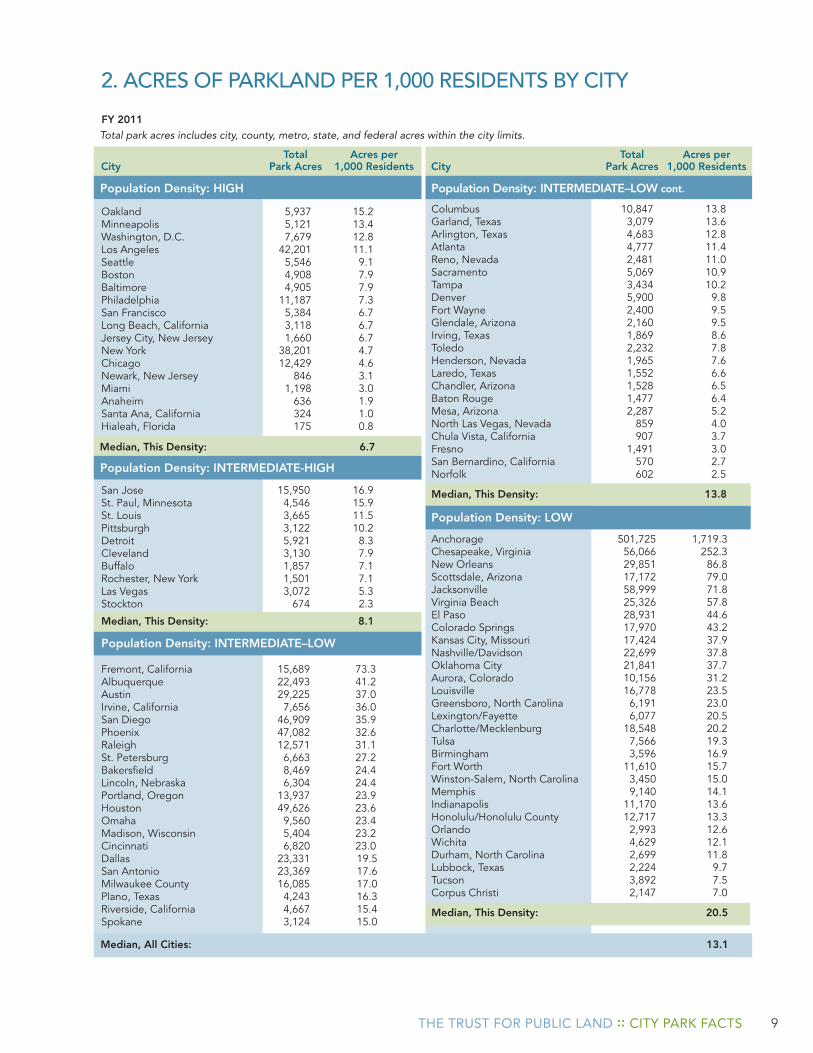
2. acres of parklaND per 1,000 resiDeNts By city
Population Density: HIGH
Total park acres includes city, county, metro, state, and federal acres within the city limits.FY 2011
Population Density: INTERMEDIATE–LOW
Acres per 1,000 Residents
Total Park AcresCity
Acres per 1,000 Residents
Total Park AcresCity
Oakland 5,937 15.2Minneapolis 5,121 13.4Washington, D.C. 7,679 12.8Los Angeles 42,201 11.1Seattle 5,546 9.1Boston 4,908 7.9Baltimore 4,905 7.9Philadelphia 11,187 7.3San Francisco 5,384 6.7Long Beach, California 3,118 6.7Jersey City, New Jersey 1,660 6.7New York 38,201 4.7Chicago 12,429 4.6Newark, New Jersey 846 3.1Miami 1,198 3.0Anaheim 636 1.9Santa Ana, California 324 1.0Hialeah, Florida 175 0.8
Median, This Density: 6.7
Population Density: INTERMEDIATE-HIGH
Fremont, California 15,689 73.3Albuquerque 22,493 41.2Austin 29,225 37.0Irvine, California 7,656 36.0San Diego 46,909 35.9Phoenix 47,082 32.6Raleigh 12,571 31.1St. Petersburg 6,663 27.2Bakersfield 8,469 24.4Lincoln, Nebraska 6,304 24.4Portland, Oregon 13,937 23.9Houston 49,626 23.6Omaha 9,560 23.4Madison, Wisconsin 5,404 23.2Cincinnati 6,820 23.0Dallas 23,331 19.5San Antonio 23,369 17.6Milwaukee County 16,085 17.0Plano, Texas 4,243 16.3Riverside, California 4,667 15.4 Spokane 3,124 15.0
Population Density: INTERMEDIATE–LOW cont.
Population Density: LOW
Anchorage 501,725 1,719.3Chesapeake, Virginia 56,066 252.3New Orleans 29,851 86.8Scottsdale, Arizona 17,172 79.0Jacksonville 58,999 71.8Virginia Beach 25,326 57.8El Paso 28,931 44.6Colorado Springs 17,970 43.2Kansas City, Missouri 17,424 37.9Nashville/Davidson 22,699 37.8Oklahoma City 21,841 37.7Aurora, Colorado 10,156 31.2Louisville 16,778 23.5Greensboro, North Carolina 6,191 23.0Lexington/Fayette 6,077 20.5Charlotte/Mecklenburg 18,548 20.2Tulsa 7,566 19.3Birmingham 3,596 16.9Fort Worth 11,610 15.7Winston-Salem, North Carolina 3,450 15.0Memphis 9,140 14.1Indianapolis 11,170 13.6Honolulu/Honolulu County 12,717 13.3Orlando 2,993 12.6Wichita 4,629 12.1Durham, North Carolina 2,699 11.8Lubbock, Texas 2,224 9.7Tucson 3,892 7.5Corpus Christi 2,147 7.0
Median, This Density: 20.5
Columbus 10,847 13.8Garland, Texas 3,079 13.6Arlington, Texas 4,683 12.8Atlanta 4,777 11.4Reno, Nevada 2,481 11.0Sacramento 5,069 10.9Tampa 3,434 10.2Denver 5,900 9.8Fort Wayne 2,400 9.5Glendale, Arizona 2,160 9.5Irving, Texas 1,869 8.6Toledo 2,232 7.8Henderson, Nevada 1,965 7.6Laredo, Texas 1,552 6.6Chandler, Arizona 1,528 6.5Baton Rouge 1,477 6.4Mesa, Arizona 2,287 5.2North Las Vegas, Nevada 859 4.0Chula Vista, California 907 3.7Fresno 1,491 3.0San Bernardino, California 570 2.7Norfolk 602 2.5
Median, This Density: 13.8
Median, All Cities: 13.1
10 CITY PARK FACTS :: THE TRUST FOR PUBLIC LAND
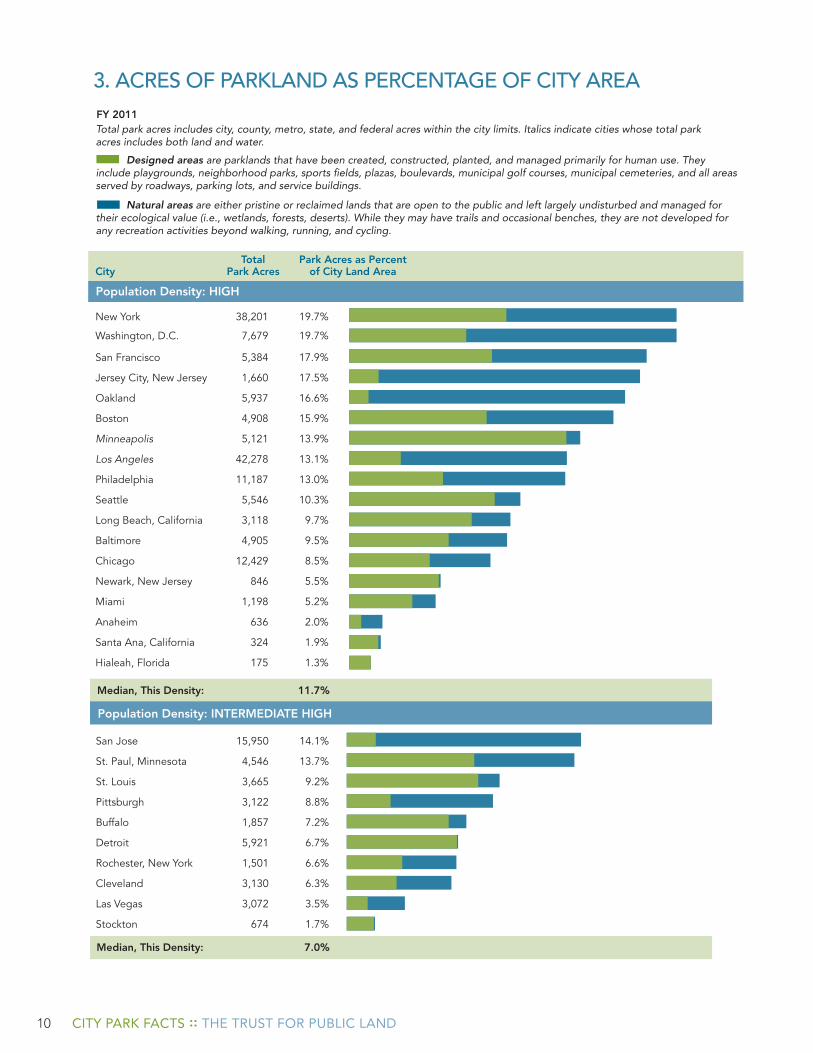
3. acres of parklaND as perceNtage of city area
Population Density: INTERMEDIATE HIGH
Median, This Density: 11.7%
Median, This Density: 7.0%
Total Park Acres as Percent City Park Acres of City Land Area
Population Density: HIGH
FY 2011Total park acres includes city, county, metro, state, and federal acres within the city limits. Italics indicate cities whose total park acres includes both land and water.
Designed areas are parklands that have been created, constructed, planted, and managed primarily for human use. They include playgrounds, neighborhood parks, sports fields, plazas, boulevards, municipal golf courses, municipal cemeteries, and all areas served by roadways, parking lots, and service buildings.
Natural areas are either pristine or reclaimed lands that are open to the public and left largely undisturbed and managed for their ecological value (i.e., wetlands, forests, deserts). While they may have trails and occasional benches, they are not developed for any recreation activities beyond walking, running, and cycling.
New York 38,201 19.7%
Washington, D.C. 7,679 19.7%
San Francisco 5,384 17.9%
Jersey City, New Jersey 1,660 17.5%
Oakland 5,937 16.6%
Boston 4,908 15.9%
Minneapolis 5,121 13.9%
Los Angeles 42,278 13.1%
Philadelphia 11,187 13.0%
Seattle 5,546 10.3%
Long Beach, California 3,118 9.7%
Baltimore 4,905 9.5%
Chicago 12,429 8.5%
Newark, New Jersey 846 5.5%
Miami 1,198 5.2%
Anaheim 636 2.0%
Santa Ana, California 324 1.9%
Hialeah, Florida 175 1.3%
San Jose 15,950 14.1%
St. Paul, Minnesota 4,546 13.7%
St. Louis 3,665 9.2%
Pittsburgh 3,122 8.8%
Buffalo 1,857 7.2%
Detroit 5,921 6.7%
Rochester, New York 1,501 6.6%
Cleveland 3,130 6.3%
Las Vegas 3,072 3.5%
Stockton 674 1.7%
11THE TRUST FOR PUBLIC LAND :: CITY PARK FACTS
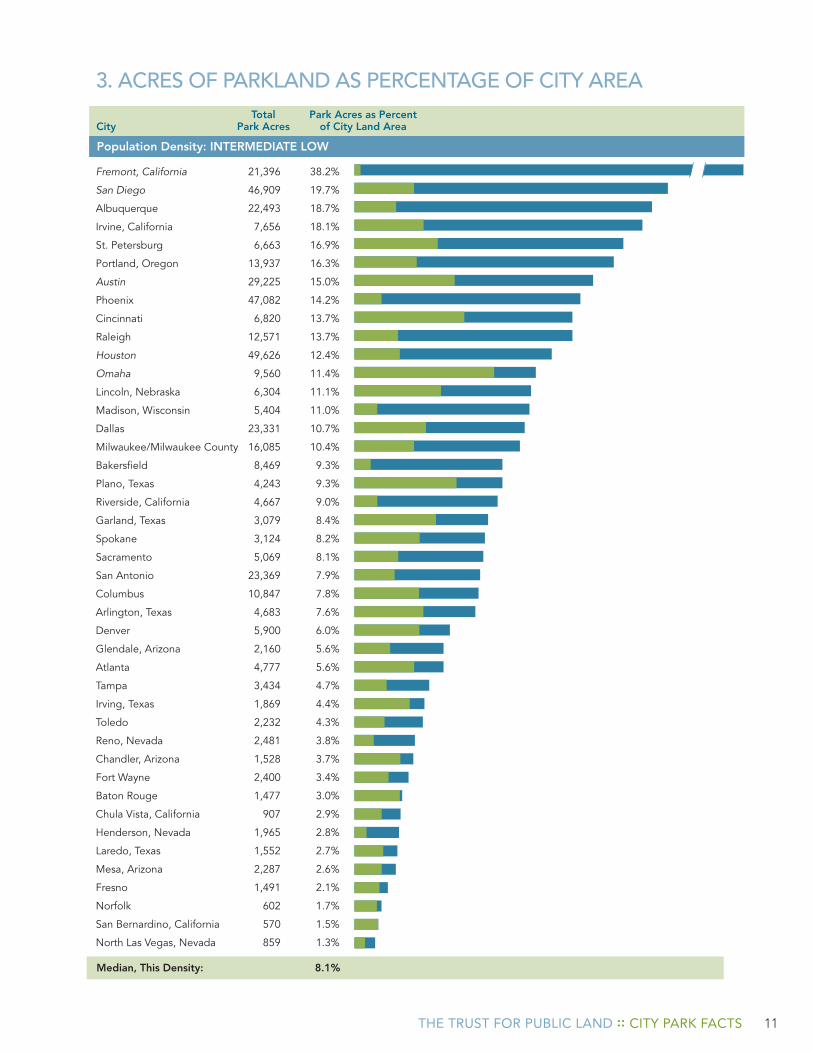
3. acres of parklaND as perceNtage of city area
Median, This Density: 8.1%
Fremont, California 21,396 38.2%
San Diego 46,909 19.7%
Albuquerque 22,493 18.7%
Irvine, California 7,656 18.1%
St. Petersburg 6,663 16.9%
Portland, Oregon 13,937 16.3%
Austin 29,225 15.0%
Phoenix 47,082 14.2%
Cincinnati 6,820 13.7%
Raleigh 12,571 13.7%
Houston 49,626 12.4%
Omaha 9,560 11.4%
Lincoln, Nebraska 6,304 11.1%
Madison, Wisconsin 5,404 11.0%
Dallas 23,331 10.7%
Milwaukee/Milwaukee County 16,085 10.4%
Bakersfield 8,469 9.3%
Plano, Texas 4,243 9.3%
Riverside, California 4,667 9.0%
Garland, Texas 3,079 8.4%
Spokane 3,124 8.2%
Sacramento 5,069 8.1%
San Antonio 23,369 7.9%
Columbus 10,847 7.8%
Arlington, Texas 4,683 7.6%
Denver 5,900 6.0%
Glendale, Arizona 2,160 5.6%
Atlanta 4,777 5.6%
Tampa 3,434 4.7%
Irving, Texas 1,869 4.4%
Toledo 2,232 4.3%
Reno, Nevada 2,481 3.8%
Chandler, Arizona 1,528 3.7%
Fort Wayne 2,400 3.4%
Baton Rouge 1,477 3.0%
Chula Vista, California 907 2.9%
Henderson, Nevada 1,965 2.8%
Laredo, Texas 1,552 2.7%
Mesa, Arizona 2,287 2.6%
Fresno 1,491 2.1%
Norfolk 602 1.7%
San Bernardino, California 570 1.5%
North Las Vegas, Nevada 859 1.3%
Population Density: INTERMEDIATE LOW
Total Park Acres as Percent City Park Acres of City Land Area
12 CITY PARK FACTS :: THE TRUST FOR PUBLIC LAND
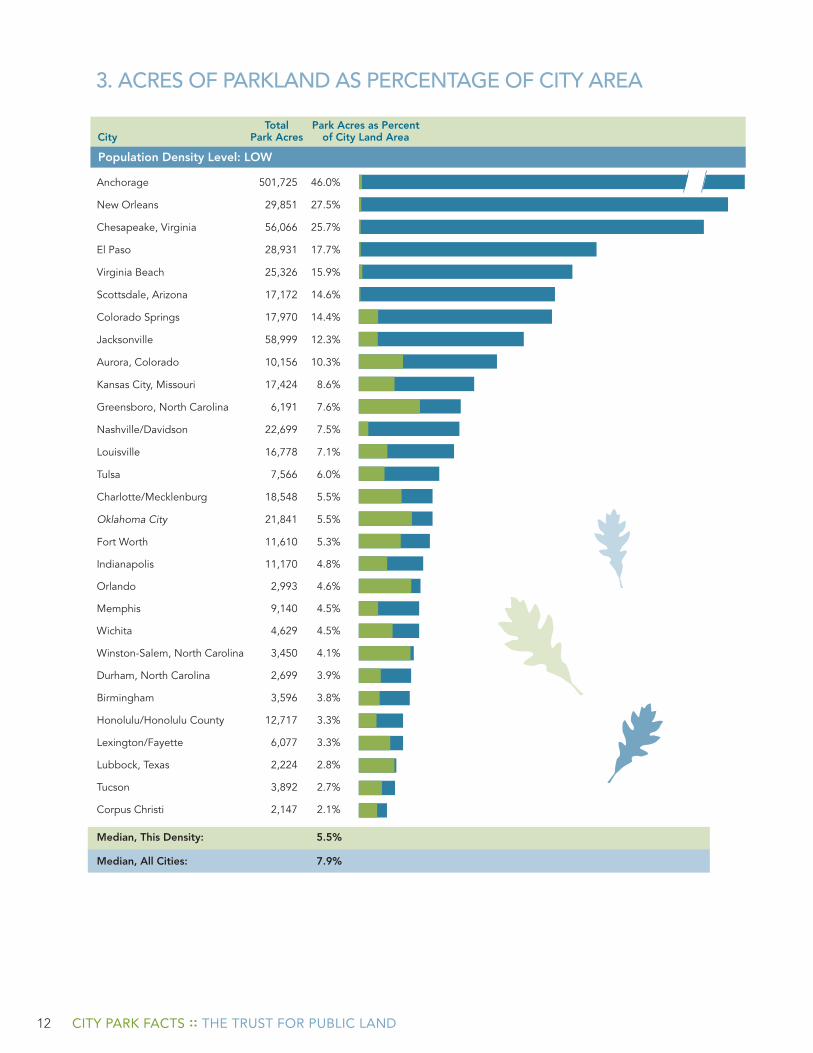
Population Density Level: LOW
Median, This Density: 5.5%
Median, All Cities: 7.9%
3. acres of parklaND as perceNtage of city area
Anchorage 501,725 46.0%
New Orleans 29,851 27.5%
Chesapeake, Virginia 56,066 25.7%
El Paso 28,931 17.7%
Virginia Beach 25,326 15.9%
Scottsdale, Arizona 17,172 14.6%
Colorado Springs 17,970 14.4%
Jacksonville 58,999 12.3%
Aurora, Colorado 10,156 10.3%
Kansas City, Missouri 17,424 8.6%
Greensboro, North Carolina 6,191 7.6%
Nashville/Davidson 22,699 7.5%
Louisville 16,778 7.1%
Tulsa 7,566 6.0%
Charlotte/Mecklenburg 18,548 5.5%
Oklahoma City 21,841 5.5%
Fort Worth 11,610 5.3%
Indianapolis 11,170 4.8%
Orlando 2,993 4.6%
Memphis 9,140 4.5%
Wichita 4,629 4.5%
Winston-Salem, North Carolina 3,450 4.1%
Durham, North Carolina 2,699 3.9%
Birmingham 3,596 3.8%
Honolulu/Honolulu County 12,717 3.3%
Lexington/Fayette 6,077 3.3%
Lubbock, Texas 2,224 2.8%
Tucson 3,892 2.7%
Corpus Christi 2,147 2.1%
Total Park Acres as Percent City Park Acres of City Land Area
13THE TRUST FOR PUBLIC LAND :: CITY PARK FACTS
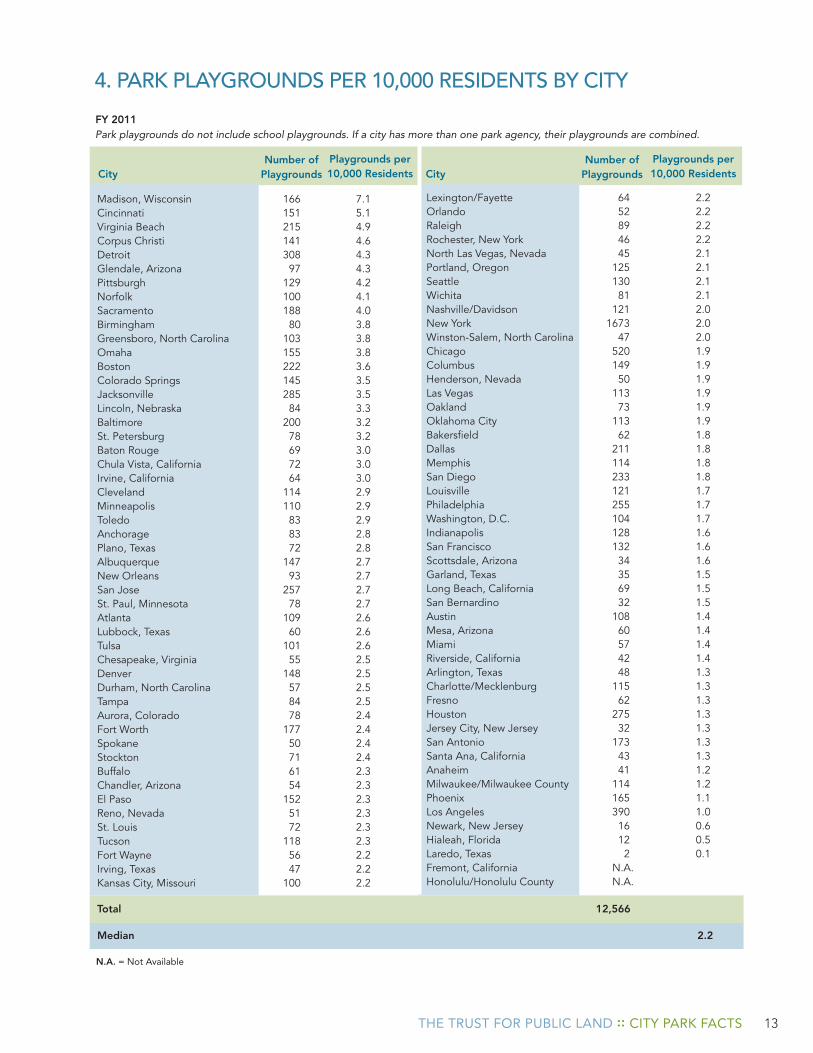
Total 12,566
Median 2.2
4. park playgroUNDs per 10,000 resiDeNts By city
Park playgrounds do not include school playgrounds. If a city has more than one park agency, their playgrounds are combined.FY 2011
Playgrounds per 10,000 Residents
Number of PlaygroundsCity
Playgrounds per 10,000 Residents
Number of PlaygroundsCity
Madison, Wisconsin 166 7.1Cincinnati 151 5.1Virginia Beach 215 4.9Corpus Christi 141 4.6Detroit 308 4.3Glendale, Arizona 97 4.3Pittsburgh 129 4.2Norfolk 100 4.1Sacramento 188 4.0Birmingham 80 3.8Greensboro, North Carolina 103 3.8Omaha 155 3.8Boston 222 3.6Colorado Springs 145 3.5Jacksonville 285 3.5Lincoln, Nebraska 84 3.3Baltimore 200 3.2St. Petersburg 78 3.2Baton Rouge 69 3.0Chula Vista, California 72 3.0Irvine, California 64 3.0Cleveland 114 2.9Minneapolis 110 2.9Toledo 83 2.9Anchorage 83 2.8Plano, Texas 72 2.8Albuquerque 147 2.7New Orleans 93 2.7San Jose 257 2.7St. Paul, Minnesota 78 2.7Atlanta 109 2.6Lubbock, Texas 60 2.6Tulsa 101 2.6Chesapeake, Virginia 55 2.5Denver 148 2.5Durham, North Carolina 57 2.5Tampa 84 2.5Aurora, Colorado 78 2.4Fort Worth 177 2.4Spokane 50 2.4Stockton 71 2.4Buffalo 61 2.3Chandler, Arizona 54 2.3El Paso 152 2.3Reno, Nevada 51 2.3St. Louis 72 2.3Tucson 118 2.3Fort Wayne 56 2.2Irving, Texas 47 2.2Kansas City, Missouri 100 2.2
Lexington/Fayette 64 2.2Orlando 52 2.2Raleigh 89 2.2Rochester, New York 46 2.2North Las Vegas, Nevada 45 2.1Portland, Oregon 125 2.1Seattle 130 2.1Wichita 81 2.1Nashville/Davidson 121 2.0New York 1673 2.0Winston-Salem, North Carolina 47 2.0Chicago 520 1.9Columbus 149 1.9Henderson, Nevada 50 1.9Las Vegas 113 1.9Oakland 73 1.9Oklahoma City 113 1.9Bakersfield 62 1.8Dallas 211 1.8Memphis 114 1.8San Diego 233 1.8Louisville 121 1.7Philadelphia 255 1.7Washington, D.C. 104 1.7Indianapolis 128 1.6San Francisco 132 1.6Scottsdale, Arizona 34 1.6Garland, Texas 35 1.5Long Beach, California 69 1.5San Bernardino 32 1.5Austin 108 1.4Mesa, Arizona 60 1.4Miami 57 1.4Riverside, California 42 1.4Arlington, Texas 48 1.3Charlotte/Mecklenburg 115 1.3Fresno 62 1.3Houston 275 1.3Jersey City, New Jersey 32 1.3San Antonio 173 1.3Santa Ana, California 43 1.3Anaheim 41 1.2Milwaukee/Milwaukee County 114 1.2Phoenix 165 1.1Los Angeles 390 1.0Newark, New Jersey 16 0.6Hialeah, Florida 12 0.5Laredo, Texas 2 0.1Fremont, California N.A. Honolulu/Honolulu County N.A.
N.A. = Not Available
14 CITY PARK FACTS :: THE TRUST FOR PUBLIC LAND
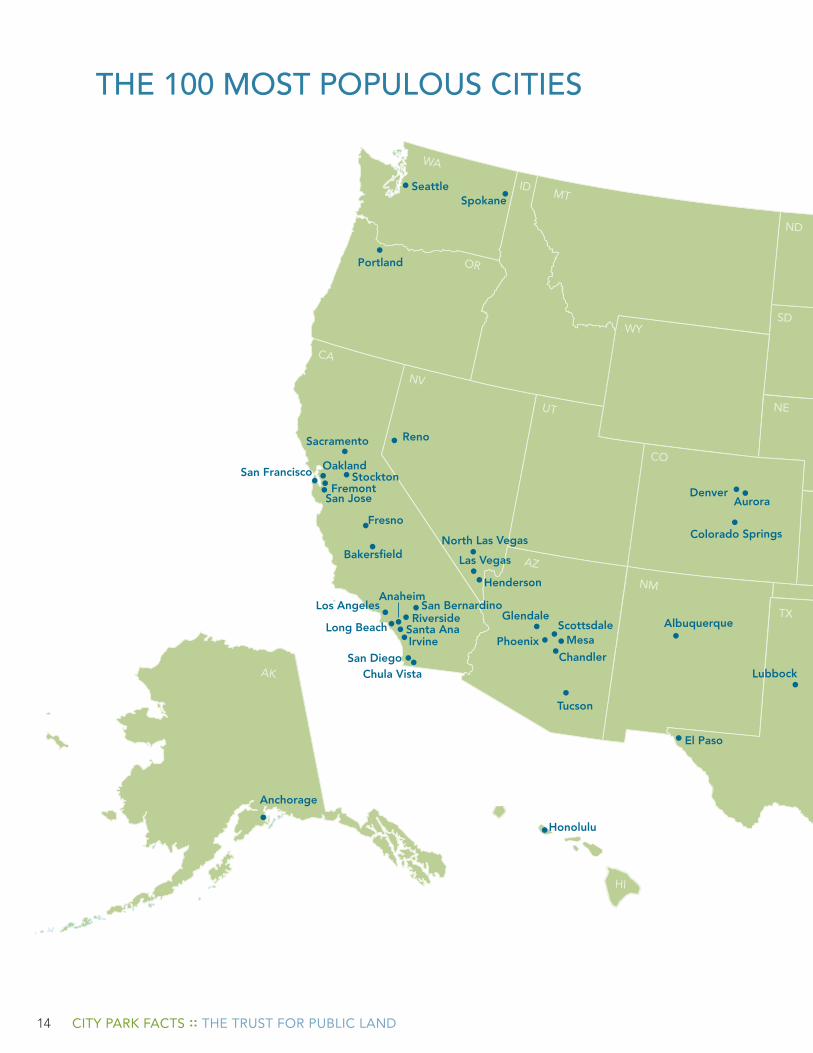
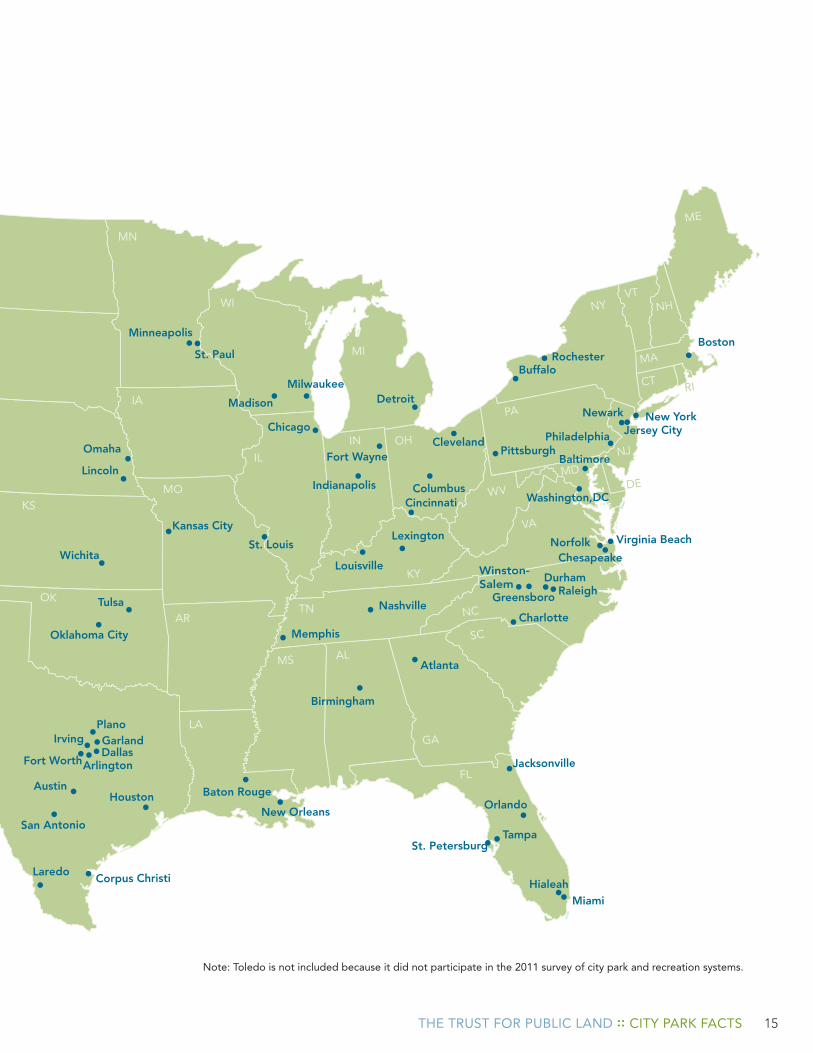
tHe 100 Most popUloUs cities
New York
Boston
Jersey City
PittsburghPhiladelphia
Buffalo
Newark
Baltimore
Washington,DC
Virginia Beach
Columbus
Lexington
Louisville
Cincinnati
Cleveland
Detroit
Fort Wayne
Indianapolis
Nashville
Memphis
St. Louis
Kansas City
Jacksonville
Miami
TampaSt. Petersburg
Atlanta
Greensboro
Charlotte
Raleigh
Chicago
Milwaukee
Minneapolis
St. Paul
OaklandStockton
Henderson
San Jose
Sacramento
Las Vegas
San Francisco
Fresno
Bakersfield
Los Angeles
Santa AnaRiverside
San Diego
Mesa
Chandler
Tucson
Phoenix
GlendaleLong Beach
Anaheim
DenverAurora
El Paso
Colorado Springs
Omaha
Wichita
Tulsa
Oklahoma City
Lincoln
Albuquerque
San Antonio
Plano
DallasArlington
Austin
Corpus Christi
Houston
Fort Worth
Seattle
Portland
Scottsdale
Madison
Birmingham
New Orleans
Baton Rouge
Durham
Norfolk
Orlando
Fremont
San Bernardino
Spokane
Laredo
Winston-Salem
Lubbock
North Las Vegas
Chesapeake
Chula Vista
Garland
Reno
Hialeah
Irvine
Rochester
Irving
Anchorage
Honolulu
WA
ID
OR
CA
NV
UT
MT
AZ
NM
WY
CO
VTNH
ME
RI
DE
MA
NJ
CT
NY
PA
MD
WV
VA
NC
KS
NE
TXOK
MN
IL
MO
WI
MI
OHIN
KY
SC
TN
LA
AL
GA
FL
AK
HI
IA
SD
ND
AR
MS
15THE TRUST FOR PUBLIC LAND :: CITY PARK FACTS
New York
Boston
Jersey City
PittsburghPhiladelphia
Buffalo
Newark
Baltimore
Washington,DC
Virginia Beach
Columbus
Lexington
Louisville
Cincinnati
Cleveland
Detroit
Fort Wayne
Indianapolis
Nashville
Memphis
St. Louis
Kansas City
Jacksonville
Miami
TampaSt. Petersburg
Atlanta
Greensboro
Charlotte
Raleigh
Chicago
Milwaukee
Minneapolis
St. Paul
OaklandStockton
Henderson
San Jose
Sacramento
Las Vegas
San Francisco
Fresno
Bakersfield
Los Angeles
Santa AnaRiverside
San Diego
Mesa
Chandler
Tucson
Phoenix
GlendaleLong Beach
Anaheim
DenverAurora
El Paso
Colorado Springs
Omaha
Wichita
Tulsa
Oklahoma City
Lincoln
Albuquerque
San Antonio
Plano
DallasArlington
Austin
Corpus Christi
Houston
Fort Worth
Seattle
Portland
Scottsdale
Madison
Birmingham
New Orleans
Baton Rouge
Durham
Norfolk
Orlando
Fremont
San Bernardino
Spokane
Laredo
Winston-Salem
Lubbock
North Las Vegas
Chesapeake
Chula Vista
Garland
Reno
Hialeah
Irvine
Rochester
Irving
Anchorage
Honolulu
WA
ID
OR
CA
NV
UT
MT
AZ
NM
WY
CO
VTNH
ME
RI
DE
MA
NJ
CT
NY
PA
MD
WV
VA
NC
KS
NE
TXOK
MN
IL
MO
WI
MI
OHIN
KY
SC
TN
LA
AL
GA
FL
AK
HI
IA
SD
ND
AR
MS
Note: Toledo is not included because it did not participate in the 2011 survey of city park and recreation systems.
16 CITY PARK FACTS :: THE TRUST FOR PUBLIC LAND
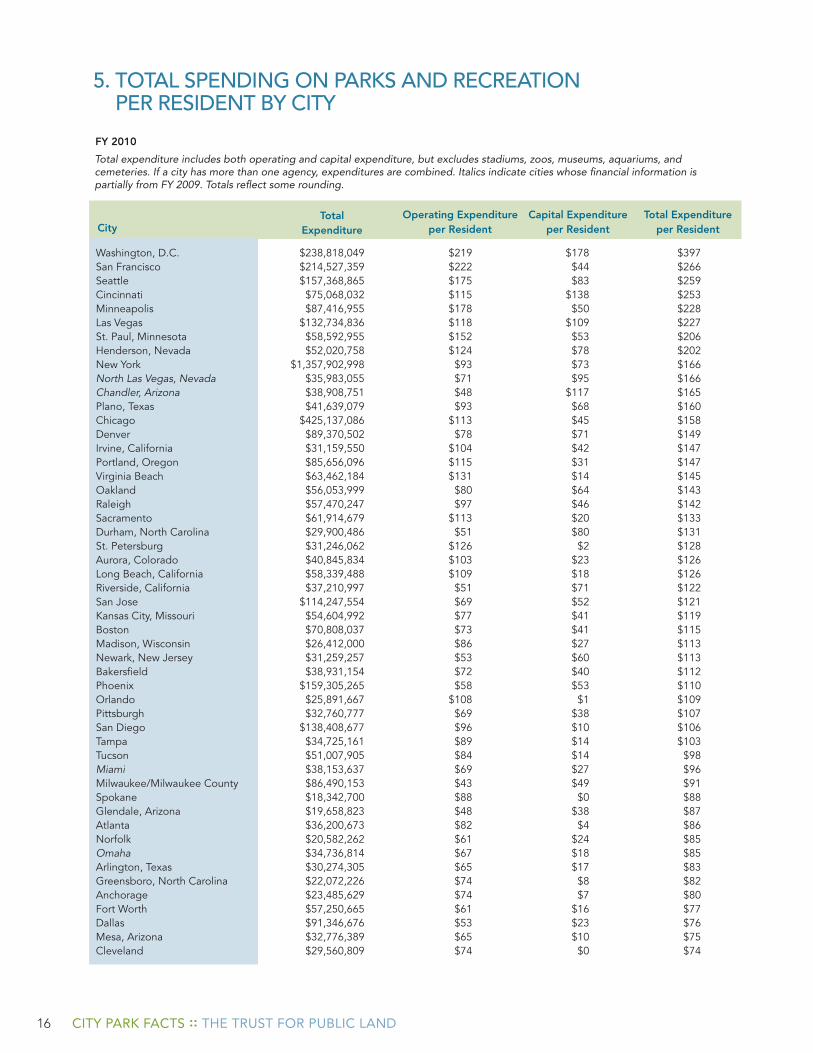
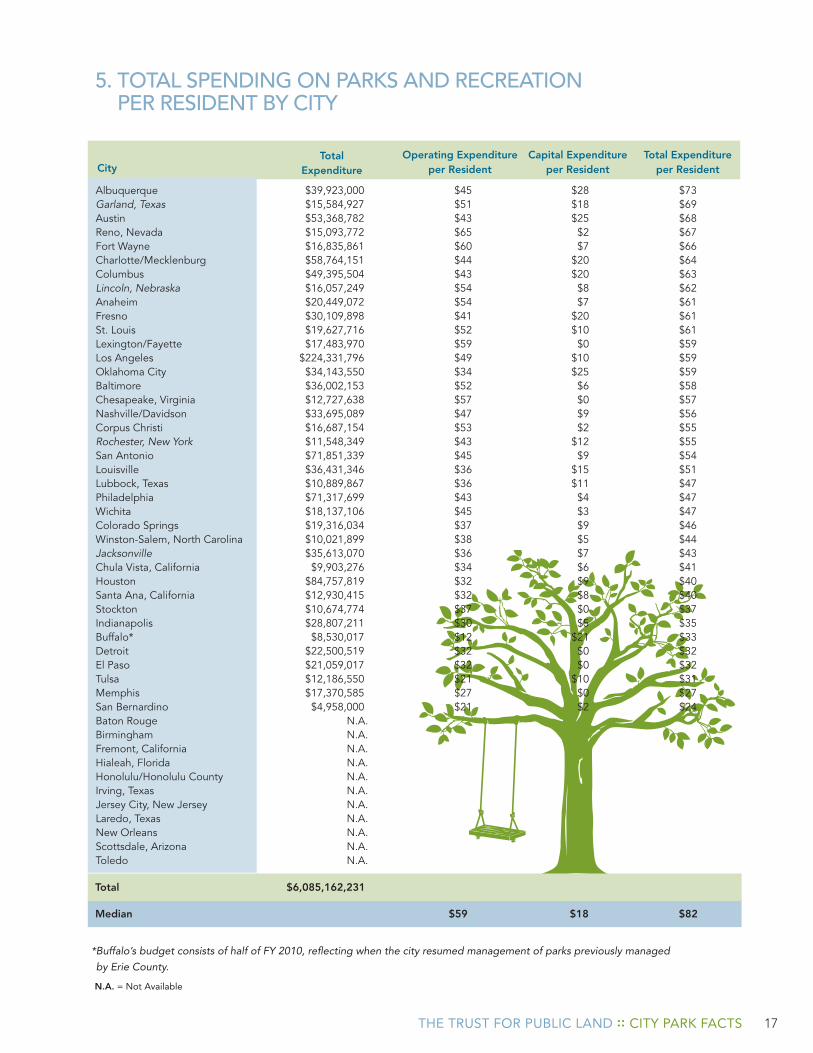
5. total speNDiNg oN parks aND recreatioN per resiDeNt By city
Total expenditure includes both operating and capital expenditure, but excludes stadiums, zoos, museums, aquariums, and cemeteries. If a city has more than one agency, expenditures are combined. Italics indicate cities whose financial information is partially from FY 2009. Totals reflect some rounding.
FY 2010
Total ExpenditureCity
Washington, D.C. $238,818,049 $219 $178 $397San Francisco $214,527,359 $222 $44 $266Seattle $157,368,865 $175 $83 $259Cincinnati $75,068,032 $115 $138 $253Minneapolis $87,416,955 $178 $50 $228Las Vegas $132,734,836 $118 $109 $227St. Paul, Minnesota $58,592,955 $152 $53 $206Henderson, Nevada $52,020,758 $124 $78 $202New York $1,357,902,998 $93 $73 $166North Las Vegas, Nevada $35,983,055 $71 $95 $166Chandler, Arizona $38,908,751 $48 $117 $165Plano, Texas $41,639,079 $93 $68 $160Chicago $425,137,086 $113 $45 $158Denver $89,370,502 $78 $71 $149Irvine, California $31,159,550 $104 $42 $147Portland, Oregon $85,656,096 $115 $31 $147Virginia Beach $63,462,184 $131 $14 $145Oakland $56,053,999 $80 $64 $143Raleigh $57,470,247 $97 $46 $142Sacramento $61,914,679 $113 $20 $133Durham, North Carolina $29,900,486 $51 $80 $131St. Petersburg $31,246,062 $126 $2 $128Aurora, Colorado $40,845,834 $103 $23 $126Long Beach, California $58,339,488 $109 $18 $126Riverside, California $37,210,997 $51 $71 $122San Jose $114,247,554 $69 $52 $121Kansas City, Missouri $54,604,992 $77 $41 $119Boston $70,808,037 $73 $41 $115Madison, Wisconsin $26,412,000 $86 $27 $113Newark, New Jersey $31,259,257 $53 $60 $113Bakersfield $38,931,154 $72 $40 $112Phoenix $159,305,265 $58 $53 $110Orlando $25,891,667 $108 $1 $109Pittsburgh $32,760,777 $69 $38 $107San Diego $138,408,677 $96 $10 $106Tampa $34,725,161 $89 $14 $103Tucson $51,007,905 $84 $14 $98Miami $38,153,637 $69 $27 $96Milwaukee/Milwaukee County $86,490,153 $43 $49 $91Spokane $18,342,700 $88 $0 $88Glendale, Arizona $19,658,823 $48 $38 $87Atlanta $36,200,673 $82 $4 $86Norfolk $20,582,262 $61 $24 $85Omaha $34,736,814 $67 $18 $85Arlington, Texas $30,274,305 $65 $17 $83Greensboro, North Carolina $22,072,226 $74 $8 $82Anchorage $23,485,629 $74 $7 $80Fort Worth $57,250,665 $61 $16 $77Dallas $91,346,676 $53 $23 $76Mesa, Arizona $32,776,389 $65 $10 $75Cleveland $29,560,809 $74 $0 $74
Total Expenditure per Resident
Operating Expenditure per Resident
Capital Expenditure per Resident
17THE TRUST FOR PUBLIC LAND :: CITY PARK FACTS
5. total speNDiNg oN parks aND recreatioN per resiDeNt By city
N.A. = Not Available
Total $6,085,162,231
Median $59 $18 $82
Total ExpenditureCity
Albuquerque $39,923,000 $45 $28 $73Garland, Texas $15,584,927 $51 $18 $69 Austin $53,368,782 $43 $25 $68Reno, Nevada $15,093,772 $65 $2 $67Fort Wayne $16,835,861 $60 $7 $66Charlotte/Mecklenburg $58,764,151 $44 $20 $64Columbus $49,395,504 $43 $20 $63Lincoln, Nebraska $16,057,249 $54 $8 $62Anaheim $20,449,072 $54 $7 $61Fresno $30,109,898 $41 $20 $61St. Louis $19,627,716 $52 $10 $61Lexington/Fayette $17,483,970 $59 $0 $59Los Angeles $224,331,796 $49 $10 $59Oklahoma City $34,143,550 $34 $25 $59Baltimore $36,002,153 $52 $6 $58Chesapeake, Virginia $12,727,638 $57 $0 $57Nashville/Davidson $33,695,089 $47 $9 $56Corpus Christi $16,687,154 $53 $2 $55Rochester, New York $11,548,349 $43 $12 $55San Antonio $71,851,339 $45 $9 $54Louisville $36,431,346 $36 $15 $51Lubbock, Texas $10,889,867 $36 $11 $47Philadelphia $71,317,699 $43 $4 $47Wichita $18,137,106 $45 $3 $47Colorado Springs $19,316,034 $37 $9 $46Winston-Salem, North Carolina $10,021,899 $38 $5 $44Jacksonville $35,613,070 $36 $7 $43Chula Vista, California $9,903,276 $34 $6 $41Houston $84,757,819 $32 $9 $40Santa Ana, California $12,930,415 $32 $8 $40Stockton $10,674,774 $37 $0 $37Indianapolis $28,807,211 $30 $5 $35Buffalo* $8,530,017 $12 $21 $33Detroit $22,500,519 $32 $0 $32El Paso $21,059,017 $32 $0 $32Tulsa $12,186,550 $21 $10 $31Memphis $17,370,585 $27 $0 $27San Bernardino $4,958,000 $21 $2 $24Baton Rouge N.A. Birmingham N.A. Fremont, California N.A. Hialeah, Florida N.A. Honolulu/Honolulu County N.A. Irving, Texas N.A. Jersey City, New Jersey N.A. Laredo, Texas N.A. New Orleans N.A. Scottsdale, Arizona N.A. Toledo N.A.
Total Expenditure per Resident
Operating Expenditure per Resident
Capital Expenditure per Resident
* Buffalo’s budget consists of half of FY 2010, reflecting when the city resumed management of parks previously managed by Erie County.
5. total speNDiNg oN parks aND recreatioN per resiDeNt By city
18 CITY PARK FACTS :: THE TRUST FOR PUBLIC LAND
400
350
300
250
200
150
100
50
0
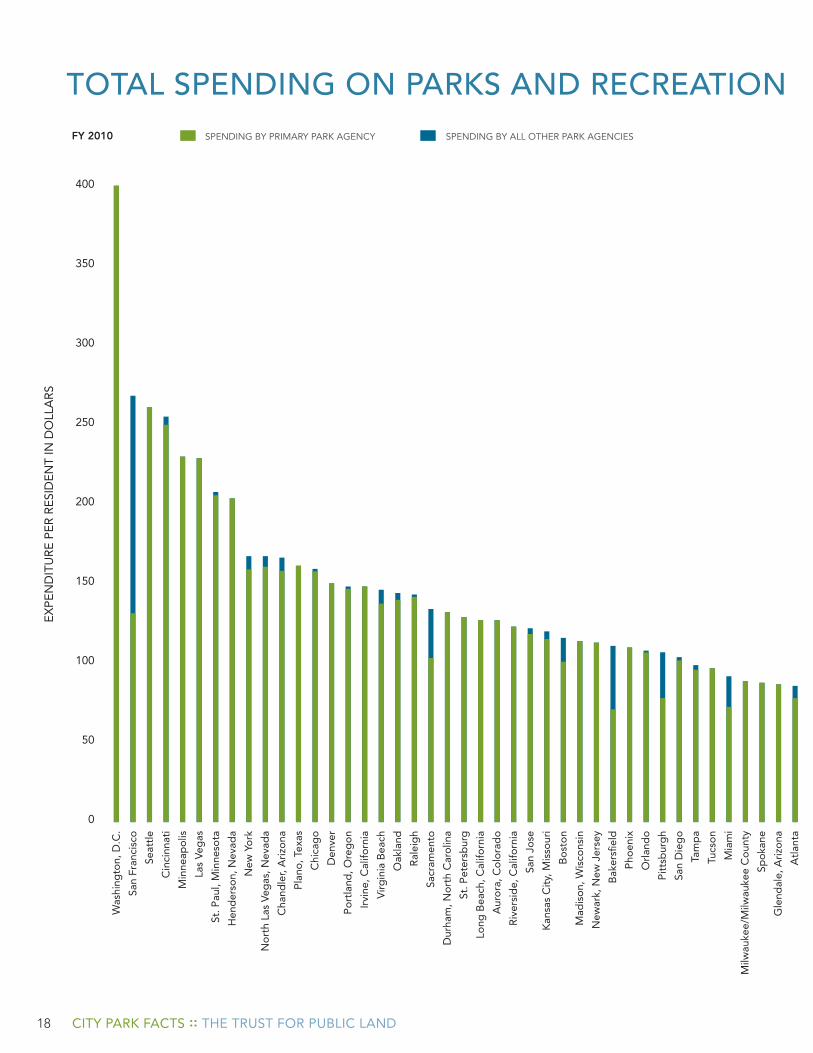
total speNDiNg oN parks aND recreatioN per resiDeNt By cityW
ashi
ngto
n, D
.C.
San
Fran
cisc
o
Seat
tle
Cin
cinn
ati
Min
neap
olis
Las
Veg
as
St. P
aul,
Min
neso
ta
Hen
der
son,
Nev
ada
New
Yo
rk
No
rth
Las
Veg
as, N
evad
a
Cha
ndle
r, A
rizo
na
Pla
no, T
exas
Chi
cag
o
Den
ver
Po
rtla
nd, O
reg
on
Irvi
ne, C
alifo
rnia
Virg
inia
Bea
ch
Oak
land
Ral
eig
h
Sacr
amen
to
Dur
ham
, No
rth
Car
olin
a
St. P
eter
sbur
g
Long
Bea
ch, C
alifo
rnia
Aur
ora
, Co
lora
do
Riv
ersi
de,
Cal
iforn
ia
San
Jose
Kan
sas
Cit
y, M
isso
uri
Bo
sto
n
Mad
iso
n, W
isco
nsin
New
ark,
New
Jer
sey
Bak
ersfi
eld
Pho
enix
Orl
and
o
Pit
tsb
urg
h
San
Die
go
Tam
pa
Tucs
on
Mia
mi
Milw
auke
e/M
ilwau
kee
Co
unty
Spo
kane
Gle
ndal
e, A
rizo
na
Atl
anta
Ex
PE
ND
ITu
RE
PE
R R
ESI
DE
NT
IN D
OLL
AR
S
FY 2010 SPENDING BY PRIMARY PARK AGENCY SPENDING BY ALL OTHER PARK AGENCIES
19THE TRUST FOR PUBLIC LAND :: CITY PARK FACTS
total speNDiNg oN parks aND recreatioN per resiDeNt By city
Om
aha
No
rfo
lk
Arl
ing
ton,
Tex
as
Gre
ensb
oro
, No
rth
Car
olin
a
Anc
hora
ge
Fort
Wo
rth
Dal
las
Mes
a, A
rizo
na
Cle
vela
nd
Alb
uque
rque
Gar
land
, Tex
as
Aus
tin
Ren
o, N
evad
a
Fort
Way
ne
Cha
rlo
tte/
Mec
klen
bur
g
Co
lum
bus
Linc
oln
, Neb
rask
a
Fres
no
Ana
heim
St. L
oui
s
Los
Ang
eles
Okl
aho
ma
Cit
y
Lexi
ngto
n/Fa
yett
e
Bal
tim
ore
Che
sap
eake
, Virg
inia
Nas
hvill
e/D
avid
son
Co
rpus
Chr
isti
Ro
ches
ter,
New
Yo
rk
San
Ant
oni
o
Loui
svill
e
Phi
lad
elp
hia
Wic
hita
Lub
bo
ck, T
exas
Co
lora
do
Sp
ring
s
Win
sto
n-Sa
lem
, No
rth
Car
olin
a
Jack
sonv
ille
Chu
la V
ista
, Cal
iforn
ia
Ho
usto
n
Sant
a A
na, C
alifo
rnia
Sto
ckto
n
Ind
iana
po
lis
Buf
falo
Det
roit
El P
aso
Tuls
a
Mem
phi
s
San
Ber
nard
ino
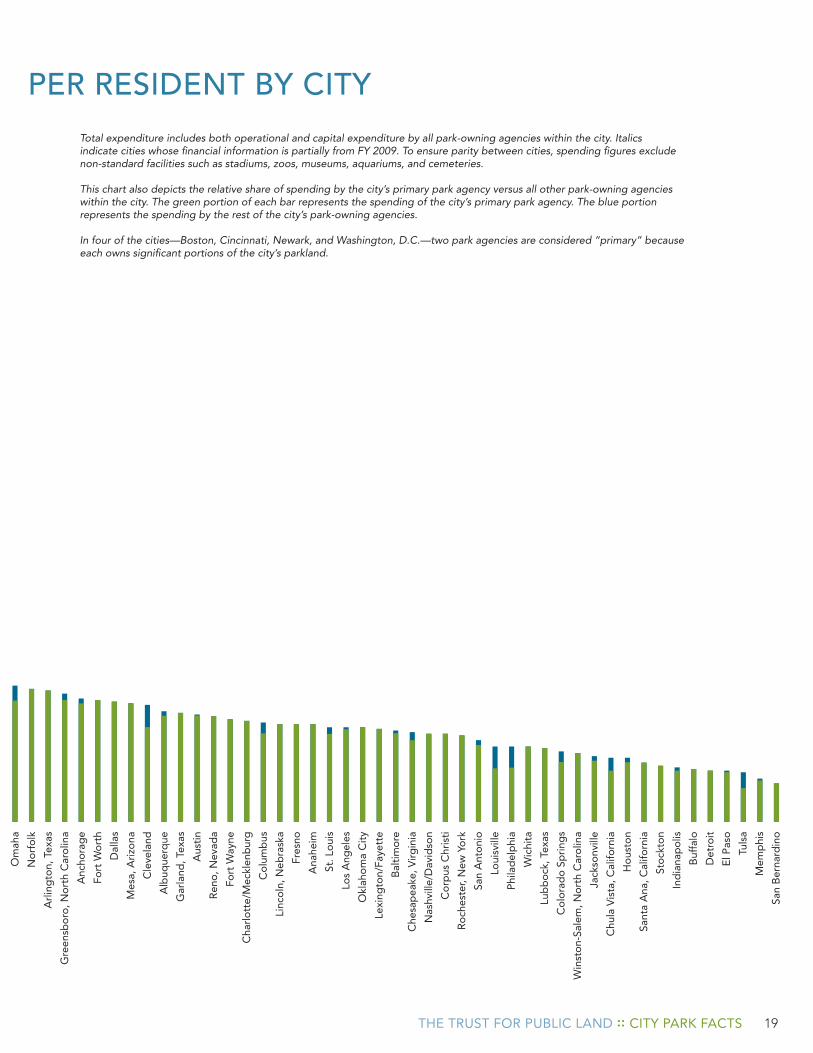
Total expenditure includes both operational and capital expenditure by all park-owning agencies within the city. Italics indicate cities whose financial information is partially from FY 2009. To ensure parity between cities, spending figures exclude non-standard facilities such as stadiums, zoos, museums, aquariums, and cemeteries.
This chart also depicts the relative share of spending by the city’s primary park agency versus all other park-owning agencies within the city. The green portion of each bar represents the spending of the city’s primary park agency. The blue portion represents the spending by the rest of the city’s park-owning agencies.
In four of the cities—Boston, Cincinnati, Newark, and Washington, D.C.—two park agencies are considered “primary” because each owns significant portions of the city’s parkland.
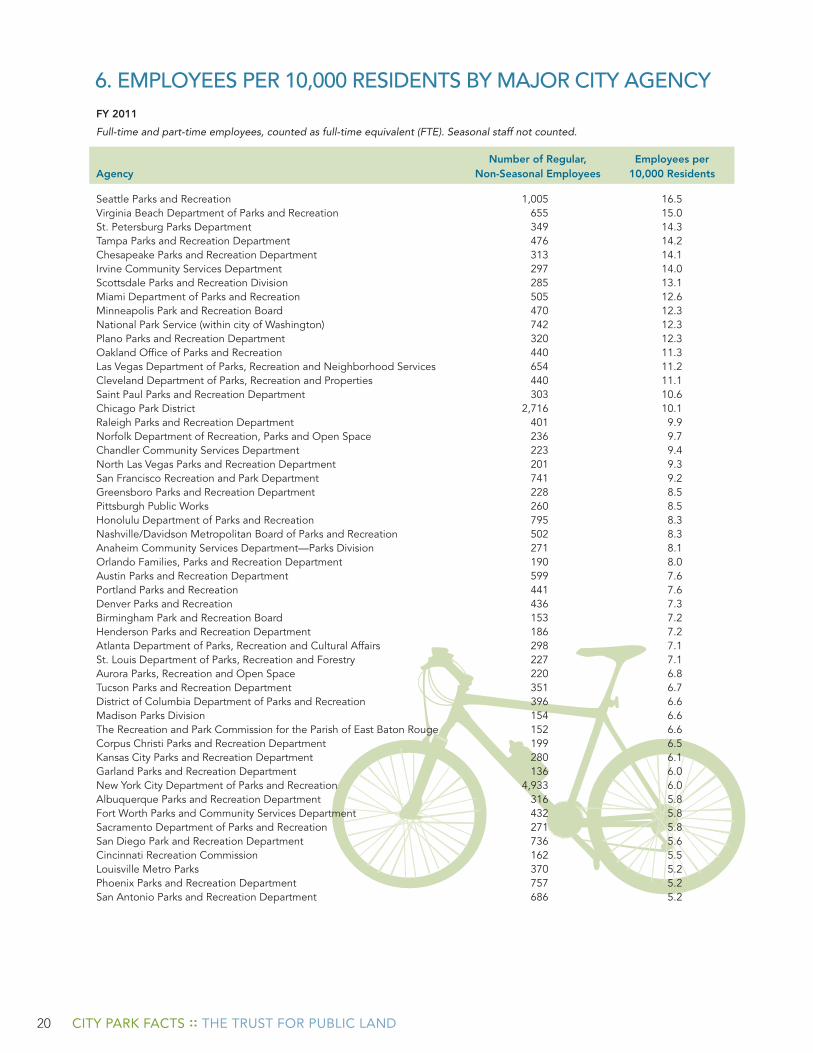
20 CITY PARK FACTS :: THE TRUST FOR PUBLIC LAND
Seattle Parks and Recreation 1,005 16.5Virginia Beach Department of Parks and Recreation 655 15.0St. Petersburg Parks Department 349 14.3Tampa Parks and Recreation Department 476 14.2Chesapeake Parks and Recreation Department 313 14.1Irvine Community Services Department 297 14.0Scottsdale Parks and Recreation Division 285 13.1Miami Department of Parks and Recreation 505 12.6Minneapolis Park and Recreation Board 470 12.3National Park Service (within city of Washington) 742 12.3Plano Parks and Recreation Department 320 12.3Oakland Office of Parks and Recreation 440 11.3Las Vegas Department of Parks, Recreation and Neighborhood Services 654 11.2Cleveland Department of Parks, Recreation and Properties 440 11.1Saint Paul Parks and Recreation Department 303 10.6Chicago Park District 2,716 10.1Raleigh Parks and Recreation Department 401 9.9Norfolk Department of Recreation, Parks and Open Space 236 9.7Chandler Community Services Department 223 9.4North Las Vegas Parks and Recreation Department 201 9.3San Francisco Recreation and Park Department 741 9.2Greensboro Parks and Recreation Department 228 8.5Pittsburgh Public Works 260 8.5Honolulu Department of Parks and Recreation 795 8.3Nashville/Davidson Metropolitan Board of Parks and Recreation 502 8.3Anaheim Community Services Department—Parks Division 271 8.1Orlando Families, Parks and Recreation Department 190 8.0Austin Parks and Recreation Department 599 7.6Portland Parks and Recreation 441 7.6Denver Parks and Recreation 436 7.3Birmingham Park and Recreation Board 153 7.2Henderson Parks and Recreation Department 186 7.2Atlanta Department of Parks, Recreation and Cultural Affairs 298 7.1St. Louis Department of Parks, Recreation and Forestry 227 7.1Aurora Parks, Recreation and Open Space 220 6.8Tucson Parks and Recreation Department 351 6.7District of Columbia Department of Parks and Recreation 396 6.6Madison Parks Division 154 6.6The Recreation and Park Commission for the Parish of East Baton Rouge 152 6.6Corpus Christi Parks and Recreation Department 199 6.5Kansas City Parks and Recreation Department 280 6.1Garland Parks and Recreation Department 136 6.0New York City Department of Parks and Recreation 4,933 6.0Albuquerque Parks and Recreation Department 316 5.8Fort Worth Parks and Community Services Department 432 5.8Sacramento Department of Parks and Recreation 271 5.8San Diego Park and Recreation Department 736 5.6Cincinnati Recreation Commission 162 5.5Louisville Metro Parks 370 5.2Phoenix Parks and Recreation Department 757 5.2San Antonio Parks and Recreation Department 686 5.2
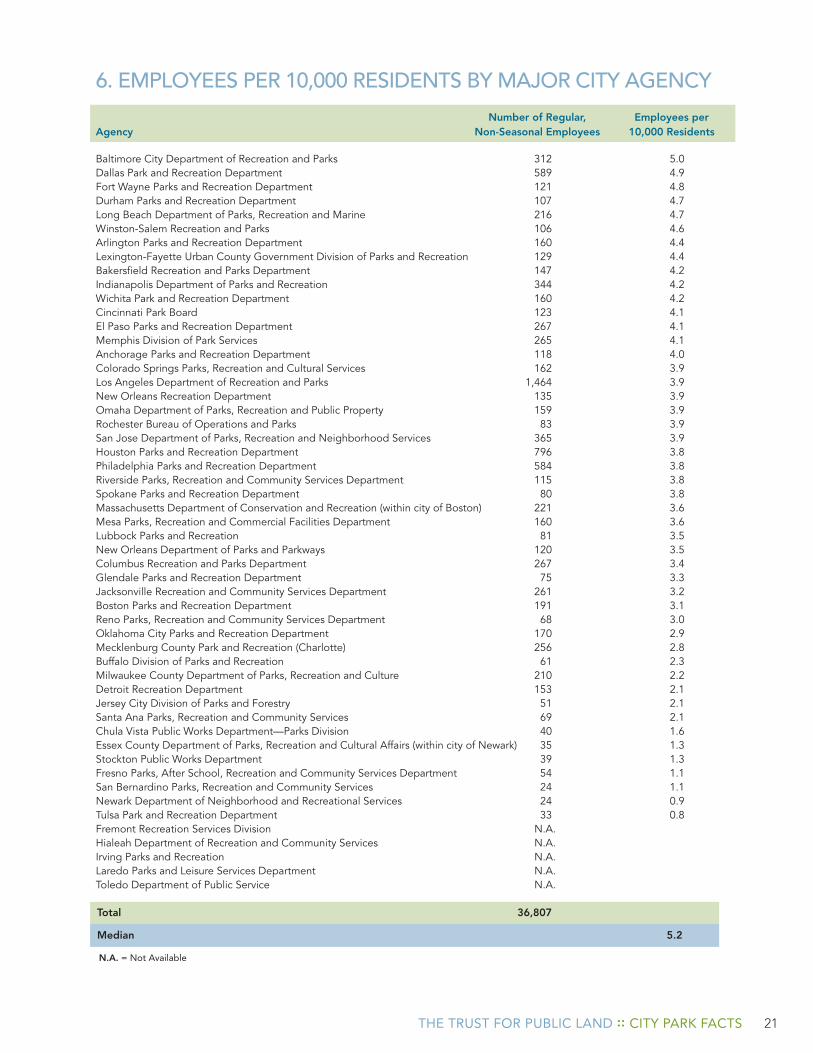
Full-time and part-time employees, counted as full-time equivalent (FTE). Seasonal staff not counted.
FY 2011
Number of Regular, Employees perAgency Non-Seasonal Employees 10,000 Residents
6. eMployees per 10,000 resiDeNts By Major city ageNcy
21THE TRUST FOR PUBLIC LAND :: CITY PARK FACTS
6. eMployees per 10,000 resiDeNts By Major city ageNcy
Total 36,807
Median 5.2
Number of Regular, Employees perAgency Non-Seasonal Employees 10,000 Residents
Baltimore City Department of Recreation and Parks 312 5.0Dallas Park and Recreation Department 589 4.9Fort Wayne Parks and Recreation Department 121 4.8Durham Parks and Recreation Department 107 4.7Long Beach Department of Parks, Recreation and Marine 216 4.7Winston-Salem Recreation and Parks 106 4.6Arlington Parks and Recreation Department 160 4.4Lexington-Fayette Urban County Government Division of Parks and Recreation 129 4.4Bakersfield Recreation and Parks Department 147 4.2Indianapolis Department of Parks and Recreation 344 4.2Wichita Park and Recreation Department 160 4.2Cincinnati Park Board 123 4.1El Paso Parks and Recreation Department 267 4.1Memphis Division of Park Services 265 4.1Anchorage Parks and Recreation Department 118 4.0Colorado Springs Parks, Recreation and Cultural Services 162 3.9Los Angeles Department of Recreation and Parks 1,464 3.9New Orleans Recreation Department 135 3.9Omaha Department of Parks, Recreation and Public Property 159 3.9Rochester Bureau of Operations and Parks 83 3.9San Jose Department of Parks, Recreation and Neighborhood Services 365 3.9Houston Parks and Recreation Department 796 3.8Philadelphia Parks and Recreation Department 584 3.8Riverside Parks, Recreation and Community Services Department 115 3.8Spokane Parks and Recreation Department 80 3.8Massachusetts Department of Conservation and Recreation (within city of Boston) 221 3.6Mesa Parks, Recreation and Commercial Facilities Department 160 3.6Lubbock Parks and Recreation 81 3.5New Orleans Department of Parks and Parkways 120 3.5Columbus Recreation and Parks Department 267 3.4Glendale Parks and Recreation Department 75 3.3Jacksonville Recreation and Community Services Department 261 3.2Boston Parks and Recreation Department 191 3.1Reno Parks, Recreation and Community Services Department 68 3.0Oklahoma City Parks and Recreation Department 170 2.9Mecklenburg County Park and Recreation (Charlotte) 256 2.8Buffalo Division of Parks and Recreation 61 2.3Milwaukee County Department of Parks, Recreation and Culture 210 2.2Detroit Recreation Department 153 2.1Jersey City Division of Parks and Forestry 51 2.1Santa Ana Parks, Recreation and Community Services 69 2.1Chula Vista Public Works Department—Parks Division 40 1.6Essex County Department of Parks, Recreation and Cultural Affairs (within city of Newark) 35 1.3Stockton Public Works Department 39 1.3Fresno Parks, After School, Recreation and Community Services Department 54 1.1San Bernardino Parks, Recreation and Community Services 24 1.1Newark Department of Neighborhood and Recreational Services 24 0.9Tulsa Park and Recreation Department 33 0.8Fremont Recreation Services Division N.A. Hialeah Department of Recreation and Community Services N.A. Irving Parks and Recreation N.A. Laredo Parks and Leisure Services Department N.A. Toledo Department of Public Service N.A.
N.A. = Not Available
22 CITY PARK FACTS :: THE TRUST FOR PUBLIC LAND
Number of Centers
Diamonds per 10,000 ResidentsCity
Number of Diamonds
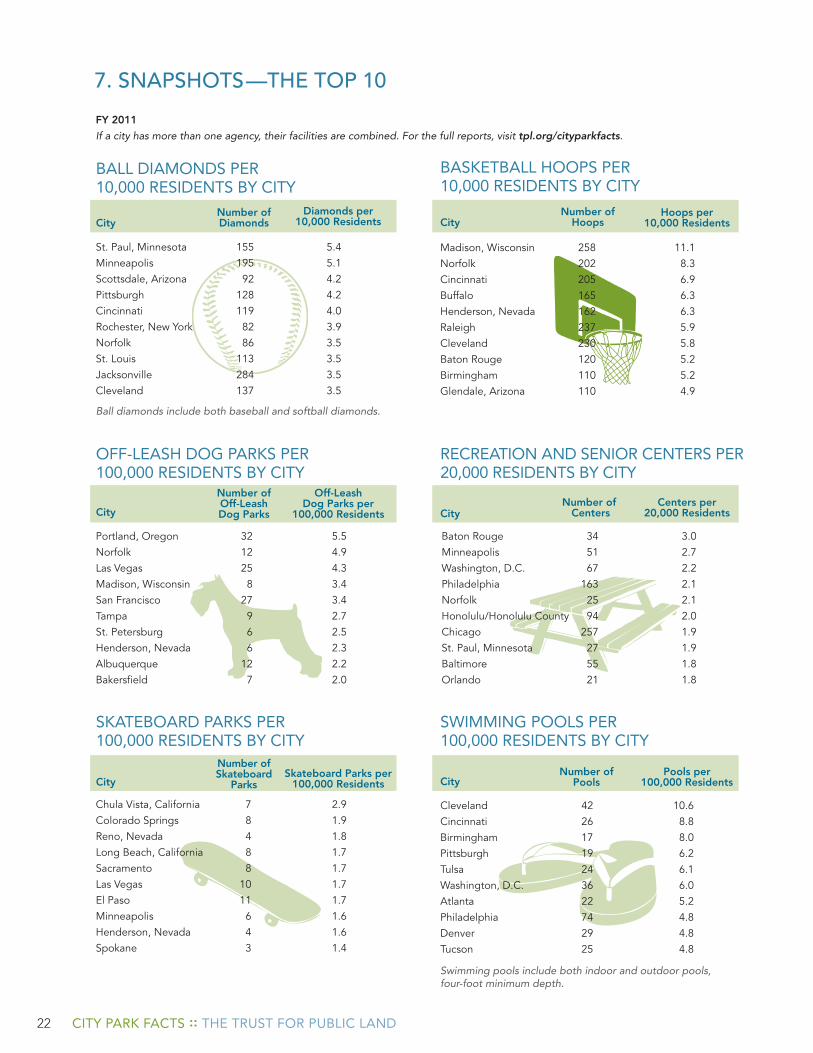
7. sNapsHots—tHe top 10
BALL DIAMONDS PER 10,000 RESIDENTS BY CITY
Ball diamonds include both baseball and softball diamonds.
If a city has more than one agency, their facilities are combined. For the full reports, visit tpl.org/cityparkfacts.FY 2011
City
Off-Leash Dog Parks per
100,000 Residents
Number of Off-Leash Dog Parks
OFF-LEASH DOG PARKS PER 100,000 RESIDENTS BY CITY
RECREATION AND SENIOR CENTERS PER 20,000 RESIDENTS BY CITY
SKATEBOARD PARKS PER 100,000 RESIDENTS BY CITY
City Centers per
20,000 Residents
City Skateboard Parks per
100,000 Residents
Number of Skateboard
Parks City
Cleveland 42 10.6Cincinnati 26 8.8Birmingham 17 8.0Pittsburgh 19 6.2Tulsa 24 6.1Washington, D.C. 36 6.0Atlanta 22 5.2Philadelphia 74 4.8Denver 29 4.8Tucson 25 4.8
Pools per 100,000 Residents
Number of Pools
City Hoops per
10,000 Residents Number of
Hoops
SWIMMING POOLS PER 100,000 RESIDENTS BY CITY
BASKETBALL HOOPS PER 10,000 RESIDENTS BY CITY
Swimming pools include both indoor and outdoor pools, four-foot minimum depth.
St. Paul, Minnesota 155 5.4Minneapolis 195 5.1Scottsdale, Arizona 92 4.2Pittsburgh 128 4.2Cincinnati 119 4.0Rochester, New York 82 3.9Norfolk 86 3.5St. Louis 113 3.5Jacksonville 284 3.5Cleveland 137 3.5
Madison, Wisconsin 258 11.1Norfolk 202 8.3Cincinnati 205 6.9Buffalo 165 6.3Henderson, Nevada 162 6.3Raleigh 237 5.9Cleveland 230 5.8Baton Rouge 120 5.2Birmingham 110 5.2Glendale, Arizona 110 4.9
Portland, Oregon 32 5.5Norfolk 12 4.9Las Vegas 25 4.3Madison, Wisconsin 8 3.4San Francisco 27 3.4Tampa 9 2.7St. Petersburg 6 2.5Henderson, Nevada 6 2.3Albuquerque 12 2.2Bakersfield 7 2.0
Chula Vista, California 7 2.9Colorado Springs 8 1.9Reno, Nevada 4 1.8Long Beach, California 8 1.7Sacramento 8 1.7Las Vegas 10 1.7El Paso 11 1.7Minneapolis 6 1.6Henderson, Nevada 4 1.6Spokane 3 1.4
Baton Rouge 34 3.0Minneapolis 51 2.7Washington, D.C. 67 2.2Philadelphia 163 2.1Norfolk 25 2.1Honolulu/Honolulu County 94 2.0Chicago 257 1.9St. Paul, Minnesota 27 1.9Baltimore 55 1.8Orlando 21 1.8
23THE TRUST FOR PUBLIC LAND :: CITY PARK FACTS
Rank Park Name Type Acres City
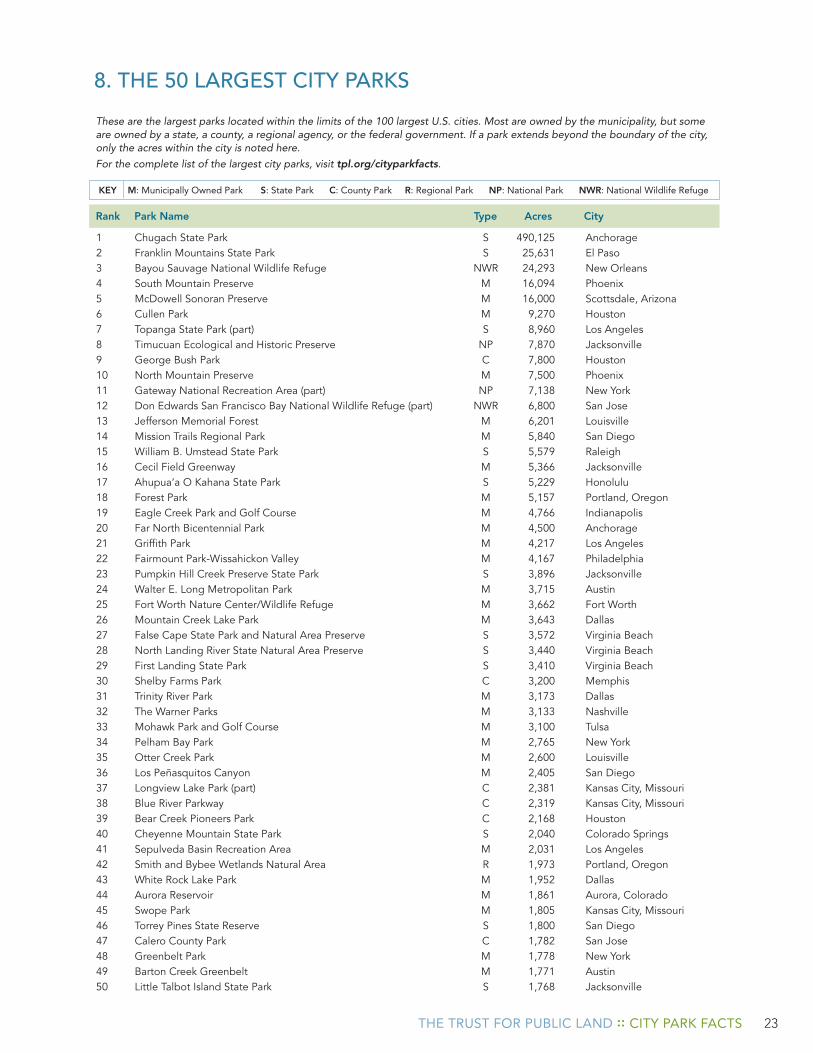
1 Chugach State Park S 490,125 Anchorage2 Franklin Mountains State Park S 25,631 El Paso3 Bayou Sauvage National Wildlife Refuge NWR 24,293 New Orleans4 South Mountain Preserve M 16,094 Phoenix5 McDowell Sonoran Preserve M 16,000 Scottsdale, Arizona6 Cullen Park M 9,270 Houston7 Topanga State Park (part) S 8,960 Los Angeles8 Timucuan Ecological and Historic Preserve NP 7,870 Jacksonville9 George Bush Park C 7,800 Houston10 North Mountain Preserve M 7,500 Phoenix11 Gateway National Recreation Area (part) NP 7,138 New York12 Don Edwards San Francisco Bay National Wildlife Refuge (part) NWR 6,800 San Jose13 Jefferson Memorial Forest M 6,201 Louisville14 Mission Trails Regional Park M 5,840 San Diego15 William B. Umstead State Park S 5,579 Raleigh16 Cecil Field Greenway M 5,366 Jacksonville17 Ahupua’a O Kahana State Park S 5,229 Honolulu18 Forest Park M 5,157 Portland, Oregon19 Eagle Creek Park and Golf Course M 4,766 Indianapolis20 Far North Bicentennial Park M 4,500 Anchorage21 Griffith Park M 4,217 Los Angeles22 Fairmount Park-Wissahickon Valley M 4,167 Philadelphia23 Pumpkin Hill Creek Preserve State Park S 3,896 Jacksonville24 Walter E. Long Metropolitan Park M 3,715 Austin25 Fort Worth Nature Center/Wildlife Refuge M 3,662 Fort Worth26 Mountain Creek Lake Park M 3,643 Dallas27 False Cape State Park and Natural Area Preserve S 3,572 Virginia Beach28 North Landing River State Natural Area Preserve S 3,440 Virginia Beach29 First Landing State Park S 3,410 Virginia Beach30 Shelby Farms Park C 3,200 Memphis31 Trinity River Park M 3,173 Dallas32 The Warner Parks M 3,133 Nashville33 Mohawk Park and Golf Course M 3,100 Tulsa34 Pelham Bay Park M 2,765 New York35 Otter Creek Park M 2,600 Louisville36 Los Peñasquitos Canyon M 2,405 San Diego37 Longview Lake Park (part) C 2,381 Kansas City, Missouri38 Blue River Parkway C 2,319 Kansas City, Missouri39 Bear Creek Pioneers Park C 2,168 Houston40 Cheyenne Mountain State Park S 2,040 Colorado Springs41 Sepulveda Basin Recreation Area M 2,031 Los Angeles42 Smith and Bybee Wetlands Natural Area R 1,973 Portland, Oregon43 White Rock Lake Park M 1,952 Dallas44 Aurora Reservoir M 1,861 Aurora, Colorado45 Swope Park M 1,805 Kansas City, Missouri46 Torrey Pines State Reserve S 1,800 San Diego47 Calero County Park C 1,782 San Jose48 Greenbelt Park M 1,778 New York49 Barton Creek Greenbelt M 1,771 Austin50 Little Talbot Island State Park S 1,768 Jacksonville
8. tHe 50 largest city parks
These are the largest parks located within the limits of the 100 largest U.S. cities. Most are owned by the municipality, but some are owned by a state, a county, a regional agency, or the federal government. If a park extends beyond the boundary of the city, only the acres within the city is noted here.
For the complete list of the largest city parks, visit tpl.org/cityparkfacts.
KEY M: Municipally Owned Park S: State Park C: County Park R: Regional Park NP: National Park NWR: National Wildlife Refuge
24 CITY PARK FACTS :: THE TRUST FOR PUBLIC LAND
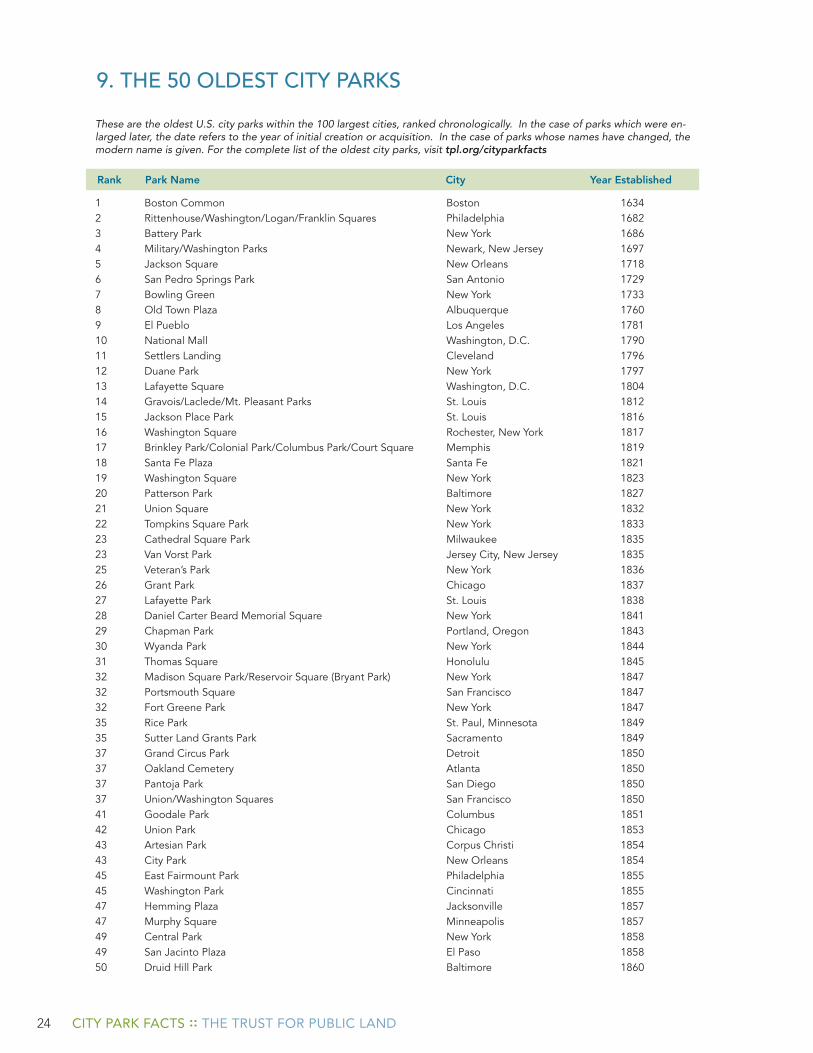
9. tHe 50 olDest city parks
These are the oldest U.S. city parks within the 100 largest cities, ranked chronologically. In the case of parks which were en-larged later, the date refers to the year of initial creation or acquisition. In the case of parks whose names have changed, the modern name is given. For the complete list of the oldest city parks, visit tpl.org/cityparkfacts
1 Boston Common Boston 16342 Rittenhouse/Washington/Logan/Franklin Squares Philadelphia 16823 Battery Park New York 16864 Military/Washington Parks Newark, New Jersey 16975 Jackson Square New Orleans 17186 San Pedro Springs Park San Antonio 17297 Bowling Green New York 17338 Old Town Plaza Albuquerque 17609 El Pueblo Los Angeles 178110 National Mall Washington, D.C. 179011 Settlers Landing Cleveland 179612 Duane Park New York 179713 Lafayette Square Washington, D.C. 180414 Gravois/Laclede/Mt. Pleasant Parks St. Louis 181215 Jackson Place Park St. Louis 181616 Washington Square Rochester, New York 181717 Brinkley Park/Colonial Park/Columbus Park/Court Square Memphis 181918 Santa Fe Plaza Santa Fe 182119 Washington Square New York 182320 Patterson Park Baltimore 182721 Union Square New York 183222 Tompkins Square Park New York 183323 Cathedral Square Park Milwaukee 183523 Van Vorst Park Jersey City, New Jersey 183525 Veteran’s Park New York 183626 Grant Park Chicago 183727 Lafayette Park St. Louis 183828 Daniel Carter Beard Memorial Square New York 184129 Chapman Park Portland, Oregon 184330 Wyanda Park New York 184431 Thomas Square Honolulu 184532 Madison Square Park/Reservoir Square (Bryant Park) New York 184732 Portsmouth Square San Francisco 184732 Fort Greene Park New York 184735 Rice Park St. Paul, Minnesota 184935 Sutter Land Grants Park Sacramento 184937 Grand Circus Park Detroit 185037 Oakland Cemetery Atlanta 185037 Pantoja Park San Diego 185037 Union/Washington Squares San Francisco 185041 Goodale Park Columbus 185142 Union Park Chicago 185343 Artesian Park Corpus Christi 185443 City Park New Orleans 185445 East Fairmount Park Philadelphia 185545 Washington Park Cincinnati 185547 Hemming Plaza Jacksonville 185747 Murphy Square Minneapolis 185749 Central Park New York 185849 San Jacinto Plaza El Paso 185850 Druid Hill Park Baltimore 1860
Rank Park Name City Year Established
25THE TRUST FOR PUBLIC LAND :: CITY PARK FACTS
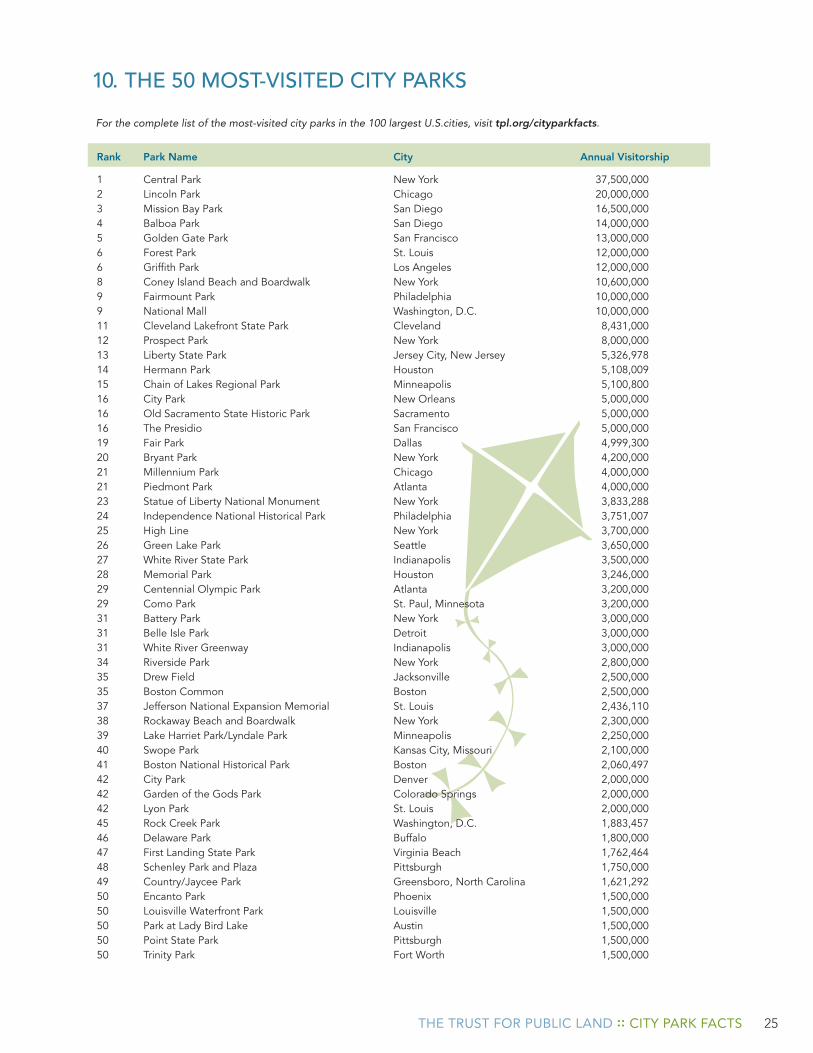
10. tHe 50 Most-VisiteD city parks
Rank Park Name City Annual Visitorship
1 Central Park New York 37,500,0002 Lincoln Park Chicago 20,000,0003 Mission Bay Park San Diego 16,500,0004 Balboa Park San Diego 14,000,0005 Golden Gate Park San Francisco 13,000,0006 Forest Park St. Louis 12,000,0006 Griffith Park Los Angeles 12,000,0008 Coney Island Beach and Boardwalk New York 10,600,0009 Fairmount Park Philadelphia 10,000,0009 National Mall Washington, D.C. 10,000,00011 Cleveland Lakefront State Park Cleveland 8,431,00012 Prospect Park New York 8,000,00013 Liberty State Park Jersey City, New Jersey 5,326,97814 Hermann Park Houston 5,108,00915 Chain of Lakes Regional Park Minneapolis 5,100,80016 City Park New Orleans 5,000,00016 Old Sacramento State Historic Park Sacramento 5,000,00016 The Presidio San Francisco 5,000,00019 Fair Park Dallas 4,999,30020 Bryant Park New York 4,200,00021 Millennium Park Chicago 4,000,00021 Piedmont Park Atlanta 4,000,00023 Statue of Liberty National Monument New York 3,833,28824 Independence National Historical Park Philadelphia 3,751,00725 High Line New York 3,700,00026 Green Lake Park Seattle 3,650,00027 White River State Park Indianapolis 3,500,00028 Memorial Park Houston 3,246,00029 Centennial Olympic Park Atlanta 3,200,00029 Como Park St. Paul, Minnesota 3,200,00031 Battery Park New York 3,000,00031 Belle Isle Park Detroit 3,000,00031 White River Greenway Indianapolis 3,000,00034 Riverside Park New York 2,800,00035 Drew Field Jacksonville 2,500,00035 Boston Common Boston 2,500,00037 Jefferson National Expansion Memorial St. Louis 2,436,11038 Rockaway Beach and Boardwalk New York 2,300,00039 Lake Harriet Park/Lyndale Park Minneapolis 2,250,00040 Swope Park Kansas City, Missouri 2,100,00041 Boston National Historical Park Boston 2,060,49742 City Park Denver 2,000,00042 Garden of the Gods Park Colorado Springs 2,000,00042 Lyon Park St. Louis 2,000,00045 Rock Creek Park Washington, D.C. 1,883,45746 Delaware Park Buffalo 1,800,00047 First Landing State Park Virginia Beach 1,762,46448 Schenley Park and Plaza Pittsburgh 1,750,00049 Country/Jaycee Park Greensboro, North Carolina 1,621,29250 Encanto Park Phoenix 1,500,00050 Louisville Waterfront Park Louisville 1,500,00050 Park at Lady Bird Lake Austin 1,500,00050 Point State Park Pittsburgh 1,500,00050 Trinity Park Fort Worth 1,500,000
For the complete list of the most-visited city parks in the 100 largest U.S.cities, visit tpl.org/cityparkfacts.
26 CITY PARK FACTS :: THE TRUST FOR PUBLIC LAND
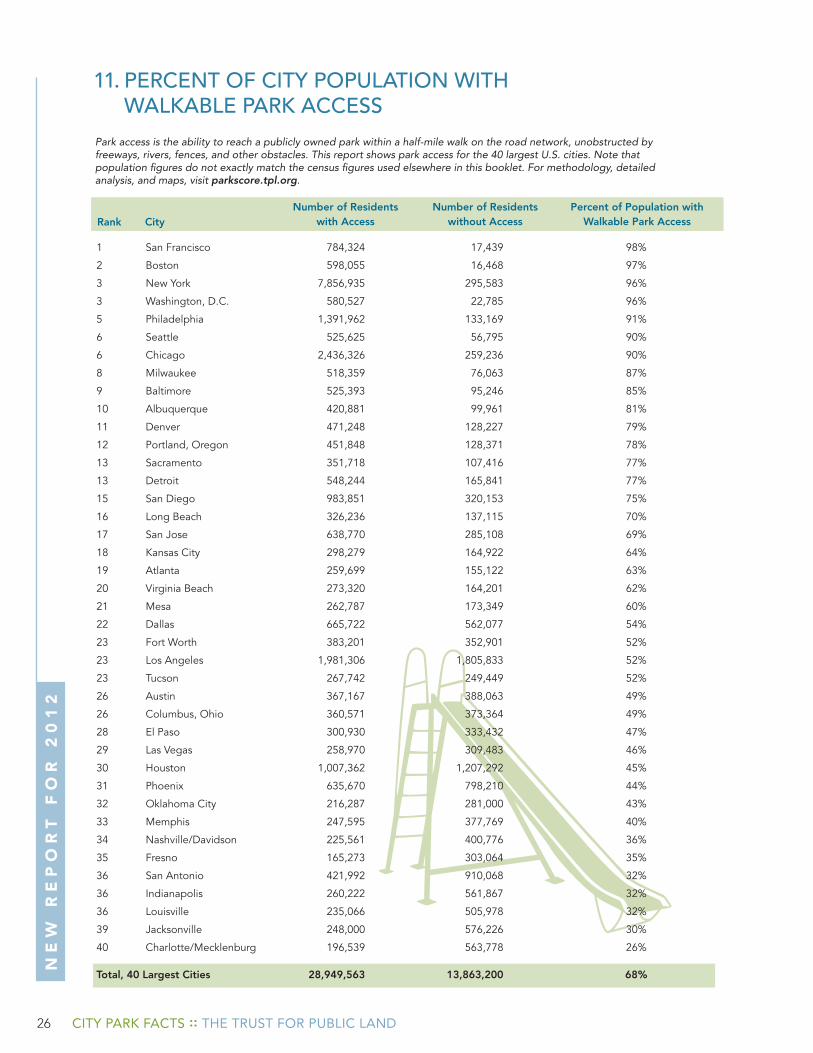
11. perceNt of city popUlatioN witH walkaBle park access
Park access is the ability to reach a publicly owned park within a half-mile walk on the road network, unobstructed by freeways, rivers, fences, and other obstacles. This report shows park access for the 40 largest U.S. cities. Note that population figures do not exactly match the census figures used elsewhere in this booklet. For methodology, detailed analysis, and maps, visit parkscore.tpl.org.
Rank CityPercent of Population with
Walkable Park AccessNumber of Residents
with AccessNumber of Residents
without Access
ne
w
re
po
rt
f
or
2
01
2
1 San Francisco 784,324 17,439 98%
2 Boston 598,055 16,468 97%
3 New York 7,856,935 295,583 96%
3 Washington, D.C. 580,527 22,785 96%
5 Philadelphia 1,391,962 133,169 91%
6 Seattle 525,625 56,795 90%
6 Chicago 2,436,326 259,236 90%
8 Milwaukee 518,359 76,063 87%
9 Baltimore 525,393 95,246 85%
10 Albuquerque 420,881 99,961 81%
11 Denver 471,248 128,227 79%
12 Portland, Oregon 451,848 128,371 78%
13 Sacramento 351,718 107,416 77%
13 Detroit 548,244 165,841 77%
15 San Diego 983,851 320,153 75%
16 Long Beach 326,236 137,115 70%
17 San Jose 638,770 285,108 69%
18 Kansas City 298,279 164,922 64%
19 Atlanta 259,699 155,122 63%
20 Virginia Beach 273,320 164,201 62%
21 Mesa 262,787 173,349 60%
22 Dallas 665,722 562,077 54%
23 Fort Worth 383,201 352,901 52%
23 Los Angeles 1,981,306 1,805,833 52%
23 Tucson 267,742 249,449 52%
26 Austin 367,167 388,063 49%
26 Columbus, Ohio 360,571 373,364 49%
28 El Paso 300,930 333,432 47%
29 Las Vegas 258,970 309,483 46%
30 Houston 1,007,362 1,207,292 45%
31 Phoenix 635,670 798,210 44%
32 Oklahoma City 216,287 281,000 43%
33 Memphis 247,595 377,769 40%
34 Nashville/Davidson 225,561 400,776 36%
35 Fresno 165,273 303,064 35%
36 San Antonio 421,992 910,068 32%
36 Indianapolis 260,222 561,867 32%
36 Louisville 235,066 505,978 32%
39 Jacksonville 248,000 576,226 30%
40 Charlotte/Mecklenburg 196,539 563,778 26%
Total, 40 Largest Cities 28,949,563 13,863,200 68%
27THE TRUST FOR PUBLIC LAND :: CITY PARK FACTS
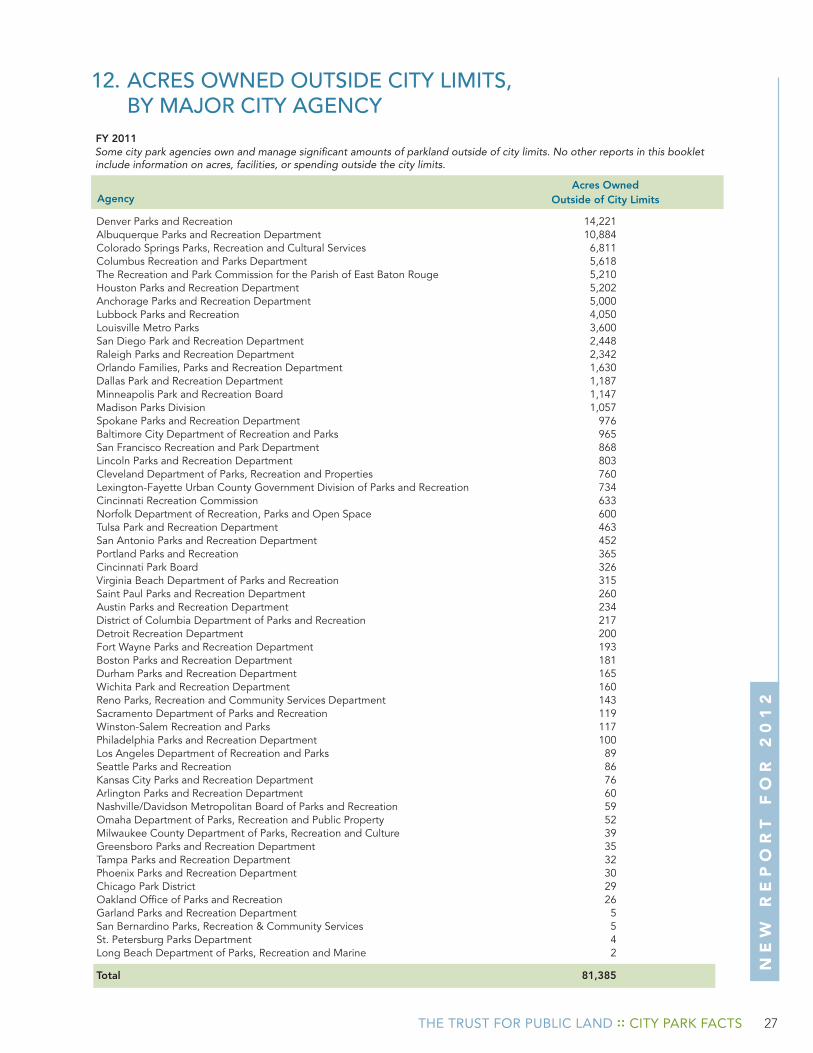
12. acres owNeD oUtsiDe city liMits, By Major city ageNcy
Some city park agencies own and manage significant amounts of parkland outside of city limits. No other reports in this booklet include information on acres, facilities, or spending outside the city limits.
Denver Parks and Recreation 14,221Albuquerque Parks and Recreation Department 10,884Colorado Springs Parks, Recreation and Cultural Services 6,811Columbus Recreation and Parks Department 5,618The Recreation and Park Commission for the Parish of East Baton Rouge 5,210Houston Parks and Recreation Department 5,202Anchorage Parks and Recreation Department 5,000Lubbock Parks and Recreation 4,050Louisville Metro Parks 3,600San Diego Park and Recreation Department 2,448Raleigh Parks and Recreation Department 2,342Orlando Families, Parks and Recreation Department 1,630Dallas Park and Recreation Department 1,187Minneapolis Park and Recreation Board 1,147Madison Parks Division 1,057Spokane Parks and Recreation Department 976Baltimore City Department of Recreation and Parks 965San Francisco Recreation and Park Department 868Lincoln Parks and Recreation Department 803Cleveland Department of Parks, Recreation and Properties 760Lexington-Fayette Urban County Government Division of Parks and Recreation 734Cincinnati Recreation Commission 633Norfolk Department of Recreation, Parks and Open Space 600Tulsa Park and Recreation Department 463San Antonio Parks and Recreation Department 452Portland Parks and Recreation 365Cincinnati Park Board 326Virginia Beach Department of Parks and Recreation 315Saint Paul Parks and Recreation Department 260Austin Parks and Recreation Department 234District of Columbia Department of Parks and Recreation 217Detroit Recreation Department 200Fort Wayne Parks and Recreation Department 193Boston Parks and Recreation Department 181Durham Parks and Recreation Department 165Wichita Park and Recreation Department 160Reno Parks, Recreation and Community Services Department 143Sacramento Department of Parks and Recreation 119Winston-Salem Recreation and Parks 117Philadelphia Parks and Recreation Department 100Los Angeles Department of Recreation and Parks 89Seattle Parks and Recreation 86Kansas City Parks and Recreation Department 76Arlington Parks and Recreation Department 60Nashville/Davidson Metropolitan Board of Parks and Recreation 59Omaha Department of Parks, Recreation and Public Property 52Milwaukee County Department of Parks, Recreation and Culture 39Greensboro Parks and Recreation Department 35Tampa Parks and Recreation Department 32Phoenix Parks and Recreation Department 30Chicago Park District 29Oakland Office of Parks and Recreation 26Garland Parks and Recreation Department 5San Bernardino Parks, Recreation & Community Services 5St. Petersburg Parks Department 4Long Beach Department of Parks, Recreation and Marine 2
Total 81,385
AgencyAcres Owned
Outside of City Limits
FY 2011
ne
w
re
po
rt
f
or
2
01
2
28 CITY PARK FACTS :: THE TRUST FOR PUBLIC LAND
$ $$ $
$ $$ $$ $$ $$ $$ $$ $$ $$ $$ $$ $$ $$ $$ $$ $$ $$ $$ $$ $$ $
$ $$ $$ $$ $$ $$ $$ $$ $$ $$ $$ $$ $$ $$ $$ $$ $$ $$ $$ $$ $$ $$ $
$ $$ $$ $$ $
$ $$ $$ $$ $$ $$ $$ $$ $$ $$ $$ $$ $$ $$ $$ $$ $$ $$ $$ $$ $$ $$ $$ $$ $
$ $$ $
$ $$ $
$ $$ $
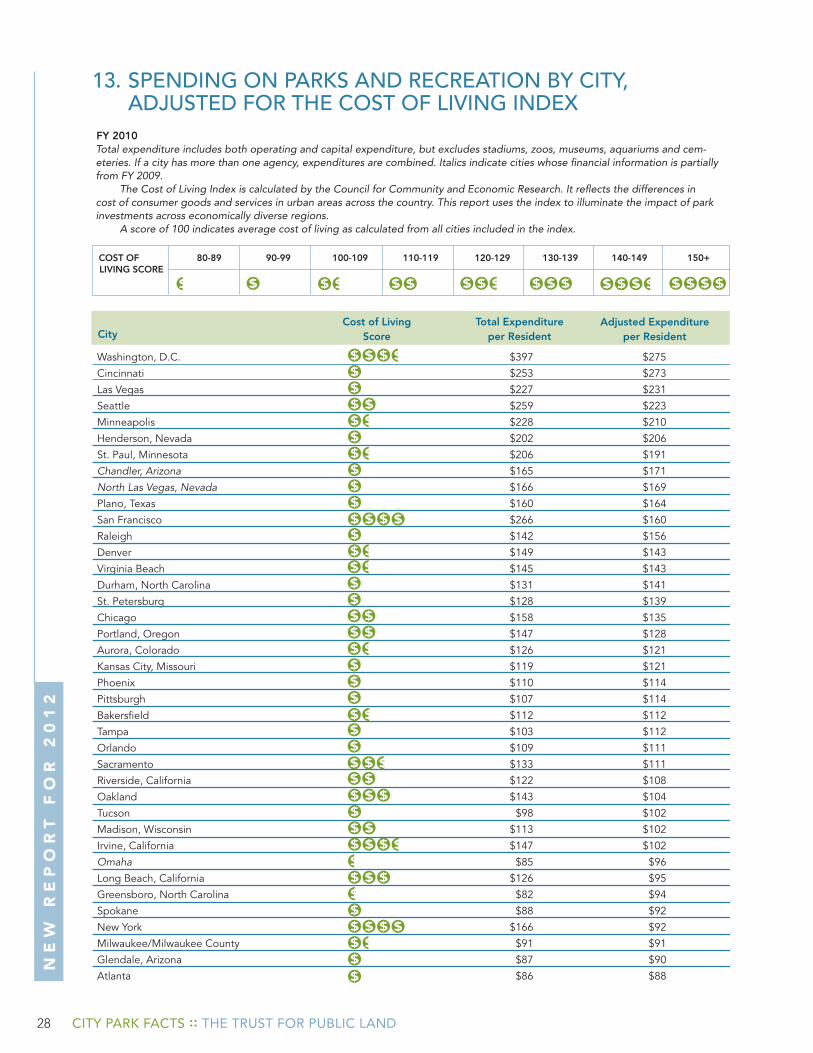
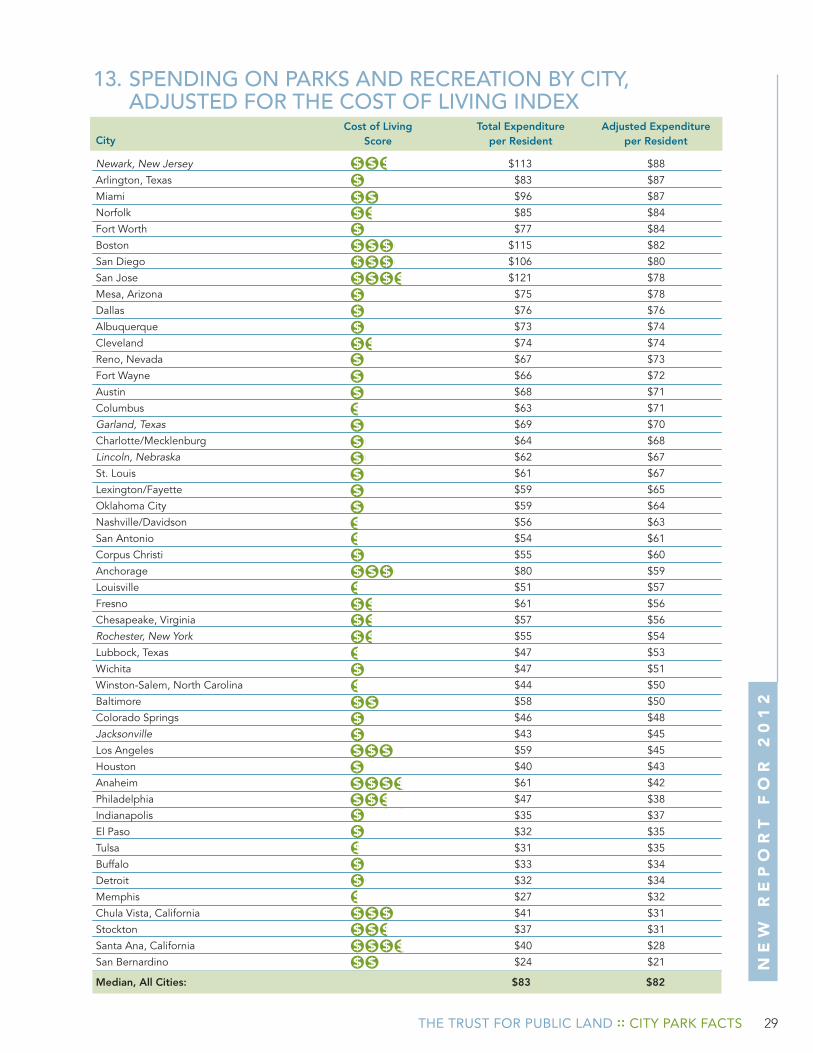
13. speNDiNg oN parks aND recreatioN By city, aDjUsteD for tHe cost of liViNg iNDex
Total expenditure includes both operating and capital expenditure, but excludes stadiums, zoos, museums, aquariums and cem-eteries. If a city has more than one agency, expenditures are combined. Italics indicate cities whose financial information is partially from FY 2009. The Cost of Living Index is calculated by the Council for Community and Economic Research. It reflects the differences in cost of consumer goods and services in urban areas across the country. This report uses the index to illuminate the impact of park investments across economically diverse regions. A score of 100 indicates average cost of living as calculated from all cities included in the index.
Washington, D.C. $397 $275 3.50
Cincinnati $253 $273
Las Vegas $227 $231 1.00
Seattle $259 $223
Minneapolis $228 $210 1.50
Henderson, Nevada $202 $206
St. Paul, Minnesota $206 $191 1.50
Chandler, Arizona $165 $171
North Las Vegas, Nevada $166 $169 1.00
Plano, Texas $160 $164
San Francisco $266 $160 4.00
Raleigh $142 $156 1.00
Denver $149 $143
Virginia Beach $145 $143 1.50
Durham, North Carolina $131 $141
St. Petersburg $128 $139 1.00
Chicago $158 $135
Portland, Oregon $147 $128 2.00
Aurora, Colorado $126 $121
Kansas City, Missouri $119 $121 1.00
Phoenix $110 $114
Pittsburgh $107 $114 1.00
Bakersfield $112 $112 1.50
Tampa $103 $112
Orlando $109 $111
Sacramento $133 $111 2.1.00
Riverside, California $122 $108
Oakland $143 $104 3.00
Tucson $98 $102
Madison, Wisconsin $113 $102 2.00
Irvine, California $147 $102
Omaha $85 $96
Long Beach, California $126 $95 3.00
Greensboro, North Carolina $82 $94
Spokane $88 $92 1.00
New York $166 $92
Milwaukee/Milwaukee County $91 $91 1.50
Glendale, Arizona $87 $90
Atlanta $86 $88 1.00
CityTotal Expenditure
per Resident
FY 2010
Cost of Living Score
ne
w
re
po
rt
f
or
2
01
2
COST OF 80-89 90-99 100-109 110-119 120-129 130-139 140-149 150+
$ $$ $$ $$ $ $ $$ $ $ $$ $$ $$ $ $ $$ $ $ $$ $LIVING SCORE
$ $$ $
Adjusted Expenditure per Resident
29THE TRUST FOR PUBLIC LAND :: CITY PARK FACTS
13. speNDiNg oN parks aND recreatioN By city, aDjUsteD for tHe cost of liViNg iNDex
City
Newark, New Jersey $113 $88
Arlington, Texas $83 $87
Miami $96 $87
Norfolk $85 $84 1.50
Fort Worth $77 $84 1.00
Boston $115 $82 3.00
San Diego $106 $80 3.00
San Jose $121 $78 3.50
Mesa, Arizona $75 $78 1.00
Dallas $76 $76 1.00
Albuquerque $73 $74 1.00
Cleveland $74 $74 1.50
Reno, Nevada $67 $73 1.00
Fort Wayne $66 $72 1.00
Austin $68 $71 1.00
Columbus $63 $71 0.50
Garland, Texas $69 $70 1.00
Charlotte/Mecklenburg $64 $68 1.00
Lincoln, Nebraska $62 $67 1.00
St. Louis $61 $67 1.00
Lexington/Fayette $59 $65 1.00
Oklahoma City $59 $64 1.00
Nashville/Davidson $56 $63 0.50
San Antonio $54 $61 0.50
Corpus Christi $55 $60 1.00
Anchorage $80 $59 3.00
Louisville $51 $57 0.50
Fresno $61 $56 1.50
Chesapeake, Virginia $57 $56 1.50
Rochester, New York $55 $54 1.50
Lubbock, Texas $47 $53 0.50
Wichita $47 $51 1.00
Winston-Salem, North Carolina $44 $50 0.50
Baltimore $58 $50 2.00
Colorado Springs $46 $48 1.00
Jacksonville $43 $45 1.00
Los Angeles $59 $45 3.00
Houston $40 $43 1.00
Anaheim $61 $42 3.50
Philadelphia $47 $38 2.50
Indianapolis $35 $37 1.00
El Paso $32 $35 1.00
Tulsa $31 $35 0.50
Buffalo $33 $34 1.00
Detroit $32 $34 1.00
Memphis $27 $32 0.50
Chula Vista, California $41 $31 3.00
Stockton $37 $31 2.50
Santa Ana, California $40 $28 3.50
San Bernardino $24 $21 2.00
Total Expenditure per Resident
Adjusted Expenditure per Resident
Cost of Living Score
$ $$ $$ $$ $$ $$ $$ $$ $
$ $$ $$ $$ $
$ $$ $
$ $$ $$ $$ $
$ $$ $
$ $$ $$ $$ $$ $$ $$ $$ $$ $$ $$ $$ $$ $$ $$ $$ $$ $$ $$ $$ $$ $$ $$ $$ $$ $$ $$ $$ $$ $$ $$ $$ $$ $$ $$ $$ $$ $$ $$ $$ $$ $$ $$ $$ $$ $$ $$ $$ $$ $$ $$ $$ $$ $$ $$ $$ $
$ $$ $
$ $$ $
$ $$ $$ $$ $
$ $$ $$ $$ $$ $$ $$ $$ $
$ $$ $
$ $$ $$ $$ $
$ $$ $
ne
w
re
po
rt
f
or
2
01
2
Median, All Cities: $83 $82
30 CITY PARK FACTS :: THE TRUST FOR PUBLIC LAND
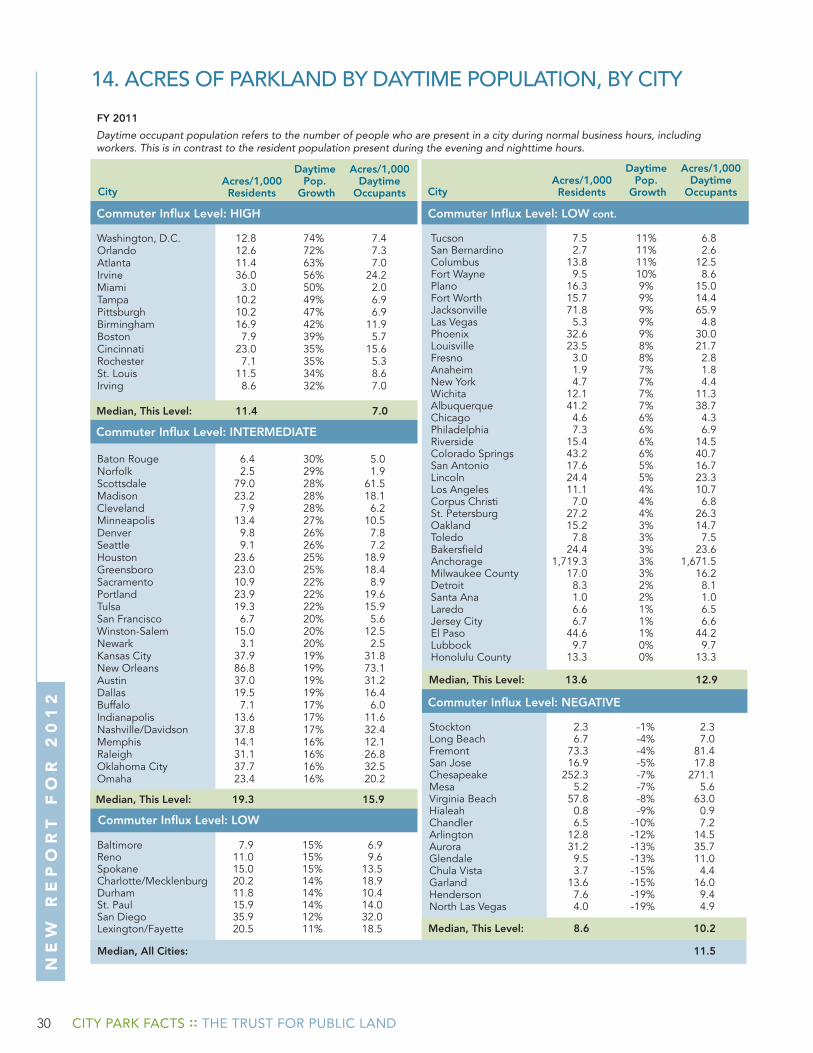
14. acres of parklaND By DaytiMe popUlatioN, By city
Commuter Influx Level: HIGH
Daytime occupant population refers to the number of people who are present in a city during normal business hours, including workers. This is in contrast to the resident population present during the evening and nighttime hours.
FY 2011
Commuter Influx Level: LOW
DaytimePop.
GrowthAcres/1,000 ResidentsCity City
Washington, D.C. 12.8 74% 7.4Orlando 12.6 72% 7.3Atlanta 11.4 63% 7.0Irvine 36.0 56% 24.2Miami 3.0 50% 2.0Tampa 10.2 49% 6.9Pittsburgh 10.2 47% 6.9Birmingham 16.9 42% 11.9Boston 7.9 39% 5.7Cincinnati 23.0 35% 15.6Rochester 7.1 35% 5.3St. Louis 11.5 34% 8.6Irving 8.6 32% 7.0
Median, This Level: 11.4 7.0
Commuter Influx Level: LOW cont.
Commuter Influx Level: NEGATIVE
Median, All Cities: 11.5
Baltimore 7.9 15% 6.9Reno 11.0 15% 9.6Spokane 15.0 15% 13.5Charlotte/Mecklenburg 20.2 14% 18.9Durham 11.8 14% 10.4St. Paul 15.9 14% 14.0San Diego 35.9 12% 32.0Lexington/Fayette 20.5 11% 18.5
Baton Rouge 6.4 30% 5.0Norfolk 2.5 29% 1.9Scottsdale 79.0 28% 61.5Madison 23.2 28% 18.1Cleveland 7.9 28% 6.2Minneapolis 13.4 27% 10.5Denver 9.8 26% 7.8Seattle 9.1 26% 7.2Houston 23.6 25% 18.9Greensboro 23.0 25% 18.4Sacramento 10.9 22% 8.9Portland 23.9 22% 19.6Tulsa 19.3 22% 15.9San Francisco 6.7 20% 5.6Winston-Salem 15.0 20% 12.5Newark 3.1 20% 2.5Kansas City 37.9 19% 31.8New Orleans 86.8 19% 73.1Austin 37.0 19% 31.2Dallas 19.5 19% 16.4Buffalo 7.1 17% 6.0Indianapolis 13.6 17% 11.6Nashville/Davidson 37.8 17% 32.4Memphis 14.1 16% 12.1Raleigh 31.1 16% 26.8Oklahoma City 37.7 16% 32.5Omaha 23.4 16% 20.2
Stockton 2.3 -1% 2.3Long Beach 6.7 -4% 7.0Fremont 73.3 -4% 81.4San Jose 16.9 -5% 17.8Chesapeake 252.3 -7% 271.1Mesa 5.2 -7% 5.6Virginia Beach 57.8 -8% 63.0Hialeah 0.8 -9% 0.9Chandler 6.5 -10% 7.2Arlington 12.8 -12% 14.5Aurora 31.2 -13% 35.7Glendale 9.5 -13% 11.0Chula Vista 3.7 -15% 4.4Garland 13.6 -15% 16.0Henderson 7.6 -19% 9.4North Las Vegas 4.0 -19% 4.9
Tucson 7.5 11% 6.8San Bernardino 2.7 11% 2.6Columbus 13.8 11% 12.5Fort Wayne 9.5 10% 8.6Plano 16.3 9% 15.0Fort Worth 15.7 9% 14.4Jacksonville 71.8 9% 65.9Las Vegas 5.3 9% 4.8Phoenix 32.6 9% 30.0Louisville 23.5 8% 21.7Fresno 3.0 8% 2.8Anaheim 1.9 7% 1.8New York 4.7 7% 4.4Wichita 12.1 7% 11.3Albuquerque 41.2 7% 38.7Chicago 4.6 6% 4.3Philadelphia 7.3 6% 6.9Riverside 15.4 6% 14.5Colorado Springs 43.2 6% 40.7San Antonio 17.6 5% 16.7Lincoln 24.4 5% 23.3Los Angeles 11.1 4% 10.7Corpus Christi 7.0 4% 6.8St. Petersburg 27.2 4% 26.3Oakland 15.2 3% 14.7Toledo 7.8 3% 7.5Bakersfield 24.4 3% 23.6Anchorage 1,719.3 3% 1,671.5Milwaukee County 17.0 3% 16.2Detroit 8.3 2% 8.1Santa Ana 1.0 2% 1.0Laredo 6.6 1% 6.5Jersey City 6.7 1% 6.6El Paso 44.6 1% 44.2Lubbock 9.7 0% 9.7Honolulu County 13.3 0% 13.3
Commuter Influx Level: INTERMEDIATE
Median, This Level: 19.3 15.9
Median, This Level: 13.6 12.9
Median, This Level: 8.6 10.2
Acres/1,000 Daytime
Occupants
DaytimePop.
GrowthAcres/1,000 Residents
Acres/1,000 Daytime
Occupants
ne
w
re
po
rt
f
or
2
01
2

National OfficeThe Trust for Public Land
101 Montgomery Street, Suite 900San Francisco, CA 94104
415.495.4014
tpl.org
Center for City Park ExcellenceThe Trust for Public Land
660 Pennsylvania Avenue SE, Suite 401 Washington, D.C. 20003
202.543.7552
tpl.org/ccpe