2012 asprs track, forest cover loss in papua new guinea: how much does subsistence agriculture...
TRANSCRIPT

Forest Loss in Papua New Guinea: How much does subsistence
agriculture contribute?
Jamie Fuller PhD Student in Ecology Colorado State University [email protected] http://warnercnr.colostate.edu/~jdfuller

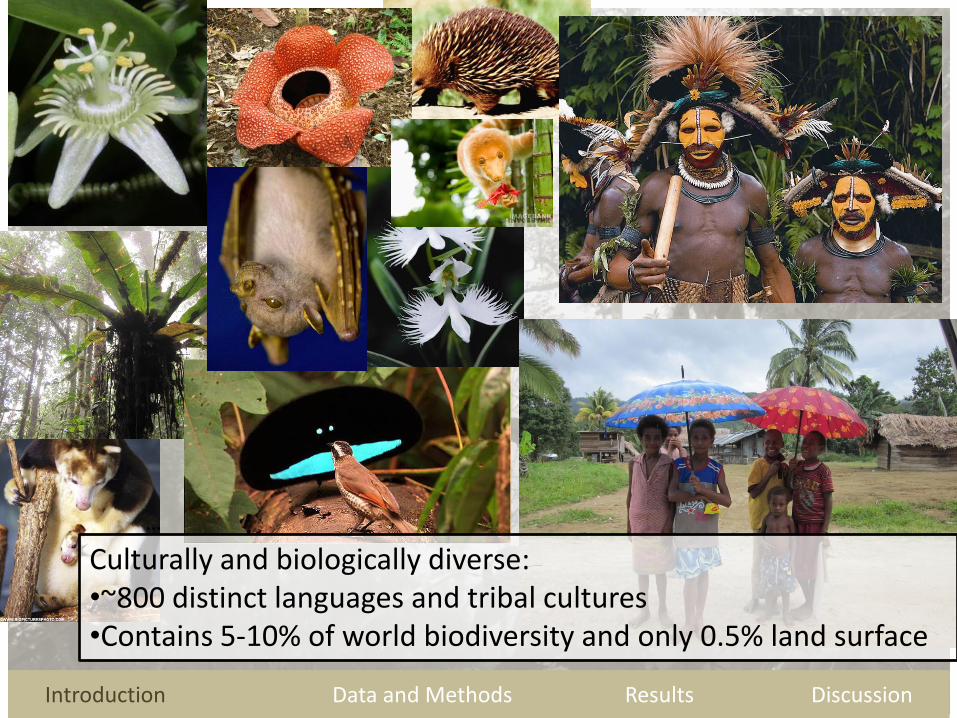
Papua New Guinea and relative area
Introduction Data and Methods Results Discussion
Introduction Data and Methods Results Discussion
Culturally and biologically diverse: •~800 distinct languages and tribal cultures •Contains 5-10% of world biodiversity and only 0.5% land surface
…

Food and agricultural Organization (FAO) Forestry Department, website 2012
Introduction Data and Methods Results Discussion

Introduction Data and Methods Results Discussion
(Shearman et al. 2009; Shearman and Bryan 2011)
Degradation Deforestation
Between 1972 and 2002 - 24% forest loss (9% degraded and 15% deforested)
Combined forest degradation and deforestation Potential Change
Introduction Data and Methods Results Discussion
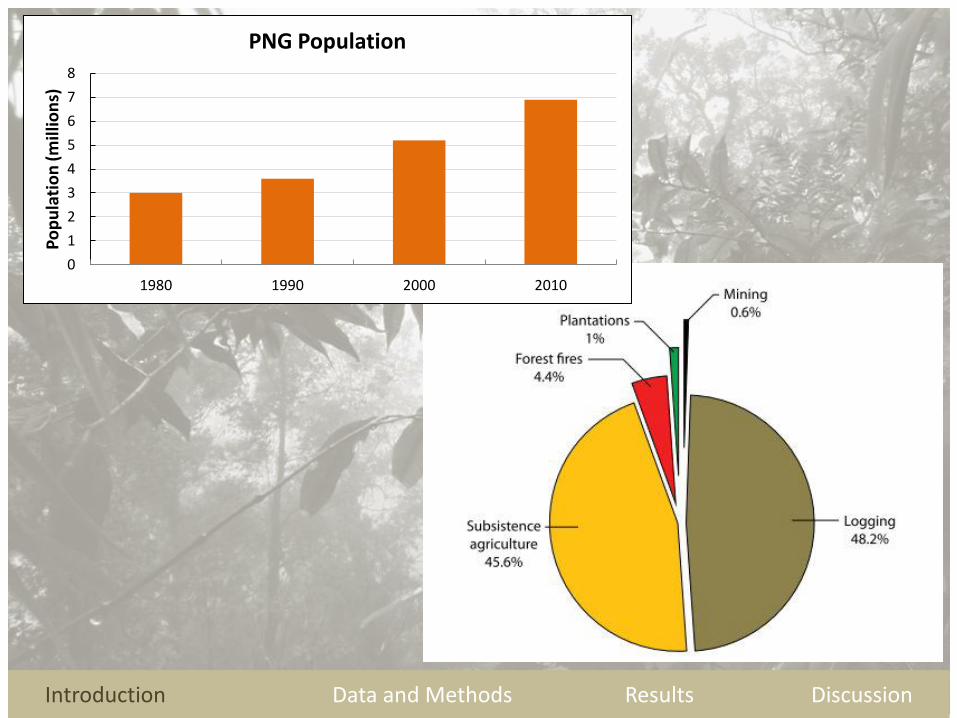
0
1
2
3
4
5
6
7
8
1980 1990 2000 2010
Po
pu
lati
on
(mill
ion
s)
PNG Population
Introduction Data and Methods Results Discussion
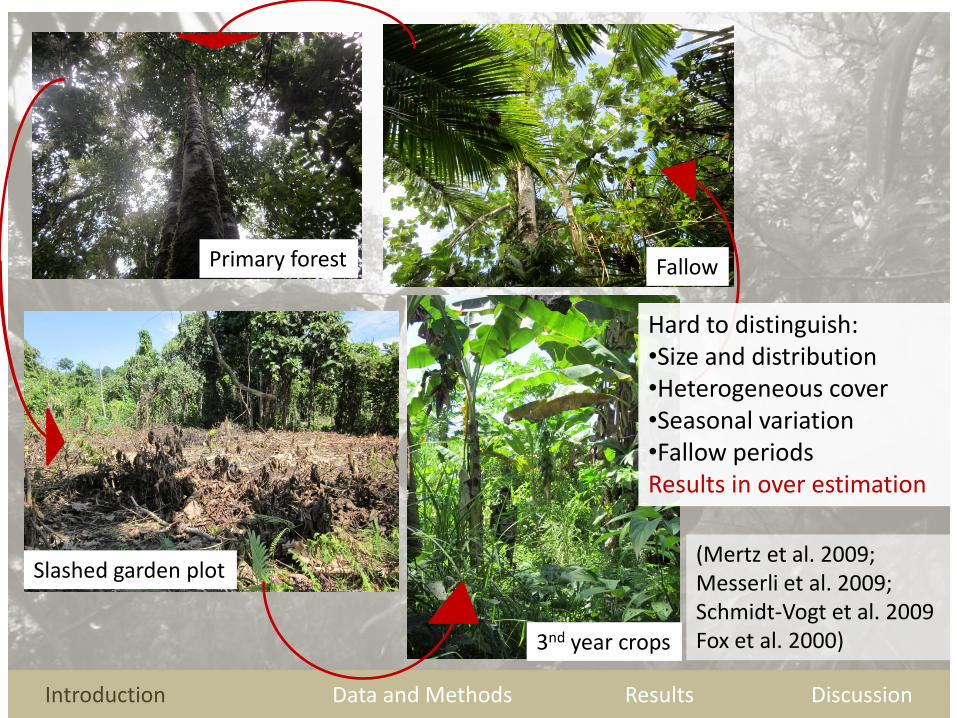
Primary forest Fallow
Slashed garden plot
3nd year crops
Hard to distinguish: •Size and distribution •Heterogeneous cover •Seasonal variation •Fallow periods Results in over estimation
(Mertz et al. 2009; Messerli et al. 2009; Schmidt-Vogt et al. 2009 Fox et al. 2000)

Perceptions of swidden: • Minor disturbance to ecosystem
• Increased edge habitat
• Fallow regeneration
• Runoff and erosion lessened – (Ziegler et al 2009, Fox et al. 2000)
Introduction Data and Methods Results Discussion
• Simple, naïve and destructive
• Practiced by indigenous and poor populations
• Governments began to ban it to reduce deforestation
Recent ecological research:
Transition to more permanent agriculture causes:
• Above and below ground carbon decline
• Native plant diversity decreases • Fewer crop varieties • Economic vulnerability & losses
when crops fail or markets change • Land sparing vs. land sharing (Ziegler et al. 2011; Sturgeon 2005; Cramb
et al. 2009; Perfecto and Vandermeer 2010)

Kamiali village
Kamiali, PNG
65 km from Lae, PNG Ocean access only (no roads) WMA area: 500 km2 Current Population: ~850 Subsistence livelihood
Introduction Data and Methods Results Discussion
-Quantify how the land has changed -Understand the decisions influencing land use change -Identify the drivers of change

Participatory research: (Conducted July 2011) •Participatory mapping •Structured household surveys •Resource use interviews
•e.g. fishing, gardening, forest resources •Oral history with elders •Economic organization exercise
Satellite imagery: •Landsat: 1992, 2003, 2010 (end of Sept-early Oct)
•Cloud mask (LEDAPS by NASA) •Tasseled cap •Wetness-Brightness Difference Index (WBDI)
•Helmer et al. 2009 •Unsupervised classification
Introduction Data and Methods Results Discussion

Introduction Data and Methods Results Conclusion
Rip
aria
n
11
%
Forest 67%
Mixed 10%
Ag. 12%
Cloud Water
1992
Rip
aria
n
11
%
Forest 59%
Mixed 12%
Ag. 18%
Cloud Water
2003
Rip
aria
n
9%
Forest 57%
Mixed 16%
Ag. 18%
2010

Introduction Data and Methods Results Discussion
Agr
icu
ltu
re c
on
vers
ion
4% 16%
7%
45%
28%
3% 6% 8%
38%
45% Loss to riparian
Loss to forest
Loss to mixed
Ag. - no change
Ag. gain
1992 to 2003 2003 to 2010
=17% =27%
Introduction Data and Methods Results Discussion
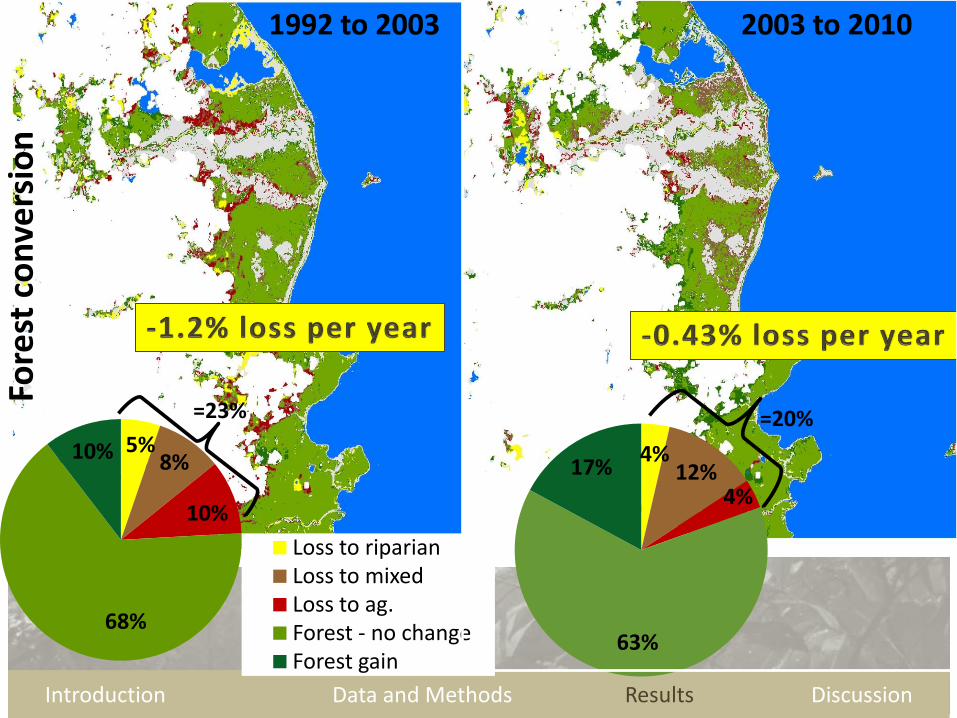
1992 to 2003
4% 12%
4%
63%
17% 5%
8%
10%
68%
10%
Loss to riparian Loss to mixed Loss to ag. Forest - no change Forest gain
Fore
st c
on
vers
ion
2003 to 2010
=23% =20%

2% 15%
15%
20%
48%
3%
16%
15%
19%
47% Loss to riparian
Loss to forest
Loss to ag.
Mixed - no change
Mixed gain
1992 to 2003 2003 to 2010 M
ixe
d c
ove
r co
nve
rsio
n
Introduction Data and Methods Results Discussion
=34% =32%

• Agricultural expansion is not directly correlated to population growth
• Other subsistence strategies were employed
Introduction Data and Methods Results Discussion
Land use is dynamic and rates of change vary over time
Time span 1990-2000 2000-2010
Population 1.4% per year 8% per year
Time span 1992-2003 2003-2010
Agriculture 2.6% per year 0.14% per year
Introduction Data and Methods Results Discussion

1) Cultural and land tenure systems • Smaller plot sizes • Shorter fallows • Increased # of crops per plot
2) Natural variability • Changes in weather/climate
• Pest increases
3) Institutional changes • Support from NGO • WMA status • Fishing cooperative • Visiting researchers
Introduction Data and Methods Results Discussion Introduction Data and Methods Results Discussion
Mechanistic pathways in land change (Lambin et al. 2003)
4) Economic influences • Modern goods & conveniences • Cash economy
5) Demographics •Population increase •Shifts •In/Out migration
6) Technological changes • Access to different varieties & crops • Fishing equipment changes
7) Globalization • Local and global fish markets
• The Jones’s

• Agricultural expansion did not occur to the same extent as national levels
– Suggesting that agricultural expansion may be overestimated in other regions of PNG
– Intensified agriculture
• These results improved our understanding of the rate of land change in this conservation area.
– Ecological importance: pressures from logging, mining and climate changes are likely to increase
Introduction Data and Methods Results Discussion Introduction Data and Methods Results Discussion
Conclusion

Questions ?
Jamie Fuller PhD Student in Ecology Colorado State University [email protected] http://warnercnr.colostate.edu/~jdfuller