2012 annual report - sihayo gold limited
TRANSCRIPT

1 | P a g e
2012 ANNUAL REPORT
ABN 77 009 241 374
“DEVELOPING A WORLD CLASS MID‐SIZED INDONESIAN GOLD COMPANY”

CONTENTS
2 | P a g e
CONTENTS .......................................................................................................................... 2
CORPORATE DIRECTORY ..................................................................................................... 3
CHAIRMAN’S REVIEW ......................................................................................................... 4
REVIEW OF OPERATIONS .................................................................................................... 6
DIRECTORS’ REPORT ......................................................................................................... 30
AUDITOR’S INDEPENDENCE DECLARATION ...................................................................... 41
CORPORATE GOVERNANCE STATEMENT .......................................................................... 42
CONSOLIDATED STATEMENT OF COMPREHENSIVE INCOME ........................................... 51
CONSOLIDATED STATEMENT OF FINANCIAL POSITION .................................................... 52
CONSOLIDATED STATEMENT OF CASH FLOWS ................................................................. 53
CONSOLIDATED STATEMENT OF CHANGES IN EQUITY ...................................................... 54
NOTES TO THE FINANCIAL STATEMENTS .......................................................................... 55
DIRECTORS’ DECLARATION ............................................................................................... 93
INDEPENDENT AUDIT REPORT TO THE MEMBERS OF SIHAYO GOLD LIMITED ................ 94
ADDITIONAL SHAREHOLDER INFORMATION .................................................................... 96
SUMMARY OF TENEMENTS HELD BY COMPANY ............................................................. 98
CORPORATE DIRECTORY
3 | P a g e
Directors Peter Bilbe B.Eng (Mining) (Hons) (Non Executive Director – Chairman)
Paul Willis B. Comm (Executive Director) Misha A Collins C.F.A (Non Executive Director)
Gavin Caudle (Non Executive Director)
William John Blake M.Eng Sc, MBA, DBA (Non Executive Director) Chief Executive Officer Paul Willis
Secretary Daniel Nolan Registered Office 25 Charles Street and Business Address South Perth WA 6151 Telephone: (08) 9368 4544 Facsimile: (08) 9368 4522 E‐mail: [email protected] Web: www.sihayogold.com Share Registry Security Transfer Share Registry Pty Ltd Alexandrea House 770 Canning Highway Applecross WA 6153 Telephone: (08) 9315 2333 Facsimile: (08) 9315 2233 Home Exchange Australian Securities Exchange (Perth) Limited Exchange Plaza 2 The Esplanade Perth WA 6000 Auditors Stantons International Level 2 / 1 Walker Avenue West Perth WA 6005 Solicitors Williams & Hughes 25 Richardson Street West Perth WA 6005 Bankers National Australia Bank 100 St Georges Terrace Perth WA 6000
Sihayo Gold Limited is a company limited by shares, incorporated and domiciled in Australia.
CHAIRMANS REVIEW
4 | P a g e
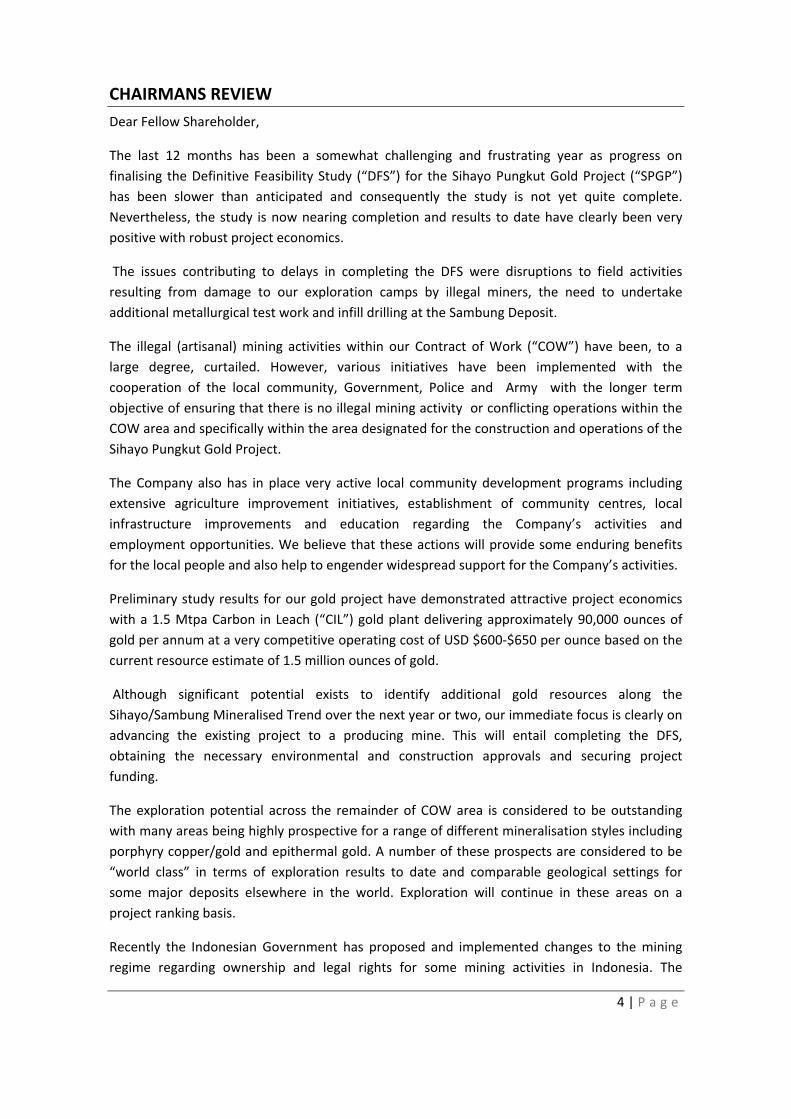
Dear Fellow Shareholder,
The last 12 months has been a somewhat challenging and frustrating year as progress on
finalising the Definitive Feasibility Study (“DFS”) for the Sihayo Pungkut Gold Project (“SPGP”)
has been slower than anticipated and consequently the study is not yet quite complete.
Nevertheless, the study is now nearing completion and results to date have clearly been very
positive with robust project economics.
The issues contributing to delays in completing the DFS were disruptions to field activities
resulting from damage to our exploration camps by illegal miners, the need to undertake
additional metallurgical test work and infill drilling at the Sambung Deposit.
The illegal (artisanal) mining activities within our Contract of Work (“COW”) have been, to a
large degree, curtailed. However, various initiatives have been implemented with the
cooperation of the local community, Government, Police and Army with the longer term
objective of ensuring that there is no illegal mining activity or conflicting operations within the
COW area and specifically within the area designated for the construction and operations of the
Sihayo Pungkut Gold Project.
The Company also has in place very active local community development programs including
extensive agriculture improvement initiatives, establishment of community centres, local
infrastructure improvements and education regarding the Company’s activities and
employment opportunities. We believe that these actions will provide some enduring benefits
for the local people and also help to engender widespread support for the Company’s activities.
Preliminary study results for our gold project have demonstrated attractive project economics
with a 1.5 Mtpa Carbon in Leach (“CIL”) gold plant delivering approximately 90,000 ounces of
gold per annum at a very competitive operating cost of USD $600‐$650 per ounce based on the
current resource estimate of 1.5 million ounces of gold.
Although significant potential exists to identify additional gold resources along the
Sihayo/Sambung Mineralised Trend over the next year or two, our immediate focus is clearly on
advancing the existing project to a producing mine. This will entail completing the DFS,
obtaining the necessary environmental and construction approvals and securing project
funding.
The exploration potential across the remainder of COW area is considered to be outstanding
with many areas being highly prospective for a range of different mineralisation styles including
porphyry copper/gold and epithermal gold. A number of these prospects are considered to be
“world class” in terms of exploration results to date and comparable geological settings for
some major deposits elsewhere in the world. Exploration will continue in these areas on a
project ranking basis.
Recently the Indonesian Government has proposed and implemented changes to the mining
regime regarding ownership and legal rights for some mining activities in Indonesia. The

CHAIRMANS REVIEW
5 | P a g e
Company holds a 7th Generation COW signed by the Government of the Republic of Indonesia.
The COW is the highest standing legal tenure in the Indonesian mining industry and describes in
detail the rights and obligations of both the Company and the Government and therefore
provides for a reasonable degree of certainty and security.
Our major shareholders have continued to remain very supportive and we thank them and all
our shareholders for their ongoing support and patience which we believe we be appropriately
rewarded in the years ahead.
On behalf of the directors of the Company I would also like to thank our management,
employees and contractors for their efforts and commitment throughout the year.
Peter Bilbe Chairman

REVIEW OF OPERATIONS
6 | P a g e
Sihayo Pungkut Gold Project (75%)
The Sihayo Pungkut Gold Project (“Sihayo Pungkut”) is held under a 7th Generation Contract of Work
(“COW”). The COW is the highest standing legal tenure achievable in the Indonesian mining
industry.
The COW describes in detail the rights and obligations of both the Company and the Government
during the term of the COW. Our COW is currently in the Feasibility Study Phase, the next phase is
the Construction Phase and then followed by a 30 year Production Phase. At the end of the
Production Phase the Company has the right to two by ten year extensions under the prevailing
Indonesian Mining Law.
Sihayo Pungkut is located in Mandailing Natal, North Sumatra, Indonesia.
Significant projects located nearby include; G Resources Limited’s Martabe Gold/Silver Project,
which contains a resource base of approximately 6 Moz Au and 60 Moz Ag and is 75km to the north
of Sihayo Pungkut and PT Bumi Resource Mineral Tbk’s Dairi Lead‐Zinc Project, which contains a
resource base of 18 Mt at 12.6% zinc and 7.3% lead and is approximately 200km to the north.
Figure 1 below shows the Sihayo Pungkut location and other mineral deposits within Indonesia.
Sihayo Pungkut is owned by PT Sorikmas Mining (“Sorikmas”), which is 75% owned by Sihayo Gold
Limited (“Sihayo”) and 25% by PT Aneka Tambang Tbk (“Antam”). Sihayo is responsible for 100% of
the exploration and development funding of Sorikmas until the commencement of production. The
funding is by way of loans to Sorikmas and under the terms of the Loan Agreement, Antam is
required to repay its share of loans to Sihayo or other lenders to Sorikmas, from 80% of its
attributable share of available cash flow from production, until its 25% share of the loans are repaid
in full.
The current Sihayo Pungkut JORC Compliant Resource stands at 17.0 Mt at 2.7 g/t for 1.5 Moz
comprising the larger Sihayo Resource and the smaller Sambung Resource with approximately 88%
of the total resource contained in the JORC Indicated Category.
Figure 1: Significant Indonesian Mineral Deposits including the Sihayo Pungkut Gold Deposit

REVIEW OF OPERATIONS
7 | P a g e
Sihayo Pungkut – Geological Setting
Sihayo Pungkut is located along the Trans Sumatra Fault Zone (“TSFZ”) and associated Neogene
Magmatic Arc (“NMA”), which is the result of an oblique collision of two tectonic plates and
associated subduction (refer to Figure 1). A complex suite of Permian volcanics and sediments,
intruded by Jurassic and Cretaceous intrusive plutons, subsequently juxtaposed or overlain by
Tertiary to recent volcanics, intrusives, and sediments comprises the broader COW area (refer to
Figure 2).
The TSFZ has provided the plumbing and heat mechanisms to source, transport and deposit metals
in favourable settings. The TSFZ is a major under explored corridor that boasts world class resources
such as the Martabe Gold/Silver Deposit, similar tectonic settings in the Philippines (Philippine’s
Fault) and Chile (Atacama Fault) are analogous to the TSFZ and host major gold and copper deposits.
By any measure, Sihayo Pungkut is strategically located in a world class geological address.
In addition to the current JORC Compliant Resource of 1.5 Moz Au, there are over twenty (20)
identified prospects of carbonate‐hosted gold, low to intermediate ‐sulphidation epithermal‐vein
gold; gold‐copper skarn, copper‐gold porphyry, and lead‐zinc skarn style mineralisation spread
across the highly prospective COW area and these prospects will be the subject of future exploration
activities.
Figure 2, below shows the location of the Sihayo ‐ Sambung Resources and key exploration prospects
across the COW.
Figure 2: Sihayo Pungkut Gold Project – JORC Resource, Key Prospects and Regional Geology

REVIEW OF OPERATIONS
8 | P a g e
Sihayo Pungkut – Definitive Feasibility Study
The key Definitive Feasibility Study (“DFS”) results to date support a robust gold project with an
initial 7 year mine life. The key parameters as previously advised are:
Capital cost of US$117 million (includes 9.9MW power station)
o Plus pre‐production mining US$10.5 million
1.5 Mtpa standard CIL processing plant
Estimated mine life minimum 7 years
LOM estimates:
o Average production 90koz per annum
o Site cash operating costs (incl royalties) US$600/oz – US$650/oz
o Average strip ratio of 4:1 (after pre‐strip)
o Process recoveries 72%
During the past year the main focus of work has been the final phase of the detailed metallurgy test
work program, finalisation of the project power source, assessment of the optimal waste haulage
method and the final program of infill drilling at the Sambung JORC Compliant Resource.
Metallurgical Test Work
The delays in completing the metallurgical test component of the DFS work have related to some
technical aspects of the previously completed test work.
A detailed review of the previous work was conducted by leading metallurgist, Mr. Peter Lewis, and
his key observations were:
1. the bulk samples used in the original work were not as representative of the resource as is
required for DFS sign‐off;
2. the level of cyanide used in the test work was too low and may have affected the rate of
gold dissolution; and
3. the level of dissolved oxygen present was also too low and again may have affected overall
gold recoveries.
The broad conclusion drawn was that the previous test work had most likely under‐estimated the
recoveries achievable in a standard operating Carbon‐in‐Leach (“CIL”) gold plant.
The current phase of work has involved gold extraction tests on all individual drill samples across the
Sihayo and Sambung Resources with grades above 0.5 g/t Au. The preliminary analysis of these
results shows a wide range of gold extractions, but that a large number of the individual samples
yield high to very high gold extractions. The mean recovery estimate, across approximately 3,800
samples, for the Sihayo Resource was 71.3% and the Sambung Resource was 73.8% whereas the
median recovery for the Sihayo was 78% and for the Sambung was 79%. The results also confirm
that, although the degree of oxidation, as indicated by the amount of sulphide sulphur present, is
the principle cause of the variations there are other factors affecting gold extraction.

REVIEW OF OPERATIONS
9 | P a g e
Ongoing work is focused on determining the other factors affecting gold extraction: possibilities are
differences in lithology, alteration or other geological factors. This will lead to the final classification
of different “ore types” and the associated gold extraction estimates for each. Thereafter, the final
CIL test work will be completed on each “ore type” and will establish the optimum grind‐size, leach
time and reagent consumption for each ore type.
The likely gold recoveries are expected to fall within the range of the current mean and median
recovery estimate for the Sihayo and Sambung Resources.
The final test work will ensure that the overall DFS results will fully meet the rigorous standards of
independent review by external consultants and further may lead to potential for mining schedules
to include some degree of selective mining to minimise the processing of “ore types” with
significantly below average recoveries.
Project Power Source: Biomass Power Plant
The Company appointed DP CleanTech (“DPCT”) to complete a standard DFS document for the
design, construction and commissioning of a 9.9MW Biomass Power Plant.
The alternative power production was based on diesel generators and at a basis of US$100/bbl oil
the unit cost of power was approximately US$0.25 kw/hr.
DP CleanTech have designed, constructed and successfully commissioned over 40 biomass power
plants across Asia and Europe with a combined installed capacity of 1,000MW.
The primary fuel source for the proposed power plant is Palm Kernel Shells (“PKS”) a waste product
of the palm oil production process.
The PKS market is well established in Sumatra, Indonesia and export volumes of PKS to North Asia
and Europe as a primary fuel for biomass power plants has been steadily increasing over the past
five years.
Potential supply of PKS within trucking distance of the proposed power plant site exceeds 2 times
the annual required supply and is available across multiple independent suppliers. In addition, new
palm oil plantations are being established within the area and will provide additional future supply
of PKS.
The PKS will be stored on site with a covered area to dry a nominated amount before being placed
onto a conveyor to feed into the boiler.
The PKS is fed into a boiler which will generate steam from water sourced from the local river. The
steam from the boiler will be sent to the steam turbine generator for the electrical power
generation.
Power will be delivered to the plant and infrastructure via overhead transmission lines. A diesel
generator power station will supply black start capabilities for the Biomass Power Plant as well as
emergency backup power for the operation.
DPCT have submitted a full EPCM cost of US$23m to design, supply, install and commission the full
power station.

REVIEW OF OPERATIONS
10 | P a g e
Operating costs based on the current market price for PKS per tonne delivered to our nominated
power plant location will be in the range of US$0.08c – US$0.12c per kw/hr.
Waste Haulage
Detailed discussions with some of Europe’s leading manufacturers of conveyors for the mining
industry, including Famur Group and Linter Group of Poland, for the installation of an overland
conveyor to transport up to 8 Mtpa of waste material from nearby the mining pits to the waste
dump site were concluded and DFS standard Capex and Opex estimates finalised.
The proposed conveyor route at approximately 2.1km in length was significantly shorter than the
main waste haulage road distance. In addition, because the entire length of the conveyor is
downhill, the conveyor had the potential to generate excess power equivalent to approximately 7% ‐
10% of the total project power requirement.
Whilst the standalone Capex and Opex numbers are very attractive the installation costs are
considered very high, partly reflecting the fact the area has a high seismic rating together with the
topographic conditions and annual rainfall levels.
Therefore the decision was made to move forward with a traditional truck haulage arrangement for
transporting the waste material.
DFS Participants
Independent consultants have been appointed to complete components of the DFS and each
consultant is considered competent in their respective discipline and where applicable has recent
experience in Asia. Participants in the DFS include:
Runge Limited Geology and JORC compliant resources
Ozmet, AMMTEC Ltd, Peter Lewis Metallurgical test work and management
Plant and Infrastructure
Engineering (PIE) Process design
Contromation Services DFS engineering, infrastructure, Capex and Opex
Minesure Pty Ltd Mine design and schedule
GHD Pty Ltd Geotechnical including pit wall design
Schlumberger Water Services PtyLtd Hydrogeology and hydrology
Golder Associates Pty Ltd Environmental baseline and AMDAL scoping & mine waste
dump design
DFS Capital Costs Estimation
Capital costs for the project were estimated by Contromation using first principals.
The capital estimate for the operation was estimated as follows:
by discipline for major areas of the plant including crushing, grinding and CIL circuit;
by individual assessment of the work content for earthworks, concrete, and steel;
factored estimates using known costs from previous projects for pipe work;
equipment prices (new) obtained for items of mechanical equipment.

REVIEW OF OPERATIONS
11 | P a g e
Equipment costs have been obtained from recognised Australian, European, South African and
Indonesian suppliers, well known throughout the Gold and Mining Industry and known to
Contromation via supplying other Contromation projects in the region. Quotes for all equipment
were received and a selection made base on evaluation of technical and commercial merits.
The capital cost estimate allows for all costs to design, procure, transport, erect, install and
commission the processing plant and infrastructure.
The capital cost estimate has been completed to DFS accuracy level +/‐ 10%.
DFS Operating Costs Estimation
Operating costs for the project were estimated by Contromation using first principals.
Costs have been determined by reference to a variety of sources, including:
test work results;
suppliers’ quotations;
Contromation data base for similar size operations; and
first principle estimates.
The costs have been developed for a plant capacity of 1.5 Mtpa.
The treatment plant availability has been estimated at 91.3% or 8,000 hrs/yr, including scheduled
and unscheduled maintenance.
Mining costs were based on an owner miner operation and were costed on first principals and
industry experience by Minesure.
The operation costs estimate has been completed to DFS accuracy level +/‐ 10%.
The diagram below provides an indication of the standard CIL plant configuration.

REVIEW OF OPERATIONS
12 | P a g e
Sihayo Pungkut – JORC Compliant Resources
The primary focus for the past year was the
continuation of the infill drilling program at the
Sambung JORC Resource. For the year, 65
diamond drill holes for a total of 5,900m were
completed and contributed to a 5% increase of
the total Sihayo and Sambung JORC Compliant
Resourse to 17Mt at 2.7 g/t Au for 1.5 Moz. See
Table 1 below for full details of the Sihayo and
Sambung JORC Resources.
Resource Tonnage (Mt) Grade Au (g/t)
Contained Gold ounces
JORC Classification Au Cut‐off grade (g/t)
SIHAYO 13.4 2.9 1,240,000 Indicated 1.2 SIHAYO 1.8 2.2 128,200 Inferred 1.2
15.2 2.8 1,368,200 Indicated & Inferred 1.2
SAMBUNG 1.0 2.3 72,500 Indicated 1.2 0.8 2.1 52,900 Inferred 1.2
1.8 2.2 125,400 Indicated & Inferred 1.2
TOTAL 17 2.7 1,493,600 Indicated & Inferred 1.2
Note 1: Rounding errors may occur
Note 2: Sihayo and Sambung JORC Resource estimate completed by Runge Ltd. Competent person, Rob Williams and Trevor Stevenson
Table 1: Sihayo Pungkut Gold Project JORC Resource Inventory
Sihayo Pungkut – Ongoing Resource Definition and Exploration
Gold mineralisation at Sihayo Pungkut is
contained within “Jasper” that has replaced
calcareous stratigraphy. Surface mapped jasper
strikes northwest along a section of the TSFZ and
is intermittently exposed for approximately
4.5km. Anomalous gold in soils, is co‐incident with
mapped jasper, and extends about 1km to the
south east of the known surface jasper. The
Sihayo Pungkut trend is potentially 5.5km in
length.

REVIEW OF OPERATIONS
13 | P a g e
The Sihayo and Sambung JORC Resource lies on approximately 2.7km of the potential 5.5km Sihayo
Pungkut trend of gold mineralisation. The remaining 2.8km of gold mineralised strike is yet to be
adequately drill tested.
Figure 3, shows the surface projection of the JORC Resources.
Figure 3: Sihayo Mineralisation Surface Plan shows Surface Projection of Sihayo and Sambung
JORC Resources and Location of Cross Sections (A‐B, C‐D, E‐F and G‐H)
The main Sihayo Resource 15.2Mt @ 2.8 g/t Au for 1.3684 Moz covers an area of approximately
1.5km by 0.6km and was drilled on a 25 metre by 50 metre grid or 50 metre by 50 metre grid in
areas of greater geological confidence.
The resource is exposed at surface at its north‐western end and extends to a depth of greater than
200 metres along strike at the south‐eastern end. The resource is highly oxidised to depths of about
40 metres and there are variable levels of oxidation down to approximately 150 metres depth.
Detailed geological modelling of the Sihayo Resource has identified that lithological contacts have
acted as the dominant conduits of hydrothermal fluids. These fluids have precipitated sub horizontal
economic jasper lodes through replacement of calcareous stratigraphy in three hard rock settings.
In addition, a fourth setting is oxidised zones of surface regolith gold mineralisation occurring in
modern karst environments.
REVIEW OF OPERATIONS
14 | P a g e
Geological modelling through the Sambung Resource has defined three settings of gold bearing jasper mineralisation:
1) Structurally controlled,
2) Stratigraphy controlled; and
3) Surface regolith.
The major control of the Sambung Mineralisation is a series of normal faults within the greater TSFZ.
These faults have strike extent and known gold mineralisation outside of currently defined JORC
Compliant Resource. Notably, high grade silver has been intersected in the Sambung Resource and
the significance of this will be addressed in the next JORC Resource upgrade report. Resource
extension drilling is planned for the remainder of 2012 to test the shallow high grade gold
mineralisation extents of this fault system adjacent to the Sambung Resource.
Tables 2 and 3 below contain selected gold and silver drilling results for the year and in the case of
silver there is the inclusion of some previous period drilling results.
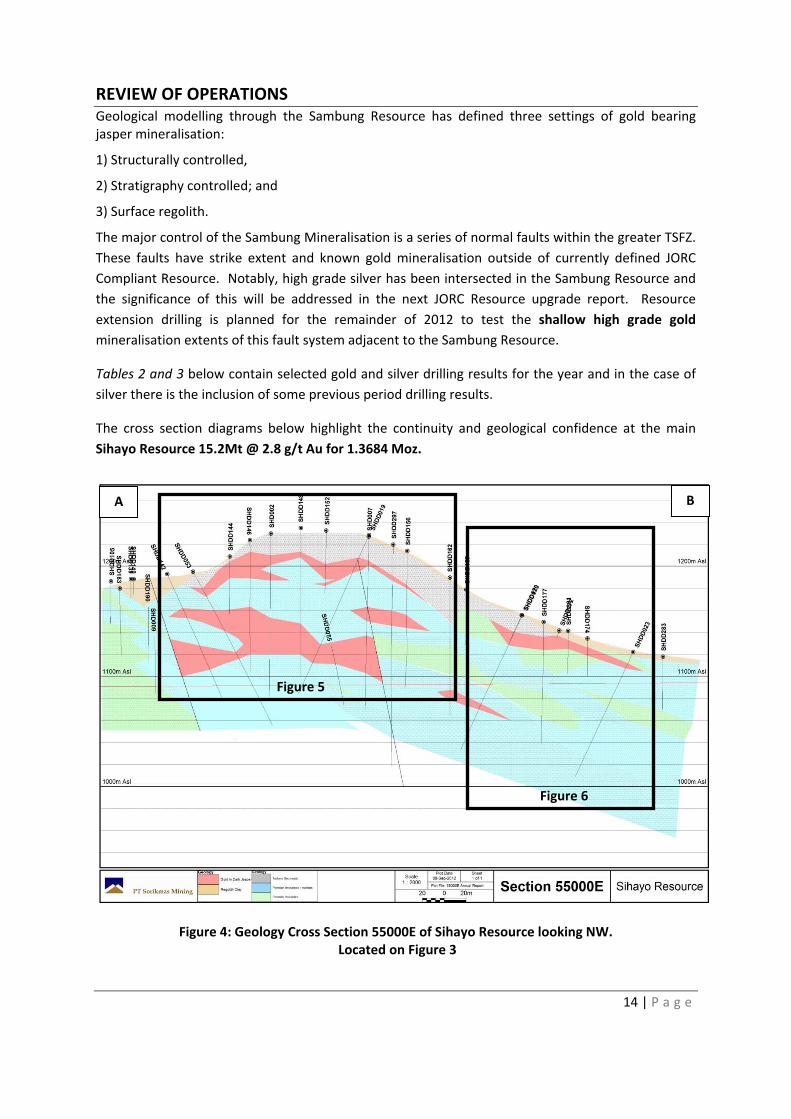
The cross section diagrams below highlight the continuity and geological confidence at the main
Sihayo Resource 15.2Mt @ 2.8 g/t Au for 1.3684 Moz.
Figure 4: Geology Cross Section 55000E of Sihayo Resource looking NW. Located on Figure 3
A B
Figure 5
Figure 6
REVIEW OF OPERATIONS
15 | P a g e
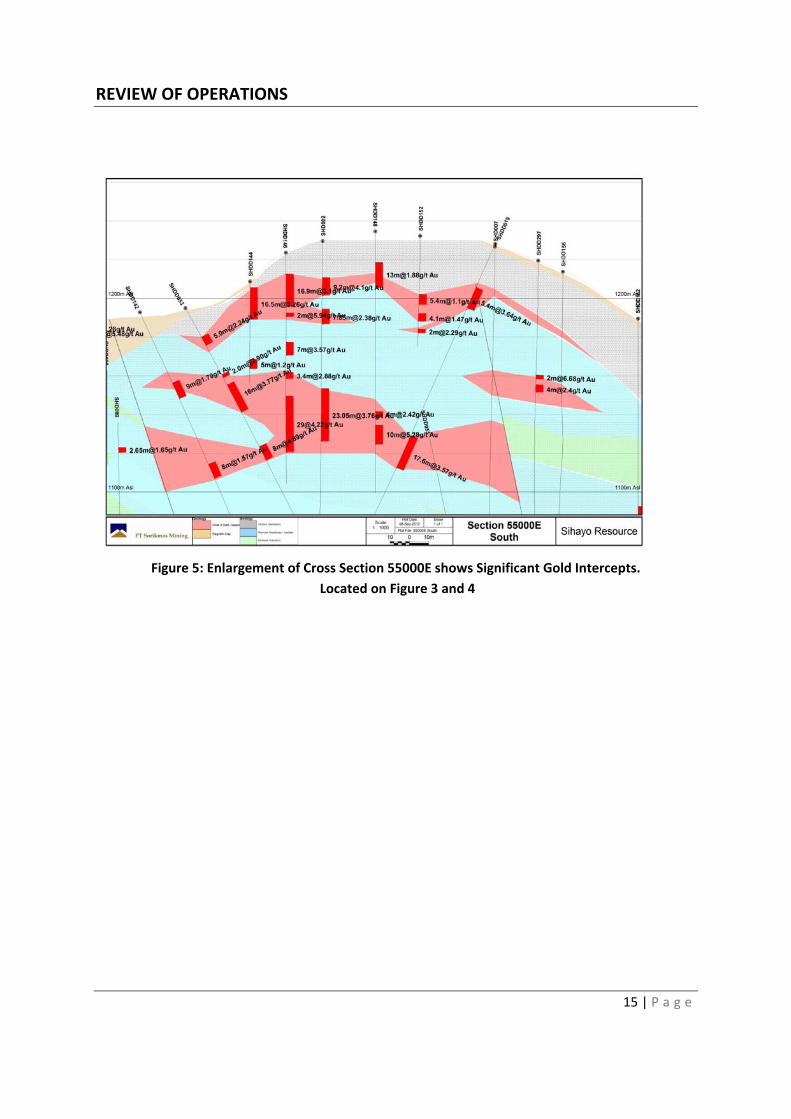
Figure 5: Enlargement of Cross Section 55000E shows Significant Gold Intercepts.
Located on Figure 3 and 4

REVIEW OF OPERATIONS
16 | P a g e
Figure 6: Enlargement of Cross Section 55000E showing Significant Gold Intercepts.
Located on Figure 3 and 4

REVIEW OF OPERATIONS
17 | P a g e
Figure 7: Geology Cross Section 54500E of Sihayo Resource looking NW. Located on Figure 3
Figure 8: Cross Section Enlargement 54500E shows Significant Gold Intercepts. Located on Figure 7 & 3

REVIEW OF OPERATIONS
18 | P a g e
Figure 9: Enlargement of Cross Section 55000E showing Significant Gold Intercepts.
Located on Figure 3 and 7
E F

REVIEW OF OPERATIONS
19 | P a g e
Table 2: Selected Significant Gold Intercepts from the Sambung drilling (current year drilling)
Hole ID East
UTM
North
UTM RL (m ASL) Azi Dip
Max
Depth From To
Intercept
(m)
Au
g/t
SAMDD086 549221 101121 1010 0 ‐90 114.1 57.0 72.0 15 4.26
SAMDD088 549191 101127 1020 222 ‐60 72.5 38.8 44.95 6.15 2.97
SAMDD094 549176 101145 1036 0 ‐90 108.7 83.55 90.40 6.85 3.35
SAMDD102 549091 101125 1048 223 ‐60 83.0 6 9.2 3.2 9.18
SAMDD111 549311 100996 1002 222 ‐60 92.0 10.8 17.2 6.4 3.59
SAMDD112 549316 101078 969 222 ‐60 143.0 45.7 52 6.3 3.60
SAMDD116 549373 100959 995 223 ‐60 90.6 10 13.3 3.3 4.53
SAMDD119 549257 101100 987 222 ‐55 131.1 33 42 9 4.64
45 47.05 2.05 4.21
SAMDD124 549176 101145 1036 224 ‐76 132.8 75.85 82.4 6.55 5.59
SAMDD126 549201 101103 1010 222 ‐65 125.2 23.75 45 21.25 2.58
SAMDD137 549131 101171 1053 0 ‐90 127.7 91.05 100.4 9.35 2.98
SAMDD138 549406 100952 995 222 ‐60 54.5 12.9 15.9 3 4.06
18.9 21.95 3.05 7.85
SAMDD142 549253 101130 1005 220 ‐60 93.55 65.65 74.8 9.15 3.26
SAMDD144 549295 101103 990 220 ‐60 78.4 54.4 61 6.6 7.76
SAMDD145 549220 101087 998 220 ‐60 77.65 32.2 42.5 10.3 3.44
SAMDD146 549277 101079 978 220 ‐60 65.5 37.2 44.3 7.1 7.27
SAMDD147 549264 101062 982 220 ‐60 69.5 22 37 15 5.22
SAMDD148 549196 101056 1025 220 ‐60 76.2 4.6 12.6 8 3.56
Notes
1. All assays determined by 50gm fire assay with AAS finish by Intertek‐ Caleb Brett Laboratories of Jakarta
2. Lower cut of 1.0ppm Au used
3. A maximum of 2m of consecutive internal waste (material less than 1.0ppm Au) per reported intersection
4. All interval grades were calculated as a weighted average
5. All intervals reported as down hole lengths
6. Sampling regime as quarter core for PQ and half core for NQ and HQ diameter core
7. Quality Assurance and Quality Control (QAQC):
8. Coordinates in UTM grid system (WGS84 z47N)

REVIEW OF OPERATIONS
20 | P a g e
Table 3: Selected Significant Silver Intercepts from the Sambung drilling (including results from
previous years and current year drilling)
Hole ID East
UTM
North
UTM RL (m ASL) Azi Dip
Max
Depth
(m)
From To Length Ag g/t
SAMDD019 549222 101042 1017 350 ‐90 73.6 59 62 3 25.67
SAMDD033 549603 100867 925 216 ‐60 70.0 0 8 8 14.62
SAMDD045 549183 101080 1013 0 ‐90 52.0 27 34 7 28.10
SAMDD048 549227 101040 1018 40 ‐60 100.0 10 14 4 61.00
SAMDD053 549116 101085 1052 40 ‐65 78.0 54 59 5 22.00
66 78 12 26.83
SAMDD092 549171 101105 1020 220 ‐61 71.0 36 43.85 7.85 22.46
SAMDD096 549131 101171 1053 222 ‐60 122.0 75.9 90.05 14.15 48.10
SAMDD117 549176 101145 1036 222 ‐50 150.0 71 77 6 20.00
Notes
1. All Ag assays determined by Hydrochloric/Perchloric digestion with AAS finish by Intertek‐ Caleb Brett Laboratories of Jakarta
2. Lower cut of 5.0ppm Ag used
3. A maximum of 2m of consecutive internal waste (material less than 5.0ppm Ag) per reported intersection
4. All interval grades were calculated as a weighted average
5. All intervals reported as down hole lengths
6. Sampling regime as quarter core for PQ and half core for NQ and HQ diameter core
7. Quality Assurance and Quality Control (QAQC): Standards, duplicates, blanks
8. Coordinates in UTM grid system (WGS84 z47N)

REVIEW OF OPERATIONS
21 | P a g e
Regional Exploration – Hutabargot Julu Epithermal Prospect The Hutabargot Prospect is located on the south eastern portion of the 11.5km long Sihayo
Pungkut‐Hutabargot Mineralised Trend (refer to Figures 10 and 11 below). The centre of the
prospect is about 7km southeast from the Sihayo‐Sambung JORC Compliant Resource. In the future
an access road could be constructed linking the Hutabargot Prospect to the Sambung Resource.
The Hutabargot Prospect is underlain by a dactitic dome complex and dissected by the Trans
Sumatran Fault Zone. Dacitic stratigraphy has been hydrothermally brecciated and magnetite
destructive clay‐silica‐pyrite altered defining an approximate 6km x 2km intermediate epithermal
gold complex footprint. Significant gold mineralisation is structurally controlled veining within
hydrothermal breccias. Historic drilling yielded a best significant intercept of 5m @ 36.7 g/t Au from
47m from quartz‐sulphide veining at the Ali Vein. Bonanza grade rock chips (up to 136 g/t Au) have
been collected from a number of locations and high grade outcrop chip channel results including, 5m
@ 5.81 g/t Au and 112 g/t Ag have been recorded (refer to Figure 11 below).
Hutabargot Mineralisation is similar to other intermediate sulphidation complexes in the Pacific Rim,
including the Baguio Epithermal District in the Philippines, which hosts greater than 35Moz Au across
the region.
During the year a total of 17 holes for 2,859 metres of diamond drilling was completed.
Exploration work has been divided into four stages:
1. Sarahan Vein Zone exploration drilling; 2. Fault, Sunday and Panas Vein Zone exploration drilling; 3. Prospect wide exploration targets; and 4. Ongoing surface work between the JORC Compliant Sambung Resource and the Hutabargot
Prospect.
Sarahan Vein Zone Exploration Drilling
The Sarahan Vein Zone is defined by a moderate westerly dipping structurally controlled, up to 40m
thick, argillic alteration zone that hosts intermediate sulphidation quartz‐sulphide +‐ gold veining
within hydro‐brecciated dacite. Surface mapping, rock chipping, historic drilling and intermittent
turn of the 19th century Dutch local mining defined a 600m strike length of gold mineralisation along
an overall 2.2km strike length of the Sarahan Vein Zone.
An exploration diamond drilling program of ten diamond drill holes for 1,148m was completed as
infill exploration drilling. Mineralisation continuity was tested at approximately 50 meter section
spacing. Total diamond drilling, including previous period drilling, on the Sarahan Vein Zone is
2,548m.

REVIEW OF OPERATIONS
22 | P a g e
The Sarahan Vein Zone gold mineralisation has proven to be continuous along strike and at depth.
Significant gold +‐ silver in drill intersections appear to represent high grade gold mineralisation
shoots. Below is a list of the significant drill intersections (historic and current):
‐ HUTDD001 6m @ 2.07g/t Au from 16m
‐ HUTDD004 6m @ 2.66g/t Au from 48m
‐ HUTDD007 5m @ 2.12g/t Au from 23m
‐ HUTDD009 9m @ 1.4g/t Au from 77m
‐ HUTDD012 12m @ 1.74g/t Au from 0m
‐ HUTDD032 4.5m @ 6.37g/t Au from 43.4m
‐ HUTDD038 5.1m @ 2.29g/t Au from 116.1m
Future diamond drilling will test potential of the high grade “mineralised shoots” and ultimately the
greater strike length of the Sarahan Vein Zone.
Fault, Sunday and Panas Vein Zone Exploration Drilling
A total of seven diamond drill holes for 1,711m were focussed on lower grade gold/high tonnage
gold targets defined by surface geochemistry, geological mapping and an induced polarisation
survey. Drill results have been encouraging with a best intercept of 5.9m @ 3.82 g/t Au from 54.3m
in HUTDD026. Gold mineralisation is hosted by colloform banded chalcedonic and vuggy white
quartz associated with pyrite arsenopyrite, sphalerite, and galena with localised chalcopyrite.
Further follow up drilling will be assessed as part of the overall program.
Hutabargot Prospect Exploration Targets
The Hutabargot Prospect (Figures 10 & 11) has been divided into 10 target zones over an area of
about 12 km2. These targets were defined by a synthesis of all surface exploration data sets which
includes; geological mapping, drill hole logging / assays, rock chip sampling, soil sampling, airborne
magnetics, regional structural interpretation, IP survey data, and topographic data. Ultimately each
target will be ranked and then scout drilled.
Ongoing Surface Work between Hutabargot and Sambung
Surface exploration work (geological mapping, rock chipping, soil sampling, and IP Survey) is ongoing
along strike between the north western part of Hutabargot and the Sambung Resource (Figure 10)
and best results to date include 5m @ 5.81 g/t Au and 112 g/t Ag from outcrop chip channel
samples, across an exposed vein structure of approximately 19m total width. On completing this
surface exploration, it is anticipated that additional target zones will be identified, ranked and then
scout drilled.

REVIEW OF OPERATIONS
23 | P a g e
Figure 10: Sihayo Pungkut – Hutabargot Julu Trend

REVIEW OF OPERATIONS
24 | P a g e
Figure 11: Hutabargot Julu Prospect Surface Plan

REVIEW OF OPERATIONS
25 | P a g e
Regional Exploration: Babisik Epithermal Gold Prospect
Babisik surface exploration programs were undertaken in the second and partly the third quarter of
the year. Exploration activities included geological mapping and grid soil within a 2km2 area. Fifty
one rock chip samples and 858 soil samples were collected. Figure 12 summarises exploration work
to date. The prospect is located approximately 2km south of the Tambang Tinggi Gold/Copper
Prospect in the southern part of the COW. Refer to Figure 3 and 13.
The Babisik prospect is underlain by Permian volcanic agglomerates that are unconformably overlain
by sandstones and conglomerates to the north of the prospect area. A number of quartz veins +‐
manganese +‐ limonite up to 15m wide are traceable over 500m of strike length. Best rock chip
results to date yielded 5.32 g/t Au and up to 400 g/t Ag. Further exploration work is scheduled for
next year.
Figure 12: Babisik Prospect Surface Plan
REVIEW OF OPERATIONS
26 | P a g e
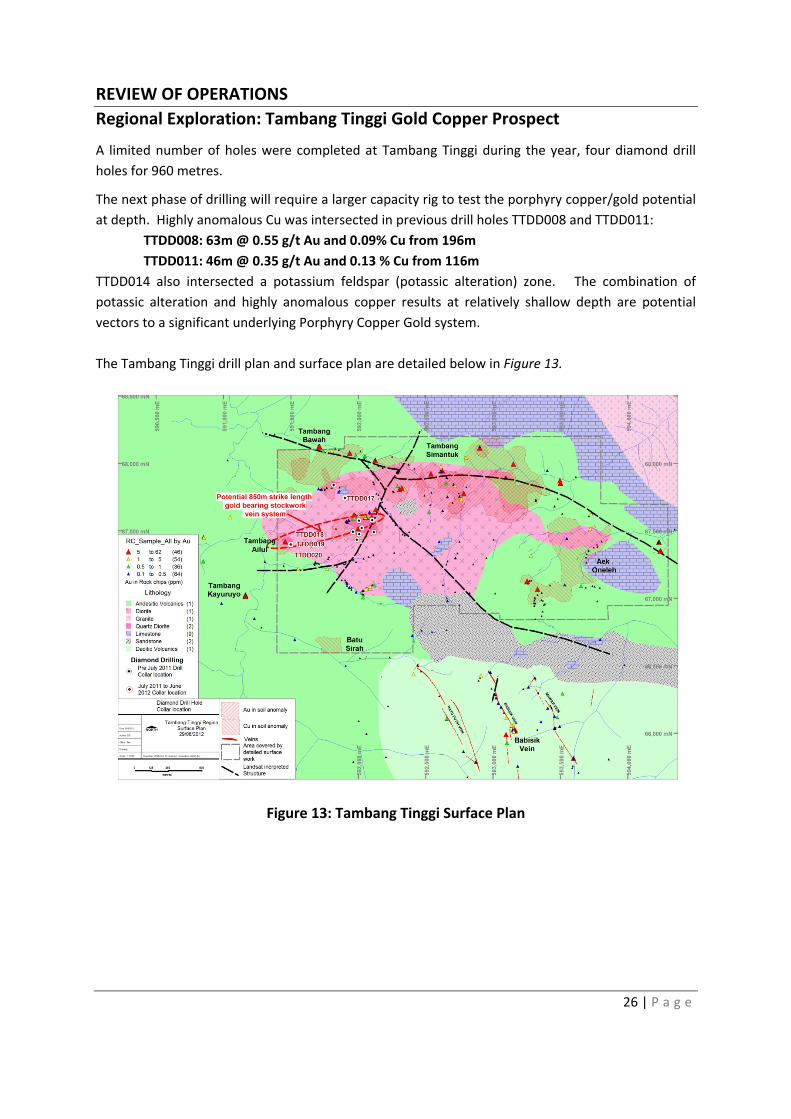
Regional Exploration: Tambang Tinggi Gold Copper Prospect
A limited number of holes were completed at Tambang Tinggi during the year, four diamond drill
holes for 960 metres.
The next phase of drilling will require a larger capacity rig to test the porphyry copper/gold potential
at depth. Highly anomalous Cu was intersected in previous drill holes TTDD008 and TTDD011:
TTDD008: 63m @ 0.55 g/t Au and 0.09% Cu from 196m
TTDD011: 46m @ 0.35 g/t Au and 0.13 % Cu from 116m
TTDD014 also intersected a potassium feldspar (potassic alteration) zone. The combination of
potassic alteration and highly anomalous copper results at relatively shallow depth are potential
vectors to a significant underlying Porphyry Copper Gold system.
The Tambang Tinggi drill plan and surface plan are detailed below in Figure 13.
Figure 13: Tambang Tinggi Surface Plan

REVIEW OF OPERATIONS
27 | P a g e
Sihayo Pungkut – Community Development Programmes
The local comunities surrounding the Sihayo Pungkut Project depend upon agricultural products as their primary souce of income. As such, the Company have made a long‐term commitment to invest into sustainable agriculture based programmes, with a clear objective of improving the overall productivity, quality and selling price of the various products that the community currently produces. Internationally experienced consultant, Franz Goetz, is leading the development and implementation of our agriculture based programmes. The main agricultural products of the region are: rice, rubber, cocoa, coffee, coconuts, fruits & vegetables, aromatic oils, cinnamon and a limited of animal and fish products. Currently, 26 separate projects have been setup under 13 co‐operatives involving 566 people from the local community. The Company has identified that the main limitations that the local communities have to deal with in regards agriculture production are:
Access to markets to sell produce;
Access to quality seed or animal stock; and
Access to training for best practice agricultural techniques. Current programs have included setting up nurseries supplying quality seed/fruit tree stock, establishing breeding stations for different livestock including goats, chickens, pigs and fish and the recently established cocoa processing facility. Training sessions have commenced in best agricultural practices such as composting, pruning, and contour planting. Once agricultural products reach the required quality levels through best stock and best agricultural practices, the Company will assist local communities in improved marketing strategies. The recently developed cocoa co‐operative project encompasses a unique solution to the deal with the major issues facing the local farmers. Currently, farmers grow their cocoa, then harvest the crop (ongoing basis), dry the beans (typically on the road outside their house) and then sell to the local trader. Often the price received from the local trader is quite low, which leaves little incentive to undertake improved farming methods including ongoing pruning of the cocoa trees and better drying methods. The cocoa co‐operative comprises a cocoa bean fermentation, drying (solar), sorting and packing facility. The facility is designed to produce up to five tonne per week of product.

REVIEW OF OPERATIONS
28 | P a g e
The co‐operative purchases wet beans from the farmers (no need for farmers to dry the beans) at the prevailing market price, the beans are then fermented, dried and sorted and then packed for transport to Medan. Since the farmers will no longer need to dry the beans the co‐operative will provide instruction on improved pruning of their tress, which will help to reduce the incidence of cocoa borer bug and therefore improve yields per tree. The co‐operative, with assistance from the Company, has negotiated with a Medan based chocolate manufacturer to purchase all the quantity of cocoa beans the co‐operative can produce. The chocolate manufacturer is also hopeful of working with the co‐operative to become certified as “organic cocoa” production. Once the payment is received from the Medan buyer, the “value add premium” over and above what was paid to the farmers for the wet beans will be re‐distributed to each farmer in proportion to their original quantities. The net effect for the farmers should be a substantial increase in income from their current cocoa crops and then followed by a further increase in yield as the impact of better pruning of the trees is realised. The Company is providing a working capital loan to the co‐operative and overtime this loan will be re‐paid (interest free) and the co‐operative will have its own working capital funds. The co‐operative has the potential to direct benefit some 2,000 farmers and the actual cocoa facility will directly employ approximately 15 to 20 people. Ultimately, co‐operatives involved in a range of agricultural projects will become profitable and self sustainable providing extra income to communities. In line with our overall Community Development Plan, the first of three community centres has been opened. The Community Centre will initially be used as a children's library and basic computer training centre followed by other educational programs that will be determined by the local community. As we move closer to the construction phase of the Sihayo Pungkut Project additional community development plans encompassing health, education and local infrastructure will be progressively developed in conjunction with the local communities and local Government.

REVIEW OF OPERATIONS
29 | P a g e
Other Projects
Malawi – Uranium exploration (100%) No exploration activities were carried out during the year. India – Diamond Exploration (9‐10%) No significant progress was made during the year in resolving the legal status of the tenements. Mount Keith Gold Project – Western Australia (2% net smelter royalty) No mining was undertaken on the project during the year. Mulgabbie Gold Project – Western Australia (2% net smelter royalty) No mining was undertaken on the project during the year. Competent Persons Statements Sihayo Gold Limited: The information in this report that relates to exploration, mineral resources or ore reserves is based on information
compiled by Mr Darin Rowley (BSc.Geol Hons 1st class) who is a full time employee of PT Sorikmas Mining (75% owned subsidiary of Sihayo
Gold Limited), and is a Member of the AusIMM. Mr Rowley has sufficient experience which is relevant to the style of mineralisation and
type of deposit under consideration and to the activity which he is undertaking to qualify as a competent person as described by the 2004
Edition of the “Australasian Code for Reporting of Exploration Results, Mineral Resources and Ore Reserves”. Mr Rowley consents to the
inclusion in this report of the matters based on his information in the form and context in which it appears.
Sihayo Resource
Runge Limited: The information in this report that relates to Mineral Resources at Sihayo is based on information compiled
by Mr Robert Williams BSc, a Member of the Australian Institute of Mining and Metallurgy, who is a full time employee in the mining
industry and has sufficient experience which is relevant to the style of mineralisation and type of deposit under consideration and to the
activity which he is undertaking to qualify as a Competent Person as defined in the 2004 Edition of the Australasian Code of Reporting for
Exploration Results, Mineral Resources and Ore Reserves. Mr Williams consents to the inclusion in the report of the matters based on his
information in the form and context in which it appears.
Modelling: The Sihayo deposit was estimated by Runge Limited using Ordinary Kriging grade interpolation,
constrained by mineralisation envelopes prepared using a nominal 0.5g/t gold cut‐off grade. In all cases a minimum downhole intercept
length of 2m was adopted. The block dimensions used in the Sihayo model were 25m EW by 10m NS by 5m vertical with sub‐cells of 6.25m
by 2.5m by 1.25m. Statistical analysis of the deposit determined that a high grade cut of 30g/t Au was necessary which cut a single composite. Bulk density was assigned in the model
based upon the results of 1,422 bulk density determinations.
Sambung Resource
Runge Limited: The information in this report that relates to Mineral Resources at Sihayo is based on information compiled by Mr Trevor Stevenson. Mr Stevenson is a full time employee
of Runge Limited (RUL), a Fellow of the Australian Institute of Mining and Metallurgy (AusIMM), and has sufficient experience which is relevant to the style of mineralisation and type of
deposit under consideration and to the activity which he has undertaken to qualify as a Competent Person as defined in the 2004 Edition of the Australasian Code for the Reporting of
Mineral Resources and Ore Reserves. Mr Stevenson consents to the inclusion in the report of the matters based on his information in the form and context in which it appears.
Modelling: The Sambung deposit was estimated by Runge Limited using Ordinary Kriging grade interpolation,
constrained by mineralisation envelopes prepared using a nominal 0.5g/t gold cut‐off grade. In all cases a minimum downhole intercept
length of 2m was adopted. The block dimensions used in the model were 10m along strike by 10m across strike by 5m vertical with sub‐cells of 5m by 5m by 2.5m. Statistical analysis of
the deposit determined that a high grade cut of 25g/t Au was necessary which resulted in 2 composites being cut. Bulk density was assigned in the model based upon the results of 382
bulk density measurements.
Note
All statements in this report, other than statements of historical facts that address future timings, activities, events and developments that
the Company expects, are forward looking statements. Although Sihayo Gold Limited, its subsidiaries, officers and consultants believe the
expectations expressed in such forward looking statements are based on reasonable expectations, investors are cautioned that such
statements are not guarantees of future performance and actual results or developments may differ materially from those in the forward
looking statements. Factors that could cause actual results to differ materially from forward looking statements include, amongst other
things commodity prices, continued availability of capital and financing, timing and receipt of environmental and other regulatory approvals, and general economic, market or business
conditions.

DIRECTORS’ REPORT
30 | P a g e
Your directors present their report on the consolidated entity consisting of Sihayo Gold Limited (“Sihayo Gold, or the Company”) and the entities it controlled at the end of, or during the year ended 30 June 2012 (“the reporting period”). DIRECTORS The following persons were directors of Sihayo Gold during the financial year and up to the date of this report: Misha Collins Paul Willis Peter Bilbe Gavin Caudle John Blake PRINCIPAL ACTIVITIES The principal activities of the consolidated entity during the course of the financial year were the continuing development of the Sihayo Pungkut Gold project. There were no significant changes in the nature of those activities during the financial year. DIVIDENDS No dividends have been paid or declared since the end of the previous financial year and no dividend is recommended in respect of this financial year. REVIEW OF OPERATIONS The review of operations is detailed at pages 6 ‐ 29 OPERATING RESULTS During the financial year the consolidated entity incurred a consolidated operating loss after income tax of $9,711,061 (2011: $11,141,054). SIGNIFICANT CHANGES IN THE STATE OF AFFAIRS There have been no significant changes in the state of affairs of the corporate group for the 2012 financial year. EMPLOYEES The consolidated entity employed 243 employees as at 30 June 2012 (2011: 131 employees) CORPORATE STRUCTURE The corporate group consists of the parent entity Sihayo Gold Limited, its 100% owned subsidiaries Inland Goldmines Pty Ltd, Excelsior Resources Pty Ltd, Oropa Technologies Pty Ltd, Oropa Indian Resources Pty Ltd, Oropa Exploration Pty Ltd and Aberfoyle Pungkut Investments Pte Ltd. Aberfoyle Pungkut Investments Pte Ltd holds a 75% interest in PT Sorikmas Mining, with an Indonesian Government mining company PT Aneka Tambang Tbk holding the remaining 25%. LIKELY FUTURE DEVELOPMENTS Details of important developments occurring in this current financial year have been covered in the review of operations. Further information on likely developments in the operations of the consolidated entity and the expected results have not been included in this report because the directors believe it would be likely to result in unreasonable prejudice to the consolidated entity.
DIRECTORS’ REPORT
31 | P a g e
FINANCIAL POSITION The net assets of the consolidated entity as at 30 June 2012 are $28,346,004 (2011: $22,288,944). ENVIRONMENTAL REGULATION The consolidated entity has assessed whether there are any particular or significant environmental regulations which apply. It has determined that the risk of non‐compliance is low, and has not identified any compliance breaches during the year. INFORMATION ON DIRECTORS Details of the directors of the Company in office at the date of this report are:
Paul Willis (CEO & Executive Director – appointed a director on 29 September 2009) Experience and expertise Paul Willis, Chief Executive Officer and Executive Director, has over 18 years experience in the mining and investment industry. Prior to joining Sihayo Gold in September 2009, Paul was founder and Executive Chairman of IndoAust Mining, a private exploration company with activities in Indonesia since 2005. Prior to establishing IndoAust Mining, Paul was a founding partner and Executive Director of JF Capital Partners Limited, a large Melbourne based equities funds management company established in 1998 with funds under management exceeding A$3 billion. He is also a former Non‐Executive Chairman of Moly Mines Limited, ASX and TSX listed. Directorships of Other ASX Listed Companies No other current directorships Former ASX Listed Companies Directorships in last 3 years Moly Mines Limited Special responsibilities ‐ Interests in shares and options 54,221,409 ordinary shares (held indirectly) 2,000,000 options exercisable @ 12.5 cents before 30 June 2013 (held indirectly)
Misha A Collins (Non Executive Director) Experience and expertise Mr Collins brings extensive financial and capital markets experience to the Board as well as having a complementary technical background in metallurgy and 14 years of experience in financial markets with particular emphasis on gold and mining business analysis. He was employed by BT Funds Management for an eleven year period as an equity analyst covering both domestic and international markets together with the formulation of capital market strategies and commodity forecasting and currently operates his own investment and trading business.

DIRECTORS’ REPORT
32 | P a g e
Mr Collins holds a Bachelor of Engineering in Metallurgy, graduating with First Class Honours from the RMIT University, a Graduate Certificate in Banking and Finance from Monash University and a Graduate Diploma in Applied Finance and Investment from the Financial Services Institute of Australia. He also completed the CFA program with the US based CFA Institute and has been awarded the Chartered Financial Analyst designation (CFA). Directorships of Other ASX Listed Companies Ask Funding Limited Former ASX Listed Companies Directorships in last 3 years No former directorships Special responsibilities Audit committee chairman Remuneration committee member Interests in shares and options 14,529,574 ordinary shares in Sihayo Gold Limited (held indirectly) 1,000,000 unlisted director options for fully paid ordinary shares at 15 cents at any time on or before the expiry date of 31 May 2013 (held directly)
Gavin Caudle (Non Executive Director – appointed a director on 8 April 2010) Experience and expertise Mr Caudle has over 20 years experience in the finance and investment sectors in Australia, Singapore and Indonesia. Starting his career at Arthur Andersen Australia, he eventually became a partner based in the Jakarta office. He joined Citigroup in 1998 in Indonesia and held positions as Head of Mergers and Acquisitions and Head of Private Equity at Citigroup and Country Head of the Investment Bank at Salomon Smith Barney. Since 2003, together with his partners, Gavin has developed numerous successful businesses including Tower Bersama Group (a telecommunications infrastructure business) and Provident Agro (a plantation business) with assets valued at more than $1 billion today. Gavin and his partners bring substantial expertise in dealing with all business aspects in Indonesia, most importantly for Sihayo being:
Track record of raising more than US$2 billion of senior, mezzanine and equity capital over the past seven years; and
Expertise in dealing with forestry issues through the ownership of a substantial plantation business.
Directorships of Other ASX Listed Companies No other current directorships Former ASX Listed Companies Directorships in last 3 years No former directorships

DIRECTORS’ REPORT
33 | P a g e
Special responsibilities Audit committee member Interests in shares and options 6,613,984 ordinary shares (held directly) 149,850,490 ordinary shares (held indirectly)
Peter R Bilbe (Chairman & Non Executive Director – appointed a director on 3 June 2010) Experience and expertise Peter Bilbe brings over 35 years of corporate, operational and international mining industry experience to the Company covering the full range of mining industry management positions. He holds a Bachelor of Engineering (Mining )(Hons) degree from the University of New South Wales (1974), is a member of AusIMM and holds various Mine Manager’s Certificates of Competency. From 2004 to 2007, Peter was Managing Director and Chief Executive Officer, Aztec Resources Limited (“Aztec”) which successfully developed the Koolan Island Iron Ore Project from exploration and bankable feasibility study through to financing, construction and operation. Peter’s substantial gold industry experience over some 20 years includes all aspects of narrow vein and large scale open pit and underground gold projects at Papua New Guinea (Morobe Gold Project, Hidden Valley), Kalgoorlie Consolidated Gold Mines Limited (the Golden Mile, Kalgoorlie, WA), the Norseman goldfield (WA) and in South Africa. Over the past three years Peter has held Non‐Executive Director positions with RMA Energy Limited, Aurox Resources Limited, Northern Iron Limited, Independence Group NL and Norseman Gold Plc. Peter brings a very significant depth and breadth of mining industry experience to the Board of Sihayo Gold and this will be of particular value to the Company as we progress through the feasibility and development process of the Sihayo Gold project in North Sumatra, Indonesia. Directorships of Other ASX Listed Companies Northern Iron Limited Independence Group NL Former ASX Listed Companies Directorships in last 3 years Aztec Resources Limited RMA Energy Limited Aurox Resources Limited Norseman Gold Mines plc Special responsibilities Audit committee member Remuneration committee member Interests in shares and options 1,920,000 ordinary shares (held indirectly)

REVIEW OF OPERATIONS
34 | P a g e
William John Blake (Non Executive Director – appointed a director on 4 June 2010) Experience and expertise Mr Blake brings over 30 years of international mining industry experience to the Company, including over 13 years in senior management roles in Indonesia. Mr Blake is President and CEO of Luna Gold, TSX listed gold mining in Canada. He holds a Masters Degree in Engineering Science (Mining Engineering) from the University of New South Wales, Masters Degree in Business Administration (Technology Management) from Deakin University and Doctor of Business Administration (Gold Hedging) from University of South Australia, and is a member of AusIMM. Mr Blake was CEO of Australian Solomons Gold Ltd, a company developing the two million ounce Gold Ridge Gold Mine in the Solomons Islands. Mr Blake was a Director of Agincourt Resources Limited and President Director, PT Agincourt Resources Limited (Indonesia). This role focused on the full permitting and Bankable Feasibility Study (“BFS”) of the Martabe Gold/Silver Project located in North Sumatra, Indonesia. Prior to this Mr Blake was General Manager and Director of Operations for PT Nusa Halmahera Minerals, North Maluku, Indonesia, a subsidiary of Newcrest Mining Ltd (“Newcrest”) responsible for construction and operation of the Gosowong Gold Mine and the Toguraci Gold Mine and development from discovery to feasibility, permitting and production of the Kencana Underground Mine now producing 450,000 ounces of gold per annum. Directorships of Other ASX Listed Companies None Former ASX Listed Companies Directorships in last 3 years Agincourt Resources Limited Special responsibilities Remuneration committee chairman Interests in shares and options 1,500,000 ordinary shares (held indirectly) Company Secretary The company secretary is Mr Daniel Garry Nolan. Mr Nolan was appointed to the position of company secretary on 1 July 2011, after the resignation of Mr Dean Calder. Mr Nolan has worked in finance and accounting for more than 30 years. He has held senior finance positions in Australia, Cambodia, Vietnam and Indonesia. Immediately before joining Sihayo he held senior management roles in the Saratoga Group in Indonesia. Prior to that he was a senior finance executive at Telstra for 10 years in Australia, Cambodia and Indonesia. Mr Nolan holds a Bachelor of Business from Monash University and a Certificate in Governance and Risk Management from Chartered Secretaries Australia.

DIRECTORS’ REPORT
35 | P a g e
MEETINGS OF DIRECTORS The following table sets out the number of meetings of the Company's directors held during the year ended 30 June 2012, and the number of meetings attended by each director. (Note that meeting attendance may have been completed via telephone conferencing.)
Number eligible to attend
Number Attended
M Collins 7 7
P Willis 7 7
Gavin Caudle 7 5
P Bilbe 7 7
W J Blake 7 6
REMUNERATION REPORT (AUDITED) Sihayo Gold Limited has established a remuneration committee comprising of Misha Collins, John Blake and Peter Bilbe as at the date of this report. The responsibilities and functions of the Remuneration Committee are as follows:
1) review the competitiveness of the Company’s executive compensation programs to ensure: (a) the attraction and retention of corporate officers; (b) the motivation of corporate officers to achieve the Company’s business objectives;
and (c) the alignment of the interests of key leadership with the long‐term interests of the
Company’s shareholders; 2) review trends in management compensation, oversee the development of new
compensation plans and, when necessary, approve the revision of existing plans; 3) review the performance of executive management; 4) review and approve Chairperson and Chief Executive Officer goals and objectives, evaluate
Chairperson and Chief Executive Officer performance in light of these corporate objectives, and set Chairperson and Chief Executive Officer compensation levels consistent with Company philosophy;
5) approve the salaries, bonus and other compensation for all senior executives, the committee will recommend appropriate salary, bonus and other compensation to the Board for approval;
6) review and approve compensation packages for new corporate officers and termination packages for corporate officers as requested by management;
7) review and approve the awards made under any executive officer bonus plan, and provide an appropriate report to the Board;
8) review and make recommendations concerning long‐term incentive compensation plans, including the use of share options and other equity‐based plans. Except as otherwise delegated by the Board, the committee will act on behalf of the Board as the “Committee” established to administer equity‐based and employee benefit plans, and as such will discharge any responsibilities imposed on the committee under those plans, including making and authorising grants, in accordance with the terms of those plans; and
9) review periodic reports from management on matters relating to the Company’s personnel appointments and practices.

DIRECTORS’ REPORT
36 | P a g e
REMUNERATION REPORT (AUDITED) (CONTINUED) Principles used to determine the nature and amount of remuneration
Non‐executive directors receive fees in cash. The fees are fixed and approved by shareholders.
Where non‐executive directors provide services in their area of expertise they receive payment at normal commercial rates.
There are no executives (other than directors) with authority for strategic decision and management.
The remuneration of the directors is not linked directly to the performance of the Company. Details of remuneration Details of the remuneration of key management personnel and related parties of Sihayo Gold Limited, including their personally related entities are set out below for the year ended 30 June 2012
REMUNERATION REPORT (AUDITED) (CONTINUED)
2012 Short‐term Post Employment Long Term
Equity Performance related %
Name
Cash Salary & Fees
Non Monetary Benefits
Super Payment
RetirementBenefits
IncentivePlans
LSL Share based
Total
M Collins (a) 49,050 2,230 ‐ ‐ ‐ ‐ ‐ 51,280 ‐
P Willis (b) 350,304 2,230 ‐ ‐ ‐ ‐ ‐ 352,534 ‐
P Bilbe (c) 61,165 2,230 9,685 ‐ ‐ ‐ ‐ 73,080 ‐
W J Blake (d) 45,000 2,230 ‐ ‐ ‐ ‐ ‐ 47,230 ‐
G Caudle(e) 45,000 2,230 ‐ ‐ ‐ ‐ ‐ 47,230 ‐
G Entwistle(f) 274,059 ‐ 15,775 ‐ ‐ ‐ ‐ 289,834 ‐
G Petersen(g) 140,589 ‐ ‐ ‐ ‐ ‐ ‐ 140,589 ‐
D Rowley(h) 255,098 ‐ ‐ ‐ ‐ ‐ ‐ 255,098 ‐
D Nolan(i) 170,000 ‐ ‐ ‐ ‐ ‐ ‐ 170,000 ‐
Total 1,390,265 11,150 25,460 ‐ ‐ ‐ ‐ 1,426,875 ‐
2011 Short‐term Post Employment Long Term
Equity Performance related %
Name
Cash Salary & Fees
Non Monetary Benefits
Super Payment
RetirementBenefits
IncentivePlans
LSL Share based
Total
M Collins 49,050 2,220 ‐ ‐ ‐ ‐ ‐ 51,270 ‐
P Willis 275,004 2,220 ‐ ‐ ‐ ‐ 332,758 609,982 ‐
P Bilbe 65,000 2,220 5,850 ‐ ‐ ‐ 117,369 190,439 ‐
W J Blake 45,000 2,220 ‐ ‐ ‐ ‐ 117,369 164,589 ‐
G Caudle 45,000 2,220 ‐ ‐ ‐ ‐ ‐ 47,220 ‐
G Entwistle 274,059 ‐ 15,199 ‐ ‐ ‐ ‐ 289,258 ‐
D Pluckhahn 5,701 ‐ ‐ ‐ ‐ ‐ ‐ 5,701 ‐
G Petersen 212,616 ‐ ‐ ‐ ‐ ‐ 302,433 515,049 ‐
D Rowley 134,210 ‐ ‐ ‐ ‐ ‐ 277,200 411,410 ‐
D Nolan 100,000 ‐ ‐ ‐ ‐ ‐ 138,600 238,600 ‐
Total 1,205,640 11,100 21,049 ‐ ‐ ‐ 1,285,729 2,523,518 ‐

DIRECTORS’ REPORT
37 | P a g e
There are no other key management personnel. (a) $49,050 in directors fees was paid to M Collins as at 30 June 2012. (b) $350,304 salary was paid to P Willis as at 30 June 2012. (c) $61,165 salary plus superannuation of $9,685 was paid to P Bilbe as at 30 June 2012. (d) $45,000 in directors fees was paid to Blake Mining Services, a personally related entity of W J
Blake, as at 30 June 2012. (e) $45,000 in directors fees was payable to G Caudle as at 30 June 2012. (f) $274,059 salary plus $15,775 superannuation was paid to G Entwistle as at 30 June 2012 (g) $140,589 salary was paid to G Petersen as at 30 June 2012. His resignation date was 19
December 2011. (h) $255,098 salary was paid to D Rowley as at 30 June 2012. (i) $170,000 salary was paid to D Nolan as at 30 June 2012.
Compensation Options (Consolidated)
Terms and Conditions for each Grant Vested
30 June 2012 Granted No
Grant Date
Fair value per option at grant date ($)
Exercise price per option ($)
Expiry date
First Exercise date
Last exercise date
No %
M Collins ‐ ‐ ‐ ‐ ‐ ‐ ‐ ‐ ‐
P Willis ‐ ‐ ‐ ‐ ‐ ‐ ‐ ‐ ‐
P Bilbe ‐ ‐ ‐ ‐ ‐ ‐ ‐ ‐ ‐
W J Blake ‐ ‐ ‐ ‐ ‐ ‐ ‐ ‐ ‐
G Caudle ‐ ‐ ‐ ‐ ‐ ‐ ‐ ‐ ‐
Terms and Conditions for each Grant Vested
30 June 2011
Granted No
Grant Date Fair value per option at grant date ($)
Exercise price per option ($)
Expiry date
First Exercise date
Last exercise date
No %
M Collins ‐ ‐ ‐ ‐ ‐ ‐ ‐ ‐ ‐
P Willis ‐ ‐ ‐ ‐ ‐ ‐ ‐ ‐ ‐
P Bilbe ‐ ‐ ‐ ‐ ‐ ‐ ‐ ‐ ‐
WJ Blake ‐ ‐ ‐ ‐ ‐ ‐ ‐ ‐ ‐
G Caudle ‐ ‐ ‐ ‐ ‐ ‐ ‐ ‐ ‐
DIRECTORS’ REPORT
38 | P a g e
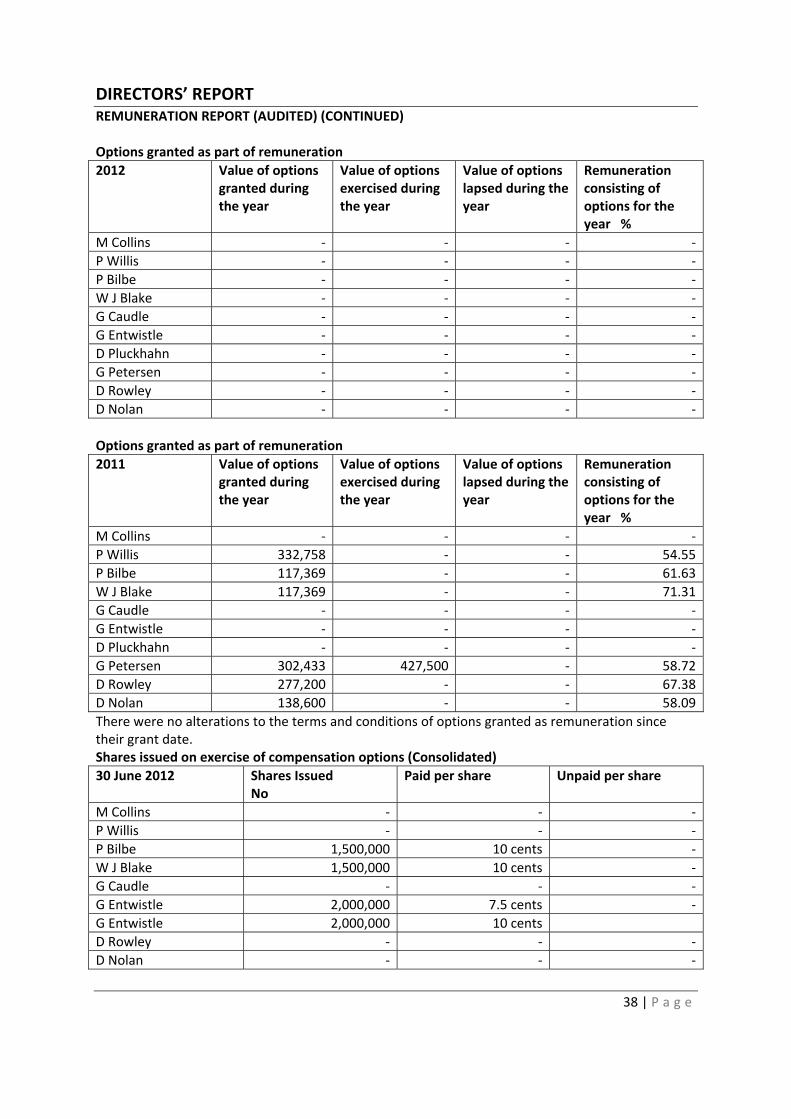
REMUNERATION REPORT (AUDITED) (CONTINUED) Options granted as part of remuneration
2012 Value of options granted during the year
Value of options exercised during the year
Value of options lapsed during the year
Remuneration consisting of options for the year %
M Collins ‐ ‐ ‐ ‐
P Willis ‐ ‐ ‐ ‐
P Bilbe ‐ ‐ ‐ ‐
W J Blake ‐ ‐ ‐ ‐
G Caudle ‐ ‐ ‐ ‐
G Entwistle ‐ ‐ ‐ ‐
D Pluckhahn ‐ ‐ ‐ ‐
G Petersen ‐ ‐ ‐ ‐
D Rowley ‐ ‐ ‐ ‐
D Nolan ‐ ‐ ‐ ‐
Options granted as part of remuneration
2011 Value of options granted during the year
Value of options exercised during the year
Value of options lapsed during the year
Remuneration consisting of options for the year %
M Collins ‐ ‐ ‐ ‐
P Willis 332,758 ‐ ‐ 54.55
P Bilbe 117,369 ‐ ‐ 61.63
W J Blake 117,369 ‐ ‐ 71.31
G Caudle ‐ ‐ ‐ ‐
G Entwistle ‐ ‐ ‐ ‐
D Pluckhahn ‐ ‐ ‐ ‐
G Petersen 302,433 427,500 ‐ 58.72
D Rowley 277,200 ‐ ‐ 67.38
D Nolan 138,600 ‐ ‐ 58.09
There were no alterations to the terms and conditions of options granted as remuneration since their grant date. Shares issued on exercise of compensation options (Consolidated)
30 June 2012 Shares Issued No
Paid per share Unpaid per share
M Collins ‐ ‐ ‐
P Willis ‐ ‐ ‐
P Bilbe 1,500,000 10 cents ‐
W J Blake 1,500,000 10 cents ‐
G Caudle ‐ ‐ ‐
G Entwistle 2,000,000 7.5 cents ‐
G Entwistle 2,000,000 10 cents
D Rowley ‐ ‐ ‐
D Nolan ‐ ‐ ‐

DIRECTORS’ REPORT
39 | P a g e
REMUNERATION REPORT (AUDITED) (CONTINUED) Shares issued on exercise of compensation options (Consolidated)
30 June 2011 Shares Issued No
Paid per share Unpaid per share
M Collins ‐ ‐ ‐
P Willis ‐ ‐ ‐
P Bilbe ‐ ‐ ‐
W J Blake ‐ ‐ ‐
G Caudle ‐ ‐ ‐
T Martin 3,000,000 5 cents ‐
G Entwistle ‐ ‐ ‐
D Pluckhahn ‐ ‐ ‐
G Petersen 1,500,000 13.5 cents ‐
G Petersen 1,500,000 15 cents ‐
D Rowley ‐ ‐ ‐
D Nolan ‐ ‐ ‐
Officer Emoluments Fees of $91,500 (GST exclusive) were paid to Calder Roth & Co, a Chartered Accounting firm of which provide accounting, company secretarial, taxation and other services during the year. Directors and Officer Insurance During the year $11,150 was incurred for Directors and officeholders insurance, covering all directors and officeholders. The liabilities insured are costs and expenses that may be incurred in defending civil or criminal proceedings that may be brought against the officers in their capacity as officers of entities in the consolidated entity. SHARES UNDER OPTION Unissued ordinary shares of Sihayo Gold Limited under option at the date of this report are as follows:
As at the end of the reporting period, there were no listed options for Sihayo Gold Ltd shares on the Australian Stock Exchange.
6,800,000 director unlisted options exercisable at 15 cents before the expiry date of 31 May 2013.
2,000,000 director unlisted options exercisable at 12.5 cents at any time on or before 30 June 2013.
3,000,000 employee unlisted options exercisable at 25 cents at any time on or before 31 December 2012

DIRECTORS’ REPORT
40 | P a g e
CONVERTIBLE NOTES There are no convertible notes held as at 30 June 2012. PROCEEDINGS ON BEHALF OF COMPANY No person entitled to exercise any of the options has any right, by virtue of the options, to participate in any share issue of any other body corporate. The names of all persons who currently hold options, granted at any time, are entered in the register kept by the Company pursuant to Section 216C of the Corporations Act 2001 and the register may be inspected free of charge. No person has applied for leave of Court to bring proceedings on behalf of the Company or intervene in any proceedings to which the Company is a party for the purpose of taking responsibility on behalf of the Company for all or part of these proceedings. The Company was not party to any such proceedings during the year. CORPORATE GOVERNANCE The Company’s Corporate Governance Statement is set out on pages 42 – 50. NON‐AUDIT SERVICES There were no non‐audit services undertaken by Stantons International during the financial year. A copy of the auditor’s independence declaration as required under section 307C of the Corporations Act 2001 is set out on page 41. Signed in accordance with a resolution of the Board of Directors.
Paul Michael Willis Director 27 September 2012


CORPORATE GOVERNANCE STATEMENT
42 | P a g e
Sihayo Gold Limited (Company) has adopted systems of control and accountability as the basis for
the administration of corporate governance. Some of these policies and procedures are summarised
in this statement. Commensurate with the spirit of the ASX Corporate Governance Council's
Corporate Governance Principles and Recommendations 2nd edition (Principles &
Recommendations), the Company has followed each recommendation where the Board has
considered the recommendation to be an appropriate benchmark for its corporate governance
practices. Where the Company's corporate governance practices follow a recommendation, the
Board has made appropriate statements reporting on the adoption of the recommendation. In
compliance with the "if not, why not" reporting regime, where, after due consideration, the
Company's corporate governance practices depart from a recommendation, the Board has offered
full disclosure and an explanation for the adoption of its own practice.
The following governance‐related documents can be found on the Company's website at
www.sihayogold.com, under the section marked “About Us”, "Corporate Governance":
Charters
Board
Audit Committee
Nomination Committee
Remuneration Committee
Policies and Procedures
Policy and Procedure for Selection and (Re) Appointment of Directors
Process for Performance Evaluation
Policy on Assessing the Independence of Directors
Code of Conduct (summary)
Policy on Continuous Disclosure (summary)
Compliance Procedures (summary)
Procedure for the Selection, Appointment and Rotation of External Auditor
Shareholder Communication Policy
Risk Management Policy (summary) The Company reports below on how it has followed (or
otherwise departed from) each of the recommendations during the 2011/2012 financial year
(Reporting Period). The information in this statement is current at 30 September 2012.

CORPORATE GOVERNANCE STATEMENT
43 | P a g e
Board
Roles and responsibilities of the Board and Senior Executives
(Recommendations: 1.1, 1.3)
The Company has established the functions reserved to the Board, and those delegated to senior
executives and has set out these functions in its Board Charter.
The Board is collectively responsible for promoting the success of the Company through its key
functions of overseeing the management of the Company, providing overall corporate governance of
the Company, monitoring the financial performance of the Company, engaging appropriate
management commensurate with the Company's structure and objectives, involvement in the
development of corporate strategy and performance objectives, and reviewing, ratifying and
monitoring systems of risk management and internal control, codes of conduct and legal
compliance.
Senior executives are responsible for supporting the Chief Executive Officer and assisting the Chief
Executive Officer in implementing the running of the general operations and financial business of the
Company in accordance with the delegated authority of the Board. Senior executives are
responsible for reporting all matters which fall within the Company's materiality thresholds at first
instance to the Chief Executive Officer or, if the matter concerns the Chief Executive Officer, directly
to the Chair or the lead independent director, as appropriate.
The Company’s Board Charter is disclosed on the Company’s website.
Skills, experience, expertise and period of office of each Director
(Recommendation: 2.6)
A profile of each Director setting out their skills, experience, expertise and period of office is set out
in the Directors' Report.
The mix of skills and diversity for which the Board is looking to achieve in membership of the Board
is represented in the Board’s current composition. The directors on the Board possess the following
skills and experience, which the Board considers are appropriate for the Company at this stage of its
development: corporate, operational and international mining industry experience; investment
industry experience; financial and capital markets experience; technical skills and experience; and
Indonesia experience.
Director independence
(Recommendations: 2.1, 2.2, 2.3, 2.6)
The Board has a majority of directors who are independent.
The Board considers the independence of directors having regard to the relationships listed in Box
2.1 of the Principles & Recommendations and the Company's materiality thresholds. The Board has

CORPORATE GOVERNANCE STATEMENT
44 | P a g e
agreed on the following guidelines, as set out in the Company's Board Charter for assessing the
materiality of matters:
Balance sheet items are material if they have a value of: (a) more than 10%; or (b) more than $500,000, whichever is the greater, of pro‐forma net assets.
Profit and loss items are material if they will have an impact on the current year operating result of: (a) more than 10%; or (b) more than $500,000, whichever is the greater.
Items are also material if they impact on the reputation of the Company, involve a breach of legislation, are outside the ordinary course of business, could affect the Company’s rights to its assets, if accumulated would trigger the quantitative tests, involve a contingent liability that would have a probable effect of: (i) 10% or more; or (b) more than $500,000 (whichever is the greater) or more on balance sheet or profit and loss items, or will have an effect on operations which is likely to result in an increase or decrease in net income or dividend distribution of: (i) more than 10%; or (ii) more than $500,000 (whichever is the greater).
Contracts will be considered material if they are outside the ordinary course of business, contain exceptionally onerous provisions in the opinion of the Board, impact on income or distribution in excess of the quantitative tests, there is a likelihood that either party will default, and the default may trigger any of the quantitative or qualitative tests, are essential to the activities of the Company and cannot be replaced, or cannot be replaced without an increase in cost which triggers any of the quantitative tests, contain or trigger change of control provisions, are between or for the benefit of related parties, or otherwise trigger the quantitative tests.
The independent directors of the Company are Peter Bilbe (Chair), John Blake and Misha Collins.
These directors are independent as they are non‐executive directors who are not members of
management and who are free of any business or other relationship that could materially interfere
with, or could reasonably be perceived to materially interfere with, the independent exercise of
their judgment.
The non‐independent directors of the Company are Paul Willis and Gavin Caudle.
The Chief Executive Officer is Paul Willis who is not also Chair of the Board.
Independent professional advice
(Recommendation: 2.6)
To assist directors with independent judgement, it is the Board's policy that if a director considers it
necessary to obtain independent professional advice to properly discharge the responsibility of their
office as a director then, provided the director first obtains approval for incurring such expense from
the Chair, the Company will pay the reasonable expenses associated with obtaining such advice.
Selection and (Re)Appointment of Directors
(Recommendation: 2.6)
In determining candidates for the Board, the Nomination Committee (or equivalent) follows a
prescribed process whereby it evaluates the mix of skills, experience and expertise of the existing
Board. In particular, the Nomination Committee (or equivalent) is to identify the particular skills that

CORPORATE GOVERNANCE STATEMENT
45 | P a g e
will best increase the Board's effectiveness. Consideration is also given to the balance of
independent directors. Potential candidates are identified and, if relevant, the Nomination
Committee (or equivalent) recommends an appropriate candidate for appointment to the Board.
Any appointment made by the Board is subject to ratification by shareholders at the next general
meeting.
The Board recognises that Board renewal is critical to performance and the impact of Board tenure
on succession planning. Each director other than the Managing Director, must not hold office
(without re‐election) past the third annual general meeting of the Company following the director's
appointment or three years following that director's last election or appointment (whichever is the
longer). However, a director appointed to fill a casual vacancy or as an addition to the Board must
not hold office (without re‐election) past the next annual general meeting of the Company. At each
annual general meeting a minimum of one director or one third of the total number of directors
must resign. A director who retires at an annual general meeting is eligible for re‐election at that
meeting. Re‐appointment of directors is not automatic.
The Company’s Policy and Procedure for the Selection and Re (Appointment) of Directors is
disclosed on the Company’s website.
Board committees
Nomination Committee
(Recommendations: 2.4, 2.6)
The Board has not established a separate Nomination Committee. Given the current size and
composition of the Board, the Board believes that there would be no efficiencies gained by
establishing a separate Nomination Committee. Accordingly, the Board performs the role of the
Nomination Committee. Items that are usually required to be discussed by a Nomination Committee
are marked as separate agenda items at Board meetings when required. When the Board convenes
as the Nomination Committee it carries out those functions which are delegated to it in the
Company’s Nomination Committee Charter. The Board deals with any conflicts of interest that may
occur when convening in the capacity of the Nomination Committee by ensuring that the director
with conflicting interests is not party to the relevant discussions.
The full Board did not officially convene as a Nomination Committee during the Reporting Period,
however nomination‐related discussions occurred from time to time during the year as required.
The Company has adopted a Nomination Committee Charter which describes the role, composition,
functions and responsibilities of the Nomination Committee.
The Company’s Nomination Committee Charter is disclosed on the Company’s website.

CORPORATE GOVERNANCE STATEMENT
46 | P a g e
Audit Committee
(Recommendations: 4.1, 4.2, 4.3, 4.4)
The Board has established an Audit Committee, which comprises Misha Collins as Chair, Peter Bilbe
and Gavin Caudle. The Audit Committee is structured in compliance with Recommendation 4.2 as it
consists only of non‐executive directors, consists of a majority of independent directors, is chaired
by an independent chair, who is not chair of the Board and has three members.
Details of each of the director's qualifications are set out in the Directors' Report. All members of
the Audit Committee consider themselves to be financially literate and have an understanding of the
industry in which the Company operates. The Chair of the Audit Committee, Mr Misha Collins, is a
Chartered Financial Analyst, having completed the Chartered Financial Analyst programme with the
US based Chartered Financial Analyst Institute. Gavin Caudle is a Chartered Accountant
The Board has adopted an Audit Committee Charter which describes its role, composition, functions
and responsibilities of the Audit Committee.
The Audit Committee held two meetings during the Reporting Period, which all members of the
Audit Committee attended.
The Company has established a Procedure for the Selection, Appointment and Rotation of its
External Auditor. The Board is responsible for the initial appointment of the external auditor and the
appointment of a new external auditor when any vacancy arises, as recommended by the Audit
Committee. Candidates for the position of external auditor must demonstrate complete
independence from the Company through the engagement period. The Board may otherwise select
an external auditor based on criteria relevant to the Company's business and circumstances. The
performance of the external auditor is reviewed on an annual basis by the Audit Committee and any
recommendations are made to the Board.
The Company’s Audit Committee Charter and Procedure for Selection, Appointment and Rotation of
External Auditor are disclosed on the Company’s website.
Remuneration Committee
(Recommendations: 8.1, 8.2, 8.3, 8.4)
The Board has established a Remuneration Committee, which comprises John Blake as Chair, Peter
Bilbe and Misha Collins. The Remuneration Committee is structured in compliance with
Recommendation 8.2 as it consists only of independent, non‐executive directors, is chaired by an
independent chair and has three members.
The Remuneration Committee held one meeting during the Reporting Period, which all members of
the Remuneration Committee attended.
The Board has adopted a Remuneration Committee Charter which describes the role, composition,
functions and responsibilities of the Remuneration Committee.

CORPORATE GOVERNANCE STATEMENT
47 | P a g e
Details of remuneration, including the Company’s policy on remuneration, are contained in the
“Remuneration Report” which forms of part of the Directors’ Report. Non‐executive directors are
remunerated at a fixed fee for time, commitment and responsibilities. Remuneration for non‐
executive directors is not linked to individual performance. The Company may consider it
appropriate to issue unlisted options to non‐executive directors, subject to obtaining the relevant
approvals. This policy is subject to annual review. All of the directors’ option holdings are fully
disclosed. The maximum aggregate amount of fees (including superannuation payments) that can
be paid to non‐executive directors is subject to approval by shareholders at general meeting. Pay
and rewards for executive directors and senior executives consists of a base salary and performance
incentives. Long term performance incentives may include options granted at the discretion of the
Remuneration Committee and subject to obtaining the relevant approvals. The grant of options is
designed to recognise and reward efforts as well as to provide additional incentive and may be
subject to the successful completion of performance hurdles. Executives are offered a competitive
level of base pay at market rates and are reviewed annually to ensure market competitiveness.
There are no termination or retirement benefits for non‐executive directors (other than for
superannuation).
The Company's Remuneration Committee Charter includes a statement of the Company's policy on
prohibiting transactions in associated products which limit the risk of participating in unvested
entitlements under any equity based remuneration schemes.
The Company’s Remuneration Committee Charter is disclosed on the Company’s website.
Performance evaluation
Senior executives
(Recommendations: 1.2, 1.3)
The Company has not developed a formal process for the evaluation of its two senior executives; the
Chief Executive Officer and Chief Financial Officer, as the Board believes that the current size and
structure of the Company allows effective evaluation on an ongoing basis.
The Chief Executive Officer reviews the performance of the Chief Financial Officer closely on an
ongoing basis. Further, the Chief Executive Officer’s performance is reviewed by the Chair and the
Board. This evaluation is also undertaken on an ongoing basis through open and regular
communication.
During the Reporting Period an evaluation of the Chief Executive Officer and the Chief Financial
Officer took place in accordance with the process disclosed above.

CORPORATE GOVERNANCE STATEMENT
48 | P a g e
Board, its committees and individual directors
(Recommendations: 2.5, 2.6)
The Chair is responsible for evaluation of the Board and, when deemed appropriate, Board
committees and individual directors.
A formal process for the evaluation of the Board, its committees and individual directors has not
been developed as the Board considers that effective evaluation of its performance, the
performance of Board committees and individual directors is achieved through ongoing open and
regular communication. Performance evaluation of the Board, its committees and individual
directors is carried out by ongoing review by the Chair. During the Reporting Period, the Chair also
met with directors individually.
During the Reporting Period an evaluation of the Board, its committees and individual directors took
place in accordance with the process disclosed above.
The Company’s Process for Performance Evaluation is disclosed on the Company’s website.
Ethical and responsible decision making
Code of Conduct
(Recommendations: 3.1, 3.5)
The Company has established a Code of Conduct as to the practices necessary to maintain
confidence in the Company's integrity, the practices necessary to take into account its legal
obligations and the reasonable expectations of its stakeholders and the responsibility and
accountability of individuals for reporting and investigating reports of unethical practices.
A summary of the Company’s Code of Conduct is disclosed on the Company’s website.
Diversity
(Recommendations: 3.2, 3.3, 3.4, 3.5)
The Company has not established a Diversity Policy, or set measurable objectives for achieving
gender diversity. The Board considered the merits of adopting a Diversity Policy, and considers that
while the Company’s operations are still at feasibility stage and it has a small number of employees,
it is not practical to establish a Diversity Policy or to set measurable objectives for achieving gender
diversity. The Board will review its position as the Company’s circumstances change.
The proportion of women employees in the whole organisation, women in senior executive positions
and women on the Board are set out in the following table:

CORPORATE GOVERNANCE STATEMENT
49 | P a g e
Continuous Disclosure
(Recommendations: 5.1, 5.2)
The Company has established written policies and procedures designed to ensure compliance with
ASX Listing Rule disclosure requirements and accountability at a senior executive level for that
compliance.
A summary of the Company’s Policy on Continuous Disclosure and Compliance Procedures are
disclosed on the Company’s website.
Shareholder Communication
(Recommendations: 6.1, 6.2)
The Company has designed a communications policy for promoting effective communication with
shareholders and encouraging shareholder participation at general meetings.
The Company’s Shareholder Communication Policy is disclosed on the Company’s website.
Risk Management
Recommendations: 7.1, 7.2, 7.3, 7.4)
The Board has adopted a Risk Management Policy, which sets out the Company's risk profile. Under
the policy, the Board is responsible for approving the Company's policies on risk oversight and
management and satisfying itself that management has developed and implemented a sound
system of risk management and internal control.
Under the policy, the Board delegates day‐to‐day management of risk to the Chief Executive Officer,
who is responsible for identifying, assessing, monitoring and managing risks. The Chief Executive
Officer is also responsible for updating the Company's material business risks to reflect any material
changes, with the approval of the Board.
In fulfilling the duties of risk management, the Chief Executive Officer may have unrestricted access
to Company employees, contractors and records and may obtain independent expert advice on any
matter they believe appropriate, with the prior approval of the Board.
Proportion of women
Whole organisation (excluding the Board) 1 out of 4 (25%)
Senior executive positions 0 out of 3 (0%)
Board 0 out of 5 (0%)
CORPORATE GOVERNANCE STATEMENT
50 | P a g e
The Board has established a separate Audit Committee to monitor and review the integrity of
financial reporting and the Company's internal financial control systems and risk management
systems.
In addition, the following risk management measures have been adopted by the Board to manage
the Company's material business risks:
the Board has established authority limits for management, which, if proposed to be exceeded, requires prior Board approval;
the Board has adopted a compliance procedure for the purpose of ensuring compliance with the Company's continuous disclosure obligations; and
the Board has adopted a corporate governance manual which contains other policies to assist the Company to establish and maintain its governance practices.
The Company’s risk management system includes the preparation of a risk register by management
to identify and categorise the Company’s material business risks and notes the risk management
strategies for those risks. The risk register is reviewed by the Chief Executive Officer and reported to
the Board on a regular basis. Risk management is a standing agenda item at each Board meeting.
The categories of material business risks detailed in the Company’s risk register are: strategic;
operational and governance.
The Board has required management to design, implement and maintain risk management and
internal control systems to manage the Company's material business risks. The Board also requires
management to report to it confirming that those risks are being managed effectively. The Board has
received a report from management as to the effectiveness of the Company's management of its
material business risks for the Reporting Period.
The Chief Executive Officer and the Chief Financial Officer have provided a declaration to the Board
in accordance with section 295A of the Corporations Act and have assured the Board that such
declaration is founded on a sound system of risk management and internal control and that the
system is operating effectively in all material respects in relation to financial reporting risks.
A summary of the Company’s Risk Management Policy is disclosed on the Company’s website.

CONSOLIDATED STATEMENT OF COMPREHENSIVE INCOME
51 | P a g e
FOR THE YEAR ENDED 30 JUNE 2012 Notes Consolidated 2012
$ 2011
$
Other revenue 3 104,490 136,392
Total revenue 104,490 136,392
Corporate secretarial expenses (85,863) (61,262) Depreciation and amortisation 20(b) (185,893) (128,103) Exploration expenditure (administrative) 3(a)(i) ‐ (2,856,832) Employee benefits expense (3,389,881) (2,478,388) Exploration expenditure 3(a)(i) ‐ (1,196,081) Write off of depreciable assets 20(b) ‐ (60,818) External consultancy expenses (2,722,935) (10,654) Insurance expenses (19,684) (24,097) Rental expenses 3(a)(i) (69,777) (67,363) Share based payments 14(a),20(b) ‐ (1,285,729) Travel and entertainment expenses (583,390) (613,037) Other expenses (2,758,128) (2,495,082)
Loss before income tax (9,711,061) (11,141,054) Income tax expense 3(b) ‐ ‐
Net loss (9,711,061) (11,141,054)
Other comprehensive income Movement in foreign currency translation reserve 11(b) (1,598,628) (2,043,622)
Other comprehensive income for the year, net of tax (1,598,628) (2,043,622)
Total comprehensive loss for the year (11,309,689) (13,184,676)
Loss after income tax attributable to: Members of Sihayo Gold Limited (9,667,996) (10,592,830) Non controlling interest (43,065) (548,224)
(9,711,061) (11,141,054)
Comprehensive loss after income tax attributable to: Members of Sihayo Gold Limited (11,266,624) (12,636,452) Non controlling interest (43,065) (548,224)
(11,309,689) (13,184,676)
Basic/diluted loss per share in cents 21 (1.36) (1.86)
The above Consolidated Statement of Comprehensive Income should be read in conjunction with
the accompanying notes
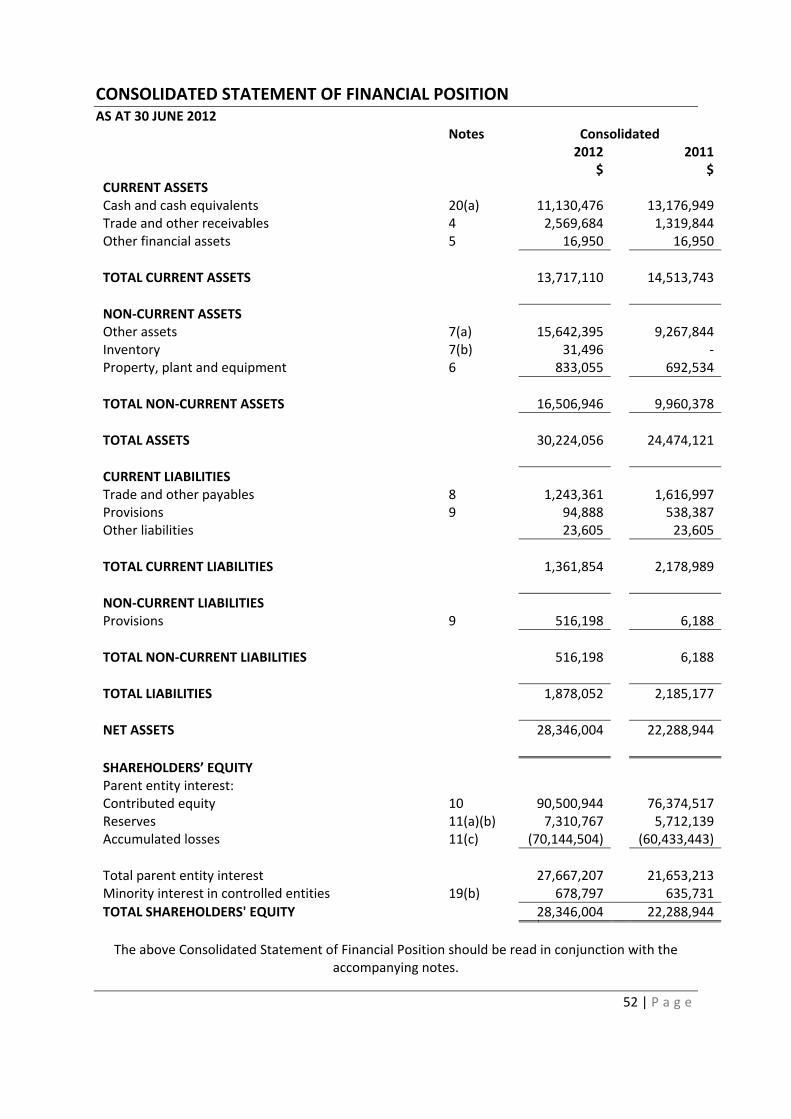
CONSOLIDATED STATEMENT OF FINANCIAL POSITION
52 | P a g e
AS AT 30 JUNE 2012 Notes Consolidated 2012
$ 2011
$
CURRENT ASSETS Cash and cash equivalents 20(a) 11,130,476 13,176,949 Trade and other receivables 4 2,569,684 1,319,844 Other financial assets 5 16,950 16,950
TOTAL CURRENT ASSETS 13,717,110 14,513,743
NON‐CURRENT ASSETS Other assets 7(a) 15,642,395 9,267,844 Inventory 7(b) 31,496 ‐ Property, plant and equipment 6 833,055 692,534
TOTAL NON‐CURRENT ASSETS 16,506,946 9,960,378
TOTAL ASSETS 30,224,056 24,474,121
CURRENT LIABILITIES Trade and other payables 8 1,243,361 1,616,997 Provisions 9 94,888 538,387 Other liabilities 23,605 23,605
TOTAL CURRENT LIABILITIES 1,361,854 2,178,989
NON‐CURRENT LIABILITIES Provisions 9 516,198 6,188
TOTAL NON‐CURRENT LIABILITIES 516,198 6,188
TOTAL LIABILITIES 1,878,052 2,185,177
NET ASSETS 28,346,004 22,288,944
SHAREHOLDERS’ EQUITY Parent entity interest: Contributed equity 10 90,500,944 76,374,517 Reserves 11(a)(b) 7,310,767 5,712,139 Accumulated losses 11(c) (70,144,504) (60,433,443)
Total parent entity interest 27,667,207 21,653,213 Minority interest in controlled entities 19(b) 678,797 635,731
TOTAL SHAREHOLDERS' EQUITY 28,346,004 22,288,944
The above Consolidated Statement of Financial Position should be read in conjunction with the
accompanying notes.

CONSOLIDATED STATEMENT OF CASH FLOWS
53 | P a g e
FOR THE YEAR ENDED 30 JUNE 2012 Notes Consolidated 2012
$ 2011
$
CASH FLOWS FROM OPERATING ACTIVITIES Payments to creditors and suppliers (8,600,309) (3,682,850) Payments to employees (2,818,491) (1,376,189) Exploration expenditure ‐ (1,181,426) Interest received 104,490 136,392
NET CASH FLOWS USED IN OPERATING ACTIVITIES
20(b)
(11,314,310)
(6,104,073)
CASH FLOWS FROM INVESTING ACTIVITIES Mining exploration & evaluation expenditure (6,153,730) (9,938,734) Purchase of property, plant and equipment (296,280) (638,106)
NET CASH USED IN INVESTING ACTIVITIES
(6,450,010)
(10,576,840)
CASH FLOWS FROM FINANCING ACTIVITIES Proceeds from issue of shares and options 14,365,291 29,656,498 Share and option issue costs (238,737) (980,537) Payment of unmarketable securities (127) ‐
NET CASH FLOWS FROM FINANCING ACTIVITIES
14,126,427
28,675,961
Net (decrease) / increase in cash and cash equivalents held
(3,637,893)
11,995,048
Effects of exchange rate changes on cash 1,591,420 (176,774) Cash and cash equivalents at the beginning of the financial year
13,176,949
1,358,675
Cash and cash equivalents at the end of the financial year
20(a)
11,130,476
13,176,949
The above Consolidated Statement of Cash Flows should be read in conjunction with the
accompanying notes.

CONSOLIDATED STATEMENT OF CHANGES IN EQUITY
54 | P a g e
FOR THE YEAR ENDED 30 JUNE 2012 Consolidated
$ $ $ $ $ $ Share
Capital & shares to be issued
Options & Equity
Reserve
FX Reserve Accum Losses
Non Controlling
Interest
Total
Balance at 1.7.10 47,698,556 1,041,408 1,438,080 (49,292,389) 87,507 973,162 Total comprehensive income for the year
‐ ‐ ‐ (11,141,054)
‐ (11,141,054)
Other comprehensive income:
Movement in foreign currency translation reserve
‐ ‐ 2,043,622 ‐
‐ 2,043,622
Movement in OEI ‐ ‐ ‐ ‐ 548,224 548,224 Issue of shares 29,656,498 (96,700) ‐ ‐ ‐ 29,559,798 Share issue costs (980,537) ‐ ‐ ‐ ‐ (980,537) Issue of options ‐ 1,285,729 ‐ ‐ ‐ 1,285,729
Balance at 30.06.11
76,374,517 2,230,437 3,481,702 (60,433,443) 635,731 22,288,944
$ $ $ $ $ $ Share
Capital & shares to be issued
Options & Equity
Reserve
FX Reserve AccumLosses
Non Controlling
Interest
Total
Balance at 1.7.11 76,374,517 2,230,437 3,481,702 (60,433,443) 635,731 22,288,944 Total comprehensive income for the year
‐ ‐ ‐ (9,711,061)
‐ (9,711,061)
Other comprehensive income:
Movement in foreign currency translation reserve
‐ ‐ 1,598,628 ‐
‐ 1,598,628
Movement in OEI ‐ ‐ ‐ ‐ 43,066 43,066 Issue of shares 14,365,163 ‐ ‐ ‐ ‐ 14,365,163 Share issue costs (238,736) ‐ ‐ ‐ ‐ (238,736) Issue of options ‐ ‐ ‐ ‐ ‐ ‐
Balance at 30.06.12
90,500,944 2,230,437 5,080,330 (70,144,504) 678,797 28,346,004
The above Consolidated Statement of Changes in Equity should be read in conjunction with the accompanying notes.

NOTES TO THE FINANCIAL STATEMENTS
55 | P a g e
FOR THE YEAR ENDED 30 JUNE 2012 1. SUMMARY OF SIGNIFICANT ACCOUNTING POLICIES The financial statements are general purpose financial statements that have been prepared in accordance with Accounting Standards of the Australian Accounting Standards Board and the Corporations Act 2001. The financial statements cover the economic entity of Sihayo Gold Limited and its controlled entities, and was authorised for issue in accordance with a resolution of the Directors on 27 September 2012. Sihayo Gold Limited is a listed public company, incorporated and domiciled in Australia. The following is a summary of the material accounting policies adopted by the economic entity in the preparation of the financial report. The accounting policies have been consistently applied, unless otherwise stated. Basis of Preparation Statement of compliance The financial report is a general purpose financial report which has been prepared in accordance with Australian Accounting Standards (AASBs) and the Corporations Act 2001. The consolidated financial report of the Company also complies with International Financial Reporting Standards and interpretations adopted by the International Accounting Standards Board. Separate financial statements for Sihayo Gold Limited as an individual entity are no longer presented as the consequence of a change to the Corporations Act 2001, however required financial information for Sihayo Gold Limited as an individual entity is included in Note 12. Adoption of New and Revised Accounting Standards In the current year, the group has adopted all of the new and revised standards and interpretations issued by the Australian Accounting Standards Board (the AASB) that are relevant to its operations and effective for the current annual reporting period. The adoption of these new and revised Standards and Interpretations has not resulted in any material changes to the Group’s accounting policies. Certain new accounting standards and interpretations have been published that are not mandatory for 30 June 2012 reporting year. The group’s assessment of the impact of these new standards and interpretations is set out below:
i. AASB 9 Financial Instruments and AASB 2009‐2011 Amendments to Australian Accounting Standards arising from AASB 9 (effective from 1 January 2013).
ii. AASB 10 Consolidated Financial Statements, AASB 11 Joint Arrangements, AASB 12 Disclosure of Interests in Other Entities, revised AASB 127 Separate Financial Statements and AASB 128 Investments in Associates and Joint Ventures and AASB 2011‐7 Amendments to Australian Accounting Standards arising from the Consolidation and Joint Arrangement Standards (effective 1 January 2013). The Group does not expect to adopt the new standards before their operation date.

NOTES TO THE FINANCIAL STATEMENTS
56 | P a g e
FOR THE YEAR ENDED 30 JUNE 2012 1. SUMMARY OF SIGNIFICANT ACCOUNTING POLICIES (CONTINUED)
They would therefore be first applied in the financial statements for the annual reporting period ending 30 June 2014.
iii. Revised AASB 124 Related Party Disclosures and AASB 2009‐12 Amendments to Australian Accounting Standards (effective 1 January 2011). The revised AASB 124 is effective for accounting periods beginning on or after 1 January 2011 and must be applied retrospectively. The aim of the amendment is to clarify and simplify the definition of a related party. The group will apply the amended standard from 1 July 2011. When the amendments are applied, the group will need to disclose any transactions between its subsidiaries and its associates. However, there will be no impact on any of the amounts recognised in the financial statements.
iv. AASB 13 Fair Value Measurement and AASB 2011‐8 Amendments to Australian Accounting Standards arising from AASB 13 (effective 1 January 2013). The revised AASB 13 explains how to measure fair value and aims to enhance fair value disclosures. The group has yet to determine which, if any, of its current measurement techniques it will have to change as a result of the new guidance. The group does not intend to adopt the new standard before its operative date being 30 June 2014.
a) Reporting Basis and Conventions The financial report has been prepared on an accruals basis and is based on historical costs modified by the revaluation of selected non‐current assets, financial assets and financial liabilities for which the fair value basis of accounting has been applied. b) Going Concern
The consolidated financial statements have been prepared on a going concern basis. However, the ability of the Company and the consolidated entity to actively explore and continue as a going concern, and to meet their debts and commitments as they fall due, is dependent upon further capital raisings. The Directors are confident that the Company will be successful in raising further capital and, accordingly, have prepared the financial statements on a going concern basis. At this time, the Directors are of the opinion that no asset is likely to be realised for an amount less than the amount at which it is recorded in the financial report at 30 June 2012. Accordingly, no adjustments have been made to the financial report relating to the recoverability and classification of the asset carrying amounts or the amounts and classification of liabilities that might be necessary should the Company not continue as a going concern. c) Principles of Consolidation
The consolidated financial statements incorporate the assets, liabilities and results of entities controlled by Sihayo Gold Limited at reporting date. A controlled entity is any entity over which Sihayo Gold Limited has the power to govern the financial and operating policies so as to obtain benefits from its activities. Control will generally exist when the parent owns, directly or indirectly

NOTES TO THE FINANCIAL STATEMENTS
57 | P a g e
FOR THE YEAR ENDED 30 JUNE 2012 1. SUMMARY OF SIGNIFICANT ACCOUNTING POLICIES (CONTINUED) through subsidiaries, more than half of the voting power of an entity. In assessing the power to govern, the existence and effect of holdings of actual and potential voting rights are also considered. Where controlled entities have entered or left the group during the year, the financial performance of those entities are included only for the period of the year that they were controlled. A list of controlled entities is contained in Note 19 to the financial statements. In preparing the consolidated financial statements, all inter‐group balances and transactions between entities in the consolidated group have been eliminated on consolidation. Accounting policies of subsidiaries have been changed where necessary to ensure consistency with those adopted by the parent entity. Non‐controlling interests, being the equity in a subsidiary not attributable, directly or indirectly, to a parent, are shown separately within the Equity section of the consolidated Statement of Financial Position and Statement of Comprehensive Income. The non‐controlling interest’s interest in the net assets comprises their interests at the date of the original business combination and their share of changes in equity since that date. d) Business Combinations
The purchase method of accounting is used to account for business combinations regardless of whether equity instruments or other assets are acquired. The cost of a business combination is measured as the fair value of the assets given, shares issued or liabilities incurred or assumed at the date of exchange and the amount of any non‐controlling interest in the acquiree. For each business combination, the acquirer measures the non‐controlling interest in the acquiree either at fair value or at the proportionate share of the acquiree's identifiable net assets. Acquisition‐related costs are expensed as incurred. Where equity instruments are issued in a business combination, the fair value of the instruments is their published market price as at the date of exchange unless, in rare circumstances, it can be demonstrated that the published price at the date of exchange is an unreliable indicator of fair value and that other evidence and valuation methods provide a more reliable measure of fair value. Identifiable assets acquired and liabilities and contingent liabilities assumed in a business combination are measured initially at their fair values at the acquisition date, irrespective of the extent of any non‐controlling interest. The excess of the cost of the business combination over the fair value of the Group’s share of the identifiable net assets acquired is recorded as goodwill. If the cost of acquisition is less than the fair value of the net assets acquired, the difference is recognised directly in the Statement of Comprehensive Income, but only after a reassessment of the identification and measurement of the net assets acquired. If the business combination is achieved in stages, the acquisition date fair value of the acquirer's previously held equity interest in the acquiree is remeasured at fair value as at the acquisition date through profit or loss. Where settlement of any part of cash consideration is deferred, the amounts payable in the future are discounted to their present value as at the date of exchange. The discount rate used is the FOR

NOTES TO THE FINANCIAL STATEMENTS
58 | P a g e
THE YEAR ENDED 30 JUNE 2012 1. SUMMARY OF SIGNIFICANT ACCOUNTING POLICIES (CONTINUED) entity’s incremental borrowing rate, being the rate at which a similar borrowing could be obtained from an independent financier under comparable terms and conditions. e) Income Tax The charge for current income tax expenses is based on the profit for the year adjusted for any non‐assessable or disallowed items. It is calculated using tax rates that have been enacted or are substantively enacted by the balance sheet date. Deferred tax is accounted for using the balance sheet liability method in respect of temporary differences arising between the tax bases of assets and liabilities and their carrying amounts in the financial statements. No deferred income tax will be recognised from the initial recognition of an asset or liability, excluding business combination, where there is no effect on accounting or taxable profit or loss. Deferred tax is calculated at the tax rates that are expected to apply to the period when the asset is realised or liability is settled. Deferred tax is credited in the statement of comprehensive income except where it relates to items that may be credited directly to equity, in which case the deferred tax is adjusted directly against equity. Deferred income tax assets are recognised to the extent that it is probable that future tax profits will be available against which deductible temporary differences can be utilised. The amount of benefits brought to account or which may be realised in the future is based on the assumption that no adverse change will occur in income tax legislation and the anticipation that the economic entity will derive sufficient future assessable income to enable the benefit to be realised and comply with the conditions of deductibility imposed by the law. f) Property, Plant & Equipment Each class of property, plant and equipment is carried at cost or fair value less, where applicable, any accumulated depreciation and impairment losses. Plant and equipment Property, plant and equipment are measured on the cost basis less depreciation and impairment losses. The carrying amount of plant and equipment is reviewed annually by directors to ensure it is not in excess of the recoverable amount from these assets. The recoverable amount is assessed on the basis of the expected net cash flows that will be received from the assets employment and subsequent disposal. The expected net cash flows have been discounted to their present values in determining recoverable amounts. Depreciation The depreciable amount of all Property, Plant and Equipment (other than Leasehold Improvements and certain plant and equipment which are based on the prime cost method) is based on the diminishing value method over their useful lives to the Company commencing from the time the

NOTES TO THE FINANCIAL STATEMENTS
59 | P a g e
FOR THE YEAR ENDED 30 JUNE 2012 1. SUMMARY OF SIGNIFICANT ACCOUNTING POLICIES (CONTINUED) assets are held ready for use. The depreciation rates used for plant and equipment vary between 2.5% and 40%. The assets’ residual values and useful lives are reviewed, and adjusted if appropriate, at each balance sheet date. An asset’s carrying amount is written down immediately to its recoverable amount if the asset’s carrying value is greater than its estimated recoverable amount. Gains and losses on disposals are determined by comparing proceeds with the carrying amount. These gains and losses are included in the statement of comprehensive income. g) Acquisition of Assets The purchase method of accounting is used for all acquisitions of assets regardless of whether shares or other assets are acquired. Cost is determined as the fair value of the assets given up, shares issued or liabilities undertaken at the date of acquisition plus costs incidental to the acquisition. Where shares are issued in an acquisition, the value of the shares is determined having reference to the fair value of the assets or net assets acquired, including goodwill or discount on acquisition where applicable. Where settlement of any part of cash consideration is deferred, the amounts payable in the future are discounted to their present value as at the date of the acquisition. The discount rate used is the rate at which a similar borrowing could be obtained under comparable terms and conditions. h) Exploration and Evaluation Expenditure Exploration, evaluation and development expenditure incurred is accumulated in respect of each identifiable area of interest. These costs are only carried forward to the extent that they are expected to be recouped through the successful development of the area or where activities in the areas have not yet reached a stage that permits reasonable assessment of the existence of economically recoverable reserves. Accumulated costs in relation to an abandoned area are written off in full against profit in the year in which the decision to abandon the area is made. i) Exploration and Evaluation Expenditure (continued) When production commences, the accumulated costs for the relevant area of interest are amortised over the life of the area according to the rate of depletion of the economically recoverable reserves. A regular review is undertaken of each area of interest to determine the appropriateness of continuing to carry forward costs in relation to that area of interest.

NOTES TO THE FINANCIAL STATEMENTS
60 | P a g e
FOR THE YEAR ENDED 30 JUNE 2012 1. SUMMARY OF SIGNIFICANT ACCOUNTING POLICIES (CONTINUED) j) Financial Instruments Recognition Financial instruments are initially measured at cost on trade date, which includes transaction costs, when the related contractual rights or obligations exist. Subsequent to initial recognition these instruments are measured as set out below. Loans and receivables Loans and receivables are non‐derivative financial assets with fixed or determinable payments that are not quoted in an active market and are stated at amortised cost using the effective interest rate method. Financial liabilities Non‐derivative financial liabilities are recognised at amortised cost, comprising original debt less principal payments and amortisation. Fair value Fair value is determined based on current bid prices for all quoted investments. Valuation techniques are applied to determine the fair value for all unlisted securities, including recent arm’s length transactions, reference to similar instruments and option pricing models. Impairment At each reporting date, the group assesses whether there is objective evidence that a financial instrument has been impaired. Impairment losses are recognised in the statement of comprehensive income. k) Impairment of Assets At each reporting date, the group reviews the carrying values of its tangible and intangible assets to determine whether there is any indication that those assets have been impaired. If such an indication exists, the recoverable amount of the asset, being the higher of the asset’s fair value less costs to sell and value in use, is compared to the asset’s carrying value. Any excess of the asset’s carrying value over its recoverable amount is expensed to the statement of comprehensive income. l) Interest in Joint Ventures The economic entity’s share of the assets, liabilities, revenue and expenses of joint venture operations are included in the appropriate items of the consolidated statement of comprehensive income and consolidated statement of financial position. The economic entity’s interest in joint venture entities are brought to account using the equity method of accounting in the consolidated financial statements. The parent entity’s interest in joint venture entities are brought to account using the cost method.

NOTES TO THE FINANCIAL STATEMENTS
61 | P a g e
FOR THE YEAR ENDED 30 JUNE 2012 1. SUMMARY OF SIGNIFICANT ACCOUNTING POLICIES (CONTINUED) m) Functional and Presentation Currency The functional currency of each of the group’s entities is measured using the currency of the primary economic environment in which that entity operates. The consolidated financial statements are presented in Australian dollars which is the parent entity’s functional and presentation currency. n) Foreign Currency Transactions and Balances Foreign currency transactions are translated into functional currency using the exchange rates prevailing at the date of the transaction. Foreign currency monetary items are translated at the year end exchange rate. Non‐monetary items measured at historical costs continue to be carried at the exchange rate at the date of the transaction. Non‐monetary items measured at fair value are reported at the exchange rate at the date when fair values were determined. Exchange differences arising on the translation of monetary items are recognised in the statement of comprehensive income, except where deferred in equity as a qualifying cashflow or net investment hedge. Exchange differences arising on the translation of non‐monetary items are recognised directly in equity to the extent that the gain or loss is directly recognised in equity, otherwise the exchange difference is recognised in the statement of comprehensive income. o) Group Companies The financial results and position of foreign operations whose functional currency is different from the group’s presentation currency are translated as follows:
Assets and Liabilities are translated at year‐end exchange rates prevailing at that reporting date.
Income and expenses are translated at average exchange rates for the period. Exchange rate differences arising on translation of foreign operations are transferred directly to the group’s foreign currency translation reserve in the statement of financial position. These differences are recognised in the statement of comprehensive income in the period in which the operation is disposed. p) Revenue Interest revenue is recognised on a proportional basis taking into account the interest rates applicable to the financial assets. Revenue from the sale of assets is recognised at the date that the contract is entered into. All revenue is stated net of the amount of goods and services tax (GST).

NOTES TO THE FINANCIAL STATEMENTS
62 | P a g e
FOR THE YEAR ENDED 30 JUNE 2012 1. SUMMARY OF SIGNIFICANT ACCOUNTING POLICIES (CONTINUED) q) Employee Benefits Provision is made for the group’s liability for employee benefits arising from services rendered by employees to balance date. Employee benefits that are expected to be settled within one year have been measured at the amounts expected to be paid when the liability is settled, plus related on‐costs. Employee benefits payable later than one year have been measured at the present value of the estimated future cash outflows to be made for those benefits. r) Provisions Provisions are recognised when the group has a legal or constructive obligation, as a result of a past event, for which it is probable that an outflow of economic benefits will result and that outflow can be reliably measured. s) Cash and Cash Equivalents Cash and cash equivalents includes cash on hand, deposits held at call with banks, other short term highly liquid investments with original maturities of three months or less, and bank overdrafts. Bank overdrafts are shown within short term borrowings in current liabilities on the statement of financial position. t) Goods and Services Tax (GST) Revenues, expenses and assets are recognised net of the amount of GST, except where the amount of GST is not recoverable from the Australian Taxation Office. In these circumstances the GST is recognised as part of the cost of acquisition of the asset or as part of an item of the expense. Receivables and payables in the statement of financial position are shown inclusive of GST. Cash flows are presented in the statement of cash flows on a gross basis, except for the GST component of investing and financing activities, which are disclosed as operating cash flows. u) Share Based Payment Transactions The group provides benefits to the directors and senior executives in the form of share‐based payment transactions, whereby services are rendered in exchange for shares or rights over shares (‘equity settled transactions’). The cost of these equity settled transactions with directors is measured by reference to the fair value at the date at which they are granted. The fair value is determined by an external valuer using the Black‐ Scholes model. In valuing equity‐settled transactions, no account is taken of any performance conditions, other than conditions linked to the price of the shares of Sihayo Gold Limited. The cost of equity‐settled transactions is recognised, together with a corresponding increase in equity, over the period in which the market conditions are fulfilled.

NOTES TO THE FINANCIAL STATEMENTS
63 | P a g e
FOR THE YEAR ENDED 30 JUNE 2012 1. SUMMARY OF SIGNIFICANT ACCOUNTING POLICIES (CONTINUED) The cumulative expense recognised for equity‐settled transactions at each reporting date until vesting date reflects (i) the extent to which the vesting period has expired and (ii) the number of awards that in the opinion of the directors will ultimately vest. The opinion is formed on the best available information at balance date. No adjustment is made for the likelihood of market performance conditions being met as the effect of these conditions is included in the determination of fair value at grant date. No expense is recognised for awards that do not ultimately vest, except for awards where vesting is conditional upon market condition. Where the terms of an equity‐settled award are modified, as a minimum an expense is recognised as if the terms had not been modified. In addition, an expense is recognised for any increase in the value of the transaction as a result of the modification, as measured at the date of modification. v) Share Based Payment Transactions (continued) Where an equity‐settled award is cancelled, it is treated as if it had vested on the date of cancellation, and any expense not yet recognised for the award is recognised immediately. However, if a new award is substituted for the cancelled award, and designated as a replacement award on the date that it is granted, the cancelled and new award are treated as if they were a modification of the original award, as described in the previous paragraph. The dilutive effect, if any, of outstanding options is reflected as additional share dilution in the computation of earnings per share. w) Trade and Other Receivables CURRENT All trade debtors are recognised at the amounts receivable as they are due for settlement no more than 30 days from the date of recognition. Collectability of trade debtors is reviewed on an ongoing basis. Debts which are known to be uncollectible are written off. A provision for doubtful debts is raised when some doubt as to collection exists and in any event when the debt is more than 60 days overdue. NON‐CURRENT All debtors that are not expected to be received within 12 months of reporting date are included in non‐current receivables. Collectability of non‐current receivables is reviewed on an ongoing basis. Debts which are known to be uncollectible are written off. A provision for doubtful debts is raised when some doubt as to collection exists. x) Trade and Other Creditors These amounts represent liabilities for goods and services provided to the consolidated entity prior to the end of the financial year and which are unpaid. The amounts are unsecured and are usually paid within 30 days of recognition.

NOTES TO THE FINANCIAL STATEMENTS
64 | P a g e
FOR THE YEAR ENDED 30 JUNE 2012 1. SUMMARY OF SIGNIFICANT ACCOUNTING POLICIES (CONTINUED) y) Operating Leases Operating lease payments are charged to the Statement of comprehensive income in the periods in which they are incurred, as this represents the pattern of benefits derived from the leased assets. z) Significant Accounting Judgements, Estimates and Assumptions Significant accounting judgements In the process of applying the Group’s accounting policies, management has made the following judgements, apart from those involving estimations, which have the most significant effect on the amounts recognised in the financial statements: Exploration and evaluation assets The Group’s accounting policy for exploration and evaluation expenditure is set out above. The application of this policy necessarily requires management to make certain estimates and assumptions as to future events and circumstances, in particular, the assessment of whether economic quantities of reserves are found. Any such estimates and assumptions may change as new information becomes available. Significant accounting estimates and assumptions The carrying amounts of certain assets and liabilities are often determined based on estimates and assumptions of future events. The key estimates and assumptions that have a significant risk of causing a material adjustment to the carrying amounts of certain assets and liabilities within the next annual reporting period are: Recovery of deferred assets Deferred tax assets are recognised for deductible temporary differences when management considers that it is probable that future taxable profits will be available to utilise those temporary differences. Share‐based payment transactions The Group measures the cost of equity‐settled transactions with employees by reference to the fair value of the equity instruments at the date at which they are granted. The Group measures the cost of cash‐settled share‐based payments at fair value at the grant date using the Black‐Scholes model taking into account the terms and conditions upon which the instruments were granted. y) Segment Reporting The Group determines and presents operating segments based on the information that internally is provided to the Managing Director, who is the Group’s chief operating decision maker. An operating segment is a component of the Group that engages in business activities from which it may earn revenues and incur expenses, including revenues and expenses that relate to transactions with any of the Group’s other components. All operating segments’ operating results are regularly reviewed by the Managing Director to make decisions about resources to be allocated to the segment and assess its performance.

NOTES TO THE FINANCIAL STATEMENTS
65 | P a g e
FOR THE YEAR ENDED 30 JUNE 2012 1. SUMMARY OF SIGNIFICANT ACCOUNTING POLICIES (CONTINUED) Unless stated otherwise, all amounts reported to the Board of Directors as the chief decision maker with respect to operating segments are determined in accordance with accounting policies that are consistent to those adopted in the annual financial statements of the Group. Intersegment loans payable and receivable are initially recognised at the consideration received net of transaction costs. If intersegment loans receivable and payable are not on commercial terms, these are not adjusted to fair value on market interest rates. z) Comparative Figures When required by Accounting Standards, comparative figures have been adjusted to conform to changes in presentation for the current financial year. 2. RISK MANAGEMENT (a) Interest rate risk The Consolidated Entity and the Company’s exposure to interest rate risk, is the risk that a financial instrument’s value will fluctuate as a result of changes in market interest rates and the effective weighted average interest rate on classes of financial assets and liabilities. The Consolidated Entity and the Company do not have a major exposure in this area as the interest rate earned on deposited funds does not vary greatly from month to month.
Consolidated Entity 2012
Fixed interest rate maturing in
Floating Interest
Rate
$
1 year or less
$
1 to 5 years
$
More than 5 years
$
Non interest bearing
$
Total carrying
amount at balance sheet
$
Applicable interest
rate on 30 June
%
Cash and cash equivalents 11,086,373 ‐ ‐ ‐ ‐
11,086,373
3.00%
Trade and other receivables ‐ ‐ ‐ ‐ 2,569,684
2,569,684
‐
Other financial assets ‐ ‐ ‐ ‐ 16,950
16,950
‐
Deposits ‐ 43,863 5,050 ‐ ‐ 48,913 5.00%
Total Financial Assets 11,086,373 43,863 5,050 ‐ 2,586,634
13,721,920
Trade and other payables ‐ ‐ ‐ ‐ 409,127
409,127
Other ‐ ‐ ‐ ‐ 23,605 23,605
Total Financial Liabilities ‐ ‐ ‐ ‐ 432,732
432,732

NOTES TO THE FINANCIAL STATEMENTS
66 | P a g e
FOR THE YEAR ENDED 30 JUNE 2012 2. RISK MANAGEMENT (CONTINUED) Consolidated Entity 2011
Fixed interest rate maturing in
Floating Interest
Rate
$
1 year or less
$
1 to 5 years
$
More than 5 years
$
Non interest bearing
$
Total carrying
amount at balance sheet
$
Applicable interest
rate on 30 June
%
Financial Assets Cash and cash equivalents 13,176,949 ‐ ‐ ‐ ‐ 13,176,949 5.43% Trade and other receivables ‐ ‐ ‐ ‐ 1,319,844 1,319,844 ‐ Other financial assets ‐ ‐ ‐ ‐ 16,950 16,950 ‐ Deposits ‐ 43,863 11,544 ‐ ‐ 55,407 6.00%
Total Financial Assets 13,176,949 43,863 11,544 ‐ 1,336,794 14,569,150
Financial Liabilities
Trade and other payables ‐ ‐ ‐ ‐ 1,076,634 1,076,634 ‐ Other ‐ ‐ ‐ ‐ 23,605 23,605 ‐
Total Financial Liabilities ‐ ‐ ‐ ‐ 1,100,239 1,100,239
(b) Credit risk exposures The Consolidated Entity and the Company has no significant concentrations of credit risk. The maximum exposure to credit risk at balance date is the carrying amount (net of provision of doubtful debts) of those assets as disclosed in the statement of financial position and note 23. As the Consolidated Entity and Company does not presently have any debtors arising from sales, lending, significant stock levels or any other credit risk, a formal credit risk management policy is not maintained. (c) Foreign currency risk management The Consolidated Entity and the Company is exposed to fluctuations in foreign currencies arising from costs incurred at overseas mineral exploration tenements. To mitigate this risk the Company holds cash in the currency in which it forecasts the costs will be incurred.

NOTES TO THE FINANCIAL STATEMENTS
67 | P a g e
FOR THE YEAR ENDED 30 JUNE 2012 2. RISK MANAGEMENT (CONTINUED) (d) Liquidity risk Liquidity risk is the risk that the Consolidated Entity and the Company will not be able to meet its financial obligations as they fall due. Financial obligations of the Consolidated Entity and the Company consist of trade creditors and other payables. The Company has not conducted a sensitivity analysis on credit or interest rate risk as the amounts are not considered significant. (e) Financial risk management
2012 Level 1 $
Level 2 $
Level 3 $
Total$
Financial assets ‐ ‐ ‐ ‐
Shares in listed companies
16,950 ‐ ‐ 16,950
16,950 16,950
2011
Financial assets ‐ ‐ ‐ ‐
Shares in listed companies
16,950 ‐ ‐ 16,950
16,950 16,950
Included within Level 1 of the hierarchy are listed investments. The fair values of these financial assets and liabilities have been based on the closing quoted prices at reporting date, excluding transaction costs. In valuing unlisted investments – included in Level 2 of the hierarchy – valuation techniques such as those using comparisons to similar investments for which market observable prices are available have been adopted to determine the fair values of these investments. Derivative instruments are included in Level 2 of the hierarchy with the fair values determined using valuation techniques incorporating observable market data relevant to the hedged position.

NOTES TO THE FINANCIAL STATEMENTS
68 | P a g e
FOR THE YEAR ENDED 30 JUNE 2012 Consolidated 2012 2011 $ $
3. REVENUE
Revenue from outside the operating activities Interest 104,490 136,392
Revenue from ordinary activities
104,490
136,392
3(a) LOSS BEFORE INCOME TAX Net Expenses The loss before income tax includes the following expenses: (i) Expenses:
Exploration expenditure (administrative) ‐ 2,856,832Exploration expenditure ‐ 1,196,081Depreciation 185,893 128,103Rental expenses 69,777 67,363
255,670 4,248,379
(ii) Numerical reconciliation of income tax expense to prima facie tax payable:
Loss from ordinary activities before income tax expense
(9,711,061)
(11,141,054)
3(b) INCOME TAX EXPENSE (i) Prima facie tax benefit on loss from ordinary activities: (2,913,318) (3,342,316) Tax effect of amounts which are not deductible (taxable) In calculating taxable income:
Provisions 29,665 23,808Share based payment ‐ 385,718Other non deductible expenses 2,242 ‐Outside equity interest 12,920 164,467Mineral exploration ‐ 1,215,874
(2,868,491) (1,552,449)

NOTES TO THE FINANCIAL STATEMENTS
69 | P a g e
FOR THE YEAR ENDED 30 JUNE 2012 3(b) INCOME TAX EXPENSE (CONTINUED) Consolidated 2012 2011 $ $
Movement in unrecognised temporary Difference
2,805,649
(106,205)
Tax effect of current year tax losses for which no deferred tax asset has been recognised
62,842
1,658,654
Income tax expense ‐ ‐
(ii) Unrecognised temporary differences Deferred Tax Assets (at 30%) Carried forward revenue tax losses 5,293,352 5,108,291Carried forward capital tax losses 910,419 932,111Carried forward foreign tax losses 2,010,662 1,974,703Mineral exploration (@ 20%) 5,523,180 4,631,869Provisions 29,665 23,808Black hole expenditure 249,415 264,448
14,016,693 12,935,230
This benefit for tax losses will only be obtained if: (i) the consolidated entity derives future assessable income of a nature and of an amount
sufficient to enable the benefit from the deductions for the losses to be realised, or (ii) the losses are transferred to an eligible entity in the consolidated entity, and (iii) the consolidated entity continues to comply with the conditions for deductibility imposed by
tax legislation, and (iv) no changes in tax legislation adversely affect the consolidated entity in realising the benefit
from the deductions for the losses.

NOTES TO THE FINANCIAL STATEMENTS
70 | P a g e
FOR THE YEAR ENDED 30 JUNE 2012 Consolidated 4. TRADE AND OTHER RECEIVABLES
2012 $
2011$
CURRENT Other debtors 2,569,684 1,319,844
2,569,684 1,319,844
Other debtors These amounts generally arise from transactions outside the usual operating activities of the consolidated entity and are non‐interest bearing. The other debtors do not contain any impaired receivables. 5. OTHER FINANCIAL ASSETS CURRENT Investments listed on a prescribed stock exchange and unlisted public companies
16,950
16,950
NON CURRENT Investments in other entities at cost 697,537 852,197 Less Provision for Diminution (697,537) (852,197)
‐ ‐
Shares in controlled entities The carrying value of the investments in controlled entities is dependent upon the successful development and exploitation of the controlled entities’ tenements, or alternatively the sale of those tenements for at least carrying value. Investments in other entities Investments in other entities include the following:
10% interest in B Vijaykumar Technical Services Pvt Limited, a company involved in diamond exploration in India, with an option to purchase a further 10% interest. As Oropa Indian Resources Pty Ltd, Sihayo Gold Limited’s wholly owned subsidiary, no longer has significant influence over B Vijaykumar Technical Services Pvt Limited, the investment has been transferred to other investments from investment in associates. This investment has been fully provided for.

NOTES TO THE FINANCIAL STATEMENTS
71 | P a g e
FOR THE YEAR ENDED 30 JUNE 2012 Consolidated 2012 2011 $ $
6. PROPERTY, PLANT AND EQUIPMENT NON‐CURRENT Land at Cost 51,002 39,195
Lease improvements at cost 14,279 14,279 Less: accumulated depreciation (8,372) (8,183)
5,907 6,096
Plant and equipment, at cost 250,987 167,489 Less: accumulated depreciation (43,657) (39,130)
207,330 128,359
Motor vehicles, at cost 230,397 267,306 Less: accumulated depreciation (75,868) (60,177)
154,529 207,129
Office equipment, at cost 486,233 457,273 Less: accumulated depreciation (71,946) (145,518)
414,287 311,755
Total property, plant and equipment 833,055 692,534

NOTES TO THE FINANCIAL STATEMENTS
72 | P a g e
FOR THE YEAR ENDED 30 JUNE 2012 6. PROPERTY, PLANT AND EQUIPMENT (CONTINUED) Reconciliations Reconciliations of the carrying amounts of each class of property, plant and equipment at the beginning and end of the current financial year are set out below: 2012 Consolidated
Land at Cost
$
Leasehold Improve.
$
Plant & Equipment
$
Motor Vehicles
$
OfficeEquipment
$
Total
$ Carrying amount at 1 July 2011
39,195 6,096 128,359 207,129 311,755 692,534
Effect of foreign currency translation
1,075 ‐ 11,157 2,117 15,782 30,131
Additions 10,732 ‐ 111,470 21,151 158,696 302,049 Write‐offs & reclassification
‐ ‐ ‐ ‐ (5,766) (5,766)
Depreciation expense ‐ (189) (43,656) (75,868) (66,180) (185,893)
Carrying amount at 30 June 2012
51,002 5,907 207,330 154,529 414,287 833,055
2011 Consolidated
Land at Cost
$
Leasehold Improve.
$
Plant & Equipment
$
Motor Vehicles
$
OfficeEquipment
$
Total
$ Carrying amount at 1 July 2010
‐ 5,250 71,759 86,443 115,194 278,646
Effect of foreign currency translation
‐ ‐ (12,968)
(15,337)
(14,671)
(42,976)
Additions 39,195 1,550 157,323 170,397 269,641 638,106 Write‐offs & reclassification ‐ ‐ (54,765) ‐ (5,803) (60,568) Depreciation expense ‐ (704) (32,990) (34,374) (52,606) (120,674)
Carrying amount at 30 June 2011
39,195 6,096 128,359
207,129
311,755
692,534

NOTES TO THE FINANCIAL STATEMENTS
73 | P a g e
FOR THE YEAR ENDED 30 JUNE 2012 Consolidated 2012 2011 $ $
7a. OTHER ASSETS NON CURRENT Deposits 5,050 11,544Capitalised mineral exploration costs 15,637,345 9,256,300
15,642,395 9,267,844 Deposits Deposits of $5,050 include a phone deposit for building of USD $2,297 (2011: USD $11,544). Mining Exploration and Evaluation Expenditure Expenditure incurred during the year 6,381,045 13,309,213Expenditure written off during the year ‐ (4,052,913)
6,381,045 9,256,300
Some of the Company’s exploration properties are subject to claim(s) under native title. As a result, exploration properties or areas within the tenements may be subject to exploration and/or mining restrictions. Recoverability of capitalised costs The value of the group’s interest in exploration expenditure is dependent upon:
the continuance of the group’s rights to tenure of the areas of interest; the results of future exploration; and the recoupment of costs through successful development and exploitation of the areas of
interest, or alternatively, by their sale.
7b. Inventory Consolidated
2012 2011 $ $ Diesel 31,496 ‐

NOTES TO THE FINANCIAL STATEMENTS
74 | P a g e
FOR THE YEAR ENDED 30 JUNE 2012 Consolidated 8. TRADE AND OTHER PAYABLES 2012
$ 2011
$
CURRENT Other creditors 409,127 1,076,634 Related party payables (API’s) 655,226 537,625 Accruals 179,008 2,738
1,243,361 1,616,997
9. PROVISIONS CURRENT Employee Entitlements
86,166 417,674
Taxation 8,722 120,713
94,888 538,387
NON CURRENT Employee Entitlements – long service leave 11,962 6,188 Employee Entitlements 504,236 ‐
516,198 6,188 Employee Numbers Average number of employees during the financial year 243 131
10. CONTRIBUTED EQUITY
Consolidated
Issued Capital 2012$
2011 $
Fully paid – ordinary shares 799,377,748 (2011 – 693,986,646) 90,500,944 76,374,517
‐
90,500,944 76,374,517

NOTES TO THE FINANCIAL STATEMENTS
75 | P a g e
FOR THE YEAR ENDED 30 JUNE 2012 10. CONTRIBUTED EQUITY (CONTINUED) Movements in ordinary share capital of the Company during the past 2 years were as follows: Number $ 01/07/2010 Opening balance 513,067,808 47,698,556 06/08/2010 Share issue 15,380,000 2,153,20009/08/2010 Conversion of Options 1,000,000 50,00015/09/2010 Share issue 23,070,000 3,229,80017/09/2010 Conversion of Options 1,500,000 75,00017/09/2010 Conversion of Options 3,000,000 150,00015/10/2010 Conversion of Options 240,385 12,01926/10/2010 Share issue 38,450,000 5,383,00001/11/2010 Conversion of Options 1,240,385 62,01901/11/2010 Conversion of Options 3,750,000 187,50012/01/2011 Conversion of Options 307,692 15,38507/02/2011 Conversion of Options 11,617,886 2,323,57707/02/2011 Conversion of Options 200,000 30,00008/02/2011 Conversion of Options 1,662,490 332,49825/02/2011 Conversion of Options 700,000 105,00005/04/2011 Conversion of Options 800,000 120,00015/04/2011 Conversion of Options 1,500,000 202,50015/04/2011 Conversion of Options 1,500,000 225,00028/04/2011 Conversion of Options 75,000,000 15,000,000 Share issue costs ‐ (980,537)
Balance at 30 June 2011 693,986,646 76,374,517
02/08/2011 Conversion of Options 300,000 15,000
15/08/2011 Conversion of Options
9,424,500
471,225 11/04/2012 Conversion of Options 1,500,000 150,000
26/04/2012 Shares issue
42,490,358
6,387,746 26/04/2012 Share issue 44,176,244 6,641,192 23/05/2012 Conversion of Options 2,000,000 150,000
23/05/2012 Conversion of Options
2,000,000
200,000
29/05/2012 Conversion of Options
1,500,000
150,000 29/06/2012 Conversion of Options 2,000,000 200,000 Share issue costs (238,736)
Balance at 30 June 2012 799,377,748 90,500,944

NOTES TO THE FINANCIAL STATEMENTS
76 | P a g e
FOR THE YEAR ENDED 30 JUNE 2012 10. CONTRIBUTED EQUITY (CONTINUED) Ordinary shares Ordinary shares entitle the holder to participate in dividends and the proceeds on winding up of the Company in proportion to the number of and amounts paid on the shares held. On a show of hands every holder of ordinary shares present at a meeting in person or by proxy, is entitled to one vote, and upon a poll each share is entitled to one vote.
Consolidated 2012 2011 $ $
11. RESERVES AND ACCUMULATED LOSSES (a) Option Premium Reserve Balance at the beginning of the financial year 2,230,347 1,041,408Options issued during the year ‐ 1,285,729Options exercised during the year ‐ (96,700)
Balance at the end of the financial year 2,230,437 2,230,437
The Option Premium Reserve is used to record the value of options issued during the year under the Black‐Scholes method. When options are exercised the credit is transferred to share capital.
Options As at 30 June 2012 the Company had the following options on issue:
6,800,000 director unlisted options exercisable at 15 cents before the expiry date of 31 May 2013.
2,000,000 director unlisted options exercisable at 12.5 cents at any time on or before 30 June 2013.
3,000,000 employee unlisted options exercisable at 25 cents at any time on or before 31 December 2012.
All options, except for unlisted options, are quoted on the Australian Securities Exchange Limited.
Options lapsed during the year:
1,346,154 unlisted options exercisable at 5 cents lapsed on 31 August 2011.

NOTES TO THE FINANCIAL STATEMENTS
77 | P a g e
FOR THE YEAR ENDED 30 JUNE 2012 Consolidated 2012 2011 $ $
11. RESERVES AND ACCUMULATED LOSSES (CONTINUED) (b) Foreign Currency Reserve Balance at the beginning of the financial year 3,481,702 1,438,080 Movement for the year 1,598,628 2,043,622
5,080,330 3,481,702
(c) Accumulated Losses Balance at the beginning of the financial year
(60,433,443)
(49,292,389)
Net losses attributable to members of Sihayo Gold Limited
(9,711,061)
(11,141,054)
(70,144,504) (60,433,443)
12. PARENT ENTITY DISCLOSURE NOTE Parent 2012 2011FINANCIAL POSITION $ $
Assets Current assets 10,811,296 11,123,880Non‐current assets 151,423 161,989
Total assets 10,962,719 11,285,869
Liabilities Current liabilities 280,944 102,799Non‐current liabilities 11,962 6,188
Total liabilities 292,906 108,987
Net Assets 10,669,813 11,176,882

NOTES TO THE FINANCIAL STATEMENTS
78 | P a g e
FOR THE YEAR ENDED 30 JUNE 2012 12. PARENT ENTITY DISCLOSURE NOTE (CONTINUED) 2012 2011Equity $ $
Issued capital 90,500,946 76,374,517Retained earnings (82,158,270) (67,524,774) Reserves Option premium reserve 2,327,137 2,327,137Equity reserve ‐ ‐
Total Equity 10,669,813 11,176,880 FINANCIAL PERFORMANCE
Loss for the year 14,633,496 19,984,184Other comprehensive income ‐ ‐
Total comprehensive income 14,633,496 19,984,184
The parent entity did not enter into any guarantees in relation to the debts of its subsidiaries for 2011 or 2012.
The parent entity did not have any contingent liabilities for 2011 or 2012. The parent entity did not enter into any commitments for the acquisition of property, plant and equipment for 2011 or 2012.
13. SHARE BASED PAYMENT PLAN Share‐based payment plan The following table illustrates the number (No.) and weighted average exercise price (WAEP) of and movements in share options issued during the year:
2012No
2012WAEPCents
2011 No
2011WAEPCents
Outstanding at the beginning of the year 17,800,000 14.44 15,500,000 11.45 Granted during the year 10,000,000 16.28 Forfeited during the year ‐ ‐ ‐ ‐ Exercised during the year (4,653,846) ‐7.00 (7,700,000) ‐10.81 Expired during the year (1,346,154) ‐5.00 ‐ ‐
Outstanding at the end of the year
11,800,000 17.12
17,800,000
14.44

NOTES TO THE FINANCIAL STATEMENTS
79 | P a g e
FOR THE YEAR ENDED 30 JUNE 2012 13. SHARE BASED PAYMENT PLAN (CONTINUED) The outstanding balance as at 30 June 2012 is represented by:
6,800,000 unlisted director options exercisable at 15 cents at any time on or before 31 May 2013.
3,000,000 unlisted employee options exercisable at 25 cents at any time on or before 31 December 2012.
2,000,000 unlisted director options exercisable at 12.5 cents at any time on or before 30 June 2013.
The following table lists the inputs to the model used for the year ended 30 June 2012.
2012 2011 2010
Dividend yield (%) ‐ ‐ ‐
Expected volatility (%) ‐ 133.8 50
Risk‐free interest rate (%) ‐ 4.5 4
Expected life of options (years) ‐ 2.21 3.32
Option exercise price ($) ‐ 0.137 0.10
Weighted average share price at grant date ($)
‐ 0.138 0.06
The expected life of the options is based on historical data and is not necessarily indicative of exercise patterns that may occur. The expected volatility reflects the assumption that the historical volatility is indicative of future trends, which may also not necessarily be the actual outcome. No other features of options were incorporated into the measurement of fair value. The fair value of the cash‐settled options is measured at the grant date using the Black‐Scholes options pricing model taking into account the terms and conditions upon which the instruments were granted. The services received and a liability to pay for those services are recognised over the expected vesting period. Until the liability is settled, it is remeasured at each reporting date with changes in fair value recognised in profit or loss.

NOTES TO THE FINANCIAL STATEMENTS
80 | P a g e
FOR THE YEAR ENDED 30 JUNE 2012 14. KEY MANAGEMENT PERSONNEL DISCLOSURE Names and Positions held of parent entity key management personnel in office at any time during the financial year are: Key Management Personnel Misha Collins Non Executive Director Paul Willis Executive Director & CEO Gavin Caudle Non Executive Director Peter Bilbe Non Executive Chairman William John Blake Non Executive Director Greg Entwistle Chief of Operations Officer Graham Petersen Head Geologist (resigned on 19 December 2011) Darin Rowley Senior Geologist Daniel Nolan Company Secretary (appointed on 1 July 2011) There are no executives (other than those listed above) with authority for strategic decision and management
(a) Compensation for Key Management Personnel Consolidated 2012 2011 $ $
Short‐term employee benefits 1,390,265 1,205,640Non monetary benefit 11,150 11,100Post employment benefits 25,460 21,049Share based payments ‐ 1,285,729
1,426,875 2,523,518

NOTES TO THE FINANCIAL STATEMENTS
81 | P a g e
FOR THE YEAR ENDED 30 JUNE 2012 14. KEY MANAGEMENT PERSONNEL DISCLOSURE (CONTINUED)
(b) Option holdings of key management personnel (consolidated) The number of options over ordinary shares in the Company held during the financial year by each director of Sihayo Gold Limited, including their personally‐related entities, are set out below.
Vested at 30 June 2012 30 June 2012 Balance at
beginning of period 1 July 11
Granted as remuneration
Options exercised
Net change other
Balance at end of period 30 June 12
Total Exercisable
M Collins 1,000,000 ‐ ‐ ‐ 1,000,000 1,000,000 1,000,000 P Willis 4,000,000 ‐ ‐ (2,000,000) 2,000,000 2,000,000 2,000,000 P Bilbe 1,500,000 ‐ (1,500,000) ‐ ‐ ‐ ‐ WJ Blake 1,500,000 ‐ (1,500,000) ‐ ‐ ‐ ‐ G Caudle ‐ ‐ ‐ ‐ ‐ ‐ ‐ G Entwistle 4,000,000 ‐ (4,000,000) ‐ ‐ ‐ ‐ D Rowley 2,000,000 ‐ ‐ ‐ 2,000,000 2,000,000 2,000,000 D Nolan 1,000,000 ‐ ‐ ‐ 1,000,000 1,000,000 1,000,000
Vested at 30 June 2011 30 June 2011 Balance at
beginning of period 1 July 10
Granted as remuneration
Options exercised
Net change other
Balance at end of period 30 June 11
Total Exercisable
M Collins 1,000,000 ‐ ‐ ‐ 1,000,000 1,000,000 1,000,000P Willis ‐ 4,000,000 ‐ ‐ 4,000,000 4,000,000 4,000,000P Bilbe ‐ 1,500,000 ‐ ‐ 1,500,000 1,500,000 1,500,000WJ Blake ‐ 1,500,000 ‐ ‐ 1,500,000 1,500,000 1,500,000G Caudle ‐ ‐ ‐ ‐ ‐ ‐ ‐G Entwistle 4,000,000 ‐ ‐ ‐ 4,000,000 4,000,000 4,000,000G Petersen ‐ 3,000,000 (3,000,000) ‐ ‐ ‐ ‐D Rowley ‐ ‐ ‐ 2,000,000 2,000,000 2,000,000 2,000,000D Nolan ‐ ‐ ‐ 1,000,000 1,000,000 1,000,000 1,000,000

NOTES TO THE FINANCIAL STATEMENTS
82 | P a g e
FOR THE YEAR ENDED 30 JUNE 2012 14. KEY MANAGEMENT PERSONNEL DISCLOSURE (CONTINUED) (c) Shareholdings of key management personnel (consolidated) The number of shares held in the Company during the financial year by each director of Sihayo Gold Limited, including their personally‐related entities, are set out below:
Balance 1 July 11
Granted as remuneration
On exercise of options
Net change other
Directors balances as at date of resigning/ terminated
Balance 30 June 12
30 June 2012
Ord Pref Ord Pref Ord Pref Ord Pref Ord Ord
M Collins 14,529,574 ‐ ‐ ‐ ‐ ‐ ‐ ‐ ‐ 14,529,574P Bilbe 420,000 ‐ ‐ ‐ 1,500,000 ‐ ‐ ‐ ‐ 1,920,000WJ Blake ‐ ‐ ‐ ‐ 1,500,000 ‐ ‐ ‐ ‐ 1,500,000G Caudle 124,850,490 ‐ ‐ ‐ ‐ ‐ 31,613,984 ‐ ‐ 156,464,474P Willis 54,221,409 ‐ ‐ ‐ ‐ ‐ ‐ ‐ ‐ 54,221,409G Petersen 3,000,000 ‐ ‐ ‐ ‐ ‐ ‐ ‐ ‐ 3,000,000G Entwistle ‐ ‐ ‐ ‐ 4,000,000 ‐ ‐ ‐ ‐ 4,000,000
Balance
1 July 10 Granted as
remuneration On
exercise of options
Net change other
Directors balances as at date of resigning/ terminated
Balance 30 June 11
30 June 2011 Ord Pref Ord Pref Ord Pref Ord Pref Ord Ord
M Collins 17,529,574 ‐ ‐ ‐ ‐ ‐ (3,000,000) ‐ ‐ 14,529,574P Willis 46,221,409 ‐ ‐ ‐ ‐ ‐ 8,000,000 ‐ ‐ 54,221,409P Bilbe 420,000 ‐ ‐ ‐ ‐ ‐ ‐ ‐ ‐ 420,000WJ Blake ‐ ‐ ‐ ‐ ‐ ‐ ‐ ‐ ‐ ‐G Caudle 75,690,000 ‐ ‐ ‐ ‐ ‐ 49,160,490 ‐ ‐ 124,850,490G Petersen ‐ ‐ ‐ ‐ 3,000,000 ‐ ‐ ‐ ‐ 3,000,000
Consolidated
2012 2011 $ $
15. REMUNERATION OF AUDITORS Remuneration for audit or review of the financial reports of the parent entity or any entity in the consolidated entity
Stantons International 40,559 42,572Other 27,643 13,133
68,202 55,705

NOTES TO THE FINANCIAL STATEMENTS
83 | P a g e
FOR THE YEAR ENDED 30 JUNE 2012 16. CONTINGENT ASSETS AND LIABILITIES The only contingent asset the parent and consolidated entity have is 1,000,000 options exercisable at 20 cents in the company Southern Cross Goldfields Limited. These options only vest upon the company discovering a minimum of 250,000 ounces of gold or 5,000 tonnes of nickel in the situ in the Golden Valley Tenements. 17. RELATED PARTIES Directors and specified executives Disclosures relating to directors and specified executives are set out in the director’s report and as detailed in Note 14. Wholly owned Group The wholly‐owned group consists of Sihayo Gold Limited and its wholly‐owned subsidiaries Inland Goldmines Pty Limited, Excelsior Resources Pty Limited, Oropa Technologies Pty Limited, Oropa Indian Resources Pty Limited and Oropa Exploration Pty Limited. Sihayo Gold Limited owns 100% of the shares in Aberfoyle Pungkut Investments Pte Ltd (API). API holds a 75% interest in PT Sorikmas Mining, with the Indonesian Government mining company, P.T. Aneka Tambang holding the remaining 25%. Transactions between Sihayo Gold Limited and related parties in the wholly‐owned group during the year ended 30 June 2012 consisted of loans on an interest free basis with no fixed term and no specific repayment arrangements. Sihayo Gold Limited made an additional provision for doubtful debts of $15,395,415 in its accounts for the year ended 30 June 2012 (2011 ‐ $12,391,669) in relation to the loans made to its subsidiaries. No other amounts were included in the determination of operating loss before tax of the parent entity that resulted from transactions with related parties in the group. Other related parties Aggregate amounts receivable from related parties in the wholly owned group at balance date were as follows:
Parent Entity 2012 2011 $ $ Non‐current receivables 49,608,795 34,213,380Provision for doubtful debts (49,608,795) (34,213,380)
‐ ‐
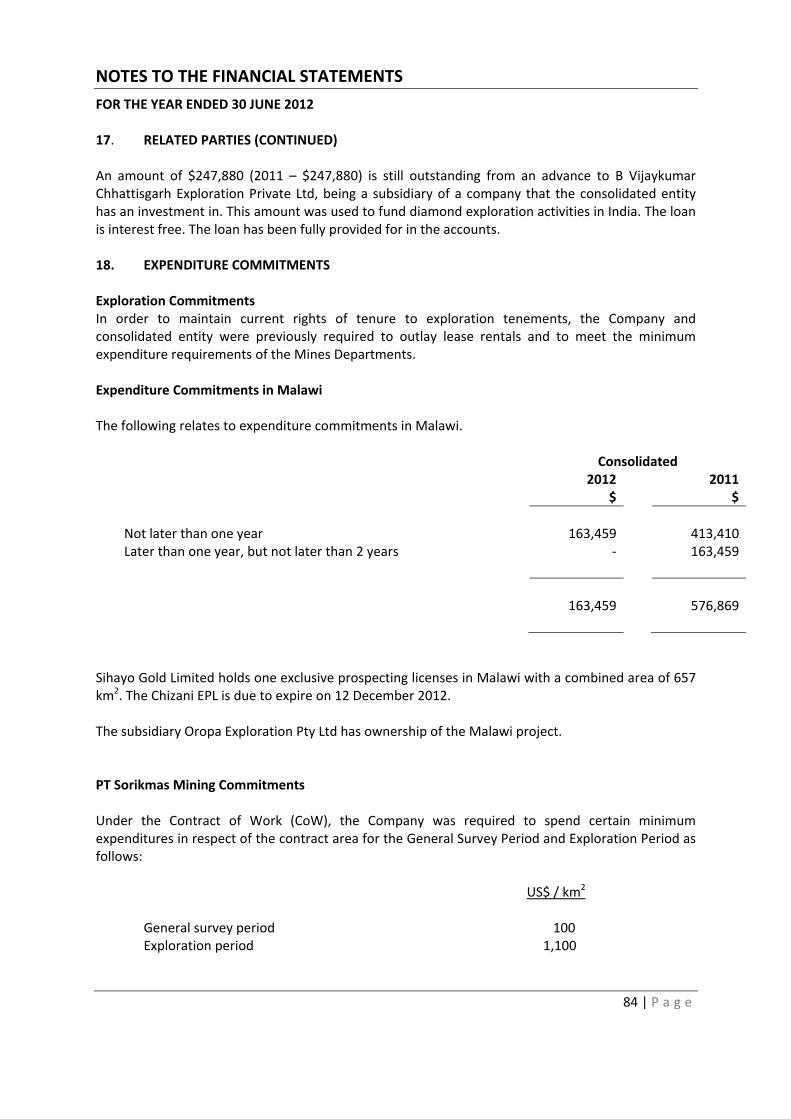
NOTES TO THE FINANCIAL STATEMENTS
84 | P a g e
FOR THE YEAR ENDED 30 JUNE 2012 17. RELATED PARTIES (CONTINUED) An amount of $247,880 (2011 – $247,880) is still outstanding from an advance to B Vijaykumar Chhattisgarh Exploration Private Ltd, being a subsidiary of a company that the consolidated entity has an investment in. This amount was used to fund diamond exploration activities in India. The loan is interest free. The loan has been fully provided for in the accounts. 18. EXPENDITURE COMMITMENTS Exploration Commitments In order to maintain current rights of tenure to exploration tenements, the Company and consolidated entity were previously required to outlay lease rentals and to meet the minimum expenditure requirements of the Mines Departments. Expenditure Commitments in Malawi The following relates to expenditure commitments in Malawi.
Consolidated 2012 2011 $ $
Not later than one year 163,459 413,410Later than one year, but not later than 2 years ‐ 163,459
163,459 576,869
Sihayo Gold Limited holds one exclusive prospecting licenses in Malawi with a combined area of 657 km2. The Chizani EPL is due to expire on 12 December 2012. The subsidiary Oropa Exploration Pty Ltd has ownership of the Malawi project. PT Sorikmas Mining Commitments Under the Contract of Work (CoW), the Company was required to spend certain minimum expenditures in respect of the contract area for the General Survey Period and Exploration Period as follows: US$ / km2 General survey period 100 Exploration period 1,100

NOTES TO THE FINANCIAL STATEMENTS
85 | P a g e
FOR THE YEAR ENDED 30 JUNE 2012 18. EXPENDITURE COMMITMENTS (CONTINUED) As at 30 June 2012, PT Sorikmas Mining had fulfilled its expenditure commitments in respect of the General Survey Period and Exploration Period. Operating Leases – Rent Commitments for minimum lease payments in relation to non cancellable operating leases are payable as follows:
Consolidated 2012 2011 $ $
Not later than one year 73,558 67,900Later than one year, but not later than 2 years ‐ 73,558Later than two years but not more than 3 years ‐ ‐
73,558 141,458
Sihayo Gold Limited has entered into a new three year lease for 25 Charles Street South Perth commencing 1 August 2010 at $67,900 pa. Other Commitments The Company currently has no other capital commitments as at 30 June 2012. Capital Commitments There were no outstanding capital commitments not provided for in the financial statements of the Company as at 30 June 2012 or 30 June 2011.
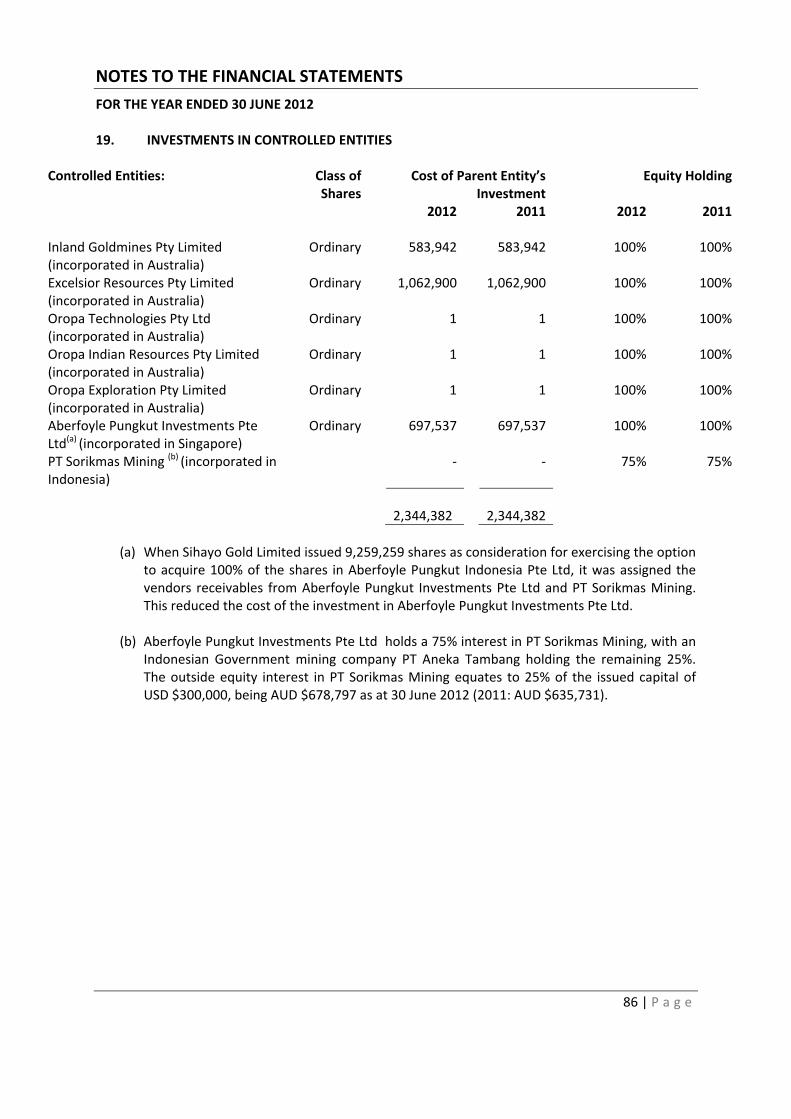
NOTES TO THE FINANCIAL STATEMENTS
86 | P a g e
FOR THE YEAR ENDED 30 JUNE 2012 19. INVESTMENTS IN CONTROLLED ENTITIES
Controlled Entities: Class of Shares
Cost of Parent Entity’s Investment
Equity Holding
2012 2011 2012 2011 Inland Goldmines Pty Limited (incorporated in Australia)
Ordinary 583,942 583,942 100% 100%
Excelsior Resources Pty Limited (incorporated in Australia)
Ordinary 1,062,900 1,062,900 100% 100%
Oropa Technologies Pty Ltd (incorporated in Australia)
Ordinary 1 1 100% 100%
Oropa Indian Resources Pty Limited (incorporated in Australia)
Ordinary 1 1 100% 100%
Oropa Exploration Pty Limited (incorporated in Australia)
Ordinary 1 1 100% 100%
Aberfoyle Pungkut Investments Pte Ltd(a) (incorporated in Singapore)
Ordinary 697,537 697,537 100% 100%
PT Sorikmas Mining (b) (incorporated in Indonesia)
‐ ‐ 75% 75%
2,344,382
2,344,382
(a) When Sihayo Gold Limited issued 9,259,259 shares as consideration for exercising the option
to acquire 100% of the shares in Aberfoyle Pungkut Indonesia Pte Ltd, it was assigned the vendors receivables from Aberfoyle Pungkut Investments Pte Ltd and PT Sorikmas Mining. This reduced the cost of the investment in Aberfoyle Pungkut Investments Pte Ltd.
(b) Aberfoyle Pungkut Investments Pte Ltd holds a 75% interest in PT Sorikmas Mining, with an
Indonesian Government mining company PT Aneka Tambang holding the remaining 25%. The outside equity interest in PT Sorikmas Mining equates to 25% of the issued capital of USD $300,000, being AUD $678,797 as at 30 June 2012 (2011: AUD $635,731).

NOTES TO THE FINANCIAL STATEMENTS
87 | P a g e
FOR THE YEAR ENDED 30 JUNE 2012 20. NOTES TO THE STATEMENT OF CASH FLOWS
(a) Reconciliation of Cash and Cash Equivalents For the purposes of the Statement of Cash Flows cash includes cash and cash equivalents on hand and at call deposits with banks, and investments in money market instruments net of outstanding bank overdrafts. Cash and cash equivalents at the end of the financial year as shown in the Statement of Cash Flows is reconciled to the related items in the Statement of Financial Position as follows:
Consolidated 2012 2011 $ $
Cash at Bank 11,130,476 13,176,949
(b) Reconciliation of operating loss after income tax
to net cash flow from operating activities Operating (loss) after income tax (9,711,061) (11,141,054) Non Cash Items Depreciation 185,893 128,103Exploration costs written off ‐ 2,856,832Convertible note costs ‐ ‐Plant & equipment written off ‐ 60,818Share based payments ‐ 1,285,729Diminution in investments ‐ ‐Increase in OEI deduction 43,065 548,224 Change in operating assets and liabilities, net of effects from purchase
controlled entity (Increase) / decrease in trade and other receivables (1,249,840) (789,330)Increase / (decrease) in payables 373,636 1,084,994Increase / (decrease) in provisions 66,511 (168,101)Increase / (decrease) in inventory (31,496) ‐Increase / (decrease) in FX (991,018) 15,057Reclassification of expenses ‐ 14,655
Net cash (outflow) from operating activities (11,314,310) (6,104,073)
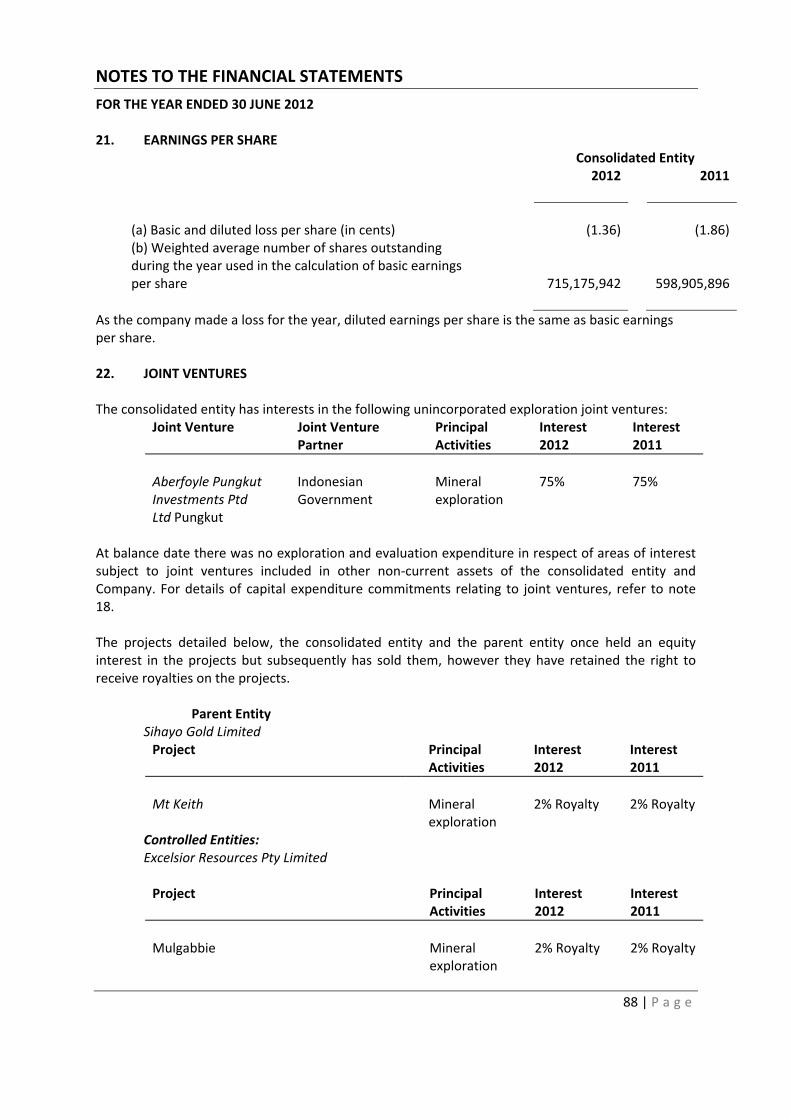
NOTES TO THE FINANCIAL STATEMENTS
88 | P a g e
FOR THE YEAR ENDED 30 JUNE 2012 21. EARNINGS PER SHARE
Consolidated Entity 2012 2011
(a) Basic and diluted loss per share (in cents) (1.36) (1.86)(b) Weighted average number of shares outstanding during the year used in the calculation of basic earnings per share
715,175,942
598,905,896
As the company made a loss for the year, diluted earnings per share is the same as basic earnings per share. 22. JOINT VENTURES The consolidated entity has interests in the following unincorporated exploration joint ventures:
Joint Venture Joint Venture Partner
Principal Activities
Interest 2012
Interest 2011
Aberfoyle Pungkut Investments Ptd Ltd Pungkut
Indonesian Government
Mineral exploration
75% 75%
At balance date there was no exploration and evaluation expenditure in respect of areas of interest subject to joint ventures included in other non‐current assets of the consolidated entity and Company. For details of capital expenditure commitments relating to joint ventures, refer to note 18. The projects detailed below, the consolidated entity and the parent entity once held an equity interest in the projects but subsequently has sold them, however they have retained the right to receive royalties on the projects. Parent Entity Sihayo Gold Limited
Project Principal Activities
Interest 2012
Interest 2011
Mt Keith Mineral
exploration 2% Royalty 2% Royalty
Controlled Entities: Excelsior Resources Pty Limited
Project Principal Activities
Interest 2012
Interest 2011
Mulgabbie Mineral
exploration 2% Royalty 2% Royalty
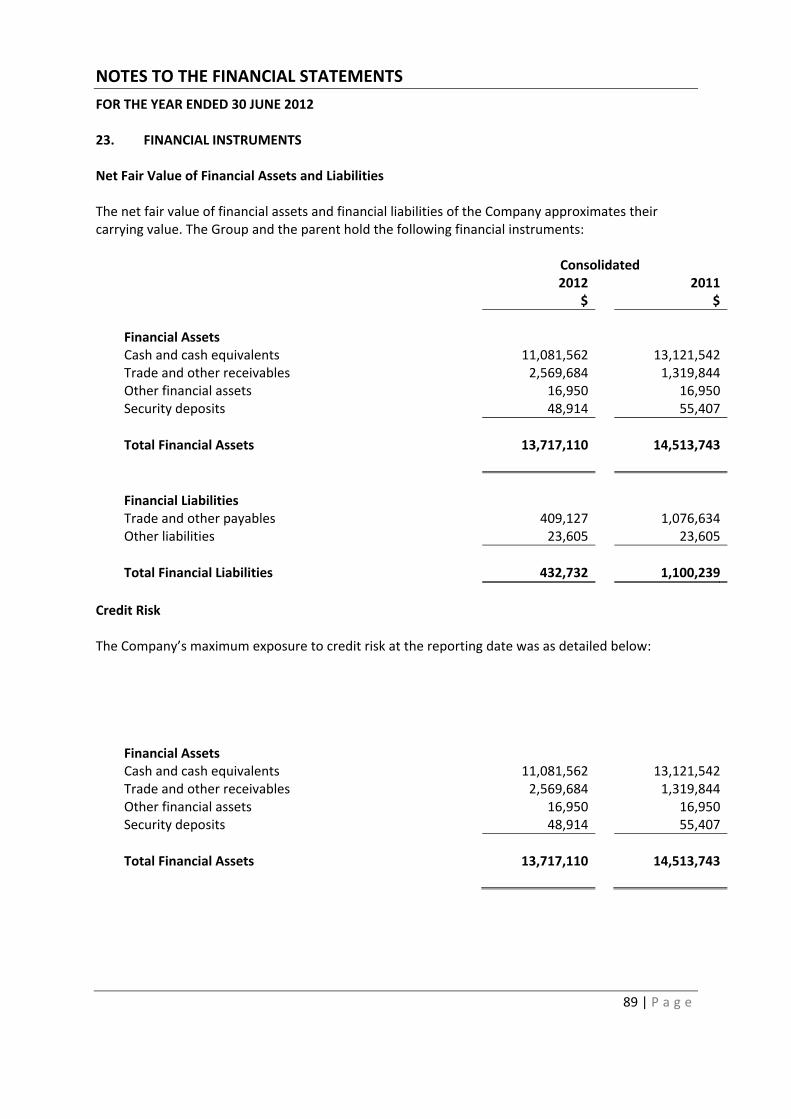
NOTES TO THE FINANCIAL STATEMENTS
89 | P a g e
FOR THE YEAR ENDED 30 JUNE 2012 23. FINANCIAL INSTRUMENTS Net Fair Value of Financial Assets and Liabilities The net fair value of financial assets and financial liabilities of the Company approximates their carrying value. The Group and the parent hold the following financial instruments:
Consolidated 2012 2011 $ $
Financial Assets Cash and cash equivalents 11,081,562 13,121,542Trade and other receivables 2,569,684 1,319,844Other financial assets 16,950 16,950Security deposits 48,914 55,407
Total Financial Assets
13,717,110
14,513,743
Financial Liabilities Trade and other payables 409,127 1,076,634Other liabilities 23,605 23,605
Total Financial Liabilities
432,732
1,100,239
Credit Risk The Company’s maximum exposure to credit risk at the reporting date was as detailed below:
Financial Assets Cash and cash equivalents 11,081,562 13,121,542Trade and other receivables 2,569,684 1,319,844Other financial assets 16,950 16,950Security deposits 48,914 55,407
Total Financial Assets
13,717,110
14,513,743

NOTES TO THE FINANCIAL STATEMENTS
90 | P a g e
FOR THE YEAR ENDED 30 JUNE 2012 23. FINANCIAL INSTRUMENTS (CONTINUED) Impairment Losses No impairment loss was recognised in either 2011 or 2012 with regards to receivables. The Company does not have any material credit risk exposure to any single debtor or group of debtors under financial instruments entered by the economic entity. Foreign currency risk management The Consolidated Entity and Company undertake certain transactions denominated in foreign currencies, hence exposures to exchange rate fluctuations arise. Sihayo Gold Limited has opened a US Bank Account to manage exchange rate fluctuations. The carrying amount of the Consolidated Entity’s foreign currency denominated assets and liabilities at the reporting date in Australian dollars is as follows:
Liabilities Assets 2012
$ 2011
$ 2012
$ 2011
$Australian Dollars 1,052,688 2,047,968 2,910,848 3,401,391
The table below details financial assets and liabilities of the consolidated entity exposed to foreign currency risk.
Consolidated
2012 $
2011 $
Cash and cash equivalents
SGD 2,307 2,547
USD 2,955,324 3,604,126
Trade and other payables
SGD 5,000 5,000
USD 1,065,497 2,167,228

NOTES TO THE FINANCIAL STATEMENTS
91 | P a g e
FOR THE YEAR ENDED 30 JUNE 2012 23. FINANCIAL INSTRUMENTS (CONTINUED) Sensitivity Analysis The table below summarises the impact of a 10 per cent weakening/strengthening of the Australian dollar against the US dollar and the Singaporean dollar in the movement of the financial assets and liabilities listed in the previous table.
Consolidated
Impact on post‐tax profit and accumulated losses
AUD 2012 2011
AUD / USD +10% 185,586 136,222
AUD / USD ‐10% (186,385) (134,964)
SGD / USD +10% (199) (183)
SGD / USD ‐10% 218 192
Consolidated
Impact on equity reserve only AUD 2012 2011
USD +10% 185,586 136,222
USD ‐10% (186,385) (134,964)
SGD +10% (199) (183)
SGD ‐10% 218 192
24. EVENTS OCCURRING AFTER REPORTING DATE
On 7th July 2012, there was a group of local demonstrators consist mainly of illegal miners at Sambung’s exploration camp.
Greg Entwistle (Chief Operating Officer) resigned effective from 01 September 2012. 25. SEGMENT INFORMATION Primary reporting – geographical segments The geographical segments of the consolidated entity are as follows: Revenue by geographical region Revenue attributable to the Group disclosed below, based on where the revenue is generated from:
30 June 2012 30 June 2011
$ $
Australia 104,490 136,392 Africa ‐ ‐ South East Asia ‐ ‐ India ‐ ‐ Other foreign countries ‐ ‐
Total revenue 104,490 136,392

NOTES TO THE FINANCIAL STATEMENTS
92 | P a g e
FOR THE YEAR ENDED 30 JUNE 2012 25. SEGMENT INFORMATION (CONTINUED) Segment result by geographical region
30 June 2012 30 June 2011
$ $
Australia (809,299) (2,696,379)Africa (4,191) (17,254)South East Asia (8,854,279) (7,876,977)India (227) (2,220)
Segment Result (9,667,996) (10,592,830)
Assets by geographical region The location of segment assets by geographical location of the assets is disclosed below:
30 June 2012 30 June 2011
$ $
Australia 10,962,731 11,285,880Africa 22,211 14,664South East Asia 19,239,112 13,173,575India 2 2
Total Assets 30,224,056 24,474,121
Liabilities by geographical region The location of segment assets by geographical location of the assets is disclosed below:
30 June 2012 30 June 2011
$ $
Australia 321,128 137,209Africa ‐ ‐South East Asia 1,556,924 2,047,968India ‐ ‐
Total Liabilities 1,878,052 2,185,177

DIRECTORS’ DECLARATION
93 | P a g e
DIRECTORS’ DECLARATION In accordance with a resolution of the directors of Sihayo Gold Limited, I state that: 1. In the opinion of the directors: (a) The financial statements, notes and the additional disclosures included in the directors’ report
designated as audited, of the Company and of the consolidated entity are in accordance with the Corporations Act 2001, including:
(i) giving a true and fair view of the Company’s and consolidated entity’s financial position as at 30 June 2012 and of their performance for the year ended on that date; and (ii) complying with Accounting Standards and Corporations Regulations 2001; and (b) There are reasonable grounds to believe that the Company will be able to pay its debts as and
when they become due and payable. (c) The financial report also complies with International Financial Reporting Standards as disclosed
in Note 1. 2. This declaration has been made after receiving the declarations required to be made to the directors in accordance with section 295A of the Corporations Act 2001 for the financial year ended 30 June 2012. On behalf of the Board
PAUL MICHAEL WILLIS Director 27 September 2012


ADDITIONAL SHAREHOLDER INFORMATION
96 | P a g e
The following additional information dated 24 September 2012 is provided in compliance with the requirements of the Australian Securities Exchange Limited. 1 DISTRIBUTION OF LISTED ORDINARY SHARES AND OPTIONS (a) Analysis of numbers of shareholders by size of holding.
Distribution No. of shareholders
Units % off issued Capital
1‐1000 499 234,402 0.03% 1,001‐5,000 889 2,347,290 0.29% 5,001‐10,000 340 2,705,151 0.34% 10,001‐100,000 539 21,159,655 2.65% 100,001 and above 218 772,931,250 96.69%
Total 2,485 799,377,748 100.00%
(b) There were 1,238 shareholders holding less than a marketable parcel. (c) The percentage of the total of the twenty largest holders of ordinary shares was 2 TWENTY LARGEST SHAREHOLDERS AND OPTION HOLDERS
Names No. of shares
%
Summit Investments Pty Ltd 125,662,490 15.72% National Nominees Limited 118,297,728 14.80% Shane Inv Kendall Ltd 50,000,000 6.25% HSBC Custody Nominees (Australia) Pty Ltd 49,983,713 6.25% JP Morgan Nominees Australia Ltd 31,051,150 3.88% Asian Lion Ltd 30,122,242 3.77% Goldstar Asia Mining Res 29,666,603 3.71% Summit Investments Pty 24,188,000 3.03% FATS Pty 23,617,842 2.95% Yaw Chee Siew 23,333,333 2.92% DBS Vickers Sec Singapore 21,212,966 2.65% Lion Selection Group 19,667,650 2.46% Citicorp Nominees Pty 15,944,648 1.99% Insight Capital Management Pty 13,294,039 1.66% Pettersson Bradley John 12,724,000 1.59% Phillip Securities Pty Ltd 11,101,569 1.39% Gemtwin Pty Ltd 9,300,000 1.16% Devine Luke David 8,023,907 1.00% Caudle Gavin Arnold 6,613,984 0.83% Merrill Lynch Australia Nominees Pty 6,170,497 0.77%
Total 629,976,361 78.78%
There were no options in the Company listed on the ASX as at 24 September 2012.

ADDITIONAL SHAREHOLDER INFORMATION
97 | P a g e
3 SUBSTANTIAL SHAREHOLDERS An extract from the Company’s register of substantial shareholders is set out below: Ordinary Shares Held Name Number Percentage __________________________________________________________________________________ Summit Investments Pty Ltd 149,850,490 18.75%
National Nominees Ltd 118,297,728 14.80%
HSBC Custody Nominees Australia Ltd
55,730,296 6.97%
Shane Investments Kendall Ltd 55,000,000 6.88%
4 VOTING RIGHTS The Company's share capital is of one class with the following voting rights: (a) Ordinary Shares On a show of hands every shareholder present in person or by proxy shall have one vote and upon a poll each share shall have one vote. (b) Options The Company's options have no voting rights. 5 RESTRICTED SECURITIES There are no ordinary shares on issue that have been classified by the Australian Securities Exchange Limited, Perth as restricted securities. 6 SECURITIES EXCHANGE LISTING Sihayo Gold Limited shares are listed on the Australian Securities Exchange Limited. The home exchange is the Australian Securities Exchange (Perth) Limited.

SUMMARY OF TENEMENTS HELD BY COMPANY
98 | P a g e
FOR THE YEAR ENDED 30 JUNE 2012 Project Name Tenement Approval Expiry Area Equity Date Date % OROPA INDIAN RESOURCES INDIA Block D‐7 22.01.00 N/A 4,600km2 9(1)
PT SORIKMAS MINING INDONESIA Pungkut 96PK0042 31.05.96 N/A 66,200ha 75
OROPA EXPLORATION MALAWI Chitunde EPL0212/07R 27.06.10 27.06.12 98km2 100 Mzimba Northwest EPL0211/07R 27.06.10 27.06.12 1,106km2 100 Chizani EPL0223/07R 12.12.10 12.12.12 657km2 100 SIHAYO GOLD LIMITED WESTERN AUSTRALIA Mt. Keith M53/490 11.06.04 10.06.25 582ha 0(2) M53/491 11.06.04 10.06.25 621ha 0(2) EXCELSIOR RESOURCES PTY LTD Mulgabbie ML28/364 25.03.09 24.03.30 54.3ha 0(2) PL28/1078 22.09.08 21.09.12 98.0ha 0(2) PL28/1079 22.09.08 21.09.12 143.7ha 0(2) PL28/1080 22.09.08 21.09.12 140.7ha 0(2) PL28/1081 22.09.08 21.09.12 191.4ha 0(2) PL28/1082 22.09.08 21.09.12 120.0ha 0(2) Gullewa M59/394 200.0 0 (3)
NOTES (1) Option to increase interest to 18% (2) 2% net smelter royalty (3) 5% profit royalty