2012 annual report and financial statements - bamburi cement
TRANSCRIPT

2012 ANNUAL REPORTAND FINANCIAL STATEMENTS
Bamburi Cement Limited Corporate Office, Nairobi6th Floor, Kenya-Re Towers,Mara Ragati Road, Upper Hill
P.O. Box 10921 - 00100, Nairobi, KenyaTel: (+254 - 20) 289 3000/2710478
Fax: (+254 - 20) 2710581
www.lafarge.co.ke
Building better cities™

2012 ANNUAL REPORT & FINANCIAL STATEMENTS2 3BAMBURI CEMENT LIMITED I PART OF YOU. FROM THE START
CONTENTS
TABLE OF CONTENTSBUSINESS REVIEW
Who We Are 4 - 5 Five Year Performance Highlights 6
Other Performance Highlights 7
Value Added Statement 7
Chairman’s Statements 8 - 10
Managing Directors Statement 11 - 13
CORPORATE GOVERNANCEBoard of Directors 14 - 16
Executive Management Committee Team 17 - 19
Corporate Information 20 - 21
Statement of Corporate Governance 22 - 25
Shareholders Information 26 - 27
Management’s Discussion and Analysis of Financial Conditions and Results of Operation 28 - 34
Sustainability Statement 35 - 38
Report of the Directors 39
Statement of Director’s Responsibility 40
Report of the Independent Auditors 42 -43
FINANCIAL STATEMENTSStatements of Comprehensive Income 46 - 47
Statement of Financial Position 48 - 49
Statement of Changes in Equity 50 - 53
Statement of Cash Flows 55 - 56
Notes to the Financial Statements 57 - 119
OTHER INFORMATIONNotice of the Annual General Meeting 120
Proxy Form 121 - 122

2012 ANNUAL REPORT & FINANCIAL STATEMENTS 5BAMBURI CEMENT LIMITED I PART OF YOU. FROM THE START
Our Vision ‘To be a World Class producer that provides construction solutions to our customers across Eastern Africa with a commitment to sustainability’.
Our Values We strive to push all employees and contractors to embrace our company values of Ownership, Accountability and Ambition, to help drive our priorities for the business. Our area of focus as a business is to provide products, systems and solutions that are reliable, innovative and cost effective; achieve global leadership in local business through excellence in ‘multi-local’ management by combining local initiatives with global strengths; mobilize the full talent and energies of our people to realize global ambition in each local market. As part of the Lafarge family, we are bound by shared values. The Lafarge brand stands for commitment to excellence and the values of the group are expressed in the ‘Lafarge Way’.
WHO WE ARE WHO WE ARE
Bamburi Cement Limited is a subsidiary of Lafarge, the world leader in building materials and is listed on the Nairobi Stock Exchange. The Company has three (3) active subsidiaries: Hima Cement Limited, Bamburi Special Products Limited and Lafarge Eco Systems Limited.
The Group operates in East Africa, mainly in Kenya and Uganda but serving a wider Eastern African market. Our principal activities are manufacture and sale of cement & cement related products. We also own and manage a world class nature and environmental park developed from rehabilitated quarries. Bamburi Cement Limited is the largest cement producer in East Africa. In Kenya, it operates two (2) plants with the capacity to produce 2.5 million tons of cement per annum; Mombasa Plant – an integrated plant located in Mombasa and Nairobi Grinding Plant – a grinding plant located in Athi River. In Uganda, the Company, through its subsidiary Hima Cement Limited, operates one fully integrated cement plant with a capacity of 850kt.
Lafarge GroupLafarge in brief
A world leader in building materials and a top-ranking player in the cement, aggregates and concrete industries, we contribute to the construction of cities around the world. Our innovative solutions provide them with more housing and make them more compact, more durable, more beautiful and better connected. The Group employs 65,000 people in 64 countries, and posted sales of €15.8 billion in 2012.
Bamburi is driven by the needs of its customers, shareholders, local communities and architects. We create specialist solutions which encourage creativity whilst leaving a lighter trace on the world. The Group works with all actors in the building industry from do-it-yourself builders to large construction companies, architects and local artisans. Whether supplying high-quality cement to a craftsman or helping leading architects explore and deliver creative possibilities, Bamburi Cement Limited is committed to providing solutions that fit the needs of all its clients.
We are an innovative company with the widest cement and concrete product range, with our service proposition of an integrated one-stop shop for all cement and concrete solutions.
Our company, Bamburi Special Products Limited was launched in 1998 and it has revolutionized the concrete industry with a rapid growth in its two divisions, Concrete paving Block and Ready mix concrete. As a result Bamburi is a well known strong brand both locally and internationally, and has gained repute of being the cement expert that is innovative, delivers consistently high quality products and is the industry captain.
Lafarge Eco Systems Limited, is the environmental and rehabilitation arm of the business. It was set up in 1971, as Bamburi Nature Trails with the principle responsibility of rehabilitating exhausted, barren quarries. This is in line with our vision and commitment to the environment and community around us. Since inception Lafarge Eco Systems has restored numerous quarries and won international acclaim and awards for its rehabilitation work as well as for best practice. Quarry rehabilitation projects are continuous remaining part and parcel of our business. We strive to meet the International Environmental Standards and the Group was awarded “The Best Environmental Compliant Firm 2010” in the Cement Sector from the National Environmental Management Authority in recognition of our environmental management systems.
4
58countries
41,200employees
10,373 revenuesin million euros
161production sites
36 countries
21,800 employees
5,353 revenuesin million euros
1,395 production sites
LAFARGE PROFILE LAFARGE WORLDWIDE (at December 31, 2012)
KEY FIGURES (at December 31, 2012)
432 M€
CEMENT WORLD LEADER
N°2 AGGREGATES& N°4 CONCRETE
NET INCOME GROUP SHARE
GROUP REVENUESBY DIVISION
(at December 31, 2012)
GROUP REVENUESBY GEOGRAPHIC AREA
(at December 31, 2012)
LAFARGE PROFILE
1, 570production sites
15, 816revenuesin million euros
65 , 0 00employees
countries 64
North America Asia Western Europe Central and Eastern Europe Middle East and Africa
World map of lafarge's presence as of D e cember 31, 2012 (plants and sales offi ces)
Latin America
Western Europe 20.1%
North America21.3%
Central and Eastern Europe
8.0%
Middle East and Africa
27.1%
Latin America 6.1%
Asia17.4%
Cement65.6%
Other0.6%
Aggregates and concrete
33.8%
• xxxxxx - xxxxxx 2012 xxxxx - xxxxxx 2012 •xxxxx - xxxxx 2012 • 01

2012 ANNUAL REPORT & FINANCIAL STATEMENTS6 7BAMBURI CEMENT LIMITED I PART OF YOU. FROM THE START
FIVE YEAR PERFORMANCE HIGHLIGHTS
Group Turnover Profit Attributable to Shareholders
EPS DPS
Earnings/Divided per share Net Indebtedness
400
350
300
250
200
150
100
50
251
374
91
14
74
0
Kshs
Mill
ion
Shareholders’ Equity Finance Costs - Shs M
Operating Income Investments and Net Cashflows from Operating Activities
1100 1075 10721043
985
925
908
955999974976
1050
1000
950
Num
ber o
f Sta
�
Employees
900
850
-
VALUE AddEd STATEMENT
OTHER PERFORMANCE HIGHLIGHTS
Employees

2012 ANNUAL REPORT & FINANCIAL STATEMENTS8 9BAMBURI CEMENT LIMITED I PART OF YOU. FROM THE START
CHAIRMAN’S STATEMENT
dear Shareholders,
This statement is more that of Richard Kemoli than it is mine as Richard was the Chairman for most of the year under review. Richard left the Group after having served it for more than thirty years, overseeing tremendous growth and change. On my own behalf, that of the Board and the Group at large, I take this opportunity to thank Richard for his significant contributions to the Board and the Group. We wish him all the best as he pursues other interests.
It was my great pleasure to join the Bamburi Group in November 2012 and to subsequently be appointed Chairman of the Board of Directors. I look forward to working together with my colleagues on the Board, management and staff to grow the business and contribute to its success.
While safety remains our number one priority, I am sad to report that in 2012 we recorded three fatalities on the road in Uganda. We have undertaken various
measures to reinforce our safety culture within our road operations to safeguard the lives and livelihoods of those who work for and do business with us together with the communities along our routes. Economic Conditions1
In both Kenya and Uganda, the economies experienced slow growth at the beginning of 2012 following high inflation and high commercial bank interest rates.
In Kenya, the gross domestic product (GDP) growth rate was estimated at 4.5%, in line with 2011, while in Uganda estimated GDP growth reduced to 3.4% from 6.7% in 2011 as a result of high inflation and high interest rates together with reduction in public spending.
The tight monetary policy stance applied by the central banks in both Kenya and Uganda, was successful in reigning in inflation and halting the depreciation of the local currencies. In Kenya, headline inflation declined to 3.3% from a high of 18.3% at the beginning of 2012 and
Innovation in Construction Solutions
this was followed by the gradual reduction of the bench mark Central Bank rate from 18% in January to 11% by year end. The Kenya shilling was relatively stable against major hard currencies, averaging Shs. 85/= against the US dollar.
In Uganda, headline inflation reduced to 5.3% in December from a high of 25.6% in January 2012 which was followed by the gradual reduction of the central bank policy rate from 23% in January to 12% in December. The Uganda shilling weakened against the major currencies during the year falling from Ugshs. 2,495/= against the US dollar in January to Ugshs. 2,615/= against the US dollar at the end of the year.
Cement Market and Competitive Landscape
As the construction sector is closely linked to the financial sector due to its capital intensive nature, the high interest rates resulted in reduction of demand.
Cement demand in the East African market grew by 7% to 8.5 million tons compared to 9% growth in 20112 with growth driven by Individual Home Builders and government expenditure on infrastructural projects. We expect underlying demand to continue growing driven by increased urbanization, consequently increasing housing demand, rising infrastructure development, sustained economic growth and reconstruction in South Sudan and the Democratic Republic of Congo.
2012 saw an increase in cement production capacity with production capacity in Kenya increasing by approximately 500 kt while in Uganda production capacity increased by approximately 650 kt tons3. The changing competitive landscape made it imperative for the Group to focus on cost control to protect our bottom line performance, improving efficiencies in our route to market while exploring new markets to secure volumes and grow shareholder value.
Performance
Despite an increasingly competitive market, the Group revenues grew by 4% to Shs. 37.5 billion mainly as a result of 2% increase in domestic sales volumes supported by strong commercial actions and improved value propositions to our customers. However, the Group’s Operating Profit reduced by 14% to Shs. 6.8 billion.
The Group experienced an extremely difficult cost environment, particularly in the first half of the year, due to challenges in industrial operations which in Kenya resulted in higher consumption of imported clinker as we lowered our production to comply with emission standards and in Uganda resulted in higher fixed costs.
We continued to experience volatility of global fuel prices which resulted in higher raw material, transport and power costs further aggravated by the removal of power subsidy in Uganda leading to increase in power cost. We were able to mitigate this cost increase through increased Alternative Fuel substitution at the Uganda plant using biomass fuels like coffee husks, rice husks and palm kernel waste.
Sustainability
As a Group, we firmly believe that we can only prosper if we operate sustainably. In 2012, we completed the conversion of the dust filter in the Mombasa Kiln 2 to a bag filter significantly reducing dust emissions.
In Uganda, the coffee seedling project supporting 45,000 small holder farmers in Kasese and Kamwenge Districts, to grow coffee which would in future provide husks for use as biomass fuel was commenced.
CHAIRMAN’S STATEMENT
2Source: East African Cement Producers Association and Market Intelligence3Source: Media and sales team estimates
1Source: Kenya - Economist Intelligence unit and Central Bank of Kenya; Uganda - Bank of Uganda

2012 ANNUAL REPORT & FINANCIAL STATEMENTS10 11BAMBURI CEMENT LIMITED I PART OF YOU. FROM THE START
Cash generation remained strong in 2012 and in addition to the interim dividend of Shs. 2.00 per share paid in October 2012, the Directors now recommend a final dividend of Shs. 8.50 per share, bringing the total dividend for the year to Shs. 10.50 per ordinary share which is a 5% growth over 2011 and represents a 11.4% compound annual growth rate in dividends since 2006.
Outlook
Although the economies in Eastern Africa are expected to grow, there are various uncertainties, key among them being weak global economic growth particularly in the West that could negatively impact infrastructure projects, political uncertainty in Kenya and possibility of resumption of conflict in our inland Africa export markets. However, the Group has put in place strategies that seek both to address near-term challenges and to seize opportunities to strengthen our platform for the future.
The Eastern Africa region is currently witnessing increased urbanization and large infrastructure projects. We as a Group, and the construction sector in general, are strategically placed to help governments and investors meet the needs of a growing population and at the same time continue to support individuals build their dreams of owning their homes.
We remain committed to developing deepening relationships with our customers and key partners while continuously scanning the market for emerging opportunities, leveraging on the synergy of the Group. We shall do this by developing our people, delivering high quality construction solutions, focusing relentlessly
on cost control, improving industrial productivity and offering superior customer service.
Governance
Strong governance is integral to our long-term success and the Board believes that upholding the highest standards of corporate governance will be essential in delivering the Group’s strategy. The Statement of Corporate Governance included in the Annual Reports provides the details on the governance within the Group and I invite you to go through this statement to gain an understanding of how the Group is governed.
Appreciation
The Bamburi Group is a great company with excellent people and I thank you for your continued support. In the short time that I have been on the Board, I have been impressed with the passion our people have shown in serving our customers and their determination to compete in a dynamic competitive landscape and I wish to thank them for their contribution. I would also wish to thank the Management and Board of Directors for their input in guiding the Group on its path of being a world class producer of construction solutions in Eastern Africa with a commitment to sustainability.
I am also particularly grateful to our shareholders for their faith and continued support.
Dr. John P.N. Simba, OGW, MBSChairman
CHAIRMAN’S STATEMENT MANAGING dIRECTOR’S STATEMENT
Innovation in Construction Solutions
In 2011, the Group embraced a new vision of being a world class producer of construction solutions in Eastern Africa while committed to sustainability.
The vision was set in recognition of the needs of our markets covering East and Inland Africa, as well as the changing market conditions which had seen increased capacity by both new and existing players together with an unstable global and regional economic outlook. In the region, the unstable economic conditions resulted in high borrowing costs in the first half of the year and relatively flat GDP growth rates compared to prior years. It is my belief that this vision put the Group on a sound footing to achieve topline growth despite the prevailing market conditions.
The Group’s strategy seeks for consistent delivery of results and sustained growth through new construction solutions and new ways of serving our end customers. We have continued to invest in our Ready-mix business with additional investment in our concrete logistics capability.
Safety and HealthWe remain commited to the health and safety of all our staff, contractors and partners working within our sites and along the supply chain. The efforts to improve health and safety while safeguarding the livelihoods of our people, partners and communities continued through

2012 ANNUAL REPORT & FINANCIAL STATEMENTS12 13BAMBURI CEMENT LIMITED I PART OF YOU. FROM THE START
MANAGING dIRECTOR’S STATEMENT
the entrenchment of the Visible Felt Leadership, Team Based Safety and the Safety Observation Programs as well as focused training.
Road safety, however, remained a challenge for business and for governments across the region. Despite our best efforts in the careful selection of our partners on the road and in training of drivers, I am sad to note that we had three fatalities in Uganda. I would like to express my profound regret for this loss of lives and the loss suffered by the families and communities of those who lost their lives.
In recognition of the need to influence behavior on our roads, the Group participated, in conjunction with SafeWay RightWay, a non-governmental organization set up by the Kenya Roads Board, the World Bank and Total Kenya, in the national Road Safety Campaign with the theme ‘Kuwa Mpole’ to promote road safety initiatives in Kenya. The campaign was launched at our plants in Mombasa and Athi River, an indication of our proactive approach and commitment to promote safety on the roads.
Environmental SustainabilityIn the year, Lafarge launched the Sustainability Ambitions 2020, which are organized around the three main pillars of sustainable development - social, economic and environmental. In line with our environmental ambitions, the Group invested Shs. 540 million to replace the ESP technology used to manage dust emission at our Mombasa Plant, with a state of the art bag filter.
I firmly believe that we can only operate sustainably if the communities in which we operate benefit from our existence. During the year, Lafarge Eco Systems Limited, in partnership with World Wide Fund for Nature and the National Environmental Management Authority, undertook a project to share quarry rehabilitation best practices with limestone miners who cut coral building blocks for construction within Mombasa. These included the land owners and miners, who were brought together to embark on an awareness campaign and develop guidelines for sustainable mining of coral blocks and
rehabilitation of the quarries to a useful state. This initiative will promote sustainable land use and create a safe environment for the communities around our sites.
Operational and financial performanceGroup turnover grew by 4% over 2011 as we developed new avenues to serve our end customers and grew our inland Africa export markets from Uganda in the first half of the year. However, growth in the inland Africa markets slowed down in the second half of the year due to political uncertainties in the eastern parts of Democratic Republic of Congo and in South Sudan. We have seen signs of recovery in some of these markets and are optimistic that there will be a resumption of a stable trading environment.
Despite the increase in turnover, the Group’s operating profit declined by 14% to Shs.6.8 billion, predominantly due to increased reliance of imported clinker in Kenya and higher power cost in Uganda. We have remained focused on cost control and industrial performance, through better process mastery via our Plant Operating Model, to improve operating profit.
During the year, we had a number of significant achievements and I will mention a few. We embarked on the “Structures Don’t Lie” marketing campaign to differentiate ourselves by building our brand visibility and we intend to continue carrying out our campaign in 2013. We rolled out a customer relation management system to capture our customer interaction with the aim of leveraging on this system to enhance the relationship we have with our customers and consequently improve service levels. We improved our Alternative Fuel substitution level in Uganda from an average of 30% in 2011 to average of 40% in 2012. The Group’s cash generation remained strong in the period as we optimized our working capital and cash.
Other projects undertaken during the year included automation of the truck safety inspection process and implementation of a queue management system to enhance operations around our weighbridge system.
The Group moved its telecommunications system from satellite network links to fiber which has resulted in 60% reduction in telecommunication cost and better reliability. We are looking to improve the quality of life and productivity of our employees, by creating an environment where mobility and collaboration are enhanced through cloud computing technology, which will allow our people to access key applications from anywhere, using any device, at anytime.
Outlook for 2013We entered 2013 stronger than we started in 2012, with a better appreciation of our strategy by our people. We will continue to build a strong brand, lever-age on our footprint to offer innovative con-struction solutions, relentlessly exert downward pressure on our costs and optimise our as-sets to deliver greater value.
However we maintain cautionary optimism with the elections in Kenya. We remain determined to maintain our market leadership position through three strategic pillars – people, superior customer service and excellence in industrial performance.
AppreciationI would like to thank each and every one of our customers, our dedicated and talented staff, our service providers, the regional governments and all our other stakeholders for their contribution in the course of the year. I look forward to their continued support as we strive to be a world class producer of construction solutions in Eastern Africa with a commitment to sustainability.
Hussein MansiManaging Director
MANAGING dIRECTOR’S STATEMENT

2012 ANNUAL REPORT & FINANCIAL STATEMENTS14 15BAMBURI CEMENT LIMITED I PART OF YOU. FROM THE START
David Njoroge, 42, BComm, CPA (K) Director (Executive)David joined the Group in 1999 as Finance Manager a position he held until 2002 when he was promoted to Finance Director. In April 2006, he was appointed General Manager, Hima Cement Limited. David has attended managerial, financial and leadership related courses’ both locally and internationally and has broad experience in finance and related fields.
Sheila M’Mbijjewe, 55, MBS, ICAEW, CPA(K) Director (Non-Executive)Sheila’s previous jobs have included the Finance Director position at PricewaterhouseCoopers, Stagecoach International and Standard Chartered Bank Kenya. She is a member of the Monetary Policy Committee of the Central Bank of Kenya. Sheila is the Chairperson of the Audit Committee.
Amb. Solomon W Karanja, 76, BA, MA Director (Non-Executive)He has worked as a Deputy to the University of East Africa Registrar and was the first Kenyan Registrar of the University of Nairobi. Subsequently he held the position of Executive Chairman, East Africa Portland Cement Company for twelve years until he was appointed Executive Chairman National Bank of Kenya in 1987. He has served as Chairman of the Kenya Golf Union, Muthaiga Golf Club and Fidelity Shield Insurance Company. Amb. Karanja has also been appointed by the Government to serve on several commissions. He retired as a Director of Muthaiga Country Club and also as the Kenyan Ambassador & Permanent Representative to UN Habitat after serving two three year terms. Amb. Karanja is the Chairman of the Kenya Medical Supplies Agencies. He is a member of the Nomination & Corporate Governance Committee.
John Simba, 68, LLB, PhD, OGW, MBS Chairman (Non-Executive)He is a Senior Partner at Simba & Simba Advocates. He has previously worked with the Attorney General’s chambers, Industrial Commercial Development Corporation and National Bank of Kenya. John has served as Chairman of Federation of Kenya Employers, Kenya Bankers’ Association and the Retirement Benefits Authority and as President of the Rotary Club of Nairobi. He is currently Chairman of several companies including Pan Africa Insurance Holdings Limited, APA Insurance Company Limited and is a director in several others. He is Chairman of the University of Nairobi Council and Chancellor of Pwani University. John is a member of the Law Society of Kenya, East African Law Society, International Bar Association and the Institute of Directors, Kenya. John is the Chairman of the Board of Directors and member of the Nomination & Corporate Governance Committee.
Thomas Farrell, 56, BA, JD Law Director (Non-Executive)Prior to joining Lafarge, Thomas was a corporate attorney with Shearman & Sterling, New York (U.S.A.)and Paris (France) offices. Thomas joined Lafarge in 1990 as Vice-President of Strategy. From 1992 to 2002, he managed various Lafarge operating units in France, Canada and India. In June 2002, Thomas was appointed Executive Vice President (EVP), Lafarge North America and in September 2007, he was appointed Lafarge Group EVP, Co-President of the Aggregates & Concrete Division and a member of the Executive Committee. In January 2012, Thomas was appointed Group EVP, Operations. He is a member of the Nomination & Corporate Governance Committee.
Chris C. Kisire, 46, BComm, MBA, CPA (K), CPS (K) Director (Non-Executive)Chris is the Finance Director, Mumias Sugar Company Limited. He has business experience spanning over nineteen years in Finance, Administration and Business Management both locally and internationally. He is an alumni of Strathmore Business School/IESE, AMP 2010. Chris is a member of the Audit Committee.
Dominique Brugier, 54, BMechE Director (Non-Executive)He joined Lafarge in 1991 as a Mechanical Expert, moved to Lafarge China in 1995 as a Maintenance Manager, became Project Manager in 1997 and rose to Industrial Director in 2005. In 2009, he was promoted to the position of Director, Performance and Progress, East and West Sub-Saharan, Africa, a position he held until 2013 when he was promoted to General Manager, Lafarge Industrial Performance, Middle East & Africa. Dominique is a member of the Audit Committee.
THE BOARd OF dIRECTORS THE BOARd OF dIRECTORS
Catherine Langreney, 47, MSEE, MBA, CPM Director (Non-Executive)Catherine started her career in 1991 working as an engineer and in procurement in various organizations in France and the United States of America including Alcatel USA and Bell Canada Technologies. She joined Lafarge in 2002 as Vice President - Purchasing, Lafarge North America until 2006 when she was promoted to Group SVP Purchasing. In 2011, Catherine was appointed Country CEO, Tanzania – a key regional collaborator of the Company. Catherine combines her business knowledge with her engineering background to drive change.
Hussein Mansi, 46, BSc, MBA Managing Director (Executive)Hussein began his career in 1989 as a Design Engineer, Saudi Building Systems. In January 1999, Hussein joined the Orascom Cement Division, which was acquired by Lafarge in 2007, as Works Director - Sales and Marketing, Egyptian Cement Company rising to Commercial Director, Algeria Cement Company, a position he held until December 2008 following which he was appointed Managing Director Bamburi Cement Limited. Hussein is the Chief Executive Officer and a member of the Nomination & Corporate Governance Committee.
Fabrizio Olivares, 51, MCF Director – Alternate (Non Executive)Before joining Lafarge, Fabrizio worked at Inergy Automotive Systems, Rhoda Chemicals, Ingersoll-Rand and Motorola. He joined Lafarge in May 2008 as Senior VP Finance, Aggregates & Concrete Division, a position he held until April 2012 when he was appointed Senior VP Finance, Regional Operations Cement, Aggregates & Concrete for a number of countries covering about one third of the Lafarge Group. Fabrizio has almost twenty five (25) years experience in financial management and international controlling with major US and European Corporations.
Betty Kanyagia, 38, Company Secretary LLB, CPS (K), MCIArB Betty practised with a law firm in Nairobi before joining PricewaterhouseCoopers, Tax and Legal Services Department as a Consultant. She joined Bamburi Cement Limited in 2003 as the Compensation and Benefits Manager, a position she held until June 2007, when she took up the role as Company Secretary. Betty is a Commissioner for Oaths and Notary Public. She is a member of the Law Society of Kenya, the Chartered Institute of Arbitrators, the Institute of Certified Public Secretaries of Kenya and the Commonwealth Lawyers Association.
Eric Kironde, 46 BSc, FCCA, CPA(U), CPA(K), ACMT Director (Executive)Prior to joining the Group, he worked at Nile Breweries Limited (Uganda) as an Internal Audit Manager and PricewaterhouseCoopers, where his last position was Audit Manager. Eric joined the Group in August 2001 as Finance Manager, Hima Cement Limited and has since held various Finance positions within the Bamburi Group and Lafarge, including a twenty months’ secondment to Ashaka Cement Company in Nigeria. He was Director of Internal Control for Lafarge Sub Sahara Africa, based in Nairobi, before being appointed Finance Director in November 2011.

16 BAMBURI CEMENT LIMITED I PART OF YOU. FROM THE START
BOARd OF dIRECTORS
Left to right:Amb. Solomon Karanja, Eric Kironde, Catherine Langreney, John Simba, Betty
Kanyagia, Hussein Mansi, Sheila M’Mbijjewe, Fabrizio Olivares, Dominique Brugier, David Njoroge, Chris C. Kisire
BOARd OF dIRECTORS
2012 ANNUAL REPORT & FINANCIAL STATEMENTS 17
ExECUTIVE MANAGEMENT TEAM
Left to right:Steve Okeyo, Robert Nyangaya, Hussein Mansi,
Susan Maingi, Jacqueline Wanyama, David Njoroge, Tariq Iqbal, Eric Kironde, Xavier DeCharentenay

2012 ANNUAL REPORT & FINANCIAL STATEMENTS18 19BAMBURI CEMENT LIMITED I PART OF YOU. FROM THE START
Eric Kironde, Finance Directoris a Bachelor of Sciences (BSc) degree holder, a Fellow of the Chartered Association of Certified Accountant (FCCA), a member of the Institute of Certified Public Accountants of Uganda (ICPAU) and an Associate of The Association of Corporate Treasurers (ACMT). Prior to joining the Group, he worked at Nile Breweries Limited (Uganda) as an Internal Audit Manager and PricewaterhouseCoopers, where his last position was Audit Manager. Eric joined the Group in August 2001 as Finance Manager, Hima Cement Limited and has since held various Finance positions within the Bamburi Group and Lafarge, including a twenty months’ secondment to Ashaka Cement Company in Nigeria. He was Director of Internal Control for Lafarge Sub Sahara Africa, based in Nairobi before being appointed as the Finance Director Bamburi Cement Limited.
Hussein Mansi, Managing Director is a Master of Business Administration and a Bachelor of Science degree holder. Hussein began his career in 1989 as a Design Engineer Saudi Building Systems. In January 1999, Hussein joined the Orascom Cement Division, which was acquired by Lafarge in 2007, as Works Director - Sales and Marketing, Egyptian Cement Company rising to Commercial Director, Algeria Cement Company, a position he held until December 2008 following which he was appointed Managing Director Bamburi Cement Limited. Hussein is the Chief Executive Office and a member of the Nomination & Corporate Governance Committee.
David Njoroge, General Manager, Hima Cementis a holder of a Bachelor of Commerce degree (Accounting major), a Certified Public Accountant. David was a director at the Nairobi Stock Exchange where he chaired the Finance and Manpower Committees. He has attended managerial, financial and leadership related courses’ both locally and internationally and has broad experience in finance and related fields. He joined Bamburi Cement Limited in 1999 as Finance Manager a position he held until 2002 when he was promoted to Finance Director. In April 2006, he was appointed General Manager, Hima Cement Limited and was also responsible for the Group’s capacity increase projects in Uganda.
Susan Maingi, Corporate Affairs and Communications Directoris a Business Education and Sociology graduate from Kenyatta University, an AIESEC Board of Advisor, and a member of the Institute of Human Resource Management, Kenya. She joined Bamburi Cement Limited, in 2002 as the Career Development Manager from an audit and management consulting firm, KPMG. She was appointed to the role of Human Resources & Organizational Director in 2007, where she played a key role in the development of the Human Resources function to be a strategic business partner. Susan was later appointed to the position of Corporate Affairs and Communications Director in July 2012.
Steve Okeyo, Sales Director is Sales Director and Acting Marketing Director. He holds a Bachelor of Arts degree from the University of Nairobi and a Master of Science Degree in Business Administration from the United States International University in Nairobi. Steve built most of his management career at The Coca-cola Company where, for over ten years, he worked in different markets across East Africa and the Indian Ocean Islands. He held different responsibilities from Operations Marketing to General Management. His last assignment was Country Manager for Uganda where he successfully stabilized a previously-declining business. Steve joined the group in 2010 as Sales Director and took up an expanded role including Marketing in 2012.
THE ExECUTIVE MANAGEMENT COMMITTEE
Jacqueline Wanyama, Human Resources& Organization Directoris a Master of Business Administration (International Business) and Bachelor of Commerce (Business Administration) degree holder and is a member of the Institute of Human Resource Management, Kenya. She has over 10 years experience in Human Resources & Organization Development across Sub Saharan Africa, gained from working experiences in leading multinational organizations such as British American Tobacco, Standard Chartered Bank and Colgate Palmolive. Jacqueline joined Lafarge in July 2011 as the Regional Organization Development Director for Sub Saharan Africa and later Bamburi Cement Limited as the Human Resources & Organization Director, in June 2012.
Xavier DeCharentanay, Industrial Director is a holder a technical degree in mining engineering with a speciality in Materials from Ecole des Mines de Saint-Etienne with experience of optimization of production standards. He started as the Assistant to the Industrial Manager in Metaleurop SA and later on held the position of Managing Director in Recytech SA before joining the Lafarge Group in 2008 as the Projects Director in Lafarge SA. He later joined Bamburi Cement Limited in September 2009 as the Industrial Manager before being appointed to the Industrial Director position in 2011.
Tariq Iqbal, Supply Chain Directoris a holder of an HND (Civil Engineering). Prior to joining the Company, Tariq worked with Pacific Consultants International (Japan) as a Building Engineer. Tariq joined Bamburi Cement Limited in December 1996 as the Commercial Manager, Simbarite Limited (Bamburi Cement Subsidiary) and has since held various positions within the Bamburi Group. He was the Project Manager responsible in setting up Bamburi Special Products in 1998. He was the General Manager of Bamburi Special Products before being appointed the Supply Chain Director in October 2007.
Robert Nyangaya, General Manager, Bamburi Special Products is a Bachelor of Commerce (Accounting Option) degree holder from the University of Nairobi and a Certified Public Accountant, CPA (K). He worked for 11 years at the local subsidiary of Eastman Kodak Company (Kodak Kenya) in various capacities i.e. Finance, Sales and Marketing amongst others. Before joining Bamburi Cement Limited in 2001, Robert was looking after Eastman Kodak distributor operations in Sub Saharan Africa. In Bamburi Group, he has served as Commercial Manager for Hima Cement Limited, as the Marketing Director Bamburi Group, before his appointment as General Manager - Bamburi Special Products Limited in March 2012.
THE ExECUTIVE MANAGEMENT COMMITTEE

20 BAMBURI CEMENT LIMITED I PART OF YOU. FROM THE START
CORPORATE INFORMATION
2012 ANNUAL REPORT & FINANCIAL STATEMENTS 21
CORPORATE INFORMATION
REGISTRARS Custody & Registrars Services Limited
Bruce House, Standard Street
P. O. Box 8484 – 00100
Nairobi, Kenya
AUdITORS Ernst & Young
Kenya-Re Towers, Upper Hill
P.O. Box 44286 00100
Nairobi, Kenya
PRINCIPAL BANKERS Citibank N A
Citibank House, Upper Hill
P. O. Box 30711 – 00100
Nairobi, Kenya
Citibank NA Uganda
Centre Court Nakasero
P. O. Box 7505
Kampala, Uganda
Standard Chartered Bank Uganda Limited
Speke Road Branch, 5 Speke Road
P. O. Box 7111
Kampala, Uganda
dIRECTORS Executive H Mansi (Egyptian) Managing Director D Njoroge (Kenyan) General Manager, Hima Cement Limited E Kironde (Ugandan) Finance Director
Non-Executive J Simba (Kenyan) -Chairman Appointed on 29 November 2012 R Kemoli (Kenyan) Resigned on 29 November 2012 J Stull (American) Resigned 23 February 2012 S W Karanja (Kenyan) C C Kisire (Kenyan) S M’Mbijjewe (Kenyan) D Brugier (French) C Langreney (American) Appointed 7 June 2012 T Farrell - (American) Appointed 7 June 2012 F Olivares (Italian) (alternate to T Farrell) Appointed 7 June 2012 SECRETARY B Kanyagia Kenya-Re Towers, Upper Hill P .O. Box 10921 – 00100 GPO Nairobi, Kenya
REGISTEREd OFFICE Kenya-Re Towers, Upper Hill
P .O. Box 10921 – 00100 GPO
Nairobi, Kenya

2012 ANNUAL REPORT & FINANCIAL STATEMENTS22 23BAMBURI CEMENT LIMITED I PART OF YOU. FROM THE START
STATEMENT OF CORPORATE GOVERNANCE
INTROdUCTION Following the events in 2012 affecting several companies, the conviction of the Board of Directors of Bamburi Cement Limited that good governance is mandatory to manage the business effectively, responsibly and in a manner that is transparent and reflects accountability was reinforced.
The Board recognizes that for governance to be effective, it must be realised through leadership and collaboration. With this in mind, the Board compliments, enhances and supports the Executive.
This statement provides necessary information to enable investors to evaluate the application of the Group’s governance obligations, that the Group has complied with the obligations and therefore satisfied its obligations thereunder.
BOARd MandateThe Board of Directors is responsible for the long term success of the Group and remains, at all times, accountable to the shareholders for performance and risk management.
Separation of RolesThere is a clear division of responsibilities between the running of the Board and that of the Executive. The schedule of matters reserved for the Board details specific company affairs the Board does not delegate.
The division of responsibility between the Chairman and the Managing Director is agreed by the Board. The Chairman’s role is to lead and manage the business of the Board, provide direction and focus to the Board while ensuring existence of clear structures for the effective operation of the Board and its committees. The Chairman also leads high level relationships with regulators and shareholders.
The Managing Director’s role is to provide leadership to the Executive, management of the business, development of strategy for consideration and approval by the Board following which the CEO ensures implementation.
Board Meeting AttendanceBoard members devote such time as is necessary for the proper performance of their duties including attendance of all board and committee meetings together with shareholder meetings.
MembershipThe Board recognizes the benefits of diversity, be it of gender, nationality or background, both at the Board level and throughout the Group. There are six nationalities represented on the Board. In 2012, a second female director was appointed bringing the current female representation on the Board to 25%.
The Group continuously refreshes the composition of the Board to draw upon the experience of the longer serving directors while tapping into the new external perspectives and insights brought by the more recent appointees.
The Board has a strong independent element, currently comprising of the Chairman and four directors, which is well placed to constructively challenge and support the executive. The independent directors are considered independent in character and judgement from any business or other relationship that could materially interfere with the exercise of their judgement.
In addition, the Board has two non-executive directors, bringing the total non-executives to seven. The non-executive directors have a particular responsibility to ensure the business strategy proposed by management is fully discussed and critically reviewed
Training & Evaluation
Induction & TrainingUpon appointment, Directors are provided with a reference manual containing all information on legal obligations the Directors should be aware of. The manual
Director Category 23 February 7 June 2 August 29 November
R Kemoli Non-executive √ √ √ x
C Kisire Non-executive √ √ √ √S M’Mbijjewe Non-executive √ √ x √S Karanja Non-executive √ √ √ √H Mansi Executive √ √ √ √
J Stull Non-executive x x n/a n/aD Brugier Non-executive √ √ √ √D Njoroge Executive √ √ √ √E Kironde Executive √ √ √ √T Farrell Non-executive n/a x¹ x¹ x¹C Langreney Non-executive n/a √ x √Alternate Alternate to 23 Februray 7 June 2 August 29 NovemberF Olivares T Farrell n/a √ √ √
¹ Represented by his alternate
STATEMENT OF CORPORATE GOVERNANCE
also contains items such as the Board Charter, Articles of Association and Code of Business Conduct Policy.
The Company Secretary designs and facilitates a tailored induction programme for new directors, which include visits to all group sites and meetings with senior management to enable the new Directors develop a full understanding of the Group’s business.
Continuous training is availed to keep the Directors up to date on legal, regulatory and governance matters.
The Directors have access to Management together with access to the advice of the Company Secretary and any other experts at the cost of the Group.
Performance EvaluationThe Group carried out an evaluation of the board performance to review performance and/or effectiveness, identify actions to improve performance and establish a benchmark for measuring future progress. The evaluation aims also to capture open and constructive feedback on board mandate, board culture, relationships with senior management, effectiveness of induction and training.
During the evaluation, the Board reviewed the performance of the overall board, the Chairman and individual directors. The evaluation involved review by each director and the Company Secretary evaluating overall board performance, review of the performance of the individual directors by the Chairman and Managing Director together with evaluation of the Chairman’s performance by the Managing Director, the General Manager – Hima Cement and the Company Secretary.
During the year, the Board had four Board meetings.Board Meeting Attendance (continued)

2012 ANNUAL REPORT & FINANCIAL STATEMENTS24 25BAMBURI CEMENT LIMITED I PART OF YOU. FROM THE START
An analysis of the reviews was undertaken and reports prepared for each director and the overall board. The overall board performance report was discussed and action plans developed to improve performance. These plans are continuously reviewed by the Board.
The Group is pleased to confirm that each board member continues to perform effectively and to demonstrate full commitment to their role on the Board.
Board CommitteesAudit CommitteeThe Audit Committee considers existing and emerging risks that could impact on the Group, review adequacy of the internal control environment, evaluates the effectiveness of the audit process, ensures quality corporate accounting and financial reporting while approving the mandate, resources and plans of the internal audit function.The Audit Committee serves as the link between internal and external audit facilitating the necessary independence from management.
The Committee is required to meet at least four times a year. The meetings are scheduled in November of the previous year and are normally held the day before the Board meeting. The Audit Committee held five meetings in 2012. The Committee held meetings with the outgoing auditors in the absence of management to review any concerns the auditors may have had. Deloitte & Touche confirmed there were no issues outstanding.
The Committee also met the incoming auditors, reviewed their work plan and team experience while also reviewing the auditors fees. The Committee made its expectations of the auditors clear during this meeting.
Director 22 February 6 June 1 August 13 September 28 November
S M’Mbijjewe √ √ √ √ √C Kisire √ √ √ √ √D Brugier √ √ √ x √AuditorsS Kibirige √ √ √ √ √
Deloitte & Touche √ √ n/a n/a n/aErnst & Young n/a n/a n/a √ n/a
STATEMENT OF CORPORATE GOVERNANCE
Nomination & Corporate Governance Committee
The NCGC is responsible for nomination of appointments to the Board and its committees together with compliance to corporate governance rules and regulations.
Nomination
The Committee ensures the appropriate balance of skills, experience, independence and knowledge of the Company/industry. The Committee sets criteria (subject to Board approval) for time availability and diversity sought when searching for new directors.
In 2012, there were vacancies to be filled on the Board. The Committee reviewed nominated candidates and identified other potential candidates. The shortlisted candidates were interviewed and nominations for appointment made to the Board. As a result, two non-executive directors and one independent non-executive director were appointed.
Governance
The Committee ensures governance to facilitate effective, efficient and entrepreneurial management that will deliver long term shareholder value. The Committee also reviews
compliance and any departures from the corporate governance rules and regulations to ensure actual practises are consistent with good governance.
The Committee is also responsible for review of declaration by Directors in respect of conflict of interest and assessing any potential conflict of interest situations, for which it makes recommendations to the Board.
Executive Committee
The Executive Committee is appointed and chaired by the Managing Director. It consists of individuals responsible for key components of the business i.e. Finance Director, Industrial Director, HR & Organization Director, Sales Director, Supply Chain Director, Corporate Affairs, General Manager – Bamburi Special Products and General Manager – Hima Cement. The Managing Director has also created several other committees, which have specific responsibilities and mandates e.g. the land committee, the business continuity committee etc.
Company Secretary
The Secretary, who is also secretary to all committees of the Board, advises the Board on board procedures and all
corporate governance matters, ensures information to the Board is available in a timely manner, arranges for board training, induction and site visits.
The Secretary supports the Chair in planning the agendas and performance management for the Board and committees.
CONTROL ENVIRONMENT MANAGEMENT
Risk Management
The Board is responsible for ensuring all significant risks associated with the Group’s business are effectively managed through internal controls.
The Group’s risk management programme goes beyond the legal and regulatory issues to consider overall strategy and changes in the environment in which the Group operates.
The programme is designed to manage and mitigate risk, providing reasonable rather than absolute assurance against material misstatement, errors, losses or fraud.
Internal Controls
The Board, through the Audit Committee, reviews areas of significant risk and related controls together with the effectiveness of those controls.
The internal control procedures are designed for risk identification and monitoring, financial reporting, process documentation and review together with internal audit.
The Board has reviewed the assessment of risks and the internal control framework of the Group for the year under review and is satisfied with the effectiveness of the system of control in operation.
Code of Business Conduct
The Board is responsible for the promotion of the Group values of ambition, ownership and accountability.Accountability is ensured through the Code of Business conduct policy, which defines the standards of behaviour and expectations in respect of competition, corruption, insider trading, health, safety, discrimination, harassment, environment and financial reporting. All members of the Board, management and employees are required to act with the highest standard of business integrity, to comply with applicable laws and ensure business standards are not compromised for the sake of results.
In 2012, day to day management of the Code of Business Conduct policy was moved from the HR department to
the Company Secretary, who then reports to the Board. A group wide refresher training and awareness campaign commenced during the year and is scheduled to be completed in 2013. Each employee is expected to sign a personal commitment form in respect of compliance to the Code of Business Conduct and contravention will lead to disciplinary action.
Whistleblowing
For several years now, the Group has had a whistle blowing policy that provides for confidential reporting of any suspected breaches of the Code of Business Conduct and any other concerns in respect of business practises.
COMMUNICATION
The Group values open, constructive and effective communication with its shareholders and other stakeholders. The Group also takes cognisance of the importance of explaining its business development and financial
results. This is achieved through various forums including the website which contains a wealth of information.
The Chief Executive Officer held several interviews on relevant topics with the media
and participated in a live television debate.
Annual General Meeting
The Group holds an Annual General Meeting of the Company each year
and notice of the meeting is provided at least a month in advance. The AGM provides a forum for discussion on the financial results and include a question and answer session.
In 2012, the AGM was held in Mombasa on 7 June 2012 and was attended by all directors, in person or by proxy, who were available to answer any questions the shareholders had. The external auditors were also present and responded to shareholders’ questions. The meeting recorded the highest shareholder attendance in recent times.
Investors
The Group values the opinions of private investors and continued to engage them throughout the year. The Managing Director and Finance Director met with representatives from different investment managers to provide updates on the Group’s performance and plans while also addressing any questions from the investment managers.
To address any shareholder and investor issue two email addresses for the Finance Director and the Company Secretary were opened during the year. The addresses have already recorded significant email traffic.
STATEMENT OF CORPORATE GOVERNANCE
Financial ResultsThe Group announces its financial results every six
months. A summary of the annual and
half year results are published in two
daily newspapers and posted on
the website. The shareholders also get a copy
of the annual report that contains the full year results.
Audit committee meeting attendance

2012 ANNUAL REPORT & FINANCIAL STATEMENTS26 27BAMBURI CEMENT LIMITED I PART OF YOU. FROM THE START
SHAREHOLdER INFORMATION
The top major shareholders, based on the Share Register as at 31 December 2012 are as followsRank Name of Shareholder Shares %age 1 Fincem Holding Limited 106,360,798 29.30% 2 Kencem Holding Limited 106,360,797 29.30%
3 Paramount Company Limited 27,400,000 7.55% 4 Standard Chartered Nominees Resd A/C KE11422 10,253,127 2.91% 5 Standard Chartered Nominees Resd A/C KE11415 8,635,130 2.38% 6 Standard Chartered Nominees Resd A/C KE11450 8,603,131 2.37% 7 Standard Chartered Nominees Resd A/C KE11443 8,603,130 2.37% 8 Standard Chartered Nominees Resd A/C KE11436 8,603,130 2.37% 9 Standard Chartered Nominees Resd A/C KE11401 8,603,130 2.37% 10 Baloobhai Chhotabhai Patel 5,000,990 1.38%
SHAREHOLdER INFORMATION
Top 10 shareholders as at 31 December 2012 Share analysis by volume as at 31 December 2012
Shareholders analysis by domicile as at 31 December 2012
Foreign Institutions 250,924,881 69.13% 57Foreign Individuals 300,562 0.08% 50Local Institutions 99,544,668 27.43% 652Foreign Individuals 12,189,164 3.36% 2,284
TOTAL 362,959,275 100.00% 3,043
NUMBER OFDOMICILE NUMBER OF SHARES % HOLDERS
Directors’ shareholding as at 31 December 2012
Chris Kisire 1,000TOTAL 1,000
Name of Director Number of Shares
1 – 500 234,205 0.065% 1,166 501 – 5,000 2,300,825 0.634% 1,140 5,001 – 10,000 1,633,115 0.450% 228 10,001 – 100,000 11,645,896 3.209% 363 100,001 – 1,000,000 37,632,341 10.368% 128 1,000,001- 99999999999 309,512,893 85.275% 18 TOTAL 362,959,275 100.00% 3,043
NUMBER OFCATEGORY NUMBER OF SHARES % HOLDERS
Distribution Schedule

2012 ANNUAL REPORT & FINANCIAL STATEMENTS28 29BAMBURI CEMENT LIMITED I PART OF YOU. FROM THE START
MANAGEMENT’S dISCUSSION ANd ANALYSIS OF FINANCIAL CONdITIONS ANd RESULTS OF OPERATION
SECTOR HIGHLIGHTS1
Cement consumption in East Africa was estimated at 8.5 million tons, which represents a growth of 6% over 2011 levels. The market in Kenya grew by 6% to 3.7 million tons on the back of government investment in infrastructure development projects, while the market in Uganda contracted slightly by 4% to 1.7 million tons mainly as a result of supply constraints in the first half of the year and a reduction in government infrastructure spending. Growth in both markets was however constrained in the period due to a tight monetary regime in the first half of the year.
The sector witnessed an increase in grinding capacity with one new entrant and expansion of capacity by two existing Cement Companies. The Kenya and Uganda markets are projected to remain in a Cement surplus but with a clinker manufacturing deficit.
The Group has continued to pursue a strategy of maximizing shareholder value through vertical integration. This strategy, is expected to secure the Group’s market by growing the cement market and deepening the Group’s reach in the supply chain.
The Group further expects to secure its market share through commercial initiatives, namely, the dealer loyalty program and the retail program, both of which will build a sustainable route to market.
As the market becomes more competitive, there has been pressure on prices that has resulted in a sub-optimal cost pass through mechanism. The Group has therefore taken a more rigorous focus on reducing costs particularly management of energy costs to protect shareholder value, while at the same time maintaining high brand visibility and maintaining its position as the market leader.
The Group’s outlook for the region remains positive. However the Group takes cognizance of the high likelihood of a slow start in the year especially in Kenya as the country comes out of the election period, while in
Uganda the effect of withdrawal of donor support may continue to linger in the first half dampening infrastructure projects. But with lower interest rates, the Group expects the private sector, particularly Individual Home builders to drive cement demand in Uganda. Exports to the Inland Africa markets are expected to bounce back after easing of political tension, but we remain cautious as to the risk of resumption of hostilities. The Group will continue to be cushioned from foreign exchange volatility through its dollar denominated sales to Inland Africa markets.
SEGMENT HIGHLIGHTSKENYABamburi Cement Limited
The Company‘s operating profit declined by 6% to Shs 4.2 billion driven by a 15% growth in cost of sales arising from higher consumption of imported clinker, with 425 kilo tons of clinker consumed in 2012 compared to 186 kilo tons in 2011. The higher reliance on imported clinker arose from the delays in the Electrostatic Precipitator (ESP) conversion to Bag filter. The project was commissioned in August 2012 and the plant resumed normal operations and we are already seeing the benefits of this conversion.
The Group has a revaluation policy which requires it to carry out a revaluation of fixed assets every five years. In the last quarter of 2012, the Company undertook an asset revaluation of fixed assets that recognized an increase in the value of Property Plant & Equipment as well as Land and Buildings of Shs. 6.5 billion. This increase has been shown under Other Comprehensive Income and in Equity, as required by International Accounting Standards.
The significant increase in value, is as a result of the sharp increase in real estate values witnessed in the Kenya in the last few years, as well as recognition of changing land use around the sites that we operate in.
Sales and Marketing
Domestic volumes grew by 12% to 1.6 million tons of cement with a 12% growth in revenue to Shs. 22.9 billion. Export volumes remained relatively flat at 423 kilo tons.
1Source: East African Cement Producers Association

2012 ANNUAL REPORT & FINANCIAL STATEMENTS30 31BAMBURI CEMENT LIMITED I PART OF YOU. FROM THE START
MANAGEMENT’S dISCUSSION ANd ANALYSIS OF FINANCIAL CONdITIONS ANd RESULTS OF OPERATION
Exports experienced growth in the first half and slow activity in the second half mainly due to reduced demand from inland Africa export market which experienced political instability in the period. The Company continues to run the Dealer Loyalty Program and was successful in rolling out the Retail Program in the year.
OperationsThe plants continued a clean run in the year with the Nairobi Grinding Plant achieving 6 years without any Lost Time Injury (LTI) and the Mombasa plant achieving two years without LTI. The Company continues to encourage management participation in driving the safety culture and there was an increased participation in the Visible Felt Leadership program. The Company’s Team Based Safety Program was reorganized to recognize the main areas where the Group wanted to focus on and to align the teams to the organization structure, in a bid to enhance safety discussions within the functions.
Clinker production was lower by 9% compared to 2011 as a result of delays in the start of the ESP conversion project which resulted in the plant deliberately reducing output to manage dust emissions which the Company regularly monitors.
The Nairobi Grinding plant production grew by 10.5% compared to 2011 while production in Mombasa grew by 4% compared to 2011. The plants have the capacity to respond to an increase in demand by leveraging on the cement to clinker ratio. This has been made possible through the implementation of the Plant Operating Model that aims to make each plant self sustaining.
Mombasa Plant was recognized as the second best site in the Lafarge group-wide Biodiversity awards for its plant greening project launched in June 2012. By December, more than 1,500 indigenous trees, shrubs and fruit trees had been planted in the plant.
Costs
Variable costs grew by 18% on account of higher use of more imported clinker. Industrial Fixed costs remained relatively flat compared to 2011, while Selling General and
Source of macroeconomic figures: Economist intelligence unit (eiu)Source of cement market figures: East African Cement Producers Association (EACPA)
Administrative Costs increased by 12% mainly on account of one off staff costs. The Company expects inflationary pressure on fixed costs, while keeping variable costs in check except for the effects of any domestic power price increases, global commodity price changes, and changes on account of exchange rates fluctuations.
Bamburi Special Products
Bamburi Special Products Limited (BSP), a wholly owned subsidiary, is the largest supplier of Ready mix concrete and precast blocks in Kenya. Revenues grew by 20% to Shs1.45 billion driven by 9% growth in Precast sales volumes with total dispatches of 801,458 m² (733,277 m² in 2011) and 30% growth in Ready-mix concrete sales volumes with dispatches of 63,520 m³ (48,731m³ in 2011). Revenues grew by 12% for Precast driven by increased volumes, better price and a better product mix while Ready-mix concrete revenues grew by 28% on account of increased volumes. The market in Nairobi has recorded an increase in the number of players offering Precast products and the Company expects downward pressure on price. However, the Company plans to mitigate this by leveraging on a wider product range, quality of products and superior customer service. In the Ready-mix segment, the market has shown increased uptake of ready mix concrete as a convenient alternative to conventional concrete mixing processes and the Company expects this segment to experience continued growth.
Profit before tax dropped by 39% to Shs. 56 million mainly attributed to higher raw material costs and the effect of higher production fixed costs to cover the increased plant capacity, as well as increased distribution cost after the Company expanded its fleet. The trucks used to transport Ready-mix concrete are on lease and this segment will continue to be sensitive to fluctuations in the interest rates, as was the case in the first half of the year.
Our Ready-mix concrete capacity was enhanced with the commissioning of a 60 m3 per hour plant in Industrial Area and acquisition of 4 new ready mix trucks as well as a mobile pump. These investments will allow the Company to meet the growing market demand and entrench our position as the market leaders in concrete products.
BSP reported over 5 years without LTI by year end supported by an increase in the number of staff engaged by managers through the Visible Felt Leadership Program and the number of safety observations made by staff. The increased management and staff participation is part of BSP’s efforts to make its operations safer and therefore more sustainable.
Lafarge Eco-Systems LimitedLafarge Eco-Systems Limited (LES) is a wholly owned subsidiary incorporated to sustainably utilize Bamburi Cement’s land and rehabilitate the quarries, using the land and quarries as a showcase of environmental responsibility and also to engage neighboring communities and other stakeholders. In 2012, LES operating profit grew by 84% to Shs. 5.6 million driven by increased revenue from tourism, land management and housing.
In the course of 2012, Haller Park and Bamburi Forest Trails attracted a total of 156,830 visitors, a 12% decline compared to 2011 which was as a result of declining tourist arrivals to the coastal region, especially from traditional tourist markets. The reduction in overseas tourists was attributed to security concerns and subsequent travel advisories issued by key tourist markets. LES was able to increase tourist gate fees in the period and despite a fall in the number of overseas tourists, it’s focus on increasing local tourists resulted in an increase in the number of visitors from local educational institutions.
Biofuel Project
LES increased the area under the Biofuel plantation cover by an additional 68 hectares, bringing the total coverage to 768 hectares by the end of the year. An audit of the plantations to assess productivity of the plantations was undertaken in the year and a review of the feasibility of integrating the wood into the Mombasa Plant Biomass Fuel Program made. The results of the audit revealed a low yield on account of climatic conditions that affected the Coastal region. LES undertook to introduce management practices to improve the yield and give the plantation time to mature before carrying out another audit.
The Biofuel Project has been instrumental in improving stakeholder relations and community integration which has helped avoid encroachment into company land and thereby securing reserves. The project has provided employment opportunities for communities around the limestone reserve lands of Diani and Vipingo who benefit from the Shamba System (permission to farm in mature sections of the plantation). In addition, the communities have access to a readily available market for seedlings they produce. During the year, LES paid KSh.3.7m for the purchase of tree seedlings from the community based tree nurseries.
In 2012, LES in partnership with World Wide Fund for Nature (WWF), local administration in Kilifi and Kwale counties, as well as the National Environmental Management Authority (NEMA) brought together land owners and miners to create awareness on and develop guidelines for sustainable mining of coral blocks and rehabilitation of the quarries. The National Environmental Management Authority (NEMA) selected Haller Park to host the national World Environment Day celebrations, where Bamburi’s restored quarries featured as a key rehabilitation showcase. Lafarge Eco Systems also participated in an exhibition at the bi-annual African Ministerial Conference on the Environment in Arusha, where it not only showcased quarry rehabilitation but other Lafarge environmental programs. Haller Park received recognition from TripAdvisor, the world’s largest internet travel site, for earning exceptional traveler ratings over the past year. The Company expects tourism numbers to resume their upward trend after the elections and a with fewer security concerns on account of the improving security situation in Somalia.
UGANdAHima Cement Limited
Hima’s profit before tax dropped to Shs. 2.3 billion compared to 2011 mainly due to a higher cost environment as a result of higher power price, volatile global fuel prices, resulting in increased input prices and freight charges. The removal of the power subsidy by the Government of Uganda at the beginning of the year, led to a 70% increase in power prices.
MANAGEMENT’S dISCUSSION ANd ANALYSIS OF FINANCIAL CONdITIONS ANd RESULTS OF OPERATION

2012 ANNUAL REPORT & FINANCIAL STATEMENTS32 33BAMBURI CEMENT LIMITED I PART OF YOU. FROM THE START
As part of the Group’s revaluation exercise undertaken in the last quarter of 2012, the Company recognized an increase in the value of Property Plant & Equipment as well as Land & Buildings of Shs. 760 million. This has been shown under Other Comprehensive income and Equity, as required by International Accounting Standards.
Sales
Turnover, at Shs. 17 billion, was flat compared to 2011 with domestic volumes lower by 16% because of the challenges in the Uganda domestic economy in the year, lower than expected plant performance in the first half of year and increased competitor activity in the second half, following commissioning of additional capacity. Domestic revenues experienced a lower decline than the volume decline, going down by 10% compared to 2011, as the Company was able to partially recover the increase in cost of inputs through pricing actions. Export volumes grew by 13% in 2012 mainly in the Rwanda market.
However, sales to the Democratic Republic of Congo (DRC) were depressed in the second half of the year due to conflict in the Goma/Kivu region, while sales to South Sudan were depressed due to unavailability of dollars in that market, arising from inability to export oil. We were able to increase export revenues by 8% on account of improvements in the distribution network, a good first half export volumes into DRC and overall favorable pricing actions.
Operations
The plant achieved two years without Lost Time Injury (LTI) with a significant increase in the number of discussions held between management and staff on safety, through the Visible Felt Leadership program as well as increased participation of staff in the Team Based Safety Program.
Clinker production remained relatively flat compared to 2011 although we had expected a significant improvement in clinker output compared to 2011. The main driver for the lower than expected output was power interruptions where the plant lost 300 hours on account of power failures. Although the plant has installed
standby generators to run the kilns, it continues to suffer from unplanned interruptions that disrupt operations. This situation is expected to continue and the Company remains committed to finding a lasting solution through continued engagement with the power distributor.
In addition, the plant suffered 270 hours on account of failure of the Electrostatic precipitator, which is sensitive to power interruptions. This resulted in additional plant downtime and lower output in a bid to manage dust emissions. Similar to the Mombasa plant project completed in August 2012, the Company will be installing a new bag filter in 2013 at the Kasese plant to address this problem.
The Plant achieved a record global Biomass Alternative Fuel (AF) substitution of 44% compared to 34% in 2011 on account of improvement in management of the alternative fuel supply chain which improved stock availability and quality, optimizing mixing ratios and an additional investment in a biomass feeder system. We expect to achieve greater substitution going forward. And as the substitution ratio increases and the domestic economy grows, the Company expects that competition for the available biomass will increase. The Company has therefore instituted measures to manage the potential increase in the price of alternative fuels through better management of the supply chain as well as through diversification of the types and sources of biomass.
Cement production was 6% lower compared to 2011 mainly on account of power interruptions that accounted for 732 hours downtime on our main mill which was equivalent to one month’s loss in cement production. Power interruptions will continue to affect plant operations, at least in the short to medium term. The Company has therefore focused on improving process mastery through the Plant Operating Model, in a bid to be more responsive to changing operating condition and therefore maximize the plant’s production opportunity. In addition to this, we shall continue having discussions with the power utility provider on the improvement of power quality to the plant, while exploring other alternatives to stabilize power.
MANAGEMENT’S dISCUSSION ANd ANALYSIS OF FINANCIAL CONdITIONS ANd RESULTS OF OPERATION

2012 ANNUAL REPORT & FINANCIAL STATEMENTS34 35BAMBURI CEMENT LIMITED I PART OF YOU. FROM THE START
Costs
Variable costs grew by 7% mainly on account of higher power prices. This was partly mitigated by an increase in the level of biomass alternative fuel substitution. Industrial Fixed costs grew by 9% on account of low plant reliability which resulted in increased expenditure on maintenance expenses, while Selling General and Administrative Costs increased by 42% mainly on account of increased marketing spend, legal fees and expenditures incurred in defending a claim on our quarry by a third party and changes in Uganda VAT tax legislation that rendered previously recoverable tax as
irrecoverable. The depreciation of the Uganda shilling is expected to exert upward pressure on the price of inputs due to the increased cost of imports. The Company will be undertaking a series of projects to improve energy consumption and carry out further improvements in the alternative fuels supply chain to manage the cost of biomass. However transport costs and the knock on effect on delivered costs will remain subject to fluctuations of global commodity prices. The Company expects inflationary pressure on fixed costs and is carrying out an aggressive campaign to review costs with the aim of maintaining a low cost base.
MANAGEMENT’S dISCUSSION ANd ANALYSIS OF FINANCIAL CONdITIONS ANd RESULTS OF OPERATION
Health and Safety
OverviewDelivering a safe and healthy work environment for our employees and contractors is a key priority for the company. We pride ourselves in our commitment to uphold good health and safety practices and behaviors, not only within and outside our premises, but with every single point along our supply channel in the region. This is a commitment that Lafarge has made for all its operations worldwide.
We take every effort to ensure that an employee’s well being (physical, emotional and financial) is considered as this affects them both at home and at work. Bamburi Cement has implemented workplace health programs aimed at improving health and well-being of workers, their dependents, contractors and other stakeholders.
These are programs designed to avert the occurrence of diseases or the progression of disease from its early unrecognized stage to one that is more severe. At their core, these programs support primary, secondary, and tertiary prevention efforts. Examples of primary prevention include programs that encourage exercise and fitness, healthy eating, weight management, stress management, use of safety belts in cars, moderate alcohol consumption and recommended adult immunizations.When it comes to safety, we have over the years put in place several far-reaching measures to achieve the highest-level in safety – through our policies and standards, and we have achieved significant milestones in our journey towards achieving zero fatalities at all our operations.
2012 begun on a positive note with the Health and Safety team’s main focus looking at: Promoting Area Ownership, Improving Frontline Supervision and Risk Management. Seven areas were identified including Road Transport Safety, Risk Management, Documentation and Record Keeping, Area Ownership, Mobile Equipment, Energy Isolation and Health. We will continue to address these identified areas by involving all our staff and contractors in order to create ownership while strengthening the role of Health and Safety leadership at all our sites.
Industrial Safety and Health
2012 provided us with our strongest performance since 2006 on leading indicators (effectiveness in engaging staff). We enhanced our success in managing safety through increasing the level of management and shop floor employee involvement in the promotion of a safe working environment. This included our Visible Felt Leadership (VFL) program which achieved 95% participation from managers discussing various H&S issues at the plants and suggesting improvements to be reviewed and implemented. We also saw significant improvement in our staff and contractor engagements in Health and Safety training.
As healthier employees contribute to the bottom line, we continued to implement the Lafarge Group Standard on Health. This standard amongst other elements, improved our Medical Emergency response process, and implementation of our Health Assessment Operating Procedure (HASOP). One key initiative was to undergo our annual detailed review of the health status of our employees through a health assessment program. This has and continues to enable us to address potential health issues at all our sites.
Externally, we partnered with the German Technical Development (GIZ) to expand the Bamburi Cement health workplace program through health promotion to reach out to contractor employees and surrounding communities. A total of 30 workers from 14 transport contractors and 70 workers from 30 plant health contractors were trained in financial wellness, occupational stress (fatigue), WASH (Water and Sanitation Hygiene), HIV, Malaria and TB.
Road Safety
Every year, we loose 3,000 lives on the Kenyan roads through road carnage. For every 8 trucks on the Northern corridor in any day, 1 truck is working for Bamburi Group and is owned by a contracted transporter.
Championing a road safety culture of achieving zero accidents is key to advocating for safer roads and part
SUSTAINABILITY STATEMENT

2012 ANNUAL REPORT & FINANCIAL STATEMENTS36 37BAMBURI CEMENT LIMITED I PART OF YOU. FROM THE START
Marketing
In 2012, we run an Integrated Marketing communications campaign dubbed ‘Structures Don’t Lie’ in both the Kenya and Uganda markets.
The campaign objective, is in line with the Company’s’ overall marketing strategy to build and leverage brand through marketing communications and is part of an evolving phased campaign that was launched in 2010.
The campaign was executed on various platforms, the first being mass media advertising campaign which was aired in the early part of the year on TV, radio, billboards and select magazines to drive brand awareness and entrench brand proposition. In 2012, we launched the second phase of the advertising campaign on account of feedback from the market that the message was fresh, relevant and that it continued to resonate in the minds of our consumers, staff and other stakeholders. It was also true of our brand.
The second platform that the campaign run on was direct marketing to increase brand knowledge and relevance amongst end users namely masons, foremen, engineers, and contractors among other opinion leaders within the Industry. This was done through face-face discussion forums whose main agenda was best construction practices, product performance and application. We engaged with more than 2,000 end users of our brands.
Another aspect of the campaign was trade branding activations, to increase visibility at point of purchase. This entailed branding numerous customer shops countrywide. These branding exercises were augmented by tactical market storms targeted at retailers who received branded merchandise that showed our appreciation for their support and hard work. Retailers used the merchandise to appreciate their customers and encourage them to continue purchasing our brands.
A final aspect was the recognition and celebration of our channel partners (dealers and retailers) through feting events in their honor and presentations performance awards to the top customers which was greatly appreciated by our partners and which further reinforced our value and drive for a performance oriented culture.
of responsible business practices. We have over the years engaged in partnerships with stakeholders through initiating Road Safety awareness campaigns, targeting our employees, drivers, contracted transporters and all other road users to address this problem.
This year, we implemented 5 pillars of the Logistics Advisory from Lafarge Group. This enabled us to align our activities and create a systematic approach to road safety management. We went a step further, towards the end of the year where we partnered with other corporate partners and NGOs on the ‘Safe Way, Right Way’ campaign which focused on changing drivers’ behaviour and attitude while on the road. We unfortunately, experienced three fatalities on our roads and although this was a setback to our strong safety record, we will continue to engage with our transport contractors in our road safety initiatives.
Human Resources
Lafarge is recognized amongst the world’s top industrial companies in attracting and developing the best local talents and teams in every market where we operate. We select individuals who are innovative, market driven and performance oriented while living Lafarge Group Principles of Action in everything they do.
Significant strides were made in 2012 in the identification of strategic levers for our People Agenda; these included leadership development, technical development and reward management. Our 360º feedback process was launched for our key managers to enhance their development and we continue to certify our technical teams to achieve plant operational mastery through superior expertise. Our revised variable reward scheme is a critical base for our pay for performance strategy and will support our drive for excellence .
Our highly technical operations and competitive commercial environment have necessitated robust sourcing strategies to ensure that we get the right people on board to sustain our operations, but we remain committed to ensuring that we optimize our structures to obtain efficiencies.
SUSTAINABILITY STATEMENT
Corporate Social Responsibility and Stakeholder Engagement
Our focus continues to be on sustainable relationships with our stakeholders at the local and national level. As members of Lafarge Group, we have entered a new phase in our sustainability commitment with the launch of Sustainability Ambitions 2020. The 34 new sustainability ambitions are organized around the three main pillars of sustainable development - social, economic and environmental – and they are coupled with demanding quantitative targets.
Environment
KenyaWe made significant strides towards achieving our milestones in the environment agenda. We successfully commissioned a newly installed bag filter technology in our Mombasa Plant operations (investment of Shs 540 Million), which is a key milestone in the Company compliance to Global Environmental Standards and in line with our Sustainability Ambition goals. A similar investment of Shs 300 million has been put into upgrading the Electrostatic Precipitators installation with more efficient bag filter technology in Uganda. This is scheduled to be completed within the first half of 2013.
In line with our sustainability ambitions, we held various high level stakeholder meetings including engagements with Ministry of Local Government and other stakeholders to engage on the proposed implementation in Mombasa of a municipal waste recovery management system; and with high level private sector teams and NEMA in regards to the validation of an organizational model for Waste Tyre Management in Kenya.
Through Lafarge Eco Systems, our environmental and rehabilitation arm of the business, we were awarded a ‘Certificate of Excellence 2012’ by TripAdvisor.com for earning exceptional traveller ratings at Haller Park over the past year.
We continue to support other environmental initiatives with staff contributing to planting of trees in schools such as Mlolongo Secondary School, Machakos County and Sholinke Primary school, Kajiado County.
UgandaThe strong presence of Hima Cement in the region is cemented by our comprehensive corporate social investments in the areas of education, health, environment, and infrastructure development that have seen the organization spend over Shs 60 million to implement the programs. We have supported the Hima Town Council with the construction of their new administration block and construction of a storm water channel. Through partnership with SNV - Netherlands Development Organization, 11,000 (eleven thousand) seedlings were distributed to six schools and six women groups in Kanara Sub County, Kamwenge District. SNV’s role is to embark on capacity building for school administration, school management, women groups’ community leaders and school environment clubs.
Alternative Fuels
Bamburi Cement Group is leading in using environmentally friendly biomass by achieving and alternating 52% substitution of fossil fuels.
In Uganda, Hima Cement set aside over Shs 80 Million in a two year project to boost coffee production and improve small farmer holdings’ income in Kasese and Kamwenge Districts. The project was launched in April 2012 and will lead to improvement in the incomes of at least 41,000 smallholder farmers. Over 7.1 Million coffee seedlings will be distributed to coffee farmers through registered farmer organizations. This initiative provides a huge benefit to coffee production and to the livelihoods of the farmers and the community.
Education and Infrastructure development
Uganda Our partnership in and contribution to the Newspapers in Education (NiE) program continues to grow with a total of 20 primary schools enrolled in the program (10 in Kasese district and 10 in Kamwenge district).
We continue to support bright students from families that are financially challenged through the Hima Community Bursary Scheme, with the sponsorship in 2012 amounting to Shs 1.2 Million. We currently sponsor 21 students who are enrolled in the program.
SUSTAINABILITY STATEMENT
2012 ANNUAL REPORT & FINANCIAL STATEMENTS38 39BAMBURI CEMENT LIMITED I PART OF YOU. FROM THE START
The Directors have the pleasure of presenting their report together with the audited financial statements for the year ended 31 December 2012, which show the state of the Group affairs.
PRINCIPAL ACTIVITIES
The Group is primarily engaged in the manufacture and sale of cement and cement related products. The Group owns and maintains a world class nature and environmental park created from rehabilitated quarries.
dIVIdENdS
During the year, an interim dividend of Shs. 2.00 (2011- Shs 2.00) per ordinary share amounting to Shs. 726 million (2011 – Shs. 726 million) was paid.
Subject to the approval of the shareholders at the Annual General Meeting, the Directors recommend payment of a final dividend of Shs 8.50 (2011 – Shs 8.00) per ordinary share equivalent to a total sum of Shs. 3,086 million (2011 – Shs 2,904 million). dIRECTORS
The present Board of Directors is shown on page 14 and 15.
AUdITORS
Ernst & Young, who were appointed on 7 June 2012 in accordance with Section 159(1) of the Kenyan Companies Act (Cap 486), have expressed their willingness to continue in office in accordance with Section 159(2) of the Act.
By Order of the Board
B KanyagiaSecretary
28 February 2013
REPORT OF THE dIRECTORS
Group profit before tax 7,176 8,466Tax charge (2,294) (2,607)
Group profit for the year 4,882 5,859
Attributable to: Owners of the parent company 4,416 5,243Non-controlling interests 466 616
4,882 5,859
2012 2011Results Shs’million Shs’million
Hima Cement also supports infrastructure development. Civil works to construct a 6-stance eco-san toilet, at a cost of Shs 500,000 at Mwora Primary School in Kamwenge District commenced in November 2012, and will improve sanitation for over 600 pupils. A similar project to construct 5-stance VIP latrines was completed at Nyakakindo Primary School. This newly established community school, located in Hima Town Council, was using shallow pits with temporary shelter as toilets.
KenyaWe continue to support education through established organizations while also undertaking our own activities. We have supported Gongoni Secondary School in Vipingo with the construction of 2 classrooms worth Ksh1.9 million. This is a new community school which had only 2 classrooms, thus some of the children were learning in the neighboring primary school classrooms.
We also initiated the construction of a borehole worth Shs 450,000 to improve sanitation in Bamburi Primary
School. The school had in the past faced closure due to lack of proper hygiene and sanitation that was caused by rampant water shortages. Furthermore, in addition to infrastructure support, we have provided chairs and desks, and supported in the construction of toilets at Ngómbeni Secondary Schools Diani to Kadzandani Primary School, Gongoni Secondary School in Vipingo - donations all worth over Shs 1 Million.
The Group also donated Shs 1 million to the Kisauni Bursary Fund towards support of needy children who have gained admission to access secondary education. In addition, we have also contributed to the repair of three community feeder roads - Vipingo Trading Centre, road to Kadzandani Primary School in Kisauni and the road to Kwabullo sub-location in Kisauni.
In addition to these activities, we further offered support to the Mwembelegeza Welfare Association of Shs 300,000 towards the repair of two community boreholes.
SUSTAINABILITY STATEMENT

40 BAMBURI CEMENT LIMITED I PART OF YOU. FROM THE START
The Kenyan Companies Act requires the Directors to prepare financial statements for each financial year which give a true and fair view of the state of affairs of the Group and of the company as at the end of the financial year and of the operating results of the Group for that year. It also requires the Directors to ensure that the parent company and its subsidiaries keep proper accounting records, which disclose with reasonable accuracy at any time the financial position of the Group and of the parent company. The Directors are responsible for safeguarding the assets of the Group.
The Directors are also responsible for the preparation and fair presentation of these financial statements in accordance with International Financial Reporting Standards, the requirements of the Kenyan Companies Act and such controls as the Directors determine are necessary to enable the preparation of financial statements that are free from material misstatements, whether due to fraud or error.
The Directors accept responsibility for the annual financial statements. The Directors further accept responsibility for the maintenance of accounting records which may be relied upon in the preparation of financial statements, as well as adequate systems of internal financial control.
The Directors are of the opinion that the financial statements give a true and fair view of the state of the financial affairs of the Group and of the company together with the Group’s operating results.
Nothing has come to the attention of the Directors to indicate that the company and its subsidiaries will not remain going concerns for at least the next twelve months from the date of this statement.
Eric Kironde Director23 February 2013
Hussein Mansi Director23 February 2013
STATEMENT OF THE dIRECTORS RESPONSIBILITY

INdEPENdENT AUdITORS REPORT
REPORT OF THE INDEPENDENT AUDITORS TO THE MEMBERS OF BAMBURI CEMENT LIMITED
REPORT ON THE FINANCIAL STATEMENTS
We have audited the accompanying consolidated financial statements of Bamburi Cement Limited (the company) and its subsidiaries (together, the Group), which comprise the consolidated statement of financial position as at 31 December 2012, and the consolidated statement of comprehensive income, consolidated statement of changes in equity and consolidated statement of cash flows for the year then ended, together with the statement of financial position of the company as at 31 December 2012, statement of comprehensive income of the company, statement of changes in equity of the company and statement of cash flows of the company for the year then ended, and a summary of significant accounting policies and other explanatory information, as set out on pages 46 to 119.
dIRECTORS’ RESPONSIBILITY FOR THE FINANCIAL STATEMENTS
The directors are responsible for the preparation and fair presentation of these financial statements in accordance with International Financial Reporting Standards and in the manner required by the Kenyan Companies Act, and for such internal control as the directors determine is necessary to enable the preparation of financial statements that are free from material misstatement, whether due to fraud or error.
AUdITOR’S RESPONSIBILITY
Our responsibility is to express an independent opinion on these financial statements based on our audit. We conducted our audit in accordance with International Standards on Auditing. Those standards require that we comply with ethical requirements and plan and perform the audit to obtain reasonable assurance about whether the financial statements are free from material misstatement.
An audit involves performing procedures to obtain audit evidence about the amounts and disclosures in the financial statements. The procedures selected depended on our professional judgment, including the assessment of the risks of material misstatement of the financial statements, whether due to fraud or error. In making those risk assessments, we considered the internal control relevant to the company’s preparation and fair presentation of the financial statements
Ernst & Young Certified Public Accountants Kenya-Re Towers, Upperhill Off Ragati Road P.O. Box 44286 00100 Nairobi GPO - Kenya Tel: +254 20 2715300 Fax: +254 20 2716271 E-mail: [email protected] www.ey.com
REPORT OF THE dIRECTORSin order to design audit procedures that were appropriate in the circumstances, but not for the purpose of expressing an opinion on the effectiveness of the company’s internal control. An audit also includes evaluating the appropriateness of accounting policies used and the reasonableness of accounting estimates made by the directors, as well as evaluating the overall presentation of the financial statements.
We believe that the audit evidence we have obtained is sufficient and appropriate to provide a basis for our audit opinion.
OPINION
In our opinion, the accompanying consolidated financial statements present fairly, in all material respects, the financial position of the Group and of the company as at 31 December 2012 and of the financial performance and cash flows of the Group and the company for the year then ended in accordance with International Financial Reporting Standards and the requirements of the Kenyan Companies Act.
REPORT ON OTHER LEGAL REQUIREMENTS
As required by the Kenyan Companies Act, we report to you, based on our audit, that:
i) We have obtained all the information and explanations which, to the best of our knowledge and belief were necessary for the purposes of our audit;
ii) In our opinion, proper books of account have been kept by the Group and the company, so far as appears from our examination of those books; and,
iii) The company’s statement of financial position and statement of comprehensive income are in agreement with the books of account.
OTHER MATTERS
The Financial Statements of Bamburi Cement Limited, (the company) and its subsidiaries (together, the group), for the year ended 31 December 2011 were audited by another auditor who expressed an unqualified opinion of those Financial Statements on 23 February 2012
Nairobi
Ernst & YoungCertified Public Accountants (Kenya)
30 April 2013Nairobi
42 43

2012 ANNUAL REPORT & FINANCIAL STATEMENTS 45
FINANCIAL STATEMENTSFor the year ended 31 December 2012
Table of ContentsCONSOLIDATED STATEMENT OF COMPREHENSIVE INCOME 46
COMPANY STATEMENT OF COMPREHENSIVE INCOME 47
CONSOLIDATED STATEMENT OF FINANCIAL POSITION 48
COMPANY STATEMENT OF FINANCIAL POSITION 49
CONSOLIDATED STATEMENT OF CHANGES IN EQUITY 50 - 51
COMpANY STATEMENT OF CHANGES IN EQUITY 52 - 53
CONSOLIDATED STATEMENT OF CASH FLOwS 55
COMpANY STATEMENT OF CASH FLOwS 56
NOTES TO THE FINANCIAL STATEMENTS 57 - 119
NOTICE OF ANNUAL GENERAL MEETING 120 pROxY FORM 121 - 122

46 BAMBURI CEMENT LIMITED I PART OF YOU. FROM THE START 2012 ANNUAL REPORT & FINANCIAL STATEMENTS 47
FINANCIAL STATEMENTS
CONSOLIdATEd STATEMENT OF COMPREHENSIVE INCOME FOR THE YEAR ENdEd 31 dECEMBER 2012
Revenue 4 37,491 35,884 Cost of sales 5 (27,635) (25,920)
Gross profit 9,856 9,964 Investment income 6 657 342 Other gains and losses 7 (71) 544 Distribution costs (115) (213)Marketing expenses (154) (94)Administration expenses 8 (1,363) (1,151)Other expenses 9 (1,383) (552)Finance costs 10 (251) (374)
Profit before tax 11(a) 7,176 8,466Tax charge 12 (2,294) (2,607)
Profit for the year 13 4,882 5,859
OTHER COMPREHENSIVE INCOME Exchange differences on translation of foreign operations (797) 219Income tax effect - - (797) 219Net loss on revaluation of available-for-sale financial assets 19(b) (188) (271)Income tax effect - - (188) (271)(Loss)/gain on hedging instruments entered into for cash flow hedges (33) 8Income tax effect - - (33) 8Gain on revaluation of property, plant and Equipment 7,259 -Income tax effect (411) - 6,848 -OTHER COMPREHENSIVE INCOME FOR THE YEAR NET OF TAX 5,830 (44)
TOTAL COMPREHENSIVE INCOME FOR THE YEAR 10,712 5,815
Profit for the year attributable to: Owners of the parent company 4,416 5,243Non-controlling interests 466 616
4,882 5,859
Total comprehensive income attributable to:Owners of the parent company 10,086 5,130Non-controlling interests 626 685
10,712 5,815
Earnings per share – basic and diluted 13 Shs 12.17 Shs 14.44
2012 2011 Notes Shs’million Shs’million
FINANCIAL STATEMENTS
CONSOLIdATEd STATEMENT OF COMPREHENSIVE INCOME FOR THE YEAR ENdEd 31 dECEMBER 2012CONTINUED
Revenue 4 22,877 20,545
Cost of Sales 5 (17,002) (14,774)
Gross profit 5,875 5,771
Investment income 6 1,238 313
Other gains and losses 7 (15) 608
Distribution costs 26 (170)
Marketing expenses (103) (85)
Administration expenses 8 (860) (758)
Other expenses 9 (738) (311)
Profit before tax 11(a) 5,423 5,368
Tax charge 12 (1,547) (1,648)
Profit for the year 3,876 3,720
OTHER COMPREHENSIVE INCOME
Loss on revaluation of available-for-sale financial assets 19(b) (188) (271)
Income tax effect - -
(188) (271)
Loss on hedging instruments entered into for cash flow hedges (15) (4)
Income tax effect - -
(15) (4)
Gain on revaluation of property, plant and equipment 6,501 -
Income tax effect (183) -
6,318 -
OTHER COMPREHENSIVE INCOME FOR THE YEAR NET OF TAX 6,115 (275)
TOTAL COMPREHENSIVE INCOME FOR THE YEAR 9,991 3,445
Earnings per share – basic and diluted 13 Shs 10.68 Shs 10.25
2012 2011 Notes Shs’million Shs’million
COMPANY STATEMENT OF COMPREHENSIVE INCOME FOR THE YEAR ENdEd 31 dECEMBER 2012

2012 ANNUAL REPORT & FINANCIAL STATEMENTS48 49BAMBURI CEMENT LIMITED I PART OF YOU. FROM THE START
2012 2011 Notes Shs’million Shs’million
ASSETS Non-current assets Property, plant and equipment 15(a) 25,572 19,006Prepaid operating lease rentals 16 175 177Intangible assets 17 160 106Other equity investments 19 452 640Goodwill 20 217 217
26,576 20,146
Current assets Inventories 21 5,606 4,305Trade and other receivables 22(a) 1,712 1,465Cash flow hedge contracts 23 - 33Corporate tax recoverable 12(c) 375 417Cash and cash equivalents 24(a) 8,769 7,136
16,462 13,356
TOTAL ASSETS 43,038 33,502
EQUITY AND LIABILITIES Equity and reserves Share capital 25 1,815 1,815Revaluation surplus 26(a) 8,307 1,823Fair value reserve 26(b) 249 437Translation reserve 26(c) (860) (63)Cash flow hedging reserve 26(d) - 33Retained earnings 18,875 17,983
Equity attributable to owners of the company 28,386 22,028Non-controlling interests 2,475 2,146
Total equity 30,861 24,174
Non-current liabilities Deferred tax liability 27 4,033 3,076Provision for liabilities and charges 28 556 536Term loan 30(a) 577 619
5,166 4,231
Current liabilities Unclaimed dividends 14(a) 23 29Provision for liabilities and charges 28 505 216Trade and other payables 29 6,195 4,080Term loan 30(a) 288 772
7,011 5,097
43,038 33,502
CONSOLIdATEd STATEMENT OF FINANCIAL POSITION AS AT 31 dECEMBER 2012
FINANCIAL STATEMENTS
The financial statements were approved and authorised for issue by the board of Directors on 23 February 2013 and were signed on its behalf by:
EriC KirONDE HuSSEiN MANSi
Director Director
The financial statements were approved and authorised for issue by the board of Directors on 23 February 2013 and were signed on its behalf by:
EriC KirONDE HuSSEiN MANSi
Director Director
ASSETS Non-current assets Property, plant and equipment 15(b) 14,935 8,585Prepaid operating lease rentals 16 1 1Intangible assets 17 124 103Investments in subsidiaries 18 968 968Other equity investments 19(b) 452 640Loan to subsidiary 34 (iii) 202 231
16,682 10,528
Current assets Inventories 21 3,537 2,916Loan to subsidiary 34 (iii) 29 29Trade and other receivables 22(a) 2,197 2,614Cash flow hedge contracts 23 - 15Corporate tax recoverable 12(c) 119 388Bank and cash balances 24 7,821 6,286
13,703 12,248
TOTAL ASSETS 30,385 22,776
EQUITY AND RESERVES Capital and reserves Share capital 25 1,815 1,815Revaluation surplus 26(a) 7,880 1,756Fair value reserve 26(b) 249 437Cash flow hedging reserve 26(d) - 15Retained earnings 13,922 13,476
Total Equity 23,866 17,499
Non-current liabilities Deferred tax liability 27 1,615 1,527Provision for liabilities and charges 28 556 536
2,171 2,063
Current liabilities Unclaimed dividends 14(a) 23 29Provision for liabilities and charges 28 404 148Trade and other payables 29 3,921 3,037
4,348 3,214
30,385 22,776
2012 2011 Notes Shs’million Shs’million
COMPANY STATEMENT OF FINANCIAL POSITION AS AT 31 dECEMBER 2012
FINANCIAL STATEMENTS
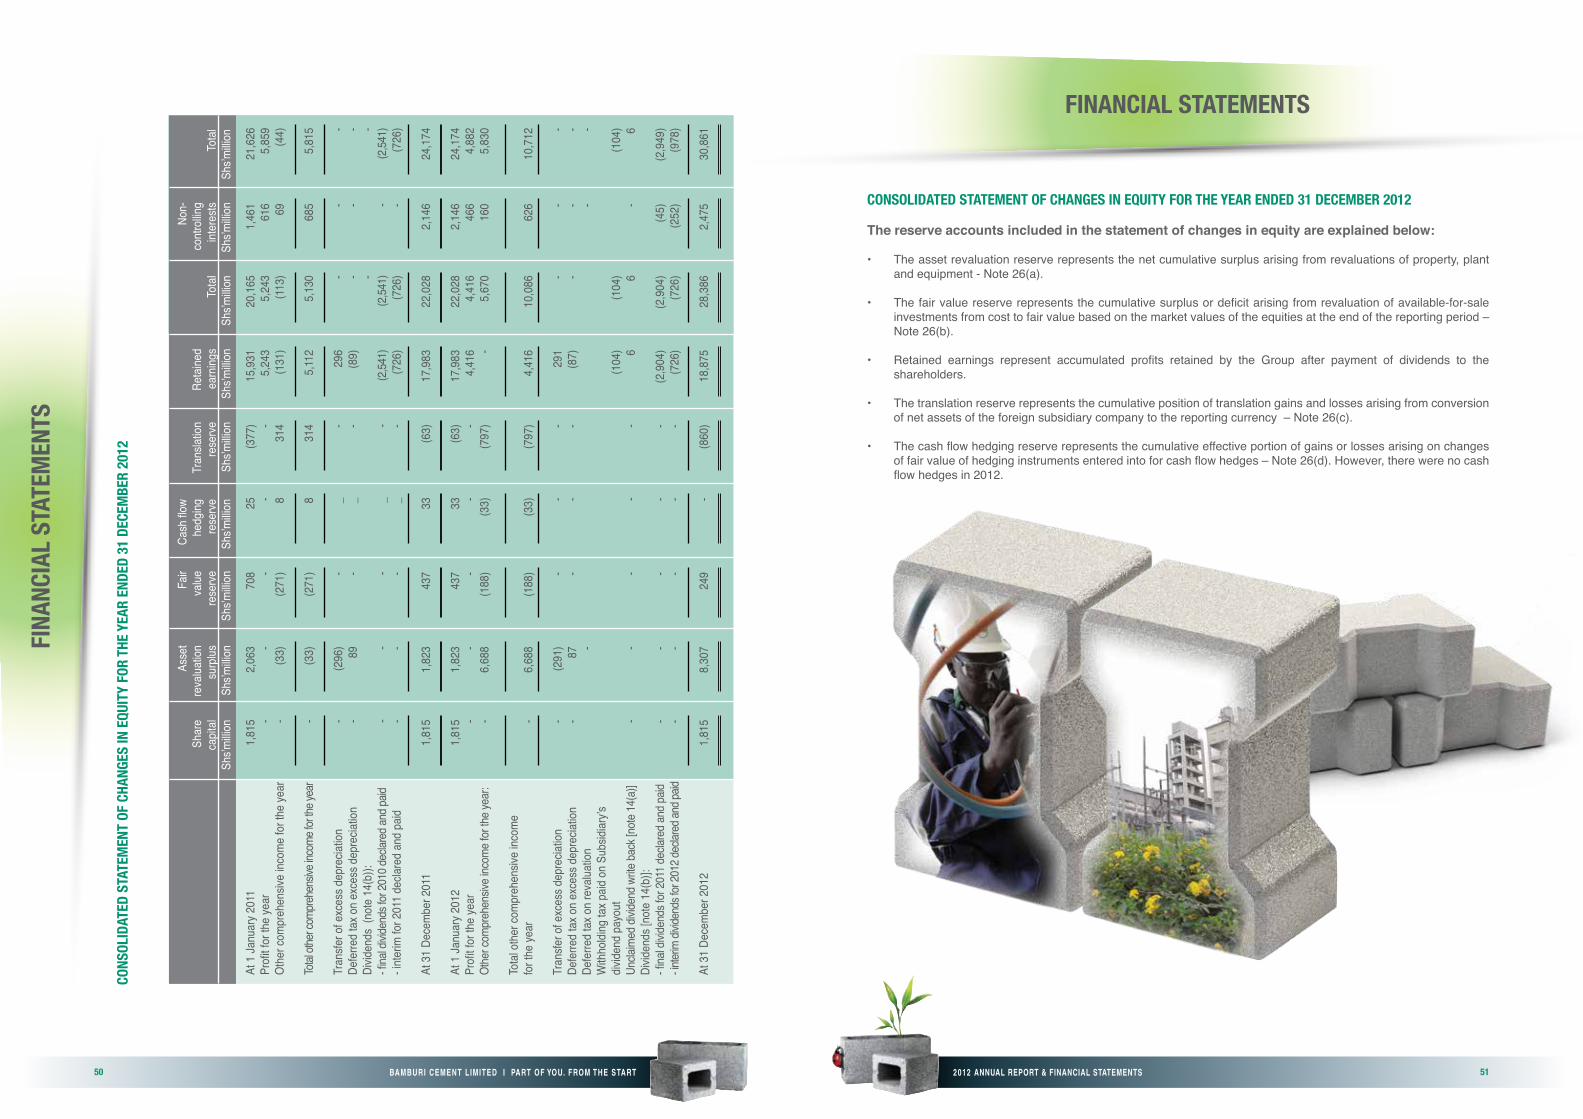
2012 ANNUAL REPORT & FINANCIAL STATEMENTS 51
FINA
NCIA
L STA
TEM
ENTS
50 BAMBURI CEMENT LIMITED I PART OF YOU. FROM THE START
CONS
OLId
ATEd
STA
TEM
ENT
OF C
HANG
ES IN
EQU
ITY
FOR
THE Y
EAR
ENdE
d 31
dEC
EMBE
R 20
12
At 1
Janu
ary 2
011
1,81
5 2,
063
708
25
(377
) 15
,931
20
,165
1,
461
21,6
26Pr
ofit f
or th
e ye
ar
- -
- -
- 5,
243
5,24
3 61
6 5,
859
Othe
r com
preh
ensiv
e inc
ome
for t
he ye
ar
- (3
3)
(271
) 8
314
(131
) (11
3)
69
(44)
Total
othe
r com
prehe
nsive
inco
me fo
r the y
ear
- (3
3)
(271
) 8
314
5,11
2 5,
130
685
5,81
5
Tran
sfer o
f exc
ess d
epre
ciatio
n -
(296
) -
_ -
296
- -
-De
ferre
d ta
x on
exce
ss d
epre
ciatio
n -
89
- _
- (8
9)
- -
-Di
viden
ds (
note
14(
b)):
-
-- fi
nal d
ivide
nds f
or 20
10 de
clare
d and
paid
- -
- _
- (2
,541)
(2
,541)
-
(2,54
1)- i
nter
im fo
r 201
1 de
clare
d an
d pa
id -
- -
_ -
(726
) (7
26)
- (7
26)
At 3
1 De
cem
ber 2
011
1,81
5 1,
823
437
33
(63)
17
,983
22
,028
2,
146
24,1
74
At 1
Janu
ary 2
012
1,81
5 1,
823
437
33
(63)
17
,983
22
,028
2,
146
24,1
74Pr
ofit f
or th
e ye
ar
- -
- -
- 4,
416
4,41
6 46
6 4,
882
Othe
r com
preh
ensiv
e inc
ome f
or th
e yea
r: -
6,68
8 (1
88)
(33)
(7
97)
- 5,
670
160
5,83
0
Tota
l oth
er co
mpr
ehen
sive
incom
e fo
r the
year
-
6,68
8 (1
88)
(33)
(7
97)
4,41
6 10
,086
62
6 10
,712
Tran
sfer o
f exc
ess d
epre
ciatio
n -
(291
) -
- -
291
- -
-De
ferre
d ta
x on
exce
ss d
epre
ciatio
n -
87
- -
- (8
7)
- -
-De
ferre
d ta
x on
reva
luatio
n
-
- -
With
holdi
ng ta
x paid
on
Subs
idiar
y’s
divide
nd p
ayou
t
(104
) (1
04)
(1
04)
Uncla
imed
divid
end w
rite ba
ck [n
ote 14
(a)]
- -
- -
- 6
6 -
6Di
viden
ds [n
ote
14(b
)]:
- fina
l divi
dend
s for
2011
decla
red a
nd pa
id -
- -
- -
(2,9
04)
(2,9
04)
(45)
(2
,949
)- in
terim
divid
ends
for 2
012 d
eclar
ed an
d paid
-
- -
- -
(726
) (7
26)
(252
) (9
78)
At 3
1 De
cem
ber 2
012
1,81
5 8,
307
249
- (8
60)
18,8
75
28,3
86
2,47
5 30
,861
Asse
t Fa
ir Ca
sh flo
w
Non-
Shar
e re
valua
tion
value
he
dging
Tr
ansla
tion
Reta
ined
cont
rollin
g
capit
al su
rplus
re
serv
e re
serv
e re
serv
e ea
rning
s To
tal
inter
ests
Tota
l
Shs’m
illion
Sh
s’milli
on
Shs’m
illion
Sh
s’milli
on
Shs’m
illion
Sh
s’milli
on
Shs’m
illion
Sh
s’milli
on
Shs’m
illion
The reserve accounts included in the statement of changes in equity are explained below:
• The asset revaluation reserve represents the net cumulative surplus arising from revaluations of property, plant and equipment - Note 26(a).
• The fair value reserve represents the cumulative surplus or deficit arising from revaluation of available-for-sale investments from cost to fair value based on the market values of the equities at the end of the reporting period – Note 26(b).
• Retained earnings represent accumulated profits retained by the Group after payment of dividends to the shareholders.
• The translation reserve represents the cumulative position of translation gains and losses arising from conversion of net assets of the foreign subsidiary company to the reporting currency – Note 26(c).
• The cash flow hedging reserve represents the cumulative effective portion of gains or losses arising on changes of fair value of hedging instruments entered into for cash flow hedges – Note 26(d). However, there were no cash flow hedges in 2012.
FINANCIAL STATEMENTS
CONSOLIdATEd STATEMENT OF CHANGES IN EQUITY FOR THE YEAR ENdEd 31 dECEMBER 2012
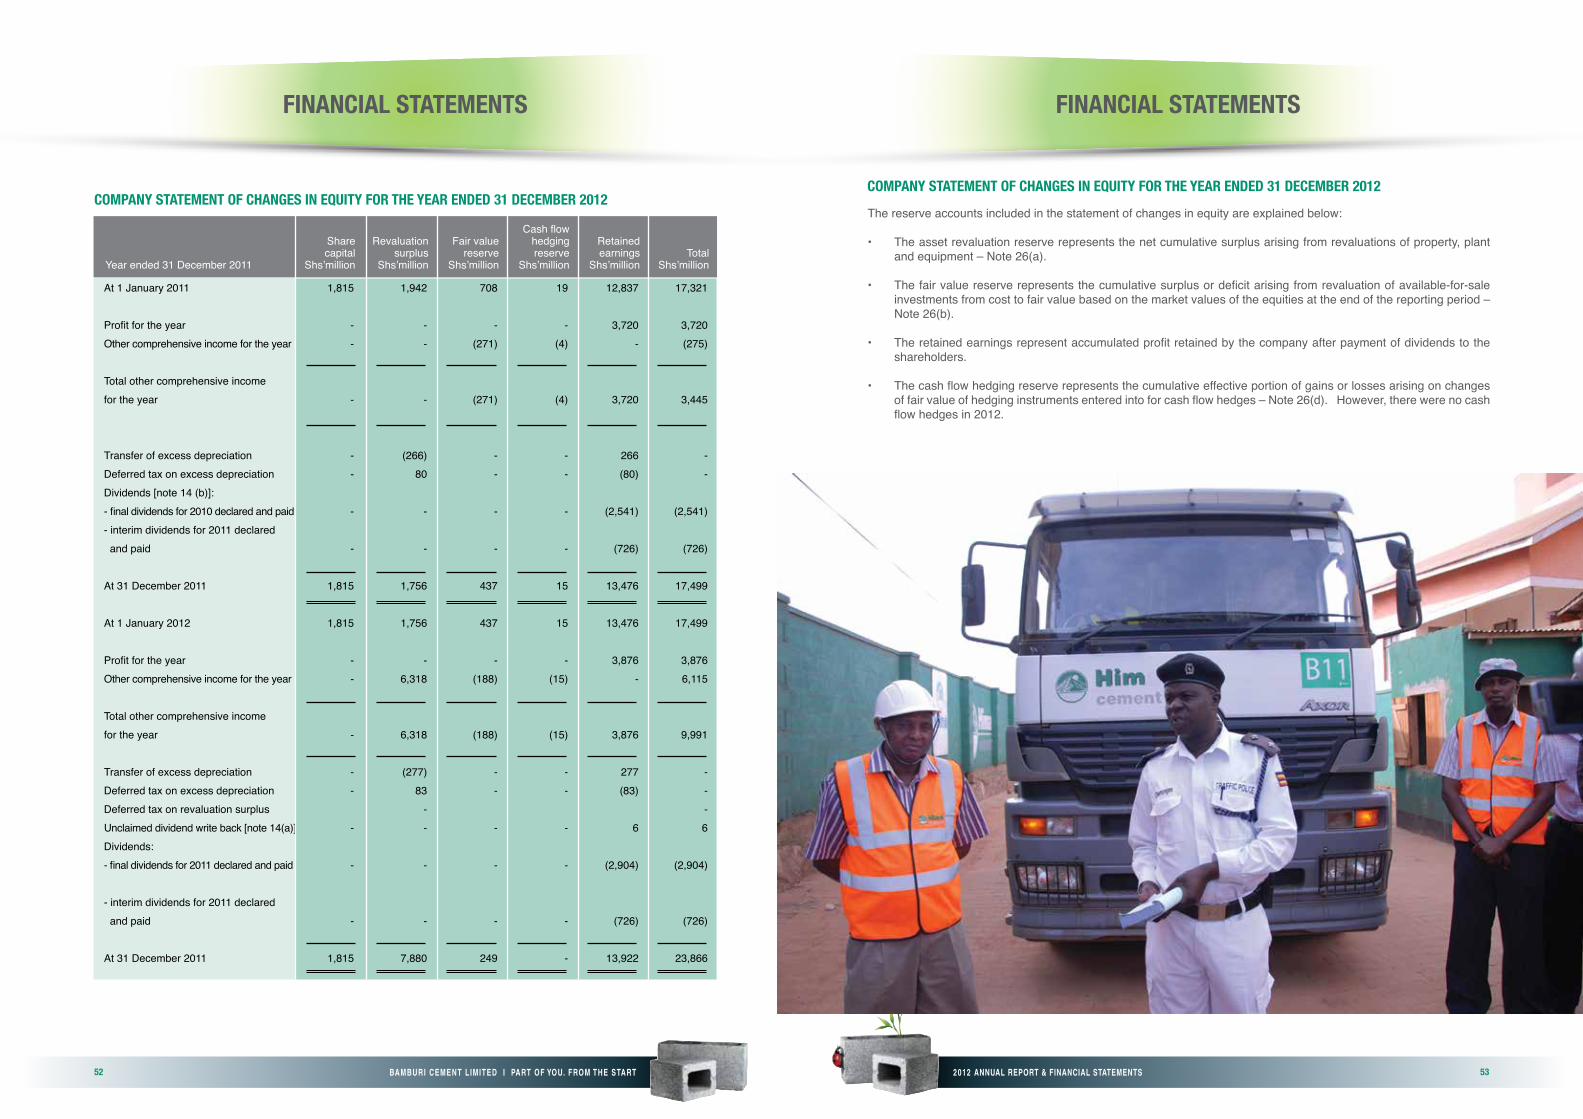
2012 ANNUAL REPORT & FINANCIAL STATEMENTS52 53BAMBURI CEMENT LIMITED I PART OF YOU. FROM THE START
FINANCIAL STATEMENTS
At 1 January 2011 1,815 1,942 708 19 12,837 17,321 Profit for the year - - - - 3,720 3,720Other comprehensive income for the year - - (271) (4) - (275)
Total other comprehensive income for the year - - (271) (4) 3,720 3,445
Transfer of excess depreciation - (266) - - 266 -Deferred tax on excess depreciation - 80 - - (80) -Dividends [note 14 (b)]: - final dividends for 2010 declared and paid - - - - (2,541) (2,541)- interim dividends for 2011 declared and paid - - - - (726) (726)
At 31 December 2011 1,815 1,756 437 15 13,476 17,499
At 1 January 2012 1,815 1,756 437 15 13,476 17,499 Profit for the year - - - - 3,876 3,876Other comprehensive income for the year - 6,318 (188) (15) - 6,115 Total other comprehensive income for the year - 6,318 (188) (15) 3,876 9,991 Transfer of excess depreciation - (277) - - 277 -Deferred tax on excess depreciation - 83 - - (83) -Deferred tax on revaluation surplus - -Unclaimed dividend write back [note 14(a)] - - - - 6 6Dividends: - final dividends for 2011 declared and paid - - - - (2,904) (2,904)
- interim dividends for 2011 declared and paid - - - - (726) (726)
At 31 December 2011 1,815 7,880 249 - 13,922 23,866
Cash flow Share Revaluation Fair value hedging Retained capital surplus reserve reserve earnings TotalYear ended 31 December 2011 Shs’million Shs’million Shs’million Shs’million Shs’million Shs’million
COMPANY STATEMENT OF CHANGES IN EQUITY FOR THE YEAR ENdEd 31 dECEMBER 2012COMPANY STATEMENT OF CHANGES IN EQUITY FOR THE YEAR ENdEd 31 dECEMBER 2012
FINANCIAL STATEMENTS
The reserve accounts included in the statement of changes in equity are explained below:
• The asset revaluation reserve represents the net cumulative surplus arising from revaluations of property, plant and equipment – Note 26(a).
• The fair value reserve represents the cumulative surplus or deficit arising from revaluation of available-for-sale investments from cost to fair value based on the market values of the equities at the end of the reporting period – Note 26(b).
• The retained earnings represent accumulated profit retained by the company after payment of dividends to the shareholders.
• The cash flow hedging reserve represents the cumulative effective portion of gains or losses arising on changes of fair value of hedging instruments entered into for cash flow hedges – Note 26(d). However, there were no cash flow hedges in 2012.

2012 ANNUAL REPORT & FINANCIAL STATEMENTS54 55BAMBURI CEMENT LIMITED I PART OF YOU. FROM THE START
CASH FLOWS FROM OPERATING ACTIVITIES
Cash generated from operations 33 8,977 7,595Interest received 6 651 342Net foreign exchange (loss)/gain 7 (98) 417Interest paid 10 (251) (374)Tax paid 12(c) (1,818) (2,300)
Net cash generated from operating activities 7,461 5,680
CASH FLOWS FROM INVESTING ACTIVITIES
Purchase of property, plant and equipment 15 (1,185) (1,318)Purchase of intangible assets 17 (90) (55)Proceeds from disposals of property, plant and equipment 8 -Withholding tax paid on dividend to Group (104) -Dividends received 6 6 - -
Net cash used in investing activities (1,365) (1,373)
CASH FLOWS FROM FINANCING ACTIVITIES
Dividends paid to owners of the company 14(b) (3,630) (3,268)Dividends paid to non-controlling interests (297) -Loans received 30(a) - 177Loans repaid 30(a) (477) (1,739)
Net cash used in financing activities (4,404) (4,830)
NET INCREASE/(DECREASE) IN CASH AND CASH EQUIVALENTS 1,692 (523)
MOVEMENT IN CASH AND CASH EQUIVALENTS
At beginning of the year 7,136 7,616Net increase/ (decrease) in cash and cash equivalents above 1,692 (523)Effects of exchange rate changes on cash held in foreign currencies (59) 43
At end of the year 24(b) 8,769 7,136
2012 2011 Notes Shs’million Shs’million
FINANCIAL STATEMENTS
CONSOLIdATEd STATEMENT OF CASH FLOWS FOR THE YEAR ENdEd 31 dECEMBER 2012
FINANCIAL STATEMENTS

2012 ANNUAL REPORT & FINANCIAL STATEMENTS56 57BAMBURI CEMENT LIMITED I PART OF YOU. FROM THE START
COMPANY STATEMENT OF CASH FLOWS FOR THE YEAR ENdEd 31 dECEMBER 2012
FINANCIAL STATEMENTS
CASH FLOWS FROM OPERATING ACTIVITIES
Cash generated from operations 33 5,993 4,295Interest received 6 642 313Net foreign exchange (loss)/gain 7 (20) 419Tax paid 12(c) (1,371) (2,295)
Net cash generated from operating activities 5,244 2,732
CASH FLOWS FROM INVESTING ACTIVITIES
Purchase of property, plant and equipment 15(b) (649) (364)Purchase of property of intangible assets 17 (55) (55)Dividends received 6 596 -
Net cash used in investing activities (108) (419)
CASH FLOWS FROM FINANCING ACTIVITIES
Dividends paid to owners of the company 14(b) (3,630) (3,268)Loans repaid 34(iii) 29 26
Net cash used in financing activities (3,601) (3,242)
NET INCREASE/(DECREASE) IN CASH AND CASH EQUIVALENTS 1,535 (929)
MOVEMENT IN CASH AND CASH EQUIVALENTS
At beginning of the year 6,286 7,214Net increase/(decrease) in cash and cash equivalents above 1,535 (929)
At end of the year 24(b) 7,821 6,286
2012 2011 Notes Shs’million Shs’million
1. SUMMARY OF SIGNIFICANT ACCOUNTING POLICIES
The accounting policies adopted in the preparation of these financial statements are set out below. These policies have been consistently applied to all years presented, unless otherwise stated.
a) Basis of preparation
The consolidated financial statements have been prepared on historical cost basis of accounting except for certain items of property, plant and available–for-sale financial assets that have been measured at fair value.
The financial statements of the Group have been prepared in accordance with International Financial Reporting Standards (IFRS). The consolidated financial statements are presented in Kenyan Shillings (Shs) and all values are rounded to the nearest million (Shs’ million), except when otherwise indicated.
b) New and amended standards, interpretations and improvements
The accounting policies adopted are consistent with those of the previous financial year, except for the following new and amended IFRS and IFRIC interpretations effective as of 1 January 2012:
• IAS 12 Income Taxes (Amendment) – Deferred Taxes: Recovery of Underlying Assets
• IFRS 7 Financial Instruments : Disclosures – Enhanced Derecognition Disclosure Requirements
These revised standards and interpretations did not have any material effect on the financial performance or position of the Group. They did, however, give rise to additional disclosures in some occasions.
The principal effects of these changes are as follows:
• IAS 12 Income Taxes (Amendment) –Deferred Taxes: Recovery of UnderlyingAssets
The amendment clarified the determination of deferred tax on investment property measured at fair value and introduces a rebuttable presumption that deferred tax on investment property measured using the fair value model in IAS 40 should be determined on the basis that its carrying amount will be recovered through sale. It includes the requirement that deferred tax on non-depreciable assets that are measured using the revaluation model in IAS 16 should always be measured on a sale basis. The amendment is effective for annual periods beginning on or after 1 January 2012 and has been no effect on the Group’s financial position, performance or its disclosures.
• IFRS 7 Financial Instruments: Disclosures— Enhanced Derecognition DisclosureRequirements
The amendment requires additional disclosure about financial assets that have been transferred but not derecognised to enable the user of the Group’s financial statements to understand the relationship with those assets that have not been derecognised and their associated liabilities. In addition, the amendment requires disclosures about the entity’s continuing involvement in derecognised assets to enable the users to evaluate the nature of, and risks associated with, such involvement. The amendment is effective for annual periods beginning on or after 1 July 2011. The Group does not have any assets with these characteristics so there has been no effect on the presentation of its financial statements.
Standards issued but not yet effective
Standards issued but not yet effective up to the date of issuance of the Group’s financial statements are disclosed below. The Group intends to adopt these standards, if applicable, when they become effective.
IAS 1 Presentation of Items of OtherComprehensive Income–Amendments toIAS1
The amendments to IAS 1 change the grouping of items presented in other comprehensive
NOTES TO THE FINANCIAL STATEMENTS FOR THE YEAR ENdEd 31 dECEMBER 2012
FINANCIAL STATEMENTS
2012 ANNUAL REPORT & FINANCIAL STATEMENTS58 59BAMBURI CEMENT LIMITED I PART OF YOU. FROM THE START
income (OCI). Items that could be reclassified (or ‘recycled’) to profit or loss at a future point in time (for example, net gain on hedge of net investment, exchange differences on translation of foreign operations, net movement on cash flow hedges and net loss or gain on available-for-sale financial assets) would be presented separately from items that will never be reclassified (for example, actuarial gains and losses on defined benefit plans and revaluation of land and buildings). The amendment affects presentation only and has no impact on the Group’s financial position or performance. The amendment becomes effective for annual periods beginning on or after 1 July 2012, and will therefore be applied in the Group’s first annual report after becoming effective.
IAS19EmployeeBenefits(Revised)
The IASB has issued numerous amendments to IAS 19. These range from fundamental changes such as removing the corridor mechanism and the concept of expected returns on plan assets to simple clarifications and re-wording. The amendment becomes effective for annual periods beginning on or after 1 January 2013. The amendment has no impact on the Group’s financial position or performance.
IAS28InvestmentsinAssociatesandJointVentures(asrevisedin2011)
As a consequence of the new IFRS 11 Joint Arrangements, and IFRS 12 Disclosure of Interests in Other Entities, IAS 28 Investments in Associates, has been renamed IAS 28 Investments in Associates and Joint Ventures, and describes the application of the equity method to investments in joint ventures in addition to associates. The revised standard becomes effective for annual periods beginning on or after 1 January 2013.
IAS 32 Offsetting Financial Assets andFinancialLiabilities—AmendmentstoIAS32
These amendments clarify the meaning of “currently has a legally enforceable right to set-off”. The amendments also clarify the
NOTES TO THE FINANCIAL STATEMENTS FOR THE YEAR ENdEd 31 dECEMBER 2012
application of the IAS 32 offsetting criteria to settlement systems (such as central clearing house systems) which apply gross settlement mechanisms that are not simultaneous. These amendments are not expected to impact the Group’s financial position or performance and become effective for annual periods beginning on or after 1 January 2014.
IFRS7Disclosures—OffsettingFinancialAssetsandFinancialLiabilities—AmendmentstoIFRS7
These amendments require an entity to disclose information about rights to set-off and related arrangements (e.g., collateral agreements). The disclosures would provide users with information that is useful in evaluating the effect of netting arrangements on an entity’s financial position. The new disclosures are required for all recognized financial instruments that are set off in accordance with IAS 32 Financial Instruments: Presentation. The disclosures also apply to recognized financial instruments that are subject to an enforceable master netting arrangement or similar agreement, irrespective of whether they are set off in accordance with IAS 32. These amendments will not impact the Group’s financial position or performance and become effective for annual periods beginning on or after 1 January 2013.
IFRS9FinancialInstruments:ClassificationandMeasurement
IFRS 9, as issued, reflects the first phase of the IASB’s work on the replacement of IAS 39 and applies to classification and measurement of financial assets and financial liabilities as defined in IAS 39. The standard was initially effective for annual periods beginning on or after 1 January 2013, but Amendments to IFRS 9 Mandatory Effective Date of IFRS 9 and Transition Disclosures, issued in December 2011, moved the mandatory effective date to 1 January 2015. In subsequent phases, the IASB will address hedge accounting and impairment of financial assets. The adoption of the first phase of IFRS 9 will have an effect on the classification and measurement of the Group’s financial assets, but will not have an impact on
FINANCIAL STATEMENTS
1. SUMMARY OF SIGNIFICANT ACCOUNTING pOLICIES (continued) b) New and amended standards, interpretations and improvements (Continued) Standards issued but not yet effective (Continued)
classification and measurements of financial liabilities. The Group will quantify the effect in conjunction with the other phases, when the final standard including all phases is issued.
IFRS10ConsolidatedFinancialStatements,IAS27SeparateFinancialStatements
IFRS 10 replaces the portion of IAS 27 Consolidated and Separate Financial Statements that addresses the accounting for consolidated financial statements. It also addresses the issues raised in SIC-12 Consolidation —Special Purpose Entities.
IFRS 10 establishes a single control model that applies to all entities including special purpose entities. The changes introduced by IFRS 10 will require management to exercise significant judgement to determine which entities are controlled and therefore are required to be consolidated by a parent, compared with the requirements that were in IAS 27. Based on the preliminary analyses performed, IFRS 10 is not expected to have any impact on the currently held investments of the Group. This standard becomes effective for annual periods beginning on or after 1 January 2013.
IFRS11JointArrangements
IFRS 11 replaces IAS 31 Interests in Joint Ventures and SIC-13 Jointly-controlled Entities — Non-monetary Contributions by Venturers. IFRS 11 removes the option to account for jointly controlled entities (JCEs) using proportionate consolidation. Instead, JCEs that meet the definition of a joint venture must be accounted for using the equity method. This standard becomes effective for annual periods beginning on or after 1 January 2013, and is to be applied retrospectively for joint arrangements held at the date of initial application. The standard will not have an impact on the Group.
NOTES TO THE FINANCIAL STATEMENTS FOR THE YEAR ENdEd 31 dECEMBER 2012
IFRS 12 Disclosure of Interests in OtherEntities
IFRS 12 includes all of the disclosures that were previously in IAS 27 related to consolidated financial statements, as well as all of the disclosures that were previously included in IAS 31 and IAS 28. These disclosures relate to an entity’s interests in subsidiaries, joint arrangements, associates and structured entities. A number of new disclosures are also required, but has no impact on the Group’s financial position or performance. This standard becomes effective for annual periods beginning on or after 1 January 2013.
IFRS13FairValueMeasurement
IFRS 13 establishes a single source of guidance under IFRS for all fair value measurements. IFRS 13 does not change when an entity is required to use fair value, but rather provides guidance on how to measure fair value under IFRS when fair value is required or permitted. The Group is currently assessing the impact that this standard will have on the financial position and performance, but based on the preliminary analyses, no material impact is expected. This standard becomes effective for annual periods beginning on or after 1 January 2013.
IFRIC20StrippingCostsintheProductionPhaseofaSurfaceMine
This interpretation applies to waste removal (stripping) costs incurred in surface mining activity, during the production phase of the mine. The interpretation addresses the accounting for the benefit from the stripping activity. The interpretation is effective for annual periods beginning on or after 1 January 2013. The new interpretation will not have an impact on the Group.
FINANCIAL STATEMENTS
1. SUMMARY OF SIGNIFICANT ACCOUNTING pOLICIES (continued) b) New and amended standards, interpretations and improvements (Continued) Standards issued but not yet effective (Continued)

2012 ANNUAL REPORT & FINANCIAL STATEMENTS60 61BAMBURI CEMENT LIMITED I PART OF YOU. FROM THE START
NOTES TO THE FINANCIAL STATEMENTS FOR THE YEAR ENdEd 31 dECEMBER 2012
AnnualImprovementsMay2012
These improvements will not have an impact on the Group, but include:
• IAS 1 Presentation of Financial Statements: This improvement clarifies the difference between voluntary additional comparative information and the minimum required comparative information. Generally, the minimum required comparative information is the previous period.
• IAS 16 Property Plant and Equipment: This improvement clarifies that major spare parts and servicing equipment that meet the definition of property, plant and equipment are not inventory.
• IAS 32 Financial Instruments, Presentation: This improvement clarifies that income taxes arising from distributions to equity holders are accounted for in accordance with IAS 12 Income Taxes.
• IAS 34 Interim Financial Reporting: The amendment aligns the disclosure requirements for total segment assets with total segment liabilities in interim financial statements. This clarification also ensures that interim disclosures are aligned with annual disclosures.
These improvements are effective for annual periods beginning on or after 1 January 2013.
c) Basis of Consolidation
The consolidated financial statements comprise the financial statements of the Group and its subsidiaries as at 31 December 2012.
Subsidiary undertakings, which are those companies in which the Group either directly or indirectly, has an interest of more than one half of the voting rights or otherwise has power
to exercise control over the operations, are consolidated. A listing of the subsidiaries in the Group is provided in Note 18.
Subsidiaries are consolidated from the date of acquisition, being that date on which effective control is transferred to the Group, and consolidation ceases when such control ceases. All inter-company transactions, balances and unrealised gains or losses on transactions between Group companies are eliminated in full.
The financial statements of the subsidiaries are prepared for the same reporting period as the parent company, using consistent accounting policies.
Non-controlling interests present outside ownership interests and entitle their holders to a proportionate share of the entity’s net assets in the event of liquidation, and may be initially measured either at fair value or at the non-controlling interests’ proportionate share of the recognised amounts of the acquiree’s identifiable net assets. The choice of measurement basis is made on a transaction-by-transaction basis. Other types of non-controlling interests are measured at fair value or, when applicable, on the basis specified.
Total comprehensive income within a subsidiary is attributed to the non-controlling interest even if it results in a deficit balance.
A change in the ownership interest of a subsidiary, without a loss of control, is accounted for as an equity transaction. If the Group loses control over a subsidiary, it:• Derecognises the assets (including
goodwill) and liabilities of the subsidiary• Derecognises the carrying amount of any
non-controlling interest• Derecognises the cumulative translation
differences recorded in equity• Recognises the fair value of the
consideration received
FINANCIAL STATEMENTS
1. SUMMARY OF SIGNIFICANT ACCOUNTING pOLICIES (continued) b) New and amended standards, interpretations and improvements (Continued) Standards issued but not yet effective (Continued)
• Recognises the fair value of any investment retained
• Recognises any surplus or deficit in profit or loss
• Reclassifies the parent’s share of components previously recognized in other comprehensive income to profit or loss or retained earnings, as appropriate.
d) Business combinations and goodwill
Business combinations are accounted for using the acquisition method. The cost of an acquisition is measured as the aggregate of the consideration transferred measured at acquisition date fair value and the amount of any non-controlling interest in the acquiree. For each business combination, the Group elects whether to measure the non-controlling interest in the acquiree at fair value or at the proportionate share of the acquiree’s identifiable net assets. Acquisition-related costs are expensed as incurred and included in administrative expenses.
When the Group acquires a business, it assesses the financial assets and liabilities assumed for appropriate classification and designation in accordance with the contractual terms, economic circumstances and pertinent conditions as at the acquisition date. This includes the separation of embedded derivatives in host contracts by the acquiree.
If the business combination is achieved in stages, the previously held equity interest is remeasured at its acquisition date fair value and any resulting gain or loss is recognised in profit or loss.
Any contingent consideration to be transferred by the acquirer will be recognised at fair value at the acquisition date. Contingent consideration classified as an asset or liability that is a financial instrument and within the scope of IAS 39 Financial Instruments:
NOTES TO THE FINANCIAL STATEMENTS FOR THE YEAR ENdEd 31 dECEMBER 2012
FINANCIAL STATEMENTS
Recognition and Measurement, is measured at fair value with changes in fair value recognised either in either profit or loss or as a change to other comprehensive income. If the contingent consideration is not within the scope of IAS 39, it is measured in accordance with the appropriate IFRS. Contingent consideration that is classified as equity is not remeasured and subsequent settlement is accounted for within equity.
Goodwill is initially measured at cost, being the excess of the aggregate of the consideration transferred and the amount recognised for non-controlling interest over the net identifiable assets acquired and liabilities assumed. If the fair value of the net assets acquired is in excess of the aggregate consideration transferred, the gain is recognised in profit or loss.
After initial recognition, goodwill is measured at cost less any accumulated impairment losses. For the purpose of impairment testing, goodwill acquired in a business combination is, from the acquisition date, allocated to each of the Group’s cash-generating units that are expected to benefit from the combination, irrespective of whether other assets or liabilities of the acquiree are assigned to those units.
Where goodwill has been allocated to a cash-generating unit and part of the operation within that unit is disposed of, the goodwill associated with the disposed operation is included in the carrying amount of the operation when determining the gain or loss on disposal. Goodwill disposed in these circumstances is measured based on the relative values of the disposed operation and the portion of the cash-generating unit retained.
e) Translation of foreign currencies
i)Transactionsandbalances
Transactions in foreign currencies
1. SUMMARY OF SIGNIFICANT ACCOUNTING pOLICIES (continued) c) Basis of Consolidation (Continued)
2012 ANNUAL REPORT & FINANCIAL STATEMENTS62 63BAMBURI CEMENT LIMITED I PART OF YOU. FROM THE START
NOTES TO THE FINANCIAL STATEMENTS FOR THE YEAR ENdEd 31 dECEMBER 2012
during the year are initially recorded by the Group’s entities at their respective functional currency spot rates at the rates ruling at the transaction dates. Assets and liabilities which are expressed in foreign currencies are translated into the functional currencies at rates ruling at the end of reporting period. The resulting differences from conversion and translation are dealt with in the profit or loss for the year in which they arise.
ii)Translationofforeignoperations
The results and financial position of all the group entities (none of which has the currency of a hyperinflationary economy) that have a functional currency different from the presentation currency are translated into the presentation currency as follows:
• assets and liabilities for each statement of financial position presented are translated into Kenya Shillings using exchange rates prevailing at the end of the reporting period;
• income and expenses for each statement of comprehensive income are translated at average exchange rates (unless this average is not a reasonable approximation of the cumulative effect of the rates prevailing on the transaction dates, in which case income and expenses are translated at the dates of the transactions); and
• all resulting exchange differences are recognised under other comprehensive income and accumulated in a separate heading, translation reserve, in the consolidated statement of changes in equity
When a foreign operation is sold, the cumulative amount of the exchange differences relating to that foreign entity, recognised in other comprehensive income and accumulated on the separate component of equity, is reclassified from equity to profit or loss when the gain or loss on disposal is recognised.
f) Revenue recognition
Revenue is recognized to the extent that it is probable that the economic benefits will flow to the Group and the revenue can be reliably measured, regardless of when the payment is being made. Revenue is measured at the fair value of the consideration received or receivable, taking into account contractually defined terms of payment and excluding taxes or duty. The Group assesses its revenue arrangements against specific criteria to determine if it is acting as principal or agent. The Group has concluded that it is acting as a principal in all of its revenue arrangements. The specific recognition criteria described below must also be met before revenue is recognized.
Saleofgoods
Revenue from the sale of goods is recognized when the significant risks and rewards of ownership of the goods have passed to the buyer, usually upon dispatch for self collection or else on delivery of products to customers or on completion of service. The sales are stated net of value added tax and discounts, and after eliminating sales within the Group
Interestincome
For all financial instruments measured at amortised cost and interest bearing financial assets classified as available for sale, interest
FINANCIAL STATEMENTS
1. SUMMARY OF SIGNIFICANT ACCOUNTING pOLICIES (continued) e) Translation of foreign currencies (Continued) i) Transactions and balances (Continued)
NOTES TO THE FINANCIAL STATEMENTS FOR THE YEAR ENdEd 31 dECEMBER 2012
income is recorded using the effective interest rate (EIR). EIR is the rate that exactly discounts the estimated future cash payments or receipts over the expected life of the financial instrument or a shorter period, where appropriate, to the net carrying amount of the financial asset or liability. Interest income is included in finance income in the statement of comprehensive income.
Dividends
Revenue is recognized when the Group’s right to receive the payment is established, which is generally when shareholders approve the dividend.
Rental income Rental income is accounted for on a straight-
line basis over the lease terms and is included in revenue due to its operating nature.
g) Borrowing costs
Borrowing costs consist of interest and other costs that an entity incurs in connection with the borrowing of funds.
Borrowing costs that are directly attributable to the acquisition, construction or production of qualifying assets, which are assets that necessarily take a substantial period of time to get ready for their intended use or sale, are capitalised as part of the cost of those assets, until such a time as the assets are substantially ready for their intended use or sale.
Investment income earned on the temporary investment of specific borrowings pending their expenditure on qualifying assets is deducted from the borrowing costs eligible for capitalisation.
All other borrowing costs are recognized in profit or loss in the period in which they are incurred.
h) Leases
The determination of whether an arrangement is, or contains, a lease is based on the substance of the arrangement at the inception date. The arrangement is assessed for whether fulfilment of the arrangement is dependent on the use of a specific asset or assets or the arrangement conveys a right to use the asset or assets, even if that right is not explicitly specified in an arrangement.
Leases are classified as finance leases whenever the terms of the lease transfer substantially all risks and rewards of ownership to the Group or the company as the lessee. All other leases are classified as operating leases.
Rentals payable under operating leases are amortised on the straight line basis over the term of the relevant lease.
i) Property, plant and equipment
All property, plant and equipment are initially recorded at cost. Freehold land and buildings are subsequently shown at their revalued amounts based on valuations by external independent valuers, less accumulated depreciation and any accumulated impairment losses. Plant and machinery is revalued internally on the basis of a valuation model prescribed by engineers and consultants at the technical centre of the ultimate shareholder. The valuations are carried out approximately once every five years.
All other property and equipment are stated at
historical cost less accumulated depreciation less any accumulated impairment losses.
Increases in the carrying value of buildings
arising on revaluation are recognized in other comprehensive income and accumulated in equity under the heading of asset revaluation reserve. Increases are recognized in profit or
FINANCIAL STATEMENTS
1. SUMMARY OF SIGNIFICANT ACCOUNTING pOLICIES (continued) f) Revenue recognition (Continued) Interest income (Continued)

2012 ANNUAL REPORT & FINANCIAL STATEMENTS64 65BAMBURI CEMENT LIMITED I PART OF YOU. FROM THE START
NOTES TO THE FINANCIAL STATEMENTS FOR THE YEAR ENdEd 31 dECEMBER 2012
loss to the extent that they reverse a revaluation decrease of the same asset previously recognized in profit or loss. Decreases arising from revaluation of assets are recognized in profit or loss. However, decreases that offset previous increases of the same asset are recognized in other comprehensive income to the extent of any credit balance existing in the revaluation reserve in respect of that asset.
Each year the difference between depreciation based on the revalued carrying amount of an asset (the depreciation charged to profit or loss) and depreciation based on the asset’s original cost is transferred from the asset revaluation reserve to retained earnings.
Depreciation is calculated on the straight line basis to write down the cost of each item of property plant and equipment, or the revalued amount, to its residual value over its expected useful life as follows:
Buildings, plant and machinery 14 - 22 years Equipment and mobile plant 3 - 10 years Residential buildings 40 years
Freehold land is not depreciated as it is deemed to have an indefinite useful life.
Where the carrying amount of an asset is greater than its estimated recoverable amount, it is written down immediately to its recoverable amount.
The residual values, useful lives and methods of depreciation of property, plant and equipment are reviewed at each financial year end and adjusted prospectively, if appropriate.
The gain or loss arising on disposal or retirement of an item of property, plant and equipment is determined as the difference between the actual proceeds and the carrying amount of the asset and is recognised in the profit or loss in the year in which the disposal or retirement occurs.
j) Goodwill
Goodwill arising on consolidation represents the excess of the cost of acquisition over the fair value of the Group’s share of the net assets of the acquired subsidiary as at the date of acquisition. Goodwill is initially recognized as an asset at cost and is subsequently measured at cost less any accumulated impairment losses.
For the purpose of impairment testing, goodwill is allocated to the cash generating units expected to benefit from the synergies of the business combination. Cash generating units to which goodwill has been allocated are tested for impairment annually. If the recoverable amount of the cash generating unit is less than the carrying amount of the unit, the impairment loss is allocated to reduce the carrying amount of the goodwill allocated to the unit. An impairment loss recognized for goodwill is not reversed in a subsequent period.
k) Intangible assets
Computer software costs are stated at cost less accumulated amortisation and any accumulated impairment losses. The costs are amortised over the expected useful lives of the software on the straight line basis. Currently, the estimated useful life is five years.
The useful lives of computer software are reviewed at least at the end of each reporting period. Changes in the expected useful lives are considered to modify the amortisation period and are treated as changes in accounting estimates. The amortisation expense on computer software is recognized in profit or loss.
l) Inventories
Inventories are valued at the lower of cost and net realisable value.
FINANCIAL STATEMENTS
1. SUMMARY OF SIGNIFICANT ACCOUNTING pOLICIES (continued) i) Property, plant and equipment (Continued)
NOTES TO THE FINANCIAL STATEMENTS FOR THE YEAR ENdEd 31 dECEMBER 2012
Inventories of consumables and spare parts are stated at the lower of cost and net realisable value. The cost of consumables and spare parts is the weighted average cost less provision for obsolete and slow moving items.
All other inventories are stated at the lower of cost and net realisable value. The cost includes direct cost and appropriate overheads and is determined on the first-in first-out method.
Net realisable value of inventories is the estimated selling price of the inventories in the ordinary course of the Group’s business less the estimated costs of completion and the estimated costs necessary to make the sale.
m) Tax
Current income tax
Current income tax assets and liabilities for the current period are measured at the amount expected to be recovered from or paid to the taxation authorities. Current income tax is provided on the basis of the results for the year, as shown in the financial statements, adjusted in accordance with tax legislation. The tax rates and tax laws used to compute the amount are those that are enacted or substantively enacted, at the reporting date in the countries where the Group operates and generates taxable income.
Current income tax relating to items recognized directly in equity is recognized in equity and not in profit or loss. Management periodically evaluates positions taken in the tax returns with respect to situations in which applicable tax regulations are subject to interpretation and establishes provisions where appropriate.
Deferred tax
Deferred tax is provided, using the liability method, for all temporary differences arising between the tax bases of assets and liabilities
and their carrying amounts for financial reporting purposes at the reporting date.
Deferred tax liabilities are recognized for all taxable temporary differences, except:
• When the deferred tax liability arises from the initial recognition of goodwill or an asset or liability in a transaction that is not a business combination and, at the time of the transaction, affects neither the accounting profit nor taxable profit or loss
• In respect of taxable temporary differences associated with investments in subsidiaries, associates and interests in joint ventures, when the timing of the reversal of the temporary differences can be controlled and it is probable that the temporary differences will not reverse in the foreseeable future
Deferred tax assets are recognized for all deductible temporary differences, the carry forward of unused tax credits and any unused tax losses. Deferred tax assets are only recognized to the extent that it is probable that future taxable profits will be available against which the temporary differences, and the carry forward of unused tax credits and unused tax losses can be utilised except:
• When the deferred tax asset relating to the deductible temporary difference arises from the initial recognition of an asset or liability in a transaction that is not a business combination and, at the time of the transaction, affects neither the accounting profit nor taxable profit or loss
• In respect of deductible temporary differences associated with investments in subsidiaries, associates and interests in joint ventures, deferred tax assets are recognized only to the extent that it is probable that the temporary differences will reverse in the foreseeable future and taxable profit will be available against which the temporary differences can be utilised.
FINANCIAL STATEMENTS
1. SUMMARY OF SIGNIFICANT ACCOUNTING pOLICIES (continued) l) Inventories (Continued)

2012 ANNUAL REPORT & FINANCIAL STATEMENTS66 67BAMBURI CEMENT LIMITED I PART OF YOU. FROM THE START
• When receivables and payables are stated with the amount of value added tax included
The net amount of value added tax recoverable from, or payable to, the taxation authority is included as part of receivables or payables in the statement of financial position.
n) Dividends payable
Dividends payable on ordinary shares are charged to retained earnings in the period in which they are declared. Proposed dividends are not accrued for until ratified in an Annual General Meeting.
o) Financial instruments
Financial assets and financial liabilities are recognized in the Group’s statement of financial position when the company has become party to the contractual provisions of the instrument.
The entity’s classification of financial assets and financial liabilities is as follows:
NOTES TO THE FINANCIAL STATEMENTS FOR THE YEAR ENdEd 31 dECEMBER 2012
The carrying amount of deferred tax assets is reviewed at each reporting date and reduced to the extent that it is no longer probable that sufficient taxable profit will be available to allow all or part of the deferred tax asset to be utilised. Unrecognised deferred tax assets are reassessed at each reporting date and are recognized to the extent that it has become probable that future taxable profits will allow the deferred tax asset to be recovered.
Deferred tax assets and liabilities are measured at the tax rates that are expected to apply in the year when the asset is realised or the liability is settled, based on tax rates (and tax laws) that have been enacted or substantively enacted at the reporting date.
Deferred tax relating to items recognized outside profit or loss is recognized outside profit or loss. Deferred tax items are recognized in correlation to the underlying transaction either in other comprehensive income or directly in equity.
Deferred tax assets and deferred tax liabilities are offset only when there is a legally enforceable right to set off the current tax assets against current tax liabilities and when they relate to the same entity and the same taxation authority, and the Group intends to settle the tax assets and the tax liabilities on a net basis.
Value added tax
Expenses and assets are recognized net of the amount of sales tax, except:• When the sales tax incurred on a purchase of
assets or services is not recoverable from the taxation authority, in which case the value added tax is recognized as part of the cost of acquisition of the asset or as part of the expense item, as applicable, and
FINANCIAL STATEMENTS
1. SUMMARY OF SIGNIFICANT ACCOUNTING pOLICIES (continued) m) Tax (continued) Deferred tax (continued)
Description of asset/liability
Other equity investmentsTrade and other receivables Loan to subsidiaryCash and cash equivalents-Cash and bank balanceCash and cash equivalents-Cash deposits with related partyCash and cash equivalents-Short term deposits-Held to maturityLoans payable and borrowingsTrade and other payablesCash flow hedge contracts
Classification
Available-for-sale investmentsLoans and receivablesLoans and receivablesLoans and receivables
Held to maturity investments
Held to maturity investments
Loans and borrowings.Loans and borrowings.Derivative financial instruments
NOTES TO THE FINANCIAL STATEMENTS FOR THE YEAR ENdEd 31 dECEMBER 2012
Financial assets
i) Classificationandmeasurement
The Group classifies its financial assets into the following IAS 39 categories: Financial assets at fair value through profit or loss; loans and receivables; held to maturity financial assets; and available for sale financial assets. Management determines the appropriate classification of its financial instruments at initial recognition.
All financial assets are recognised initially at fair value plus transaction costs, except in the case of financial assets recorded at fair value through profit or loss.
Purchases or sales of financial assets that require delivery of assets within a time frame established by regulation or convention in the market place (regular way trades) are recognised on the trade date, i.e. the date that the Group commits to purchase or sell the asset.
Financial assets at fair value through profit or loss
This category has two sub-categories: Financial assets held for trading and those designated at fair value through profit or loss at inception.
A financial asset is classified as held for trading if:
a) it has been acquired or incurred principally for the purpose of selling or repurchasing it in the near term; or
b) on initial recognition it is part of a portfolio of identified financial instruments that the Group manages together and for which there is evidence of a recent actual pattern of short-term profit taking; or;
c) it is a derivative that is not designated and effective as a hedging instrument.
A financial asset other than a financial asset held for trading may be designated as at fair value through profit or loss if:
a. such designation eliminates or significantly reduces a measurement or recognition inconsistency that would otherwise arise; or
b. the financial asset forms part of a Group of financial assets or financial liabilities or both, which is managed and its performance is evaluated on a fair value basis, in accordance with the Group’s documented risk management or investment strategy and information about the grouping is provided internally on that basis; or
c. it forms part of a contract containing one or more embedded derivatives, and IAS 39 Financial Instruments: Recognition and Measurement, permits the entire combined contract (asset or liability) to be designated as at fair value through profit or loss.
Financial instruments at fair value through profit or loss are recognised initially at fair value; transaction costs are taken directly to profit or loss. Gains and losses arising from changes in fair value are included directly in profit or loss. The net gain or loss recognised in the statement of comprehensive income incorporates any dividend or interest earned on the financial asset. The group has not designated any financial assets at fair value through profit or loss.
Loans and receivables Loans and receivables are non-derivative
financial assets with fixed or determinable payments that are not quoted in an active market. After initial measurement, such financial assets are subsequently measured
FINANCIAL STATEMENTS
1. SUMMARY OF SIGNIFICANT ACCOUNTING pOLICIES (continued) o) Financial instruments (continued)

2012 ANNUAL REPORT & FINANCIAL STATEMENTS68 69BAMBURI CEMENT LIMITED I PART OF YOU. FROM THE START
NOTES TO THE FINANCIAL STATEMENTS FOR THE YEAR ENdEd 31 dECEMBER 2012
at amortised cost using the EIR method, less impairment. Amortised cost is calculated by taking into account any discount or premium on acquisition and fees or costs that are an integral part of the EIR. The EIR amortisation is included in finance income in the income statement. The losses arising from impairment are recognised in the income statement in finance costs for loans and in cost of sales or other operating expenses for receivables.
Heldtomaturityfinancialassets Held to maturity investments are non-
derivative financial assets with fixed or determinable payments and fixed maturities that management has the positive intention and ability to hold to maturity. Where a sale of other than an insignificant amount of held-to-maturity assets occurs, the entire category would be tainted and classified as available for sale.
Held to maturity investments are initially recognised at fair value including direct and incremental transaction costs and measured subsequently at amortised cost using the effective interest method less any impairment, with revenue recognised on an effective yield basis.
Available-for-salefinancialassets Available for sale investments are those
that are intended to be held for an indefinite period of time, which may be sold in response to needs for liquidity or changes in interest rates or equity prices or that are not classified as loans and receivables, held-to-maturity investments or financial assets at fair value through profit or loss.
Available-for-sale investments are initially recognised at fair value, which is the cash consideration including any transaction costs, and measured subsequently at fair value.
Gains and losses arising from changes in fair value are recognised in other comprehensive income and accumulated in the fair value reserve with the exception of impairment losses, which are recognised in profit or loss.
Where the investment is disposed of or is
determined to be impaired, the cumulative gain or loss previously accumulated in the fair value reserve is reclassified to profit or loss.
Dividends on available for sale equity instruments are recognised in profit or loss when the Group’s right to receive the dividends is established.
ii) Reclassificationoffinancialassets
Reclassifications are accounted for at the fair value of the financial asset at the date of reclassification.
iii) De-recognitionoffinancialassets
Financial assets are derecognised when the contractual rights to receive cash flows from the financial assets have expired or where the Group has transferred substantially all risks and rewards of ownership of the asset to another entity. If the Group has neither transferred nor retained substantially all the risks and rewards of ownership and continues to control the transferred asset, the Group recognises its retained interest in the asset and an associated liability for amounts it may have to pay. If the Group retains substantially all the risks and rewards of ownership of a transferred financial asset, the Group continues to recognise the financial asset and also recognises a collateralised borrowing for the proceeds received.
FINANCIAL STATEMENTS
1. SUMMARY OF SIGNIFICANT ACCOUNTING pOLICIES (continued) o) Financial instruments (continued) Financial assets (continued)
i) Classificationandmeasurement(Continued) Loans and receivables (continued) iv)Impairmentoffinancialassets
Financial assets, other than those at fair value through profit or loss, are assessed for indicators of impairment at each reporting period end. Financial assets are impaired where there is objective evidence that, as a result of one or more events that occurred after the initial recognition of the financial asset, the estimated future cash flows of the asset have been affected.
For listed and unlisted equity investments classified as available-for-sale, a significant or prolonged decline in the fair value of the security below its cost is considered to be objective evidence of impairment.
For all other financial assets, objective evidence of impairment could include; the Group’s past experience of collecting payments, an increase in the number of delayed payments past the average credit period, delinquency, and initiation of bankruptcy proceedings as well as observable changes in national or local economic conditions that correlate with default on receivables.
For certain categories of financial asset, such as trade receivables, assets that are assessed not to be impaired individually are, in addition, assessed for impairment on a collective basis. Objective evidence of impairment for a portfolio of receivables could include the Group’s past experience of collecting payments, an increase in the number of delayed payments in the portfolio past the average credit period of 30 days, as well as observable changes in national or local economic conditions that correlate with default on receivables.
For financial assets carried at amortised cost, the amount of the impairment loss
recognised is the difference between the asset’s carrying amount and the present value of estimated future cash flows, discounted at the financial asset’s original effective interest rate.
The carrying amount of the financial asset is reduced by the impairment loss directly for all financial assets with the exception of trade receivables, where the carrying amount is reduced through the use of an allowance account. When a trade receivable is considered uncollectible, it is written off against the allowance account. Subsequent recoveries of amounts previously written off are credited against the allowance account. Changes in the carrying amount of the allowance account are recognised in profit or loss.
When an available-for-sale financial asset is considered to be impaired, cumulative gains or losses previously recognised in other comprehensive income are reclassified to profit or loss in the period.
In respect of available-for-sale equity securities, impairment losses previously recognised in profit or loss are not reversed through profit or loss. Any increase in fair value subsequent to an impairment loss is recognised in other comprehensive income.
Financial liabilities and equity instruments issued by the Group
i)Classificationandmeasurement
Financial liabilities within the scope of IAS 39 are classified as financial liabilities at fair value through profit or loss, loans and borrowings, or as derivatives designated as hedging instruments in an effective hedge, as appropriate. The Group determines the classification of its financial liabilities at initial recognition.
FINANCIAL STATEMENTS
NOTES TO THE FINANCIAL STATEMENTS FOR THE YEAR ENdEd 31 dECEMBER 2012
1. SUMMARY OF SIGNIFICANT ACCOUNTING pOLICIES (continued) o) Financial instruments (continued) Financial assets (continued)

2012 ANNUAL REPORT & FINANCIAL STATEMENTS70 71BAMBURI CEMENT LIMITED I PART OF YOU. FROM THE START
All financial liabilities are recognised initially at fair value and, in the case of loans and borrowings, net of directly attributable transaction costs.
The Group’s financial liabilities include trade and other payables, bank overdrafts, loans and borrowings and derivative financial instruments.
Debt and equity instruments are classified as either financial liabilities or as equity in accordance with the substance of the contractual arrangement.
Financial liabilitiesclassifiedas loansandborrowings.
Loans and borrowings, including trade and other payables, bank overdrafts, loans and borrowings, are initially measured at fair value, net of transaction costs.
Loans and borrowings are subsequently measured at amortised cost using the effective interest method, with interest expense recognised on an effective yield basis. The effective interest method is a method of calculating the amortised cost of a financial liability and of allocating interest expense over the relevant period. The effective interest rate is the rate that exactly discounts estimated future cash payments through the expected life of the financial liability, or (where appropriate) a shorter period, to the net carrying amount on initial recognition.
Derivativefinancialinstruments The Group enters into a variety of derivative
financial instruments to manage its exposure to changes in fuel prices and foreign exchange rate risk.
Derivatives are initially recognized at fair value at the date the derivative contract is entered into and are subsequently measured at their fair value at the end of each reporting period.
The resulting gain or loss is recognized in profit or loss immediately.
A derivative with a positive fair value is recognised as a financial asset; a derivative with a negative fair value is recognised as a financial liability. A derivative is presented as a non-current asset or a non-current liability if the remaining maturity of the instrument is more than 12 months and it is not expected to be realised or settled within 12 months. Other derivatives are presented as current assets or current liabilities.
Equityinstruments An equity instrument is any contract that
evidences a residual interest in the assets of an entity after deducting all of its liabilities. Equity instruments issued by the Group are recorded at the proceeds received, net of direct issue costs.
ii) De-recognition of financial liabilities
A financial liability is derecognised when the obligation under the liability is discharged or cancelled, or expires. When an existing financial liability is replaced by another from the same lender on substantially different terms, or the terms of an existing liability are substantially modified, such an exchange or modification is treated as the derecognition of the original liability and the recognition of a new liability. The difference in the respective carrying amounts is recognised in profit or loss.
p) Offsetting of financial instruments
Financial assets and liabilities are offset and the net amount reported in the statement of financial position when there is a currently legally enforceable right to set off the recognised amounts and there is an intention to settle on net basis, or realise the asset and settle the liability simultaneously.
FINANCIAL STATEMENTS
NOTES TO THE FINANCIAL STATEMENTS FOR THE YEAR ENdEd 31 dECEMBER 2012
1. SUMMARY OF SIGNIFICANT ACCOUNTING pOLICIES (continued) o) Financial instruments (continued) Financial liabilities and equity instruments issued by the Group (continued) i)Classificationandmeasurement(continued)
q) Impairment of non financial assets
At each reporting date, the Group reviews the carrying amounts of its tangible and intangible assets to determine whether there is any indication that those assets have suffered an impairment loss. If any such indication exists, the recoverable amount of the asset is estimated in order to determine the extent of the impairment loss.
Where it is not possible to estimate the recoverable amount of an individual asset, the Group estimates the recoverable amount of the cash generating unit to which the asset belongs.
Impairment losses are recognised as an expense immediately except for a property previously revalued when the revaluation was taken to other comprehensive income. In this case, the impairment is also recognised in other comprehensive income up to the amount of any previous revaluation.
An assessment is made at each reporting date to determine whether there is an indication that previously recognised impairment losses no longer exist or have decreased. If such indication exists, the Group estimates the asset’s or CGU’s recoverable amount. A previously recognised impairment loss is reversed only if there has been a change in the assumptions used to determine the asset’s recoverable amount since the last impairment loss was recognised. The reversal is limited so that the carrying amount of the asset does not exceed its recoverable amount, nor exceed the carrying amount that would have been determined, net of depreciation, had no impairment loss been recognised for the asset in prior years. Such reversal is recognised in profit or loss unless the asset is carried at a revalued amount, in which case, the reversal is treated as a revaluation increase.
r) Retirement benefits obligations
The Group operates a defined contribution pension scheme for eligible employees. The
scheme is administered by an independent administration company and is funded by contributions from the Group companies and employees.
The Group also makes contributions to the statutory defined contribution schemes in the two countries where operations are based.
Unionisable staff who retire on attaining the age of 55 years or are declared redundant are eligible for service gratuity and pension based on each employee’s length of service with the Group, as provided for in the collective bargaining agreement.
The Group’s obligations to the staff retirement schemes are charged to the profit or loss as they fall due or in the case of service gratuity as they accrue to each employee.
s) Employee entitlements
Employee entitlements to long service awards are recognised when they accrue to employees. A provision is made for the estimated liability for long-service awards as a result of services rendered by employees up to the reporting date.
Employee entitlements to annual leave are recognized when they accrue to employees. A provision is made for the estimated liability for annual leave at the reporting date.
t) Provisions
Provisions are recognised when the Group has a present obligation (legal or constructive) as a result of a past event, it is probable that the Group will be required to settle the obligation, and a reliable estimate can be made of the amount of obligation.
The amount recognised as a provision is the best estimate of the consideration required to settle the present obligation at the reporting date taking into account the risks and uncertainties surrounding the obligation.
FINANCIAL STATEMENTS
NOTES TO THE FINANCIAL STATEMENTS FOR THE YEAR ENdEd 31 dECEMBER 2012
1. SUMMARY OF SIGNIFICANT ACCOUNTING pOLICIES (continued)

2012 ANNUAL REPORT & FINANCIAL STATEMENTS72 73BAMBURI CEMENT LIMITED I PART OF YOU. FROM THE START
Restructuring Provisions
Restructuring provisions mainly comprise employee termination payments and are recognised in the year in which the Group becomes legally or constructively committed to payment.
Employee termination benefits are recognised only after either an agreement is in place with the appropriate employee representatives specifying the terms of redundancy and number of employees affected, or after individual employees have been advised of the specific terms. Costs related to the ongoing activities of the Group are not provided for in advance.
2. SIGNIFICANT ACCOUNTING JUDGEMENTS AND KEY SOURCES OF ESTIMATION UNCERTAINTY
In the process of applying the Group’s accounting policies, the Directors have made estimates and assumptions that affect the reported amounts of revenues, expenses, assets and liabilities, and the accompanying disclosures, and the disclosure of contingent liabilities within the next financial year.
Uncertainty about these assumptions and estimates could result in outcomes that require a material adjustment to the carrying amount of assets or liabilities affected in future periods.
Estimates and judgements are continually evaluated and are based on historical experience and other factors, including expectations of future events that are believed to be reasonable under the circumstances. Actual results may differ from these estimates.
The estimates and underlying assumptions are reviewed on an ongoing basis. Revisions to accounting estimates are recognised in the period in which the estimate is revised if the revision affects only that period, or in the period of the revision and future periods, if the revision affects both current and future periods.
The key areas of judgement and sources of estimation uncertainty are as set out below:
Inventories provision Management makes provisions for spares that
exceed the set maximum level based on the usage of the inventory by comparing items in stock with the recent past consumption. The maximum level is determined by taking into consideration the lead time, the specified order quantity, the source of the spares and the projected usage rate.
Revaluation of certain class of property, plant and equipment
The Group carries certain class of property, plant and equipment at fair value, with changes in fair value being recognized in the other comprehensive income. The Group’s land, buildings, plant, and machinery were last revalued on 1 December 2012. Land and buildings were valued on the basis of open market value by independent valuers, Knight Frank Valuers Limited
Plant and machinery were revalued on a depreciated replacement cost basis using a valuation model prescribed by engineers and consultants at the technical centre of the ultimate shareholder.
Fairvalueoffinancialinstruments When the fair value of financial assets and
financial liabilities recorded in the statement of financial position cannot be derived from active markets, their fair value is determined using valuation techniques including the discounted cash flow model. The inputs to these models are taken from observable markets where possible, but where this is not feasible, a degree of judgement is required in establishing fair values. The judgements include considerations of inputs such as liquidity risk, credit risk and volatility. Changes in assumptions about these factors could affect the reported fair value of financial instruments. See Note 37 (vi) for further discussion.
1. SUMMARY OF SIGNIFICANT ACCOUNTING pOLICIES (continued) t) Provisions (continued)
NOTES TO THE FINANCIAL STATEMENTS FOR THE YEAR ENdEd 31 dECEMBER 2012
FINANCIAL STATEMENTS FINANCIAL STATEMENTS
NOTES TO THE FINANCIAL STATEMENTS FOR THE YEAR ENdEd 31 dECEMBER 2012
2. SIGNIFICANT ACCOUNTING JUDGEMENTS AND KEY SOURCES OF ESTIMATION UNCERTAINTY (continued)
Impairmentlosses At each reporting date, the Group reviews the
carrying amounts of its tangible and intangible assets to determine whether there is any indication that those assets have suffered an impairment loss. If any such indication exists, the recoverable amount of the asset is estimated in order to determine the extent of the impairment loss.
An impairment exists when the carrying value of an asset or cash generating unit exceeds its recoverable amount, which is the higher of its fair value less costs to sell and its value in use. The fair value less costs to sell calculation is based on available data from binding sales transactions, conducted at arm’s length, for similar assets or observable market prices less incremental costs for disposing of the asset. The value in use calculation is based on a discounted cash flow model. The cash flows are derived from the budget for the next five years and do not include restructuring activities that the Group is not yet committed to or significant future investments that will enhance the asset’s performance of the CGU being tested. The recoverable amount is most sensitive to the discount rate used for the discounted cash flow model as well as the expected future cash-inflows and the growth rate used for extrapolation purposes.
Determining whether goodwill is impaired requires an estimation of the value in use of the cash-generating units to which goodwill has been allocated. The company estimates the dividend yearly expected from each CGU and discounts this using estimated discount rates.
Usefullivesandresidualvaluesofproperty,plantandequipment
The Group reviews the estimated useful lives and residual values of property, plant and equipment at the end of each reporting period. During the financial year, no changes to the useful lives were identified by the Directors.
Contingentliabilities As disclosed in note 31 to these financial
statements, the Group is exposed to various contingent liabilities in the normal course of business including a number of legal cases.
The Directors evaluate the status of these exposures on a regular basis to assess the probability of the Group incurring related liabilities. However, provisions are only made in the financial statements where, based on the Directors’ evaluation, a present obligation has been established.
Incometaxes The Group is subject to income taxes in
various jurisdictions. Significant judgement is required in determining the Group’s provision for income taxes. There are many transactions and calculations for which the ultimate tax determination is uncertain during the ordinary course of business. The group recognises liabilities for anticipated tax audit issues based on estimates of whether additional taxes will be due. Where the final outcome of these matters is different from the amounts that were initially recorded, such differences will impact the income tax and deferred tax provision in the period in which such determination is made.
3. SEGMENT INFORMATION In accordance with IFRS 8, operating segments,
the information presented hereafter by operating segment is the same as that reported to the Chief Operating Decision Maker (the Group Managing Director) for the purposes of making decisions about allocating resources to the segment and assessing its performance.
The Group analyses its organisational structure and internal reporting system for the purpose of identifying suitable segment reporting format for the Group. In particular, the Group has identified geographical segments as the primary segment reporting format that is suitable for the Group. The Group is organised on a regional basis into two main geographical segments: Kenya and Uganda.
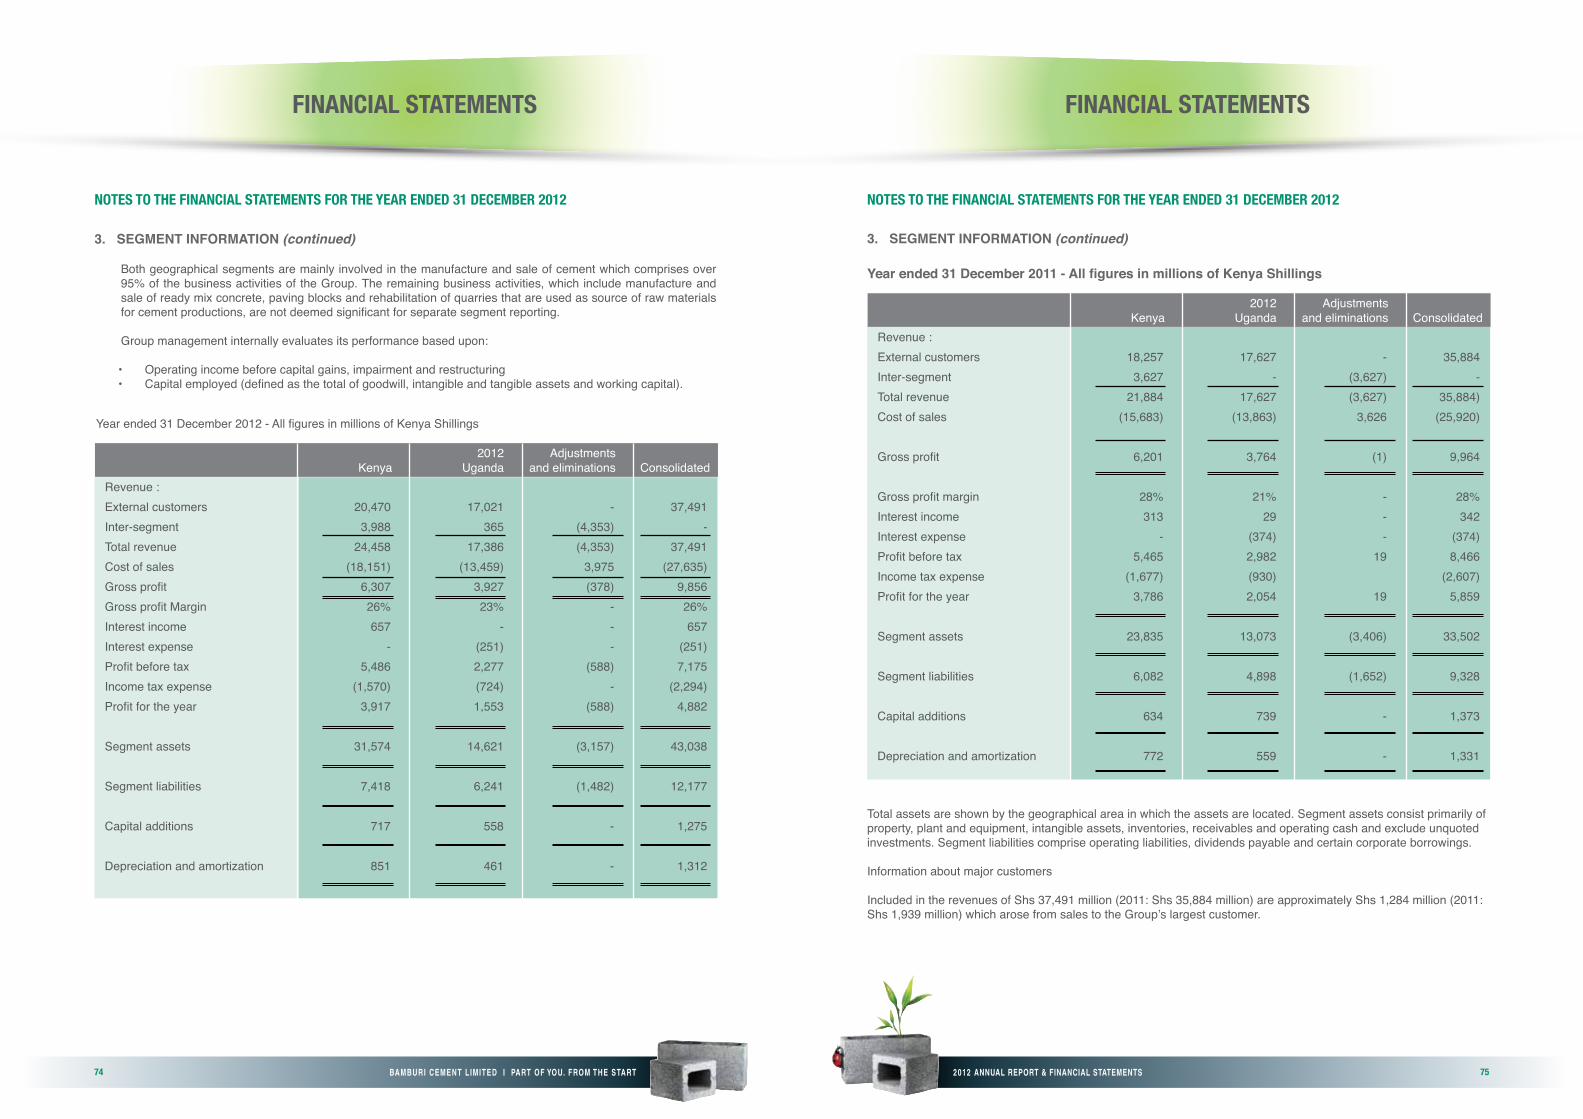
2012 ANNUAL REPORT & FINANCIAL STATEMENTS74 75BAMBURI CEMENT LIMITED I PART OF YOU. FROM THE START
Both geographical segments are mainly involved in the manufacture and sale of cement which comprises over 95% of the business activities of the Group. The remaining business activities, which include manufacture and sale of ready mix concrete, paving blocks and rehabilitation of quarries that are used as source of raw materials for cement productions, are not deemed significant for separate segment reporting.
Group management internally evaluates its performance based upon:
• Operating income before capital gains, impairment and restructuring • Capital employed (defined as the total of goodwill, intangible and tangible assets and working capital).
FINANCIAL STATEMENTS
Revenue : External customers 20,470 17,021 - 37,491Inter-segment 3,988 365 (4,353) -Total revenue 24,458 17,386 (4,353) 37,491Cost of sales (18,151) (13,459) 3,975 (27,635)Gross profit 6,307 3,927 (378) 9,856Gross profit Margin 26% 23% - 26%Interest income 657 - - 657Interest expense - (251) - (251)Profit before tax 5,486 2,277 (588) 7,175Income tax expense (1,570) (724) - (2,294)Profit for the year 3,917 1,553 (588) 4,882
Segment assets 31,574 14,621 (3,157) 43,038
Segment liabilities 7,418 6,241 (1,482) 12,177
Capital additions 717 558 - 1,275
Depreciation and amortization 851 461 - 1,312
2012 Adjustments Kenya Uganda and eliminations Consolidated
Year ended 31 December 2012 - All figures in millions of Kenya Shillings
NOTES TO THE FINANCIAL STATEMENTS FOR THE YEAR ENdEd 31 dECEMBER 2012
3. SEGMENT INFORMATION (continued)
NOTES TO THE FINANCIAL STATEMENTS FOR THE YEAR ENdEd 31 dECEMBER 2012
3. SEGMENT INFORMATION (continued)
FINANCIAL STATEMENTS
Total assets are shown by the geographical area in which the assets are located. Segment assets consist primarily of property, plant and equipment, intangible assets, inventories, receivables and operating cash and exclude unquoted investments. Segment liabilities comprise operating liabilities, dividends payable and certain corporate borrowings.
Information about major customers
Included in the revenues of Shs 37,491 million (2011: Shs 35,884 million) are approximately Shs 1,284 million (2011: Shs 1,939 million) which arose from sales to the Group’s largest customer.
Revenue : External customers 18,257 17,627 - 35,884Inter-segment 3,627 - (3,627) -Total revenue 21,884 17,627 (3,627) 35,884)Cost of sales (15,683) (13,863) 3,626 (25,920)
Gross profit 6,201 3,764 (1) 9,964
Gross profit margin 28% 21% - 28%Interest income 313 29 - 342Interest expense - (374) - (374)Profit before tax 5,465 2,982 19 8,466Income tax expense (1,677) (930) (2,607)Profit for the year 3,786 2,054 19 5,859
Segment assets 23,835 13,073 (3,406) 33,502
Segment liabilities 6,082 4,898 (1,652) 9,328
Capital additions 634 739 - 1,373
Depreciation and amortization 772 559 - 1,331
2012 Adjustments Kenya Uganda and eliminations Consolidated
Year ended 31 December 2011 - All figures in millions of Kenya Shillings

2012 ANNUAL REPORT & FINANCIAL STATEMENTS76 77BAMBURI CEMENT LIMITED I PART OF YOU. FROM THE START
NOTES TO THE FINANCIAL STATEMENTS FOR THE YEAR ENdEd 31 dECEMBER 2012
FINANCIAL STATEMENTS
4. REVENUECement 35,911 34,545 22,877 20,545Paving blocks 642 566 - -Ready mix 802 641 - -Others 136 132 - -
37,491 35,884 22,877 20,545
5. COST OF SALES Energy 8,148 8,164 4,280 4,521Maintenance supplies and contract works 1,471 1,178 817 816Imported clinker 3,446 1,506 3,446 1,506Packaging 1,518 1,451 1,020 978Additives and production supplies 2,953 2,849 1,865 1,695Freight of raw materials 4,367 4,216 3,063 2,842Purchased cement and clinker costs 1,883 1,529 128 2Staff costs 1,486 1,567 1,047 1,086Professional fees 164 491 45 48Telecommunication costs 39 60 12 44Transport and travelling costs 81 61 55 55Rentals, security and business licences 408 371 147 141Depreciation on property, plant and equipment 1,223 1,161 758 697Amortisation of intangible assets and leasehold land 32 19 21 13Inventory Movement and other 416 1,297 298 330
27,635 25,920 17,002 14,774
GROUP COMPANY
2012 2011 2012 2011
Shs’million Shs’million Shs’million Shs’million
The dividends income from subsidiary was received from Hima Cement Limited net of withholding tax of Shs 104 million.
7. OTHER GAINS AND LOSSES Gain on disposal of property, plant and equipment 1 1 - -Sundry income 26 126 5 189Net foreign exchange (losses) / gains (98) 417 (20) 419
(71) 544 (15) 608
8. ADMINISTRATION EXPENSES Staff costs 868 708 580 494Professional fees 82 47 63 68Telecommunication costs 148 132 92 75Transport and travel costs 70 122 42 36Rental and security costs 158 83 72 65Bank charges 37 59 11 20
1,363 1,151 860 758
GROUP COMPANY
2012 2011 2012 2011
Shs’million Shs’million Shs’million Shs’million
NOTES TO THE FINANCIAL STATEMENTS FOR THE YEAR ENdEd 31 dECEMBER 2012
FINANCIAL STATEMENTS
6. INVESTMENT INCOME Interest income – held to maturity bank deposits 651 342 642 313Dividends income – available-for-sale investments 6 - 6 -Dividends income from subsidiary - - 590 -
657 342 1,238 313
GROUP COMPANY 2012 2011 2012 2011 Shs’million Shs’million Shs’million Shs’million

2012 ANNUAL REPORT & FINANCIAL STATEMENTS78 79BAMBURI CEMENT LIMITED I PART OF YOU. FROM THE START
9. OTHER EXPENSES Depreciation on property, plant and equipment 55 65 25 20Amortisation of intangible assets and leasehold land 12 12 13 11Contract works - 35 - 30Technical Fees 1,273 402 687 258Other Costs 43 38 13 (8)
1,383 552 738 311
10. Finance Costs Interest expense on long term loan 251 374 - -
GROUP COMPANY
2012 2011 2012 2011
Shs’million Shs’million Shs’million Shs’million
FINANCIAL STATEMENTS
NOTES TO THE FINANCIAL STATEMENTS FOR THE YEAR ENdEd 31 dECEMBER 2012
FINANCIAL STATEMENTS
NOTES TO THE FINANCIAL STATEMENTS FOR THE YEAR ENdEd 31 dECEMBER 2012
GROUP COMPANY
2012 2011 2012 2011
Shs’million Shs’million Shs’million Shs’million
11 (a) pROFIT BEFORE TAxThe profit before tax is arrived at after charging Staff costs (note 11b) 2,354 2,275 1,627 1,580Depreciation on property, plant and equipment (Note 15(a) 1,278 1,226 783 717Amortisation of intangible assets (Note 17) 36 25 34 1Amortisation of leasehold land (Note 16) 8 6 - -Directors’ emoluments: (note 34 (iv)) Fees 4 4 4 4Other emoluments 123 152 123 152Auditors’ remuneration 10 8 8 7
(b) STAFF COSTS Defined contribution plans and related benefits 173 215 130 199Other employee benefits 2,181 2,060 1,497 1,381
2,354 2,275 1,627 1,580
Presented as: Cost of sales (Note 5) 1486 1,567 1,047 1,086Administration expenses (Note 8) 868 708 580 494
2,354 2,275 1,627 1,580

2012 ANNUAL REPORT & FINANCIAL STATEMENTS80 81BAMBURI CEMENT LIMITED I PART OF YOU. FROM THE START
(a) Tax charge Current tax based on the adjusted profit at 30% 1,849 1,829 1,642 1,828
Deferred tax charge (note 27) 452 779 (93) (180) Over provision of deferred tax in prior years (note 27) (7) (1) (2) -
Net deferred tax charge 445 778 (95) (180)
Total tax charge 2,294 2,607 1,547 1,648
(b) Reconciliation of expected tax based on accounting profit to tax charge: Profit before tax 7,175 8,466 5,424 5,368
Tax calculated at the domestic rates applicable of 30 % 2,153 2,540 1,627 1,611 Tax effect of income not subject to tax (30) - (206) - Tax effect of expenses not deductible for tax purposes 178 68 128 37 Over provision of current tax in prior years (7) (1) (2) -
Total tax charge 2,294 2,607 1,547 1,648
GROUP COMPANY
2012 2011 2012 2011
Shs’million Shs’million Shs’million Shs’million
FINANCIAL STATEMENTS
NOTES TO THE FINANCIAL STATEMENTS FOR THE YEAR ENdEd 31 dECEMBER 2012
12. Tax
FINANCIAL STATEMENTS
NOTES TO THE FINANCIAL STATEMENTS FOR THE YEAR ENdEd 31 dECEMBER 2012
13. EARNINGS pER SHARE
Basic and diluted earnings per share is calculated by dividing the net profit attributable to the ordinary equity holders by the weighted average number of ordinary shares in issue during the year, as shown below:
There were no potentially dilutive shares as at 31 December 2012 and as at 31 December 2011. There were also no discontinued operations during the year (2011: Nil).
(c) Net tax (recoverable)/payable at the beginning of the year (417) 62 (388) 72 Tax charge 1,849 1,829 1,640 1,829 Tax paid (1,818) (2,300) (1,371) (2,295) Prior year under provision - - - 6 Foreign exchange differences 11 (8) - -
Net tax balance at end of the year (375) (417) (119) (388)
Comprising Tax payable - - - - Tax recoverable (375) (417) (119) (388)
Net tax (recoverable)/payable at end of the year (375) (417) (119) (388)
GROUP COMPANY
2012 2011 2012 2011
Shs’million Shs’million Shs’million Shs’million
Net profit attributable to owners of the parent company (Shs million) 4,416 5,243
Weighted average number of ordinary shares (million) 363 363
Basic and diluted earnings per share (Shs) 12.17 14.44
2012 2011 Shs’million Shs’million
12. Tax (continued)

2012 ANNUAL REPORT & FINANCIAL STATEMENTS82 83BAMBURI CEMENT LIMITED I PART OF YOU. FROM THE START
FINANCIAL STATEMENTS
NOTES TO THE FINANCIAL STATEMENTS FOR THE YEAR ENdEd 31 dECEMBER 2012
14. DIVIDENDS
On 31 October 2012, an interim dividend of Sh 2.00 (2011-Shs 2.00) per share representing an amount of Shs 726 million (2011: Shs 726 million) was declared and paid.
In respect of the current year, the Directors propose that a final dividend of Shs 8.50 (2011 – Shs 8.00) per share equivalent to a total sum of Shs 3,086 million (2011 – Shs 2,904 million) be paid to the shareholders.
The final dividend is subject to approval by owners of the company at the Annual General Meeting and has not been included as a liability in these financial statements.
Withholding tax
Payment of dividends is subject to withholding tax at a rate of 10% for non-resident owners of the group and 5% for resident shareholders. For resident owners of the group, withholding tax is only deductible where the shareholding is below 12.5%.
a) Unclaimed dividends At beginning of year 29 30 Declared during the year 3,630 3,267 Dividends claimed in the year - note 14(b) (3,630) (3,268) Dividends written back (6) - At end of year 23 29
b) Payments during the year 2012 and 2011: Final dividend for previous years 2,904 2,542 Interim dividend for current year 726 726 3,630 3,268
c) Dividends declared/proposed in respect of the year Interim dividend - paid in the year 726 726 Proposed for approval at the annual general meeting (not recognized as a liability as at 31 December): 3,086 2,904 3,812 3,630
Dividends per share (based on number of shares per note 13) Shs 10.50 Shs 10.00
GROUP AND COMPANY 2012 2011 Shs’million Shs’million
FINANCIAL STATEMENTS
NOTES TO THE FINANCIAL STATEMENTS FOR THE YEAR ENdEd 31 dECEMBER 2012
*The foreign exchange adjustments arise from the translation of the carrying values of assets held by a subsidiary, HimCem Holdings Limited.
Cost or valuation
At 1 January 2012 1,388 30,149 1,072 811 2,067 35,487
Foreign exchange adjustments* (25) (765) (29) (15) (18) (852)
Additions - 154 90 - 941 1,185
Retirements - - - - (29) (29)
Disposals (3) - - (3) - (6)
Transfers 259 1,364 79 144 (1,846) -
Revaluation surplus 6,030 1,229 - - - 7,259
At 31 December 2012 7,649 32,131 1,212 937 1,115 43,044
Depreciation
At 1 January 2012 416 14,714 674 677 - 16,481
Foreign exchange adjustments* (6) (250) (16) (11) - (283)
Charge for the year 33 1,050 160 35 - 1,278
Disposals (1) - - (3) - (4)
At 31 December 2012 442 15,514 818 698 - 17,472
Net carrying amount
At 31 December 2012 7,207 16,617 394 239 1,115 25,572
Land and Office Capital residential Plant and equipment Mobile work-in- buildings machinery and tools Plant progress Total Shs’million Shs’million Shs’million Shs’million Shs’million Shs’million
15. pROpERTY, pLANT AND EQUIpMENTa) GROUP
Year ended 31 December 2012
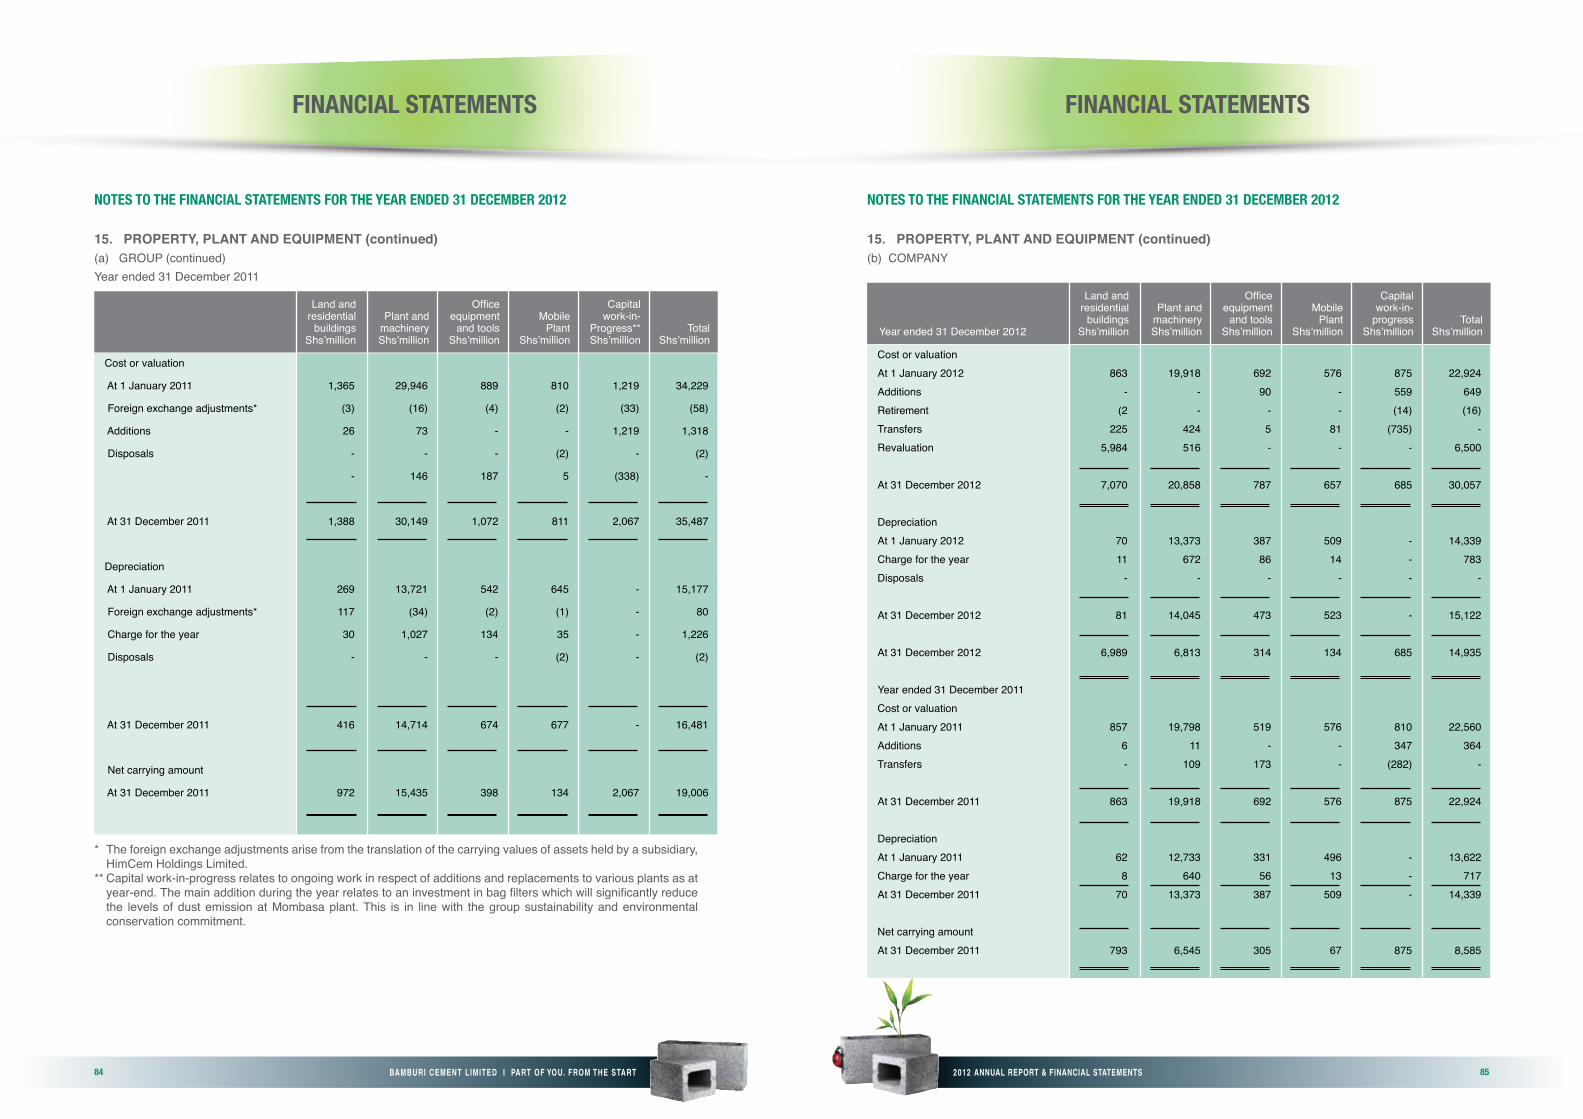
2012 ANNUAL REPORT & FINANCIAL STATEMENTS84 85BAMBURI CEMENT LIMITED I PART OF YOU. FROM THE START
FINANCIAL STATEMENTS
* The foreign exchange adjustments arise from the translation of the carrying values of assets held by a subsidiary, HimCem Holdings Limited.
** Capital work-in-progress relates to ongoing work in respect of additions and replacements to various plants as at year-end. The main addition during the year relates to an investment in bag filters which will significantly reduce the levels of dust emission at Mombasa plant. This is in line with the group sustainability and environmental conservation commitment.
NOTES TO THE FINANCIAL STATEMENTS FOR THE YEAR ENdEd 31 dECEMBER 2012
Cost or valuation
At 1 January 2011 1,365 29,946 889 810 1,219 34,229
Foreign exchange adjustments* (3) (16) (4) (2) (33) (58)
Additions 26 73 - - 1,219 1,318
Disposals - - - (2) - (2)
- 146 187 5 (338) -
At 31 December 2011 1,388 30,149 1,072 811 2,067 35,487
Depreciation
At 1 January 2011 269 13,721 542 645 - 15,177
Foreign exchange adjustments* 117 (34) (2) (1) - 80
Charge for the year 30 1,027 134 35 - 1,226
Disposals - - - (2) - (2)
At 31 December 2011 416 14,714 674 677 - 16,481
Net carrying amount
At 31 December 2011 972 15,435 398 134 2,067 19,006
Land and Office Capital residential Plant and equipment Mobile work-in- buildings machinery and tools Plant Progress** Total Shs’million Shs’million Shs’million Shs’million Shs’million Shs’million
15. pROpERTY, pLANT AND EQUIpMENT (continued)(a) GROUP (continued)Year ended 31 December 2011
FINANCIAL STATEMENTS
NOTES TO THE FINANCIAL STATEMENTS FOR THE YEAR ENdEd 31 dECEMBER 2012
Cost or valuation At 1 January 2012 863 19,918 692 576 875 22,924Additions - - 90 - 559 649Retirement (2 - - - (14) (16)Transfers 225 424 5 81 (735) -Revaluation 5,984 516 - - - 6,500
At 31 December 2012 7,070 20,858 787 657 685 30,057
Depreciation At 1 January 2012 70 13,373 387 509 - 14,339Charge for the year 11 672 86 14 - 783Disposals - - - - - -
At 31 December 2012 81 14,045 473 523 - 15,122
At 31 December 2012 6,989 6,813 314 134 685 14,935
Year ended 31 December 2011Cost or valuation At 1 January 2011 857 19,798 519 576 810 22,560Additions 6 11 - - 347 364Transfers - 109 173 - (282) -
At 31 December 2011 863 19,918 692 576 875 22,924
Depreciation At 1 January 2011 62 12,733 331 496 - 13,622Charge for the year 8 640 56 13 - 717At 31 December 2011 70 13,373 387 509 - 14,339
Net carrying amount At 31 December 2011 793 6,545 305 67 875 8,585
Land and Office Capital residential Plant and equipment Mobile work-in- buildings machinery and tools Plant progress TotalYear ended 31 December 2012 Shs’million Shs’million Shs’million Shs’million Shs’million Shs’million
15. pROpERTY, pLANT AND EQUIpMENT (continued)(b) COMPANY
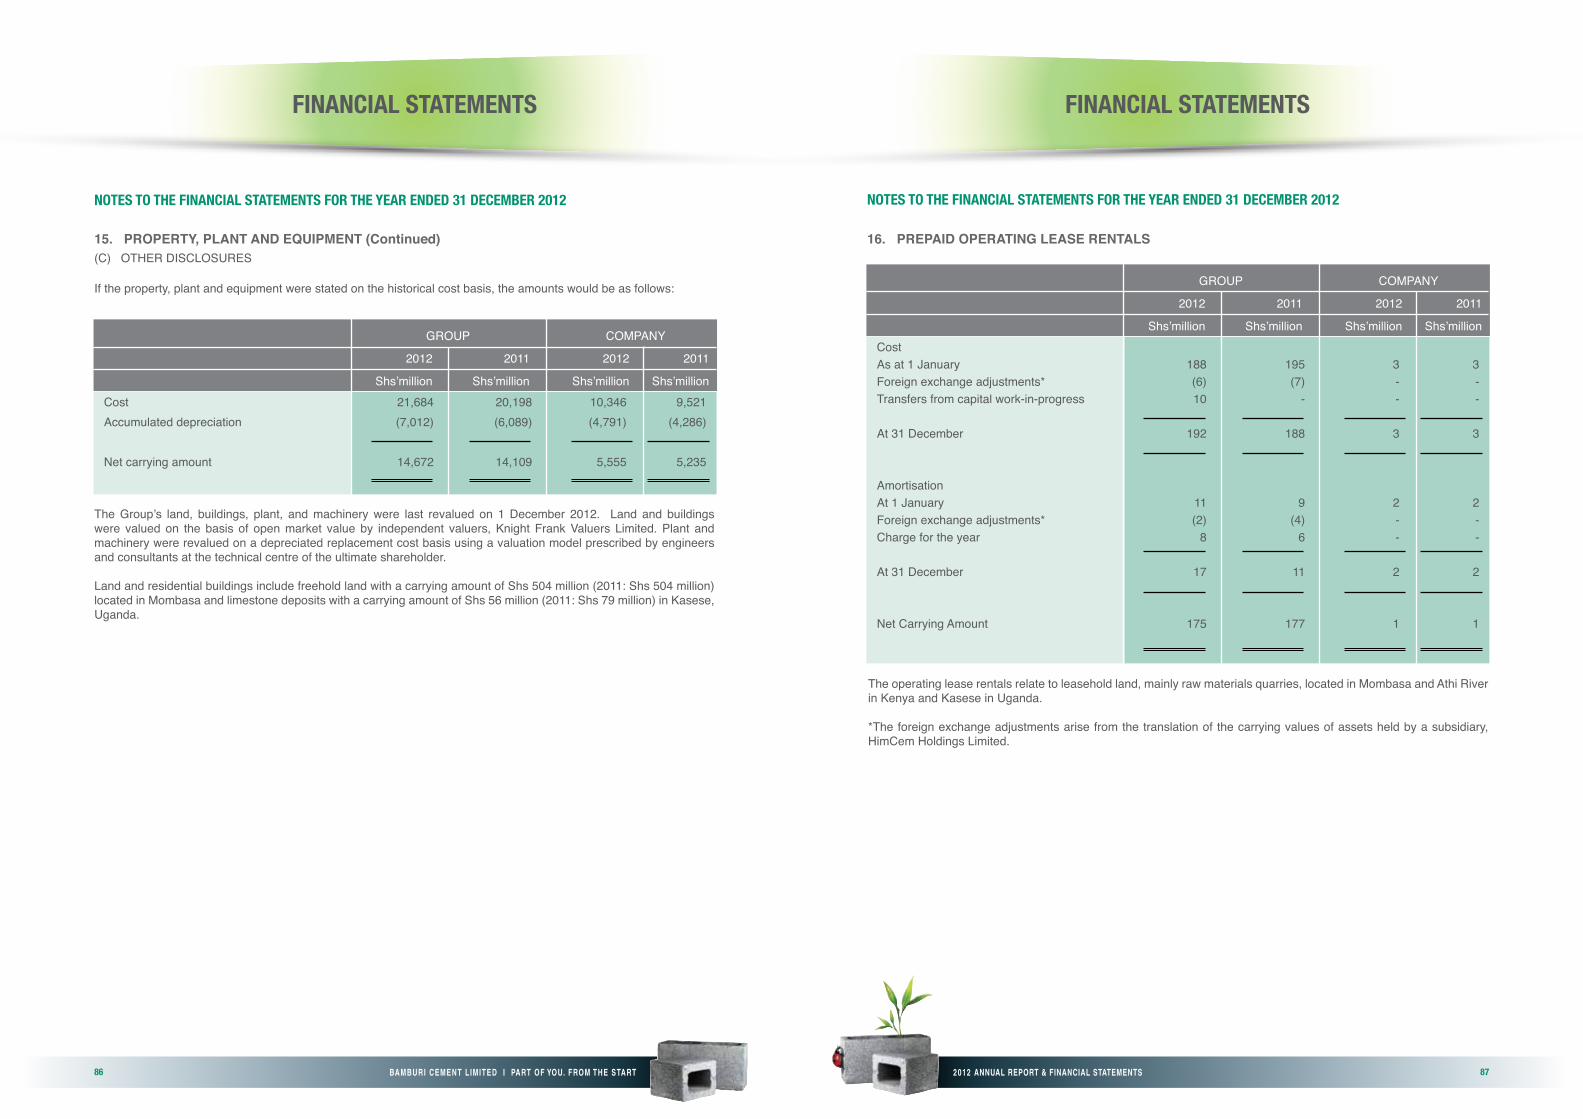
2012 ANNUAL REPORT & FINANCIAL STATEMENTS86 87BAMBURI CEMENT LIMITED I PART OF YOU. FROM THE START
FINANCIAL STATEMENTS
NOTES TO THE FINANCIAL STATEMENTS FOR THE YEAR ENdEd 31 dECEMBER 2012
15. pROpERTY, pLANT AND EQUIpMENT (Continued)(C) OTHER DISCLOSURES If the property, plant and equipment were stated on the historical cost basis, the amounts would be as follows:
The Group’s land, buildings, plant, and machinery were last revalued on 1 December 2012. Land and buildings were valued on the basis of open market value by independent valuers, Knight Frank Valuers Limited. Plant and machinery were revalued on a depreciated replacement cost basis using a valuation model prescribed by engineers and consultants at the technical centre of the ultimate shareholder.
Land and residential buildings include freehold land with a carrying amount of Shs 504 million (2011: Shs 504 million) located in Mombasa and limestone deposits with a carrying amount of Shs 56 million (2011: Shs 79 million) in Kasese, Uganda.
Cost 21,684 20,198 10,346 9,521Accumulated depreciation (7,012) (6,089) (4,791) (4,286)
Net carrying amount 14,672 14,109 5,555 5,235
GROUP COMPANY
2012 2011 2012 2011
Shs’million Shs’million Shs’million Shs’million
FINANCIAL STATEMENTS
NOTES TO THE FINANCIAL STATEMENTS FOR THE YEAR ENdEd 31 dECEMBER 2012
The operating lease rentals relate to leasehold land, mainly raw materials quarries, located in Mombasa and Athi River in Kenya and Kasese in Uganda.
*The foreign exchange adjustments arise from the translation of the carrying values of assets held by a subsidiary, HimCem Holdings Limited.
16. pREpAID OpERATING LEASE RENTALS
Cost As at 1 January 188 195 3 3Foreign exchange adjustments* (6) (7) - -Transfers from capital work-in-progress 10 - - -
At 31 December 192 188 3 3
Amortisation At 1 January 11 9 2 2Foreign exchange adjustments* (2) (4) - -Charge for the year 8 6 - -
At 31 December 17 11 2 2
Net Carrying Amount 175 177 1 1
GROUP COMPANY
2012 2011 2012 2011
Shs’million Shs’million Shs’million Shs’million
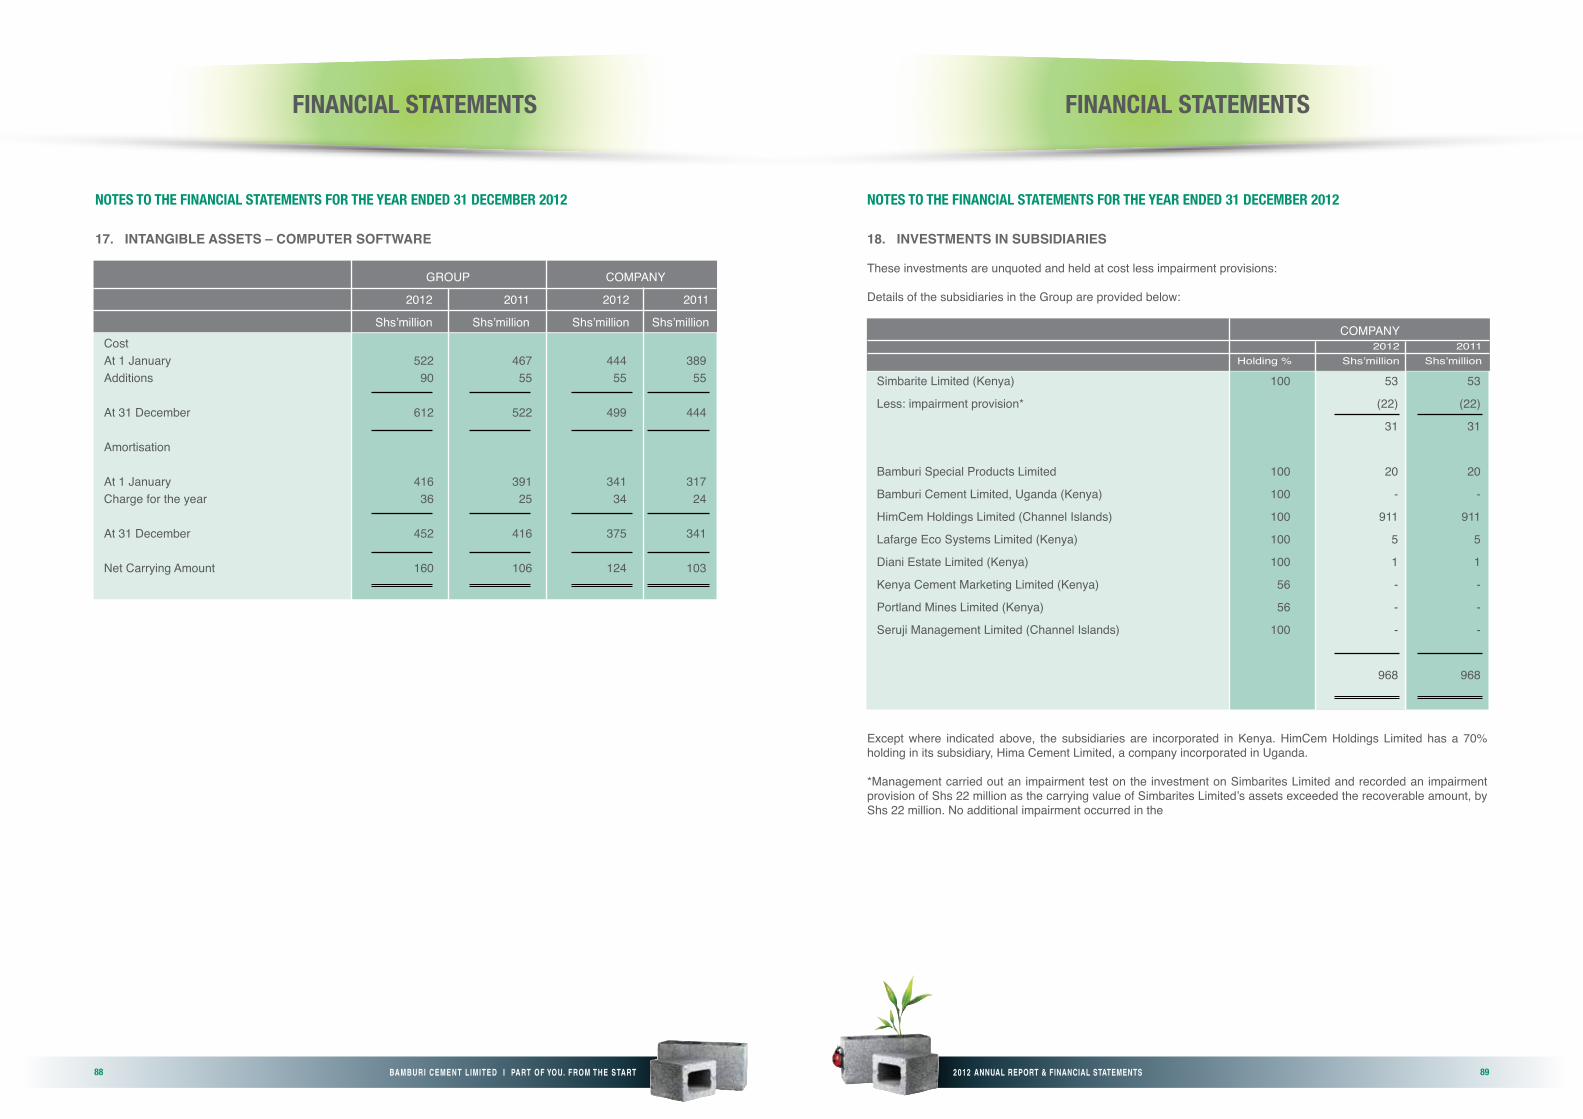
2012 ANNUAL REPORT & FINANCIAL STATEMENTS88 89BAMBURI CEMENT LIMITED I PART OF YOU. FROM THE START
FINANCIAL STATEMENTS
NOTES TO THE FINANCIAL STATEMENTS FOR THE YEAR ENdEd 31 dECEMBER 2012
17. INTANGIBLE ASSETS – COMpUTER SOFTwARE
CostAt 1 January 522 467 444 389Additions 90 55 55 55 At 31 December 612 522 499 444 Amortisation At 1 January 416 391 341 317Charge for the year 36 25 34 24 At 31 December 452 416 375 341
Net Carrying Amount 160 106 124 103
GROUP COMPANY
2012 2011 2012 2011
Shs’million Shs’million Shs’million Shs’million
FINANCIAL STATEMENTS
NOTES TO THE FINANCIAL STATEMENTS FOR THE YEAR ENdEd 31 dECEMBER 2012
18. INVESTMENTS IN SUBSIDIARIES These investments are unquoted and held at cost less impairment provisions:
Details of the subsidiaries in the Group are provided below:
Except where indicated above, the subsidiaries are incorporated in Kenya. HimCem Holdings Limited has a 70% holding in its subsidiary, Hima Cement Limited, a company incorporated in Uganda.
*Management carried out an impairment test on the investment on Simbarites Limited and recorded an impairment provision of Shs 22 million as the carrying value of Simbarites Limited’s assets exceeded the recoverable amount, by Shs 22 million. No additional impairment occurred in the
Simbarite Limited (Kenya) 100 53 53
Less: impairment provision* (22) (22)
31 31
Bamburi Special Products Limited 100 20 20
Bamburi Cement Limited, Uganda (Kenya) 100 - -
HimCem Holdings Limited (Channel Islands) 100 911 911
Lafarge Eco Systems Limited (Kenya) 100 5 5
Diani Estate Limited (Kenya) 100 1 1
Kenya Cement Marketing Limited (Kenya) 56 - -
Portland Mines Limited (Kenya) 56 - -
Seruji Management Limited (Channel Islands) 100 - -
968 968
COMPANY 2012 2011 Holding % Shs’million Shs’million
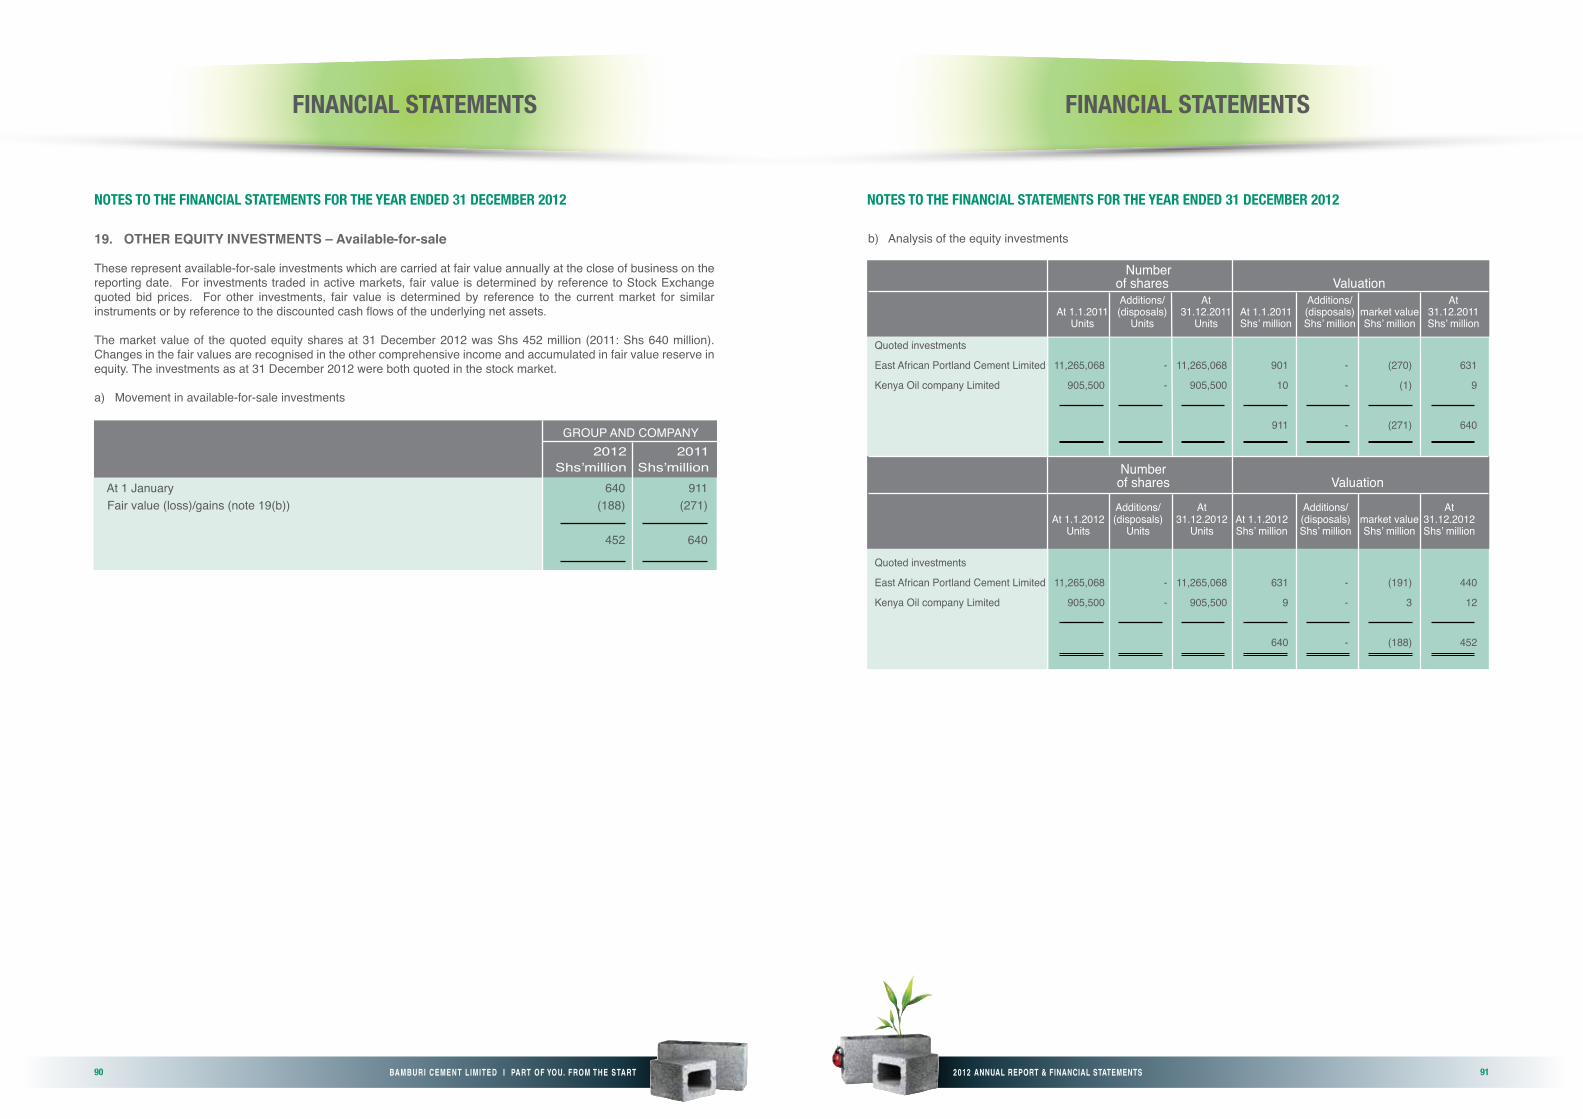
2012 ANNUAL REPORT & FINANCIAL STATEMENTS90 91BAMBURI CEMENT LIMITED I PART OF YOU. FROM THE START
FINANCIAL STATEMENTS
NOTES TO THE FINANCIAL STATEMENTS FOR THE YEAR ENdEd 31 dECEMBER 2012
19. OTHER EQUITY INVESTMENTS – Available-for-sale
These represent available-for-sale investments which are carried at fair value annually at the close of business on the reporting date. For investments traded in active markets, fair value is determined by reference to Stock Exchange quoted bid prices. For other investments, fair value is determined by reference to the current market for similar instruments or by reference to the discounted cash flows of the underlying net assets.
The market value of the quoted equity shares at 31 December 2012 was Shs 452 million (2011: Shs 640 million). Changes in the fair values are recognised in the other comprehensive income and accumulated in fair value reserve in equity. The investments as at 31 December 2012 were both quoted in the stock market.
a) Movement in available-for-sale investments
_____ _____
_____ _____
At 1 January 640 911 Fair value (loss)/gains (note 19(b)) (188) (271) 452 640
GROUP AND COMPANY 2012 2011 Shs’million Shs’million
FINANCIAL STATEMENTS
NOTES TO THE FINANCIAL STATEMENTS FOR THE YEAR ENdEd 31 dECEMBER 2012
Number of shares Valuation Additions/ At Additions/ At At 1.1.2011 (disposals) 31.12.2011 At 1.1.2011 (disposals) market value 31.12.2011 Units Units Units Shs’ million Shs’ million Shs’ million Shs’ million
b) Analysis of the equity investments
Quoted investments
East African Portland Cement Limited 11,265,068 - 11,265,068 901 - (270) 631
Kenya Oil company Limited 905,500 - 905,500 10 - (1) 9
911 - (271) 640
Number of shares Valuation Additions/ At Additions/ At At 1.1.2012 (disposals) 31.12.2012 At 1.1.2012 (disposals) market value 31.12.2012 Units Units Units Shs’ million Shs’ million Shs’ million Shs’ million
Quoted investments
East African Portland Cement Limited 11,265,068 - 11,265,068 631 - (191) 440
Kenya Oil company Limited 905,500 - 905,500 9 - 3 12
640 - (188) 452
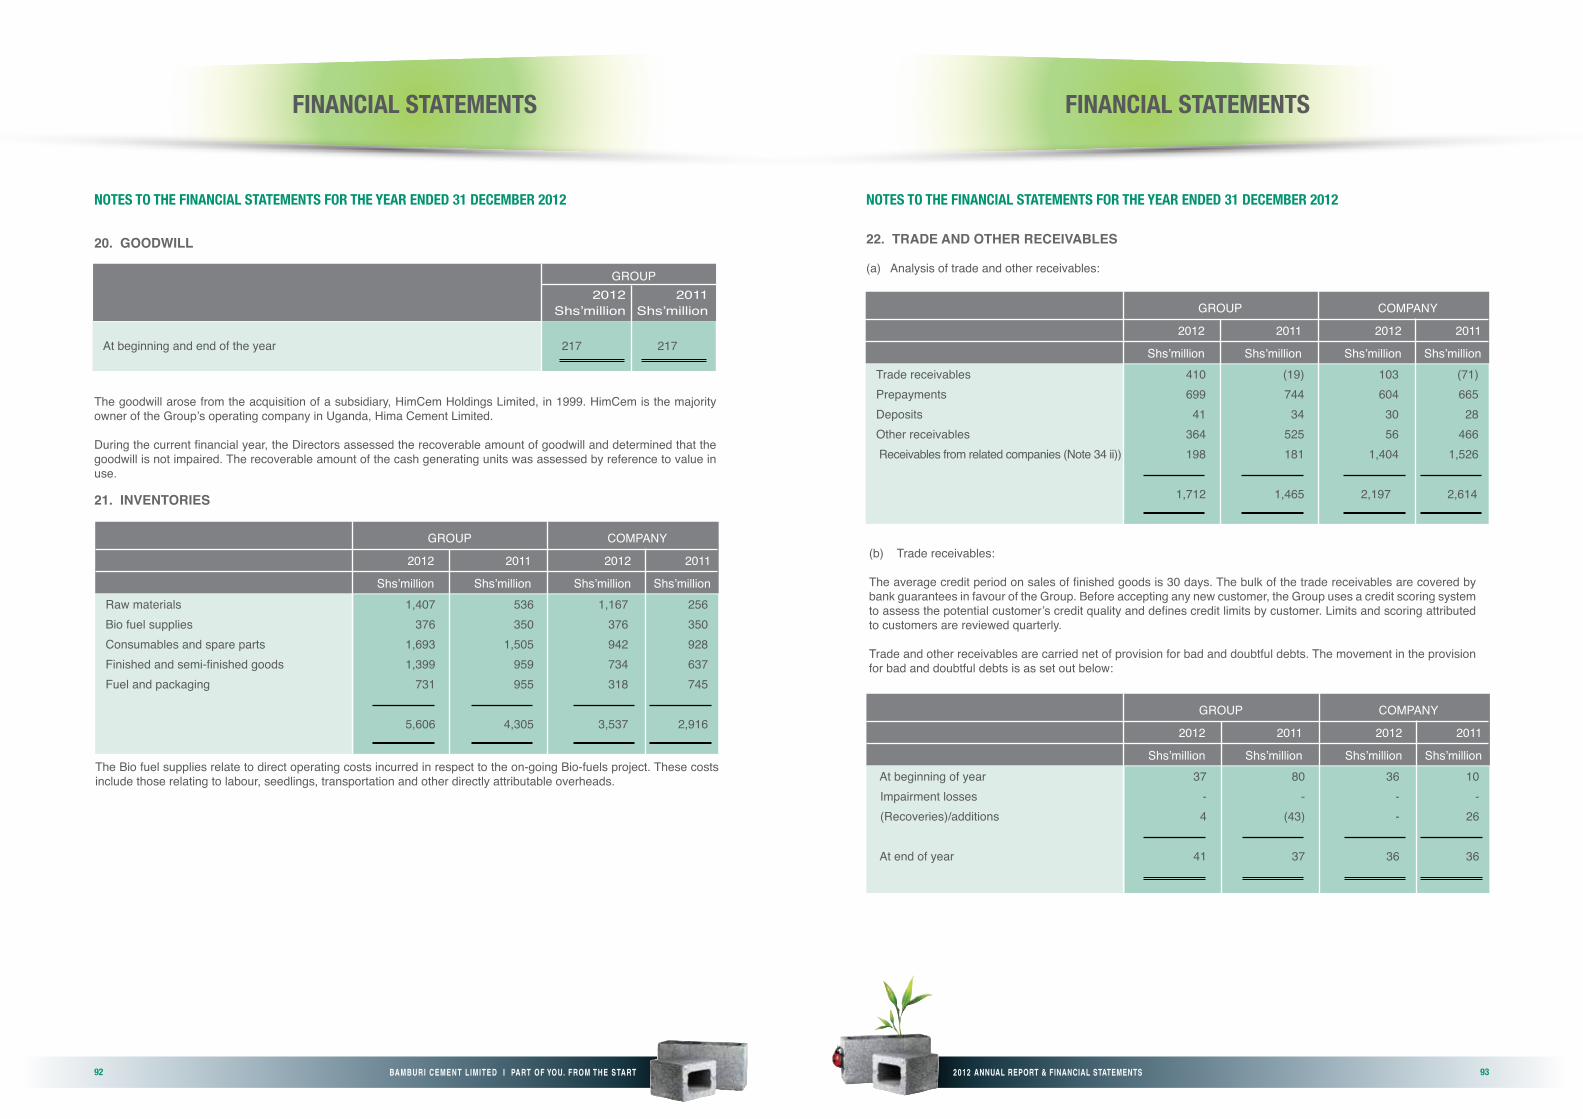
2012 ANNUAL REPORT & FINANCIAL STATEMENTS92 93BAMBURI CEMENT LIMITED I PART OF YOU. FROM THE START
_____ _____At beginning and end of the year 217 217
GROUP 2012 2011 Shs’million Shs’million
FINANCIAL STATEMENTS
NOTES TO THE FINANCIAL STATEMENTS FOR THE YEAR ENdEd 31 dECEMBER 2012
The goodwill arose from the acquisition of a subsidiary, HimCem Holdings Limited, in 1999. HimCem is the majority owner of the Group’s operating company in Uganda, Hima Cement Limited.
During the current financial year, the Directors assessed the recoverable amount of goodwill and determined that the goodwill is not impaired. The recoverable amount of the cash generating units was assessed by reference to value in use.
The Bio fuel supplies relate to direct operating costs incurred in respect to the on-going Bio-fuels project. These costs include those relating to labour, seedlings, transportation and other directly attributable overheads.
21. INVENTORIES
Raw materials 1,407 536 1,167 256Bio fuel supplies 376 350 376 350Consumables and spare parts 1,693 1,505 942 928Finished and semi-finished goods 1,399 959 734 637Fuel and packaging 731 955 318 745 5,606 4,305 3,537 2,916
GROUP COMPANY
2012 2011 2012 2011
Shs’million Shs’million Shs’million Shs’million
20. GOODwILL
Trade receivables 410 (19) 103 (71)Prepayments 699 744 604 665Deposits 41 34 30 28Other receivables 364 525 56 466 Receivables from related companies (Note 34 ii)) 198 181 1,404 1,526
1,712 1,465 2,197 2,614
GROUP COMPANY
2012 2011 2012 2011
Shs’million Shs’million Shs’million Shs’million
At beginning of year 37 80 36 10 Impairment losses - - - - (Recoveries)/additions 4 (43) - 26
At end of year 41 37 36 36
GROUP COMPANY
2012 2011 2012 2011
Shs’million Shs’million Shs’million Shs’million
FINANCIAL STATEMENTS
NOTES TO THE FINANCIAL STATEMENTS FOR THE YEAR ENdEd 31 dECEMBER 2012
22. TRADE AND OTHER RECEIVABLES
(a) Analysis of trade and other receivables:
(b) Trade receivables:
The average credit period on sales of finished goods is 30 days. The bulk of the trade receivables are covered by bank guarantees in favour of the Group. Before accepting any new customer, the Group uses a credit scoring system to assess the potential customer’s credit quality and defines credit limits by customer. Limits and scoring attributed to customers are reviewed quarterly.
Trade and other receivables are carried net of provision for bad and doubtful debts. The movement in the provision for bad and doubtful debts is as set out below:

2012 ANNUAL REPORT & FINANCIAL STATEMENTS94 95BAMBURI CEMENT LIMITED I PART OF YOU. FROM THE START
Cash at bank and on hand 1,614 2,283 691 1,458 Cash deposits with related party (note 34(ii)) 7,130 4,828 7,130 4,828 Short term bank deposits – held to maturity 25 25 - - 8,769 7,136 7,821 6,286
GROUP COMPANY
2012 2011 2012 2011
Shs’million Shs’million Shs’million Shs’million
Derivatives designated and effective as hedging instruments - 33 - 15
GROUP COMPANY
2012 2011 2012 2011
Shs’million Shs’million Shs’million Shs’million
FINANCIAL STATEMENTS
NOTES TO THE FINANCIAL STATEMENTS FOR THE YEAR ENdEd 31 dECEMBER 2012
In determining the recoverability of a trade receivable, the Group considers any change in the credit quality of the trade receivable from the date credit was initially granted up to the reporting date.
Other receivables and receivables from related companies are all performing and no impairment losses have been recognised for them.
23. CASH FLOWS HEDGES
There were no outstanding cash flow hedges at the end of the reporting period.
In 2011, the Group had entered into cash flow hedge contracts with its holding company Lafarge SA. The contracts have different maturity dates ranging up to 12 months from the end of the reporting period. There were no hedging contracts entered into during the year.
24. CASH AND CASH EQUIVALENTS
(a) Analysis of cash and cash equivalents:
Cash and cash equivalents: - note 24(a) 8,769 7,136 7,821 6,286
(c) Short term bank deposits – held to maturity: Cash deposits with related party (note 34(ii)) 7,130 4,828 7,130 4,828 Short term bank deposits – held to maturity 25 25 - - Short term fixed deposits 7,155 4,853 7,130 4,828
GROUP COMPANY
2012 2011 2012 2011
Shs’million Shs’million Shs’million Shs’million
Local currencies 16.27% 9.52% 12.54% 7.72% Foreign currencies 2.64% 0.87% 3.41% 1.13%
GROUP COMPANY
2012 2011 2012 2011
Shs’million Shs’million Shs’million Shs’million
Local currencies 14.47% 7.86% 14.47% 7.86% Foreign currencies 0.15% 0.11% 0.14% 0.55%
GROUP COMPANY
2012 2011 2012 2011
Shs’million Shs’million Shs’million Shs’million
FINANCIAL STATEMENTS
NOTES TO THE FINANCIAL STATEMENTS FOR THE YEAR ENdEd 31 dECEMBER 2012
The short-term bank deposits mature within 90 days from the date of placement.
The weighted average interest rates earned on the short-term bank deposits during the year were as shown below:
(d) Cash deposit with related party The weighted average interest rates earned on the cash deposited with related party during the year were as
shown below:
24. CASH AND CASH EQUIVALENTS (continued)
(b) Cash and cash equivalents:
For the purposes of the statement of cash flows, cash and cash equivalents comprise balances with less than three months’ maturity from the date of acquisition, including cash in hand, deposits held at call with banks and other short term highly liquid investments with original maturities of three months or less, net of bank overdrafts. Analysis of cash and cash equivalents is as set out below:

2012 ANNUAL REPORT & FINANCIAL STATEMENTS96 97BAMBURI CEMENT LIMITED I PART OF YOU. FROM THE START
Authorised 366,600,000 ordinary shares of Shs 5 each 1,833 1,833100,000, 7% redeemable cumulative preference shares of Shs 20 each 2 2
1,835 1,835
Issued and fully paid 362,959,275 ordinary shares of Shs 5 each 1,815 1,815
GROUP AND COMPANY 2012 2011 Shs’million Shs’million
FINANCIAL STATEMENTS
NOTES TO THE FINANCIAL STATEMENTS FOR THE YEAR ENdEd 31 dECEMBER 2012
25. SHARE CApITAL
Fully paid ordinary shares, which have a par value of Shs 5 each, carry a right of one vote per share and have rights to dividends.
26. RESERVES
a) Asset revaluation reserve The revaluation reserve arises on the revaluation of property, plant and equipment. An annual transfer from
the asset revaluation reserve to retained earnings is made for the difference between depreciation based on the revalued amount of the asset and depreciation based on the asset original cost. When revalued assets are sold, the portion of the revaluation reserve that relates to those assets is effectively realised and transferred directly to retained earnings. The revaluation reserve is not distributable.
b) Fair value reserve The fair value reserve represents accumulated gains and losses arising on the revaluation of available- for-
sale financial assets that have been recognised in other comprehensive income, net of amounts reclassified to profit or loss when those assets have been disposed of or are determined to be impaired.
At 1 January 437 708Net loss arising on revaluation of available for sale investments (note 19(b)) (188) (271)
At 31 December 249 437
GROUP AND COMPANY 2012 2011 Shs’million Shs’million
FINANCIAL STATEMENTS
NOTES TO THE FINANCIAL STATEMENTS FOR THE YEAR ENdEd 31 dECEMBER 2012
26. RESERVES (continued)
c) Translation reserve Exchange differences relating to the translation of the net assets of the Group’s foreign operations from their
functional currency to the Group’s presentation currency (Kenya shillings) are recognised directly in other comprehensive income and accumulated in the foreign currency translation reserve. Exchange differences previously accumulated in the foreign currency translation reserve are reclassified to profit or loss on disposal or partial disposal of the foreign operation.
d) Cash flow hedging reserve
The cash flow hedging reserve represents the cumulative effective portion of gains or losses arising on changes in fair value of hedging instruments entered into for cash flow hedges. The cumulative gain or loss arising on changes in fair value of the hedging instruments that are recognised and accumulated under the heading of cash flow hedging reserve will be reclassified to profit or loss only when the hedged transaction affects the profit or loss, or included as a basis adjustment to the non-financial hedged item, consistent with the relevant accounting policy. No hedging instruments were held as at year end.
27. DEFERRED TAX LIABILITY
Deferred taxes are calculated on all temporary differences under the liability method using a principal tax rate of 30% (2011: 30%). The makeup of the deferred tax liabilities at the year end and the movement on the deferred tax account during the year are as presented below:
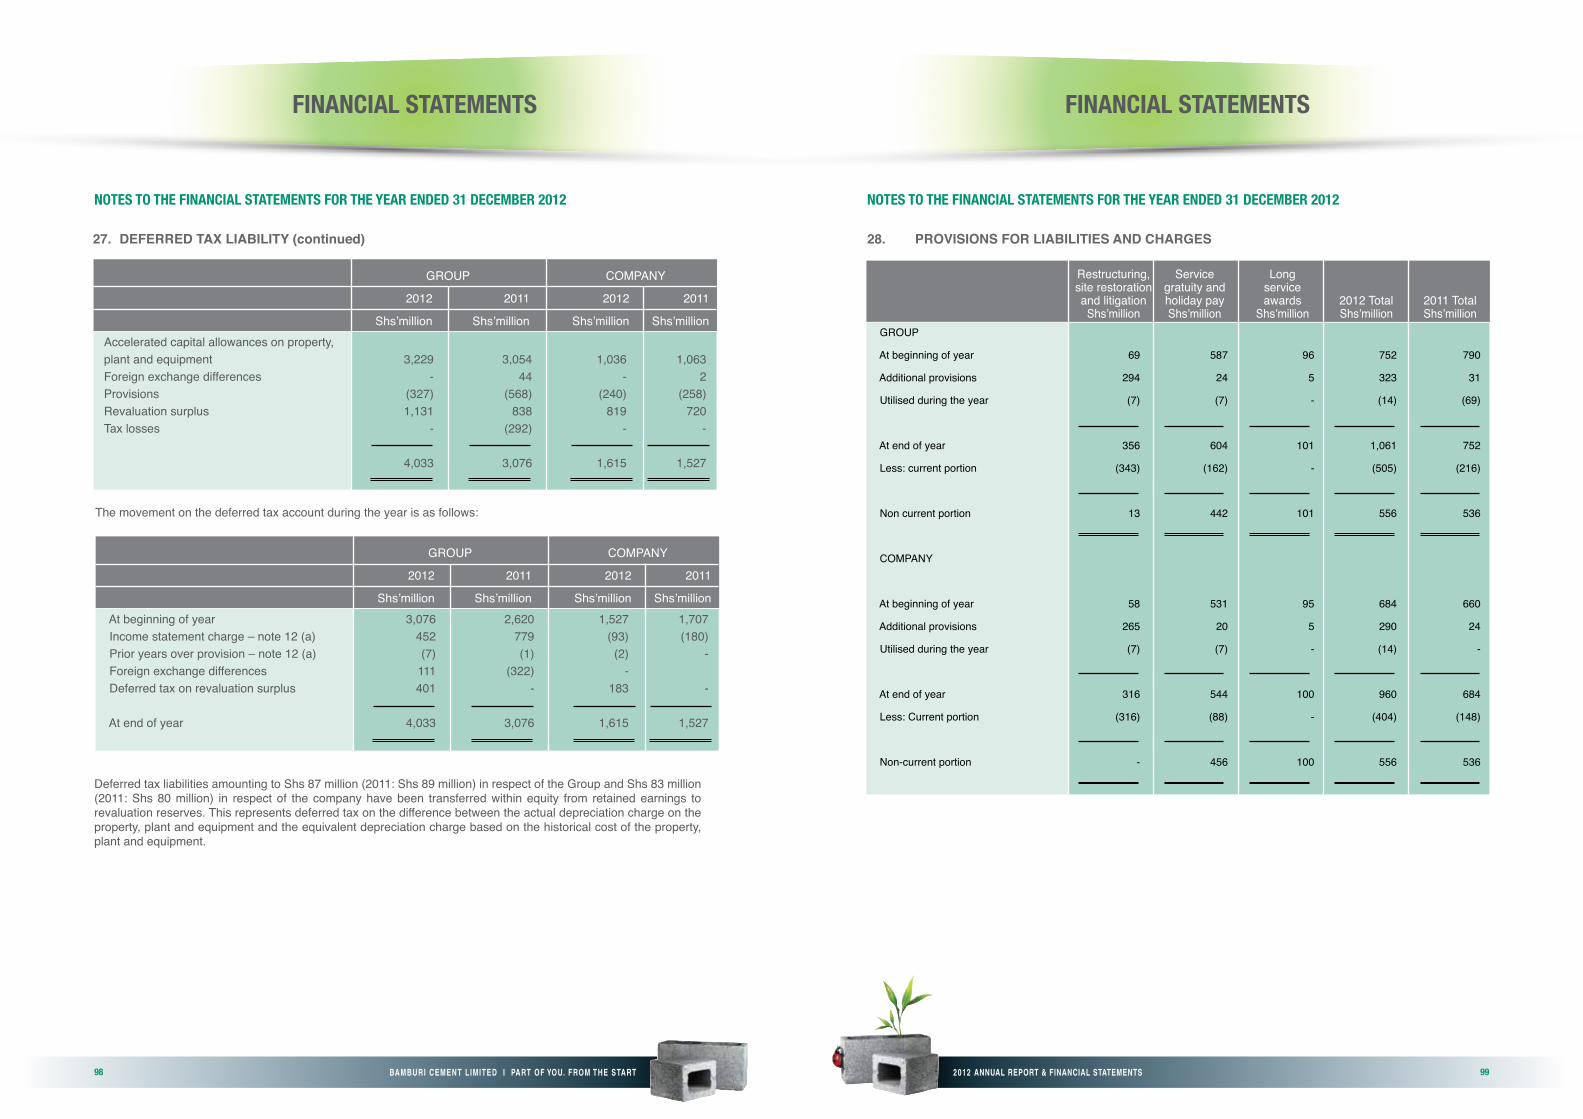
2012 ANNUAL REPORT & FINANCIAL STATEMENTS98 99BAMBURI CEMENT LIMITED I PART OF YOU. FROM THE START
Accelerated capital allowances on property, plant and equipment 3,229 3,054 1,036 1,063Foreign exchange differences - 44 - 2Provisions (327) (568) (240) (258)Revaluation surplus 1,131 838 819 720Tax losses - (292) - -
4,033 3,076 1,615 1,527
GROUP COMPANY
2012 2011 2012 2011
Shs’million Shs’million Shs’million Shs’million
At beginning of year 3,076 2,620 1,527 1,707 Income statement charge – note 12 (a) 452 779 (93) (180) Prior years over provision – note 12 (a) (7) (1) (2) - Foreign exchange differences 111 (322) - Deferred tax on revaluation surplus 401 - 183 -
At end of year 4,033 3,076 1,615 1,527
GROUP COMPANY
2012 2011 2012 2011
Shs’million Shs’million Shs’million Shs’million
FINANCIAL STATEMENTS
NOTES TO THE FINANCIAL STATEMENTS FOR THE YEAR ENdEd 31 dECEMBER 2012
The movement on the deferred tax account during the year is as follows:
Deferred tax liabilities amounting to Shs 87 million (2011: Shs 89 million) in respect of the Group and Shs 83 million (2011: Shs 80 million) in respect of the company have been transferred within equity from retained earnings to revaluation reserves. This represents deferred tax on the difference between the actual depreciation charge on the property, plant and equipment and the equivalent depreciation charge based on the historical cost of the property, plant and equipment.
27. DEFERRED TAX LIABILITY (continued)
FINANCIAL STATEMENTS
NOTES TO THE FINANCIAL STATEMENTS FOR THE YEAR ENdEd 31 dECEMBER 2012
28. PROVISIONS FOR LIABILITIES AND CHARGES
GROUP
At beginning of year 69 587 96 752 790
Additional provisions 294 24 5 323 31
Utilised during the year (7) (7) - (14) (69)
At end of year 356 604 101 1,061 752
Less: current portion (343) (162) - (505) (216)
Non current portion 13 442 101 556 536
COMPANY
At beginning of year 58 531 95 684 660
Additional provisions 265 20 5 290 24
Utilised during the year (7) (7) - (14) -
At end of year 316 544 100 960 684
Less: Current portion (316) (88) - (404) (148)
Non-current portion - 456 100 556 536
Restructuring, Service Long site restoration gratuity and service and litigation holiday pay awards 2012 Total 2011 Total Shs’million Shs’million Shs’million Shs’million Shs’million

2012 ANNUAL REPORT & FINANCIAL STATEMENTS100 101BAMBURI CEMENT LIMITED I PART OF YOU. FROM THE START
Trade payables 4,154 1,474 2,420 1,586 Accrued expenses 1,470 2,226 1,012 1,131 Other payables 557 313 475 253 Payable to related companies - Note 34 (ii) 14 67 14 67
6,195 4,080 3,921 3,037
GROUP COMPANY
2012 2011 2012 2011
Shs’million Shs’million Shs’million Shs’million
FINANCIAL STATEMENTS
NOTES TO THE FINANCIAL STATEMENTS FOR THE YEAR ENdEd 31 dECEMBER 2012
The provision for restructuring, site restoration and litigation relate to future outflows that will be required to settle related liabilities or finalise the ongoing restructuring activities of the Group, including termination benefits.
The group makes full provision for the future cost of rehabilitating its quarry sites and related production facilities on a discounted basis at the time of developing the quarries and installing and using those facilities.
The provision represents the present value of restructuring costs relating to quarry sites, which are expected to be incurred up to 2022. These provisions have been created based on the Group’s internal estimates and assumptions based on the current economic environment, which management believes are a reasonable basis upon which to estimate the future liability. These estimates are reviewed regularly to take into account any material changes to the assumptions.
The actual restructuring costs will depend upon future market prices for the necessary restructuring works required that will reflect market conditions at the relevant time. The timing of the restructuring is likely to depend on when the quarries cease to produce at economically viable rates. This, in turn, will depend upon future material prices, which are inherently uncertain.
The provision for service gratuity, annual leave and long service awards represent entitlements that accrue as a result of services offered by employees.
Terms and conditions of the above financial liabilities:• Trade payables and payables to relate parties are non interest bearing and are normally settled on a 30 – 60 day
terms.• Other payables are non-interest bearing and have an average term of six months.
30. BORROwINGS
a) Term loan In June 2008, Hima Cement Limited, a subsidiary company, signed a syndicated loan facility equivalent to
Shs 1,789 million (Ugx 45 billion) with lead arranger, Stanbic Bank Uganda Limited. During the year, Hima Cement Limited did not withdraw any funds from the facility as the Rwenzori project for which the facility was taken was completed in 2011. Shs. 177 million was drawn in 2011. The loan is secured by a corporate guarantee from Lafarge SA and is payable in 5 equal instalments starting June 2011 and fully matures in June 2015. The facility is structured in two tranches of 50% each. Tranche A is at fixed interest rate equivalent to 5 year Treasury bond plus 70 basis points while Tranche B is at floating interest rate equivalent to 182-day Treasury bill plus 100 basis points.
29. TRADE AND OTHER PAYABLES
At 1 January 1,391 2,953 Received during the year - 177 Paid during the year (477) (1,693) Foreign exchange differences (49) (46)
At 31 December 865 1,391 Less; Due within one year (288) (772)
Due after one year 577 619
GROUP 2012 2011 Shs’million Shs’million
FINANCIAL STATEMENTS
NOTES TO THE FINANCIAL STATEMENTS FOR THE YEAR ENdEd 31 dECEMBER 2012
The movement in term loan is as shown below:
30. BORROwINGS (continued)
b) Effective interest rates
The weighted average interest rates incurred on borrowing facilities during the year were:
c) Borrowing facilities
As at end of the year, the Group had borrowing facilities amounting to a total of Shs 3,105 million (2011 – Shs 3,105 million), out of which the undrawn facilities amounted to Shs 2,240 million (2011 – Shs 1,716 million).
The borrowing facilities are annual facilities that were subject to review at various dates during the year 2012. They consist of overdrafts, letters of credit, guarantees among others.
Local currencies - Loans 22.20% 12.76% - -
GROUP COMPANY
2012 2011 2012 2011
Shs’million Shs’million Shs’million Shs’million
28. PROVISIONS FOR LIABILITIES AND CHARGES (continued)

2012 ANNUAL REPORT & FINANCIAL STATEMENTS102 103BAMBURI CEMENT LIMITED I PART OF YOU. FROM THE START
Bonds issued by the Group’s bankers in favour of Kenya Revenue Authority 662 576 576 576Bonds/Guarantees issued by the Group’s bankers in favour of other parties 228 321 220 220
At end of year 890 897 796 796
GROUP COMPANY
2012 2011 2012 2011
Shs’million Shs’million Shs’million Shs’million
FINANCIAL STATEMENTS
NOTES TO THE FINANCIAL STATEMENTS FOR THE YEAR ENdEd 31 dECEMBER 2012
31. CONTINGENT LIABILITIES
Guarantees
The guarantees and bonds are issued by the Group’s bankers in favour of third parties and the Group has entered into counter-indemnities with the same banks. These guarantees are part of the bank facilities disclosed in note 31 above and are issued in the normal course of business.
Legal matters
The Group is involved in a number of legal proceedings which are yet to be concluded upon. Included in the guarantees to third parties is Shs 86 million (Ugx 2,687 million) relating to a pending court case with Kampala International University. The Directors have evaluated the pending cases and determined that no material liabilities are likely to arise from these cases which arose in the normal course of business.
Tax matters
The Group is regularly subject to an evaluation, by the taxation authorities, of its direct and indirect taxation affairs and in connection with such reviews, tax assessments can be issued by the taxation authorities in respect of the Group’s taxation affairs.
In February 2012, the Kenya Revenue Authority issued a tax assessment of Shs 3.9 billion being principal tax of Shs 2.0 billion, penalties and interest of Shs 1.9 billion. This assessment is in respect of company’s corporate tax, income tax, value added tax and withholding tax affairs for the years 2007 to 2011. The company has formally objected to a principal amount of Shs 2.0 billion of the assessment in accordance to the tax legislation. The basis of the company objection relates to the specific matters of application and interpretation of tax legislation affecting the company and the industry in which it operates.
With the assistance of professional advice, the directors have considered all matters in contention and are confident that the objection will be successful and no material liability will crystallise to the company.
FINANCIAL STATEMENTS
NOTES TO THE FINANCIAL STATEMENTS FOR THE YEAR ENdEd 31 dECEMBER 2012
32. CAPITAL COMMITMENTS
Authorised and contracted
Capital expenditure contracted for at the end of the reporting period but not recognised in the financial statements is as follows:
Commitments for the acquisition of property, plant and equipment 175 178 107 107
GROUP COMPANY
2012 2011 2012 2011
Shs’million Shs’million Shs’million Shs’million
Commitments for the acquisition of property, plant and equipment 339 177 236 107
GROUP COMPANY
2012 2011 2012 2011
Shs’million Shs’million Shs’million Shs’million
Authorised but not contracted Capital expenditure authorised but not contracted for at the reporting period end:
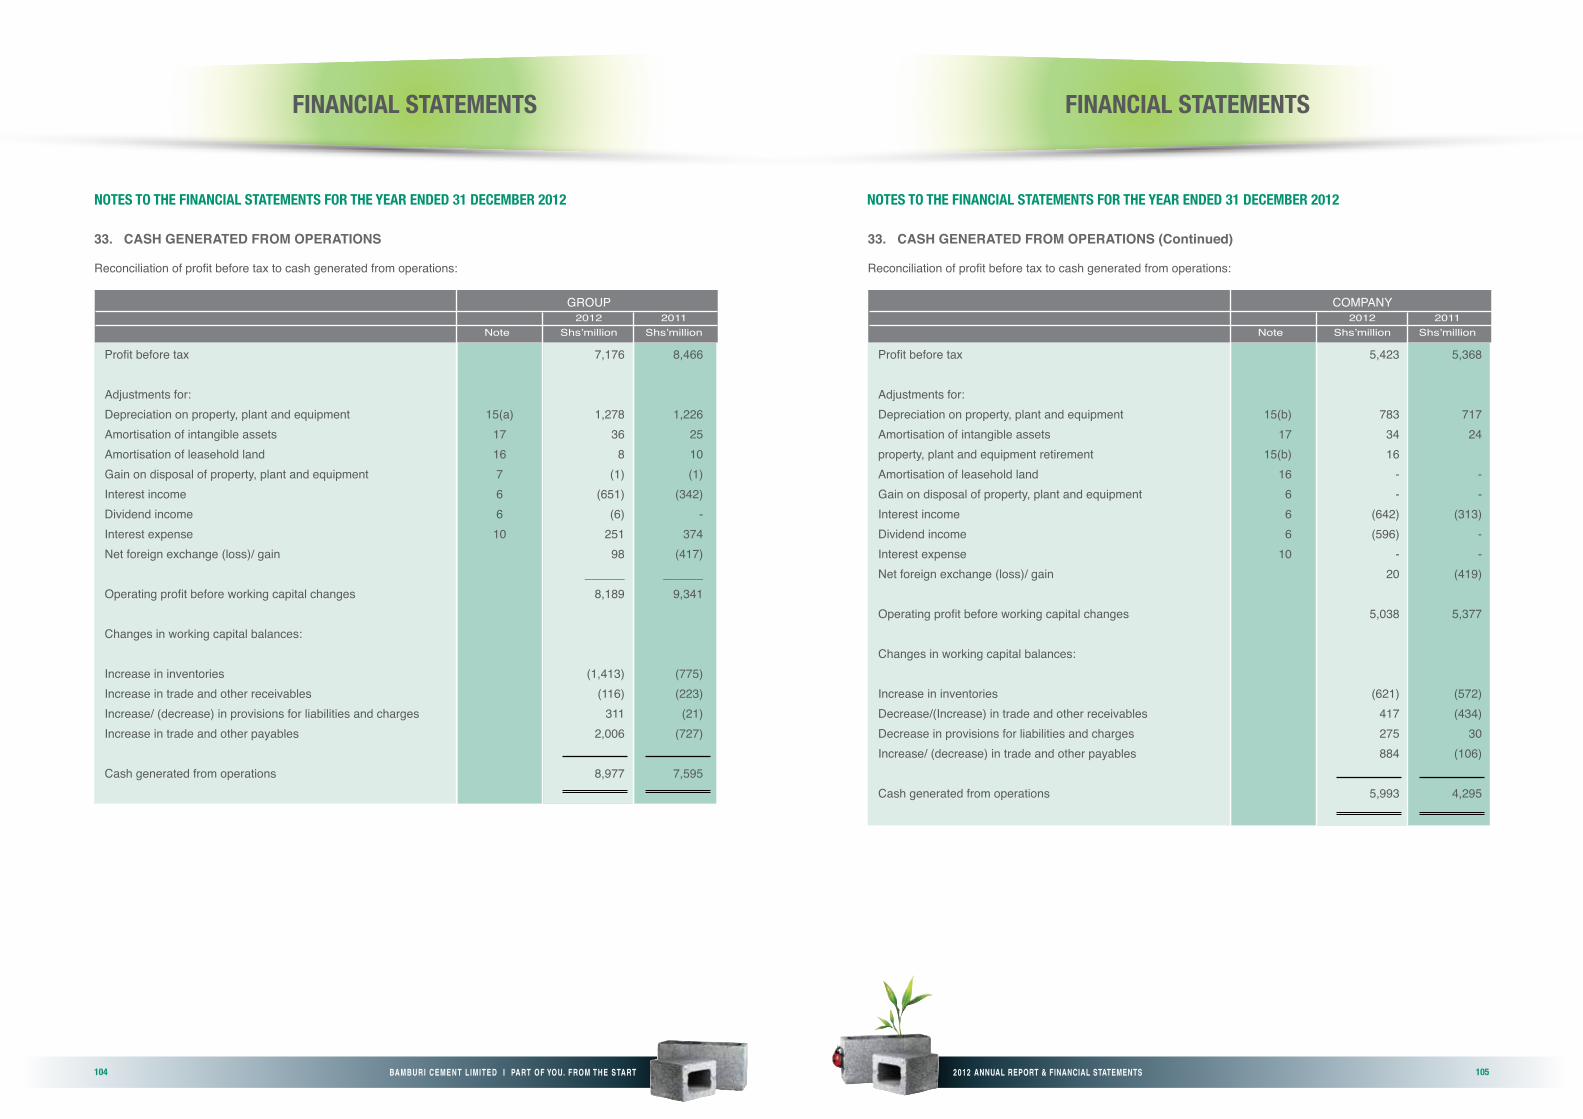
2012 ANNUAL REPORT & FINANCIAL STATEMENTS104 105BAMBURI CEMENT LIMITED I PART OF YOU. FROM THE START
FINANCIAL STATEMENTS
NOTES TO THE FINANCIAL STATEMENTS FOR THE YEAR ENdEd 31 dECEMBER 2012
33. CASH GENERATED FROM OPERATIONS
Reconciliation of profit before tax to cash generated from operations:
Profit before tax 7,176 8,466
Adjustments for: Depreciation on property, plant and equipment 15(a) 1,278 1,226Amortisation of intangible assets 17 36 25Amortisation of leasehold land 16 8 10Gain on disposal of property, plant and equipment 7 (1) (1)Interest income 6 (651) (342)Dividend income 6 (6) -Interest expense 10 251 374Net foreign exchange (loss)/ gain 98 (417) ______ ______Operating profit before working capital changes 8,189 9,341
Changes in working capital balances:
Increase in inventories (1,413) (775)Increase in trade and other receivables (116) (223)Increase/ (decrease) in provisions for liabilities and charges 311 (21)Increase in trade and other payables 2,006 (727)
Cash generated from operations 8,977 7,595
GROUP 2012 2011 Note Shs’million Shs’million
FINANCIAL STATEMENTS
NOTES TO THE FINANCIAL STATEMENTS FOR THE YEAR ENdEd 31 dECEMBER 2012
33. CASH GENERATED FROM OPERATIONS (Continued)
Reconciliation of profit before tax to cash generated from operations:
Profit before tax 5,423 5,368 Adjustments for: Depreciation on property, plant and equipment 15(b) 783 717Amortisation of intangible assets 17 34 24property, plant and equipment retirement 15(b) 16 Amortisation of leasehold land 16 - -Gain on disposal of property, plant and equipment 6 - -Interest income 6 (642) (313)Dividend income 6 (596) -Interest expense 10 - -Net foreign exchange (loss)/ gain 20 (419) Operating profit before working capital changes 5,038 5,377 Changes in working capital balances: Increase in inventories (621) (572)Decrease/(Increase) in trade and other receivables 417 (434)Decrease in provisions for liabilities and charges 275 30Increase/ (decrease) in trade and other payables 884 (106)
Cash generated from operations 5,993 4,295
COMPANY 2012 2011 Note Shs’million Shs’million

2012 ANNUAL REPORT & FINANCIAL STATEMENTS106 107BAMBURI CEMENT LIMITED I PART OF YOU. FROM THE START
Receivables from related parties Lafarge France 9 14 9 14Lafarge South Africa 1 1 1 1Lafarge Technical Centre Europe 1 1 1 1Chilanga Cement Plc Zambia - 16 - 16Circle Cement Limited - 10 - 10Malawi Portland Cement 24 7 24 7West Africa Portland Cement 13 29 13 29Ashaka Cement Co. 0 6 - 6Lafarge Cairo 150 97 150 97 198 181 198 181Receivables from subsidiaries Hima Cement Limited - - 767 1,065Bamburi Special Products Limited - - 382 261Lafarge Ecosystems Limited - - 57 19 - - 1,206 1,345
Total receivables (note 22(a)) 198 181 1,404 1,526
GROUP COMPANY
2012 2011 2012 2011
Shs’million Shs’million Shs’million Shs’million
Sales of goods and services 134 213 Purchases of goods and services 2,712 1,520
GROUP 2012 2011 Shs’million Shs’million
FINANCIAL STATEMENTS
NOTES TO THE FINANCIAL STATEMENTS FOR THE YEAR ENdEd 31 dECEMBER 2012
34. RELATED PARTIES
The ultimate parent of the Group is Lafarge SA, incorporated in France. There are other companies which are related to Bamburi Cement Limited through common shareholdings or common directorships.
(i) Related party transactions
The company receives technical assistance from the majority shareholder, which is paid for under a five year agreement.
The following transactions were carried out with related parties during the year.
(ii) Outstanding balances arising from sale and purchase of goods and services to/from related companies at the year end.
Cementia Holdings - 27 - 27 Lafarge France 13 15 13 15 Lafarge South Africa 1 9 1 9 Lafarge Paris Cedex - 16 - 16
Total payables to related parties (note 29) 14 67 14 67
Short term cash deposits (note 24(a)) 7,130 4,828 7,130 4,828
Cash flow hedges (note 23) - 33 - 15
GROUP COMPANY
2012 2011 2012 2011
Shs’million Shs’million Shs’million Shs’million
FINANCIAL STATEMENTS
NOTES TO THE FINANCIAL STATEMENTS FOR THE YEAR ENdEd 31 dECEMBER 2012
34. RELATED PARTIES (CONTINUED)
The short term deposits represent amounts held in investment accounts with the principal shareholder, Lafarge SA’s, central treasury department on terms similar to those offered by unrelated financial institutions. Additional disclosures for short term deposits with the related party are in Note 24 (d)
Terms and conditions of transactions with related partiesThe sales to and purchases from related parties are made on terms equivalent to those that prevail in arm’s length transactions. Outstanding balances at the year-end are unsecured and interest free and settlement occurs in cash. There have been no guarantees provided or received for any related party receivables or payables. For the year ended 31 December 2012, the Group has not recorded any impairment of receivables relating to amounts owed by related parties (2011: Nil). This assessment is undertaken each financial year through examining the financial position of the related party and the market in which the related party operates.
(iii) Loan to subsidiary
As at the end of the year, the balance due to the company in respect of a loan to its subsidiary, Bamburi Special Products Limited, amounted to Shs 231 million (2011 - Shs 260 million ). The loan was unsecured and the effective interest on the loan was 10% (2011 – 10%). The loan repayment period is 10 years from January 2011. There is no material difference between the fair value and the carrying amount of the loan. The loan comprises:

2012 ANNUAL REPORT & FINANCIAL STATEMENTS108 109BAMBURI CEMENT LIMITED I PART OF YOU. FROM THE START
FINANCIAL STATEMENTS
NOTES TO THE FINANCIAL STATEMENTS FOR THE YEAR ENdEd 31 dECEMBER 2012
(iv) Key management compensationThe remuneration of directors and members of key management during the year was as follows:
Current portion 29 29Non-current portion 202 231 Total 231 260
The movement in Loan to subsidiary is as shown below: At 1 January 260 286Paid during the year (29) (26)
At 31 December 231 260
COMPANY 2012 2011 Shs’million Shs’million
Fees for services as a director Executive 3 3Non-executive 1 1
Total fees 4 4
Other emoluments Salaries and other short-term employment benefits: Executive 112 141Non-executive 2 2
Total other emoluments 114 143Post-employment benefits: Executive 9 9 123 152
Total remuneration 127 156
Guaranteed long-term loans 15 23
GROUP 2012 2011 Shs’million Shs’million
34. RELATED PARTIES (Continued)
FINANCIAL STATEMENTS
NOTES TO THE FINANCIAL STATEMENTS FOR THE YEAR ENdEd 31 dECEMBER 2012
Terms and conditions of the guaranteed long-term loansThese are loans issued to executive directors as part of the employee benefit from the general employee loan schemes and include mortgage, car loan and unsecured loan from Citibank. Any guaranteed loans that exceed Shs 1 million require a security from the director.
35. OpERATING LEASE COMMITMENTS
The company has entered into operating lease agreements for leasing of motor vehicles and commercial premises. Future lease payments under non-cancellable operating leases are as follows:
During the year ended 31 December 2012, Shs 50 million was recognized as an expense in the statement of comprehensive income in respect of the operating leases (2011: Shs 175 million).
36. RETIREMENT BENEFITS SCHEME
The Group operates a defined contribution retirement plans for eligible employees. The assets of the plans are held separately from those of the Group in funds under the control of trustees. The scheme is administered by an independent administration company and is funded by contributions from the Group companies and employees. The Group’s obligations to the staff retirement benefits plans are charged to profit or loss as they fall due or in the case of service gratuity as they accrue to each employee.
The Group also makes contributions to the statutory defined contribution schemes in the two countries where its operations are based. The only obligation of the Group with respect to the retirement benefit plan is to make the specified contributions.
The total expense recognised in profit or loss of Shs 96 million (2011: Shs 86 million) represents contributions payable to these plans by the Group at rates specified in the rules of the plans. The expense has been included within the retirement benefits costs under staff costs in note 11(b).
Lease payments committed under operating leases: Not later than 1 year 120 121Later than 1 year but not later than 5 years 212 213 332 334
GROUP 2012 2011 Shs’million Shs’million
34. RELATED PARTIES (Continued)
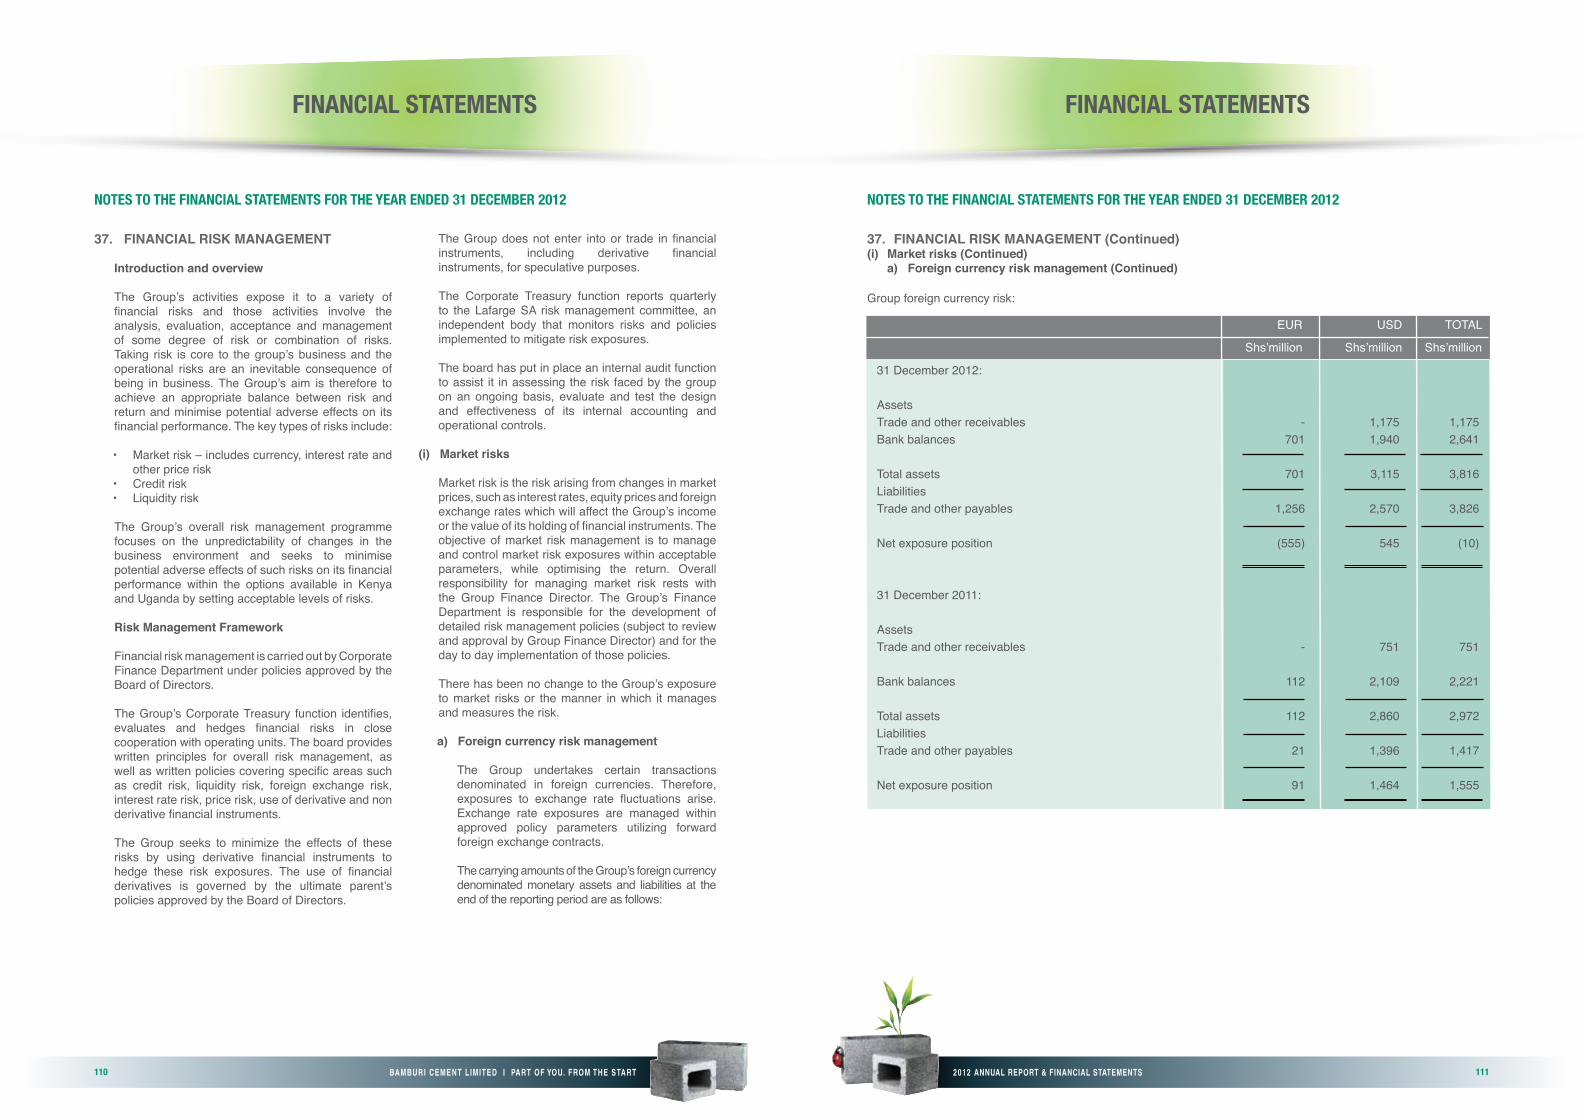
2012 ANNUAL REPORT & FINANCIAL STATEMENTS110 111BAMBURI CEMENT LIMITED I PART OF YOU. FROM THE START
37. FINANCIAL RISK MANAGEMENT (Continued)(i) Market risks (Continued) a) Foreign currency risk management (Continued)
FINANCIAL STATEMENTS
NOTES TO THE FINANCIAL STATEMENTS FOR THE YEAR ENdEd 31 dECEMBER 2012
37. FINANCIAL RISK MANAGEMENT
Introduction and overview
The Group’s activities expose it to a variety of financial risks and those activities involve the analysis, evaluation, acceptance and management of some degree of risk or combination of risks. Taking risk is core to the group’s business and the operational risks are an inevitable consequence of being in business. The Group’s aim is therefore to achieve an appropriate balance between risk and return and minimise potential adverse effects on its financial performance. The key types of risks include:
• Market risk – includes currency, interest rate and other price risk
• Credit risk• Liquidity risk
The Group’s overall risk management programme focuses on the unpredictability of changes in the business environment and seeks to minimise potential adverse effects of such risks on its financial performance within the options available in Kenya and Uganda by setting acceptable levels of risks.
Risk Management Framework
Financial risk management is carried out by Corporate Finance Department under policies approved by the Board of Directors.
The Group’s Corporate Treasury function identifies, evaluates and hedges financial risks in close cooperation with operating units. The board provides written principles for overall risk management, as well as written policies covering specific areas such as credit risk, liquidity risk, foreign exchange risk, interest rate risk, price risk, use of derivative and non derivative financial instruments.
The Group seeks to minimize the effects of these risks by using derivative financial instruments to hedge these risk exposures. The use of financial derivatives is governed by the ultimate parent’s policies approved by the Board of Directors.
The Group does not enter into or trade in financial instruments, including derivative financial instruments, for speculative purposes.
The Corporate Treasury function reports quarterly to the Lafarge SA risk management committee, an independent body that monitors risks and policies implemented to mitigate risk exposures.
The board has put in place an internal audit function to assist it in assessing the risk faced by the group on an ongoing basis, evaluate and test the design and effectiveness of its internal accounting and operational controls.
(i) Market risks
Market risk is the risk arising from changes in market prices, such as interest rates, equity prices and foreign exchange rates which will affect the Group’s income or the value of its holding of financial instruments. The objective of market risk management is to manage and control market risk exposures within acceptable parameters, while optimising the return. Overall responsibility for managing market risk rests with the Group Finance Director. The Group’s Finance Department is responsible for the development of detailed risk management policies (subject to review and approval by Group Finance Director) and for the day to day implementation of those policies.
There has been no change to the Group’s exposure to market risks or the manner in which it manages and measures the risk.
a) Foreign currency risk management
The Group undertakes certain transactions denominated in foreign currencies. Therefore, exposures to exchange rate fluctuations arise. Exchange rate exposures are managed within approved policy parameters utilizing forward foreign exchange contracts.
The carrying amounts of the Group’s foreign currency denominated monetary assets and liabilities at the end of the reporting period are as follows:
FINANCIAL STATEMENTS
NOTES TO THE FINANCIAL STATEMENTS FOR THE YEAR ENdEd 31 dECEMBER 2012
31 December 2012: Assets Trade and other receivables - 1,175 1,175Bank balances 701 1,940 2,641
Total assets 701 3,115 3,816Liabilities Trade and other payables 1,256 2,570 3,826 Net exposure position (555) 545 (10)
31 December 2011: Assets Trade and other receivables - 751 751 Bank balances 112 2,109 2,221
Total assets 112 2,860 2,972Liabilities Trade and other payables 21 1,396 1,417
Net exposure position 91 1,464 1,555
EUR USD TOTAL
Shs’million Shs’million Shs’million
Group foreign currency risk:

2012 ANNUAL REPORT & FINANCIAL STATEMENTS112 113BAMBURI CEMENT LIMITED I PART OF YOU. FROM THE START
FINANCIAL STATEMENTS
NOTES TO THE FINANCIAL STATEMENTS FOR THE YEAR ENdEd 31 dECEMBER 2012
Company foreign currency risk:
31 December 2012: Assets Trade and other receivables - 566 566Bank balances 474 1,490 1,964
Total assets 474 2,056 2,530
Liabilities Trade and other payables 687 1,257 1,944
Total liabilities 687 1,257 1,944
Net exposure position (213) 799 586
31 December 2011: Assets Trade and other receivables - 751 751Bank balances 59 1,740 1,799
Total assets 59 2,491 2,550
Liabilities Trade and other payables 9 332 341
Total liabilities 9 332 341
Net exposure position 50 2,159 2,209
EUR USD TOTAL
Shs’million Shs’million Shs’million
FINANCIAL STATEMENTS
NOTES TO THE FINANCIAL STATEMENTS FOR THE YEAR ENdEd 31 dECEMBER 2012
b) Interest rate risk
The Group is exposed to interest rate risk as entities in the Group borrow funds at both fixed and floating interest rates in the form of long term loans and short term loans (overdrafts). The Group also holds cash deposits with financial institutions. The interest rates on the cash deposits are fixed and agreed upon in advance.
Management closely monitors the interest rate trends to minimise the potential adverse impacts of interest rate changes. Deposits are placed at fixed interest rates and management is therefore able to plan for the resulting income. For the facilities with variable rates, the Group is in regular contact with the lenders in a bid to obtain the best available rates.
During the year, a 5% increase/decrease of the annual interest rate would have resulted in an increase/decrease in pre-tax profit of Shs 78 million (2011 - Shs 93 million).
Foreign currency sensitivity analysis
The following sensitivity analysis shows how profit and equity would change if the Kenya Shilling had depreciated against the other currencies by 5% on the reporting period end with all other variables held constant. The reverse would also occur if the Kenya Shilling appreciated with all other variables held constant. This is mainly attributable to the change in value of foreign exchange receivables, payables and cash.
2012 2011 Shs. million Shs. million
GROUP EUR 28 5USD (27) 73
1 78
COMPANY EUR (11) 3USD 40 108
29 111
37. FINANCIAL RISK MANAGEMENT (Continued)(i) Market risks (Continued)
a) Foreign currency risk management (Continued)
37. FINANCIAL RISK MANAGEMENT (Continued)(i) Market risks (Continued)
a) Foreign currency risk management (Continued)

2012 ANNUAL REPORT & FINANCIAL STATEMENTS114 115BAMBURI CEMENT LIMITED I PART OF YOU. FROM THE START
NOTES TO THE FINANCIAL STATEMENTS FOR THE YEAR ENdEd 31 dECEMBER 2012
c) Price risk
Quoted assets are valued at their market prices. These values are subject to frequent variations and adverse market movements. This risk is mitigated by the fact that equity investments are held for strategic rather than trading purposes. The Group does not actively trade in equity investments.
At 31 December 2012, if the prices at the Nairobi Securities Exchange had appreciated/depreciated by 5% with all other variables held constant would have resulted in an increase/ decrease on other comprehensive income of Shs 23 million (2011 - Shs 32 million) as a result of changes in fair value of available for sale shares.
(ii) Credit risk management
Credit risk refers to the risk that a counter party will default on its contractual obligations resulting in financial loss to the Group. The Group has adopted a policy of only dealing with creditworthy counterparties and obtaining sufficient collateral, where appropriate, as a means of mitigating the risk of financial loss from defaults. The Group’s exposure and the credit rating of its counterparties are continuously monitored and the aggregate value of transactions concluded is spread amongst approved counterparties. Credit exposure is controlled by counterparty limits that are reviewed and approved by the management annually.
The credit risk exposures are classified in three categories:
• Fully performing• Past due• Impaired
Maximum exposure to credit risk before collateral held or other credit enhancements
The carrying amount of financial assets recorded in the financial statements representing the Group’s maximum exposure to credit risk without taking account of the value of any collateral obtained is made up as follows:
Trade receivables consist of a large number of customers, spread across diverse industries and geographical areas. On an ongoing basis, a credit evaluation is performed on the financial condition of accounts receivable. The credit risk on liquid funds is limited because the counterparties are banks with high credit-ratings assigned by international credit-rating agencies.
The Group does not have any significant credit risk exposure to any single counterparty or any Group of counterparties having similar characteristics. The Group defines counterparties as having similar characteristics if they are related entities. Concentration of credit risk did not exceed 5% of gross monetary assets at any time during the year.
Trade receivables and other receivables 1,712 1,465 2,197 2,756 Bank balances 8,769 7,136 7,821 6,286
GROUP COMPANY
2012 2011 2012 2011
Shs’million Shs’million Shs’million Shs’million
37. FINANCIAL RISK MANAGEMENT (Continued)
FINANCIAL STATEMENTS
NOTES TO THE FINANCIAL STATEMENTS FOR THE YEAR ENdEd 31 dECEMBER 2012
Included in the impairment provision is an amount of Shs Nil (2011 – Shs Nil) relating to other receivables.
Fully performing
The Group classifies financial assets under this category for those exposures that are up to date and in line with contractual agreements. These exposures will normally be maintained within approved product programs and with no signs of impairment or distress.
Past due but not impaired
The financial assets that are past due relate to trade receivables overdue by over 30 days. The receivables are not impaired and continue to be paid. The Group is actively following these receivables. No collateral is held with respect to the debt.
Impaired financial assets
Impaired financial assets are financial assets for which the Group determines that it is probable that it will be unable to collect all payments due according to the contractual terms of the agreement(s). No collateral is held with respect to the debt.
Financial Risk Management (continued)(ii) Credit Risk Management (continued)a) Analysis of group credit exposure
37. FINANCIAL RISK MANAGEMENT (Continued)(ii) Credit risk management(Continued)
Fully performing 1,807 - 1,807 2,158 - 2,158
Past due 426 36 390 492 36 456
Trade and other receivables - note 22 (a) 2,233 36 2,197 2,650 36 2,614
Gross Impairment Net Gross Impairment Net 2012 2012 2012 2011 2011 2011 Shs’million Shs’million Shs’million Shs’million Shs’million Shs’million
b) Analysis of company credit risk:
Fully performing 1,479 - 1,479 1,150 - 1,150
Past due 312 79 233 352 37 315
Trade and other receivables - note 22 (a) 1,791 79 1,712 1,502 37 1,465
Gross Impairment Net Gross Impairment Net 2012 2012 2012 2011 2011 2011 Shs’million Shs’million Shs’million Shs’million Shs’million Shs’million
a) Analysis of Group credit exposure:

2012 ANNUAL REPORT & FINANCIAL STATEMENTS116 117BAMBURI CEMENT LIMITED I PART OF YOU. FROM THE START
FINANCIAL STATEMENTS
NOTES TO THE FINANCIAL STATEMENTS FOR THE YEAR ENdEd 31 dECEMBER 2012
31 December 2012:
Trade and other payables (note 29) 4,725 3,007 993 122 603
Term loan 1,174 31 - - 1,143
5,899 3,038 993 122 1,746
31 December 2011:
Trade and other payables (note 29) 1,854 1,032 462 252 108
Term loan 2,087 70 - - 2,017
3,941 1,102 462 252 2,125
120 days 0-30 31-90 91-120 and and Total days days days above Shs’million Shs’million Shs’million Shs’million Shs’million
(iii) Liquidity risk management
This is the risk that the group will encounter difficulties in meeting its financial commitments from its financial liabilities that are settled by delivering cash or another financial asset. Prudent liquidity risk management includes maintaining sufficient cash to meet company obligations.
Ultimate responsibility for liquidity risk management rests with the Board of Directors, which has developed and put in place an appropriate liquidity risk management framework for the management of the Group’s short, medium and long-term funding and liquidity management requirements. The Group manages liquidity risk by maintaining adequate reserves, banking facilities and reserve borrowing facilities, by continuously monitoring forecast and actual cash flows and matching the maturity profiles of financial assets and liabilities.
The following table analyses the Group’s remaining contractual maturity for its non-derivative financial liabilities with agreed repayment periods. The table has been drawn up based on the undiscounted cash flows of financial liabilities based on the earliest date on which the Group can be required to pay. The tables include both interest and principal cash flows and exclude the impact of netting agreements. The contractual maturity is based on the earliest date on which the Group may be required to pay.
Balances due within 12 months equal their carrying balances, as the impact of discounting is not significant.
GROUP – Financial liabilities:
37. FINANCIAL RISK MANAGEMENT (Continued)
31 December 2012:
Trade and other payables (note 29) 2,909 1,334 760 - 815
31 December 2011:
Trade and other payables (note 29) 1,906 973 604 264 65
120 days 0-30 31-90 91-120 and and Total days days days above Shs’million Shs’million Shs’million Shs’million Shs’million
FINANCIAL STATEMENTS
NOTES TO THE FINANCIAL STATEMENTS FOR THE YEAR ENdEd 31 dECEMBER 2012
37. FINANCIAL RISK MANAGEMENT (Continued)(iii) Liquidity risk management (Continued)
COMPANY – Financial liabilities:
(iv) Capital risk management
The Group’s objectives when managing capital are:
• To ensure that entities in the Group will be able to continue as going concerns while maximizing the return to stakeholders through the optimization of the debt and equity balance.
• To maintain a strong capital base to support the current and future development needs of the business.
The capital structure of the Group consists of debt, which includes borrowings, cash and cash equivalents and equity attributable to equity holders of the parent, comprising issued capital, reserves and retained earnings.
The Board of Directors reviews the capital structure on a regular basis. As part of this review, the board considers the cost of capital and the risks associated with each class of capital. Based on the review, the Group analyses and assesses the gearing ratio to determine the level and its optimality.
The Group monitors capital using a gearing ratio. This ratio is calculated as net debt divided by total capital. Net debt is calculated as total borrowings less cash and cash equivalents. Group’s policy is to keep the gearing ratio between 20% and 40%.
There have been no material changes in the Group’s management of capital during the year.

2012 ANNUAL REPORT & FINANCIAL STATEMENTS118 119BAMBURI CEMENT LIMITED I PART OF YOU. FROM THE START
FINANCIAL STATEMENTS
NOTES TO THE FINANCIAL STATEMENTS FOR THE YEAR ENdEd 31 dECEMBER 2012
37. FINANCIAL RISK MANAGEMENT (Continued)(iv) Capital risk management (Continued)
Equity 30,861 24,174 23,868 17,499 Total borrowings-note 30(a) (865) (1,391) - -Less: cash and cash equivalents - note 24(b) 8,769 7,136 7,821 6,286 Net debt position 7,904 5,745 7,871 6,286 Gearing 25% 24% 33% 36%
GROUP COMPANY
2012 2011 2012 2011
Shs’million Shs’million Shs’million Shs’million
(v) Fair value of financial assets and liabilities
The table below shows an analysis of financial instruments at fair value by level of the fair value hierarchy. The financial instruments are grouped into levels 1 to 3 based on the degree to which the fair value is observable.
i) Level 1 fair value measurements are those derived from quoted prices (unadjusted) in active markets for identical assets or liabilities;
ii) Level 2 fair value measurements are those derived from inputs other than quoted prices included within level 1 that are observable for the asset or liability, either directly (i.e. as a price) or indirectly (i.e. derived from prices);and
iii) Level 3 fair value measurements are those derived from valuation techniques that include inputs for the asset or liability that are not based on observable market data (unobservable inputs)
31 December 2012: Available for sale financial assets Investment in quoted shares 19 452 - - 452 Total 452 - - 452
GROUP AND COMPANY Note Level 1 Level 2 Level 3 Total Shs’million Shs’million Shs’million Shs’million
31 December 2011 Available for sale financial assets Investment in quoted shares 19 640 - - 640Cash flow hedge contracts 23 - 33 - 33 640 33 - 673
GROUP AND COMPANY Note Level 1 Level 2 Level 3 Total Shs’million Shs’million Shs’million Shs’million
There were no transfers between levels 1, 2 and 3 in the year.
FINANCIAL STATEMENTS
NOTES TO THE FINANCIAL STATEMENTS FOR THE YEAR ENdEd 31 dECEMBER 2012
38. COUNTRY OF INCORPORATION
The company is incorporated and domiciled in Kenya under the Companies Act. The ultimate parent of the Group is Lafarge SA, incorporated in France. The Group is primarily engaged in the manufacture and sale of cement and cement related products.
39. EVENTS AFTER THE REPORTING DATE
The Board of Directors approved the financial statements on 28 February 2013 and authorised that the financial statements be issued. On this date, the Directors were not aware of any matter or circumstances arising since the end of the financial year, not otherwise dealt with in the financial statements, which would significantly affect the financial position of the Group and results of its operations as laid out in these financial statements.
Subsequent to the approval of the financial statements, the High Court in Kampala conferred the mining rights of Hima Cement Limited, a subsidiary of Bamburi Cement Limited operating in Uganda, to East Africa Gold Sniffing Company Limited.
Hima Cement Limited had a mining lease over limestone deposits in Kasese, western Uganda, on which the expiry date was indicated as 31 December 2012. In February 2012, East Africa Gold Sniffing Company Limited (EAGSCL) gave notice that it had been issued with an exploration license over the area covered by mining lease. Hima Cement Limited filed an application for administrative review by the Ministry of Energy and Mineral Development against the issuance of the exploration license, which was heard and determined on 26 April 2012. The Minister for Energy held that EAGSCL’s application for the exploration licence did not comply with requirements of the mining Act, 2003 and was cancelled. The Minister also held that the expiry date indicated in the Hima Cement Limited’s mining lease was incorrect and that the lease had expired on 31 December 2011. Subsequent to this, the company applied for, and received a new mining lease which was granted on 14 March 2013.
EAGSCL filed an application for judicial review in the High Court on the Minister’s decision on grounds that the Minister erred in hearing an administrative review application filed by Hima Cement Limited, which had no legal right under the law since the Company’s mining
lease had expired and that no company known as Hima Cement Limited existed. Hima Cement Limited applied and was enjoined in this case as an interested party.
On 26 March 2013, the High Court ruled that Hima Cement Limited did not follow the law in changing its name and, as such, no entity known as Hima Cement Limited exists in law and therefore, there was no competent legal person to file an administrative review before the Minister. The decision by the Minister that revoked the EAGSCL’s exploration license was cancelled and the mining rights of Hima Cement Limited conferred to East Africa Gold Sniffing Company Limited.
On the issue of existence of the Company, Hima Cement Limited took over the rights and obligations of Hima Cement (1994) Limited. This was after Hima Cement Limited filed a resolution on the change of name with the Registrar of Companies. Consequently, the Company received the certificate of change on 23rd June 1999. Since the change of name in 1999, Hima Cement Limited has been fulfilling its obligations including filling returns and paying taxes.
The Attorney General filed a notice of appeal and an application for interim stay of execution in the Court of Appeal of Uganda was granted on 12 April 2013. This was issued prior to granting a permanent stay of execution, expected to be granted in June 2013. The stay of execution allows Hima Cement Limited to continue with it operations, until the Court of Appeal makes a judgement.
According to the Board of Directors’ evaluation of the case and the legal advice received from the company’s lawyers, the directors opine that the appeal has a strong basis with a high likelihood of success.
40. CURRENCY
The individual financial statements of each Group entity are presented in the currency of the primary economic environment in which the entity operates (its functional currency). For the purpose of the consolidated financial statements, the results and financial position of each entity are presented in millions of Kenya Shillings (Shs’ Million), which is the functional currency of the parent company, and the presentation currency for the consolidated financial statements.
The constitution of capital managed by the Group is as shown below:

120 BAMBURI CEMENT LIMITED I PART OF YOU. FROM THE START
NOTICE OF ANNUAL GENERAL MEETING
NOTICEISHEREBYGIVEN that the 62nd Annual General Meeting of the Shareholders of Bamburi Cement Limited will be held in Mombasa at the Nyali International Beach Hotel on Thursday 6 June 2013 at 2.00 pm. for the following purposes:
1. To table the proxies and to note the presence of a quorum.
2. To read the notice convening the meeting.
3. To receive the Chairman’s statement, the Report of the Directors and the Audited Accounts for the year ended 31 December 2012.
4. To declare dividends:
a) To ratify the payment of the interim dividend of Shs. 2.00/= per ordinary share paid on 12 October 2012;
b) To declare a final dividend payment of Shs.8.50/= per ordinary share for the year ended 31 December 2012.
5. To approve Directors’ fees for 2012 and increase Directors’ fees in 2013.
6. To re-elect directors:
a) In accordance with Article 96 of the Company’s Articles of Association D Brugier retires by rotation and being eligible, offers himself for re-election;
b) In accordance with Article 96 of the Company’s Articles of Association S M’Mbijjewe retires by rotation and being eligible, offers herself for re-election;
c) In accordance with Article 101 of the Company’s Articles of Association, C Langreney, who was appointed a director on 7 June 2012, retires from office and, being eligible, offers herself for re-election.
d) In accordance with Article 101 of the Company’s Articles of Association, T Farrell, who was appointed a director on 7 June 2012, retires from office and, being eligible, offers himself for re-election.
e) In accordance with Article 101 of the Company’s Articles of Association, J Simba, who was appointed a director on 29 November 2012, retires from office and, being eligible, offers himself for re-election
7. To note that Ernst & Young continue in office as Auditors in accordance with Section 159 (2) of the Companies Act and to authorize the Directors to fix their remuneration for 2013.
8. To transact any other business of the Company of which due notice has been received.
By order of the Board
B KanyagiaSecretary
26 April 2013
A member entitled to attend and vote at the above meeting is entitled to appoint a proxy, who need not be a member of the Company, to attend and vote in his stead. Proxy forms must be lodged at the registered office of the Company, P.O. Box 10921, 00100 Nairobi not less than 48 hours before the time of the meeting. A proxy form is provided with this report.
Proxy Form: The SecretaryBamburi Cement LimitedCorporate OfficesKenya Re Tower, 6th FloorUpper Hill, Off Ragati RoadP O Box 10921, 00100NAIROBI, KENYA
I/WE
of
a member of BAMBURI CEMENT LIMITED hereby appoint
of
or in his/her place THE CHAIRMAN OF THE MEETING as my/our proxy and/or representative to vote at his/her discretion for me/us and on my/our behalf at the Annual General Meeting to be held on Thursday 6 June 2013 and at every adjournment thereof.
AS WITNESS my/our hand(s) this day of 2013
(Usual Signature)
Proxy forms must reach the registered office of the Company by 2.00 pm Tuesday 4 June 2013.

2012 ANNUAL REPORT & FINANCIAL STATEMENTS122 123BAMBURI CEMENT LIMITED I PART OF YOU. FROM THE START
Proxy Form: for the year ended 31 December 2012
Staple here3 Staple here3
Cut
her
e1
Fold here3
Fold here2
Affix stamp
The SecretaryBamburi Cement Limited. Corporate Offices6th floor, Kenya-Re Towers, Upper Hill, off Ragati RoadP O Box 10921, 00100 NAIROBI, KENYA

124 BAMBURI CEMENT LIMITED I PART OF YOU. FROM THE START
2012 ANNUAL REPORTAND FINANCIAL STATEMENTS
Bamburi Cement Limited Corporate Office, Nairobi6th Floor, Kenya-Re Towers,Mara Ragati Road, Upper Hill
P.O. Box 10921 - 00100, Nairobi, KenyaTel: (+254 - 20) 289 3000/2710478
Fax: (+254 - 20) 2710581
www.lafarge.co.ke