2012 annual report · mercury computer systems is a best-of-breed provider of commercially ... and...
TRANSCRIPT

2012 ANNUAL REPORT

This annual report contains certain forward-looking statements, as that term is defi ned in the Private Securities Litigation Reform Act of 1995, including those relating to the Company’s overall business and markets. You can identify these statements by the use of the words “may,” “will,” “would,” “should,” “could,” “plan,” “expect,” “anticipate,” “continue,” “estimate,” “project,” “intend,” “likely,” “forecast,“ “probable” and similar expressions. These forward-looking statements involve risks and uncertainties that could cause actual results to differ materially from those projected or anticipated. Such risks and uncertainties include, but are not limited to, continued funding of defense programs and the timing of such funding, including the potential for a continuing resolution for the defense budget, the potential for defense budget sequestration, and the budget uncertainty related to the Presidential election, general economic and business conditions, including unforeseen weakness in the Company’s markets, effects of continued geopolitical unrest and regional confl icts, competition, changes in technology and methods of marketing, delays in completing engineering and manufacturing programs, changes in customer order patterns, changes in product mix, continued success in technological advances and delivering technological innovations, changes in the U.S. Government’s interpretation of federal procurement rules and regulations, market acceptance of the Company’s products, shortages in components, production delays due to performance quality issues with outsourced components, inability to fully realize the expected benefi ts from acquisitions and divestitures or delays in realizing such benefi ts, challenges in integrating acquired businesses and achieving anticipated synergies, changes to export regulations, increases in tax rates, changes to generally accepted accounting principles, diffi culties in retaining key employees and customers, unanticipated costs under fi xed-price service and system integration engagements, and various other factors beyond our control. These risks and uncertainties also include such additional risk factors as are discussed in the Company’s fi lings with the U.S. Securities and Exchange Commission, including its Annual Report on Form 10-K for the fi scal year ended June 30, 2012, accompanying this report. The Company cautions readers not to place undue reliance upon any such forward-looking statements, which speak only as of the date made. The Company undertakes no obligation to update any forward-looking statement to refl ect events or circumstances after the date on which such statement is made.
Mercury Computer Systems is a best-of-breed provider of commercially developed, open sensor and Big Data processing systems, software and services for critical commercial, defense and intelligence applications.
www.mc.com NASDAQ:MRCY
Where Challenges Drive Innovation

To Our Shareholders:
Fiscal 2012 was another strong year for Mercury in an increasingly challenging defense industryenvironment. Solid growth in our defense business more than offset the decline in our commercial business.Total bookings and revenue were up 14 percent and 7 percent, respectively, from fiscal 2011.
Including KOR Electronics (KOR) and Paragon Dynamics (PDI), which we acquired during the secondquarter of fiscal 2012, we delivered record total defense revenues of $230m – a growth of 27 percent year-over-year. On an organic basis, defense revenue grew 16 percent. Our total defense bookings and backlog increased24 percent and 25 percent, respectively. GAAP operating income increased 21 percent, and adjusted EBITDA –our key non-GAAP profitability measure – was up 20 percent, exceeding the top end of our fiscal 2012 targetbusiness model.
Fiscal 2012 was also an excellent year for our Mercury Federal Systems (MFS) business, as revenue andbookings grew 150 percent and 315 percent, respectively. This growth was primarily driven by demand for theimage processing capabilities we provide for the U.S. military’s Gorgon Stare surveillance program, as well asthe addition of PDI. Organically, MFS revenue and bookings were up 82 percent and 201 percent, respectively.As we anticipated, MFS went from an operating loss in fiscal 2011 to a significant operating profit forfiscal 2012.
Fiscal 2012 marked the completion of the first phase of our multi-year M&A strategy. Acquiring KOR andPDI enabled us to build out our capabilities along the sensor processing chain, and helped establish a presence forMercury in the government’s intelligence community for the first time. In the fourth quarter of fiscal 2012, weannounced the signing of a definitive agreement to acquire Micronetics, a publicly traded designer andmanufacturer of high performance microwave and RF components and subsystems for the defense andcommercial aerospace markets.
Similar to the KOR/PDI transaction and the acquisition of LNX that we completed in fiscal 2011, acquiringMicronetics should move us closer to building out a scalable RF and microwave business, complementing ourlongstanding capabilities in signal processing. I am pleased to report that we successfully closed the Microneticstransaction in early August, marking a great start to fiscal 2013.
Through the acquisitions of LNX, KOR, PDI and now Micronetics, we believe that we are evolvingMercury into a unique asset in the non-prime, defense electronics industry. We are the only commercial itemdefense electronics company with end-to-end capabilities along the entire sensor processing chain. With morethan two quarters of integration behind us, KOR and PDI are performing well and shaping up to be superb assetsthat are fully aligned with our strategy, as we expected.
Fiscal 2012 was also another solid year for Mercury in terms of design wins, which totaled 50 – 47 of themin defense with a five-year probable value currently estimated at approximately $293 million. As in recent years,the majority of these wins focused on radar, electronic warfare (EW) and electro-optical/infrared (EO/IR). Theyincluded a design with Raytheon for the U.S. Army Patriot; a next-generation radar processor for the F-16 fighterwith Northrop Grumman; and a win that could designate Mercury as the next-generation standard for radarprocessing for a division of yet another major prime.
Mercury’s success in winning new designs is a testament, we believe, to three factors. First among them isthe successful product portfolio refresh we undertook several years ago, which is currently nearing completion.We believe that we now have the industry’s leading Intel and GPU product line – one with significant advantageswith respect to processing density and embedded security. The second factor is our services-led business model,which allows us to leverage our systems engineering and technical expertise across our portfolio. Thirdly, wehave successfully positioned ourselves as a systems-oriented company, building on our improved portfolio, deepengineering skills and growing services capabilities. Together, these characteristics are proving to be majorcompetitive differentiators for us, as the primes outsource more of their sensor processing subsystem needs tobest-of-breed commercial item companies such as Mercury.

Looking forward, we believe that fiscal 2013 will be another challenging year for the defense industry andfor Mercury. The potential for major defense budget cuts and disruptions later in the year appears to be causing apronounced slowdown in the timing of funding and in program funding levels as political wrangling continues inWashington. We responded to these industry challenges in fiscal 2012 by tightly constraining operating expensesas well as completing a sizeable restructuring action in the fourth quarter that is expected to result inapproximately $5 million of annualized savings.
With all of that said, our plan for fiscal 2013 is to continue focusing on our strategy of being a best-of-breedprovider of commercially developed open sensor and big data processing systems, software and services forcritical commercial, defense and intelligence applications. We will continue to deliver rapid time-to-value andworld-class service and support to our commercial and prime contractor customers. Finally, we will remainfocused on executing well – maximizing our performance and results wherever we can, and remaining agile inadapting to challenges that are outside of our control.
At the same time, we continue to be involved in discussions with numerous potential M&A candidates that,like LNX, KOR, PDI and Micronetics, represent possible opportunities along the sensor processing chain. Theseare companies that fit our previously stated acquisition parameters: proven technology and capabilities, strongmanagement, and participation on the right programs and platforms. On balance, however, fiscal 2013 will likelybe a year in which we will focus primarily on integrating Micronetics – our most recent acquisition.
We have also been talking with major banks to replace our existing revolving credit line with a largerfacility. We believe this will provide us with financial flexibility and support our future M&A activities, if andwhen they occur. It is not our intent at this time, however, to burden Mercury’s balance sheet by adding unduefinancial risk on top of the defense industry macro risks that we are currently experiencing and anticipate facingas fiscal 2013 unfolds.
Over the longer term, we are confident in Mercury’s prospects and in our ability to continue to buildintrinsic value into our business. Mercury’s presence in ISR, EW and missile defense places us in the sweet spotof the defense market. We have built or acquired capabilities that are aligned with the Defense Department’s newroles and missions for the armed forces. Our services-led business model is aligned to the outsourcing needs ofthe primes. And we have a contemporary, differentiated, industry-leading product portfolio.
As a result, we believe that Mercury is positioned on the right programs – some of which are expected totransition to low rate initial production. We are winning a large number of high-value new designs. And at thesame time, we are successfully executing on our M&A strategy to build Mercury’s capabilities along the sensorprocessing chain. These factors lead us to believe that Mercury will successfully navigate this challenging periodin the defense industry and ultimately emerge from it with the potential for accelerated growth and improvedprofitability.
On behalf of the entire Mercury team, I extend my appreciation to you, our shareholders, for the confidenceyou placed in us in fiscal 2012. We are committed to continuing to reward your confidence in Mercury in fiscal2013 and in future years.
Sincerely,
Mark AslettPresident and Chief Executive Officer
August 31, 2012
2

UNITED STATESSECURITIES AND EXCHANGE COMMISSION
WASHINGTON, D.C. 20549
FORM 10-KÈ ANNUAL REPORT PURSUANT TO SECTION 13 OR 15(d) OF THE SECURITIES EXCHANGE ACT OF
1934 FOR THE FISCAL YEAR ENDED JUNE 30, 2012OR
‘ TRANSITION REPORT PURSUANT TO SECTION 13 OR 15(d) OF THE SECURITIES EXCHANGE ACTOF 1934 FOR THE TRANSITION PERIOD FROM TO .
COMMISSION FILE NUMBER 0-23599
MERCURY COMPUTER SYSTEMS, INC.(Exact name of registrant as specified in its charter)
MASSACHUSETTS 04-2741391(State or other jurisdiction ofincorporation or organization)
(I.R.S. EmployerIdentification No.)
201 RIVERNECK ROADCHELMSFORD, MA 01824
(Address of principal executive offices) (Zip Code)
978-256-1300(Registrant’s telephone number, including area code)
SECURITIES REGISTERED PURSUANT TO SECTION 12(b) OF THESECURITIES EXCHANGE ACT OF 1934:
Title of Each Class Name of Each Exchange on Which Registered
Common Stock, Par Value $.01 Per SharePreferred Stock Purchase Rights
NASDAQ Global Select Market
SECURITIES REGISTERED PURSUANT TO SECTION 12(g) OF THESECURITIES EXCHANGE ACT OF 1934: NONE
Indicate by check mark if the registrant is a well-known seasoned issuer, as defined in Rule 405 of the SecuritiesAct. Yes ‘ No È
Indicate by check mark if the registrant is not required to file reports pursuant to Section 13 or Section 15(d) of theAct. Yes ‘ No È
Indicate by check mark whether the registrant (1) has filed all reports required to be filed by Section 13 or 15(d) of the SecuritiesExchange Act of 1934 during the preceding 12 months (or for such shorter period that the registrant was required to file such reports), and(2) has been subject to such filing requirements for the past 90 days. Yes È No ‘
Indicate by check mark whether the registrant has submitted electronically and posted on its corporate Website, if any, everyInteractive Data File required to be submitted and posted pursuant to Rule 405 of Regulation S-T (§ 229.405 of this chapter) during thepreceding 12 months (or for such shorter period that the registrant was required to submit and post such files). Yes È No ‘
Indicate by check mark if disclosure of delinquent filers pursuant to Item 405 of Regulation S-K (§ 229.405 of this chapter) is notcontained herein, and will not be contained, to the best of registrant’s knowledge, in definitive proxy or information statementsincorporated by reference in Part III of this Form 10-K or any amendment to this Form 10-K. È
Indicate by check mark whether the registrant is a large accelerated filer, an accelerated filer, a non-accelerated filer, or a smallerreporting company. See the definitions of “large accelerated filer,” “accelerated filer” and “smaller reporting company” in Rule 12b-2 ofthe Exchange Act.
Large accelerated filer ‘ Accelerated filer È Non-accelerated filer ‘ Smaller reporting company ‘Indicate by check mark whether the registrant is a shell company (as defined by Rule 12b-2 of the Exchange Act). Yes ‘ No ÈThe aggregate market value of the Common Stock held by non-affiliates of the registrant was approximately $392.6 million based
upon the closing price of the Common Stock as reported on the Nasdaq Global Select Market on December 30, 2011, the last business dayof the registrant’s most recently completed second fiscal quarter.
Shares of Common Stock outstanding as of July 31, 2012: 31,018,894 shares
DOCUMENTS INCORPORATED BY REFERENCEPortions of the registrant’s definitive Proxy Statement for its Annual Meeting of Shareholders to be held on October 17, 2012 (the
“Proxy Statement”) are incorporated by reference into Part III of this report.Exhibit Index on Page 95

MERCURY COMPUTER SYSTEMS, INC.
INDEX
PAGENUMBER
PART IItem 1. Business . . . . . . . . . . . . . . . . . . . . . . . . . . . . . . . . . . . . . . . . . . . . . . . . . . . . . . . . . . . . . . . . . 3Item 1A. Risk Factors . . . . . . . . . . . . . . . . . . . . . . . . . . . . . . . . . . . . . . . . . . . . . . . . . . . . . . . . . . . . . . 15Item 1B. Unresolved Staff Comments . . . . . . . . . . . . . . . . . . . . . . . . . . . . . . . . . . . . . . . . . . . . . . . . . 30Item 2. Properties . . . . . . . . . . . . . . . . . . . . . . . . . . . . . . . . . . . . . . . . . . . . . . . . . . . . . . . . . . . . . . . . 30Item 3. Legal Proceedings . . . . . . . . . . . . . . . . . . . . . . . . . . . . . . . . . . . . . . . . . . . . . . . . . . . . . . . . . 31Item 4. Removed and Reserved . . . . . . . . . . . . . . . . . . . . . . . . . . . . . . . . . . . . . . . . . . . . . . . . . . . . . 31Item 4.1. Executive Officers of the Registrant . . . . . . . . . . . . . . . . . . . . . . . . . . . . . . . . . . . . . . . . . . . 31
PART IIItem 5. Market for Registrant’s Common Equity, Related Stockholder Matters and Issuer
Purchases of Equity Securities . . . . . . . . . . . . . . . . . . . . . . . . . . . . . . . . . . . . . . . . . . . . . . 33Item 6. Selected Financial Data . . . . . . . . . . . . . . . . . . . . . . . . . . . . . . . . . . . . . . . . . . . . . . . . . . . . . 33Item 7. Management’s Discussion and Analysis of Financial Condition and Results of
Operations . . . . . . . . . . . . . . . . . . . . . . . . . . . . . . . . . . . . . . . . . . . . . . . . . . . . . . . . . . . . . 34Item 7A. Quantitative and Qualitative Disclosures about Market Risk . . . . . . . . . . . . . . . . . . . . . . . . 52Item 8. Financial Statements and Supplementary Data . . . . . . . . . . . . . . . . . . . . . . . . . . . . . . . . . . 56Item 9. Changes in and Disagreements with Accountants on Accounting and Financial
Disclosure . . . . . . . . . . . . . . . . . . . . . . . . . . . . . . . . . . . . . . . . . . . . . . . . . . . . . . . . . . . . . 89Item 9A. Controls and Procedures . . . . . . . . . . . . . . . . . . . . . . . . . . . . . . . . . . . . . . . . . . . . . . . . . . . . 89Item 9B. Other Information . . . . . . . . . . . . . . . . . . . . . . . . . . . . . . . . . . . . . . . . . . . . . . . . . . . . . . . . . 90
PART IIIItem 10. Directors, Executive Officers and Corporate Governance . . . . . . . . . . . . . . . . . . . . . . . . . . 91Item 11. Executive Compensation . . . . . . . . . . . . . . . . . . . . . . . . . . . . . . . . . . . . . . . . . . . . . . . . . . . 91Item 12. Security Ownership of Certain Beneficial Owners and Management and Related
Stockholder Matters . . . . . . . . . . . . . . . . . . . . . . . . . . . . . . . . . . . . . . . . . . . . . . . . . . . . . 91Item 13. Certain Relationships and Related Transactions, and Director Independence . . . . . . . . . . . 91Item 14. Principal Accounting Fees and Services . . . . . . . . . . . . . . . . . . . . . . . . . . . . . . . . . . . . . . . . 91
PART IVItem 15. Exhibits and Financial Statement Schedules . . . . . . . . . . . . . . . . . . . . . . . . . . . . . . . . . . . . 92
Signatures . . . . . . . . . . . . . . . . . . . . . . . . . . . . . . . . . . . . . . . . . . . . . . . . . . . . . . . . . . . . . . . 94Exhibit Index . . . . . . . . . . . . . . . . . . . . . . . . . . . . . . . . . . . . . . . . . . . . . . . . . . . . . . . . . . . . . 95
2

PART I
This Annual Report on Form 10-K contains forward-looking statements within the meaning ofSection 27A of the Securities Act of 1933, as amended, and Section 21E of the Securities Exchange Act of1934, as amended. Actual results could differ materially from those set forth in the forward-lookingstatements. Certain factors that might cause such a difference are discussed in this annual report onForm 10-K, including in the section entitled “Risk Factors.”
When used in this report, the terms “Mercury,” “we,” “our,” “us,” and “the Company” refer to MercuryComputer Systems, Inc. and its consolidated subsidiaries, except where the context otherwise requires or asotherwise indicated. The term “fiscal” with respect to a year refers to the period from July 1 to June 30. Forexample, fiscal 2012 refers to the period from July 1, 2011 to June 30, 2012.
ITEM 1. BUSINESS
Our Company
We design, manufacture and market commercially-developed, high-performance embedded, real-timedigital signal and image processing sub-systems and software for specialized defense and commercial markets.Our solutions play a critical role in a wide range of applications, processing and transforming sensor data toinformation for storage, analysis and interpretation. Our goal is to grow and build on our position as a criticalcomponent of the defense and intelligence industrial base and be the leading provider of open and affordablesensor processing subsystems for intelligence, surveillance and reconnaissance (“ISR”), electronic warfare(“EW”), and missile defense applications. In military reconnaissance and surveillance platforms, our sub-systemsreceive, process, and store real-time radar, video, sonar and signals intelligence data. We provide radio frequency(“RF”) and microwave products for enhanced signal acquisition and communications in military and commercialapplications. Additionally, Mercury Federal Systems, our wholly owned subsidiary, focuses on direct andindirect contracts supporting the defense, intelligence, and homeland security agencies. We have growingcapabilities in the area of “Big Data” processing, analytics and analysis in support of both the U.S. Department ofDefense (“DoD”) and to the intelligence community as they enhance their ability to acquire, process and exploitlarge amounts of data for both real-time analytics and “forensic” analysis.
Our products and solutions address mission-critical requirements within the defense industry for C4ISR(command, control, communications, computers, intelligence, surveillance and reconnaissance) and electronicwarfare, systems and services, and target several markets including maritime defense, airborne reconnaissance,ballistic missile defense, ground mobile and force protection systems and tactical communications and networksystems. Our products or solutions have been deployed in more than 300 different programs with over25 different prime defense contractors. We deliver commercially developed technology and solutions that arebased on open system architectures and widely adopted industry standards, and support all of this with servicesand support capabilities.
Our revenue, income from continuing operations and adjusted EBITDA for fiscal 2012 were $244.9 million,$22.6 million and $48.9 million, respectively. Our revenue, income from continuing operations and adjustedEBITDA for fiscal 2011 were $228.7 million, $18.5 million and $40.9 million, respectively. Our revenue,income from continuing operations and adjusted EBITDA for fiscal 2010 were $199.8 million, $28.1 million and$29.9 million, respectively. See the Non-GAAP Financial Measures section of this annual report for areconciliation of our adjusted EBITDA to income from continuing operations.
Our operations are presently organized in the following two business segments:
Advanced Computing Solutions, or ACS. This business segment is focused on specialized, high-performanceembedded, real-time digital signal and image processing solutions that encompass signal acquisition, includingmicrowave front-end, digitization, digital signal processing, exploitation processing, high capacity digital storage
3

and communications, targeted to key market segments, including defense, communications and other commercialapplications. ACS’s open system architecture solutions span the full range of embedded technologies from boardlevel products to fully integrated sub-systems. Our products utilize leading-edge processor and other technologiesarchitected to address highly data-intensive applications that include signal, sensor and image processing withinenvironmentally challenging and size, weight and power constrained military and commercial applications. Inaddition, ACS has a portfolio of RF and microwave sub-assemblies to address needs in EW, signal intelligence(“SIGINT”), electronic intelligence (“ELINT”), and high bandwidth communications subsystems.
These products are highly optimized for size, weight and power, as well as for the performance andruggedization requirements of our customers. Customized design and sub-systems integration services extend ourcapabilities to tailor solutions to meet the specialized requirements of our customers. We continue to innovateour technologies around challenging requirements and have technologies available today and planned for thefuture to address them as they evolve and become increasingly demanding.
With the addition of KOR Electronics (“KOR”) in December 2011, we added a focus on the exploitation ofRF signals. Leveraging our analog-to-digital and digital-to-analog technologies and expertise, KOR deliversinnovative high end solutions and services to the defense communities:
• DRFM (Digital Radio Frequency Memory) products which offer state of the art performance at lowcost, for EW applications; and
• radar and EW environment test and simulator products that are DRFM based and use modular andscalable building blocks including commercial-off-the-shelf hardware.
In fiscal 2012, ACS accounted for 88% of our total net revenues.
Mercury Federal Systems, or MFS. This business segment is focused on services and support work with theDoD and federal intelligence and homeland security agencies, including designing, engineering, and deployingnew ISR capabilities to address present and emerging threats to U.S. forces. With the addition of ParagonDynamics, Inc. (“PDI”), our MFS segment also provides sophisticated analysis and exploitation, multi-sensordata fusion and enrichment, and data processing services for the U.S. intelligence community. MFS is part of ourlong-term strategy to expand our software and services presence and pursue growth within the intelligencecommunity. MFS offers a wide range of engineering architecture and design services that enable clients todeploy leading edge computing capabilities for ISR applications on an accelerated time cycle. This businesssegment enables us to combine classified intellectual property with the commercially developed application-ready sub-systems being developed by ACS, providing customers with platform-ready, affordableISR sub-systems. In fiscal 2012, MFS accounted for 12% of our total net revenues, which include six months ofPDI revenues of $7.9 million.
Recent Developments
Subsequent to the end of fiscal 2012, on August 8, 2012, we acquired Micronetics, Inc. Based in Hudson,New Hampshire, Micronetics is a leading designer and manufacturer of microwave and RF subsystems andcomponents for defense and commercial customers. Adding Micronetics is the next logical next step in ourjourney to provide end-to-end sensor processing capabilities to our customers. Specifically, Micronetics furtherexpands our technology and subsystems integration capabilities for the acquire, digitize and disseminate stages ofthe sensor processing chain. From a product perspective, Micronetics brings us a portfolio of high-valuecomponents and subsystems. At the same time, Micronetics’ engineering and manufacturing capabilities providethe RF side of our business with the scalability we need not only to continue to deliver on some of our ownhigher volume programs, but to support growth in the business as we expand our customer base and programaccess.
During the fourth quarter of fiscal 2012, we announced a restructuring plan (“2012 Plan”) affecting both theACS and MFS business segments. The 2012 Plan primarily consisted of involuntary separation costs related to
4

the reduction in force which eliminated 41 positions largely in the engineering and manufacturing functions; andfacility costs related to outsourcing of certain manufacturing activities at our Huntsville, Alabama site. The 2012Plan for which expense of $2.8 million was recorded in fiscal 2012 was implemented to cope with the near-termuncertainties in the defense industry and improve our overall business scalability. Future restructuring expensesof approximately $0.7 million associated with the 2012 Plan are expected in fiscal 2013 as we start transitioningthe manufacturing activities formerly conducted at the Huntsville, Alabama facility to our contract manufacturingpartner. We expect to realize approximately $5.3 million in annual savings from these activities.
On December 30, 2011, we acquired both KOR and its wholly-owned subsidiary, PDI. Based in Cypress,California, KOR designs and develops DRFM units for a variety of modern EW applications, as well as radarenvironment simulation and test systems for defense applications. Based in Aurora, Colorado, PDI providessophisticated analytic exploitation services and customized multi-intelligence data fusion solutions for theU.S. intelligence community. We are working to ensure that capabilities of KOR and PDI are integrated into aframework whereby we can deliver agile, affordable solutions to the markets we collectively serve. We areworking to rapidly integrate these new capabilities into our overall organization.
Our History
Since 1981, we have operated as a provider of advanced embedded computing products primarily for endmarkets in the defense industry. Over time, we expanded our business to focus on a number of commercial endmarkets, including the biotechnology, embedded systems and professional services, visual imaging software andlife sciences markets. While this strategy was designed to expand our target market, in the mid-2000’s many ofthese new businesses required large investments, which significantly reduced our profitability, and we foundourselves spread across several disparate, unprofitable end-user segments.
In November 2007, we embarked on a strategy to refocus the business and return to growth and profitability.Since then, we have successfully sold or shut down five non-core business units, returned the Company toprofitability and growth and transformed the Company into a best-of-breed provider of affordable, openarchitecture, commercially-developed, application-ready and multi-intelligence sub-systems for our primarydefense embedded computing end markets. Our refocused business combined with improved operations has ledto improved overall financial performance, including:
• increasing defense sales from $131.9 million in fiscal 2008 to $229.9 million in fiscal 2012representing approximately 74% growth, and increasing defense sales as percentage of revenue from69% in fiscal 2008 to 94% in fiscal 2012;
• increasing income from continuing operations from a loss of $4.4 million in fiscal 2008 to income of$22.6 million in fiscal 2012 and increasing income from continuing operations as a percentage of netrevenues from negative 2% for fiscal 2008 to 9% for fiscal 2012;
• increasing adjusted EBITDA from $22.5 million in fiscal 2008 to adjusted EBITDA of $48.9 million infiscal 2012;
• improving our cash flow from operations of $13.7 million in fiscal 2008 to $31.9 million in fiscal2012; and
• improving our balance sheet by reducing total indebtedness from $125.0 million at June 30, 2008 tozero at June 30, 2010, 2011 and 2012.
During this period of improving financial performance, we continued to have success on programs such asAegis, Global Hawk, Predator and Reaper and have reinvested in our business. We improved our position as abest-of-breed provider in our target markets, with major design wins including the Patriot missile program, theJCREW I1B1 program, which is the DoD’s principal program to counter improvised explosive devices, or IEDs,and the Surface Electronic Warfare Improvement Program, or SEWIP, the EW improvement program for surface
5

vessels to counteract a variety of emerging threats. In fiscal 2010, we grew organically, improved our workingcapital position and profitability metrics, continued to refresh our product portfolio, and grew our services andsystems integration business. We strengthened our position in our core ISR, EW and ballistic missile defensemarkets and believe our position in these markets will continue to grow. In fiscal 2011 and 2012, we continued tostrengthen and grow our core business by enhancing our product portfolio and increasing our ISR, EW, andmissile defense system domain expertise and capabilities. We continue to be successful on our existing programsand to pursue new design wins on high growth, high priority programs. In response to new and emerging threats,and the need for better intelligence in shorter time frames, we have developed new products and capabilities that,in conjunction with our customers, seek to address those areas of concern. We have also grown and anticipategrowing further through acquisitions of performing companies that will complement, strengthen and grow ourcore business. As a result of these efforts, we believe we are well-positioned to capture existing and futuregrowth opportunities in our end markets. We also continually look at our organizational, product developmentand go-to-market capabilities to ensure we maintain an orientation towards “time to value” for our customers.This approach will help us reach our goal of providing the best solutions as we apply our commerciallydeveloped technologies to solve complex customer problems.
Our Market Opportunity
Our market opportunity is defined by the growing demand for advanced sensor processing capabilitieswithin the defense industry, as well as the burgeoning needs of the intelligence community to handle big dataprocessing, analytics and analysis challenges. Our primary market has historically been the defense sector,specifically C4ISR, EW, and ballistic missile defense; and commercial markets, which include commercialcommunications and other commercial computing markets. We believe we are well-positioned in growing,sustainable market segments of the defense sector that leverage advanced technology to improve warfightercapability and provide enhanced force protection capabilities.
We believe there are a number of evolving trends that are reshaping our target market and accordinglyprovide us with attractive growth opportunities, including:
The U.S. defense electronics market is large. We have expanded our target market and are well-positionedfrom a DoD budget, program and platform perspective. Despite expected DoD defense budget cuts, the portionmost relevant to our business is projected to remain stronger than the defense budget as a whole. DoD defenseelectronics spending was approximately $39.5 billion in government fiscal year 2012, and is projected toincrease to $40.4 billion in government fiscal year 2013. Defense electronic spending represents approximately6% of the total DoD spending annually. We believe ISR, EW and ballistic missile defense have a high priorityfor future DoD spending. We have positioned ourselves well in these important areas and have won a position onmany programs and platforms. We are a best-of-breed provider in the design and development of performanceoptimized electronic sub-systems for the ISR and EW markets. As a leader in these markets, we often contractwith multiple prime defense contractors as they bid for a particular project, thereby increasing our chance of asuccessful outcome.
The rapidly expanding demand for tactical ISR is leading to significant growth in sensor data, causing evengreater demand for the capability of our products to process data onboard the platform. An increase in theprevalence and resolution of ISR sensors is generating significant growth in the associated data that needs to beturned into information for the warfighter in a timely manner. In addition, several factors are driving the defenseand intelligence industries to demand greater capability to collect and process data onboard the aircraft,unmanned aerial vehicles, or UAVs, ships and other vehicles, which we refer to collectively as platforms. Eachplatform has limited communications bandwidth and cannot realistically transmit all the data that is collectedonboard the platform, and this problem will increase over time as sensor generated data will continue to outstripdata communication capabilities. Looking forward, we believe our armed forces will need platforms that operatemore autonomously and possibly in denied communication environments. In addition, the platforms themselvesrequire increased persistence, and reducing the need to communicate data off the platform can help increase the
6

ability of the platform to remain on or fly above the battlefield for extended periods. Finally, the scarcity and costof human analysts, the demand for timely and relevant quality information and the increasing need to fuse datanot only from multiple onboard sensors but also with intelligence generated from other platforms is causing evengreater demand for the onboard processing capabilities our products provide.
IEDs, rogue nations’ missile programs and threats from peer nations are causing greater investment in newEW and ballistic missile defense capabilities. Existing threats, such as IEDs in the form of roadside bombs,continue to be effective weapons of choice for insurgents. We have developed responses for these existingthreats, including providing the core radio frequency and signal processing for the JCREW I1B1 counter-IEDprogram. Our acquisition of LNX significantly increased our content on the JCREW I1B1 program.JCREW I1B1 is the program of record for counter-IED. While we believe that the program will remain indevelopment longer than the previously planned Milestone C highlighted in the government fiscal year 2013budget request, the U.S. Marine Corps has requested significant funding for JCREW in the government fiscalyear 2013 budget.
There are also new and emerging threats, such as peer nations developing stealth technologies, includingstealth aircraft and new anti-ship ballistic missiles that potentially threaten the U.S. naval fleet. Finally,U.S. armed forces require enhanced signals intelligence and jamming capabilities. In response to these emergingthreats, we have engaged in the following:
• we provide the core radar processing on both the Aegis ballistic missile defense systems as well as thePatriot missile system, a ground-based missile defense platform;
• in the fall of 2010, we were selected by Lockheed Martin to work on SEWIP, the surfaceEW improvement program designed to upgrade the Naval Surface Fleet EW capability and counteracta range of new peer threats;
• we provide radar processing capabilities for the F-22 Raptor and F-35 Joint Strike Fighter, the latestgeneration of U.S. stealth-enabled fighters; and
• to respond to the need for enhanced signals intelligence and jamming capabilities, we recently achieveda new design win for the next generation of the airborne signals intelligence payload, or ASIP,program.
The long-term DoD budget pressure is pushing more dollars toward upgrades of the electronic sub-systemson existing platforms, which may increase demand for our products. The DoD is moving from major newweapons systems developments to upgrades of the electronic sub-systems on existing platforms. These upgradesare expected to include more sensors, signal processing, ISR algorithms, multi-INT fusion exploitation,computing and communications. We believe that upgrades to provide new urgent war fighting capability, drivenby combatant commanders, are occurring more rapidly than traditional prime defense contractors can easily reactto. We believe these trends will cause prime defense contractors to increasingly seek out our high performance,cost-effective open architecture products.
Defense procurement reform is causing the prime defense contractors to outsource more work tobest-of-breed companies. The U.S. government is intensely focused on making systems more affordable andshortening their development time. As a company that provides commercial items to the defense industry, webelieve our products are often more affordable than products with the same functionality developed by a primedefense contractor. Prime defense contractors are increasingly being asked to work under firm fixed pricecontract awards, which can pressure profit margins and increase program risk. Prime defense contractors are alsobeing asked to produce systems much more rapidly than they have in the past. In addition, the U.S. government isdemanding more use of commercial items and open system architectures. In this budget environment, there arefewer research and development dollars available with which prime defense contractors can invest early-on todifferentiate their offerings while competing for new program awards or re-competes. As a result, prime defensecontractors are generally trying to adjust their cost model from a high fixed cost model to a variable cost model.
7

All of these factors are forcing the prime defense contractors to outsource more work to best-of-breedsubcontractors, and we have transformed our business model over the last several years to address these long-term outsourcing needs and other trends.
A Growing Role in Big Data. In a world of increasing information flow, the intelligence community andDoD are faced with the problem of processing extremely large volumes of data, and transforming that data intoactionable intelligence. We have technologies and solutions that are currently being used, and will be seeingincreased usage moving forward, for these types of applications. We will continue to invest in technologies andservice capabilities that enhance our value in this important area. We leverage both traditional computing modelsand increasingly leverage cloud-based applications and analytic process to allow us to efficiently process andanalyze Big Data on shared application platforms.
Our Business Strategy
Our long-term strategy is to become a mission critical supplier to the prime defense contractors andintelligence community and a leading provider of more affordable, open architecture, commercially-developed,application-ready and multi-intelligence sub-systems.
We intend to achieve this objective through continued investment in advanced new products and solutionsdevelopment in the fields of radio frequency, analog-to-digital and digital to analog conversion, advanced multi-and many-core sensor processing systems including GPUs, digital storage, and DRFM solutions as well assoftware defined communications capabilities. In fiscal 2008, we established our services and systemsintegration, or SSI, business to become a commercial outsourcing partner to the large prime defense contractorsas they seek the more rapid design, development and delivery of affordable, best-of-breed, application-readyISR sub-system solutions. We believe that services-led engagements in SSI may lead to long-term productionsub-system annuity revenues that will continue long after the initial services are delivered. This business modelpositions us to be paid for work we would have previously expensed through our own income statement, to teamconcurrently with multiple prime defense contractors as they pursue new business with the government, and toengage with our customers much earlier in the design cycle and ahead of our competition. In fiscal 2008, we alsoestablished MFS—the ISR systems and technology services arm of Mercury. Our goal in MFS is to enhance theapplication-ready sub-systems from ACS with classified, domain-specific intellectual property that results in thedelivery of platform-ready ISR sub-system solutions to our prime customers.
Key elements of our strategy to accomplish our continued growth objectives include:
Achieve Design Wins on High Growth, High Priority Defense Programs. We believe that the mostsignificant long-term, leading indicator in our business is the number and probable value of design wins awarded.We believe our advanced embedded signal processing solutions position us well going forward to capture designwins on key high growth, high priority defense programs within our targeted segments of the C4ISR market. Wehave won designs in persistent ISR related signals intelligence payloads on UAVs and other aerial platforms. Asa result of these successes, we now have significant content on all major UAV platforms, including GlobalHawk, Predator, Broad Area Maritime Surveillance (BAMS), Reaper and a wide area airborne surveillanceplatform. Our ballistic missile defense wins include additional designs on the Aegis program, as well ascontinued foreign military sales for the Patriot missile program, including the just announced U.S. Army Patriotdesign win. In EW, we won key designs related to the Navy’s SEWIP program, including the next generationSSEE Navy program. Together, these wins represent a substantial opportunity for us in the years ahead.
Continue to Provide Excellent Performance on Our Existing Programs. The foundation for our growthremains our continued involvement with existing programs that are in late-stage development or currently inproduction, such as Aegis, the F-35 Joint Strike Fighter, Patriot missile, the F-16 aircraft and the Global Hawk,Predator and Reaper UAV programs. As part of a long-term reprioritization, the DoD is shifting its emphasisfrom major new weapons systems development to upgrades of existing programs and platforms. The upgrades on
8

these programs focus on four key areas: improved sensors; more advanced on-board embedded computing;enhanced ISR algorithms; and better communications on and off the platform. A key element of our strategy is tocontinue to provide high performance, cost-effective solutions on these programs and for these customers as abest-of-breed provider.
Pursue Strategic, Capability-Enhancing Acquisitions. We will continue to pursue selective strategicacquisitions of profitable growing businesses to augment our businesses using the following strategies: addingtechnologies or products that expand ACS’ core business by competing more effectively in the ISR, EW, andmissile defense markets; adding content and services to the defense and intelligence programs and platforms inwhich we currently participate or could participate in the future; enhancing key customer relationships andforming relationships with potential new customers; and adding a platform company that we can build around inour intelligence business. Our acquisitions of LNX, KOR, and PDI in fiscal 2011 and 2012 support all three ofthese objectives. Adding LNX to our business significantly strengthened our product portfolio in radio frequencyand our capabilities in signals intelligence and EW. LNX’s position as a key supplier to the prime defensecontractor under the JCREW I1B1 program significantly increases our content on that platform. Similarly,adding KOR has brought capabilities with DRFM technologies that combine well with the RF domain expertiseof LNX and the embedded computing and packaging design expertise developed organically at Mercury. Ourrecent acquisition of Micronetics expands our technology and subsystems integration capabilities and providesour RF business with scalability. Our acquisition strategy also focuses on broadening our customer base.
Rapidly Scale MFS to Provide Fully Integrated Sub-systems for ISR Applications in Classified Programs.Through MFS, we have sought to become a services-led, best-of-breed ISR sub-systems provider to our primedefense contractors for classified programs. Through the addition of key personnel, high-level security clearancesand new defense and intelligence community customers, MFS provides us access to critical classifiedgovernment intellectual property that we can integrate with our existing ACS embedded computing solutions inorder to provide fully integrated, platform ready ISR sub-systems. We believe MFS differentiates us from ourcompetitors and places us in a stronger position to serve as the sub-systems architect for next-generation ISRprograms and platforms. As an example, the multi-phase Gorgon Stare program has encompassed concept ofoperation, system architecture, processor design, algorithm optimization, airborne platform-hosted mechanical/environmental design, and integration and test expertise. The first program phase yielded a successfully deployedsystem that has provided significant operational capabilities to the warfighter. The second program phasecombines state of the art hardware and software infrastructure developed by ACS with advanced imageprocessing techniques implemented by MFS that leverage ultra-high resolution cameras to enable the world’sleading airborne wide-area EO/IR surveillance system. We expect to build upon these successes in the future.
Capitalize on Outsourcing and Other Dynamics in the Defense and Intelligence Industries. We are well-positioned to take advantage of several changing dynamics in the defense industry. Prime defense contractors areincreasingly being awarded firm fixed price contracts. These contracts shift risk to the prime contractors, and as aresult they are beginning to outsource increasing levels of sub-system development and production and otherhigher value program content. In addition, the U.S. government is shifting toward shorter program timelines,which require increased flexibility and responsiveness from prime contractors. Finally, more programs aremoving to open systems architectures encompassing best-of-breed capabilities. We believe that these dynamicswill result in prime contractors outsourcing increasing levels of program content to us as a best-of-breed providerof differentiated products, sub-systems engineering services and system integration.
Leverage Our Research and Development Efforts to Anticipate Market Needs and Maintain our TechnologyLeadership. Our high performance, quick reaction sub-systems and capabilities require increasingly moresophisticated hardware, software and middleware technology. In addition, as the defense and intelligenceindustries shift to products with open systems architectures, we believe that our software expertise will becomeincreasingly important and differentiates us from many of our competitors as we have the ability to map complexalgorithms onto size, weight, and power-constrained on-board embedded sensor processing solutions. We havesubstantially and will continue to refresh both our sensor processing and multicomputer product lines while
9

increasing our product development velocity. Faster product development velocity aligns us with theU.S. government’s demands on the prime defense contractors for quick reaction capabilities. By shortening ourproduct development times, we have been able to quickly launch the products we need to win new designs fromthe prime contractor community that will ultimately generate bookings and revenue for us. We intend to continueto utilize company and customer-funded research and development, as well as our acquisition strategy, todevelop technologies, products and solutions that have significant potential for near-term and long-term valuecreation in both the defense and intelligence markets. We devote significant resources in order to anticipate thefuture requirements in our target defense and intelligence markets, including monitoring and pioneering advancesin advanced embedded computing hardware and software, anticipating changes in U.S. government spending andprocurement practices and leveraging insight from direct interaction with our customers.
Our Competitive Strengths
We believe the following competitive strengths will allow us to take advantage of the evolving trends in ourindustry and successfully pursue our business strategy:
Best-of-Breed Sub-System Solutions Provider for the C4ISR Market. Through our commercially-developed,high-performance embedded signal processing solutions, we address the challenges associated with the collectionand processing of massive, continuous streams of data and dramatically shorten the time that it takes to giveinformation to U.S. armed forces at the tactical edge. Our solutions are specifically designed for flexibility andinteroperability, allowing our products to be easily integrated into larger system-level solutions. Our ability tointegrate sub-system-level capabilities allows us to provide solutions that most effectively address the mission-critical challenges within the C4ISR market, including multi-intelligence data fusion and intelligence processingonboard the platform.
Diverse Mix of Stable, High Growth Programs Aligned with DoD Funding Priorities. Our products havebeen deployed in approximately 300 different programs with over 25 different prime contractors. We serve highpriority markets for the DoD and foreign militaries, such as UAVs, ballistic missile defense, airbornereconnaissance, EW and jamming of IEDs, and have secured positions on mission-critical programs includingAegis, Predator and Reaper UAVs, F-35 Joint Strike Fighter, Patriot missile, JCREW I1B1 and SEWIP. Inaddition, we consistently leverage our technology and capability across 15 to 20 programs on an annual basis,providing significant operating leverage and cost savings.
Value-Added Sub-System Solution Provider for Prime Defense Contractors. Because of the DoD’s shifttowards a firm fixed price contract procurement model, an increasingly uncertain budgetary and procurementenvironment, and increased budget pressures from both the U.S. and allied governments, prime defensecontractors are accelerating their move towards outsourcing opportunities to help mitigate the increased programand financial risk. Our differentiated advanced signal processing solutions offer meaningful capabilities upgradesfor our customers and enable the rapid, cost-effective deployment of systems to the end customer. We believeour open architecture sub-systems offer differentiated signal processing and data analytics capabilities thatcannot be easily replicated. Our solutions minimize program risk, maximize application portability, andaccelerate customers’ time to market.
MFS Enables the Delivery of Platform-Ready Solutions for Classified Programs. MFS was created in fiscal2008 to enable us to directly pursue systems integration opportunities within the DoD and U.S. intelligencecommunity. We believe the development work through MFS will provide us leverage and implement keyclassified government intellectual property, including critical intelligence and signal processing algorithms. Webelieve that MFS also provides us the opportunity to directly integrate this intellectual property onto our existingadvanced computing solutions, enabling us to deliver platform-ready integrated ISR sub-systems that leverageour open architecture solutions and address key government technology and procurement concerns. MFSoperations in this environment will also influence future product development so that critical future needs can bemet in a timely manner.
10
Long-Standing Industry Relationships. We have established long-standing relationships with prime defensecontractors, the U.S. government and other key organizations in the defense and intelligence industries over our30 years in the defense electronics industry. Our customers include The Boeing Company, Lockheed MartinCorporation, Northrop Grumman Corporation, and Raytheon Company, many of whom have been valued andloyal customers for more than a decade. Over this period, we have become recognized for our ability to developnew technologies and meet stringent program requirements. Our demonstrated track record of delivering high-performance embedded signal processing solutions helped us to acquire new customers, such as Exelis ElectronicSystems, for whom we are providing the processing content on the JCREW I1B1 counter-IED program. Webelieve we are well-positioned to maintain these high-level customer engagements.
Proven Management Team. Over the past several years, our senior management team has refocused theCompany on its economic core, developed a long-term compelling strategy for the defense market and restoredprofitability to the business. Having completed these critical steps to rebuild the Company and with a seniormanagement team with significant experience in growing and scaling businesses, both through operatingexecution and acquisitions, we believe that we have demonstrated our operational capabilities and we are well-positioned for the next phase to transform, grow and scale our business.
Our Solutions and Products
Services and Systems Integration (“SSI”)
As part of our strategy, we are continuing to invest in our SSI capability. Our SSI group is tasked withpartnering with prime defense contractors to deliver sub-system level engineering expertise as well as ongoingsystems integration services. Our SSI capability addresses our strategy to capitalize on the $2.7 billionsub-system market within the defense embedded electronics market segment.
As the U.S. government mandates more outsourcing and open standards, a major shift is occurring withinthe prime defense contractors toward procurement of integrated sub-systems that enable quick application levelporting through standards-based methodologies. We believe that our core expertise in this area is well aligned tocapitalize on this trend. By leveraging our open architecture and high performance modular product set, weprovide prime defense contractors with rapid deployment and quick reaction capabilities through our professionalservices and systems integration offerings. This results in less risk for the prime defense contractors, shorteneddevelopment cycles, quicker solution deployment and reduced lifecycle costs.
Software Products
We actively design, market and sell complete software and middleware environments to acceleratedevelopment and execution of complex signal and image processing applications on a broad range ofheterogeneous, multi-computing platforms. Our software suite is based on open standards and includesheterogeneous processor support with extensive high performance math libraries, multi-computing fabricsupport, net-centric and system management enabling services, extended operating system services, boardsupport packages and development tools.
Our software is developed using some of the most advanced integrated development environments (IDE’s),such as Eclipse, and our work is done on multiple platforms including open source platforms such as Linux. Oursoftware development teams are schooled in the most up-to-date software development methodologies.
Our software and middleware provides customer application-level algorithm portability across rapidlyevolving hardware processor types with math and input/output, or I/O, interfaces running at industry leadingperformance rates. In order to develop, test and integrate software ahead of hardware availability, we haveinvested in the notion of a Virtual Multi-Computer which we have branded Virtual ARS (Application ReadySub-system™). The Virtual ARS model allows for concurrent engineering internally and with customers toaccelerate time to deployment, improve quality and reduce development costs. In most cases, these softwareproducts are bundled together with broader solutions including hardware and/or services, while in other casesthey are licensed separately.
11

Our multi-computer software packages are marketed and licensed under the MultiCore Plus® registeredtrademark. These software products are a key differentiator for our systems business and represent only a modestamount of stand-alone revenue. We generally charge a user-based development license fee and bundle softwarerun-time licenses with our hardware. We offer a standards-based software value proposition to our customers andprovide this offer through several integrated software packages and service offerings.
Hardware Products
We offer a broad family of products designed to meet the full range of requirements in compute-intensive,signal processing and image processing applications, multi-computer interconnect fabrics, sensor interfaces andcommand and control functions. To maintain a competitive advantage, we seek to leverage technologyinvestments across multiple product lines. We are also influential in the industry-standard organizationsassociated with our market segments. For example, we started the OpenVPX™ initiative with the goal ofproviding customers with multi-vendor interoperable hardware built to well-defined system standards.
Our hardware products are typically compute-intensive and require extremely high inter-processorbandwidth and high I/O capacity. These systems often must also meet significant size, weight and powerconstraints for use in aircraft, UAVs, ships and other vehicles, and be ruggedized for use in highly demandinguse environments. They are used in both commercial industrial applications, such as ground radar air trafficcontrol, and advanced defense applications, including space-time adaptive processing, synthetic aperture radar,airborne early warning, command control communication and information systems, mission planning, imageintelligence and signal intelligence systems. Our products transform the massive streams of digital data created inthese applications into usable information in real time. The systems can scale from a few processors to thousandsof processors.
To address the current challenges facing the war fighter, our government and prime defense contractors, wehave developed a new product architecture that supports a more dynamic, iterative, spiral development processby leveraging open architecture standards and leading-edge commercial technologies and products. Configuredand productized as integrated sub-systems, customers can rapidly and cost-effectively port and adapt theirapplications to changing threats.
Our open architecture is carried throughout our entire Ensemble product line from the very small form-factor sub-systems to the high-end, where ultimate processing power and reliability is of paramount importanceto the mission. Our commercially-developed hardware and software product capabilities cover the entire ISRspectrum from acquisition and digitization of the signal, to processing of the signal, through the exploitation anddissemination of the information. We work continuously to improve our hardware technology with an eye towardoptimization of size, weight and power (“SWaP”) demands.
Research and Product Development
Our research and development efforts are focused on developing new products and systems as well asenhancing existing hardware and software products in signal and image processing. Our research anddevelopment goal is to fully exploit and maintain our technological lead in the high-performance, real-time signalprocessing industry. Expenditures for research and development amounted to $46.0 million in fiscal 2012,$44.5 million in fiscal 2011 and $41.5 million in fiscal 2010. As of June 30, 2012, we had 277 employees,including hardware and software architects and design engineers, primarily engaged in engineering and researchand product development activities. These individuals, in conjunction with our sales team, also devote a portionof their time to assisting customers in utilizing our products, developing new uses for these products andanticipating customer requirements for new products.
12

Manufacturing
Advanced Computing Solutions
The majority of our sales are produced in International Organization for Standardization, or ISO, 9001:2000quality system certified facilities. The current scope of delivered hardware products includes commercial andindustrial class printed circuit board assemblies (modules) and complex chassis systems. Our manufacturingoperations consist primarily of materials planning and procurement, final assembly and test and logistics(inventory and traffic management). We subcontract the assembly and testing of most modules to contractmanufacturers in the U.S. to build to our specifications. We currently rely primarily on one contractmanufacturer. We have a comprehensive quality and process control plan for each of our products, which includean effective supply chain management program and the use of automated inspection and test equipment to assurethe quality and reliability of our products. We perform most post sales service obligations (both warranty andother lifecycle support) in-house through a dedicated service and repair operation. We periodically review ourcontract manufacturing capabilities to ensure we are optimized for the right mix of quality, affordability,performance and on-time delivery.
Although we generally use standard parts and components for our products, certain components, includingcustom designed ASICs, static random access memory, FPGAs, microprocessors and other third-party chassisperipherals (single board computers, power supplies, blowers, etc.), are currently available only from a singlesource or from limited sources. With the exception of certain components that have gone “end of life,” we striveto maintain minimal supply commitments from our vendors and generally purchase components on a purchaseorder basis as opposed to entering into long-term procurement agreements with vendors. We have generally beenable to obtain adequate supplies of components in a timely manner from current vendors or, when necessary tomeet production needs, from alternate vendors. We believe that, in most cases, alternate vendors can be identifiedif current vendors are unable to fulfill needs.
Mercury Federal Systems
As of June 30, 2012, MFS did not manufacture hardware. All hardware (e.g. computers and computerperipherals) is generally procured from our other subsidiaries or third-party suppliers.
Competition
Advanced Computing Solutions
The markets for our products are highly competitive and are characterized by rapidly changing technology,frequent product performance improvements, increasing speed of deployment to align with warfighters’ needs,and evolving industry standards and requirements coming from our customers or the DoD. Competition typicallyoccurs at the design stage of a prospective customer’s product, where the customer evaluates alternativetechnologies and design approaches.
The principal competitive factors in our market are price/performance value proposition, available newproducts at the time of design win engagement, services and systems integration capability, effective marketingand sales efforts, and reputation in the market. Our competitive strengths include innovative engineering in bothhardware and software products, sub-system design expertise, advanced packaging capability to deliver the mostoptimized size, weight and power solution possible, our ability to rapidly respond to varied customerrequirements, and a track record of successfully supporting many high profile programs in both the commercialand defense markets. There are a limited number of competitors across the market segments and applicationtypes in which we compete. Some of these competitors are larger and have greater resources than us. Some ofthese competitors compete against us at purely a board-level, others at a sub-system level. We also compete within-house design teams at our customers. The DoD as well as the prime defense contractors are pushing for moreoutsourcing of sub-system designs to mitigate risk and to enable concurrent design of the platform whichultimately leads to faster time to deployment. We are aligning our strategy to capitalize on that trend andleveraging our long standing sub-system expertise to provide this value to our customers.
13

A design win usually ensures, but does not always guarantee, that a customer will purchase our product untilthe next-generation system is developed. In addition, a design win also needs to be funded by the governmentand the program needs to move to production. We believe that our future ability to compete effectively willdepend, in part, upon our ability to improve product and process technologies, to develop new technologies, tomaintain the performance advantages of products and processes relative to competitors, to adapt products andprocesses to technological changes, to identify and adopt emerging industry standards and to adapt to customerneeds.
Mercury Federal Systems
The markets for our products and services are highly competitive and primarily focus on providing servicesto the federal contracting markets. MFS is focused on developing advanced solutions for emerging ISR systemprocessing challenges in the federal space. With the addition of PDI, MFS also provides sophisticated analyticexploitation, multi-sensor fusion, and data processing services for the U.S. intelligence community. Our targetsare existing programs that are confronting modernization challenges and planned programs yet to be fielded. Ourgoal is to produce open, commercial item-based processing solutions that are platform agnostic.
Due to the competitive environment in which MFS operates, price and past performance are becoming asimportant as technical quality in most awards. Our primary competitors for our federal services are other small tolarge service-based companies that have long-standing customer relationships and program insights. We also faceadditional competition from platform and sensor developers that will continue to offer the government customsolutions packaged to support individual platform designs and point solution concepts. These companies, largeand small, will want to maintain configuration control of compute processing architectures across their platformsin order to control systems upgrade and out-year modernization efforts. To win business, we will continue tooffer program managers an alternative path to achieving interoperability and advanced SWaP efficient processingsolutions for ISR applications.
Intellectual Property and Proprietary Rights
As of June 30, 2012, we held 39 patents of varying duration issued in the United States. We regularly fileU.S. patent applications and, where appropriate, foreign patent applications. We also file continuations to coverboth new and improved designs and products. At present, we have several U.S. and foreign patent applications inprocess.
We also rely on a combination of trade secret, copyright, and trademark laws, as well as contractualagreements, to safeguard our proprietary rights in technology and products. In seeking to limit access to sensitiveinformation to the greatest practical extent, we routinely enter into confidentiality and assignment of inventionagreements with each of our employees and consultants and nondisclosure agreements with our key customersand vendors.
Backlog
As of June 30, 2012, we had a backlog of orders aggregating approximately $104.6 million, of which $91.9million is expected to be delivered within the next twelve months. As of June 30, 2011, backlog wasapproximately $86.9 million. The defense backlog at June 30, 2012 was $101.5 million, a $20.0 million increasefrom June 30, 2011. We include in our backlog customer orders for products and services for which we haveaccepted signed purchase orders, as long as that order is scheduled to ship or invoice in whole, or in part, withinthe next 24 months. Orders included in backlog may be canceled or rescheduled by customers, although thecustomer may incur cancellation penalties depending on the timing of the cancellation. A variety of conditions,both specific to the individual customer and generally affecting the customer’s industry, may cause customers tocancel, reduce or delay orders that were previously made or anticipated. We cannot assure the timely replacementof canceled, delayed or reduced orders. Significant or numerous cancellations, reductions or delays in orders by acustomer or group of customers could materially and adversely affect our results of operations or our ability topredict future revenues. Backlog should not be relied upon as indicative of our revenues for any future period.
14

Employees
At June 30, 2012, we employed a total of 713 people excluding contractors, including 277 in research anddevelopment, 83 in sales and marketing, 223 in manufacturing and customer support and 130 in general andadministrative functions. We have seven employees located in Europe, four located in Japan, and 702 located inthe United States. We do not have any employees represented by a labor organization, and we believe that ourrelations with our employees are good.
WEBSITE
We maintain a website at www.mc.com. We make available on our website, free of charge, our annual reporton Form 10-K, quarterly reports on Form 10-Q, and current reports on Form 8-K, including exhibits andamendments to those reports filed or furnished pursuant to Section 13(a) or 15(d) of the Securities Exchange Actof 1934, as soon as reasonably practicable after such reports are electronically filed with, or furnished to, theSecurities and Exchange Commission (“SEC”). Our code of business conduct and ethics is also available on ourwebsite. We intend to disclose any future amendments to, or waivers from, our code of business conduct andethics within four business days of the waiver or amendment through a website posting or by filing a currentreport on Form 8-K with the SEC. Information contained on our website does not constitute part of this report.Our reports filed with, or furnished to, the SEC are also available on the SEC’s website at www.sec.gov.
OTHER INFORMATION
Challenges Drive Innovation, Echocore, Echotek, Ensemble2, Powerstream, RACE++ and MultiCore Plusare registered trademarks, and Ensemble, Application Ready Subsystem, ARS, POET, Converged SensorNetwork, CSN, Embedded Smart Processing and ESP are trademarks of Mercury Computer Systems, Inc.OpenVPX™ is a trademark of the VMEbus International Trade Association. IBM and PowerPC are registeredtrademarks of International Business Machine Corporation. All other trademarks and registered trademarks arethe property of their respective holders, and are hereby acknowledged.
Item 1A. Risk Factors:
We depend heavily on defense electronics programs that incorporate our products, which may be onlypartially funded and are subject to potential termination and reductions and delays in governmentspending.
Sales of our embedded computer systems and related services, primarily as an indirect subcontractor or teammember with prime defense contractors, and in some cases directly, to the U.S. government and its agencies, aswell as foreign governments and agencies, accounted for approximately 94%, 78%, and 79% of our total netrevenues in fiscal 2012, 2011, and 2010, respectively. Our computer systems are included in many differentdomestic and international programs. Over the lifetime of a program, the award of many different individualcontracts and subcontracts may impact our products’ requirements. The funding of U.S. government programs issubject to Congressional appropriations. Although multiple-year contracts may be planned in connection withmajor procurements, Congress generally appropriates funds on a fiscal year basis even though a program maycontinue for many years. Consequently, programs are often only partially funded initially, and additional fundsare committed only as Congress makes further appropriations and prime contracts receive such funding. Thereduction or delay in funding or termination of a government program in which we are involved would result in aloss of or delay in receiving anticipated future revenues attributable to that program and contracts or ordersreceived. The U.S. government could reduce or terminate a prime contract under which we are a subcontractor orteam member irrespective of the quality of our products or services. The termination of a program or thereduction in or failure to commit additional funds to a program in which we are involved could negatively impactour revenues and have a material adverse effect on our financial condition and results of operations. The U.S.defense budget frequently operates under a continuing budget resolution, which increases revenue uncertaintyand volatility. For fiscal 2013, the Presidential election and the potential for defense budget sequestration may
15

reduce or delay revenues and increase uncertainty in our business and financial planning. In addition, delays infunding of a program, or of the defense appropriation generally, could negatively impact our revenues and have amaterial adverse effect on our financial condition and results of operations for the period in which such revenueswere originally anticipated.
Economic conditions could adversely affect our business, results of operations and financial condition.
The world’s financial markets have experienced turmoil, characterized by reductions in available credit,volatility in security prices, rating downgrades of investments, and reduced valuations of securities. These eventshave materially and adversely impacted the availability of financing to a wide variety of businesses, includingsmall businesses, and the resulting uncertainty has led to reductions in capital investments, overall spendinglevels, future product plans, and sales projections across many industries and markets. These trends could have amaterial adverse impact on our business. These trends could also impact our financial condition and our ability toachieve targeted results of operations due to:
• reduced and delayed demand for our products;
• increased risk of order cancellations or delays;
• downward pressure on the prices of our products;
• greater difficulty in collecting accounts receivable; and
• risks to our liquidity, including the possibility that we might not have access to our cash and short-terminvestments or to our line of credit when needed.
Further, the funding of the defense programs that incorporate our products and services is subject to theoverall U.S. government budget and appropriation decisions and processes, which are driven by numerous factorsbeyond our control, including geo-political, macroeconomic, and political conditions. Increased federal budgetdeficits could result in reduced Congressional appropriations, such as the potential for defense budgetsequestration, for the defense programs that use our defense electronics products and services. In addition,Congress could fund U.S. government operations through a continuing budget resolution without approving aformal budget for the government fiscal year, thereby potentially reducing or delaying the demand for ourproducts. We are unable to predict the likely duration and severity of adverse economic conditions in the UnitedStates and other countries, but the longer the duration or the greater the severity, the greater the risks we face inoperating our business.
We face other risks and uncertainties associated with defense-related contracts, which may have amaterial adverse effect on our business.
Whether our contracts are directly with the U.S. government, a foreign government, or one of theirrespective agencies, or indirectly as a subcontractor or team member, our contracts and subcontracts are subjectto special risks. For example:
• Changes in government administration and national and international priorities, includingdevelopments in the geo-political environment, could have a significant impact on national orinternational defense spending priorities and the efficient handling of routine contractual matters.These changes could have a negative impact on our business in the future.
• Our contracts with the U.S. and foreign governments and their prime defense contractors andsubcontractors are subject to termination either upon default by us or at the convenience of thegovernment or contractor if, among other reasons, the program itself has been terminated. Terminationfor convenience provisions generally entitle us to recover costs incurred, settlement expenses and profiton work completed prior to termination, but there can be no assurance in this regard.
• Because we contract to supply goods and services to the U.S. and foreign governments and their primeand subcontractors, we compete for contracts in a competitive bidding process and, in the event we are
16
awarded a contract, we are subject to protests by disappointed bidders of contract awards that can resultin the reopening of the bidding process and changes in governmental policies or regulations and otherpolitical factors. In addition, we may be subject to multiple rebid requirements over the life of adefense program in order to continue to participate on such program, which can result in the loss of theprogram or significantly reduce our revenue or margin from the program. The government’srequirements for more frequent technology refreshes on defense programs may lead to increased costsand lower long term revenues.
• Consolidation among defense industry contractors has resulted in a few large contractors withincreased bargaining power relative to us. The increased bargaining power of these contractors mayadversely affect our ability to compete for contracts and, as a result, may adversely affect our businessor results of operations in the future.
• Our customers include U.S. government contractors who must comply with and are affected by lawsand regulations relating to the formation, administration, and performance of U.S. governmentcontracts. In addition, when our business units, such as MFS, contract with the U.S. government, theymust comply with these laws and regulations, including the organizational conflict-of-interestregulations. A violation of these laws and regulations could result in the imposition of fines andpenalties to us or our customers or the termination of our or their contracts with the U.S. government.As a result, there could be a delay in our receipt of orders from our customers, a termination of suchorders, or a termination of contracts between our business units and the U.S. government.
• We sell products to U.S. and international defense contractors and also directly to the U.S. governmentas a commercial supplier such that cost data is not supplied. To the extent that there are interpretationsor changes in the Federal Acquisition Regulations regarding the qualifications necessary to be acommercial supplier, there could be a material adverse effect on our business and operating results. Forexample, there have been legislative proposals to narrow the definition of a “commercial item” (asdefined in the Federal Acquisition Regulations) that could limit our ability to contract as a commercialsupplier. In addition, growth in our defense sales relative to our commercial sales could adverselyimpact our status as a commercial supplier, which could adversely affect our business and operatingresults. Changes in federal regulations, or the interpretation of federal regulations, may subject us toaudit by the Defense Contract Audit Agency for certain of our products or services.
• We qualify as a “small business” for government contracts purposes under the definition of that term inan applicable NAICS code because we have fewer than 1,000 employees. As we grow and potentiallyhave over 1,000 employees in the future, we would no longer qualify as a small business. Loss of oursmall business status could negatively impact us, including our customers purchases from us would notqualify as purchases from a small business, customers may flow down additional Federal AcquisitionRegulation, or FAR, clauses in their contracts with us that are less favorable than our existing contractterms and conditions, and the flow down of certain FAR clauses may require us to implement aDefense Contract Audit Agency cost-accounting system.
• We are subject to the Defense Federal Acquisition Regulations Supplement, referred to as DFARS, inconnection with our defense work for the U.S. government and prime defense contractors.Amendments to the DFARS, such as the 2009 amendment to the DFARS specialty metals clauserequiring that the specialty metals in specified items be melted or produced in the U.S. or otherqualifying countries, may increase our costs for certain materials or result in supply-chain difficultiesor production delays due to the limited availability of compliant materials.
• The U.S. government or a prime defense contractor customer could require us to relinquish data rightsto a product in connection with performing work on a defense contract, which could lead to a loss ofvaluable technology and intellectual property in order to participate in a government program.
• We are subject to various U.S. federal export-control statutes and regulations which affect our businesswith, among others, international defense customers. In certain cases the export of our products andtechnical data to foreign persons, and the provision of technical services to foreign persons related to
17

such products and technical data, may require licenses from the U.S. Department of Commerce or theU.S. Department of State. The time required to obtain these licenses, and the restrictions that may becontained in these licenses, may put us at a competitive disadvantage with respect to competing withinternational suppliers who are not subject to U.S. federal export control statutes and regulations. Inaddition, violations of these statutes and regulations can result in civil and, under certaincircumstances, criminal liability as well as administrative penalties which could have a materialadverse effect on our business and operating results.
• Certain of our employees with appropriate security clearance may require access to classifiedinformation in connection with the performance of a U.S. government contract. We must comply withsecurity requirements pursuant to the National Industrial Security Program Operating Manual, orNISPOM, and other U.S. government security protocols when accessing sensitive information. Failureto comply with the NISPOM or other security requirements may subject us to civil or criminalpenalties, loss of access to sensitive information, loss of a U.S. government contract, or potentiallydebarment as a government contractor.
The loss of one or more of our largest customers, programs, or applications could adversely affect ourresults of operations.
We are dependent on a small number of customers for a large portion of our revenues. A significantdecrease in the sales to or loss of any of our major customers would have a material adverse effect on ourbusiness and results of operations. In fiscal 2012, Raytheon Company accounted for 22% of our total netrevenues, Northrop Grumman Corporation accounted for 17% of our total net revenues and Lockheed MartinCorporation accounted for 15% of our total net revenues. In fiscal 2011, Northrop Grumman Corporationaccounted for 21% of our total net revenues, Raytheon Company accounted for 17% of our total net revenues andLockheed Martin Corporation accounted for 13% of our total net revenues. In fiscal 2010, Raytheon Companyaccounted for 20% of our total net revenues and Lockheed Martin Corporation accounted for 17% of our total netrevenues. The defense market is highly acquisitive, which could lead to further concentration in our largestcustomers. Customers in the defense market generally purchase our products in connection with governmentprograms that have a limited duration, leading to fluctuating sales to any particular customer in this market fromyear to year. In addition, our revenues are largely dependent upon the ability of customers to develop and sellproducts that incorporate our products. No assurance can be given that our customers will not experiencefinancial, technical or other difficulties that could adversely affect their operations and, in turn, our results ofoperations. Additionally, on a limited number of programs the customer has co-manufacturing rights which couldlead to a shift of production on such a program away from us which in turn could lead to lower revenues.
We are dependent on sales for radar applications for a large portion of our revenues. Sales related to radarapplications accounted for 55%, 53%, and 49% of our total net revenues for fiscal 2012, 2011, and 2010,respectively. While our radar sales relate to multiple different platforms and defense programs, our revenues arelargely dependent upon our customers incorporating our products into radar applications. In fiscal 2012 and fiscal2010, the Aegis program accounted for 11% and 15% of our total net revenues, respectively. Loss of a significantradar program could adversely affect our results of operations. For the year ended June 30, 2011, no singleprogram comprised 10% or more of the Company’s revenue.
Going forward, we believe the JCREW I1B1 counter-IED and SEWIP programs could be a large portion ofour future revenues in the coming years, and the loss or cancellation of these programs could adversely affect ourfuture results. In addition, as we shift our business mix toward more services-led engagements with legacyproduct revenues becoming a lesser amount of our total revenues, we could experience downward pressure onmargins and reduced profitability. Further, new programs may yield lower margins than legacy programs, whichcould result in an overall reduction in gross margins.
18

If we are unable to respond adequately to our competition or to changing technology, we may lose existingcustomers and fail to win future business opportunities.
The markets for our products are highly competitive and are characterized by rapidly changing technology,frequent product performance improvements and evolving industry standards. Competitors may be able to offermore attractive pricing or develop products that could offer performance features that are superior to ourproducts, resulting in reduced demand for our products. Due to the rapidly changing nature of technology, wemay not become aware in advance of the emergence of new competitors into our markets. The emergence of newcompetitors into markets targeted by us could result in the loss of existing customers and may have a negativeimpact on our ability to win future business opportunities. In addition to adapting to rapidly changing technology,we must also develop a reputation as a best-of-breed technology provider. Competitors may be perceived in themarket as being providers of open-source architectures versus Mercury as a closed-architecture company.Perceptions of Mercury as a high-cost provider, or as having stale technology could cause us to lose existingcustomers or fail to win new business.
With continued microprocessor evolution, low-end systems could become adequate to meet therequirements of an increased number of the lesser-demanding applications within our target markets.Workstation or blade center computer manufacturers and other low-end single-board computer, or newcompetitors, may attempt to penetrate the high-performance market for defense electronics systems, which couldhave a material adverse effect on our business. In addition, our customers provide products to markets that aresubject to technological cycles. Any change in the demand for our products due to technological cycles in ourcustomers’ end markets could result in a decrease in our revenues.
Competition from existing or new companies could cause us to experience downward pressure on prices,fewer customer orders, reduced margins, the inability to take advantage of new business opportunities,and the loss of market share.
We compete in highly competitive industries, and our OEM customers generally extend the competitivepressures they face throughout their respective supply chains. Additionally, our markets are facing increasingindustry consolidation, resulting in larger competitors who have more market share to put more downwardpressure on prices and offer a more robust portfolio of products and services. We are subject to competitionbased upon product design, performance, pricing, quality and services. Our product performance, embeddedsystems’ engineering expertise, and product quality have been important factors in our growth. While we try tomaintain competitive pricing on those products that are directly comparable to products manufactured by others,in many instances our products will conform to more exacting specifications and carry a higher price thananalogous products. Many of our OEM customers and potential customers have the capacity to design andinternally manufacture products that are similar to our products. We face competition from research and productdevelopment groups and the manufacturing operations of current and potential customers, who continuallyevaluate the benefits of internal research, product development, and manufacturing versus outsourcing. Thiscompetition could result in fewer customer orders and a loss of market share.
Our sales in the defense market could be adversely affected by the emergence of commodity-type productsas acceptable substitutes for certain of our products and by uncertainty created by emerging changes instandards that may cause customers to delay purchases or seek alternative solutions.
Our computing products for the defense market are designed for operating under physical constraints suchas limited space, weight, and electrical power. Furthermore, these products are often designed to be “rugged,”that is, to withstand enhanced environmental stress such as extended temperature range, shock, vibration, andexposure to sand or salt spray. Historically these requirements have often precluded the use of less expensive,readily available commodity-type systems typically found in more benign non-military settings. Factors that mayincrease the acceptability of commodity-type products in some defense platforms that we serve includeimprovements in the physical properties and durability of such alternative products, combined with the relaxation
19

of physical and ruggedness requirements by the military due to either a reevaluation of those requirements or theinstallation of computing products in a more highly environmentally isolated setting. These developments couldnegatively impact our revenues and have a material adverse effect on our business and operating results.
If we fail to respond to commercial industry cycles in terms of our cost structure, manufacturing capacityand/or personnel need, our business could be seriously harmed.
The timing, length and severity of the up-and-down cycles in the telecommunications and other commercialindustries are difficult to predict. This cyclical nature of the industries in which we operate affects our ability toaccurately predict future revenue, and in some cases, future expense levels. In the current environment, ourability to accurately predict our future operating results is particularly low. During down cycles in our industry,the financial results of our customers may be negatively impacted, which could result not only in a decrease inorders but also a weakening of their financial condition that could impair our ability to recognize revenue or tocollect on outstanding receivables. Furthermore, in the current credit environment, it may be more difficult forour customers to raise capital, whether debt or equity, to finance their purchases of capital equipment, includingthe products we sell. If our customers experience persistent difficulties in raising capital for equipment financing,we could experience a decrease in orders for our products. When cyclical fluctuations result in lower thanexpected revenue levels, operating results may be adversely affected and cost reduction measures may benecessary in order for us to remain competitive and financially sound. During periods of declining revenues, suchas in the current environment, we must be in a position to adjust our cost and expense structure to reflectprevailing market conditions and to continue to motivate and retain our key employees. If we fail to respond,then our business could be seriously harmed. In addition, during periods of rapid growth, we must be able toincrease manufacturing capacity and personnel to meet customer demand. We can provide no assurance thatthese objectives can be met in a timely manner in response to industry cycles. Each of these factors couldadversely impact our operating results and financial condition.
Implementation of our growth strategy may not be successful, which could affect our ability to increaserevenues.
Our growth strategy includes developing new products, adding new customers within our existing markets,and entering new markets, as well as identifying and integrating acquisitions. Our ability to compete in newmarkets will depend upon a number of factors including, among others:
• our ability to create demand for products in new markets;
• our ability to manage growth effectively;
• our ability to respond to changes in our customers’ businesses by updating existing products andintroducing, in a timely fashion, new products which meet the needs of our customers;
• our ability to develop a reputation as a best-of-breed technology provider;
• the quality of our new products;
• our ability to respond rapidly to technological change; and
• our ability to successfully integrate any acquisitions that we make.
The failure to do any of the foregoing could have a material adverse effect on our business, financialcondition and results of operations. In addition, we may face competition in these new markets from variouscompanies that may have substantially greater research and development resources, marketing and financialresources, manufacturing capability and customer support organizations.
Growing our business, in particular through providing services and products such as sophisticatedapplication ready subsystems for major defense programs like JCREW I1B1, SEWIP and Aegis, could strain our
20

operational capacity and working capital demands if not properly anticipated and managed. Pursuing such growthcould result in our operational and infrastructure resources being spread too thin, which could negatively impactour ability to deliver quality product on schedule and on budget. Providing quality services for systems levelproducts is a key driver of our growth strategy and the failure to properly scale our capabilities to support ourcustomers at a systems level could result lost opportunities and revenues.
Future acquisitions or divestitures may adversely affect our financial condition.
As part of our strategy for growth, we may continue to explore acquisitions, divestitures, or strategicalliances, which may not be completed or may not be ultimately beneficial to us.
Acquisitions or divestitures may pose risks to our operations, including:
• problems and increased costs in connection with the integration or divestiture of the personnel,operations, technologies, or products of the acquired or divested businesses;
• unanticipated costs;
• failure to achieve anticipated increases in revenues and profitability;
• diversion of management’s attention from our core business;
• inability to make planned divestitures of businesses on favorable terms in a timely manner or at all;
• adverse effects on business relationships with suppliers and customers and those of the acquiredcompany;
• acquired assets becoming impaired as a result of technical advancements or worse-than-expectedperformance by the acquired company;
• volatility associated with accounting for earn-outs in a given transaction;
• entering markets in which we have no, or limited, prior experience; and
• potential loss of key employees.
In addition, in connection with any acquisitions or investments we could:
• issue stock that would dilute our existing shareholders’ ownership percentages;
• incur debt and assume liabilities;
• obtain financing on unfavorable terms, or not be able to obtain financing on any terms at all;
• incur amortization expenses related to acquired intangible assets or incur large and immediate write-offs;
• incur large expenditures related to office closures of the acquired companies, including costs relating tothe termination of employees and facility and leasehold improvement charges resulting from ourhaving to vacate the acquired companies’ premises; and
• reduce the cash that would otherwise be available to fund operations or for other purposes.
The failure to successfully integrate any acquisitions or to make planned divestitures in an efficient ortimely manner may negatively impact our financial condition and operating results, or we may not be able tofully realize anticipated savings.
We may be unable to obtain critical components from suppliers, which could disrupt or delay our abilityto deliver products to our customers.
Several components used in our products are currently obtained from sole-source suppliers. We aredependent on key vendors like LSI Logic Corporation, Xilinx, Inc., and IBM Corporation for custom-designed
21

application-specific integrated circuits (“ASICs”) and field programmable gate arrays (“FPGAs”), FreescaleSemiconductor, Inc. and IBM Corporation for PowerPC microprocessors, Intel Corporation for our nextgeneration processors, IBM Corporation for a specific SRAM, Curtiss Wright Corporation and Motorola, Inc. forchassis and chassis components and Benchmark Electronics, Inc. for board assembly, test and integration. Thesemiconductor industry is experiencing a significant year over year increase in demand amid an uncertain macroeconomy which is limiting any investment in additional capacity. We believe this dynamic will result inincreased lead-time for most classes of semiconductors and passive components and will continue to put pressureon component pricing where supply becomes constrained. Generally, suppliers may terminate their contractswith us without cause upon 30 days’ notice and may cease offering their products upon 180 days’ notice. If anyof our sole-source suppliers limits or reduces the sale of these components, we may be unable to fulfill customerorders in a timely manner or at all. In addition, if these or other component suppliers, some of which are smallcompanies, experienced financial difficulties or other problems that prevented them from supplying us with thenecessary components, we could experience a loss of revenues due to our inability to fulfill orders. These sole-source and other suppliers are each subject to quality and performance issues, materials shortages, excessdemand, reduction in capacity and other factors that may disrupt the flow of goods to us or to our customers,which would adversely affect our business and customer relationships. We have no guaranteed supplyarrangements with our suppliers and there can be no assurance that these suppliers will continue to meet ourrequirements. If supply arrangements are interrupted, we may not be able to find another supplier on a timely orsatisfactory basis. We may incur significant set-up costs and delays in manufacturing should it become necessaryto replace any key vendors due to work stoppages, shipping delays, financial difficulties, natural or manmadedisasters or other factors.
We may not be able to effectively manage our relationships with contract manufacturers.
We may not be able to effectively manage our relationship with contract manufacturers, and the contractmanufacturers may not meet future requirements for timely delivery. We rely on contract manufacturers to buildhardware sub-assemblies for our products in accordance with our specifications. During the normal course ofbusiness, we may provide demand forecasts to contract manufacturers up to five months prior to scheduleddelivery of our products to customers. If we overestimate requirements, the contract manufacturers may assesscancellation penalties or we may be left with excess inventory, which may negatively impact our earnings. If weunderestimate requirements, the contract manufacturers may have inadequate inventory, which could interruptmanufacturing of our products and result in delays in shipment to customers and revenue recognition. Contractmanufacturers also build products for other companies, and they may not have sufficient quantities of inventoryavailable or sufficient internal resources to fill our orders on a timely basis or at all.
In addition, there have been a number of major acquisitions within the contract manufacturing industry inrecent periods. While there has been no significant impact on our contract manufacturers to date, futureacquisitions could potentially have an adverse effect on our working relationships with contract manufacturers.Moreover, we currently rely primarily on one contract manufacturer. The failure of this contract manufacturer tofill our orders on a timely basis or in accordance with our customers’ specifications could result in a loss ofrevenues and damage to our reputation. We may not be able to replace this contract manufacturer in a timelymanner or without significantly increasing our costs if such contract manufacturer were to experience financialdifficulties or other problems that prevented it from fulfilling our order requirements.
We are exposed to risks associated with international operations and markets.
We market and sell products in international markets, and have established offices and subsidiaries inEurope and Japan. Revenues from international operations accounted for 4% of our total net revenues in fiscal2012 and 2011, and 10% of our total net revenues in fiscal 2010. We also ship directly from our U.S. operationsto international customers. There are inherent risks in transacting business internationally, including:
• changes in applicable laws and regulatory requirements;
• export and import restrictions;
22

• export controls relating to technology;
• tariffs and other trade barriers;
• less favorable intellectual property laws;
• difficulties in staffing and managing foreign operations;
• longer payment cycles;
• problems in collecting accounts receivable;
• adverse economic conditions in foreign markets;
• political instability;
• fluctuations in currency exchange rates;
• expatriation controls; and
• potential adverse tax consequences.
There can be no assurance that one or more of these factors will not have a material adverse effect on ourfuture international activities and, consequently, on our business and results of operations.
We may be exposed to unfavorable currency exchange rate fluctuations, which may lead to loweroperating margins, or may cause us to raise prices which could result in reduced revenues.
Currency exchange rate fluctuations could have an adverse effect on our net revenues and results ofoperations. Unfavorable currency fluctuations could require us to increase prices to foreign customers, whichcould result in lower net revenues from such customers. Alternatively, if we do not adjust the prices for ourproducts in response to unfavorable currency fluctuations, our results of operations could be adversely affected.In addition, most sales made by our foreign subsidiaries are denominated in the currency of the country in whichthese products are sold, and the currency they receive in payment for such sales could be less valuable at the timeof receipt as a result of exchange rate fluctuations. We do not currently hedge our foreign currency exchange rateexposure.
If we are unable to respond to technological developments and changing customer needs on a timely andcost-effective basis, our results of operations may be adversely affected.
Our future success will depend in part on our ability to enhance current products and to develop newproducts on a timely and cost-effective basis in order to respond to technological developments and changingcustomer needs. Defense customers, in particular, demand frequent technological improvements as a means ofgaining military advantage. Military planners have historically funded significantly more design projects thanactual deployments of new equipment, and those systems that are deployed tend to contain the components of thesubcontractors selected to participate in the design process. In order to participate in the design of new defenseelectronics systems, we must demonstrate the ability to deliver superior technological performance on a timelyand cost-effective basis. There can be no assurance that we will secure an adequate number of defense designwins in the future, that the equipment in which our products are intended to function will eventually be deployedin the field, or that our products will be included in such equipment if it eventually is deployed.
Customers in our commercial markets, including the semiconductor market, also seek technologicalimprovements through product enhancements and new generations of products. OEMs historically have selectedcertain suppliers whose products have been included in the OEMs’ machines for a significant portion of theproducts’ life cycles. We may not be selected to participate in the future design of any semiconductor equipment,or if selected, we may not generate any revenues for such design work.
The design-in process is typically lengthy and expensive, and there can be no assurance that we will be ableto continue to meet the product specifications of OEM customers in a timely and adequate manner. In addition,
23

any failure to anticipate or respond adequately to changes in technology, customer preferences and future orderdemands, or any significant delay in product developments, product introductions or order volume, couldnegatively impact our financial condition and results of operations, including the risk of inventory obsolescence.Because of the complexity of our products, we have experienced delays from time to time in completing productson a timely basis. If we are unable to design, develop or introduce competitive new products on a timely basis,our future operating results may be adversely affected.
Our products are complex, and undetected defects may increase our costs, harm our reputation withcustomers or lead to costly litigation.
Our products are extremely complex and must operate successfully with complex products of other vendors.Our products may contain undetected errors when first introduced or as we introduce product upgrades. Thepressures we face to be the first to market new products or functionality increases the possibility that we willoffer products in which we or our customers later discover problems. We have experienced new product andproduct upgrade errors in the past and expect similar problems in the future. These problems may cause us toincur significant costs to support our service contracts and other costs and divert the attention of personnel fromour product development efforts. Undetected errors may adversely affect our product’s ease of use and maycreate customer satisfaction issues. If we are unable to repair these problems in a timely manner, we mayexperience a loss of or delay in revenue and significant damage to our reputation and business prospects. Manyof our customers rely upon our products for mission-critical applications. Because of this reliance, errors, defectsor other performance problems in our products could result in significant financial and other damage to ourcustomers. Our customers could attempt to recover those losses by pursuing products liability claims against uswhich, even if unsuccessful, would likely be time-consuming and costly to defend and could adversely affect ourreputation.
We may be unsuccessful in protecting our intellectual property rights which could result in the loss of acompetitive advantage.
Our ability to compete effectively against other companies in our industry depends, in part, on our ability toprotect our current and future proprietary technology under patent, copyright, trademark, trade secret and unfaircompetition laws. We cannot assure that our means of protecting our proprietary rights in the United States orabroad will be adequate, or that others will not develop technologies similar or superior to our technology ordesign around our proprietary rights. In addition, we may incur substantial costs in attempting to protect ourproprietary rights.
Also, despite the steps taken by us to protect our proprietary rights, it may be possible for unauthorized thirdparties to copy or reverse-engineer aspects of our products, develop similar technology independently orotherwise obtain and use information that we regard as proprietary and we may be unable to successfully identifyor prosecute unauthorized uses of our technology. Furthermore, with respect to our issued patents and patentapplications, we cannot assure you that any patents from any pending patent applications (or from any futurepatent applications) will be issued, that the scope of any patent protection will exclude competitors or providecompetitive advantages to us, that any of our patents will be held valid if subsequently challenged or that otherswill not claim rights in or ownership of the patents (and patent applications) and other proprietary rights held byus.
If we become subject to intellectual property infringement claims, we could incur significant expenses andcould be prevented from selling specific products.
We may become subject to claims that we infringe the intellectual property rights of others in the future. Wecannot assure that, if made, these claims will not be successful. Any claim of infringement could cause us toincur substantial costs defending against the claim even if the claim is invalid, and could distract managementfrom other business. Any judgment against us could require substantial payment in damages and could alsoinclude an injunction or other court order that could prevent us from offering certain products.
24

Our need for continued investment in research and development may increase expenses and reduce ourprofitability.
Our industry is characterized by the need for continued investment in research and development. If we failto invest sufficiently in research and development, our products could become less attractive to potentialcustomers and our business and financial condition could be materially and adversely affected. As a result of theneed to maintain or increase spending levels in this area and the difficulty in reducing costs associated withresearch and development, our operating results could be materially harmed if our research and developmentefforts fail to result in new products or if revenues fall below expectations. In addition, as a result of ourcommitment to invest in research and development, spending levels of research and development expenses as apercentage of revenues may fluctuate in the future.
Our results of operations are subject to fluctuation from period to period and may not be an accurateindication of future performance.
We have experienced fluctuations in operating results in large part due to the sale of computer systems inrelatively large dollar amounts to a relatively small number of customers. Customers specify delivery daterequirements that coincide with their need for our products. Because these customers may use our products inconnection with a variety of defense programs or other projects with different sizes and durations, a customer’sorders for one quarter generally do not indicate a trend for future orders by that customer. As such, we have notbeen able in the past to consistently predict when our customers will place orders and request shipments so thatwe cannot always accurately plan our manufacturing requirements. As a result, if orders and shipments differfrom what we predict, we may incur additional expenses and build excess inventory, which may requireadditional reserves and allowances. Any significant change in our customers’ purchasing patterns could have amaterial adverse effect on our operating results and reported earnings per share for a particular quarter. Thus,results of operations in any period should not be considered indicative of the results to be expected for any futureperiod.
Our quarterly results may be subject to fluctuations resulting from a number of other factors, including:
• delays in completion of internal product development projects;
• delays in shipping computer systems and software programs;
• delays in acceptance testing by customers;
• a change in the mix of products sold to our served markets;
• production delays due to quality problems with outsourced components;
• inability to scale quick reaction capability products due to low product volume;
• shortages and costs of components;
• the timing of product line transitions;
• declines in quarterly revenues from previous generations of products following announcement ofreplacement products containing more advanced technology;
• potential impairment or restructuring charges; and
• changes in estimates of completion on fixed price service engagements.
In addition, from time to time, we have entered into contracts, referred to as development contracts, toengineer a specific solution based on modifications to standard products. Gross margins from developmentcontract revenues are typically lower than gross margins from standard product revenues. We intend to continueto enter into development contracts and anticipate that the gross margins associated with development contractrevenues will continue to be lower than gross margins from standard product sales.
Another factor contributing to fluctuations in our quarterly results is the fixed nature of expenditures onpersonnel, facilities and marketing programs. Expense levels for these programs are based, in significant part, onexpectations of future revenues. If actual quarterly revenues are below management’s expectations, our results ofoperations will likely be adversely affected.
25

Further, the preparation of financial statements in conformity with accounting principles generally acceptedin the United States requires us to make estimates and assumptions that affect the reported amounts of assets andliabilities and disclosure of contingent assets and liabilities at the dates of the financial statements and thereported amounts of revenues and expenses during the reporting periods. Actual results could differ from thoseestimates, and changes in estimates in subsequent periods could cause our results of operations to fluctuate.
Changes in regulations could materially adversely affect us.
Our business, results of operations, or financial condition could be materially adversely affected if laws,regulations, or standards relating to us or our products are newly implemented or changed. In addition, ourcompliance with existing regulations may have a material adverse impact on us. Under applicable federalsecurities laws, we are required to evaluate and determine the effectiveness of our internal control structure andprocedures for financial reporting. Should we or our independent registered public accounting firm determinethat we have material weaknesses in our internal controls, our results of operations or financial condition may bematerially adversely affected or our stock price may decline.
Changes in generally accepted accounting principles may adversely affect us.
From time to time, the Financial Accounting Standards Board, or FASB, promulgates new accountingprinciples that could have a material adverse impact on our results of operations or financial condition.
We rely on the significant experience and specialized expertise of our senior management and engineeringstaff and must retain and attract qualified engineers and other highly skilled personnel in order to growour business successfully.
Our performance is substantially dependent on the continued services and performance of our seniormanagement and our highly qualified team of engineers, many of whom have numerous years of experience,specialized expertise in our business, and security clearances required for certain defense projects. If we are notsuccessful in hiring and retaining highly qualified engineers, we may not be able to extend or maintain ourengineering expertise, and our future product development efforts could be adversely affected. Competition forhiring these employees is intense, especially with regard to engineers with specialized skills and securityclearances required for our business, and we may be unable to hire and retain enough engineers to implement ourgrowth strategy.
Our future success also depends on our ability to identify, attract, hire, train, retain and motivate highlyskilled managerial, operations, sales, marketing and customer service personnel. If we fail to attract, integrate andretain the necessary personnel, our ability to maintain and grow our business could suffer significantly. Further,stock price volatility and improvements in the economy could impact our ability to retain key personnel.
If we experience a disaster or other business continuity problem, we may not be able to recoversuccessfully, which could cause material financial loss, loss of human capital, regulatory actions,reputational harm, or legal liability.
If we experience a local or regional disaster or other business continuity problem, such as an earthquake,terrorist attack, pandemic or other natural or man-made disaster, our continued success will depend, in part, onthe availability of our personnel, our office facilities, and the proper functioning of our computer,telecommunication and other related systems and operations. As we attempt to grow our operations, the potentialfor particular types of natural or man-made disasters, political, economic or infrastructure instabilities, or othercountry- or region-specific business continuity risks increases.
26

If we are unable to continue to obtain U.S. federal government authorization regarding the export of ourproducts, or if current or future export laws limit or otherwise restrict our business, we could beprohibited from shipping our products to certain countries, which would harm our ability to generaterevenue.
We must comply with U.S. laws regulating the export of our products and technology. In addition, we arerequired to obtain a license from the U.S. federal government to export certain of our products and technical dataas well as to provide technical services to foreign persons related to such products and technical data. We cannotbe sure of our ability to obtain any licenses required to export our products or to receive authorization from theU.S. federal government for international sales or domestic sales to foreign persons including transfers oftechnical data or the provision of technical services. Moreover, the export regimes and the governing policiesapplicable to our business are subject to change. We cannot assure you of the extent that such exportauthorizations will be available to us, if at all, in the future. If we cannot obtain required government approvalsunder applicable regulations in a timely manner or at all, we would be delayed or prevented from selling ourproducts in international jurisdictions, which could adversely affect our business and financial results.
In addition, we must comply with the Foreign Corrupt Practices Act, or the FCPA. The FCPA generallyprohibits U.S. companies and their intermediaries from making corrupt payments to foreign officials for thepurpose of obtaining or keeping business or otherwise obtaining favorable treatment, and requires companies tomaintain adequate record-keeping and internal accounting practices to accurately reflect the transactions of thecompany. Under the FCPA, U.S. companies may be held liable for actions taken by strategic or local partners orrepresentatives. If we or our intermediaries fail to comply with the requirements of the FCPA, governmentalauthorities in the United States could seek to impose civil and criminal penalties, which could have a materialadverse effect on our business, results of operations, financial conditions and cash flows.
If we suffer any data breaches involving the designs, schematics or source code for our products or othersensitive information, our business and financial results could be adversely affected.
We securely store our designs, schematics and source code for our products as they are created. A breach,whether physical, electronic or otherwise, of the systems on which this sensitive data is stored could lead todamage or piracy of our products. If we are subject to data security breaches, we may have a loss in sales orincreased costs arising from the restoration or implementation of additional security measures, either of whichcould adversely affect our business and financial results. In addition, a security breach that involved classifiedinformation could subject us to civil or criminal penalties, loss of a government contract, loss of access toclassified information, or debarment as a government contractor.
Our income tax provision and other tax liabilities may be insufficient if taxing authorities are successful inasserting tax positions that are contrary to our position. Increases in tax rates could impact our financialperformance.
From time to time, we are audited by various federal, state and local authorities regarding income taxmatters. Significant judgment is required to determine our provision for income taxes and our liabilities forfederal, state, local and other taxes. Although we believe our approach to determining the appropriate taxtreatment is supportable and in accordance with relevant authoritative guidance it is possible that the final taxauthority will take a tax position that is materially different than that which is reflected in our income taxprovision. Such differences could have an adverse effect on our income tax provision or benefit, in the reportingperiod in which such determination is made and, consequently, on our results of operations, financial positionand/or cash flows for such period. Further, future increases in tax rates may adversely affect our financial results.
27

Provisions in our organizational documents and Massachusetts law and other actions we have taken couldmake it more difficult for a third party to acquire us.
Provisions of our charter and by-laws could have the effect of discouraging a third party from making aproposal to acquire our company and could prevent certain changes in control, even if some shareholders mightconsider the proposal to be in their best interest. These provisions include a classified board of directors, advancenotice to our board of directors of shareholder proposals and director nominations, and limitations on the abilityof shareholders to remove directors and to call shareholder meetings. In addition, we may issue shares of anyclass or series of preferred stock in the future without shareholder approval upon such terms as our board ofdirectors may determine. The rights of holders of common stock will be subject to, and may be adverselyaffected by, the rights of the holders of any such class or series of preferred stock that may be issued.
We also are subject to the Massachusetts General Laws which, subject to certain exceptions, prohibit aMassachusetts corporation from engaging in a broad range of business combinations with any “interestedshareholder” for a period of three years following the date that such shareholder becomes an interestedshareholder. These provisions could discourage a third party from pursuing an acquisition of our company at aprice considered attractive by many shareholders.
We have adopted a Shareholder Rights Plan that could make it more difficult for a third party to acquire, orcould discourage a third party from acquiring, our company or a large block of our common stock. A third partythat acquires 15% or more of our common stock (an “acquiring person”) could suffer substantial dilution of itsownership interest under the terms of the Shareholder Rights Plan through the issuance of common stock orcommon stock equivalents to all shareholders other than the acquiring person.
Our profits may decrease and/or we may incur significant unanticipated costs if we do not accuratelyestimate the costs of fixed-price engagements.
A significant number of our system integration projects are based on fixed-price contracts, rather thancontracts in which payment to us is determined on a time and materials or other basis. Our failure to estimateaccurately the resources and schedule required for a project, or our failure to complete our contractual obligationsin a manner consistent with the project plan upon which our fixed-price contract was based, could adverselyaffect our overall profitability and could have a material adverse effect on our business, financial condition andresults of operations. We are consistently entering into contracts for large projects that magnify this risk. Wehave been required to commit unanticipated additional resources to complete projects in the past, which hasoccasionally resulted in losses on those contracts. We will likely experience similar situations in the future. Inaddition, we may fix the price for some projects at an early stage of the project engagement, which could result ina fixed price that is too low. Therefore, any changes from our original estimates could adversely affect ourbusiness, financial condition and results of operations.
The trading price of our common stock may continue to be volatile, which may adversely affect ourbusiness, and investors in our common stock may experience substantial losses.
Our stock price, like that of other technology companies, has been volatile. The stock market in general andtechnology companies in particular may continue to experience volatility. This volatility may or may not berelated to our operating performance. Our operating results, from time to time, may be below the expectations ofpublic market analysts and investors, which could have a material adverse effect on the market price of ourcommon stock. Our low stock trading volume and microcap status could hamper existing and new shareholdersfrom gaining a meaningful position in our stock. In addition, the limited availability of credit in the financialmarkets and the continued threat of terrorism in the United States and abroad and the resulting military actionand heightened security measures undertaken in response to threats may cause continued volatility in securitiesmarkets. When the market price of a stock has been volatile, holders of that stock will sometimes issue securitiesclass action litigation against the company that issued the stock. If any shareholders were to issue a lawsuit, wecould incur substantial costs defending the lawsuit. Also, the lawsuit could divert the time and attention ofmanagement.
28

We have never paid dividends on our capital stock and we do not anticipate paying any dividends in theforeseeable future. Consequently, any gains from an investment in our common stock will likely depend onwhether the price of our common stock increases.
We have not declared or paid cash dividends on any of our classes of capital stock to date and we currentlyintend to retain our future earnings, if any, to fund the development and growth of our business. As a result,capital appreciation, if any, of our common stock will be your sole source of gain for the foreseeable future.Furthermore, we may in the future become subject to contractual restrictions on, or prohibitions against, thepayment of dividends. Consequently, in the foreseeable future, you will likely only experience a gain from yourinvestment in our common stock if the price of our common stock increases. There is no guarantee that ourcommon stock will appreciate in value or even maintain the price at which you purchased your shares, and youmay not realize a return on your investment in our common stock.
If our internal controls over financial reporting are not considered effective, our business and stock pricecould be adversely affected.
Section 404 of the Sarbanes-Oxley Act of 2002 requires us to evaluate the effectiveness of our internalcontrols over financial reporting as of the end of each fiscal year, and to include a management report assessingthe effectiveness of our internal controls over financial reporting in our annual report on Form 10-K for thatfiscal year. Section 404 also requires our independent registered public accounting firm to attest to, and report on,management’s assessment of our internal controls over financial reporting.
Our management, including our chief executive officer and principal financial officer, does not expect thatour internal controls over financial reporting will prevent all errors and all fraud. A control system, no matterhow well designed and operated, can provide only reasonable, not absolute, assurance that the control system’sobjectives will be met. Further, the design of a control system must reflect the fact that there are resourceconstraints, and the benefits of controls must be considered relative to their costs. Because of the inherentlimitations in all control systems, no evaluation of controls can provide absolute assurance that all control issuesand instances of fraud involving a company have been, or will be, detected. The design of any system of controlsis based in part on certain assumptions about the likelihood of future events, and we cannot assure you that anydesign will succeed in achieving its stated goals under all potential future conditions. Over time, controls maybecome ineffective because of changes in conditions or deterioration in the degree of compliance with policies orprocedures. Because of the inherent limitations in a cost-effective control system, misstatements due to error orfraud may occur and not be detected. We cannot assure you that we or our independent registered publicaccounting firm will not identify a material weakness in our internal controls in the future. A material weaknessin our internal controls over financial reporting would require management and our independent registered publicaccounting firm to consider our internal controls as ineffective. If our internal controls over financial reportingare not considered effective, we may experience a loss of public confidence, which could have an adverse effecton our business and on the market price of our common stock.
If equity research analysts do not publish research or reports about our business or if they issueunfavorable commentary or downgrade our common stock, the price of our common stock could decline.
The trading market for our common stock relies in part on the research and reports that equity researchanalysts publish about us and our business. We do not control these analysts. The price of our common stockcould decline if one or more equity analysts downgrade our common stock or if analysts issue other unfavorablecommentary or cease publishing reports about us or our business.
29

We may need additional capital and may not be able to raise funds on acceptable terms, if at all. In addition,any funding through the sale of additional common stock or other equity securities could result in additionaldilution to our stockholders and any funding through indebtedness could restrict our operations.
We may require additional cash resources to finance our continued growth or other future developments,including any investments or acquisitions we may decide to pursue. The amount and timing of such additionalfinancing needs will vary principally depending on the timing of new product and service launches, investmentsand/or acquisitions, and the amount of cash flow from our operations. If our resources are insufficient to satisfy ourcash requirements, we may seek to sell additional equity or debt securities or obtain a credit facility. The sale ofadditional equity securities or securities convertible into our ordinary shares could result in additional dilution to ourstockholders. The incurrence of indebtedness would result in increased debt service obligations and could result inoperating and financing covenants that would restrict our operations.
Our ability to obtain additional capital on acceptable terms is subject to a variety of uncertainties, including:
• investors’ perception of, and demand for, securities of embedded computing systems and softwareproviders;
• conditions of the United States and other capital markets in which we may seek to raise funds; and
• our future results of operations, financial condition and cash flows.
We cannot assure that financing will be available in amounts or on terms acceptable to us, if at all. If we fail toraise additional funds, we may need to sell debt or additional equity securities or to reduce our growth to a level thatcan be supported by our cash flow. Without additional capital, we may not be able to:
• further develop or enhance our customer base;
• acquire necessary technologies, products or businesses;
• expand operations in the United States and elsewhere;
• hire, train and retain employees;
• market our software solutions, services and products; or
• respond to competitive pressures or unanticipated capital requirements.
ITEM 1B. UNRESOLVED STAFF COMMENTS
None.
ITEM 2. PROPERTIES
The following table sets forth our significant properties as of June 30, 2012:
Location Segment(s) servedSize inSq. Feet Commitment
Chelmsford, MA . . . . . . . . . . . . . . . . . . . All (Corporate HQ) 185,327 Leased, expiring 20172 buildings
Cypress, CA . . . . . . . . . . . . . . . . . . . . . . . ACS Business Unit 42,770 Leased, expiring 2014Huntsville, AL . . . . . . . . . . . . . . . . . . . . . ACS Business Unit 25,137 Leased, expiring 2014Aurora, CO . . . . . . . . . . . . . . . . . . . . . . . . MFS Business Unit 16,775 Leased, expiring 2017Salem, NH . . . . . . . . . . . . . . . . . . . . . . . . ACS Business Unit 16,290 Leased, expiring 2013Reston, VA . . . . . . . . . . . . . . . . . . . . . . . . ACS Business Unit 5,375 Leased, expiring 2017Crystal City, VA . . . . . . . . . . . . . . . . . . . . MFS Business Unit 3,931 Leased, expiring 2013Silchester, Reading, United Kingdom . . . ACS Business Unit 3,453 Leased, expiring 2015Rome, NY . . . . . . . . . . . . . . . . . . . . . . . . ACS Business Unit 3,000 Leased, expiring 2013Tokyo, Japan . . . . . . . . . . . . . . . . . . . . . . ACS Business Unit 2,401 Leased, expiring 2012
In addition, we lease a number of smaller offices around the world primarily for sales. For financialinformation regarding obligations under our leases, see Note L to the consolidated financial statements.
30

ITEM 3. LEGAL PROCEEDINGS
The U.S. Department of Justice (“DOJ”) is conducting an investigation into the conduct of certain formeremployees of PDI in the 2008-2009 time frame and has asserted that such conduct may have constituted aviolation of the Procurement Integrity Act and that civil penalties would apply to any such violations. PDI and itsparent company, KOR, have been cooperating in the investigation. While the parties have engaged in discussionsand correspondence regarding this matter, no resolution has been reached and no litigation has commenced. Weare entitled to indemnity with respect to this matter pursuant to the terms of the Merger Agreement, and based onthis indemnity and the associated escrow arrangements, the matter is not expected to have a material impact onour cash flows, results of operations, or financial condition.
In addition to the foregoing, we are subject to litigation, claims, investigations and audits arising from timeto time in the ordinary course of our business. Although legal proceedings are inherently unpredictable, webelieve that we have valid defenses with respect to those matters currently pending against us and intend todefend our self vigorously. The outcome of these matters, individually and in the aggregate, is not expected tohave a material impact on our cash flows, results of operations, or financial position.
ITEM 4. (REMOVED AND RESERVED)
ITEM 4.1. EXECUTIVE OFFICERS OF THE REGISTRANT
Our executive officers are appointed to office by the Board of Directors at the first board meeting followingthe Annual Meeting of Shareholders or at other board meetings as appropriate, and hold office until the firstboard meeting following the next Annual Meeting of Shareholders and until a successor is chosen, subject toprior death, resignation or removal. Information regarding our executive officers as of the date of filing of thisAnnual Report on Form 10-K is presented below.
Mark Aslett, age 44, joined Mercury in 2007 and has served as the President and Chief Executive Officersince that date, and served as a member of the Board since 2007. Prior to joining Mercury, he was ChiefOperating Officer and Chief Executive Officer of Enterasys Networks from 2003 to 2006, and held variouspositions with Marconi plc and its affiliated companies, including Executive Vice President of Marketing, VicePresident of Portfolio Management, and President of Marconi Communications—North America, from 1998 to2002. Mr. Aslett has also held positions at GEC Plessey Telecommunications, as well as othertelecommunications-related technology firms.
Kevin M. Bisson, age 51, joined Mercury in January 2012 as Senior Vice President, Chief Financial Officerand Treasurer. Prior to joining Mercury, Mr. Bisson had been Chief Financial Officer, Treasurer, Secretary, andSenior Vice President, Finance and Administration, at SeaChange International, Inc., a publicly-traded globalmulti-screen video software company. Mr. Bisson worked at SeaChange from March 2006 until January 2012.Prior to joining SeaChange, Mr. Bisson served from May 2003 until March 2006 as the Senior Vice Presidentand Chief Financial Officer of American Superconductor Corporation, a publicly-traded energy technologiescompany. Mr. Bisson served from 2000 to 2003 as Vice President, Controller, and Treasurer for AxcelisTechnologies, Inc., a publicly-traded semiconductor equipment manufacturing company. Prior to joining AxcelisTechnologies, Mr. Bisson served for ten years in a number of financial capacities with United TechnologiesCorporation. Mr. Bisson is a CPA licensed in Massachusetts.
Gerald M. Haines II, age 49, joined Mercury in July 2010 as Senior Vice President, CorporateDevelopment, Chief Legal Officer, and Secretary. Prior to joining Mercury, from January 2008 to June 2010,Mr. Haines was Executive Vice President, Chief Legal Officer and Secretary at Verenium Corporation, apublicly traded company engaged in the development and commercialization of cellulosic biofuels and highperformance specialty enzymes. From September 2006 to December 2007, he was an advisor to early-stagecompanies on legal and business matters. From May 2001 to August 2006, Mr. Haines served as Executive Vice
31

President of Strategic Affairs, Chief Legal Officer and Secretary of Enterasys Networks, Inc., a public networkcommunications company that was taken private in March 2006 following a successful business restructuringand turnaround. Prior to Enterasys Networks, Mr. Haines served as Senior Vice President and General Counsel ofCabletron Systems, Inc., the predecessor of Enterasys Networks. Before Cabletron, he was Vice President andGeneral Counsel of the largest manufacturer of oriented polypropylene packaging and labeling films in NorthAmerica, and prior to that was in private practice as a corporate attorney in a large Boston law firm. Mr. Hainesis admitted to practice in Massachusetts, Maine, and the Federal District of Massachusetts.
Charles A. Speicher, age 53, joined Mercury in September 2010 as Vice President, Controller, and ChiefAccounting Officer. Prior to joining Mercury, Mr. Speicher held various positions at Virtusa Corporation, apublicly-traded global IT services company, including Vice President of Global Accounting Operations andCorporate Controller from 2001 to 2009. Mr. Speicher was Corporate Controller at Cerulean Technologies Inc., aprivate software product company, from 1996 to 2000 prior to its sale to Aether Systems Inc. where he served asDivision Controller of Aether Mobile Government from 2000 to 2001. Prior to Cerulean Technology,Mr. Speicher held positions with Wyman-Gordon Company, Wang Laboratories and Arthur Andersen &Company, LLP. Mr. Speicher is a CPA licensed in Massachusetts.
Didier M.C. Thibaud, age 51, joined Mercury in 1995, and has served as President, Advanced ComputingSolutions since July 2007. Prior to that, he was Senior Vice President, Defense & Commercial Businesses from2005 to June 2007 and Vice President and General Manager, Imaging and Visualization Solutions Group, from2000 to 2005 and served in various capacities in sales and marketing from 1995 to 2000.
32
PART II
ITEM 5. MARKET FOR REGISTRANT’S COMMON EQUITY, RELATED STOCKHOLDERMATTERS AND ISSUER PURCHASES OF EQUITY SECURITIES
Our common stock is listed and traded on the Nasdaq Global Select Market under the symbol MRCY. Thefollowing table sets forth, for the fiscal periods indicated, the high and low sale prices per share for our commonstock during such periods. Such market quotations reflect inter-dealer prices without retail markup, markdown orcommission.
High Low
2012 Fourth quarter . . . . . . . . . . . . . . . . . . . . . . . . . . . . . . . . . . . . . . . . . . . . . . . . . . $13.92 $11.61Third quarter . . . . . . . . . . . . . . . . . . . . . . . . . . . . . . . . . . . . . . . . . . . . . . . . . . . $14.98 $13.01Second quarter . . . . . . . . . . . . . . . . . . . . . . . . . . . . . . . . . . . . . . . . . . . . . . . . . . $15.69 $11.35First quarter . . . . . . . . . . . . . . . . . . . . . . . . . . . . . . . . . . . . . . . . . . . . . . . . . . . . $19.27 $11.49
2011 Fourth quarter . . . . . . . . . . . . . . . . . . . . . . . . . . . . . . . . . . . . . . . . . . . . . . . . . . $21.76 $17.42Third quarter . . . . . . . . . . . . . . . . . . . . . . . . . . . . . . . . . . . . . . . . . . . . . . . . . . . $21.16 $17.84Second quarter . . . . . . . . . . . . . . . . . . . . . . . . . . . . . . . . . . . . . . . . . . . . . . . . . . $20.00 $12.37First quarter . . . . . . . . . . . . . . . . . . . . . . . . . . . . . . . . . . . . . . . . . . . . . . . . . . . . $13.31 $10.72
As of July 26, 2012, we had approximately 5,055 shareholders including record and nominee holders.
Dividend Policy
We have never declared or paid cash dividends on shares of our common stock. We currently intend toretain any earnings for future growth. Accordingly, we do not anticipate that any cash dividends will be declaredor paid on our common stock in the foreseeable future.
Net Share Settlement Plans
During fiscal 2012, we had no active net share settlement plans.
Share Repurchase Plans
During fiscal 2012, we had no active share repurchase programs.
ITEM 6. SELECTED FINANCIAL DATA
The following table summarizes certain historical consolidated financial data, restated for discontinuedoperations, which should be read in conjunction with the consolidated financial statements and related notesincluded elsewhere in this report (in thousands, except per share data):
For the Years Ended June 30,
2012 2011 2010 2009 2008
Statement of Operations Data:Net revenues . . . . . . . . . . . . . . . . . . . . . . . . . . . . . . . . . $244,929 $228,710 $199,830 $188,939 $190,208Income (loss) from operations . . . . . . . . . . . . . . . . . . . $ 30,112 $ 24,985 $ 17,313 $ 7,747 $ (5,391)Income (loss) from continuing operations . . . . . . . . . . $ 22,619 $ 18,507 $ 28,069 $ 7,909 $ (4,437)Adjusted EBITDA(1) . . . . . . . . . . . . . . . . . . . . . . . . . . $ 48,874 $ 40,883 $ 29,856 $ 22,858 $ 22,525Net earnings (loss) per share from continuingoperations:Basic . . . . . . . . . . . . . . . . . . . . . . . . . . . . . . . . . . . $ 0.77 $ 0.73 $ 1.25 $ 0.36 $ (0.21)Diluted . . . . . . . . . . . . . . . . . . . . . . . . . . . . . . . . . $ 0.75 $ 0.71 $ 1.22 $ 0.35 $ (0.21)
33

As of June 30,
2012 2011 2010 2009 2008
Balance Sheet Data:Working capital . . . . . . . . . . . . . . . . . . . . . . . . . . . . . . $170,761 $203,978 $111,249 $ 80,716 $ 6,085Total assets . . . . . . . . . . . . . . . . . . . . . . . . . . . . . . . . . . $385,606 $355,562 $224,338 $219,372 $338,550Long-term obligations . . . . . . . . . . . . . . . . . . . . . . . . . $ 15,560 $ 17,920 $ 10,621 $ 8,946 $ 12,280Total shareholders’ equity . . . . . . . . . . . . . . . . . . . . . . $333,104 $301,436 $179,112 $145,037 $146,512
(1) In our periodic communications, we discuss a key measure that is not calculated according to U.S. generallyaccepted accounting principles (“GAAP”), adjusted EBITDA. Adjusted EBITDA is defined as earningsfrom continuing operations before interest income and expense, income taxes, depreciation, amortization ofacquired intangible assets, restructuring, impairment of long-lived assets, acquisition costs and other relatedexpenses, fair value adjustments from purchase accounting and stock-based compensation costs. We useadjusted EBITDA as an important indicator of the operating performance of our business. We use adjustedEBITDA in internal forecasts and models when establishing internal operating budgets, supplementing thefinancial results and forecasts reported to our board of directors, determining a component of bonuscompensation for executive officers and other key employees based on operating performance andevaluating short-term and long-term operating trends in our operations. We believe the adjusted EBITDAfinancial measure assists in providing a more complete understanding of our underlying operationalmeasures to manage our business, to evaluate our performance compared to prior periods and themarketplace, and to establish operational goals. We believe that these non-GAAP financial adjustments areuseful to investors because they allow investors to evaluate the effectiveness of the methodology andinformation used by management in our financial and operational decision-making.
Adjusted EBITDA is a non-GAAP financial measure and should not be considered in isolation or as asubstitute for financial information provided in accordance with GAAP. This non-GAAP financial measuremay not be computed in the same manner as similarly titled measures used by other companies. We expectto continue to incur expenses similar to the adjusted EBITDA financial adjustments described above, andinvestors should not infer from our presentation of this non-GAAP financial measure that these costs areunusual, infrequent or non-recurring. See the Non-GAAP Financial Measures section of this annual reportfor a reconciliation of our adjusted EBITDA to income from continuing operations.
ITEM 7. MANAGEMENT’S DISCUSSION AND ANALYSIS OF FINANCIAL CONDITION ANDRESULTS OF OPERATIONS
FORWARD-LOOKING STATEMENTS
From time to time, information provided, statements made by our employees or information included in ourfilings with the Securities and Exchange Commission may contain statements that are not historical facts but thatare “forward-looking statements,” which involve risks and uncertainties. The words “may,” “will,” “would,”“should,” “could,” “plan,” “expect,” “believe,” “anticipate,” “continue,” “estimate,” “project,” “intend,” “likely,”“forecast,” “probable,” and similar expressions are intended to identify forward-looking statements regardingevents, conditions and financials trends that may affect our future plans of operations, business strategy, resultsof operations and financial position. These forward-looking statements, which include those related to ourstrategic plans, business outlook, and future business and financial performance, involve risks and uncertaintiesthat could cause actual results to differ materially from those projected or anticipated. Such risks anduncertainties include, but are not limited to, continued funding of defense programs and the timing of suchfunding, including the potential for a continuing resolution for the defense budget, the potential for defensebudget sequestration, and the budget uncertainty related to the Presidential election, general economic andbusiness conditions, including unforeseen economic weakness in our markets, effects of continued geo-politicalunrest and regional conflicts, competition, changes in technology and methods of marketing, delays in
34

completing various engineering and manufacturing programs, changes in customer order patterns, changes inproduct mix, continued success in technological advances and delivering technological innovations, changes inthe U.S. Government’s interpretation of federal procurement rules and regulations, market acceptance of ourproducts, shortages in components, production delays due to performance quality issues with outsourcedcomponents, inability to fully realize the expected benefits from acquisitions or divestitures or delays in realizingsuch benefits, challenges in integrating acquired businesses and achieving anticipated synergies, changes toexport regulations, increases in tax rates, changes to generally accepted accounting principles, difficulties inretaining key employees and customers, unanticipated costs under fixed-price service and system integrationengagements, and various other factors beyond our control. These risks and uncertainties also include suchadditional risk factors as set forth under Part I-Item 1A (Risk Factors) in this Annual Report on Form 10-K. Wecaution readers not to place undue reliance upon any such forward-looking statements, which speak only as ofthe date made. We undertake no obligation to update any forward-looking statement to reflect events orcircumstances after the date on which such statement is made.
OVERVIEW
We design, manufacture and market commercially-developed, high-performance embedded, real-timedigital signal and image processing sub-systems and software for specialized defense and commercial markets.Our solutions play a critical role in a wide range of applications, processing and transforming sensor data toinformation for storage, analysis and interpretation. Our goal is to grow and build on our position as a criticalcomponent of the defense and intelligence industrial base and be the leading provider of open and affordablesensor processing subsystems for intelligence, surveillance and reconnaissance (“ISR”), electronic warfare(“EW”), and missile defense applications. In military reconnaissance and surveillance platforms, our sub-systemsreceive, process, and store real-time radar, video, sonar and signals intelligence data. We provide radio frequency(“RF”) and microwave products for enhanced signal acquisition and communications in military and commercialapplications. Additionally, Mercury Federal Systems, our wholly owned subsidiary, focuses on direct andindirect contracts supporting the defense, intelligence, and homeland security agencies. We have growingcapabilities in the area of “Big Data” processing, analytics and analysis in support of both the U.S. Department ofDefense (“DoD”) and to the intelligence community as they enhance their ability to acquire, process and exploitlarge amounts of data for both real-time analytics and “forensic” analysis.
Our products and solutions address mission-critical requirements within the defense industry for C4ISR(command, control, communications, computers, intelligence, surveillance and reconnaissance) and electronicwarfare, systems and services, and target several markets including maritime defense, airborne reconnaissance,ballistic missile defense, ground mobile and force protection systems and tactical communications and networksystems. Our products or solutions have been deployed in more than 300 different programs with over 25different prime defense contractors. We deliver commercially developed technology and solutions that are basedon open system architectures and widely adopted industry standards, and support all of this with services andsupport capabilities.
Our revenue, income from continuing operations and adjusted EBITDA for fiscal 2012 were $244.9 million,$22.6 million and $48.9 million, respectively. See the Non-GAAP Financial Measures section this annual reportfor a reconciliation of our adjusted EBITDA to income from continuing operations.
Our operations are presently organized in the following two business segments:
Advanced Computing Solutions, or ACS. This business segment is focused on specialized, high-performanceembedded, real-time digital signal and image processing solutions that encompass signal acquisition, includingmicrowave front-end, digitization, digital signal processing, exploitation processing, high capacity digital storageand communications, targeted to key market segments, including defense, communications and other commercialapplications. ACS’s open system architecture solutions span the full range of embedded technologies from boardlevel products to fully integrated sub-systems. Our products utilize leading-edge processor and other technologies
35

architected to address highly data-intensive applications that include signal, sensor and image processing withinenvironmentally challenging and size, weight and power constrained military and commercial applications. Inaddition, ACS has a portfolio of RF and microwave sub-assemblies to address needs in EW, signal intelligence(“SIGINT”), electronic intelligence (“ELINT”), and high bandwidth communications subsystems.
These products are highly optimized for size, weight and power, as well as for the performance andruggedization requirements of our customers. Customized design and sub-systems integration services extend ourcapabilities to tailor solutions to meet the specialized requirements of our customers. We continue to innovateour technologies around challenging requirements and have technologies available today and planned for thefuture to address them as they evolve and become increasingly demanding.
With the addition of KOR Electronics (“KOR”) in December 2011, we added a focus on the exploitation ofRF signals. Leveraging our analog-to-digital and digital-to-analog technologies and expertise, KOR deliversinnovative high end solutions and services to the defense communities:
• DRFM (Digital Radio Frequency Memory) products which offer state of the art performance at lowcost, for EW applications; and
• radar and EW environment test and simulator products that are DRFM based and use modular andscalable building blocks including commercial-off-the-shelf hardware.
In fiscal 2012, ACS accounted for 88% of our total net revenues.
Mercury Federal Systems, or MFS. This business segment is focused on services and support work with theDoD and federal intelligence and homeland security agencies, including designing, engineering, and deployingnew ISR capabilities to address present and emerging threats to U.S. forces. With the addition of ParagonDynamics, Inc. (“PDI”), our MFS segment also provides sophisticated analysis and exploitation, multi-sensordata fusion and enrichment, and data processing services for the U.S. intelligence community. MFS is part of ourlong-term strategy to expand our software and services presence and pursue growth within the intelligencecommunity. MFS offers a wide range of engineering architecture and design services that enable clients todeploy leading edge computing capabilities for ISR applications on an accelerated time cycle. This businesssegment enables us to combine classified intellectual property with the commercially developed application-ready sub-systems being developed by ACS, providing customers with platform-ready, affordable ISRsub-systems. In fiscal 2012, MFS accounted for 12% of our total net revenues, which include six months of PDIrevenues of $7.9 million.
Since we are an OEM supplier to our commercial markets and conduct business with our defense customersvia commercial items, requests by customers are a primary driver of revenue fluctuations from quarter to quarter.Customers specify delivery date requirements that coincide with their need for our products. Because thesecustomers may use our products in connection with a variety of defense programs or other projects of differentsizes and durations, a customer’s orders for one quarter generally do not indicate a trend for future orders by thatcustomer. Additionally, order patterns do not necessarily correlate amongst customers and, therefore, wegenerally cannot identify sequential quarterly trends, even within our business units.
BUSINESS DEVELOPMENTS:
On June 8, 2012, we and Wildcat Merger Sub Inc., our newly formed, wholly-owned subsidiary (the“Merger Sub”), entered into an Agreement and Plan of Merger (the “Merger Agreement”) with Micronetics, Inc.(“Micronetics”). On August 8, 2012, the transaction closed with the Merger Sub merging with and intoMicronetics with Micronetics continuing as the surviving company and our wholly-owned subsidiary.
Headquartered in Hudson, NH, Micronetics is a leading designer and manufacturer of microwave and radiofrequency (RF) subsystems and components for defense and commercial customers.
36

Pursuant to the terms of the Merger Agreement, at the closing of the merger on August 8, 2012, each shareof common stock of Micronetics issued and outstanding immediately prior to the closing was converted into theright to receive $14.80 in cash, without interest (the “Merger Consideration”). All outstanding options to acquireshares of Micronetics common stock that were vested as of the closing were cancelled and the holders of suchoptions are entitled to receive an amount of cash equal to the product of the total number of shares previouslysubject to such vested options and the excess of the Merger Consideration over the exercise price per share. Alloutstanding Micronetics stock options that were unvested at the closing were assumed by us. We funded theacquisition with cash on hand.
FISCAL 2012
On December 30, 2011, we acquired both KOR and its wholly-owned subsidiary, PDI. Based in Cypress,California, KOR designs and develops DRFM units for a variety of modern EW applications, as well as radarenvironment simulation and test systems for defense applications. Based in Aurora, Colorado, PDI providessophisticated analytic exploitation services and customized multi-intelligence data fusion solutions for the U.S.intelligence community. For segment reporting, KOR is included in the ACS operating segment and PDI isincluded in the MFS operating segment.
The amounts of revenue, income from continuing operations and adjusted EBITDA of KOR and PDIincluded in our consolidated statements of operations for fiscal 2012 was $19.8 million, $2.7 million, and $3.8million, respectively.
In fiscal 2012, we concluded the financial targets which underlie the $5.0 million earn-out related to theLNX acquisition would not be achieved. During the fourth quarter of fiscal 2012, we did not receive a purchaseorder for long lead-time materials. This timing issue, in itself, triggered a reversal of the earn-out (see Note C tothe consolidated financial statements). This reversal of the earn-out was recorded as an offset to operatingexpenses.
In fiscal 2012, we announced a restructuring plan (“2012 Plan”) affecting both the ACS and MFS businesssegments. The 2012 Plan primarily consisted of involuntary separation costs related to the reduction in forcewhich eliminated 41 positions largely in engineering and manufacturing functions; and facility costs related tooutsourcing of certain manufacturing activities at our Huntsville, Alabama site. The 2012 Plan for which expenseof $2.8 million was recorded in fiscal 2012 was implemented to cope with the near term uncertainties in thedefense industry and improve our overall business scalability. Future restructuring expenses of approximately$0.7 million associated with the 2012 Plan are expected in fiscal 2013 as we start transitioning the manufacturingactivities formerly conducted at the Huntsville, Alabama facility to our contract manufacturing partner. Weexpect to realize approximately $5.3 million in annual savings from these activities.
FISCAL 2011
On January 12, 2011, we acquired the outstanding equity interests in LNX Corporation. The cash purchaseprice for the acquisition was approximately $31.0 million, subject to post-closing adjustments. We funded thepurchase price with cash on hand and assumed no debt. In addition to the $31.0 million cash purchase price, wealso committed to pay up to $5.0 million upon the achievement of financial targets in calendar years 2011 and2012. During the fourth quarter of fiscal 2012, we concluded the financial targets which underlie the $5.0 millionpayment of contingent consideration relating to the acquisition of LNX would not be met.
On February 16, 2011, we completed a follow-on public stock offering of 5,577,500 shares of commonstock, which were sold at a price to the public of $17.75. The follow-on public stock offering resulted in $93.6million of net proceeds to us. The underwriting discount of $5.0 million and other expenses of $0.4 millionrelated to the follow-on public stock offering were recorded as an offset to additional paid-in-capital (see Note Mto the consolidated financial statements).
37

FISCAL 2010
On June 28, 2010, we repaid the remaining $11.3 million principal balance on our line of credit with UBS.As of June 30, 2010, there were no borrowings against this line of credit.
On July 1, 2009, we had $50.1 million par value of auction rate securities (“ARS”). During fiscal 2010,UBS called $32.1 million of our ARS at par, reducing our balance on June 30, 2010 to $18.0 million. On June 30,2010, we exercised our right to sell the remaining $18.0 million ARS balance to UBS at par value. Thetransaction settled on July 1, 2010 when we received $18.0 million in cash.
RESULTS OF OPERATIONS:
FISCAL 2012 VS. FISCAL 2011
The following tables set forth, for the periods indicated, financial data from the consolidated statement ofoperations:
(In thousands) Fiscal 2012
As a % ofTotal NetRevenue Fiscal 2011
As a % ofTotal NetRevenue
Net revenues . . . . . . . . . . . . . . . . . . . . . . . . . . . . . . . . . . . . . . . . . . . $244,929 100.0% $228,710 100.0%Cost of revenues . . . . . . . . . . . . . . . . . . . . . . . . . . . . . . . . . . . . . . . . 108,773 44.4 98,811 43.2
Gross margin . . . . . . . . . . . . . . . . . . . . . . . . . . . . . . . . . . . . . . . 136,156 55.6 129,899 56.8Operating expenses:
Selling, general and administrative . . . . . . . . . . . . . . . . . . . . . . 57,159 23.3 57,868 25.3Research and development . . . . . . . . . . . . . . . . . . . . . . . . . . . . 45,984 18.8 44,500 19.4Amortization of acquired intangible assets . . . . . . . . . . . . . . . . 3,799 1.6 1,984 0.9Restructuring and other charges . . . . . . . . . . . . . . . . . . . . . . . . 2,821 1.1 — —Impairment of long-lived assets . . . . . . . . . . . . . . . . . . . . . . . . — — 150 0.1Acquisition costs and other related expenses . . . . . . . . . . . . . . 1,219 0.5 412 0.2Change in the fair value of the liability related to the LNXearn-out . . . . . . . . . . . . . . . . . . . . . . . . . . . . . . . . . . . . . . . . . (4,938) (2.0) — —
Total operating expenses . . . . . . . . . . . . . . . . . . . . . . . . . . 106,044 43.3 104,914 45.9
Income from operations . . . . . . . . . . . . . . . . . . . . . . . . . . . . . . . . . . . 30,112 12.3 24,985 10.9Other income, net . . . . . . . . . . . . . . . . . . . . . . . . . . . . . . . . . . . . . . . 1,659 0.7 1,582 0.7
Income from continuing operations before income taxes . . . . . . . . . 31,771 13.0 26,567 11.6Income taxes . . . . . . . . . . . . . . . . . . . . . . . . . . . . . . . . . . . . . . . . . . . 9,152 3.8 8,060 3.5
Income from continuing operations . . . . . . . . . . . . . . . . . . . . . . . . . . 22,619 9.2 18,507 8.1Loss from discontinued operations, net of income taxes . . . . . . . . . — — (65) —
Net income . . . . . . . . . . . . . . . . . . . . . . . . . . . . . . . . . . . . . . . . . . . . . $ 22,619 9.2% $ 18,442 8.1%
REVENUES
(In thousands)Fiscal2012
As a % ofTotal NetRevenue
Fiscal2011
As a % ofTotal NetRevenue $ Change % Change
ACS . . . . . . . . . . . . . . . . . . . . . . . . . . . . . . . . $215,899 88% $217,423 95% $ (1,524) (1%)MFS . . . . . . . . . . . . . . . . . . . . . . . . . . . . . . . . 28,670 12% 11,415 5% 17,255 151%Eliminations . . . . . . . . . . . . . . . . . . . . . . . . . . 360 — (128) — 488 381%
Total revenues . . . . . . . . . . . . . . . . . . . . . . . . $244,929 100% $228,710 100% $16,219 7%
38

Total revenues increased $16.2 million, or 7%, to $244.9 million during fiscal 2012 compared to $228.7million during fiscal 2011.
Net ACS revenues decreased $1.5 million, or 1%, during fiscal 2012 compared to fiscal 2011. The decreasein net ACS revenues was primarily due to lower commercial revenues of $33.3 million, partially offset by higherdefense revenues of $31.8 million, including revenues contributed by KOR. Defense revenue accounted for 93%of net ACS revenues during fiscal 2012 compared to 78% in fiscal 2011.
Net MFS revenues increased $17.3 million, or 151%, during fiscal 2012 compared to fiscal 2011. Thisincrease was driven by revenues from a wide area persistent surveillance program and revenue contributed byPDI.
International revenues increased slightly by $0.3 million to $9.6 million during fiscal 2012 compared to $9.3million during fiscal 2011. The increase was primarily driven by higher defense revenues in the European region,partially offset by lower commercial revenue from the Asia Pacific region. International revenues represented 4%of total revenues during fiscal 2012 and 2011.
Eliminations revenue is attributable to development programs where the revenue is recognized in bothsegments under contract accounting, and reflects the reconciliation to our consolidated results.
GROSS MARGIN
Gross margin was 55.6% for fiscal 2012, a decrease of 120 basis points from the 56.8% gross marginachieved in fiscal 2011. The decrease in gross margin was driven by product mix and the inclusion of KOR andPDI revenues. KOR and PDI are service based business models which typically carry lower margins than productbased models.
SELLING, GENERAL AND ADMINISTRATIVE
Selling, general and administrative expenses decreased 1.2%, or $0.7 million, to $57.2 million during fiscal2012 compared to $57.9 million during fiscal 2011. The overall decrease was primarily due to lower variablecompensation expense partially offset by headcount related expenses as a result of the KOR and LNXacquisitions. Selling, general and administrative expenses decreased as a percentage of revenues to 23.3% duringfiscal 2012 from 25.3% during fiscal 2011 due to higher revenue and increased operating leverage.
RESEARCH AND DEVELOPMENT
Research and development expenses increased 3%, or $1.5 million, to $46.0 million during fiscal 2012compared to $44.5 million for fiscal 2011. The increase was primarily due to a $2.0 million increase inheadcount related expenses as a result of the KOR and LNX acquisitions, a $0.9 million increase in allocated ITand depreciation expenses and a $0.5 million increase in prototype and development expenses. These increaseswere partially offset by $2.8 million in higher customer funded credits. Research and development continues tobe a focus of our business with 18.8% and 19.4% of our revenues dedicated to research and developmentactivities during fiscal 2012 and fiscal 2011, respectively. However, we continue to focus on improving theleverage of our research and development investments and increased customer funded development resulting inthis percentage trending downward in future years.
AMORTIZATION OF ACQUIRED INTANGIBLE ASSETS
Amortization of acquired intangible assets increased $1.8 million to $3.8 million during fiscal 2012compared to $2.0 million for fiscal 2011, primarily due to amortization of intangible assets from the KOR andPDI acquisition completed in December 2011 and the LNX acquisition completed in January 2011.
39

RESTRUCTURING EXPENSE
There was $2.8 million of restructuring expense recorded in fiscal 2012 as compared to no expense in fiscal2011. The restructuring plan implemented in 2012 primarily consisted of involuntary separation costs related tothe reduction in force which eliminated 41 positions largely in engineering and manufacturing functions; andfacility costs related to outsourcing of certain manufacturing activities at our Huntsville, Alabama site. We willincur additional expenses of approximately $0.7 million associated with this plan in fiscal 2013. We expect torealize approximately $5.3 million in annual savings from these activities.
IMPAIRMENT OF LONG-LIVED ASSETS
No impairment charges were recorded during fiscal 2012 compared to $0.2 million in fiscal 2011. The fiscal2011 charge represents the impairment of the fair value of the shares we received as compensation in the sale ofour former Biotech business. There were no impairment charges for goodwill in either fiscal 2012 or 2011.
ACQUISITION COSTS AND OTHER RELATED EXPENSES
We incurred $1.2 million of acquisition costs and other related expenses during fiscal 2012, in connectionwith the acquisitions of Micronetics, KOR and PDI, as compared to $0.4 million during fiscal 2011, inconnection with the LNX acquisition.
INTEREST INCOME
Interest income for fiscal years 2012 and 2011 were minimal due to the near zero percent yield on our U.S.treasury bills and money market accounts.
INTEREST EXPENSE
We incurred a minimal amount of interest expense for fiscal 2012 and 2011, which primarily consisted offinance charges related to capital lease obligations.
OTHER INCOME
Other income increased $0.1 million to $1.7 million during fiscal 2012 compared to fiscal 2011. Otherincome primarily consists of $1.2 million in amortization of the gain on the sale leaseback of our corporateheadquarters located in Chelmsford, Massachusetts and foreign currency exchange gains and losses.
INCOME TAXES
We recorded a provision for income taxes of $9.2 million in fiscal 2012 compared to $8.1 million in fiscal2011. The effective tax rate for fiscal 2012 and fiscal 2011 was 28.8% and 30.3%, respectively. The difference inthe rates is mainly driven by the change in the fair value of the liability related to the LNX earn-out of$4.9 million offset by $1.2 million of acquisition costs, both of which are not subject to tax. This decrease in thefiscal 2012 rate was partially offset by a higher tax provision as a result of having a full-year benefit for thefederal research and development tax credit in fiscal 2011 compared to only a six-month benefit in fiscal 2012.Our effective tax rate for fiscal 2012 differed from the federal statutory rate primarily due to the change in thefair value of the liability related to the LNX earn-out, the impact of research and development tax credits, theimpact of the Section 199 Manufacturing Deduction and acquisition costs,.
SEGMENT OPERATING RESULTS
Adjusted EBITDA for the ACS segment increased $1.5 million to $43.8 million during fiscal 2012, ascompared to $42.3 million during fiscal 2011. The increase in adjusted EBITDA was mostly driven by higherrevenues. ACS generated $228.1 million in revenues including intersegment revenues in fiscal 2012 compared to$223.7 million in fiscal 2011. This improvement was partially offset by an increase in operating expenses as aresult of the KOR and LNX acquisitions. Overall, operating expenses declined as a percent of revenue.
40

Adjusted EBITDA for the MFS segment increased by $5.8 million during fiscal 2012 to $4.9 million, ascompared to a loss of $0.9 million in fiscal 2011. The increase in adjusted EBITDA was primarily due to higherrevenues from a wide area persistent surveillance contract and revenues contributed by PDI.
See Note O to our consolidated financial statements for more information regarding our operating segments.
FISCAL 2011 VS. FISCAL 2010
The following tables set forth, for the periods indicated, financial data from the consolidated statement ofoperations:
(In thousands) Fiscal 2011
As a % ofTotal NetRevenue Fiscal 2010
As a % ofTotal NetRevenue
Net revenues . . . . . . . . . . . . . . . . . . . . . . . . . . . . . . . . . . . . . . . . . . . . $228,710 100.0% $199,830 100.0%Cost of revenues . . . . . . . . . . . . . . . . . . . . . . . . . . . . . . . . . . . . . . . . . 98,811 43.2 87,298 43.7
Gross margin . . . . . . . . . . . . . . . . . . . . . . . . . . . . . . . . . . . . . . . 129,899 56.8 112,532 56.3Operating expenses:
Selling, general and administrative . . . . . . . . . . . . . . . . . . . . . . 57,868 25.3 51,519 25.7Research and development . . . . . . . . . . . . . . . . . . . . . . . . . . . . . 44,500 19.4 41,548 20.8Amortization of acquired intangible assets . . . . . . . . . . . . . . . . 1,984 0.9 1,710 0.9Impairment of long-lived assets . . . . . . . . . . . . . . . . . . . . . . . . . 150 0.1 211 0.1Restructuring and other charges . . . . . . . . . . . . . . . . . . . . . . . . . — — 231 0.1Acquisition costs and other related expenses . . . . . . . . . . . . . . . 412 0.2 — —
Total operating expenses . . . . . . . . . . . . . . . . . . . . . . . . . . 104,914 45.9 95,219 47.6
Income from operations . . . . . . . . . . . . . . . . . . . . . . . . . . . . . . . . . . . 24,985 10.9 17,313 8.7Other income, net . . . . . . . . . . . . . . . . . . . . . . . . . . . . . . . . . . . . . . . . 1,582 0.7 1,379 0.7
Income from continuing operations before income taxes . . . . . . . . . 26,567 11.6 18,692 9.4Income taxes (benefit) . . . . . . . . . . . . . . . . . . . . . . . . . . . . . . . . . . . . 8,060 3.5 (9,377) (4.7)
Income from continuing operations . . . . . . . . . . . . . . . . . . . . . . . . . . 18,507 8.1 28,069 14.1(Loss) income from discontinued operations, net of incometaxes . . . . . . . . . . . . . . . . . . . . . . . . . . . . . . . . . . . . . . . . . . . . . . . . (65) — 289 0.1
Net income . . . . . . . . . . . . . . . . . . . . . . . . . . . . . . . . . . . . . . . . . . . . . $ 18,442 8.1% $ 28,358 14.2%
REVENUES
(In thousands)Fiscal2011
As a % ofTotal NetRevenue
Fiscal2010
As a % ofTotal NetRevenue $ Change % Change
ACS . . . . . . . . . . . . . . . . . . . . . . . . . . . . . . . . . $217,423 95% $188,967 95% $28,456 15%MFS . . . . . . . . . . . . . . . . . . . . . . . . . . . . . . . . . 11,415 5% 10,735 5% 680 6%Eliminations . . . . . . . . . . . . . . . . . . . . . . . . . . (128) — 128 — (256) (200%)
Total revenues . . . . . . . . . . . . . . . . . . . . . . . . . $228,710 100% $199,830 100% $28,880 14%
Total revenues increased $28.9 million, or 14%, to $228.7 million during fiscal 2011 compared to fiscal2010.
Net ACS revenues increased $28.5 million, or 15%, to $217.4 million during fiscal 2011 compared to fiscal2010. Revenue from sales to defense customers increased $21.1 million, from $146.6 million in fiscal 2010 to$167.7 million in fiscal 2011. This growth was mostly driven by an increase in the radar market, slightly offset
41

by a decline in service revenues from $24.4 million to $12.9 million. Revenue from sales to commercialcustomers increased $7.2 million, from $42.4 million in fiscal 2010 to $49.6 million in fiscal 2011. This growthwas mostly driven by an increase in the semiconductor market driven by end of life buys, slightly offset by adecrease in sales in the commercial communications market.
Net MFS revenues increased $0.7 million, or 6% to $11.4 million, during fiscal 2011 as compared to fiscal2010. This increase in revenue was primarily driven by an increase of $0.9 million in revenue relating to apersistent ISR development program. This increase was slightly offset by the year over year completion of otherdevelopment programs.
International revenues decreased by $10.4 million to $9.3 million during fiscal 2011 as compared to$19.7 million in fiscal 2010. The decrease in international revenues during fiscal 2011 was primarily driven byboth the sales to a commercial customer in the European region during the 2010 period whose sales wereserviced by the U.K. operations during the 2010 period versus our U.S. operations during the 2011 period, andreduced sales to a commercial customer in the Asia Pacific region during 2011.
Eliminations revenue is attributable to development programs where the revenue is recognized in bothsegments under contract accounting, and reflects the reconciliation to our consolidated results.
GROSS MARGIN
Gross margin was 56.8% for fiscal 2011, an increase of 50 basis points from the 56.3% gross marginachieved in fiscal 2010. The increase in gross margin was primarily due to a favorable shift in product mix fromlower margin professional service revenues to higher margin product sales.
SELLING, GENERAL AND ADMINISTRATIVE
Selling, general and administrative expenses increased 12.4%, or $6.4 million, to $57.9 million during fiscal2011 compared to $51.5 million during fiscal 2010. The increase was primarily due to a $5.8 million increase inemployee compensation expense driven by an increase in headcount, primarily related to the LNX acquisition,and variable compensation increases. Selling, general and administrative expenses decreased as a percentage ofrevenues to 25.3% during fiscal 2011 from 25.7% during fiscal 2010. We realized improved operating leverageby maintaining our selling, general and administrative expenses growth below our revenue growth rate as ourbusiness scaled.
RESEARCH AND DEVELOPMENT
Research and development expenses increased 7%, or $3.0 million, to $44.5 million during fiscal 2011compared to $41.5 million for fiscal 2010. The increase was primarily due to a $3.0 million increase in employeecompensation expense driven by increased variable compensation. Research and development expenses represent19.4% and 20.8% of our revenues during fiscal 2011 and fiscal 2010, respectively.
AMORTIZATION OF ACQUIRED INTANGIBLE ASSETS
Amortization of acquired intangible assets increased 18% or $0.3 million to $2.0 million during fiscal 2011compared to $1.7 million for fiscal 2010, primarily due to amortization of intangible assets from the LNXacquisition completed during the third quarter of fiscal 2011.
IMPAIRMENT OF LONG-LIVED ASSETS
We recorded $0.2 million in impairment charges during fiscal 2011 compared to $0.2 million in impairmentcharges recorded in fiscal 2010. The fiscal 2011 charge and $0.1 million of the fiscal 2010 charge represent theimpairment of the fair value of the shares we received as compensation in the sale of our former Biotechbusiness. The additional fiscal 2010 charge of $0.1 million was the result of impairment of the remaining valueof a terminated license agreement.
42

RESTRUCTURING EXPENSE
There was no restructuring expense recorded in fiscal 2011 as compared to $0.2 million in fiscal 2010.Restructuring activities during fiscal 2010 were primarily due to the elimination of four positions under ourrestructuring plan within the ACS business unit which was enacted in July 2009, following the completion of thedivestitures of our non-core businesses as part of the refocusing of our business operations.
ACQUISITION COSTS AND OTHER RELATED EXPENSES
We incurred $0.4 million of acquisition costs and other related expenses during fiscal 2011, which consistedof transaction costs incurred in connection with the acquisition of LNX Corporation, which was completed onJanuary 12, 2011.
INTEREST INCOME
Interest income for fiscal 2011 decreased by $0.5 million to nil compared to fiscal 2010. Our marketablesecurities held during fiscal 2010 yielded higher interest rates than the money market funds and short-termgovernment securities in which our cash was primarily invested during fiscal 2011. We held no marketablesecurities during fiscal 2011.
INTEREST EXPENSE
Interest expense for fiscal 2011 decreased by $0.3 million to $0.1 million compared to the same period infiscal 2010. The decrease was the result of the repayment of our borrowings against our ARS at the end of fiscal2010. We did not have any debt during fiscal 2011, other than capital lease obligations.
OTHER INCOME, NET
Other income, net for fiscal 2011 increased by $0.4 million to $1.6 million compared to $1.2 million infiscal 2010. Other income, net primarily consisted of $1.2 million in amortization of the gain on the saleleaseback of our corporate headquarters located in Chelmsford, Massachusetts and foreign currency exchangegains and losses. The $0.4 million increase is primarily associated with a $0.4 million foreign currency exchangegain during fiscal 2011 as compared to a $0.2 million foreign currency exchange loss for fiscal 2010. The foreigncurrency exchange gain was largely driven by strengthening of the British pound and the Japanese yen againstthe U.S. dollar.
INCOME TAXES (BENEFIT)
We recorded a provision for income taxes of $8.1 million in fiscal 2011 reflecting a 30.3% effective taxrate, as compared to a (50.2)% effective tax rate for fiscal 2010. Our provision for income taxes for fiscal year2011 differed from the federal statutory tax rate of 35% primarily due to the impact of research and developmenttax credits, the impact of a domestic manufacturing deduction, and favorable discrete items. Our provision forincome taxes for fiscal year 2010 differed from the federal statutory rate primarily due to the release of a portionof our valuation allowance on U.S. deferred tax assets, and several favorable discrete items which included abenefit from our 2009 tax return filing concerning our ability to utilize certain net operating losses, a decrease inour valuation allowance for uncertain tax positions and a decrease due to the favorable settlement of audit issuesregarding certain of our 2006 through 2008 U.S. tax return filings.
DISCONTINUED OPERATIONS
In accordance with FASB ASC 360, VSG, VI and Biotech have been reflected as discontinued operationsfor fiscal 2011 and 2010. Accordingly, the revenue, costs, expenses of VSG, VI and Biotech have been reportedseparately in the consolidated statements of operations for all periods presented.
43

We incurred a loss from discontinued operations of $0.1 million during fiscal 2011 compared to incomefrom discontinued operations of $0.2 million in fiscal 2010.
SEGMENT OPERATING RESULTS
Adjusted EBITDA for ACS increased $11.8 million to $42.3 million during fiscal 2011, as compared to$30.5 million during fiscal 2010. The increase in adjusted EBITDA was primarily due to increased revenues of$28.5 million, which drove an improvement in gross margin dollars. This improvement was partially offset byincreases in operating expenses necessary to grow the business. However, operating expenses declined as apercent of revenue as we continued to improve our operating leverage.
Adjusted EBITDA for MFS decreased by $0.3 million during fiscal 2011 to a loss of $0.9 million, ascompared to a loss of $0.6 million in fiscal 2010. The increased loss was primarily driven by increased operatingexpenses related to additional headcount, partially offset by an increase in revenues from a persistent ISRdevelopment program.
See Note O to our consolidated financial statements for more information regarding our operating segments.
LIQUIDITY AND CAPITAL RESOURCES
During fiscal 2012, our primary source of liquidity came from existing cash and cash generated fromoperations. Our near-term fixed commitments for cash expenditures consist primarily of payment for theMicronetics acquisition, payments under operating leases, and inventory purchase commitments with ourcontract manufacturers. We do not currently have any material commitments for capital expenditures.
Shelf Registration Statement
On August 2, 2011, we filed a shelf registration statement on Form S-3 with the SEC. The shelf registrationstatement, which has been declared effective by the SEC, registered up to $500 million of debt securities,preferred stock, common stock, warrants and units. We intend to use the proceeds from a financing using theshelf registration statement for general corporate purposes, which may include the following:
• the acquisition of other companies or businesses;
• the repayment and refinancing of debt;
• capital expenditures;
• working capital; and
• other purposes as described in the prospectus supplement.
Follow-On Public Stock Offering
On February 16, 2011, we completed a follow-on public stock offering of 5,577,500 shares of commonstock, which were sold at a price to the public of $17.75. The follow-on public stock offering resulted in$93.6 million of net proceeds to us. The underwriting discount of $5.0 million and other expenses of $0.4 millionrelated to the follow-on public stock offering were recorded as an offset to additional paid-in-capital.
The February 2011 follow-on public stock offering generated gross proceeds (i.e. proceeds beforeunderwriting fees) of $99 million out of the $100 million available under our then existing shelf registrationstatement.
44
Senior Secured Credit Facility
Original Loan Agreement
On February 12, 2010, we entered into a loan and security agreement (the “Loan Agreement”) with SiliconValley Bank (the “Lender”). The Loan Agreement provided for a $15.0 million revolving line of credit (the“Revolver”) and a $20.0 million acquisition line (the “Term Loan”). The Revolver was available for borrowingduring a two-year period, with interest payable monthly and the principal due at the February 11, 2012 maturityof the Revolver. The Term Loan was available for up to three separate borrowings, with total borrowings not toexceed $20.0 million, until February 11, 2012. The Term Loan had monthly interest and principal paymentsthrough the February 11, 2014 maturity of the Term Loan.
The interest rates include various rate options that are available to us. The rates are calculated using acombination of conventional base rate measures plus a margin over those rates. The base rates consist of LIBORrates and prime rates. The actual rates will depend on the level of these underlying rates plus a margin based onour leverage at the time of borrowing.
Borrowings are secured by a first-priority security interest in all of our domestic assets, includingintellectual property, but limited to 65% of the voting stock of foreign subsidiaries. Our MFS subsidiary is aguarantor and has granted a security interest in its assets in favor of the Lender. Following the acquisition ofLNX Corporation and KOR Electronics, LNX also became guarantor. The Lender may require MercuryComputer Systems Limited, our United Kingdom subsidiary, or Nihon Mercury Computer Systems, K.K., ourJapanese subsidiary, to provide guarantees in the future if the cash or assets of such subsidiary exceed specifiedlevels.
The Loan Agreement provided for conventional affirmative and negative covenants, including a minimumquick ratio of 1.5 to 1.0. If we had less than $10.0 million of cash equivalents in accounts with the Lender inexcess of our borrowings, we must also satisfy a $15.0 million minimum trailing-four-quarter cash-flowcovenant. The minimum cash flow covenant is calculated as our trailing-four quarter adjusted EBITDA asdefined in the Loan Agreement. In addition, the Loan Agreement contains certain customary representations andwarranties and limits our and our subsidiaries’ ability to incur liens, dispose of assets, carry out certain mergersand acquisitions, make investments and capital expenditures and defines events of default and limitations on usand our subsidiaries to incur additional debt.
Amended Loan Agreement
On March 30, 2011, we entered into an amendment to the Loan Agreement (as amended, the “AmendedLoan Agreement”) with the Lender. We amended the Loan Agreement in order to extend the term during whichwe may borrow, to make the entire $35 million available for revolving credit, and to obtain more favorablefinancial covenants and relax mergers and acquisition restrictions. The amendment extended the term of theRevolver for an additional two years, to February 11, 2014, terminated the $20.0 million Term Loan under theoriginal Loan Agreement, and increased the original $15.0 million Revolver to $35.0 million. The amendmentalso included modifications to the financial covenants as summarized below.
The Amended Loan Agreement provides for conventional affirmative and negative covenants, including aminimum quick ratio of 1.0 to 1.0 and a $15.0 million minimum trailing four quarter cash flow covenant throughand including June 30, 2012 (with $17.5 million of minimum cash flow required thereafter).
There are no other changes to the Loan Agreement other than the modification described above.
Following the acquisition of KOR Electronics, both KOR and PDI became guarantors.
We have had no borrowings under the credit facility since inception and were in compliance with allcovenants in the Amended Loan Agreement as of June 30, 2012.
45

Based on our current plans and business conditions, we believe that existing cash, cash equivalents,available line of credit with Silicon Valley Bank, cash generated from operations, and financing capabilities willbe sufficient to satisfy our anticipated cash requirements for at least the next twelve months.
CASH FLOWS
(In thousands)As of and for the fiscal year ended
June 30,2012
June 30,2011
June 30,2010
Net cash provided by operating activities . . . . . . . . . . . . . . . . . . . . . . . . . . . . . . $ 31,869 $ 31,474 $ 15,708Net cash (used in) provided by investing activities . . . . . . . . . . . . . . . . . . . . . . $ (80,802) $ (22,683) $ 23,615Net cash provided by (used in) financing activities . . . . . . . . . . . . . . . . . . . . . . $ 1,975 $ 97,800 $(30,594)Net (decrease) increase in cash and cash equivalents . . . . . . . . . . . . . . . . . . . . . $ (46,911) $106,634 $ 9,291Cash and cash equivalents at end of year . . . . . . . . . . . . . . . . . . . . . . . . . . . . . . $115,964 $162,875 $ 56,241
Our cash and cash equivalents decreased by $46.9 million during fiscal 2012 primarily as a result of the$71.0 million payment, net of cash acquired, for the KOR acquisition, $9.4 million in capital expenditures, and a$0.5 million payment for other financing and investing activities, partially offset by $31.9 million generated byoperating activities and $2.2 million generated from stock related activities.
Operating Activities
During fiscal 2012, we generated $31.9 million in cash from operations, an increase of $0.4 million whencompared to $31.5 million generated in fiscal 2011. The increase was primarily due to the $1.2 million netchange in net working capital, partially offset by $0.8 million lower comparative net income excluding thechange in the fair value of the liability related to the LNX earn-out. Our ability to generate cash from operationsin future periods will depend in large part on profitability, the rate of collection of accounts receivable, ourinventory turns and our ability to manage other areas of working capital.
During fiscal 2011, we generated $31.5 million in cash from operations compared to $15.7 milliongenerated from operations during fiscal 2010. The $15.8 million increase in the amount of cash generated fromoperations was driven by a $15.5 million improvement in accounts receivable primarily driven by collection of alarge receivable shipped at the end of fiscal 2010, an $11.6 million increase in provision for deferred incometaxes, a $4.0 million increase in cash generated from prepaid income taxes and income taxes payable, a$3.4 million increase in inventory activities, a $1.6 million increase in stock-based compensation, a $1.5 millionincrease in depreciation and amortization expense, and a $0.9 million reduction in other non-cash items. Theseimprovements were partially offset by lower comparative net income of $9.9 million, a $4.8 million increase incash used for accounts payable and accrued expenses, a $4.8 million increase in cash used for deferred revenue,customer advances, and other non-current liabilities, and a $3.2 million increase in cash used for prepaidexpenses and other current and non-current assets.
Investing Activities
During fiscal 2012, we used cash of $80.8 million in investing activities compared to $22.7 million usedduring fiscal 2011. The $58.1 million increase in cash used by investing activities was primarily driven by a$71.0 million payment, net of cash acquired, for the KOR and PDI acquisition, compared to a $29.5 millionpayment, net of cash acquired, for the LNX acquisition in fiscal 2011, a $0.6 million increase in capitalexpenditures, and a $0.3 million increase in restricted cash. Additionally, we generated cash in fiscal 2011 byexercising the put option to sell auction rate securities for $18.0 million in cash. These increases were partiallyoffset by a $2.4 million payment for intangible assets made during fiscal 2011.
During fiscal 2011, we used cash of $22.7 million in investing activities compared to $23.6 milliongenerated from investing activities during fiscal 2010. The $46.3 million increase in cash used by investingactivities was primarily driven by a $29.5 million payment, net of cash acquired, for the LNX acquisition, a $14.0
46

million decrease in net sales of marketable securities, a $2.1 million increase in cash used for purchases ofintangible assets and a $1.5 million increase in capital expenditures, offset by a $0.8 million decrease in cashpayments related to the sale of discontinued operations.
Financing Activities
During fiscal 2012, we generated $2.0 million in cash from financing activities compared to $97.8 milliongenerated from financing activities during fiscal 2011. The $95.8 million decrease in cash generated fromfinancing activities was primarily due to the decrease in net proceeds received from a follow-on public stockoffering in 2011 of $93.6 million and a decrease of $2.4 million in cash generated from stock related activities.These decreases were slightly offset by $0.2 million of lower cash payments made for capital lease obligations,deferred financing and offering costs.
During fiscal 2011, we generated $97.8 million in cash from financing activities compared to $30.6 millionused by financing activities during fiscal 2010. The $128.4 million increase in cash generated from financingactivities was primarily due to $93.6 million of net proceeds received from a follow-on public stock offering, theabsence of $33.3 million in payments under our line of credit with UBS, an increase of $1.7 million of cashgenerated from stock related activities, and a $0.1 million decrease in payments of deferred financing andoffering costs. These increases were slightly offset by $0.3 million of cash used in payments of capital leaseobligations and other.
COMMITMENTS AND CONTRACTUAL OBLIGATIONS
The following is a schedule of our commitments and contractual obligations outstanding at June 30, 2012:
(In thousands) TotalLess Than1 Year
2-3Years
4-5Years
More Than5 Years
Operating leases . . . . . . . . . . . . . . . . . . . . . . . . . . . . . . . . . . . $15,036 $ 3,905 $6,238 $4,893 $—Purchase obligations . . . . . . . . . . . . . . . . . . . . . . . . . . . . . . . . 14,002 14,002 — — —Capital lease obligations . . . . . . . . . . . . . . . . . . . . . . . . . . . . . 79 79 — — —
$29,117 $17,986 $6,238 $4,893 $—
We have a liability at June 30, 2012 of $2.6 million for uncertain tax positions that have been taken or areexpected to be taken in various income tax returns. We do not know the ultimate resolution of these uncertain taxpositions and as such, do not know the ultimate timing of payments related to this liability. Accordingly, theseamounts are not included in the above table.
Purchase obligations represent open non-cancelable purchase commitments for certain inventorycomponents and services used in normal operations. The purchase commitments covered by these agreements arefor less than one year and aggregated $14.0 million at June 30, 2012.
Our standard product sales and license agreements entered into in the ordinary course of business typicallycontain an indemnification provision pursuant to which we indemnify, hold harmless, and agree to reimburse theindemnified party for losses suffered or incurred by the indemnified party in connection with certain intellectualproperty infringement claims by any third party with respect to our products. Such provisions generally survivetermination or expiration of the agreements. The potential amount of future payments we could be required tomake under these indemnification provisions is, in some instances, unlimited.
OFF-BALANCE SHEET ARRANGEMENTS
Other than our lease commitments incurred in the normal course of business and certain indemnificationprovisions, we do not have any off-balance sheet financing arrangements or liabilities, guarantee contracts,retained or contingent interests in transferred assets, or any obligation arising out of a material variable interest in
47

an unconsolidated entity. We do not have any majority-owned subsidiaries that are not consolidated in thefinancial statements. Additionally, we do not have an interest in, or relationships with, any special purposeentities.
RELATED PARTY TRANSACTIONS
In July 2008, we and our former CEO, James Bertelli, entered into an agreement for consulting servicesthrough June 30, 2010. The consideration for these services totaled $0.2 million and was paid out over the serviceperiod. As of June 30, 2010, we had made payments of $0.2 million for consulting services under this agreement.Additionally, in July 2008, we entered into a five year non-compete agreement with Mr. Bertelli. This agreement,which is carried as an intangible asset on our balance sheet, was valued at $0.5 million and is being amortizedover the life of the agreement. As of December 31, 2010, we had made payments of $0.5 million under thisnon-compete agreement.
During fiscal 2012 and 2011, we did not engage in any related party transactions.
NON-GAAP FINANCIALMEASURES
In our periodic communications, we discuss two important measures that are not calculated according toU.S. generally accepted accounting principles (“GAAP”), adjusted EBITDA and free cash flow.
Adjusted EBITDA is defined as earnings from continuing operations before interest income and expense,income taxes, depreciation, amortization of acquired intangible assets, restructuring, impairment of long-livedassets, acquisition costs and other related expenses, fair value adjustments from purchase accounting and stock-based compensation costs. We use adjusted EBITDA as an important indicator of the operating performance ofour business. We use adjusted EBITDA in internal forecasts and models when establishing internal operatingbudgets, supplementing the financial results and forecasts reported to our board of directors, determining acomponent of bonus compensation for executive officers and other key employees based on operatingperformance and evaluating short-term and long-term operating trends in our operations. We believe the adjustedEBITDA financial measure assists in providing a more complete understanding of our underlying operationalmeasures to manage our business, to evaluate our performance compared to prior periods and the marketplace,and to establish operational goals. We believe that these non-GAAP financial adjustments are useful to investorsbecause they allow investors to evaluate the effectiveness of the methodology and information used bymanagement in our financial and operational decision-making.
Adjusted EBITDA is a non-GAAP financial measure and should not be considered in isolation or as asubstitute for financial information provided in accordance with GAAP. This non-GAAP financial measure maynot be computed in the same manner as similarly titled measures used by other companies. We expect tocontinue to incur expenses similar to the adjusted EBITDA financial adjustments described above, and investorsshould not infer from our presentation of this non-GAAP financial measure that these costs are unusual,infrequent or non-recurring.
48

The following table reconciles our net income, the most directly comparable GAAP financial measure, toour adjusted EBITDA:
Year Ended June 30,
(In thousands) 2012 2011 2010
Net income . . . . . . . . . . . . . . . . . . . . . . . . . . . . . . . . . . . . . . . . . . . . . . . . . . . . . . . . $22,619 $18,442 $28,358(Loss) income from discontinued operations, net of income taxes . . . . . . . . . — (65) 289
Income from continuing operations . . . . . . . . . . . . . . . . . . . . . . . . . . . . . . . . . . . . . 22,619 18,507 28,069Interest expense (income), net . . . . . . . . . . . . . . . . . . . . . . . . . . . . . . . . . . . . . 27 45 (151)Income tax expense (benefit) . . . . . . . . . . . . . . . . . . . . . . . . . . . . . . . . . . . . . . 9,152 8,060 (9,377)Depreciation . . . . . . . . . . . . . . . . . . . . . . . . . . . . . . . . . . . . . . . . . . . . . . . . . . . 7,859 6,364 5,147Amortization of acquired intangible assets . . . . . . . . . . . . . . . . . . . . . . . . . . . 3,799 1,984 1,710Restructuring and other charges . . . . . . . . . . . . . . . . . . . . . . . . . . . . . . . . . . . . 2,821 — 231Impairment of long-lived assets . . . . . . . . . . . . . . . . . . . . . . . . . . . . . . . . . . . . — 150 211Acquisition costs and other related expenses . . . . . . . . . . . . . . . . . . . . . . . . . . 1,219 412 —Fair value adjustments related to purchase accounting items . . . . . . . . . . . . . (5,238) (219) —Stock-based compensation cost . . . . . . . . . . . . . . . . . . . . . . . . . . . . . . . . . . . . 6,616 5,580 4,016
Adjusted EBITDA . . . . . . . . . . . . . . . . . . . . . . . . . . . . . . . . . . . . . . . . . . . . . . . . . . $48,874 $40,883 $29,856
Free cash flow, a non-GAAP measure for reporting cash flow, is defined as cash provided by operatingactivities less capital expenditures for property and equipment, which includes capitalized software developmentcosts. We believe free cash flow provides investors with an important perspective on cash available forinvestments and acquisitions after making capital investments required to support ongoing business operationsand long-term value creation. We believe that trends in our free cash flow are valuable indicators of ouroperating performance and liquidity.
Free cash flow is a non-GAAP financial measure and should not be considered in isolation or as a substitutefor financial information provided in accordance with GAAP. This non-GAAP financial measure may not becomputed in the same manner as similarly titled measures used by other companies. We expect to continue toincur expenditures similar to the free cash flow adjustment described above, and investors should not infer fromour presentation of this non-GAAP financial measure that these expenditures reflect all of our obligations whichrequire cash.
The following table reconciles cash provided by operating activities, the most directly comparable GAAPfinancial measure, to free cash flow:
Year Ended June 30,
(In thousands) 2012 2011 2010
Cash provided by operating activities . . . . . . . . . . . . . . . . . . . . . . . . $31,869 $31,474 $15,708Purchases of property and equipment . . . . . . . . . . . . . . . . . . . . (9,427) (8,825) (7,334)
Free cash flow . . . . . . . . . . . . . . . . . . . . . . . . . . . . . . . . . . . . . . . . . . $22,442 $22,649 $ 8,374
CRITICAL ACCOUNTING POLICIES AND SIGNIFICANT JUDGMENTS AND ESTIMATES
We have identified the policies discussed below as critical to understanding our business and our results ofoperations. The impact and any associated risks related to these policies on our business operations are discussedthroughout Management’s Discussion and Analysis of Financial Condition and Results of Operations where suchpolicies affect our reported and expected financial results. We believe the following critical accounting policiesto be those most important to the portrayal of our financial position and results of operations and those thatrequire the most subjective judgment.
49

REVENUE RECOGNITION
We generate our revenue mainly from two different types of contractual arrangements: fixed-price contractsand time-and-material contracts. Revenue recognition methods on fixed-price contracts vary depending on thenature of the work and contract terms. Revenue from system sales is recognized upon shipment provided that titleand risk of loss have passed to the customer, there is persuasive evidence of an arrangement, the sales price isfixed or determinable, collection of the related receivable is reasonably assured, and customer acceptancecriteria, if any, have been successfully demonstrated. For multiple-deliverable revenue arrangements that mayinclude a combination of hardware components, related integration or other services, we allocate revenue to eachdeliverable based on its relative selling price. We generally determine relative selling price using best estimate ofthe selling price (“BESP”). Each deliverable within our multiple-deliverable revenue arrangement is accountedfor as a separate unit of accounting if the delivered item or items have value to the customer on a standalonebasis. We consider a deliverable to have standalone value if the item is sold separately by us or another vendor orif the item could be resold by the customer. Of our multiple-deliverable revenue arrangements, approximately50% typically ship complete within the same quarter.
We also have long term production type contracts that are fixed-price for which we apply thepercentage-of-completion method for revenue recognition. Application of the percentage-of-completion methodrequires significant judgment relative to estimating total contract costs, including assumptions relative to thelength of time to complete the contract, the nature and complexity of the work to be performed, anticipatedincreases in wages and prices for subcontractor services and materials, and the availability of subcontractorservices and materials. Our estimates are based upon the professional knowledge and experience of ourengineers, program managers and other personnel, who review each long-term contract monthly to assess thecontract’s schedule, performance, technical matters and estimated cost at completion. A cancellation, scheduledelay, or modification of a fixed-price contract which is accounted for using the percentage-of-completionmethod may adversely affect our gross margins for the period in which the contract is modified or cancelled.Changes in estimates are applied retrospectively and when adjustments in estimated contract costs are identified,such revisions may result in current period adjustments to earnings applicable to performance in prior periods.
For time and materials contracts, revenue reflects the number of direct labor hours expended in theperformance of a contract multiplied by the contract billing rate, as well as reimbursement of other billable directcosts. The risk inherent in time and materials contracts is that actual costs may differ materially from negotiatedbilling rates in the contract, which would directly affect operating income.
For all types of contracts, we recognize anticipated contract losses as soon as they become known andestimable. We do not provide our customers with rights of product return, other than those related to warrantyprovisions that permit repair or replacement of defective goods. We accrue for anticipated warranty costs uponproduct shipment. Our payment terms range from 30 to 180 days from invoice date based on the nature of thecontracts, customers’ geographic locations and customer type.
INVENTORY VALUATION
We value our inventory at the lower of cost (first-in, first-out) or its current estimated market value. Wewrite down inventory for excess and obsolescence based upon assumptions about future demand, product mixand possible alternative uses. Actual demand, product mix and alternative usage may be lower than those that weproject and this difference could have a material adverse effect on our gross margin if inventory write-downsbeyond those initially recorded become necessary. Alternatively, if actual demand, product mix and alternativeusage are more favorable than those we estimated at the time of such a write-down, our gross margin could befavorably impacted in future periods.
GOODWILL, ACQUIRED INTANGIBLE ASSETS AND LONG-LIVED ASSETS
We evaluate whether goodwill is impaired annually and when events occur or circumstances change. Wetest goodwill for impairment at the reporting unit level, which presently is the same as our operating segments. In
50

2011, an amendment to the goodwill impairment guidance was issued that provides entities an option to performa qualitative assessment (commonly known as “step zero”) to determine whether further impairment testing isnecessary before performing the two-step test that was previously required. The qualitative assessment requiressignificant judgments by management about macro-economic conditions including the entity’s operatingenvironment, its industry and other market considerations, entity-specific events related to financial performanceor loss of key personnel, and other events that could impact the reporting unit. We elected to adopt the provisionsof this amendment for our annual test of impairment as of June 30, 2012 and concluded, based on our qualitativeassessment, that no further testing was required. In the future, if we conclude that further testing is required, theimpairment test involves a two-step process. Step one compares the fair value of the reporting unit with itscarrying value, including goodwill. If the carrying amount exceeds the fair value of the reporting unit, step two isrequired to determine if there is an impairment of the goodwill. Step two compares the implied fair value of thereporting unit’s goodwill to the carrying amount of the goodwill. The Company estimates the fair value of itsreporting units using the income approach based upon a discounted cash flow model. In addition, the Companyuses the market approach, which compares the reporting unit to publicly-traded companies and transactionsinvolving similar businesses, to support the conclusions of the income approach. The income approach requiresthe use of many assumptions and estimates including future revenues, expenses, capital expenditures, andworking capital, as well as discount factors and income tax rates.
We also review finite-lived intangible assets and long-lived assets when indications of potential impairmentexist, such as a significant reduction in undiscounted cash flows associated with the assets. Should the fair valueof our long-lived assets decline because of reduced operating performance, market declines, or other indicators ofimpairment, a charge to operations for impairment may be necessary.
INCOME TAXES
The determination of income tax expense requires us to make certain estimates and judgments concerningthe calculation of deferred tax assets and liabilities, as well as the deductions and credits that are available toreduce taxable income. We recognize deferred tax assets and liabilities for the expected future tax consequencesof events that have been included in our consolidated financial statements. Under this method, deferred tax assetsand liabilities are determined based on the difference between the financial statement and tax basis of assets andliabilities using enacted tax rates for the year in which the differences are expected to reverse. We record avaluation allowance against net deferred tax assets if, based upon the available evidence, it is more likely thannot that some or all of the deferred tax assets will not be realized. If it becomes more likely than not that a taxasset will be used for which a reserve has been provided, we reverse the related valuation allowance. If our actualfuture taxable income by tax jurisdiction differs from estimates, additional allowances or reversals of reservesmay be necessary.
We use a two-step approach to recognize and measure uncertain tax positions. First, the tax position must beevaluated to determine the likelihood that it will be sustained upon external examination. If the tax position isdeemed more-likely-than-not to be sustained, the tax position is then assessed to determine the amount of benefitto recognize in the financial statements. The amount of the benefit that may be recognized is the largest amountthat has a greater than 50% likelihood of being realized upon ultimate settlement. We reevaluate our uncertaintax positions on a quarterly basis and any changes to these positions as a result of tax audits, tax laws or otherfacts and circumstances could result in additional charges to operations.
BUSINESS COMBINATIONS
Business combinations are accounted for under the acquisition method of accounting. Allocating thepurchase price requires us to estimate the fair value of various assets acquired and liabilities assumed.Management is responsible for determining the appropriate valuation model and estimated fair values, and indoing so, considers a number of factors, including information provided by an outside valuation advisor. We
51

primarily establish fair value using the income approach based upon a discounted cash flow model. The incomeapproach requires the use of many assumptions and estimates including future revenues and expenses, as well asdiscount factors and income tax rates.
RECENTLY ADOPTED ACCOUNTING PRONOUNCEMENTS
Effective July 1, 2011, we elected to adopt FASB ASU 2011-08, Intangibles—Goodwill and Other(Topic 350): Testing Goodwill for Impairment (“ASU 2011-08”): an amendment of the FASB AccountingStandards Codification. The ASU permits an entity to make a qualitative assessment of whether it is more likelythan not that a reporting unit’s fair value is less than its carrying amount before applying the two-step goodwillimpairment test. If an entity concludes it is more likely than not that the fair value of a reporting unit is greaterthan its carrying amount, it does not need to perform the two-step impairment test. The ASU is effective for us onJuly 1, 2012; however, we have elected to early adopt as permitted by the guidance. Upon adoption, we appliedASU 2011-08 to our annual goodwill impairment test using a qualitative assessment before applying a two-stepgoodwill impairment test. Such adoption did not have a material impact on our financial position or results ofoperations.
RECENTLY ISSUED ACCOUNTING PRONOUNCEMENTS
In December 2011, the FASB issued ASU No. 2011-11, Disclosures about Offsetting Assets and Liabilities,in conjunction with the International Accounting Standards Board (“IASB”)’s issuance of amendments toDisclosures—Offsetting Financial Assets and Financial Liabilities (Amendments to IFRS 7). While the Boardsretained the existing offsetting models under U.S. GAAP and International Financial Reporting Standards(“IFRS”), the new standards require disclosures to allow investors to better compare financial statementsprepared under U.S. GAAP with financial statements prepared under IFRS. The new standards are effective forannual periods beginning January 1, 2013, and interim periods within those annual periods. Retrospectiveapplication is required. This guidance is not expected to have a material impact to our consolidated financialstatements.
In December 2011, the FASB issued ASU No. 2011-12, Comprehensive Income (Topic 220): Deferral ofthe Effective Date for Amendments to the Presentation of Reclassifications of Items Out of Accumulated OtherComprehensive Income in Accounting Standards Update No. 2011-05. The ASU defers the new requirement topresent components of reclassifications of other comprehensive income on the face of the income statement.Companies are still required to adopt the other requirements contained in the new standard on comprehensiveincome, ASU No. 2011-05, Comprehensive Income (Topic 220): Presentation of Comprehensive Income(“ASU 2011-05”). The new standard and this deferral are effective for public entities as of the beginning of afiscal year that begins after December 15, 2011 and interim and annual periods thereafter. Early adoption ispermitted but full retrospective application is required. Effective July 1, 2010, we adopted ASU 2011-05 andhave presented the components of net income and comprehensive income in one consecutive financial statementon our annual and quarterly reports filed on Form 10-K and Form 10-Q respectively.
ITEM 7A. QUANTITATIVE AND QUALITATIVE DISCLOSURES ABOUTMARKET RISK
INTEREST RATE RISK
Our exposure to interest rate risk is related primarily to our investment portfolio and our line of credit. Ourinvestment portfolio includes money market funds from high quality U.S. government issuers. A change inprevailing interest rates may cause the fair value of our investments to fluctuate. For example, if we hold asecurity that was issued with a fixed interest rate at the then-prevailing rate and the prevailing rate rises, the fairvalue of the principal amount of our investment will probably decline. To minimize this risk, investments aregenerally available for sale and we generally limit the amount of credit exposure to any one issuer. Our line ofcredit was unused at June 30, 2012.
52

FOREIGN CURRENCY RISK
We operate primarily in the United States; however, we conduct business outside the United States throughour foreign subsidiaries in Europe and Japan, where business is largely transacted in non-U.S. dollar currencies.Accordingly, we are subject to exposure from adverse movements in the exchange rates of local currencies.Local currencies are used as the functional currency for our subsidiaries in Europe and Japan. Consequently,changes in the exchange rates of the currencies may impact the translation of the foreign subsidiaries’ statementsof operations into U.S. dollars, which may in turn affect our consolidated statement of operations.
We have not entered into any financial derivative instruments that expose us to material market risk,including any instruments designed to hedge the impact of foreign currency exposures. We may, however, hedgesuch exposure to foreign currency exchange rate fluctuations in the future.
53

REPORT OF INDEPENDENT REGISTERED PUBLIC ACCOUNTING FIRM
The Board of Directors and ShareholdersMercury Computer Systems, Inc.:
We have audited the accompanying consolidated balance sheets of Mercury Computer Systems, Inc. andsubsidiaries as of June 30, 2012 and 2011, and the related consolidated statements of operations andcomprehensive income, shareholders’ equity, and cash flows for each of the years in the three-year period endedJune 30, 2012. In connection with our audits of the consolidated financial statements, we have also auditedfinancial statement Schedule II. We also have audited Mercury Computer Systems, Inc.’s internal control overfinancial reporting as of June 30, 2012, based on criteria established in Internal Control – Integrated Frameworkissued by the Committee of Sponsoring Organizations of the Treadway Commission (COSO). MercuryComputer Systems, Inc.’s management is responsible for these consolidated financial statements and financialstatement Schedule II, for maintaining effective internal control over financial reporting, and for its assessmentof the effectiveness of internal control over financial reporting, included in the accompanying Management’sAnnual Report on Internal Controls Over Financial Reporting. Our responsibility is to express an opinion onthese consolidated financial statements and financial statement schedule and an opinion on the Company’sinternal control over financial reporting based on our audits.
We conducted our audits in accordance with the standards of the Public Company Accounting OversightBoard (United States). Those standards require that we plan and perform the audits to obtain reasonableassurance about whether the financial statements are free of material misstatement and whether effective internalcontrol over financial reporting was maintained in all material respects. Our audits of the consolidated financialstatements included examining, on a test basis, evidence supporting the amounts and disclosures in the financialstatements, assessing the accounting principles used and significant estimates made by management, andevaluating the overall financial statement presentation. Our audit of internal control over financial reportingincluded obtaining an understanding of internal control over financial reporting, assessing the risk that a materialweakness exists, and testing and evaluating the design and operating effectiveness of internal control based onthe assessed risk. Our audits also included performing such other procedures as we considered necessary in thecircumstances. We believe that our audits provide a reasonable basis for our opinions.
A company’s internal control over financial reporting is a process designed to provide reasonable assuranceregarding the reliability of financial reporting and the preparation of financial statements for external purposes inaccordance with generally accepted accounting principles. A company’s internal control over financial reportingincludes those policies and procedures that (1) pertain to the maintenance of records that, in reasonable detail,accurately and fairly reflect the transactions and dispositions of the assets of the company; (2) provide reasonableassurance that transactions are recorded as necessary to permit preparation of financial statements in accordancewith generally accepted accounting principles, and that receipts and expenditures of the company are being madeonly in accordance with authorizations of management and directors of the company; and (3) provide reasonableassurance regarding prevention or timely detection of unauthorized acquisition, use, or disposition of thecompany’s assets that could have a material effect on the financial statements.
Because of its inherent limitations, internal control over financial reporting may not prevent or detectmisstatements. Also, projections of any evaluation of effectiveness to future periods are subject to the risk thatcontrols may become inadequate because of changes in conditions, or that the degree of compliance with thepolicies or procedures may deteriorate.
In our opinion, the consolidated financial statements referred to above present fairly, in all material respects,the financial position of Mercury Computer Systems, Inc. and subsidiaries as of June 30, 2012 and 2011, and theresults of their operations and their cash flows for each of the years in the three-year period ended June 30, 2012,in conformity with U.S. generally accepted accounting principles. Also in our opinion, the related financialstatement schedule, when considered in relation to the basic consolidated financial statements taken as a whole,
54

presents fairly, in all material respects, the information set forth therein. Also in our opinion, Mercury ComputerSystems, Inc. maintained, in all material respects, effective internal control over financial reporting as of June 30,2012, based on criteria established in Internal Control – Integrated Framework issued by the Committee ofSponsoring Organizations of the Treadway Commission.
Mercury Computer Systems, Inc. and subsidiaries acquired KOR Electronics and its wholly-ownedsubsidiary, Paragon Dynamics, Inc. during fiscal year 2012, and management excluded from its assessment of theeffectiveness of Mercury Computer Systems, Inc.’s internal control over financial reporting as of June 30, 2012KOR Electronics and its wholly-owned subsidiary, Paragon Dynamics, Inc.’s internal control over financialreporting associated with total assets of 22 percent (of which 17 percent represented goodwill and intangibleassets included within the scope of the assessment) and total revenues of 8 percent included in the consolidatedfinancial statements of Mercury Computer Systems, Inc. and subsidiaries as of and for the year ended June 30,2012. Our audit of internal control over financial reporting of Mercury Computer Systems, Inc. and subsidiariesalso excluded an evaluation of the internal control over financial reporting of KOR Electronics and its wholly-owned subsidiary, Paragon Dynamics, Inc.
/s/ KPMG LLP
Boston, MassachusettsAugust 22, 2012
55

ITEM 8. FINANCIAL STATEMENTS AND SUPPLEMENTARY DATA
MERCURY COMPUTER SYSTEMS, INC.
CONSOLIDATED BALANCE SHEETS(In thousands, except share and per share data)
June 30,
2012 2011
AssetsCurrent assets:
Cash and cash equivalents . . . . . . . . . . . . . . . . . . . . . . . . . . . . . . . . . . . . . . . . . . . . . . . . . . . . . . . . $115,964 $162,875Accounts receivable, net of allowance for doubtful accounts of $5 and $17 at June 30, 2012 and2011, respectively . . . . . . . . . . . . . . . . . . . . . . . . . . . . . . . . . . . . . . . . . . . . . . . . . . . . . . . . . . . . . 38,532 44,786
Unbilled receivables and cost in excess of billings . . . . . . . . . . . . . . . . . . . . . . . . . . . . . . . . . . . . . 10,918 1,059Inventory . . . . . . . . . . . . . . . . . . . . . . . . . . . . . . . . . . . . . . . . . . . . . . . . . . . . . . . . . . . . . . . . . . . . . . 25,845 18,540Deferred income taxes . . . . . . . . . . . . . . . . . . . . . . . . . . . . . . . . . . . . . . . . . . . . . . . . . . . . . . . . . . . 7,653 7,678Prepaid income taxes . . . . . . . . . . . . . . . . . . . . . . . . . . . . . . . . . . . . . . . . . . . . . . . . . . . . . . . . . . . . 2,585 1,075Prepaid expenses and other current assets . . . . . . . . . . . . . . . . . . . . . . . . . . . . . . . . . . . . . . . . . . . . 6,206 4,171
Total current assets . . . . . . . . . . . . . . . . . . . . . . . . . . . . . . . . . . . . . . . . . . . . . . . . . . . . . . . . . . 207,703 240,184Restricted cash . . . . . . . . . . . . . . . . . . . . . . . . . . . . . . . . . . . . . . . . . . . . . . . . . . . . . . . . . . . . . . . . . . . . . 3,281 3,000Property and equipment, net . . . . . . . . . . . . . . . . . . . . . . . . . . . . . . . . . . . . . . . . . . . . . . . . . . . . . . . . . . . 15,929 14,520Goodwill . . . . . . . . . . . . . . . . . . . . . . . . . . . . . . . . . . . . . . . . . . . . . . . . . . . . . . . . . . . . . . . . . . . . . . . . . . 132,621 79,558Acquired intangible assets, net . . . . . . . . . . . . . . . . . . . . . . . . . . . . . . . . . . . . . . . . . . . . . . . . . . . . . . . . . 25,083 16,702Other non-current assets . . . . . . . . . . . . . . . . . . . . . . . . . . . . . . . . . . . . . . . . . . . . . . . . . . . . . . . . . . . . . . 989 1,598
Total assets . . . . . . . . . . . . . . . . . . . . . . . . . . . . . . . . . . . . . . . . . . . . . . . . . . . . . . . . . . . . . . . . $385,606 $355,562
Liabilities and Shareholders’ EquityCurrent liabilities:
Accounts payable . . . . . . . . . . . . . . . . . . . . . . . . . . . . . . . . . . . . . . . . . . . . . . . . . . . . . . . . . . . . . . . $ 9,002 $ 7,972Accrued expenses . . . . . . . . . . . . . . . . . . . . . . . . . . . . . . . . . . . . . . . . . . . . . . . . . . . . . . . . . . . . . . . 9,895 5,808Accrued compensation . . . . . . . . . . . . . . . . . . . . . . . . . . . . . . . . . . . . . . . . . . . . . . . . . . . . . . . . . . . 13,190 16,288Deferred revenues and customer advances . . . . . . . . . . . . . . . . . . . . . . . . . . . . . . . . . . . . . . . . . . . . 4,855 6,138
Total current liabilities . . . . . . . . . . . . . . . . . . . . . . . . . . . . . . . . . . . . . . . . . . . . . . . . . . . . . . . 36,942 36,206Deferred gain on sale-leaseback . . . . . . . . . . . . . . . . . . . . . . . . . . . . . . . . . . . . . . . . . . . . . . . . . . . . . . . . 4,399 5,556Deferred income taxes . . . . . . . . . . . . . . . . . . . . . . . . . . . . . . . . . . . . . . . . . . . . . . . . . . . . . . . . . . . . . . . 7,197 3,877Income taxes payable . . . . . . . . . . . . . . . . . . . . . . . . . . . . . . . . . . . . . . . . . . . . . . . . . . . . . . . . . . . . . . . . 2,597 1,777Other non-current liabilities . . . . . . . . . . . . . . . . . . . . . . . . . . . . . . . . . . . . . . . . . . . . . . . . . . . . . . . . . . . 1,367 6,710
Total liabilities . . . . . . . . . . . . . . . . . . . . . . . . . . . . . . . . . . . . . . . . . . . . . . . . . . . . . . . . . . . . . 52,502 54,126Commitments and contingencies (Note L)Shareholders’ equity:
Preferred stock, $.01 par value; 1,000,000 shares authorized; no shares issued or outstanding . . . — —Common stock, $.01 par value; 85,000,000 shares authorized; 29,729,065 and 29,143,738 sharesissued and outstanding at June 30, 2012 and 2011 respectively . . . . . . . . . . . . . . . . . . . . . . . . . . 297 291
Additional paid-in capital . . . . . . . . . . . . . . . . . . . . . . . . . . . . . . . . . . . . . . . . . . . . . . . . . . . . . . . . . 222,769 213,777Retained earnings . . . . . . . . . . . . . . . . . . . . . . . . . . . . . . . . . . . . . . . . . . . . . . . . . . . . . . . . . . . . . . . 108,732 86,113Accumulated other comprehensive income . . . . . . . . . . . . . . . . . . . . . . . . . . . . . . . . . . . . . . . . . . . 1,306 1,255
Total shareholders’ equity . . . . . . . . . . . . . . . . . . . . . . . . . . . . . . . . . . . . . . . . . . . . . . . . . . . . 333,104 301,436
Total liabilities and shareholders’ equity . . . . . . . . . . . . . . . . . . . . . . . . . . . . . . . . . . . . . . . . . $385,606 $355,562
The accompanying notes are an integral part of the consolidated financial statements.
56

MERCURY COMPUTER SYSTEMS, INC.
CONSOLIDATED STATEMENTS OF OPERATIONS AND COMPREHENSIVE INCOME(In thousands, except per share data)
For the Years Ended June 30,
2012 2011 2010
Net revenues . . . . . . . . . . . . . . . . . . . . . . . . . . . . . . . . . . . . . . . . . . . . . . . . . . . . $244,929 $228,710 $199,830Cost of revenues . . . . . . . . . . . . . . . . . . . . . . . . . . . . . . . . . . . . . . . . . . . . . . . . . 108,773 98,811 87,298
Gross margin . . . . . . . . . . . . . . . . . . . . . . . . . . . . . . . . . . . . . . . . . . . 136,156 129,899 112,532Operating expenses:
Selling, general and administrative . . . . . . . . . . . . . . . . . . . . . . . . . . . . . . 57,159 57,868 51,519Research and development . . . . . . . . . . . . . . . . . . . . . . . . . . . . . . . . . . . . . 45,984 44,500 41,548Amortization of acquired intangible assets . . . . . . . . . . . . . . . . . . . . . . . . 3,799 1,984 1,710Restructuring and other charges . . . . . . . . . . . . . . . . . . . . . . . . . . . . . . . . . 2,821 — 231Impairment of long-lived assets . . . . . . . . . . . . . . . . . . . . . . . . . . . . . . . . . — 150 211Acquisition costs and other related expenses . . . . . . . . . . . . . . . . . . . . . . . 1,219 412 —Change in the fair value of the liability related to the LNX earn-out . . . . (4,938) — —
Total operating expenses . . . . . . . . . . . . . . . . . . . . . . . . . . . . . . . . . . 106,044 104,914 95,219
Income from operations . . . . . . . . . . . . . . . . . . . . . . . . . . . . . . . . . . . . . . . . . . . 30,112 24,985 17,313Interest income . . . . . . . . . . . . . . . . . . . . . . . . . . . . . . . . . . . . . . . . . . . . . . . . . . 13 34 532Interest expense . . . . . . . . . . . . . . . . . . . . . . . . . . . . . . . . . . . . . . . . . . . . . . . . . (40) (79) (381)Other income, net . . . . . . . . . . . . . . . . . . . . . . . . . . . . . . . . . . . . . . . . . . . . . . . . 1,686 1,627 1,228
Income from continuing operations before income taxes (benefit) . . . . . . . . . . 31,771 26,567 18,692Income taxes (benefit) . . . . . . . . . . . . . . . . . . . . . . . . . . . . . . . . . . . . . . . . . . . . 9,152 8,060 (9,377)
Income from continuing operations . . . . . . . . . . . . . . . . . . . . . . . . . . . . . . . . . . 22,619 18,507 28,069(Loss) income from discontinued operations, net of income taxes . . . . . . . . . . — (65) 289
Net income . . . . . . . . . . . . . . . . . . . . . . . . . . . . . . . . . . . . . . . . . . . . . . . . . . . . . $ 22,619 $ 18,442 $ 28,358
Basic net earnings (loss) per share:Income from continuing operations . . . . . . . . . . . . . . . . . . . . . . . . . . . . . . $ 0.77 $ 0.73 $ 1.25(Loss) income from discontinued operations, net of income taxes . . . . . . — — 0.01
Net income . . . . . . . . . . . . . . . . . . . . . . . . . . . . . . . . . . . . . . . . . . . . . . . . . $ 0.77 $ 0.73 $ 1.26
Diluted net earnings (loss) per share:Income from continuing operations . . . . . . . . . . . . . . . . . . . . . . . . . . . . . . $ 0.75 $ 0.71 $ 1.22(Loss) income from discontinued operations, net of income taxes . . . . . . — (0.01) 0.01
Net income . . . . . . . . . . . . . . . . . . . . . . . . . . . . . . . . . . . . . . . . . . . . . . . . . $ 0.75 $ 0.70 $ 1.23
Weighted-average shares outstanding:Basic . . . . . . . . . . . . . . . . . . . . . . . . . . . . . . . . . . . . . . . . . . . . . . . . . . . . . . 29,477 25,322 22,559
Diluted . . . . . . . . . . . . . . . . . . . . . . . . . . . . . . . . . . . . . . . . . . . . . . . . . . . . 30,085 26,209 23,008
Comprehensive income:Net income . . . . . . . . . . . . . . . . . . . . . . . . . . . . . . . . . . . . . . . . . . . . . . . . . . . . . $ 22,619 $ 18,442 $ 28,358Foreign currency translation adjustments . . . . . . . . . . . . . . . . . . . . . . . . . . . . . 53 311 368Net unrealized (loss) gain on investments . . . . . . . . . . . . . . . . . . . . . . . . . . . . . (2) 2 (83)
Total comprehensive income . . . . . . . . . . . . . . . . . . . . . . . . . . . . . . . . . . . . . . . $ 22,670 $ 18,755 $ 28,643
The accompanying notes are an integral part of the consolidated financial statements.
57

MERCURY COMPUTER SYSTEMS, INC.
CONSOLIDATED STATEMENTS OF SHAREHOLDERS’ EQUITYFor the Years Ended June 30, 2012, 2011 and 2010
(In thousands)
Common Stock AdditionalPaid-inCapital
RetainedEarnings
AccumulatedOther
ComprehensiveIncome
TotalShareholders’
EquityShares Amount
Balance June 30, 2009 . . . . . . . . . . . . . . . . . . . 22,376 $224 $104,843 $ 39,313 $ 657 $145,037Issuance of common stock under employeestock incentive plans . . . . . . . . . . . . . . . . . . 455 5 997 1,002
Issuance of common stock under employeestock purchase plan . . . . . . . . . . . . . . . . . . . 94 1 846 847
Repurchase of common stock . . . . . . . . . . . . . (42) (1) (432) (433)Stock-based compensation . . . . . . . . . . . . . . . . 4,016 4,016Net income . . . . . . . . . . . . . . . . . . . . . . . . . . . . 28,358 28,358Net unrealized loss on securities . . . . . . . . . . . (83) (83)Foreign currency translation adjustments . . . . 368 368
Balance June 30, 2010 . . . . . . . . . . . . . . . . . . . 22,883 $229 $110,270 $ 67,671 $ 942 $179,112Issuance of common stock under employeestock incentive plans . . . . . . . . . . . . . . . . . . 594 6 2,590 2,596
Issuance of common stock under employeestock purchase plan . . . . . . . . . . . . . . . . . . . 89 1 1,093 1,094
Follow-on public stock offering . . . . . . . . . . . . 5,578 55 93,550 93,605Stock-based compensation . . . . . . . . . . . . . . . . 5,580 5,580Tax benefit from employee stock planawards . . . . . . . . . . . . . . . . . . . . . . . . . . . . . 694 694
Net income . . . . . . . . . . . . . . . . . . . . . . . . . . . . 18,442 18,442Net unrealized gain on investments . . . . . . . . . 2 2Foreign currency translation adjustments . . . . 311 311
Balance June 30, 2011 . . . . . . . . . . . . . . . . . . . 29,144 $291 $213,777 $ 86,113 $1,255 $301,436Issuance of common stock under employeestock incentive plans . . . . . . . . . . . . . . . . . . 481 5 461 466
Issuance of common stock under employeestock purchase plan . . . . . . . . . . . . . . . . . . . 104 1 1,164 1,165
Stock-based compensation . . . . . . . . . . . . . . . . 6,616 6,616Tax benefit from employee stock planawards . . . . . . . . . . . . . . . . . . . . . . . . . . . . . 751 751
Net income . . . . . . . . . . . . . . . . . . . . . . . . . . . . 22,619 22,619Net unrealized loss on investments . . . . . . . . . (2) (2)Foreign currency translation adjustments . . . . 53 53
Balance June 30, 2012 . . . . . . . . . . . . . . . . . . . 29,729 $297 $222,769 $108,732 $1,306 $333,104
The accompanying notes are an integral part of the consolidated financial statements.
58

MERCURY COMPUTER SYSTEMS, INC.
CONSOLIDATED STATEMENTS OF CASH FLOWS(In thousands)
For The Years Ended June 30,
2012 2011 2010
Cash flows from operating activities:Net income . . . . . . . . . . . . . . . . . . . . . . . . . . . . . . . . . . . . . . . . . . . . . . . . . . . . . . . . . . . . . . . . . . . . . . . $ 22,619 $ 18,442 $ 28,358Adjustments to reconcile net income to net cash provided by operating activities:
Depreciation and amortization expense . . . . . . . . . . . . . . . . . . . . . . . . . . . . . . . . . . . . . . . . . . . . . 11,658 8,348 6,857Stock-based compensation expense . . . . . . . . . . . . . . . . . . . . . . . . . . . . . . . . . . . . . . . . . . . . . . . . 6,616 5,580 4,016(Benefit) provision for deferred income taxes . . . . . . . . . . . . . . . . . . . . . . . . . . . . . . . . . . . . . . . . (3,056) 1,888 (9,698)Impairment of long-lived assets . . . . . . . . . . . . . . . . . . . . . . . . . . . . . . . . . . . . . . . . . . . . . . . . . . . — 150 211Excess tax benefit from stock-based compensation . . . . . . . . . . . . . . . . . . . . . . . . . . . . . . . . . . . (559) (893) (1,494)Change in the fair value of the liability related to the LNX earn-out . . . . . . . . . . . . . . . . . . . . . . (4,938) — —Other non-cash items . . . . . . . . . . . . . . . . . . . . . . . . . . . . . . . . . . . . . . . . . . . . . . . . . . . . . . . . . . . (555) (898) (1,308)
Changes in operating assets and liabilities, net of effects of businesses acquired and disposed of:Accounts receivable, unbilled receivable, and cost in excess of billings . . . . . . . . . . . . . . . . . . . 6,755 257 (15,256)Inventory . . . . . . . . . . . . . . . . . . . . . . . . . . . . . . . . . . . . . . . . . . . . . . . . . . . . . . . . . . . . . . . . . . . . (7,267) 2,514 (859)Prepaid income taxes . . . . . . . . . . . . . . . . . . . . . . . . . . . . . . . . . . . . . . . . . . . . . . . . . . . . . . . . . . . 3,514 1,567 (2,162)Prepaid expenses and other current assets . . . . . . . . . . . . . . . . . . . . . . . . . . . . . . . . . . . . . . . . . . . (816) (2,120) 505Other non-current assets . . . . . . . . . . . . . . . . . . . . . . . . . . . . . . . . . . . . . . . . . . . . . . . . . . . . . . . . 646 (677) (113)Accounts payable and accrued expenses . . . . . . . . . . . . . . . . . . . . . . . . . . . . . . . . . . . . . . . . . . . . (1,092) 931 5,708Deferred revenues and customer advances . . . . . . . . . . . . . . . . . . . . . . . . . . . . . . . . . . . . . . . . . . (1,850) (3,696) 234Income taxes payable . . . . . . . . . . . . . . . . . . . . . . . . . . . . . . . . . . . . . . . . . . . . . . . . . . . . . . . . . . . 820 21 (262)Other non-current liabilities . . . . . . . . . . . . . . . . . . . . . . . . . . . . . . . . . . . . . . . . . . . . . . . . . . . . . . (626) 60 971
Net cash provided by operating activities . . . . . . . . . . . . . . . . . . . . . . . . . . . . . . . . . . . . . . . . . . . . . . . . . . . 31,869 31,474 15,708
Cash flows from investing activities:Acquisition of businesses, net of cash acquired . . . . . . . . . . . . . . . . . . . . . . . . . . . . . . . . . . . . . . . . . . (71,044) (29,508) —Sales and maturities of marketable securities . . . . . . . . . . . . . . . . . . . . . . . . . . . . . . . . . . . . . . . . . . . . — 18,025 32,025Purchases of property and equipment . . . . . . . . . . . . . . . . . . . . . . . . . . . . . . . . . . . . . . . . . . . . . . . . . . (9,427) (8,825) (7,334)Payments for acquired intangible assets . . . . . . . . . . . . . . . . . . . . . . . . . . . . . . . . . . . . . . . . . . . . . . . . (50) (2,375) (250)Payments for sale of discontinued operations, net . . . . . . . . . . . . . . . . . . . . . . . . . . . . . . . . . . . . . . . . . — — (826)Increase in restricted cash . . . . . . . . . . . . . . . . . . . . . . . . . . . . . . . . . . . . . . . . . . . . . . . . . . . . . . . . . . . (281) — —
Net cash (used in) provided by investing activities . . . . . . . . . . . . . . . . . . . . . . . . . . . . . . . . . . . . . . . . . . . . (80,802) (22,683) 23,615
Cash flows from financing activities:Proceeds from follow-on public stock offering, net . . . . . . . . . . . . . . . . . . . . . . . . . . . . . . . . . . . . . . . — 93,605 —Proceeds from employee stock plans . . . . . . . . . . . . . . . . . . . . . . . . . . . . . . . . . . . . . . . . . . . . . . . . . . . 1,631 3,690 1,849Excess tax benefit from stock-based compensation . . . . . . . . . . . . . . . . . . . . . . . . . . . . . . . . . . . . . . . 559 893 1,494Payments under line of credit . . . . . . . . . . . . . . . . . . . . . . . . . . . . . . . . . . . . . . . . . . . . . . . . . . . . . . . . — — (33,364)Payments of deferred financing costs . . . . . . . . . . . . . . . . . . . . . . . . . . . . . . . . . . . . . . . . . . . . . . . . . . — (31) (170)Payments of deferred offering costs . . . . . . . . . . . . . . . . . . . . . . . . . . . . . . . . . . . . . . . . . . . . . . . . . . . (30) (59) —Repurchases of common stock . . . . . . . . . . . . . . . . . . . . . . . . . . . . . . . . . . . . . . . . . . . . . . . . . . . . . . . — — (433)(Payments) proceeds of capital lease obligations . . . . . . . . . . . . . . . . . . . . . . . . . . . . . . . . . . . . . . . . . (185) (298) 30
Net cash provided by (used in) financing activities . . . . . . . . . . . . . . . . . . . . . . . . . . . . . . . . . . . . . . . . . . . . 1,975 97,800 (30,594)
Effect of exchange rate changes on cash and cash equivalents . . . . . . . . . . . . . . . . . . . . . . . . . . . . . . . . . . . 47 43 562
Net (decrease) increase in cash and cash equivalents . . . . . . . . . . . . . . . . . . . . . . . . . . . . . . . . . . . . . . . . . . (46,911) 106,634 9,291Cash and cash equivalents at beginning of year . . . . . . . . . . . . . . . . . . . . . . . . . . . . . . . . . . . . . . . . . . . . . . 162,875 56,241 46,950
Cash and cash equivalents at end of year . . . . . . . . . . . . . . . . . . . . . . . . . . . . . . . . . . . . . . . . . . . . . . . . . . . $115,964 $162,875 $ 56,241
Cash paid during the period for:Interest . . . . . . . . . . . . . . . . . . . . . . . . . . . . . . . . . . . . . . . . . . . . . . . . . . . . . . . . . . . . . . . . . . . . . . . . . . $ 40 $ 45 $ 150Income taxes . . . . . . . . . . . . . . . . . . . . . . . . . . . . . . . . . . . . . . . . . . . . . . . . . . . . . . . . . . . . . . . . . . . . . $ 8,686 $ 4,397 $ 2,587
Supplemental disclosures—non-cash activities:Issuance of restricted stock awards to employees . . . . . . . . . . . . . . . . . . . . . . . . . . . . . . . . . . . . . . . . . $ 8,367 $ 9,204 $ 6,219Acquisition of intangible assets . . . . . . . . . . . . . . . . . . . . . . . . . . . . . . . . . . . . . . . . . . . . . . . . . . . . . . . $ — $ 495 $ —Capital lease . . . . . . . . . . . . . . . . . . . . . . . . . . . . . . . . . . . . . . . . . . . . . . . . . . . . . . . . . . . . . . . . . . . . . . $ 41 $ 251 $ 168
The accompanying notes are an integral part of the consolidated financial statements.
59

MERCURY COMPUTER SYSTEMS, INC.
NOTES TO CONSOLIDATED FINANCIAL STATEMENTS(Amounts in thousands, except per share data)
A. Description of Business
Mercury Computer Systems, Inc. (the “Company” or “Mercury”) designs, manufactures and marketscommercially-developed, high-performance embedded, real-time digital signal and image processingsub-systems and software for specialized defense and commercial markets. The Company’s solutions play acritical role in a wide range of applications, processing and transforming sensor data to information for storage,analysis and interpretation. The Company’s goal is to grow and build on its position as a critical component ofthe defense and intelligence industrial base and be the leading provider of open and affordable sensor processingsubsystems for intelligence, surveillance and reconnaissance (“ISR”), electronic warfare (“EW”), and missiledefense applications. In military reconnaissance and surveillance platforms, the Company’s sub-systems receive,process, and store real-time radar, video, sonar and signals intelligence data. The Company provides radiofrequency (“RF”) and microwave products for enhanced signal acquisitions and communications in military andcommercial applications. Additionally, Mercury Federal Systems, the Company’s wholly owned subsidiary,focuses on direct and indirect contracts supporting the defense, intelligence, and homeland security agencies.
The Company’s products and solutions address mission-critical requirements within the defense industry forC4ISR (command, control, communications, computers, intelligence, surveillance and reconnaissance) andelectronic warfare systems and services, and target several markets including maritime defense, airbornereconnaissance, ballistic missile defense, ground mobile and force protection systems and tacticalcommunications and network systems. The Company delivers commercially developed technology and solutionsthat are based on open system architectures and widely adopted industry standards, and supports all of this withservices and support capabilities.
B. Summary of Significant Accounting Policies
PRINCIPLES OF CONSOLIDATION
The consolidated financial statements include the accounts of the Company and its wholly-ownedsubsidiaries. All intercompany transactions and balances have been eliminated.
BUSINESS COMBINATIONS
The Company utilizes the acquisition method of accounting under Financial Accounting Standard Boards(“FASB”) Accounting Standard Codification (“ASC”) 805, Business Combinations, (“FASB ASC 805”), for alltransactions and events which it obtains control over one or more other businesses, to recognize the fair value ofall assets and liabilities acquired, even if less than one hundred percent ownership is acquired, and in establishingthe acquisition date fair value as measurement date for all assets and liabilities assumed. The Company alsoutilizes FASB ASC 805 for the initial recognition and measurement, subsequent measurement and accounting,and disclosure of assets and liabilities arising from contingencies in business combinations.
USE OF ESTIMATES
The preparation of financial statements in conformity with accounting principles generally accepted in theUnited States requires management to make estimates and assumptions that affect the reported amounts of assetsand liabilities and disclosure of contingent assets and liabilities at the dates of the financial statements and thereported amounts of revenues and expenses during the reporting periods. Actual results could differ from thoseestimates.
60

REVENUE RECOGNITION
The Company relies upon FASB ASC 605, Revenue Recognition to account for its revenue transactions.Revenue from system sales is recognized upon shipment provided that title and risk of loss have passed to thecustomer, there is persuasive evidence of an arrangement, the sales price is fixed or determinable, collection ofthe related receivable is reasonably assured, and customer acceptance criteria, if any, have been successfullydemonstrated.
Certain contracts with customers require the Company to perform tests of its products prior to shipment toensure their performance complies with the Company’s published product specifications and, on occasion, withadditional customer-requested specifications. In these cases, the Company conducts such tests and, if they arecompleted successfully, includes a written confirmation with each order shipped. As a result, at the time of eachproduct shipment, the Company believes that no further customer testing requirements exist and that there is nouncertainty of acceptance by its customer.
The Company enters into multiple-deliverable arrangements that may include a combination of hardwarecomponents, related integration or other services. These arrangements generally do not include anyperformance-, cancellation-, termination- or refund-type provisions. Total revenue recognized under multiple-deliverable revenue arrangements in fiscal 2012, 2011 and 2010 was 39%, 50% and 53% of total revenues,respectively.
The Company uses FASB Accounting Standards Update (“ASU”) No. 2009-13 (“FASB ASU 2009-13”),Multiple-Deliverable Revenue Arrangements. FASB ASU 2009-13 establishes a selling price hierarchy fordetermining the selling price of a deliverable, which includes: (1) vendor-specific objective evidence (“VSOE”)if available; (2) third-party evidence (“TPE”) if VSOE is not available; and (3) best estimated selling price(“BESP”), if neither VSOE nor TPE is available. Additionally, FASB ASU 2009-13 expands the disclosurerequirements related to a vendor’s multiple-deliverable revenue arrangements. This guidance was required for theCompany beginning July 1, 2010; however, the Company elected to early adopt, as permitted by the guidance.As such, the Company prospectively applied the provisions of FASB ASU 2009-13 to all revenue arrangementsentered into or materially modified after July 1, 2009.
Per the provisions of FASB ASU 2009-13, the Company allocates arrangement consideration to eachdeliverable in an arrangement based on its relative selling price. The Company generally expects that it will notbe able to establish VSOE or TPE due to limited single element transactions and the nature of the markets inwhich the Company competes, and, as such, the Company typically determines its relative selling price usingBESP.
The Company uses BESP in its allocation of arrangement consideration. The objective of BESP is todetermine the price at which the Company would transact if the product or service were sold by the Company ona standalone basis.
The Company’s determination of BESP involves the consideration of several factors based on the specificfacts and circumstances of each arrangement. Specifically, the Company considers the cost to produce thedeliverable, the anticipated margin on that deliverable, the selling price and profit margin for similar parts, theCompany’s ongoing pricing strategy and policies (as evident from the price list established and updated bymanagement on a regular basis), the value of any enhancements that have been built into the deliverable and thecharacteristics of the varying markets in which the deliverable is sold.
The Company analyzes the selling prices used in its allocation of arrangement consideration at a minimumon an annual basis. Selling prices will be analyzed on a more frequent basis if a significant change in theCompany’s business necessitates a more timely analysis or if the Company experiences significant variances inits selling prices.
61

Each deliverable within the Company’s multiple-deliverable revenue arrangements is accounted for as aseparate unit of accounting under the guidance of FASB ASU 2009-13 if both of the following criteria are met:the delivered item or items have value to the customer on a standalone basis; and for an arrangement thatincludes a general right of return relative to the delivered item(s), delivery or performance of the undelivereditem(s) is considered probable and substantially in the control of the Company. The Company considers adeliverable to have standalone value if the item is sold separately by the Company or another vendor or if theitem could be resold by the customer. Further, the Company’s revenue arrangements generally do not include ageneral right of return relative to delivered products.
Deliverables not meeting the criteria for being a separate unit of accounting are combined with a deliverablethat does meet that criterion. The appropriate allocation of arrangement consideration and recognition of revenueis then determined for the combined unit of accounting.
For transactions involving the licensing of standalone software products and of software that is notincidental to the product, the Company recognizes revenue when there is persuasive evidence of an arrangement,delivery of the software has occurred, the price is fixed or determinable, and collection of the related receivableis reasonably assured. The Company’s software products are generally not deemed essential to the functionalityof any hardware system and do not require installation by the Company or significant modification orcustomization of the software. If fair value of maintenance agreements related to standalone software products isobtained, the fair value of the maintenance agreement is recognized as revenue ratably over the term of eachmaintenance agreement.
In electing to early adopt FASB ASU 2009-13, the Company also early adopted FASB ASU No. 2009-14,Certain Revenue Arrangements That Include Software Elements (“FASB ASU 2009-14”). FASB ASU 2009-14amends the FASB ASC 985-605, Software Revenue Recognition, to change the accounting model for revenuearrangements that include both tangible products and software elements, such that tangible products containingboth software and non-software components that function together to deliver the tangible product’s essentialfunctionality are no longer within the scope of software revenue guidance. These arrangements are insteadsubject to the guidance in FASB ASC 605-25. The Company monitors all multiple-element arrangements todetermine if they are in scope of FASB ASU 2009-14, and when applicable will apply all relevant criteria perguidance. The adoption of FASB ASU 2009-14 has not had a material impact on the Company’s financialposition or results of operations.
For multiple-element arrangements entered into prior to July 1, 2009, in accordance with FASB ASC605-25, the Company defers the greater of the fair value of any undelivered elements of the contract or theportion of the sales price that is not payable until the undelivered elements are delivered.
The Company also engages in long-term contracts for development, production and services activities whichit accounts for consistent with FASB ASC 605-35, Accounting for Performance of Construction-Type andCertain Production-Type Contracts, and other relevant revenue recognition accounting literature. The Companyconsiders the nature of these contracts and the types of products and services provided when determining theproper accounting for a particular contract. Generally for fixed-price contracts, other than service-type contracts,revenue is recognized primarily under the percentage of completion method or, for certain short-term contracts,by the completed contract method. Revenue from service-type fixed-price contracts is recognized ratably overthe contract period or by other appropriate input or output methods to measure service provided, and contractcosts are expensed as incurred. The Company establishes billing terms at the time project deliverables andmilestones are agreed. Revenues recognized in excess of the amounts invoiced to clients are classified as unbilledreceivables. The risk to the Company on a fixed-price contract is that if estimates to complete the contract changefrom one period to the next, profit levels will vary from period to period. For time and materials contracts,revenue reflects the number of direct labor hours expended in the performance of a contract multiplied by thecontract billing rate, as well as reimbursement of other billable direct costs. The risk inherent in time andmaterials contracts is that actual costs may differ materially from negotiated billing rates in the contract, which
62

would directly affect operating income. For all types of contracts, the Company recognizes anticipated contractlosses as soon as they become known and estimable. Out-of-pocket expenses that are reimbursable by thecustomer are included in revenue and cost of revenue.
The use of contract accounting requires significant judgment relative to estimating total contract revenuesand costs, including assumptions relative to the length of time to complete the contract, the nature andcomplexity of the work to be performed, anticipated increases in wages and prices for subcontractor services andmaterials, and the availability of subcontractor services and materials. The Company’s estimates are based uponthe professional knowledge and experience of its engineers, program managers and other personnel, who revieweach long-term contract monthly to assess the contract’s schedule, performance, technical matters and estimatedcost at completion. Changes in estimates are applied retrospectively and when adjustments in estimated contractcosts are identified, such revisions may result in current period adjustments to earnings applicable to performancein prior periods.
The Company does not provide its customers with rights of product return, other than those related towarranty provisions that permit repair or replacement of defective goods. The Company accrues for anticipatedwarranty costs upon product shipment. Revenues from product royalties are recognized upon invoice by theCompany. Additionally, all revenues are reported net of government assessed taxes (e.g. sales taxes or value-added taxes).
CASH AND CASH EQUIVALENTS
Cash equivalents, consisting of highly liquid money market funds and U.S. government and U.S.government agency issues with remaining maturities of 90 days or less at the date of purchase, are carried at fairmarket value which approximates cost. The Company also has restricted cash which is classified as a non-currentasset due to the length of the restriction.
CONCENTRATION OF CREDIT RISK
Financial instruments that potentially expose the Company to concentrations of credit risk consistprincipally of cash, cash equivalents and accounts receivable. The Company places its cash and cash equivalentswith financial institutions that management believes are of high credit quality. At June 30, 2012 and 2011, theCompany had $115,958 and $162,869, respectively, of cash and cash equivalents on deposit or invested with itsfinancial and lending institutions.
The Company provides credit to customers in the normal course of business. The Company performsongoing credit evaluations of its customers’ financial condition and limits the amount of credit extended whendeemed necessary but generally does not require collateral. At June 30, 2012, five customers accounted for 59%of the Company’s receivables, unbilled receivables and cost in excess of billings. At June 30, 2011, fivecustomers accounted for 74% of the Company’s receivables, unbilled receivables and cost in excess of billings.
INVENTORY
Inventory is stated at the lower of cost (first-in, first-out) or market value, and consists of materials, laborand overhead. On a quarterly basis, the Company uses consistent methodologies to evaluate inventory for netrealizable value. Once an item is written down, the value becomes the new inventory cost basis. The Companyreduces the value of inventory for excess and obsolete inventory, consisting of on-hand and non-cancelableon-order inventory in excess of estimated usage. The excess and obsolete inventory evaluation is based uponassumptions about future demand, product mix and possible alternative uses.
63

GOODWILL AND ACQUIRED INTANGIBLE ASSETS
Goodwill is the amount by which the cost of the acquired net assets in a business acquisition exceeded thefair values of the net identifiable assets on the date of purchase. Goodwill is not amortized in accordance with therequirements of FASB ASC 350, Intangibles-Goodwill and Other (“FASB ASC 350”). Goodwill is assessed forimpairment at least annually, on a reporting unit basis, or more frequently when events and circumstances occurindicating that the recorded goodwill may be impaired. If the book value of a reporting unit exceeds its fair value,the implied fair value of goodwill is compared with the carrying amount of goodwill. If the carrying amount ofgoodwill exceeds the implied fair value, an impairment loss is recorded in an amount equal to that excess.
For the year ended June 30, 2012, the Company elected to adopt FASB ASU 2011-08, Intangibles—Goodwill and Other (Topic 350): Testing Goodwill for Impairment (“ASU 2011-08”). Under ASU 2011-08, theCompany has the option to assess qualitative factors to determine whether the existence of events orcircumstances leads to a determination that it is more likely than not that the fair value of a reporting unit is lessthan its carrying amount to determine whether further impairment testing is necessary. Based on the results of thequalitative review of goodwill performed as of June 30, 2012, the Company did not identify any indicators ofimpairment. As such, the two-phase process was not necessary.
Acquired intangible assets result from the Company’s various business acquisitions (see Note E) and certainlicensed technologies, and consist of identifiable intangible assets, including completed technology, licensingagreements, customer relationships, backlog, and non-compete agreements. Acquired intangible assets arereported at cost, net of accumulated amortization and are either amortized on a straight-line basis over theirestimated useful lives of up to seven years or over the period the economic benefits of the intangible asset areconsumed.
LONG-LIVED ASSETS
Long-lived assets primarily include property and equipment and acquired intangible assets. The Companyperiodically evaluates its long-lived assets for events and circumstances that indicate a potential impairment inaccordance with FASB ASC 360, Property, Plant, and Equipment (“FASB ASC 360”). The Company reviewslong-lived assets for impairment whenever events or changes in business circumstances indicate that the carryingamount of the assets may not be fully recoverable or that the useful lives of these assets are no longerappropriate. Each impairment test is based on a comparison of the estimated undiscounted cash flows of the assetas compared to the recorded value of the asset. If impairment is indicated, the asset is written down to itsestimated fair value.
PROPERTY AND EQUIPMENT
Property and equipment are the long-lived, physical assets of the Company acquired for use in theCompany’s normal business operations and are not intended for resale by the Company. These assets arerecorded at cost. Renewals and betterments that increase the useful lives of the assets are capitalized. Repair andmaintenance expenditures that increase the efficiency of the assets are expensed as incurred. Equipment undercapital lease is recorded at the present value of the minimum lease payments required during the lease period.Depreciation is based on the estimated useful lives of the assets using the straight-line method (see Note I).
As assets are retired or sold, the related cost and accumulated depreciation are removed from the accountsand any resulting gain or loss is included in the results of operations.
Expenditures for major software purchases and software developed for internal use are capitalized anddepreciated using the straight-line method over the estimated useful lives of the related assets, which aregenerally three years. For software developed for internal use, all external direct costs for material and servicesand certain payroll and related fringe benefit costs are capitalized in accordance with FASB ASC 350. Duringfiscal 2012 and 2011, the Company capitalized $1,092 and $1,000 of software development costs. Softwaredevelopment costs qualifying for capitalization were not material for the year ended June 30, 2010.
64

DEFERRED REVENUES AND CUSTOMER ADVANCES
Deferred revenues consist of deferred product revenue, billings in excess of revenues, and deferred servicerevenue. Deferred product revenue represents amounts that have been invoiced to customers, but are not yetrecognizable as revenue because one or more of the conditions for revenue recognition have not been met.Billings in excess of revenues represents milestone billing arrangements on percentage of completion projectswhere the billings of the contract exceed recognized revenues. Deferred service revenue primarily representsamounts invoiced to customers for annual maintenance contracts or extended warranty concessions, which arerecognized ratably over the term of the arrangements. Customer advances represent deposits received fromcustomers on an order.
INCOME TAXES
The Company accounts for income taxes under FASB ASC 740, Income Taxes (“FASB ASC 740”). TheCompany recognizes deferred tax assets and liabilities for the expected future tax consequences of events thathave been included in the Company’s consolidated financial statements. Under this method, deferred tax assetsand liabilities are determined based on the difference between the financial statement and tax basis of assets andliabilities using enacted tax rates for the year in which the differences are expected to reverse. The Companyrecords a valuation allowance against net deferred tax assets if, based upon the available evidence, it is morelikely than not that some or all of the deferred tax assets will not be realized.
FASB ASC 740 requires a two-step approach to recognizing and measuring uncertain tax positions. First,the tax position must be evaluated to determine the likelihood that it will be sustained upon external examination.If the tax position is deemed more-likely-than-not to be sustained, the tax position is then assessed to determinethe amount of benefit to recognize in the financial statements. The amount of the benefit that may be recognizedis the largest amount that has a greater than 50% likelihood of being realized upon ultimate settlement.
The Company recognizes interest and penalties accrued on any unrecognized tax benefits as a component ofincome tax expense.
PRODUCT WARRANTY ACCRUAL
The Company’s product sales generally include a 12 month standard hardware warranty. At time of productshipment, the Company accrues for the estimated cost to repair or replace potentially defective products.Estimated warranty costs are based upon prior actual warranty costs for substantially similar transactions and anyspecifically identified warranty requirements.
RESEARCH AND DEVELOPMENT COSTS
Research and development costs are expensed as incurred. Research and development costs are primarilymade up of labor charges and prototype material and development expenses.
STOCK-BASED COMPENSATION
Stock-based compensation cost is measured at the grant date based on the fair value of the award and isrecognized as expense on a straight-line basis over the requisite service period, which generally represents thevesting period, and includes an estimate of the awards that will be forfeited. The Company uses the Black-Scholes valuation model for estimating the fair value on the date of grant of stock options. The fair value of stockoption awards is affected by the Company’s stock price as well as valuation assumptions, including the volatilityof the Company’s stock price, expected term of the option, risk-free interest rate and expected dividends. The fairvalue of restricted stock awards are based on the market price on the date of grant.
65

NET EARNINGS PER SHARE
Basic net earnings per share is calculated by dividing net income by the weighted-average number ofcommon shares outstanding during the period. Diluted net earnings per share computation includes the effect ofshares which would be issuable upon the exercise of outstanding stock options and the vesting of restricted stock,reduced by the number of shares which are assumed to be purchased by the Company under the treasury stockmethod.
Basic and diluted weighted average shares outstanding were as follows:
Years Ended June 30,
2012 2011 2010
Basic weighted-average shares outstanding . . . . . . . . . . . . . . . . . . . . . . . 29,477 25,322 22,559Effect of dilutive equity instruments . . . . . . . . . . . . . . . . . . . . . . . . . . . . 608 887 449
Diluted weighted-average shares outstanding . . . . . . . . . . . . . . . . . . . . . 30,085 26,209 23,008
Weighted average equity instruments to purchase 1,244, 753 and 1,705 shares of common stock were notincluded in the calculation of diluted net earnings per share for the fiscal years ended June 30, 2012, 2011 and2010, respectively, because the equity instruments were anti-dilutive.
On February 16, 2011, the Company completed a follow-on public stock offering of 5,578 shares of theCompany’s common stock, at a price to the public of $17.75, generating net proceeds, after underwriting fees andexpenses, of $93,605. As a result, an additional 5,578 and 2,129 weighted average shares outstanding wereincluded in the calculation of basic and diluted net earnings per shares for fiscal 2012 and 2011.
COMPREHENSIVE INCOME
Comprehensive income consists of net income and other comprehensive income, which includes foreigncurrency translation adjustments and unrealized gains on investments.
The components of accumulated other comprehensive income were as follows:
June 30,
2012 2011
Accumulated foreign currency translation adjustments . . . . . . . . . . . . . . . . . . . . . . $1,306 $1,253Accumulated net unrealized gains on investments . . . . . . . . . . . . . . . . . . . . . . . . . . — 2
Total accumulated other comprehensive income . . . . . . . . . . . . . . . . . . . . . . . . . . . $1,306 $1,255
FOREIGN CURRENCY
Local currencies are used as the functional currency for the Company’s subsidiaries in Europe and Japan.The accounts of foreign subsidiaries are translated using exchange rates in effect at period-end for assets andliabilities and at average exchange rates during the period for results of operations. The related translationadjustments are reported in accumulated other comprehensive income in shareholders’ equity. Gains (losses)resulting from foreign currency transactions are included in other income (expense) and were immaterial for allperiods presented.
RECENTLY ADOPTED ACCOUNTING PRONOUNCEMENTS
Effective July 1, 2011, the Company elected to adopted FASB ASU 2011-08, Intangibles—Goodwill andOther (Topic 350): Testing Goodwill for Impairment (“ASU 2011-08”): an amendment of the FASB AccountingStandards Codification. The ASU permits an entity to make a qualitative assessment of whether it is more likely
66

than not that a reporting unit’s fair value is less than its carrying amount before applying the two-step goodwillimpairment test. If an entity concludes it is not more likely than not that the fair value of a reporting unit is lessthan its carrying amount, it does not need to perform the two-step impairment test. The ASU is effective for theCompany on July 1, 2012; however, the Company has elected to early adopt as permitted by the guidance. Uponadoption, the Company applied ASU 2011-08 to its annual goodwill impairment test using a qualitativeassessment before applying a two-step goodwill impairment test. Such adoption did not have a material impacton the Company’s financial position or results of operations.
RECENTLY ISSUED ACCOUNTING PRONOUNCEMENTS
In December 2011, the FASB issued ASU No. 2011-11, Disclosures about Offsetting Assets and Liabilities,in conjunction with the International Accounting Standards Board (“IASB”)’s issuance of amendments toDisclosures—Offsetting Financial Assets and Financial Liabilities (Amendments to IFRS 7). While the Boardsretained the existing offsetting models under U.S. GAAP and International Financial Reporting Standards(“IFRS”), the new standards require disclosures to allow investors to better compare financial statementsprepared under U.S. GAAP with financial statements prepared under IFRS. The new standards are effective forannual periods beginning January 1, 2013, and interim periods within those annual periods. Retrospectiveapplication is required. This guidance is not expected to have a material impact to our consolidated financialstatements.
In December 2011, the FASB issued ASU No. 2011-12, Comprehensive Income (Topic 220): Deferral ofthe Effective Date for Amendments to the Presentation of Reclassifications of Items Out of Accumulated OtherComprehensive Income in Accounting Standards Update No. 2011-05. The ASU defers the new requirement topresent components of reclassifications of other comprehensive income on the face of the income statement.Companies are still required to adopt the other requirements contained in the new standard on comprehensiveincome, ASU No. 2011-05, Comprehensive Income (Topic 220): Presentation of Comprehensive Income(“ASU 2011-05”). The new standard and this deferral are effective for public entities as of the beginning of afiscal year that begins after December 15, 2011 and interim and annual periods thereafter. Early adoption ispermitted but full retrospective application is required. Effective July 1, 2010, the Company adopted ASU2011-05 and has presented the components of net income and comprehensive income in one consecutivefinancial statement on the Company’s annual and quarterly reports filed on Form 10-K and Form 10-Qrespectively.
C. Acquisitions
KOR AND PDI ACQUISITION
On December 22, 2011, the Company and King Merger Inc., a newly formed, wholly-owned subsidiary ofthe Company (the “Merger Sub”), entered into an Agreement and Plan of Merger (the “Merger Agreement”) withKOR Electronics (“KOR”), and Shareholder Representative Services LLC, as the securityholders’representative. On December 30, 2011, the transaction closed with the Merger Sub being merged with and intoKOR with KOR continuing as the surviving company and wholly-owned subsidiary of the Company (the“Merger”). By operation of the Merger, the Company acquired both KOR and its wholly-owned subsidiary,Paragon Dynamics, Inc. (“PDI”). Based in Cypress, California, KOR designs and develops digital radiofrequency memory (“DRFM”) units for a variety of modern EW applications, as well as radar environmentsimulation and test systems for defense applications. Based in Aurora, Colorado, PDI provides sophisticatedanalytic exploitation services and customized multi-intelligence data fusion solutions for the U.S. intelligencecommunity. For segment reporting, KOR is included in the Advanced Computing Solutions (“ACS”) businesssegment and PDI is included in the MFS business segment.
The Company acquired KOR and PDI for a purchase price of $70,000 paid in cash. The Company fundedthe purchase price with cash on hand. The Company acquired KOR and PDI free of bank debt. The purchaseprice was subject to post-closing adjustment based on a determination of KOR’s closing net working capital.
67
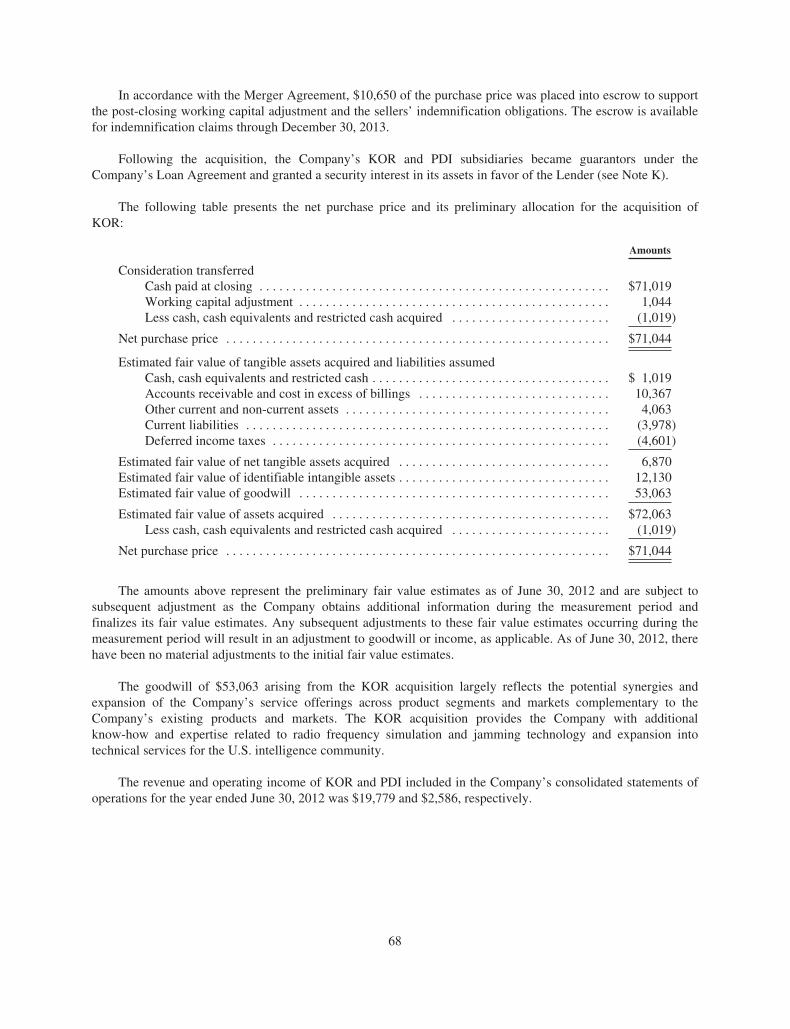
In accordance with the Merger Agreement, $10,650 of the purchase price was placed into escrow to supportthe post-closing working capital adjustment and the sellers’ indemnification obligations. The escrow is availablefor indemnification claims through December 30, 2013.
Following the acquisition, the Company’s KOR and PDI subsidiaries became guarantors under theCompany’s Loan Agreement and granted a security interest in its assets in favor of the Lender (see Note K).
The following table presents the net purchase price and its preliminary allocation for the acquisition ofKOR:
Amounts
Consideration transferredCash paid at closing . . . . . . . . . . . . . . . . . . . . . . . . . . . . . . . . . . . . . . . . . . . . . . . . . . . . . $71,019Working capital adjustment . . . . . . . . . . . . . . . . . . . . . . . . . . . . . . . . . . . . . . . . . . . . . . . 1,044Less cash, cash equivalents and restricted cash acquired . . . . . . . . . . . . . . . . . . . . . . . . (1,019)
Net purchase price . . . . . . . . . . . . . . . . . . . . . . . . . . . . . . . . . . . . . . . . . . . . . . . . . . . . . . . . . . $71,044
Estimated fair value of tangible assets acquired and liabilities assumedCash, cash equivalents and restricted cash . . . . . . . . . . . . . . . . . . . . . . . . . . . . . . . . . . . . $ 1,019Accounts receivable and cost in excess of billings . . . . . . . . . . . . . . . . . . . . . . . . . . . . . 10,367Other current and non-current assets . . . . . . . . . . . . . . . . . . . . . . . . . . . . . . . . . . . . . . . . 4,063Current liabilities . . . . . . . . . . . . . . . . . . . . . . . . . . . . . . . . . . . . . . . . . . . . . . . . . . . . . . . (3,978)Deferred income taxes . . . . . . . . . . . . . . . . . . . . . . . . . . . . . . . . . . . . . . . . . . . . . . . . . . . (4,601)
Estimated fair value of net tangible assets acquired . . . . . . . . . . . . . . . . . . . . . . . . . . . . . . . . 6,870Estimated fair value of identifiable intangible assets . . . . . . . . . . . . . . . . . . . . . . . . . . . . . . . . 12,130Estimated fair value of goodwill . . . . . . . . . . . . . . . . . . . . . . . . . . . . . . . . . . . . . . . . . . . . . . . 53,063
Estimated fair value of assets acquired . . . . . . . . . . . . . . . . . . . . . . . . . . . . . . . . . . . . . . . . . . $72,063Less cash, cash equivalents and restricted cash acquired . . . . . . . . . . . . . . . . . . . . . . . . (1,019)
Net purchase price . . . . . . . . . . . . . . . . . . . . . . . . . . . . . . . . . . . . . . . . . . . . . . . . . . . . . . . . . . $71,044
The amounts above represent the preliminary fair value estimates as of June 30, 2012 and are subject tosubsequent adjustment as the Company obtains additional information during the measurement period andfinalizes its fair value estimates. Any subsequent adjustments to these fair value estimates occurring during themeasurement period will result in an adjustment to goodwill or income, as applicable. As of June 30, 2012, therehave been no material adjustments to the initial fair value estimates.
The goodwill of $53,063 arising from the KOR acquisition largely reflects the potential synergies andexpansion of the Company’s service offerings across product segments and markets complementary to theCompany’s existing products and markets. The KOR acquisition provides the Company with additionalknow-how and expertise related to radio frequency simulation and jamming technology and expansion intotechnical services for the U.S. intelligence community.
The revenue and operating income of KOR and PDI included in the Company’s consolidated statements ofoperations for the year ended June 30, 2012 was $19,779 and $2,586, respectively.
68
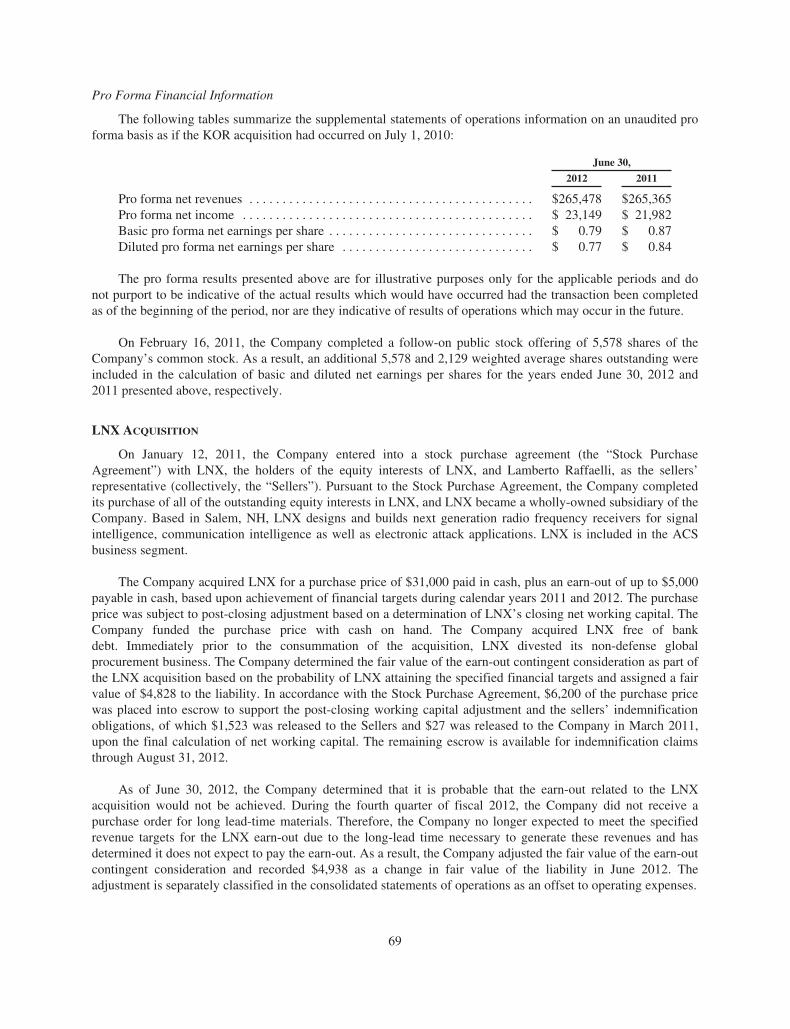
Pro Forma Financial Information
The following tables summarize the supplemental statements of operations information on an unaudited proforma basis as if the KOR acquisition had occurred on July 1, 2010:
June 30,
2012 2011
Pro forma net revenues . . . . . . . . . . . . . . . . . . . . . . . . . . . . . . . . . . . . . . . . . . . $265,478 $265,365Pro forma net income . . . . . . . . . . . . . . . . . . . . . . . . . . . . . . . . . . . . . . . . . . . . $ 23,149 $ 21,982Basic pro forma net earnings per share . . . . . . . . . . . . . . . . . . . . . . . . . . . . . . . $ 0.79 $ 0.87Diluted pro forma net earnings per share . . . . . . . . . . . . . . . . . . . . . . . . . . . . . $ 0.77 $ 0.84
The pro forma results presented above are for illustrative purposes only for the applicable periods and donot purport to be indicative of the actual results which would have occurred had the transaction been completedas of the beginning of the period, nor are they indicative of results of operations which may occur in the future.
On February 16, 2011, the Company completed a follow-on public stock offering of 5,578 shares of theCompany’s common stock. As a result, an additional 5,578 and 2,129 weighted average shares outstanding wereincluded in the calculation of basic and diluted net earnings per shares for the years ended June 30, 2012 and2011 presented above, respectively.
LNX ACQUISITION
On January 12, 2011, the Company entered into a stock purchase agreement (the “Stock PurchaseAgreement”) with LNX, the holders of the equity interests of LNX, and Lamberto Raffaelli, as the sellers’representative (collectively, the “Sellers”). Pursuant to the Stock Purchase Agreement, the Company completedits purchase of all of the outstanding equity interests in LNX, and LNX became a wholly-owned subsidiary of theCompany. Based in Salem, NH, LNX designs and builds next generation radio frequency receivers for signalintelligence, communication intelligence as well as electronic attack applications. LNX is included in the ACSbusiness segment.
The Company acquired LNX for a purchase price of $31,000 paid in cash, plus an earn-out of up to $5,000payable in cash, based upon achievement of financial targets during calendar years 2011 and 2012. The purchaseprice was subject to post-closing adjustment based on a determination of LNX’s closing net working capital. TheCompany funded the purchase price with cash on hand. The Company acquired LNX free of bankdebt. Immediately prior to the consummation of the acquisition, LNX divested its non-defense globalprocurement business. The Company determined the fair value of the earn-out contingent consideration as part ofthe LNX acquisition based on the probability of LNX attaining the specified financial targets and assigned a fairvalue of $4,828 to the liability. In accordance with the Stock Purchase Agreement, $6,200 of the purchase pricewas placed into escrow to support the post-closing working capital adjustment and the sellers’ indemnificationobligations, of which $1,523 was released to the Sellers and $27 was released to the Company in March 2011,upon the final calculation of net working capital. The remaining escrow is available for indemnification claimsthrough August 31, 2012.
As of June 30, 2012, the Company determined that it is probable that the earn-out related to the LNXacquisition would not be achieved. During the fourth quarter of fiscal 2012, the Company did not receive apurchase order for long lead-time materials. Therefore, the Company no longer expected to meet the specifiedrevenue targets for the LNX earn-out due to the long-lead time necessary to generate these revenues and hasdetermined it does not expect to pay the earn-out. As a result, the Company adjusted the fair value of the earn-outcontingent consideration and recorded $4,938 as a change in fair value of the liability in June 2012. Theadjustment is separately classified in the consolidated statements of operations as an offset to operating expenses.
69

D. Goodwill
The following table sets forth the changes in the carrying amount of goodwill for the years ended June 30,2012 and 2011:
ACS MFS Total
Balance at June 30, 2010, . . . . . . . . . . . . . . . . . . . . . . . . . . . . . . . . $ 57,653 $ — $ 57,653Goodwill arising from the LNX acquisition . . . . . . . . . . . . . 21,905 — 21,905
Balance at June 30, 2011 . . . . . . . . . . . . . . . . . . . . . . . . . . . . . . . . 79,558 — 79,558Goodwill arising from the KOR acquisition . . . . . . . . . . . . . 33,913 19,150 53,063
Balance at June 30, 2012 . . . . . . . . . . . . . . . . . . . . . . . . . . . . . . . . $113,471 $19,150 $132,621
In fiscal 2012, there were no triggering events, as defined by FASB ASC 350, which required an interimgoodwill impairment test. The Company performs its annual goodwill impairment test in the fourth quarter ofeach fiscal year.
The Company determines its reporting units in accordance with FASB ASC 350, by assessing whetherdiscrete financial information is available and if management regularly reviews the operating results of thatcomponent. Following this assessment, the Company determined that its reporting units are the same as itsoperating segments, ACS and MFS. As of June 30, 2012, both ACS and MFS had goodwill balances, as such; theannual impairment analysis was performed for each reporting unit in the fourth quarter of fiscal year 2012.
The Company tests goodwill for impairment by evaluating the fair value of the reporting unit as comparedto the book value. If the book value of the reporting unit exceeds its fair value, the implied fair value of goodwillis compared with the carrying amount of goodwill. If the carrying amount of goodwill exceeds the implied fairvalue, an impairment loss is recorded in an amount equal to that excess.
For fiscal 2011, this evaluation was performed in the Company’s fourth quarter. The evaluation wasperformed consistent with prior years and relied on a discounted cash flow analysis, which was corroborated bytwo market-based analyses: one evaluated guideline companies and another that reviewed comparabletransactions. For each analysis performed, the fair value of the reporting unit was deemed to be in excess of thebook value. As such, no impairment charge was recorded.
For the year ended June 30, 2012, the Company elected to adopt ASU 2011-08. Under ASU 2011-08, theCompany has the option to assess qualitative factors to determine whether the existence of events orcircumstances leads to a determination that it is more likely than not that the fair value of a reporting unit is lessthan its carrying amount to determine whether further impairment testing is necessary. Based on the results of thequalitative review of goodwill performed as of June 30, 2012, the Company did not identify any indicators ofimpairment. As such, no impairment charge was recorded for fiscal 2012.
In fiscal 2012, 2011 and 2010, goodwill was determined to be appropriately valued and no impairmentcharge was recorded.
70

E. Acquired Intangible Assets
Acquired intangible assets consisted of the following:
GrossCarryingAmount
AccumulatedAmortization
NetCarryingAmount
WeightedAverageUsefulLife
JUNE 30, 2012Customer relationships . . . . . . . . . . . . . . . . . . . . . . . . . . . . . . . . . . $26,770 $ (9,217) $17,553 6.9 yearsLicensing agreements and patents . . . . . . . . . . . . . . . . . . . . . . . . . 4,095 (2,365) 1,730 5.4 yearsCompleted technologies . . . . . . . . . . . . . . . . . . . . . . . . . . . . . . . . . 5,570 (1,007) 4,563 5.3 yearsTrademarks . . . . . . . . . . . . . . . . . . . . . . . . . . . . . . . . . . . . . . . . . . . 990 (95) 895 6.0 yearsBacklog . . . . . . . . . . . . . . . . . . . . . . . . . . . . . . . . . . . . . . . . . . . . . . 800 (588) 212 2.0 yearsNon-compete agreements . . . . . . . . . . . . . . . . . . . . . . . . . . . . . . . . 500 (370) 130 5.0 years
$38,725 $(13,642) $25,083
JUNE 30, 2011Customer relationships . . . . . . . . . . . . . . . . . . . . . . . . . . . . . . . . . . $18,300 $ (7,530) $10,770 6.7 yearsLicensing agreements and patents . . . . . . . . . . . . . . . . . . . . . . . . . 4,045 (1,622) 2,423 5.5 yearsCompleted technologies . . . . . . . . . . . . . . . . . . . . . . . . . . . . . . . . . 2,900 (227) 2,673 6.0 yearsBacklog . . . . . . . . . . . . . . . . . . . . . . . . . . . . . . . . . . . . . . . . . . . . . . 800 (188) 612 2.0 yearsNon-compete agreements . . . . . . . . . . . . . . . . . . . . . . . . . . . . . . . . 500 (276) 224 5.0 years
$26,545 $ (9,843) $16,702
Estimated future amortization expense for acquired intangible assets remaining at June 30, 2012 is asfollows:
Year EndingJune 30,
2013 . . . . . . . . . . . . . . . . . . . . . . . . . . . . . . . . . . . . . . . . . . . . . . . . . . . . . . . . . . . . . . . . . . . $ 4,8262014 . . . . . . . . . . . . . . . . . . . . . . . . . . . . . . . . . . . . . . . . . . . . . . . . . . . . . . . . . . . . . . . . . . . 4,8112015 . . . . . . . . . . . . . . . . . . . . . . . . . . . . . . . . . . . . . . . . . . . . . . . . . . . . . . . . . . . . . . . . . . . 4,6692016 . . . . . . . . . . . . . . . . . . . . . . . . . . . . . . . . . . . . . . . . . . . . . . . . . . . . . . . . . . . . . . . . . . . 4,1852017 . . . . . . . . . . . . . . . . . . . . . . . . . . . . . . . . . . . . . . . . . . . . . . . . . . . . . . . . . . . . . . . . . . . 2,703Thereafter . . . . . . . . . . . . . . . . . . . . . . . . . . . . . . . . . . . . . . . . . . . . . . . . . . . . . . . . . . . . . . . 3,889
Total future amortization expense . . . . . . . . . . . . . . . . . . . . . . . . . . . . . . . . . . . . . . . . . . . . $25,083
The following table summarizes the preliminary estimated fair value of acquired intangible assets arising asa result of the KOR acquisition. These assets are included in the Company’s gross and net carrying amounts as ofJune 30, 2012.
GrossCarryingAmount
AccumulatedAmortization
NetCarryingAmount
WeightedAverageUsefulLife
Customer relationships . . . . . . . . . . . . . . . . . . . . . . . . . . . . . . . . . . $ 8,470 $(592) $ 7,878 7.2 yearsCompleted technologies . . . . . . . . . . . . . . . . . . . . . . . . . . . . . . . . . 2,670 (297) 2,373 4.5 yearsTrademark . . . . . . . . . . . . . . . . . . . . . . . . . . . . . . . . . . . . . . . . . . . . 990 (95) 895 6.0 years
Total . . . . . . . . . . . . . . . . . . . . . . . . . . . . . . . . . . . . . . . . . . . . . . . . $12,130 $(984) $11,146 6.5 years
71

F. Fair Value of Financial Instruments
The Company measures at fair value certain financial assets and liabilities, including cash equivalents,restricted cash, ARS and contingent consideration. FASB ASC 820, Fair Value Measurement and Disclosures,specifies a hierarchy of valuation techniques based on whether the inputs to those valuation techniques areobservable or unobservable. Observable inputs reflect market data obtained from independent sources, whileunobservable inputs reflect the Company’s market assumptions. These two types of inputs have created thefollowing fair-value hierarchy:
Level 1—Quoted prices for identical instruments in active markets;
Level 2—Quoted prices for similar instruments in active markets, quoted prices for identical or similarinstruments in markets that are not active, and model-derived valuations in which all significant inputsand significant value drivers are observable in active markets; and
Level 3—Valuations derived from valuation techniques in which one or more significant inputs orsignificant value drivers are unobservable.
The following table summarizes the Company’s financial assets measured at fair value on a recurring basisat June 30, 2012:
Fair Value Measurements
June 30,2012 Level 1 Level 2 Level 3
Assets:U.S. Treasury bills and money market funds . . . . . . . . . . . . . . . . . . $ 97,049 $ 97,049 $— $—Restricted cash . . . . . . . . . . . . . . . . . . . . . . . . . . . . . . . . . . . . . . . . . . 3,281 3,281 — —
Total . . . . . . . . . . . . . . . . . . . . . . . . . . . . . . . . . . . . . . . . . . . . . . . . . . $100,330 $100,330 $— $—
The carrying values of cash and cash equivalents, including U.S. Treasury bills and money market funds,accounts receivable and payable, and accrued liabilities approximate fair value due to the short-term maturities ofthese assets and liabilities.
The Company determines the fair value of the contingent consideration related to the LNX acquisition basedon the probability of LNX attaining specific financial targets using an appropriate discount rate to present valuethe liability. As of June 30, 2012, the Company determined that it is probable that the earn-out related to the LNXacquisition would not be achieved (see Note C). As a result, the Company adjusted the fair value of the LNXearn-out contingent consideration and recorded $4,938 as a change in fair value in June 2012. The adjustment isseparately classified on the statement of operations and is reflected as an offset to operating expenses. Thefollowing table provides a rollforward of the fair value of the contingent consideration, whose fair values weredetermined by Level 3 inputs:
Fair Value
Balance at June 30, 2010 . . . . . . . . . . . . . . . . . . . . . . . . . . . . . . . . . . . . . . . . . . . . . . . . . . . . $ —Contingent consideration from the LNX acquisition . . . . . . . . . . . . . . . . . . . . . . . . . . . 4,828Recognition of accretion expense in operating expenses . . . . . . . . . . . . . . . . . . . . . . . . 26
Balance at June 30, 2011 . . . . . . . . . . . . . . . . . . . . . . . . . . . . . . . . . . . . . . . . . . . . . . . . . . . . $ 4,854Recognition of accretion expense in operating expenses . . . . . . . . . . . . . . . . . . . . . . . . 84Change in the fair value of the liability related to the LNX earn-out . . . . . . . . . . . . . . . (4,938)
Balance at June 30, 2012 . . . . . . . . . . . . . . . . . . . . . . . . . . . . . . . . . . . . . . . . . . . . . . . . . . . . $ —
72

The following table summarizes the Company’s financial assets and liabilities measured at fair value on arecurring basis at June 30, 2011:
Fair Value Measurements
June 30,2011 Level 1 Level 2 Level 3
Assets:U.S. Treasury bills and money market funds . . . . . . . . . . . . . . . . . . $153,038 $153,038 $— $ —Restricted cash . . . . . . . . . . . . . . . . . . . . . . . . . . . . . . . . . . . . . . . . . 3,000 3,000 — —
Total . . . . . . . . . . . . . . . . . . . . . . . . . . . . . . . . . . . . . . . . . . . . . . . . . $156,038 $156,038 $— $ —
Liabilities:Contingent consideration . . . . . . . . . . . . . . . . . . . . . . . . . . . . . . . . . $ 4,854 $ — $— $4,854
G. Inventory
Inventory was comprised of the following:
June 30,
2012 2011
Raw materials . . . . . . . . . . . . . . . . . . . . . . . . . . . . . . . . . . . . . . . . . . . . . . . . . . . . . . . . . . . . . . $11,246 $ 7,314Work in process . . . . . . . . . . . . . . . . . . . . . . . . . . . . . . . . . . . . . . . . . . . . . . . . . . . . . . . . . . . . . 8,979 7,554Finished goods . . . . . . . . . . . . . . . . . . . . . . . . . . . . . . . . . . . . . . . . . . . . . . . . . . . . . . . . . . . . . . 5,620 3,672
Total . . . . . . . . . . . . . . . . . . . . . . . . . . . . . . . . . . . . . . . . . . . . . . . . . . . . . . . . . . . . . . . . . $25,845 $18,540
There are no amounts in inventory relating to contracts having production cycles longer than one year.During fiscal 2012, the Company has purchased inventories which were nearing the end of their production lifeand hence executed last time buy purchases with its vendors to be able to support certain products and the relatedcustomers into the foreseeable future.
H. Restricted Cash
The Company had restricted cash balance of $3,281 and $3,000 as of June 30, 2012 and 2011, respectively.The balance consisted of the following: (1) the Company has deposited $3,000 with its bank as collateral for thelandlord pursuant to the sale-lease back transaction entered in April 2007 for the Company’s headquarters inChelmsford, Massachusetts (see Note I). The balance is classified as restricted cash on the accompanyingconsolidated balance sheet at June 30, 2012 and 2011, and is reflected in non-current assets: (2) the terms of oneof the Company’s contracts with a foreign customer requires a certificate of deposit to be held at a commercialbank until performance on the contract has been completed. This certificate of deposit represents restricted cashof approximately $281. The balance is classified as restricted cash on the accompanying consolidated balancesheet at June 30, 2012 and is reflected in non-current assets.
73

I. Property and Equipment
Property and equipment consisted of the following:
Estimated Useful Lives(Years)
June 30,
2012 2011
Computer equipment and software . . . . . . . . . . . . . . . . . . . . . . 2-4 $ 51,372 $ 47,675Furniture and fixtures . . . . . . . . . . . . . . . . . . . . . . . . . . . . . . . . . 5 7,110 6,967Building and leasehold improvements . . . . . . . . . . . . . . . . . . . . lesser of estimated useful
life or lease term 2,313 1,837Machinery and equipment . . . . . . . . . . . . . . . . . . . . . . . . . . . . . 5 7,838 5,213Vehicles . . . . . . . . . . . . . . . . . . . . . . . . . . . . . . . . . . . . . . . . . . . 5 88 119
68,721 61,811Less: accumulated depreciation and amortization . . . . . . . . . . . (52,792) (47,291)
$ 15,929 $ 14,520
In fiscal 2012 and 2011, the Company retired $2,058 and $10,143, respectively, of fully depreciatedcomputer equipment and software assets that were no longer in use by the Company. The retirement was part ofan on-going effort by the Company to review and identify all assets that are still in use by the Company, and toretire those that are not.
Depreciation and amortization expense related to property and equipment for the fiscal years ended June 30,2012, 2011 and 2010 was $7,859, $6,364 and $5,147, respectively.
On April 20, 2007, the Company entered into a sales agreement and a lease agreement in connection with asale-leaseback of the Company’s headquarters in Chelmsford, Massachusetts. Pursuant to the agreements, theCompany sold all land, land improvements, buildings and building improvements related to the facilities andleased back those assets. The term of the lease is ten years and includes two five year options to renew. Under theprovisions of sale-leaseback accounting, the transaction was considered a normal leaseback; thus the realizedgain of $11,569 was deferred and will be amortized to other income on a straight-line basis over the initial leaseterm.
The unamortized deferred gain consisted of the following of which the current portion is included in accruedexpenses and the non-current portion is separately classified in the accompanying consolidated balance sheets:
June 30,
2012 2011
Current portion . . . . . . . . . . . . . . . . . . . . . . . . . . . . . . . . . . . . . . . . . . . . . . . . . . . . . $1,157 $1,157Non-current portion . . . . . . . . . . . . . . . . . . . . . . . . . . . . . . . . . . . . . . . . . . . . . . . . . . 4,399 5,556
Total unamortized deferred gain . . . . . . . . . . . . . . . . . . . . . . . . . . . . . . . . . . . . $5,556 $6,713
J. Product Warranty Accrual
All of the Company’s product sales generally include a 12 month standard hardware warranty. At the timeof product shipment, the Company accrues the estimated cost to repair or replace potentially defective products.Estimated warranty costs are based upon prior actual warranty costs for substantially similar transactions andother specifically identified warranty matters. Product warranty accrual is included as part of accrued expenses inthe accompanying consolidated balance sheets. The following table presents the changes in the Company’sproduct warranty accrual.
74
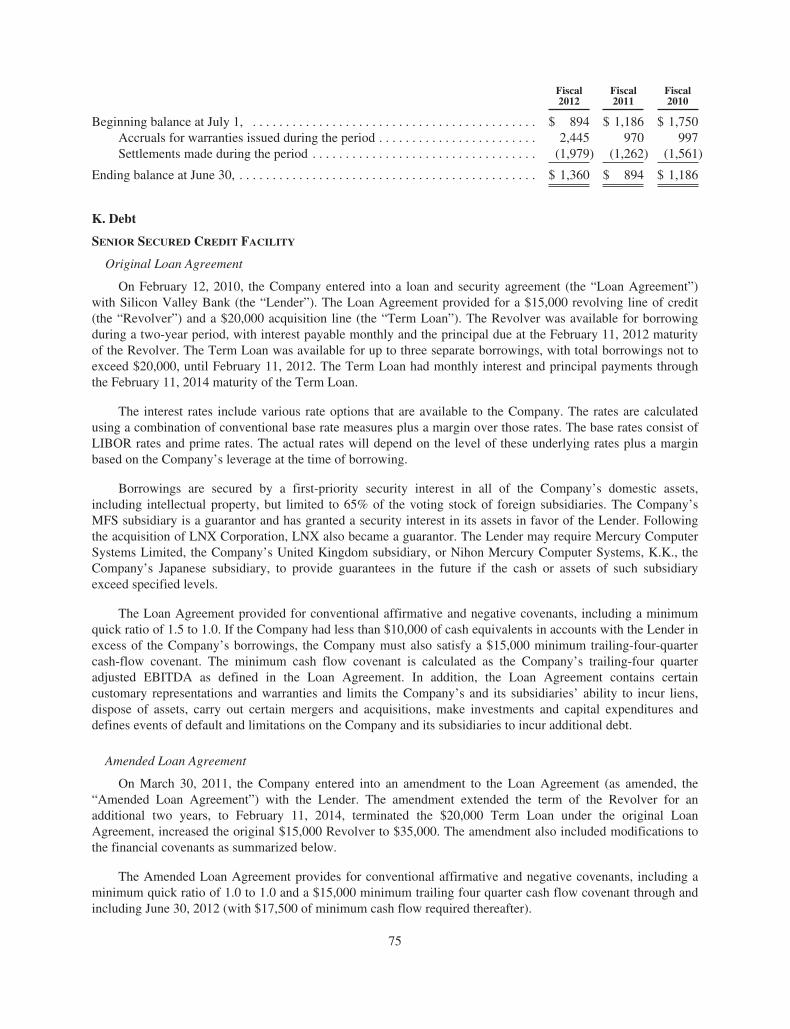
Fiscal2012
Fiscal2011
Fiscal2010
Beginning balance at July 1, . . . . . . . . . . . . . . . . . . . . . . . . . . . . . . . . . . . . . . . . . . . $ 894 $ 1,186 $ 1,750Accruals for warranties issued during the period . . . . . . . . . . . . . . . . . . . . . . . . 2,445 970 997Settlements made during the period . . . . . . . . . . . . . . . . . . . . . . . . . . . . . . . . . . (1,979) (1,262) (1,561)
Ending balance at June 30, . . . . . . . . . . . . . . . . . . . . . . . . . . . . . . . . . . . . . . . . . . . . . $ 1,360 $ 894 $ 1,186
K. Debt
SENIOR SECURED CREDIT FACILITY
Original Loan Agreement
On February 12, 2010, the Company entered into a loan and security agreement (the “Loan Agreement”)with Silicon Valley Bank (the “Lender”). The Loan Agreement provided for a $15,000 revolving line of credit(the “Revolver”) and a $20,000 acquisition line (the “Term Loan”). The Revolver was available for borrowingduring a two-year period, with interest payable monthly and the principal due at the February 11, 2012 maturityof the Revolver. The Term Loan was available for up to three separate borrowings, with total borrowings not toexceed $20,000, until February 11, 2012. The Term Loan had monthly interest and principal payments throughthe February 11, 2014 maturity of the Term Loan.
The interest rates include various rate options that are available to the Company. The rates are calculatedusing a combination of conventional base rate measures plus a margin over those rates. The base rates consist ofLIBOR rates and prime rates. The actual rates will depend on the level of these underlying rates plus a marginbased on the Company’s leverage at the time of borrowing.
Borrowings are secured by a first-priority security interest in all of the Company’s domestic assets,including intellectual property, but limited to 65% of the voting stock of foreign subsidiaries. The Company’sMFS subsidiary is a guarantor and has granted a security interest in its assets in favor of the Lender. Followingthe acquisition of LNX Corporation, LNX also became a guarantor. The Lender may require Mercury ComputerSystems Limited, the Company’s United Kingdom subsidiary, or Nihon Mercury Computer Systems, K.K., theCompany’s Japanese subsidiary, to provide guarantees in the future if the cash or assets of such subsidiaryexceed specified levels.
The Loan Agreement provided for conventional affirmative and negative covenants, including a minimumquick ratio of 1.5 to 1.0. If the Company had less than $10,000 of cash equivalents in accounts with the Lender inexcess of the Company’s borrowings, the Company must also satisfy a $15,000 minimum trailing-four-quartercash-flow covenant. The minimum cash flow covenant is calculated as the Company’s trailing-four quarteradjusted EBITDA as defined in the Loan Agreement. In addition, the Loan Agreement contains certaincustomary representations and warranties and limits the Company’s and its subsidiaries’ ability to incur liens,dispose of assets, carry out certain mergers and acquisitions, make investments and capital expenditures anddefines events of default and limitations on the Company and its subsidiaries to incur additional debt.
Amended Loan Agreement
On March 30, 2011, the Company entered into an amendment to the Loan Agreement (as amended, the“Amended Loan Agreement”) with the Lender. The amendment extended the term of the Revolver for anadditional two years, to February 11, 2014, terminated the $20,000 Term Loan under the original LoanAgreement, increased the original $15,000 Revolver to $35,000. The amendment also included modifications tothe financial covenants as summarized below.
The Amended Loan Agreement provides for conventional affirmative and negative covenants, including aminimum quick ratio of 1.0 to 1.0 and a $15,000 minimum trailing four quarter cash flow covenant through andincluding June 30, 2012 (with $17,500 of minimum cash flow required thereafter).
75

There are no other changes to the Loan Agreement other than the modification described above.
Following the acquisition of KOR Electronics, both KOR and PDI became guarantors.
The Company has had no borrowings under the credit facility since inception and was in compliance withall covenants in the Amended Loan Agreement as of June 30, 2012.
L. Commitments and Contingencies
LEGAL CLAIMS
The U.S. Department of Justice (“DOJ”) is conducting an investigation into the conduct of certain formeremployees of PDI in the 2008-2009 time frame and has asserted that such conduct may have constituted aviolation of the Procurement Integrity Act and that civil penalties would apply to any such violations. PDI and itsformer parent company, KOR, have been cooperating in the investigation. While the parties have engaged indiscussions and correspondence regarding this matter, no resolution has been reached and no litigation hascommenced. The Company is entitled to indemnity with respect to this matter pursuant to the terms of theMerger Agreement, and based on this indemnity and the associated escrow arrangement, the matter is notexpected to have a material impact on the Company’s cash flows, results of operations, or financial condition.
In addition to the foregoing, the Company is subject to litigation, claims, investigations and audits arisingfrom time to time in the ordinary course of its business. Although legal proceedings are inherently unpredictable,the Company believes that it has valid defenses with respect to those matters currently pending against it andintends to defend itself vigorously. The outcome of these matters, individually and in the aggregate, is notexpected to have a material impact on the Company’s cash flows, results of operations, or financial position.
INDEMNIFICATION OBLIGATIONS
The Company’s standard product sales and license agreements entered into in the ordinary course of businesstypically contain an indemnification provision pursuant to which the Company indemnifies, holds harmless, andagrees to reimburse the indemnified party for losses suffered or incurred by the indemnified party in connectionwith any patent, copyright or other intellectual property infringement claim by any third party with respect to theCompany’s products. Such provisions generally survive termination or expiration of the agreements. The potentialamount of future payments the Company could be required to make under these indemnification provisions is, insome instances, unlimited.
PURCHASE COMMITMENTS
As of June 30, 2012, the Company has entered into non-cancelable purchase commitments for certaininventory components and services used in its normal operations. The purchase commitments covered by theseagreements are for less than one year and aggregate to $14,002.
76

LEASE COMMITMENTS
The Company leases certain facilities, machinery and equipment under various cancelable andnon-cancelable operating leases that expire at various dates through fiscal 2017. The leases contain variousrenewal options. Rental charges are subject to escalation for increases in certain operating costs of the lessor. Fortenant improvement allowances and rent holidays, the Company records a deferred rent liability on theconsolidated balance sheets and amortizes the deferred rent over the terms of the leases as reductions to rentexpense on the consolidated statements of operations. Rental expense during the fiscal years ended June 30,2012, 2011 and 2010 was $3,803, $3,369 and $3,613, respectively. Minimum lease payments under theCompany’s non-cancelable operating leases are as follows:
Year EndingJune 30,
2013 . . . . . . . . . . . . . . . . . . . . . . . . . . . . . . . . . . . . . . . . . . . . . . . . . . . . . . . . . . . . . . . . . . . . . . . . . . . . 3,9052014 . . . . . . . . . . . . . . . . . . . . . . . . . . . . . . . . . . . . . . . . . . . . . . . . . . . . . . . . . . . . . . . . . . . . . . . . . . . . 3,4612015 . . . . . . . . . . . . . . . . . . . . . . . . . . . . . . . . . . . . . . . . . . . . . . . . . . . . . . . . . . . . . . . . . . . . . . . . . . . . 2,7772016 . . . . . . . . . . . . . . . . . . . . . . . . . . . . . . . . . . . . . . . . . . . . . . . . . . . . . . . . . . . . . . . . . . . . . . . . . . . . 2,6622017 . . . . . . . . . . . . . . . . . . . . . . . . . . . . . . . . . . . . . . . . . . . . . . . . . . . . . . . . . . . . . . . . . . . . . . . . . . . . 2,231
Total minimum lease payments . . . . . . . . . . . . . . . . . . . . . . . . . . . . . . . . . . . . . . . . . . . . . . . . . . . . . . . $15,036
M. Shareholders’ Equity
FOLLOW-ON PUBLIC STOCK OFFERING
On February 16, 2011, the Company completed a follow-on public stock offering of 5,578 shares ofcommon stock, which were sold at a price to the public of $17.75. The follow-on public stock offering resulted in$93,605 of net proceeds to the Company. The underwriting discount of $4,950 and other expenses of $446related to the follow-on public stock offering were recorded as an offset to additional paid-in-capital.
PREFERRED STOCK
The Company is authorized to issue 1,000 shares of preferred stock with a par value of $0.01 per share.
SHAREHOLDER RIGHTS PLAN
The Company has adopted a Shareholder Rights Plan, the purpose of which is, among other things, toenhance the Board’s ability to protect the shareholder interests and to ensure that shareholders receive fairtreatment in the event any coercive takeover attempt of the Company is made in the future. The followingsummary description of the Shareholder Rights Plan does not purport to be complete and is qualified in itsentirety by reference to the Company’s Shareholder Rights Plan, which has been previously filed with theSecurities and Exchange Commission as an exhibit to a Registration Statement on Form 8-A.
In connection with the adoption of the Shareholder Rights Plan, the Board of Directors of the Companydeclared a dividend distribution of one preferred stock purchase right (a “Right”) for each outstanding share ofcommon stock to shareholders of record as of the close of business on December 23, 2005. The Rights currentlyare not exercisable and are attached to and trade with the outstanding shares of common stock. Under theShareholder Rights Plan, the Rights become exercisable if a person becomes an “acquiring person” by acquiring15% or more of the outstanding shares of common stock or if a person commences a tender offer that wouldresult in that person owning 15% or more of the common stock. If a person becomes an “acquiring person,” eachholder of a Right (other than the acquiring person) would be entitled to purchase, at the then-current exerciseprice, such number of shares of the Company’s preferred stock which are equivalent to shares of common stockhaving a value of twice the exercise price of the Right. If the Company is acquired in a merger or other businesscombination transaction after any such event, each holder of a Right would then be entitled to purchase, at thethen-current exercise price, shares of the acquiring company’s common stock having a value of twice theexercise price of the Right.
77

STOCK NET SETTLEMENT PROGRAM
The Company may net settle shares in connection with the surrender of shares to cover the minimum taxeson vesting of restricted stock. During fiscal 2010, 42 shares were net settled in such transactions for a total costof $433. Effective May 1, 2010, the Company discontinued the net share settlement practice for settling restrictedstock awards.
N. Stock-Based Compensation
STOCK OPTION PLANS
The number of shares authorized for issuance under the Company’s 2005 Stock Incentive Plan , as amendedand restated (the “2005 Plan”), is 6,092 shares, including a 1,000 share increase approved by the Company’sshareholders on October 21, 2011. The 2005 Plan will be increased by any future cancellations, forfeitures orterminations (other than by exercise) under the Company’s 1997 Stock Option Plan (the “1997 Plan”). The 2005Plan provides for the grant of non-qualified and incentive stock options, restricted stock, stock appreciation rightsand deferred stock awards to employees and non-employees. All stock options are granted with an exercise priceof not less than 100% of the fair value of the Company’s common stock at the date of grant and the optionsgenerally have a term of seven years. There were 2,675 shares available for future grant under the 2005 Plan atJune 30, 2012.
The number of shares authorized for issuance under the 1997 Plan was 8,650 shares, of which 100 sharescould be issued pursuant to restricted stock grants. The 1997 Plan provided for the grant of non-qualified andincentive stock options and restricted stock to employees and non-employees. All stock options were grantedwith an exercise price of not less than 100% of the fair value of the Company’s common stock at the date ofgrant. The options typically vest over periods of zero to four years and have a maximum term of 10 years.Following shareholder approval of the 2005 Plan on November 14, 2005, the Company’s Board of Directorsdetermined that no further grants of stock options or other awards would be made under the 1997 Plan, and the1997 Plan subsequently expired in June 2007. The foregoing does not affect any outstanding awards under the1997 Plan, which remain in full force and effect in accordance with their terms.
EMPLOYEE STOCK PURCHASE PLAN
The number of shares authorized for issuance under the Company’s 1997 Employee Stock Purchase Plan, asamended and restated (“ESPP”), is 1,400 shares, including a 300 share increase approved by the Company’sshareholders on October 21, 2011. Under the ESPP, rights are granted to purchase shares of common stock at85% of the lesser of the market value of such shares at either the beginning or the end of each six-month offeringperiod. The ESPP permits employees to purchase common stock through payroll deductions, which may notexceed 10% of an employee’s compensation as defined in the ESPP. The number of shares issued under theESPP during fiscal years 2012, 2011 and 2010 was 104, 89 and 94, respectively. Shares available for futurepurchase under the ESPP totaled 360 at June 30, 2012.
78

STOCK OPTION AND AWARD ACTIVITY
The following table summarizes activity of the Company’s stock option plans since June 30, 2010:
Options Outstanding
Number ofShares
Weighted AverageExercise Price
Weighted AverageRemaining
Contractual Term(Years)
AggregateIntrinsic Value as
of 6/30/2012
Outstanding at June 30, 2010 . . . . . . . . . . . . 2,612 $13.70 4.69Granted . . . . . . . . . . . . . . . . . . . . . . . . . . . . . . . 77 13.70Exercised . . . . . . . . . . . . . . . . . . . . . . . . . . . . . (315) 8.25Cancelled . . . . . . . . . . . . . . . . . . . . . . . . . . . . . (81) 16.41
Outstanding at June 30, 2011 . . . . . . . . . . . . 2,293 $14.35 3.88Granted . . . . . . . . . . . . . . . . . . . . . . . . . . . . . . . — —Exercised . . . . . . . . . . . . . . . . . . . . . . . . . . . . . (72) 6.48Cancelled . . . . . . . . . . . . . . . . . . . . . . . . . . . . . (36) 23.70
Outstanding at June 30, 2012 . . . . . . . . . . . . 2,185 $14.46 2.89 $3,489
Vested and expected to vest at June 30,2012 . . . . . . . . . . . . . . . . . . . . . . . . . . . . . . . 2,184 $14.46 2.88 $3,486
Exercisable at June 30, 2012 . . . . . . . . . . . . . 2,102 $14.66 2.85 $3,173
The intrinsic value of the options exercised during fiscal year 2012, 2011 and 2010 was $534, $2,979 and$532, respectively. Non-vested stock options are subject to the risk of forfeiture until the fulfillment of specifiedconditions. As of June 30, 2012, there was $110 of total unrecognized compensation cost related to non-vestedoptions granted under the Company’s stock plans that is expected to be recognized over a weighted-averageperiod of 0.3 years from June 30, 2012. As of June 30, 2011, there was $1,218 of total unrecognizedcompensation cost related to non-vested options granted under the Company’s stock plans that was expected tobe recognized over a weighted-average period of 0.9 years from June 30, 2011.
The following table summarizes the status of the Company’s non-vested restricted stock awards sinceJune 30, 2010:
Non-vested Restricted Stock Awards
Number ofShares
Weighted AverageGrant DateFair Value
Outstanding at June 30, 2010 . . . . . . . . . . . . . . . . . . . . . . . . . . . . . . 828 $ 9.44Granted . . . . . . . . . . . . . . . . . . . . . . . . . . . . . . . . . . . . . . . . . . . . . . . . 738 12.47Vested . . . . . . . . . . . . . . . . . . . . . . . . . . . . . . . . . . . . . . . . . . . . . . . . . (279) 9.42Forfeited . . . . . . . . . . . . . . . . . . . . . . . . . . . . . . . . . . . . . . . . . . . . . . . (100) 10.57
Outstanding at June 30, 2011 . . . . . . . . . . . . . . . . . . . . . . . . . . . . . . 1,187 $11.23Granted . . . . . . . . . . . . . . . . . . . . . . . . . . . . . . . . . . . . . . . . . . . . . . . . 585 14.30Vested . . . . . . . . . . . . . . . . . . . . . . . . . . . . . . . . . . . . . . . . . . . . . . . . . (409) 10.62Forfeited . . . . . . . . . . . . . . . . . . . . . . . . . . . . . . . . . . . . . . . . . . . . . . . (88) 13.14
Outstanding at June 30, 2012 . . . . . . . . . . . . . . . . . . . . . . . . . . . . . . 1,275 $12.71
An aggregate of 79 shares of restricted stock that were granted to employees of LNX Corporation joiningthe Company in connection with the acquisition of LNX in January 2011 are included in the granted figure in thetable above.
An aggregate of 144 shares of restricted stock that were granted to employees of KOR and PDI joining theCompany in connection with the acquisition of KOR in December 2011 are included in the granted figure in thetable above.
79

The total fair value of restricted stock awards vested during fiscal year 2012, 2011 and 2010 was $5,848,$4,175 and $3,485, respectively.
Non-vested restricted stock awards are subject to the risk of forfeiture until the fulfillment of specifiedconditions. As of June 30, 2012, there was $10,515 of total unrecognized compensation cost related tonon-vested restricted stock awards granted under the Company’s stock plans that is expected to be recognizedover a weighted-average period of 2.4 years from June 30, 2012. As of June 30, 2011, there was $10,400 of totalunrecognized compensation cost related to non-vested restricted stock awards granted under the Company’sstock plans that is expected to be recognized over a weighted-average period of 2.6 years from June 30, 2011.
STOCK-BASED COMPENSATION EXPENSE AND ASSUMPTIONS
The Company recognized the full expense of its share-based payment plans in the consolidated statementsof operations for the fiscal years 2012, 2011 and 2010 in accordance with FASB ASC 718 and did not capitalizeany such costs on the consolidated balance sheets, as such costs that qualified for capitalization were notmaterial. Under the fair value recognition provisions of FASB ASC 718, stock-based compensation cost ismeasured at the grant date based on the value of the award and is recognized as expense over the service period.The following table presents share-based compensation expenses from continuing operations included in theCompany’s consolidated statement of operations:
Year Ended June 30,
2012 2011 2010
Cost of revenues . . . . . . . . . . . . . . . . . . . . . . . . . . . . . . . . . . . . . . . . . . . . . . . . . . . . . $ 349 $ 263 $ 251Selling, general and administrative . . . . . . . . . . . . . . . . . . . . . . . . . . . . . . . . . . . . . . 5,309 4,609 3,145Research and development . . . . . . . . . . . . . . . . . . . . . . . . . . . . . . . . . . . . . . . . . . . . . 958 708 620
Share-based compensation expense before tax . . . . . . . . . . . . . . . . . . . . . . . . . . . . . 6,616 5,580 4,016Income taxes . . . . . . . . . . . . . . . . . . . . . . . . . . . . . . . . . . . . . . . . . . . . . . . . . . . . . . . . (2,357) (1,966) (1,499)
Share-based compensation expense, net of income taxes . . . . . . . . . . . . . . . . . . . . . $ 4,259 $ 3,614 $ 2,517
There were no options granted during fiscal year 2012. The following table sets forth the weighted-averagekey assumptions and fair value results for stock options granted during fiscal years 2011 and 2010:
Years Ended June 30,
2012 2011 2010
Weighted-average fair value of options granted . . . . . . . . . . . . . . . $— $ 7.25 $ 7.17Option life(1) . . . . . . . . . . . . . . . . . . . . . . . . . . . . . . . . . . . . . . . . . . — 5.0 years 5.0 yearsRisk-free interest rate(2) . . . . . . . . . . . . . . . . . . . . . . . . . . . . . . . . . . — 1.27% 2.38%Stock volatility(3) . . . . . . . . . . . . . . . . . . . . . . . . . . . . . . . . . . . . . . . — 63% 87%Dividend rate . . . . . . . . . . . . . . . . . . . . . . . . . . . . . . . . . . . . . . . . . . — 0% 0%
(1) The option life was determined based upon historical option activity.(2) The risk-free interest rate for each grant is equal to the U.S. Treasury yield curve in effect at the time of
grant for instruments with a similar expected life.(3) The stock volatility for each grant is measured using the weighted average of historical daily price changes
of the Company’s common stock over the most recent period equal to the expected option life of the grant,the historical short-term trend of the option and other factors, such as expected changes in volatility arisingfrom planned changes in the Company’s business operations.
80

O. Operating Segment, Significant Customers and Geographic Information
Operating segments are defined as components of an enterprise evaluated regularly by the Company’ssenior management in deciding how to allocate resources and assess performance. The Company is presentlyorganized in two operating segments. These reportable segments were determined based upon the nature of theproducts offered to customers, the market characteristics of each operating segment and the Company’smanagement structure:
• Advanced Computing Solutions: this operating segment is focused on specialized, high-performanceembedded, real-time digital signal and image processing solutions that encompass signal acquisition,including microwave front-end, digitalization, digital signal processing, exploitation processing, highcapacity digital storage and communications, targeted to key market segments, including defense,communications and other commercial applications. With the addition of KOR, the ACS segment alsodesigns and develops DRFM units for a variety of modern EW applications, as well as radarenvironment simulation and test systems for defense applications.
• Mercury Federal Systems: this operating segment is focused on services and support work with theDepartment of Defense and federal intelligence and homeland security agencies, including designing,engineering, and deploying new ISR capabilities to address present and emerging threats to U.S. forces.With the addition of PDI, the MFS segment also provides sophisticated analysis and exploitation,multi-sensor data fusion and enrichment, and data processing services for the U.S. intelligencecommunity.
The accounting policies of the reportable segments are the same as those described in “Note B: Summary ofSignificant Accounting Policies.” Beginning with the three months ended March 31, 2012, the profitabilitymeasure employed by the Company and its chief operating decision maker (“CODM”) as the basis for allocatingresources to segments and assessing segment performance is adjusted EBITDA, The Company believes theadjusted EBITDA financial measure assists in providing an enhanced understanding of its underlying operationalmeasures to manage its business, to evaluate its performance compared to prior periods and the marketplace, andto establish operational goals. The Company believes that adjusted EBITDA provides a more comprehensivebasis for decision making and assessing segment performance than income (loss) from operations prior to stockcompensation expense which was used in prior reporting periods.
81

Adjusted EBITDA is defined as earnings from continuing operations before interest income and expense,income taxes, depreciation, amortization of acquired intangible assets, restructuring, impairment of long-livedassets, acquisition costs and other related expenses, fair value adjustments from purchase accounting and stock-based compensation costs. Prior year’s amounts have been presented to reflect the current profitability measuresfor comparative purposes. Additionally, asset information by reportable segment is not reported because theCompany and its CODM utilize consolidated asset information when making business decisions. The followingis a summary of the performance of the Company’s operations by reportable segment:
ACS MFS Eliminations Total
YEAR ENDED JUNE 30, 2012Net revenues to unaffiliated customers . . . . . . . . . . . . . . . . . . $215,899 $28,670 $ 360 $244,929Intersegment revenues . . . . . . . . . . . . . . . . . . . . . . . . . . . . . . 12,208 3 (12,211) —
Net revenues . . . . . . . . . . . . . . . . . . . . . . . . . . . . . . . . . . . . . . $228,107 $28,673 $(11,851) $244,929
Adjusted EBITDA . . . . . . . . . . . . . . . . . . . . . . . . . . . . . . . . . $ 43,802 $ 4,913 $ 159 $ 48,874YEAR ENDED JUNE 30, 2011
Net revenues to unaffiliated customers . . . . . . . . . . . . . . . . . . $217,423 $11,415 $ (128) $228,710Intersegment revenues . . . . . . . . . . . . . . . . . . . . . . . . . . . . . . 6,260 52 (6,312) —
Net revenues . . . . . . . . . . . . . . . . . . . . . . . . . . . . . . . . . . . . . . $223,683 $11,467 $ (6,440) $228,710
Adjusted EBITDA . . . . . . . . . . . . . . . . . . . . . . . . . . . . . . . . . $ 42,304 $ (914) $ (507) $ 40,883YEAR ENDED JUNE 30, 2010
Net revenues to unaffiliated customers . . . . . . . . . . . . . . . . . . $188,967 $10,735 $ 128 $199,830Intersegment revenues . . . . . . . . . . . . . . . . . . . . . . . . . . . . . . 4,779 336 (5,115) —
Net revenues . . . . . . . . . . . . . . . . . . . . . . . . . . . . . . . . . . . . . . $193,746 $11,071 $ (4,987) $199,830
Adjusted EBITDA . . . . . . . . . . . . . . . . . . . . . . . . . . . . . . . . . $ 30,454 $ (641) $ 43 $ 29,856
The following table reconciles the Company’s net income, the most directly comparable GAAP financialmeasure, to its adjusted EBITDA:
Year Ended June 30,
(In thousands) 2012 2011 2010
Net income . . . . . . . . . . . . . . . . . . . . . . . . . . . . . . . . . . . . . . . . . . . . . . . . . . . . . . . . $22,619 $18,442 $28,358(Loss) income from discontinued operations, net of income taxes . . . . . . . . . — (65) 289
Income from continuing operations . . . . . . . . . . . . . . . . . . . . . . . . . . . . . . . . . . . . . 22,619 18,507 28,069Interest expense (income), net . . . . . . . . . . . . . . . . . . . . . . . . . . . . . . . . . . . . . 27 45 (151)Income tax expense (benefit) . . . . . . . . . . . . . . . . . . . . . . . . . . . . . . . . . . . . . . 9,152 8,060 (9,377)Depreciation . . . . . . . . . . . . . . . . . . . . . . . . . . . . . . . . . . . . . . . . . . . . . . . . . . . 7,859 6,364 5,147Amortization of acquired intangible assets . . . . . . . . . . . . . . . . . . . . . . . . . . . 3,799 1,984 1,710Restructuring . . . . . . . . . . . . . . . . . . . . . . . . . . . . . . . . . . . . . . . . . . . . . . . . . . 2,821 — 231Impairment of long-lived assets . . . . . . . . . . . . . . . . . . . . . . . . . . . . . . . . . . . . — 150 211Acquisition costs and other related expenses . . . . . . . . . . . . . . . . . . . . . . . . . . 1,219 412 —Fair value adjustments from purchase accounting . . . . . . . . . . . . . . . . . . . . . . (5,238) (219) —Stock-based compensation cost . . . . . . . . . . . . . . . . . . . . . . . . . . . . . . . . . . . . 6,616 5,580 4,016
Adjusted EBITDA . . . . . . . . . . . . . . . . . . . . . . . . . . . . . . . . . . . . . . . . . . . . . . . . . . $48,874 $40,883 $29,856
82

The geographic distribution of the Company’s revenues and long-lived assets from continuing operations issummarized as follows:
US EuropeAsiaPacific Eliminations Total
YEAR ENDED JUNE 30, 2012Net revenues to unaffiliated customers . . . . . . . . . . $235,292 $ 4,983 $4,654 $ — $244,929Inter-geographic revenues . . . . . . . . . . . . . . . . . . . . 5,511 747 175 (6,433) —
Net revenues . . . . . . . . . . . . . . . . . . . . . . . . . . . . . . . $240,803 $ 5,730 $4,829 $ (6,433) $244,929
Identifiable long-lived assets . . . . . . . . . . . . . . . . . . $ 15,895 $ 32 $ 2 $ — $ 15,929YEAR ENDED JUNE 30, 2011
Net revenues to unaffiliated customers . . . . . . . . . . $219,435 $ 3,665 $5,610 $ — $228,710Inter-geographic revenues . . . . . . . . . . . . . . . . . . . . 5,637 2,277 243 (8,157) —
Net revenues . . . . . . . . . . . . . . . . . . . . . . . . . . . . . . . $225,072 $ 5,942 $5,853 $ (8,157) $228,710
Identifiable long-lived assets . . . . . . . . . . . . . . . . . . $ 15,390 $ 24 $ 704 $ — $ 16,118YEAR ENDED JUNE 30, 2010
Net revenues to unaffiliated customers . . . . . . . . . . $180,103 $ 9,960 $9,767 $ — $199,830Inter-geographic revenues . . . . . . . . . . . . . . . . . . . . 13,916 789 198 (14,903) —
Net revenues . . . . . . . . . . . . . . . . . . . . . . . . . . . . . . . $194,019 $10,749 $9,965 $(14,903) $199,830
Identifiable long-lived assets . . . . . . . . . . . . . . . . . . $ 13,384 $ 21 $ 716 $ — $ 14,121
Foreign revenue is based on the country in which the Company’s legal subsidiary is domiciled. Identifiablelong-lived assets exclude goodwill and intangible assets.
Customers comprising 10% or more of the Company’s revenues for the fiscal years shown below are asfollows:
Year EndedJune 30,
2012 2011 2010
Raytheon Company (ACS) . . . . . . . . . . . . . . . . . . . . . . . . . . . . . . . . . . . . . . . . . . . 22% 17% 20%Northrop Grumman Corporation (ACS) . . . . . . . . . . . . . . . . . . . . . . . . . . . . . . . . 17 21% *Lockheed Martin Corporation (ACS) . . . . . . . . . . . . . . . . . . . . . . . . . . . . . . . . . . . 15 13 17
54% 51% 37%
Although the Company typically has several customers from which it derives 10% or more of its revenue,the sales to each of these customers are spread across multiple programs and platforms. For the fiscal years endedJune 30, 2012 and 2010, the AEGIS Program individually comprised 11% and 15% of the Company’s revenues,respectively. For the fiscal year ended June 30, 2011, no single program comprised 10% or more of theCompany’s revenues.
83

P. Income Taxes
The components of income before income taxes and income tax expense (benefit) were as follows:
Year Ended June 30,
2012 2011 2010
Income from continuing operations before income taxes:United States . . . . . . . . . . . . . . . . . . . . . . . . . . . . . . . . . . . . . . . . . . . . . . . . . . $31,277 $26,072 $18,714Foreign . . . . . . . . . . . . . . . . . . . . . . . . . . . . . . . . . . . . . . . . . . . . . . . . . . . . . . . 494 495 (22)
$31,771 $26,567 $18,692
Income tax expense (benefit) from continuing operations:Federal:
Current . . . . . . . . . . . . . . . . . . . . . . . . . . . . . . . . . . . . . . . . . . . . . . . . . . . . . . . $10,591 $ 4,974 $ (356)Deferred . . . . . . . . . . . . . . . . . . . . . . . . . . . . . . . . . . . . . . . . . . . . . . . . . . . . . . (2,582) 1,992 (8,286)
$ 8,009 $ 6,966 $ (8,642)State:
Current . . . . . . . . . . . . . . . . . . . . . . . . . . . . . . . . . . . . . . . . . . . . . . . . . . . . . . . $ 1,401 $ 855 $ 98Deferred . . . . . . . . . . . . . . . . . . . . . . . . . . . . . . . . . . . . . . . . . . . . . . . . . . . . . . (335) 48 (711)
$ 1,066 $ 903 $ (613)Foreign:
Current . . . . . . . . . . . . . . . . . . . . . . . . . . . . . . . . . . . . . . . . . . . . . . . . . . . . . . . $ 77 $ 161 $ (122)Deferred . . . . . . . . . . . . . . . . . . . . . . . . . . . . . . . . . . . . . . . . . . . . . . . . . . . . . . — 30 —
$ 77 $ 191 $ (122)
$ 9,152 $ 8,060 $ (9,377)
The following is the reconciliation between the statutory federal income tax rate and the Company’seffective income tax rate from continuing operations:
Year Ended June 30,
2012 2011 2010
Income taxes at federal statutory rates . . . . . . . . . . . . . . . . . . . . . . . . . . . . . . . . . . 35.0% 35.0% 35.0%State income tax, net of federal tax benefit . . . . . . . . . . . . . . . . . . . . . . . . . . . . . . 2.6 2.2 0.5Research and development credits . . . . . . . . . . . . . . . . . . . . . . . . . . . . . . . . . . . . . (4.2) (6.9) (5.9)Domestic manufacturing deduction . . . . . . . . . . . . . . . . . . . . . . . . . . . . . . . . . . . . (3.0) (2.6) —Deemed repatriation of foreign earnings . . . . . . . . . . . . . . . . . . . . . . . . . . . . . . . . — — (1.4)Equity compensation . . . . . . . . . . . . . . . . . . . . . . . . . . . . . . . . . . . . . . . . . . . . . . . 1.0 1.6 1.8IRS audit adjustments . . . . . . . . . . . . . . . . . . . . . . . . . . . . . . . . . . . . . . . . . . . . . . . — — (1.5)Goodwill impairment . . . . . . . . . . . . . . . . . . . . . . . . . . . . . . . . . . . . . . . . . . . . . . . — — 0.4Change in the fair value of the liability related to the LNX earn-out . . . . . . . . . . (5.4) — —Acquisition costs . . . . . . . . . . . . . . . . . . . . . . . . . . . . . . . . . . . . . . . . . . . . . . . . . . 1.3 0.6 —Valuation allowance . . . . . . . . . . . . . . . . . . . . . . . . . . . . . . . . . . . . . . . . . . . . . . . . 2.2 1.7 (79.8)Other . . . . . . . . . . . . . . . . . . . . . . . . . . . . . . . . . . . . . . . . . . . . . . . . . . . . . . . . . . . . (0.7) (1.3) 0.7
28.8% 30.3% (50.2)%
84

The components of the Company’s net deferred tax assets (liabilities) were as follows:
June 30,
2012 2011
Deferred tax assets:Inventory valuation and receivable allowances . . . . . . . . . . . . . . . . . . . . . . . . . . . . . . . $ 4,788 $ 4,189Accrued compensation . . . . . . . . . . . . . . . . . . . . . . . . . . . . . . . . . . . . . . . . . . . . . . . . . . 1,367 1,424Equity compensation . . . . . . . . . . . . . . . . . . . . . . . . . . . . . . . . . . . . . . . . . . . . . . . . . . . 6,036 5,565Federal and state research and development tax credit carryforwards . . . . . . . . . . . . . . 8,569 8,716Net operating loss . . . . . . . . . . . . . . . . . . . . . . . . . . . . . . . . . . . . . . . . . . . . . . . . . . . . . . — 900Gain on sale-leaseback . . . . . . . . . . . . . . . . . . . . . . . . . . . . . . . . . . . . . . . . . . . . . . . . . . 2,116 2,556Other accruals . . . . . . . . . . . . . . . . . . . . . . . . . . . . . . . . . . . . . . . . . . . . . . . . . . . . . . . . . 919 328Repatriation of foreign earnings . . . . . . . . . . . . . . . . . . . . . . . . . . . . . . . . . . . . . . . . . . . — 76Other temporary differences . . . . . . . . . . . . . . . . . . . . . . . . . . . . . . . . . . . . . . . . . . . . . . 1,333 594
25,128 24,348Valuation allowance . . . . . . . . . . . . . . . . . . . . . . . . . . . . . . . . . . . . . . . . . . . . . . . . . . . . (8,682) (7,973)
Total deferred tax assets . . . . . . . . . . . . . . . . . . . . . . . . . . . . . . . . . . . . . . . . . . . . . . . . . 16,446 16,375Deferred tax liabilities:
Deferred revenue . . . . . . . . . . . . . . . . . . . . . . . . . . . . . . . . . . . . . . . . . . . . . . . . . . . . . . (3,488) (4,776)Property and equipment depreciation . . . . . . . . . . . . . . . . . . . . . . . . . . . . . . . . . . . . . . . (3,995) (2,452)Acquired intangible assets . . . . . . . . . . . . . . . . . . . . . . . . . . . . . . . . . . . . . . . . . . . . . . . (8,507) (5,346)
Total deferred tax liabilities . . . . . . . . . . . . . . . . . . . . . . . . . . . . . . . . . . . . . . . . . . . . . . (15,990) (12,574)
Net deferred tax (liabilities) assets . . . . . . . . . . . . . . . . . . . . . . . . . . . . . . . . . . . . . . . . . . . . . $ 456 $ 3,801
At June 30, 2012, the Company evaluated the need for a valuation allowance on deferred tax assets. Inassessing whether the deferred tax assets are realizable, management considered whether it is more likely thannot that some portion or all of the deferred tax assets will not be realized. The ultimate realization of deferred taxassets is dependent upon the generation of future taxable income during the periods in which those temporarydifferences become deductible. The Company continues to conclude that it was “more likely than not”, that mostdomestic deferred tax assets would be realizable based on the financial performance in fiscal year 2012,projected future taxable income and the reversal of existing deferred tax liabilities.
The Company continues to record a full valuation allowance on Massachusetts research and development(“R&D”) and investment tax credits as of June 30, 2012 as management continues to believe that it is not morelikely than not that these deferred tax assets would be realized.
The Company had state research and development credit carryforwards of $12,813, which will expire 2018through 2027. The Company also had state investment tax credits carryforwards of $124 that will expire in 2015.As of June 30, 2012, the Company also had approximately $399 in foreign operating loss carryforwards.
Upon consideration of changing business conditions and cash position in its foreign subsidiaries,management has determined that it would no longer need to indefinitely reinvest the earnings of certain foreignsubsidiaries. Therefore, the Company has accrued deferred taxes in association with the $1,200 in undistributedearnings and profits.
The Company files income tax returns in all jurisdictions in which it operates. The Company has establishedreserves to provide for additional income taxes that may be due in future years as these previously filed taxreturns are audited. These reserves have been established based upon management’s assessment as to thepotential exposures. All tax reserves are analyzed quarterly and adjustments are made as events occur andwarrant modification.
85

The changes in the Company’s reserves for unrecognized income tax benefits are summarized as follows:
Year Ended June 30,
2012 2011
Unrecognized tax benefits, beginning of period . . . . . . . . . . . . . . . . . . . . . . . . . $1,831 $1,856Increases for previously recognized positions . . . . . . . . . . . . . . . . . . . . . . . . . . . 716 27Settlements of previously recognized positions . . . . . . . . . . . . . . . . . . . . . . . . . . — (59)Decreases for previously recognized positions . . . . . . . . . . . . . . . . . . . . . . . . . . (84) (229)Increases for currently recognized positions . . . . . . . . . . . . . . . . . . . . . . . . . . . . 179 236
Unrecognized tax benefits, end of period . . . . . . . . . . . . . . . . . . . . . . . . . . . . . . $2,642 $1,831
The $2,642 of unrecognized tax benefits as of June 30, 2012, if released, would reduce income tax expense.
The Company’s major tax jurisdiction is the U.S. and the open tax years are 2009 through 2011.
The Company expects that there will not be any material changes in its reserves for unrecognized taxbenefits within the next 12 months. Currently there are no significant tax audits underway.
Q. Restructuring Plan
In fiscal 2012, the Company announced a restructuring plan (“2012 Plan”) affecting both the ACS and MFSbusiness segments. The 2012 Plan primarily consisted of involuntary separation costs related to the reduction inforce which eliminated 41 positions largely in engineering and manufacturing functions; and facility costs relatedto outsourcing of certain manufacturing activities at the Company’s Huntsville, Alabama site. The 2012 Plan forwhich expense of $2,821 was recorded in fiscal 2012 was implemented to cope with the near term uncertaintiesin the defense industry and improve the Company’s overall business scalability. Future restructuring expenses ofapproximately $737 associated with the 2012 Plan are expected in fiscal 2013 as the Company starts transitioningthe manufacturing activities formerly conducted at the Huntsville, Alabama facility. This restructuring expensewill affect the ACS business segment.
All of the restructuring charges are classified as operating expenses in the consolidated statements ofoperations and any remaining obligations are expected to be paid within the next twelve months. The remainingrestructuring liability is classified as accrued expenses in the consolidated balance sheets.
The following table presents the detail of expenses by business segment for the Company’s restructuringplans:
Severance Facilities Other Total
ACS . . . . . . . . . . . . . . . . . . . . . . . . . . . . . . . . . . . . . . . . . . . . . . . . . . . . 2,406 — 306 2,712MFS . . . . . . . . . . . . . . . . . . . . . . . . . . . . . . . . . . . . . . . . . . . . . . . . . . . 109 — — 109
Total provision . . . . . . . . . . . . . . . . . . . . . . . . . . . . . . . . . . . . . . . . . . . . . . . 2,515 — 306 2,821Cash paid . . . . . . . . . . . . . . . . . . . . . . . . . . . . . . . . . . . . . . . . . . . . . . . . . . . . (2) — (121) (123)
Restructuring liability at June 30, 2012 . . . . . . . . . . . . . . . . . . . . . . . . . . . . $2,513 $— $ 185 $2,698
86

R. Employee Benefit Plans
The Company maintains a qualified 401(k) plan (the “401(k) Plan”) for its U.S. employees. The 401(k) Plancovers U.S. employees who have attained the age of 21. During fiscal 2012, 2011 and 2010, the Companymatched employee contributions up to 3% of eligible compensation. The Company may also make optionalcontributions to the plan for any plan year at its discretion. Expense recognized by the Company for matchingcontributions related to the 401(k) plan was $2,196, $1,762 and $1,569 during the fiscal years ended June 30,2012, 2011 and 2010, respectively.
S. Related Party Transactions
In July 2008, the Company and our former CEO, James Bertelli, entered into an agreement for consultingservices through June 30, 2010. The consideration for these services totaled $190 and was paid out over theservice period. As of June 30, 2010, the Company had made all payments for consulting services under thisagreement. Additionally, in July 2008, the Company entered into a five year non-compete agreement withMr. Bertelli. This agreement, which is carried as an intangible asset on the Company’s balance sheet, was valuedat $500 and is being amortized over the life of the agreement. As of December 31, 2010, the Company had madeall payments under this non-compete agreement.
T. Subsequent Events
On June 8, 2012, the Company and Wildcat Merger Sub Inc., a newly formed, wholly-owned subsidiary ofthe Company (the “Merger Sub”), entered into an Agreement and Plan of Merger (the “Merger Agreement”) withMicronetics, Inc. (“Micronetics”). On August 8, 2012, the transaction closed with the Merger Sub merging withand into Micronetics with Micronetics continuing as the surviving company and wholly-owned subsidiary of theCompany.
Headquartered in Hudson, NH, Micronetics is a leading designer and manufacturer of microwave and radiofrequency (RF) subsystems and components for defense and commercial customers.
Pursuant to the terms of the Merger Agreement, at the closing of the merger on August 8, 2012, each shareof common stock of Micronetics issued and outstanding immediately prior to the closing was converted into theright to receive $14.80 in cash, without interest (the “Merger Consideration”). All outstanding options to acquireshares of Micronetics common stock that were vested as of the closing were cancelled and the holders of suchoptions are entitled to receive an amount of cash equal to the product of the total number of shares previouslysubject to such vested options and the excess of the Merger Consideration over the exercise price per share. Alloutstanding Micronetics stock options that were unvested at the closing were assumed by Mercury. Mercuryfunded the acquisition with cash on hand.
The transaction will be accounted for using the acquisition method of accounting which requires, amongother things, that the assets acquired and liabilities assumed be recognized at their fair values as of the acquisitiondate. The acquisition related disclosures required by FASB ASC 805 cannot be made as the initial accounting forthe business transaction is incomplete. Key financial data such as the determination of the fair value of the assetsacquired and liabilities assumed is not yet available.
87

SUPPLEMENTARY INFORMATION (UNAUDITED)
The following sets forth certain unaudited consolidated quarterly statements of operations data for each ofthe Company’s last eight quarters. In management’s opinion, this quarterly information reflects all adjustments,consisting only of normal recurring adjustments, necessary for a fair presentation for the periods presented. Suchquarterly results are not necessarily indicative of future results of operations and should be read in conjunctionwith the audited consolidated financial statements of the Company and the notes thereto included elsewhereherein.
2012 (In thousands, except per share data) 1ST QUARTER 2ND QUARTER 3RD QUARTER 4TH QUARTER
Net revenues . . . . . . . . . . . . . . . . . . . . . . . . . . . . . . $49,122 $67,959 $66,989 $60,859Gross margin . . . . . . . . . . . . . . . . . . . . . . . . . . . . . . $29,916 $40,913 $35,063 $30,264Income from operations . . . . . . . . . . . . . . . . . . . . . . $ 3,565 $13,485 $ 7,106 $ 5,956Income from operations before income taxes . . . . . $ 3,967 $13,873 $ 7,625 $ 6,306Income tax expense . . . . . . . . . . . . . . . . . . . . . . . . . $ 1,314 $ 4,828 $ 2,380 $ 630Income from continuing operations . . . . . . . . . . . . . $ 2,653 $ 9,045 $ 5,245 $ 5,676Net income . . . . . . . . . . . . . . . . . . . . . . . . . . . . . . . . $ 2,653 $ 9,045 $ 5,245 $ 5,676
Net earnings per common share:Basic net earnings per share:
Income from continuing operations . . . . . . . . . $ 0.09 $ 0.31 $ 0.18 $ 0.19Net income . . . . . . . . . . . . . . . . . . . . . . . . . . . . $ 0.09 $ 0.31 $ 0.18 $ 0.19
Diluted net earnings per share:Income from continuing operations . . . . . . . . . $ 0.09 $ 0.30 $ 0.17 $ 0.19Net income . . . . . . . . . . . . . . . . . . . . . . . . . . . . $ 0.09 $ 0.30 $ 0.17 $ 0.19
2011 (In thousands, except per share data) 1ST QUARTER 2ND QUARTER 3RD QUARTER 4TH QUARTER
Net revenues . . . . . . . . . . . . . . . . . . . . . . . . . . . . . . $52,108 $55,513 $59,855 $61,234Gross margin . . . . . . . . . . . . . . . . . . . . . . . . . . . . . . $30,660 $31,640 $32,882 $34,717Income from operations . . . . . . . . . . . . . . . . . . . . . . $ 5,245 $ 6,518 $ 6,999 $ 6,223Income from operations before income taxes . . . . . $ 5,759 $ 6,879 $ 7,385 $ 6,544Income tax expense (benefit) . . . . . . . . . . . . . . . . . . $ 2,077 $ 1,696 $ 2,007 $ 2,280Income from continuing operations . . . . . . . . . . . . . $ 3,682 $ 5,183 $ 5,378 $ 4,264Net income . . . . . . . . . . . . . . . . . . . . . . . . . . . . . . . . $ 3,630 $ 5,183 $ 5,378 $ 4,251
Net earnings per common share:Basic net earnings per share:
Income from continuing operations . . . . . . . . . $ 0.16 $ 0.22 $ 0.20 $ 0.15Net income . . . . . . . . . . . . . . . . . . . . . . . . . . . . $ 0.16 $ 0.22 $ 0.20 $ 0.15
Diluted net earnings per share:Income from continuing operations* . . . . . . . . $ 0.16 $ 0.22 $ 0.20 $ 0.14Net income* . . . . . . . . . . . . . . . . . . . . . . . . . . . $ 0.15 $ 0.22 $ 0.20 $ 0.14
* Due to the effects of rounding, the sum of the four quarters does not equal the annual total.
88

ITEM 9. CHANGES IN AND DISAGREEMENTSWITH ACCOUNTANTS ON ACCOUNTING ANDFINANCIAL DISCLOSURE
None.
ITEM 9A. CONTROLS AND PROCEDURES
(a) EFFECTIVENESS OF DISCLOSURE CONTROLS AND PROCEDURES
We conducted an evaluation as of June 30, 2012 under the supervision and with the participation of ourmanagement, including our Chief Executive Officer and Chief Financial Officer (our principal executive officerand principal financial officer, respectively), and concluded that our disclosure controls and procedures (asdefined in Rule 13a-15(e) or Rule 15d-15(e) under the Securities Exchange Act of 1934, as amended, the“Exchange Act”) were effective as of June 30, 2012 to ensure that the information required to be disclosed by usin reports that we file or submit under the Exchange Act is recorded, processed, summarized and reported withinthe time periods specified in the SEC’s rules and forms and that it is accumulated and communicated to ourmanagement, including our Chief Executive Officer and Chief Financial Officer, to allow timely decisionsregarding required disclosure.
(b) INHERENT LIMITATIONS ON EFFECTIVENESS OF CONTROLS
Our management, including the Chief Executive Officer and Chief Financial Officer, does not expect thatour internal control over financial reporting or our internal controls will prevent or detect all errors and all fraud.A control system, no matter how well designed and operated, can provide only reasonable, not absolute,assurance that the control system’s objectives will be met. The design of any system of controls is based in parton certain assumptions about the likelihood of future events, and there can be no assurance that any design willsucceed in achieving its stated goals under all potential future conditions.
(c) MANAGEMENT’S ANNUAL REPORT ON INTERNAL CONTROL OVER FINANCIAL REPORTING
Our management is responsible for establishing and maintaining adequate internal control over financialreporting. Under the supervision of the Chief Executive Officer and Chief Financial Officer, managementconducted an assessment of the effectiveness of our internal control over financial reporting as of June 30, 2012based on the framework in Internal Control-Integrated Framework published by the Committee of SponsoringOrganizations of the Treadway Commission. As a result of this assessment, management concluded that ourinternal control over financial reporting was effective as of June 30, 2012. The effectiveness of our internalcontrol over financial reporting as of June 30, 2012 has been audited by KPMG LLP, an independent registeredpublic accounting firm, as stated in its report.
The audited consolidated financial statements of the Company include the results of acquired KORElectronics and its wholly-owned subsidiary, Paragon Dynamics, Inc. (“acquired business”). Upon considerationof the date of the acquisition and the time constraints under which our management’s assessment would have tobe made, management determined that it would not be possible to conduct a sufficiently comprehensiveassessment of the acquired business’ controls over financial reporting as allowable under section 404 of theSarbanes-Oxley Act of 2002. Accordingly, these operations have been excluded from the scope of management’sassessment of internal controls. The Company’s consolidated financial statements reflect revenues and totalassets from the acquired business of approximately 8 percent and 22 percent (of which 17 percent representedgoodwill and intangible assets included within the scope of the Company’s assessment), respectively, as ofJune 30, 2012.
89

(d) CHANGES IN INTERNAL CONTROL OVER FINANCIAL REPORTING
There were no changes in our internal control over financial reporting (as defined in Rules 13a-15(f) and15d-15(f) under the Exchange Act) during the fourth quarter of fiscal 2012 identified in connection with ourChief Executive Officer’s and Chief Financial Officer’s evaluation that have materially affected, or arereasonably likely to materially affect, our internal control over financial reporting.
ITEM 9B. OTHER INFORMATION
None.
90

PART III
ITEM 10. DIRECTORS, EXECUTIVE OFFICERS AND CORPORATE GOVERNANCE
The information required by this item is incorporated herein by reference to our Proxy Statement for our2012 Annual Meeting of Shareholders (the “Shareholders Meeting”), except that information required by thisitem concerning our executive officers appears in Part I, Item 4.1 of this Annual Report on Form 10-K.
ITEM 11. EXECUTIVE COMPENSATION
The information required by this item is incorporated by reference to our Proxy Statement for theShareholders Meeting.
ITEM 12. SECURITY OWNERSHIP OF CERTAIN BENEFICIAL OWNERS ANDMANAGEMENTAND RELATED STOCKHOLDERMATTERS
The information required by this item is incorporated herein by reference to our Proxy Statement for theShareholders Meeting.
ITEM 13. CERTAIN RELATIONSHIPS AND RELATED TRANSACTIONS, AND DIRECTORINDEPENDENCE
The information required by this item is incorporated herein by reference to our Proxy Statement for theShareholders Meeting.
ITEM 14. PRINCIPAL ACCOUNTANT FEES AND SERVICES
The information required by this item is incorporated herein by reference to our Proxy Statement for theShareholders Meeting.
91

PART IV
ITEM 15. EXHIBITS AND FINANCIAL STATEMENT SCHEDULES
(a) FINANCIAL STATEMENTS, SCHEDULES AND EXHIBITS
The financial statements, schedule, and exhibits listed below are included in or incorporated by reference aspart of this report:
1. Financial statements:
Report of Independent Registered Public Accounting FirmConsolidated Balance Sheets as of June 30, 2012 and 2011Consolidated Statements of Operations and Comprehensive Income for the fiscal years ended June 30,2012, 2011 and 2010Consolidated Statements of Shareholders’ Equity for the fiscal years ended June 30, 2012, 2011 and2010Consolidated Statements of Cash Flows for the years ended June 30, 2012, 2011 and 2010Notes to Consolidated Financial Statements
2. Financial Statement Schedule:
II. Valuation and Qualifying Accounts
92
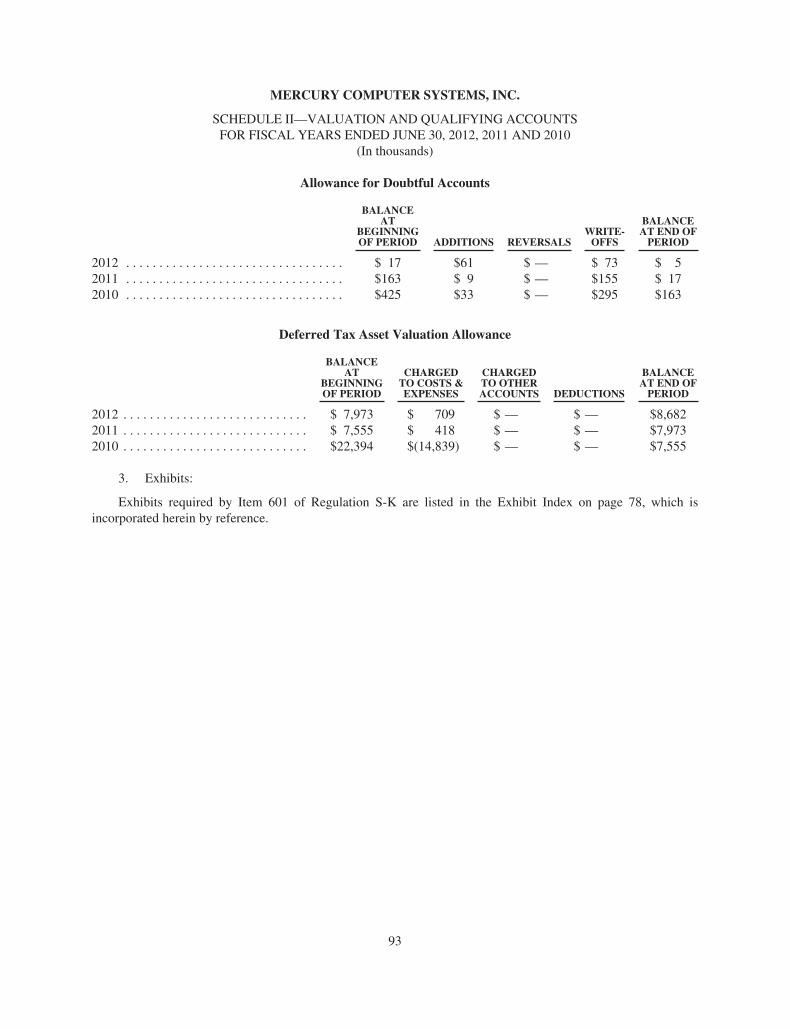
MERCURY COMPUTER SYSTEMS, INC.
SCHEDULE II—VALUATION AND QUALIFYING ACCOUNTSFOR FISCAL YEARS ENDED JUNE 30, 2012, 2011 AND 2010
(In thousands)
Allowance for Doubtful Accounts
BALANCEAT
BEGINNINGOF PERIOD ADDITIONS REVERSALS
WRITE-OFFS
BALANCEAT END OFPERIOD
2012 . . . . . . . . . . . . . . . . . . . . . . . . . . . . . . . . . $ 17 $61 $ — $ 73 $ 52011 . . . . . . . . . . . . . . . . . . . . . . . . . . . . . . . . . $163 $ 9 $ — $155 $ 172010 . . . . . . . . . . . . . . . . . . . . . . . . . . . . . . . . . $425 $33 $ — $295 $163
Deferred Tax Asset Valuation Allowance
BALANCEAT
BEGINNINGOF PERIOD
CHARGEDTO COSTS &EXPENSES
CHARGEDTO OTHERACCOUNTS DEDUCTIONS
BALANCEAT END OFPERIOD
2012 . . . . . . . . . . . . . . . . . . . . . . . . . . . . $ 7,973 $ 709 $ — $ — $8,6822011 . . . . . . . . . . . . . . . . . . . . . . . . . . . . $ 7,555 $ 418 $ — $ — $7,9732010 . . . . . . . . . . . . . . . . . . . . . . . . . . . . $22,394 $(14,839) $ — $ — $7,555
3. Exhibits:
Exhibits required by Item 601 of Regulation S-K are listed in the Exhibit Index on page 78, which isincorporated herein by reference.
93

Signatures
Pursuant to the requirements of Section 13 or 15(d) of the Securities Exchange Act of 1934, the registranthas duly caused this report to be signed on its behalf by the undersigned, thereunto duly authorized, inChelmsford, Massachusetts, on August 22, 2012.
MERCURY COMPUTER SYSTEMS, INC.
By /s/ KEVIN M. BISSON
Kevin M. BissonSENIOR VICE PRESIDENT, CHIEF FINANCIAL
OFFICER, AND TREASURER[PRINCIPAL FINANCIAL OFFICER]
Pursuant to the requirements of the Securities Exchange Act of 1934, this report has been signed below bythe following persons on behalf of the registrant and in the capacities and on the dates indicated.
Signature Title(s) Date
/s/ MARK ASLETT
Mark Aslett
President, Chief Executive Officerand Director (principal executiveofficer)
August 22, 2012
/S/ KEVIN M. BISSON
Kevin M. Bisson
Senior Vice President, ChiefFinancial Officer, and Treasurer(principal financial officer)
August 22, 2012
/S/ CHARLES A. SPEICHERCharles A. Speicher
Vice President, Controller, andChief Accounting Officer(principal accounting officer)
August 22, 2012
/S/ JAMES K. BASS
James K. Bass
Director August 22, 2012
/S/ GEORGE W. CHAMILLARD
George W. Chamillard
Director August 22, 2012
/S/ MICHAEL A. DANIELS
Michael A. Daniels
Director August 22, 2012
/S/ GEORGE K. MUELLNER
George K. Muellner
Director August 22, 2012
/S/ WILLIAM K. O’BRIEN
William K. O’Brien
Director August 22, 2012
/S/ LEE C. STEELELee C. Steele
Director August 22, 2012
/S/ VINCENT VITTO
Vincent Vitto
Chairman of the Board ofDirectors
August 22, 2012
94

EXHIBIT INDEX
ITEM NO. DESCRIPTION OF EXHIBIT
1.1 Underwriting Agreement, dated February 10, 2011, among the Company and Jefferies &Company, Inc. and Lazard Capital Markets LLC as representatives of the several underwritersnamed therein (incorporated herein by reference to Exhibit 1.1 of the Company’s current report onForm 8-K filed on February 11, 2011)
3.1.1 Articles of Organization (incorporated herein by reference to Exhibit 3.1.1 of the Company’sannual report on Form 10-K for the fiscal year ended June 30, 2009)
3.1.2 Articles of Amendment (incorporated herein by reference to Exhibit 3.1.2 of the Company’sannual report on Form 10-K for the fiscal year ended June 30, 2010)
3.1.3 Articles of Amendment (incorporated herein by reference to Exhibit 1 of the Company’sregistration statement on Form 8-A filed on December 15, 2005)
3.2 Bylaws, amended and restated effective as of May 4, 2011 (incorporated herein by reference toExhibit 3.2 of the Company’s quarterly report on Form 10-Q for the quarter ended March 31,2011)
4.1 Form of Stock Certificate (incorporated herein by reference to Exhibit 4.1 of the Company’sRegistration Statement on Form S-1 (File No. 333-41139))
4.2 Shareholder Rights Agreement, dated as of December 14, 2005, between the Company andComputershare Trust Company, N.A. (formerly known as EquiServe Trust Company, N.A.)(incorporated herein by reference to Exhibit 2 of the Company’s registration statement onForm 8-A filed on December 15, 2005)
10.1.1* 1997 Stock Option Plan, as amended and restated (incorporated herein by reference toExhibit 10.1.1 of the Company’s annual report on Form 10-K for the fiscal year ended June 30,2010)
10.1.2* Form of Stock Option Agreement under the 1997 Stock Option Plan (incorporated herein byreference to Exhibit 10.1.2 of the Company’s annual report on Form 10-K for the fiscal year endedJune 30, 2010)
10.1.3* Form of Restricted Stock Award Agreement under the 1997 Stock Option Plan (incorporatedherein by reference to Exhibit 10.1.3 of the Company’s annual report on Form 10-K for the fiscalyear ended June 30, 2010)
10.2* 1998 Stock Option Plan (incorporated herein by reference to Exhibit 10.2 of the Company’s annualreport on Form 10-K for the fiscal year ended June 30, 2009)
10.3* 1997 Employee Stock Purchase Plan, as amended and restated (incorporated herein by reference toAppendix B to the Company’s definitive proxy statement filed on September 19, 2011)
10.4* Form of Indemnification Agreement between the Company and each of its current directors(incorporated herein by reference to Exhibit 10.4 of the Company’s annual report on Form 10-Kfor the fiscal year ended June 30, 2009)
10.5* Annual Executive Bonus Plan – Corporate Financial Performance (incorporated herein byreference to Exhibit 10.6 of the Company’s annual report on Form 10-K for the fiscal year endedJune 30, 2009)
10.6* Annual Executive Bonus Plan – Individual Performance (incorporated herein by reference toExhibit 10.7 of the Company’s annual report on Form 10-K for the fiscal year ended June 30,2009)
10.7* 2005 Stock Incentive Plan, as amended and restated (incorporated herein by reference toAppendix A to the Company’s definitive proxy statement filed on September 19, 2011)
10.8.1* Form of Stock Option Agreement under the 2005 Stock Incentive Plan (incorporated herein byreference to Exhibit 10.8.1 of the Company’s annual report on Form 10-K for the fiscal year endedJune 30, 2011)
10.8.2* Form of Restricted Stock Award Agreement under the 2005 Stock Incentive Plan (incorporatedherein by reference to Exhibit 10.8.2 of the Company’s annual report on Form 10-K for the fiscalyear ended June 30, 2011)
95
ITEM NO. DESCRIPTION OF EXHIBIT
10.8.3* Form of Deferred Stock Award Agreement under the 2005 Stock Incentive Plan (incorporatedherein by reference to Exhibit 10.8.3 of the Company’s annual report on Form 10-K for the fiscalyear ended June 30, 2011)
10.8.4* Form of Stock Option Agreement for performance stock options under the 2005 Stock IncentivePlan (incorporated herein by reference to Exhibit 10.1 of the Company’s current report onForm 8-K filed on September 28, 2007)
10.9.1* Form of Change in Control Severance Agreement between the Company and Mark Aslett(incorporated herein by reference to Exhibit 10.9.1 of the Company’s annual report on Form 10-Kfor the fiscal year ended June 30, 2011)
10.9.2* Form of Change in Control Severance Agreement between the Company and Non-CEO Executives(incorporated herein by reference to Exhibit 10.9.2 of the Company’s annual report on Form 10-Kfor the fiscal year ended June 30, 2011)
10.10*† Compensation Policy for Non-Employee Directors10.11.1* Employment Agreement, dated as of November 19, 2007, by and between the Company and Mark
Aslett (incorporated herein by reference to Exhibit 10.1 of the Company’s current report onForm 8-K filed on November 20, 2007)
10.11.2* First Amendment to Employment Agreement, dated as of December 20, 2008, by and between theCompany and Mark Aslett (incorporated by reference to Exhibit 10.2 of the Company’s quarterlyreport on Form 10-Q for the quarter ended December 31, 2008)
10.11.3* Second Amendment to Employment Agreement, dated as of September 30, 2009, by and betweenthe Company and Mark Aslett (incorporated by reference to Exhibit 10.1 of the Company’squarterly report on Form 10-Q for the quarter ended September 30, 2009)
10.12.1* Agreement, dated as of March 27, 2008, by and between the Company and Didier M.C. Thibaud(incorporated herein by reference to Exhibit 10.13 of the Company’s annual report on Form 10-Kfor the fiscal year ended June 30, 2008)
10.12.2* First Amendment to Agreement, dated as of December 22, 2008, by and between the Company andDidier M.C. Thibaud (incorporated herein by reference to Exhibit 10.4 of the Company’s quarterlyreport on Form 10-Q for the quarter ended December 31, 2008)
10.13* Agreement, dated March 1, 2010, by and between the Company and Gerald M. Haines II(incorporated herein by reference to Exhibit 10.13 of the Company’s annual report on Form 10-Kfor the fiscal year ended June 30, 2011)
10.14* Agreement, dated November 26, 2011, by and between the Company and Kevin M. Bisson(incorporated herein by reference to Exhibit 10.1 of the Company’s current report on Form 8-Kfiled on January 17, 2012)
10.15†† Purchase and Sale Agreement dated as of April 12, 2007 among 1999 Riverneck, LLC, RiverneckRoad, LLC, 191 Riverneck, LLC and BTI 199-201 Riverneck, L.P.
10.16†† Lease Agreement dated April 20, 2007 between BTI 199-201 Riverneck, L.P. and the Company10.17 Loan and Security Agreement dated February 12, 2010 between the Company and Silicon Valley
Bank (incorporated herein by reference to Exhibit 10.1 of the Company’s current report onForm 8-K filed on February 19, 2010)
10.18 First Loan Modification Agreement dated March 30, 2011 between the Company and SiliconValley Bank (incorporated by reference to Exhibit 10.1 of the Company’s current report onForm 8-K filed on April 1, 2011)
10.19 Stock Purchase Agreement by and among the Company, LNX Corporation, and the Holders of theSecurities of LNX Corporation (incorporated herein by reference to Exhibit 10.1 of the Company’squarterly report on Form 10-Q for the quarter ended March 31, 2011)
10.20 Agreement and Plan of Merger dated as of December 22, 2011 by and among the Company,King Merger, Inc., KOR Electronics, and the Securityholders’ Representative (incorporated byreference to Exhibit 10.1 of the Company’s quarterly report on Form 10-Q for the quarter endedDecember 31, 2011)
96

ITEM NO. DESCRIPTION OF EXHIBIT
10.21 Agreement and Plan of Merger by and among the Company, Wildcat Merger Sub Inc., andMicronetics, Inc. dated as of June 8, 2012 (incorporated herein by reference to Exhibit 10.1 of theCompany’s current report on Form 8-K filed on June 11, 2012)
10.22* Micronetics, Inc. 2006 Equity Incentive Plan (incorporated herein by reference to Exhibit 99.1 tothe Company’s registration statement on Form S-8 filed on August 10, 2012)
21.1† Subsidiaries of the Company23.1† Consent of KPMG LLP31.1† Certification of the Company’s Chief Executive Officer pursuant to Section 302 of the Sarbanes-
Oxley Act of 200231.2† Certification of the Company’s Chief Financial Officer pursuant to Section 302 of the Sarbanes-
Oxley Act of 200232.1+ Certification of the Company’s Chief Executive Officer and Chief Financial Officer pursuant to
Section 906 of the Sarbanes-Oxley Act of 2002101++ Interactive data files pursuant to Rule 405 of Regulation S-T: (i) Consolidated Statement of
Operations, (ii) Consolidated Balance Sheet, (iii) Consolidated Statement of Shareholders’ Equity,(iv) Consolidated Statement of Cash Flows, and (v) Notes to Consolidated financial Statements
* Identifies a management contract or compensatory plan or arrangement in which an executive officer ordirector of the Company participates.
† Filed with this Form 10-K.†† Indicates an exhibit the Company is re-filing with this Form 10-K since the Company cannot incorporate by
reference to Exchange Act reports that are more than five years old.+ Furnished herewith. This certification shall not be deemed “filed” for purposes of Section 18 of the Securities
Exchange Act of 1934, or otherwise subject to the liability of that section, nor shall it be incorporated byreference into any filing under the Securities Act of 1933 or the Securities Exchange Act of 1934.
++ XBRL (Extensible Business Reporting Language) information is furnished and not filed.
97


EXHIBIT 31.1
CERTIFICATION
I, Mark Aslett, certify that:
1. I have reviewed this annual report on Form 10-K of Mercury Computer Systems, Inc.;
2. Based on my knowledge, this report does not contain any untrue statement of a material fact or omit to statea material fact necessary to make the statements made, in light of the circumstances under which suchstatements were made, not misleading with respect to the period covered by this report;
3. Based on my knowledge, the financial statements, and other financial information included in this report,fairly present in all material respects the financial condition, results of operations and cash flows of theregistrant as of, and for, the periods presented in this report;
4. The registrant’s other certifying officer(s) and I are responsible for establishing and maintaining disclosurecontrols and procedures (as defined in Exchange Act Rules 13a-15(e) and 15d-15(e)) and internal controlover financial reporting (as defined in Exchange Act Rules 13a-15(f) and 15d-15(f)) for the registrant andhave:
a) Designed such disclosure controls and procedures, or caused such disclosure controls and procedures tobe designed under our supervision, to ensure that material information relating to the registrant,including its consolidated subsidiaries, is made known to us by others within those entities, particularlyduring the period in which this report is being prepared;
b) Designed such internal control over financial reporting, or caused such internal control over financialreporting to be designed under our supervision, to provide reasonable assurance regarding thereliability of financial reporting and the preparation of financial statements for external purposes inaccordance with generally accepted accounting principles;
c) Evaluated the effectiveness of the registrant’s disclosure controls and procedures and presented in thisreport our conclusions about the effectiveness of the disclosure controls and procedures, as of the endof the period covered by this report based on such evaluation; and
d) Disclosed in this report any change in the registrant’s internal control over financial reporting thatoccurred during the registrant’s most recent fiscal quarter (the registrant’s fourth fiscal quarter in thecase of an annual report) that has materially affected, or is reasonably likely to materially affect, theregistrant’s internal control over financial reporting; and
5. The registrant’s other certifying officer(s) and I have disclosed, based on our most recent evaluation ofinternal control over financial reporting, to the registrant’s auditors and the audit committee of theregistrant’s board of directors (or persons performing the equivalent functions):
a) All significant deficiencies and material weaknesses in the design or operation of internal control overfinancial reporting which are reasonably likely to adversely affect the registrant’s ability to record,process, summarize and report financial information; and
b) Any fraud, whether or not material, that involves management or other employees who have asignificant role in the registrant’s internal control over financial reporting.
Date: August 22, 2012
/s/ MARK ASLETT
Mark AslettPRESIDENT AND CHIEF EXECUTIVE OFFICER
[PRINCIPAL EXECUTIVE OFFICER]

EXHIBIT 31.2
CERTIFICATION
I, Kevin M. Bisson, certify that:
1. I have reviewed this annual report on Form 10-K of Mercury Computer Systems, Inc.;
2. Based on my knowledge, this report does not contain any untrue statement of a material fact or omit to statea material fact necessary to make the statements made, in light of the circumstances under which suchstatements were made, not misleading with respect to the period covered by this report;
3. Based on my knowledge, the financial statements, and other financial information included in this report,fairly present in all material respects the financial condition, results of operations and cash flows of theregistrant as of, and for, the periods presented in this report;
4. The registrant’s other certifying officer(s) and I are responsible for establishing and maintaining disclosurecontrols and procedures (as defined in Exchange Act Rules 13a-15(e) and 15d-15(e)) and internal controlover financial reporting (as defined in Exchange Act Rules 13a-15(f) and 15d-15(f)) for the registrant andhave:
a) Designed such disclosure controls and procedures, or caused such disclosure controls and procedures tobe designed under our supervision, to ensure that material information relating to the registrant,including its consolidated subsidiaries, is made known to us by others within those entities, particularlyduring the period in which this report is being prepared;
b) Designed such internal control over financial reporting, or caused such internal control over financialreporting to be designed under our supervision, to provide reasonable assurance regarding thereliability of financial reporting and the preparation of financial statements for external purposes inaccordance with generally accepted accounting principles;
c) Evaluated the effectiveness of the registrant’s disclosure controls and procedures and presented in thisreport our conclusions about the effectiveness of the disclosure controls and procedures, as of the endof the period covered by this report based on such evaluation; and
d) Disclosed in this report any change in the registrant’s internal control over financial reporting thatoccurred during the registrant’s most recent fiscal quarter (the registrant’s fourth fiscal quarter in thecase of an annual report) that has materially affected, or is reasonably likely to materially affect, theregistrant’s internal control over financial reporting; and
5. The registrant’s other certifying officer(s) and I have disclosed, based on our most recent evaluation ofinternal control over financial reporting, to the registrant’s auditors and the audit committee of theregistrant’s board of directors (or persons performing the equivalent functions):
a) All significant deficiencies and material weaknesses in the design or operation of internal control overfinancial reporting which are reasonably likely to adversely affect the registrant’s ability to record,process, summarize and report financial information; and
b) Any fraud, whether or not material, that involves management or other employees who have asignificant role in the registrant’s internal control over financial reporting.
Date: August 22, 2012
/s/ KEVIN M. BISSON
Kevin M. BissonSENIOR VICE PRESIDENT,
CHIEF FINANCIAL OFFICER, AND TREASURER[PRINCIPAL FINANCIAL OFFICER]

EXHIBIT 32.1
Mercury Computer Systems, Inc.
Certification Pursuant To18 U.S.C. Section 1350,As Adopted Pursuant ToSection 906 of the Sarbanes-Oxley Act of 2002
In connection with the Annual Report of Mercury Computer Systems, Inc. (the “Company”) on Form 10-Kfor the fiscal year ended June 30, 2012 as filed with the Securities and Exchange Commission (the “Report”), we,Mark Aslett, President and Chief Executive Officer of the Company, and Kevin Bisson, Senior Vice President,Chief Financial Officer, and Treasurer of the Company, certify, pursuant to Section 1350 of Chapter 63 of Title18, United States Code, that to our knowledge the Report fully complies with the requirements of Section 13(a)or 15(d), as applicable, of the Securities Exchange Act of 1934, as amended, and the information contained in theReport fairly presents, in all material respects, the financial condition and results of operations of the Company.
Date: August 22, 2012
/S/ MARK ASLETT
Mark AslettPRESIDENT AND CHIEF EXECUTIVE OFFICER
/S/ KEVIN M. BISSON
Kevin M. BissonSENIOR VICE PRESIDENT,
CHIEF FINANCIAL OFFICER, AND TREASURER

SHAREHOLDER RETURN PERFORMANCE GRAPH
Set forth below is a line graph comparing the cumulative total shareholder return of our common stock against thecumulative total return of the Spade Defense Index and a peer group of 23 companies for the period of June 30, 2007through June 30, 2012. The graph and table assume that $100 was invested on June 30, 2007 in each of our commonstock, the Spade Defense Index and a peer group and that all dividends were reinvested. The peer group consists of thefollowing companies:
AeroVironment, Inc. Cray, Inc. KVH Industries, Inc.American Science and Engineering, Inc. Digital Globe, Inc. NCI, Inc.Analogic Corporation Ducommun Incorporated Radisys CorporationAnaren, Inc. Electro Scientific Industries, Inc. Satcon Technology CorporationAPI Technologies Corp. GeoEye, Inc. Sonus Networks, Inc.Cognex Corporation Globecomm Systems Inc. Stratasys, Inc.Comtech Telecommunications Corp. IRobot Corporation Symmetricom, Inc.CPI International, Inc. KEYW Holdings Corporation
We retained the same peer group used in fiscal 2011 with the following exceptions: (i) EMS Technologies, Inc., HerleyIndustries, Inc., and Integral Systems, Inc. were all acquired and are no longer public companies; and(ii) AeroVironment, Inc., Cray, Inc., Digital Globe, Inc., GeoEye, Inc., and KEYW Holdings Corporation were addedto the peer group. In fiscal 2012, we used this updated peer group for analyzing our performance.
COMPARISON OF 5-YEAR CUMULATIVE TOTAL RETURNAMONG MERCURY COMPUTER SYSTEMS, INC.,
THE SPADE DEFENSE INDEX AND THE PEER GROUP
Measurement PointMercury Computer
Systems, Inc. Spade Defense Index Peer Group
6/30/07 100.00 100.00 100.006/30/08 59.86 86.04 76.386/30/09 73.53 64.25 62.226/30/10 93.24 74.46 73.026/30/11 148.49 93.97 92.326/30/12 102.78 87.88 74.65
COMPARISON OF 5-YEAR CUMULATIVE TOTAL RETURNAMONG MERCURY COMPUTER SYSTEMS, INC.,
THE SPADE DEFENSE INDEX AND THE PEER GROUP
RE
TU
RN
Mercury Computer Systems, Inc.Spade Defense IndexPeer Group
ASSUMES $100 INVESTED ON JUNE 30, 2007ASSUMES DIVIDEND REINVESTEDFISCAL YEAR ENDED JUNE 30, 2012
FISCAL YEAR2007 2008 2009 2010 2011 2012
0
20
40
60
80
100
120
140
160

DIRECTORS AND MANAGEMENT
EXECUTIVE OFFICERS Mark AslettPresident and Chief Executive Offi cer
Kevin M. BissonSenior Vice President, Chief Financial Offi cer and Treasurer
Gerald M. Haines IISenior Vice President, Corporate Development, Chief Legal Offi cer and Secretary
Charles A. SpeicherVice President, Controller and Chief Accounting Offi cer
Didier M.C. ThibaudPresident,Advanced Computing Solutions
BOARD OF DIRECTORSVincent VittoChairman of the BoardRetired President and CEOThe Charles Stark Draper Laboratory, Inc.
Mark AslettPresident and Chief Executive Offi cerMercury Computer Systems, Inc.
James K. BassRetired President and CEOPiper Aircraft, Inc.
George W. ChamillardRetired Chairman, Teradyne, Inc.
Michael A. DanielsRetired Chairman and CEOMobile 365, Inc. andNetwork Solutions, Inc.
George K. MuellnerRetired ExecutiveThe Boeing Company
William K. O’BrienRetired Chairman and CEOEnterasys Networks
Lee C. SteelePartner, Tatum, LLC
CORPORATE OFFICE
MERCURY COMPUTER SYSTEMS, INC.201 Riverneck RoadChelmsford, MA 01824-2820Tel 978.256.1300 866.411.MRCYir.mc.com NASDAQ: MRCY
INTERNATIONAL SUBSIDIARIES
NIHON MERCURY COMPUTER SYSTEMS K.K.No. 2 Gotanda Fujikoshi Bldg. 4F5-23-1 Higashi Gotanda, Shinagawa-kuTokyo 141-0022JAPANTel 81.3.3473.0140
MERCURY COMPUTER SYSTEMS LTD
Unit 1, Easter Park, Benyon RoadSilchester, Reading, RG7 2PQUNITED KINGDOMTel 44.1189.702050
AUDITOR
KPMG LLPTwo Financial Center60 South Street Boston, MA 02111
TRANSFER AGENT AND REGISTRAR
Computershare Investor ServicesP.O. Box 43023Providence, RI 02940-4023Tel 781.575.2879www.computershare.com/investor
COMMON STOCK
Mercury Computer Systems, Inc. common stock is traded on the Nasdaq Global Select Market under the symbol MRCY.
STOCKHOLDER INFORMATION
The Company’s Form 10-K and other published information is available on request, free of charge, by writing or calling Investor Relations as listed below.
INVESTOR RELATIONS
Mercury Computer Systems, Inc.201 Riverneck Road Chelmsford, MA 01824-2820Tel 866.411.MRCY
CORPORATE INFORMATION
Copyright © 2012 Mercury Computer Systems, Inc.Mercury Computer Systems, Inc. is an Equal Opportunity/Affi rmative Action Employer.

201 Riverneck RoadChelmsford, MA 01824-2820tel 978.256.1300 866.411.MRCYfax 978.256.3599 www.mc.com
mc.com
Where Challenges Drive InnovationCopyright © 2012 Mercury Computer Systems, Inc. All rights reserved.
Mercury Computer Systems is a best-of-breed provider of commercially developed, open sensor and Big Data processing systems,
software and services for critical commercial, defense and intelligence applications.