2012 active healthy kids canada report card on physical activity for children and youth
TRANSCRIPT

2012 Active Healthy Kids Canada Report Card on
Physical Activity for Children and Youth
Presentation OutlineActive Healthy Kids Canada
• History, Strategic Direction, Strategic Partners
2012 Report Card• Is Active Play Extinct?• Report Card Influences and Indicators
• Physical Activity• Sedentary Behaviour• School• Family and Peers• Community and Built Environment • Policy
Active Healthy Kids Canada
• Established in 1994, a national organization with a passionate voice for the development of active healthy children and youth in Canada.
• Focused on making physical activity a major priority in the everyday lives of Canadian families.
• Committed to providing expertise and direction to policymakers and the public on increasing and effectively allocating resources and attention toward physical activity for children and youth.
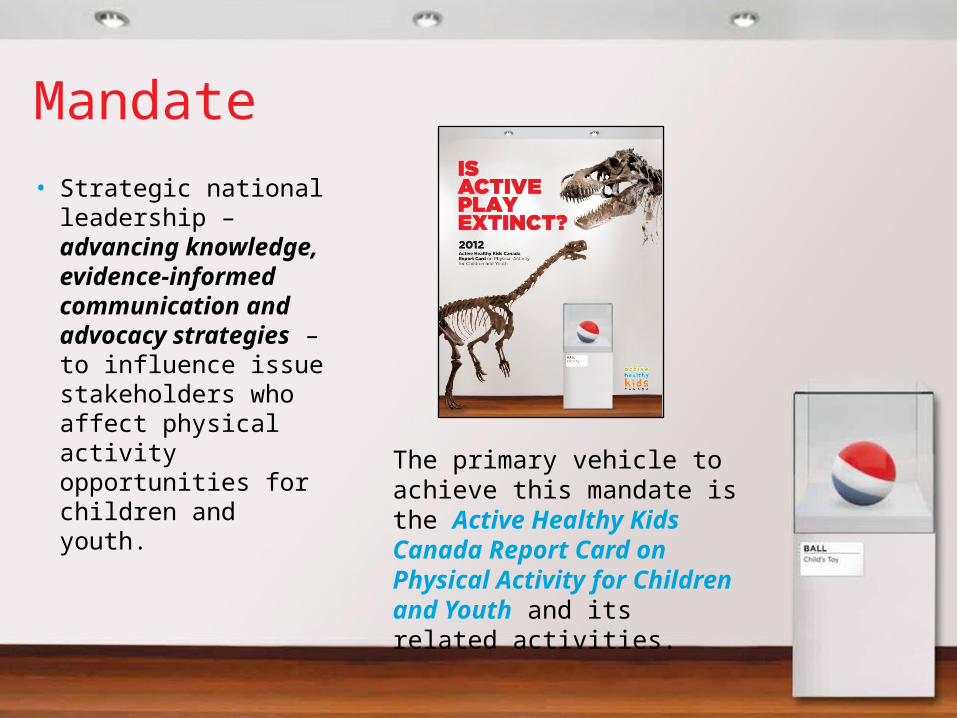
Mandate
• Strategic national leadership – advancing knowledge, evidence-informed communication and advocacy strategies – to influence issue stakeholders who affect physical activity opportunities for children and youth.
The primary vehicle to achieve this mandate is the Active Healthy Kids Canada Report Card on Physical Activity for Children and Youth and its related activities.
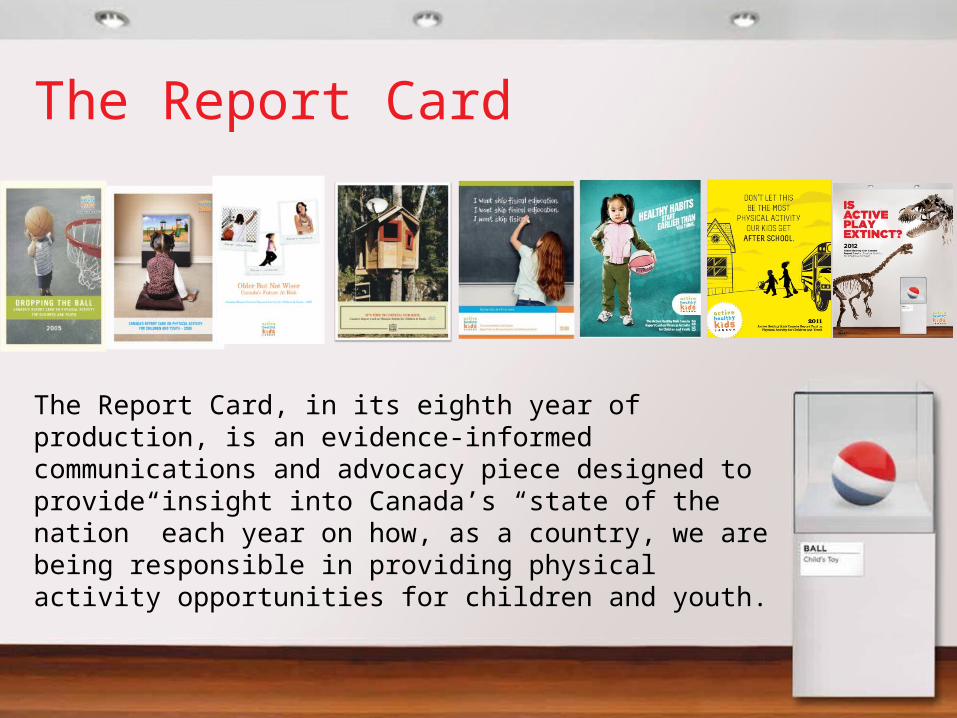
The Report Card
The Report Card, in its eighth year of production, is an evidence-informed communications and advocacy piece designed to provide insight into Canada’s “state of the nation” each year on how, as a country, we are being responsible in providing physical activity opportunities for children and youth.

Strategic Partners
The Healthy Active Living and Obesity Research Group at the Children’s Hospital of Eastern Ontario Research Institute serves as the key knowledge partner, and leads the content development and writing of the Report Card, supported by a Research Work Group.
ParticipACTION facilitates design, dissemination and media outreach for the Report Card across Canada, through communications strategies that garner attention and provoke action across government, non-governmental organizations, the media and the public.

2012 Research Work Group• Chair – Rachel Colley
CHEO Research Institute
• Coordinator – Joel BarnesCHEO Research Institute
• Mark Tremblay CHEO Research Institute
• Jean-Philippe Chaput CHEO Research Institute
• Michael BorgheseCHEO Research Institute
• Christine CameronCFLRI
• Ian JanssenQueens University
• Michael ArthurGovernment of NS
• Steve ManskeUniversity of Waterloo
• John SpenceUniversity Alberta
• Jon McGavockManitoba Institute of Child Health
• Jennifer Cowie-BonneSheridan Institute of Technology and Advanced Learning
• Brian TimmonsMcMaster University
• Guy FaulknerUniversity of Toronto
• Angela ThompsonSt. Francis Xavier University
• Adrea FinkActive Healthy Kids Canada

Report Card Influences and Indicators
• The Report Card frames around the Physical Activity Levels grade.
• It assesses the influences and indicators that have an impact on Physical Activity Levels.
• It also looks at the outcomes associated with physical activity and how these also then influence Physical Activity Levels.
Data Sources• Key data sources:• Health Behaviour of School-aged Children Survey (HBSC)• Tell Them from Me Survey (TTFM)• Canadian Fitness and Lifestyle Research Institute: Physical Activity
Monitor; Survey of Canadian Schools; CANPLAY Survey; • Canadian Community Health Survey (CCHS)• Canadian Health Measures Survey (CHMS)• National Longitudinal Survey on Children and Youth (NLSCY)• Participation and Activity Limitation Survey, Statistics Canada (PALS)• SHAPE Survey (Alberta Preschoolers)• WEB-Span Survey (Alberta)• School Health Action Planning and Evaluation System (SHAPES)• SHES: School Health Environment Survey
• In addition, the long form Report Card includes a comprehensive set of references and a variety of specific recommendations in each section and can be accessed at activehealthykids.ca.
Is Active Play Extinct?• Parks, playgrounds and neighbourhood streets are not
bustling with kids playing like they used to because active play is in danger of becoming extinct
• Researcher agree the decline of play over the past 50 or 60 years has been consistent and substantial
• Active play is fun, but it’s not frivolous. Aside from providing opportunity for regular physical activity of a child’s own design, play is shown to improve a child’s motor function, creativity, decision-making, problem-solving and social skills
• Play comes in many forms, but it is generally freely chosen, spontaneous, self-directed and fun. Regular active play can help Canadian children and youth meet the Canadian Physical Activity Guidelines of at least 60 minutes a day

Is Active Play Extinct? Key Stats
• 46% of Canadian children and youth are getting a mere 3 hours or less of active play each week (including weekend days)
• Kids are spending 63% of their free time after school an don weekends being sedentary
• 92% of Canadian kids said, if given the choice, they would choose to play with friends over watching TV
• The proportion of Canadian kids who play outside after school dropped 14% over the last decade
• At lunch and after school, kids are getting only 24 minutes of moderate- to vigorous- intensity physical activity out of a possible 4 hours.

‘The Business of Childhood’Play has been shown to foster and improve:• Motor Function• Creativity• Decision-making• Problem-solving• Executive functions – the ability to control and direct one’s
emotions and behaviours• Social skills – sharing, taking turns, helping others,
resolving conflict• Speech (in preschoolers)
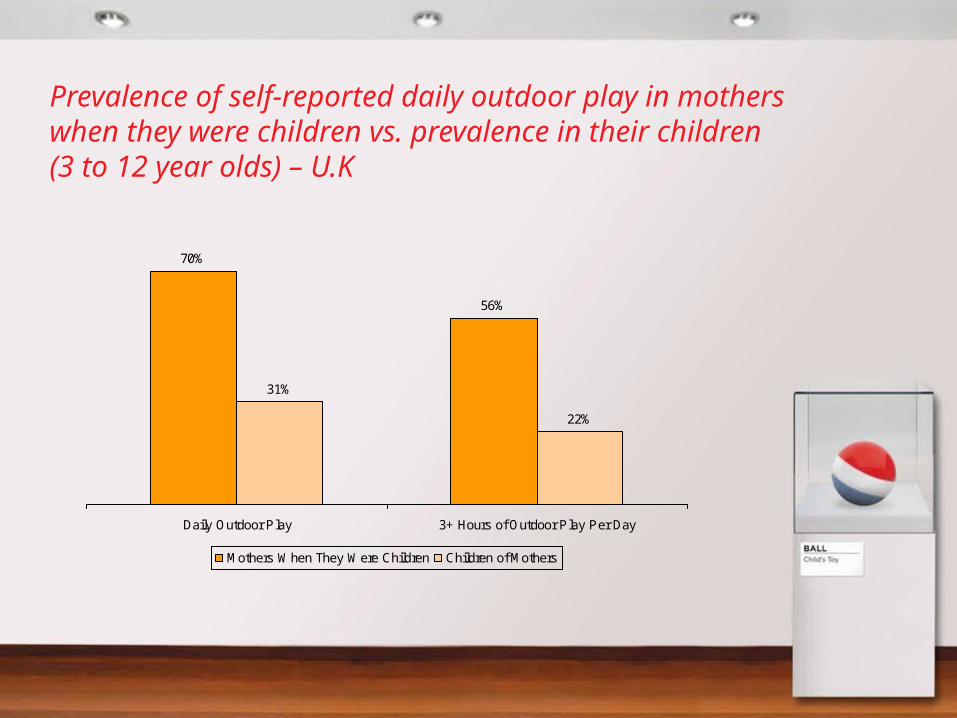
Prevalence of self-reported daily outdoor play in mothers when they were children vs. prevalence in their children (3 to 12 year olds) – U.K
70%
56%
31%
22%
Daily Outdoor Play 3+ Hours of Outdoor Play Per Day
Mothers When They Were Children Children of Mothers
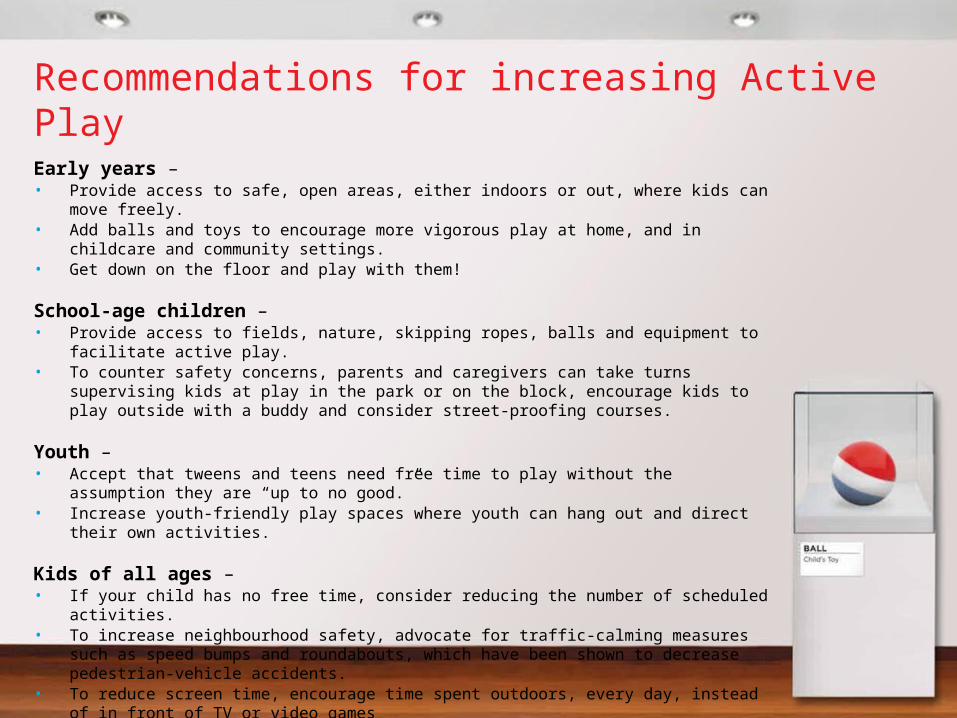
Recommendations for increasing Active PlayEarly years – • Provide access to safe, open areas, either indoors or out, where kids can move freely. • Add balls and toys to encourage more vigorous play at home, and in childcare and community
settings. • Get down on the floor and play with them!
School-age children – • Provide access to fields, nature, skipping ropes, balls and equipment to facilitate active play. • To counter safety concerns, parents and caregivers can take turns supervising kids at play in the
park or on the block, encourage kids to play outside with a buddy and consider street-proofing courses.
Youth – • Accept that tweens and teens need free time to play without the assumption they are “up to no
good.” • Increase youth-friendly play spaces where youth can hang out and direct their own activities.
Kids of all ages – • If your child has no free time, consider reducing the number of scheduled activities.• To increase neighbourhood safety, advocate for traffic-calming measures such as speed bumps
and roundabouts, which have been shown to decrease pedestrian-vehicle accidents.• To reduce screen time, encourage time spent outdoors, every day, instead of in front of TV or video
games
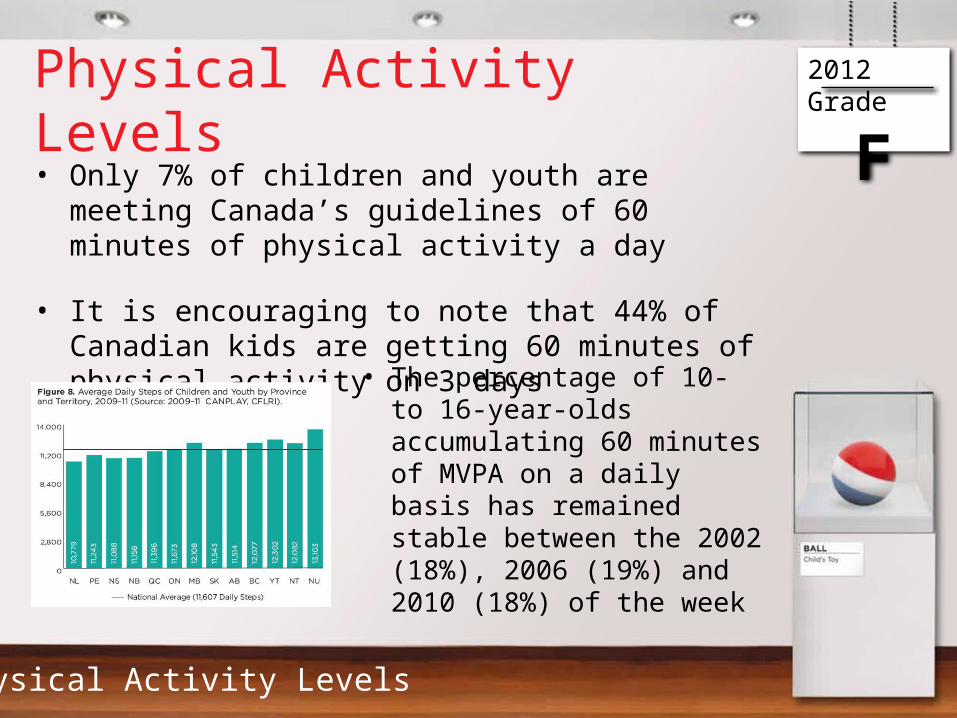
Physical Activity Levels• Only 7% of children and youth are meeting Canada’s
guidelines of 60 minutes of physical activity a day
• It is encouraging to note that 44% of Canadian kids are getting 60 minutes of physical activity on 3 days
2012 Grade
F
• The percentage of 10- to 16-year-olds accumulating 60 minutes of MVPA on a daily basis has remained stable between the 2002 (18%), 2006 (19%) and 2010 (18%) of the week
Physical Activity Levels
Recommendations• The majority of Canadian children and youth need to make
permanent changes to their routine physical activity patterns. Such changes can include increased active transportation, engagement in a new sport or activity club, and regular outdoor active play.
• Children and youth should be encouraged to add bits of physical activity throughout their day – before school, during school, after school, in the evenings and on the weekend.
• Expand social marketing efforts to communicate the importance of regular, lifestyle-embedded physical activity throughout the day and week.
Physical Activity Levels
Organized Sport & Physical Activity Participation
• 75% of kids aged 5-19 participate in organized physical activities or sport.
• Kids from higher-income families have a 25% higher participation rate than those from lower-income families.
• One soccer and baseball/softball study found that only 46% of practice time is spent being moderately or vigorously active.
2012 Grade
C
Physical Activity Levels – Organized Sport and Physical Activity Participation
Recommendations• Coaches and program leaders should organize
practices in order to ensure less idle time and more MVPA outside of necessary instructional time.
• Work with sport associations is required to devise ways for kids to be more active when participating in sports and organized activities.
• Youth-serving organizations should develop strategies to counter the dropout rate in organized sport and physical activities among teenagers.
Physical Activity Levels – Organized Sport and Physical Activity Participation
Active Play & Leisure• 46% of kids aged 6-11 get 3 hours or less of active
play (unstructured physical activity) per week, including weekends
• 5- to 17-year-olds get 7 hours and 23 minutes of physical activity per week while at home. This is down from 8 hours and 37 minutes per week in 2005, and 8 hours and 35 minutes per week in 2000
• There has been a 25% decline in active play in 6- to 8-year-old children between 1981 and 1997
• 1 in 2 adults cite fear of exposure to child predators as the reason they restrict their children’s outdoor play
2012 Grade
F
Physical Activity Levels – Active Play & Leisure
Recommendations• If your child has no free time, consider reducing
the number of scheduled activities.
• To increase neighbourhood safety, advocate for traffic-calming measures such as speed bumps and roundabouts, which have been shown to decrease pedestrian-vehicle accidents.
• To reduce screen time, encourage children to spend time outdoors, every day, instead of in front of a TV or video games.
Physical Activity Levels – Active Play & Leisure

Active Transportation• 35% of kids aged 10-16 report using active
transportation on the main part of their trip to school (33% walk, 2% bicycle)
• The percentage of Canadian kids who walk or wheel to school peaks at age 10 and then drops off
• Walking to school is the most common mode of transport for elementary school children living in the inner-urban areas of Toronto while driving is more dominant in the suburban areas
• More children walk home than walk to school
2012 Grade
D+
Physical Activity Levels – Active Transportation
Recommendations• Children and youth should be encouraged to use
various forms of active transportation (e.g., walk, cycle, skate, skateboard, scooter) to get to and from school as well as to and from the various activities they do outside of school during the week and on the weekend.
• Efforts should be expanded to implement Active and Safe Routes to School programs in all communities.
• Parents and kids should consider active transportation to other destinations besides school (e.g., sport and recreational activities, parks and playgrounds, shopping, friends’ houses).
Physical Activity Levels – Active Transportation
Screen-Based Sedentary Behaviour• Children and youth get an average of 7 hours and 48
minutes of screen time per day
• Only 19% of kids aged 10-16 report meeting the Canadian Sedentary Behaviour Guidelines, which recommend no more than 2 hours of recreational screen time per day
Sedentary Behaviour – Screen-Based Sedentary Behaviour
2012 Grade
F
Non-Screen Sedentary Behaviour• Although it is difficult to separate out non-screen
behaviours, kids under age 6 spend 73-84% of their waking hours sedentary, and kids aged 6-19 spend 62% of their free time (after school and weekends) sedentary
• Numerous studies suggest that high levels of sedentary behaviour increase health risks in kids regardless of how active they are
2012 Grade
INC.
Sedentary Behaviour – Non-Screen Sedentary Behaviour
Sedentary Behaviour Recommendations
• There is a need to increase awareness of the recently released Canadian Sedentary Behaviour Guidelines and of the ill health effects of excessive amounts of sedentary behaviour.
• Parents should implement household rules on screen time and provide alternative opportunities for active play, sport and physical activity participation.
• Children and youth need to be encouraged to interrupt their sedentary behaviours. Parents can suggest that after every hour kids spend sitting, whether doing homework or playing video games, they should get up and move – even if only for a short bit of time.
Sedentary Behaviour
Physical Education (PE)• 67% of schools report that almost all of their students
take PE classes from a PE specialist
• The proportion of students who get the recommended 150 minutes of PE per week ranges from 15-65% across school grades
• Canadian schools average from 88.7 minutes of PE per week (Kindergarten) to 169.2 minutes of PE per week (Grades 11-12). However, the percentage of students taking at least 1 PE class per week drops significantly in higher secondary grades (57% among Grades 11-12 students) compared to other grades (98% in Kindergarten, 99% in Grades 1-8
School & Childcare Settings – Physical Education
2012 Grade
C
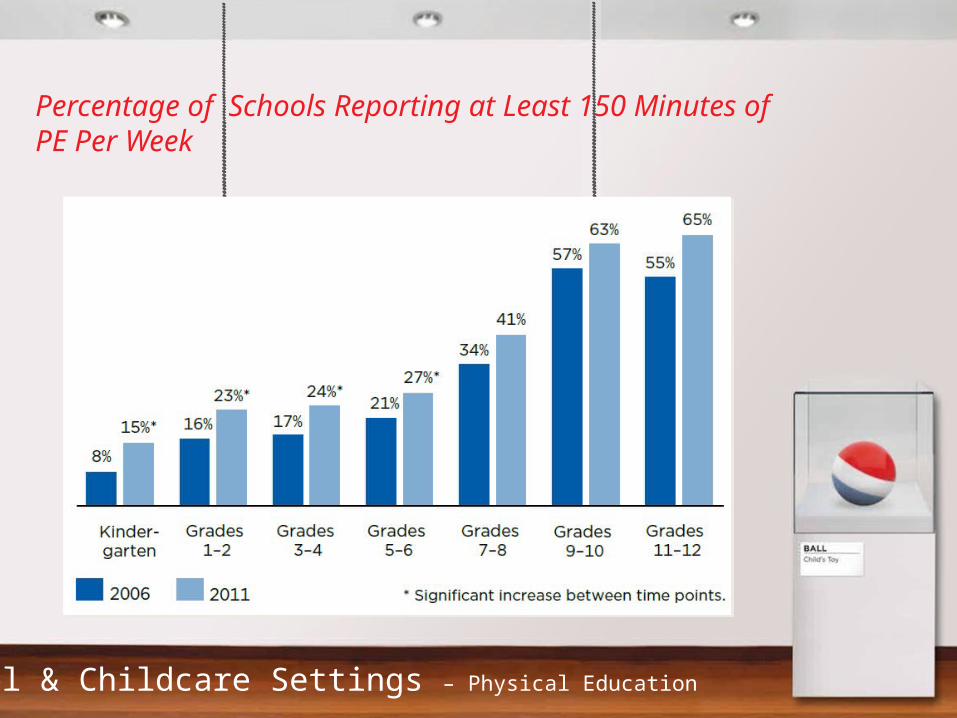
Percentage of Schools Reporting at Least 150 Minutes of PE Per Week
School & Childcare Settings – Physical Education
• More than half of schools in Canada with Grade 6–10 students offer several intramural and interschool sports.
• 77% of parents report their schools offer sport or activity programs outside of regular PE classes.
School & Childcare Settings – Sport & Physical Activity Opportunities
2012 Grade
B
Sport & Physical Activity Opportunities
School Infrastructure & Equipment
• 95% of school administrators report that students have regular access to a gymnasium during school hours
• A large majority of administrators report that students have access to outdoor facilities (89%) and gyms (84%) outside of school hours.
• 85% and 70% of school administrators agree/strongly agree that their school’s gymnasium and playing field are in good condition, respectively.
School & Childcare Settings – School Infrastructure & Equipment
2012 Grade
B+
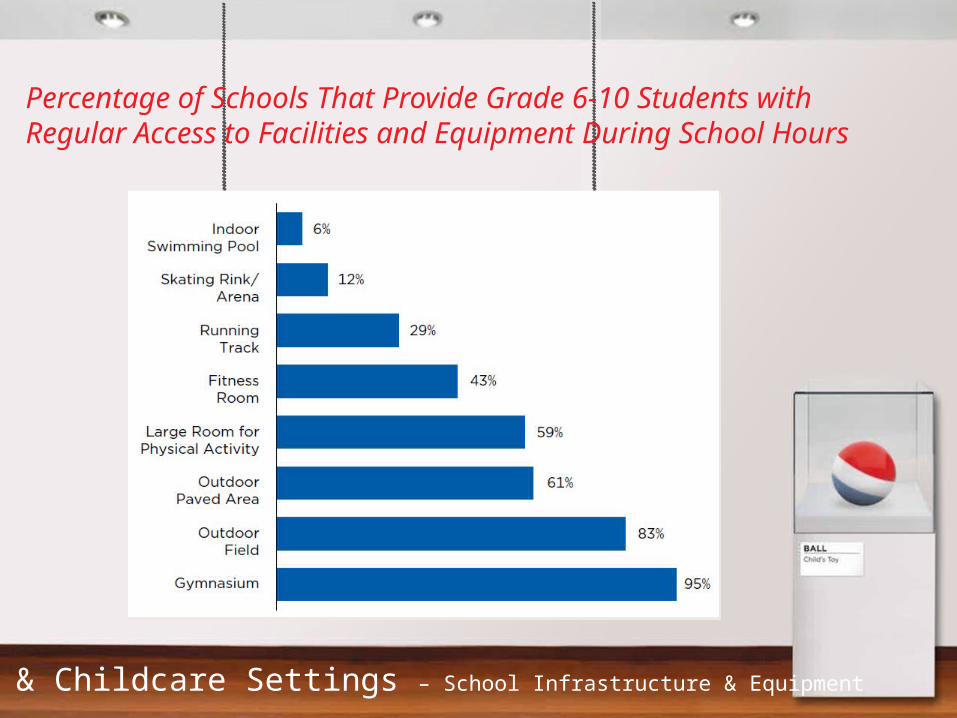
Percentage of Schools That Provide Grade 6-10 Students with Regular Access to Facilities and Equipment During School Hours
School & Childcare Settings – School Infrastructure & Equipment
School Policy• 54% of middle and high schools have a committee
that oversees physical activity policies
• 53% report having improvement plans related to physical activity for the current school year
• More than 70% of Canadian schools with Grades 6-10 students have passive policies (e.g., skateboards permitted on school grounds) and facilities (e.g., bicycle racks in secure areas to avoid theft) to encourage bicycle and small-wheeled vehicle use.
• Fewer than 40% of schools have active programs designed to encourage active transportation (e.g., organized Walk to School days)
School & Childcare Settings – School Policy
2012 Grade
C-
School & Childcare Settings Recommendations
• School district administrators need to elevate the priority of quality daily PE.
• Schools should provide a variety of physical activity and sporting opportunities that appeal to students with different interests and ability levels, since this has been shown to be successful in motivating student participation and in fostering student leadership
• The utilization of “natural” play areas (e.g., rocks, stumps, hills) and structures in school grounds should be encouraged
• Playground equipment and layouts should be updated and modified periodically to sustain student interest.
• Stronger accountability measures are required to ensure the documented curriculum is taught
School & Childcare Settings
Family Physical Activity• Only 15% of Canadian adults are active enough to
meet the guideline of 150 minutes of physical activity per week
• 38% of parents say they often played active games with their children in the past year
• Children with parents who consider themselves substantially less active than their peers take fewer daily steps on average than those children with parents who consider themselves more active than their peers
2012 Grade
D+
Family and Peers – Family Physical Activity
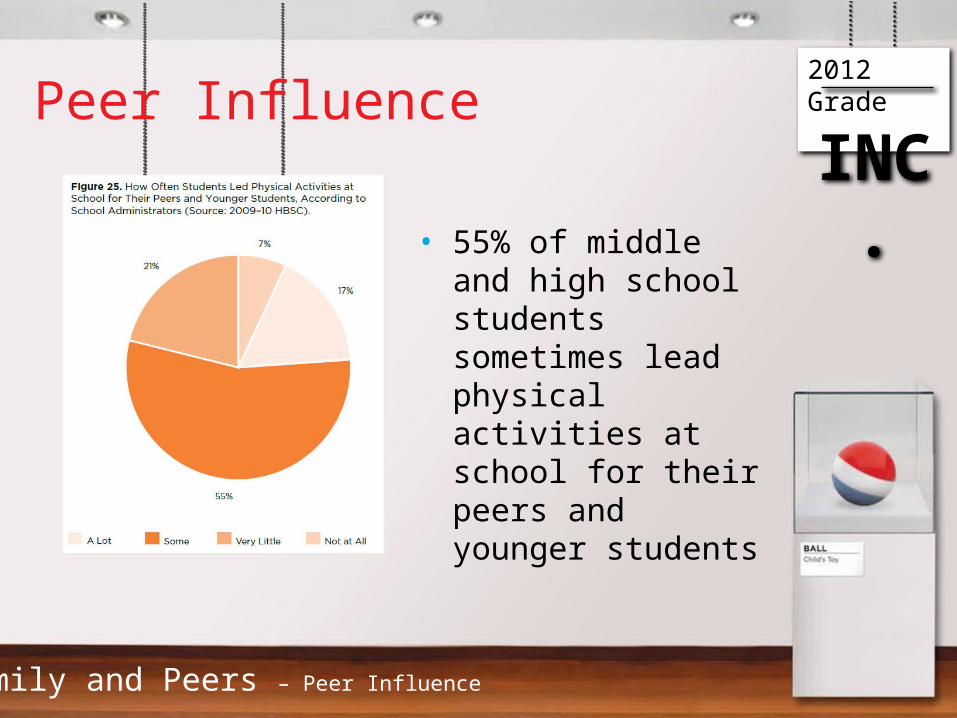
Peer Influence
• 55% of middle and high school students sometimes lead physical activities at school for their peers and younger students
2012 Grade
INC.
Family and Peers – Peer Influence

Family and Peers Recommendations• Parents should encourage their children to engage in
more unstructured, outdoor time.
• Recreation programmers should be encouraged to plan for more family-based activities. Creativity among recreational programmers in designing programs that accommodate various family needs (e.g., fitness class for parents at the same time as one for kids) should be encouraged.
• Peer-leader programs for physical activity promotion should be implemented in schools, and recreation departments should explore the use of peer-led recreation programming and park supervision.
Family and Peers
Proximity & Availability• 93% of parents report local availability of public
facilities and programs for physical activity
• Compared to 2000, there has been an increase in the proportion of municipalities saying that they have designated bicycle lanes on roads, multi-use trails (both permitting and prohibiting vehicular traffic), and bicycle carriers and ski racks on public transport (if public transit exists)
• Many Canadian schools report the availability of a municipal sports and recreation facility on evenings and weekends (56%)
Community and Built Environment – Proximity & Availability
2012 Grade
A-
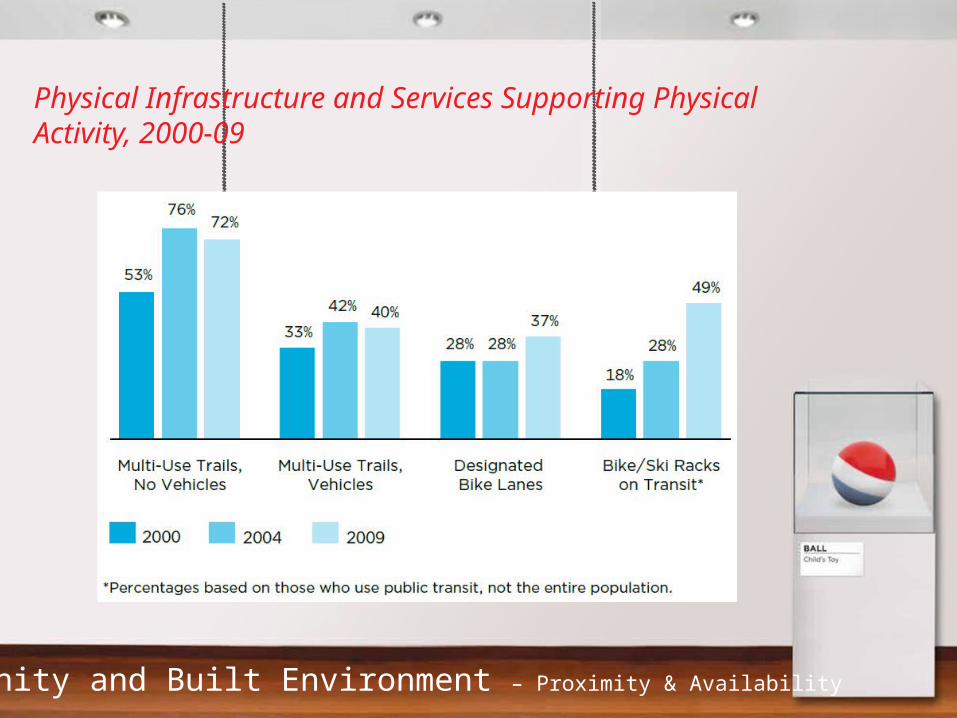
Physical Infrastructure and Services Supporting Physical Activity, 2000-09
Community and Built Environment – Proximity & Availability
Community Programming• Availability remains high, yet only 51% of
municipalities offer programs for youth at risk, 49% offer discounted child fees and 24% target Aboriginal people
• 91% of municipalities report offering physical activity programs or scheduling specifically for children
2012 Grade
B+
Community and Built Environment – Community Programming
Usage of Facilities, Programs, Parks & Playgrounds• 61% of parents with kids aged 5-17 say they use public
facilities and programs for physical activity at least ‘sometimes’
• An estimated 67% of current facilities need to be repaired or replaced
• 18% of parents with 5- to 17-year-olds report that their children use commercial facilities (e.g., YM/YWCA) for physical activity or sport either ‘often’ or ‘very often’
• Only 25% of parents with 5- to 17-year-olds report that their children use non-designated physical activity facilities (e.g., schoolyards, community centres) either often or very often, which represents no significant change since 2000
Community and Built Environment – Usage of Facilities, Programs , Parks & Playgrounds
2012 Grade
C
• 64% of families agree their neighbourhood is safe for kids to walk to and from school
• In one study, the highest perceived threat to children’s safety was traffic, with 47% of parents agreeing it is an issue
2012 Grade
B
Perceptions of Safety & Maintenance
Community and Built Environment – Perceptions of Safety & Maintenance
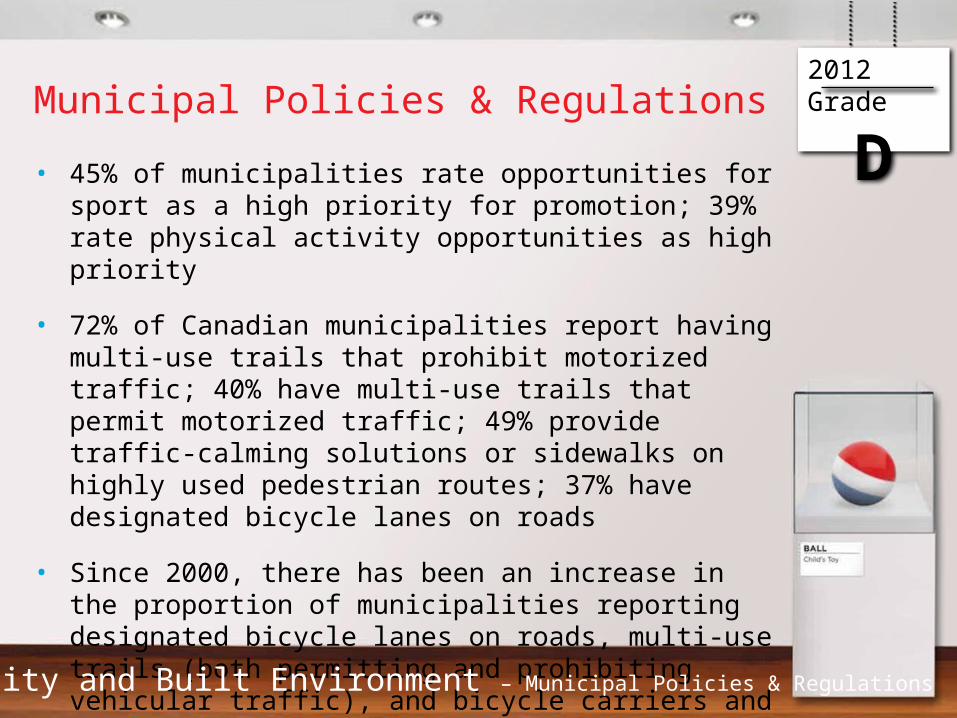
Municipal Policies & Regulations
• 45% of municipalities rate opportunities for sport as a high priority for promotion; 39% rate physical activity opportunities as high priority
• 72% of Canadian municipalities report having multi-use trails that prohibit motorized traffic; 40% have multi-use trails that permit motorized traffic; 49% provide traffic-calming solutions or sidewalks on highly used pedestrian routes; 37% have designated bicycle lanes on roads
• Since 2000, there has been an increase in the proportion of municipalities reporting designated bicycle lanes on roads, multi-use trails (both permitting and prohibiting vehicular traffic), and bicycle carriers and ski racks on public transport (if public transit exists)
Community and Built Environment – Municipal Policies & Regulations
2012 Grade
D

Nature & the Outdoors• There are limited data on the amount and
frequency of outdoor activity in children and youth.
• The most common outdoor activity was playing or just hanging out (84%). Other common activities included biking, jogging or running (80%) and use of electronic media outdoors (65%)
Community and Built Environment – Nature & the Outdoors
2012 Grade
INC.

Community and Built Environment Recommendations• Encourage collaboration between school board
administrators and recreational directors regarding shared use of facilities (this relationship should go both ways)
• Ensure adequate sidewalks, trails and bike lanes to encourage use of existing programs, parks and playgrounds.
• Provide time in facility schedules for drop-in, spontaneous activities. Many arenas and gyms are booked for organized activities that don’t serve all children and youth.
• Encourage parents to manage safety concerns (e.g., neighbourhood watch program, walking school bus, shared supervision)
Community and Built Environment
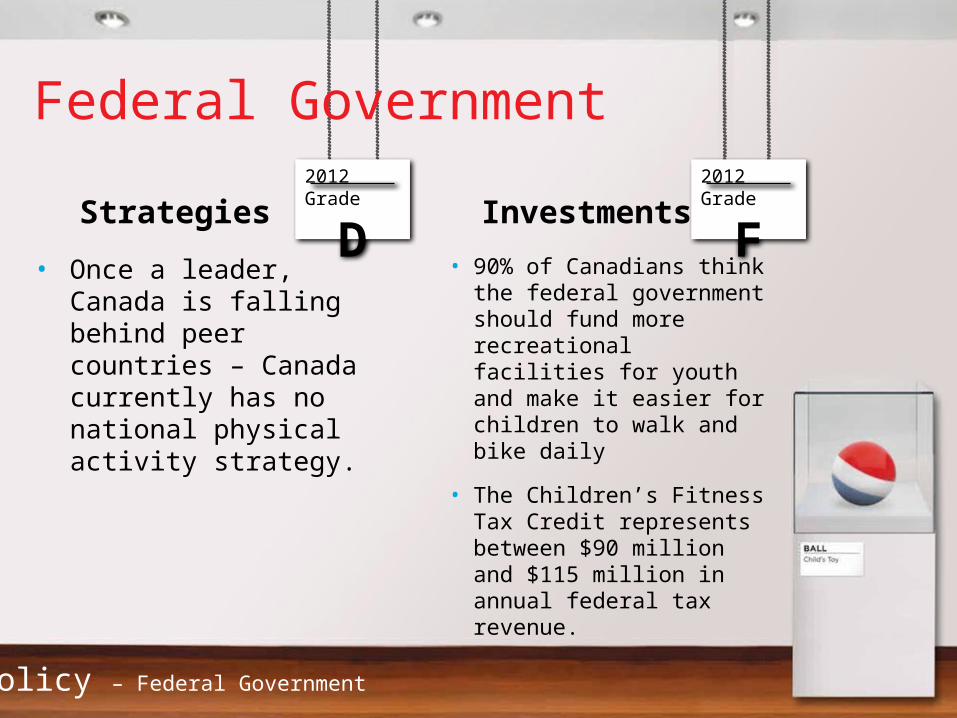
Federal Government
Strategies
• Once a leader, Canada is falling behind peer countries – Canada currently has no national physical activity strategy.
Investments
• 90% of Canadians think the federal government should fund more recreational facilities for youth and make it easier for children to walk and bike daily
• The Children’s Fitness Tax Credit represents between $90 million and $115 million in annual federal tax revenue.
Policy – Federal Government
2012 Grade
F2012 Grade
D

Provincial/ Territorial Government
Strategies
• The majority of Canadian provinces and territories have developed specific physical activity strategies.
Investments
• Less than 1% of total healthcare spending in Canada is devoted to health promotion, physical activity/ education and sport
• Provincial tax credits in 5 provinces and territories (Manitoba, Nova Scotia, Ontario, Saskatchewan, Yukon) represent approximately $95 million in annual tax revenue.
Policy – Provincial/Territorial Government
2012 Grade
C-2012 Grade
B+
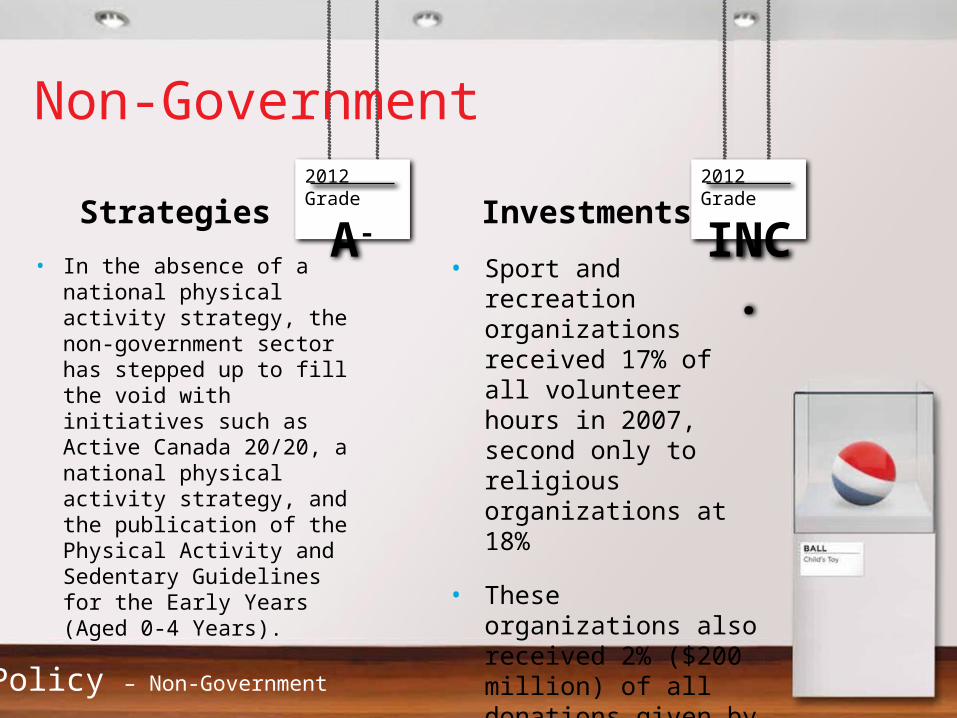
Non-Government
Strategies
• In the absence of a national physical activity strategy, the non-government sector has stepped up to fill the void with initiatives such as Active Canada 20/20, a national physical activity strategy, and the publication of the Physical Activity and Sedentary Guidelines for the Early Years (Aged 0-4 Years).
Investments
• Sport and recreation organizations received 17% of all volunteer hours in 2007, second only to religious organizations at 18%
• These organizations also received 2% ($200 million) of all donations given by Canadians in 2007
Policy – Non-Government
2012 Grade
INC.2012 Grade
A-
Policy Recommendations• Work with the physical activity sector organizations in
Canada to complete, endorse, implement and fund a comprehensive national physical activity strategy.
• Provincial/territorial physical activity strategies should be reviewed regularly to ensure they are meeting the public’s needs and having an impact
• The Children’s Fitness Tax Credit should continue with a greater maximum allowed; revisions should be made to benefit those not currently being favoured by the current policy
• Organizations that promote physical activity in children and youth should continue to take advantage of the large voluntary sector that exists in Canada
Policy
The Report Card was supported by the Interprovincial Sport and
Recreation Counsel and:

In May of 2014 Active Healthy Kids Canada will
be hosting a Global Summit. Go to
www.activehealthykids.ca/summit to find out more and join
our mailing list