2012 aag annual meeting panel session “where america’s climate, weather, ocean and space weather...
TRANSCRIPT

2012 AAG Annual MeetingPanel Session
“Where America’s Climate, Weather, Ocean and Space Weather Services Begin”
Communicating across Disciplinary Boundaries: Atmospheric Sciences in Geography
1
4:40 PM, February 24, 2012Hilton Hotel, New York, NY
Panelists:
Christopher Badurek – Appalachian State UniversityMark D Schwartz – University of Wisconsin – MilwaukeeJulie Silva – University of Maryland Louis Uccellini – NOAA

• Global Observing System• Computers
(supercomputers, work stations)
• Data Assimilation & Modeling/Science
Background: NCEPWhere America’s Weather, Climate, Ocean and
Space Weather Prediction Services Begin
Three Major Components of the
Numerical Prediction Enterprise
Everything you read, see or hear about weather, climate and ocean
forecasts is based on numerical prediction
2

Land
Ocean
• Predictions Driven by Global Observing Systems• Real-time operations require world’s largest computers• BIOLOGY/CHEMISTRY NOW BEING INCLUDED
Atmosphere
Cryosphere
Model Production Suite
3

4
Attribute CFS v1.0Operational Since 2004
CFS v2.0Operational Since March 2011
Analysis Resolution 200 km 27 km
Atmosphere model 2003: 200 km/64 levelsHumidity based clouds
2010: 100 km/64 levelsVariable CO2
AER SW & LW radiationPrognostic clouds & liquid water
Retuned mountain blockingConvective gravity wave drag
Ocean model MOM-3: 60N-65S1/3 x 1 deg.
Assim depth 750 m
MOM-4 fully global¼ x ½ deg.
Assim depth 4737 m
Land surface model (LSM) and assimilation
2-level OSU LSMNo separate land data assim
4 level Noah modelGLDAS driven by obs precip
Sea ice Climatology Daily analysis and 3-layer interactive sea ice model
Coupling Daily 30 minutes
Data assimilation Retrieved soundings, 1995 analysis, uncoupled background
Radiances assimilated, 2008 GSI, coupled background
Reforecasts 15/month seasonal output 24/month (seasonal)124/month (week 3-6)
NOAA Climate Forecast System (CFS)

5

February 4-11, 2010: “Snowmageddon”
• February 4-7, 2010: massive winter storm paralyzes mid-Atlantic region– Locations in Maryland, Pennsylvania, Virginia, and West Virginia recorded more than 30 inches of snow. – Washington DC’s two-day total of 17.8 inches ranked as the fourth highest total storm amount in history.– Philadelphia’s 28.5 inches ranked as the second highest amount– Baltimore’s 24.8 inches ranked as its third highest storm total amount
• Strong blizzard during February 9-11 affects same areas still digging out from earlier storm.
– Produced as much as 14 inches in the D.C. area, 20 inches in Baltimore, 17 inches in New Jersey, more than 27 inches in Pennsylvania, and 24 inches in northern Maryland.
• Storm system predicted 7+ days in advance; potential for heavy snow 3-5 days in advance• States implement COOP plans, airlines cancel flights, retail industry pre-stocks shelves
6
Feb 4-7, 2010 Feb 9-11, 2010
6
7
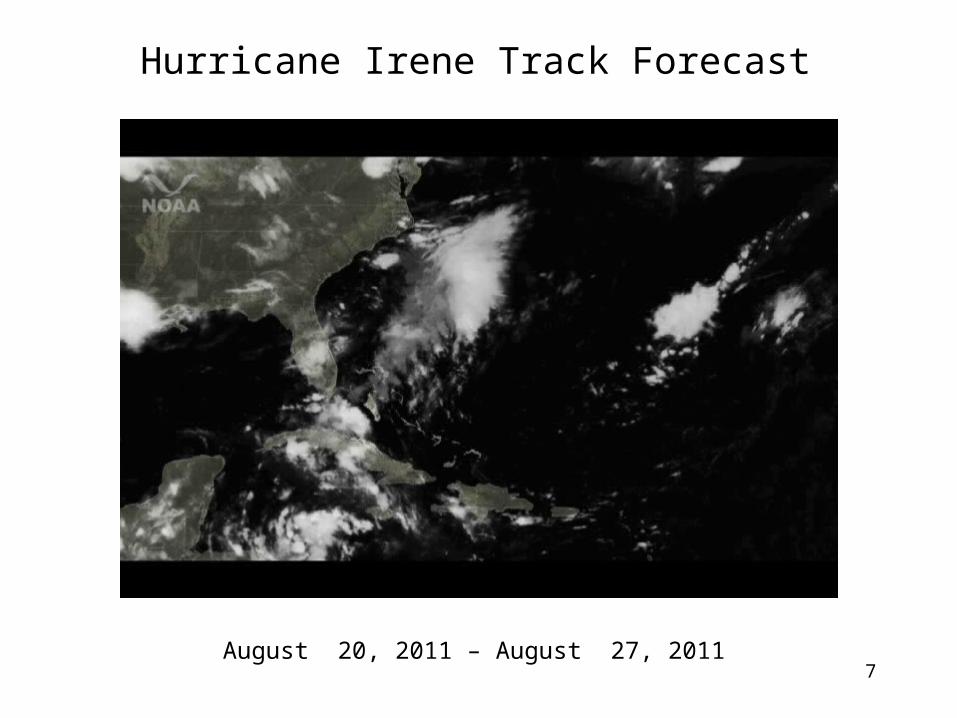
Hurricane Irene Track Forecast
August 20, 2011 – August 27, 2011
8
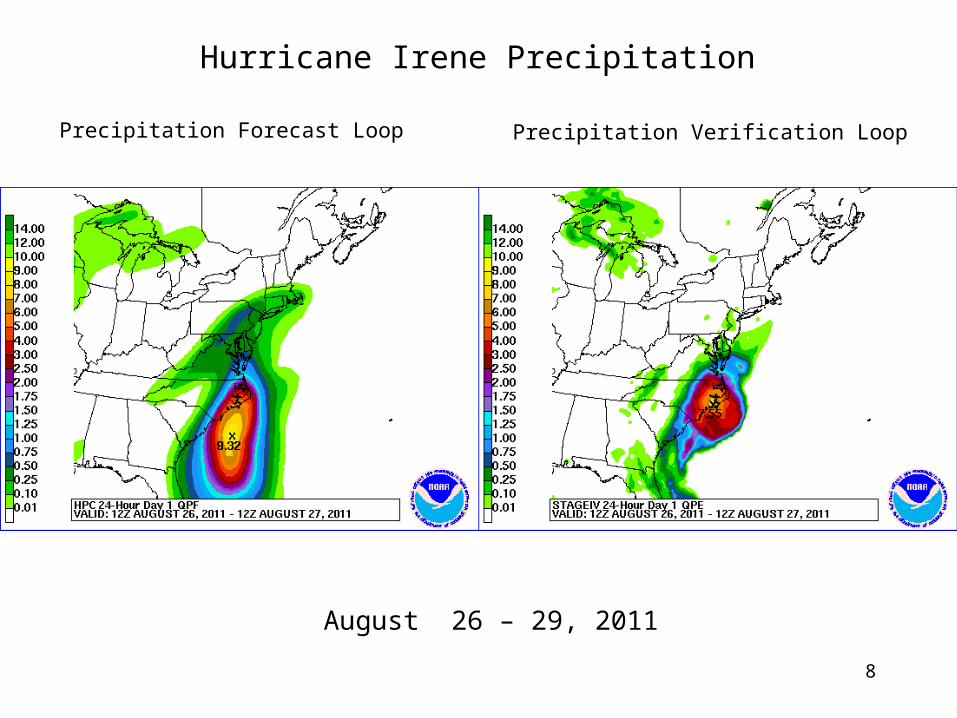
Precipitation Forecast Loop Precipitation Verification Loop
Hurricane Irene Precipitation
August 26 – 29, 2011

• Outlook issued 5 days prior; Moderate Risk issued 3 days in advance; High Risk issued 16 hours in advance
• Coordination calls initiated w/FEMA and state emergency managers 3 days in advance
• Average warning lead time 24 min• 209 tornadoes, 316 fatalities• Deadliest outbreak since March 21, 1932• 550 tornado fatalities in 2011, 4th deadliest year since 1925• Issues identified at Norman, OK event: Weather Ready Nation
- A Vital Conversation • Demands social-physical science partnership to address the
“last mile” in watches/warnings/understanding/response
9
April 27-28, 2011 Southeast Tornado Outbreak
10AM – 11PM CDT April 27, 20119

10
Key Themes of Weather Ready Nation: A Vital Conversation
Norman, OK, December 2011
• Integrate strongly social and physical science into the future end-to-end extreme weather forecast and warning process – from research to operations. Essential to complete the “last mile” in the forecast warning decision support response.
• Review carefully the issue of warning false alarms to determine physical science improvements and other strategies that can be used to reduce false alarms without decreasing threat detection and warning lead-time.
• Assess and update warning dissemination strategy. – Geo-targeting mobile devices specified
• Improve outreach and education • Advance physical modeling of severe weather to provide improved lead-
time, accuracy and precision necessary to facilitate tornado warnings based on weather forecast model output (“Warn on Forecast”). – Land model improvements are included
• Transform the National Weather Service (NWS) Assessment following major severe weather outbreaks into one more like the assessments of the National Transportation Safety Board (NTSB) following major transportation disasters. 10
11
Concluding Remarks
• Advance of predictive skill based on numerical models – one of the top intellectual advances of the 20th century
• Based increasingly on earth systems models and interdisciplinary science– Including geography/meteorology/oceanography
• 2013 AMS Annual Meeting theme: – “Taking Predictions to the Next Level: Expanding Beyond
Today’s Weather and Climate Forecasts and Projections” – Designed to build off interdisciplinary partnerships– An important partnership involves the atmospheric-ocean
sciences-geography intersection– Completing the “last mile” to expand beyond today’s forecasts
points to a physical science-social science intersection/overlap, especially for mitigation and adaptation