20126 union bank 2012 2.1. history of union bank union bank received its license from the bank of...
TRANSCRIPT
UNION BANK 2012 1
2012A N N U A L R E P O R T

2 UNION BANK 2012

UNION BANK 2012 3
Content1. Who we are
2. The Bank and its Shareholders
2.1. History of Union Bank
2.2. Bank’s Shareholders
2.3. Board of Directors
2.4. Senior Management
3. Economy Overview during 2012
3.1. Economic developments during 2012
3.2. Banking system in Albania
4. Network Development
5. Organisation structure, and human resources developments
5.1. Organisational structure
5.2. Human resources development
6. Risk Management
7. Key highlights
7.1. Customer funds
7.2. Lending activity
7.3. Card Products
7.4. Transfers and Payments
7.5. Customer Services
7.6. Financial Results
8. Plans for 2013
9. Audited Financial statements
9.1. Independent Auditors Report
9.2. Financial statements

4 UNION BANK 2012
Our VisionTo make Union Bank a sound, sustainable and a profitable bank, for our shareholders, clients and employees.
Our Strategic GoalTo be better than our competitors as measured by our customers.
Our Core ValuesWe take a long term view of our relationships with our customers...provide them with products and services at competitive prices...and are innovative and proactive with them.
We developprofessional, highly trained, motivated people.... working in teams.... with honest two way communication at all levels.
We supportthe development of the Albanian banking system and national economy.
We operatewith integrity in all our dealings.
We do not:deceive our customers;disrespect our employees;infringe the law.
1. Who we are

UNION BANK 2012 5
6 UNION BANK 2012
2.1. History of Union Bank Union Bank received its license from the Bank of Albania in January 2006. The Bank is registered as a joint stock company and provides universal banking services almost exclusively to and for individuals and enterprises in the Republic of Albania.
Main Developments 2006 The Bank obtained its license for banking activities on January 9, 2006;
2006 7 branches are opened, the bank starts its operational activities in Tirana, Durres, Elbasan, Fushe Kruje, and Fier;
2006 The Bank offers a full range of deposit, credit and payment services;
2007 13 new branches open in Tirane, Kukes, Berat, Korce, Shkoder, Pogradec, Lezhe, Lushnje, Lac and Rrogozhine;
2008 Launch of Maestro debit card product; First Mastercard credit card is issued;
2008 Launch of the UB-Online Internet banking product;
2008 Bank's total assets exceed EUR 100 million;
2008 EBRD joins as second largest shareholder (12.5% stake);
2009 Institutional Building Plan (IBP) starts as a two-year technical support program from EBRD with a purpose of further strengthening the Bank;
2009 With Kavaja and Vlora followed by 2 more new branches in Tirana, the branch network reaches 30 branches and 39 ATMs; the Bank has 236 employees;
2009
2010 6 new branches are opened, including two new cities – Divjaka and Polican;
2010 The Bank activates credit line agreement with EBRD to support lending to SMEs;
2010 The new organization structure and new performance evaluation process took place to respond to the growing size and complexity of the Bank;
2011
2011
2011 Contracts signed for the Upgrade of the Core Banking System software;
2012 Bank's total assets increased by 20% reaching EUR 200 million;
2012 country Loan Application module via internet.
2.The Bank and its Shareholders
;
;
UNION BANK 2012 7
2.2. Bank’s ShareholdersThe shareholding of Union Bank comprises financial institutions and successful entrepreneurs, acting as major supporters of the successful activity of the Bank.
Financial Union Tirana (“UFT”)UFT as the main shareholder is one of the most successful non-banking financial institutions in the region, representing Western Union in Albania, Kosovo and Macedonia, and recently in Switzerland. UFT provides simple, fast, and modern money transfer services to a large mass of clients.
The European Bank for Reconstruction and Development (“EBRD”)EBRD is the second largest shareholder. Established since 1991, EBRD is the largest financial investor in central Europe, the Western Balkans and Central Asia with a mandate to help countries in these regions to become open, market economies. EBRD is owned by 64 countries, the European Union and the European Investment Bank. EBRD’s investment in Union Bank aims to support high corporate governance standards and to help Union Bank achieve its objective of becoming one of the leading financial organizations in Albania. EBRD is represented in General Assembly and appoints one member to the Board of Directors.
Mr. Edmond Leka Mr. Leka brings an extensive experience in various financial activities. Since March 1995 he is the President and Chief Executive Officer of Financial Union Tirana and since 2006 is Chairman of the Board of Union Bank. From September 2000 until 2008 Mr. Leka was the Vice – President of American Chamber of Commerce in Albania, and previously as Chairman of the Board of Directors of Albanian Mobile Communications. He also has been Chairman of the Board of Directors of the Italian – Albanian Bank, from March 1996 to February 2002 and Chairman of the Board of Open Society Foundation Albania (Soros Foundation) from January 2002 to March 2005.
Mr. Niko LekaMr. Leka has a well established and long term experience in the financial, management and business activity. Currently, he serves with the capacity of the Executive Director of Financial Union Tirana. Previously, Mr. Leka has been a consultant and member of various management and financial organizations. In addition, Mr. Leka is the Director of Urban Credit Department (Microfinance Institution) and serves as a Board Executive Member of the “Besa” Fund (Micro credit Financing Foundation).

8 UNION BANK 2012
Mr. Genc Turku
Mr. Genc Turku serves as the member of the Union Bank Board since 2010 and is presently working as the Executive Director (before that as the Operational Director) of the Financial Union in Prishtina, Kosovo since 2000. Mr. Turku has established a solid and long work expertise in banking, treasury, foreign exchange, insurance and asset-liability matters. From 1992-2000, Mr. Turku has served in the capacity of the Head of Foreign Exchange, and later as the Head of Treasury within International Division with Savings Bank of Albania in Albania. Mr. Turku also serves as a Member of the Institution for Change Management Albania (ICLA)
Edmond Leka(Chairman of the Board)
Niko Leka(Vice Chairman of the Board)
Varuzhan PiranjaniPaul Nabavi Gazmend KadriuAgim XhajaGenc Turku
2.3. Board of Directors
The Board meets on 6-8 times per year or as needed to set the overall strategy and direction for UB, to make major organizational decisions, to approve larger credit decisions and effectively monitor the management of the Bank. In addition, the Board is expected and it does consider, review and approve, at least once a year, all operating policies of the Bank. The Board has established the Audit Committee and the Human Resource Management Committee.
Mr. Varuzhan Piranjani
Mr. Varuzhan Piranjani has been a member of the Union Bank Board since 2005, the Head of its Audit Committee since 2007, and he brings forward a long-time and accomplished experience in business, finance, banking and insurance matters. His early work relates to managerial positions in the accounting field with several enterprises. From 1992-2006, Mr. Piranjani has been in the insurance industry in the capacity of the Deputy CEO and then later as the CEO of the Insurance Institute of Albania (INSIG). Mr. Piranjani presently serves as a Board Member of Union Group and of the Unioni Financiar Tirane.
Mr. Paul Nabavi
Mr. Paul Nabavi has been a member of the Union Group Board since 2011. He is a Senior Banker at the European Bank for Reconstruction and Development, based in London. Mr Nabavi’s experience spans over thirty years in banking, finance and investments in different regions of the world. From 2007-2008 he was Director at ACTIS LLP (a leading emerging markets private equity firm) and from 2001 to 2008 he was Chief Executive of Caribbean Finance Investments Limited, based in Havana, Cuba.Prior to that, Mr Nabavi worked for many years at the CDC Group (the UK’s development finance institution) where he became Director for the financial institutions team, responsible for new investments and loans to CDC’s FI clients in Asia, Africa and Latin America. His early career was spent in corporate finance advisory work and auditing.
Mr. Agim Xhaja
Mr. Agim Xhaja serves as a member of the Union Bank Board Group since 2008 and is currently working as the Head of Service for Fixed Income, Foreign Exchange and Real Estate Portfolios for Banque Cantonale Vaudoise, Asset Management based in Switzerland. Mr. Xhaja’s background entails a vast, thorough and international experience in banking, finance and investments with a special focus in Risk-related and portfolio management issues. Some of his previous positions have been in various international firms, the most highlighted of which UBS Zurich, where he dealt with Investment Analysis and Credit Risk Aggregation. While working for other firms, he has also concentrated in mathematics and financial product engineering.
Mr. Gazmend Kadriu
The Board meets on 4-6 times per year or as needed to set the overall strategy and direction for UB, to make major organizational decisions, to approve larger credit decisions and effectively monitor the management of the Bank. In addition, the Board is expected and it does consider, review and approve, at least once a year, all operating policies of the Bank.
The Board has established the Audit Committee and the Human Resource Management Committee.

UNION BANK 2012 9
Mr. Gazmend Kadriu, CEOTetovo, Macedonia, 1969
Mr. Kadriu serves in the capacity of CEO and Board Member of Union Bank since the beginning of building the bank in 2005.
Mr. Kadriu has a comprehensive and wide-spread experience as a banker, bank regulator and auditor, and has gained an extensive and thorough professional banking and financial experience in three countries in the region (Macedonia, Kosovo, Albania), as well as a broad consulting expertise in a few other transitional countries (Bosnia, Turkey, Armenia).
Mr. Kadriu holds a degree in Economics from the University St. Ciril and Metodius – Skopje. His experience includes five years in Supervision Department of the National Bank of Macedonia, 1993 – 1998, from which the last two as Head of the Department, than as Audit Manager in Ernst & Young, Skopje from 2001 to 2004. He continued his career as the CEO and Board Member of the New Bank of Kosovo.
Mr. Kadriu has been a member of the Board of Directors and Risk Management Committee of Tutunska Banka a.d. Skopje during December 2000 - June 2006 and Board of Trustee Member and Vice-Chairman of Macedonian Enterprise Development Foundation during December 1998 - March 2006.
Mr. Ardian Petollari, Chief Business OfficerMr. Petollari serves in the capacity of Chief Business Officer in Union Bank since August 2007.
Mr. Petollari has a diverse experience including banking, business activity, academic experience etc.
Mr. Petollari graduated in Economy in the University of Tirana. After almost five years of academic and business experience he started his banking career in National Bank of Greece in Korça, holding the positions of Deputy and the Branch Manager for more than four years. Afterwards Mr. Petollari had important positions in state institutions like Deputy Director and then Director of the General Director of Taxes during 2002 – 2005, Deputy Minister in the Ministry of Economy, 2005.
Mrs. Suela Bokshi, Chief Operations OfficerMrs. Bokshi serves in the capacity of Chief Operations Officer in Union Bank since July 2005.
Mrs. Bokshi has a long term experience in banking. She graduated in Finance and Banking, in the University of Tirana and continued a Master in Banking and Finance for Eastern European Countries in “Giordano Del’ Amore Foundation” and CARIPLO Bank, Milan, Italy. Mrs. Bokshi started her career
as a Manager in charge for auditing and also financial advisory services for several industries in Albania and Kosovo. In 2004 he has been in the position of Deputy Chief Financial Officer in Procredit Bank of Albania and in 2007-2010 he served in KEP Trust, a MFI in Kosovo in the capacity of Deputy Executive Director.
Mrs. Enkeleda Hasho, Chief Credit OfficerBerati, 1975
Mrs. Hasho serves in the capacity as Chief Credit Officer and joined the executive team in 2012.
Mrs Hasho’ experience comes from a long and solid finance and banking background. Prior to being the Head of Credit for UB, Mrs. Hasho has worked as the Head of the Credit Department for International Commercial Bank (ICB) from 2000-2005 where she had a wide-ranging and close involvement to Credit and Risk controls on day-to-day issues such as: overall handling of Corporate and Retail Banking proposals, assessing and monitoring process, developing and utilizing internal risk rating systems as well as determining the adequacy of provisions and reserves by ensuring adequate controls over credit risk. Mrs. Hasho also brings a valuable expertise in the process of credit commercial strategy development based on the credit products
Mrs. Hasho graduated in Business Management from Faculty of Economics of Tirana University and she also holds an MBA degree from Universitas Fabrefacta Optime (UFO) University
Mrs. Hasho is a Member of Credit Committee and Bank Administrator since 2006.
2.4. Senior Management
in the National Commercial Bank in 1995. In 1997 she worked in the Bank of Albania in the capacity of Head of Payments Department. In 2000 she joined ProCredit Bank holding the positions of Head of Payments and Treasury and then Chief Operations Officer.
Mr. Arten Zikaj, Chief Fi-nance OfficerTirana, 1975
Mr. Zikaj serves in the capacity of Chief Finance Officer in Union Bank since March 2011.
Mr. Zikaj has an extensive experience in financial accounting, reporting and financial analysis, international and local audit on financial institution, insurance and other commercial companies, IFRS expertise, risk management, treasury operations, etc. He has also served for several years as a part time lecturer in University of Tirana, Economic Faculty.
Mr. Zikaj graduated in Business Management in the Faculty of Economics, Tirana University. He worked for about 7 years in auditing for KPMG

10 UNION BANK 2012
3. Economy Overview during 2012
3.1 Economy Overview during 2012Global economy
The global economy during 2012, however generally unstable, it developed toward its recuperation with clear signs of
growth which is at 3.1% versus 4.2% of the prior year1. The second half of the year had weaker results in some key
particularly in problematic countries. The new mechanism and change of monetary policies aimed at liberalization of the
Eurozone had a general economical decline during the second half of the year mostly due to the decrease of the domestic
crediting deriving from the required adjustments of banks balance sheets.
Albanian Economy
Albania’s economy was indirectly and/or directly impacted from all global developments, although there are a variety of issues
economic development was lower than the prior periods with a GDP growth rate of 1.5% versus 3.0% in 20112, and the
the level of 60 percent.
Unemployment lingers at relatively high levels of 13.3% but it has remained stable associated with a very slight downward
foreseen parameters and the goal of Bank of Albania.
1 Source “xxx”2 Source of Debt data: Ministry of Finance publications3 Source of Debt data: Ministry of Finance publications
0.0%
1.0%
2.0%
3.0%
4.0%
5.0%
6.0%
7.0%
8.0%
9.0%
2005 2006 2007 2008 2009 2010 2011 2012
GBP growth

UNION BANK 2012 11
12 UNION BANK 2012
0%
2%
4%
6%
8%
10%
12%
14%
16%
2005 2006 2007 2008 2009 2010 2011 2012
Unemployment & In�ation
Annual average in�ation Unemployment level
Financial Markets in Albania showed the same tendency that they have portrayed these last terms which are characterized by the constantly growing volume of activity and transactions although in lower rates, where the interest rates, during last quarter of the year have showed a decreasing trend thus reflecting the prime rate determined by BoA. Nevertheless, the financial markets in Albania still face a lot of complex challenges and obstacles along with international and domestic high risk factors embedded in them, but the primary one remains the credit risk (direct an indirect) of the entire system, while the risks form exchange and interest rates, as well as liquidity are relatively in moderate levels.
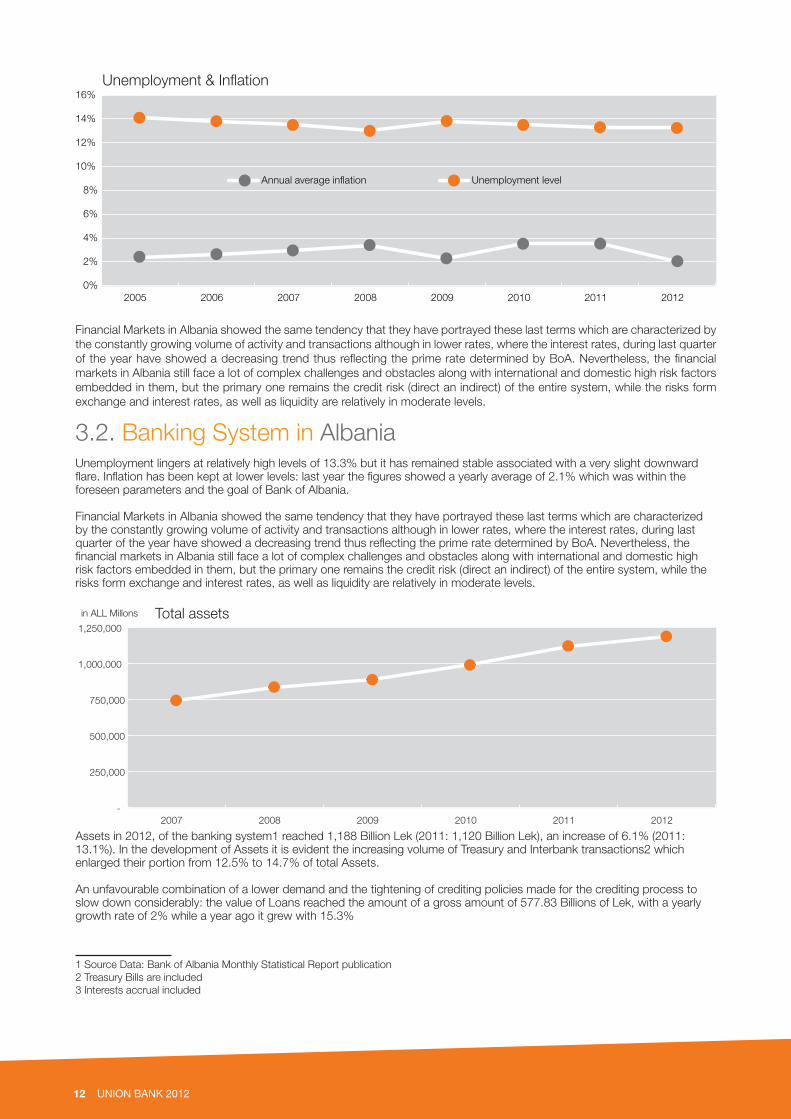
3.2. Banking System in AlbaniaUnemployment lingers at relatively high levels of 13.3% but it has remained stable associated with a very slight downward flare. Inflation has been kept at lower levels: last year the figures showed a yearly average of 2.1% which was within the foreseen parameters and the goal of Bank of Albania.
Financial Markets in Albania showed the same tendency that they have portrayed these last terms which are characterized by the constantly growing volume of activity and transactions although in lower rates, where the interest rates, during last quarter of the year have showed a decreasing trend thus reflecting the prime rate determined by BoA. Nevertheless, the financial markets in Albania still face a lot of complex challenges and obstacles along with international and domestic high risk factors embedded in them, but the primary one remains the credit risk (direct an indirect) of the entire system, while the risks form exchange and interest rates, as well as liquidity are relatively in moderate levels.
-
250,000
500,000
750,000
1,000,000
1,250,000
2007 2008 2009 2010 2011 2012
in ALL Millons Total assets
Assets in 2012, of the banking system1 reached 1,188 Billion Lek (2011: 1,120 Billion Lek), an increase of 6.1% (2011: 13.1%). In the development of Assets it is evident the increasing volume of Treasury and Interbank transactions2 which enlarged their portion from 12.5% to 14.7% of total Assets.
An unfavourable combination of a lower demand and the tightening of crediting policies made for the crediting process to slow down considerably: the value of Loans reached the amount of a gross amount of 577.83 Billions of Lek, with a yearly growth rate of 2% while a year ago it grew with 15.3%
1 Source Data: Bank of Albania Monthly Statistical Report publication2 Treasury Bills are included3 Interests accrual included

UNION BANK 2012 13
The banking system continues to be financed largely by customer deposits which reached 992 4 Billions of Lek or 7.3% higher than the prior year, which is considered a satisfactory growth rate but lower than the two last years. Sources of Funding are focused on lending, mainly to the private sector. At the end of the year, gross Loans component comprised 42.1% of total assets as opposed to 44.9% that they had in 2011, Customer Deposits reached 82.3 %, while Shareholders Equity provides 8.6% of total assets.
Loan portfolio quality has deteriorated for both business and individual loans. The classified loans reached to the level of 23% of the loan portfolio (2011: 20.8%).
Treasury and interbank
transactions 32%
Securities transactions
22%
Loans to customers, net
42%
Others Assets 4%
Banking Sector Assets structure 2012 Banking Sector Liabilities structure 2012
Treasuryand interbank transactions
5%
Operations with customers
82%
Other Liabilities
4%
Shareholdeers Equity
9%
From the regulatory prospective, in order to stimulate the growth of crediting, the Central Bank decided to lower the refinancing rate (Lek’s prime rate) three times during the year by 25 bases points (in January, March and July of 2012) , and it also launched a series of new and easing mechanisms to further help banks with this process.
4 Interests accrual included
14 UNION BANK 2012
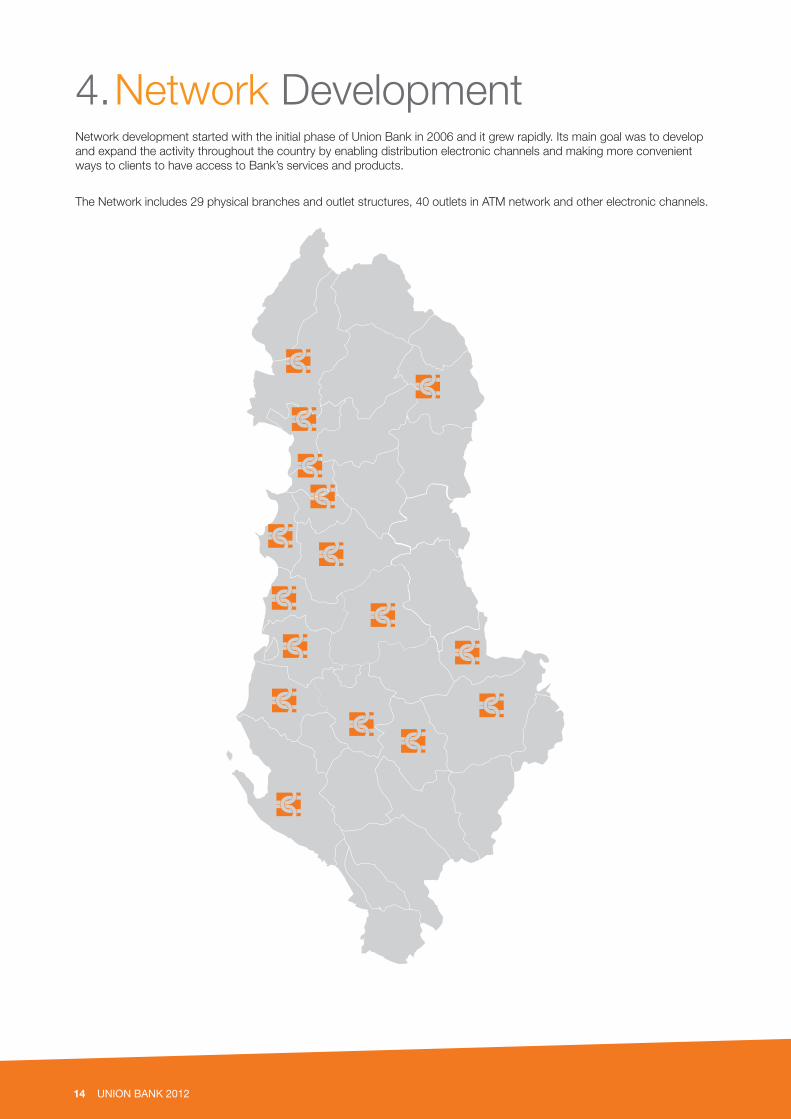
4. Network Development Network development started with the initial phase of Union Bank in 2006 and it grew rapidly. Its main goal was to develop and expand the activity throughout the country by enabling distribution electronic channels and making more convenient ways to clients to have access to Bank’s services and products.
The Network includes 29 physical branches and outlet structures, 40 outlets in ATM network and other electronic channels.

UNION BANK 2012 15
1) Dega QendroreBlv. “Zogu I”, Përballë Stacionit të Trenit, TiranëTel: 04 238 9001Fax: 04 226 2183
2) Dega ShallvareRruga “ Reshit Çollaku”, Pallatet Shallvare 2/18, TiranëTel: 04 225 3568Fax: 04 225 3570
3) Dega GardaRruga “ Dëshmorët e 4 Shkurtit”(Te Garda e Republikës)Tel: 04 227 4170Fax: 04 227 4171
4) Dega LanaRruga “Irfan Tomini”, Pallati 8/1 (ish-stacioni i fundit i Tiranës së Re), TiranëTel: 04 223 6080Fax: 04 224 2927
5) Dega Rruga e DurrësitRruga e Durrësit, Pall N.7, Njësia nr.1, TiranëTel: 04 224 7476Fax: 04 225 0788
6)Dega KinostudioRruga “Aleksandër Moisiu” (100 m para stacionit të fundit të urbanit), Kinostudio, TiranëTel: 04 237 9678Fax: 04 237 9672
7)Dega MedreseRruga e Dibrës, Medrese (godina ngjitur me Klinikën Ortodokse) TiranëTel: 04 237 8655
8)Dega Ali DemiRruga Ali Demi (ngjitur me agjencinë WU, përballë fushës së zezë) TiranëTel: 04 237 9984Fax: 04 237 9981
9) Dega LaprakëRruga “Dritan Hoxha”, Pallatet Hawai, Laprakë, TiranëTel: 04 241 5460Fax: 04 241 5461
10) Agjencia Kodër-KamëzKodër-Kamëz, Kamëz, TiranëTel: 04 720 0669
11) Agjencia Kamëz-QendërKamëz-Qendër( te pika WU, Rruga Nacionale), TiranëTel: 04 720 0483
12) Dega DurrësLagjia Nr.1, Rruga Tregtare, DurrësTel: 052 220 340Fax: 052 235 700
13) Agjenica Durrës-2Rruga “9 Maji”, Nr. 14, DurrësTel: 052 239 378Fax: 052 239 379
14) Dega ElbasanBulevardi “Qemal Stafa”, ElbasanTel: 054 245 918Fax: 054 245 919
15)Dega KavajëLagjia Nr.2, Salibeg, Bulevardi kryesor, KavajëTel: 055 243 414Fax: 055 243 405
16) Agjenica RrogozhinëLagjia Nr.2, Pallati 82/3, Shk.1, Ap.2 (ngjitur me agjencinë WU) RrogozhinëTel: 057 723 204Fax: 057 723 205
17) Dega Fushë-KrujëLagjia “ Adem Gjeli” (sheshi i furgonëve) Fushë-KrujëTel: 056 322 895
18) Dega LaçLagjia Nr.1 (20 m nga pika WU), LaçTel: 053 222 025Fax: 053 222 026
19) Dega LezhëRruga “Besëlidhja”, LezhëTel: 021 524 641Fax: 021 524 661
20) Dega ShkodërLagjia “Qemal Stafa”, Rruga “ 13 Dhjetori”, ShkodërTel: 022 255 163Fax: 022 251 500
21) Dega KukësLagjia Nr.5 (përballë hotel Amerika), KukësTel: 024 224 728Fax: 024 224 727
22) Dega LushnjeLagjia “Kongresi” (godina pranë Bashkisë) LushnjeTel: 035 226 366Fax: 035 226 365
23) Agjencia DivjakëQendër Divjakë, LushnjeTel: 037 122 563Fax: 037 122 573
24) Dega FierSheshi “Fitorja”, Ish-turizmi Apollonia, FierTel: 034 230 258Fax: 034 230 259
25) Dega BeratLagjia “22 Tetori” (përballë shëtitores), BeratTel: 032 238 000Fax: 032 238 555
26) Agjencia PoliçanQendër, Poliçan, SkraparTel: 036 824 132Fax: 036 824 133
27) Dega VlorëLagjia “Lef Sallata” (Rruga Qendër-Skelë, te Conad) VlorëTel: 033 237 500Fax: 033 237 600
28) Dega PogradecLagjia Nr.1, Bulevardi “Reshit Çollaku” (Kapri Center), PogradecTel: 083 226 804Fax: 083 226 803
29) Dega KorçëSheshi i Demostratave, KorçëTel: 082 254 924Fax: 082 254 923

16 UNION BANK 2012
5.Organisation structure and Human Resources developments5.1 Organisational Structure
Board ofDirectors
Chief ExecutiveOfficer
BUSINESSDIVISION
CREDITDIVISION
FINANCEDIVISION
OPERATIONSDIVISION
Retail BankingDepartment
Corporate BankingDepartment
MarketingDepartment
Credit Risk Department Operations / Procedures
Department
IT Department
Payments and CardsDepartment
AML / Compliance
AccountingDepartment
Reporting and Fin. Con.Department
Budgeting and AnalysisDepartment
TreasuryDepartment
AdministrationDepartment
SecurityDepartment
Credit RiskBusiness Unit
Credit RiskIndividual Unit
LoanAdministration Unit
LoanRecovery Unit
Bank Lawyer
Human ResourcesDepartment
Risk ManagementDepartment
InternalAudit
AuditCommittee

UNION BANK 2012 17
Enklida Çibuku Human ResourcesPlator Ulqinaku Risk Management
Gent Drita Corporate BankingValdet Kodra Retail BankingDiana Huta Retail Credit Risk Erand Saliaj Loan Administration Department
Irena Rushaj Information TechnologyValbona Banka (Çuçka) Payments and CardsJonida Vaso (Lamaj) Operations and ProceduresDritan Dezhgiu AML / ComplianceMarjeta Sejdari AdministrationQirjako Taçe Security
Ilirjan Ligaçaj TreasuryAdela Haxhiu AccountingErida Malosmani Reporting and Financial ControlElona Kola Budgeting and Analysis
Our Department Managers
5.2 Human resources development
Union Bank’s organization counts 289 members: 95 in Head Office and 194 in the branch network. This number indicates for a yearly net addition of 19 or an approximate 7% increase compared to the previous year.
The Bank’s increase and solidification depends on the addition of extra support staff and the strengthening managerial capacity in the branches, as well as increasing the capacities of various Head Office departments.During 2011, the Human Resources Committee (HRC) was established. HRC activity is regulated by the HRC charter, approved by the Board, and its main achievement in 2011 was the proposal and approval by the board of a new compensation plan as part of the HR policy.
90
166
210
236
257
276
289
0
50
100
150
200
250
300
350
2006 2007 2008 2009 2010 2011 2012
Numbers of staff
Regarding hiring and promotion procedures, the Bank puts a strong emphasis on the promotion from within the organization. During 2012, five vacant positions in HO were filled by branch staff, and approximately 19 employees were promoted to higher positions within the Bank.

18 UNION BANK 2012
Learning and Training Union Bank continues to uphold high professional and ethical standards regarding its existing and newly-hired organization members, based on the strong belief that the success of the bank relies first and foremost on its staff.
A rigorous annual performance evaluation is built in order not only to aide the bank in its HR management, but also to provide feedback and guidance for the professional development and advancement of employees at all levels. From time to time the Bank organizes an employee opinion survey and uses the results to identify where it needs to invest more time, energy and resources to create a positive employment experience. In this regard, the Bank continues to instil and require professional higher learning, first-rate customer service, team-effort, and great ethical working environment, and at the same time bringing and maintaining a positive, challenging attitude, and conveying this organizational culture to its newest members.
The bank holds before and on-the-job instructions and training to all employees from the first day of joining the Bank aiming to provide them with relevant knowledge prior and during workA special emphasis is also put in introducing the new employees and frequently training the existing employees with the new and updated rules and regulations for a range of compliance and safety areas such as operational procedures, Anti Money Laundering (AML) procedures, physical security issues, etc.During 2012, approximately 23 training courses were organized; the internal ones consisted of several rounds to cover for all branch employees in their respective position, all totalling to 362 training hours.
Most of the training sessions for existing and new employees focused on Customer Service Staff, Sales Force Efficiency and Success, Management and Leadership etc.
Employee Engagement The engagement of our employees depends on giving our people an environment at work that encourages and motivates them to take the extra step for servicing customers and upholding the bank’s standards at the same time.
Remuneration PolicyThis is a very important issue that UB currently faces and one which has a significant impact on employee engagement. The Human Resources Committee (HRC) that was established in 2011 is regulated by the HRC charter and approved by the Board, and it also approves the compensation plan as part of the HR policy.
All performance compensation actions stem from the overall performance of Union Bank, the individual business unit performance as measured by level of achievement of business targets and individual staff performance as measured by the performance appraisal. The Bank implements the following salary reviews, complying with respective rules: the initial review, the promotion review, annual performance review and loyalty review, with the main focus in the performance review in order to reward the best performers. Compensation serves as one part of a total reward and recognition package that includes the base pay, bonuses and benefits for employees.
In addition to the base salary, the Bank applies several bonuses, the most important ones related to the achievement of the business targets. Some of the bonuses applied are the annual performance bonus, quarterly sales bonus, New Year bonus and the bonus for exceptional performance.
Safety and SecurityUB puts lots of efforts into making banking safer by always increasing controls that protect the customer information, launching fraud prevention programs and investing in new security and technology equipments and procedures. New and existing employees are continuously informed about updated security measures and they also participate in sessions accompanied with frequent adequate training to allow their optimal dispersion throughout the bank network.
UB also makes it one of its main functions to ensure the health, safety, and wellbeing of its employees. A special Security Council is created with participants from both the Bank’s Management and bank’s personnel, which regularly meets in order to identify potential areas for improvement of the working conditions and safety and security standards.
In terms of benefits, Health Insurance was renewed for almost the entire staff. The scheme covers a regular check up and a high number of employees has benefited.

UNION BANK 2012 19
6. Risk Management In its business activities, the Bank strives to achieve an optimum balance between the risks taken and returns realized, while steering clear of excessive, unnecessary, and uncontrollable risk exposures. Based on its business profile and characteristics, the bank has identified several major risk categories such as Liquidity Risk, Credit Risk, Counterparty Risk, Financial Risks and Operational Risk. While the performance of each of these risks is explained in detail under the Auditor’s report on Financial Statements, in this section we are providing main policies with regards to risk control and mitigation.
Liquidity: The Bank strives to maintain a well-diversified depositor base and preserve satisfactory access to funding avoiding uncon-trolled concentrations and structural imbalances. The marketability of assets, whose availability for sale or adaptability as collateral for refinance, is evaluated under different market scenarios. In addition, the Bank monitors any internal and external factors that might have an impact on its capability to remain liquid.
Bank’s ALCO has developed quantitative models for reducing cash and liquid assets balances while observing at all times liquidity risk indicators defined by regulators and Board of Directors. Credit:In addition to direct accounting loss, credit risk is viewed in the context of economic exposures taking into consideration the opportunity costs, transaction costs, and expenses associated with a non-performing asset. Credit risk is mitigated by: cash-flow oriented lending, adequate collateral as second-tier protection, appropriate risk-based pricing, effective loan portfolio structuring and diversification, effective bank-wide controls, starting from sales, through risk assessment, loan administration, loan review and workout, and adequate reserve funds and contingencies to protect the bank’s position.
Moreover, factors that could affect the bank’s individual and aggregate credit risk exposure (e.g. credit concentration, industry, geographic region, political events, etc) are identified and adequately tackled. The Bank therefore has tailored its credit pro-cedures in such a way that they minimize credit risk, but at the same time comply with Credit Policy intended to extend credit facilities to a targeted clientele.
Counterparty:The Counterparty Exposure Risk is treated very much like Credit Risk, except that the borrower is a bank or financial institution. In such case, the creditworthiness is evaluated individually and limits set accordingly based on the results of such evaluation.
Risk indicators used to measure the inter-bank exposure risk are in line with the definitions provided in regulations of the Bank of Albania such as definition of inter-bank exposure, both with single counterparties and with related parties, definition of risk-weighting, depending upon type of exposure and counterparty, definitions on collateral/ guarantee netting, and those on regulatory capital requirements, including different categories of capital.
As part of the Counterparty Risk, the bank recognizes the Country Risk and many actions in the recent period of market turbu-lence regarding a number of Eurozone countries have been triggered taking into active consideration exactly the country risk.
Financial: The financial risks include the assets risk, the foreign exchange risk, and interest rate risk. While the asset risk is not present for the moment, the Bank puts on focus the foreign exchange and interest rate.
The Foreign Exchange Risk arises from changes in foreign exchange rates that affect the value of assets, liabilities and off-bal-ance sheet activities denominated in currencies different from the bank’s own currency.
The Bank’s ALCO has developed rules, procedures, instruments and control mechanisms to cover for the currency revaluation risk. This risk is managed by controlling for daylight both trading and open position limits and overnight open position limits which are fully compliant with the regulatory definitions.
Interest rate risk is defined as the sensitivity of the bank’s earnings and equity to changes in interest rates. Interest rate risk re-sults from the differences in the way assets, liabilities and off-balance sheet instruments are affected by interest-rate changes.
Therefore to achieve the objective of protecting the bank’s net interest margin from changes in the market interest rates, the bank has actively managed its interest rate risk profile within controlled risk parameters. As a core business risk, it has strived to maintain an interest risk profile that leads to financial performance consistent with its long-term objectives.
The bank’s ALCO has established risk control limits which are monitored frequently. The management of interest rate risk en-compasses the gap technique, interest spread management, and dynamic pricing of rate-sensitive assets and liabilities in line with the market expectations and movements.

20 UNION BANK 2012
Operational:The operational risk is incurred on the delivery of all of the bank’s products and services and arises on a daily basis as trans-actions are being processed. It may occur also as a result of inadequate information systems, technology failures, breaks of internal controls, and fraud or unforeseen catastrophes.
To cover for operational risk, the Bank has established a framework that incorporates clear definitions of operational risk throughout the organization and a philosophy of business process self-assessment and incident response/ management. It has also developed, and is actively monitoring, the performance of key risk indicators.
The Bank’s Operational Risk Committee (ORC) is periodically monitoring the occurrences of operational losses and has as-signed responsibilities for mitigating losses and providing back-up solutions and risk coverage for activities subject to opera-tional risk.

UNION BANK 2012 21
7. Key HighlightsProducts of Retail and Commercial BankingUB proudly extends its retail and commercial banking services to more than 70,000 clients. It provides a full range of products, whose features and parameters offer efficiency, security, transparency and flexibility. They include current and deposit accounts, credits and advancements as well as guaranties, transfers and a variety of money transactions.
7.1 Customer FundsThe growth of Customer Funds in 2012 marked significant yearly additions that took the total amount to 24 Billions of Lek. This figure reflects an increment of 4,5 Billons of Lek or a 26% growth rate compared to the previous year. As a result of this, the bank increased its total market share from 2.1% to approximately 2.5% at the end of the year.
1,510,483
5,862,408
9,925,440
12,747,859
16,857,231
19,548,619
24,031,899
-
2,000,000
4,000,000
6,000,000
8,000,000
10,000,000
12,000,000
14,000,000
16,000,000
18,000,000
20,000,000
22,000,000
24,000,000
2006 2007 2008 2009 2010 2011 2012
in ALL '000 Customer Accounts developments
During the years Union Bank’s funds have increased and maintained significant growth rates each period by offering a comprehensive range of products to its retail and business clients including packets with combination of current accounts, saving and term deposits, in both local and foreign currency.
The sales and operational team continued to build strong relationship with clients, providing them with a wide variety of options to help them reach their financial goals and increase their savings by tailoring to their needs.
Term, Savings and Current Account with 99% of the total Customers Deposits are the core of the Bank’ Customer Funds. The composition of these funds resembles the formation of the last year, but the Term Deposits increased their share from 73% to 78%, pretty much in the line with the budgeted levels.
Banks’ deposit mix improved significantly, with strong growth in Term Deposits combined with migration away from shorter terms into longer terms as the division adjusted its pricing strategy. Term Deposits are a very strong and steady component of Customer Funds, and Individuals and Businesses followed a firm rising path in 2012 as well. Their growth took them to 18 Billions of Lek, up by 3.8Bilion or 27% higher than 2011.
CurrentAccounts
12%
Savings Accounts
10%
Time Deposits 77%
Othercustomer accounts
1%
Customers Accounts Structure 2012

22 UNION BANK 2012
0
2,000
4,000
6,000
8,000
10,000
12,000
14,000
0
2,000,000
4,000,000
6,000,000
8,000,000
10,000,000
12,000,000
14,000,000
16,000,000
18,000,000
20,000,000
2006 2007 2008 2009 2010 2011 2012
Number of TD Volume in Lek '000 Term Deposits developments
Time Deposits Time deposits, Numbers
products, last year, the bank offered three new products: term deposits with up-front interest payment for 11 months, and term deposits for 25 and 35 months. These products had an immediate response and proved to be very appealing to existing and new clients.
7.2 Lending ActivityThe total Loans portfolio reached a value of LEK 13.6 Billion, reflecting a yearly increase of LEK close to 2 Billion or 17% compared to 2011. The growth has been in much better relative terms compared to the yearly growth of the system that has been at the range of 2%.
-
1,000
2,000
3,000
4,000
5,000
6,000
7,000
8,000
9,000
10,000
-
2,000,000
4,000,000
6,000,000
8,000,000
10,000,000
12,000,000
14,000,000
16,000,000
2006 2007 2008 2009 2010 2011 2012
Numbers Volume in Lek '000 Loans to Customers development
Loans to customers, Volume Loans to customers, numbers

UNION BANK 2012 23
Viewed in the overall frame of macroeconomic global and domestic conditions and in Albania we could mention that the Bank faces a complexity of challenges that directly affects the outstanding amount of the portfolio and its quality. As we mentioned earlier in the report, the main reason is the appetite reduction of clients as a result of the insecurity of economical developments in the future.
Nevertheless, the number of our individual and business clients grew by end 2012 to more than 9,500 (from approximately 7,400 in 2011) who benefited from a diverse product range of loans and overdrafts.
Within the growth of the entire portfolio, the bank focused on further enlargement of retail lending and smaller business loans. As a result, 56% of the portfolio growth was in retail segment where the number of retail loans grew by 31% substantiated by an increase in volume by 41% compared to previous year. As a result of this increase, the retail portion of the portfolio went from 24% to 28% of the entire volume.
Trade24%
Other Services15%
Construction14%
Real Estate18%
Consumer11%
Others18%
Bank's credit exposue by industry sectors
7.3 Card ProductsThe Bank has equipped a large portion of its clientele base with Debit Cards (Maestrocard) which provide a full range of domestic and international purchasing and withdrawing options in most of the ATM and POS networks. The number of transactions performed in 2012 was over 500,000. The Credit Card (Mastercard) activity started in 2008, and by Dec’12, the trends are progressive. Notable growth is detected in the number of users which have gone up as well as the number of transactions, even though the Bank (in similar terms with the entire market) faces strong competition and difficulty in the overall customer familiarization with these products. In June 2012, we commenced a program to replace all magnetic strips Maestro Cards with electronic chip Maestro Cards. Customers are now benefiting from a higher level of purchase protection.
7.4 Transfers and Payments In 2012, the total number of transfers and payments international and domestic (in and out) reached an amount of 20,500. UB’s clients have benefited for years from a wide range of services related to monetary and wire transactions. The product of transfers is closely related to the numbers of clients, thus the higher the number of clients who have accounts with the bank, the higher number of these transfers will be, and related fee income would also increase if cross-sell efforts produce higher penetration rates in this segment.
7.5 Customer ServiceSince the Customer Service is the one of main key areas of its strategy, the Bank always aims to listening to the customers’ views and reflecting on their opinions, suggestions and requests. Besides daily interactions with its clients, there are also leaflets and questionnaires placed inside every branch and clients are encouraged to fill out these surveys about the service and the banking products

24 UNION BANK 2012
Furthermore, the ultimate goal being the further improvement of customer service, the bank has organized an activity called “Mystery Shopping” which is conducted frequently for several times a year by independent “shoppers” who interact with our tellers and the customer service and where the scope of the analysis are: timeliness, accuracy, fairness, and transparency of transactions. The feedback that this activity contains has turned out to be very positive and valuable. On one hand, the bank understands and assesses its level of service and professionalism, and on the other hand, the employees are able to evaluate, reflect and enhance their overall performance viewed from a different angle.
7.6 Financial ResultsMain results of the year
In Lek '000 In Euro '000* Change
2012 2011 2012 2011 2012
Balance Sheet
Total assets 28,078,859 23,415,942 201,152 168,545 20%
Gross loans portfolio 13,620,463 11,642,169 97,575 83,799 17%
Investments in securities 8,538,448 6,095,723 61,168 43,876 40%
Placements with banks 2,632,691 2,677,364 18,860 19,271 -2%
Customer accounts 24,031,899 19,548,619 172,161 140,708 23%
Paid in capital 2,299,633 2,159,743 16,474 15,546 6%
Profit and Loss
Net interest income 819,375 721,255 5,870 5,197 14%
Net fee and commission income 121,795 139,708 873 1,007 -13%
Other operating income 73,499 64,892 527 468 13%
Operating income 1,014,669 925,855 7,269 6,672 10%
Total operating expenses (1,000,854) (794,600) (7,170) (5,726) 26%
Net Profit before taxes 13,815 131,255 99 945 -89%
Statistics
Numbers of staff 289 276 5%
Number of outlets 29 29 0%
Number of Loans outstanding 9556 7,367 30%
Number of Clients 79,842 74,015 8%
Kery ratios
Return on Equity 0.5% 6.0% -91%
Cost to Banking Income Ratio 84.0% 83.6% 1%
Loans to Deposits ratio 54.9% 58.0% -5%
Assets Growth Rate 19.9% 9.7% 105%
Customer Deposit Growth Rate 22.9% 16.0% 44%
Loans Growth Rate 17.0% 10.7% 59%
LLP to Loan portfolio 3.7% 3.0% 22%
Net Interest Margin 3.2% 3.2% -1%
Capital Adequacy ratio 12.59% 13.85% -9%
Asset to Employee Ratio 97,159 84,840 696 611 15%
Assets to Branch ratio 968,237 807,446 6,936 5,812 20%

UNION BANK 2012 25
The assets growth during the years has been strong and solid. The Bank closed 2012 at a total assets value of LEK 28.1 Bil-lion or 20% more than 2011. The assets structure is mainly composed by Loans to customers, reaching 47.0% of the Bank’s total assets, followed by Cash and due from banks and Investment securities with 19.7% and 30.4% respectively. Investments Securities are Albanian Government Treasury Bills and Bonds.
4,214,202 4,890,223 4,208,886 6,857,279
5,197,024 5,541,605
356,201 978,949 2,030,468
3,73
7,76
0
6,09
5,72
3
8,53
8,44
8
2,536,221
6,38
9,41
7
9,82
9,68
0 10
,351
,805
11,3
39,9
05
13,1
83,4
00
770,487
705,217
674,488
396,843
783,290
815,406
0
5,000,000
10,000,000
15,000,000
20,000,000
25,000,000
30,000,000
2007 2008 2009 2010 2011 2012
in Lek '000 Structure of Assets
Fixed and other assets Loans and advances to customers, net Investment securities
574,878 815,021 1,136,231 1,827,327 2,454,160 1,553,296 1,575,520 1,510,483 5,
862,
408
9,92
5,44
0
12,7
47,8
59
16,8
57,2
31
19,5
48,6
19
24,0
31,8
99
905,707
995,545
1,271,948
1,881,106
1,937,529
2,170,676
2,322,007
0
5,000,000
10,000,000
15,000,000
20,000,000
25,000,000
30,000,000
2006 2007 2008 2009 2010 2011 2012
in Lek '000
Structure of Liabilities and Equity
Shareholders’ equity Other liabilities Due to customers Due to banks and FI

26 UNION BANK 2012
The Bank has created a strong customer base to finance its investments and operations. Therefore, its liabilities structure is mainly composed by customer accounts, reaching 85.6% of the Bank’s total assets in 2012, followed by Due to Banks and other Financial Institutions with 5.6%. The Shareholders equity represents 8.3% of the total assets of the Bank.
Year 2012 was the fourth consecutive year of profit for Union Bank. However, the amount of Lek 11.5 Million is smaller than the figure of 2011. Net Interest Income increased by 13.6%, while Net Fees income decreased by -13%, mostly due to variable guar-anty fees. Total operating income has increased by 9.6% while the Operational Cost increased by 26% (LLP included) compared to the previous year.
(170,000)
30,000
230,000
430,000
630,000
830,000
1,030,000
1,230,000
2007 2008 2009 2010 2011 2012
in ALL '000
Pro�t and Loss structure
Operating income Total operating expenses
Net pro�t

UNION BANK 2012 27
8. Plans for 2013 The Bank’s platform for Y2013 is that it will grow and prosper by following the established mission and core strategy, and keep the overall sustainibility of its entire performance at the same time.
The Bank plans to continue to be ambitious despite the difficult economic environment and will seek opportunities to grow its business rather than simply survive the crisis in a defensive way. It will also continue to work to achieve a reasonable level of profitability and to maintain the quality of its assets.
Lending
Union Bank plans to continue the Loan Portfolio increase with much stronger growth on the retail side.
On the retail lending side, the basic plan is for the progress to be merely continued and finetuned, with some additional changes regarding products and credit scoring system. Building on the steady growth of retail lending in the recent years, as well as its superior risk profile to the more challenging business loans, retail lending is projected to provide most of the planned loan growth for 2013.
The business loans side will be the focus of a slightly different attention, with demands for securing the required credit growth combined with demands for better loan monitoring and stronger cross-sell efforts.
The Bank will continue to be prudent and closely monitor all the risk factors and exposures which it faces on day-today bases. It believes as well that it will keep the good quality of the loan portfolio.
Funding The Bank’s growth target for Deposits, that are the core source of the banking activities is at the level of 20%. Year 2012 was another example of the fact that the bank has a strong capacity to generate deposits with all time deposit elements growing, and even exceeding the plan. For next year there are no major changes of strategy for this segment, which consists with firstly sustaining the main product range, and then improving and tailoring a few product characteristics just be competitive and to keep the deposit products fresh. The bank will continue to focus on taking advantage of cross-sale opportunities through aggressive marketing and brand campaigns and the Retail Sales Department.
Main Marketing Projects for 2012
UB plans to undertake several projects during Y2013 that will not only boost its entire activity and improve the bank’s image, but will greatly help its clients to facilitate and quicken their daily financial transactions, and at the same time educate them on deeper understanding of contemporary banking products.
UB also understands and fully appreciates the role of its contribution to the Community as a responsible business that has a sustainable impact upon the regions in which it operates. It has launched a series of programs as components of the project “Part of Community”. To ensure that it makes community investments as effective as possible, the Bank is going to focus its resources on a small but substantial numbers of strategic programs which center on issues that are important to individuals, businesses and the bank itself. It has planned this by cooperating with local schools, small local stores and establishments, etc.
During Y2012, UB will continue to proudly sponsor the Albanian National Soccer Team.
New Core Banking Software During the year UB is going to finalize the Upgrade of the Core Banking Software, a project that is expected to enable the bank to improve and enhance the quality of the services, offer a wider range of products and improve processing and reporting capacities.
Branches Network The bank has planned the refurbishment of several branches. In addition, to reach the projected growth and widen its geographic network in the upcoming years, it has also has planned to open 2 new branches in Tirana.

28 UNION BANK 2012

9. Audited Financial StatementsUNION BANK SH.A.
Independent Auditor’s Report and Financial Statements for the year ended December 31, 2011
TABLE OF CONTENTS
• INDEPENDENT AUDITOR’S REPORT
• FINANCIAL STATEMENTS:
STATEMENT OF FINANCIAL POSITION
STATEMENT OF COMPREHENSIVE INCOME
STATEMENT OF CHANGES IN EQUITY
STATEMENT OF CASH FLOWS
NOTES TO THE FINANCIAL STATEMENTS

30 Audited Financial Statements

Audited Financial Statements 31
UNION BANK SH.A. Financial Statements
as at 31 December 2012 (with Independent Auditors’ Report thereon)

32 Audited Financial Statements
TABLE OF CONTENTS
Page
INDEPENDENT AUDITORS’ REPORT
FINANCIAL STATEMENTS:
STATEMENT OF FINANCIAL POSITION 1 STATEMENT OF COMPREHENSIVE INCOME 2 STATEMENT OF CHANGES IN EQUITY 3 STATEMENT OF CASH FLOWS 4 NOTES TO THE FINANCIAL STATEMENTS 5 – 44

Audited Financial Statements 33

34 Audited Financial Statements

Audited Financial Statements 35
Union Bank sh.aStatement of Comprehensive Income (Amounts in LEK’000)
2
NotesYear ended
31 December 2012Year ended
31 December 2011
Interest income 20 1,763,805 1,527,131Interest expense 21 (944,430) (805,876)Net interest income 819,375 721,255
Fee and commission income 22 156,879 168,651 Fee and commission expenses 23 (35,084) (28,943) Net fee and commission income 121,795 139,708
Net foreign exchange gain 24 72,156 68,831Other (expense) / income, net 1,343 (3,939)
73,499 64,892
Operating income 1,014,669 925,855
Allowances for losses on loans and advances 9 (148,447) (20,992)Amortization for intangible assets 10 (22,832) (20,115)Depreciation of property and equipment 11 (39,008) (41,756)Impairment of assets held for sale 12 (5,912) -Personnel costs 25 (325,077) (299,616)Other operating expenses 26 (459,578) (412,121)Total operating expenses (1,000,854) (794,600)
Profit before tax 13,815 131,255Income tax 27 (2,374) (8,520)Profit of the year 11,441 122,735
Other comprehensive income, net of income tax - -Total comprehensive income for the year 11,441 122,735
The statement of comprehensive income is to be read in conjunction with the notes to and forming part of the financial statements set out on pages 5 to 44.

36 Audited Financial Statements
Union Bank sh.aStatement of Changes in Equity (Amounts in LEK’000)
3
Sharecapital
Share premium
Accumulated loss Total
Balance at 1 January 2011 2,049,331 175,600 (287,402) 1,937,529Transactions with owners recorded directly in equityContributions by and distributions to ownersIncrease in share capital 110,412 - - 110,412Total contributions by and distributions to owners 110,412 - - 110,412
Total comprehensive income for the yearProfit for the year - - 122,735 122,735Other comprehensive income, net of income tax - - - -Total comprehensive income for the year - - 122,735 122,735Balance at 31 December 2011 2,159,743 175,600 (164,667) 2,170,676
Transactions with owners recorded directly in equityContributions by and distributions to ownersIncrease in share capital 139,890 - - 139,890Total contributions by and distributions to owners 139,890 - - 139,890
Total comprehensive income for the yearProfit for the year - - 11,441 11,441 Other comprehensive income, net of income tax - - - -Total comprehensive income for the year - - 11,441 11,441
Balance at 31 December 2012 2,299,633 175,600 (153,226) 2,322,007
The statement of changes in equity is to be read in conjunction with the notes to and forming part of the financial statements set out on pages 5 to 44

Audited Financial Statements 37
Union Bank sh.aStatement of Cash Flows (Amounts in LEK’000)
4
Notes
Year ended 31 December
2012
Year ended 31 December
2011
Cash flows from operating activitiesProfit before tax 13,815 131,255Adjustments for non-cash items:Interest income 20 (1,763,805) (1,527,131)Interest expense 21 944,430 805,876Depreciation of property and equipment 11 39,008 41,756Amortization of intangible assets 10 22,832 20,115Impairment loss 9 148,447 20,992Impairment of assets held for sale 5,912 -Revaluation effect of cash and cash equivalents (3,844) (26,212)Revaluation effect of subordinated debt 5 1Written of property and equipment 534 3,380Net loss from sale of property and equipment - 1,725
(592,666) (528,243)Increase in placements and balances with banks (35,606) (75,242)Increase in loans and advances to customers (2,025,853) (1,350,430)Decrease/(Increase) in other assets 37,874 (189,198)Increase/ (Decrease) in due to banks and financial institutions 20,454 (1,137,911)Increase in due to customers 4,419,428 2,671,536Increase in Treasury bills sold under repurchased agreements 10,176 251,050Increase in other liabilities 6,077 52,144
Interest received 1,703,736 1,587,072Interest paid (888,984) (800,027)Net Cash generated from operating activities 2,654,636 480,751Cash flows from investing activitiesPurchases of intangible assets 10 (63,229) (28,800)Purchases of property and equipment 11 (24,842) (25,864)Proceeds from disposals of property plant and equipment - 2,104Proceeds from sale of non-current assets held for sale - 17,965Purchases of treasury bills (134,579) 223,297Purchases of government bonds (2,108,409) (2,100,898)Net Cash used in investing activities (2,331,059) (1,912,196)Cash flows from financing activitiesSubordinated debt - -Proceeds from capital injection 139,890 110,412Net Cash generated from financing activities 139,890 110,412Cash and cash equivalents at the beginning of the year 4,125,888 5,420,709Net cash provided by operating activities 2,654,636 480,751Net cash used in investing activities (2,331,059) (1,912,196)Net Cash generated from financing activities 139,890 110,412Revaluation effect of cash and cash equivalents 3,844 26,212Cash and cash equivalents at the end of the year 28 4,593,199 4,125,888
The statement of cash flows is to be read in conjunction with the notes to and forming part of the financial statements set out on pages 5 to 44.

38 Audited Financial Statements
Union Bank Sh.aNotes to the Financial Statements for the year ended 31 December 2012 (Amounts in LEK ‘000 unless otherwise stated)
5
1. INTRODUCTIONUnion Bank Sh.a. (the “Bank”) is a financial institution registered as a commercial bank on 9 January 2006 based on Decision no. 101, dated 28 December 2005, of the Supervisory Board of the Bank of Albania (“BoA”). The bank’s activity is subject to Law no. 8269 “On the Bank of Albania” dated 23 December 1997, Law No. 9662 “On Banks in the Republic of Albania” dated 18 December 2006 and all rules and regulations approved by the Supervisory Board of the BoA. The Bank is a commercial bank, which provides banking services to individuals and enterprises in the Republic of Albania. The Bank is registered as a joint stock company, with the registration number 33563, dated 26 May 2005, on which date the Bank started its commercial activities. The Bank obtained its license for banking activities on 9 January 2006. The Headquarters of the Bank are located in Tirana, Albania. As at 31 December 2012 the Bank had 289 employees (2011: 276).Directors and Management as at 31 December 2012 Board of Directors (Supervisory Board) Edmond Leka ChairmanNiko Leka Vice-ChairmanVaruzhan Piranian MemberAgim Xhaja MemberPaul Nabavi MemberGazmend Kadriu MemberGenc Turku Member
Audit CommitteeVaruzhan Piranian Head of Audit CommitteeMirela Lika MemberErton Kaleshi Member
Executive Management Gazmend Kadriu Chief Executive OfficerSuela Bokshi Chief Operations OfficerArdian Petollari Chief Business OfficerArten Zikaj Chief Financial OfficerEnkeleda Hasho Chief Credit Officer2. BASIS OF PREPARATION2.1 Statement of compliance The financial statements have been prepared in accordance with International Financial Reporting Standards (IFRSs) as issued by the International Accounting Standards Board (IASB). 2.2 Basis of preparation The financial statements have been prepared on the historical cost basis.2.3 Functional and presentation currencyThese financial statements are presented in Albanian Lek (“LEK”), which is the Bank’s functional currency. All financial information presented in LEK has been rounded to the nearest thousand, except when otherwise indicated. 2.4 Use of estimates and judgments The preparation of financial statements in conformity with IFRSs requires management to make judgments, estimates and assumptions that affect the application of accounting policies and the reported amounts of assets, liabilities, income and expenses. Actual results may differ from these estimates.

Audited Financial Statements 39
Union Bank Sh.aNotes to the Financial Statements for the year ended 31 December 2012 (Amounts in LEK ‘000 unless otherwise stated)
6
2. BASIS OF PREPARATION (CONTINUED)2.4 Use of estimates and judgements (continued)Estimates and underlying assumptions are reviewed on an ongoing basis. Revisions to accounting estimates are recognized in the period in which the estimate is revised and in any future periods affected. Management believes that the underlying assumptions are appropriate and that the financial statements therefore present the financial position and results fairly.In particular, information about significant areas of estimation uncertainty and critical judgments in applying accounting policies that have the most significant effect on the amount recognized in the financial statements are described in note 4. 3. SIGNIFICANT ACCOUNTING POLICIESThe accounting policies set out below have been applied consistently to all periods presented in these financial statements. 3.1 Foreign currency transactions Transactions in foreign currencies are translated into the respective functional currency entities at the spot exchange rates at the date of the transactions. Monetary assets and denominated in foreign currencies at the reporting date are retranslated to the functional at the spot exchange rate at that date. The foreign currency gain or loss on monetary items is the difference between amortised cost in the functional currency at the beginning of the year, adjusted for effective interest and payments during the year, and the amortised cost in foreign currency translated at the spot exchange rate at the end of the year. Non-monetary assets and liabilities that are measured at fair value in a foreign currency translated to the functional currency at the spot exchange rate at the date that the fair value determined. Non-monetary items that are measured based on historical cost in a foreign currency are translated using the spot exchange rate at the date of the transaction. Foreign currency differences arising on retranslation are generally recognised in profit or loss. Net foreign exchange gains or losses include all foreign exchange differences related to spot transactions with settlement dates two business days after the trade date, although such transactions are recognised on the settlement date.3.2 Interest Interest income and expense are recognised in profit or loss using the effective interest method. The effective interest rate is the rate that exactly discounts the estimated future cash payments and receipts through the expected life of the financial asset or liability (or, where appropriate, a shorter period) to the carrying amount of the financial asset or liability. When calculating the effective interest rate, the Bankestimates future cash flows considering all contractual terms of the financial instrument, but not future credit losses. The calculation of the effective interest rate includes all transaction costs and fees and points paid or received that are an integral part of the effective interest rate. Transaction costs include incremental costs that are directly attributable to the acquisition or issue of a financial asset or liability. Interest income and expense presented in the statement of comprehensive income include interest on financial assets and financial liabilities measured at amortised cost calculated on an effective interest basis.3.3 Fees and commission Fees and commission income and expense that are integral to the effective interest rate on a financial asset or liability are included in the measurement of the effective interest rate. Other fees and commission income, including account servicing fees, investment management fees, sales commission and placement fees are recognised as the related services are performed. When a loan commitment is not expected to result in the draw-down of a loan, the related loan commitment fees are recognised on a straight-line basis over the commitment period.Other fees and commission expense relate mainly to transaction and service fees, which are expensed as the services are received.

40 Audited Financial Statements
Union Bank Sh.aNotes to the Financial Statements for the year ended 31 December 2012 (Amounts in LEK ‘000 unless otherwise stated)
7
3. SIGNIFICANT ACCOUNTING POLICIES (CONTINUED)3.4 Lease payments Payments made under operating leases are recognised in profit or loss on a straight-line basis over the term of the lease. Lease incentives received are recognised as an integral part of the total lease expense, over the term of the lease.3.5 Tax expense Tax expense comprises current and deferred tax. Current tax and deferred tax are recognised in profit or loss except to the extent that they relate to items recognised directly in equity or in other comprehensive income. 3.5.1 Current tax Current tax is the expected tax payable or receivable on the taxable income or loss for the year, using tax rates enacted or substantively enacted at the reporting date, and any adjustment to tax payable in respect of previous years. 3.5.2 Deferred tax Deferred tax is recognised in respect of temporary differences between the carrying amounts of assets and liabilities for financial reporting purposes and the amounts used for taxation purposes. Deferred tax is not recognised for temporary differences on the initial recognition of assets or liabilities in a transaction that is not a business combination and that affects neither accounting nor taxable profit or loss.The measurement of deferred tax reflects the tax consequences that would follow the manner in which the Bank expects, at the end of the reporting period, to recover or settle the carrying amount of its assets and liabilities. Deferred tax is measured at the tax rates that are expected to be applied to temporary differences when they reverse, using tax rates enacted or substantively enacted at the reporting date.Deferred tax assets and liabilities are offset if there is a legally enforceable right to offset current tax liabilities and assets, and they relate to taxes levied by the same tax authority. Additional taxes that arise from the distribution of dividends by the Bank are recognised at the same time as the liability to pay the related dividend is recognised. A deferred tax asset is recognised for unused tax losses, tax credits and deductible temporary differences to the extent that it is probable that future taxable profits will be available against which it can be utilised. Deferred tax assets are reviewed at each reporting date and are reduced to the extent that it is no longer probable that the related tax benefit will be realised. 3.5.3 Tax exposures In determining the amount of current and deferred tax, the Bank takes into account the impact of uncertain tax positions and whether additional taxes and interest may be due. This assessment relies on estimates and assumptions and may involve a series of judgements about future events. New information may become available that causes the Bank to change its judgement regarding the adequacy of existing tax liabilities; such changes to tax liabilities will impact tax expense in the period that such a determination is made.
3.6 Financial assets and financial liabilities 3.6.1 Recognition The Bank initially recognises loans and advances, deposits, and subordinated liabilities on the date that they are originated. Regular way purchases and sales of financial assets are recognised on the trade date at which the Bank commits to purchase or sell the asset. All other financial assets and liabilities are recognised initially on the trade date, which is the date that the Bank becomes a party to the contractual provisions of the instrument. A financial asset or financial liability is measured initially at fair value plus transaction costs that are directly attributable to its acquisition or issue.

Audited Financial Statements 41
Union Bank Sh.aNotes to the Financial Statements for the year ended 31 December 2012 (Amounts in LEK ‘000 unless otherwise stated)
8
3. SIGNIFICANT ACCOUNTING POLICIES (CONTINUED)
3.6 Financial assets and financial liabilities (continued)3.6.2 Classification Financial assets The Bank classifies its financial assets in one of the following categories:
• loans and receivables • held to maturity.
See Notes 3.7, 3.8 and 3.9. Financial liabilities The Bank classifies its financial liabilities as measured at amortised cost. See Note 3.14. 3.6.3 Derecognition Financial assets The Bank derecognises a financial asset when the contractual rights to the cash flows from the financial asset expire, or it transfers the rights to receive the contractual cash flows in a transaction in which substantially all the risks and rewards of ownership of the financial asset are transferred or in which the Bank neither transfers nor retains substantially all the risks and rewards of ownership and it does not retain control of the financial asset. Any interest in such transferred financial assets that qualify for derecognition that is created or retained by the Bank is recognised as a separate asset or liability. On derecognition of a financial asset, the difference between the carrying amount of the asset (or the carrying amount allocated to the portion of the asset transferred), and the sum of (i) the consideration received (including any new asset obtained less any new liability assumed) and (ii) any cumulative gain or loss that had been recognised in other comprehensive income is recognised in profit or loss. The Bank enters into transactions whereby it transfers assets recognised on its statement of financial position, but retains either all or substantially all of the risks and rewards of the transferred assets or a portion of them. If all or substantially all risks and rewards are retained, then the transferred assets are not derecognised. Transfers of assets with retention of all or substantially all risks and rewards include, for example, repurchase transactions.In transactions in which the Bank neither retains nor transfers substantially all the risks and rewards of ownership of a financial asset and it retains control over the asset, the Bank continues to recognise the asset to the extent of its continuing involvement, determined by the extent to which it is exposed to changes in the value of the transferred asset. Financial liabilities The Bank derecognises a financial liability when its contractual obligations are discharged, cancelled or expire. 3.6.4 Offsetting Financial assets and liabilities are offset and the net amount presented in the statement of financial position when, and only when, the Bank has a legal right to set off the amounts and it intends either to settle them on a net basis or to realise the asset and settle the liability simultaneously. Income and expenses are presented on a net basis only when permitted under IFRS, or for gains and losses arising from a group of similar transactions such as in the Bank’s trading activity. 3.6.5 Amortised cost measurement The amortised cost of a financial asset or liability is the amount at which the financial asset or liability is measured at initial recognition, minus principal repayments, plus or minus the cumulative amortisation using the effective interest method of any difference between the initial amount recognised and the maturity amount, minus any reduction for impairment.

42 Audited Financial Statements
Union Bank Sh.aNotes to the Financial Statements for the year ended 31 December 2012 (Amounts in LEK ‘000 unless otherwise stated)
9
3. SIGNIFICANT ACCOUNTING POLICIES (CONTINUED)3.6 Financial assets and financial liabilities (continued)3.6.6 Fair value measurement Fair value is the amount for which an asset could be exchanged, or a liability settled, between knowledgeable, willing parties in an arm’s length transaction on the measurement date. When available, the Bank measures the fair value of an instrument using quoted prices in an active market for that instrument. A market is regarded as active if quoted prices are readily and regularly available and represent actual and regularly occurring market transactions on an arm’s length basis. If a market for a financial instrument is not active, the Bank establishes fair value using a valuation technique. Valuation techniques include using recent arm’s length transactions between knowledgeable, willing parties (if available), reference to the current fair value of other instruments that are substantially the same, discounted cash flow analyses and option pricing models. The chosen valuation technique makes maximum use of market inputs, relies as little as possible on estimates specific to the Bank, incorporates all factors that market participants would consider in setting a price, and is consistent with accepted economic methodologies for pricing financial instruments. Inputs to valuation techniques reasonably represent market expectations and measures of the risk-return factors inherent in the financial instrument. The Bank calibrates valuation techniques and tests them for validity using prices from observable current market transactions in the same instrument or based on other available observable market data. Assets and long positions are measured at a bid price; liabilities and short positions are measured at an asking price. Where the Bank has positions with offsetting risks, mid-market prices are used to measure the offsetting risk positions and a bid or asking price adjustment is applied only to the net open position as appropriate. Fair values reflect the credit risk of the instrument and include adjustments to take account of the credit risk of the Bank and the counterparty where appropriate. Fair value estimates obtained from models are adjusted for any other factors, such as liquidity risk or model uncertainties, to the extent that the Bank believes a third-party market participant would take them into account in pricing a transaction. The best evidence of the fair value of a financial instrument at initial recognition is the transaction price – i.e. the fair value of the consideration given or received. However, in some cases, the fair value of a financial instrument on initial recognition may be different to its transaction price. If such fair value is evidenced by comparison with other observable current market transactions in the same instrument (without modification or repackaging) or based on a valuation technique whose variables include only data from observable markets, then the difference is recognised in profit or loss on initial recognition of the instrument. In other cases the difference is not recognised in profit or loss immediately but is recognised over the life of the instrument on an appropriate basis or when the instrument is redeemed, transferred or sold, or the fair value becomes observable.3.6.7 Identification and measurement of impairment At each reporting date the Bank assesses whether there is objective evidence that financial assets not carried at fair value through profit or loss are impaired. A financial asset or a group of financial assets is impaired when objective evidence demonstrates that a loss event has occurred after the initial recognition of the asset(s), and that the loss event has an impact on the future cash flows of the asset(s) that can be estimated reliably.Objective evidence that financial assets are impaired can include significant financial difficulty of the borrower or issuer, default or delinquency by a borrower, restructuring of a loan by the Bank on terms that the Bank would not otherwise consider, indications that a borrower or issuer will enter bankruptcy, the disappearance of an active market for a security, or other observable data relating to a group of assets such as adverse changes in the payment status of borrowers or issuers in the group, or economic conditions that correlate with defaults in the group.

Audited Financial Statements 43
Union Bank Sh.aNotes to the Financial Statements for the year ended 31 December 2012 (Amounts in LEK ‘000 unless otherwise stated)
10
3. SIGNIFICANT ACCOUNTING POLICIES (CONTINUED)3.6 Financial assets and financial liabilities (continued)3.6.7 Identification and measurement of impairment (continued)The Bank considers evidence of impairment for loans and advances and held-to-maturity investment securities at both a specific asset and collective level. All individually significant loans and advances and held-to-maturity investment securities are assessed for specific impairment. Those found not to be specifically impaired are then collectively assessed for any impairment that has been incurred but not yet identified. Loans and advances and held-to-maturity investment securities that are not individually significant are collectively assessed for impairment by grouping together loans and advances and held-to-maturity investment securities with similar risk characteristics. For the purpose of a collective evaluation of impairment, financial assets are grouped on the basis of similar credit risk characteristics (type and amount of the loan). Based on historical data for each of these groups a loss factor is calculated. These expected loss factors are adjusted for management’s judgment as to whether current economic and credit conditions are such that the actual losses are likely to be greater or less than suggested by historical trends, and then they are applied to estimate impairment loss on each group. Default rates, loss rates and the expected timing of future recoveries are regularly benchmarked against actual outcomes to ensure that they remain appropriate. Impairment losses on assets measured at amortised cost are calculated as the difference between the carrying amount and the present value of estimated future cash flows discounted at the asset’s original effective interest rate.If the terms of a financial asset are renegotiated or modified or an existing financial asset is replaced with a new one due to financial difficulties of the borrower then an assessment is made whether the financial asset should be derecognised. If the cash flows of the renegotiated asset are substantially different, then the contractual rights to cash flows from the original financial asset are deemed to have expired. In this case the original financial asset is derecognised and the new financial asset is recognised at fair value. The impairment loss is measured as follows:
• If the expected restructuring does not result in derecognition of the existing asset, the estimated cash flows arising from the modified financial asset are included in the measurement of the existing asset based on their expected timing and amounts discounted at the original effective interest rate of the existing financial asset.
• If the expected restructuring results in derecognition of the existing asset, then the expected fair value of the new asset is treated as the final cash flow from the existing financial asset at the time of its derecognition. This amount is discounted from the expected date of derecognition to the reporting date using the original effective interest rate of the existing financial asset. Impairment losses are recognised in profit or loss and reflected in an allowance account against loans and advances or held-to-maturity investment securities. Interest on the impaired assets continues to be recognised through the unwinding of the discount. When an event occurring after the impairment was recognised causes the amount of impairment loss to decrease, the decrease in impairment loss is reversed through profit or loss.The Bank writes off certain loans and advances and investment securities when they are determined to be uncollectible (see Note 31). Such loans are written off after all the necessary procedures have been completed and the amount of the loss has been determined. 3.7 Cash and cash equivalents Cash and cash equivalents include notes and coins on hand, unrestricted balances held with Central bank and highly liquid financial assets with original maturities of three months or less from the acquisition date that are subject to an insignificant risk of changes in their fair value, and are used by the Bank in the management of its short-term commitments. Cash and cash equivalents are carried at amortised cost in the statement of financial position.

44 Audited Financial Statements
Union Bank Sh.aNotes to the Financial Statements for the year ended 31 December 2012 (Amounts in LEK ‘000 unless otherwise stated)
11
3. SIGNIFICANT ACCOUNTING POLICIES (CONTINUED)3.8 Loans and advances Loans and advances are non-derivative financial assets with fixed or determinable payments that are not quoted in an active market and that the Bank does not intend to sell immediately or in the near term. Loans and advances to banks and to customers are classified as loans and receivables. Loans and advances are initially measured at fair value plus incremental direct transaction costs, and subsequently measured at their amortised cost using the effective interest method. When the Bank purchases a financial asset and simultaneously enters into an agreement to resell the asset (or a substantially similar asset) at a fixed price on a future date (reverse repo), the arrangement is accounted foras a loan or advance, and the underlying asset is not recognised in the Bank’s financial statements. 3.9 Investment securities held-to-maturityInvestment securities are initially measured at fair value plus incremental direct transaction costs, and subsequently accounted for depending on their classification as held to maturity.Held-to-maturity investments are non-derivative assets with fixed or determinable payments and fixed maturity that the Bank has the positive intent and ability to hold to maturity, and which are not designated as at fair value through profit or loss or as available for sale. Held-to-maturity investments are carried at amortised cost using the effective interest method, less any impairment losses (see Note 3.6.7). A sale or reclassification of a more than insignificant amount of held-to-maturity investments would result in the reclassification of all held-to-maturity investments as available for sale, and would prevent the Bank from classifying investment securities as held to maturity for the current and the following two financial years. However, sales and reclassifications in any of the following circumstances would not trigger a reclassification: • sales or reclassifications that are so close to maturity that changes in the market rate of interest would not have a significant effect on the financial asset’s fair value; • sales or reclassifications after the Bank has collected substantially all of the asset’s original principal; and • sales or reclassifications attributable to non-recurring isolated events beyond the Bank’s control that could not have been reasonably anticipated.
3.10 Property and equipment 3.10.1 Recognition and measurement Items of property and equipment are measured at cost less accumulated depreciation and any accumulated impairment losses. Cost includes expenditure that is directly attributable to the acquisition of the asset. The cost of self-constructed assets includes the cost of materials and direct labour, any other costs directly attributable to bringing the assets to a working condition for their intended use, and when the Bank has an obligation to remove the asset or restore the site, an estimate of the costs of dismantling and removing the items and restoring the site on which they are located. Purchased software that is integral to the functionality of the related equipment is capitalised as part of that equipment. When parts of an item of property or equipment have different useful lives, they are accounted for as separate items (major components) of property and equipment. Any gain or loss on disposal of an item of property and equipment (calculated as the difference between the net proceeds from disposal and the carrying amount of the item) is recognised within other income in profit or loss.3.10.2 Subsequent costs Subsequent expenditure is capitalised only when it is probable that the future economic benefits of the expenditure will flow to the Bank. Ongoing repairs and maintenance are expensed as incurred.

Audited Financial Statements 45
Union Bank Sh.aNotes to the Financial Statements for the year ended 31 December 2012 (Amounts in LEK ‘000 unless otherwise stated)
12
3. SIGNIFICANT ACCOUNTING POLICIES (CONTINUED)3.10 Property and equipment (continued)3.10.3 Depreciation Items of property and equipment are depreciated from the date they are available for use or, in respect of self-constructed assets, from the date that the assets are completed and ready for use. Depreciation is calculated to write off the cost of items of property and equipment less their estimated residual values over their estimated useful lives. Depreciation is recognised in profit or loss. Depreciation is calculated using the reducing balance method at the following annual rates:
Rate per annumComputers 25%Office furniture 20%Electronic equipment 20%Fixtures and fittings 20%Leasehold improvements are depreciated using the straight-line basis over the shorter of the lease term and their useful lives. The estimated useful lives of the leasehold improvements range from 3 to 15 years. Workin progress is not depreciated. Depreciation methods, useful lives and residual values are reviewed at each reporting date and adjusted if appropriate.
3.11 Intangible assets Software acquired by the Bank is measured at cost less accumulated amortisation and any accumulated impairment losses. Subsequent expenditure on software assets is capitalised only when it increases the future economic benefits embodied in the specific asset to which it relates. All other expenditure is expensed as incurred. Amortisation is recognised in profit or loss over the estimated useful life of the asset, from the date that it is available for use. Work in progress is not amortised.Software is amortised using the reducing balance method with an annual amortization rate of 25%, while other intangible assets, including licenses and fees paid for access to electronic systems and services used by the Bank, are amortized using the straight line method with an annual rate of 15%. Amortisation methods, useful lives and residual values are reviewed at each reporting date and adjusted if appropriate.
3.12 Non-current assets held for sale Non-current assets are classified as held for sale as their carrying amount will be recovered principally through a sale transaction rather than through continuing use. This condition is regarded as met only when the sale is highly probable and the non-current asset is available for immediate sale in its present condition. Management must be committed to the sale, which should be expected to qualify for recognition as a completed sale within one year from the date of classification. If an extension of the sale period occurs it does not preclude an asset from being classified as held for sale if the delay is caused by events or circumstances beyond the Bank’s control and there is sufficient evidence that the Bank remains committed to its plan to sell the asset.Non-current assets classified as held for sale are measured at the lower of their carrying amount and fair value less costs to sell.

46 Audited Financial Statements
Union Bank Sh.aNotes to the Financial Statements for the year ended 31 December 2012 (Amounts in LEK ‘000 unless otherwise stated)
13
3. SIGNIFICANT ACCOUNTING POLICIES (CONTINUED)
3.13 Impairment of non-financial assets The carrying amounts of the Bank’s non-financial assets, other than deferred tax assets, are reviewed at each reporting date to determine whether there is any indication of impairment. If any such indication exists, then the asset’s recoverable amount is estimated. An impairment loss is recognised if the carrying amount of an asset exceeds its recoverable amount. The recoverable amount of an asset is the greater of its value in use and its fair value less costs to sell. In assessing value in use, the estimated future cash flows are discounted to their present value using a pre-tax discount rate that reflects current market assessments of the time value of money and the risks specific to the asset. Impairment losses are recognised in profit or loss. An impairment loss is reversed only to the extent that the asset’s carrying amount does not exceed the carrying amount that would have been determined, net of depreciation or amortisation, if no impairment loss had been recognised.
3.14 Deposits, repurchase agreements, and subordinated liabilities Deposits, repurchase agreements and subordinated liabilities are the Bank’s sources of debt funding. When the Bank sells a financial asset and simultaneously enters into an agreement to repurchase the asset (or a similar asset) at a fixed price on a future date (repo), the arrangement is accounted for as a financial liability, and the underlying asset continues to be recognised in the Bank’s financial statements.
3.15 Provisions A provision is recognised if, as a result of a past event, the Bank has a present legal or constructive obligation that can be estimated reliably, and it is probable that an outflow of economic benefits will be required to settle the obligation. Provisions are determined by discounting the expected future cash flows at a pre-tax rate that reflects current market assessments of the time value of money and, where appropriate, the risks specific to the liability. The unwinding of the discount is recognised as finance cost.
3.16 Employee benefits
Defined contribution plans Obligations for contributions to defined contribution pension plans are recognised as an expense in profit or loss when they are due. The Bank makes compulsory social security contributions that provide pension benefits for employees upon retirement. The local authorities are responsible for providing the legally set minimum threshold for pensions in Albania under a defined contribution pension plan. Short-term benefitsShort-term employee benefit obligations are measured on an undiscounted basis and are expensed as the related service is provided. A provision is recognised for the amount expected to be paid under short-term cash bonus or profit-sharing plans if the Bank has a present legal or constructive obligation to pay this amount as a result of past service provided by the employee and the obligation can be estimated reliably.
3.17 New standards and interpretations not yet adopted A number of new standards, amendments to standards and interpretations are effective for annual periods beginning after 1 January 2012, and have not been applied in preparing these financial statements. Those which may be relevant to the Bank are set out below. The Bank does not plan to adopt these standards early.
• IFRS 9 Financial Instruments (Effective for annual periods beginning on or after 1 January 2015; to be applied prospectively. Earlier application is permitted.) This Standard replaces the guidance in IAS 39,Financial Instruments: Recognition and Measurement, about classification and measurement of financial assets. The Standard eliminates the existing IAS 39 categories of held to maturity, available for sale and loans and receivable.
Financial assets will be classified into one of two categories on initial recognition: − financial assets measured at amortized cost; or − financial assets measured at fair value.

Audited Financial Statements 47
Union Bank Sh.aNotes to the Financial Statements for the year ended 31 December 2012 (Amounts in LEK ‘000 unless otherwise stated)
14
3. SIGNIFICANT ACCOUNTING POLICIES (CONTINUED)3.17 New standards and interpretations not yet adopted (continued)
A financial asset is measured at amortized cost if the following two conditions are met:− the asset is held within a business model whose objective is to hold assets in order to collect
contractual cash flows; and, − its contractual terms give rise on specified dates to cash flows that are solely payments of principal
and interest on the principal outstanding. Gains and losses on remeasurement of financial assets measured at fair value are recognised in profit or loss, except that for an investment in an equity instrument which is not held for trading, IFRS 9 provides, on initial recognition, an irrevocable election to present all fair value changes from the investment in other comprehensive income (OCI). The election is available on an individual share-by-share basis. No amount recognised in OCI is ever reclassified to profit or loss at a later date.It is expected that the new Standard, when initially applied, will have a significant impact on the financial statements, since the classification and the measurement of the Bank’s financial assets are expected to change. The Bank will prepare an analysis of the impact this will have on the financial statements, and is planning to complete this analysis before the date of initial application. The Bank has not yet decided on the date that it will initially apply the new Standard.
• IFRS 13 Fair Value Measurement (Effective for annual periods beginning on or after 1 January 2013; to be applied prospectively. Earlier application is permitted). IFRS 13 provides a single source of guidance on how fair value is measured, and replaces the fair value measurement guidance that is currently dispersed throughout IFRS. Subject to limited exceptions, IFRS 13 is applied when fair value measurements or disclosures are required or permitted by other IFRSs. The Bank is currently reviewing its methodologies for determining fair values. Although many of the IFRS 13 disclosure requirements regarding financial assets and financial liabilities are already required, the adoption of IFRS 13 will require the Bank to provide additional disclosures. These include fair value hierarchy disclosures for non-financial assets/liabilities and disclosures on fair value measurements that are categorised in Level 3.
4. USE OF ESTIMATES AND JUDGEMENTSThe preparation of the financial statements in conformity with IFRS requires management to make judgements, estimates and assumptions that affect the application of accounting policies and the reported amounts of assets, liabilities, income and expenses. Actual results may differ from these estimates. Estimates and underlying assumptions are reviewed on an ongoing basis. Revisions to accounting estimates are recognised in the period in which the estimates are revised and in any future periods affected. Management discusses with the Audit Committee the development, selection and disclosure of the Bank’s critical accounting policies and their application, and assumptions made relating to major estimation uncertainties. Information about assumptions and estimation uncertainties that have a significant risk of resulting in a material adjustment within the next financial year and about critical judgements in applying accounting policies that have the most significant effect on the amounts recognised in the financial statements is disclosed below. These disclosures supplement the commentary on financial risk management (see Note 31).
4.1 Impairment Assets accounted for at amortised cost are evaluated for impairment on a basis described in Note 3.6.7. The specific component of the total allowances for impairment applies to financial assets evaluated individually for impairment and is based upon management’s best estimate of the present value of the cash flows that are expected to be received. In estimating these cash flows, management makes judgements about a debtor’s financial situation and the net realisable value of any underlying collateral. Each impaired asset is assessed on its merits, and the workout strategy and estimate of cash flows considered recoverable are independently approved by the Credit Risk function.

48 Audited Financial Statements
Union Bank Sh.aNotes to the Financial Statements for the year ended 31 December 2012 (Amounts in LEK ‘000 unless otherwise stated)
15
4. USE OF ESTIMATES AND JUDGEMENTS (CONTINUED)4.1 Impairment (continued)A collective component of the total allowance is established for groups of homogeneous loans that are not individually impaired. Collective allowance for groups of assets that are not considered individually significant and those that are individually significant but that were not found to be individually impaired cover credit losses inherent in portfolios of loans and advances, and held-to-maturity investment securities with similar credit risk characteristics when there is objective evidence to suggest that they contain impaired loans and advances, and held-to-maturity investment securities, but the individual impaired items cannot yet be identified. In assessing the need for collective loss allowances, management considers factors such as credit quality, portfolio size, concentrations and economic factors. In order to estimate the required allowance, assumptions are made to define the way inherent losses are modelled and to determine the required input parameters, based on historical experience and current economic conditions. The accuracy of the allowances depends on the estimates of future cash flows for specific counterparty allowances and the model assumptions and parameters used in determining collective allowances.An assessment as to whether an investment in sovereign debt is impaired may be complex. In making such an assessment, the Bank considers the market’s assessment of creditworthiness as reflected in the bond yields, the rating agencies’ assessments of the creditworthiness, the ability of the country to access the capital markets for new debt issuance, the probability of debt being restructured resulting in holders suffering losses through voluntary or mandatory debt forgiveness and the international support mechanisms in place to provide the necessary support as ‘lender of last resort’ to that country as well as the intention, reflected in public statements, about governments’ and agencies’ willingness to use those mechanisms. This includes an assessment as to the depth of those mechanisms and, irrespective of the political intent, whether there is the capacity to fulfil the required criteria.
4.2 Fair valueThe determination of fair value for financial assets and financial liabilities for which there is no observable market price requires the use of valuation techniques as described in Note 3.6.6. For financial instruments that trade infrequently and have little price transparency, fair value is less objective, and requires varying degrees of judgement depending on liquidity, concentration, uncertainty of market factors, pricing assumptions and other risks affecting the specific instrument.
The Bank measures fair values using the following hierarchy of methods:
• Level 1: Quoted market price in an active market for an identical instrument.
• Level 2: Valuation techniques based on observable inputs. This category includes instruments valued using: quoted market prices in active markets for similar instruments; quoted prices for similar instruments in markets that are considered less than active; or other valuation techniques where all significant inputs are directly or indirectly observable from market data.
• Level 3: Valuation techniques using significant unobservable inputs. This category includes all instruments where the valuation technique includes inputs not based on observable data and the unobservable inputs could have a significant effect on the instrument’s valuation. This category includes instruments that are valued based on quoted prices for similar instruments where significant unobservable adjustments or assumptions are required to reflect differences between the instruments.The estimation of the fair value of treasury bills and bonds held-to-maturity is disclosed in note 32.
Audited Financial Statements 49
Union Bank Sh.aNotes to the Financial Statements for the year ended 31 December 2012 (Amounts in LEK ‘000 unless otherwise stated)
16
5. CASH AND BALANCES WITH CENTRAL BANK
Cash and balances with the Central Bank are detailed as following:31 December 2012 31 December 2011
Cash on hand 799,151 595,410Central Bank:Current account 79,968 21,882Compulsory reserves 2,029,125 1,901,681Accrued interest 670 687Total 2,908,914 2,519,660In accordance with the Bank of Albania’s requirement relating to the deposit reserve, the Bank should maintain a minimum of 10% of customer deposits in Albania with the Bank of Albania as a compulsory reserve account. This reserve is not available for use in the Bank’s day to day operations, however according to the applicable regulations the Bank can make use of up to 40% of the compulsory reserve, provided that the monthly average balance of accounts with the Central Bank (current account plus compulsory reserve)does not fall below the compulsory reserve level.
6. PLACEMENTS AND BALANCES WITH BANKS
Placements and balances with banks are detailed as follows:31 December 2012 31 December 2011
Current accounts:Resident - -Non-resident 1,417,251 581,830
1,417,251 581,830Deposits:Resident 457,140 275,740Non-resident 698,610 1,667,160
1,155,750 1,942,900Other accounts 59,673 151,511Accrued interest 17 1,123Total 2,632,691 2,677,364
Deposits with resident and non-resident banks mature in the range of 2 to 7 days (2011: 4 days to 3 months) and bear interest in the range of 0.15%p.a. to 0.4%p.a. (2011: 0.15%p.a. to 4.75%p.a.).
7. TREASURY BILLS HELD-TO-MATURITY
Treasury Bills held-to-maturity (“T-Bills”) at 31 December 2012 are issued by the Albanian Government.
T-Bills by original maturity are presented as follows:31 December 2012 31 December 2011
Nominal value
Remainingdiscount
BookValue
Nominal value
Remainingdiscount
BookValue
3 months 100,000 (1,141) 98,859 - - -6 months 93,255 (2,211) 91,044 - - -12 months 2,261,391 (60,356) 2,201,035 2,158,433 (59,287) 2,099,146Total 2,454,646 (63,708) 2,390,938 2,158,433 (59,287) 2,099,146

50 Audited Financial Statements
Union Bank Sh.aNotes to the Financial Statements for the year ended 31 December 2012 (Amounts in LEK ‘000 unless otherwise stated)
17
8. TREASURY BONDS HELD-TO-MATURITY
Treasury Bonds held-to-maturity (“Bonds”) are issued by the Albanian Government. The interests are paid semi-annually.
Treasury Bonds by original maturity are presented as follows:31 December 2012
Nominal value Remaining discount Accrued interest Book Value24 months 4,560,000 - 89,027 4,649,027 36 months 800,000 - 22,700 822,700 60 months 668,770 (1,199) 8,212 675,783 Total 6,028,770 (1,199) 119,939 6,147,510
31 December 2011
Nominal value Remaining discount Accrued interest Book Value24 months 3,383,571 - 70,289 3,453,860 36 months 120,000 - 2,573 122,57360 months 416,790 (1,613) 4,967 420,144 Total 3,920,361 (1,613) 77,829 3,996,577
9. LOANS AND ADVANCES TO CUSTOMERS31 December 2012 31 December 2011
Loans 9,247,579 7,354,523Overdrafts 4,308,229 4,241,626Other advances to customers 64,655 46,020
13,620,463 11,642,169Accrued interest 111,344 92,676Allowances for losses on loans and advances (499,271) (349,812)Deferred income (49,136) (45,128)Total 13,183,400 11,339,905
Loans and advances to customers earn interest as follows: Currency 2012 2011LEK 3.50% - 20.0% p.a. 3.5% - 20.0% p.a.EUR 2.79% - 15.5% p.a. 3.1% - 15.5% p.a.USD 3.40% - 11.0% p.a. 1.8% - 10.8% p.a.
The Bank has granted few loans with interest rates at the minimum limit shown above, which are lower than the rates that are generally offered by the Bank, and are covered by cash collaterals or are granted to personnel under special conditions. Loan by type of customer are presented as follows:
31 December 2012 31 December 2011Amount % Amount %
Business Enterprises 9,758,954 72% 8,856,842 76%Individuals 3,861,509 28% 2,785,327 24%Total 13,620,463 100% 11,642,169 100%
Movements in the allowance for impairment on loans are as follows:31 December 2012 31 December 2011
As at 1 January 349,812 332,649Net impairment charge for the year 148,447 20,992Translation differences 1,012 (3,829)Balance at the end of the year 499,271 349,812
Audited Financial Statements 51
Union Bank Sh.aNotes to the Financial Statements for the year ended 31 December 2012 (Amounts in LEK ‘000 unless otherwise stated)
18
9. LOANS AND ADVANCES TO CUSTOMERS (CONTINUED)
The following table presents the distribution of the Bank’s credit exposure by industry sector for loans and advances to customers:
31 December 2012
31 December 2011
Amount % Amount %Trade 3,274,611 24% 3,175,723 27%Real Estate 2,389,477 17% 1,708,465 15%Other services 2,050,375 15% 2,116,487 18% Construction 1,954,853 14% 1,553,403 13%Consumer 1,472,032 11% 1,076,862 9% Hotels and restaurants 869,002 6% 542,371 5%Processing industry 420,232 3% 466,648 4%Education 370,203 3% 328,302 3%Transportation, storing, telecommunication 352,897 3% 244,933 2%Production, transmission of electricity, gas,water 289,491 2% 283,806 2% Financial services 118,119 1% 100,357 1%Agriculture and forestry 59,171 1% 44,812 1%Total 13,620,463 100% 11,642,169 100%
10. INTANGIBLE ASSETS Software Other
intangible assets
Intangible assets in progress
Total
At 1 January 2011Cost 122,202 24,312 4,012 150,526Accumulated amortization (60,256) (11,724) - (71,980)Net book amount 61,946 12,588 4,012 78,546Year ended December 2011Opening net book amount 61,946 12,588 4,012 78,546Additions 25,906 - 2,894 28,800Amortization charge (16,468) (3,647) - (20,115)Closing net book amount 71,384 8,941 6,906 87,231At 31 December 2011Cost 148,108 24,312 6,906 179,326Accumulated amortization (76,724) (15,371) - (92,095)Net book amount 71,384 8,941 6,906 87,231Year ended December 2012Opening net book amount 71,384 8,941 6,906 87,231 Additions 1,539 13,944 47,746 63,229 Amortization charge (18,124) (4,708) - (22,832)Closing net book amount 54,799 18,177 54,652 127,628 At 31 December 2012Cost 149,647 38,256 54,652 242,555 Accumulated amortization (94,848) (20,079) - (114,927)Net book amount 54,799 18,177 54,652 127,628
“Other intangible assets” includes payments made to First Data Hellas (“FDH”) for developing the ATM network supporting systems and the installation, customization, certification and on-line links between FDH’s ATM host system and the Bank’s system, as well as payments made for SWIFT and CIS joining, interface and access fees.

52 Audited Financial Statements
Uni
on B
ank
Sh.a
Not
es to
the
Fina
ncia
l Sta
tem
ents
for
the
year
end
ed 3
1 D
ecem
ber
2012
(A
mou
nts i
n LE
K ‘0
00 u
nles
s oth
erwi
se st
ated
)
19
11.
PRO
PER
TY A
ND
EQ
UIP
ME
NT
Com
pute
rsE
lect
roni
c eq
uipm
ent
Off
ice
Furn
iture
Fixt
ures
and
Fitt
ings
Fixe
d as
sets
in
pro
gres
sL
ease
hold
im
prov
emen
tsT
otal
At 1
Jan
uary
201
1C
ost
145,
713
84,4
6139
,586
13,5
4410
,856
150,
630
444,
790
Acc
umul
ated
dep
reci
atio
n(8
9,68
9)(3
9,55
7)(1
8,20
3)(4
,083
)-
(69,
079)
(220
,611
)N
et b
ook
amou
nt56
,024
44,9
0421
,383
9,46
110
,856
81,5
5122
4,17
9Y
ear
ende
d D
ecem
ber
2011
Ope
ning
net
boo
k am
ount
56,0
2444
,904
21,3
839,
461
10,8
5681
,551
224,
179
Add
ition
s10
,198
2,89
72,
806
-7,
403
2,56
025
,864
Dis
posa
ls(6
21)
(965
)(1
66)
(4,6
43)
(224
)(1
0,54
2)(1
7,16
1)D
epre
ciat
ion
char
ge(1
4,53
3)(9
,191
)(4
,476
)(1
,815
)-
(11,
741)
(41,
756)
Dep
reci
atio
n ch
arge
for d
ispos
als
451
409
922,
728
-6,
272
9,95
2C
losi
ng n
et b
ook
amou
nt51
,519
38,0
5419
,639
5,73
118
,035
68,1
0020
1,07
8A
t 31
Dec
embe
r 20
11C
ost
155,
290
86,3
9342
,226
8,90
118
,035
142,
648
453,
493
Acc
umul
ated
dep
reci
atio
n(1
03,7
71)
(48,
339)
(2
2,58
7)
(3,1
70)
- (7
4,54
8)
(252
,415
) N
et b
ook
amou
nt51
,519
38,0
5419
,639
5,73
118
,035
68,1
0020
1,07
8Y
ear
ende
d D
ecem
ber
2012
Ope
ning
net
boo
k am
ount
51,5
1938
,054
19,6
395,
731
18,0
3568
,100
201,
078
Add
ition
s11
,693
6,25
31,
940
1,07
9(4
,974
)8,
851
24,8
42D
ispo
sals
(474
)(1
,144
)(5
5)-
--
(1,6
73)
Dep
reci
atio
n ch
arge
(15,
010)
(8,3
79)
(4,1
11)
(1,1
46)
-(1
0,36
2)(3
9,00
8)D
epre
ciat
ion
char
ge fo
r disp
osal
s33
876
239
--
-1,
139
Clo
sing
net
boo
k am
ount
48,0
6635
,546
17,4
525,
664
13,0
6166
,589
186,
378
At 3
1 D
ecem
ber
2012
Cos
t16
6,50
991
,502
44,1
119,
980
13,0
6115
1,49
947
6,66
2A
ccum
ulat
ed d
epre
ciat
ion
(118
,443
)(5
5,95
6)(2
6,65
9)(4
,316
)-
(84,
910)
(290
,284
)N
et b
ook
amou
nt48
,066
35,5
4617
,452
5,66
413
,061
66,5
8918
6,37
8
Leas
ehol
d im
prov
emen
ts re
late
to th
e ex
pend
iture
s mad
e by
the
Ban
k fo
r the
reco
nstru
ctio
n of
leas
ed p
rem
ises
used
fort
hebr
anch
es.

Audited Financial Statements 53
Union Bank Sh.aNotes to the Financial Statements for the year ended 31 December 2012 (Amounts in LEK ‘000 unless otherwise stated)
20
12. NON-CURRENT ASSETS HELD FOR SALE
Non-current assets held for sale are properties acquired through enforcement of security over loans and advances to customers. The Bank intends and is taking steps to sell them for the best offer within a year from their acquisition.
Non-current assets held for sale as at 31 December 2012 are measured with the lower of its carrying amount and fair value less costs to sell, amounting to LEK 299,810 thousand (2011: LEK 253,143 thousand). As at 31 December 2012 an impairment of LEK 5,912 thousand is recognized for these non-current assets.
13. OTHER ASSETS
Other assets are comprised of the following: 31 December 2012 31 December 2011
Monetary values in transit 135,864 181,438Sundry debtors 29,986 17,683Prepayments 13,646 19,038Accrued income 11,550 14,854Inventory 3,767 1,845Payment in transit 2,745 577Guarantee deposit paid 698 695
Total 198,256 236,130
Monetary values in transit represent transactions with banks and financial institutions, with agreed settlement dates in the first days of the subsequent year.
14. DUE TO BANKS AND FINANCIAL INSTITUTIONS
Amounts due to banks and financial institutions are detailed as follows:31 December 2012 31 December 2011
Current accounts:Resident 14,356 340,342Non-resident 46,202 33,739
60,558 374,081Term deposits:Resident 815,109 863,035Non-resident 33,300 52,793
848,409 915,828Borrowings:Resident 400,000 -Non-resident - -
400,000 -Other accounts:Resident 20 20Non-resident 1,396 -
1,416 20Accrued interest 3,765 11,148Total 1,314,148 1,301,077
Term deposits from resident financial institutions mature in the range of 10 days to 12 months (2011: in 12 months) and bear interest from 1.4%p.a. to 4.2%p.a. (2011: 3.3%p.a. to 4.5%p.a.). These funds are deposited by Unioni Financiar Tirane (‘UFT’ or the main shareholder of the Bank) and represent mainly collateral for loans issued by the Bank to related parties.

54 Audited Financial Statements
Union Bank Sh.aNotes to the Financial Statements for the year ended 31 December 2012 (Amounts in LEK ‘000 unless otherwise stated)
21
14. DUE TO BANKS AND FINANCIAL INSTITUTIONS (CONTINUED)
Term deposits from non-resident financial institutions include annual deposits from ’Union of Financial Corners’, a related party, of LEK 22,715 thousand (2011: LEK 11,114 thousand), which are held as collateral for loans issued by the Bank, and bear interest at rates ranging from 3.7%p.a. to 4%p.a. (2011: 4.2%p.a.).
15. DUE TO CUSTOMERS
Customer accounts for enterprises, private entrepreneurs and individuals consisted of current and deposit accounts as follows:
31 December 2012 31 December 2011Government and public administrationLocal currency 23,940 -Foreign currency 170,107 21,823
194,047 21,823Current accounts:Local currency 1,674,591 1,864,414Foreign currency 1,257,963 935,680
2,932,554 2,800,094Saving accounts:Local currency 830,438 507,954Foreign currency 1,403,917 1,427,244
2,234,355 1,935,198Term deposits:Local currency 9,928,851 7,239,248Foreign currency 8,122,387 6,995,757
18,051,238 14,235,005Other customer accounts:Local currency 119,289 68,705Foreign currency 195,852 223,512
315,141 292,217Prepaid interest on customer deposits (23,570) -Accrued interest 328,134 264,282Total 24,031,899 19,548,619
Current and saving accounts bear interest in the range of 0.1% p.a. to 0.4% p.a. (2011: 0.2% p.a. to 0.4% p.a.) and term deposits bear interest as follows: Currency 2012 2011LEK 2.70%p.a. to 7.90%p.a. 2.90%p.a. to 8.40%p.a.EUR 1.20%p.a. to 4.60%p.a. 1.20%p.a. to 5.50%p.a. USD 0.90%p.a. to 3.50%p.a. 0.20%p.a. to 2.90%p.a.GBP 1.20%p.a. to 4.60%p.a. 0.90%p.a. to 1.05%p.a.
Other customer accounts represent blocked accounts for tender or contract guarantees, other bank guarantees and initial capital blocked by customers in the process of the establishment of their own companies.

Audited Financial Statements 55
Uni
on B
ank
Sh.a
Not
es to
the
Fina
ncia
l Sta
tem
ents
for
the
year
end
ed 3
1 D
ecem
ber
2012
(A
mou
nts i
n LE
K ‘0
00 u
nles
s oth
erwi
se st
ated
)
22
15.
DU
E T
O C
UST
OM
ER
S (C
ON
TIN
UE
D)
Cus
tom
er a
ccou
nts a
nd d
epos
its c
ould
be
furth
er a
naly
zed
by p
rodu
cts a
s fol
low
s:31
Dec
embe
r20
1231
Dec
embe
r20
11L
EK
Fore
ign
curr
ency
Tot
alL
EK
Fore
ign
curr
ency
Tot
alC
urre
nt a
ccou
nts(
incl
udin
g G
over
nmen
t and
adm
inis
tratio
n)1,
698,
531
1,42
8,07
0 3,
126,
601
1,86
4,41
495
7,50
32,
821,
917
Savi
ng a
ccou
nts
830,
438
1,40
3,91
7 2,
234,
355
507,
954
1,42
7,24
41,
935,
198
Ter
m d
epos
its:
One
mon
th
3
7,59
2
6
3,58
4 10
1,17
6 64
,175
109,
933
174,
108
Thre
e m
onth
s32
9,59
9 54
1,50
9 87
1,10
8 40
2,73
6 48
5,42
6 88
8,16
2 Si
x m
onth
s46
1,77
6 47
3,81
3 93
5,58
9 40
0,08
6 60
6,21
9 1,
006,
305
Twel
ve m
onth
s3,
472,
945
3,21
3,32
5 6,
686,
270
3,26
1,34
1 3,
421,
625
6,68
2,96
6 Fo
urte
enm
onth
s2,
041,
360
1,46
1,63
1 3,
502,
991
1,65
9,10
0 1,
118,
810
2,77
7,91
0 Tw
enty
-four
mon
ths
594,
578
230,
236
824,
814
403,
379
429,
840
833,
219
Twen
ty-fi
vem
onth
s1,
421,
665
1,06
1,59
3 2,
483,
258
-
--
Oth
er1,
569,
336
1,07
6,69
6 2,
646,
032
1,04
8,43
1 82
3,90
4 1,
872,
335
Tot
al d
epos
its9,
928,
851
8,12
2,38
7 18
,051
,238
7,
239,
248
6,99
5,75
7 14
,235
,005
Oth
er c
usto
mer
acc
ount
s:O
n de
man
d
1
6,22
2
5,59
8 21
,820
12
,883
6,46
019
,343
Thre
e m
onth
s
-
6,28
2 6,
282
--
-Si
x m
onth
s
30
0
36
3
6
6330
0-
300
Twel
ve m
onth
s
3
1,03
8 10
5,22
0 13
6,25
8 12
,726
110,
331
123,
057
Oth
er
7
1,72
9
7
8,38
9 15
0,11
8 42
,796
106,
721
149,
517
Tot
al o
ther
cus
tom
er a
ccou
nts
119,
289
195,
852
315,
141
68,7
0522
3,51
229
2,21
7T
otal
12,5
77,1
09
11,1
50,2
26
23,7
27,3
35
9,68
0,32
19,
604,
016
19,2
84,3
37
“Oth
er”
incl
udes
dep
osits
with
initi
al m
atur
ities
of 4
mon
ths,
7 m
onth
s and
21
mon
ths.

56 Audited Financial Statements
Union Bank Sh.aNotes to the Financial Statements for the year ended 31 December 2012 (Amounts in LEK ‘000 unless otherwise stated)
23
16. TREASURY BILLS SOLD UNDER REPURCHASE AGREEMENTS
31 December 2012 31 December 2011Treasury bills sold under repurchased agreements 261,226 251,050Accrued interest 146 1,169Total 261,372 252,219
Treasury bills sold under repurchase agreements “Repos” are short term liquidity management instruments issued by the Central Bank to inject liquidity in the banking system. Repos bear interest at market rates ranging from 4.07% p.a. to 4.12% p.a (2011: 5.45% p.a. to 5.5% p.a) and are denominated in LEK.
17. OTHER LIABILITIES
Other liabilities are comprised of the following:
31 December 2012 31 December 2011Payment in transit 75,050 80,166Invoices to be received 36,638 27,960Other 15,045 13,277Other provisions for risk and expenses 2,132 2,132Deferred income and accrued expenses 2,608 1,350Sundry creditors 414 925
Total 131,887 125,810
Payment in transit accounts represent outbound international money transfers with agreed settlement dates in the first days of the subsequent year.
18. SUBORDINATED DEBT
The amount of subordinated debt represents the remaining balance of a loan provided by the Bank’s shareholders in previous years, to enable the Bank to maintain the minimum regulatory capital requirements until the subscription and contribution of EBRD for new shares issued. Following the subscription of such shares on 8 October 2008 and pursuant to regulatory requirements, the remaining balance of the subordinated loan was treated as a commitment for capital injections and is expected to be utilized as paid-in capital in future periods.
19. SHARE CAPITAL
Based on Shareholders’ Decision dated 28 September 2012, the subscribed capital was increased by 200 thousand shares using the following contributions of UFT (the main shareholder of the Bank):
• 28 September 2012: contribution in 50,000 shares with a total nominal value of EUR 500 thousand; • 31 December 2012: contribution in 50,000 shares with a total nominal value of EUR 500 thousand; • 26 March 2013: contribution in 100,000 shares with a total nominal value of EUR 1,000 thousand
(see note 34).
At 31 December 2012, the subscribed capital was LEK 2,438,857 thousand (2011: LEK 2,159,197 thousand) divided into 1,897,143 shares (2011: 1,697,143 shares) with a nominal value of EUR 10 each, while the movements in the paid up share capital in 2012 and 2011 were as follows:
31 December 2012 31 December 2011No. of shares Value of shares No. of shares Value of shares
Balance at the beginning of the year 1,697,143 2,159,743 1,617,143 2,049,331Capital injection during the year 100,000 139,890 80,000 110,412Paid-up share capital 1,797,143 2,299,633 1,697,143 2,159,743
Audited Financial Statements 57
Union Bank Sh.aNotes to the Financial Statements for the year ended 31 December 2012 (Amounts in LEK ‘000 unless otherwise stated)
24
19. SHARE CAPITAL (CONTINUED)
The structure of subscribed capital is as follows:2012 2011
Unioni Financiar Tirane (UFT) Sh.p.k 84.90% 83.12%European Bank for Reconstruction and Development (EBRD) 11.18% 12.50%Edmond Leka 1.96% 2.19%Niko Leka 1.96% 2.19%
Paid-up share capital represents ordinary share capital and has no preferences or restrictions attached thereto.
20. INTEREST INCOME
Interest income was earned on the following assets:2012 2011
Loans and advances to customers 1,171,569 1,073,022Investment securities 554,651 384,987Loans and advances to banks & financial institutions 37,585 69,122Total 1,763,805 1,527,131
21. INTEREST EXPENSE
Interest expense was incurred on the following liabilities:
2012 2011Due to customers 895,350 732,959Loans and advances from financial institutions 36,654 66,933Repurchase agreements 12,400 5,955Subordinated debt 26 29Total 944,430 805,876
22. FEE AND COMMISSION INCOME
Fees and commissions received were comprised as follows:2012 2011
Banking services 123,226 132,629Other 30,011 31,910Lending activity 3,642 4,112Total 156,879 168,651
23. FEE AND COMMISSION EXPENSES
Fees and commissions expense were comprised as follows:2012 2011
Fee charged for services offered from the agents 21,019 18,146Banking services 5,160 4,450Other 4,692 3,458Treasury operations 4,213 2,889Total 35,084 28,943
24. NET FOREIGN EXCHANGE GAIN
Net foreign exchange gain includes gains less losses from trading activities and foreign currency differences arising on retranslation. Net foreign exchange gain in 2012 is LEK 72,156 thousand (2011: LEK 68,831 thousand).
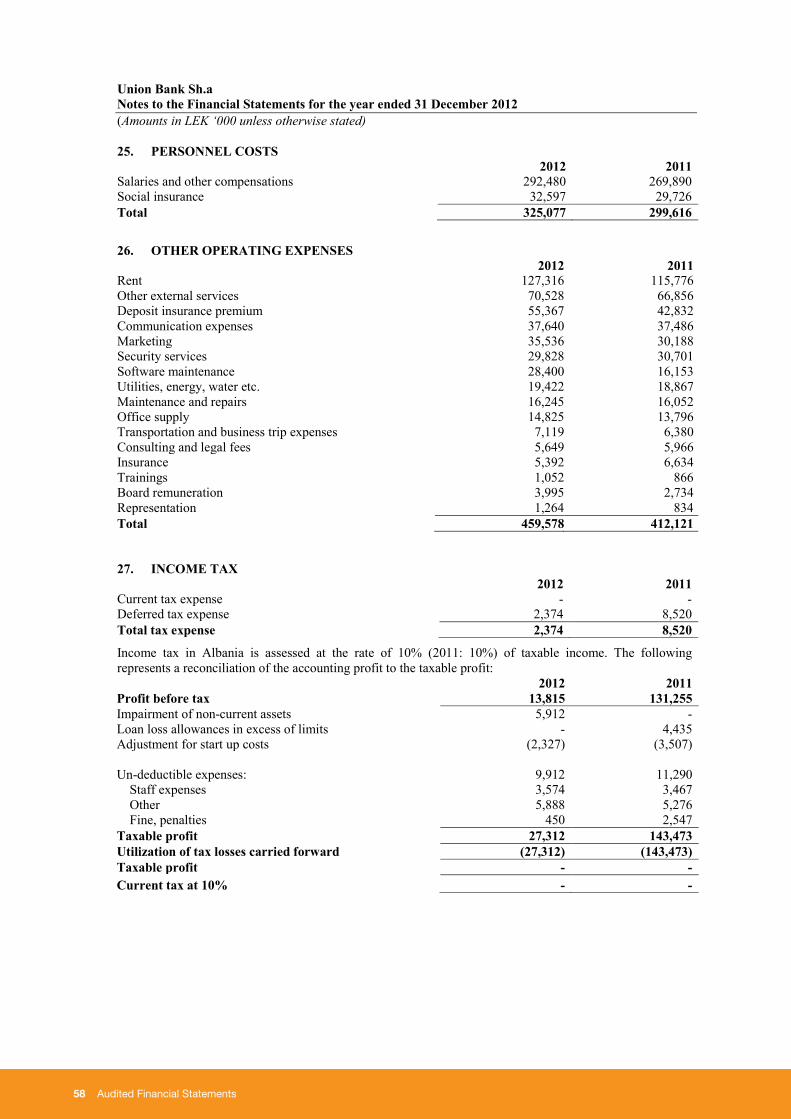
58 Audited Financial Statements
Union Bank Sh.aNotes to the Financial Statements for the year ended 31 December 2012 (Amounts in LEK ‘000 unless otherwise stated)
25
25. PERSONNEL COSTS2012 2011
Salaries and other compensations 292,480 269,890 Social insurance 32,597 29,726 Total 325,077 299,616
26. OTHER OPERATING EXPENSES2012 2011
Rent 127,316 115,776Other external services 70,528 66,856Deposit insurance premium 55,367 42,832Communication expenses 37,640 37,486Marketing 35,536 30,188Security services 29,828 30,701Software maintenance 28,400 16,153Utilities, energy, water etc. 19,422 18,867Maintenance and repairs 16,245 16,052Office supply 14,825 13,796Transportation and business trip expenses 7,119 6,380Consulting and legal fees 5,649 5,966Insurance 5,392 6,634Trainings 1,052 866Board remuneration 3,995 2,734Representation 1,264 834Total 459,578 412,121
27. INCOME TAX2012 2011
Current tax expense - -Deferred tax expense 2,374 8,520Total tax expense 2,374 8,520
Income tax in Albania is assessed at the rate of 10% (2011: 10%) of taxable income. The following represents a reconciliation of the accounting profit to the taxable profit:
2012 2011Profit before tax 13,815 131,255Impairment of non-current assets 5,912 -Loan loss allowances in excess of limits - 4,435Adjustment for start up costs (2,327) (3,507)
Un-deductible expenses: 9,912 11,290Staff expenses 3,574 3,467Other 5,888 5,276Fine, penalties 450 2,547
Taxable profit 27,312 143,473Utilization of tax losses carried forward (27,312) (143,473)Taxable profit - -Current tax at 10% - -

Audited Financial Statements 59
Union Bank Sh.aNotes to the Financial Statements for the year ended 31 December 2012 (Amounts in LEK ‘000 unless otherwise stated)
26
27. INCOME TAX (CONTINUED)
2012 2011Losses carried forward from 2010 at beginning of the year 54,747 198,220Utilization of tax losses (27,312) (143,473)Unutilized tax losses from 2010 (expire in 2013) 27,435 54,747
The carry forward period for any tax losses in accordance with the Albanian Tax Law is three years.Deferred tax assets recognized in respect of tax losses extended to the management future estimate of probable taxable profit that will be available against which the losses can be utilized.
The movements in deferred tax assets and liabilities are presented as follows:31 December 2012 31 December 2011
Deferred tax asset at the beginning of the year 5,708 17,789 Recognized in statement of comprehensive income (2,374) (12,081)Deferred tax asset at the end of the year 3,334 5,708
Deferred tax liability at the beginning of the year 16,499 20,060 Recognized in statement of comprehensive income - (3,561)Deferred tax liability at the end of the year 16,499 16,499
Deferred tax assets and liabilities are attributable to the following items:
31 December 2012 31 December 2011Deferred tax asset:Start-up costs - 233Non-current assets held for sale 591 -Tax losses carried forward 2,743 5,475
3,334 5,708Deferred tax liability:Allowances for losses on loans and advances 16,499 16,499
16,499 16,499
Based on the local accounting law, starting from 1 January 2008 the Bank must report in accordance with IFRS. In addition, Law No. 10364, dated 16.12.2010 provides for certain amendments (effective as of 24January 2011). Based on these amendments, the impairment allowances on loans and advances charged by banks in accordance with IFRS shall be considered as tax deductible expenses, provided that they are certified by the external auditors and are not in excess of the limits determined by the Central Bank. However, the impact of these changes in the legislation, on the financial statements of the Bank, are still uncertain and guidelines on the tax impact for IFRS reporting not yet clear.
28. CASH AND CASH EQUIVALENTS
Cash and cash equivalents consisted of the following: 31 December 2012 31 December 2011
Cash on hand 799,151 595,410Accounts with Central Bank 79,968 21,882Accounts with financial institutions with maturity of less than 3 months 2,573,001 2,524,730 Treasury bills with maturity of less than 3 months 1,141,079 983,866 Total 4,593,199 4,125,888

60 Audited Financial Statements
Union Bank Sh.aNotes to the Financial Statements for the year ended 31 December 2012 (Amounts in LEK ‘000 unless otherwise stated)
27
29. RELATED PARTIES
Parties are considered to be related if one of them has the ability to control the other or exercise significant influence over the one making financial and operating decisions.
In considering each possible related party relationship, attention is directed to the substance of the relationship and not the merely to the legal form.
The Bank has related party relationships with its shareholders and affiliates, directors and executive officers. The shareholding structure of the Bank as at 31 December 2012 and 2011 is presented in Note 19.
Associated entities include Union Distribucion Servis Albania Shpk, Media Union Shpk, Union Travel Shpk, Albanian Courier Shpk, Intergrafika Shpk, United Transport, Union Group Shpk, Uni-Com Sha, Albanian Courier Service Shpk, Auto Master Sha, United Motors Shpk, S-Systems Sha, Klubi i Automobilit te Shqiperise, Atex Shpk, Union Distribucion Shpk, Auto City Sha, Pluton Investor Shpk, Arch Investor Shpk, Union Of Financial Corners, Plus Communication, Auto Net Shpk, Press Point Albania Shpk, Press Point El, Uni-Cons Shpk, Auto Master Service Shpk, Union Smart Security Shpk, Union Net Shpk, Paylink Sha.
As at each reporting date the Bank has the following balances with its related parties:
As at 31 December
2012
As at 31 December
2011Assets:Loans and advances to customers:
Parent company - -Associated entities 1,036,104 1,322,518Management personnel of the entity or its parent and their relatives 107,359 50,148
Other Assets:Parent company 761 994Associated entities 377 282Management personnel of the entity or its parent and their relatives 659 9
Liabilities: Due to banks and FI:
Parent company 832,566 1,214,481Associated entities 23,707 11,301EBRD - -
Due to customers:Associated entities 231,647 398,162Management personnel of the entity or its parent and their relatives 240,475 222,178
Other Liabilities:Parent company 223 625Associated entities 3,843 2,983Management personnel of the entity or its parent and their relatives - -EBRD 140 69
Subordinated debt:Parent company 1,047 1,042
Loans to associated entities in the amount of LEK 625,494 thousand (2011: LEK 1,002,943 thousand) are covered by cash collateral and the remaining balance is covered by other collaterals provided by the parent company and associated entities.

Audited Financial Statements 61
Union Bank Sh.aNotes to the Financial Statements for the year ended 31 December 2012 (Amounts in LEK ‘000 unless otherwise stated)
28
29. RELATED PARTY TRANSACTIONS (CONTINUED)
31 December2012
31 December2011
Off Statement of Financial PositionUn-drawn credit facilities from the Bank:
Associated entities 5,363 15,366Management personnel of the entity or its parent and their relatives 19,145 19,040
Guarantees received:Parent company 497,579 1,366,606Associated entities 565,773 691,031Management personnel of the entity or its parent and their relatives 415,060 365,275
Guarantees given:Parent company 20 20Associated entities 34,637 34,854
Commitments given:Associated entities - 73,147
The Bank has entered into the following transactions with related parties:
2012 2011Interest income:
Parent company 86 465Associated entities 85,841 97,130Management personnel of the entity or its parent and their relatives 6,995 4,495
Interest expense:Parent company 31,982 59,450Associated entities 5,985 11,959Management personnel of the entity or its parent and their relatives 4,648 4,367EBRD - 12,259
Fees and commission income:Parent company 9,033 4,772Associated entities 3,509 4,928Management personnel of the entity or its parent and their relatives 568 348
Fees and commission expense:EBRD - 1,418
Operating income:Associated entities - 1,494
Operating expense:Parent company 2,674 2,361Associated entities 42,635 36,023Management personnel of the entity or its parent and their relatives 134,821 118,216Other shareholders 787 69

62 Audited Financial Statements
Union Bank Sh.aNotes to the Financial Statements for the year ended 31 December 2012 (Amounts in LEK ‘000 unless otherwise stated)
29
30. COMMITMENTS AND CONTINGENCIES
Commitments and contingencies include the following:31 December 2012 31 December 2011
Guarantees given in favor of customers 446,193 637,027Un-drawn credit facilities 746,276 860,981
Guarantees and commitments
The Bank issues guarantees for its customers. These instruments bear a credit risk similar to that of loans granted. Guarantees received from customers and credit institutions include cash collateral, mortgages pledged in favor of the bank from its borrowers.
Commitments represent the undrawn balances of loans, overdraft and card limits granted to the customers.
Legal
The Bank was involved in various claims and legal proceedings of a nature considered normal to its business as at 31 December 2012. The level of these claims and legal proceedings corresponds to the level of claims and legal proceedings in previous years. The Bank’s management is of the opinion that no material losses will be incurred in relation to legal claims.
Operating lease commitments
The Bank has entered into non-cancelable lease commitments. Such commitments are composed as follows:31 December 2012 31 December 2011
Not later than 1 year 87,071 80,013Later than 1 year and not later than 5 years 195 361Total 87,266 80,374
31. FINANCIAL RISK MANAGEMENT
The Bank’s activities expose it to a variety of financial risks and those activities involve analysis, evaluation, acceptance and management of some degree of risk or combination of risks. Taking risks is core to the financial business, and the operational risks are inevitable consequence of being in business. The Bank’s aim is therefore to achieve an appropriate balance between risk and return and minimize potential adverse effects on the Bank’s financial performance.
The Bank’s risk management policies are designed to identify and analyze these risks, to set appropriate risk limits and controls, and to monitor the risks and adherence to limits by means of reliable and up to date information systems.
The most important types of risk are discussed below.
Audited Financial Statements 63
Union Bank Sh.aNotes to the Financial Statements for the year ended 31 December 2012 (Amounts in LEK ‘000 unless otherwise stated)
30
31. FINANCIAL RISK MANAGEMENT (CONTINUED)
(a) Credit risk
Credit risk is the risk that the counterparty to a financial instrument will fail to repay the obligation and cause the Bank to incur a loss. The Bank is subject to credit risk through its lending activities, and in cases where it acts as an intermediary on behalf of customers or other third parties or issues guarantees in this respect, the credit risk for the Bank stems from the possibility that different counterparties might default on their contractual obligations.
The Board of Directors has delegated responsibility for the oversight of credit risk to its Bank Credit Committee. A separate Bank Credit Department, reporting to the Bank Executive Management isresponsible for management of the Bank's credit risk, including:
• Formulating credit policies in consultation with business units, covering collateral requirements, credit assessment, risk grading and reporting, documentary and legal procedures, and compliance with regulatory and statutory requirements.
• Establishing the authorization structure for the approval and renewal of credit facilities. Credit facilities approvals and renewals require approval by Credit Department, Head of Credit Department, Bank Credit Committee or the Board of Directors as appropriate.
• Reviewing and assessing credit risk. Bank Credit Department assesses all credit exposures in excess of designated limits, prior to facilities being committed to customers by the business unit concerned. Renewals and reviews of facilities are subject to the same review process.
• Limiting concentrations of exposure to counterparties, geographies and industries (for loans and advances).
• Developing and maintaining the Bank's risk grading in order to categorize exposures according to the degree of risk of financial loss faced and to focus management on the attendant risks. The risk grading system is used in determining where impairment provisions may be required against specific credit exposures. The current risk grading framework consists of ten grades reflecting varying degrees of risk of default and the availability of collateral or other credit risk mitigation. The responsibility for setting risk grades lies with the final approving executive / committee as appropriate. Risk grades are subject to regular reviews by Bank’s Executive Management.
• Reviewing compliance of business units with agreed exposure limits. Regular reports on the credit quality of local portfolios are provided to Bank Credit Department who may require appropriate corrective action to be taken.
• Providing advice, guidance and specialist skills to business units to promote best practice throughout the Bank in the management of credit risk.
Each business unit is required to implement Bank credit policies and procedures, with credit approval authorities delegated from the Bank’s Credit Department and Credit Committee. Each business unit has a responsible officer who reports on all credit related matters to local management and the Bank Credit Committee. Each business unit is responsible for the quality and performance of its credit portfolio and for monitoring and controlling all credit risks in its portfolios, including those subject to central approval. In addition, regular audits of business units and Bank Credit processes are undertaken by Internal Audit.

64 Audited Financial Statements
Union Bank Sh.aNotes to the Financial Statements for the year ended 31 December 2012 (Amounts in LEK ‘000 unless otherwise stated)
31
31. FINANCIAL RISK MANAGEMENT (CONTINUED)
(a) Credit risk (continued)
Maximum credit exposure
Maximum exposure to credit risk before collateral held or other credit enhancements are as follows:
31 December 2012 31 December 2011Treasury Bills held-to-maturity 2,390,938 2,099,146Placements and balances with banks 2,632,691 2,677,364Loans and advances to customers 13,183,400 11,339,905Treasury Bonds held-to-maturity 6,147,510 3,996,577Financial guarantees 446,193 637,027Commitments to extend credit 746,276 860,981Maximum exposures to credit risk 25,547,008 21,611,000
Exposure to credit risk is also managed in part by obtaining collateral and guarantees. The principal collateral types are:• Mortgage over residential properties• Pledges over business assets and inventories• Deposits and accounts placed (cash collateral)• Personal guarantee for the loan
In addition to the term loans and business overdrafts that are secured by the above type of collateral, overdrafts on payroll accounts are extended to individuals as well. No pledges are taken for these advances as the monthly salary offsets the used part of the limit given. Financial guaranties and stand-by letters ofcredit are cash-collateralized.
Impaired loans and advances
Impaired loans and advances are loans and advances for which the Bank determines that it is probable that it will be unable to collect all principal and interest due according to the contractual terms of the loan agreement(s).
Past due but not impaired loans
Loans and advances where contractual interest or principal payments are past due but the Bank believes that impairment is not appropriate on the basis of the level of security, collateral available and / or the stage of collection of amounts owed to the Bank.
Loans with renegotiated terms
Loans with renegotiated terms are loans that have been restructured due to deterioration in the borrower’s financial position and where the Bank has made concessions that it would not otherwise consider. Once the loan is restructured it remains in this category independently from eventual satisfactory performance after restructuring.
Allowances for impairment
The Bank establishes an allowance for impairment losses that represents its estimate of incurred losses in its loan portfolio. It consists in the specific loss component that relates to individually significant exposures.

Audited Financial Statements 65
Uni
on B
ank
Sh.a
Not
es to
the
Fina
ncia
l Sta
tem
ents
for
the
year
end
ed 3
1 D
ecem
ber
2012
(A
mou
nts i
n LE
K ‘0
00 u
nles
s oth
erwi
se st
ated
)
32
31.
FIN
AN
CIA
L R
ISK
MA
NA
GE
ME
NT
(CO
NT
INU
ED
)
(a)
Cre
dit r
isk
(con
tinue
d)
Loan
s and
adv
ance
s are
sum
mar
ized
as f
ollo
ws:
As a
t 31
Dec
embe
r20
12L
oans
and
adv
ance
s to
cust
omer
sPl
acem
ents
and
ba
lanc
es w
ith
bank
sR
etai
l C
orpo
rate
Adv
ance
sT
otal
Loa
nsN
eith
er p
ast d
ue n
or im
paire
d2,
734,
965
3,71
4,85
7 2,
210,
684
8,66
0,50
6 2,
632,
691
Past
due
but
not
impa
ired
480,
353
933,
139
1,76
2,77
2 3,
176,
264
-In
divi
dual
ly im
paire
d14
2,81
0 1,
260,
066
443,
025
1,84
5,90
1 -
Tot
al G
ross
3,35
8,12
8 5,
908,
062
4,41
6,48
1 13
,682
,671
2,
632,
691
Less
: allo
wan
ce fo
r ind
ivid
ually
impa
ired
loan
s56
,174
21
4,65
0 89
,128
35
9,95
2 Le
ss: a
llow
ance
for c
olle
ctiv
ely
impa
ired
loan
s27
,385
70
,913
41
,021
13
9,31
9 -
Tot
al A
llow
ance
for
impa
irm
ent
83,5
59
285,
563
130,
149
499,
271
-
As a
t 31
Dec
embe
r20
11L
oans
and
adv
ance
s to
cust
omer
sPl
acem
ents
and
ba
lanc
es w
ith
bank
sR
etai
l C
orpo
rate
Adv
ance
sT
otal
Loa
nsN
eith
er p
ast d
ue n
or im
paire
d2,
026,
430
3,59
1,53
73,
176,
750
8,79
4,71
72,
677,
364
Past
due
but
not
impa
ired
313,
261
828,
216
967,
520
2,10
8,99
7-
Indi
vidu
ally
impa
ired
68,7
3953
0,30
618
6,95
878
6,00
3-
Tot
al G
ross
2,40
8,43
04,
950,
059
4,33
1,22
811
,689
,717
2,67
7,36
4Le
ss: a
llow
ance
for i
ndiv
idua
lly im
paire
d lo
ans
51,5
9313
2,52
071
,227
255,
340
-Le
ss: a
llow
ance
for c
olle
ctiv
ely
impa
ired
loan
s18
,969
46,6
1228
,891
94,4
72-
Tot
al A
llow
ance
for
impa
irm
ent
70,5
6217
9,13
210
0,11
834
9,81
2-
The
tota
l im
pairm
ent c
harg
e fo
r loa
ns a
nd a
dvan
ces i
s LEK
499
,271
thou
sand
(201
1: L
EK 3
49,8
12 th
ousa
nd).

66 Audited Financial Statements
Union Bank Sh.aNotes to the Financial Statements for the year ended 31 December 2012 (Amounts in LEK ‘000 unless otherwise stated)
33
31. FINANCIAL RISK MANAGEMENT (CONTINUED)
(a) Credit risk (continued)
Loans and advances neither past due nor impaired
As per Bank’s internal credit rating, loans and advances that are neither past due nor impaired are classified as below:
As at 31 December 2012Rating Loans and advances to customers
Total Loans
Placements and balances with banksRetail Corporate Advances
Good 2,734,553 3,714,857 1,997,691 8,447,101 2,632,691Acceptable 412 - 212,993 213,405 -Close monitoring - - - - -Unacceptable - - - - -Total 2,734,965 3,714,857 2,210,684 8,660,506 2,632,691
As at 31 December 2011Rating Loans and advances to customers
Total Loans
Placements and balances with banksRetail Corporate Advances
Good 1,990,429 3,555,785 2,966,242 8,512,456 2,677,364Acceptable 34,893 27,383 - 62,276 -Close monitoring 1,108 8,369 210,508 219,985 -Unacceptable - - - - -Total 2,026,430 3,591,537 3,176,750 8,794,717 2,677,364
Loans and advances past due but not impaired
Below is the ageing analysis of loans past due but not individually impaired.
As at 31 December 2012Time band
Loans and advances to customers
Retail Corporate Advances Total LoansPast due up to 30 days 321,942 683,755 107,255 1,112,952Past due 31-60 days 100,352 48,346 382,252 530,950Past due 61-90 days 49,192 184,163 1,164,978 1,398,333Past due 91-180 days 8,867 16,875 32,867 58,609Past due over 180 days - - 75,420 75,420Total 480,353 933,139 1,762,772 3,176,264Estimation of fair value of collateral 2,191,108 3,711,350 3,864,096 9,766,554
Loans and advances past due over 90 days are collateralized by cash amounting at LEK 62,311 thousand (2011: LEK 334,957 thousand).
As at 31 December 2011Time band
Loans and advances to customers
Retail Corporate Advances Total LoansPast due up to 30 days 241,836 685,128 134,801 1,061,765Past due 31-60 days 47,807 27,591 116,201 191,599Past due 61-90 days 22,226 75,333 98,417 195,976Past due 91-180 days 898 35,729 543,963 580,590Past due over 180 days 494 4,435 74,138 79,067Total 313,261 828,216 967,520 2,108,997Estimation of fair value of collateral 1,941,218 4,059,601 1,629,389 7,630,208

Audited Financial Statements 67
Union Bank Sh.aNotes to the Financial Statements for the year ended 31 December 2012 (Amounts in LEK ‘000 unless otherwise stated)
34
31. FINANCIAL RISK MANAGEMENT (CONTINUED)
(a) Credit risk (continued)
Loans and advances individually impaired
The individually impaired loans and advances before taking into consideration the cash flows from collateral held is LEK 1,845,901 thousand (2011: LEK 786,003 thousand).
The breakdown of the gross amount of the individually impaired loans and advances by class, along with the fair value of the collateral held by the Bank as security, are as follows:As at 31 December 2012 Loans and advances to customers
Retail Corporate Advances Total LoansIndividually impaired 142,810 1,260,066 443,025 1,845,901 Collateral 324,012 9,077,646 631,114 10,032,772 As at 31 December 2011 Loans and advances to customers
Retail Corporate Advances Total LoansIndividually impaired 68,739 530,306 186,958 786,003Collateral 205,526 6,727,390 272,635 7,205,551
Included in collateral used to secure the corporate loans is an amount of LEK 5,376,408 thousand, whichrepresents a portion of the real estate collaterals received from a single borrower of the Bank that is not a first mortgage. Therefore, the Bank will not have the first claim in the event of a default by that borrower.
Loans and advances renegotiated
Restructuring activities include extended payment agreements, modification and deferral of payments. Following restructuring, a previously overdue customer account is reset to normal status and managed together with other similar accounts.
The total restructured portfolio is of LEK 198,779 thousand (2011: LEK 130,345 thousand)
Write-off policy
The Bank writes off a loan / security balance (and any related allowances for impairment losses) when Risk Committee determines that the loans / securities are uncollectible. This determination is reached after considering information such as the occurrence of significant changes in the borrower / issuer’s financial position such that the borrower / issuer can no longer pay the obligation, or that proceeds from collateral will not be sufficient to pay back the entire exposure.
The Bank holds collateral against loans and advances to customers in the form of mortgage interests over property, other registered securities over assets, and guarantees. Estimates of fair value are based on the value of collateral assessed at the time of borrowing, and generally are not updated except when a loan is individually assessed as impaired. Collateral generally is not held over loans and advances to banks, except when securities are held as part of reverse repurchase and securities borrowing activity. The collateral structure referring to loans past due but not impaired is similar to the collaterals structure referring to impaired loans presented below.
Against individually impaired
Against collectively impaired
Total
Property 9,804,866 23,045,964 32,850,830 Pledge 227,906 9,446,988 9,674,894Cash - 2,541,805 2,541,805Total 10,032,772 35,034,757 45,067,529

68 Audited Financial Statements
Union Bank Sh.aNotes to the Financial Statements for the year ended 31 December 2012 (Amounts in LEK ‘000 unless otherwise stated)
35
31. FINANCIAL RISK MANAGEMENT (CONTINUED)
(b) Liquidity risk
Liquidity risk is the risk that the Bank will encounter difficulty in raising funds to meet commitments associated with financial instruments, and, in general to retain continuity of its core business lines. On an operational basis, the Bank monitors the performance of its customer deposits, and on that basis adjusts the balance of its current assets’ access to funding, in order to maintain a satisfactory payment capability. On a more strategic level, the Bank through its Asset and Liability Committee (“ALCO”) manages this risk by continually monitoring expected cash flows from financial instruments and adjusting its investments to match the timing of payments and receipts.
When an operating branch is subject to a liquidity limit imposed, the branch is responsible for managing its overall liquidity within regulatory limit in co-ordination with Bank’s Treasury Department. Treasury Department monitors compliance for all operating branches with limits set on daily basis.
All liquidity policies and procedures are subject to annual review and approval by Board and ALCOrespectively. Daily reports cover the liquidity position of both the Bank and operating branches.
The Bank relies on deposits from customer and banks, Repos and short term borrowings as its primary source of funding. The short term nature of these source of funding increases the Bank’s liquidity risk and the Bank actively manages this risk through maintaining competitive pricing and constant monitoring of market trends.
One of the key measures used by the Bank for managing liquidity risk is the ratio of liquid assets to short term liabilities. This ratio was always above limits set by Central Bank in each and all currencies converted.
To manage the liquidity risk arising from financial liabilities, the Bank holds liquid assets comprising cash and cash equivalents and investment securities for which there is an active and liquid market. These assets can be readily sold to meet liquidity requirements.
The monitoring and control function for the Bank’s investments are performed by ALCO. Bank’s ALCO policy includes sets of daily, weekly and monthly reports to be prepared and analyzed. Daily report, “Liquidity Position Report”, controls respectively daily inflows/outflows of liquidity till 1-year maturity, under business usual scenario. Monthly reports include ratio and gap analyses under separate bank specific and market crisis scenarios. Reports are produced for each single currency LEK, USD and EUR and for the total balance sheet as well.

Audited Financial Statements 69
Uni
on B
ank
Sh.a
Not
es to
the
Fina
ncia
l Sta
tem
ents
for
the
year
end
ed 3
1 D
ecem
ber
2012
(A
mou
nts i
n LE
K ‘0
00 u
nles
s oth
erwi
se st
ated
)
36
31.
FIN
AN
CIA
L R
ISK
MA
NA
GE
ME
NT
(CO
NT
INU
ED
)
(b)
Liq
uidi
ty r
isk
(con
tinue
d)
An
anal
ysis
of f
inan
cial
ass
ets a
nd li
abili
ties a
ccor
ding
to th
eir m
atur
ities
is a
s fol
low
s:31
Dec
embe
r20
12U
p to
1 to
3 to
66
to 1
2 1
to 5
Ove
r 5
Tot
al1
mon
th3
mon
ths
Mon
ths
mon
ths
year
sye
ars
Ass
ets
Cas
han
d ba
lanc
es w
ith C
entra
l Ban
k2,
908,
914
--
-
-
-2,
908,
914
Plac
emen
ts a
nd b
alan
ces w
ith b
anks
2,57
3,01
8 -
-49
,088
-
10,5
85
2,63
2,69
1 Tr
easu
ry B
ills h
eld-
to-m
atur
ity49
9,33
0 64
1,74
941
9,95
8 82
9,90
1
-
-2,
390,
938
Trea
sury
Bon
ds h
eld-
to-m
atur
ity19
9,32
7 17
6,27
211
9,44
8 1,
604,
891
4,04
7,57
2 -
6,14
7,51
0 Lo
ans a
nd a
dvan
ces t
o cu
stom
ers
1,68
7,36
1 1,
040,
873
1,32
9,89
7 2,
549,
981
4,56
9,71
6 2,
005,
572
13,1
83,4
00
Oth
er a
sset
s18
0,14
5 -
--
-69
8 18
0,84
3 T
otal
8,04
8,09
5 1,
858,
894
1,86
9,30
3 5,
033,
861
8,61
7,28
8 2,
016,
855
27,4
44,2
96
Lia
bilit
ies
Due
to b
anks
and
Fin
anci
al in
stitu
tions
801,
025
1,39
6 -
511,
727
--
1,31
4,14
8D
ue to
cus
tom
ers
7,00
1,75
8 2,
302,
281
2,92
4,02
1 7,
998,
801
3,80
5,03
8 -
24,0
31,8
99
Trea
sury
bill
s sol
d un
der r
epur
chas
e ag
reem
ent
261,
372
--
-
-
-26
1,37
2 O
ther
liab
ilitie
s12
9,27
9 -
--
--
129,
279
Subo
rdin
ated
deb
t-
--
1,04
7
-
-1,
047
Tot
al8,
193,
434
2,30
3,67
7 2,
924,
021
8,51
1,57
5 3,
805,
038
-25
,737
,745
L
iqui
dity
ris
k at
31
Dec
embe
r20
12(1
45,3
39)
(444
,783
)(1
,054
,718
)(3
,477
,714
)4,
812,
250
2,01
6,85
5 1,
706,
551
Cum
ulat
ive
(145
,339
)(5
90,1
22)
(1,6
44,8
40)
(5,1
22,5
54)
(310
,304
)1,
706,
551

70 Audited Financial Statements
Uni
on B
ank
Sh.a
Not
es to
the
Fina
ncia
l Sta
tem
ents
for
the
year
end
ed 3
1 D
ecem
ber
2012
(A
mou
nts i
n LE
K ‘0
00 u
nles
s oth
erwi
se st
ated
)
37
31.
FIN
AN
CIA
L R
ISK
MA
NA
GE
ME
NT
(CO
NT
INU
ED
)
(b)
Liq
uidi
ty r
isk
(con
tinue
d)31
Dec
embe
r20
11U
p to
1 m
onth
1 to
3 m
onth
s3
to 6
mon
ths
6 to
12
mon
ths
1 to
5ye
ars
Ove
r 5
year
sT
otal
Ass
ets
Cas
h an
d ba
lanc
es w
ith C
entra
l Ban
k2,
519,
660
--
--
-2,
519,
660
Plac
emen
ts a
nd b
alan
ces w
ith b
anks
2,52
5,85
2-
55,5
7290
,305
-5,
635
2,67
7,36
4Tr
easu
ry B
ills h
eld-
to-m
atur
ity39
9,23
448
6,28
850
5,24
470
8,38
0-
-2,
099,
146
Trea
sury
Bon
ds h
eld-
to-m
atur
ity33
2,79
831
7,42
617
2,63
865
8,53
92,
515,
176
-3,
996,
577
Loan
s and
adv
ance
s to
custo
mer
s1,
274,
338
896,
481
1,17
0,50
62,
841,
090
3,48
4,37
71,
673,
113
11,3
39,9
05O
ther
ass
ets
214,
552
--
-
-
695
215,
247
Tot
al7,
266,
434
1,70
0,19
5 1,
903,
960
4,29
8,31
4 5,
999,
553
1,67
9,44
3 22
,847
,899
L
iabi
litie
sD
ue to
ban
ks a
nd F
inan
cial
inst
itutio
ns41
5,82
8-
-88
5,24
9-
-1,
301,
077
Due
to c
usto
mer
s6,
756,
764
2,06
8,63
02,
450,
288
7,53
4,38
173
8,55
6-
19,5
48,6
19Tr
easu
ry b
ills s
old
unde
r rep
urch
ase
agre
emen
t-
252,
219
--
--
252,
219
Oth
er li
abili
ties
125,
810
--
--
-12
5,81
0Su
bord
inat
ed d
ebt
--
--
1,04
2-
1,04
2T
otal
7,29
8,40
22,
320,
849
2,45
0,28
88,
419,
630
739,
598
-21
,228
,767
Liq
uidi
ty r
isk
at 3
1 D
ecem
ber
2011
(31,
968)
(620
,654
)(5
46,3
28)
(4,1
21,3
16)
5,25
9,95
5 1,
679,
443
1,61
9,13
2 C
umul
ativ
e(3
1,96
8)(6
52,6
22)
(1,1
98,9
50)
(5,3
20,2
66)
(60,
311)
1,61
9,13
2 -
(c)
Mar
ket r
isk
The
Ban
k is
exp
osed
to th
e m
arke
t a r
isk
whe
neve
r th
e fa
ir va
lue
or f
utur
e ca
sh f
low
s of
a f
inan
cial
inst
rum
ent f
luct
uate
s be
caus
e of
cha
nges
in m
arke
t pric
es.
Mar
ket r
isks
aris
e fr
om o
pen
posi
tions
in in
tere
st ra
tes a
ndcu
rren
cy, a
ll of
whi
ch a
re e
xpos
ed to
gen
eral
and
spec
ific
mar
ket m
ovem
ents
and
cha
nges
in th
e le
vel o
f vo
latil
ity o
f mar
ket r
ates
or p
rices
such
as i
nter
est r
ates
, cre
dit s
prea
ds a
nd fo
reig
n ex
chan
ge ra
tes.
Cur
renc
y ri
skTh
e B
ank
is e
xpos
ed to
cur
renc
y ris
k th
roug
h tra
nsac
tions
in fo
reig
n cu
rren
cies
. Cur
renc
y ris
k is
the
risk
that
the
valu
e of
fina
ncia
l ins
trum
ents
will
fluc
tuat
e du
e to
ch
ange
s in
fore
ign
exch
ange
rate
s. Th
e B
ank
atte
mpt
s to
man
age
this
risk
by
clos
ing
daily
ope
n fo
reig
n cu
rren
cy p
ositi
ons a
nd b
y es
tabl
ishi
ng a
nd m
onito
ring
limits
on
ope
n po
sitio
ns. A
s th
e cu
rren
cy in
whi
ch th
e B
ank
pres
ents
it fi
nanc
ial s
tate
men
ts is
the
LEK
, the
Ban
k’s
finan
cial
sta
tem
ents
are
aff
ecte
dby
mov
emen
ts in
the
exch
ange
rate
s bet
wee
n th
e LE
K a
nd o
ther
cur
renc
ies.
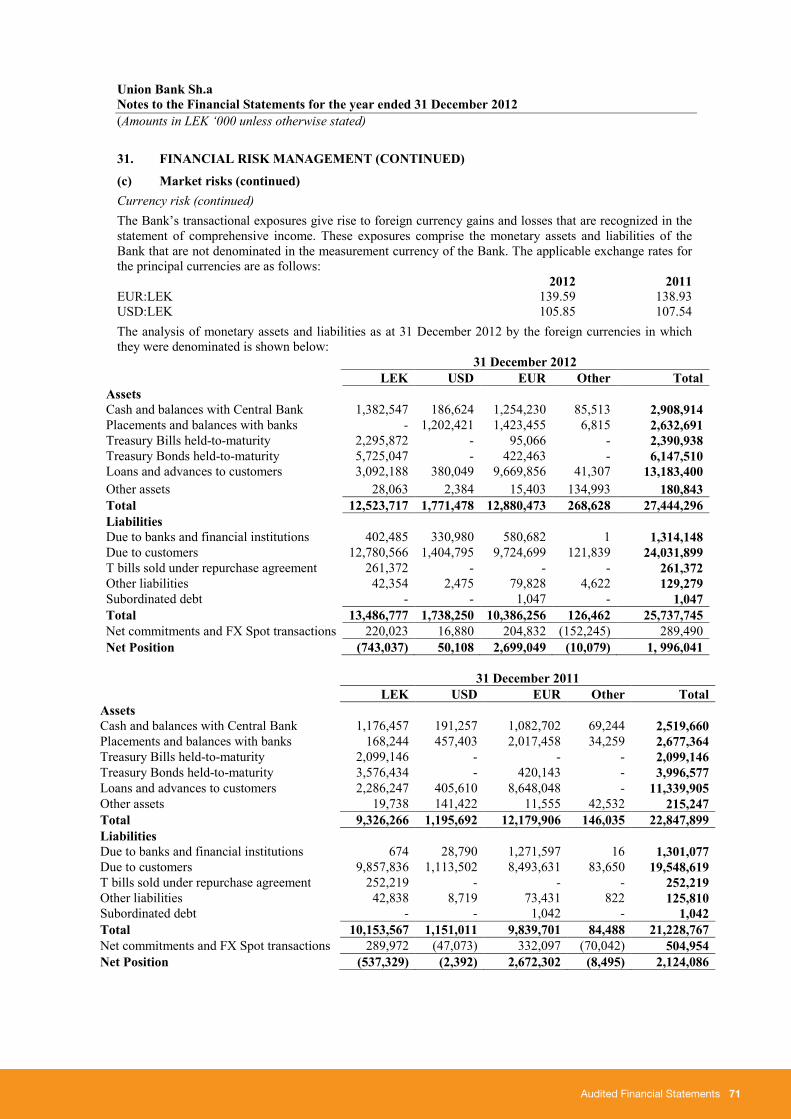
Audited Financial Statements 71
Union Bank Sh.aNotes to the Financial Statements for the year ended 31 December 2012 (Amounts in LEK ‘000 unless otherwise stated)
38
31. FINANCIAL RISK MANAGEMENT (CONTINUED)
(c) Market risks (continued)Currency risk (continued)The Bank’s transactional exposures give rise to foreign currency gains and losses that are recognized in the statement of comprehensive income. These exposures comprise the monetary assets and liabilities of the Bank that are not denominated in the measurement currency of the Bank. The applicable exchange rates for the principal currencies are as follows:
2012 2011EUR:LEK 139.59 138.93USD:LEK 105.85 107.54The analysis of monetary assets and liabilities as at 31 December 2012 by the foreign currencies in which they were denominated is shown below:
31 December 2012LEK USD EUR Other Total
AssetsCash and balances with Central Bank 1,382,547 186,624 1,254,230 85,513 2,908,914Placements and balances with banks - 1,202,421 1,423,455 6,815 2,632,691Treasury Bills held-to-maturity 2,295,872 - 95,066 - 2,390,938Treasury Bonds held-to-maturity 5,725,047 - 422,463 - 6,147,510Loans and advances to customers 3,092,188 380,049 9,669,856 41,307 13,183,400Other assets 28,063 2,384 15,403 134,993 180,843Total 12,523,717 1,771,478 12,880,473 268,628 27,444,296LiabilitiesDue to banks and financial institutions 402,485 330,980 580,682 1 1,314,148Due to customers 12,780,566 1,404,795 9,724,699 121,839 24,031,899T bills sold under repurchase agreement 261,372 - - - 261,372Other liabilities 42,354 2,475 79,828 4,622 129,279Subordinated debt - - 1,047 - 1,047Total 13,486,777 1,738,250 10,386,256 126,462 25,737,745Net commitments and FX Spot transactions 220,023 16,880 204,832 (152,245) 289,490Net Position (743,037) 50,108 2,699,049 (10,079) 1, 996,041
31 December 2011
LEK USD EUR Other TotalAssetsCash and balances with Central Bank 1,176,457 191,257 1,082,702 69,244 2,519,660Placements and balances with banks 168,244 457,403 2,017,458 34,259 2,677,364Treasury Bills held-to-maturity 2,099,146 - - - 2,099,146Treasury Bonds held-to-maturity 3,576,434 - 420,143 - 3,996,577Loans and advances to customers 2,286,247 405,610 8,648,048 - 11,339,905Other assets 19,738 141,422 11,555 42,532 215,247Total 9,326,266 1,195,692 12,179,906 146,035 22,847,899LiabilitiesDue to banks and financial institutions 674 28,790 1,271,597 16 1,301,077Due to customers 9,857,836 1,113,502 8,493,631 83,650 19,548,619T bills sold under repurchase agreement 252,219 - - - 252,219Other liabilities 42,838 8,719 73,431 822 125,810Subordinated debt - - 1,042 - 1,042Total 10,153,567 1,151,011 9,839,701 84,488 21,228,767Net commitments and FX Spot transactions 289,972 (47,073) 332,097 (70,042) 504,954Net Position (537,329) (2,392) 2,672,302 (8,495) 2,124,086

72 Audited Financial Statements
Union Bank Sh.aNotes to the Financial Statements for the year ended 31 December 2012 (Amounts in LEK ‘000 unless otherwise stated)
39
31. FINANCIAL RISK MANAGEMENT (CONTINUED)
(c) Market risks (continued)
Interest rate risk
Interest rate price risk is the risk that the value of a financial instrument will fluctuate due to changes in market interest rates relative to the interest rate that applies to the financial instrument. Interest rate cash flow risk is the risk that the interest cost will fluctuate over time. The Bank attempts to mitigate this risk by maintaining the Repricing Gap fully matched, so that both its assets and liabilities mature and re-price simultaneously. This limits the risk of the Bank becoming over-sensitive to interest rate changes.
The Bank’s interest rate gap as at 31 December 2012 is analyzed below. As at 31 December 2012, majority of the Bank’s short-term financial assets and liabilities, except for the loan portfolio, carry fixed interest rates. The majority of Bank’s loans and advances to customers, representing 58.5% (2011: 57%) of total assets in the statement of financial position, carry floating interest rates.
i. Effective yield information
The average effective yields of significant categories of financial assets and liabilities of the Bank were as follows:
Weighted average interest rateLEK USD EUR Other
2012 2011 2012 2011 2012 2011 2012 2011Assets:Statutory reserves 2.8% 3.325% - 0.09 % - 0.875% N/A N/APlacements and balances with banks N/A 4.78% 0.21% 0.70% 0.40% 0.56% N/A N/AInvestment securities 7.78% 7.82% N/A N/A 6.99% 7.50% N/A N/ALoans to customers 11.42% 12.01% 7.63% 7.80% 8.15% 8.16% 3.10% N/ALiabilities:Due to banks 4.03% N/A 1.36% N/A 3.57% 4.12% N/A N/ADue to customers 6.53% 6.62% 2.51% 1.99% 3.70% 4.43% 1.65% 0.99%T Bills under Repos 4.09% 5.48% N/A N/A N/A N/A N/A N/ASubordinated debt N/A N/A N/A N/A 2.10% 2.99% N/A N/A
ii. Interest rate repricing analysis
The following table presents the interest rate repricing dates for the Bank’s assets and liabilities. Variable-rate assets have been reported according to their next rate change date. Fixed-rate assets and liabilities have been reported according to their scheduled principal repayment dates.
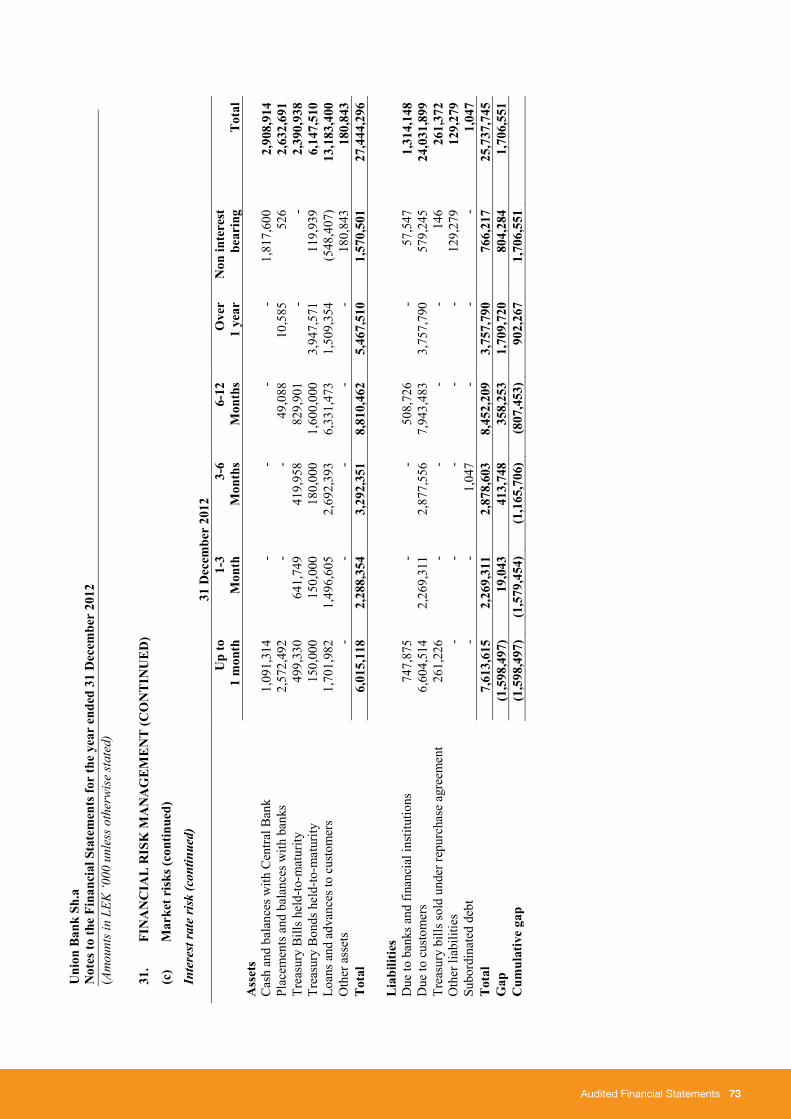
Audited Financial Statements 73
Uni
on B
ank
Sh.a
Not
es to
the
Fina
ncia
l Sta
tem
ents
for
the
year
end
ed 3
1 D
ecem
ber
2012
(A
mou
nts i
n LE
K ‘0
00 u
nles
s oth
erwi
se st
ated
)
40
31.
FIN
AN
CIA
L R
ISK
MA
NA
GE
ME
NT
(CO
NT
INU
ED
)
(c)
Mar
ket r
isks
(con
tinue
d)
Inte
rest
rate
risk
(con
tinue
d)31
Dec
embe
r20
12U
p to
1 m
onth
1-3
Mon
th3-
6M
onth
s6-
12M
onth
sO
ver
1 ye
arN
on in
tere
stbe
arin
gT
otal
Ass
ets
Cas
h an
d ba
lanc
es w
ith C
entra
l Ban
k1,
091,
314
-
-
--
1,81
7,60
0 2,
908,
914
Plac
emen
ts a
nd b
alan
ces w
ith b
anks
2,57
2,49
2 -
-49
,088
10
,585
52
6 2,
632,
691
Trea
sury
Bill
s hel
d-to
-mat
urity
499,
330
641,
749
419,
958
829,
901
--
2,39
0,93
8 Tr
easu
ry B
onds
hel
d-to
-mat
urity
150,
000
150,
000
180,
000
1,60
0,00
0 3,
947,
571
119,
939
6,14
7,51
0 Lo
ans a
nd a
dvan
ces t
o cu
stom
ers
1,70
1,98
2 1,
496,
605
2,69
2,39
3 6,
331,
473
1,50
9,35
4 (5
48,4
07)
13,1
83,4
00
Oth
er a
sset
s-
--
--
180,
843
180,
843
Tot
al6,
015,
118
2,28
8,35
4 3,
292,
351
8,81
0,46
2 5,
467,
510
1,57
0,50
1 27
,444
,296
Lia
bilit
ies
Due
to b
anks
and
fina
ncia
l ins
titut
ions
747,
875
-
-
508,
726
-57
,547
1,
314,
148
Due
to c
usto
mer
s6,
604,
514
2,26
9,31
1 2,
877,
556
7,94
3,48
3 3,
757,
790
579,
245
24,0
31,8
99
Trea
sury
bill
s sol
d un
der r
epur
chas
e ag
reem
ent
261,
226
-
-
--
146
261,
372
Oth
er li
abili
ties
--
--
-12
9,27
9 12
9,27
9 Su
bord
inat
ed d
ebt
--
1,04
7 -
--
1,04
7 T
otal
7,61
3,61
5 2,
269,
311
2,87
8,60
3 8,
452,
209
3,75
7,79
0 76
6,21
7 25
,737
,745
G
ap(1
,598
,497
)19
,043
41
3,74
8 35
8,25
3 1,
709,
720
804,
284
1,70
6,55
1 C
umul
ativ
e ga
p(1
,598
,497
)(1
,579
,454
)(1
,165
,706
)(8
07,4
53)
902,
267
1,70
6,55
1

74 Audited Financial Statements
Uni
on B
ank
Sh.a
Not
es to
the
Fina
ncia
l Sta
tem
ents
for
the
year
end
ed 3
1 D
ecem
ber
2012
(A
mou
nts i
n LE
K ‘0
00 u
nles
s oth
erwi
se st
ated
)
41
31.
FIN
AN
CIA
L R
ISK
MA
NA
GE
ME
NT
(CO
NT
INU
ED
)
(c)
Mar
ket r
isks
(con
tinue
d)
Inte
rest
rate
risk
(con
tinue
d)31
Dec
embe
r20
11U
p to
1 m
onth
1-3
Mon
th3-
6M
onth
s6-
12M
onth
sO
ver
1 ye
arN
on in
tere
stbe
arin
gT
otal
Ass
ets
Cas
h an
d ba
lanc
es w
ith C
entra
l Ban
k95
7,78
8-
--
-1,
561,
872
2,51
9,66
0Pl
acem
ents
and
bal
ance
s with
ban
ks2,
491,
344
-55
,572
90,3
055,
635
34,5
082,
677,
364
Trea
sury
Bill
s hel
d-to
-mat
urity
399,
234
486,
288
505,
244
708,
380
--
2,09
9,14
6Tr
easu
ry B
onds
hel
d-to
-mat
urity
300,
000
300,
000
150,
000
653,
571
2,51
5,17
677
,830
3,99
6,57
7Lo
ans a
nd a
dvan
ces t
o cu
stom
ers
1,25
0,87
81,
492,
901
2,14
8,11
55,
301,
020
1,54
1,93
1(3
94,9
40)
11,3
39,9
05O
ther
ass
ets
--
--
-21
5,24
721
5,24
7T
otal
5,39
9,24
42,
279,
189
2,85
8,93
16,
753,
276
4,06
2,74
21,
494,
517
22,8
47,8
99
Lia
bilit
ies
Due
to b
anks
and
fina
ncia
l ins
titut
ions
119,
573
--
874,
150
-30
7,35
41,
301,
077
Due
to c
usto
mer
s6,
533,
237
2,03
9,35
72,
410,
462
7,48
7,19
773
4,37
134
3,99
519
,548
,619
Trea
sury
bill
s sol
d un
der r
epur
chas
e ag
reem
ent
-25
1,05
0-
--
1,16
925
2,21
9O
ther
liab
ilitie
s-
--
--
125,
810
125,
810
Subo
rdin
ated
deb
t1,
042
--
--
-1,
042
Tot
al6,
653,
852
2,29
0,40
7 2,
410,
462
8,36
1,34
7 73
4,37
1 77
8,32
8 21
,228
,767
G
ap(1
,254
,608
)(1
1,21
8)44
8,46
9 (1
,608
,071
)3,
328,
371
716,
189
1,61
9,13
2 C
umul
ativ
e ga
p(1
,254
,608
)(1
,265
,826
)(8
17,3
57)
(2,4
25,4
28)
902,
943
1,61
9,13
2

Audited Financial Statements 75
Union Bank Sh.aNotes to the Financial Statements for the year ended 31 December 2012 (Amounts in LEK ‘000 unless otherwise stated)
42
31. FINANCIAL RISK MANAGEMENT (CONTINUED)
(c) Market risks (continued)
Sensitivity analyses
The sensitivity analysis below have been determined based on the exposure to interest rates at the reporting date and the stipulated change taking place at the beginning of the financial year and held constant throughout the reporting period. The following is a stipulation of effects of changes in interest rate in the net profit, assuming all the other variables are held constant:
31 December 2012 31 December 2011Interest rate increases by 2% 18,045 18,059 Interest rate increases by 1.5% 13,534 13,544 Interest rate increases by 1% 9,023 9,029 Interest rate decreases by 1% (9,023) (9,029)Interest rate decreases by 1.5% (13,534) (13,544) Interest rate decreases by 2% (18,045) (18,059)
The sensitivity rate, used when reporting foreign currency risk internally to key management personnel,represents management’s assessment of the reasonably possible change in foreign exchange rates based on information available after the balance sheet date. The sensitivity analysis includes only outstanding foreign currency denominated monetary items and adjusts their translation at the period end for the change in exchange rates as described above.
Below is a stipulation of effects of changes in exchange rates in the net profit, assuming that all the other variables are held constant:
31 December 2012 31 December 2011Lek depreciates by 5% 136,954 133,071 Lek appreciates by 5% (136,954) (133,071)
(d) Operational risk
The operational risk is incurred on the delivery of all of the bank’s products and services and arises on a daily basis as transactions are being processed. It may occur also as a result of inadequate information systems, technology failures, breaks of internal controls, and fraud or unforeseen catastrophes.
To cover for operational risk, the Bank has established a framework that incorporates clear definitions of operational risk throughout the organization, and a philosophy of business processes self-assessment. It has also developed, and is actively monitoring, the performance of key risk indicators.
The Bank’s Operational Risk Committee (ORC) is periodically monitoring the occurrences of operational losses and has assigned responsibilities for mitigating losses and providing back-up solutions and risk coverage for activities subject to operational risk.

76 Audited Financial Statements
Union Bank Sh.aNotes to the Financial Statements for the year ended 31 December 2012 (Amounts in LEK ‘000 unless otherwise stated)
43
32. DISCLOSURE AND ESTIMATION OF FAIR VALUE
Fair value estimates are based on existing financial instruments on the bank’s financial position statementwithout attempting to estimate the value of anticipated future business and the value of assets and liabilities not considered financial instruments.
The table below summarizes the carrying amounts and fair values of financial assets and liabilities.
As at 31 December 2012 As at 31 December 2011Carrying
amount Fair valueCarrying
amount Fair valueFinancial assetsTreasury Bills held-to-maturity 2,390,938 2,393,327 2,099,146 2,102,136Placements and balances with banks 2,632,691 2,632,691 2,677,364 2,677,364Loans and advances to customers 13,183,400 13,183,400 11,339,905 11,339,905Treasury Bonds held-to-maturity 6,147,510 6,200,044 3,996,577 3,992,917
Financial liabilitiesDue to other banks and financial institutions 1,314,148 1,302,274 1,301,077 1,279,073Due to customers 24,031,899 23,442,439 19,548,619 20,464,416Treasury bills sold under repurchase agreement 261,372 261,372 252,219 252,219Subordinated debt 1,047 1,047 1,042 1,042
Treasury Bills held-to-maturity
Treasury Bills held-to-maturity include treasury bills issued by Government which are bought with the intention to hold them till maturity. Since no active market exists for treasury bills, the fair value has been estimated using a discounted cash flow model based on a current yield curve appropriate for the remaining term to maturity.
Placements and balances with banks
Due from other banks include inter-bank placements and items in the course of collection. As loans, advances and overnight deposits are short term and at floating rates, their fair value is considered to equate to their carrying amount.
Loans and advances to customers
Loans and advances are net of allowances for impairment. The Bank’s loan portfolio has an estimated fair value approximately equal to its book value due either to their short term nature or to underlying interest rates which approximate market rates. The majority of the loan portfolio is subject to re-pricing within a year.
Treasury Bonds held-to-maturity
Treasury Bonds held-to-maturity include treasury bonds issued by Government which are bought with the intention to hold them till maturity. Since no active market exists for treasury bonds, the fair value has been estimated using a discounted cash flow model based on a current yield curve appropriate for the remaining term to maturity.
Due to banks and financial institutions
Due to banks and financial institutions have an estimated fair value approximately equal to its book value due either to their short term nature or to underlying interest rates which approximate market rates.
Due to customers
The estimated fair value of deposits with no stated maturity, which include non-interest bearing deposits, is the amount repayable on demand.

Audited Financial Statements 77
Union Bank Sh.aNotes to the Financial Statements for the year ended 31 December 2012 (Amounts in LEK ‘000 unless otherwise stated)
44
33. CAPITAL MANAGEMENT
Regulatory capital
The Bank monitors the adequacy of its capital using, among other measures, the rules and ratios established by the Albanian regulator, the Bank of Albania (“BoA”), which ultimately determines the statutory capital required to underpin its business. The regulation “On capital adequacy” is issued pursuant to Law No. 8269 date 23.12.1997 "On the Bank of Albania", and Law No. 8365 date 02.07.1998 "Banking Law of the Republic of Albania".
Capital Adequacy Ratio
The Capital Adequacy Ratio is the proportion of the regulatory capital to risk weighted assets and off balance-sheet items, expressed as a percentage. The minimum required Capital Adequacy Ratio is 12%.
The Modified Capital Adequacy Ratio is the proportion of the base capital to risk-weighted assets and off balance-sheet items, expressed as a percentage. The minimum modified capital adequacy is 6%.
Risk-Weighted Assets (RWAs)
Assets are weighted according to broad categories of notional risk, being assigned a risk weighting according to the amount of capital deemed to be necessary to support them. Five categories of risk weights (0%, 20%, 50%, 100%, 150%) are applied; for example cash and money market instruments have a zero risk weighting which means that no capital is required to support the holding of these assets. Property and equipment carries a 100% risk weighting, meaning that it must be supported by capital equal to 12% of the carrying amount.
Off-balance-sheet credit related commitments are taken into account. The amounts are then weighted for risk using the same percentages as for on-balance-sheet assets.
The Bank’s policy is to maintain a strong capital base so as to sustain future development of the business and to maintain market confidence. The impact of the level of capital on future shareholders’ return is also recognized and the Bank recognizes the need to maintain a balance between the higher returns that might be possible with greater gearing within regulatory and prudential limits and the advantages and security afforded by a sound capital position.
Although the Bank continues to have accumulated losses, it has realized profit in the last three years and expects to continue realizing profits.
The Bank monitors all externally imposed capital requirements throughout the period and anticipates future needs on an ongoing basis. A capital contribution of EUR 1,000 thousand was made on 26 March 2013 (see note 34). Furthermore, the Management expects future capital contributions of EUR 1,500 thousand during the year 2013, in order to support the banking activities and comply with the requirements of the Bank of Albania. The financial statements for the year ended 31 December 2012 for regulatory purposes have not been finalized at the date of approval of these financial statements.
34. EVENTS AFTER THE REPORTING DATE
A capital contribution of EUR 1,000 thousand was made by UFT on 26 March 2013 (see note 19).
There are no other events after the reporting date that would require either adjustments or additional disclosures in the financial statements.

78 Audited Financial Statements