2012 2016 corporate-plan_summary_feb_7_e
DESCRIPTION
Canada Corporate Plan 2012-2016 , great for tourism professionals building strategies for destinations.TRANSCRIPT
2012-2016 corporate plan summary 1
Harnessing innovation and alignment2012-2016 corporate plan summary
Calg
ary
, A
lbert
a

2 2012-2016 corporate plan summary
Canadian Tourism Commission corporate plan 2012-2016
Print: Iu83-3/2012E
PDF: Iu83-3/2012E-PDF
Table of contentsMessage from the President & CEO 1
Executive summary 3
Part 1: Our role 8
1.1 Corporate profi le 8
1.2 Supporting tourism in Canada 10
1.3 Selling Canada abroad 10
1.4 Path to purchase model 11
1.5 Standing out from the competition 12
1.6 Canada’s unique selling propositions 13
1.7 Fostering innovation 14
1.8 Generating results 15
Part 2: Our world 16
2.1 Industry environment 16
2.2 Opportunities 19
2.3 Challenges 23
2.4 Federal priorities 27
Part 3: Our plan 28
3.1 Strategy framework 28
3.2 Objectives 29
3.3 Priorities 32
3.4 Risks 41
Part 4: Measuring performance 43
Part 5: Our fi nancial plan 49
Appendix 59

4 2012-2016 corporate plan summary
Calg
ary
, A
lbert
a

2012-2016 corporate plan summary 1
Tourism is big business for Canada – over $73 billion a year, with
an export value exceeding the aerospace, fi nancial services, and
computer and information services sectors. It’s our No. 7 source
of money from outside of Canada and growing fast. And tourist
spending creates nearly 600,000 jobs for Canadians.
It’s also a trillion dollar global business – tourists spend three
billion dollars a day, or two million dollars a minute. That means
it’s intensely competitive and in constant fl ux. A shift in a country’s
economy, a new cultural trend, a destabilizing political event, a
pandemic, or an earthquake are just a few things that can radically
change who goes where to spend those billions in travel dollars that
are up for grabs every year.
To win in this business a national tourism organization has to read
the market trends before anyone else, adopt the best marketing and
national branding techniques and embrace a constantly evolving
strategic vision to get the edge on tomorrow’s tourism trends.
In planning the Canadian Tourism Commission’s (CTC) corporate strategy for the 2012-2016 period, we have
focused on alignment and innovation. These twin priorities, we believe, are critical as we go head to head with
new destinations offering exotic tourism experiences and who are focused on growing their share of the tourism
business. Tourism marketing abroad is already a fi ercely competitive business with variables we can’t control…
we must work smarter than our competitors.
Innovation
Innovation has been a cornerstone of our work at the CTC and is at the heart of our corporate business plan
going forward to help us gain a competitive advantage.
We create programs to showcase excellence in Canadian tourism, by “pulling” or inspiring tourism businesses
to strengthen their spirit of innovation and entrepreneurial attitude to support development of new tourism
products and business practices that, in turn, increase Canada’s competitiveness in the world.
Our recently launched Signature Experiences Collection® is an example of such an innovative program – the
latest phase of our global strategy to make Canada stand-out from the competition. The qualifying members of
the Collection offer exceptional tourism experiences that are aligned with Canada’s strong tourism brand, and
reflect the kind of authentic experiences that CTC research says our high-spend customers look for when they
choose a vacation destination.
The CTC will draw on the Collection’s expanding pool of high-quality tourism experiences in our marketing
campaigns, enhancing awareness of our country, increasing our share of international visitors and generating
greater revenues from abroad for Canada. At the same time, the program raises the bar for tourism businesses
and offers a wide range of tools to help them meet the high standard that is required to compete in the
international marketplace.
In May 2010, the Public Policy Forum organized an event called Innovation Next, bringing together leaders
from across disciplines to discuss how to foster a deeper culture and practice of innovation in Canada for a
more productive economy and sustained prosperity. There was agreement that, above all, what is needed is
Message from the President & CEO

2 2012-2016 corporate plan summary
leadership from within each sector, with key players stepping forward to provide the vision, policy alignment
and support for innovators to thrive. The CTC will support the Innovation Next agenda by actively providing
leadership for innovation in Canada’s tourism and marketing sectors.
Alignment
In Canada, we face challenges of fragmentation in the tourism landscape. The panorama is a dizzying collection
of interests – destination marketing organizations, regional marketing organizations and provincial and territorial
marketing organizations are the better-known players, but governance and funding changes are adding new
levels of complexity.
It’s counter-productive for Canadian destinations to think of the guys next door as our competitors. We do have
tough competitors, but they’re not on our home turf. They’re in those international markets in which the CTC
invests. Long-standing rivalries, duplication of efforts and overlapping roles cause confusion in the domestic
marketplace.
We have an admirable history of successful tourism partnerships in Canada, but we need to harmonize the
overall marketing system so we’re not working at cross purposes and to focus on how we can best use the
power of our resources to outsmart the competition for the best return on our investment.
The customer journey to making a decision to buy something follows along the same path-to-purchase for any
product, tourism experiences included. In the travel industry, we can track consumers from the moment they
fi rst hear about our destination to the actual point of booking a trip. It’s a great model to start the discussion
about where the many tourism players fi t along this pathway.
This thinking about roles helped the CTC make a decision last year to invest only in those markets and activities
where the Canada tourism brand leads. In those 11 markets, we have now defi ned our particular role as
building a strong brand and creating awareness of compelling Canadian travel experiences. The industry and
destinations will then take over their own roles to close the sale. We’re all part of an ecosystem in which we
need to play to our natural strengths.
In addition to a strong focus on roles, and as a feature of the corporate plan, we’ve committed to work within
our sphere of infl uence and encourage clarity around roles. And we’ll do so by pursuing a number of priorities:
We’ll act to align federal support for international tourism marketing with Canada’s tourism brand; promote
common return-on-investment measures for international marketing activities; communicate the CTC’s
marketing strategy more effectively; encourage discussions around respective roles; and build awareness
that competitive behavior between individual Canadian destinations in the international marketplace hurts our
effectiveness.
In addition, we’ll continue to seek to coordinate how Canadian tourism marketing organizations approach
customers abroad and work with the Tourism Industry Association of Canada to ensure that all players active in
international marketing understand the policy landscape and advocacy priorities.
We can outsmart the competition, and focusing on our dual priorities of alignment and innovation presents us a
path to success.
Keep exploring!
Michele McKenzie
2012-2016 corporate plan 3
The Canadian Tourism Commission’s Corporate Plan is an annual fi ve-year rolling strategic plan submitted to
the Government of Canada. This Corporate Plan for 2012-2016 outlines our:
• corporate objectives and strategic priorities;
• performance measurements; and
• forecasted fi nancial statements.
Canada’s national tourism marketing organization
The Canadian Tourism Commission (CTC) is a federal Crown corporation wholly owned by the Government of
Canada. As set out in the Canadian Tourism Commission Act, our purpose is to sustain a vibrant and profi table
tourism industry by supporting a cooperative relationship between the private sector and the governments of
Canada, the provinces and the territories. We promote Canada as an internationally competitive, premier four-
season tourism destination where travellers have access to extraordinary experiences. We provide a consistent
voice for Canada in the international tourism marketplace.
The immediate benefi ciary of our activity is Canada’s tourism industry which represents $73.4 billion in annual
revenues. Over 157,000 tourism-related businesses1 contribute some 594,500 jobs2 to the Canadian economy.
The industry has long recognized the value of CTC marketing programs and works with us through public-
private partnerships. Our target is for partner contributions to match our federal funding at a 0.6:1 ratio.
Opportunities and tough competition ahead
Opportunities abound for the Canadian tourism industry. Tourism remains one of the fastest-growing industries,
and there is seldom a lag in the recovery of tourism spending when economic activity increases. In fact, typically
a direct correlation between economic activity and tourism spending can be seen, with tourism spending often
recovering at a slightly higher pace.
1 Statistics Canada, Income and Expenditure Division, Special Tabulation, 2011.
2 National Tourism Indicators, Quarterly Estimates, Statistics Canada, 2011 Q1.
Executive summary
Calg
ary
, A
lbert
a
4 2012-2016 corporate plan summary
1990-5
0
5
10
15
20
25
% y
ear
1994 1998 2002 2006 2010
International Tourism Spending (US$)
World GDP (US$)
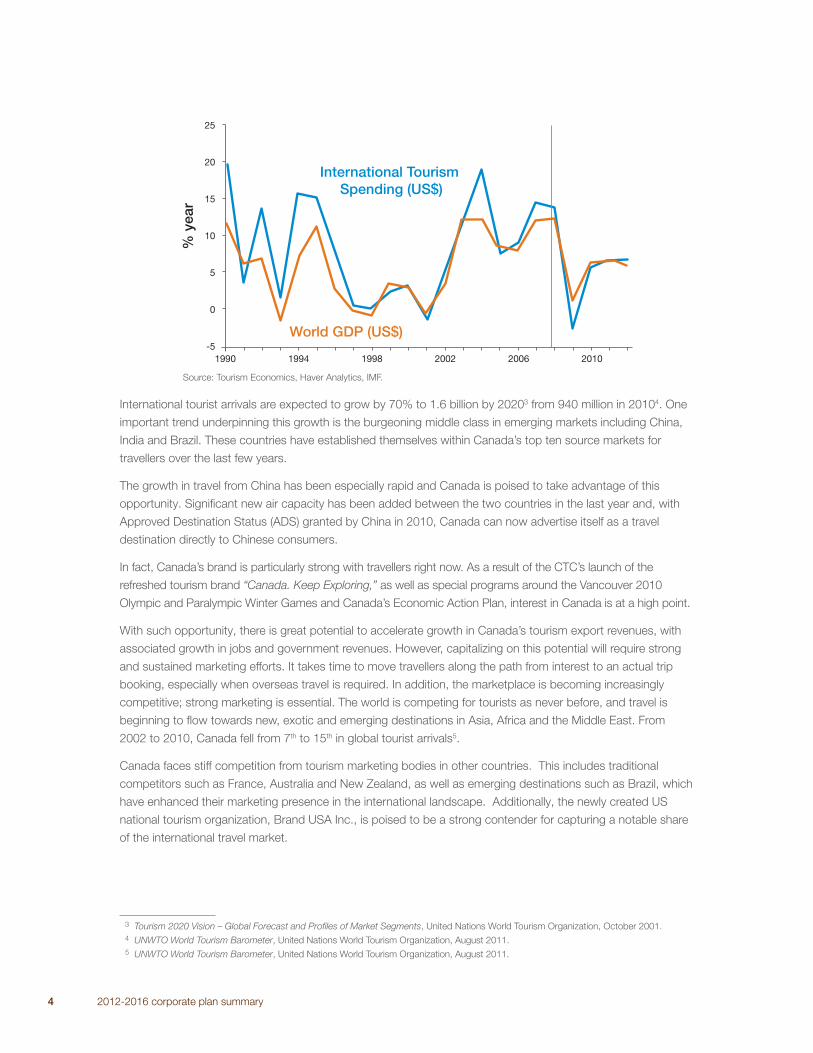
International tourist arrivals are expected to grow by 70% to 1.6 billion by 20203 from 940 million in 20104. One
important trend underpinning this growth is the burgeoning middle class in emerging markets including China,
India and Brazil. These countries have established themselves within Canada’s top ten source markets for
travellers over the last few years.
The growth in travel from China has been especially rapid and Canada is poised to take advantage of this
opportunity. Signifi cant new air capacity has been added between the two countries in the last year and, with
Approved Destination Status (ADS) granted by China in 2010, Canada can now advertise itself as a travel
destination directly to Chinese consumers.
In fact, Canada’s brand is particularly strong with travellers right now. As a result of the CTC’s launch of the
refreshed tourism brand “Canada. Keep Exploring,” as well as special programs around the Vancouver 2010
Olympic and Paralympic Winter Games and Canada’s Economic Action Plan, interest in Canada is at a high point.
With such opportunity, there is great potential to accelerate growth in Canada’s tourism export revenues, with
associated growth in jobs and government revenues. However, capitalizing on this potential will require strong
and sustained marketing efforts. It takes time to move travellers along the path from interest to an actual trip
booking, especially when overseas travel is required. In addition, the marketplace is becoming increasingly
competitive; strong marketing is essential. The world is competing for tourists as never before, and travel is
beginning to fl ow towards new, exotic and emerging destinations in Asia, Africa and the Middle East. From
2002 to 2010, Canada fell from 7th to 15th in global tourist arrivals5.
Canada faces stiff competition from tourism marketing bodies in other countries. This includes traditional
competitors such as France, Australia and New Zealand, as well as emerging destinations such as Brazil, which
have enhanced their marketing presence in the international landscape. Additionally, the newly created US
national tourism organization, Brand USA Inc., is poised to be a strong contender for capturing a notable share
of the international travel market.
3 Tourism 2020 Vision – Global Forecast and Profi les of Market Segments, United Nations World Tourism Organization, October 2001.
4 UNWTO World Tourism Barometer, United Nations World Tourism Organization, August 2011.
5 UNWTO World Tourism Barometer, United Nations World Tourism Organization, August 2011.
Source: Tourism Economics, Haver Analytics, IMF.
2012-2016 corporate plan summary 5
Gaining advantage through alignment and innovation
To focus marketing resources, the industry must work smarter. Two important drivers of our strategy are
alignment and innovation.
Canada has a fragmented tourism marketing structure: marketing organizations from the national, provincial,
territorial and municipal levels have overlapping mandates. This results in the potential duplication of efforts and
players working at cross purposes. Clarity of organizational roles, coupled with enhanced alignment of efforts,
is needed to ensure we are all working towards the same strategic goals and communicating under a single,
strong brand.
Innovation is another key to staying competitive, and has been an essential foundation for our work at the
CTC. We look to new research methods, ideas, technology and media to keep our message fresh and relevant
to consumers, and to gain a competitive advantage. In the tourism industry in general, there is a need to
encourage innovation and entrepreneurism to support the development of new tourism products and business
practices. In 2010, and in an effort to advance this alignment imperative, the CTC introduced the “role of the
Canada brand” when making decisions about markets in which to invest. As a result, we now invest only in
those markets where partners are prepared to invest under the Canada brand (rather than leading with their
own brands). The CTC will continue to provide leadership to the industry to help harness the full power of our
collective marketing resources and compete internationally at top strength.
These two goals of alignment and innovation are key priorities for our 2012-2016 Corporate Plan.
The CTC’s 2012-2016 corporate objectives and strategic priorities
In support of our overarching strategic goal of growing tourism export revenues for Canada, we will pursue the
following two corporate objectives:
Increase demand for Canada’s visitor economy
• Generate wealth for Canadians by focusing on both short-term and long-term potential for maximizing return
on investment as markets mature and evolve.
• Engage in effective tourism marketing, promotions and market development activities supported by market
research with the aim to support the achievement of Canada’s national tourism revenue goal of $100 billion
by 2015.
Focus on markets where Canada’s tourism brand leads and which yield the highest return on
investment
• Concentrate on those geographic markets or consumer market segments where Canada’s tourism brand
leads and which hold the highest potential for return on investment.
• Convert high-yield customers by investing in appropriate communication channels based on insights from
customer segmentation research and the path-to-purchase model.
6 2012-2016 corporate plan summary
These four strategic priorities for action form the framework for how we will achieve our corporate objectives:
Ensure customer relevancy and differentiate Canada
• Develop and maintain relevant communication with targeted potential travellers and ensure that the received
marketing messaging addresses their interests and expectations as consumers.
• Position Canada’s tourism brand as a leading experiential brand where travellers create extraordinary stories
all their own.
Advance a culture of innovation and entrepreneurial development among tourism businesses
• Work with the industry to foster the development and adoption of new tourism products and business
practices.
• Aim to be recognized as one of the most innovative tourism marketing organizations in the world by adopting
new tools and technology, using world-class research and cutting edge multimedia marketing to keep
Canada front-of-mind internationally.
Lead industry in international brand alignment and consistency
• Provide a unifi ed voice internationally and drive alignment in key source markets.
• Facilitate international marketplace access for brand-aligned Canadian small and medium-sized enterprises
(SMEs) with export-ready consumer products.
Foster organizational excellence
• Be a “strategy-focused organization” with the right tools, people and resources in place to deliver.
• Focus on continuing to be a lean and scalable organization.
2012-2016 corporate plan summary 7
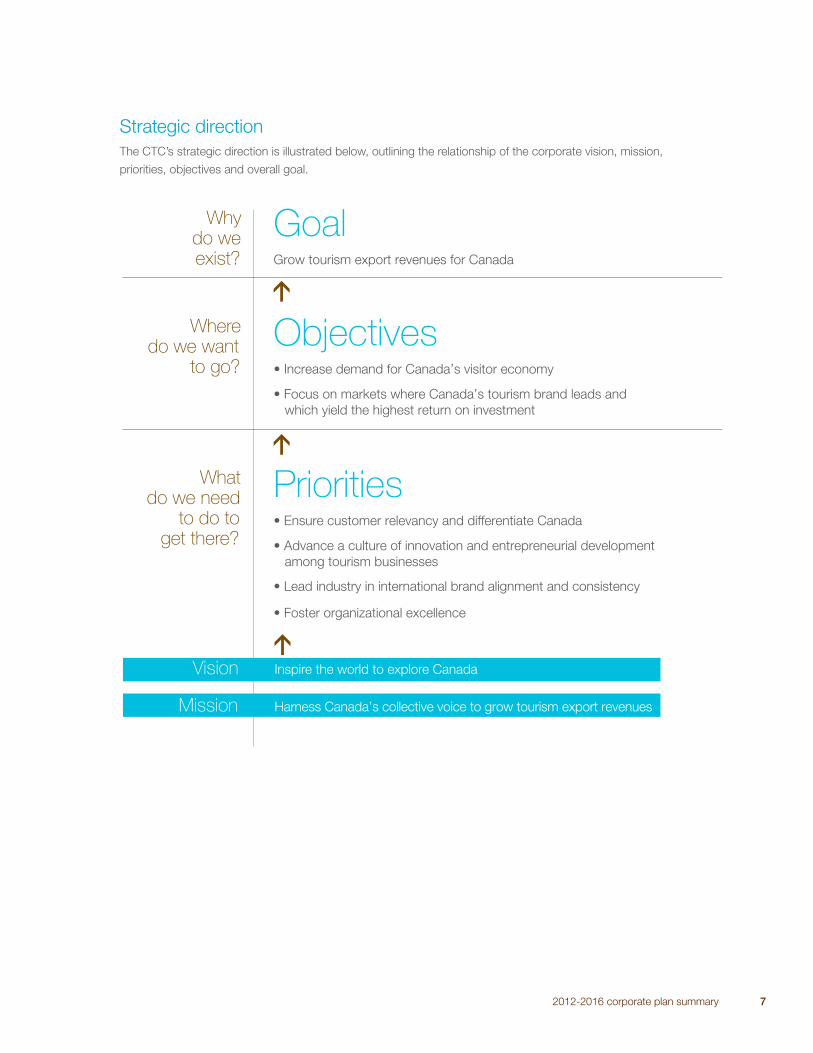
Strategic direction
The CTC’s strategic direction is illustrated below, outlining the relationship of the corporate vision, mission,
priorities, objectives and overall goal.
GoalGrow tourism export revenues for Canada
Objectives
Priorities
Why do we exist?
Where do we want
to go?
What do we need
to do to get there?
Vision
Mission
r re Canada
8 2012-2016 corporate plan summary
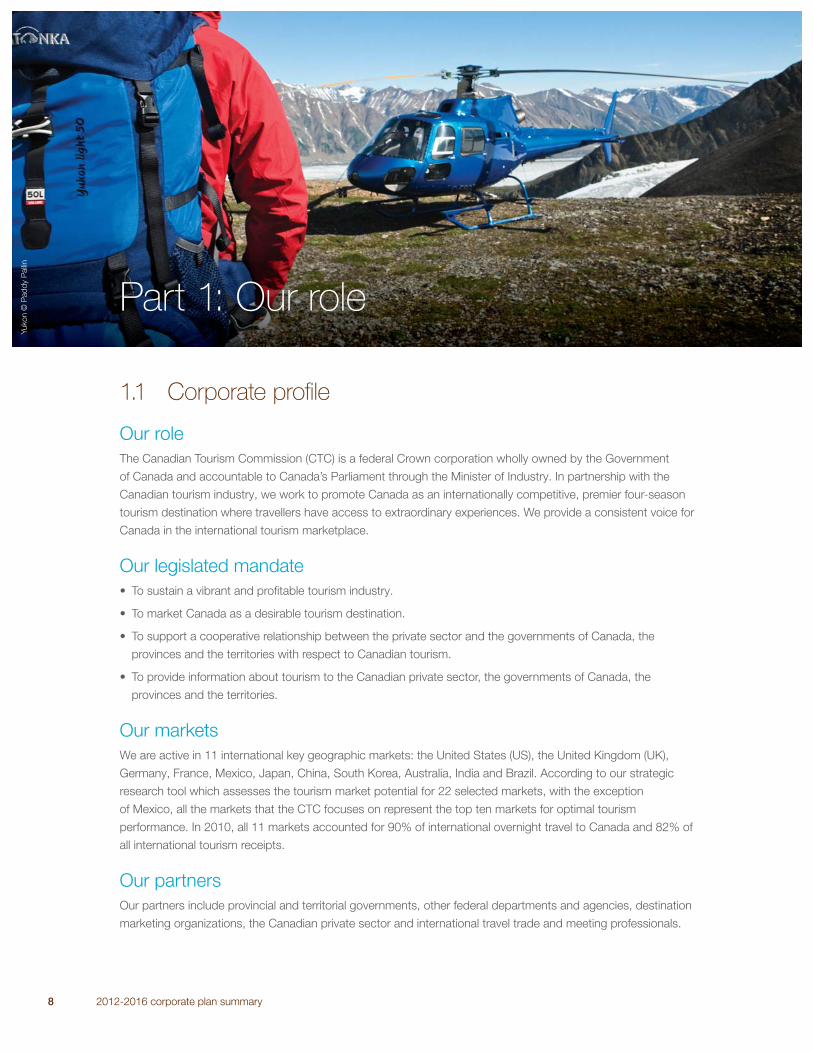
1.1 Corporate profi le
Our role
The Canadian Tourism Commission (CTC) is a federal Crown corporation wholly owned by the Government
of Canada and accountable to Canada’s Parliament through the Minister of Industry. In partnership with the
Canadian tourism industry, we work to promote Canada as an internationally competitive, premier four-season
tourism destination where travellers have access to extraordinary experiences. We provide a consistent voice for
Canada in the international tourism marketplace.
Our legislated mandate
• To sustain a vibrant and profi table tourism industry.
• To market Canada as a desirable tourism destination.
• To support a cooperative relationship between the private sector and the governments of Canada, the
provinces and the territories with respect to Canadian tourism.
• To provide information about tourism to the Canadian private sector, the governments of Canada, the
provinces and the territories.
Our markets
We are active in 11 international key geographic markets: the United States (US), the United Kingdom (UK),
Germany, France, Mexico, Japan, China, South Korea, Australia, India and Brazil. According to our strategic
research tool which assesses the tourism market potential for 22 selected markets, with the exception
of Mexico, all the markets that the CTC focuses on represent the top ten markets for optimal tourism
performance. In 2010, all 11 markets accounted for 90% of international overnight travel to Canada and 82% of
all international tourism receipts.
Our partners
Our partners include provincial and territorial governments, other federal departments and agencies, destination
marketing organizations, the Canadian private sector and international travel trade and meeting professionals.
Part 1: Our role
Yukon ©
Pad
dy P
allin
2012-2016 corporate plan summary 9
Our funding
The CTC is largely funded through appropriations, currently at about $72 million per year. In order to increase
the impact of the government’s investment in Canada’s tourism marketing, the CTC actively partners with
industry to develop marketing programs and leverages cash and in-kind partner contributions at a target ratio
of 0.6:1.
Our leadership
Currently, a 12-member Board of Directors governs the CTC. Its role is to provide stewardship and strategic
direction. The Governor in Council (GIC) appoints the Chair of the Board, as well as the President & Chief
Executive Offi cer (CEO). Appointments of the other directors are made by the Minister of Industry with the
approval of the Governor in Council and are based on the full range of skills and competencies required to
provide effective oversight.
Our values
Innovation, collaboration and respect.
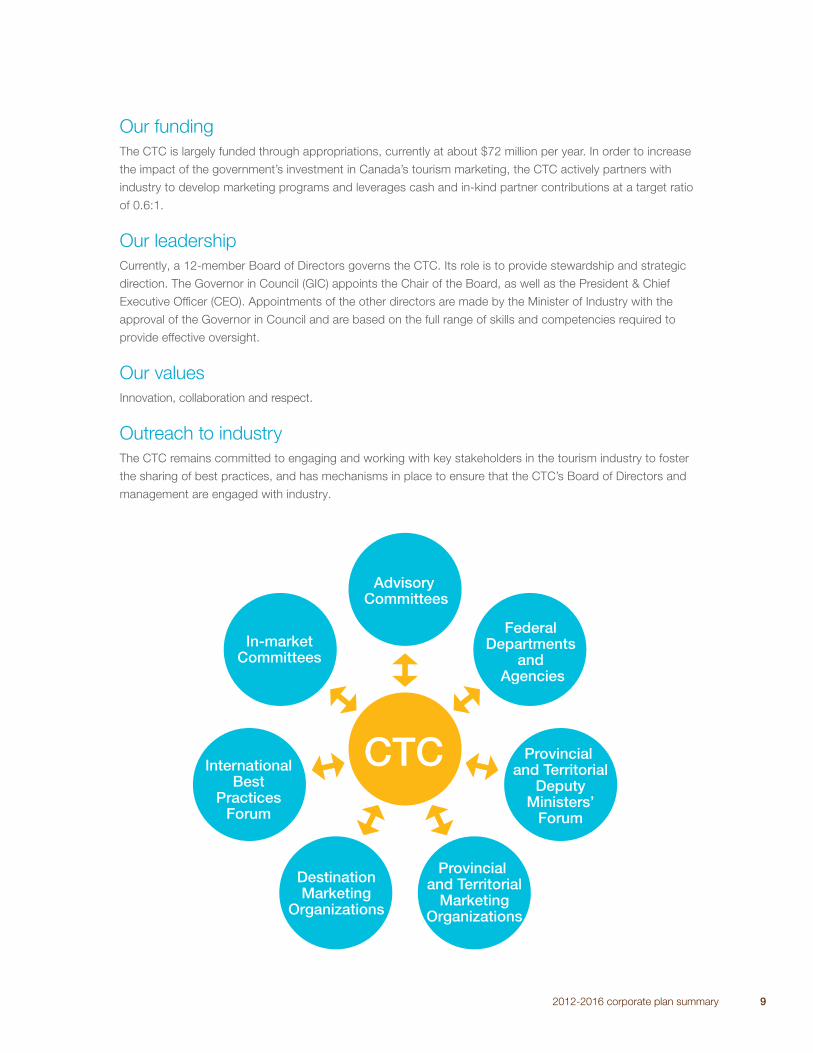
Outreach to industry
The CTC remains committed to engaging and working with key stakeholders in the tourism industry to foster
the sharing of best practices, and has mechanisms in place to ensure that the CTC’s Board of Directors and
management are engaged with industry.
CTC
Advisory Committees
DestinationMarketing
Organizations
Federal Departments
and Agencies
In-marketCommittees
Provincial and Territorial
DeputyMinisters’
Forum
InternationalBest
PracticesForum
Provincial and Territorial
MarketingOrganizations
10 2012-2016 corporate plan
1.2 Supporting tourism in Canada
Representing approximately 1.9% of Canada’s Gross Domestic Product (GDP)6, tourism is big business
for Canada, with an export value exceeding each of the aerospace, fi nancial services and computer and
information services sectors. In 2010, the total value of tourism in Canada was $73.4 billion; government
revenues generated by tourism amounted to an estimated $20.1 billion.
Tourism generates export revenues (any item sold to an international tourist is considered an export) and
is a signifi cant component of Canada’s exports. In 2010, export tourism brought in nearly $15 billion to the
Canadian economy.
The benefi ts of tourism are widespread across the country, with the ultimate benefi ciary being the Canadian
taxpayer. In addition to drawing in international money, tourism provides work for thousands of Canadians.
In June 2011, there were over 157,000 tourism-related businesses in Canada providing services in the areas
of accommodation (i.e. hotels), food and beverage (i.e. restaurants), recreation and entertainment (i.e. boat
rentals), transportation and travel (i.e. travel agency), equating to some 594,500 jobs in communities from coast
to coast to coast. Many of these businesses are small and medium-sized enterprises (SMEs), operating in
communities large and small in every province and territory of Canada. They are often considered the economic
backbone of their communities as they deliver strong economic, social and cultural benefi ts to Canadians in
both urban and rural areas.
In addition to stimulating revenue growth and jobs for the Canadian economy, tourism contributes to the quality
of life in Canada through public and private investments in parks, transportation infrastructure, attractions,
events and event facilities.
1.3 Selling Canada abroad
Over the past decade, there has been a dramatic shift in the profi le of travellers. The relatively strong Canadian
economic environment over the last decade has been conducive to Canadians discovering more of their own
country. As a result, currently 80% of tourism revenue is derived from domestic travellers, up from 65% a
decade ago. At the same time, decreases in inbound international export revenue, largely fuelled by a series of
shocks (i.e. SARS, global recession, earthquake), hindered long-haul travel arrivals from our target markets. This
has contributed to the rise in share of domestic travel. As would be the case for any industry, relying on 80+%
of revenue from the domestic market is unlikely to facilitate healthy growth opportunities for Canadian tourism
businesses, particularly given the anticipated expansion of international tourism arrivals globally over the next
several years as projected by the United Nations World Tourism Organization (UNWTO).
Therefore, Canada needs to stimulate international visitation. Tourism marketing plays a critical role in achieving
this. World travellers are increasingly aware of countries as destination choices, rather than sub-national entities
such as provinces or regions, as illustrated in the chart on the following page.
6 National Tourism Indicators, Quarterly Estimates, Statistics Canada, 2011 Q1.
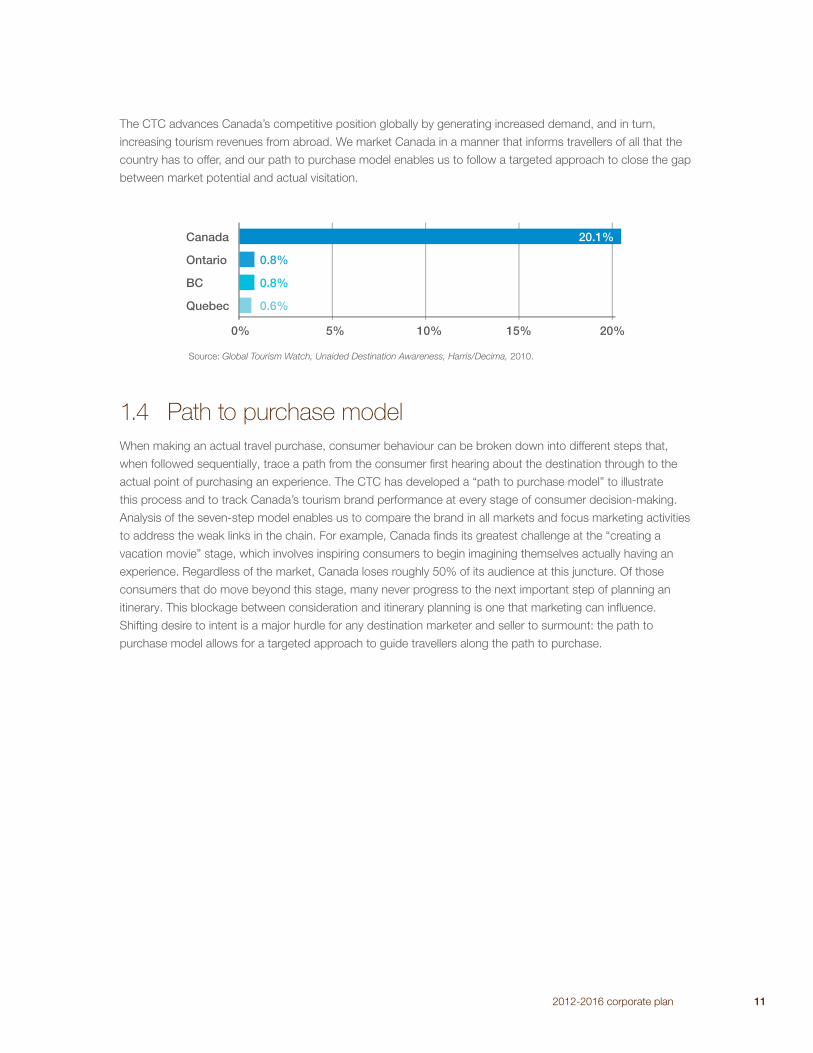
The CTC advances Canada’s competitive position globally by generating increased demand, and in turn,
increasing tourism revenues from abroad. We market Canada in a manner that informs travellers of all that the
country has to offer, and our path to purchase model enables us to follow a targeted approach to close the gap
between market potential and actual visitation.
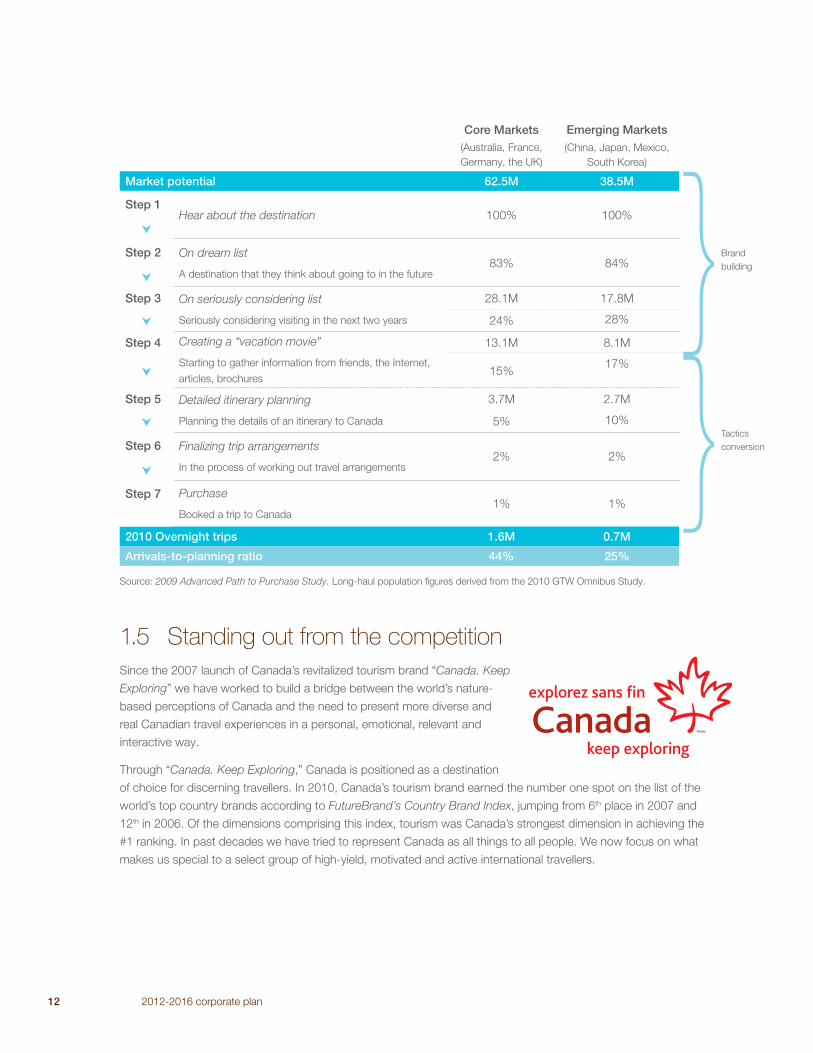
1.4 Path to purchase model
When making an actual travel purchase, consumer behaviour can be broken down into different steps that,
when followed sequentially, trace a path from the consumer fi rst hearing about the destination through to the
actual point of purchasing an experience. The CTC has developed a “path to purchase model” to illustrate
this process and to track Canada’s tourism brand performance at every stage of consumer decision-making.
Analysis of the seven-step model enables us to compare the brand in all markets and focus marketing activities
to address the weak links in the chain. For example, Canada fi nds its greatest challenge at the “creating a
vacation movie” stage, which involves inspiring consumers to begin imagining themselves actually having an
experience. Regardless of the market, Canada loses roughly 50% of its audience at this juncture. Of those
consumers that do move beyond this stage, many never progress to the next important step of planning an
itinerary. This blockage between consideration and itinerary planning is one that marketing can infl uence.
Shifting desire to intent is a major hurdle for any destination marketer and seller to surmount: the path to
purchase model allows for a targeted approach to guide travellers along the path to purchase.
2012-2016 corporate plan 11
Canada
Ontario
BC
Quebec
0.8%
0.8%
0.6%
20.1%
0% 5% 10% 15% 20%
Source: Global Tourism Watch, Unaided Destination Awareness, Harris/Decima, 2010.
12 2012-2016 corporate plan
Core Markets(Australia, France,
Germany, the UK)
Emerging Markets(China, Japan, Mexico,
South Korea)
Market potential 62.5M 38.5M
Step 1Hear about the destination 100% 100%
Step 2 On dream list
A destination that they think about going to in the future83% 84%
Step 3 On seriously considering list
Seriously considering visiting in the next two years
28.1M 17.8M
24% 28%
Step 4 Creating a “vacation movie”
Starting to gather information from friends, the Internet,
articles, brochures
13.1M 8.1M
15%17%
Step 5 Detailed itinerary planning
Planning the details of an itinerary to Canada
3.7M 2.7M
5% 10%
Step 6 Finalizing trip arrangements
In the process of working out travel arrangements2% 2%
Step 7 Purchase
Booked a trip to Canada1% 1%
2010 Overnight trips 1.6M 0.7M
Arrivals-to-planning ratio 44% 25%
Source: 2009 Advanced Path to Purchase Study. Long-haul population fi gures derived from the 2010 GTW Omnibus Study.
1.5 Standing out from the competition
Since the 2007 launch of Canada’s revitalized tourism brand “Canada. Keep
Exploring” we have worked to build a bridge between the world’s nature-
based perceptions of Canada and the need to present more diverse and
real Canadian travel experiences in a personal, emotional, relevant and
interactive way.
Through “Canada. Keep Exploring,” Canada is positioned as a destination
of choice for discerning travellers. In 2010, Canada’s tourism brand earned the number one spot on the list of the
world’s top country brands according to FutureBrand’s Country Brand Index, jumping from 6th place in 2007 and
12th in 2006. Of the dimensions comprising this index, tourism was Canada’s strongest dimension in achieving the
#1 ranking. In past decades we have tried to represent Canada as all things to all people. We now focus on what
makes us special to a select group of high-yield, motivated and active international travellers.
Brand
building
Tactics
conversion
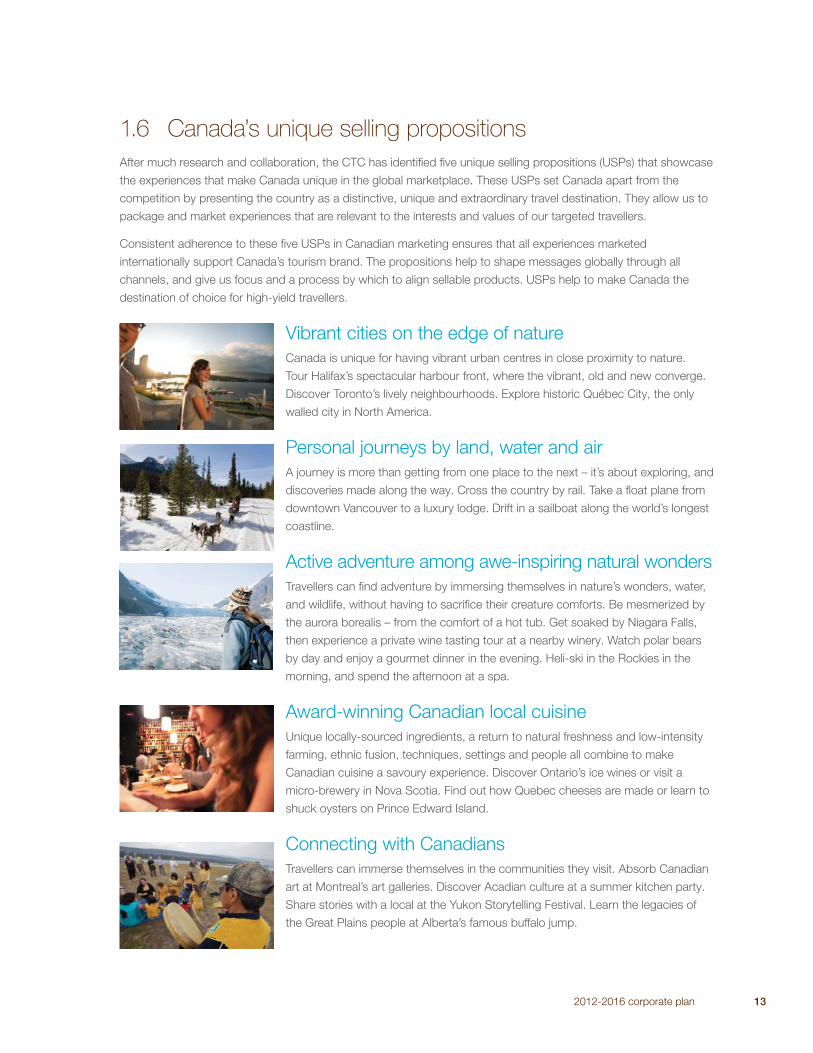
1.6 Canada’s unique selling propositions
After much research and collaboration, the CTC has identifi ed fi ve unique selling propositions (USPs) that showcase
the experiences that make Canada unique in the global marketplace. These USPs set Canada apart from the
competition by presenting the country as a distinctive, unique and extraordinary travel destination. They allow us to
package and market experiences that are relevant to the interests and values of our targeted travellers.
Consistent adherence to these fi ve USPs in Canadian marketing ensures that all experiences marketed
internationally support Canada’s tourism brand. The propositions help to shape messages globally through all
channels, and give us focus and a process by which to align sellable products. USPs help to make Canada the
destination of choice for high-yield travellers.
Vibrant cities on the edge of nature
Canada is unique for having vibrant urban centres in close proximity to nature.
Tour Halifax’s spectacular harbour front, where the vibrant, old and new converge.
Discover Toronto’s lively neighbourhoods. Explore historic Québec City, the only
walled city in North America.
Personal journeys by land, water and air
A journey is more than getting from one place to the next – it’s about exploring, and
discoveries made along the way. Cross the country by rail. Take a fl oat plane from
downtown Vancouver to a luxury lodge. Drift in a sailboat along the world’s longest
coastline.
Active adventure among awe-inspiring natural wonders
Travellers can fi nd adventure by immersing themselves in nature’s wonders, water,
and wildlife, without having to sacrifi ce their creature comforts. Be mesmerized by
the aurora borealis – from the comfort of a hot tub. Get soaked by Niagara Falls,
then experience a private wine tasting tour at a nearby winery. Watch polar bears
by day and enjoy a gourmet dinner in the evening. Heli-ski in the Rockies in the
morning, and spend the afternoon at a spa.
Award-winning Canadian local cuisine
Unique locally-sourced ingredients, a return to natural freshness and low-intensity
farming, ethnic fusion, techniques, settings and people all combine to make
Canadian cuisine a savoury experience. Discover Ontario’s ice wines or visit a
micro-brewery in Nova Scotia. Find out how Quebec cheeses are made or learn to
shuck oysters on Prince Edward Island.
Connecting with Canadians
Travellers can immerse themselves in the communities they visit. Absorb Canadian
art at Montreal’s art galleries. Discover Acadian culture at a summer kitchen party.
Share stories with a local at the Yukon Storytelling Festival. Learn the legacies of
the Great Plains people at Alberta’s famous buffalo jump.
2012-2016 corporate plan 13
14 2012-2016 corporate plan summary
1.7 Fostering innovation
The tourism marketing industry is a major customer of
Canada’s creative and digital economies, and the CTC takes
advantage of technological changes in marketing to make
Canada more competitive internationally. For example, CTC
marketing campaigns have taken innovative approaches
incorporating quick response (QR) codes in our print
advertising that, when scanned, take readers to a mobile
page to view images, videos and reviews. The CTC has also
collaborated with Google Maps and Street View to create
360° virtual online ads and use interactive murals that display
live Twitter posts and photos from travellers in Canada.
Our latest and innovative travel tool Explore Canada
Like a Local invites travellers to plan their trip with
recommendations from locals and other travellers who
know the real Canada. Inspiring travellers to become
excited about Canada, this website allows visitors to create
their own travel guide and then take it along with them
using a downloadable mobile application. Explore Canada
Like a Local, launched in 2011, makes the CTC the fi rst
national tourism organization to launch a mobile application
and online itinerary-building tool powered solely by user-generated content. This tool takes the traveller from
planning to experiencing a trip, and even to recommending their own travel tips.
The CTC leads innovation by contributing to the demand for innovative technologies in Canada. From
multimedia campaigns to social media strategies, leveraging the latest advances in technology remains a key
focus of the CTC’s marketing strategy.
The CTC also aims to be innovative in its
partnership arrangements to effectively
promote Canada internationally. In
addition to the four traditional partnership
arrangements noted on page 46, the CTC
will explore new and innovative types
of partnerships to address needs such
as bringing tourism experiences to the
international marketplace in a manner that
is strategic, brand-aligned, and customer
focused.
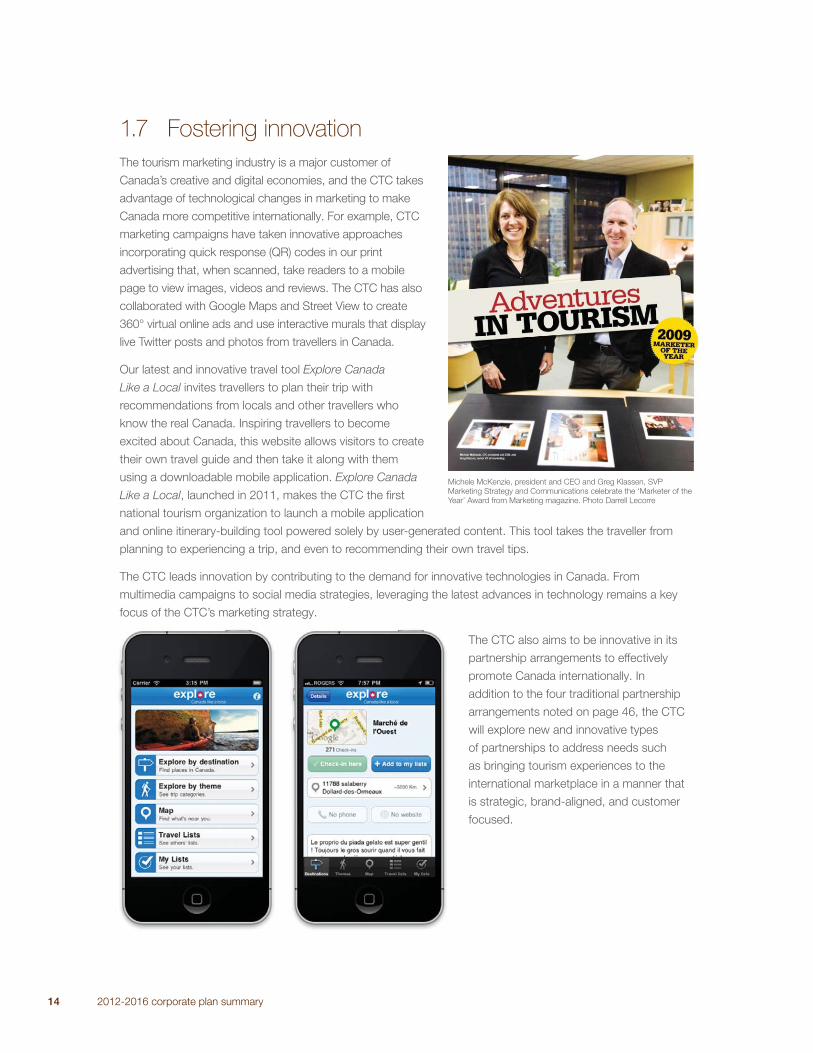
Michele McKenzie, president and CEO and Greg Klassen, SVP
Marketing Strategy and Communications celebrate the ‘Marketer of the
Year’ Award from Marketing magazine. Photo Darrell Lecorre
2012-2016 corporate plan summary 15
1.8 Generating results
The CTC actively tracks the net effect that investments in our campaigns have on generating returns to the
tourism economy and on the broader domestic economy. It is our stable and consistent branded marketing
which generates demand for tourism products and experiences. We work with the industry, largely made up
of SMEs, to enhance their product offerings in the marketplace, and the resulting demand, in turn, encourages
these SMEs to create jobs which drive economic wealth and taxation revenues. As a result of this link between
destination marketing and tourism demand generation, we are able to attribute our contribution to tourism
revenue, job creation and federal tax receipts7. In 2010, the CTC’s marketing efforts generated $1.9 billion
in export revenue for Canada’s tourism economy; generated nearly $252 million in federal government tax
revenues; and created or protected 16,569 Canadian jobs8.
Below is a table illustrating other results from 2010 from our various marketing channels:
Marketing Channel 2010 Results
Direct to consumer marketing Marketing campaign return on investment (ROI) of 82 : 1
Media & public relations Canadian tourism and the 2010 Winter Olympic Games messaging
reached a global audience of 13.5 billion9
Travel Trade 2,814 new agents certifi ed under the Canada Specialist Program10
Meetings, Convention & 1,064 Leads
Incentive Travel (MC&IT)
7 CTC attributable tourism revenues are the estimated additional revenues received by the Canadian tourism industry as a result of travellers
converted or infl uenced to take a trip to Canada by CTC marketing.
8 Canadian Tourism Commission estimates based on average daily spending data from Statistics Canada.
9 Result was largely driven by the 2010 Winter Olympic Games coverage.
10 The Canada Specialist Program is an educational tool designed to assist travel trade agents in becoming knowledgeable on Canadian
experiences and in promoting travel and tourism to Canada.
16 2012-2016 corporate plan summary
Part 2: Our world
Queb
ec C
ity
2.1 Industry environment
Keeping abreast
In a fast-changing industry it is vital to have regular access to accurate, up-to-date information. To that end,
the CTC monitors economic and market trends on a monthly basis and uses the information collected to
support decision making. We also make this data available to Canadian businesses on our corporate website
(www.canada.travel/corporate).
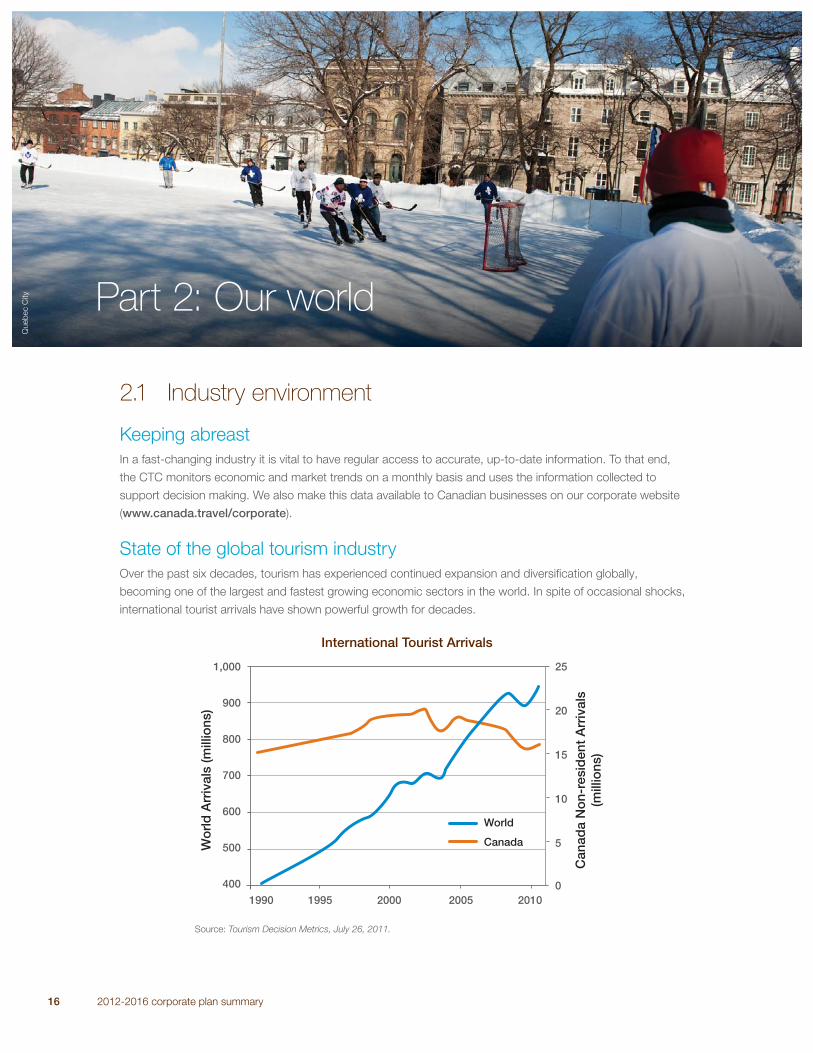
State of the global tourism industry
Over the past six decades, tourism has experienced continued expansion and diversifi cation globally,
becoming one of the largest and fastest growing economic sectors in the world. In spite of occasional shocks,
international tourist arrivals have shown powerful growth for decades.
International Tourist Arrivals
Source: Tourism Decision Metrics, July 26, 2011.
1990
400
500
600
700
800
900
1,000 25
20
15
10
5
0
Can
ada
No
n-re
sid
ent
Arr
ival
s(m
illio
ns)
Wo
rld
Arr
ival
s (m
illio
ns)
1995 2000 2005
World
Canada
2010
2012-2016 corporate plan summary 17
While a sizeable dip was experienced in 2009 as a result of the global fi nancial and economic slowdown,
the industry recovered faster than expected in 2010, spurred by improved economic conditions worldwide.
International tourism arrivals reached an estimated peak of 940 million in 2010, a gain of 7% over 2009 and 3%
over the 2008 pre-crisis peak year. The recovery was particularly strong in emerging economies, where arrivals
grew faster (8%) than in advanced ones (5%): this trend is expected to continue.
Despite the social unrest in the Middle East and North Africa and the earthquake in Japan, the industry’s
recovery is expected to stay on track through 2011. International arrivals are anticipated to grow at 4-5%,
slightly above the long-term average of 4%11. However, there remains a number of risks that could dampen
growth, such as concerns over fi scal stability in the US and Europe, increased public austerity measures, stock
market performance and volatile oil prices.
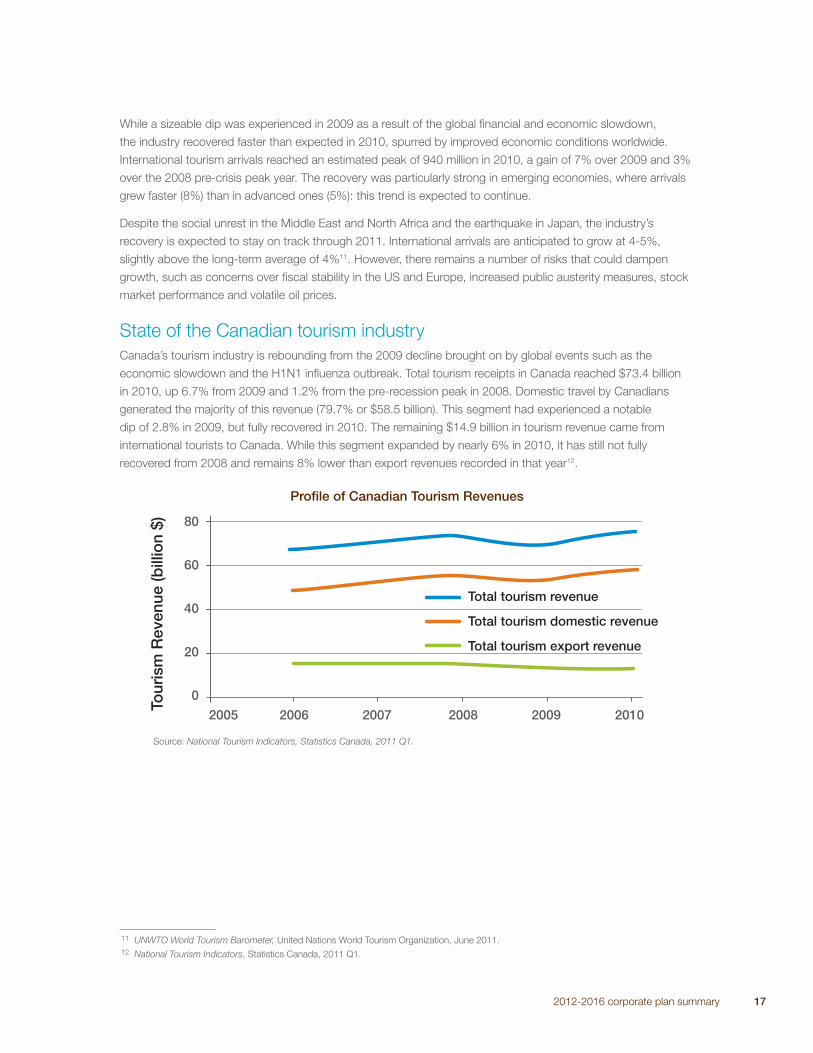
State of the Canadian tourism industry
Canada’s tourism industry is rebounding from the 2009 decline brought on by global events such as the
economic slowdown and the H1N1 infl uenza outbreak. Total tourism receipts in Canada reached $73.4 billion
in 2010, up 6.7% from 2009 and 1.2% from the pre-recession peak in 2008. Domestic travel by Canadians
generated the majority of this revenue (79.7% or $58.5 billion). This segment had experienced a notable
dip of 2.8% in 2009, but fully recovered in 2010. The remaining $14.9 billion in tourism revenue came from
international tourists to Canada. While this segment expanded by nearly 6% in 2010, it has still not fully
recovered from 2008 and remains 8% lower than export revenues recorded in that year12.
Profi le of Canadian Tourism Revenues
Source: National Tourism Indicators, Statistics Canada, 2011 Q1.
11 UNWTO World Tourism Barometer, United Nations World Tourism Organization, June 2011.
12 National Tourism Indicators, Statistics Canada, 2011 Q1.
2005
0
20
40
60
80
Tour
ism
Rev
enue
(bill
ion
$)
2006 2007 2008
Total tourism domestic revenue
Total tourism export revenue
2009 2010
Total tourism revenue
18 2012-2016 corporate plan summary
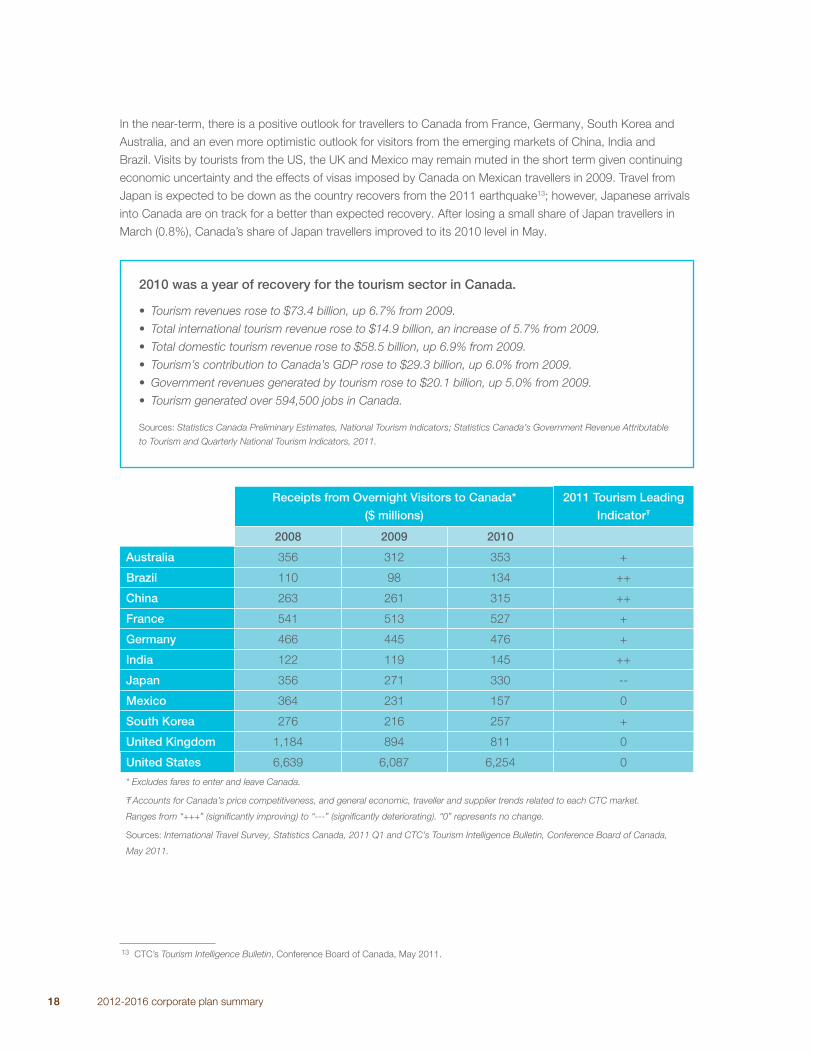
In the near-term, there is a positive outlook for travellers to Canada from France, Germany, South Korea and
Australia, and an even more optimistic outlook for visitors from the emerging markets of China, India and
Brazil. Visits by tourists from the US, the UK and Mexico may remain muted in the short term given continuing
economic uncertainty and the effects of visas imposed by Canada on Mexican travellers in 2009. Travel from
Japan is expected to be down as the country recovers from the 2011 earthquake13; however, Japanese arrivals
into Canada are on track for a better than expected recovery. After losing a small share of Japan travellers in
March (0.8%), Canada’s share of Japan travellers improved to its 2010 level in May.
Receipts from Overnight Visitors to Canada*
($ millions)
2011 Tourism Leading
IndicatorŦ
2008 2009 2010
Australia 356 312 353 +
Brazil 110 98 134 ++
China 263 261 315 ++
France 541 513 527 +
Germany 466 445 476 +
India 122 119 145 ++
Japan 356 271 330 --
Mexico 364 231 157 0
South Korea 276 216 257 +
United Kingdom 1,184 894 811 0
United States 6,639 6,087 6,254 0
* Excludes fares to enter and leave Canada.
Ŧ Accounts for Canada’s price competitiveness, and general economic, traveller and supplier trends related to each CTC market.
Ranges from “+++” (signifi cantly improving) to “---” (signifi cantly deteriorating). “0” represents no change.
Sources: International Travel Survey, Statistics Canada, 2011 Q1 and CTC’s Tourism Intelligence Bulletin, Conference Board of Canada,
May 2011.
13 CTC’s Tourism Intelligence Bulletin, Conference Board of Canada, May 2011.
2010 was a year of recovery for the tourism sector in Canada.
• Tourism revenues rose to $73.4 billion, up 6.7% from 2009.
• Total international tourism revenue rose to $14.9 billion, an increase of 5.7% from 2009.
• Total domestic tourism revenue rose to $58.5 billion, up 6.9% from 2009.
• Tourism’s contribution to Canada’s GDP rose to $29.3 billion, up 6.0% from 2009.
• Government revenues generated by tourism rose to $20.1 billion, up 5.0% from 2009.
• Tourism generated over 594,500 jobs in Canada.
Sources: Statistics Canada Preliminary Estimates, National Tourism Indicators; Statistics Canada’s Government Revenue Attributable
to Tourism and Quarterly National Tourism Indicators, 2011.
2012-2016 corporate plan summary 19
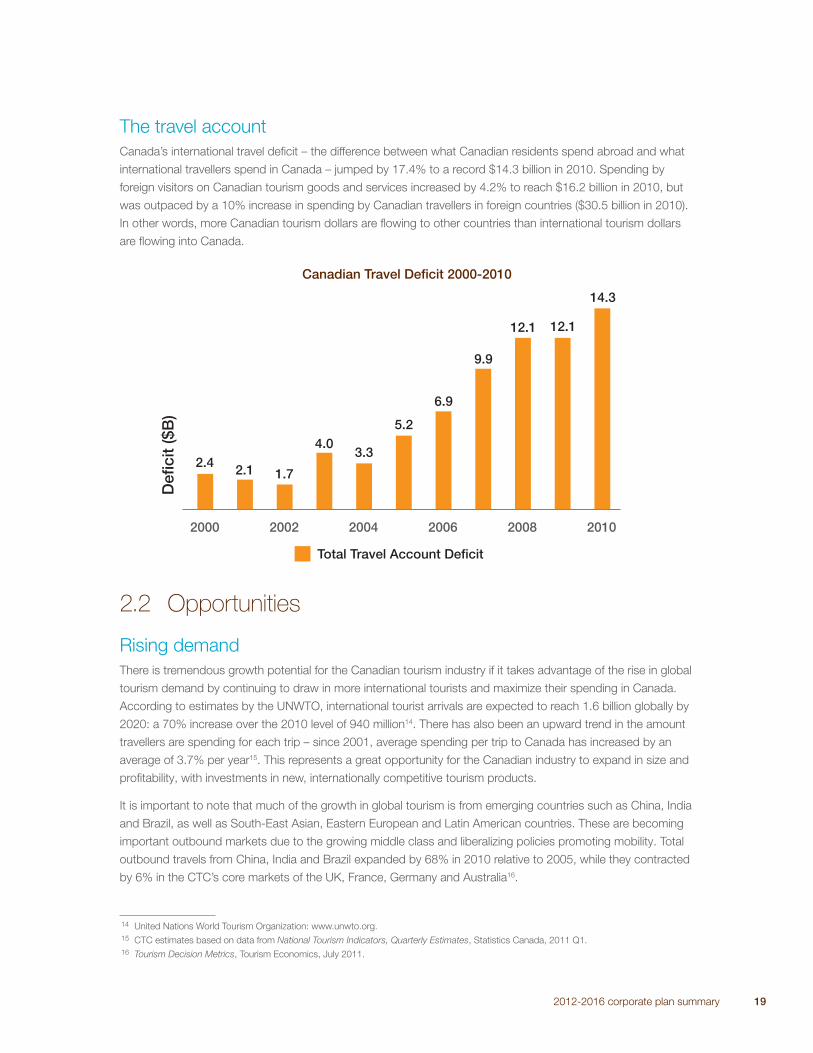
The travel account
Canada’s international travel defi cit – the difference between what Canadian residents spend abroad and what
international travellers spend in Canada – jumped by 17.4% to a record $14.3 billion in 2010. Spending by
foreign visitors on Canadian tourism goods and services increased by 4.2% to reach $16.2 billion in 2010, but
was outpaced by a 10% increase in spending by Canadian travellers in foreign countries ($30.5 billion in 2010).
In other words, more Canadian tourism dollars are fl owing to other countries than international tourism dollars
are fl owing into Canada.
Canadian Travel Defi cit 2000-2010
2.2 Opportunities
Rising demand
There is tremendous growth potential for the Canadian tourism industry if it takes advantage of the rise in global
tourism demand by continuing to draw in more international tourists and maximize their spending in Canada.
According to estimates by the UNWTO, international tourist arrivals are expected to reach 1.6 billion globally by
2020: a 70% increase over the 2010 level of 940 million14. There has also been an upward trend in the amount
travellers are spending for each trip – since 2001, average spending per trip to Canada has increased by an
average of 3.7% per year15. This represents a great opportunity for the Canadian industry to expand in size and
profi tability, with investments in new, internationally competitive tourism products.
It is important to note that much of the growth in global tourism is from emerging countries such as China, India
and Brazil, as well as South-East Asian, Eastern European and Latin American countries. These are becoming
important outbound markets due to the growing middle class and liberalizing policies promoting mobility. Total
outbound travels from China, India and Brazil expanded by 68% in 2010 relative to 2005, while they contracted
by 6% in the CTC’s core markets of the UK, France, Germany and Australia16.
14 United Nations World Tourism Organization: www.unwto.org.
15 CTC estimates based on data from National Tourism Indicators, Quarterly Estimates, Statistics Canada, 2011 Q1.
16 Tourism Decision Metrics, Tourism Economics, July 2011.
2000
Total Travel Account Deficit
Defi
cit
($B
)
2002 2004 2006 2008 2010
14.3
12.112.1
9.9
6.9
5.2
3.34.0
1.72.12.4
20 2012-2016 corporate plan summary
The CTC is taking advantage of these trends. Over the past few years, we have moved into China, India and
Brazil to develop these key markets for Canada. Those efforts are starting to generate results for Canadians:
tourist arrivals from these three markets grew by 66%, 64% and 31%, respectively, between 2005 and 201017.
Access in China
The Chinese market for international travel is projected to grow rapidly – by 17% annually over the next 10 years
– to become the third major source of foreign tourists to North America, behind the UK and Japan18. Canada is
poised to take advantage of this opportunity with our ADS granted by China in June 2010. With ADS, the CTC
and its partners are now able to advertise directly to consumers in China and promote travel to Canada. Due to
one-time funding through Budget 2009 and Canada’s Economic Action Plan, which ended in March 2011, the
CTC was able to augment its activities in this market. The CTC targeted high-yield travellers and incentive travel,
which is a key sales motivation tool for multinational and Chinese companies.
The acquisition of ADS has also opened the door to a signifi cant increase in air capacity between the two
countries, with new Chinese carriers China Southern Airlines and Hainan Airlines entering the market. These
carriers, combined with further capacity increases by Air Canada, Air China and China Eastern, have boosted
the total number of weekly fl ights to 55 during the 2011 summer peak. This strong competition is driving a
downward trend in pricing, making Canada a more affordable destination for consumers.
Chinese visits to Canada in 2010 increased by 21.2% over 2009 levels. However, from the time ADS was
granted in June 2010 to the end of the year, Chinese visitation increased by 30.1%, and during the fi rst fi ve
months of 2011 it expanded by 16.7% over the same pre-ADS period in 2010. Overall, in the fi rst year of China
granting ADS to Canada the number of Chinese visitors to Canada soared by 25.8%.
Expanded presence in traditional markets
In 2010, the CTC undertook a signifi cant restructuring (our Strategic Shift) to fi nd major operational effi ciencies
and push maximum resources to our marketing programs, especially in core markets like the UK, France and
Australia. Our goal was to invest forcefully in markets where our brand leads in order to maximize our impact.
In the months following the implementation of our new business model, overnight visits from France and
Australia rose by 8% and 4%, respectively, during the fi rst four months of 2011, compared to the same period
the previous year. Over the same period though, overnight visits from the UK were down 8% due to lingering
economic uncertainties. In the coming years, we will continue to keep a pulse on the effects of our Strategic
Shift in our traditional markets.
17 International Travel Survey, Statistics Canada, May 2011.
18 “Chinese international travel ready for takeoff,” CTC’s Tourism Intelligence Bulletin, Conference Board of Canada, May 2011.
2012-2016 corporate plan summary 21
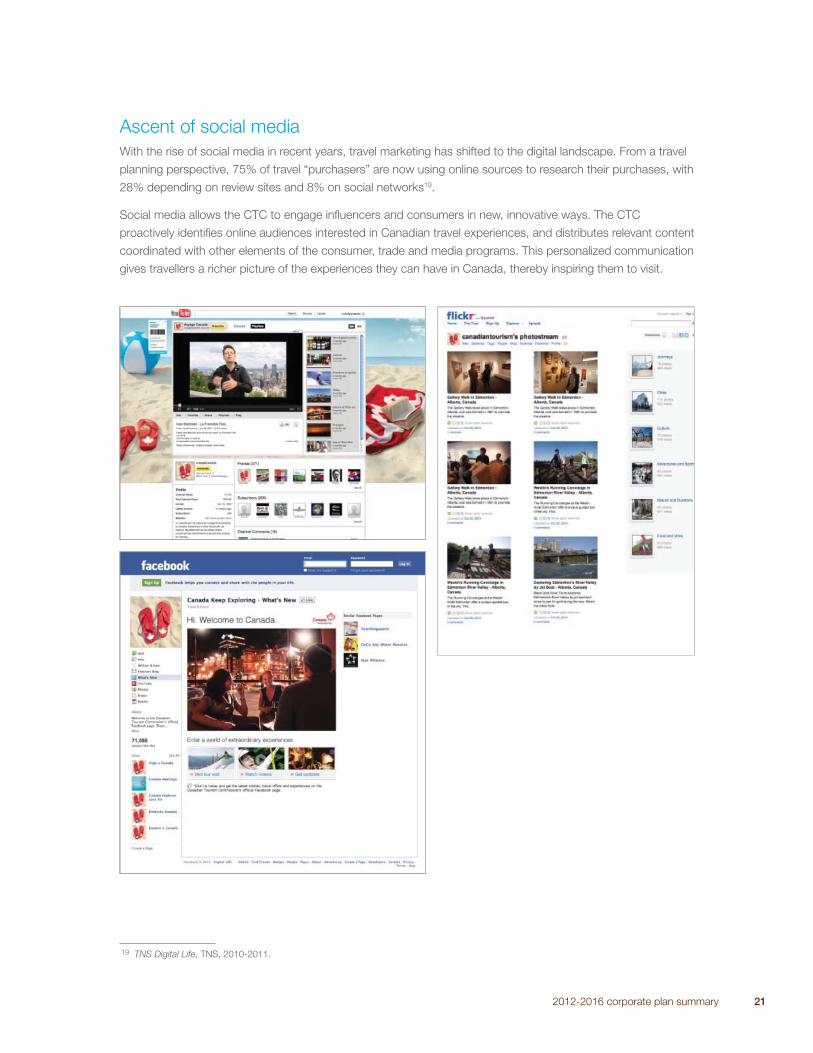
Ascent of social media
With the rise of social media in recent years, travel marketing has shifted to the digital landscape. From a travel
planning perspective, 75% of travel “purchasers” are now using online sources to research their purchases, with
28% depending on review sites and 8% on social networks19.
Social media allows the CTC to engage infl uencers and consumers in new, innovative ways. The CTC
proactively identifi es online audiences interested in Canadian travel experiences, and distributes relevant content
coordinated with other elements of the consumer, trade and media programs. This personalized communication
gives travellers a richer picture of the experiences they can have in Canada, thereby inspiring them to visit.
19 TNS Digital Life, TNS, 2010-2011.
22 2012-2016 corporate plan summary
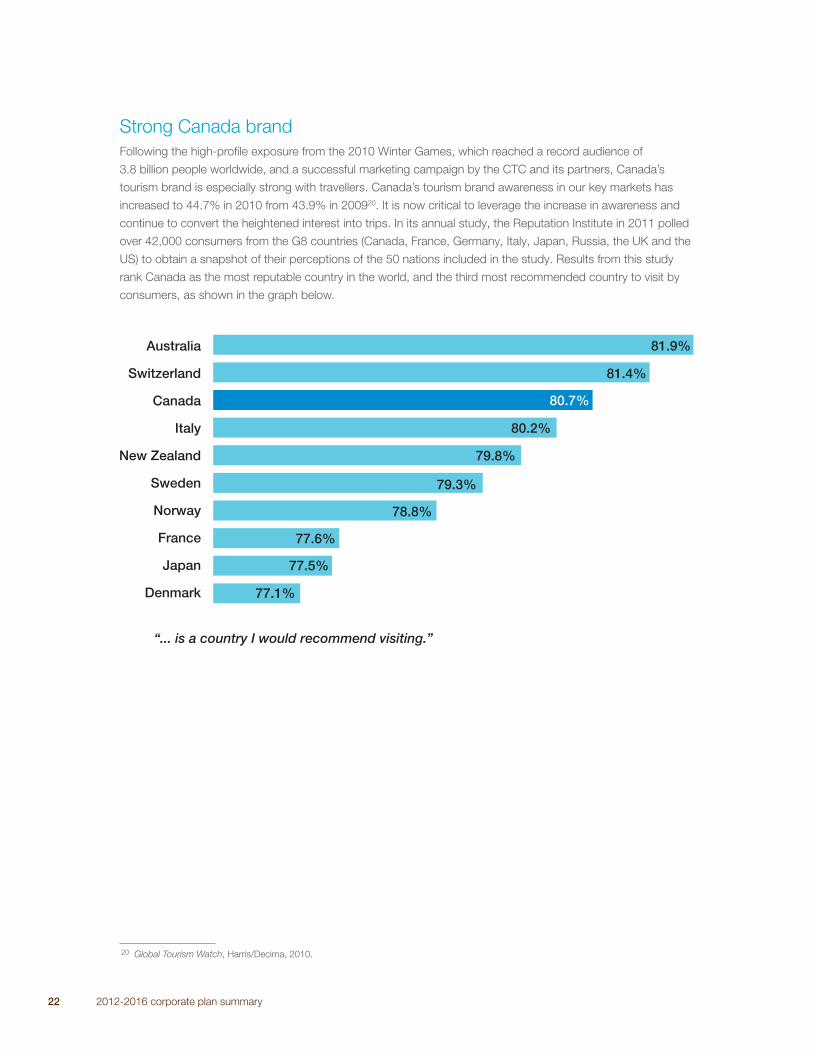
Strong Canada brand
Following the high-profi le exposure from the 2010 Winter Games, which reached a record audience of
3.8 billion people worldwide, and a successful marketing campaign by the CTC and its partners, Canada’s
tourism brand is especially strong with travellers. Canada’s tourism brand awareness in our key markets has
increased to 44.7% in 2010 from 43.9% in 200920. It is now critical to leverage the increase in awareness and
continue to convert the heightened interest into trips. In its annual study, the Reputation Institute in 2011 polled
over 42,000 consumers from the G8 countries (Canada, France, Germany, Italy, Japan, Russia, the UK and the
US) to obtain a snapshot of their perceptions of the 50 nations included in the study. Results from this study
rank Canada as the most reputable country in the world, and the third most recommended country to visit by
consumers, as shown in the graph below.
20 Global Tourism Watch, Harris/Decima, 2010.
Denmark
“... is a country I would recommend visiting.”
Japan
France
Norway
Sweden
New Zealand
Italy
Canada
Switzerland
Australia
77.1%
77.5%
77.6%
78.8%
79.3%
79.8%
80.2%
81.4%
81.9%
80.7%
2012-2016 corporate plan summary 23
2.3 Challenges
Emerging destinations
The world is competing for tourists as never before, and travel is beginning to fl ow towards new, exotic and
emerging destinations in Asia, Africa and the Middle East. Over the next 10 years, emerging and developing
regions are expected to post strong gains at the expense of Europe and the Americas. It is projected that by
2020 Europe and the Americas together will achieve one billion in international arrivals, while Asia, Africa and
the Middle East together will hit over half a billion21.
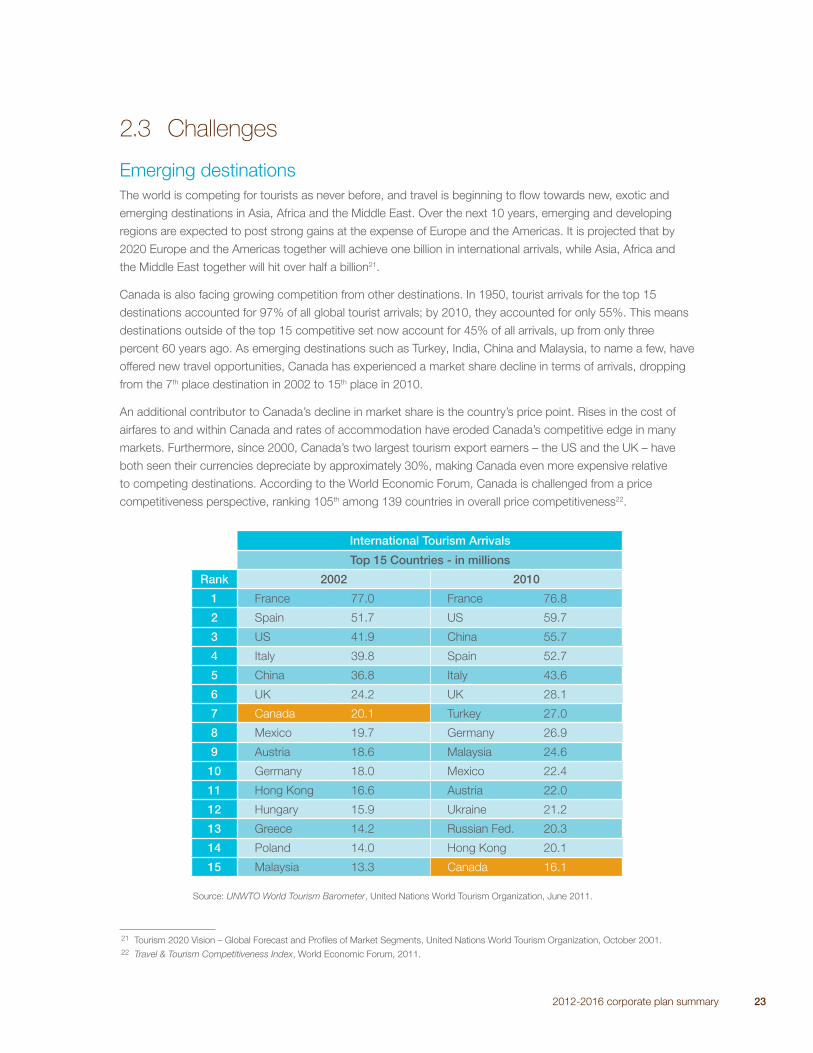
Canada is also facing growing competition from other destinations. In 1950, tourist arrivals for the top 15
destinations accounted for 97% of all global tourist arrivals; by 2010, they accounted for only 55%. This means
destinations outside of the top 15 competitive set now account for 45% of all arrivals, up from only three
percent 60 years ago. As emerging destinations such as Turkey, India, China and Malaysia, to name a few, have
offered new travel opportunities, Canada has experienced a market share decline in terms of arrivals, dropping
from the 7th place destination in 2002 to 15th place in 2010.
An additional contributor to Canada’s decline in market share is the country’s price point. Rises in the cost of
airfares to and within Canada and rates of accommodation have eroded Canada’s competitive edge in many
markets. Furthermore, since 2000, Canada’s two largest tourism export earners – the US and the UK – have
both seen their currencies depreciate by approximately 30%, making Canada even more expensive relative
to competing destinations. According to the World Economic Forum, Canada is challenged from a price
competitiveness perspective, ranking 105th among 139 countries in overall price competitiveness22.
21 Tourism 2020 Vision – Global Forecast and Profi les of Market Segments, United Nations World Tourism Organization, October 2001.
22 Travel & Tourism Competitiveness Index, World Economic Forum, 2011.
International Tourism Arrivals
Top 15 Countries - in millions
Rank 2002 2010
1 France 77.0 France 76.8
2 Spain 51.7 US 59.7
3 US 41.9 China 55.7
4 Italy 39.8 Spain 52.7
5 China 36.8 Italy 43.6
6 UK 24.2 UK 28.1
7 Canada 20.1 Turkey 27.0
8 Mexico 19.7 Germany 26.9
9 Austria 18.6 Malaysia 24.6
10 Germany 18.0 Mexico 22.4
11 Hong Kong 16.6 Austria 22.0
12 Hungary 15.9 Ukraine 21.2
13 Greece 14.2 Russian Fed. 20.3
14 Poland 14.0 Hong Kong 20.1
15 Malaysia 13.3 Canada 16.1
Source: UNWTO World Tourism Barometer, United Nations World Tourism Organization, June 2011.
24 2012-2016 corporate plan summary
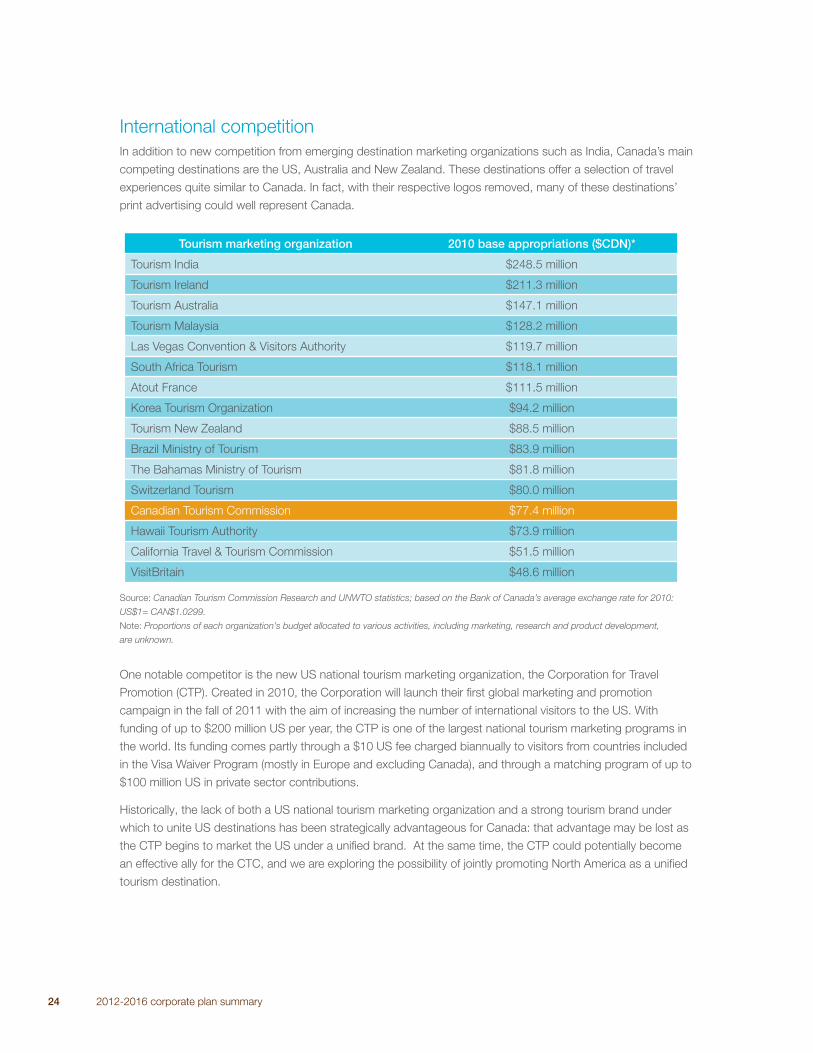
International competition
In addition to new competition from emerging destination marketing organizations such as India, Canada’s main
competing destinations are the US, Australia and New Zealand. These destinations offer a selection of travel
experiences quite similar to Canada. In fact, with their respective logos removed, many of these destinations’
print advertising could well represent Canada.
Tourism marketing organization 2010 base appropriations ($CDN)*
Tourism India $248.5 million
Tourism Ireland $211.3 million
Tourism Australia $147.1 million
Tourism Malaysia $128.2 million
Las Vegas Convention & Visitors Authority $119.7 million
South Africa Tourism $118.1 million
Atout France $111.5 million
Korea Tourism Organization $94.2 million
Tourism New Zealand $88.5 million
Brazil Ministry of Tourism $83.9 million
The Bahamas Ministry of Tourism $81.8 million
Switzerland Tourism $80.0 million
Canadian Tourism Commission $77.4 million
Hawaii Tourism Authority $73.9 million
California Travel & Tourism Commission $51.5 million
VisitBritain $48.6 million
Source: Canadian Tourism Commission Research and UNWTO statistics; based on the Bank of Canada’s average exchange rate for 2010:
US$1= CAN$1.0299.
Note: Proportions of each organization’s budget allocated to various activities, including marketing, research and product development,
are unknown.
One notable competitor is the new US national tourism marketing organization, the Corporation for Travel
Promotion (CTP). Created in 2010, the Corporation will launch their fi rst global marketing and promotion
campaign in the fall of 2011 with the aim of increasing the number of international visitors to the US. With
funding of up to $200 million US per year, the CTP is one of the largest national tourism marketing programs in
the world. Its funding comes partly through a $10 US fee charged biannually to visitors from countries included
in the Visa Waiver Program (mostly in Europe and excluding Canada), and through a matching program of up to
$100 million US in private sector contributions.
Historically, the lack of both a US national tourism marketing organization and a strong tourism brand under
which to unite US destinations has been strategically advantageous for Canada: that advantage may be lost as
the CTP begins to market the US under a unifi ed brand. At the same time, the CTP could potentially become
an effective ally for the CTC, and we are exploring the possibility of jointly promoting North America as a unifi ed
tourism destination.
2012-2016 corporate plan summary 25
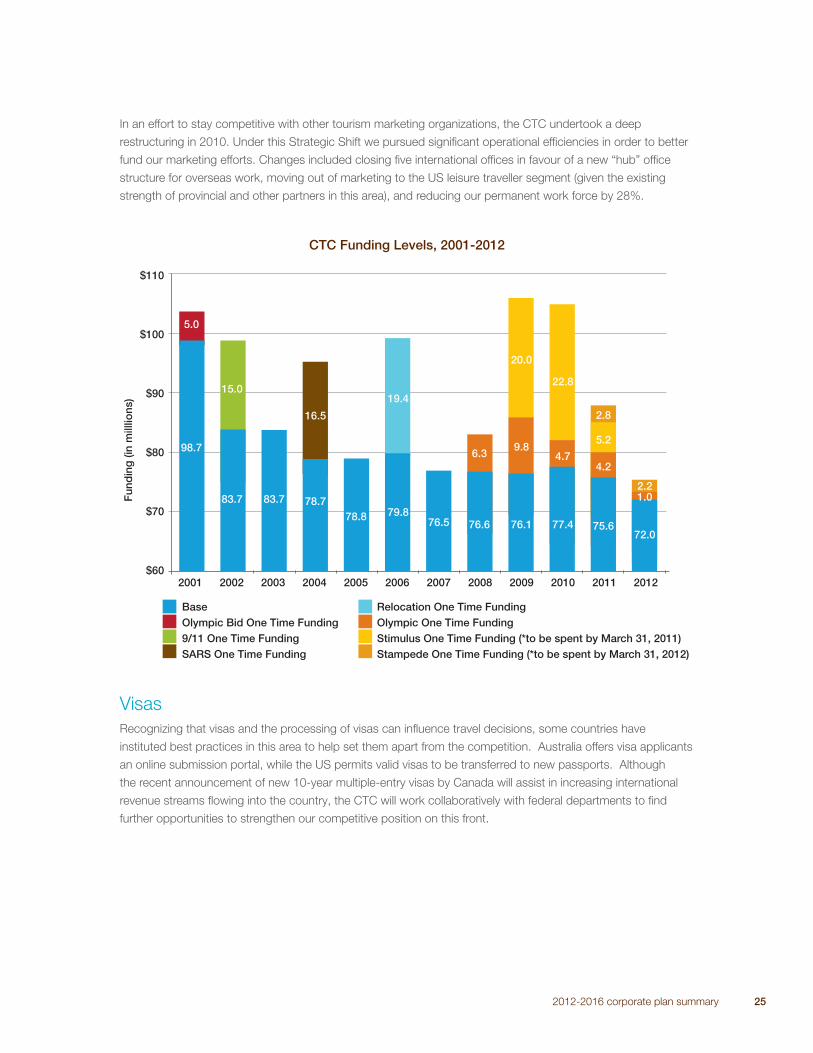
In an effort to stay competitive with other tourism marketing organizations, the CTC undertook a deep
restructuring in 2010. Under this Strategic Shift we pursued signifi cant operational effi ciencies in order to better
fund our marketing efforts. Changes included closing fi ve international offi ces in favour of a new “hub” offi ce
structure for overseas work, moving out of marketing to the US leisure traveller segment (given the existing
strength of provincial and other partners in this area), and reducing our permanent work force by 28%.
$110
$100
$90
$80
$70
$602001 2002 2003 2004 2005 2006 2007 2008 2009 2010 2011 2012
Fun
din
g (i
n m
illlio
ns)
98.7
83.7 83.7
15.0
78.7
16.5
19.4
79.876.5 76.6
6.3
76.1 77.4
4.7
22.8
75.672.0
1.02.2
4.2
5.2
2.8
9.8
20.0
78.8
5.0
Base Relocation One Time FundingOlympic Bid One Time Funding Olympic One Time Funding 9/11 One Time Funding Stimulus One Time Funding (*to be spent by March 31, 2011)SARS One Time Funding Stampede One Time Funding (*to be spent by March 31, 2012)
CTC Funding Levels, 2001-2012
Visas
Recognizing that visas and the processing of visas can infl uence travel decisions, some countries have
instituted best practices in this area to help set them apart from the competition. Australia offers visa applicants
an online submission portal, while the US permits valid visas to be transferred to new passports. Although
the recent announcement of new 10-year multiple-entry visas by Canada will assist in increasing international
revenue streams fl owing into the country, the CTC will work collaboratively with federal departments to fi nd
further opportunities to strengthen our competitive position on this front.
26 2012-2016 corporate plan summary
Fuel costs
Political unrest in various part of the world and expanding global demand continue to cause fl uctuations in
fuel prices, creating uncertainty for airlines around the world. The International Air Transport Association (IATA)
is forecasting a 46% fall in net profi ts for the airline industry compared to 2010, and industry analysts are
predicting airfares to reach all-time highs in the near term23. As such, rising crude oil prices will continue to
impact the tourism industry by increasing the cost of travel.
Air access and capacity
Increasing air access between Canada and other countries will no doubt improve Canada’s competitiveness
as a tourism destination. The recent Open Skies-type air transport agreement between Canada and Brazil
will attract Brazilian travellers, who represent a sizeable ski market for Canada. The Government of Canada
also recently signed or updated air agreements with the following countries: Switzerland (October 22, 2010);
Jamaica and Trinidad and Tobago (December 20, 2010); Egypt (December 21, 2010); Algeria (January 11,
2011); and Qatar (February 2, 2011).
Furthermore, in 2011, Canada successfully negotiated bilateral air agreements with Mexico and Japan, allowing
for the potential expansion of direct air services to Canada. Although this is good news for Canada’s tourism
industry, Canada still has limited or no air agreements with three of its major markets: Australia, China and India,
and the CTC will continue to monitor progress in this area and the impacts on travel from abroad.
Exchange rates
The Canadian economic recovery that began in early 2009 coincided with a strengthening Canadian dollar that
brought it near parity with the US dollar. As the US currency fell nearly 10% against the Canadian dollar in 2010,
other currencies followed suit, including the euro (-13.8%), the British pound (-10.6%) and the Chinese yuan
renminbi (-9.0%). Canada’s currency has continued to improve into 2011 amid rising commodity prices and an
improving Canadian economic outlook, but is expected to show some volatility in late 2011.
A strong Canadian dollar weakens the competitiveness of Canada’s tourism industry as foreign tourists no
longer benefi t from favourable exchange rates. Since the dollar began to rise in 2001, visits by foreigners to
Canada, particularly from the US, have been on the decline. A strong Canadian dollar makes international travel
to Canada increasingly expensive. At the same time, a strengthening dollar increases the purchasing power of
Canadians, enabling them to travel abroad more cheaply. The combination of both effects serves to increase
Canada’s travel defi cit.
This has important strategic implications for the industry. In particular, the high dollar driving further
deterioration of US visits by car (Canada’s largest source market) means that marketers will need to consider
shifting their focus elsewhere, and the industry will need to align its products to serve new customers from
other source markets.
23 CTC’s Tourism Intelligence Bulletin, Conference Board of Canada, May 2011.
2012-2016 corporate plan summary 27
2.4 Federal priorities
Federal Tourism Strategy
On October 6, 2011, the Honourable Maxime Bernier, Minister of State for Small Business and Tourism,
launched the new Federal Tourism Strategy. This initiative aims to build a more coherent, whole-of-government
approach in supporting the industry towards the $100 billion revenue target. It focuses on four pillars: 1)
increasing awareness of Canada as a premier tourism destination; 2) facilitating ease of access and movement
of travellers while protecting the safety and integrity of Canada’s borders; 3) encouraging product development
and investments in Canadian tourism products; and 4) fostering an adequate supply of skills and labour to
enhance visitor experiences through quality service and hospitality. The CTC will participate in implementing
the strategy and will lead one of its centerpieces: the newly launched Signature Experiences Collection®, an
inventory of export-ready, unique experiences that exemplify Canada’s tourism brand. See page 35 for more
information on this program.
Calgary Stampede’s 100th anniversary
In its 2011 budget, the Government of Canada provided $5 million for the CTC to market the 100th anniversary
of the Calgary Stampede to be marked in July 2012. This is a unique opportunity to leverage the anniversary
celebrations to boost awareness of the Stampede internationally and get new travellers interested in a Western
Canada experience. The program, launched in July 2011, involves a blitz of advertising campaigns, promotions,
media relations, social media content and marketing through tour operators and travel agents. The program will
end by March 31, 2012.
28 2012-2016 corporate plan summary
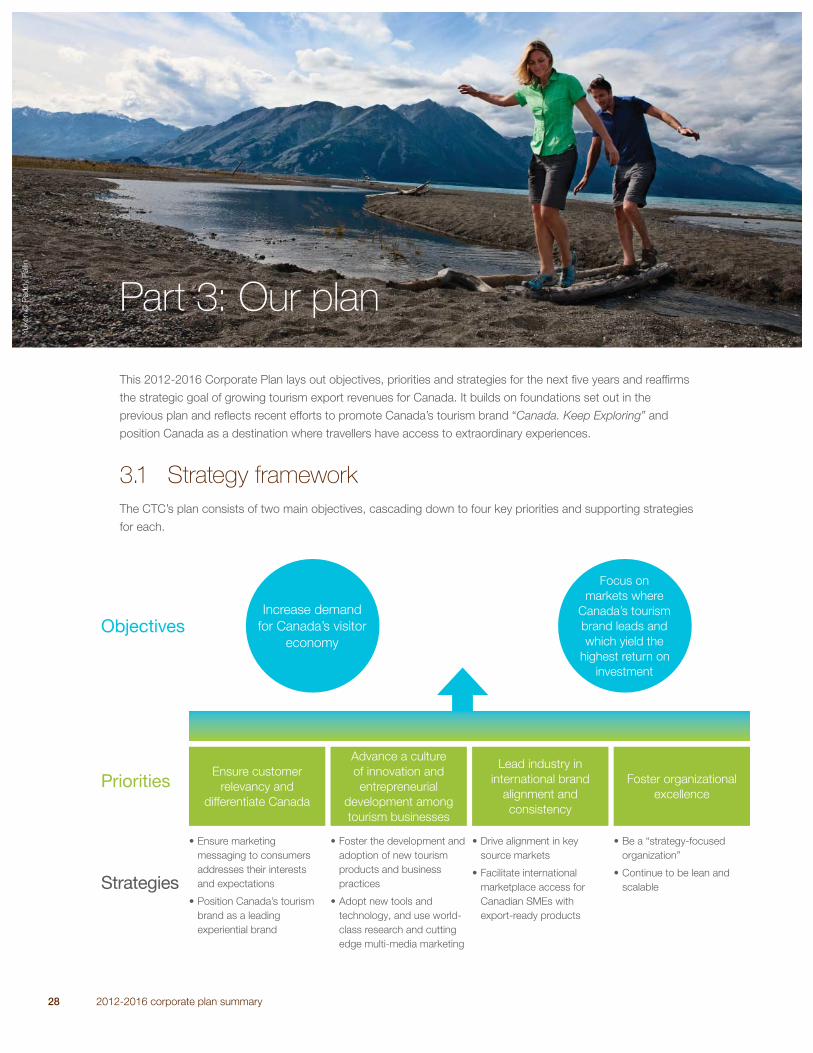
This 2012-2016 Corporate Plan lays out objectives, priorities and strategies for the next fi ve years and reaffi rms
the strategic goal of growing tourism export revenues for Canada. It builds on foundations set out in the
previous plan and refl ects recent efforts to promote Canada’s tourism brand “Canada. Keep Exploring” and
position Canada as a destination where travellers have access to extraordinary experiences.
3.1 Strategy framework
The CTC’s plan consists of two main objectives, cascading down to four key priorities and supporting strategies
for each.
Part 3: Our plan
Yukon ©
Pad
dy P
allin
Objectives
Priorities
Strategies
Increase demand
for Canada’s visitor
economy
Focus on
markets where
Canada’s tourism
brand leads and
which yield the
highest return on
investment
Ensure customer
relevancy and
differentiate Canada
• Ensure marketing
messaging to consumers
addresses their interests
and expectations
• Position Canada’s tourism
brand as a leading
experiential brand
• Foster the development and
adoption of new tourism
products and business
practices
• Adopt new tools and
technology, and use world-
class research and cutting
edge multi-media marketing
• Drive alignment in key
source markets
• Facilitate international
marketplace access for
Canadian SMEs with
export-ready products
• Be a “strategy-focused
organization”
• Continue to be lean and
scalable
Advance a culture
of innovation and
entrepreneurial
development among
tourism businesses
Lead industry in
international brand
alignment and
consistency
Foster organizational
excellence
2012-2016 corporate plan summary 29
3.2 Objectives
The CTC’s plan is founded on two main objectives, with high-level measures and strategies for each as follows:
Objective 1: Increase demand for Canada’s visitor economy
Key Measures
• Tourism export revenue
• Tourism GDP
• Tourism employment
• International tourist receipts from the CTC’s markets
• Average spend per person per night among the CTC’s markets
Key Strategies
• We will generate wealth for Canadians by focusing on both short-term and long-term potential for
maximizing return on investment as markets mature and evolve.
• We will engage in effective tourism marketing, promotions and market development activities based
on market research to support the achievement of Canada’s national tourism revenue goal of
$100 billion by 2015.
National tourism revenue goal
In 2009, tourism ministers at the federal, provincial and territorial levels set a goal of growing Canada’s
tourism revenues from $72.5 billion in 2008 to $100 billion by 2015. The CTC has set aggressive internal
targets to contribute to this goal; however, even with this additional revenue, the $100 billion national goal will
be challenging to reach and will require a determined effort by all levels of government and industry. 2009
constituted one of the worst global recessions since the 1930s, and the current economic environment is still
subdued. Nonetheless, the CTC remains steadfast in engaging in effective tourism marketing and market
development activities to support Canada’s national tourism revenue goal.
30 2012-2016 corporate plan summary
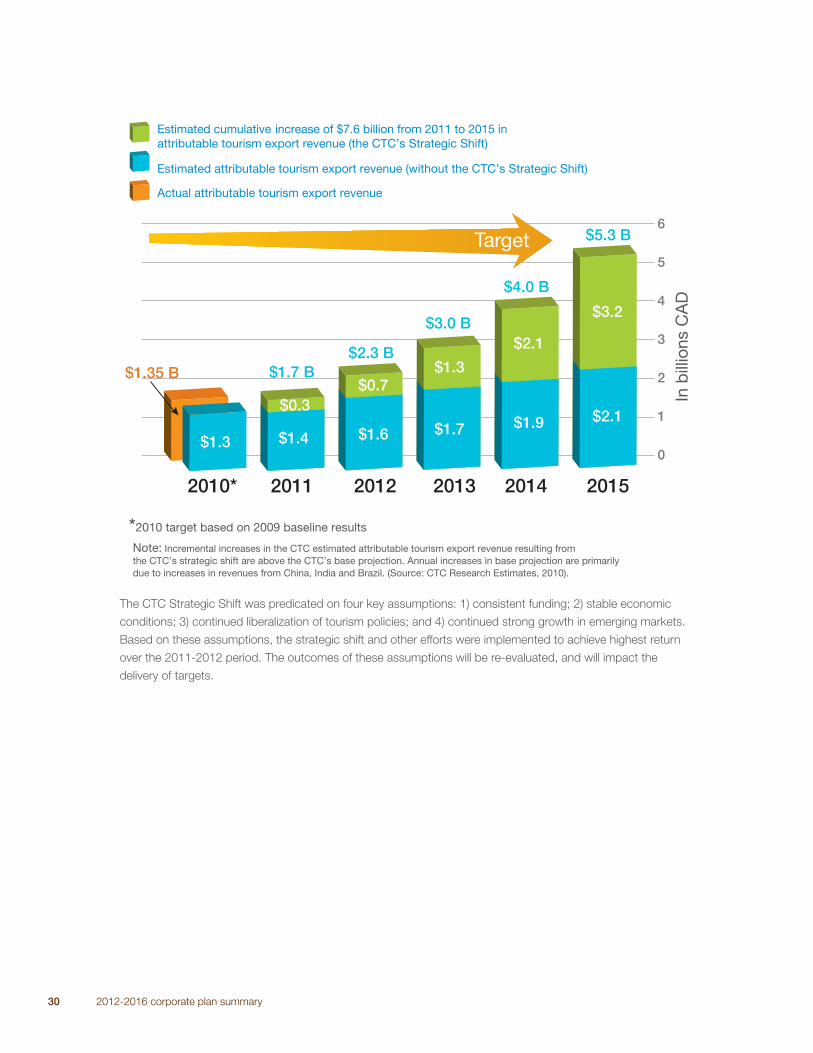
Estimated attributable tourism export revenue (without the CTC’s Strategic Shift)
Actual attributable tourism export revenue
Estimated cumulative increase of $7.6 billion from 2011 to 2015 in attributable tourism export revenue (the CTC’s Strategic Shift)
*2010 target based on 2009 baseline results
Target
Note: Incremental increases in the CTC estimated attributable tourism export revenue resulting from the CTC’s strategic shift are above the CTC’s base projection. Annual increases in base projection are primarily due to increases in revenues from China, India and Brazil. (Source: CTC Research Estimates, 2010).
2010* 2011 2012 2013 2014 2015
$2.1
$3.2
$1.9
$2.1
$1.7
$1.3
$1.6
$0.7
$1.4
$5.3 B
$4.0 B
$3.0 B
$2.3 B$1.7 B
$0.3
$1.3
$1.35 B
0
1
2
3
4
5
6
In b
illio
ns C
AD
The CTC Strategic Shift was predicated on four key assumptions: 1) consistent funding; 2) stable economic
conditions; 3) continued liberalization of tourism policies; and 4) continued strong growth in emerging markets.
Based on these assumptions, the strategic shift and other efforts were implemented to achieve highest return
over the 2011-2012 period. The outcomes of these assumptions will be re-evaluated, and will impact the
delivery of targets.
2012-2016 corporate plan summary 31
Objective 2: Focus on markets where Canada’s tourism brand
leads and which yield the highest return on investment
Key Measures
• Marketing campaign ROI
• Program ROI
• Number of people converted
• Economic contribution of the CTC’s MC&IT program
• Attributable tourism export revenue
• Attributable jobs created and/or maintained
• Attributable federal tax revenue
Key Strategies
• We will concentrate on those geographic markets or consumer market segments where
marketing at the national level (i.e. Canada’s tourism brand) leads to the highest potential for
return on investment.
• We will convert high-yield customers by investing in appropriate communication channels based on
insights from customer segmentation research and the path to purchase model.
Focusing on where Canada’s tourism brand leads
The CTC decides how to allocate its resources across key international markets every year, based on our
own strategic investment models that advise on how to achieve maximum return across the portfolio. These
models have guided recent decisions to maintain a focus on the UK, France, Germany and Australia as strong
traditional markets, as well as growing activities in China, South Korea, India and Brazil as important emerging
markets. We have also maintained our focus on Meetings, Conventions and Incentive Travel (including in the
US), given the lucrative potential of this market segment, and remained active in Mexico to support a recovery
of this important traditional market following the effects of the new visa requirements introduced in 2009.
At the same time, the CTC has moved away from marketing to US leisure travellers (shifting leadership in that
area to our provincial and territorial partners) and direct-to-consumer advertising in Japan.
32 2012-2016 corporate plan summary
3.3 Priorities
The CTC’s plan has four key priorities for action:
• ensure customer relevancy and differentiate Canada;
• advance a culture of innovation and entrepreneurial development among tourism businesses;
• lead industry in international brand alignment and consistency; and
• foster organizational excellence.
For each priority, there is a series of detailed strategies that will allow us to meet our objectives and, ultimately,
our goal to increase tourism export revenues for Canada. For each priority, at least one key result has been
defi ned and a number of additional performance measures are listed in the Enterprise Balanced Scorecard.
Priority 1: Ensure customer relevancy and differentiate Canada
Key Measures
• Aided destination awareness
• Aided destination consideration
• Country brand rank
Key Strategies
• We will develop and maintain relevant communication with targeted potential travellers and ensure
that the marketing messaging they receive is relevant and addresses their interests and expectations
as consumers.
• We will position Canada’s tourism brand as a leading experiential brand in the world where travellers
create extraordinary stories all their own.
Learning more about the potential traveller
The idea behind “Canada. Keep Exploring” is to speak to the curious traveller, inviting them to live a life
less ordinary in a land defi ned by a spirit of geographic, cultural and personal exploration. While we still use
traditional demographic tools to fi nd our audience, we now have a more sophisticated tool for connecting with
those consumers who will be most receptive to our message. This proprietary social segmentation model is
called the Explorer Quotient® (EQ®). It allows us to understand not just how people travel, but why they travel.
The EQ® model segments consumers into nine types. Each type has its own psychographic profi le, giving us
much richer insight into consumer behaviours and preferences compared to demographic-based models. Using
the EQ® model, we can talk to travellers in their own language, matching their needs and desires with truly
unforgettable and relevant Canadian experiences.
2012-2016 corporate plan summary 33
Offering more compelling
experiences and content
Communicating a tourism experience is very different
from marketing a tourism product. When people
promote a product, they talk about what they have
to offer. When people communicate an experience,
they talk about what the consumer wants to feel. Our
promise to the traveller with “Canada. Keep Exploring”
is that when they visit Canada, they will have the
freedom to create their own unique, extraordinary and
authentic moments. Our brand identity standards detail
what is needed to tell stories about amazing Canadian
experiences, all in a way that complements our key
insights and appeals to our primary EQ® types. By
emphasizing such experiences refl ected in Canada’s
unique selling propositions, we strongly differentiate
Canada from other destinations. The goal is to surprise
potential travellers, change their perception of Canada
and inspire them to visit.
EQ®, our proprietary segmentation tool, is
changing the way that Canadian travel
experiences are developed, marketed and
sold. The EQ® tool gives us a deeper
understanding into travellers’ personal
beliefs, social values and views of the
world, including what travel experiences
they buy, what brands they like, what
media they watch and read, and even the
kinds of photos they like to take on
vacation. This kind of information is valuable
as it assists in building highly targeted
marketing campaigns.
For more information about EQ®,
visit the Resources section at
http://en-corporate.canada.travel
34 2012-2016 corporate plan summary
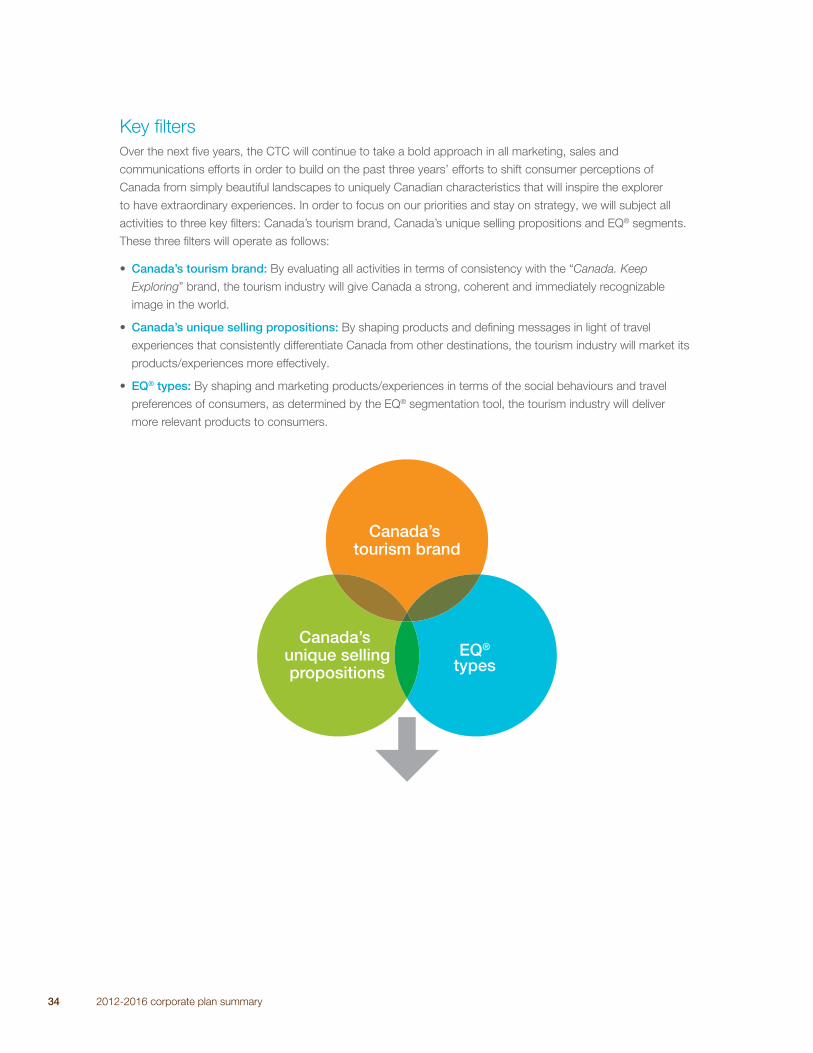
Key fi lters
Over the next fi ve years, the CTC will continue to take a bold approach in all marketing, sales and
communications efforts in order to build on the past three years’ efforts to shift consumer perceptions of
Canada from simply beautiful landscapes to uniquely Canadian characteristics that will inspire the explorer
to have extraordinary experiences. In order to focus on our priorities and stay on strategy, we will subject all
activities to three key fi lters: Canada’s tourism brand, Canada’s unique selling propositions and EQ® segments.
These three fi lters will operate as follows:
• Canada’s tourism brand: By evaluating all activities in terms of consistency with the “Canada. Keep
Exploring” brand, the tourism industry will give Canada a strong, coherent and immediately recognizable
image in the world.
• Canada’s unique selling propositions: By shaping products and defi ning messages in light of travel
experiences that consistently differentiate Canada from other destinations, the tourism industry will market its
products/experiences more effectively.
• EQ® types: By shaping and marketing products/experiences in terms of the social behaviours and travel
preferences of consumers, as determined by the EQ® segmentation tool, the tourism industry will deliver
more relevant products to consumers.
EQ®
types
Canada’s tourism brand
Canada’s unique sellingpropositions
2012-2016 corporate plan summary 35
The Signature Experiences Collection®
Building on the unique selling propositions for Canada, the Signature Experiences Collection® (SECTM) aims
to differentiate Canada from our competitors by highlighting the travel experiences that exemplify Canada’s
tourism brand – experiences that are memorable, authentic and engage the targeted international traveller
with our people, geography and culture. The program will help to shift travellers’ perceptions about Canada
so that they will understand us as a unique destination with more to offer than they imagined, and a sense of
urgency will be heightened.
Members of the SECTM (selected from an application-driven process twice each year) will become the priority
pool from which the CTC chooses content for advertising, media and trade activities. While this program aims
to improve Canada’s brand perceptions as a whole, there will be spin-off benefi ts to members.
For trade and media, the SECTM provides a fresh, new, provocative platform in the marketplace. And tourism
business operators in Canada have good incentive (and support) to evolve their product, further improving the
customer experience.
Expected outcomes:
• more international demand for Canadian experiences
• improved customer experience as tourism suppliers
elevate their experiences
• heightened awareness with travel trade of Canada’s
differentiating experiences
• better alignment of industry in support of Canada’s
tourism brand, leading to a smoother path to
purchase for travellers.
For more information on the Signature Experiences Collection®, visit www.canada.travel/sec.
Priority 2: Advance a culture of innovation and entrepreneurial
development among tourism businesses
Key Measures
• Member advocacy of SECTM program
Key Strategies
• We will work with the industry to foster the development and adoption of new tourism products and
business practices.
• We will aim to be recognized as one of the most innovative tourism marketing organizations in
the world by adopting new tools and technologies, using world-class research and cutting edge
multimedia marketing to keep Canada front-of-mind internationally.
36 2012-2016 corporate plan summary
The Innovation Next agenda
In May 2010, the Public Policy Forum organized Innovation Next, bringing together leaders from across
disciplines to discuss how to foster a deeper culture and practice of innovation in Canada for a more productive
economy and sustained prosperity.
A key conclusion from the event was that we need a broader understanding of what innovation is,
encompassing not just new technologies but also pioneering processes, original business models, creative
marketing techniques, inventive social movements and novel public policies. Additionally, participants agreed
that leadership from within each sector is needed, with key players stepping forward to provide the vision, policy
alignment and support for innovators to thrive. The CTC will support the Innovation Next agenda by providing
leadership for innovation in Canada’s tourism and marketing sectors.
Innovations at the CTC
Since 2005, innovation has been one of the CTC’s core values (along with collaboration and respect) and
is an essential foundation for our success. In this environment of tough competition and constant change
(in consumer preferences, marketing practices, technologies, etc.) we rely on innovative ideas to keep our
message fresh and relevant to consumers.
Over the last few years, we have had a number of important innovations in our marketing and business practices.
CTC Marketing Innovations
• Canada. Keep Exploring: Moved away from the dated, nature-based perceptions of Canada in
favour of a national tourism brand with a contemporary and compelling look and feel. Launching this
new brand was considered a bold move as many stakeholders and partners argued that Canada
was a collection of parts and that a coherent national brand would not be possible.
• EQ®: A more sophisticated customer segmentation tool to move us beyond traditional profi ling by
simple demographics (e.g. age and gender) and help us understand travellers’ preferences on a
deeper, more personalized level.
• Social Media: The CTC was an early adopter of the use of social media, starting in 2008, and
was one of the fi rst to have consumer campaigns based on user-generated content (e.g. TV spots
sourced from real experiences found on YouTube, print ads designed to look like Facebook and
Flickr, and online ads that feature Google Maps and Street View) as opposed to highly produced
advertisement. This has since been emulated by other major brands such as Disney.
• Signature Experiences Collection® (SECTM): A new way to connect Canada’s rich supply of
tourism experiences with consumers in international markets. The program also encourages
businesses to create and communicate tourism products in a way that resonates with international
customers.
2012-2016 corporate plan summary 37
CTC Innovations in Business Practices
• Research: State-of-the-art research tools, including the EQ® and our market investment models
to optimize marketing strategies.
• Performance Metrics: Measurements to quantify the value of our work, including leading-edge
methodologies for calculating the Return on Investment (ROI) from our marketing campaigns, as well
as the industry jobs and government revenues directly attributable to the CTC’s marketing activities.
Industry leadership
The CTC aims to not only foster innovation within our own organization but across Canada’s broader tourism
industry and the federal government as well. Apart from providing leadership to provincial and destination
marketing organizations on areas such as brand alignment and performance measurement, the CTC has
also demonstrated its leadership to federal departments with mutual interests, as demonstrated through the
establishment of memoranda of understanding around the clarity of roles with Parks Canada and the Atlantic
Canada Opportunities Agency.
Going forward, a particular challenge is the need for more entrepreneurs willing to take risks to bring new
tourism products to market. There is especially a need to foster this entrepreneurial spirit among small and
medium-sized enterprises as they are important cornerstones of the industry which support job creation. The
CTC will look for opportunities to provide leadership on this, and continue to support these business decisions
with information on market opportunities, market research tools like the EQ® and platforms like the SECTM.
Priority 3: Lead industry in international brand alignment and
consistency
Key Measures
• Partner brand alignment
• Partner satisfaction
Key Strategies
• We will provide a unifi ed voice internationally and drive alignment in key source markets.
• We will facilitate international marketplace access for brand-aligned Canadian SMEs with export-
ready products.
38 2012-2016 corporate plan summary
A complex and fragmented environment
With a number of Canadian organizations working to attract international travellers – including marketing bodies
from the municipal, regional, provincial/territorial and national levels – efforts can become fragmented. This weakens
Canada’s competitive position, with organizations duplicating efforts and sometimes working at cross purposes.
Further harmonization of the overall marketing system will help the industry make the best use of its collective
marketing resources and compete abroad at top strength. The CTC will encourage this greater harmonization,
focusing on the following initiatives:
1. Alignment of federal tourism investments. The federal government, through regional economic
development activities, funds a number of organizations to undertake international tourism marketing.
These investments require alignment to support logical roles, minimize duplication and ensure consistent
support for Canada’s tourism brand.
2. Working constructively. The CTC will foster discussion among our partners on our respective roles in
order to reduce redundancy and overlap. There is also a need to increase awareness that competitive
behavior between individual Canadian destinations in the international marketplace can hurt our
effectiveness and become an impediment to success for Canada.
3. Best practices in performance management. The CTC will promote alignment of best practices in
performance management including promoting a common understanding of key metrics such as ROI for
international marketing campaigns.
4. Best practices in destination marketing. The CTC will promote best practices in destination marketing in
order to align the broader Canadian spend more effectively. This will include efforts to better communicate
the CTC’s marketing strategy, including case studies and pilot projects to help illustrate the power of
marketing that speaks to the right people in the most appropriate channel.
5. Informing Canadian businesses and communities. The CTC will work with the Tourism Industry
Association of Canada to better inform Canadian businesses and communities about Canada’s tourism
opportunities, and ensure that players are well-informed of developments in the tourism policy landscape
and agree on advocacy priorities.
6. Alignment in the international marketplace. The CTC will pursue optimal alignment in how Canadian
tourism marketing organizations approach consumers in key international markets. This will include looking
at options like co-location with partners and bidding on General Sales Agent contracts put to tender by
Canadian provinces and territories when they are consistent with the CTC’s strategy.
Supporting SMEs to develop export-ready “experiences”
The CTC focuses its efforts on engaging with Canada’s tourism businesses that are capable of marketing
themselves in the global marketplace. The CTC will continue to work with SMEs to encourage them to think
of their Canada product as an experience. By providing export-ready businesses with support and resources,
such as market research, brand guides and experience toolkits, the CTC works to harness the collective voice
of Canadian tourism partners and advance Canada’s tourism brand in the world. To help them develop powerful
and consistent messages for the marketplace, we have developed the following toolkits:
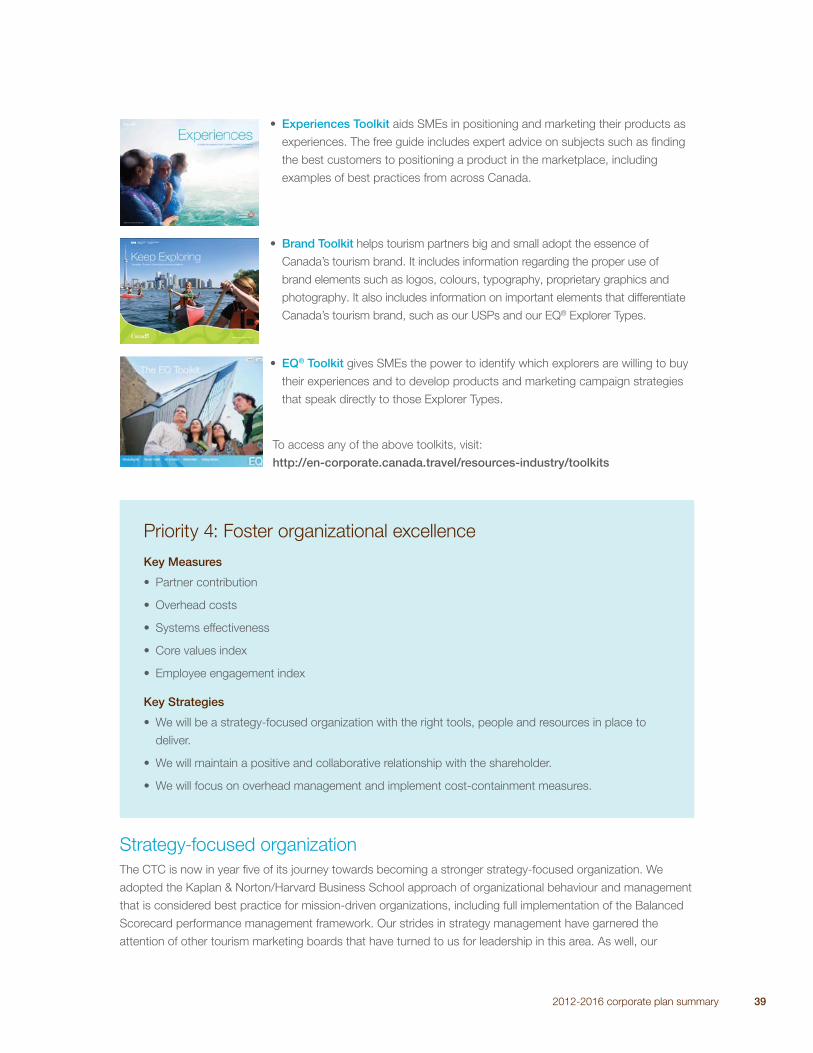
2012-2016 corporate plan summary 39
• Experiences Toolkit aids SMEs in positioning and marketing their products as
experiences. The free guide includes expert advice on subjects such as fi nding
the best customers to positioning a product in the marketplace, including
examples of best practices from across Canada.
• Brand Toolkit helps tourism partners big and small adopt the essence of
Canada’s tourism brand. It includes information regarding the proper use of
brand elements such as logos, colours, typography, proprietary graphics and
photography. It also includes information on important elements that differentiate
Canada’s tourism brand, such as our USPs and our EQ® Explorer Types.
• EQ® Toolkit gives SMEs the power to identify which explorers are willing to buy
their experiences and to develop products and marketing campaign strategies
that speak directly to those Explorer Types.
To access any of the above toolkits, visit:
http://en-corporate.canada.travel/resources-industry/toolkits
Priority 4: Foster organizational excellence
Key Measures
• Partner contribution
• Overhead costs
• Systems effectiveness
• Core values index
• Employee engagement index
Key Strategies
• We will be a strategy-focused organization with the right tools, people and resources in place to
deliver.
• We will maintain a positive and collaborative relationship with the shareholder.
• We will focus on overhead management and implement cost-containment measures.
Strategy-focused organization
The CTC is now in year fi ve of its journey towards becoming a stronger strategy-focused organization. We
adopted the Kaplan & Norton/Harvard Business School approach of organizational behaviour and management
that is considered best practice for mission-driven organizations, including full implementation of the Balanced
Scorecard performance management framework. Our strides in strategy management have garnered the
attention of other tourism marketing boards that have turned to us for leadership in this area. As well, our
40 2012-2016 corporate plan summary
expertise in performance measurement was featured as a case study in the recent edition of the Balanced
Scorecard Report published by Harvard Business School Publishing. We have developed and implemented
a series of tools specifi c to the discipline of destination marketing that helps guide the planning process to
complement our comprehensive strategic management framework. Both resources guide execution against our
strategy. Our corporate strategy will continue to drive operational planning, resource allocation, target setting,
and marketing and sales, and will remain the fi lter for all organizational decision making.
Fostering a positive corporate culture
The CTC aims to foster a work environment that promotes and celebrates our core values, operational
excellence, and entrepreneurial spirit. We utilize our sound market intelligence to take risks and drive innovation,
such as investing in emerging markets and undertaking creative marketing through tools such as the SECTM and
EQ®. We will continue to invest in training, management and leadership development to ensure that we have
the right talent in the right positions. Through our human resources strategy, we will also continue to focus on
strategic talent management and develop the practices and tools needed to support the delivery of corporate
objectives and priorities.
Maintaining focus on government relations
The CTC has a number of government and private-sector stakeholders and one shareholder (the federal
government). Over the 2012-2016 period, we will continue our focus on government relations, and will monitor
and respond to all opportunities for governmental support. It is imperative that the CTC establish, build and
maintain relationships with key government offi cials and policy makers. We will facilitate open communication
with federal departments and monitor public policy, as well as parliamentary, political and media issues that
could affect our organization and the tourism industry.
Effective communication
The success of our organization depends on our ability to partner effectively with the private sector, as well as
with the governments of Canada, the provinces and the territories. The health of these partnerships hinges in
turn on effective communication. Industry, public and shareholder engagement will increase as we proactively
communicate with the relevant players.
Corporate reporting
The CTC respects statutory reporting obligations that ensure the proper accountability to Parliament, including
the annual tabling of corporate plans and annual reports. We will continue to submit quality corporate
documents that are clearly and concisely presented, aligned with government strategic priorities and delivered
within established statutory time frames.
Offi cial languages
We are committed to both offi cial languages having equality of status, rights and privileges within the CTC.
Staff in both our Vancouver and Ottawa offi ces provide services and communicate with our stakeholders,
suppliers and partners in their preferred offi cial language. Our corporate culture promotes the effective use of
both offi cial languages in the workplace. We are also committed to involving the English and French linguistic
minority tourism business communities in Canada, to ensure fair access to our tourism support services. These
endeavours will continue over the 2012-2016 period.
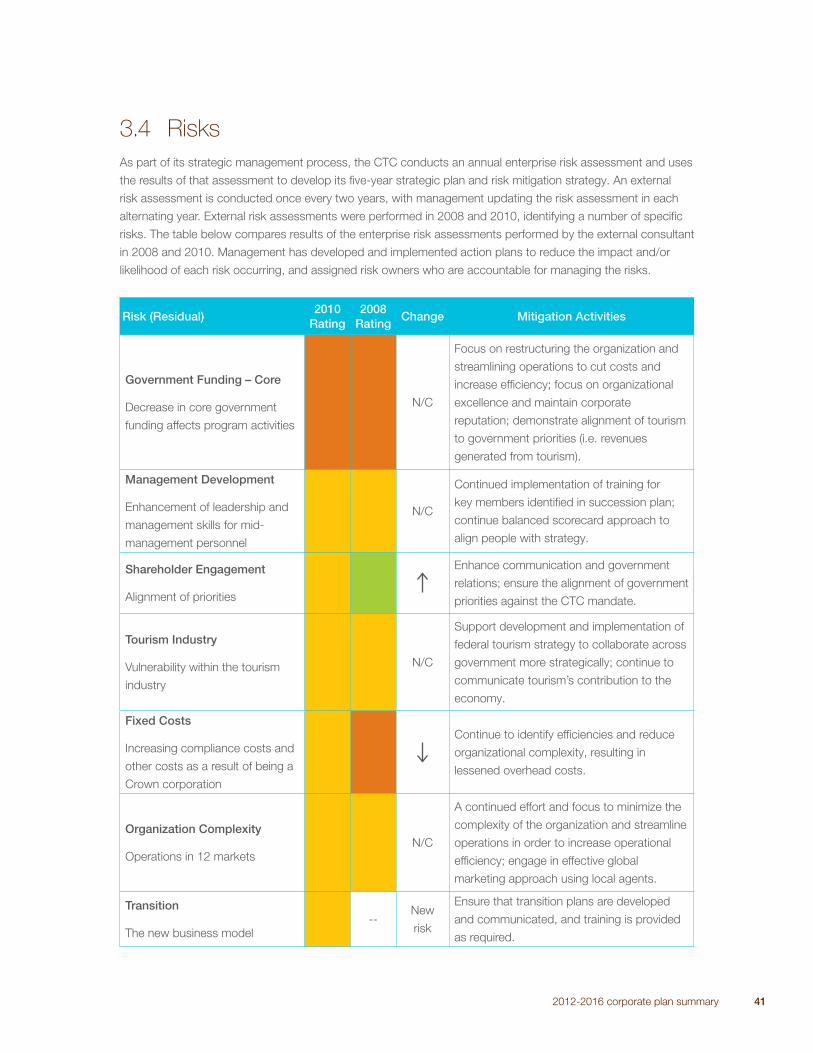
2012-2016 corporate plan summary 41
3.4 Risks
As part of its strategic management process, the CTC conducts an annual enterprise risk assessment and uses
the results of that assessment to develop its fi ve-year strategic plan and risk mitigation strategy. An external
risk assessment is conducted once every two years, with management updating the risk assessment in each
alternating year. External risk assessments were performed in 2008 and 2010, identifying a number of specifi c
risks. The table below compares results of the enterprise risk assessments performed by the external consultant
in 2008 and 2010. Management has developed and implemented action plans to reduce the impact and/or
likelihood of each risk occurring, and assigned risk owners who are accountable for managing the risks.
Risk (Residual)2010
Rating2008
RatingChange Mitigation Activities
Government Funding – Core
Decrease in core government
funding affects program activities
N/C
Focus on restructuring the organization and
streamlining operations to cut costs and
increase effi ciency; focus on organizational
excellence and maintain corporate
reputation; demonstrate alignment of tourism
to government priorities (i.e. revenues
generated from tourism).
Management Development
Enhancement of leadership and
management skills for mid-
management personnel
N/C
Continued implementation of training for
key members identifi ed in succession plan;
continue balanced scorecard approach to
align people with strategy.
Shareholder Engagement
Alignment of priorities
Enhance communication and government
relations; ensure the alignment of government
priorities against the CTC mandate.
Tourism Industry
Vulnerability within the tourism
industry
N/C
Support development and implementation of
federal tourism strategy to collaborate across
government more strategically; continue to
communicate tourism’s contribution to the
economy.
Fixed Costs
Increasing compliance costs and
other costs as a result of being a
Crown corporation
Continue to identify effi ciencies and reduce
organizational complexity, resulting in
lessened overhead costs.
Organization Complexity
Operations in 12 markets
N/C
A continued effort and focus to minimize the
complexity of the organization and streamline
operations in order to increase operational
effi ciency; engage in effective global
marketing approach using local agents.
Transition
The new business model
--New
risk
Ensure that transition plans are developed
and communicated, and training is provided
as required.
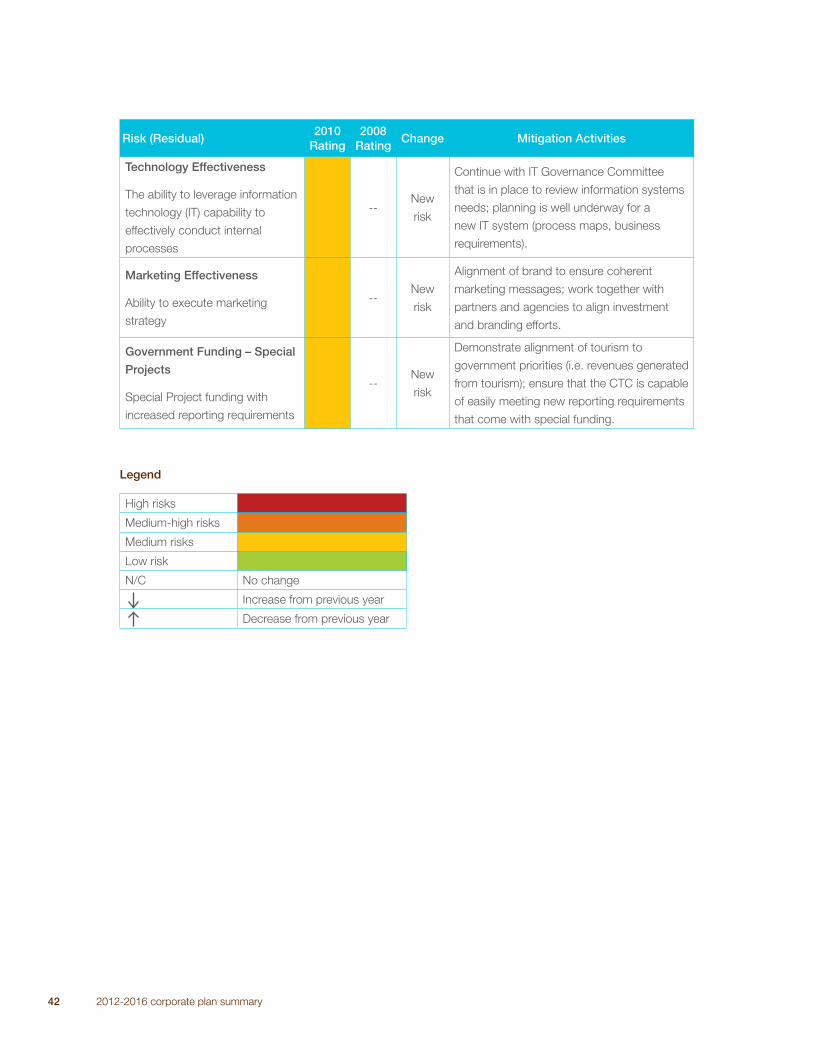
42 2012-2016 corporate plan summary
Risk (Residual)2010
Rating2008
RatingChange Mitigation Activities
Technology Effectiveness
The ability to leverage information
technology (IT) capability to
effectively conduct internal
processes
--New
risk
Continue with IT Governance Committee
that is in place to review information systems
needs; planning is well underway for a
new IT system (process maps, business
requirements).
Marketing Effectiveness
Ability to execute marketing
strategy
--New
risk
Alignment of brand to ensure coherent
marketing messages; work together with
partners and agencies to align investment
and branding efforts.
Government Funding – Special
Projects
Special Project funding with
increased reporting requirements
--New
risk
Demonstrate alignment of tourism to
government priorities (i.e. revenues generated
from tourism); ensure that the CTC is capable
of easily meeting new reporting requirements
that come with special funding.
Legend
High risks
Medium-high risks
Medium risks
Low risk
N/C No change
Increase from previous year
Decrease from previous year
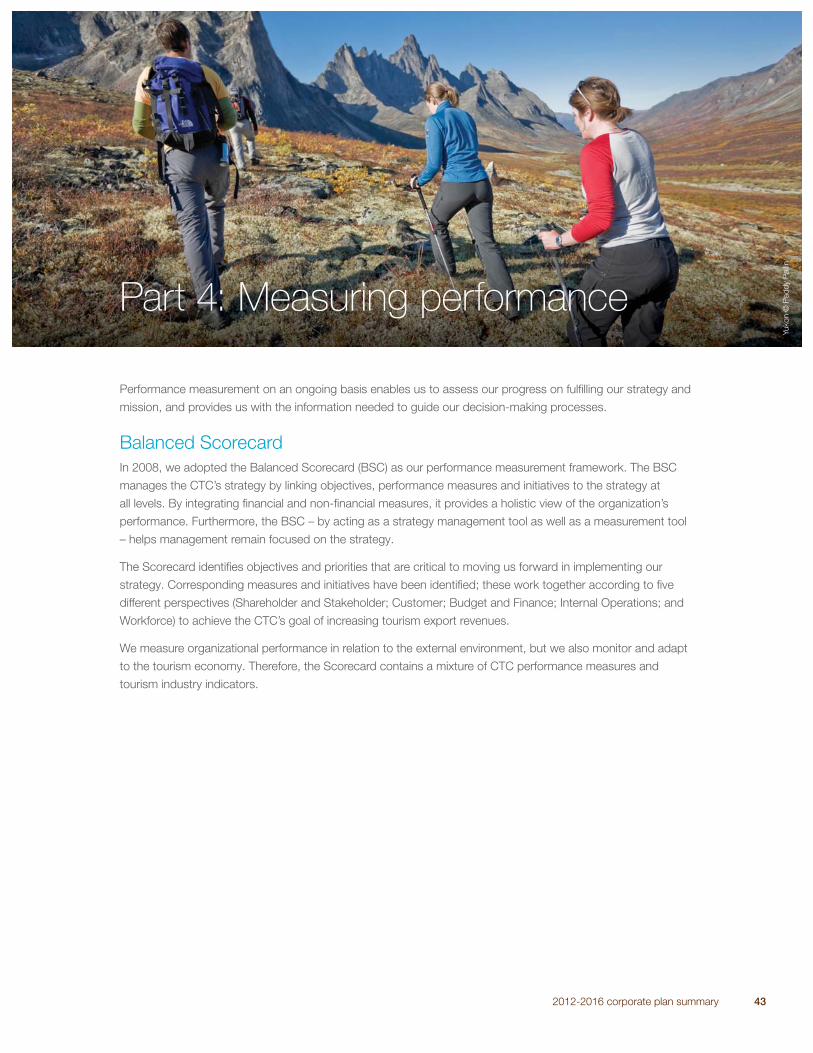
2012-2016 corporate plan summary 43
Performance measurement on an ongoing basis enables us to assess our progress on fulfi lling our strategy and
mission, and provides us with the information needed to guide our decision-making processes.
Balanced Scorecard
In 2008, we adopted the Balanced Scorecard (BSC) as our performance measurement framework. The BSC
manages the CTC’s strategy by linking objectives, performance measures and initiatives to the strategy at
all levels. By integrating fi nancial and non-fi nancial measures, it provides a holistic view of the organization’s
performance. Furthermore, the BSC – by acting as a strategy management tool as well as a measurement tool
– helps management remain focused on the strategy.
The Scorecard identifi es objectives and priorities that are critical to moving us forward in implementing our
strategy. Corresponding measures and initiatives have been identifi ed; these work together according to fi ve
different perspectives (Shareholder and Stakeholder; Customer; Budget and Finance; Internal Operations; and
Workforce) to achieve the CTC’s goal of increasing tourism export revenues.
We measure organizational performance in relation to the external environment, but we also monitor and adapt
to the tourism economy. Therefore, the Scorecard contains a mixture of CTC performance measures and
tourism industry indicators.
Part 4: Measuring performance
Yukon ©
Pad
dy P
allin
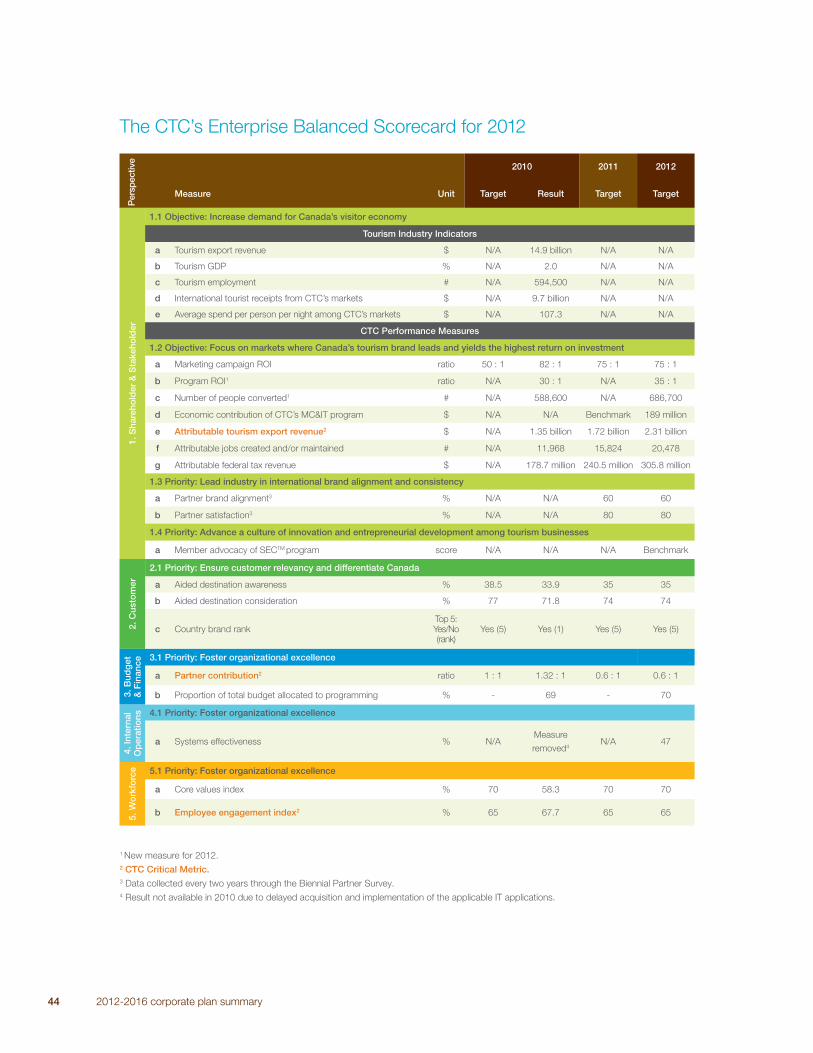
44 2012-2016 corporate plan summary
The CTC’s Enterprise Balanced Scorecard for 2012
2010 2011 2012
Measure Unit Target Result Target Target
1. S
hare
hold
er &
Sta
keho
lder
1.1 Objective: Increase demand for Canada’s visitor economy
Tourism Industry Indicators
a Tourism export revenue $ N/A 14.9 billion N/A N/A
b Tourism GDP % N/A 2.0 N/A N/A
c Tourism employment # N/A 594,500 N/A N/A
d International tourist receipts from CTC’s markets $ N/A 9.7 billion N/A N/A
e Average spend per person per night among CTC’s markets $ N/A 107.3 N/A N/A
CTC Performance Measures
1.2 Objective: Focus on markets where Canada’s tourism brand leads and yields the highest return on investment
a Marketing campaign ROI ratio 50 : 1 82 : 1 75 : 1 75 : 1
b Program ROI1 ratio N/A 30 : 1 N/A 35 : 1
c Number of people converted1 # N/A 588,600 N/A 686,700
d Economic contribution of CTC’s MC&IT program $ N/A N/A Benchmark 189 million
e Attributable tourism export revenue2 $ N/A 1.35 billion 1.72 billion 2.31 billion
f Attributable jobs created and/or maintained # N/A 11,968 15,824 20,478
g Attributable federal tax revenue $ N/A 178.7 million 240.5 million 305.8 million
1.3 Priority: Lead industry in international brand alignment and consistency
a Partner brand alignment3 % N/A N/A 60 60
b Partner satisfaction3 % N/A N/A 80 80
1.4 Priority: Advance a culture of innovation and entrepreneurial development among tourism businesses
a Member advocacy of SECTM program score N/A N/A N/A Benchmark
2. C
usto
mer
2.1 Priority: Ensure customer relevancy and differentiate Canada
a Aided destination awareness % 38.5 33.9 35 35
b Aided destination consideration % 77 71.8 74 74
c Country brand rankTop 5: Yes/No (rank)
Yes (5) Yes (1) Yes (5) Yes (5)
3. B
udg
et
& F
inan
ce
3.1 Priority: Foster organizational excellence
a Partner contribution2 ratio 1 : 1 1.32 : 1 0.6 : 1 0.6 : 1
b Proportion of total budget allocated to programming % - 69 - 70
4. In
tern
al
Op
erat
ions 4.1 Priority: Foster organizational excellence
a Systems effectiveness % N/AMeasure
removed4N/A 47
5. W
ork
forc
e 5.1 Priority: Foster organizational excellence
a Core values index % 70 58.3 70 70
b Employee engagement index2 % 65 67.7 65 65
Per
spec
tive
1 New measure for 2012.
2 CTC Critical Metric.3 Data collected every two years through the Biennial Partner Survey.
4 Result not available in 2010 due to delayed acquisition and implementation of the applicable IT applications.
2012-2016 corporate plan summary 45
Defi nitions of 2012 Enterprise Balanced Scorecard measures
1.1a Tourism export revenue: Total spend by foreign visitors on Canadian-produced tourism goods and
services. Purchases may take place outside of Canada if the goods or services are supplied by a Canadian
company (e.g. purchase of an airline ticket from a Canadian international carrier for travel to Canada). Source:
National Tourism Indicators, Statistics Canada.
1.1b Tourism Gross Domestic Product (GDP): Unduplicated value of production, within the boundaries of
a region, of goods and services purchased by tourists, represented as a share of total GDP. Source: National
Tourism Indicators, Statistics Canada.
1.1c Tourism employment: Number of jobs generated, directly or indirectly, by tourism spending. It is based
on an estimate of jobs rather than “hours of work.” Thus, someone who works 10 hours a week counts for
as much, by this measure, as someone who works 50 hours a week. Source: National Tourism Indicators,
Statistics Canada.
1.1d International tourist receipts from CTC’s markets: Total spend by visitors from CTC’s core markets
on Canadian-produced tourism goods and services during stays of at least one night. Purchases may take
place outside of Canada if the goods or services are supplied by a Canadian company, e.g. purchase of an
airline ticket from a Canadian international carrier for travel to Canada. Source: International Travel Survey,
Statistics Canada.
1.1e Average spend per person per night among CTC’s markets: Measure of yield achieved from inbound
visitors from CTC’s core markets, based on total trip spend and the number of nights spent in Canada.
1.2a Marketing campaign ROI: Value of tourist receipts generated by CTC’s consumer marketing campaigns
per dollar spent to execute the campaign. This form of conversion counts those individuals who were
considering travelling to Canada but had not yet booked a trip prior to being exposed to the campaign, and
were positively infl uenced to visit or book a trip to Canada upon seeing the advertising.
1.2b Program ROI: Value of tourism export revenue generated by CTC’s consumer marketing campaigns per
dollar spent to execute the collective marketing program (includes consumer advertising campaigns, consumer
shows, media and public relations, and trade development activities). This form of conversion counts those
individuals who were considering travelling to Canada but had not yet booked a trip prior to being exposed to
the campaign, and were positively infl uenced to visit or book a trip to Canada upon seeing the advertising.
1.2c Number of people converted: Number of people who converted as a result of CTC’s core marketing
campaigns over those that recalled the CTC core campaigns. Calculated as the proportion of travellers that
recalled seeing the advertising against the size of the long-haul population, aged 18 and over.
1.2d Economic contribution of CTC’s MC&IT leads conversion: The attributable tourism export revenue
for Canada generated as a result of CTC’s MC&IT leads conversion into defi nite business, calculated as: (Total
# of converted leads into defi nite business) x (Average visitor spending for meeting/travel type (i.e. corporate
meetings, association meetings or incentive travel)). Average spend data from Destination Marketing Association
International (DMAI).
1.2e Attributable tourism export revenue: Export tourism revenue (see defi nition for 1.1a ) that is attributable
to CTC’s leisure travel and MC&IT activities.
1.2f Attributable jobs created and/or maintained: Estimated attributable employment from tourism revenue
generated by CTC’s marketing, travel trade & MC&IT programs. Source: Statistics Canada data.
46 2012-2016 corporate plan summary
1.2g Attributable federal tax revenue: Estimated attributable federal tax revenue generated by CTC’s
marketing, travel trade and MC&IT programs. Calculations based on CTC’s Advertising Tracking and Conversion
Studies data and Statistics Canada’s Government Revenue Attributable to Tourism (GRAT) indicators. For every
$100 of tourism spending, the federal government collects $12.98 (domestic tourism) and $13.96 (export –
non-residents).
1.3a Partner brand alignment: Percentage of partners who have aligned with at least one element of the
CTC brand: visual identity (e.g. logo, colour palette, typography, pattern bar graphics); tone and writing style;
experiential photography style; and/or assets (video, text, social media). Source: CTC Biennial Partner Survey.
1.3b Partner satisfaction: Percentage of partners who are satisfi ed with their relationship with the CTC.
Source: CTC’s Biennial Partner Survey.
1.4a Member advocacy of the SECTM program: The extent that Canadian tourism suppliers featured in the
Signature Experiences Collection® believe in the value of the program, and therefore, advocate the program to
other Canadian tourism businesses and suppliers within the industry. This score will be determined via a survey
to SECTM members at the end of 2012.
2.1a Aided destination awareness: Percentage of long-haul travellers in CTC markets who rate their
knowledge of vacation opportunities in Canada as “excellent” or “very good” after having been prompted with a
set of predetermined destinations.
2.1b Aided destination consideration: Percentage of long-haul travellers in CTC markets who are somewhat
or very interested in visiting Canada in the next two years when prompted about Canada among a set of
competitive destinations.
2.1c Country brand rank: Annual rank of country brands, according to FutureBrand’s Country Brand Index.
The approach incorporates a global quantitative survey, expert opinions and external statistics which are
compared and combined to better understand drivers, preference, importance and relativism of country brands.
3.1a Partner contribution: Ratio of total partner contributions (cash, in-kind, parallel, 3rd party) versus CTC
investment (Parliamentary appropriations). Does not include $5M received in 2011-2012 for the one-time
Calgary Stampede Anniversary Program.
3.1b Proportion of total budget allocated to programming: Percentage of the CTC’s total budget, exclusive
of partner contributions, allocated to programming. Programming excludes overhead costs, operating
expenditures and compensation.
4.1a Systems effectiveness: Employee satisfaction with the support provided by applicable IT applications, as
measured through the CTC’s annual Internal Survey
5.1a Core values index: Average value of three Employee Survey questions regarding how the company
overall effectively demonstrates the CTC’s core values of innovation, collaboration and respect.
5.1b Employee engagement index: An index measuring an employee’s belief in the CTC’s mission and vision,
and their commitment to the CTC as demonstrated through their hard work, passion and organizational pride.
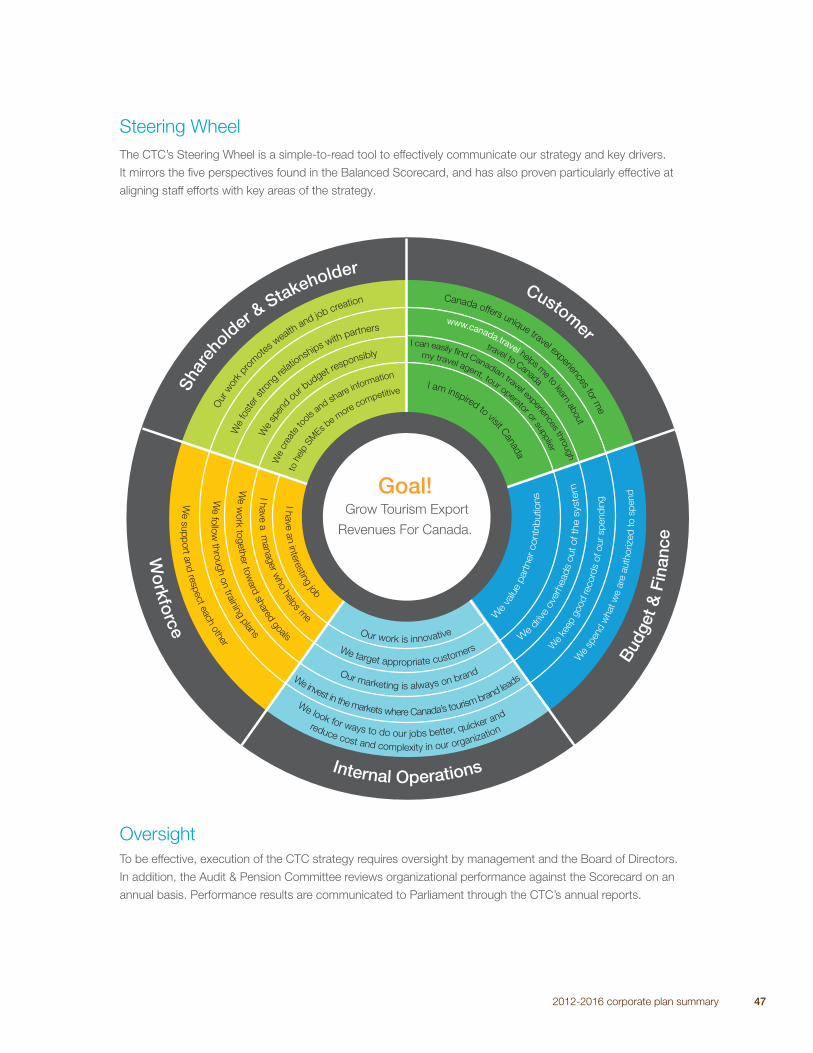
2012-2016 corporate plan summary 47
Steering Wheel
The CTC’s Steering Wheel is a simple-to-read tool to effectively communicate our strategy and key drivers.
It mirrors the fi ve perspectives found in the Balanced Scorecard, and has also proven particularly effective at
aligning staff efforts with key areas of the strategy.Sh
areh
older & Stakeholder
Our w
ork
prom
otes
wealth
and job creation
We c
reat
e to
ols
and sh
are information
We s
up
port a
nd
respect e
ach o
ther W
e fo
llow
thro
ugh o
n tra
inin
g p
lans
We w
ork
togeth
er to
ward
shared
goals
I have a
n in
tere
sting job
I have a
manager w
ho h
elps m
e
We fost
er s
tro
ng re
lationsh
ips with partners
We
spen
d ou
r budget re
sponsibly
We look for ways to do our jobs better, quicker and
We invest in the markets where Canada’s tourism brand leads
Our marketing is always on brand
We target appropriate customers
Our work is innovative
Canada offers unique travel experiences for m
e
www.canada.travel helps m
e to learn about
I am inspired to visit Can
ada
I can easily find Canadian travel experience
s thro
ugh
Customer
Budg
et &
Fin
ance
Internal Operations
Wo
rkforce
Goal! Grow Tourism Export
Revenues For Canada.
We
spen
d w
hat w
e a
re a
uth
orized
to s
pend
We
keep
good record
s o
f our
sp
end
ing
We
valu
e p
artner contr
ibutions
We
driv
e o
verh
eads o
ut of th
e s
yste
m
to h
elp S
M
Es be
more competitive
travel to Canada
my travel agent, tour operator or su
pplie
r
reduce cost and complexity in our organization
Oversight
To be effective, execution of the CTC strategy requires oversight by management and the Board of Directors.
In addition, the Audit & Pension Committee reviews organizational performance against the Scorecard on an
annual basis. Performance results are communicated to Parliament through the CTC’s annual reports.
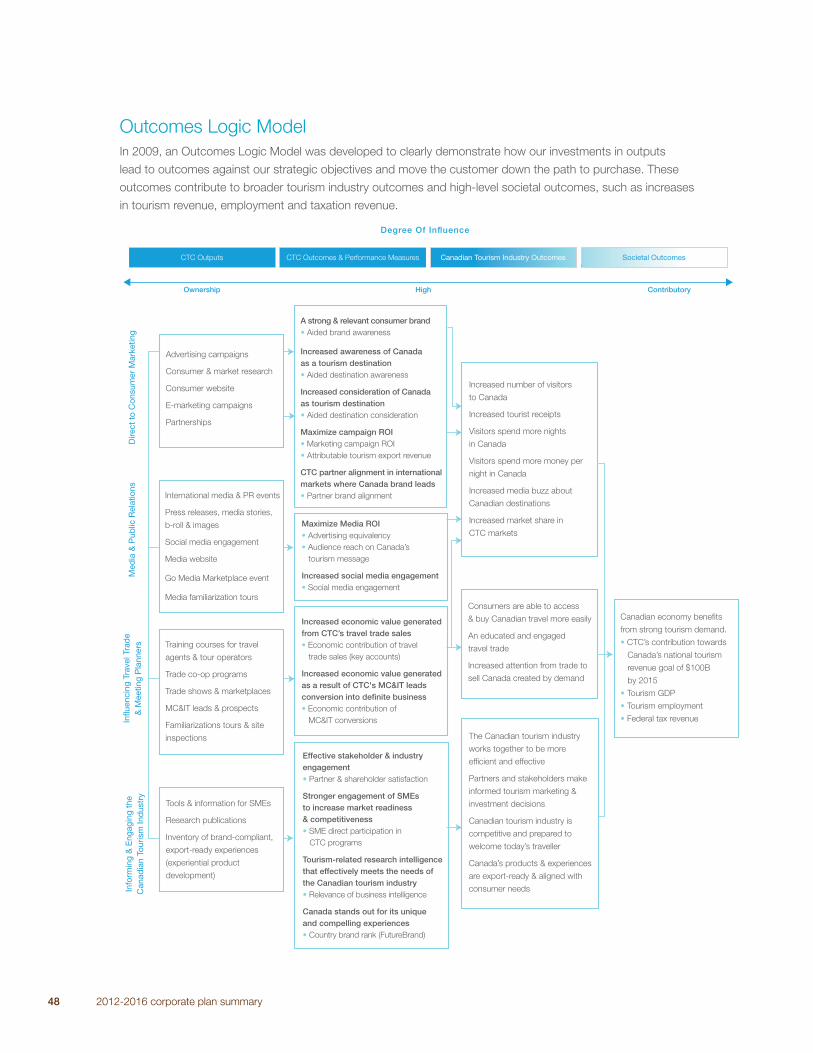
48 2012-2016 corporate plan summary
Outcomes Logic Model
In 2009, an Outcomes Logic Model was developed to clearly demonstrate how our investments in outputs
lead to outcomes against our strategic objectives and move the customer down the path to purchase. These
outcomes contribute to broader tourism industry outcomes and high-level societal outcomes, such as increases
in tourism revenue, employment and taxation revenue.
Dire
ct to
Con
sum
er M
arke
ting
Med
ia &
Pub
lic R
elat
ions
In
fluen
cing
Tra
vel T
rade
&
Mee
ting
Pla
nner
s In
form
ing
& E
ngag
ing
the
Can
adia
n To
uris
m In
dust
ry
Societal OutcomesCanadian Tourism Industry OutcomesCTC Outcomes & Performance Measures
Degree Of Influence
CTC Outputs
Ownership High Contributory
Advertising campaigns
Consumer & market research
Consumer website
E-marketing campaigns
Partnerships
A strong & relevant consumer brand Aided brand awareness
Increased awareness of Canada as a tourism destination Aided destination awareness
Increased consideration of Canada as tourism destination Aided destination consideration
Maximize campaign ROI Marketing campaign ROI
Attributable tourism export revenue
CTC partner alignment in international markets where Canada brand leads Partner brand alignment
Increased number of visitors
to Canada
Increased tourist receipts
Visitors spend more nights
in Canada
Visitors spend more money per
night in Canada
Increased media buzz about
Canadian destinations
Increased market share in
CTC markets
Canadian economy benefits
from strong tourism demand.
CTC’s contribution towards
Canada’s national tourism
revenue goal of $100B
by 2015
Tourism GDP
Tourism employment
Federal tax revenue
Consumers are able to access
& buy Canadian travel more easily
An educated and engaged
travel trade
Increased attention from trade to
sell Canada created by demand
The Canadian tourism industry
works together to be more
efficient and effective
Partners and stakeholders make
informed tourism marketing &
investment decisions
Canadian tourism industry is
competitive and prepared to
welcome today’s traveller
Canada’s products & experiences
are export-ready & aligned with
consumer needs
Effective stakeholder & industry engagement
Partner & shareholder satisfaction
Stronger engagement of SMEs to increase market readiness & competitiveness SME direct participation in
CTC programs
Tourism-related research intelligence that effectively meets the needs of the Canadian tourism industry Relevance of business intelligence
Canada stands out for its unique and compelling experiences Country brand rank (FutureBrand)
Maximize Media ROI Advertising equivalency
Audience reach on Canada’s
tourism message
Increased social media engagementSocial media engagement
Increased economic value generated from CTC’s travel trade sales Economic contribution of travel
trade sales (key accounts)
Increased economic value generated as a result of CTC's MC&IT leads conversion into definite business Economic contribution of
MC&IT conversions
Training courses for travel
agents & tour operators
Trade co-op programs
Trade shows & marketplaces
MC&IT leads & prospects
Familiarizations tours & site
inspections
Tools & information for SMEs
Research publications
Inventory of brand-compliant,
export-ready experiences
(experiential product
development)
International media & PR events
Press releases, media stories,
b-roll & images
Social media engagement
Media website
Go Media Marketplace event
Media familiarization tours

2012-2016 corporate plan summary 49
CTC fi nancial statements, forecast and capital budget
The fi nancial analysis includes actual and projected fi nancial information for the fi scal years 2010 to 2016.
Specifi cally, the following CTC fi nancial statements and forecasts are included:
• A Statement of Financial Position as at December 31, 2010 to December 31, 2016;
• A Statement of Operations, Comprehensive Income and Accumulated Surplus for the years ending
December 31, 2010 to December 31, 2016;
• A Statement of Change in Net Assets for the years ending December 31, 2010 to December 31, 2016.
• A Statement of Cash Flow for the years ending December 31, 2010 to December 31, 2016;
• A Reconciliation of Parliamentary Appropriations to Government Fiscal Year for the years ending December
31, 2010 to December 31, 2016;
• Reconciliation of the Year Ended December 31, 2010 from Canadian generally accepted accounting
principles to Public sector accounting standards; and
• Operating and Capital Budgets for the years ending December 31, 2010 to December 31, 2012.
As a federal Crown corporation, the CTC or “the Commission” is largely funded through appropriations. Core
funding is currently at $72 million. Funding levels have fl uctuated since the inception of the organization due
to one-time funding, and adjustments to the core funding to take into account transfers from other agencies/
departments.
The CTC is an organization that actively partners with industry to develop marketing programs. Although in
most partnership arrangements the CTC is not the organization that disburses the funds, this does occur in
some cases. The CTC received approximately $16 million from partners in 2010. Corresponding program
expenses offset these funds.
Part 5: Our fi nancial plan
Calg
ary
, A
lbert
a
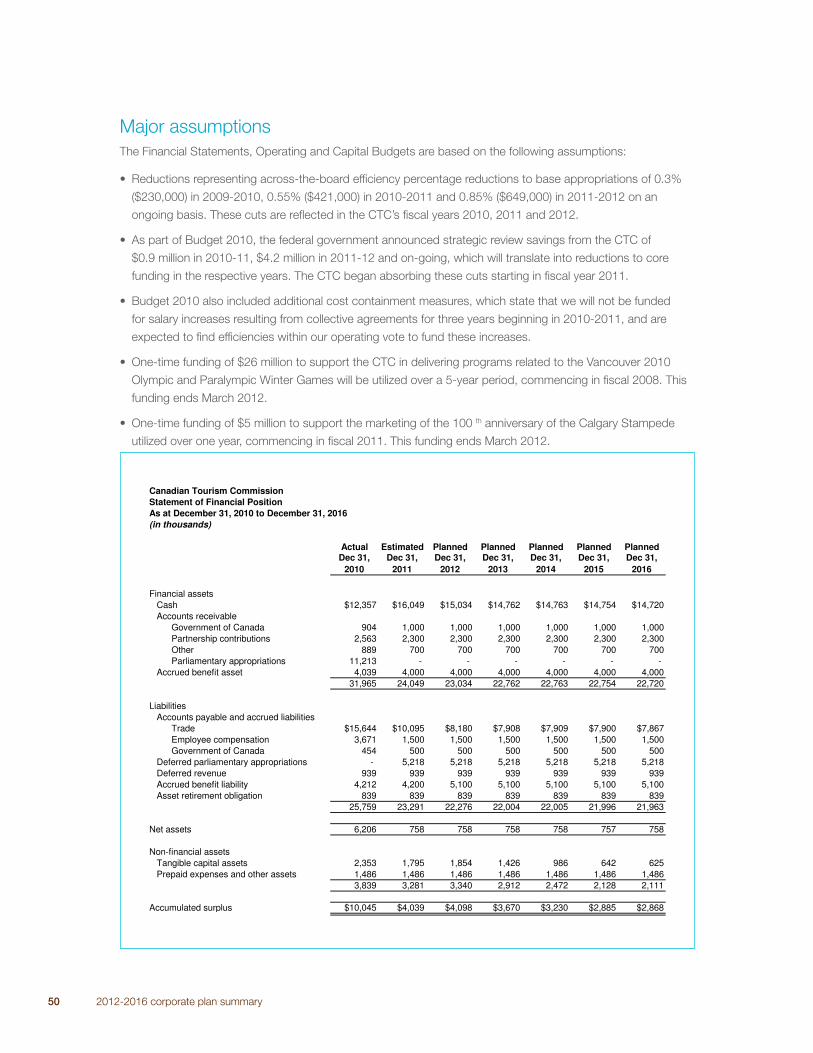
50 2012-2016 corporate plan summary
Major assumptions
The Financial Statements, Operating and Capital Budgets are based on the following assumptions:
• Reductions representing across-the-board effi ciency percentage reductions to base appropriations of 0.3%
($230,000) in 2009-2010, 0.55% ($421,000) in 2010-2011 and 0.85% ($649,000) in 2011-2012 on an
ongoing basis. These cuts are refl ected in the CTC’s fi scal years 2010, 2011 and 2012.
• As part of Budget 2010, the federal government announced strategic review savings from the CTC of
$0.9 million in 2010-11, $4.2 million in 2011-12 and on-going, which will translate into reductions to core
funding in the respective years. The CTC began absorbing these cuts starting in fi scal year 2011.
• Budget 2010 also included additional cost containment measures, which state that we will not be funded
for salary increases resulting from collective agreements for three years beginning in 2010-2011, and are
expected to fi nd effi ciencies within our operating vote to fund these increases.
• One-time funding of $26 million to support the CTC in delivering programs related to the Vancouver 2010
Olympic and Paralympic Winter Games will be utilized over a 5-year period, commencing in fi scal 2008. This
funding ends March 2012.
• One-time funding of $5 million to support the marketing of the 100 th anniversary of the Calgary Stampede
utilized over one year, commencing in fi scal 2011. This funding ends March 2012.
Canadian Tourism CommissionStatement of Financial PositionAs at December 31, 2010 to December 31, 2016(in thousands)
Actual Estimated Planned Planned Planned Planned PlannedDec 31,
2010Dec 31,
2011Dec 31,
2012Dec 31,
2013Dec 31,
2014Dec 31,
2015Dec 31,
2016
Financial assets Cash $12,357 $16,049 $15,034 $14,762 $14,763 $14,754 $14,720 Accounts receivable Government of Canada 904 1,000 1,000 1,000 1,000 1,000 1,000 Partnership contributions 2,563 2,300 2,300 2,300 2,300 2,300 2,300 Other 889 700 700 700 700 700 700 Parliamentary appropriations 11,213 - - - - - - Accrued benefit asset 4,039 4,000 4,000 4,000 4,000 4,000 4,000
31,965 24,049 23,034 22,762 22,763 22,754 22,720
Liabilities Accounts payable and accrued liabilities Trade $15,644 $10,095 $8,180 $7,908 $7,909 $7,900 $7,867 Employee compensation 3,671 1,500 1,500 1,500 1,500 1,500 1,500 Government of Canada 454 500 500 500 500 500 500 Deferred parliamentary appropriations - 5,218 5,218 5,218 5,218 5,218 5,218 Deferred revenue 939 939 939 939 939 939 939 Accrued benefit liability 4,212 4,200 5,100 5,100 5,100 5,100 5,100 Asset retirement obligation 839 839 839 839 839 839 839
25,759 23,291 22,276 22,004 22,005 21,996 21,963
Net assets 6,206 758 758 758 758 757 758
Non-financial assets Tangible capital assets 2,353 1,795 1,854 1,426 986 642 625 Prepaid expenses and other assets 1,486 1,486 1,486 1,486 1,486 1,486 1,486
3,839 3,281 3,340 2,912 2,472 2,128 2,111
Accumulated surplus $10,045 $4,039 $4,098 $3,670 $3,230 $2,885 $2,868
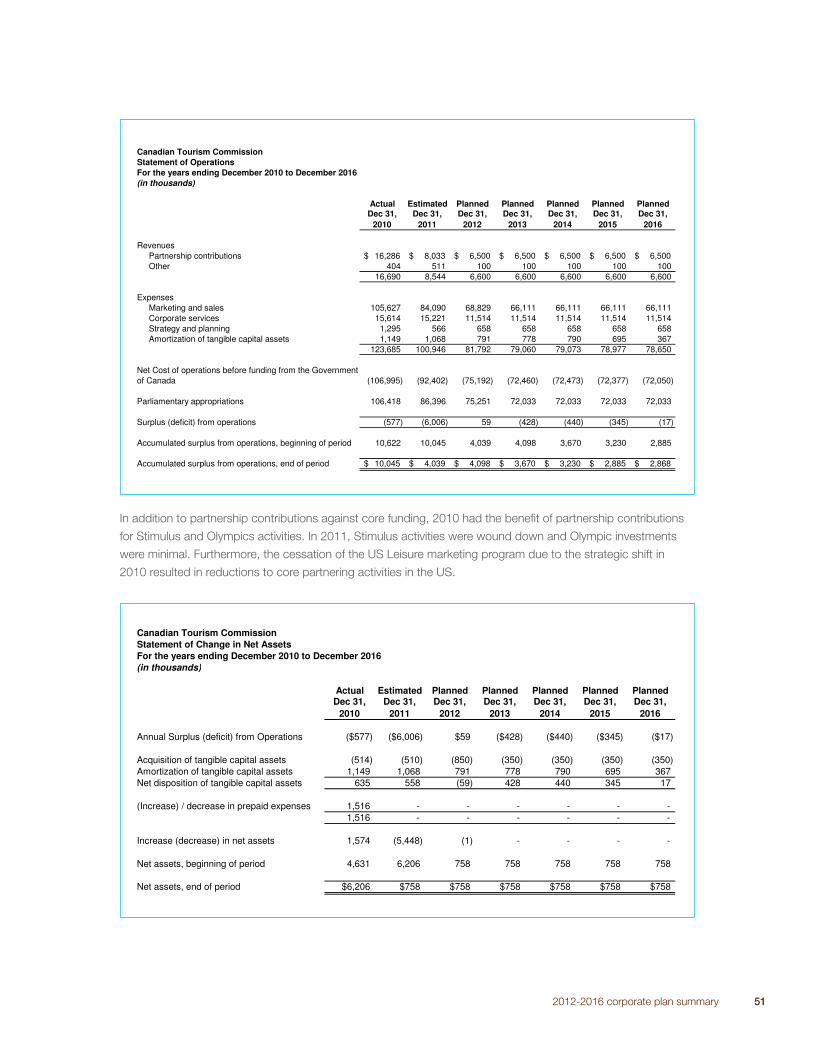
2012-2016 corporate plan summary 51
Canadian Tourism CommissionStatement of OperationsFor the years ending December 2010 to December 2016(in thousands)
Actual Estimated Planned Planned Planned Planned PlannedDec 31,
2010Dec 31,
2011Dec 31,
2012Dec 31,
2013Dec 31,
2014Dec 31,
2015Dec 31,
2016
RevenuesPartnership contributions 16,286$ 8,033$ 6,500$ 6,500$ 6,500$ 6,500$ 6,500$ Other 404 511 100 100 100 100 100
16,690 8,544 6,600 6,600 6,600 6,600 6,600
ExpensesMarketing and sales 105,627 84,090 68,829 66,111 66,111 66,111 66,111 Corporate services 15,614 15,221 11,514 11,514 11,514 11,514 11,514 Strategy and planning 1,295 566 658 658 658 658 658 Amortization of tangible capital assets 1,149 1,068 791 778 790 695 367
123,685 100,946 81,792 79,060 79,073 78,977 78,650
(106,995) (92,402) (75,192) (72,460) (72,473) (72,377) (72,050)
Parliamentary appropriations 106,418 86,396 75,251 72,033 72,033 72,033 72,033
Surplus (deficit) from operations (577) (6,006) 59 (428) (440) (345) (17)
Accumulated surplus from operations, beginning of period 10,622 10,045 4,039 4,098 3,670 3,230 2,885
Accumulated surplus from operations, end of period 10,045$ 4,039$ 4,098$ 3,670$ 3,230$ 2,885$ 2,868$
Net Cost of operations before funding from the Government of Canada
In addition to partnership contributions against core funding, 2010 had the benefi t of partnership contributions
for Stimulus and Olympics activities. In 2011, Stimulus activities were wound down and Olympic investments
were minimal. Furthermore, the cessation of the US Leisure marketing program due to the strategic shift in
2010 resulted in reductions to core partnering activities in the US.
Canadian Tourism CommissionStatement of Change in Net AssetsFor the years ending December 2010 to December 2016(in thousands)
Actual Estimated Planned Planned Planned Planned PlannedDec 31,
2010Dec 31,
2011Dec 31,
2012Dec 31,
2013Dec 31,
2014Dec 31,
2015Dec 31,
2016
Annual Surplus (deficit) from Operations ($577) ($6,006) $59 ($428) ($440) ($345) ($17)
Acquisition of tangible capital assets (514) (510) (850) (350) (350) (350) (350)Amortization of tangible capital assets 1,149 1,068 791 778 790 695 367 Net disposition of tangible capital assets 635 558 (59) 428 440 345 17
(Increase) / decrease in prepaid expenses 1,516 - - - - - - 1,516 - - - - - -
Increase (decrease) in net assets 1,574 (5,448) (1) - - - -
Net assets, beginning of period 4,631 6,206 758 758 758 758 758
Net assets, end of period $6,206 $758 $758 $758 $758 $758 $758
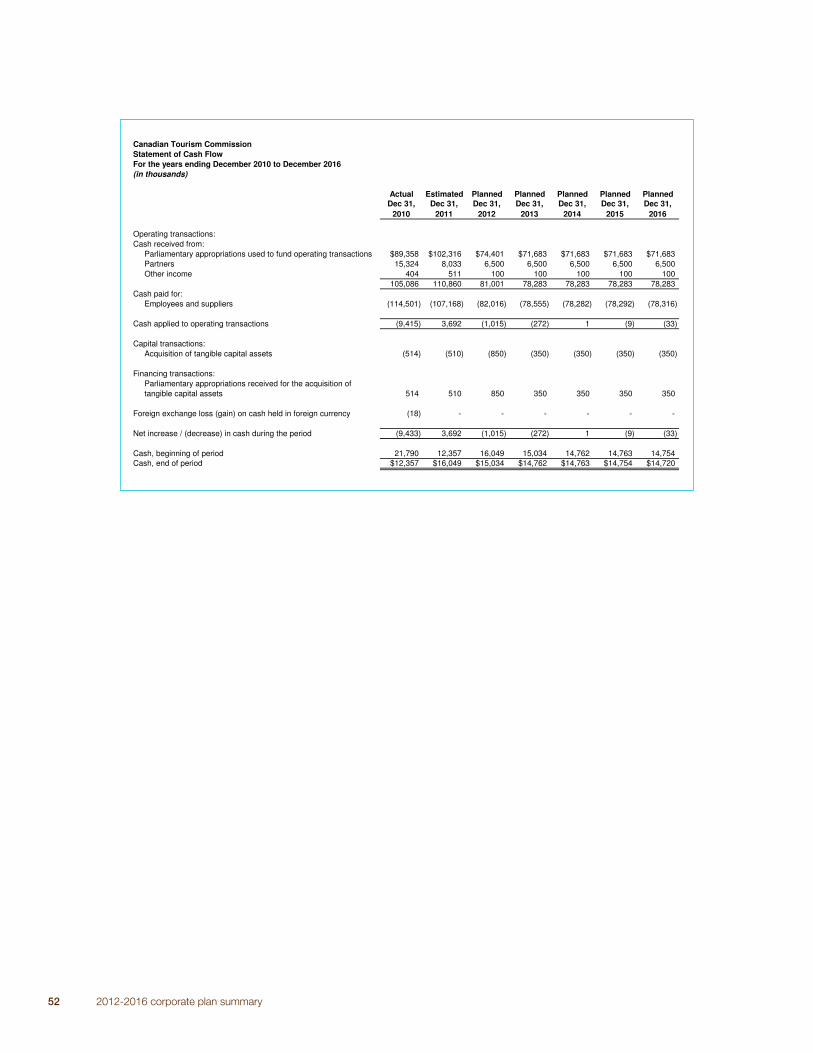
52 2012-2016 corporate plan summary
Canadian Tourism CommissionStatement of Cash FlowFor the years ending December 2010 to December 2016(in thousands)
Actual Estimated Planned Planned Planned Planned PlannedDec 31,
2010Dec 31,
2011Dec 31,
2012Dec 31,
2013Dec 31,
2014Dec 31,
2015Dec 31,
2016
Operating transactions:Cash received from:
Parliamentary appropriations used to fund operating transactions $89,358 $102,316 $74,401 $71,683 $71,683 $71,683 $71,683 Partners 15,324 8,033 6,500 6,500 6,500 6,500 6,500 Other income 404 511 100 100 100 100 100
105,086 110,860 81,001 78,283 78,283 78,283 78,283 Cash paid for:
Employees and suppliers (114,501) (107,168) (82,016) (78,555) (78,282) (78,292) (78,316)
Cash applied to operating transactions (9,415) 3,692 (1,015) (272) 1 (9) (33)
Capital transactions:Acquisition of tangible capital assets (514) (510) (850) (350) (350) (350) (350)
Financing transactions:Parliamentary appropriations received for the acquisition of tangible capital assets 514 510 850 350 350 350 350
Foreign exchange loss (gain) on cash held in foreign currency (18) - - - - - -
Net increase / (decrease) in cash during the period (9,433) 3,692 (1,015) (272) 1 (9) (33)
Cash, beginning of period 21,790 12,357 16,049 15,034 14,762 14,763 14,754 Cash, end of period $12,357 $16,049 $15,034 $14,762 $14,763 $14,754 $14,720
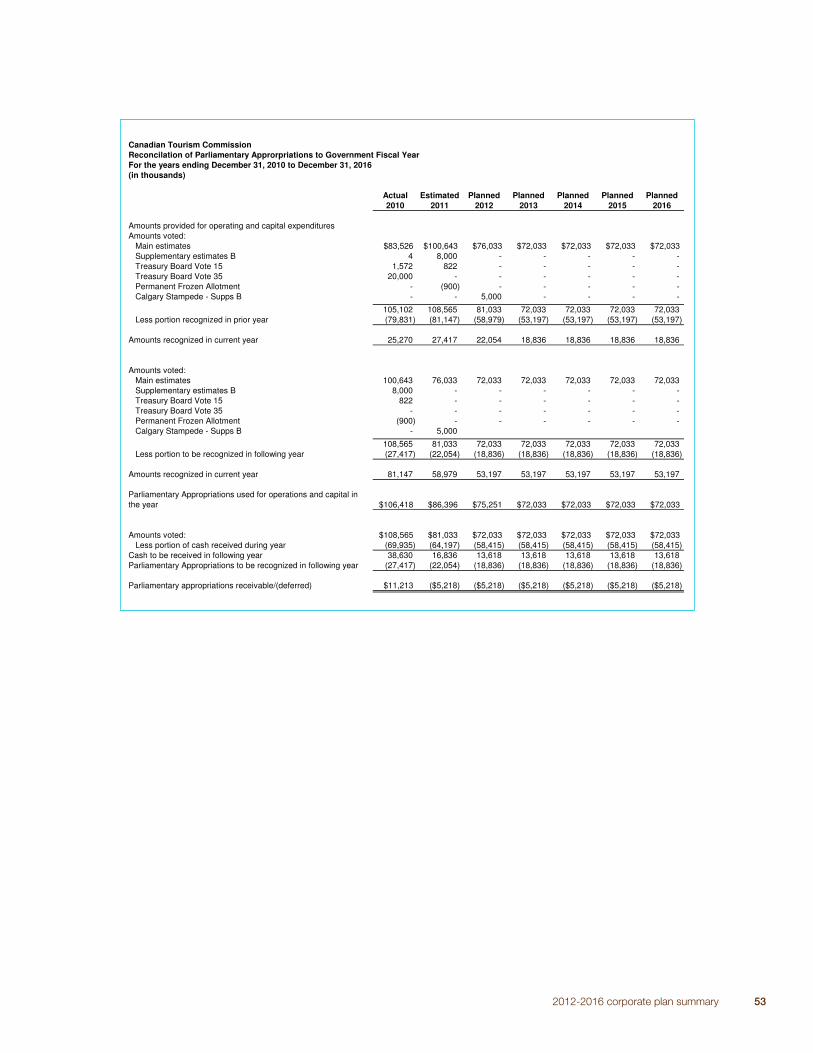
2012-2016 corporate plan summary 53
Canadian Tourism CommissionReconcilation of Parliamentary Approrpriations to Government Fiscal YearFor the years ending December 31, 2010 to December 31, 2016(in thousands)
Actual Estimated Planned Planned Planned Planned Planned2010 2011 2012 2013 2014 2015 2016
Amounts provided for operating and capital expendituresAmounts voted:
Main estimates $83,526 $100,643 $76,033 $72,033 $72,033 $72,033 $72,033 Supplementary estimates B 4 8,000 - - - - - Treasury Board Vote 15 1,572 822 - - - - - Treasury Board Vote 35 20,000 - - - - - - Permanent Frozen Allotment - (900) - - - - - Calgary Stampede - Supps B - - 5,000 - - - -
105,102 108,565 81,033 72,033 72,033 72,033 72,033 Less portion recognized in prior year (79,831) (81,147) (58,979) (53,197) (53,197) (53,197) (53,197)
Amounts recognized in current year 25,270 27,417 22,054 18,836 18,836 18,836 18,836
Amounts voted:Main estimates 100,643 76,033 72,033 72,033 72,033 72,033 72,033 Supplementary estimates B 8,000 - - - - - - Treasury Board Vote 15 822 - - - - - - Treasury Board Vote 35 - - - - - - - Permanent Frozen Allotment (900) - - - - - - Calgary Stampede - Supps B - 5,000
108,565 81,033 72,033 72,033 72,033 72,033 72,033 Less portion to be recognized in following year (27,417) (22,054) (18,836) (18,836) (18,836) (18,836) (18,836)
Amounts recognized in current year 81,147 58,979 53,197 53,197 53,197 53,197 53,197
Parliamentary Appropriations used for operations and capital in the year $106,418 $86,396 $75,251 $72,033 $72,033 $72,033 $72,033
Amounts voted: $108,565 $81,033 $72,033 $72,033 $72,033 $72,033 $72,033 Less portion of cash received during year (69,935) (64,197) (58,415) (58,415) (58,415) (58,415) (58,415)
Cash to be received in following year 38,630 16,836 13,618 13,618 13,618 13,618 13,618 Parliamentary Appropriations to be recognized in following year (27,417) (22,054) (18,836) (18,836) (18,836) (18,836) (18,836)
Parliamentary appropriations receivable/(deferred) $11,213 ($5,218) ($5,218) ($5,218) ($5,218) ($5,218) ($5,218)
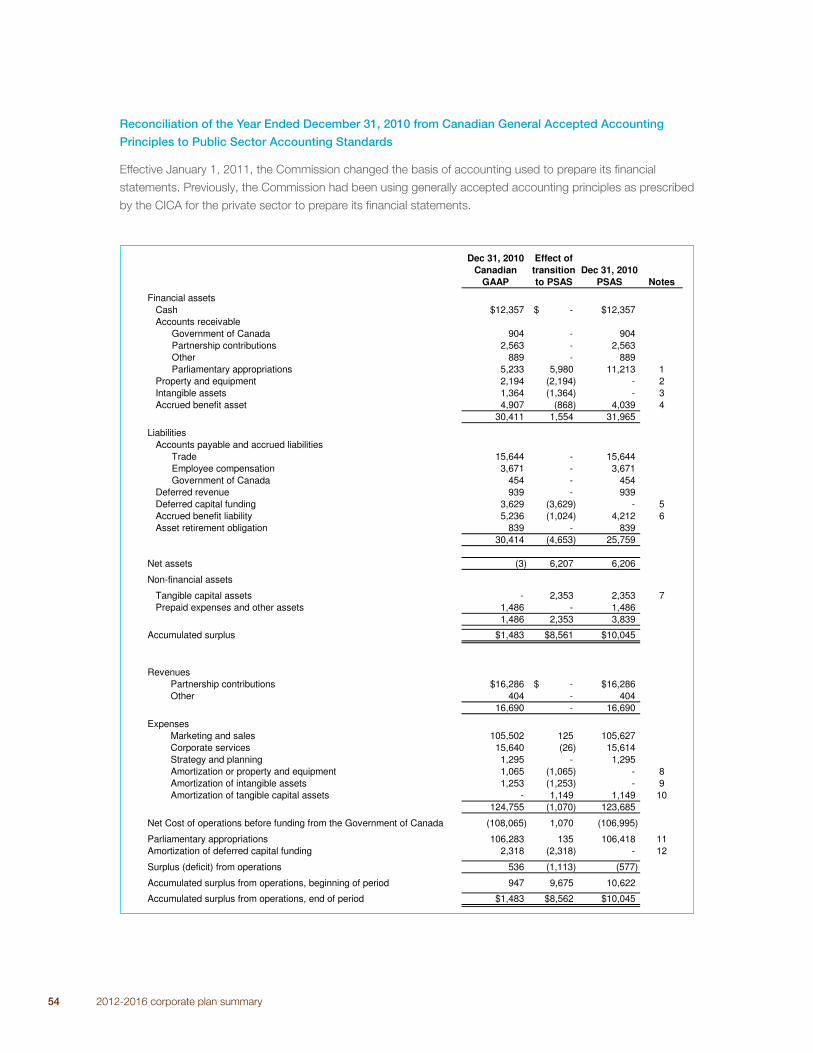
54 2012-2016 corporate plan summary
Reconciliation of the Year Ended December 31, 2010 from Canadian General Accepted Accounting
Principles to Public Sector Accounting Standards
Effective January 1, 2011, the Commission changed the basis of accounting used to prepare its fi nancial
statements. Previously, the Commission had been using generally accepted accounting principles as prescribed
by the CICA for the private sector to prepare its fi nancial statements.
Dec 31, 2010 Effect ofCanadian transition Dec 31, 2010
GAAP to PSAS PSAS Notes
Financial assets Cash $12,357 -$ $12,357 Accounts receivable Government of Canada 904 - 904 Partnership contributions 2,563 - 2,563 Other 889 - 889 Parliamentary appropriations 5,233 5,980 11,213 1 Property and equipment 2,194 (2,194) - 2 Intangible assets 1,364 (1,364) - 3 Accrued benefit asset 4,907 (868) 4,039 4
30,411 1,554 31,965
Liabilities Accounts payable and accrued liabilities Trade 15,644 - 15,644 Employee compensation 3,671 - 3,671 Government of Canada 454 - 454 Deferred revenue 939 - 939 Deferred capital funding 3,629 (3,629) - 5 Accrued benefit liability 5,236 (1,024) 4,212 6 Asset retirement obligation 839 - 839
30,414 (4,653) 25,759
Net assets (3) 6,207 6,206
Non-financial assets Tangible capital assets - 2,353 2,353 7 Prepaid expenses and other assets 1,486 - 1,486
1,486 2,353 3,839
Accumulated surplus $1,483 $8,561 $10,045
RevenuesPartnership contributions $16,286 -$ $16,286 Other 404 - 404
16,690 - 16,690
ExpensesMarketing and sales 105,502 125 105,627 Corporate services 15,640 (26) 15,614 Strategy and planning 1,295 - 1,295 Amortization or property and equipment 1,065 (1,065) - 8Amortization of intangible assets 1,253 (1,253) - 9Amortization of tangible capital assets - 1,149 1,149 10
124,755 (1,070) 123,685
Net Cost of operations before funding from the Government of Canada (108,065) 1,070 (106,995)
Parliamentary appropriations 106,283 135 106,418 11Amortization of deferred capital funding 2,318 (2,318) - 12
Surplus (deficit) from operations 536 (1,113) (577)
Accumulated surplus from operations, beginning of period 947 9,675 10,622
Accumulated surplus from operations, end of period $1,483 $8,562 $10,045
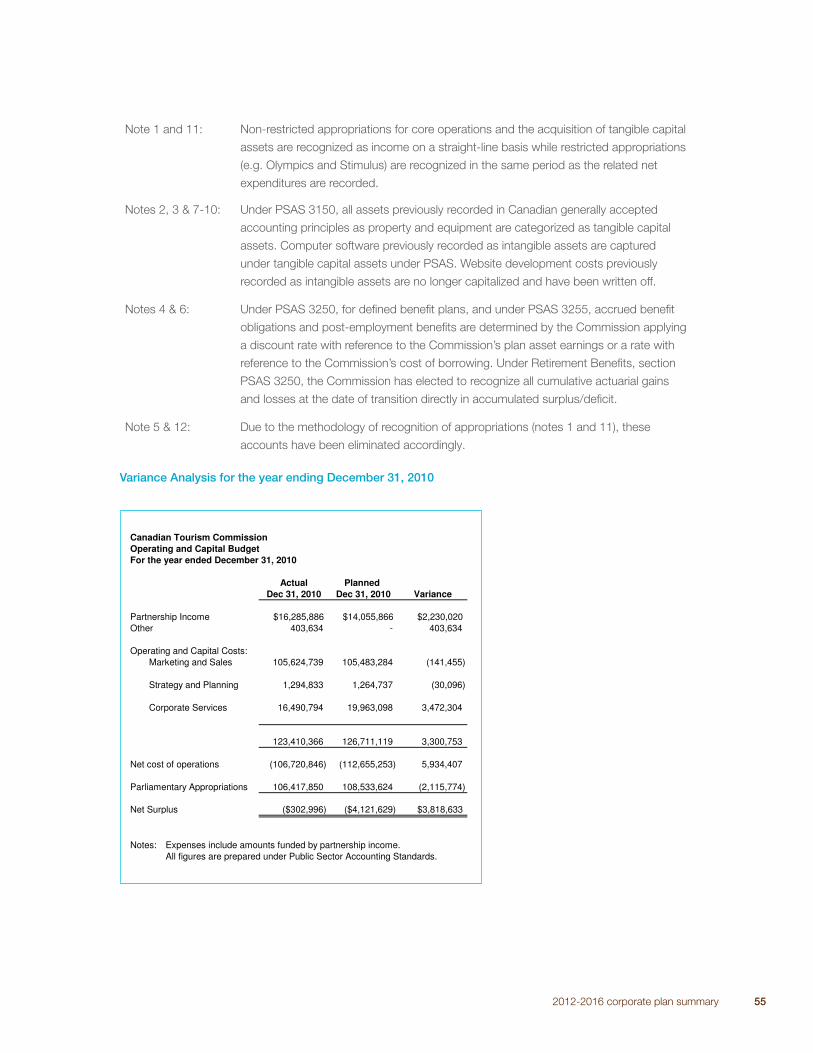
2012-2016 corporate plan summary 55
Note 1 and 11: Non-restricted appropriations for core operations and the acquisition of tangible capital
assets are recognized as income on a straight-line basis while restricted appropriations
(e.g. Olympics and Stimulus) are recognized in the same period as the related net
expenditures are recorded.
Notes 2, 3 & 7-10: Under PSAS 3150, all assets previously recorded in Canadian generally accepted
accounting principles as property and equipment are categorized as tangible capital
assets. Computer software previously recorded as intangible assets are captured
under tangible capital assets under PSAS. Website development costs previously
recorded as intangible assets are no longer capitalized and have been written off.
Notes 4 & 6: Under PSAS 3250, for defi ned benefi t plans, and under PSAS 3255, accrued benefi t
obligations and post-employment benefi ts are determined by the Commission applying
a discount rate with reference to the Commission’s plan asset earnings or a rate with
reference to the Commission’s cost of borrowing. Under Retirement Benefi ts, section
PSAS 3250, the Commission has elected to recognize all cumulative actuarial gains
and losses at the date of transition directly in accumulated surplus/defi cit.
Note 5 & 12: Due to the methodology of recognition of appropriations (notes 1 and 11), these
accounts have been eliminated accordingly.
Variance Analysis for the year ending December 31, 2010
Canadian Tourism CommissionOperating and Capital BudgetFor the year ended December 31, 2010
Actual Planned Dec 31, 2010 Dec 31, 2010 Variance
Partnership Income $16,285,886 $14,055,866 $2,230,020 Other 403,634 - 403,634
Operating and Capital Costs:Marketing and Sales 105,624,739 105,483,284 (141,455)
Strategy and Planning 1,294,833 1,264,737 (30,096)
Corporate Services 16,490,794 19,963,098 3,472,304
123,410,366 126,711,119 3,300,753
Net cost of operations (106,720,846) (112,655,253) 5,934,407
Parliamentary Appropriations 106,417,850 108,533,624 (2,115,774)
Net Surplus ($302,996) ($4,121,629) $3,818,633
Notes: Expenses include amounts funded by partnership income.All figures are prepared under Public Sector Accounting Standards.
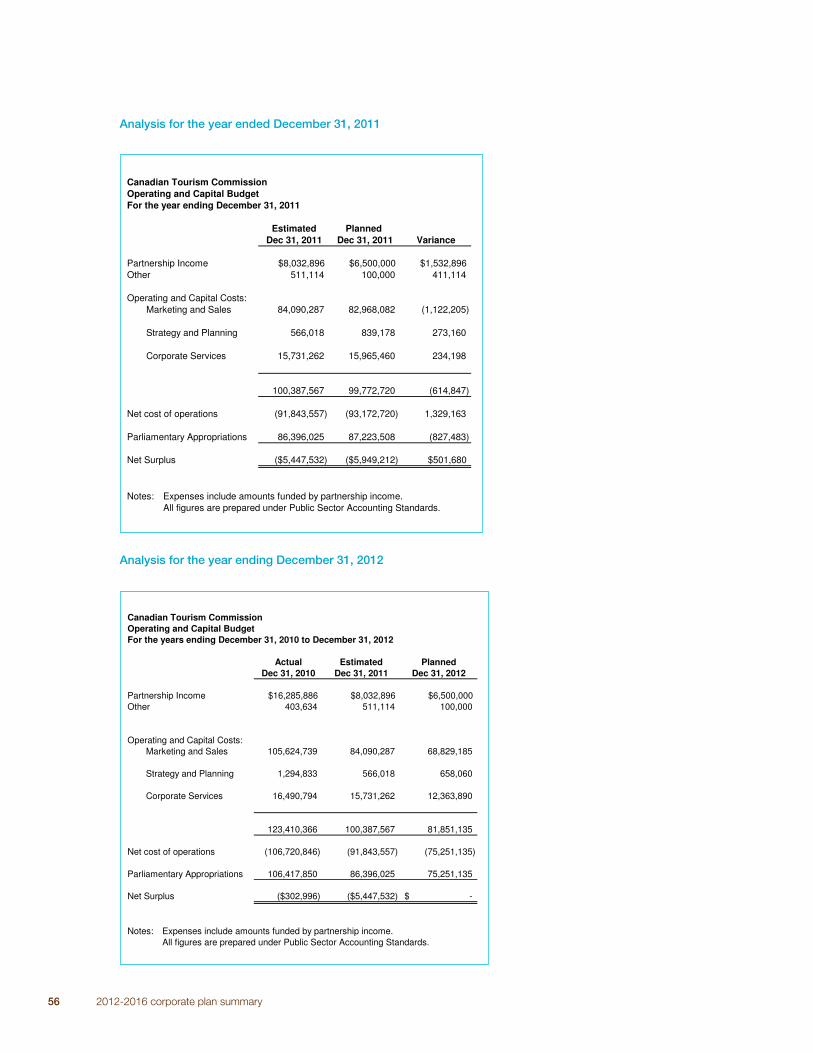
56 2012-2016 corporate plan summary
Analysis for the year ended December 31, 2011
Canadian Tourism CommissionOperating and Capital BudgetFor the year ending December 31, 2011
Estimated Planned Dec 31, 2011 Dec 31, 2011 Variance
Partnership Income $8,032,896 $6,500,000 $1,532,896 Other 511,114 100,000 411,114
Operating and Capital Costs:Marketing and Sales 84,090,287 82,968,082 (1,122,205)
Strategy and Planning 566,018 839,178 273,160
Corporate Services 15,731,262 15,965,460 234,198
100,387,567 99,772,720 (614,847)
Net cost of operations (91,843,557) (93,172,720) 1,329,163
Parliamentary Appropriations 86,396,025 87,223,508 (827,483)
Net Surplus ($5,447,532) ($5,949,212) $501,680
Notes: Expenses include amounts funded by partnership income.All figures are prepared under Public Sector Accounting Standards.
Analysis for the year ending December 31, 2012
Canadian Tourism CommissionOperating and Capital BudgetFor the years ending December 31, 2010 to December 31, 2012
Actual Estimated PlannedDec 31, 2010 Dec 31, 2011 Dec 31, 2012
Partnership Income $16,285,886 $8,032,896 $6,500,000 Other 403,634 511,114 100,000
Operating and Capital Costs:Marketing and Sales 105,624,739 84,090,287 68,829,185
Strategy and Planning 1,294,833 566,018 658,060
Corporate Services 16,490,794 15,731,262 12,363,890
123,410,366 100,387,567 81,851,135
Net cost of operations (106,720,846) (91,843,557) (75,251,135)
Parliamentary Appropriations 106,417,850 86,396,025 75,251,135
Net Surplus ($302,996) ($5,447,532) -$
Notes: Expenses include amounts funded by partnership income.All figures are prepared under Public Sector Accounting Standards.
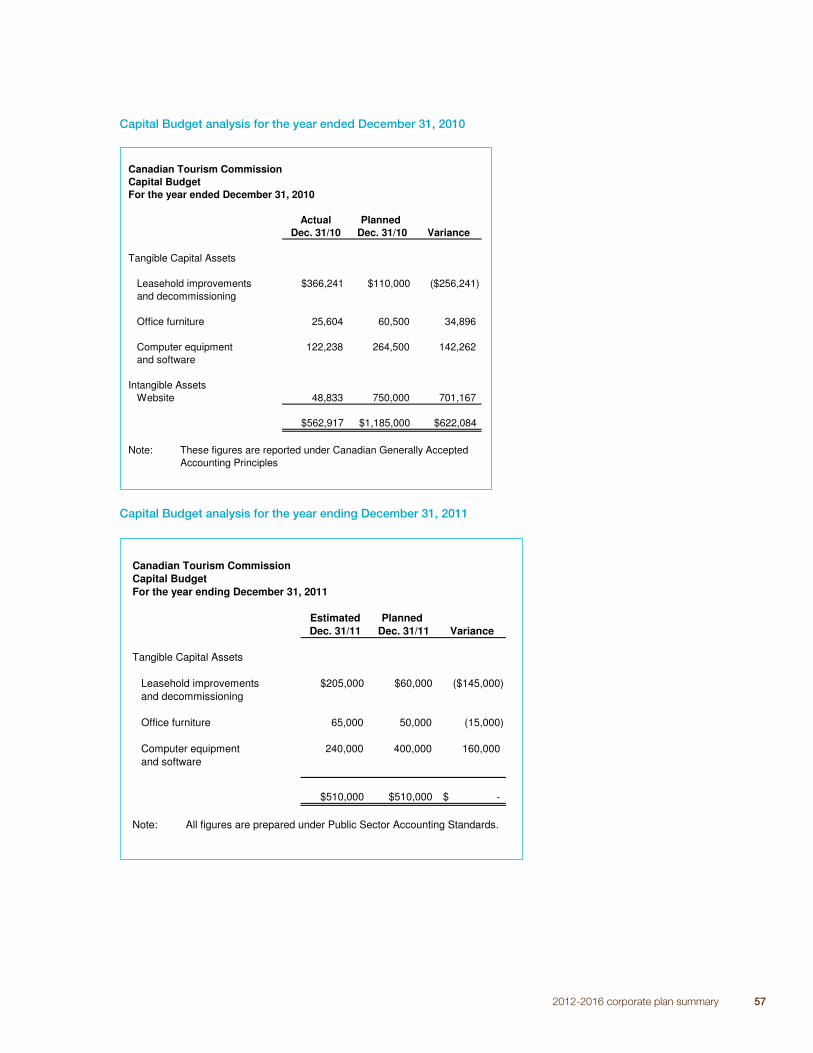
2012-2016 corporate plan summary 57
Capital Budget analysis for the year ended December 31, 2010
Canadian Tourism CommissionCapital BudgetFor the year ended December 31, 2010
Actual Planned Dec. 31/10 Dec. 31/10 Variance
Tangible Capital Assets
Leasehold improvements $366,241 $110,000 ($256,241)and decommissioning
Office furniture 25,604 60,500 34,896
Computer equipment 122,238 264,500 142,262 and software
Intangible AssetsWebsite 48,833 750,000 701,167
$562,917 $1,185,000 $622,084
Note: These figures are reported under Canadian Generally Accepted Accounting Principles
Capital Budget analysis for the year ending December 31, 2011
Canadian Tourism CommissionCapital BudgetFor the year ending December 31, 2011
Estimated Planned Dec. 31/11 Dec. 31/11 Variance
Tangible Capital Assets
Leasehold improvements $205,000 $60,000 ($145,000)and decommissioning
Office furniture 65,000 50,000 (15,000)
Computer equipment 240,000 400,000 160,000 and software
$510,000 $510,000 -$
Note: All figures are prepared under Public Sector Accounting Standards.
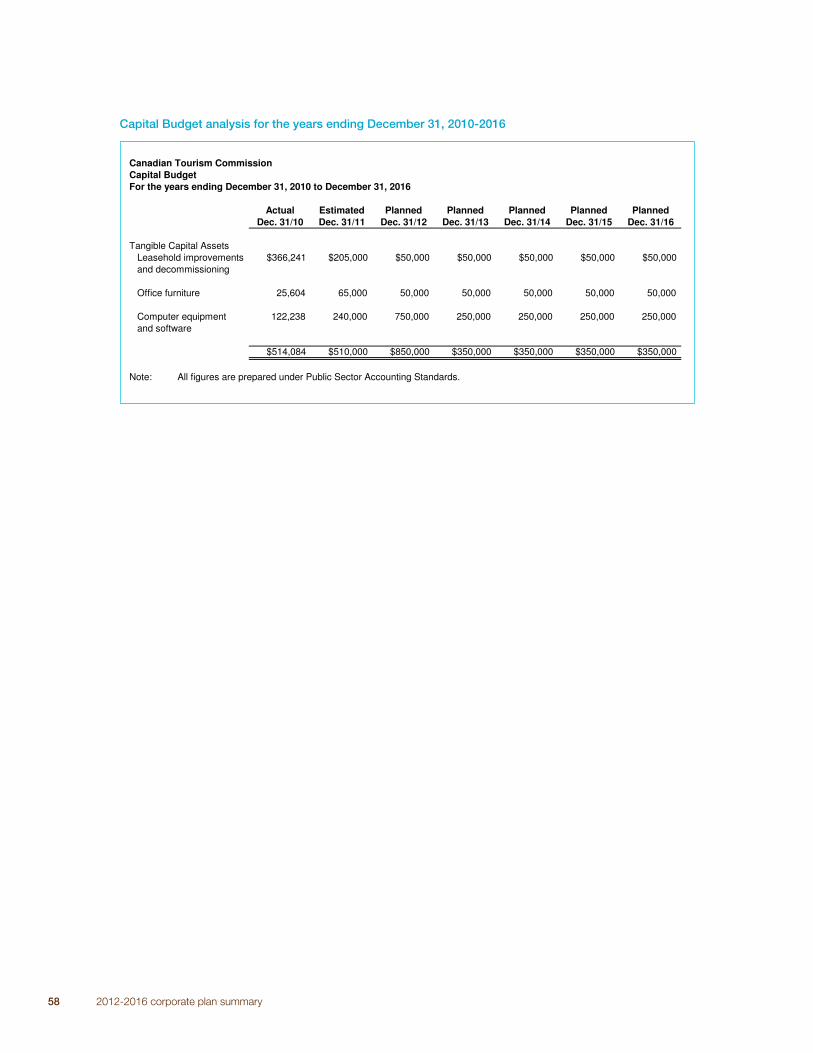
58 2012-2016 corporate plan summary
Capital Budget analysis for the years ending December 31, 2010-2016
Canadian Tourism CommissionCapital BudgetFor the years ending December 31, 2010 to December 31, 2016
Actual Estimated Planned Planned Planned Planned PlannedDec. 31/10 Dec. 31/11 Dec. 31/12 Dec. 31/13 Dec. 31/14 Dec. 31/15 Dec. 31/16
Tangible Capital AssetsLeasehold improvements $366,241 $205,000 $50,000 $50,000 $50,000 $50,000 $50,000 and decommissioning
Office furniture 25,604 65,000 50,000 50,000 50,000 50,000 50,000
Computer equipment 122,238 240,000 750,000 250,000 250,000 250,000 250,000 and software
$514,084 $510,000 $850,000 $350,000 $350,000 $350,000 $350,000
Note: All figures are prepared under Public Sector Accounting Standards.
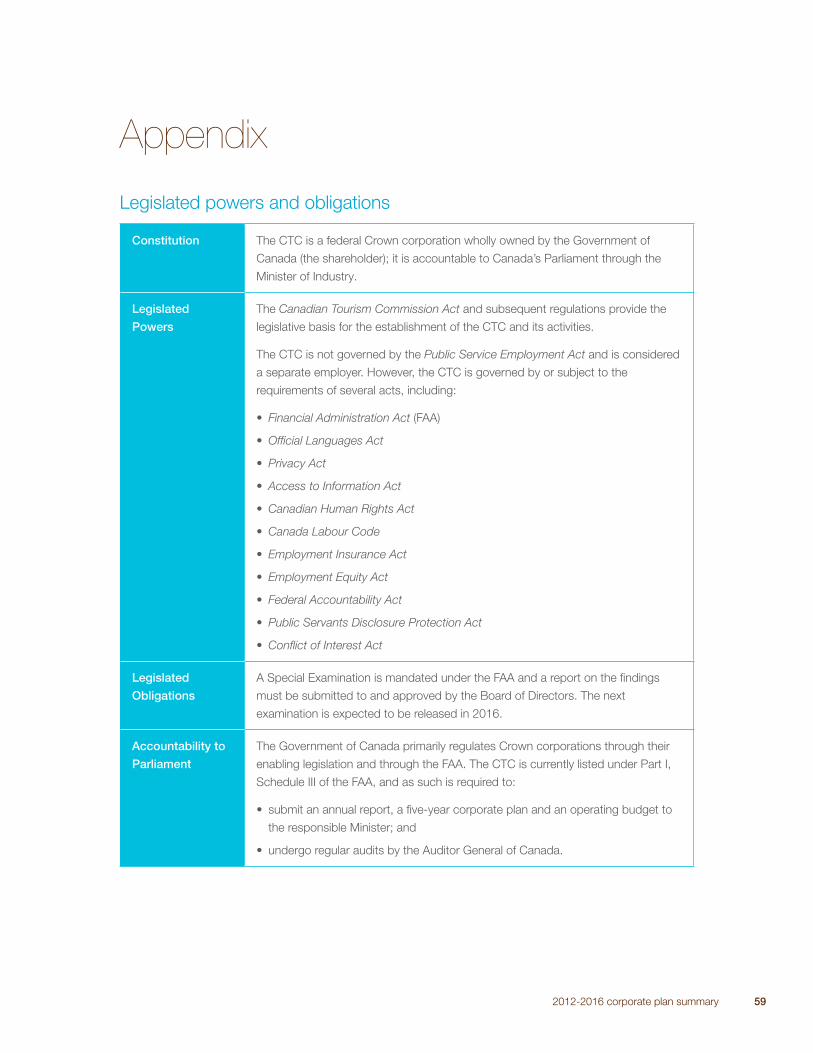
2012-2016 corporate plan summary 59
Appendix
Legislated powers and obligations
Constitution The CTC is a federal Crown corporation wholly owned by the Government of
Canada (the shareholder); it is accountable to Canada’s Parliament through the
Minister of Industry.
Legislated
Powers
The Canadian Tourism Commission Act and subsequent regulations provide the
legislative basis for the establishment of the CTC and its activities.
The CTC is not governed by the Public Service Employment Act and is considered
a separate employer. However, the CTC is governed by or subject to the
requirements of several acts, including:
• Financial Administration Act (FAA)
• Offi cial Languages Act
• Privacy Act
• Access to Information Act
• Canadian Human Rights Act
• Canada Labour Code
• Employment Insurance Act
• Employment Equity Act
• Federal Accountability Act
• Public Servants Disclosure Protection Act
• Confl ict of Interest Act
Legislated
Obligations
A Special Examination is mandated under the FAA and a report on the fi ndings
must be submitted to and approved by the Board of Directors. The next
examination is expected to be released in 2016.
Accountability to
Parliament
The Government of Canada primarily regulates Crown corporations through their
enabling legislation and through the FAA. The CTC is currently listed under Part I,
Schedule III of the FAA, and as such is required to:
• submit an annual report, a fi ve-year corporate plan and an operating budget to
the responsible Minister; and
• undergo regular audits by the Auditor General of Canada.
60 2012-2016 corporate plan summary
Governance
The Board of Directors manages the business of the CTC, which operates in partnership with the public
and private sectors. Its role is to provide strategic leadership and stewardship, and approve the allocation of
resources.
In 2009, the CTC undertook a broad assessment of its governance structure to identify and implement an
optimal governance model based on best practices and the CTC’s unique nature. As a result of the review,
recommendations for a streamlined, effective governance framework for the CTC were proposed. Almost
all recommendations have been implemented. The CTC is awaiting approval by the Governor in Council to
offi cially implement its new 12 member skills-based Board as per the Jobs and Economic Growth Act. In
January 2011, several CTC Board members resigned in order to facilitate the CTC’s move toward adopting a
smaller Board of Directors.
This new governance structure positions the CTC as a more strategic organization with greater relevancy to
government and industry, thereby enabling a modern corporate board to effectively deliver on the CTC’s goal to
grow tourism export revenues.
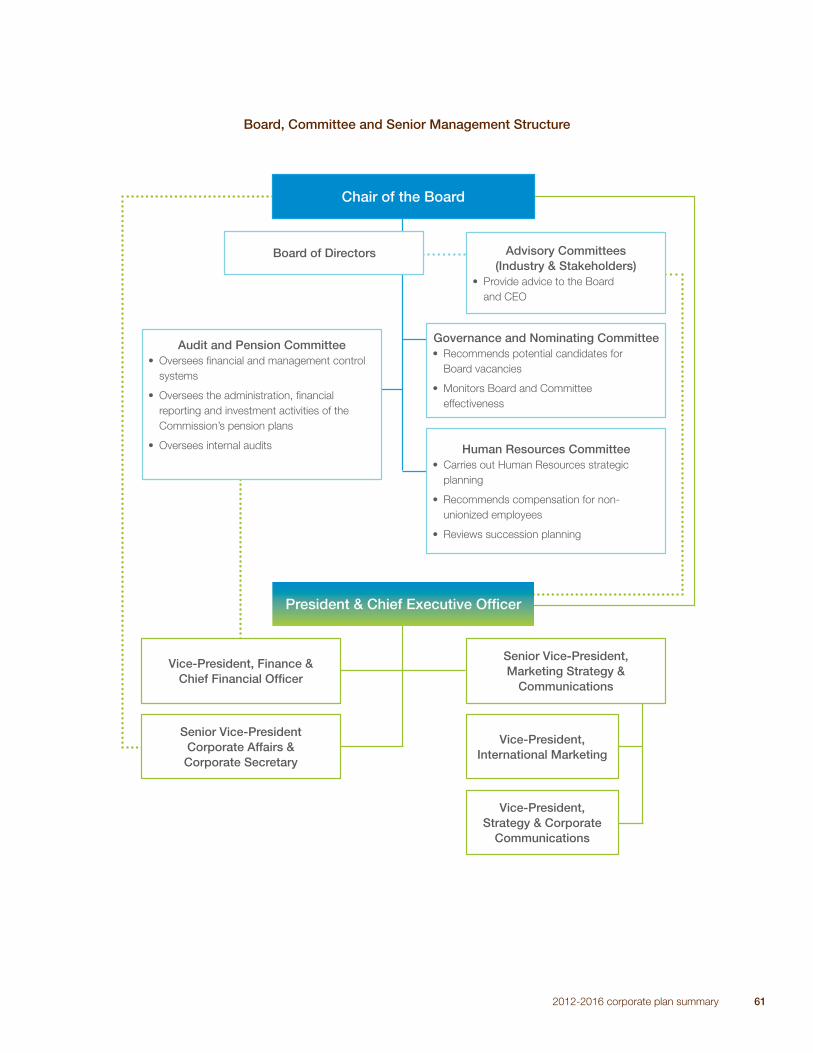
2012-2016 corporate plan summary 61
Board, Committee and Senior Management Structure
President & Chief Executive Offi cer
Vice-President, Finance & Chief Financial Offi cer
Senior Vice-President,Marketing Strategy &
Communications
Vice-President,International Marketing
Vice-President,Strategy & Corporate
Communications
Senior Vice-PresidentCorporate Affairs & Corporate Secretary
Advisory Committees (Industry & Stakeholders)
• Provide advice to the Board
and CEO
Governance and Nominating Committee• Recommends potential candidates for
Board vacancies
• Monitors Board and Committee
effectiveness
Human Resources Committee• Carries out Human Resources strategic
planning
• Recommends compensation for non-
unionized employees
• Reviews succession planning
Audit and Pension Committee• Oversees fi nancial and management control
systems
• Oversees the administration, fi nancial
reporting and investment activities of the
Commission’s pension plans
• Oversees internal audits
Board of Directors
Chair of the Board
62 2012-2016 corporate plan summary
Source markets and offi ces
The CTC is headquartered in Vancouver, British Columbia, and maintains a small branch offi ce in the National
Capital Region. The CTC is currently active in the Americas (the US, Mexico and Brazil), Europe (the UK,
Germany and France), Asia (China, India, South Korea and Japan) and Australia. However, our new regional hub
structure allows us to be nimble and opportunistic, adjust our marketing programs to refl ect changing market
conditions, and capitalize on new marketing opportunities as they arise.
Our offi ce in London, England serves as the regional hub for our core markets of the UK, France, Germany and
Australia. The CTC’s headquarters in Vancouver serves as the regional hub offi ce for the emerging markets of
India, China, Brazil and South Korea.
The Vancouver offi ce also serves Japan and Mexico, both of which were high-performance markets that are
currently dealing with external issues (such as new visa requirements, pandemics, natural disasters or air
access). These “shocked” markets require a return-to-basics approach on the ground to re-establish Canada
as a potential tourism destination.
The Meetings, Convention and Incentive Travel business is headquartered in Vancouver, with several in-market
sales representatives located in the US and internationally, primarily in the UK.
Staff
The CTC has 115 permanent positions, 84 of which (or 72%) are located at our head offi ce in Vancouver.
These positions are largely engaged in marketing, communications and research activities, as well as
providing corporate services. There is also a small offi ce in Ottawa with two positions. In addition to our
Canadian staff, we have 29 permanent positions (26%) delivering international marketing and sales services
in our international markets.
2012-2016 corporate plan summary 63
Glossary
Destination Marketing Organization: A company or other entity involved in the business of increasing
tourism to a destination or improving its public image.
Explorer Quotient® (EQ®): An innovative research tool that identifi es the underlying emotional motivators of
travellers beyond traditional demographics like age and geography.
Global Tourism Watch (GTW): An annual tracking study initiated by the CTC in 2007 to gather information
on each of its core markets.
Tourism export revenue: Spending by foreign visitors on Canadian-produced tourism goods and services,
including spending that may take place outside of Canada, such as the purchase of an airline ticket from a
Canadian international carrier in order to travel to Canada.
International tourist arrivals: Total number of arrivals (not persons) in Canada who are overnight visitors
staying at least one night in a collective or private accommodation. Note: a person who makes several trips
to Canada during a given period will be counted as a new arrival each time.
Provincial/Territorial Marketing Organization: A provincial/territorial entity involved in the business of
increasing tourism to a province or improving its public image.
Tourism employment: Measure of the number of jobs in an industry generated by, or attributable to, tourism
spending on the goods and/or services produced by that industry. It is based on an estimate of jobs rather
than “hours of work”. Thus, someone who works 10 hours a week counts for as much, by this measure, as
someone who works 50 hours a week.
Tourism Gross Domestic Product (GDP): Unduplicated value of production, within the boundaries of a
region, of goods and services purchased by tourists.
Tourism revenue: Spending of Canadian and foreign visitors on domestically-produced commodities, as
reported by Statistics Canada as total tourism demand in the Canadian Tourism Satellite Account. It is the
sum of tourism domestic demand and tourism exports.
Tourist receipts: Expenditures made by visitors from abroad generated by overnight trips, reported by
Statistics Canada as overnight international trip spending.
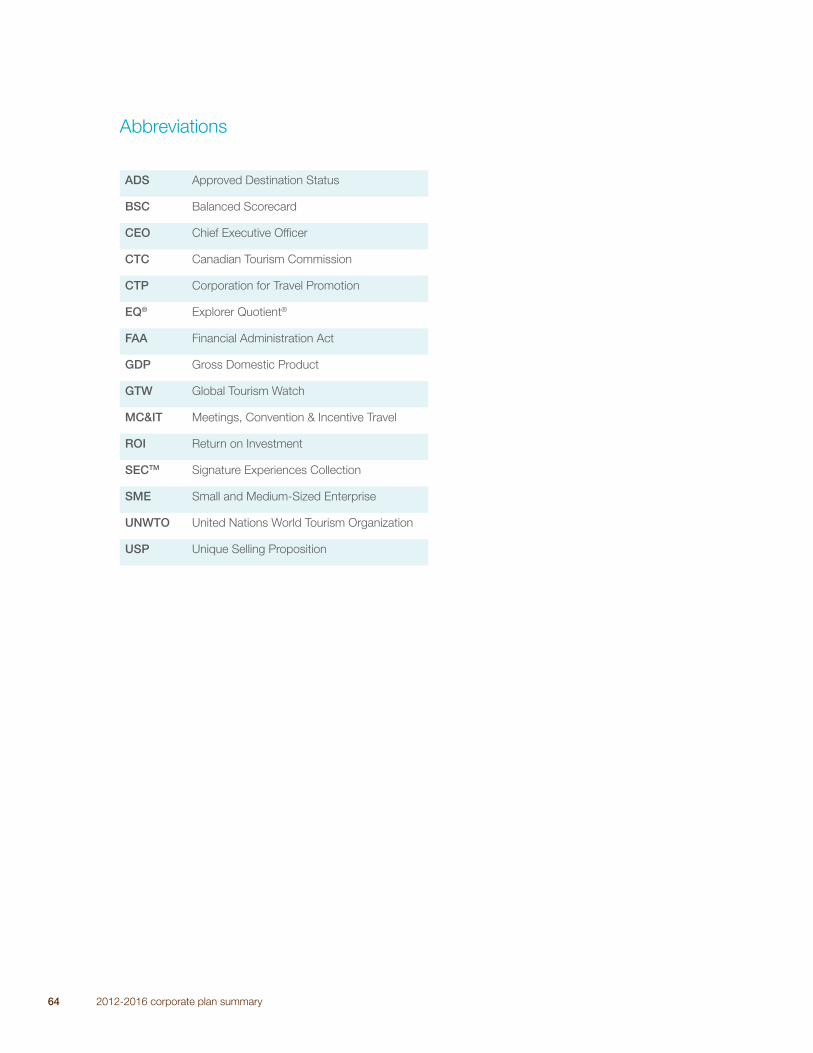
64 2012-2016 corporate plan summary
Abbreviations
ADS Approved Destination Status
BSC Balanced Scorecard
CEO Chief Executive Offi cer
CTC Canadian Tourism Commission
CTP Corporation for Travel Promotion
EQ® Explorer Quotient®
FAA Financial Administration Act
GDP Gross Domestic Product
GTW Global Tourism Watch
MC&IT Meetings, Convention & Incentive Travel
ROI Return on Investment
SECTM Signature Experiences Collection
SME Small and Medium-Sized Enterprise
UNWTO United Nations World Tourism Organization
USP Unique Selling Proposition

2012-2016 corporate plan summary 65

66 2012-2016 corporate plan summary
2011 ©
Canad
ian T
ourism
Com
mis
sio
n
Canadian Tourism Commission
Suite 1400, Four Bentall Centre
1055 Dunsmuir Street
Vancouver, BC, Canada
V7T 1L2
www.canada.travel