2012-2013 skate complex acceptable catch limit …archive.nefmc.org/tech/council_mtg_docs/june...
TRANSCRIPT

2012-2013 Skate Complex Acceptable Catch Limit Recommendations
Skate Plan Development Team Report
May 2011

ABC specifications - 2 - May 2011 Skate PDT
1.0 0BExecutive Summary The objective of this Skate Plan Development Team (PDT) document is to update data and identify 2012-2013 specifications, responding to changes in the fishery and resource. Updated data include 2008-2010 mean stratified survey biomass for seven managed skate species, fishing year 2010 landings, calendar year 2008-2010 discards, and new discard mortality estimates. Amendment 3, which established ACL specifications to limit skate catches, was implemented July 16, 2010. Amendment 3 implemented 2010 and 2011 ACL specifications, established a 20,000 lb. skate bait possession limit, reduced the skate wing possession limit to 5,000 lbs., established a 500 lbs. (wing weight) incidental skate possession limit, established in-season and post-season accountability measures, and established a two-year specification cycle. This document is the first step in establishing 2012-2013 specifications to comply with the procedures established by Amendment 3. Since Amendment 3 implementation, the skate wing fishery reached 80% of the TAL earlier than anticipated, which triggered a reduction in the skate wing possession limit to the incidental limit on September 3, 2010. This early closure of the skate wing fishery had significant economic effects and the Council reacted by submitting Framework Adjustment 1 based on input from the fishing industry. Framework 1 became effective on May 17, 2011 and reduces the 5,000 lbs. skate wing possession limit to 2,600 lbs. from May 1 to August 31 and to 4,100 lbs. from September 1 to April 30, provided the AM trigger is not exceeded before the end of the fishing year. Framework 1 also increases the skate wing fishery TAL trigger from 80% to 85%, but the 500 lbs. incidental skate wing limit was not changed. The 2009-2010 survey data were calibrated to FSV Albatross units according to Method 1, approved by the SSC for setting ACL specifications and the catch biomass median reference points were adjusted to account for consistent survey strata. Increases in little and winter skate biomass were the primary drivers of the change in ACL specifications proposed in this document. ACL specifications were calculated using formulae and procedures approved by the SSC in January 2009, following the 2008 Data Poor Assessment Workshop (DPWS). Updated landings and discard estimates were allocated to species using the selectivity ogive method, approved by the DPWS. New research on commercial trawl vessels in the Gulf of Maine indicate that little and winter skate discard mortality rates are less than formerly assumed. Accounting for the fraction of skate catch associated with trawl fishing and species composition, the weighted average discard mortality rate was estimated to be 0.31 in 2010. This lower mortality assumption applies to the entire time series, lowers the little and winter skate catch/biomass median values, reduces the ABC estimate and the fraction of the ACT which is assumed to be discarded dead in 2012-2013. The final analysis (analysis F in XTable 16X) estimates the ABC at 50,435 mt, the ACT at 37,826 mt (75% of the ABC to account for management uncertainty), and the TAL at 24,088 mt. The specifications from analysis F including the proposed skate mortality rate assumption, transfers

ABC specifications - 3 - May 2011 Skate PDT
at sea in skate landings, and updated discard rates and survey biomass is proposed by the PDT for the 2012-2013 specifications. Section X10.0X provides a stochastic estimate of the precision of the ABC estimate, incorporating scientific uncertainty about the ABC reference points (i.e. catch/biomass medians) and about the survey biomass estimates (including uncertainty in the calibration coefficient). Risk (i.e. the probability of overfishing and its consequences) is harder to interpret, however, largely because there is no skate OFL in terms of mortality or catch. The following acronyms are used commonly throughout the document, using definitions described in the Magnuson Fishery Conservation and Management Act (MSA), as amended: ABC – Acceptable Biological Catch ACL – Annual Catch Limit ACT – Annual Catch Target AM – Accountability Measure Bmsy – Biomass that would produce MSY when fished at Fmsy
DPWS – Data Poor Assessment Workshop, a benchmark assessment of the skate complex conducted in December 2008 (http://www.nefsc.noaa.gov/saw/datapoor/) Fmsy – a fishing mortality rate that produces MSY when biomass is at Bmsy MSY – Maximum sustainable yield OFL – Overfishing Level TAL – Total Allowable Landings
2.0 1BTable of Contents 1.0 Executive Summary ............................................................................................................ 2 2.0 Table of Contents................................................................................................................ 3
2.1 List of Tables .................................................................................................................. 4 2.2 List of Figures ................................................................................................................. 5
3.0 Survey biomass ................................................................................................................... 7 4.0 Landings.............................................................................................................................. 9
4.1 Wing and bait fishery monitoring ................................................................................... 9 4.2 Transfers at sea ............................................................................................................. 13
5.0 Discard estimates .............................................................................................................. 14 5.1 Discards by Species Estimation .................................................................................... 15 5.2 2010 Comparison.......................................................................................................... 16
6.0 Accountability measures................................................................................................... 30 7.0 Discard mortality .............................................................................................................. 30
7.1 Literature Review.......................................................................................................... 30 7.2 Skate Discard Mortality Research in the Gulf of Maine............................................... 32 7.3 PDT Recommendations ................................................................................................ 33
8.0 Discard rate ....................................................................................................................... 36 9.0 ACL specifications............................................................................................................ 38 10.0 Stochastic estimates of precision ...................................................................................... 40 11.0 Literature cited .................................................................................................................. 49

ABC specifications - 4 - May 2011 Skate PDT
2.1 11BList of Tables UTable 1. Annual and three year average spring (little) and fall skate stratified mean biomass
survey weight per tow (kg/tow). The 2006-2008 data were collected by the FSV Albatross, while the 2009-2010 data were collected to the FSV Bigelow and converted using accepted calibration coefficients by species (Method 1). Source: Northeast Fisheries Science Center.U ............................................................................................... 7
UTable 2. Skate complex landings by fishery and estimated discards for fishing year 2010. Federal landings are defined as landings by vessels which hold any federal permit on the landing date. Transfers at sea are reported skate landings sold to dealer ‘000002’, designating that the fish had been sold to another vessel at sea, presumably for bait. Discards are estimated on a calendar year basis due to data processing procedures, assuming a 50% discard mortality rate that was assumed in setting 2010 specifications. Source, NMFS Northeast Regional Office using reports from dealers via electronic reporting and the NMFS permit data base.U .................................................................. 12
UTable 3. Total skate ‘landings’ reported on VTRs for dealer=’000002’, designating transfers at sea to another vessel, presumably for lobster bait. Most of these reported transfers occur in Southern New England waters from vessels fishing out of MA, RI, and CT ports.U............................................................................................................................. 13
UTable 4. Estimated discards (mt) of skates (all species) by gear type taken in the Gulf of Maine-Georges Bank region, 1964-2010.U ............................................................................... 17
UTable 5. Estimated discards (mt) of skates (all species) by gear type taken in the Southern New England-Mid-Atlantic region, 1964-2010. U................................................................... 18
UTable 6. Estimated discards (mt) of skates (all species) by gear type, 1964-2010U ...................... 19
UTable 7. Number of length samples by region, year, season, and gear type of the discarded component of the skate catch from the Northeast Fisheries Observer ProgramU .......... 20
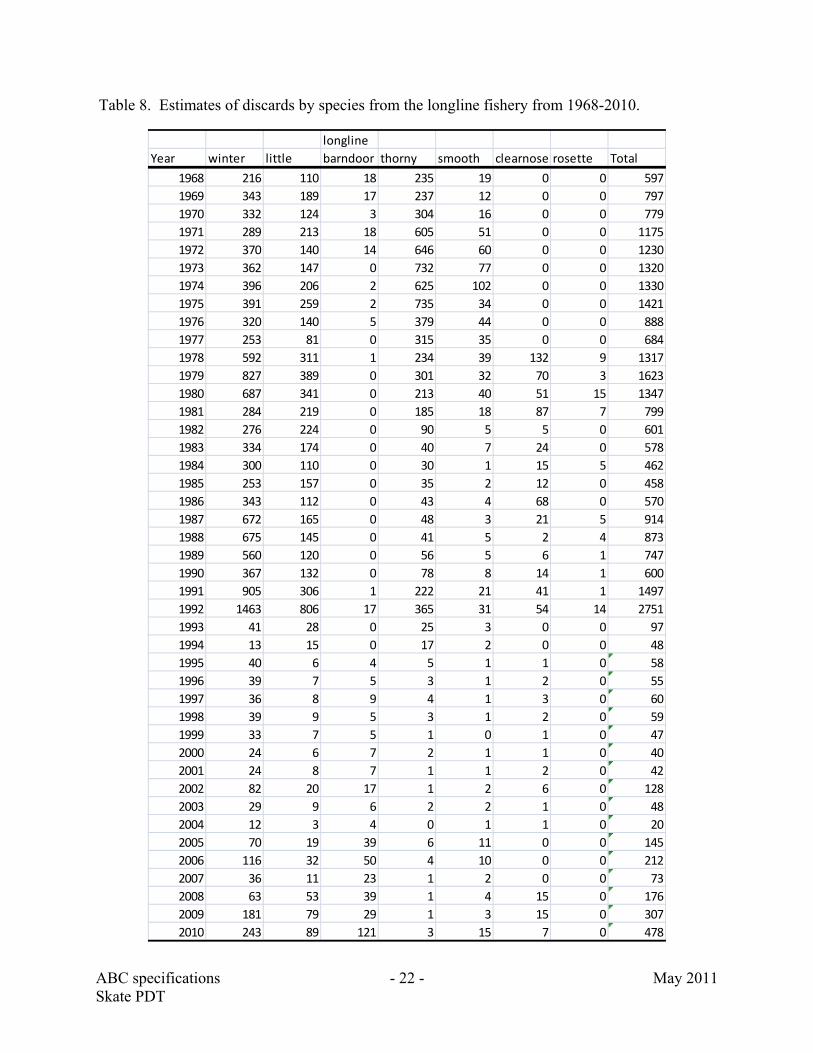
UTable 8. Estimates of discards by species from the longline fishery from 1968-2010.U ............... 22
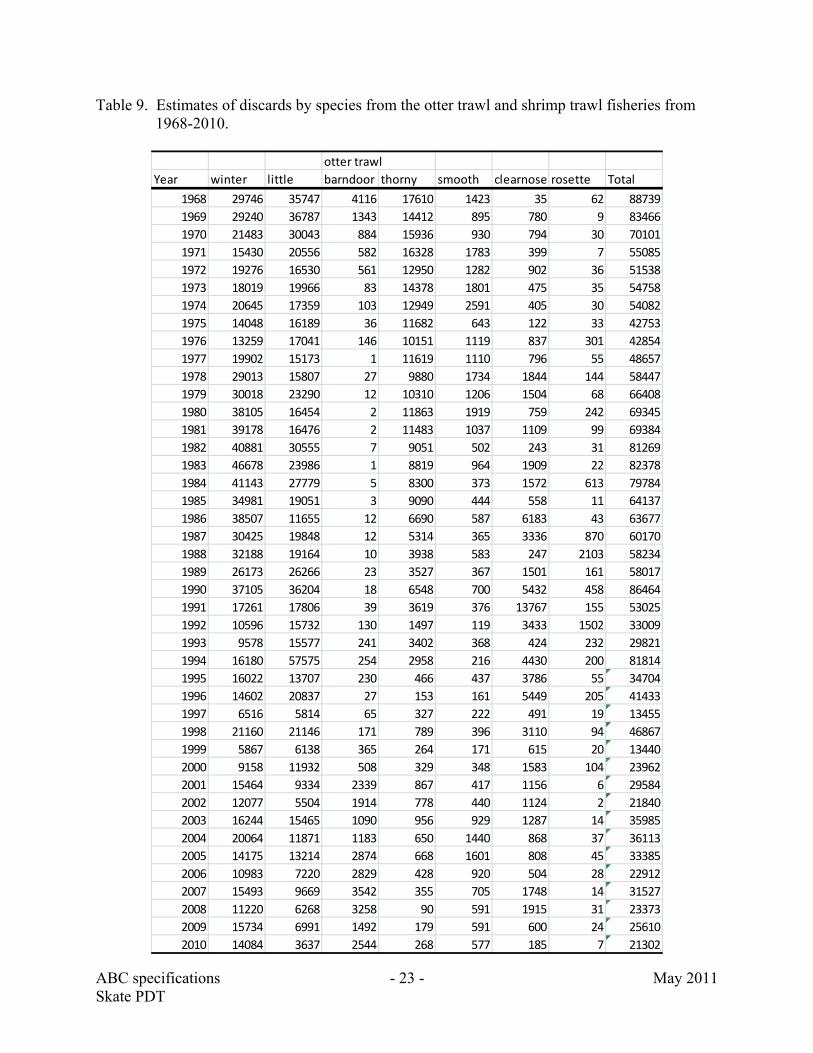
UTable 9. Estimates of discards by species from the otter trawl and shrimp trawl fisheries from 1968-2010. U ................................................................................................................... 23
UTable 10. Estimates of discards by species from the sink gill net fishery from 1968-2010. U ....... 24
UTable 11. Estimates of discards by species from the scallop dredge fishery from 1968-2010.U... 25
UTable 12. Comparison of different trawl types.U ........................................................................... 28
UTable 13. Summary of published skate and ray discard mortality rate studies.U........................... 31
UTable 14. Preliminary estimates of Gulf of Maine little and winter skate delayed (72-h) discard mortality rates in trawl gear.U ........................................................................................ 32
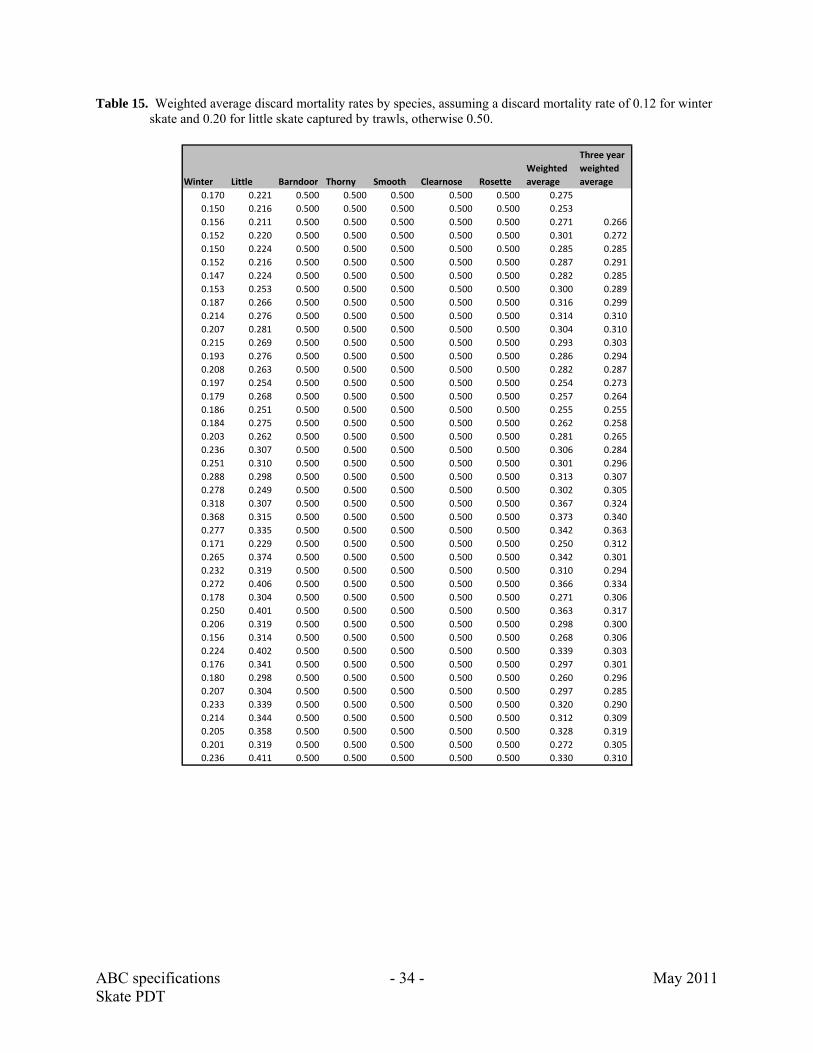
UTable 15. Weighted average discard mortality rates by species, assuming a discard mortality rate of 0.12 for winter skate and 0.20 for little skate captured by trawls, otherwise 0.50.U . 34

ABC specifications - 5 - May 2011 Skate PDT
UTable 16. Current and proposed 2012-2013 skate complex ACL specification estimates and input data. Incremental changes to input data are shown in analyses B-E. Analysis F represents the proposed final 2012-2013 specifications.U ............................................. 40
2.2 12BList of Figures UFigure 1. NEFSC survey biomass indices (kg/tow. Thin lines with symbols are annual indices,
thick lines are 3-year moving averages, and the thin horizontal lines are the biomass thresholds using consistent FSV Albatross/Bigelow strata.U........................................... 8
UFigure 2. Final landings monitoring report for the 2010 skate wing fishery. Source: NMFS, NE Regional Office.U ........................................................................................................... 10
UFigure 3. Final landings monitoring report for the 2010 skate bait fishery. Source: NMFS, NE Regional Office.U ........................................................................................................... 11
UFigure 4. Pooling scheme used to derive the length composition of the discarded component of the skate catch.U ............................................................................................................. 21
UFigure 5. Comparison of discard rates on At-Sea-Monitoring and Sea Sampler Observer Program trips. X-axis represents SBRM fleets, numbered 1 to 52 (see 2010 SBRM report for documentation). Y-axis represents a ratio in relative discard rates between the two programs (ASM/SSOP).U.................................................................................. 26
UFigure 6. Comparison of discard rates on At-Sea-Monitoring and Sea Sampler Observer Program trips. X-axis represents SBRM fleets, numbered 1 to 52 (see 2010 SBRM report for documentation). Y-axis represents a ratio of groundfish to non-groundfish discard rates between the two programs (ASM/SSOP). U .............................................. 27
UFigure 7. Total annual skate landings and catch plotted against annual ABC estimates using a three year moving average for skate biomass using FSV Bigelow surveyed strata, with updated discard mortality estimates, reported skate transfers at sea, and constant discard mortality assumed to be 50% based on published literature. The ACL specifications in 2010 use data from survey biomass for the 2008 FSV Albatross survey and 2009-2010 calibrated FSV Bigelow surveys.U ............................................ 29
UFigure 8. Total annual skate landings and catch plotted against annual ABC estimates using a three year moving average for skate biomass using FSV Bigelow surveyed strata, with updated discard mortality estimates, reported skate transfers at sea, and variable discard mortality for little and winter skates based on recent research on commercial vessels fishing in the Gulf of Maine. The ACL specifications in 2010 use data from survey biomass for the 2008 FSV Albatross survey and 2009-2010 calibrated FSV Bigelow surveys. U .......................................................................................................... 29
UFigure 9. Total dead discards assuming discard mortality is equal to 50% for all species and gears.U ............................................................................................................................ 35
UFigure 10. Total dead discards assuming discard mortality is 12% for winter skate and 20% for little skate captured by trawls, otherwise 50%.U............................................................ 35

ABC specifications - 6 - May 2011 Skate PDT
UFigure 11. Trend in calendar year skate discard rate with updated discard estimates and 50% discard mortality for all species and gears.U .................................................................. 37
UFigure 12. Trend in calendar year skate discard rate with updated discard estimates and discard mortality=0.20 for little skate and 0.12 for winter skate caught by vessels using trawls.U
...................................................................................................................................... 38
UFigure 13. Cumulative distribution of 2008-2010 average skate biomass derived from variance on the calibrated (2008 uncalibrated) stratified mean biomass, input into stochastic estimate of ABC values. U............................................................................................... 42
UFigure 14. Mean and one standard deviation for bootstrap analysis of catch/biomass medians at various probabilities of being chosen (range 0.1 to 0.9). In each iteration, annual catch/biomass values are drawn without replacement.U ................................................ 44
UFigure 15. Mean and one standard deviation on bootstrap estimates of catch/biomass medians.U45
UFigure 16. Frequency distribution of ABC accounting for catch and survey scientific uncertainty.U................................................................................................................... 46
UFigure 17. Frequency distribution of TAL accounting for catch discard mortality, and survey scientific uncertainty.U ................................................................................................... 46
UFigure 18. Empirical skate biomass response when catch levels were below confidence levels of the catch/biomass median values.U ................................................................................ 47

ABC specifications - 7 - May 2011 Skate PDT
3.0 2BSurvey biomass The ACL specifications are derived from the most recent three year average of stratified mean survey biomass from the spring (for little skate) and fall trawl surveys (XTable 1X), following a formula approved by the SSC and implemented in Amendment 3. When updated, for a new year of data, the earliest value is dropped and the newest value is added to the average, so that changes in the applied biomass value arise from omitting earlier data and adding newer data. The survey value used in the ABC calculation may change as much from the omission of older data as from the addition of newer data in the three year average. The largest changes in three year mean biomass occurred for little, thorny, and winter skates. Increases in the little and winter skate three year moving averages account for the most influence on the ABC, because the majority of catches are attributable to these two species. The three year average little skate biomass increased by 73 percent from 4.54 to 7.85 kg/tow, because the low 2006 and 2007 values were replaced by much higher 2009 and especially 2010 values. Similarly, the low winter skate biomass values in 2006 and 2007 were replaced by much higher values in 2009 and 2010. The three year average increased by 83 percent from 5.29 to 9.68 kg/tow. Thorny skate biomass has been trending downward for nearly the entire time series and continues to do so. The three year average biomass declined from 0.42 to 0.25 kg/tow, but because thorny skate account for a relatively small fraction of historic catch, this change has little influence on the ABC estimate. Barndoor, clearnose, and rosette three year average biomass values were nearly the same as those applied in Amendment 3 to estimate 2010-2011 ABC values. Trends in skate survey stratified mean biomass are graphed in XFigure 1X. According to the most recently available data from 2010, the only overfished skates are smooth and thorny. Biomass for clearnose, little, rosette, and winter are above the target value. In fact the three year (2008-2010) moving average for little skate is a time series record high. Following a series of years when winter skate biomass was near the threshold, biomass increased above the threshold in 2008, 2009, and 2010. Barndoor skate biomass is above the threshold but below the target, and is therefore not overfished nor rebuilt. Table 1. Annual and three year average spring (little) and fall skate stratified mean biomass survey weight per tow
(kg/tow). The 2006-2008 data were collected by the FSV Albatross, while the 2009-2010 data were collected to the FSV Bigelow and converted using accepted calibration coefficients by species (Method 1). Source: Northeast Fisheries Science Center.
Barndoor Clearnose Little Rosette Smooth Thorny Winter
2006 1.17 0.48 3.33 0.06 0.21 0.74 2.52 2007 0.76 0.90 4.01 0.07 0.09 0.32 3.74 2008 1.11 1.23 6.29 0.03 0.10 0.20 9.62 2009 1.13 0.89 6.62 0.06 0.21 0.25 11.33 2010 1.10 0.68 10.63 0.03 0.18 0.28 8.09
Three year averages 2006-2008 1.013 0.871 4.541 0.052 0.135 0.420 5.294 2007-2009 0.999 1.009 5.639 0.053 0.133 0.258 8.232 2008-2010 1.114 0.933 7.848 0.040 0.161 0.245 9.684

ABC specifications - 8 - May 2011 Skate PDT
Figure 1. NEFSC survey biomass indices (kg/tow. Thin lines with symbols are annual indices, thick lines are 3-year moving averages, and the thin horizontal lines are the biomass thresholds using consistent FSV Albatross/Bigelow strata.
4
8
12
16
Figure xx. Biomass and abundance indices from the NEFSC spring survey for barndoor skate from 1968-1998. The 95% confidence limits are shown by the dashed line.
Winter Skate
2
4
6
8
10
1
2
2
4
6
8
0.2
0.4
0.6
0.8
0.5
1.0
1.5
Year
1960 1965 1970 1975 1980 1985 1990 1995 2000 2005 2010
0.020.040.060.080.100.12
Little Skate
Barndoor Skate
Thorny Skate
Smooth Skate
Clearnose Skate
Rosette Skate
Skate Complex Biomass IndicesN
EF
SC
Bio
mas
s In
dex
(k
g/to
w)
Figure 1. NEFSC survey biomass indices (kg/tow). Thin lines with symbols are annual indices, thick lines are 3-year moving averages, and the thin horizontal line are the biomass thresholds developed through 2007/08 using consistent strata sets.

ABC specifications - 9 - May 2011 Skate PDT
4.0 3BLandings
4.1 13BWing and bait fishery monitoring Landings through April 30, 2011 (the end of the 2010 fishing year) were updated in this report to determine whether AMs would be triggered and to update the discard rate to 2008-2010 (landings are needed to estimate total catch). Landings are monitored in-season by the NMFS Northeast Regional Office and published weekly on their website (see figures below), determining whether in-season accountability measures (changes to skate possession limits) are warranted. The landings are monitored separately for the skate wing (sold as food) and skate bait (primarily sold as lobster bait) fisheries which target different skate species based on size. The weekly monitoring reports include landings by all vessels, whether or not they hold a federal permit at the time of landing. Skate wing landings in fishing year 2010 by vessels holding federal permits totaled 19.4 million pounds or 8,792 mt. This was 95% of the 9,209 mt TAL ( XTable 2X). Skate bait landings were determined from the disposition code supplied by dealers and totaled 8.8 million pounds or 3,988 mt by vessels holding a federal permit at the time of landing skates. This was 86% of the 4,639 mt TAL. Landings by vessels not having a federal permit, were assumed to occur from vessels with state permits fishing in state waters. The landings by these vessels totaled 4.1 million pounds or 1,852 mt., which was 12.6% of total skate landings. Analysis of 2007-2009 data in Amendment 3 indicated that skate landings by state vessels in state waters totaled 924 mt, or 3% of total skate landings. The methods in the Amendment 3 analysis differed from the monitoring methods that were actually implemented, however, probably contributing to the unexpected increase in state landings. In the Amendment 3 analysis, any dealer report of skate landings for vessels with permit numbers were assumed to be landings by federal vessels (whether or not the vessel actually had a permit at the time of landing). Only landings with ‘permit’ number ‘190998’ and ‘390998’, known to be aggregate state dealer landings for undertonnage and tonnage vessels were assigned to the state landings category. That being said, there were anecdotal reports that some fishermen in Southern New England switched to fishing with non-federal vessels to continue fishing for skates after the skate wing possession limit dropped from 5,000 lbs. to 500 lbs. on September 3, 2010.

ABC specifications - 10 - May 2011 Skate PDT
Figure 2. Final landings monitoring report for the 2010 skate wing fishery. Source: NMFS, NE Regional Office.

ABC specifications - 11 - May 2011 Skate PDT
Figure 3. Final landings monitoring report for the 2010 skate bait fishery. Source: NMFS, NE Regional Office.

ABC specifications - 12 - May 2011 Skate PDT
Table 2. Skate complex landings by fishery and estimated discards for fishing year 2010. Federal landings are defined as landings by vessels which hold any
federal permit on the landing date. Transfers at sea are reported skate landings sold to dealer ‘000002’, designating that the fish had been sold to another vessel at sea, presumably for bait. Discards are estimated on a calendar year basis due to data processing procedures, assuming a 50% discard mortality rate that was assumed in setting 2010 specifications. Source, NMFS Northeast Regional Office using reports from dealers via electronic reporting and the NMFS permit data base.
Federal Federal (mt) State State (mt) %Federal %State Total Total (mt) TAL (mt) Percent of TAL/ACL
Wings 19,382,854 8,792 2,850,052 1,293 87.1 12.8 22,241,698 10,089 9,209 95 Bait 8,792,771 3,988 1,231,847 559 87.7 12.3 10,028,606 4,549 4,639 86 Total Landings (A 28,175,625 12,780 4,081,899 1,852 87.3 12.6 32,270,304 14,638 36 Transfers at sea (B) 3,595,351 1,631 4 Estimated dead discards (C) 41,389,321 18,774 46 ACL 90,565,872 41,080 85

ABC specifications - 13 - May 2011 Skate PDT
4.2 14BTransfers at sea An additional source of mortality was discovered during the recent whiting assessment, reports of transfers at sea on vessel trip reports (VTRs). Skates were by far the highest amounts reported in this manner and comprise a significant portion of the total catch (see table below). These ‘landings’ were not recognized in the Amendment 3 analyses and were not included in the estimation of ABC or TAL. After investigating these data in more detail, the PDT decided that they should be added to the catch time series, attributed to species composition according to the DPWS procedures for the skate bait fishery, and in the future monitored against the bait fishery TAL. The reported transfers at sea for all species (not just skates) were also included in the expansion of the observed D/K-all ratios to estimate total skate discards (stratified by gear, region, and quarter). Accordingly, the revised skate discard rate with the transfers at sea multiplier should also be included assumed future discard rates to estimate TAL. Skate transfers at sea peaked at 15.2 million pounds in 1999, declined to 2.9 to 6.4 million pounds in 2003-2009, then declined to 3.6 million pounds in 2010. It is unclear why skate transfers at sea declined in 2010, possibly because of skate bait marketing changes under the new ACL management. Table 3. Total skate ‘landings’ reported on VTRs for dealer=’000002’, designating transfers at sea to another
vessel, presumably for lobster bait. Most of these reported transfers occur in Southern New England waters from vessels fishing out of MA, RI, and CT ports.
Calendar year Trips. Total QtyKept (lbs.) Total QtyKept (mt)1994 350 3,002,658 1,362 1995 338 3,354,206 1,521 1996 504 5,848,874 2,653 1997 732 7,412,444 3,362 1998 1012 10,598,440 4,807 1999 1216 15,245,292 6,915 2000 1075 11,674,476 5,295 2001 899 12,063,896 5,472 2002 687 7,311,580 3,316 2003 915 5,426,885 2,462 2004 991 4,036,078 1,831 2005 773 2,861,148 1,298 2006 910 4,143,399 1,879 2007 1171 4,741,115 2,151 2008 954 5,147,572 2,335 2009 1278 6,373,561 2,891 2010 927 3,595,351 1,631

ABC specifications - 14 - May 2011 Skate PDT
5.0 4BDiscard estimates Discards were estimated for calendar year 2010 by gear and half-year (see table below). Discards are estimated for a calendar year, rather than the fishing year, because they rely on the NMFS area allocation landings tables to expand observed discard/kept-all (D/K-all) ratios to total based on landings by gear, area, and quarter. The observed D/K-all ratios were derived from the Sea Sampling Observer and the At Sea Monitoring programs and included both sector and non-sector vessels, but were not stratified on that basis. Analysis of the two data sources indicated that the D/K-all ratios were similar for data derived from the two programs. These area allocation tables are prepared annually from dealer and vessel trip report records after these data have become final, and are usually available after April 1 following the end of the calendar year. This procedure makes it impossible at this time to include the January to April 2011 period, as a fishing year estimate. Total estimated discards for 2010 were 37,548 mt (see table below). Discards increased by 6.7% over the 2009 estimates. Some of the increase may have occurred due to the lower skate wing possession limit, particularly from September 3 to December 31, 2010 when the possession limit was 500 lbs. Changes in the estimated discards may also have been mitigated by reduced landings and effort by multispecies (groundfish) sector vessels. Discard estimates from the Data Poor Stocks Working Group were updated and errors in the tables corrected. The ratio-estimator used in this assessment is based on the methodology described in Rago et al. (2005) and updated in Wigley et al 2007. It relies on a d/k ratio where the kept component is defined as the total landings of all species within a “fishery”. A fishery is defined as a homogeneous group of vessels with respect to gear type (longline, otter trawl, shrimp trawl, sink gill net, and scallop dredge), quarter (months 1-4, 5-6, 7-8, 9-12), and area fished (GOM, GB, SNE, MA). Mesh size was not used to split out otter trawl trips or sink gill net trips. All trips were included if they occurred within this stratification regardless of whether or not they caught skates.
The discard ratio for skates in stratum h is the sum of discard weight over all trips divided by sum of kept weights over all trips:
h
h
n
iih
n
iih
h
k
d
R
1
1ˆ (1)
where dih is the discards for skates within trip i in stratum h and kih is the kept component of the catch for all species. Rh is the discard rate in stratum h. The stratum weighted discard to kept ratio is obtained by weighted sum of discard ratios over all strata:

ABC specifications - 15 - May 2011 Skate PDT
H
hhH
hh
h RN
NR
1
1
ˆˆ (2)
The total discard within a strata is simply the product of the estimate discard ratio R and the total landings for the fishery defined as stratum h, i.e., Dh=RhKh. The total landings were updated to include landings of all species sold over-the-side as bait. Missing cells were imputed using averages of existing cells. If information existed in the same area fished, the annual average discard ratio was applied in the missing cells. If the information was missing in the area fished, but available in the region (i.e. SNE and MA or GOM and GBK), then the annual average for that region was applied. There were some cases for the longline fishery in which the entire year was averaged for all areas or for a span of 12 years (1993-2004). To hindcast the discard estimates back to 1964, a three-year average (the earliest three years of data) of the discards of skates/landings of all species was used. Estimated discards by fishery, region and half year for 1964-2010 are summarized in XTable 4X to XTable 6X.
5.1 15BDiscards by Species Estimation
The discard estimates were not dis-aggregated to skate species in previous assessments because identification of skates is uncertain in the Fisheries Observer Program (NEFSC 2007). The observer lengths of the discarded component of the catch were used by gear type. The data were apportioned into two regions, Gulf of Maine to Georges Bank (GOMGBK – Divisions 51 and 52), and Southern New England to Mid-Atlantic (SNEMA – Divisions 53 and Subarea 6). The number of fish measured in these regions was barely sufficient (XTable 7X) so no further areal division was attempted. Pooling over years, sometimes over the entire time series, within a region was still required to get an adequate number of fish ( XFigure 4X). For longline gear, all samples were used for both regions. An average skate length-weight equation was applied to the samples and used to estimate the discard numbers at length by gear category Length compositions from the NEFSC spring and autumn survey for each species for the two regions (GOMGBK – Offshore strata 13-30, 36-40, and Inshore strata 56-66; SNEMA – Offshore strata 1-12, 61-76, and Inshore strata 1-55) were estimated. The species length-weight equations were then applied to determine weight-at-length by species. The proportions at length by species for both number and weight were applied to the commercial landings-at-length to estimate landings-at-length by species. The lengths had to be grouped into 5 cm intervals to avoid zero cells in the survey and all fish greater than 112 cm were set to be barndoor skate. To estimate the species composition from 1968-1995, the proportion by weight in the spring and autumn surveys in four regions (GOM, GBK, SNE, and MA) was applied to the discard estimates by gear type. The estimates by gear type and species are given in XTable 8X to XTable 11X.

ABC specifications - 16 - May 2011 Skate PDT
5.2 16B2010 Comparison
In 2010, Amendment 16 to the Northeast Multispecies (Groundfish) Management Plan required an increase in observer coverage to monitor discards of groundfish. This was done with At-Sea-Monitors (ASM), whose responsibilities were slightly different than for regular observers (OB). A comparison was made between the discard rates of these ASM trips and OB trips. XFigure 5X shows the difference between the discard rates of the two types of trips as well as the number of trips covered under each program (ASM and SSOP) for different gear/quarter/region combinations. Given that most of the rates are similar, using these data should not bias the discard estimates. A comparison was also made between these groundfish trips, and non-groundfish trips using the same gear in the same time period and region (XFigure 5X). These were also similar enough to be combined in a single analysis of skate discards, with the larger differences between the two sampling programs that appear to result from low sample sizes for non-groundfish trips (XFigure 6X).
A final comparison for 2010 was between “otter” trawl, the “Ruhle” trawl and the “haddock separator” trawl to see if these three gear types could be combined. XTable 12X shows the discard to kept ratios, the mt in the dealer database as well as the number of trips observed and in the dealer database. The ratios of the three gears are different. However, it appears that not all records in the database have the correct gear type, given that the number of trips observed is almost equal to the number of trips in the dealer database for the Ruhle and haddock separator trawls. Therefore, the PDT decided to include the Ruhle and haddock separator trawls in the otter trawl category at this time.

ABC specifications - 17 - May 2011 Skate PDT
Table 4. Estimated discards (mt) of skates (all species) by gear type taken in the Gulf of Maine-Georges Bank region, 1964-2010.
Half 1 Half 2
YearLine
TrawlOtter Trawl
Shrimp Trawl
Sink Gill Net
Scallop Dredge
Total Half 1
Line Trawl
Otter Trawl
Shrimp Trawl
Sink Gill Net
Scallop Dredge
Total Half 2
Grand Total
1964 441 37,255 0 12 5,882 43,589 471 22,824 0 7 6,539 29,841 73,4301965 491 38,321 0 17 2,294 41,123 609 24,329 0 5 599 25,541 66,6631966 373 39,624 0 26 751 40,773 572 22,374 0 7 1,504 24,458 65,2311967 318 30,462 0 22 582 31,383 379 19,148 0 8 2,294 21,829 53,2121968 252 26,067 0 37 737 27,093 345 18,036 0 10 1,649 20,040 47,1341969 272 25,173 0 32 1,011 26,488 523 15,909 0 6 1,934 18,372 44,8601970 298 22,927 0 22 1,234 24,481 479 15,208 0 7 1,887 17,582 42,0621971 458 21,746 0 21 1,767 23,993 715 14,941 0 8 1,452 17,116 41,1081972 462 19,491 0 31 1,248 21,233 765 12,401 0 13 1,715 14,894 36,1261973 553 19,548 0 31 1,793 21,924 749 13,558 0 15 1,496 15,818 37,7431974 593 17,687 0 58 1,060 19,398 691 11,947 0 24 1,410 14,071 33,4691975 660 15,631 280 61 1,327 17,959 713 11,792 37 26 2,025 14,593 32,5521976 450 15,157 66 99 1,677 17,449 407 12,139 0 37 3,113 15,696 33,1451977 332 19,662 39 169 3,321 23,524 338 14,148 0 47 7,174 21,707 45,2301978 539 23,070 0 189 4,030 27,829 372 14,383 0 66 7,886 22,707 50,5351979 741 22,771 26 156 5,292 28,986 593 16,612 0 67 8,446 25,719 54,7041980 816 28,570 21 189 7,424 37,020 183 18,066 0 96 6,969 25,314 62,3331981 325 29,786 99 258 8,268 38,735 114 15,643 0 93 9,497 25,347 64,0821982 293 26,789 124 91 5,650 32,948 86 19,496 7 83 7,923 27,595 60,5441983 282 29,695 115 116 4,847 35,055 106 16,467 22 69 5,650 22,314 57,3691984 294 27,882 152 123 3,515 31,967 22 13,640 53 94 4,352 18,161 50,1281985 252 22,242 225 115 2,350 25,184 60 10,748 70 81 4,717 15,676 40,8601986 309 19,142 252 170 4,036 23,908 58 8,856 83 87 6,203 15,288 39,1961987 510 15,330 288 140 3,927 20,196 193 8,272 46 85 7,568 16,165 36,3611988 536 17,091 183 162 6,206 24,177 230 8,410 46 90 9,991 18,767 42,9441989 481 18,497 73 48 6,392 25,491 185 8,727 17 92 11,097 20,118 45,6091990 343 23,476 208 347 7,324 31,699 182 9,910 71 73 15,213 25,449 57,1471991 1,064 11,624 243 99 9,870 22,900 260 8,680 44 113 10,371 19,468 42,3681992 1,285 8,056 247 162 8,930 18,680 727 2,848 0 56 10,931 14,562 33,2431993 57 4,528 35 119 4,541 9,279 22 11,482 1 65 4,951 16,520 25,7991994 14 4,912 11 130 2,278 7,346 25 10,153 1 72 2,026 12,277 19,6231995 25 7,492 8 209 397 8,130 26 2,317 1 259 1,647 4,249 12,3801996 21 7,509 26 284 820 8,660 21 1,189 8 65 3,002 4,285 12,9441997 20 3,683 34 110 1,832 5,679 21 3,571 4 16 3,193 6,805 12,4841998 17 4,228 6 50 2,595 6,897 24 15,062 0 56 4,110 19,254 26,1511999 19 2,840 3 98 1,235 4,195 21 7,197 0 110 2,966 10,295 14,4892000 11 4,495 4 121 1,975 6,605 22 7,605 0 740 1,375 9,742 16,3472001 15 19,283 0 188 514 19,999 16 6,275 0 153 554 6,998 26,9972002 17 11,100 1 135 923 12,176 42 5,784 0 199 2,023 8,047 20,2232003 32 11,689 8 253 1,820 13,803 4 9,858 0 153 1,962 11,977 25,7802004 3 11,512 4 269 271 12,059 10 13,838 0 218 1,017 15,083 27,1432005 91 9,468 2 399 594 10,554 54 12,851 0 204 2,212 15,321 25,8752006 193 8,043 0 173 1,070 9,480 17 9,350 1 294 2,407 12,069 21,5492007 46 10,708 0 378 872 12,005 27 11,205 0 363 3,419 15,013 27,0182008 62 5,919 2 149 1,594 7,725 17 7,959 0 302 2,175 10,452 18,1772009 56 6,784 1 538 905 8,284 46 11,295 0 198 902 12,441 20,7252010 143 7,393 0 94 296 7,926 46 9,038 0 274 1,043 10,402 18,328

ABC specifications - 18 - May 2011 Skate PDT
Table 5. Estimated discards (mt) of skates (all species) by gear type taken in the Southern New England-Mid-Atlantic region, 1964-2010.
Half 1 Half 2
YearLine
TrawlOtter Trawl
Sink Gill Net
Scallop Dredge
Total Half 1
Line Trawl
Otter Trawl
Sink Gill Net
Scallop Dredge
Total Half 2
Grand Total
1964 0 16,916 0 1 16,917 0 12,929 0 488 13,416 30,3331965 0 20,746 0 2,120 22,866 0 15,053 0 7,230 22,283 45,1491966 0 23,680 0 5,327 29,007 0 11,657 0 3,998 15,655 44,6621967 0 26,886 0 2,362 29,248 0 13,933 0 1,741 15,674 44,9231968 0 30,741 0 3,069 33,810 0 13,895 0 2,474 16,369 50,1791969 2 30,557 0 1,349 31,907 1 11,827 0 673 12,501 44,4081970 2 21,694 0 394 22,090 0 10,272 0 454 10,726 32,8151971 2 13,419 0 93 13,514 0 4,979 0 747 5,726 19,2401972 2 13,272 0 734 14,009 1 6,373 0 478 6,852 20,8611973 13 15,425 0 413 15,851 4 6,227 0 170 6,402 22,2531974 34 19,170 0 692 19,895 13 5,279 0 968 6,260 26,1551975 34 9,882 0 1,062 10,978 13 5,131 0 2,025 7,169 18,1471976 19 7,688 0 2,225 9,933 11 7,804 0 3,906 11,721 21,6531977 10 7,639 0 3,388 11,038 4 7,169 0 1,323 8,496 19,5341978 214 12,605 0 3,969 16,788 192 8,389 0 4,140 12,721 29,5091979 97 16,229 0 3,530 19,857 191 10,770 0 2,880 13,841 33,6981980 193 11,730 0 2,384 14,307 156 10,958 0 2,318 13,432 27,7391981 203 13,828 0 1,121 15,152 158 10,028 0 964 11,149 26,3011982 134 17,088 0 1,634 18,857 88 17,764 0 2,661 20,512 39,3691983 114 20,196 0 3,811 24,121 76 15,883 0 4,417 20,376 44,4981984 91 21,023 0 5,179 26,293 54 17,034 0 3,985 21,073 47,3661985 63 18,452 0 4,442 22,956 83 12,401 0 3,171 15,655 38,6111986 112 18,225 0 3,272 21,609 91 17,119 0 4,053 21,263 42,8731987 116 21,129 0 8,591 29,835 95 15,105 0 8,355 23,555 53,3911988 90 18,544 0 8,176 26,810 17 13,960 0 6,268 20,245 47,0541989 55 19,166 0 13,218 32,439 26 11,537 0 5,279 16,843 49,2821990 41 26,989 0 11,014 38,044 34 25,810 0 4,600 30,444 68,4891991 110 11,258 0 8,638 20,006 63 21,176 0 5,478 26,717 46,7231992 361 5,097 107 5,628 11,194 377 16,761 51 7,157 24,346 35,5401993 13 3,466 93 5,329 8,900 6 10,309 45 7,217 17,577 26,4781994 6 60,588 135 3,821 64,550 3 6,148 155 3,030 9,336 73,8861995 3 15,501 234 8,336 24,074 4 9,385 91 18,198 27,677 51,7521996 7 8,089 135 7,540 15,771 6 24,611 66 8,466 33,149 48,9201997 10 2,950 282 9,230 12,471 8 3,213 76 3,141 6,438 18,9101998 8 22,495 167 4,223 26,893 9 5,074 195 4,334 9,612 36,5051999 4 970 500 5,959 7,433 3 2,430 139 4,989 7,560 14,9932000 3 2,422 60 3,233 5,719 4 9,435 53 3,335 12,826 18,5452001 5 1,861 216 3,253 5,336 6 2,163 52 2,695 4,916 10,2522002 4 1,076 256 5,165 6,501 65 3,880 2,265 5,674 11,883 18,3852003 6 6,226 269 6,093 12,594 6 8,204 290 6,107 14,606 27,2002004 6 2,911 181 4,960 8,059 1 7,847 280 3,060 11,188 19,2462005 0 4,718 638 5,485 10,840 0 6,345 355 2,401 9,100 19,9412006 2 2,551 686 4,658 7,897 0 2,966 68 2,527 5,562 13,4592007 0 4,047 663 4,924 9,635 0 5,566 408 3,804 9,778 19,4132008 49 4,748 1,172 3,479 9,448 48 4,745 406 2,764 7,963 17,4112009 76 3,745 913 3,148 7,882 129 3,785 339 2,335 6,588 14,4702010 125 2,040 963 7,786 10,915 163 2,831 1,070 4,240 8,304 19,219

ABC specifications - 19 - May 2011 Skate PDT
Table 6. Estimated discards (mt) of skates (all species) by gear type, 1964-2010
Half 1 Half 2
YearLine
TrawlOtter Trawl
Shrimp Trawl
Sink Gill Net
Scallop Dredge
Total Half 1
Line Trawl
Otter Trawl
Shrimp Trawl
Sink Gill Net
Scallop Dredge
Total Half 2
Grand Total
1964 441 54,171 0 12 5,883 60,506 471 35,752 0 7 7,027 43,258 103,7631965 491 59,067 0 17 4,414 63,989 609 39,381 0 5 7,829 47,824 111,8121966 373 63,304 0 26 6,078 69,781 572 34,031 0 7 5,502 40,112 109,8931967 319 57,348 0 22 2,944 60,631 379 33,081 0 8 4,035 37,504 98,1351968 252 56,808 0 37 3,807 60,904 345 31,931 0 10 4,123 36,409 97,3131969 273 55,730 0 32 2,359 58,395 524 27,736 0 6 2,607 30,873 89,2681970 299 44,621 0 22 1,628 46,570 479 25,480 0 7 2,341 28,308 74,8781971 460 35,165 0 21 1,860 37,506 715 19,920 0 8 2,199 22,842 60,3481972 464 32,764 0 31 1,982 35,241 766 18,774 0 13 2,193 21,746 56,9881973 566 34,973 0 31 2,206 37,776 754 19,785 0 15 1,666 22,220 59,9961974 627 36,856 0 58 1,752 39,293 703 17,226 0 24 2,377 20,331 59,6241975 695 25,513 280 61 2,389 28,937 726 16,923 37 26 4,050 21,762 50,6991976 470 22,845 66 99 3,902 27,382 418 19,943 0 37 7,019 27,417 54,7981977 343 27,301 39 169 6,710 34,561 342 21,317 0 47 8,497 30,203 64,7641978 754 35,675 0 189 7,999 44,617 564 22,772 0 66 12,026 35,428 80,0451979 838 39,000 26 156 8,822 48,843 785 27,382 0 67 11,326 39,559 88,4021980 1,009 40,300 21 189 9,808 51,326 338 29,024 0 96 9,288 38,746 90,0721981 527 43,614 99 258 9,389 53,887 272 25,671 0 93 10,461 36,496 90,3831982 427 43,877 124 91 7,285 51,805 173 37,260 7 83 10,584 48,108 99,9131983 396 49,891 115 116 8,658 59,176 182 32,350 22 69 10,066 42,690 101,8671984 386 48,904 152 123 8,694 58,260 76 30,674 53 94 8,337 39,234 97,4941985 315 40,693 225 115 6,791 48,140 143 23,149 70 81 7,888 31,331 79,4711986 421 37,367 252 170 7,308 45,518 149 25,975 83 87 10,257 36,551 82,0691987 626 36,459 288 140 12,518 50,031 288 23,377 46 85 15,924 39,720 89,7521988 626 35,635 183 162 14,382 50,987 247 22,370 46 90 16,259 39,012 89,9991989 536 37,663 73 48 19,609 57,930 211 20,264 17 92 16,377 36,961 94,8901990 385 50,465 208 347 18,338 69,743 216 35,720 71 73 19,813 55,893 125,6361991 1,174 22,882 243 99 18,508 42,906 323 29,856 44 113 15,850 46,185 89,0911992 1,646 13,153 247 269 14,558 29,874 1,105 19,609 0 107 18,088 38,909 68,7831993 69 7,994 35 212 9,869 18,180 27 21,791 1 110 12,168 34,097 52,2771994 20 65,500 11 265 6,099 71,896 28 16,301 1 228 5,056 21,613 93,5091995 28 22,993 8 443 8,733 32,205 30 11,701 1 350 19,845 31,927 64,1321996 28 15,598 26 419 8,360 24,431 27 25,801 8 131 11,467 37,433 61,8641997 30 6,633 34 392 11,061 18,151 30 6,784 4 91 6,334 13,243 31,3931998 25 26,723 6 217 6,819 33,790 34 20,136 0 252 8,444 28,866 62,6561999 23 3,810 3 599 7,194 11,628 24 9,627 0 249 7,955 17,854 29,4822000 14 6,917 4 181 5,208 12,324 26 17,040 0 792 4,709 22,568 34,8922001 20 21,144 0 404 3,767 25,335 22 8,439 0 204 3,249 11,914 37,2492002 21 12,176 1 391 6,088 18,677 107 9,663 0 2,464 7,696 19,931 38,6082003 38 17,915 8 522 7,913 26,397 10 18,061 0 443 8,068 26,582 52,9802004 9 14,423 4 450 5,232 20,118 11 21,684 0 498 4,078 26,271 46,3892005 91 14,186 2 1,037 6,079 21,395 54 19,196 0 559 4,613 24,421 45,8162006 195 10,594 0 860 5,728 17,377 17 12,316 1 362 4,935 17,631 35,0082007 46 14,755 0 1,041 5,796 21,640 27 16,771 0 771 7,222 24,791 46,4312008 111 10,667 2 1,320 5,073 17,173 65 12,703 0 708 4,939 18,415 35,5882009 132 10,530 1 1,451 4,053 16,165 176 15,080 0 537 3,237 19,030 35,1952010 269 9,433 0 1,058 8,082 18,841 209 11,869 0 1,344 5,284 18,706 37,547

ABC specifications - 20 - May 2011 Skate PDT
Table 7. Number of length samples by region, year, season, and gear type of the discarded component of the skate catch from the Northeast Fisheries Observer Program
GOMGBK
Half 1 Half 2
YEARLine
TrawlOtter Trawl
Shrimp Trawl
Sink Gill Net
Scallop Dredge
Line Trawl
Otter Trawl
Shrimp Trawl
Sink Gill Net
Scallop Dredge
1994 60 9 3321995 726 9 55 90 371996 626 17 107 7 451997 263 25 9 183 251998 13 1499 60 2131999 52 77 18 482000 464 13 46 393 97 42001 1201 83 167 582002 752 178 6089 224 7622003 22 7508 186 564 12 6949 758 802004 41 6770 15 1710 654 56 8229 1758 13672005 74 19177 29 703 1042 13 12926 779 21242006 50 8096 460 440 35 8020 418 29492007 3 9376 393 1714 52 12468 1949 35142008 308 12704 26 386 1799 124 9658 525 26102009 11 4727 134 845 63 4013 296 7992010 451 8084 665 374 310 6894 2455 2090
SNEMA
Half 1 Half 2
YEARLine
TrawlOtter Trawl
Shrimp Trawl
Sink Gill Net
Scallop Dredge
Line Trawl
Otter Trawl
Shrimp Trawl
Sink Gill Net
Scallop Dredge
1994 na 619 na 55 3541995 261 na 698 500 na 121996 19 na 347 379 247 na 0 01997 407 na 188 52 1323 na 46 1791998 1 na 11 0 43 na 28 01999 0 na 78 0 0 na 10 02000 356 na 88 0 922 na 32 862001 942 na 72 0 1664 na 74 572002 190 na 370 0 1701 na 164 21252003 0 30 na 246 1525 520 na 1312 9872004 0 1285 na 614 6762 0 2789 na 630 75462005 0 2423 na 745 2670 0 4285 na 762 20422006 24 808 na 61 0 1 1906 na 202 38442007 0 740 na 219 2819 0 1008 na 39 38192008 47 1480 na 738 8445 0 1961 na 140 50722009 0 1087 na 868 7135 0 2049 na 294 22162010 0 958 na 2161 4925 2875 na 562 3612

ABC specifications - 21 - May 2011 Skate PDT
Figure 4. Pooling scheme used to derive the length composition of the discarded component of the skate catch.
GOMGBK
GOM only GOMMAtrawl gill net scallop dredge shrimp longline
1 2 1 2 1 2 1 2 1 2
1995
1996
19971998
19992000
2001
2002
2003
2004
2005
2006
2007
2008
2009
2010
SNEMAtrawl gill net scallop dredge
1 2 1 2 1 2
1995
1996
1997
19981999
2000
2001
2002
2003
2004
2005
2006
2007
2008
20092010
ABC specifications - 22 - May 2011 Skate PDT
Table 8. Estimates of discards by species from the longline fishery from 1968-2010.
longlineYear winter little barndoor thorny smooth clearnose rosette Total
1968 216 110 18 235 19 0 0 5971969 343 189 17 237 12 0 0 7971970 332 124 3 304 16 0 0 7791971 289 213 18 605 51 0 0 11751972 370 140 14 646 60 0 0 12301973 362 147 0 732 77 0 0 13201974 396 206 2 625 102 0 0 13301975 391 259 2 735 34 0 0 14211976 320 140 5 379 44 0 0 8881977 253 81 0 315 35 0 0 6841978 592 311 1 234 39 132 9 13171979 827 389 0 301 32 70 3 16231980 687 341 0 213 40 51 15 13471981 284 219 0 185 18 87 7 7991982 276 224 0 90 5 5 0 6011983 334 174 0 40 7 24 0 5781984 300 110 0 30 1 15 5 4621985 253 157 0 35 2 12 0 4581986 343 112 0 43 4 68 0 5701987 672 165 0 48 3 21 5 9141988 675 145 0 41 5 2 4 8731989 560 120 0 56 5 6 1 7471990 367 132 0 78 8 14 1 6001991 905 306 1 222 21 41 1 14971992 1463 806 17 365 31 54 14 27511993 41 28 0 25 3 0 0 971994 13 15 0 17 2 0 0 481995 40 6 4 5 1 1 0 581996 39 7 5 3 1 2 0 551997 36 8 9 4 1 3 0 601998 39 9 5 3 1 2 0 591999 33 7 5 1 0 1 0 472000 24 6 7 2 1 1 0 402001 24 8 7 1 1 2 0 422002 82 20 17 1 2 6 0 1282003 29 9 6 2 2 1 0 482004 12 3 4 0 1 1 0 202005 70 19 39 6 11 0 0 1452006 116 32 50 4 10 0 0 2122007 36 11 23 1 2 0 0 732008 63 53 39 1 4 15 0 1762009 181 79 29 1 3 15 0 3072010 243 89 121 3 15 7 0 478
ABC specifications - 23 - May 2011 Skate PDT
Table 9. Estimates of discards by species from the otter trawl and shrimp trawl fisheries from 1968-2010.
otter trawl
Year winter little barndoor thorny smooth clearnose rosette Total
1968 29746 35747 4116 17610 1423 35 62 887391969 29240 36787 1343 14412 895 780 9 834661970 21483 30043 884 15936 930 794 30 701011971 15430 20556 582 16328 1783 399 7 550851972 19276 16530 561 12950 1282 902 36 515381973 18019 19966 83 14378 1801 475 35 547581974 20645 17359 103 12949 2591 405 30 540821975 14048 16189 36 11682 643 122 33 427531976 13259 17041 146 10151 1119 837 301 428541977 19902 15173 1 11619 1110 796 55 486571978 29013 15807 27 9880 1734 1844 144 584471979 30018 23290 12 10310 1206 1504 68 664081980 38105 16454 2 11863 1919 759 242 693451981 39178 16476 2 11483 1037 1109 99 693841982 40881 30555 7 9051 502 243 31 812691983 46678 23986 1 8819 964 1909 22 823781984 41143 27779 5 8300 373 1572 613 797841985 34981 19051 3 9090 444 558 11 641371986 38507 11655 12 6690 587 6183 43 636771987 30425 19848 12 5314 365 3336 870 601701988 32188 19164 10 3938 583 247 2103 582341989 26173 26266 23 3527 367 1501 161 580171990 37105 36204 18 6548 700 5432 458 864641991 17261 17806 39 3619 376 13767 155 530251992 10596 15732 130 1497 119 3433 1502 330091993 9578 15577 241 3402 368 424 232 298211994 16180 57575 254 2958 216 4430 200 818141995 16022 13707 230 466 437 3786 55 347041996 14602 20837 27 153 161 5449 205 414331997 6516 5814 65 327 222 491 19 134551998 21160 21146 171 789 396 3110 94 468671999 5867 6138 365 264 171 615 20 134402000 9158 11932 508 329 348 1583 104 239622001 15464 9334 2339 867 417 1156 6 295842002 12077 5504 1914 778 440 1124 2 218402003 16244 15465 1090 956 929 1287 14 359852004 20064 11871 1183 650 1440 868 37 361132005 14175 13214 2874 668 1601 808 45 333852006 10983 7220 2829 428 920 504 28 229122007 15493 9669 3542 355 705 1748 14 315272008 11220 6268 3258 90 591 1915 31 233732009 15734 6991 1492 179 591 600 24 256102010 14084 3637 2544 268 577 185 7 21302

ABC specifications - 24 - May 2011 Skate PDT
Table 10. Estimates of discards by species from the sink gill net fishery from 1968-2010.
sink gill netYear winter little barndoor thorny smooth clearnose rosette Total
1968 0 1 2 42 2 0 0 461969 1 0 5 30 2 0 0 381970 1 0 0 26 2 0 0 291971 0 1 0 25 4 0 0 291972 4 1 0 36 4 0 0 451973 1 0 0 40 5 0 0 461974 1 1 0 67 14 0 0 821975 2 0 0 80 4 0 0 871976 2 2 1 113 18 0 0 1351977 6 0 0 190 20 0 0 2161978 4 1 0 205 45 0 0 2551979 50 4 0 144 26 0 0 2231980 55 12 0 184 33 0 0 2851981 36 12 0 270 33 0 0 3501982 40 17 0 112 6 0 0 1751983 43 4 0 122 16 0 0 1851984 65 11 0 136 5 0 0 2171985 35 10 0 145 6 0 0 1961986 60 8 0 174 14 0 0 2571987 49 6 0 160 9 0 0 2251988 45 44 0 141 21 0 0 2521989 65 7 0 62 5 0 0 1401990 48 33 0 300 40 0 0 4211991 46 9 1 140 16 0 0 2121992 66 147 18 138 8 0 0 3761993 96 132 1 81 11 0 0 3211994 89 221 1 136 25 18 2 4921995 435 286 8 25 16 23 0 7931996 324 188 2 8 3 23 1 5501997 189 263 1 4 1 25 1 4841998 163 261 1 4 6 32 2 4691999 282 514 3 5 3 40 1 8472000 651 247 12 29 16 19 0 9732001 347 150 39 13 5 52 1 6082002 2426 101 204 22 5 96 0 28562003 548 225 89 18 20 64 0 9652004 501 248 134 15 25 25 0 9482005 803 331 297 23 52 89 1 15962006 663 104 392 14 13 34 0 12222007 1184 315 172 10 20 108 3 18122008 650 295 742 3 18 320 0 20282009 1407 286 188 8 23 75 0 19882010 1471 122 764 6 15 23 0 2402

ABC specifications - 25 - May 2011 Skate PDT
Table 11. Estimates of discards by species from the scallop dredge fishery from 1968-2010.
scallop dredgeYear winter little barndoor thorny smooth clearnose rosette Total
1968 4033 2592 88 711 67 402 37 79301969 1893 1886 52 684 33 415 3 49661970 1740 972 10 863 44 327 12 39691971 994 1229 55 1304 145 327 4 40591972 1094 1285 37 1410 159 184 7 41751973 1162 962 1 1493 188 64 2 38721974 983 1298 3 953 177 674 40 41291975 814 3209 5 1915 82 400 15 64391976 2373 4695 22 1390 151 1745 545 109211977 6070 5076 1 1935 128 1772 225 152061978 7750 5505 6 1820 173 4468 304 200251979 8742 6499 7 2260 215 2313 111 201481980 7894 5193 1 3929 691 1069 318 190961981 11129 4131 1 3432 327 777 53 198501982 9669 6476 2 1431 84 188 20 178691983 7781 6794 0 1621 202 2301 26 187251984 7927 5517 2 1295 46 1757 487 170311985 6489 6130 1 1222 47 780 11 146801986 9984 2912 10 886 90 3661 22 175651987 12266 10899 7 849 54 3517 851 284421988 15736 10907 6 1305 194 621 1872 306401989 19790 12712 7 1419 162 1725 170 359861990 25519 6877 44 2129 180 3149 253 381511991 17490 9545 15 2434 207 4573 94 343581992 18091 8846 90 1794 195 2849 783 326461993 6497 12525 109 1762 203 702 239 220371994 2229 5939 48 1419 217 1161 142 111551995 9186 18712 59 109 113 241 159 285781996 5587 13517 90 173 166 90 205 198281997 4018 12444 305 155 217 212 46 173961998 3444 10989 122 219 227 145 116 152631999 2679 11971 117 132 75 96 78 151492000 1901 7637 74 94 68 71 73 99182001 1108 5600 32 23 50 72 127 70112002 1889 11300 160 38 87 236 75 137852003 2051 13436 92 127 213 43 21 159822004 3053 5536 79 32 96 496 17 93102005 3174 6686 397 59 152 168 56 106912006 3717 6079 395 92 151 208 22 106632007 3711 8579 324 70 122 185 29 130192008 2398 6613 290 31 250 383 40 100062009 2485 4228 335 18 48 153 23 72902010 4325 8446 303 22 52 196 21 13366

ABC specifications - 26 - May 2011 Skate PDT
Figure 5. Comparison of discard rates on At-Sea-Monitoring and Sea Sampler Observer Program trips. X-axis represents SBRM fleets, numbered 1 to 52 (see 2010 SBRM report for documentation). Y-axis represents a ratio in relative discard rates between the two programs (ASM/SSOP).

ABC specifications - 27 - May 2011 Skate PDT
Figure 6. Comparison of discard rates on At-Sea-Monitoring and Sea Sampler Observer Program trips. X-axis represents SBRM fleets, numbered 1 to 52 (see 2010 SBRM report for documentation). Y-axis represents a ratio of groundfish to non-groundfish discard rates between the two programs (ASM/SSOP).

ABC specifications - 28 - May 2011 Skate PDT
Table 12. Comparison of different trawl types.
gear typediscard to kept ratio
mt in dealer
Number of trips observed
Number of trips in dealer
otter 0.277 83597 2124 20439ruhle 0.291 131 31 39haddock separator 0.427 2323 122 144
Applying a 50% discard mortality rate, the total dead discards were estimated at 18,744 mt. The discard rate for 2010 was therefore 56.6 percent of the total catch and for the 2008-2010 period was 51.0 percent (an decrease from the 52% discard rate in the 2010 specifications). This three year average discard rate is assumed to apply in the specifications according to approved Amendment 3 procedures. Including transfers at sea in landings, the 2010 discard rate is estimated to be 44.5%, or 47.9% averaged over 2008-2010. Revising the assumed discard mortality rate for little (M=0.20) and winter (M=0.12) skates captured by trawl gear (Section X7.0X), the estimated 2010 discard rate is 30.3%, or 36.3% averaged over 2008-2010. Changes in discard estimation and discard mortality affected the entire catch history. These revisions also affect the estimation of MSY, because they change the catch/biomass medians derived from historic catches before 2008. Total catch including landings and dead discards assuming a 50% mortality rate are graphed against annual MSY estimates in XFigure 7X. Total catch was near the ABC level in 1994, 1996, 1998, and 2007, but generally has been around 20,000 to 40,000 mt annually since 1990 and was near the ACT level, if current ACL policies had been in place. Total catch increased since 2006 to near time series high in 2008 and 2009, before declining in 2010 under ACL management. Total landings have been below the recalculated TAL since 2009F
1F. MSY (here defined as the catch resulting from application of the
catch/biomass medians to the target skate biomass levels) is estimated to be 63,192 mt. If lower and variable discard mortality is assumed for little and winter skates captured by vessels using trawls, the catch history is plotted in XFigure 8X. Total skate catch varied from 20,000 to 30,000 mt since 1989 and was above the ABC level (associated with the catch/biomass median) in 1996 and 2007. Due to the lower discard mortality assumption, landings are a greater fraction of the catch and increased above the TAL level since 2006, before dropping below the revised TAL estimate in 2010. MSY (here defined as the catch resulting from application of the catch/biomass medians to the target skate biomass levels) is estimated to be 46,192 mt.
1 The actual TAL was lower in 2010 because it was based on 2006-2009 survey data and 2007-2009 discard estimates.

ABC specifications - 29 - May 2011 Skate PDT
Figure 7. Total annual skate landings and catch plotted against annual ABC estimates using a three year moving average for skate biomass using FSV Bigelow surveyed strata, with updated discard mortality estimates, reported skate transfers at sea, and constant discard mortality assumed to be 50% based on published literature. The ACL specifications in 2010 use data from survey biomass for the 2008 FSV Albatross survey and 2009-2010 calibrated FSV Bigelow surveys.
-
10,000
20,000
30,000
40,000
50,000
60,000
70,000
80,000
90,000
1985 1990 1995 2000 2005 2010
Cat
ch o
r la
nd
ing
s (m
t)
ACL/ABC ACT
TAL Landings
Catch MSY ABC
ACT
TAL
Figure 8. Total annual skate landings and catch plotted against annual ABC estimates using a three year moving
average for skate biomass using FSV Bigelow surveyed strata, with updated discard mortality estimates, reported skate transfers at sea, and variable discard mortality for little and winter skates based on recent research on commercial vessels fishing in the Gulf of Maine. The ACL specifications in 2010 use data from survey biomass for the 2008 FSV Albatross survey and 2009-2010 calibrated FSV Bigelow surveys.
-
10,000
20,000
30,000
40,000
50,000
60,000
70,000
80,000
90,000
1985 1990 1995 2000 2005 2010
Cat
ch o
r la
nd
ing
s (m
t)
ACL/ABC ACT
TAL Landings
Catch MSY
ABC
ACT
TAL

ABC specifications - 30 - May 2011 Skate PDT
6.0 5BAccountability measures Since neither the skate wing nor skate bait landings by vessels holding federal permits exceeded 105% of the wing or bait TALs implemented in Amendment 3 for 2010, they did not trigger TAL-related AMs. Had either TAL been exceeded by more than 5%, the inseason trigger point (specified percent of the TAL) where possession limits are reduced to the incidental level, would have been automatically lowered in proportion to the overage. Amendment 3 set this fraction at 80% of the wing TAL and 90% of the bait TAL. Skate Framework Adjustment 1 increased the skate wing AM trigger to 85% of the TAL. Even though transfers at sea for bait were not originally included in the 2010 ACL specifications, they accounted for 4% of the 41,080 mt ACL and were included in the estimated total removals, absorbed in the 25% buffer between the ACL and the ACT for management uncertainty. Estimated dead discards assuming a 50% mortality rate in 2010 accounted for 46% of the ACL. Taken together, total removals (federal and state landings, transfers at sea, and dead discards) totaled 77.2 million pounds (35,477 mt) or 85% of the 2010 ACL, exceeding the ACT but not exceeding the ACL. Since total catch did not exceed the ACL in 2010, no automatic AMs were triggered.
7.0 6BDiscard mortality Data on immediate- and delayed (i.e. post-release) mortality rates of discarded skates and rays is extremely limited. Only five published studies have estimated discard mortality rates in these species (XTable 13X), and only one examined a skate from the Northeast Skate Complex (winter skate, Benoit 2006). Based largely upon the results of this study, which estimated acute discard mortality rates of winter skates caught in Canadian bottom trawl surveys, the SSC in 2009 decided to use a 50% discard mortality rate assumption for all skates and gears for the purposes of setting the Skate ABC. Since skate discards are high across many fisheries, the estimates of total skate catch are sensitive to the discard mortality rate assumption, and have direct implications for allowable landings in the skate fisheries. Therefore, the PDT reviewed the best available scientific information on skate discard mortality rates to determine if the 50% assumption is still appropriate. The review included summarizing old and new published data (XTable 14X), as well as receiving a report on the preliminary findings of a focused skate discard mortality study being carried out in the Gulf of Maine by Drs. John Mandelman (New England Aquarium) and James Sulikowski (University of New England). The results are summarized below.
7.1 17BLiterature Review XTable 13X summarizes the results of the five studies on skate/ray discard mortality rates. The study locations, fisheries, species, and gears varied across these studies, however most used some type of trawl gear. Only one study (Benoit 2010) estimated the skate discard mortality rate in scallop dredge gear (10% for winter skate). Discard mortality rates for skates have not been estimated in any other gear types (e.g., gillnet, hook gear). Due to the differences in study objectives, methods, and sample sizes across these investigations, it is difficult to directly

ABC specifications - 31 - May 2011 Skate PDT
compare these results, but they may inform the range of reasonable mortality rate assumptions for the Northeast Skate Complex. Overall, discard mortality rates of skates and rays in trawl gears ranged from 10-100%. Mortality rates varied greatly between species. However, across this broad range of species, the mean discard mortality rate was approximately 50% (±1 standard deviation = 24%). While there are some significant assumptions associated with applying this information to the Northeast Skate Complex, it appears that the current scientific literature supports the use of an assumed 50% discard mortality rate for skates in trawl gear. However, more research is clearly needed on this subject area. Despite the Benoit (2010) estimate of winter skate discard mortality rates in scallop dredge gear (10%), the PDT decided that this estimate is not applicable to the Northeast Skate Complex. The Benoit study was conducted in the Gulf of St. Lawrence using at-sea observer data, and the dredge gear (small bucket scallop dredges) are not considered comparable to the New Bedford style dredges used in the New England scallop fishery. Given the magnitude of skate discards by scallop dredge vessels (Table 6), research on discard mortality rates in this gear should be a high priority. Table 13. Summary of published skate and ray discard mortality rate studies.
Source Location Gear Type Skate/Ray SpeciesDiscard Mortality Rate (%Dead)
Stobutzki et al. (2002) N. Australia Prawn Trawl 56 elasmo species 56% (range = 10‐82%)All rays 61%Dasyatidae 59%Gymnuridae 41%Rhynchobatidae 10%
Laptikhovsky (2004) Falkland Islands Squid Trawl Bathyraja albomaculata 28.6%B. brachiurops 45.4%B. griseocauda 100%B. macloviana 100%B. magellanica 40%Bathyraja sp. 25%Psammobatis sp. 40%
Benoit (2006) Gulf of St. Lawrence Bottom Trawl Leucoraja ocellata 50%Enever et al. (2009) Bristol Channel, UK Bottom Trawl 4 skate species mean = 45%
Leucoraja naevus 67%Raja microocellata 49%Raja brachyura 45%Raja clavata 41%
Benoit (2010) Gulf of St. Lawrence Scallop Dredge Leucoraja ocellata 10%
MEAN TRAWL 50%

ABC specifications - 32 - May 2011 Skate PDT
7.2 18BSkate Discard Mortality Research in the Gulf of Maine Drs. John Mandelman and James Sulikowski received NOAA funding in 2009 (Saltonstall-Kennedy Grant Program) to investigate the immediate and short-term discard mortality rates of skates in the Gulf of Maine. Their study is investigating mortality rates of winter, little, thorny, and smooth skates captured by otter trawl gear. The research is ongoing, but preliminary data were presented to the PDT on discard mortality rates of little and winter skates, which dominate the skate catch in the region. Since a variety of factors contribute to discard mortality rates (e.g., tow duration, temperature differentials, fish size and sex, tow weight, deck time and handling, etc.), the researchers are attempting to account for each of these variables. Trials were done with tow durations of 20-30 minutes (controls), 2 hours, and 3-4 hours, accounting for the range typical of industry practices in this region. The distribution of the estimated catch biomass load per tow in the study, a factor previously shown to positively correlate with the mortality of discarded finfish bycatch, was also reported as broad, and included heavily packed tows. Skates were sampled from the catch and given a standardized condition index of 1-3 based on the extent of visible injuries and general condition (i.e. energy levels). They were then placed in specially-designed cylindrical mesh cages (with sea lice resistant bottoms), and returned to the water for a period of 72 hours. The biomass of skates in each cage was kept relatively constant between trials. The cages were then retrieved and sampled for the numbers of dead and alive skates. So far, over 650 individual skates have been sampled for immediate and delayed mortality, including 243 little skates (18-60 cm TL) and 203 winter skates (23-95 cm TL) on 37 tows (the number of specimens assessed for immediately mortality only exceeds 2000). Initial results indicate that immediate at-vessel mortality of trawl-caught skates (all species) is near zero. Excluding skates from the shorter control tows (to more closely approximate commercial tow durations), pooled mortality rates after the 72-hour cage trials were 20% for little skate and 12% for winter skate (see table below). Significant predictors of mortality included condition index (more injuries resulted in higher mortality) and sex (males had higher mortality than females). Other variables were not significant, however, the researchers acknowledge that sample size is still relatively low at this time. Table 14. Preliminary estimates of Gulf of Maine little and winter skate delayed (72-h) discard
mortality rates in trawl gear.
Tow Duration PooledN tows Dead Alive N tows Dead Alive Dead Alive %Mortality
Little 6 18 61 4 17 79 35 140 20%
Winter 11 3 47 11 21 124 24 171 12%
Total2h 3‐4 hr
This project is anticipated to be completed in 2011. Laboratory-based experiments on the physiological effects of aerial exposure stress on little and thorny skates are also ongoing. The researchers expect to complete analysis of final study results in 2012, including mortality rate estimates for thorny and smooth skates, and a complete analysis of mortality predictor variables.

ABC specifications - 33 - May 2011 Skate PDT
7.3 19BPDT Recommendations Despite the results of the skate discard mortality project being preliminary, the PDT felt that they represented the best available scientific information for the Northeast Skate Complex. While the literature on other species and fisheries generally appears to support a 50% discard mortality rate assumption, data collected on regional skate species using regional fishing practices is more directly applicable. Drs. Mandelman and Sulikowski felt strongly that species specific differences in discard mortality were important, so the preliminary results for little and winter skates were not directly applicable to other skate species, such as thorny and smooth skates which were also caught in the study. At this time, samples were at this time insufficient to estimate discard mortality for these species. More discard mortality trials are currently underway and final results may provide discard mortality estimates for these species. In the meantime, the PDT decided that the existing working assumption of 50% discard mortality for all species except for little and winter skates captured by commercial length trawl tows was appropriate. The PDT is therefore recommending that for little and winter skates discarded by trawl gear, the assumed mortality rates should be changed to 20% and 12%, respectively. This assumption was applied (Section X5.0X) by disaggregating the discard estimates for each gear type by species using methods approved by the Northeast Data Poor Stocks Working Group (NEFSC 2009). The applied discard mortality rate varies by year (XTable 15X) due to the differences in the proportions of little and winter skate discarded by gear type. This new discard mortality assumption changes the perception of discard mortality by species XFigure 9X shows the estimated trends in dead discards assuming a 50% discard mortality rate for all species and gears, the substantial majority from discards of the more abundant little and winter skates. XFigure 10X shows the estimated trends in dead discards assuming a variable mortality rate, with a 20% discard mortality rate applied to little skates and a 12% discard morality rate applied to winter skates when either was captured by trawls in the expanded discard estimates by gear. Dead discards of the more abundant little and winter skates still comprise a majority of total dead skate discards, but are much lower. The trends in total dead discards are similar to that assuming a 50% discard mortality rate, but thorny skate discards were a large portion of the total before 1987. The new discard mortality assumptions and discard estimates of course also change the estimates of current and historic skate catch (Section X8.0X) and its application for setting the Skate ABC and for estimating MSY (Section X9.0X). The estimates of historic catch and ACLs, calculated by applying the three year moving average biomass to the respective catch/biomass medians is shown in XFigure 9X and XFigure 10X, respectively. Both the total catch and the respective ACL threshold and target catches change as a result of making different assumptions about the discard mortality rate, but trends in catch with respect to ACL thresholds and targets are similar. Catches were near the ACT level for most of the time series, except for 2007 and 2008 when increasing landings and discards as well as declining skate biomass caused the total catch to reach or exceed the ACL level.
ABC specifications - 34 - May 2011 Skate PDT
Table 15. Weighted average discard mortality rates by species, assuming a discard mortality rate of 0.12 for winter skate and 0.20 for little skate captured by trawls, otherwise 0.50.
Winter Little Barndoor Thorny Smooth Clearnose RosetteWeighted average
Three year weighted average
0.170 0.221 0.500 0.500 0.500 0.500 0.500 0.275 0.150 0.216 0.500 0.500 0.500 0.500 0.500 0.253 0.156 0.211 0.500 0.500 0.500 0.500 0.500 0.271 0.266 0.152 0.220 0.500 0.500 0.500 0.500 0.500 0.301 0.272 0.150 0.224 0.500 0.500 0.500 0.500 0.500 0.285 0.285 0.152 0.216 0.500 0.500 0.500 0.500 0.500 0.287 0.291 0.147 0.224 0.500 0.500 0.500 0.500 0.500 0.282 0.285 0.153 0.253 0.500 0.500 0.500 0.500 0.500 0.300 0.289 0.187 0.266 0.500 0.500 0.500 0.500 0.500 0.316 0.299 0.214 0.276 0.500 0.500 0.500 0.500 0.500 0.314 0.310 0.207 0.281 0.500 0.500 0.500 0.500 0.500 0.304 0.310 0.215 0.269 0.500 0.500 0.500 0.500 0.500 0.293 0.303 0.193 0.276 0.500 0.500 0.500 0.500 0.500 0.286 0.294 0.208 0.263 0.500 0.500 0.500 0.500 0.500 0.282 0.287 0.197 0.254 0.500 0.500 0.500 0.500 0.500 0.254 0.273 0.179 0.268 0.500 0.500 0.500 0.500 0.500 0.257 0.264 0.186 0.251 0.500 0.500 0.500 0.500 0.500 0.255 0.255 0.184 0.275 0.500 0.500 0.500 0.500 0.500 0.262 0.258 0.203 0.262 0.500 0.500 0.500 0.500 0.500 0.281 0.265 0.236 0.307 0.500 0.500 0.500 0.500 0.500 0.306 0.284 0.251 0.310 0.500 0.500 0.500 0.500 0.500 0.301 0.296 0.288 0.298 0.500 0.500 0.500 0.500 0.500 0.313 0.307 0.278 0.249 0.500 0.500 0.500 0.500 0.500 0.302 0.305 0.318 0.307 0.500 0.500 0.500 0.500 0.500 0.367 0.324 0.368 0.315 0.500 0.500 0.500 0.500 0.500 0.373 0.340 0.277 0.335 0.500 0.500 0.500 0.500 0.500 0.342 0.363 0.171 0.229 0.500 0.500 0.500 0.500 0.500 0.250 0.312 0.265 0.374 0.500 0.500 0.500 0.500 0.500 0.342 0.301 0.232 0.319 0.500 0.500 0.500 0.500 0.500 0.310 0.294 0.272 0.406 0.500 0.500 0.500 0.500 0.500 0.366 0.334 0.178 0.304 0.500 0.500 0.500 0.500 0.500 0.271 0.306 0.250 0.401 0.500 0.500 0.500 0.500 0.500 0.363 0.317 0.206 0.319 0.500 0.500 0.500 0.500 0.500 0.298 0.300 0.156 0.314 0.500 0.500 0.500 0.500 0.500 0.268 0.306 0.224 0.402 0.500 0.500 0.500 0.500 0.500 0.339 0.303 0.176 0.341 0.500 0.500 0.500 0.500 0.500 0.297 0.301 0.180 0.298 0.500 0.500 0.500 0.500 0.500 0.260 0.296 0.207 0.304 0.500 0.500 0.500 0.500 0.500 0.297 0.285 0.233 0.339 0.500 0.500 0.500 0.500 0.500 0.320 0.290 0.214 0.344 0.500 0.500 0.500 0.500 0.500 0.312 0.309 0.205 0.358 0.500 0.500 0.500 0.500 0.500 0.328 0.319 0.201 0.319 0.500 0.500 0.500 0.500 0.500 0.272 0.305 0.236 0.411 0.500 0.500 0.500 0.500 0.500 0.330 0.310

ABC specifications - 35 - May 2011 Skate PDT
Figure 9. Total dead discards assuming discard mortality is equal to 50% for all species and gears.
-
5,000
10,000
15,000
20,000
25,000
30,000
35,000
1967 1972 1977 1982 1987 1992 1997 2002 2007
Calendar year
To
tal d
isca
rds
(mt)
little
barndoor
thorny
smooth
clearnose
rosette
winter
Figure 10. Total dead discards assuming discard mortality is 12% for winter skate and 20% for little skate captured by trawls, otherwise 50%.
-
2,000
4,000
6,000
8,000
10,000
12,000
14,000
16,000
18,000
20,000
1967 1972 1977 1982 1987 1992 1997 2002 2007
Calendar year
To
tal d
isc
ard
s (m
t)
little
barndoor
thorny
smooth
clearnose
rosette
winter

ABC specifications - 36 - May 2011 Skate PDT
8.0 7BDiscard rate The discard rate is assumed to apply to the 2012-2013 specification period based on the proportion of dead discards in the total skate catch (landings + dead discards) during the most recent three year period (2008-2010). Trends in discard mortality are similar, whether a 50% or variable (see Section X7.0X) discard mortality rate is assumed. Dead discards as a proportion of total catch declined from 1985 to 1999 (30% of total catch with a 50% discard mortality assumption and 22% of total catch with a variable rate discard mortality assumption for little and winter skates) (XFigure 11X and XFigure 12X). Since 1999, using either dead discard mortality assumption, dead discards have increased as a proportion of total catch. In 2010, the three year moving average discard rate increased to 47.9% of total catch assuming a 50% discard mortality rate and 36.3% of total catch assuming a variable discard mortality rate. Discards for 2010 included January through July before Amendment 3 implementation, July to August when a 5,000 lbs. skate wing possession limit existed, and September to December when the 500 lbs. incidental skate wing possession limit was in effect. Discard estimates for January to April 2011 will not be available until May 2012 due to reporting and data processing procedures.

ABC specifications - 37 - May 2011 Skate PDT
Figure 11. Trend in calendar year skate discard rate with updated discard estimates and 50% discard mortality for all species and gears.
0%
10%
20%
30%
40%
50%
60%
70%
80%
90%
100%
1984 1989 1994 1999 2004 2009
Dis
ca
rd r
ate
(c
on
sta
nt
mo
rta
lity
) Annual
Three year average

ABC specifications - 38 - May 2011 Skate PDT
Figure 12. Trend in calendar year skate discard rate with updated discard estimates and discard mortality=0.20 for little skate and 0.12 for winter skate caught by vessels using trawls.
0%
10%
20%
30%
40%
50%
60%
70%
80%
90%
100%
1984 1989 1994 1999 2004 2009
Dis
ca
rd r
ate
(c
on
sta
nt
mo
rta
lity
) Annual
Three year average
9.0 8BACL specifications The largest change in proposed 2012-2013 skate complex ACL specifications occurs from increases in survey biomass (analysis B in the table below) from 2006-2008 to 2008-2010 time periods, mostly from increases in little and winter skate biomass. The average three year mean biomass increases from 5.04 to 7.80 kg/tow for little skate and from 5.23 to 9.68 kg/tow for winter skates. This survey biomass increases the ABC from 41,080 mt to 69,215 mt. All other ACL specifications increase accordingly. Changing the assumption about state landings from 3% to 12.6% in analysis C (see table below) has no effect on the ABC, ACT, or TAL, but reduces the amount allocated to Federally permitted vessels, from 23,979 mt to 21,752 mt. Nonetheless this amount is a substantial increase over the 13,856 TAL in current specifications (analysis A) and is a 13.8 percent increase over the landings that occurred in 2007, the peak year of landings before Amendment 3. Including reported skate transfers at sea for bait increases that catch biomass median values, particularly for little skate which is the chief component of skate bait fishery landings. The PDT assumed that the species composition of skate transfers at sea were the same as those that the DPWS estimated for the skate bait fishery.

ABC specifications - 39 - May 2011 Skate PDT
The effect on the ACL specification of including transfers at sea in the calculations is to raise the ABC estimate (because the catch/biomass median values rise) and reduce the discard rate (because more landings are included in the denominator). The additional landings data raised the ABC estimate at the catch/biomass medians nearly 2,000 mt to 70,905 mt (analysis D in the table below). At the same time, the estimated discard rate for 2008-2010 declined from 52% to 43%, raising the TAL to 30,390 mt. In 2010, the estimated discards increased to 18,744 mt and when combined with lower skate landings, the discard rate declined to 48 percent when skate transfers at sea are taken into account. Also updated were the discard estimates including the landings reported as transfers at sea. Including the transfers at sea in landings and re-estimating discards and catch/biomass medians for the time series increased the ABC to 76,491 mt (analysis E in the table below). At the same time, updating the analysis to include discards for 2008-2010 increases the discard rate to 47.9%. And when combined with the revised ABC, results in a 29,900 mt TAL based on all landings sources and updated discard estimates. Finally, new research in the Gulf of Maine on commercial trawl vessels indicates that the discard mortality rate for little and winter skates is less than formerly assumed (see Section X7.0X). Applying the new discard mortality rate to little and winter skate discards in the trawl fishery reduces the overall skate discard mortality rate to M=0.31. The applied discard mortality rate was allowed to vary by species, using these new research mortality estimates, but are reported here as a weighted average for simplicity. The average fishing mortality rate for little and winter skate varied by year due to the proportion of estimated discards in the trawl fishery, ranging from 0.216 to 0.411 for little skate and from 0.253 to 0.367 for winter skate. The effect of this change on ACL specifications is two-fold. Lower catches in the time series reduces the catch/biomass median values for little (from 3.516 to 2.384 kt/kg) and winter skates (from 4.029 to 2.256 kt/kg). The lower catch/biomass median values reduce the ABC estimate to 50,435 mt, which in turn also reduces the other ACL specifications accordingly (see analysis F in the table below). On the other side of the allocation calculations, the lower discard mortality also reduces the assumed dead discard mortality rate, because there are fewer dead discards as a proportion of total 2008-2010 skate catch. And as a result of revising the catch/biomass time series with the proposed little and winter skate discard mortality estimates and applying the revised discard rate, the recommended 2012-2013 TAL would be 24,088 mt. For the skate wing fishery, this final recommendation would mean that the allowable landings would be 10% higher than the peak 2007 landings, instead of a decrease of 27.5% in the current specifications.

ABC specifications - 40 - May 2011 Skate PDT
Table 16. Current and proposed 2012-2013 skate complex ACL specification estimates and input data. Incremental changes to input data are shown in analyses B-E. Analysis F represents the proposed final 2012-2013 specifications.
(A) (B) (C) (D) (E) (F)
Current specifications Bigelow strata
Revised state landings assumption (12.6%)
Additional skate transfers at sea
Updated discard estimates
Proposed discard mortality rate
2006-2008 survey, 2007-2009 discards
2008-2010 survey, 2007-2009 discards
2008-2010 survey, 2007-2009 discards
2008-2010 survey, 2007-2009 discards
2008-2010 survey, 2008-2010 discards
2008-2010 survey, 2008-2010 discards
ACL specificationsABC (mt) 41,080 69,215 69,215 70,905 76,491 50,435 ACT (mt) 30,810 51,911 51,911 53,179 57,368 37,826 TAL (mt) 14,780 24,903 24,903 30,390 29,900 24,088 Assumed state landings 924 924 3,151 3,829 3,767 3,035 Federal TAL 13,856 23,979 21,752 26,561 26,133 21,053 Wing TAL 9,214 15,946 14,465 17,663 17,378 14,000 Percent change 2007 -27.5% 25.5% 13.8% 39.0% 36.8% 10.2%Bait TAL 4,642 8,033 7,287 8,898 8,754 7,053 Season 1 1,430 2,474 2,244 2,741 2,696 2,172 Season 2 1,722 2,980 2,703 3,301 3,248 2,617 Season 3 1,490 2,579 2,339 2,856 2,810 2,264 C/B mediansBarndoor 3.230 3.222 3.222 3.242 2.938 2.938Clearnose 2.440 2.695 2.695 2.699 5.910 5.910Little 2.390 2.898 2.898 3.087 3.516 2.384Rosette 2.190 2.090 2.090 2.103 3.622 3.622Smooth 1.690 1.669 1.669 1.701 2.388 2.388Thorny 3.140 3.117 3.117 3.117 2.300 2.300Winter 4.120 4.067 4.067 4.072 4.029 2.256Survey biomass (mean kg/tow)Barndoor 1.020 1.113 1.113 1.114 1.114 1.114Clearnose 1.037 0.936 0.936 0.933 0.933 0.933Little 5.040 7.801 7.801 7.848 7.848 7.848Rosette 0.053 0.041 0.041 0.040 0.040 0.040Smooth 0.133 0.162 0.162 0.161 0.161 0.161Thorny 0.420 0.244 0.244 0.245 0.245 0.245Winter 5.230 9.682 9.682 9.684 9.684 9.684Discard rate 52.0% 52.0% 52.0% 42.9% 47.9% 36.3%Discard mortality 50.0% 50.0% 50.0% 50.0% 50.0% 31.0%
10.0 9BStochastic estimates of precision Until now, the PDT has provided a deterministic estimate of ABC derived from the catch/biomass median values and stratified mean biomass by species. In this update, the PDT estimated how precise the ABC and ACL specifications are estimated by incorporating estimated variance of these variables. Using this approach, it is possible to put confidence intervals on the ABC estimate or estimate a coefficient of variation (CV). But although precision can be estimated, it is not possible to quantify risk because the skate OFLs are parameterized in terms of a population change (a decline in the three year moving average of survey biomass which exceeds a species-specific, pre-determined threshold) instead of an Fmsy mortality rate translated into a catch threshold (with estimated scientific uncertainty).

ABC specifications - 41 - May 2011 Skate PDT
One component of the skate ABC estimate is the stratified mean survey biomass for each species. The variances on the stratified mean can be calculated using standard NMFS software (SURVAN) and for 2009 and 2010 incorporates the additional uncertainty associated with the FSV Bigelow calibration coefficients. For purposes of estimating ABC uncertainty, the mean biomass values were input into the calculations with μ= and σ2=s2 for 2008, 2009 and 2010, assuming a log-normal distribution of each year’s stratified mean biomass which were then averaged over the three year period. The figures below shows the mean and variances used in this calculation. A bootstrap procedure (Efron and Tibshirani 1994) was applied to estimate the quantiles of the catch/biomass median value, derived from 1000 random draws without replacement from the three year catch/biomass time series for each skate species. Variance of the catch/biomass medians increases as fewer years are chosen in each iteration (probability of successful choice, P, ranging from 0 to 1). This empirical relationship varied among species, so the lowest value (highest variance on the C/B median) was chosen at the point where the mean value of the bootstrap results began to deviate from the time series median value due to non-normal characteristics as fewer years were drawn in each set of iterations (XFigure 14X). A value of 0.1 for P was chosen for smooth and thorny skate, 0.3 for winter skates, 0.5 for little and rosette, and 0.8 for clearnose skates. Statistics on the bootstrap distribution for the catch/biomass medians is given in the XFigure 15X. The mean catch/biomass median values were around 2-3 for all species except for rosette and clearnose skates, all catch/biomass values being fairly robust. Variation for clearnose and rosette are higher than for the other species. The higher variation for clearnose and rosette arises because of interannual variation in availability to the survey and due to errors in assigning catches to species using DPWS methods using survey data. These methods assume that availability to the survey and the commercial fishery follow the same trends, when if fact there is variation in this relationship, particularly for rosette and clearnose skates whose distribution is known to occur outside the survey strata boundaries. The estimated distribution of ABC accounting for scientific uncertainty in catch and survey biomass is graphed in XFigure 16X. Uncertainty in the catch/biomass median and in the stratified mean biomass by species and year, including uncertainty in the calibration coefficient for 2009 and 2010 is estimated with 1000 iterations. The mean result is 49,405 mt with a standard deviation equal to 7,183 mt. The 80% confidence interval is 42,640 to 54,181 mt. The estimated distribution of ABC accounting for scientific uncertainty in catch and survey biomass is graphed in XFigure 17X. Uncertainty in the catch/biomass median and survey biomass were estimated as above, but additional uncertainty in the discard mortality rate is estimated by allowing the mean annual mortality rate for little and winter skates to vary according to σ2=s2 for a 10 year moving average (to reduce the effect of trend in discard mortality on the variance)F
2F.
The mean result is 23,619 mt with a standard deviation equal to 3,446 mt. The 80% confidence interval is 20,823 to 25,996 mt
2 Of course there is a more elegant method of dredge efficiency-trending the variance with time series analysis, but this effort suffered from the law of diminishing returns.

ABC specifications - 42 - May 2011 Skate PDT
Figure 13. Cumulative distribution of 2008-2010 average skate biomass derived from variance on the calibrated
(2008 uncalibrated) stratified mean biomass, input into stochastic estimate of ABC values.
2008-2010 average biomass
0%
10%
20%
30%
40%
50%
60%
70%
80%
90%
100%
- 0.5 1.0 1.5 2.0 2.5
Stratified mean biomass (kg/tow)
Cu
mu
lati
ve f
req
uen
cy
Barndoor
Clearnose
2008-2010 average biomass
0%
10%
20%
30%
40%
50%
60%
70%
80%
90%
100%
- 0.05 0.10 0.15 0.20 0.25 0.30 0.35 0.40 0.45 0.50
Stratified mean biomass (kg/tow)
Cu
mu
lati
ve f
req
uen
cy
Rosette
Smooth
Thorny
2008-2010 average biomass
0%
10%
20%
30%
40%
50%
60%
70%
80%
90%
100%
- 2 4 6 8 10 12 14 16
Stratified mean biomass (kg/tow)
Cu
mu
lati
ve f
req
uen
cy
Little
Winter

ABC specifications - 43 - May 2011 Skate PDT
Lacking a robust definition of overfishing (OFL) which is grounded in an estimate of Fmsy, risk can be evaluated in terms of the observed population biomass response to previous levels of catch (defined here as a rate of catch/survey biomass, or kt/kg). In principle, this approach is theoretically consistent with the basis for skate overfishing definitions, a rate of decline that is beyond normal survey variation. The graphs in XFigure 18X show the empirical (1963-2007) responses in biomass at various levels of exploitation equivalent below confidence intervals around the catch biomass median. For barndoor skate, biomass increased much more frequently than not at any catch level around the catch/biomass median. Even with at catches below the 5% CI, biomass increased 14 of 18 years and the catch biomass median appears to be conservative at any confidence level accounting for scientific uncertainty. The same evaluation of risk holds true for little, rosette, thorny, and winter, although each have slightly different estimated risk levels. None of the catches below the various confidence levels for the above skates caused biomass to decline more often than not. On the other hand, the catch/biomass median estimates at most confidence levels for clearnose skate were risk neutral. And for smooth skate, the catches below the 30 percent confidence level were conservative, but above the 30 percent confidence level were slightly risky. Other sources of variation and scientific uncertainty arise from other assumptions and estimates that are only partially taken into account in this analysis. These input parameters include discard estimates, discard mortality, and species composition of the commercial catch (derived using the selectivity ogive method approved by the DPWS). To some extent, these sources of uncertainty are implicitly included in the catch/biomass bootstrap procedure, but could in some cases be more directly estimated and included in the ABC calculation procedure. Finally, risk can only be assessed with respect to a reliable and robust MSY reference point estimate or more appropriately in terms of observed population response to previous catches under ACL management. The recent increase in skate biomass began long before the implementation of ACLs despite historically high skate catches, possibly as a result of transient phenomena, environmental forcing, or changes in abundances of prey and predators. One such relationship that has been postulated is the response to little skate to changes in Southern New England winter flounder abundance (or vice versa) since their diets overlap and they inhabit similar areas. This possibility will be examined in the 2011 Skate SAFE Report, although formal linkages would require targeted research. The PDT has also observed that little skate distribution has gradually expanded northward along the Gulf of Maine coastline, possibly contributing to the record high little skate biomass. Structural changes such as these cannot be adequately captured by the relatively simplistic (and reactionary) approach taken to set skate complex ABCs.

ABC specifications - 44 - May 2011 Skate PDT
Figure 14. Mean and one standard deviation for bootstrap analysis of catch/biomass medians at various probabilities of being chosen (range 0.1 to 0.9). In each iteration, annual catch/biomass values are drawn without replacement.
Winter
Barndoor skate
0
2
4
6
8
10
12
14
16
18
0 0.1 0.2 0.3 0.4 0.5 0.6 0.7 0.8 0.9 1
P(success) simulation
Cat
ch/b
iom
ass
med
ian
Clearnose skate
0
1
2
3
4
5
6
7
0 0.1 0.2 0.3 0.4 0.5 0.6 0.7 0.8 0.9 1
P(success) simulation
Cat
ch/b
iom
ass
med
ian
Little skate
0
0.5
1
1.5
2
2.5
3
3.5
4
4.5
5
0 0.1 0.2 0.3 0.4 0.5 0.6 0.7 0.8 0.9 1
P(success) simulation
Cat
ch/b
iom
ass
med
ian
Rosette skate
0
0.5
1
1.5
2
2.5
3
3.5
4
4.5
5
0 0.1 0.2 0.3 0.4 0.5 0.6 0.7 0.8 0.9 1
P(success) simulation
Cat
ch/b
iom
ass
med
ian
Smooth skate
0
0.5
1
1.5
2
2.5
0 0.1 0.2 0.3 0.4 0.5 0.6 0.7 0.8 0.9 1
P(success) simulation
Cat
ch/b
iom
ass
med
ian
Thorny skate
0
0.5
1
1.5
2
2.5
3
3.5
4
0 0.1 0.2 0.3 0.4 0.5 0.6 0.7 0.8 0.9 1
P(success) simulation
Cat
ch/b
iom
ass
med
ian
Winter skate
0
1
2
3
4
5
6
0 0.1 0.2 0.3 0.4 0.5 0.6 0.7 0.8 0.9 1
P(success) simulation
Cat
ch/b
iom
ass
med
ian

ABC specifications - 45 - May 2011 Skate PDT
Figure 15. Mean and one standard deviation on bootstrap estimates of catch/biomass medians.
0
1
2
3
4
5
6
7
8
Barndoor Clearnose Little Rosette Smooth Thorny Winter
Cat
ch/b
iom
ass
med
ian
(kt
/kg
)
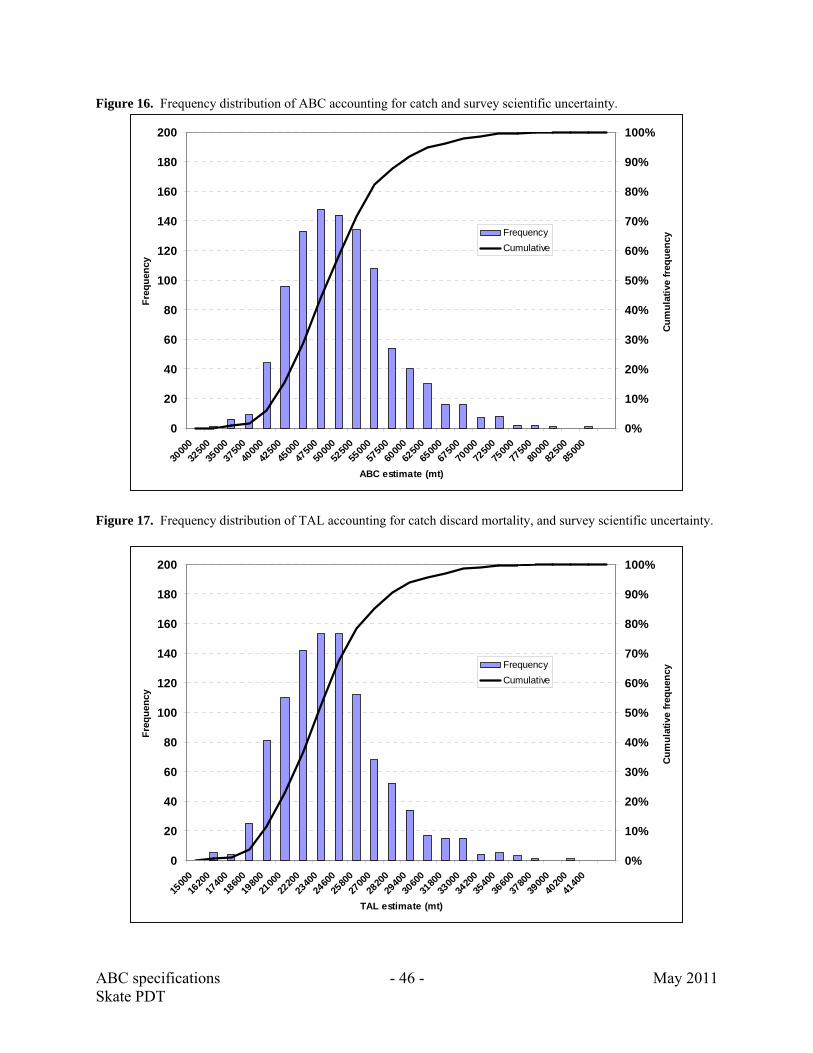
ABC specifications - 46 - May 2011 Skate PDT
Figure 16. Frequency distribution of ABC accounting for catch and survey scientific uncertainty.
0
20
40
60
80
100
120
140
160
180
200
3000
0
3250
0
3500
0
3750
0
4000
0
4250
0
4500
0
4750
0
5000
0
5250
0
5500
0
5750
0
6000
0
6250
0
6500
0
6750
0
7000
0
7250
0
7500
0
7750
0
8000
0
8250
0
8500
0
ABC estimate (mt)
Fre
qu
ency
0%
10%
20%
30%
40%
50%
60%
70%
80%
90%
100%
Cu
mu
lati
ve f
req
uen
cy
Frequency
Cumulative
Figure 17. Frequency distribution of TAL accounting for catch discard mortality, and survey scientific uncertainty.
0
20
40
60
80
100
120
140
160
180
200
1500
0
1620
0
1740
0
1860
0
1980
0
2100
0
2220
0
2340
0
2460
0
2580
0
2700
0
2820
0
2940
0
3060
0
3180
0
3300
0
3420
0
3540
0
3660
0
3780
0
3900
0
4020
0
4140
0
TAL estimate (mt)
Fre
qu
ency
0%
10%
20%
30%
40%
50%
60%
70%
80%
90%
100%
Cu
mu
lati
ve f
req
uen
cyFrequency
Cumulative
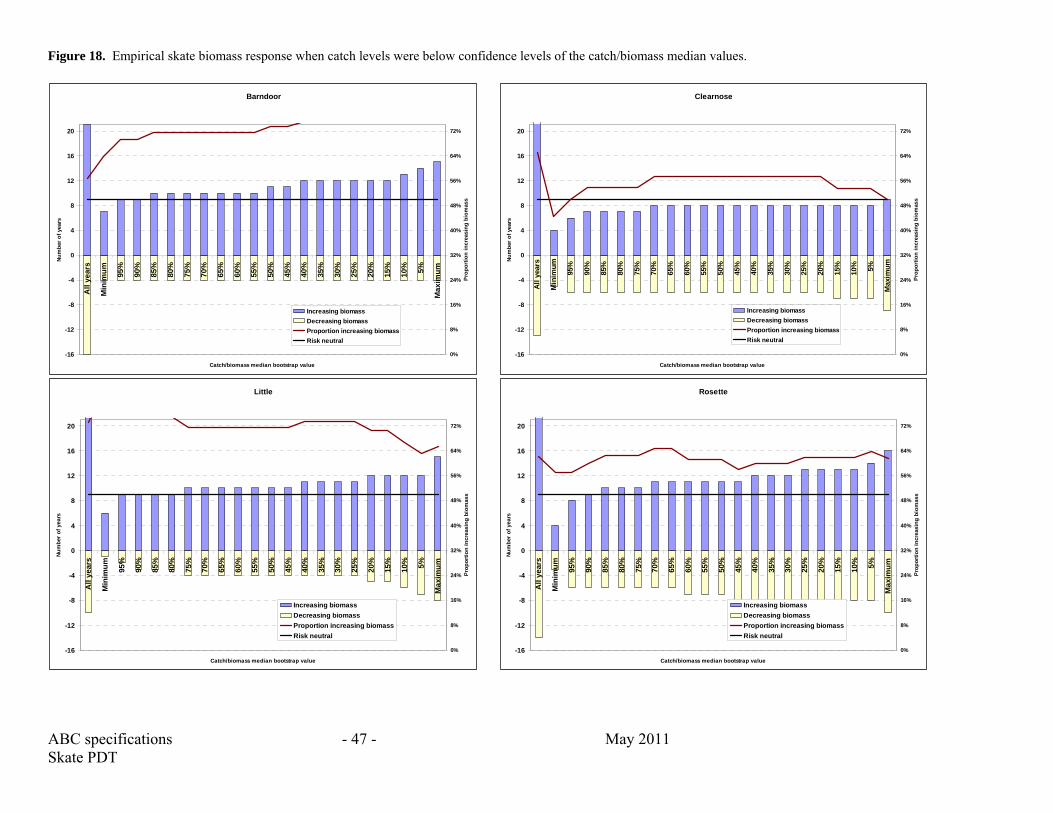
ABC specifications - 47 - May 2011 Skate PDT
Figure 18. Empirical skate biomass response when catch levels were below confidence levels of the catch/biomass median values.
Barndoor
-16
-12
-8
-4
0
4
8
12
16
20
All
ye
ars
Min
imu
m
95%
90%
85%
80%
75%
70%
65%
60%
55%
50%
45%
40%
35%
30%
25%
20%
15%
10%
5%
Ma
xim
um
Catch/biomass median bootstrap value
Nu
mb
er o
f ye
ars
0%
8%
16%
24%
32%
40%
48%
56%
64%
72%
Pro
po
rtio
n i
ncr
easi
ng
bio
mas
s
Increasing biomass
Decreasing biomass
Proportion increasing biomass
Risk neutral
Clearnose
-16
-12
-8
-4
0
4
8
12
16
20
All
yea
rs
Min
imu
m
95%
90%
85%
80%
75%
70%
65%
60%
55%
50%
45%
40%
35%
30%
25%
20%
15%
10% 5%
Max
imu
m
Catch/biomass median bootstrap value
Nu
mb
er o
f ye
ars
0%
8%
16%
24%
32%
40%
48%
56%
64%
72%
Pro
po
rtio
n i
ncr
easi
ng
bio
mas
s
Increasing biomass
Decreasing biomass
Proportion increasing biomass
Risk neutral
Little
-16
-12
-8
-4
0
4
8
12
16
20
All
ye
ars
Min
imu
m
95%
90%
85%
80%
75%
70%
65%
60%
55%
50%
45%
40%
35%
30%
25%
20%
15%
10%
5%
Ma
xim
um
Catch/biomass median bootstrap value
Nu
mb
er o
f ye
ars
0%
8%
16%
24%
32%
40%
48%
56%
64%
72%
Pro
po
rtio
n i
ncr
easi
ng
bio
mas
s
Increasing biomass
Decreasing biomass
Proportion increasing biomass
Risk neutral
Rosette
-16
-12
-8
-4
0
4
8
12
16
20
All
ye
ars
Min
imu
m
95%
90%
85%
80%
75%
70%
65%
60%
55%
50%
45%
40%
35%
30%
25%
20%
15%
10%
5%
Ma
xim
um
Catch/biomass median bootstrap value
Nu
mb
er o
f ye
ars
0%
8%
16%
24%
32%
40%
48%
56%
64%
72%
Pro
po
rtio
n i
ncr
easi
ng
bio
mas
s
Increasing biomass
Decreasing biomass
Proportion increasing biomass
Risk neutral

ABC specifications - 48 - May 2011 Skate PDT
Smooth
-16
-12
-8
-4
0
4
8
12
16
20A
ll y
ear
s
Min
imu
m
95%
90%
85%
80%
75%
70%
65%
60%
55%
50%
45%
40%
35%
30%
25%
20%
15%
10%
5%
Ma
xim
um
Catch/biomass median bootstrap value
Nu
mb
er o
f ye
ars
0%
8%
16%
24%
32%
40%
48%
56%
64%
72%
Pro
po
rtio
n i
ncr
easi
ng
bio
mas
s
Increasing biomass
Decreasing biomass
Proportion increasing biomass
Risk neutral
Thorny
-16
-12
-8
-4
0
4
8
12
16
20
All
ye
ars
Min
imu
m
95%
90%
85%
80%
75%
70%
65%
60%
55%
50%
45%
40%
35%
30%
25%
20%
15%
10%
5%
Ma
xim
um
Catch/biomass median bootstrap value
Nu
mb
er o
f ye
ars
0%
8%
16%
24%
32%
40%
48%
56%
64%
72%
Pro
po
rtio
n i
ncr
easi
ng
bio
mas
s
Increasing biomass
Decreasing biomass
Proportion increasing biomass
Risk neutral
Winter
-16
-12
-8
-4
0
4
8
12
16
20
All
ye
ars
Min
imu
m
95%
90%
85%
80%
75%
70%
65%
60%
55%
50%
45%
40%
35%
30%
25%
20%
15%
10%
5%
Ma
xim
um
Catch/biomass median bootstrap value
Nu
mb
er
of
ye
ars
0%
8%
16%
24%
32%
40%
48%
56%
64%
72%
Pro
po
rtio
n i
nc
rea
sin
g b
iom
as
s
Increasing biomass
Decreasing biomass
Proportion increasing biomass
Risk neutral

ABC specifications - 49 - May 2011 Skate PDT
11.0 10BLiterature cited Benoit, HP (2006). Estimated discards of winter skate (Leucoraja ocellata) in the southern Gulf
of St. Lawrence, 1971-2004. Canadian Science Advisory Secretariat Research Document 2006/002. 43 p.
Benoit, HP (2010). Estimated bycatch mortality of winter skate (Leucoraja ocellata) in the
southern Gulf of St. Lawrence scallop fishery (2006 to 2008). Canadian Science Advisory Secretariat Science Response 2010/009. 5 p.
Efron, B., & Tibshirani, R. J. (1994). An Introduction to the Bootstrap. Boca Raton, FL: CRC
Press. Enever, R, TL Catchpole, JR Ellis, and A Grant (2009). The survival of skates (Rajidae) caught
by demersal trawlers fishing in UK waters. Fisheries Research 97: 72-76. Laptikhovsky, VV (2004). Survival rates for rays discarded by the bottom trawl squid fishery
off the Falkland Islands. Fishery Bulletin 102: 757-759. Northeast Fisheries Science Center (NEFSC) (2009). The Northeast Data Poor Stocks Working
Group Report, December 8-12, 2008 Meeting: Part A. Skate species complex, deep sea red crab, Atlantic wolfish, scup, and black sea bass. NEFSC Reference Document 09-02.
Stobutzki, IC, MJ Miller, DS Heales, and DT Brewer (2002). Sustainability of elasmobranchs
caught as bycatch in a tropical prawn (shrimp) trawl fishery. Fishery Bulletin 100: 800-821.