2012 03 15 designs - cs.unc.educs.unc.edu/courses/comp715-s10/slides/2012_03_15_designs.pdf · –...
TRANSCRIPT

3/15/2012
1
Comp/Phys/Mtsc 715
Visualization System Design Examples
In-Class Design
13/15/2012 Designs Comp/Phys/Mtsc 715 Taylor
Example Videos
• cad-glyph.avi: Meyer Vis 2008
– Glyphs for multivariate surface visualization
• vis-1006_mpeg4.avi: Termeer Vis 2008
– Blood supply to heart surface multivariate
• Airfoil.avi: Von Funk Vis 2008
– Fading stream surface and ribbon flow display
23/15/2012 Designs Comp/Phys/Mtsc 715 Taylor
Administrative
• Be talking with your client
– Questions/Goals
– Getting final data set
3/15/2012 Designs 3Comp/Phys/Mtsc 715 Taylor
3/15/2012
2
Example Final Projects++
• ImageSurfer - confocal microscopy data
• GyVe - supercluster of galaxies
• CDView - 3D molecule charge densities
• InnerSpace - virtual arthroscopy
3/15/2012 Designs 4Comp/Phys/Mtsc 715 Taylor
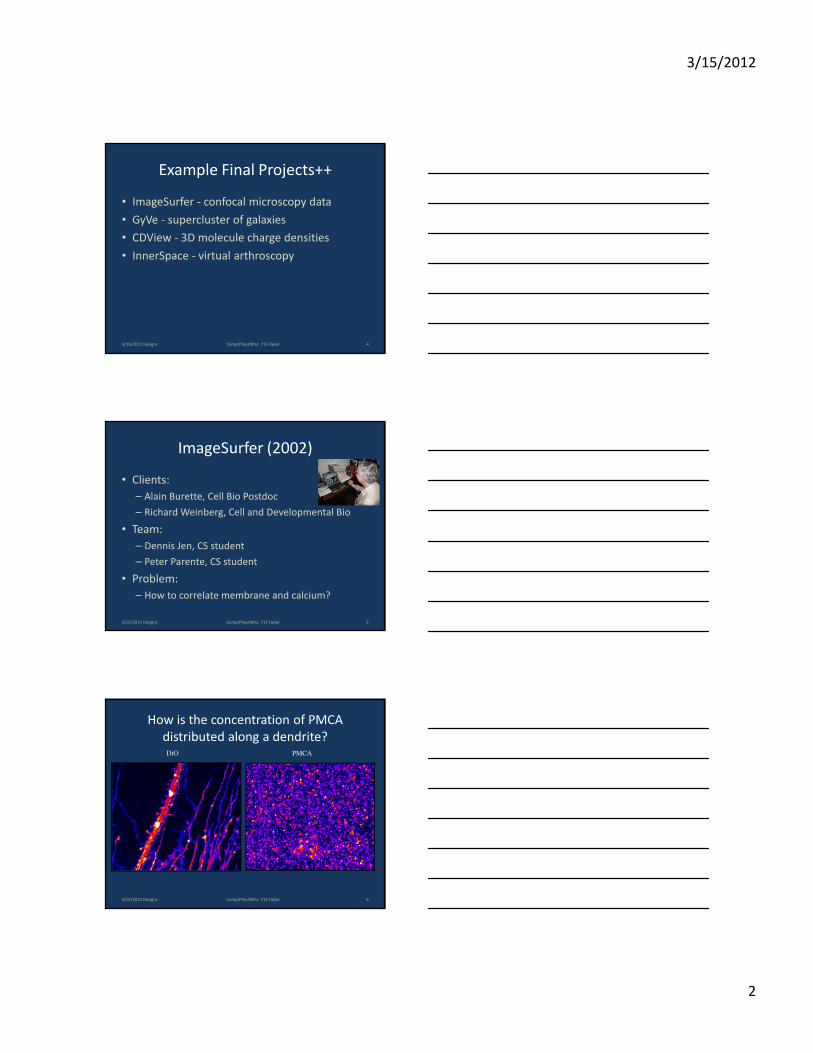
ImageSurfer (2002)
• Clients:
– Alain Burette, Cell Bio Postdoc
– Richard Weinberg, Cell and Developmental Bio
• Team:
– Dennis Jen, CS student
– Peter Parente, CS student
• Problem:
– How to correlate membrane and calcium?
3/15/2012 Designs 5Comp/Phys/Mtsc 715 Taylor
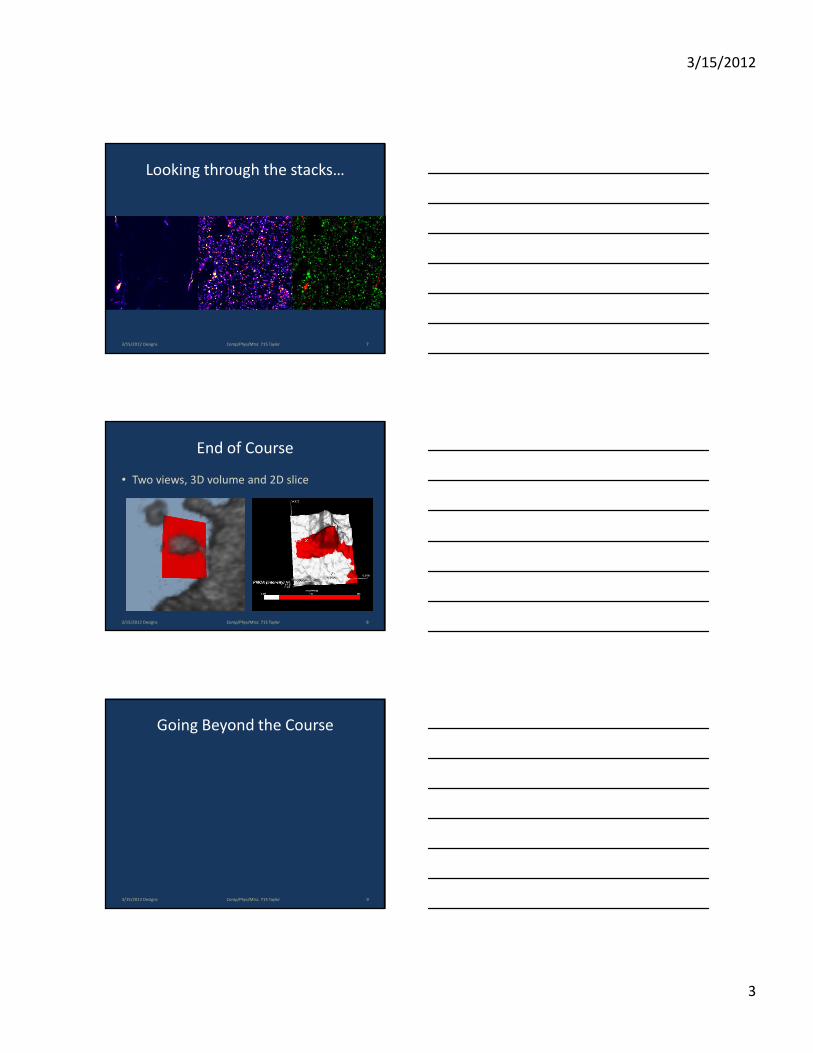
How is the concentration of PMCA
distributed along a dendrite?DiO PMCA
3/15/2012 Designs 6Comp/Phys/Mtsc 715 Taylor
3/15/2012
3
Looking through the stacks…
3/15/2012 Designs 7Comp/Phys/Mtsc 715 Taylor
End of Course
• Two views, 3D volume and 2D slice
3/15/2012 Designs 8Comp/Phys/Mtsc 715 Taylor
Going Beyond the Course
3/15/2012 Designs 9Comp/Phys/Mtsc 715 Taylor

3/15/2012
4
Failed Attempts
3/15/2012 Designs 10Comp/Phys/Mtsc 715 Taylor
CISMM-sponsored additions
3/15/2012 Designs 11Comp/Phys/Mtsc 715 Taylor
… easing the pain
3/15/2012 Designs 12Comp/Phys/Mtsc 715 Taylor
3/15/2012
5
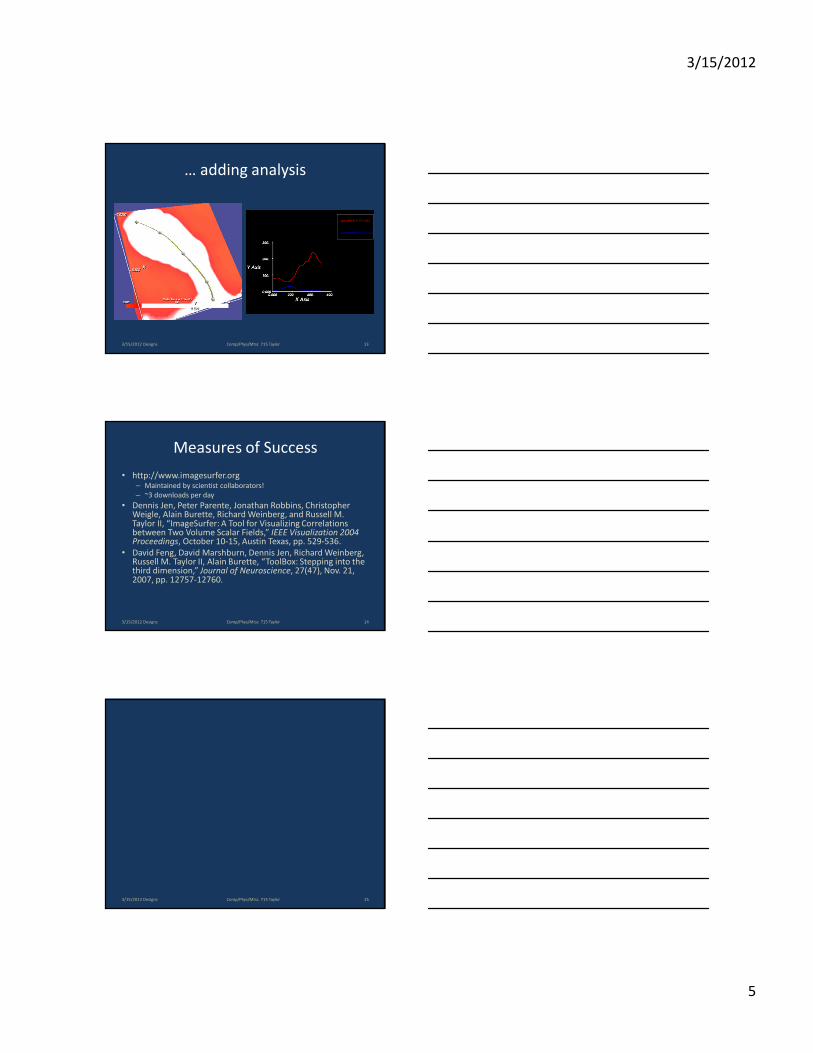
… adding analysis
3/15/2012 Designs 13Comp/Phys/Mtsc 715 Taylor
Measures of Success
• http://www.imagesurfer.org– Maintained by scientist collaborators!
– ~3 downloads per day
• Dennis Jen, Peter Parente, Jonathan Robbins, Christopher Weigle, Alain Burette, Richard Weinberg, and Russell M. Taylor II, “ImageSurfer: A Tool for Visualizing Correlations between Two Volume Scalar Fields,” IEEE Visualization 2004 Proceedings, October 10-15, Austin Texas, pp. 529-536.
• David Feng, David Marshburn, Dennis Jen, Richard Weinberg, Russell M. Taylor II, Alain Burette, “ToolBox: Stepping into the third dimension,” Journal of Neuroscience, 27(47), Nov. 21, 2007, pp. 12757-12760.
3/15/2012 Designs 14Comp/Phys/Mtsc 715 Taylor
3/15/2012 Designs 15Comp/Phys/Mtsc 715 Taylor
3/15/2012
6
Galaxy Viewer (2005)
• Clients
– Matthew Fleenor, Astronomy graduate student
– James Rose, Astronomer
• Team
– Jameson Miller, CS student
– Cory Quammen, CS student
• Problem:
– Seeing structure in Horologium Reticulum data
3/15/2012 Designs 16Comp/Phys/Mtsc 715 Taylor
Gyve AdvertisementLink
3/15/2012 Designs 17Comp/Phys/Mtsc 715 Taylor
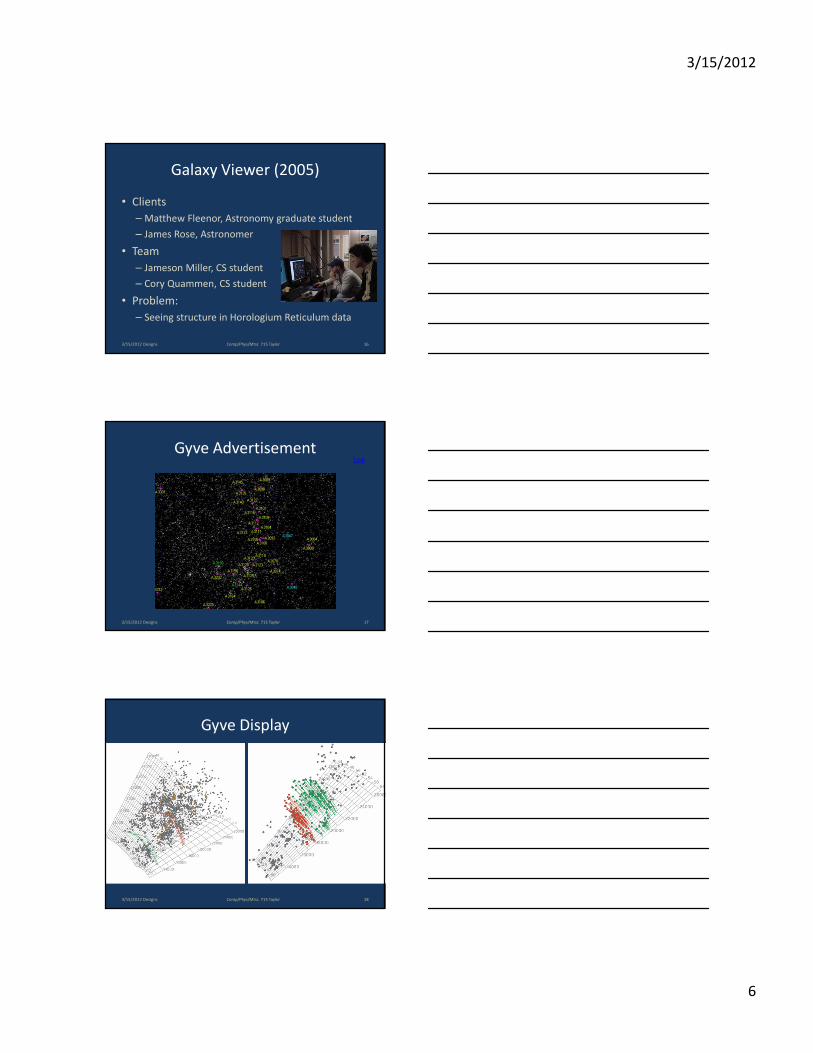
Gyve Display
3/15/2012 Designs 18Comp/Phys/Mtsc 715 Taylor

3/15/2012
7
Gyve Results
• Revealed Spherical Voids
3/15/2012 Designs Comp/Phys/Mtsc 715 Taylor
3/15/2012 Designs Comp/Phys/Mtsc 715 Taylor
Gyve Results
• Disproved incorrect filament structures
20
Gyve: What Helped?
• Stereo
• Torsional Rocking
• Curved drop shadows
– Tied to previous technique’s views
– Showed appropriate space warping
3/15/2012 Designs 21Comp/Phys/Mtsc 715 Taylor

3/15/2012
8
Measures of Success
• Scientists trooped over to CS repeatedly to use the stereo display!
• Linux version to run on scientists’ computers
• http://sourceforge.net/projects/gyve
• Jameson Miller, Cory W. Quammen, and Matthew C. Fleenor, Interactive Visualization of Intercluster Galaxy Structures in the Horologium-Reticulum Supercluster, IEEE Transactions on Visualization and Computer Graphics (Proceedings Visualization / Information Visualization 2006), vol. 12, no. 5, pp. 1149–1155, Sept.–Oct. 2006.
3/15/2012 Designs 22Comp/Phys/Mtsc 715 Taylor
3/15/2012 Designs 23Comp/Phys/Mtsc 715 Taylor
CDView: Problem Description
• Client– Luci Teague from UNC Chemistry
• Team– Chad Hantak (CS), David Borland (CS)
• Problem domain– 3D molecular charge densities, generated by
simulating molecular interactions of a 1-3 Cyclohexadine molecule bonding to a tetrahedral Silicon surface scanned by a Tungsten STM tip.
• Data Collection– Data is collected through CASTEP (CAmbridge
Serial Total Energy Package) charge density simulations in the Cerius2 software package. Output is various ASCII files. http://surface.iphy.ac.cn/schinese/SF4/stm.ht1.gif
3/15/2012 Designs 24Comp/Phys/Mtsc 715 Taylor

3/15/2012
9
CDView: Goals and Data
• Goals– Understand how the charge density varies throughout the
volume, and how it relates to the molecular models. Specifically, the charge density values and the shape of the volume where the tip is interacting with the molecule.
– Correlate the STM image data with the simulated data.
• Data– Regular 3D grid of ratio scalar data from simulation (no
noise, no missing data, no appreciable quantization)
– Irregular 3D grid of atom coordinates and bonds (no noise, no missing data, no appreciable quantization)
3/15/2012 Designs 25Comp/Phys/Mtsc 715 Taylor
CDView: Design
• 3D Scalar Field
– Volume Render vs. Isosurface
• Interested in shape
• Specific charge density values
• (Russ had an idea for displaying several isosurfaces…)
• 3D Model
– For context, simple ball and stick model
• Other Techniques
– Bounding box
– Axis glyph
– Clipping planes
– Slices with colormaps
3/15/2012 Designs 26Comp/Phys/Mtsc 715 Taylor
CDView: Implementation
• VTK + Java
– Java wrappers for VTK
– Wrote most of the code in Java—platform
independent
– Wrote new VTK class for translucent isosurfaces in
C++ (had to reimplement in Java due to wrapping
problems…)
– Used Java Swing for the GUI
3/15/2012 Designs 27Comp/Phys/Mtsc 715 Taylor
3/15/2012
10
CDView: Interface
3/15/2012 Designs 28Comp/Phys/Mtsc 715 Taylor
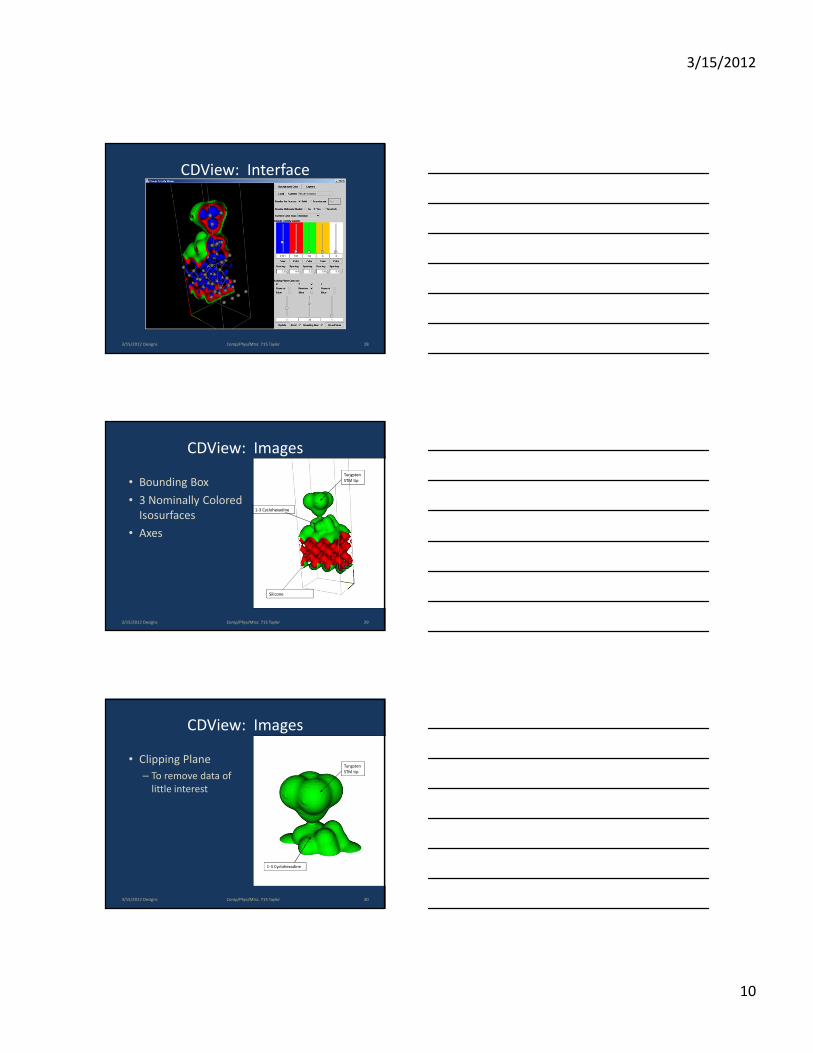
CDView: Images
• Bounding Box
• 3 Nominally Colored
Isosurfaces
• Axes
Silicone
1-3 Cyclohexadine
Tungsten
STM tip
3/15/2012 Designs 29Comp/Phys/Mtsc 715 Taylor
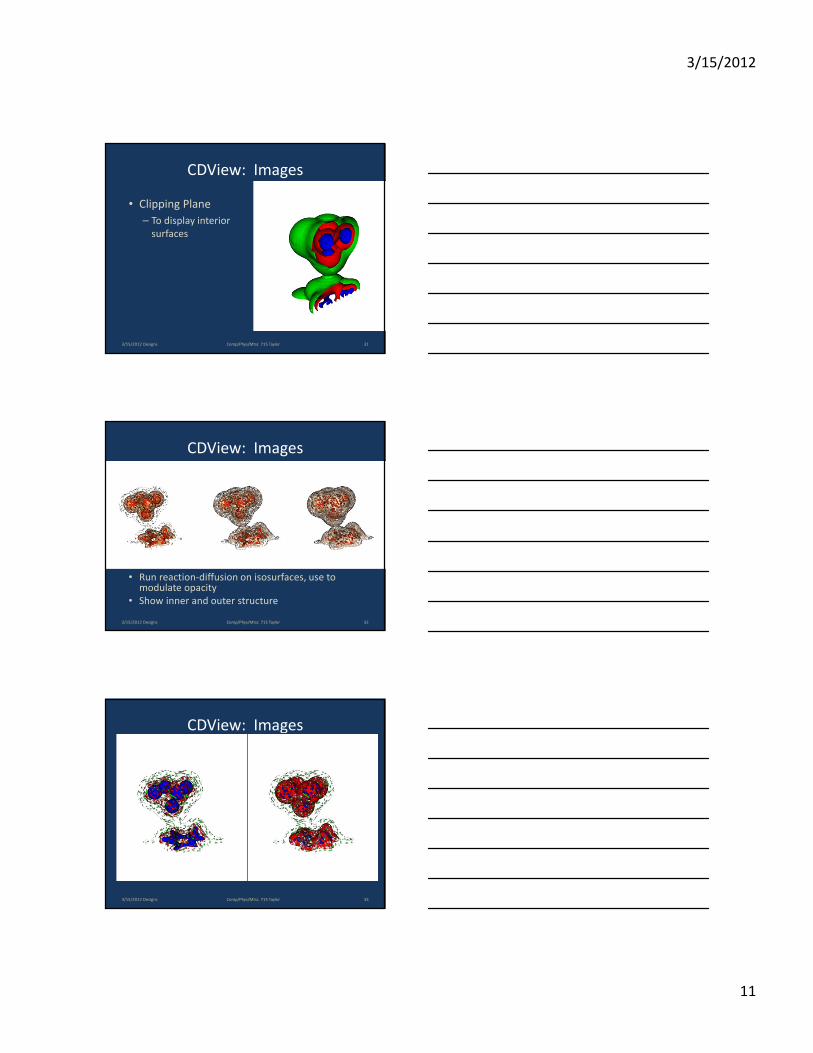
CDView: Images
• Clipping Plane
– To remove data of
little interest
Tungsten
STM tip
1-3 Cyclohexadine
3/15/2012 Designs 30Comp/Phys/Mtsc 715 Taylor
3/15/2012
11
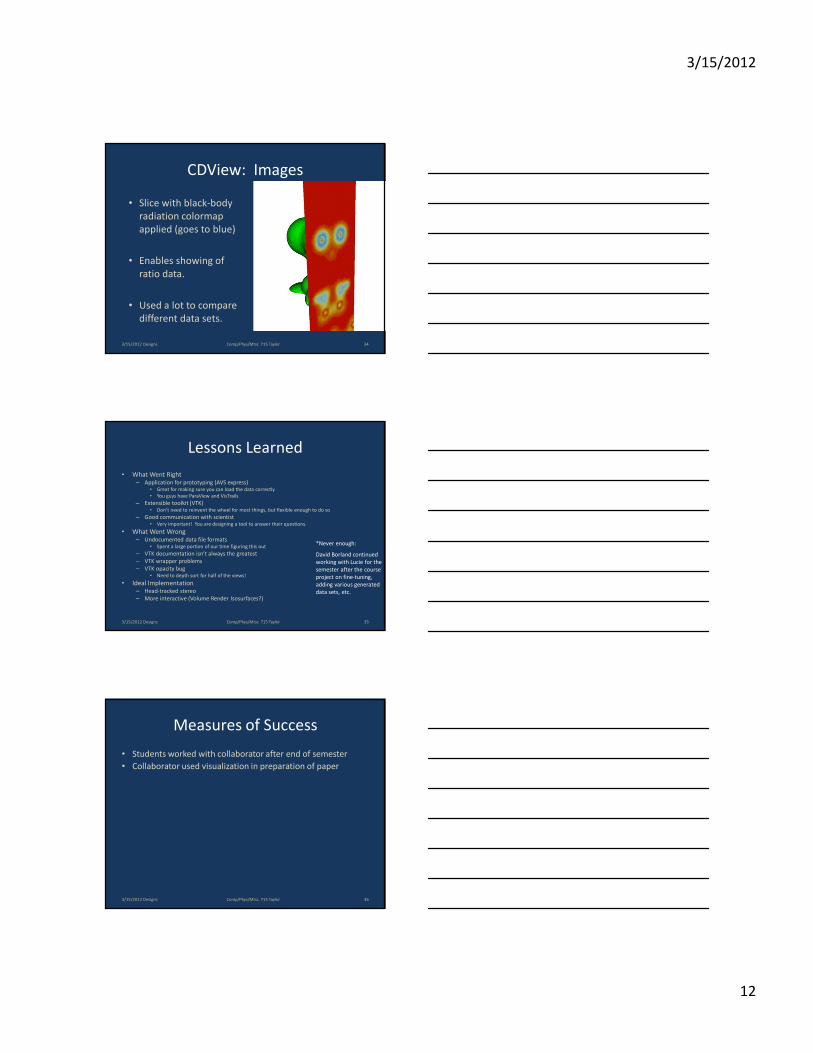
CDView: Images
• Clipping Plane
– To display interior
surfaces
3/15/2012 Designs 31Comp/Phys/Mtsc 715 Taylor
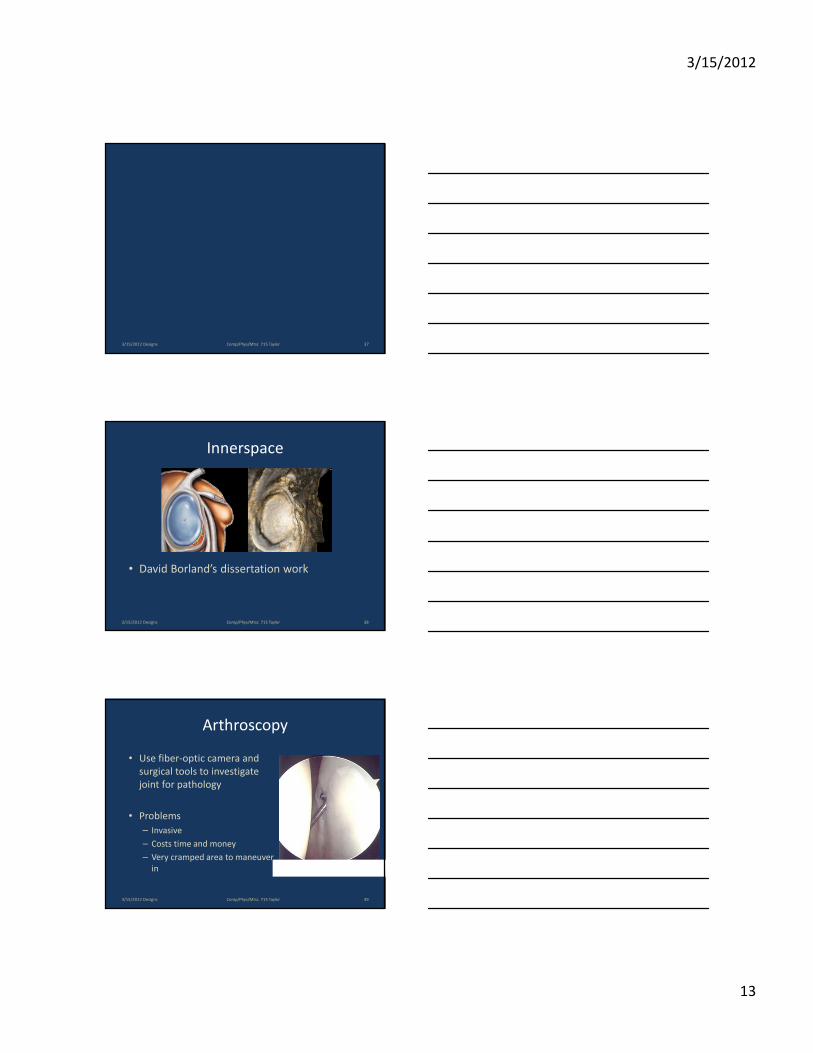
CDView: Images
• Run reaction-diffusion on isosurfaces, use to modulate opacity
• Show inner and outer structure
3/15/2012 Designs 32Comp/Phys/Mtsc 715 Taylor
CDView: Images
3/15/2012 Designs 33Comp/Phys/Mtsc 715 Taylor
3/15/2012
12
CDView: Images
• Slice with black-body
radiation colormap
applied (goes to blue)
• Enables showing of
ratio data.
• Used a lot to compare
different data sets.
3/15/2012 Designs 34Comp/Phys/Mtsc 715 Taylor
Lessons Learned
• What Went Right– Application for prototyping (AVS express)
• Great for making sure you can load the data correctly
• You guys have ParaView and VisTrails
– Extensible toolkit (VTK)• Don’t need to reinvent the wheel for most things, but flexible enough to do so
– Good communication with scientist• Very important! You are designing a tool to answer their questions.
• What Went Wrong– Undocumented data file formats
• Spent a large portion of our time figuring this out
– VTK documentation isn’t always the greatest
– VTK wrapper problems
– VTK opacity bug• Need to depth sort for half of the views!
• Ideal Implementation– Head-tracked stereo
– More interactive (Volume Render Isosurfaces?)
*Never enough:
David Borland continued
working with Lucie for the
semester after the course
project on fine-tuning,
adding various generated
data sets, etc.
3/15/2012 Designs 35Comp/Phys/Mtsc 715 Taylor
Measures of Success
• Students worked with collaborator after end of semester
• Collaborator used visualization in preparation of paper
3/15/2012 Designs 36Comp/Phys/Mtsc 715 Taylor
3/15/2012
13
3/15/2012 Designs 37Comp/Phys/Mtsc 715 Taylor
Innerspace
• David Borland’s dissertation work
3/15/2012 Designs 38Comp/Phys/Mtsc 715 Taylor
Arthroscopy
• Use fiber-optic camera and
surgical tools to investigate
joint for pathology
• Problems
– Invasive
– Costs time and money
– Very cramped area to maneuver
in
3/15/2012 Designs 39Comp/Phys/Mtsc 715 Taylor
3/15/2012
14
MRI Slice Viewing
• Current standard for joint pathology diagnosis
• Features– Less invasive
– Contrast agent routinely injected to aid imaging
• Problems– Requires tedious
selection of slices
– Requires non-intuitive mental reconstruction of 3D features
Shoulder MRI
Contrast agent in the joint-space
Humeral
HeadSocket
Humeral
Head
Humeral
Head
Socket
3/15/2012 Designs 40Comp/Phys/Mtsc 715 Taylor
Virtual Arthroscopy
• Work by John Clarke from UNC Radiology
• Features– Also less invasive
– More intuitive visualization
• Problems– Viewpoints limited to the
joint-space
– Must maneuver the virtual camera across the entire joint surface for evaluation
– “Like looking at the palm of your hand with it touching your nose.”
Humeral
Head
3/15/2012 Designs 41Comp/Phys/Mtsc 715 Taylor
Visualization Course Project
• Sean Hanlon, Karl Strohmaier, Kelly Van Busum
• DVR for context
• Extracted isosurface for detail
– Slow…
• Adjustable clipping planes
– Problem…
3/15/2012 Designs 42Comp/Phys/Mtsc 715 Taylor

3/15/2012
15
If at first you don’t succeed…
• Volume Rendering?
–Still have occlusion
problem
• Transparency?
–Confusion
3/15/2012 Designs 43Comp/Phys/Mtsc 715 Taylor
Volumetric Depth Peeling (VDP)• Extension to standard ray-casting Volume Rendering algorithm
• Enables anatomical views not possible with standard clinical techniques
• Works with complicated structures for which no clipping plane will suffice
• Requires no pre-segmentation
• Works for self-occlusion and tube-like structures
• Takes advantage of routine contrast enhancement
Presented at
Visualizaton and
Data Analysis
2006
3/15/2012 Designs 44Comp/Phys/Mtsc 715 Taylor
Standard Volume Rendering vs. VDP
Constrained to Joint-Space VDP
Ligament and Labrum (Ring of Cartilage) Tear
Humeral
Head
3/15/2012 Designs 45Comp/Phys/Mtsc 715 Taylor
3/15/2012
16
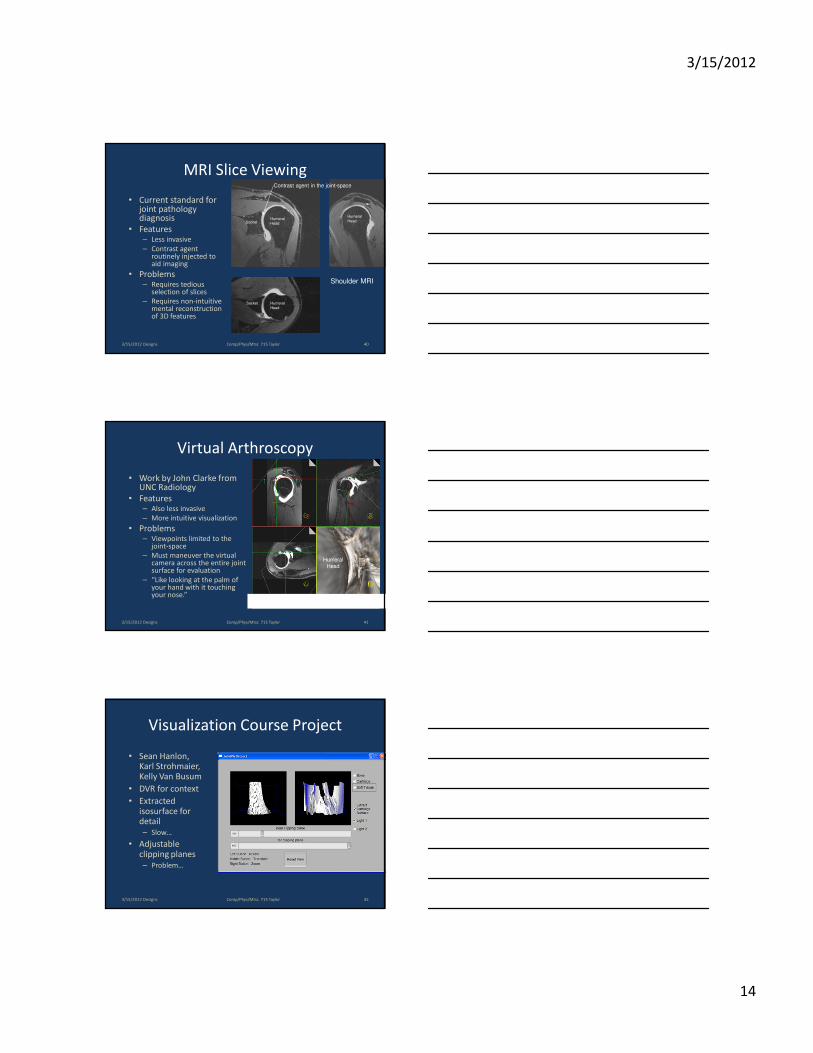
Movie 1
3/15/2012 Designs 46Comp/Phys/Mtsc 715 Taylor
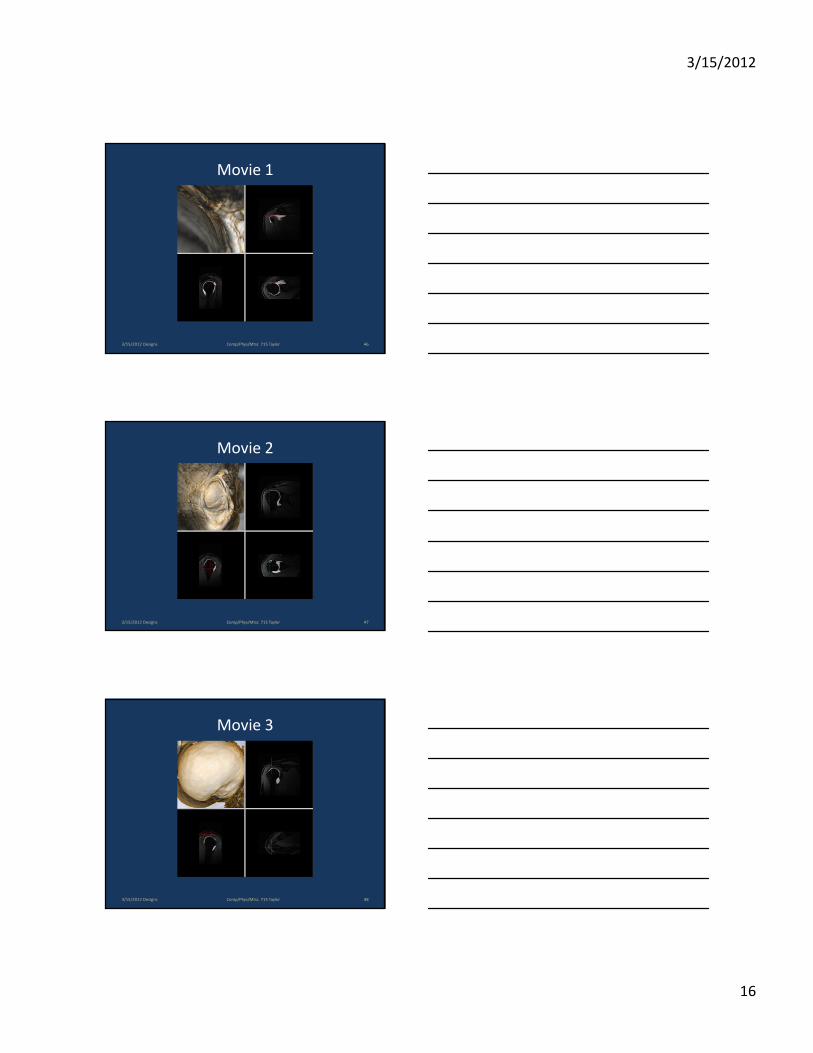
Movie 2
3/15/2012 Designs 47Comp/Phys/Mtsc 715 Taylor
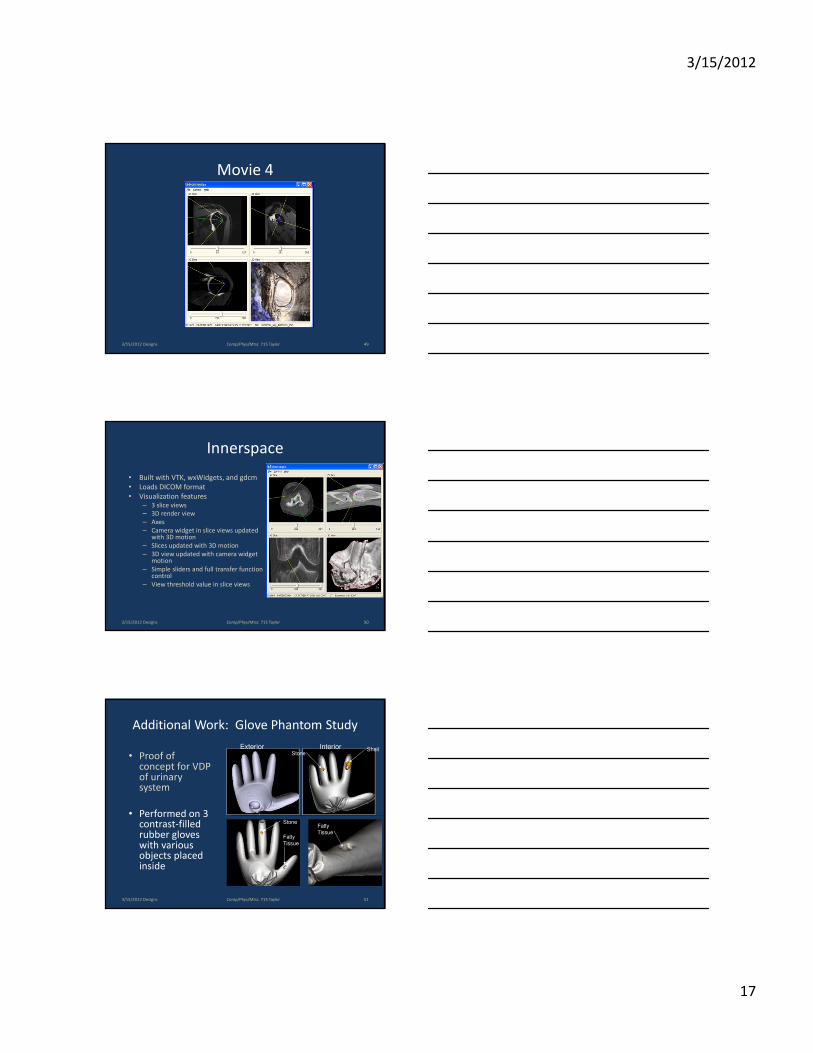
Movie 3
3/15/2012 Designs 48Comp/Phys/Mtsc 715 Taylor
3/15/2012
17
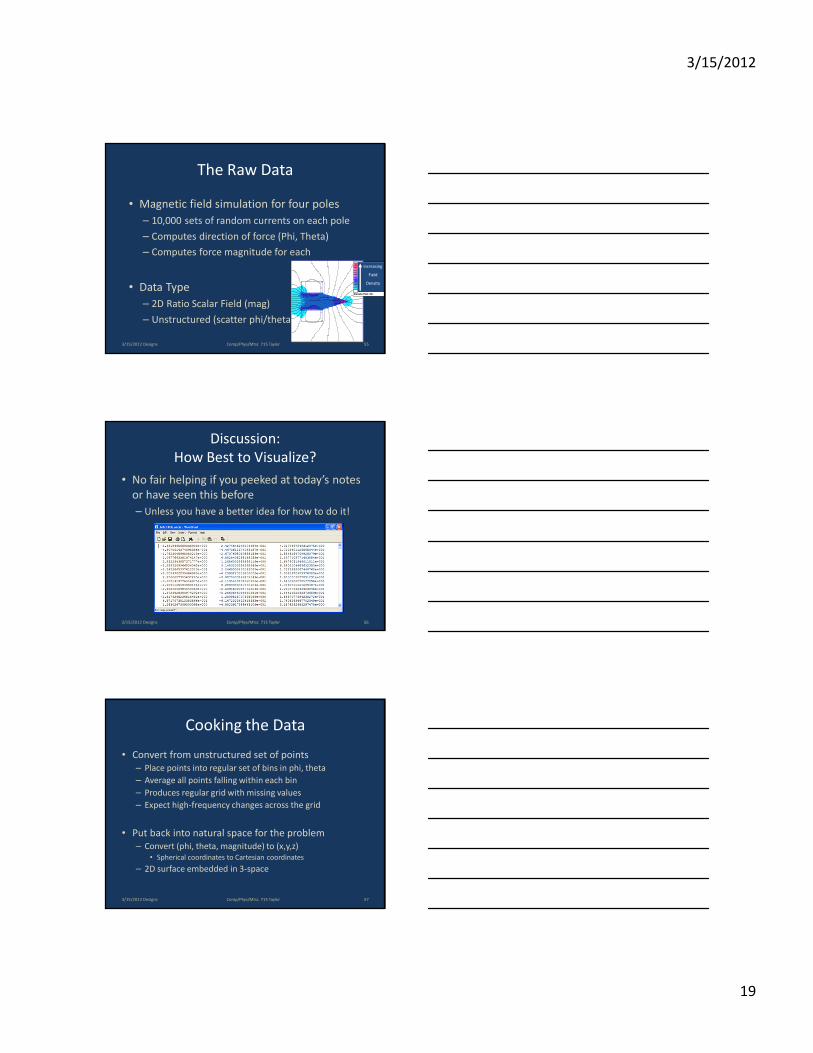
Movie 4
3/15/2012 Designs 49Comp/Phys/Mtsc 715 Taylor
Innerspace
• Built with VTK, wxWidgets, and gdcm
• Loads DICOM format
• Visualization features– 3 slice views
– 3D render view
– Axes
– Camera widget in slice views updated with 3D motion
– Slices updated with 3D motion
– 3D view updated with camera widget motion
– Simple sliders and full transfer function control
– View threshold value in slice views
3/15/2012 Designs 50Comp/Phys/Mtsc 715 Taylor
Additional Work: Glove Phantom Study
ShellStone
Stone
Fatty
Tissue
Fatty
Tissue
Exterior Interior
• Proof of concept for VDP of urinary system
• Performed on 3 contrast-filled rubber gloves with various objects placed inside
3/15/2012 Designs 51Comp/Phys/Mtsc 715 Taylor

3/15/2012
18
Measures of Success
• Collaborator found funding to support student
• Two domain-science publications
• UNC Ph.D. dissertation
• Patent issued
• Summer internship for student at Siemens
• Patent licensed to Siemens and put into Syngo software
3/15/2012 Designs 52Comp/Phys/Mtsc 715 Taylor
3/15/2012 Designs 53Comp/Phys/Mtsc 715 Taylor
Example Visualization Design
Example AVS Implementation
• The Research Questions
– Which directions can four
magnetic poles located at the
corners of a tetrahedron pull a
magnetic bead that is centered
between them?
– How uniform is the pull in
each direction?
3/15/2012 Designs 54Comp/Phys/Mtsc 715 Taylor
3/15/2012
19
The Raw Data
• Magnetic field simulation for four poles
– 10,000 sets of random currents on each pole
– Computes direction of force (Phi, Theta)
– Computes force magnitude for each
• Data Type
– 2D Ratio Scalar Field (mag)
– Unstructured (scatter phi/theta)
Density Plot: |B|,
>4.071e-3.701e-001 : 4.071e-3.331e-001 : 3.701e-2.961e-001 : 3.331e-2.591e-001 : 2.961e-2.221e-001 : 2.591e-1.851e-001 : 2.221e-1.481e-001 : 1.851e-1.111e-001 : 1.481e-7.412e-002 : 1.111e-3.712e-002 : 7.412e-<3.712e-
Increasing
Field
Density
3/15/2012 Designs 55Comp/Phys/Mtsc 715 Taylor
Discussion:
How Best to Visualize?
• No fair helping if you peeked at today’s notes
or have seen this before
– Unless you have a better idea for how to do it!
3/15/2012 Designs 56Comp/Phys/Mtsc 715 Taylor
Cooking the Data
• Convert from unstructured set of points
– Place points into regular set of bins in phi, theta
– Average all points falling within each bin
– Produces regular grid with missing values
– Expect high-frequency changes across the grid
• Put back into natural space for the problem
– Convert (phi, theta, magnitude) to (x,y,z)
• Spherical coordinates to Cartesian coordinates
– 2D surface embedded in 3-space
3/15/2012 Designs 57Comp/Phys/Mtsc 715 Taylor

3/15/2012
20
Visualization Design
• Height field encodes force magnitude for primary goal of estimating coverage of directions
• Color redundantly encodes magnitude to show uniformity of force (banded, isoluminant would have been better than the one I found in AVS Express)
• Missing values leave holes in the displayed surface
• Iso-height sphere model added to improve understanding of fraction of sphere covered
• Enable user to rotate view to explore region shape
3/15/2012 Designs 58Comp/Phys/Mtsc 715 Taylor
Six Poles? Eight Poles?
• Really want max in each bin, not average?
3/15/2012 Designs 59Comp/Phys/Mtsc 715 Taylor
What the real data looks like
3/15/2012 Designs 60Comp/Phys/Mtsc 715 Taylor

3/15/2012
21
Real vs. Simulated• Real is all data, simulated is averaged in
direction
Note the outlying white
sphere
3/15/2012 Designs 61Comp/Phys/Mtsc 715 Taylor