2011 world development indicators - isbn: …€¦ · 2011 world development indicators 189 r ......
TRANSCRIPT

ECONOMY
Introduction
4
2011 World Development Indicators 189
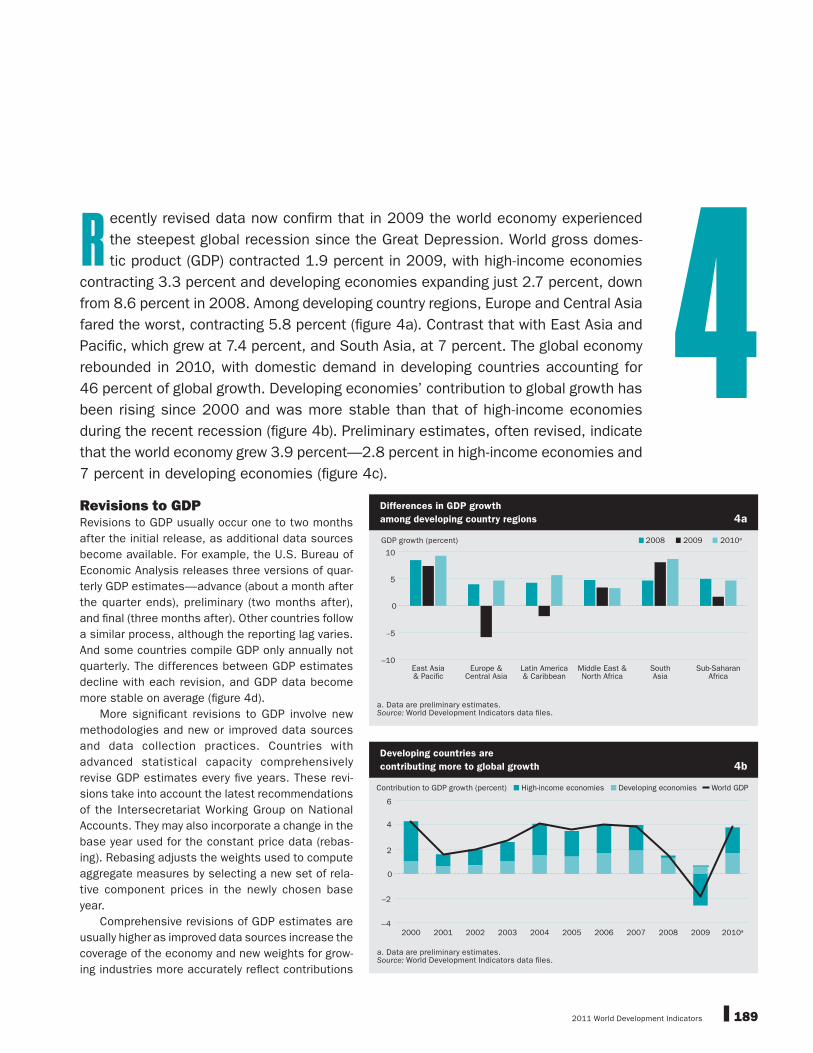
R ecently revised data now confi rm that in 2009 the world economy experienced
the steepest global recession since the Great Depression. World gross domes-
tic product (GDP) contracted 1.9 percent in 2009, with high-income economies
contracting 3.3 percent and developing economies expanding just 2.7 percent, down
from 8.6 percent in 2008. Among developing country regions, Europe and Central Asia
fared the worst, contracting 5.8 percent (fi gure 4a). Contrast that with East Asia and
Pacifi c, which grew at 7.4 percent, and South Asia, at 7 percent. The global economy
rebounded in 2010, with domestic demand in developing countries accounting for
46 percent of global growth. Developing economies’ contribution to global growth has
been rising since 2000 and was more stable than that of high-income economies
during the recent recession (fi gure 4b). Preliminary estimates, often revised, indicate
that the world economy grew 3.9 percent—2.8 percent in high-income economies and
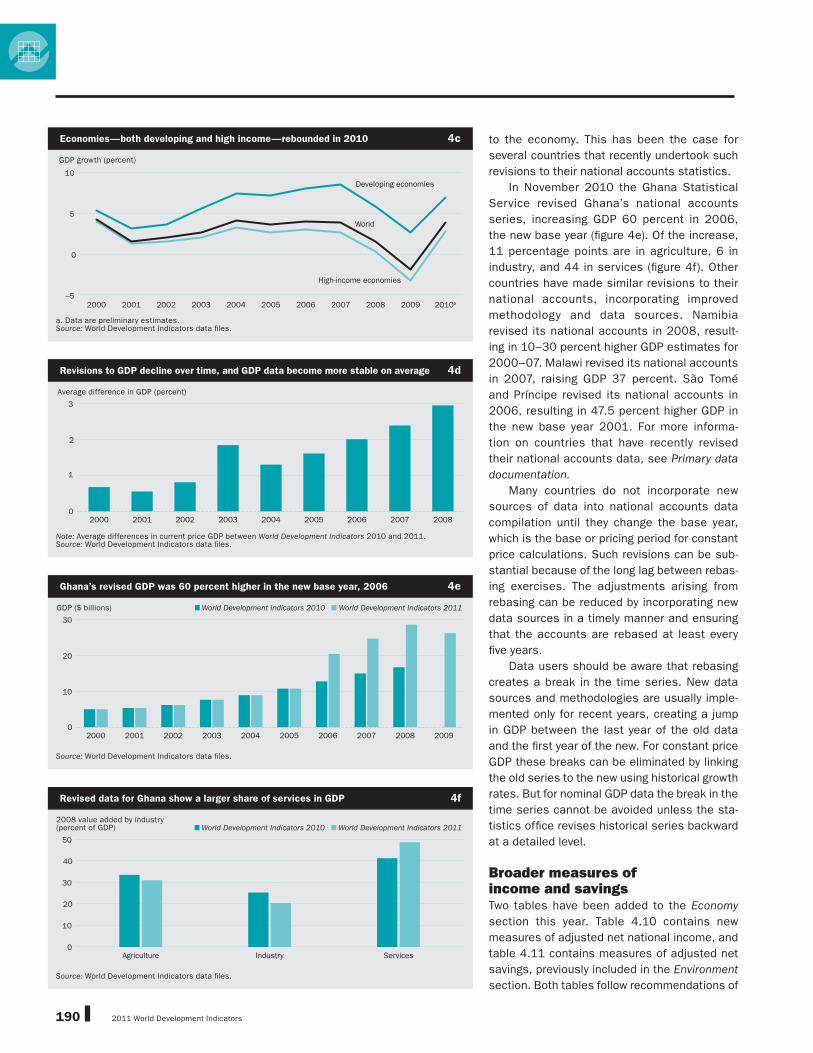
7 percent in developing economies (fi gure 4c).
Revisions to GDPRevisions to GDP usually occur one to two months
after the initial release, as additional data sources
become available. For example, the U.S. Bureau of
Economic Analysis releases three versions of quar-
terly GDP estimates—advance (about a month after
the quarter ends), preliminary (two months after),
and fi nal (three months after). Other countries follow
a similar process, although the reporting lag varies.
And some countries compile GDP only annually not
quarterly. The differences between GDP estimates
decline with each revision, and GDP data become
more stable on average (fi gure 4d).
More signifi cant revisions to GDP involve new
methodologies and new or improved data sources
and data collection practices. Countries with
advanced statistical capacity comprehensively
revise GDP estimates every fi ve years. These revi-
sions take into account the latest recommendations
of the Intersecretariat Working Group on National
Accounts. They may also incorporate a change in the
base year used for the constant price data (rebas-
ing). Rebasing adjusts the weights used to compute
aggregate measures by selecting a new set of rela-
tive component prices in the newly chosen base
year.
Comprehensive revisions of GDP estimates are
usually higher as improved data sources increase the
coverage of the economy and new weights for grow-
ing industries more accurately refl ect contributions
GDP growth (percent)
–10
–5
0
5
10
Sub-SaharanAfrica
SouthAsia
Middle East &North Africa
Latin America& Caribbean
Europe &Central Asia
East Asia& Pacific
2008 2009 2010a
Differences in GDP growth
among developing country regions 4a
a. Data are preliminary estimates.Source: World Development Indicators data fi les.
Contribution to GDP growth (percent)
–4
–2
0
2
4
6
2010a2009200820072006200520042003200220012000
High-income economies Developing economies World GDP
Developing countries are
contributing more to global growth 4b
a. Data are preliminary estimates.Source: World Development Indicators data fi les.
2011 World Development Indicators190
to the economy. This has been the case for
several countries that recently undertook such
revisions to their national accounts statistics.
In November 2010 the Ghana Statistical
Service revised Ghana’s national accounts
series, increasing GDP 60 percent in 2006,
the new base year (fi gure 4e). Of the increase,
11 percentage points are in agriculture, 6 in
industry, and 44 in services (fi gure 4f). Other
countries have made similar revisions to their
national accounts, incorporating improved
methodology and data sources. Namibia
revised its national accounts in 2008, result-
ing in 10–30 percent higher GDP estimates for
2000–07. Malawi revised its national accounts
in 2007, raising GDP 37 percent. São Tomé
and Príncipe revised its national accounts in
2006, resulting in 47.5 percent higher GDP in
the new base year 2001. For more informa-
tion on countries that have recently revised
their national accounts data, see Primary data
documentation.
Many countries do not incorporate new
sources of data into national accounts data
compilation until they change the base year,
which is the base or pricing period for constant
price calculations. Such revisions can be sub-
stantial because of the long lag between rebas-
ing exercises. The adjustments arising from
rebasing can be reduced by incorporating new
data sources in a timely manner and ensuring
that the accounts are rebased at least every
fi ve years.
Data users should be aware that rebasing
creates a break in the time series. New data
sources and methodologies are usually imple-
mented only for recent years, creating a jump
in GDP between the last year of the old data
and the fi rst year of the new. For constant price
GDP these breaks can be eliminated by linking
the old series to the new using historical growth
rates. But for nominal GDP data the break in the
time series cannot be avoided unless the sta-
tistics offi ce revises historical series backward
at a detailed level.
Broader measures of income and savingsTwo tables have been added to the Economy
section this year. Table 4.10 contains new
measures of adjusted net national income, and
table 4.11 contains measures of adjusted net
savings, previously included in the Environment
section. Both tables follow recommendations of
GDP growth (percent)
2010a2009200820072006200520042003200220012000–5
0
5
10
Developing economies
High-income economies
World
Economies—both developing and high income—rebounded in 2010 4c
a. Data are preliminary estimates.Source: World Development Indicators data fi les.
Average difference in GDP (percent)
0
1
2
3
200820072006200520042003200220012000
Revisions to GDP decline over time, and GDP data become more stable on average 4d
Note: Average differences in current price GDP between World Development Indicators 2010 and 2011.Source: World Development Indicators data fi les.
GDP ($ billions)
0
10
20
30
2009200820072006200520042003200220012000
World Development Indicators 2010 World Development Indicators 2011
Ghana’s revised GDP was 60 percent higher in the new base year, 2006 4e
Source: World Development Indicators data fi les.
2008 value added by industry(percent of GDP)
ServicesIndustryAgriculture
World Development Indicators 2010 World Development Indicators 2011
0
10
20
30
40
50
Revised data for Ghana show a larger share of services in GDP 4f
Source: World Development Indicators data fi les.
2011 World Development Indicators 191
ECONOMY
the recently published The Changing Wealth of
Nations (World Bank 2011a).
Adjusted net savings measures the change
in a country’s national wealth. It begins with
gross national savings and then adjusts for con-
sumption of fi xed capital, depletion of natural
resources, changes in human capital, and dam-
ages from carbon dioxide and particulate emis-
sions. If adjusted net savings is negative, capi-
tal stocks are declining and future well-being
is reduced. The report argues that the key to
increasing living standards is building national
wealth through investment and national savings
to fi nance the investment.
The table on adjusted net national income
presents growth rates of GDP, gross national
income (GNI), and adjusted net national income.
GNI is more useful than GDP for measuring the
economic resources available to residents of an
economy because it takes into account infl ows
of income (profi ts, wages, and rents) from out-
side the economy, net of outfl ows to other econ-
omies (box 4g). Adjusted net national income
goes one step further by subtracting from GNI
a charge for the consumption of fi xed capital
(or depreciation) and the depletion of natu-
ral resources. For some countries, adjusted net
national income growth rates tell a story quite
different from that of the more widely used GDP
growth rates.
Changes to monetary indicatorsThe monetary indicators in table 4.15 have
been revised to refl ect the International Mone-
tary Fund’s (IMF) new presentation of monetary
data for countries reporting in compliance with
the Monetary and Financial Statistics Manual
(IMF 2000) and Monetary and Financial Statis-
tics Compilation Guide (IMF 2008). More than
120 countries report their monetary data under
this new presentation. A majority of these coun-
tries transmit the data on standardized report
forms for the country’s monetary aggregates
and for the assets and liabilities of the central
bank, other depository corporations, and other
fi nancial corporations. This new presentation
better classifi es fi nancial institution assets and
liabilities by fi nancial instrument, sector of the
domestic economy, and residency. For many
countries the new presentation provides broad-
er institutional coverage of other depository cor-
porations and monetary aggregates.
In the new presentation, the IMF has
adopted broad money as the fl agship concept.
Broad money consists of currency in circulation
outside depository corporations, transferable
deposits, and other liquid components. Table
4.15 has replaced money and quasi money
with broad money. Claims on the private sec-
tor have been replaced with other claims on the
domestic economy, consisting of the private
sector plus state and local governments, pub-
lic nonfi nancial corporations, and other fi nan-
cial corporations. Claims on governments and
other public entities have been replaced with
net claims on the central government.
Gross domestic product (GDP), the most quoted measure of economic activity, is often
used as a measure of welfare. But as the Commission on the Measurement of Economic
and Social Progress points out, GDP has many shortcomings as the sole measure of
well-being. The commission’s report identifi ed problems with the GDP measure itself and
recommended including additional measures of the objective and subjective dimensions of
well-being and measures of the sustainability of current consumption levels. The commis-
sion endorsed the adjusted net savings approach as the “relevant economic counterpart
of the notion of sustainability” (Stiglitz, Sen, and Fitoussi 2009, p. 108). But it pointed
out that the adjustment for environmental degradation has so far been limited mostly to
carbon dioxide emissions. The report also notes the diffi culties of pricing natural resources
and environmental degradation. Other recommendations for improving GDP measurement
include accounting more accurately for improvements in the quality of goods and services
produced and the value of government services (usually based on inputs rather than on
actual outputs produced).
Commission on the Measurement of Economic and Social Progress 4g

2011 World Development Indicators192
Recent economic performance4.aGross domestic
product
Exports of goods
and services
Imports of goods
and services
GDP defl ator Current account
balance
Gross international
reserves
average annual
% growth
average annual
% growth
average annual
% growth
average annual
% growth % of GDP $ millions
months
of import
coverage
2009 2010a 2009 2010a 2009 2010a 2009 2010a 2009 2010a 2010a 2010a
Tables
Albania 2.5 3.0 5.9 12.7 –12.0 5.2 2.3 2.0 –15.6 –12.2 2,496 4.5
Algeria 2.1 2.4 –3.0 3.0 16.7 12.5 –9.4 8.6 –10.0 4.6 166,989 42.0
Angola 0.7 3.0 2.4 10.0 6.6 8.5 –5.8 36.1 –10.0 –5.1 .. ..
Argentinab 0.9 8.0 –6.4 12.8 –19.0 23.1 10.0 9.4 2.8 1.8 52,208 10.2
Armenia –14.4 4.0 –32.8 8.5 –21.0 4.2 1.4 7.5 –15.7 –12.7 1,859 6.7
Australia 1.3 2.8 2.9 15.0 –9.0 28.7 4.9 5.7 –4.2 –2.2 42,268 1.8
Austria –3.9 1.5 –16.1 8.2 –14.4 6.8 0.8 0.6 2.9 3.9 22,339 1.4
Azerbaijan 9.3 3.7 2.8 11.0 –5.3 3.5 –16.8 –2.7 23.7 27.2 6,409 7.0
Bangladesh 5.7 5.8 0.0 –9.0 –2.6 –12.5 6.5 10.7 3.7 2.4 11,175 6.4
Belarus 1.4 7.0 –8.2 6.0 –8.6 3.4 3.9 6.4 –13.0 –14.0 5,025 2.0
Belgium –2.8 2.1 –11.4 9.7 –11.1 8.2 1.1 –2.8 0.7 0.6 26,779 0.9
Bolivia 3.4 4.1 –10.8 11.4 –10.2 12.3 –2.4 6.5 4.7 8.0 .. ..
Botswana –3.7 7.8 –28.0 12.0 –9.3 8.9 –5.7 6.0 –4.4 –2.1 .. ..
Brazil –0.6 7.6 –10.2 26.0 –11.5 35.1 5.7 5.3 –1.5 –2.7 288,575 13.9
Bulgaria –4.9 0.0 –10.3 11.0 –21.5 3.0 4.1 –0.6 –9.8 –2.4 17,223 7.6
Cambodia –1.9 4.9 –6.3 8.0 –4.9 12.6 5.1 3.9 –8.8 –8.6 3,787 6.0
Cameroon 2.0 3.0 –4.8 17.0 –5.2 12.0 –3.4 3.4 –5.1 –2.7 .. ..
Canada –2.5 3.0 –14.2 15.5 –13.9 14.6 –2.1 2.7 –2.9 –2.0 57,151 1.4
Chile –1.5 5.5 –5.6 8.5 –14.3 25.5 4.2 6.6 2.6 0.6 27,827 5.4
China 9.1 10.0 –10.3 33.0 4.1 35.0 –0.6 1.7 6.0 5.5 2,711,162 21.6
Hong Kong SAR, China –2.8 6.0 –10.1 22.1 –8.8 22.5 0.2 0.3 8.3 22.0 266,055 6.7
Colombia 0.8 4.3 –2.8 17.4 –7.9 21.4 4.9 4.8 –2.1 –2.7 28,076 6.6
Congo, Dem. Rep. 2.7 5.2 5.4 9.3 –11.9 10.8 30.2 21.7 –13.7 –17.2 1,768 7.3
Costa Rica –1.5 3.6 0.6 6.2 –12.4 13.1 8.9 7.9 –1.8 –3.2 4,630 4.1
Côte d’Ivoire 3.6 3.0 9.3 4.4 11.0 5.0 1.3 1.3 7.2 4.1 3,502 4.8
Croatia –5.8 –0.8 –16.2 2.5 –20.7 1.5 3.3 1.6 –5.3 –4.4 14,133 7.1
Czech Republic –4.2 1.7 –10.2 9.4 –10.2 10.4 2.7 1.6 –1.1 –2.7 42,328 3.9
Denmark –4.9 2.1 –9.7 5.1 –12.5 1.0 0.4 5.3 3.6 5.6 75,077 6.7
Dominican Republic 3.5 4.4 –7.4 8.1 –9.8 11.8 3.0 7.1 –4.6 –5.9 3,501 2.7
Ecuador 0.4 2.3 –6.4 –2.0 –8.0 5.0 4.3 4.4 –0.5 –0.8 2,622 1.1
Egypt, Arab Rep. 4.6 5.1 –14.5 11.8 –17.9 12.0 10.8 11.2 –1.8 –4.1 36,517 5.7
El Salvador –3.5 1.3 –16.4 9.4 –23.3 15.2 –1.0 3.6 –1.8 –3.1 2,897 3.9
Estonia –14.1 1.0 –11.2 5.4 –26.8 4.0 –0.6 –1.1 4.7 4.0 2,567 2.3
Ethiopia 8.7 9.0 6.9 11.7 16.4 4.4 24.4 9.9 –7.7 –8.5 .. ..
Finland –8.0 3.0 –20.5 6.8 –18.1 3.5 0.9 –0.4 2.9 3.7 9,547 1.4
France –2.6 1.6 –12.2 6.6 –10.7 5.2 0.5 1.4 –2.0 –2.1 165,852 2.9
Gabon –1.0 5.1 –4.9 7.0 –2.8 4.8 –19.0 9.1 .. 12.7 .. ..
Gambia, The 4.6 5.0 2.5 5.2 3.8 3.1 2.4 4.8 8.6 5.2 .. ..
Georgia –3.9 5.5 –8.4 11.0 –6.4 9.0 –2.0 7.4 –11.3 –12.1 2,264 5.0
Germany –4.7 3.5 –14.3 10.7 –9.4 9.1 1.4 1.6 5.0 5.9 215,978 2.0
Ghana 4.7 6.6 12.6 8.9 –14.1 10.5 16.7 10.6 –4.6 –3.6 .. ..
Greece –2.0 –4.0 –6.2 0.5 –18.6 –12.1 1.3 4.8 –10.9 –8.5 6,352 0.9
Guatemala 0.6 2.2 –6.2 9.9 –9.4 14.3 2.4 6.4 0.0 –2.5 5,949 5.1
Haiti 2.9 –8.5 9.9 –7.1 5.8 5.9 3.5 12.6 –3.6 –13.6 1,282 5.3
Honduras –1.9 2.4 –12.6 4.5 –26.0 10.4 4.4 10.5 –3.1 –4.7 .. ..
Hungary –6.3 0.3 –9.1 6.8 –15.4 5.4 4.6 2.7 –0.5 –0.4 44,988 5.5
India 9.1 9.5 –6.7 8.1 –7.3 6.8 7.5 11.5 –1.9 –3.8 300,480 9.7
Indonesia 4.5 5.9 –9.7 24.7 –15.0 32.5 8.4 6.2 2.0 2.6 92,815 7.1
Iran, Islamic Rep. 1.8 1.5 8.5 –3.0 7.8 16.5 0.6 15.0 3.4 6.1 .. ..
Ireland –7.1 –0.6 –4.2 1.7 –9.7 2.1 –3.2 0.6 –2.9 –3.6 2,114 0.2
Israel 0.8 3.8 –11.9 17.8 –17.7 17.5 5.2 4.6 3.9 4.9 70,914 12.0
Italy –5.0 1.1 –19.1 8.0 –14.5 9.4 2.1 1.6 –3.1 –3.6 158,478 3.5
Jamaica –3.0 0.6 –10.8 5.7 –11.4 9.3 6.5 16.7 –9.3 –7.9 2,330 4.0
Japan –5.2 4.4 –24.2 28.7 –16.7 15.6 –0.9 –1.0 2.8 3.8 1,096,069 17.6
Jordan 2.3 4.0 –2.7 5.2 –7.8 6.5 8.1 8.5 –5.0 –4.6 13,388 9.5
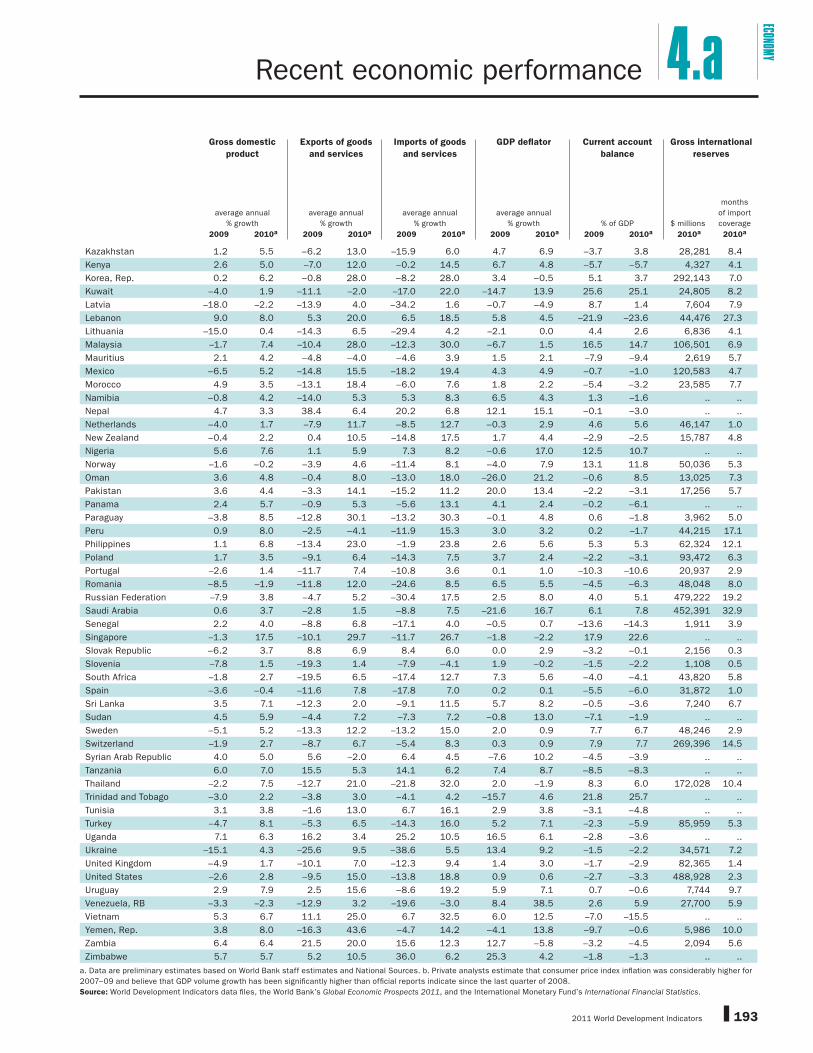
2011 World Development Indicators 193
ECONOMY4.aRecent economic performance
Gross domestic
product
Exports of goods
and services
Imports of goods
and services
GDP defl ator Current account
balance
Gross international
reserves
average annual
% growth
average annual
% growth
average annual
% growth
average annual
% growth % of GDP $ millions
months
of import
coverage
2009 2010a 2009 2010a 2009 2010a 2009 2010a 2009 2010a 2010a 2010a
Kazakhstan 1.2 5.5 –6.2 13.0 –15.9 6.0 4.7 6.9 –3.7 3.8 28,281 8.4
Kenya 2.6 5.0 –7.0 12.0 –0.2 14.5 6.7 4.8 –5.7 –5.7 4,327 4.1
Korea, Rep. 0.2 6.2 –0.8 28.0 –8.2 28.0 3.4 –0.5 5.1 3.7 292,143 7.0
Kuwait –4.0 1.9 –11.1 –2.0 –17.0 22.0 –14.7 13.9 25.6 25.1 24,805 8.2
Latvia –18.0 –2.2 –13.9 4.0 –34.2 1.6 –0.7 –4.9 8.7 1.4 7,604 7.9
Lebanon 9.0 8.0 5.3 20.0 6.5 18.5 5.8 4.5 –21.9 –23.6 44,476 27.3
Lithuania –15.0 0.4 –14.3 6.5 –29.4 4.2 –2.1 0.0 4.4 2.6 6,836 4.1
Malaysia –1.7 7.4 –10.4 28.0 –12.3 30.0 –6.7 1.5 16.5 14.7 106,501 6.9
Mauritius 2.1 4.2 –4.8 –4.0 –4.6 3.9 1.5 2.1 –7.9 –9.4 2,619 5.7
Mexico –6.5 5.2 –14.8 15.5 –18.2 19.4 4.3 4.9 –0.7 –1.0 120,583 4.7
Morocco 4.9 3.5 –13.1 18.4 –6.0 7.6 1.8 2.2 –5.4 –3.2 23,585 7.7
Namibia –0.8 4.2 –14.0 5.3 5.3 8.3 6.5 4.3 1.3 –1.6 .. ..
Nepal 4.7 3.3 38.4 6.4 20.2 6.8 12.1 15.1 –0.1 –3.0 .. ..
Netherlands –4.0 1.7 –7.9 11.7 –8.5 12.7 –0.3 2.9 4.6 5.6 46,147 1.0
New Zealand –0.4 2.2 0.4 10.5 –14.8 17.5 1.7 4.4 –2.9 –2.5 15,787 4.8
Nigeria 5.6 7.6 1.1 5.9 7.3 8.2 –0.6 17.0 12.5 10.7 .. ..
Norway –1.6 –0.2 –3.9 4.6 –11.4 8.1 –4.0 7.9 13.1 11.8 50,036 5.3
Oman 3.6 4.8 –0.4 8.0 –13.0 18.0 –26.0 21.2 –0.6 8.5 13,025 7.3
Pakistan 3.6 4.4 –3.3 14.1 –15.2 11.2 20.0 13.4 –2.2 –3.1 17,256 5.7
Panama 2.4 5.7 –0.9 5.3 –5.6 13.1 4.1 2.4 –0.2 –6.1 .. ..
Paraguay –3.8 8.5 –12.8 30.1 –13.2 30.3 –0.1 4.8 0.6 –1.8 3,962 5.0
Peru 0.9 8.0 –2.5 –4.1 –11.9 15.3 3.0 3.2 0.2 –1.7 44,215 17.1
Philippines 1.1 6.8 –13.4 23.0 –1.9 23.8 2.6 5.6 5.3 5.3 62,324 12.1
Poland 1.7 3.5 –9.1 6.4 –14.3 7.5 3.7 2.4 –2.2 –3.1 93,472 6.3
Portugal –2.6 1.4 –11.7 7.4 –10.8 3.6 0.1 1.0 –10.3 –10.6 20,937 2.9
Romania –8.5 –1.9 –11.8 12.0 –24.6 8.5 6.5 5.5 –4.5 –6.3 48,048 8.0
Russian Federation –7.9 3.8 –4.7 5.2 –30.4 17.5 2.5 8.0 4.0 5.1 479,222 19.2
Saudi Arabia 0.6 3.7 –2.8 1.5 –8.8 7.5 –21.6 16.7 6.1 7.8 452,391 32.9
Senegal 2.2 4.0 –8.8 6.8 –17.1 4.0 –0.5 0.7 –13.6 –14.3 1,911 3.9
Singapore –1.3 17.5 –10.1 29.7 –11.7 26.7 –1.8 –2.2 17.9 22.6 .. ..
Slovak Republic –6.2 3.7 8.8 6.9 8.4 6.0 0.0 2.9 –3.2 –0.1 2,156 0.3
Slovenia –7.8 1.5 –19.3 1.4 –7.9 –4.1 1.9 –0.2 –1.5 –2.2 1,108 0.5
South Africa –1.8 2.7 –19.5 6.5 –17.4 12.7 7.3 5.6 –4.0 –4.1 43,820 5.8
Spain –3.6 –0.4 –11.6 7.8 –17.8 7.0 0.2 0.1 –5.5 –6.0 31,872 1.0
Sri Lanka 3.5 7.1 –12.3 2.0 –9.1 11.5 5.7 8.2 –0.5 –3.6 7,240 6.7
Sudan 4.5 5.9 –4.4 7.2 –7.3 7.2 –0.8 13.0 –7.1 –1.9 .. ..
Sweden –5.1 5.2 –13.3 12.2 –13.2 15.0 2.0 0.9 7.7 6.7 48,246 2.9
Switzerland –1.9 2.7 –8.7 6.7 –5.4 8.3 0.3 0.9 7.9 7.7 269,396 14.5
Syrian Arab Republic 4.0 5.0 5.6 –2.0 6.4 4.5 –7.6 10.2 –4.5 –3.9 .. ..
Tanzania 6.0 7.0 15.5 5.3 14.1 6.2 7.4 8.7 –8.5 –8.3 .. ..
Thailand –2.2 7.5 –12.7 21.0 –21.8 32.0 2.0 –1.9 8.3 6.0 172,028 10.4
Trinidad and Tobago –3.0 2.2 –3.8 3.0 –4.1 4.2 –15.7 4.6 21.8 25.7 .. ..
Tunisia 3.1 3.8 –1.6 13.0 6.7 16.1 2.9 3.8 –3.1 –4.8 .. ..
Turkey –4.7 8.1 –5.3 6.5 –14.3 16.0 5.2 7.1 –2.3 –5.9 85,959 5.3
Uganda 7.1 6.3 16.2 3.4 25.2 10.5 16.5 6.1 –2.8 –3.6 .. ..
Ukraine –15.1 4.3 –25.6 9.5 –38.6 5.5 13.4 9.2 –1.5 –2.2 34,571 7.2
United Kingdom –4.9 1.7 –10.1 7.0 –12.3 9.4 1.4 3.0 –1.7 –2.9 82,365 1.4
United States –2.6 2.8 –9.5 15.0 –13.8 18.8 0.9 0.6 –2.7 –3.3 488,928 2.3
Uruguay 2.9 7.9 2.5 15.6 –8.6 19.2 5.9 7.1 0.7 –0.6 7,744 9.7
Venezuela, RB –3.3 –2.3 –12.9 3.2 –19.6 –3.0 8.4 38.5 2.6 5.9 27,700 5.9
Vietnam 5.3 6.7 11.1 25.0 6.7 32.5 6.0 12.5 –7.0 –15.5 .. ..
Yemen, Rep. 3.8 8.0 –16.3 43.6 –4.7 14.2 –4.1 13.8 –9.7 –0.6 5,986 10.0
Zambia 6.4 6.4 21.5 20.0 15.6 12.3 12.7 –5.8 –3.2 –4.5 2,094 5.6
Zimbabwe 5.7 5.7 5.2 10.5 36.0 6.2 25.3 4.2 –1.8 –1.3 .. ..
a. Data are preliminary estimates based on World Bank staff estimates and National Sources. b. Private analysts estimate that consumer price index infl ation was considerably higher for
2007–09 and believe that GDP volume growth has been signifi cantly higher than offi cial reports indicate since the last quarter of 2008.
Source: World Development Indicators data fi les, the World Bank’s Global Economic Prospects 2011, and the International Monetary Fund’s International Financial Statistics.
2011 World Development Indicators194
Afghanistan .. 10.5 .. 4.9 .. 14.5 .. 8.7 .. 13.5
Albania 3.8 5.4 4.3 1.4 –0.5 4.4 .. .. 6.9 8.3
Algeria 1.9 4.0 3.6 4.6 1.8 3.3 –2.1 2.6 1.8 5.3
Angolaa 1.6 13.1 –1.4 14.0 4.4 13.4 –0.3 20.2 –2.2 12.1
Argentina 4.3 5.4b 3.5 2.5 3.8 6.1 2.7 5.8 4.5 4.7
Armenia –1.9 10.5 0.5 6.6 –7.8 11.3 –4.3 4.6 6.4 12.1
Australia 3.7 3.3 3.1 0.0 2.7 2.6 1.8 1.3 4.2 3.7
Austria 2.4 2.0 –0.1 1.3 2.5 2.3 2.5 2.9 2.5 2.1
Azerbaijan –6.3 17.9 –1.7 5.3 –2.1 23.1 –15.7 10.8 –2.7 10.6
Bangladesh 4.8 5.9 2.9 3.3 7.3 7.8 7.2 7.9 4.5 6.1
Belarus –1.6 8.4 –4.0 5.2 –1.8 12.3 –0.7 10.8 –0.4 5.9
Belgium 2.2 1.7 2.7 –1.0 1.8 0.7 .. .. 2.0 2.0
Benina 4.8 4.0 5.8 4.6 4.1 3.8 5.8 2.7 4.2 3.2
Bolivia 4.0 4.1 2.9 3.1 4.1 5.3 3.8 4.5 4.3 3.1
Bosnia and Herzegovina .. 5.0 .. 4.9 .. 6.8 .. 7.6 .. 4.4
Botswana 5.0 4.4 –0.5 1.2 3.7 2.5 4.7 4.8 9.1 5.6
Brazil 2.7 3.6 3.6 3.7 2.4 2.8 2.0 2.6 3.8 3.8
Bulgaria –1.1 5.4 –3.9 –2.5 –19.5 5.9 .. 6.2 .. 6.1
Burkina Faso 5.5 5.4 5.9 6.2 5.9 7.3 5.9 6.3 3.9 5.5
Burundi –2.9 3.0 –1.9 –1.5 –4.3 –6.2 .. .. –2.8 10.4
Cambodia 7.0 9.0 3.7 5.7 14.3 12.0 18.6 11.3 7.1 9.5
Cameroon 1.7 3.3 5.4 3.4 –0.9 –0.4 1.4 .. 0.2 6.2
Canada 3.1 2.1 1.1 1.4 3.2 0.1 4.5 –1.6 3.1 3.0
Central African Republic 2.0 0.8 3.8 0.3 0.7 –0.4 –0.2 –0.1 0.2 –2.5
Chad 2.2 10.2 4.9 .. 0.6 .. .. .. 0.8 ..
Chile 6.6 4.1 2.2 5.2 5.6 2.7 4.4 3.2 6.9 4.6
Chinaa 10.6 10.9 4.1 4.4 13.7 11.8 12.9 11.4 11.0 11.6
Hong Kong SAR, China 3.6 4.7 .. –3.3 .. –2.6 .. .. .. 5.3
Colombia 2.8 4.5 –2.7 2.5 1.4 4.4 –2.5 4.0 4.1 4.7
Congo, Dem. Rep. –4.9 5.2 1.4 1.7 –8.0 8.7 –8.7 6.3 –13.0 11.2
Congo, Rep.a 1.0 4.0 .. .. .. .. .. .. .. ..
Costa Rica 5.3 5.1 4.1 3.5 6.2 5.1 6.8 4.7 4.7 5.6
Côte d’Ivoirea 3.2 0.8 3.5 1.4 6.3 –0.2 5.5 –1.7 2.0 1.0
Croatia 0.5 3.9 –5.5 2.0 –2.2 4.6 –3.5 3.7 2.2 4.0
Cuba –0.7 6.7 –3.3 –0.9 –1.0 2.3 0.8 –1.5 –0.7 8.3
Czech Republic 1.1 4.1 0.0 0.1 0.2 5.7 4.3 7.0 1.2 4.3
Denmark 2.7 1.2 4.6 –1.8 2.5 –0.5 2.2 0.4 2.7 1.5
Dominican Republica 6.3 5.5 1.9 3.2 7.1 2.4 7.0 2.7 5.9 7.1
Ecuador 1.9 5.0 –1.7 3.7 2.6 4.2 1.5 5.3 2.4 3.6
Egypt, Arab Rep. 4.4 4.9 3.1 3.3 5.1 5.3 6.3 4.7 4.1 5.4
El Salvador 4.8 2.6 1.2 3.6 5.1 1.7 5.2 2.1 4.0 3.2
Eritrea 5.7 0.2 1.5 2.7 15.0 0.6 10.6 –6.0 5.7 0.5
Estonia 0.4 5.9 –6.2 –2.9 –2.4 8.6 7.3 8.9 3.2 7.1
Ethiopia 3.8 8.5 2.6 7.0 4.1 9.3 3.9 7.2 5.2 10.2
Finland 2.7 2.5 –0.3 2.4 3.8 3.6 6.4 4.1 2.6 1.6
France 1.9 1.5 2.0 0.3 1.1 0.5 .. 0.1 2.2 1.9
Gabona 2.3 2.1 2.0 1.4 1.6 0.9 3.0 3.1 3.1 3.2
Gambia, The 3.0 5.2 3.3 3.0 1.0 7.4 0.9 .. 3.7 6.1
Georgia –7.1 7.4 –11.0 0.6 –8.1 10.0 .. 10.9 –0.3 8.9
Germany 1.8 1.0 0.1 –0.3 –0.1 0.3 0.1 0.8 2.9 1.5
Ghana 4.3 5.8 .. .. .. .. .. .. .. ..
Greece 2.2 3.6 0.5 –1.4 1.0 1.4 .. 1.7 2.6 4.7
Guatemala 4.2 3.7 2.8 2.9 4.3 2.8 2.8 2.8 4.7 4.4
Guinea 4.4 3.0 4.3 6.7 4.9 4.4 4.0 3.1 3.6 –2.7
Guinea-Bissau 1.2 1.0 .. .. .. .. .. .. .. ..
Haiti 0.5 0.7 .. .. .. .. .. .. .. ..
Honduras 3.2 4.9 2.2 3.3 3.6 4.1 4.0 4.6 3.8 6.2
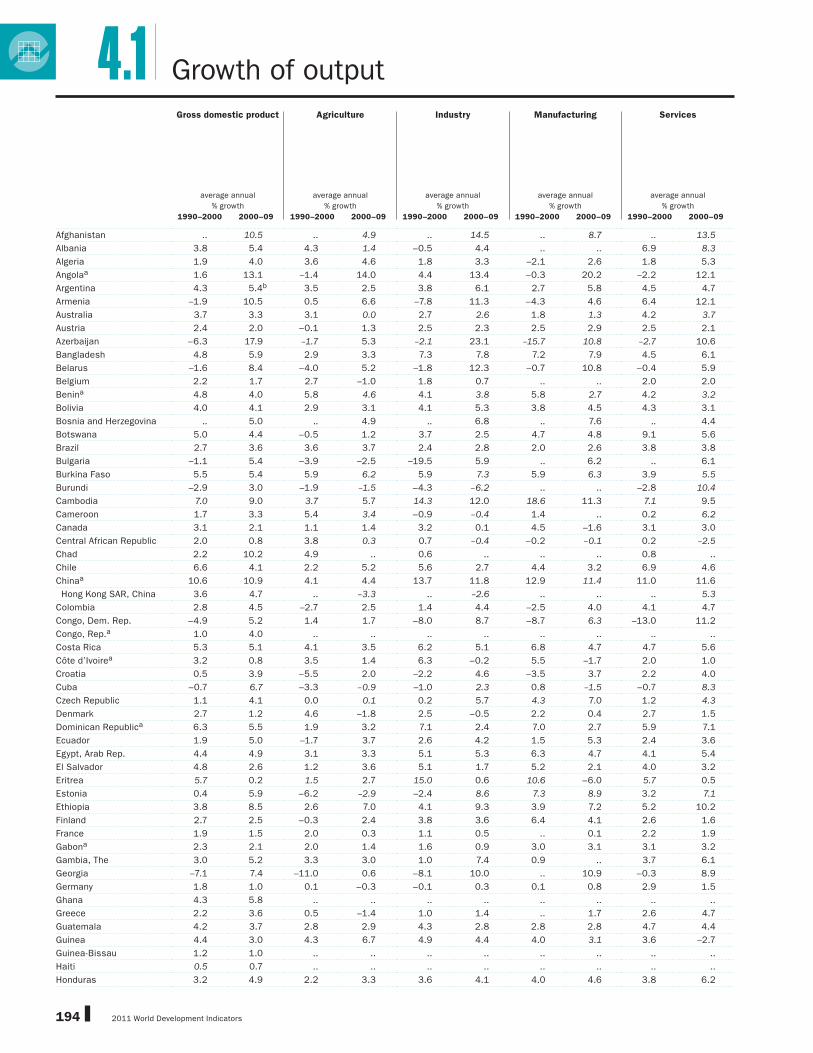
Gross domestic product Agriculture Industry Manufacturing Services
average annual
% growth
average annual
% growth
average annual
% growth
average annual
% growth
average annual
% growth
1990–2000 2000–09 1990–2000 2000–09 1990–2000 2000–09 1990–2000 2000–09 1990–2000 2000–09
4.1 Growth of output

2011 World Development Indicators 195
Growth of outputECONOMY4.1
Hungary 1.5 2.9 –1.9 5.3 3.5 3.5 7.7 5.0 1.3 3.4
India 5.9 7.9 3.2 2.9 6.1 8.6 6.7 8.7 7.7 9.5
Indonesiaa 4.2 5.3 2.0 3.4 5.2 4.1 6.7 4.7 4.0 6.2
Iran, Islamic Rep. 3.1 5.4 3.2 5.9 2.6 6.9 5.1 9.9 3.8 5.3
Iraq .. –0.3 .. .. .. .. .. .. .. ..
Ireland 7.4 3.9 0.0 –4.6 11.6 4.0 .. .. 8.7 4.4
Israela 5.5 3.6 .. .. .. .. .. .. .. ..
Italy 1.5 0.5 2.1 –0.2 1.0 –0.5 1.6 –1.1 1.6 1.0
Jamaica 1.6 1.5 –0.6 –0.7 –0.8 0.2 –1.8 –1.5 3.8 1.9
Japan 1.0 1.1 –1.3 –0.3 –0.3 1.7 0.5 2.8 1.8 1.5
Jordan 5.0 6.9 –3.0 8.3 5.2 8.4 5.6 9.6 5.0 6.1
Kazakhstan –4.1 8.8 –8.0 4.6 –8.6 9.6 .. 6.6 1.1 8.6
Kenya 2.2 4.4 1.9 2.2 1.2 4.8 1.3 4.3 3.2 4.5
Korea, Dem. Rep. .. .. .. .. .. .. .. .. .. ..
Korea, Rep. 5.8 4.2 1.6 2.0 6.0 5.4 7.3 6.3 5.6 3.7
Kosovo .. 4.8 .. .. .. .. .. .. .. ..
Kuwaita 4.9 8.4 1.0 .. 0.3 .. –0.1 .. 3.5 ..
Kyrgyz Republic –4.1 4.6 1.5 1.8 –10.3 0.8 –7.5 –1.2 –5.2 7.9
Lao PDR 6.4 6.9 4.8 3.3 11.1 11.9 11.7 –1.9 6.6 7.6
Latvia –1.5 6.2 –5.2 2.7 –8.3 5.2 –7.3 3.1 2.7 7.0
Lebanon 5.3 4.6 2.9 1.4 –0.2 4.4 1.9 2.2 1.5 4.3
Lesotho 4.0 3.1 2.8 –2.4 5.5 3.6 7.9 5.7 4.5 3.7
Liberia 4.1 0.0 .. .. .. .. .. .. .. ..
Libya .. 5.4 .. .. .. .. .. .. .. ..
Lithuania –2.5 6.3 –0.4 1.7 3.3 9.6 6.6 9.0 5.8 7.4
Macedonia, FYR –0.8 3.1 0.2 2.2 –2.3 3.5 –5.3 2.9 0.5 3.0
Madagascar 2.0 3.6 1.8 2.4 2.4 4.2 2.0 5.1 2.3 3.6
Malawi 3.7 4.8 8.6 2.4 2.0 5.5 0.5 5.0 1.6 6.5
Malaysiaa 7.0 5.1 0.3 3.5 8.6 3.5 9.5 4.3 8.2 6.4
Mali 4.1 5.3 2.6 4.8 6.4 4.5 –1.4 5.1 3.0 6.5
Mauritania 2.9 4.7 –0.2 0.9 3.4 5.0 5.8 –1.4 4.9 5.5
Mauritius 5.2 3.7 0.0 –0.8 5.4 1.7 5.3 0.4 6.3 5.7
Mexico 3.1 2.2 1.5 2.0 3.8 1.3 4.3 1.1 2.9 2.6
Moldova –9.6 5.6 –11.2 –0.6 –13.6 –1.7 –7.1 1.3 0.7 10.5
Mongolia 1.0 7.4 2.5 5.9 –2.5 6.5 –9.7 7.1 0.7 8.7
Morocco 2.4 5.0 –0.4 5.8 3.2 4.1 2.6 3.1 3.1 5.0
Mozambique 6.1 7.9 5.2 8.2 12.3 9.1 10.2 7.9 5.0 7.0
Myanmara .. .. .. .. .. .. .. .. .. ..
Namibia 4.0 5.3 3.8 0.5 2.4 6.2 7.4 5.6 4.2 5.5
Nepal 4.9 3.7 2.5 3.1 7.1 2.8 8.9 1.0 6.2 4.1
Netherlands 3.2 1.7 1.8 1.5 1.7 0.9 2.6 1.2 3.6 2.1
New Zealand 3.2 2.5 2.9 1.8 2.5 1.9 .. .. 3.6 3.4
Nicaragua 3.7 3.3 4.7 2.7 5.5 3.7 5.3 4.8 5.0 3.7
Nigera 2.4 4.3 3.0 .. 2.0 .. 2.6 .. 1.9 ..
Nigeria 2.5 6.6 .. .. .. .. .. .. .. ..
Norway 3.9 2.1 2.6 2.4 3.8 –0.3 1.5 2.6 3.8 3.0
Omana 4.5 4.5 5.0 .. 3.9 .. 6.0 .. 5.0 ..
Pakistan 3.8 5.2 4.4 3.5 4.1 6.8 3.8 8.7 4.4 5.9
Panama 4.7 6.9 3.1 3.5 6.0 5.7 2.7 1.5 4.5 7.4
Papua New Guinea 3.8 3.4 4.5 2.2 5.4 4.1 4.6 3.8 –0.6 3.8
Paraguaya 2.2 3.4 3.3 2.3 0.6 1.8 1.4 1.2 2.5 4.3
Peru 4.7 6.0 5.5 4.1 5.4 6.5 3.8 6.2 4.0 6.0
Philippinesa 3.3 4.9 1.7 3.6 3.5 4.0 3.0 3.9 4.0 6.1
Poland 4.7 4.4 0.5 0.8 7.1 5.8 9.9 8.5 5.1 3.7
Portugal 2.9 0.8 –0.6 –0.3 3.1 –0.8 2.7 –0.6 2.5 1.6
Puerto Ricoa 4.2 .. .. .. .. .. .. .. .. ..
Qatar .. 14.2 .. .. .. .. .. .. .. ..
Gross domestic product Agriculture Industry Manufacturing Services
average annual
% growth
average annual
% growth
average annual
% growth
average annual
% growth
average annual
% growth
1990–2000 2000–09 1990–2000 2000–09 1990–2000 2000–09 1990–2000 2000–09 1990–2000 2000–09

2011 World Development Indicators196
Growth of output4.1
Romania –0.6 5.6 –1.9 7.3 –1.2 6.0 .. .. 0.9 5.2
Russian Federation –4.7 6.0 –4.9 2.1 –7.1 4.6 .. .. –1.7 7.0
Rwandaa –0.2 7.6 2.5 .. –3.8 .. –5.8 .. –0.9 ..
Saudi Arabiaa 2.1 3.8 1.6 1.4 2.2 3.6 5.6 5.9 2.2 4.2
Senegal 3.0 4.3 2.4 2.0 3.8 3.3 3.1 1.4 3.0 6.3
Serbia –4.2 5.0 .. .. .. .. .. .. .. ..
Sierra Leone –5.0 9.5 .. .. .. .. .. .. .. ..
Singapore 7.6 6.5 .. 2.3 7.8 5.4 .. .. 7.8 6.2
Slovak Republic 2.2 5.8 0.2 5.0 3.7 10.5 9.3 10.7 5.4 2.4
Slovenia 2.7 3.8 0.4 –0.7 1.6 4.1 1.8 3.7 3.3 4.0
Somalia .. .. .. .. .. .. .. .. .. ..
South Africa 2.1 4.1 1.0 1.5 1.0 2.9 1.6 3.1 3.0 4.1
Spain 2.7 2.8 3.1 –0.2 2.3 1.3 5.2 –0.2 2.7 3.5
Sri Lankaa 5.3 5.5 1.8 2.8 6.9 5.5 8.1 4.4 5.7 6.2
Sudan 5.5 7.3 7.4 2.4 8.5 10.2 7.5 4.4 1.9 10.1
Swaziland 3.4 2.6 0.9 1.3 3.2 1.7 2.8 1.8 3.9 3.9
Sweden 2.3 2.4 –0.8 3.5 4.6 2.8 8.9 3.3 1.8 2.2
Switzerland 1.0 1.9 –0.9 0.3 0.3 2.1 1.0 2.5 1.2 1.8
Syrian Arab Republic 5.1 4.4 6.0 3.8 9.2 2.4 .. 14.5 1.5 7.7
Tajikistan –10.4 8.2 –6.8 7.7 –11.4 9.2 –12.6 8.6 –10.8 8.3
Tanzaniac 3.0 7.1 3.2 4.4 3.1 9.5 2.8 8.7 2.6 7.8
Thailanda 4.2 4.6 1.0 2.3 5.7 5.6 6.9 6.6 3.7 4.2
Timor-Lestea .. 2.4 .. .. .. .. .. .. .. ..
Togoa 3.5 2.5 4.0 2.8 1.8 8.1 1.8 7.5 3.9 –0.7
Trinidad and Tobago 3.2 7.4 2.7 –7.2 3.2 10.2 4.9 9.5 3.2 5.3
Tunisiaa 4.7 4.9 2.3 2.6 4.6 3.6 5.5 3.6 5.3 5.9
Turkey 3.9 4.9 1.3 1.5 4.7 5.4 4.7 5.3 4.0 5.3
Turkmenistan –4.9 13.9 –4.7 14.3 –2.7 30.3 .. .. –5.8 16.0
Uganda 7.2 7.8 3.9 2.3 12.0 9.5 13.9 6.7 8.3 8.5
Ukraine –9.3 5.6 –5.6 3.1 –12.6 4.6 –11.2 7.8 –8.1 5.8
United Arab Emirates 4.8 7.0 13.2 3.6 3.0 6.0 11.9 8.1 7.2 9.5
United Kingdom 2.8 2.0 –1.3 0.6 1.3 –0.6 .. .. 3.5 2.9
United States 3.6 2.0 3.8 2.1 3.8 0.9 .. 2.4 3.6 2.3
Uruguay 3.3 3.4 2.6 2.9 1.1 4.0 –0.1 6.2 1.5 3.4
Uzbekistan –0.2 6.9 0.5 6.5 –3.4 4.7 0.7 2.3 0.4 8.5
Venezuela, RB 1.6 4.9 1.2 3.6 1.2 3.3 4.5 3.6 –0.1 5.9
Vietnama 7.9 7.6 4.3 3.8 11.9 9.6 11.2 11.3 7.5 7.5
West Bank and Gaza 7.3 –0.9 .. .. .. .. .. .. .. ..
Yemen, Rep.a 6.0 3.9 5.6 .. 8.2 .. 5.7 .. 5.0 ..
Zambia 0.5 5.4 4.2 1.2 –4.2 9.2 0.8 5.0 2.5 5.6
Zimbabwe 2.3 –7.5 4.3 –10.8 0.4 –5.8 0.4 –6.6 3.0 –4.8
World 2.9 w 2.9 w 1.9 w 2.5 w 2.4 w 2.8 w .. w 4.0 w 3.2 w 2.9 w
Low income 3.1 5.4 2.9 3.6 3.4 7.4 3.7 6.4 2.9 5.9
Middle income 3.9 6.4 2.4 3.6 4.5 7.2 6.2 7.6 4.3 6.6
Lower middle income 6.5 8.5 3.1 3.8 8.7 9.6 9.2 9.8 6.8 9.3
Upper middle income 2.1 4.4 0.9 3.0 1.3 3.9 3.3 3.6 3.0 4.5
Low & middle income 3.9 6.4 2.4 3.6 4.5 7.2 6.2 7.6 4.3 6.6
East Asia & Pacifi c 8.5 9.4 3.4 4.1 11.0 10.2 10.9 10.2 8.6 10.0
Europe & Central Asia –1.8 5.9 –2.1 3.0 –4.3 6.2 .. .. 0.3 6.3
Latin America & Carib. 3.2 3.8 2.0 3.0 3.0 3.2 2.9 2.9 3.5 3.9
Middle East & N. Africa 3.8 4.7 2.9 4.4 4.2 3.6 4.3 6.0 3.3 5.5
South Asia 5.5 7.3 3.3 3.0 6.0 8.2 6.4 8.5 6.9 8.7
Sub-Saharan Africa 2.5 5.1 3.2 3.2 1.9 4.9 2.2 3.4 2.6 4.8
High income 2.7 2.0 1.2 0.9 1.9 1.1 .. 2.9 3.0 2.2
Euro area 2.1 1.5 1.5 0.0 1.1 0.7 2.4 0.5 2.5 1.9
a. Components are at producer prices. b. Private analysts estimate that consumer price index infl ation was considerably higher for 2007–09 and believe that GDP volume growth has been
signifi cantly higher than offi cial reports indicate since the last quarter of 2008. c. Covers mainland Tanzania only.
Gross domestic product Agriculture Industry Manufacturing Services
average annual
% growth
average annual
% growth
average annual
% growth
average annual
% growth
average annual
% growth
1990–2000 2000–09 1990–2000 2000–09 1990–2000 2000–09 1990–2000 2000–09 1990–2000 2000–09

2011 World Development Indicators 197
Growth of outputECONOMY4.1
About the data Defi nitions
An economy’s growth is measured by the change in
the volume of its output or in the real incomes of
its residents. The 1993 United Nations System of
National Accounts (1993 SNA) offers three plausible
indicators for calculating growth: the volume of gross
domestic product (GDP), real gross domestic income,
and real gross national income. The volume of GDP
is the sum of value added, measured at constant
prices, by households, government, and industries
operating in the economy.
Each industry’s contribution to growth in the econ-
omy’s output is measured by growth in the industry’s
value added. In principle, value added in constant
prices can be estimated by measuring the quantity
of goods and services produced in a period, valu-
ing them at an agreed set of base year prices, and
subtracting the cost of intermediate inputs, also in
constant prices. This double-deflation method, rec-
ommended by the 1993 SNA and its predecessors,
requires detailed information on the structure of
prices of inputs and outputs.
In many industries, however, value added is
extrapolated from the base year using single volume
indexes of outputs or, less commonly, inputs. Par-
ticularly in the services industries, including most of
government, value added in constant prices is often
imputed from labor inputs, such as real wages or
number of employees. In the absence of well defined
measures of output, measuring the growth of ser-
vices remains diffi cult.
Moreover, technical progress can lead to improve-
ments in production processes and in the quality of
goods and services that, if not properly accounted
for, can distort measures of value added and thus
of growth. When inputs are used to estimate output,
as for nonmarket services, unmeasured technical
progress leads to underestimates of the volume of
output. Similarly, unmeasured improvements in qual-
ity lead to underestimates of the value of output and
value added. The result can be underestimates of
growth and productivity improvement and overesti-
mates of inflation.
Informal economic activities pose a particular mea-
surement problem, especially in developing coun-
tries, where much economic activity is unrecorded.
A complete picture of the economy requires estimat-
ing household outputs produced for home use, sales
in informal markets, barter exchanges, and illicit or
deliberately unreported activities. The consistency
and completeness of such estimates depend on the
skill and methods of the compiling statisticians.
Rebasing national accounts
When countries rebase their national accounts, they
update the weights assigned to various components
to better reflect current patterns of production or
uses of output. The new base year should represent
normal operation of the economy—it should be a
year without major shocks or distortions. Some
developing countries have not rebased their national
accounts for many years. Using an old base year
can be misleading because implicit price and vol-
ume weights become progressively less relevant
and useful.
To obtain comparable series of constant price data,
the World Bank rescales GDP and value added by
industrial origin to a common reference year. This
year’s World Development Indicators continues to
use 2000 as the reference year. Because rescaling
changes the implicit weights used in forming regional
and income group aggregates, aggregate growth
rates in this year’s edition are not comparable with
those from earlier editions with different base years.
Rescaling may result in a discrepancy between
the rescaled GDP and the sum of the rescaled com-
ponents. Because allocating the discrepancy would
cause distortions in the growth rates, the discrep-
ancy is left unallocated. As a result, the weighted
average of the growth rates of the components gen-
erally will not equal the GDP growth rate.
Computing growth rates
Growth rates of GDP and its components are calcu-
lated using the least squares method and constant
price data in the local currency. Constant price U.S.
dollar series are used to calculate regional and
income group growth rates. Local currency series are
converted to constant U.S. dollars using an exchange
rate in the common reference year. The growth rates
in the table are average annual compound growth
rates. Methods of computing growth are described
in Statistical methods.
Changes in the System of National Accounts
World Development Indicators adopted the termi-
nology of the 1993 SNA in 2001. Although many
countries continue to compile their national accounts
according to the SNA version 3 (referred to as the
1968 SNA), more and more are adopting the 1993
SNA. Some low-income countries still use concepts
from the even older 1953 SNA guidelines, including
valuations such as factor cost, in describing major
economic aggregates. Countries that use the 1993
SNA are identified in Primary data documentation.
• Gross domestic product (GDP) at purchaser prices
is the sum of gross value added by all resident pro-
ducers in the economy plus any product taxes (less
subsidies) not included in the valuation of output. It
is calculated without deducting for depreciation of
fabricated capital assets or for depletion and degra-
dation of natural resources. Value added is the net
output of an industry after adding up all outputs and
subtracting intermediate inputs. The industrial origin
of value added is determined by the International
Standard Industrial Classifi cation (ISIC) revision
3. • Agriculture is the sum of gross output less
the value of intermediate input used in production
for industries classifi ed in ISIC divisions 1–5 and
includes forestry and fishing. • Industry is the sum
of gross output less the value of intermediate input
used in production for industries classifi ed in ISIC
divisions 10–45, which cover mining, manufactur-
ing (also reported separately), construction, electric-
ity, water, and gas. • Manufacturing is the sum of
gross output less the value of intermediate input
used in production for industries classifi ed in ISIC
divisions 15–37. • Services correspond to ISIC divi-
sions 50–99. This sector is derived as a residual
(from GDP less agriculture and industry) and may not
properly reflect the sum of services output, including
banking and financial services. For some countries
it includes product taxes (minus subsidies) and may
also include statistical discrepancies.
Data sources
Data on national accounts for most developing
countries are collected from national statistical
organizations and central banks by visiting and
resident World Bank missions. Data for high
income economies are from Organisation for
Economic Co-operation and Development (OECD)
data fi les. The United Nations Statistics Division
publishes detailed national accounts for UN mem-
ber countries in National Accounts Statistics: Main
Aggregates and Detailed Tables and publishes
updates in the Monthly Bulletin of Statistics.

2011 World Development Indicators198
Afghanistan .. 14,483 .. 33 .. 22 .. 13 .. 45
Albania 2,424 12,015 56 21 23 20 14 20 22 60
Algeria 41,764 140,577 11 12 50 55 12 6 39 34
Angolaa 5,040 75,493 7 10 66 59 4 6 26 31
Argentina 258,032 307,155 6 8 28 32 18 21 66 61
Armenia 1,468 8,714 42 21 32 35 25 16 26 45
Australia 371,091 924,843 3 3 29 29 15 10 68 68
Austria 238,314 381,084 3 2 31 29 20 19 67 69
Azerbaijan 3,052 43,019 27 8 34 60 13 4 39 32
Bangladesh 37,940 89,360 26 19 25 29 15 18 49 53
Belarus 13,973 49,037 17 10 37 42 31 30 46 48
Belgium 284,142 471,161 2 1 28 22 20 14 70 78
Benina 2,009 6,656 34 .. 15 .. 9 .. 51 ..
Bolivia 6,715 17,340 17 14 33 36 19 14 50 50
Bosnia and Herzegovina 1,867 17,042 21 8 26 28 11 13 54 64
Botswana 4,774 11,823 4 3 51 40 5 4 45 57
Brazil 768,951 1,594,490 6 6 28 25 19 16 67 69
Bulgaria 13,069 48,722 16 6 28 30 26 15 56 64
Burkina Faso 2,380 8,141 35 .. 21 .. 15 .. 43 ..
Burundi 1,000 1,325 48 .. 19 .. 9 .. 33 ..
Cambodia 3,441 10,447 50 35 15 23 10 15 36 42
Cameroon 8,733 22,186 24 19 31 31 22 17 45 50
Canada 590,517 1,336,068 3 .. 31 .. 18 .. 66 ..
Central African Republic 1,122 2,006 46 56 21 15 10 .. 33 30
Chad 1,446 6,839 36 14 14 49 11 7 51 38
Chile 71,349 163,669 9 3 35 42 18 13 55 55
Chinaa 728,007 4,985,461 20 10 47 46 34 34 33 43
Hong Kong SAR, China 144,230 210,568 .. .. 15 8 8 2 85 92
Colombia 92,507 234,045 15 7 32 34 16 14 53 58
Congo, Dem. Rep. 5,643 10,575 57 43 17 24 9 5 26 33
Congo, Rep.a 2,116 9,580 10 5 45 71 8 4 45 24
Costa Rica 11,722 29,240 14 7 30 27 22 19 57 66
Côte d’Ivoirea 11,000 23,304 25 24 21 25 15 18 55 50
Croatia 22,046 63,034 7 7 32 27 23 16 61 66
Cuba 30,428 62,705 9 5 23 20 15 10 68 75
Czech Republic 55,257 190,274 5 2 38 37 24 23 57 61
Denmark 181,984 309,596 3 1 25 22 17 13 71 77
Dominican Republica 16,358 46,788 10 6 36 32 26 24 54 61
Ecuador 20,206 57,249 .. 6 .. 23 .. 10 .. 71
Egypt, Arab Rep. 60,159 188,413 17 14 32 37 17 16 51 49
El Salvador 9,500 21,101 14 12 30 27 23 21 56 60
Eritrea 578 1,873 21 14 17 22 9 6 62 63
Estonia 4,353 19,084 6 3 33 29 21 17 61 68
Ethiopia 7,606 28,526 57 51 10 11 5 4 33 39
Finland 130,700 237,989 4 3 33 28 25 18 62 69
France 1,569,983 2,649,390 3 2 25 19 .. 11 72 79
Gabona 4,959 11,062 8 5 52 54 5 4 40 41
Gambia, The 382 733 30 27 13 15 6 5 57 57
Georgia 2,694 10,744 52 10 16 21 11 12 32 69
Germany 2,522,792 3,330,032 1 1 32 26 23 19 67 73
Ghana 6,457 26,169 43 32 27 19 10 7 31 49
Greece 131,718 329,924 9 3 21 18 .. 10 70 79
Guatemala 14,657 37,322 24 12 20 28 14 20 56 59
Guinea 3,694 4,103 19 17 29 53 4 5 52 30
Guinea-Bissau 254 837 55 55 12 13 8 10 33 32
Haiti 2,695 6,479 .. .. .. .. .. .. .. ..
Honduras 3,911 14,318 22 12 31 27 18 19 48 60
Gross domestic product Agriculture Industry Manufacturing Services
$ millions % of GDP % of GDP % of GDP % of GDP
1995 2009 1995 2009 1995 2009 1995 2009 1995 2009
Structure of output4.2

2011 World Development Indicators 199
ECONOMY
Hungary 44,656 128,964 7 4 32 29 24 22 61 66
India 356,299 1,377,265 26 18 28 27 18 15 46 55
Indonesiaa 202,132 540,274 17 16 42 49 24 27 41 35
Iran, Islamic Rep. 90,829 331,015 18 10 34 44 12 11 47 45
Iraq 10,114 65,837 9 .. 75 .. 1 .. 16 ..
Ireland 67,061 227,193 7 1 38 31 30 24 55 68
Israela 96,065 195,392 .. .. .. .. .. .. .. ..
Italy 1,126,041 2,112,780 3 2 30 25 22 16 66 73
Jamaica 5,813 12,070 9 6 37 22 16 9 54 72
Japan 5,264,380 5,068,996 2 1 34 28 23 20 64 71
Jordan 6,727 25,092 4 3 29 32 15 20 67 65
Kazakhstan 20,374 115,306 13 6 31 40 15 11 56 53
Kenya 9,046 29,376 31 23 16 15 10 9 53 62
Korea, Dem. Rep. .. .. .. .. .. .. .. .. .. ..
Korea, Rep. 517,118 832,512 6 3 42 37 28 28 52 61
Kosovo .. 5,387 .. 12 .. 20 .. 17 .. 68
Kuwaita 27,192 148,024 0 .. 55 .. 4 .. 45 ..
Kyrgyz Republic 1,661 4,578 44 29 20 19 9 13 37 51
Lao PDR 1,764 5,939 56 35 19 28 14 9 25 37
Latvia 5,236 26,195 9 3 30 20 21 10 61 77
Lebanon 11,719 34,528 8 5 25 17 14 9 68 78
Lesotho 814 1,579 19 8 43 34 17 17 38 58
Liberia 135 876 82 61 5 17 3 13 13 22
Libya 25,541 62,360 .. 2 .. 78 .. 4 .. 20
Lithuania 7,905 37,206 11 4 31 31 19 18 58 64
Macedonia, FYR 4,449 9,221 13 11 30 36 23 23 57 52
Madagascar 3,160 8,590 27 29 9 16 8 14 64 55
Malawi 1,397 4,727 30 31 20 16 16 10 50 53
Malaysiaa 88,832 193,093 13 10 41 44 26 25 46 46
Mali 2,466 8,996 50 37 19 24 8 3 32 ..
Mauritania 1,415 3,024 37 21 25 35 8 4 37 45
Mauritius 4,040 8,589 10 4 32 29 23 19 58 67
Mexico 286,698 874,810 6 4 28 35 21 17 66 61
Moldova 1,753 5,405 33 10 32 13 26 13 35 77
Mongolia 1,227 4,202 41 24 29 33 12 5 30 44
Morocco 32,986 91,375 15 16 34 29 19 16 51 55
Mozambique 2,247 9,790 35 31 15 24 8 14 51 45
Myanmara .. .. 60 .. 10 .. 7 .. 30 ..
Namibia 3,503 9,265 12 9 28 33 13 15 60 58
Nepal 4,401 12,531 42 34 23 16 10 7 35 50
Netherlands 418,969 792,128 3 2 27 24 17 13 69 74
New Zealand 62,795 126,679 7 .. 27 .. 18 .. 66 ..
Nicaragua 3,191 6,140 23 19 27 30 19 20 49 51
Nigera 1,881 5,383 40 .. 17 .. 6 .. 43 ..
Nigeria 28,109 173,004 .. 33 .. 41 .. .. .. 27
Norway 148,920 381,766 3 1 34 40 13 10 63 59
Omana 13,803 46,114 3 .. 46 .. 5 .. 51 ..
Pakistan 60,636 161,990 26 22 24 24 16 17 50 54
Panama 7,906 24,711 8 6 18 17 9 6 74 77
Papua New Guinea 4,636 7,893 35 36 34 45 8 6 31 20
Paraguaya 8,066 14,236 21 19 23 21 16 13 56 59
Peru 53,674 130,325 9 7 31 34 17 14 60 59
Philippinesa 74,120 161,196 22 15 32 30 23 20 46 55
Poland 139,062 430,076 8 4 35 30 21 16 57 66
Portugal 116,419 232,874 6 2 28 23 19 13 66 75
Puerto Ricoa 42,647 .. 1 .. 44 .. 42 .. 55 ..
Qatar 8,138 98,313 .. .. .. .. .. .. .. ..
Gross domestic product Agriculture Industry Manufacturing Services
$ millions % of GDP % of GDP % of GDP % of GDP
1995 2009 1995 2009 1995 2009 1995 2009 1995 2009
Structure of output 4.2

2011 World Development Indicators200
Romania 35,477 161,110 21 7 43 26 29 22 36 67
Russian Federation 395,528 1,231,893 7 5 37 33 .. 15 56 62
Rwandaa 1,293 5,216 44 34 16 15 10 6 40 51
Saudi Arabiaa 142,458 375,766 6 3 49 51 10 10 45 46
Senegal 4,879 12,822 21 17 24 22 17 13 55 62
Serbia 21,381 42,984 .. 13 .. 28 .. .. .. 59
Sierra Leone 871 1,942 43 51 39 22 9 .. 18 27
Singapore 84,291 182,232 .. .. 35 26 27 19 65 74
Slovak Republic 25,240 87,642 6 3 38 35 27 19 56 63
Slovenia 20,814 48,477 4 2 35 34 26 22 60 64
Somalia .. .. .. .. .. .. .. .. .. ..
South Africa 151,113 285,366 4 3 35 31 21 15 61 66
Spain 596,751 1,460,250 5 3 29 26 18 13 66 71
Sri Lankaa 13,030 41,979 23 13 27 30 16 18 50 58
Sudan 13,830 54,681 39 30 11 26 5 7 51 44
Swaziland 1,699 3,001 12 7 45 49 39 44 43 43
Sweden 253,680 406,072 3 2 30 25 22 16 66 73
Switzerland 315,940 491,924 2 1 30 27 20 19 68 72
Syrian Arab Republic 11,397 52,177 32 21 20 34 15 13 48 45
Tajikistan 1,232 4,978 38 22 39 24 28 11 22 54
Tanzaniab 5,255 21,368 47 29 15 24 7 10 38 47
Thailanda 168,019 263,772 10 12 41 43 30 34 50 45
Timor-Lestea .. 558 .. .. .. .. .. .. .. ..
Togoa 1,309 2,855 38 .. 22 .. 10 .. 40 ..
Trinidad and Tobago 5,329 21,204 2 0 47 52 9 6 51 47
Tunisiaa 18,031 39,561 11 8 29 30 19 17 59 62
Turkey 169,486 614,603 16 9 33 26 23 17 50 65
Turkmenistan 2,482 19,947 17 12 63 54 40 47 20 34
Uganda 5,756 16,043 49 25 14 26 7 8 36 50
Ukraine 48,214 113,545 15 8 43 29 35 18 42 62
United Arab Emirates 42,807 230,252 3 2 52 61 10 12 45 38
United Kingdom 1,157,119 2,174,530 2 1 31 21 21 11 67 78
United States 7,359,300 14,119,000 2 1 26 21 19 13 72 77
Uruguay 19,298 31,511 9 10 29 26 20 16 62 64
Uzbekistan 13,350 32,104 32 20 28 33 12 13 40 47
Venezuela, RB 74,889 326,133 6 .. 41 .. 15 .. 53 ..
Vietnama 20,736 97,180 27 21 29 40 15 20 44 39
West Bank and Gaza 3,220 .. .. .. .. .. .. .. .. ..
Yemen, Rep.a 4,236 26,365 20 .. 32 .. 14 .. 48 ..
Zambia 3,478 12,805 18 22 36 34 11 10 46 44
Zimbabwe 7,111 5,625 15 18 29 29 22 17 56 53
World 29,692,820 t 58,259,785 t 4 w 3 w 30 w 27 w 21 w 17 w 65 w 70 wLow income 153,755 432,171 37 26 20 24 11 12 43 50
Middle income 4,811,047 16,213,154 14 10 35 35 23 21 51 55
Lower middle income 1,992,261 8,887,269 21 13 39 39 26 26 40 48
Upper middle income 2,818,895 7,318,398 8 6 32 31 19 17 60 62
Low & middle income 4,965,895 16,657,552 15 10 34 35 22 21 51 55
East Asia & Pacifi c 1,312,902 6,353,790 19 11 44 45 31 32 36 43
Europe & Central Asia 763,913 2,591,705 14 8 35 30 22 17 51 62
Latin America & Carib. 1,770,557 4,017,912 7 6 29 31 19 17 64 63
Middle East & N. Africa 315,651 1,062,419 16 11 34 43 15 12 50 46
South Asia 476,175 1,700,339 26 18 27 27 17 15 46 55
Sub-Saharan Africa 327,608 945,923 18 13 29 30 16 13 53 57
High income 24,722,778 41,607,730 2 1 30 25 20 16 68 74
Euro area 7,286,803 12,465,331 3 2 29 24 21 15 68 74
a. Components are at producer prices. b. Covers mainland Tanzania only.
Gross domestic product Agriculture Industry Manufacturing Services
$ millions % of GDP % of GDP % of GDP % of GDP
1995 2009 1995 2009 1995 2009 1995 2009 1995 2009
Structure of output4.2

2011 World Development Indicators 201
ECONOMY
About the data Defi nitions
An economy’s gross domestic product (GDP) rep-
resents the sum of value added by all its produc-
ers. Value added is the value of the gross output of
producers less the value of intermediate goods and
services consumed in production, before accounting
for consumption of fi xed capital in production. The
United Nations System of National Accounts calls
for value added to be valued at either basic prices
(excluding net taxes on products) or producer prices
(including net taxes on products paid by producers
but excluding sales or value added taxes). Both valu-
ations exclude transport charges that are invoiced
separately by producers. Total GDP shown in the
table and elsewhere in this volume is measured at
purchaser prices. Value added by industry is normally
measured at basic prices. When value added is mea-
sured at producer prices, this is noted in Primary data
documentation and footnoted in the table.
While GDP estimates based on the production
approach are generally more reliable than estimates
compiled from the income or expenditure side, dif-
ferent countries use different defi nitions, methods,
and reporting standards. World Bank staff review the
quality of national accounts data and sometimes
make adjustments to improve consistency with
international guidelines. Nevertheless, signifi cant
discrepancies remain between international stan-
dards and actual practice. Many statistical offi ces,
especially those in developing countries, face severe
limitations in the resources, time, training, and bud-
gets required to produce reliable and comprehensive
series of national accounts statistics.
Data problems in measuring output
Among the diffi culties faced by compilers of national
accounts is the extent of unreported economic activ-
ity in the informal or secondary economy. In develop-
ing countries a large share of agricultural output is
either not exchanged (because it is consumed within
the household) or not exchanged for money.
Agricultural production often must be estimated
indirectly, using a combination of methods involv-
ing estimates of inputs, yields, and area under cul-
tivation. This approach sometimes leads to crude
approximations that can differ from the true values
over time and across crops for reasons other than
climate conditions or farming techniques. Similarly,
agricultural inputs that cannot easily be allocated to
specifi c outputs are frequently “netted out” using
equally crude and ad hoc approximations. For further
discussion of the measurement of agricultural pro-
duction, see About the data for table 3.3.
Ideally, industrial output should be measured
through regular censuses and surveys of fi rms.
But in most developing countries such surveys are
infrequent, so earlier survey results must be extrapo-
lated using an appropriate indicator. The choice of
sampling unit, which may be the enterprise (where
responses may be based on fi nancial records) or
the establishment (where production units may be
recorded separately), also affects the quality of
the data. Moreover, much industrial production is
organized in unincorporated or owner-operated ven-
tures that are not captured by surveys aimed at the
formal sector. Even in large industries, where regu-
lar surveys are more likely, evasion of excise and
other taxes and nondisclosure of income lower the
estimates of value added. Such problems become
more acute as countries move from state control of
industry to private enterprise, because new firms and
growing numbers of established firms fail to report.
In accordance with the System of National Accounts,
output should include all such unreported activity
as well as the value of illegal activities and other
unrecorded, informal, or small-scale operations.
Data on these activities need to be collected using
techniques other than conventional surveys of fi rms.
In industries dominated by large organizations
and enterprises, such as public utilities, data on
output, employment, and wages are usually read-
ily available and reasonably reliable. But in the
services industry the many self-employed workers
and one-person businesses are sometimes diffi cult
to locate, and they have little incentive to respond
to surveys, let alone to report their full earnings.
Compounding these problems are the many forms
of economic activity that go unrecorded, including
the work that women and children do for little or no
pay. For further discussion of the problems of using
national accounts data, see Srinivasan (1994) and
Heston (1994).
Dollar conversion
To produce national accounts aggregates that are
measured in the same standard monetary units,
the value of output must be converted to a single
common currency. The World Bank conventionally
uses the U.S. dollar and applies the average offi cial
exchange rate reported by the International Monetary
Fund for the year shown. An alternative conversion
factor is applied if the offi cial exchange rate is judged
to diverge by an exceptionally large margin from the
rate effectively applied to transactions in foreign cur-
rencies and traded products.
• Gross domestic product (GDP) at purchaser prices
is the sum of gross value added by all resident pro-
ducers in the economy plus any product taxes (less
subsidies) not included in the valuation of output.
It is calculated without deducting for depreciation
of fabricated assets or for depletion and degrada-
tion of natural resources. Value added is the net
output of an industry after adding up all outputs and
subtracting intermediate inputs. The industrial origin
of value added is determined by the International
Standard Industrial Classifi cation (ISIC) revision
3. • Agriculture is the sum of gross output less
the value of intermediate input used in production
for industries classifi ed in ISIC divisions 1–5 and
includes forestry and fi shing. • Industry is the sum
of gross output less the value of intermediate input
used in production for industries classifi ed in ISIC
divisions 10–45, which cover mining, manufactur-
ing (also reported separately), construction, electric-
ity, water, and gas. • Manufacturing is the sum of
gross output less the value of intermediate input
used in production for industries classifi ed in ISIC
divisions 15–37. • Services correspond to ISIC divi-
sions 50–99. This sector is derived as a residual
(from GDP less agriculture and industry) and may not
properly refl ect the sum of services output, including
banking and fi nancial services. For some countries
it includes product taxes (minus subsidies) and may
also include statistical discrepancies.
Structure of output 4.2
Data sources
Data on national accounts for most developing
countries are collected from national statistical
organizations and central banks by visiting and
resident World Bank missions. Data for high
income economies are from Organisation for
Economic Co-operation and Development (OECD)
data fi les. The United Nations Statistics Division
publishes detailed national accounts for UN mem-
ber countries in National Accounts Statistics: Main
Aggregates and Detailed Tables and publishes
updates in the Monthly Bulletin of Statistics.
2011 World Development Indicators202
Afghanistan .. 1,632 .. .. .. .. .. .. .. .. .. ..
Albania 268 1,995 20 17 27 22 3 3 5 17 46 41
Algeria 4,372 7,315 33 .. 8 .. .. .. 11 .. 48 ..
Angola 407 4,586 .. .. .. .. .. .. .. .. .. ..
Argentina 53,326 60,116 26 .. 8 .. 13 .. 15 .. 38 ..
Armenia 377 1,213 .. .. .. .. .. .. .. .. .. ..
Australia 51,505 95,726 .. 19 .. 3 .. 14 .. 7 .. 58
Austria 37,828 64,124 10 9 5 2 24 28 7 7 54 54
Azerbaijan 370 1,927 .. 18 .. 1 .. 9 .. 5 .. 66
Bangladesh 6,887 15,472 24 .. 40 .. 3 .. 11 .. 21 ..
Belarus 4,487 12,638 .. .. .. .. .. .. .. .. .. ..
Belgium 45,588 59,032 13 12 6 4 19 19 18 23 44 43
Benin 200 .. .. .. .. .. .. .. .. .. .. ..
Bolivia 1,189 2,014 35 .. 5 .. 0 .. 5 .. 55 ..
Bosnia and Herzegovina 497 1,816 .. .. .. .. .. .. .. .. .. ..
Botswana 253 475 23 22 8 5 15 .. 5 .. 69 73
Brazil 117,276 216,924 20 18 7 6 20 21 13 11 40 44
Bulgaria 2,180 6,424 22 16 13 12 18 14 9 7 39 50
Burkina Faso 387 .. .. .. .. .. .. .. .. .. .. ..
Burundi 64 .. .. .. .. .. .. .. .. .. .. ..
Cambodia 436 1,403 7 .. 87 .. 0 .. 0 .. 7 ..
Cameroon 1,843 3,328 35 .. 9 .. 1 .. 6 .. 49 ..
Canada 104,352 172,050 14 .. 4 .. 29 .. 9 .. 44 ..
Central African Republic 91 .. .. .. .. .. .. .. .. .. .. ..
Chad 188 381 .. .. .. .. .. .. .. .. .. ..
Chile 13,540 19,665 32 14 4 2 3 2 10 14 52 69
China 324,603 1,691,153 16 12 12 10 15 24 11 11 46 43
Hong Kong SAR, China 8,868 4,971 12 14 22 12 15 13 3 5 49 55
Colombia 13,770 30,690 32 27 10 9 5 6 17 13 36 45
Congo, Dem. Rep. 370 582 .. .. .. .. .. .. .. .. .. ..
Congo, Rep. 136 429 .. .. .. .. .. .. .. .. .. ..
Costa Rica 2,972 5,034 46 44 8 5 3 3 11 10 32 39
Côte d’Ivoire 2,499 4,187 42 .. 10 .. 2 .. 12 .. 34 ..
Croatia 4,163 8,789 .. .. .. .. .. .. .. .. .. ..
Cuba 3,103 4,955 .. .. .. .. .. .. .. .. .. ..
Czech Republic 14,416 39,662 13 9 6 3 23 29 6 6 52 53
Denmark 24,894 34,971 19 17 3 2 22 19 10 13 46 50
Dominican Republic 5,136 10,577 .. .. .. .. .. .. .. .. .. ..
Ecuador 2,912 5,316 22 30 3 4 2 3 3 5 69 58
Egypt, Arab Rep. 14,403 28,712 16 .. 16 .. 12 .. 21 .. 35 ..
El Salvador 2,569 4,319 29 .. 28 .. 2 .. 16 .. 25 ..
Eritrea 64 102 49 44 12 19 1 1 6 5 31 31
Estonia 870 2,393 17 12 15 4 10 10 4 4 53 69
Ethiopia 373 1,071 55 41 13 9 1 5 7 5 24 40
Finland 29,158 37,557 8 6 2 2 30 32 6 6 54 54
France 209,123 253,608 13 14 5 3 26 24 12 13 44 45
Gabon 252 479 .. .. .. .. .. .. .. .. .. ..
Gambia, The 22 32 .. .. .. .. .. .. .. .. .. ..
Georgia 307 1,073 37 34 1 2 12 6 7 8 43 50
Germany 449,216 567,902 8 8 3 2 35 36 10 10 44 45
Ghana 672 1,759 .. .. .. .. .. .. .. .. .. ..
Greece 12,338 29,718 24 22 12 8 11 10 10 6 43 54
Guatemala 2,631 6,937 .. .. .. .. .. .. .. .. .. ..
Guinea 132 201 .. .. .. .. .. .. .. .. .. ..
Guinea-Bissau 19 44 .. .. .. .. .. .. .. .. .. ..
Haiti .. .. .. .. .. .. .. .. .. .. .. ..
Honduras 826 2,470 42 .. 22 .. 1 .. 5 .. 30 ..
4.3 Structure of manufacturing
Manufacturing
value added
Food,
beverages,
and tobacco
Textiles and
clothing
Machinery
and transport
equipment
Chemicals Other
manufacturinga
$ millions % of total % of total % of total % of total % of total
1998 2009 1998 2007 1998 2007 1998 2007 1998 2007 1998 2007

2011 World Development Indicators 203
ECONOMY
Hungary 9,959 28,619 15 11 7 3 27 31 11 10 40 44
India 59,562 190,333 13 9 12 9 15 19 24 16 37 47
Indonesia 23,857 142,532 21 26 18 13 14 18 13 11 33 32
Iran, Islamic Rep. 13,607 29,832 13 10 8 4 16 24 13 13 49 50
Iraq 91 .. 31 .. 15 .. 2 .. 23 .. 29 ..
Ireland 26,279 48,709 17 18 2 0 16 16 38 33 28 33
Israel .. .. 12 10 6 3 24 22 12 20 46 44
Italy 236,315 306,459 9 9 13 10 23 23 8 7 47 51
Jamaica 914 973 48 .. 7 .. .. .. 19 .. 27 ..
Japan 868,624 970,204 11 11 4 2 33 37 10 11 42 39
Jordan 1,047 4,416 27 23 6 10 4 3 21 17 42 48
Kazakhstan 2,659 12,536 .. .. .. .. .. .. .. .. .. ..
Kenya 1,540 2,801 46 30 8 4 4 2 8 4 34 62
Korea, Dem. Rep. .. .. .. .. .. .. .. .. .. .. .. ..
Korea, Rep. 85,569 208,142 9 6 9 5 35 46 11 8 36 35
Kosovo .. 773 .. .. .. .. .. .. .. .. .. ..
Kuwait 1,037 .. 8 .. 5 .. 2 .. 3 .. 83 ..
Kyrgyz Republic 233 570 .. .. .. .. .. .. .. .. .. ..
Lao PDR 216 478 46 .. 22 .. 8 .. 3 .. 22 ..
Latvia 965 2,278 26 20 11 7 8 10 3 4 52 60
Lebanon 2,144 2,645 26 .. 10 .. 3 .. 6 .. 55 ..
Lesotho 140 243 .. .. .. .. .. .. .. .. .. ..
Liberia 17 105 .. .. .. .. .. .. .. .. .. ..
Libya .. 3,879 .. .. .. .. .. .. .. .. .. ..
Lithuania 1,807 7,562 27 23 18 9 12 10 3 9 40 48
Macedonia, FYR 645 1,816 31 18 21 17 9 4 8 6 31 55
Madagascar 399 1,115 31 0 33 30 .. 1 6 2 30 67
Malawi 216 447 44 .. 8 .. 5 .. 16 .. 28 ..
Malaysia 20,774 49,213 10 9 4 2 8 30 11 15 67 44
Mali 101 195 .. .. .. .. .. .. .. .. .. ..
Mauritania 100 115 .. .. .. .. .. .. .. .. .. ..
Mauritius 877 1,483 22 31 51 31 1 1 4 .. 26 37
Mexico 82,015 144,431 24 25 4 3 23 18 15 19 32 35
Moldova 238 568 .. 39 .. 15 .. 4 .. .. .. 42
Mongolia 46 176 53 38 33 17 0 1 2 3 12 41
Morocco 6,136 12,909 34 30 18 13 4 5 15 16 28 35
Mozambique 422 1,219 .. .. .. .. .. .. .. .. .. ..
Myanmar .. .. .. .. .. .. .. .. .. .. .. ..
Namibia 369 1,247 .. .. .. .. .. .. .. .. .. ..
Nepal 436 807 35 .. 34 .. 0 .. 6 .. 26 ..
Netherlands 58,120 89,029 18 18 2 2 15 19 13 14 51 47
New Zealand 8,495 17,968 30 27 .. 2 .. 13 .. .. 70 58
Nicaragua 538 1,086 .. .. .. .. .. .. .. .. .. ..
Niger 128 .. .. .. .. .. .. .. .. .. .. ..
Nigeria .. .. 30 .. 11 .. 7 .. 26 .. 26 ..
Norway 16,863 32,575 16 20 2 1 23 25 8 9 51 45
Oman 654 .. 17 8 7 0 2 1 7 12 67 79
Pakistan 9,131 26,290 23 22 26 29 5 8 16 14 30 26
Panama 1,135 1,490 52 .. 7 .. .. .. 7 .. 34 ..
Papua New Guinea 351 464 .. .. .. .. .. .. .. .. .. ..
Paraguay 1,239 1,850 .. .. .. .. .. .. .. .. .. ..
Peru 8,080 16,897 26 30 10 12 4 2 10 12 51 44
Philippines 14,254 32,889 35 24 7 6 21 25 10 8 28 38
Poland 30,022 61,948 25 16 7 4 16 20 7 8 45 52
Portugal 19,959 26,690 12 14 20 12 15 11 6 6 46 63
Puerto Rico 22,994 .. 10 9 4 1 5 9 62 62 20 20
Qatar .. .. 4 1 8 2 0 0 21 17 67 80
Structure of manufacturing 4.3Manufacturing
value added
Food,
beverages,
and tobacco
Textiles and
clothing
Machinery
and transport
equipment
Chemicals Other
manufacturinga
$ millions % of total % of total % of total % of total % of total
1998 2009 1998 2007 1998 2007 1998 2007 1998 2007 1998 2007
2011 World Development Indicators204
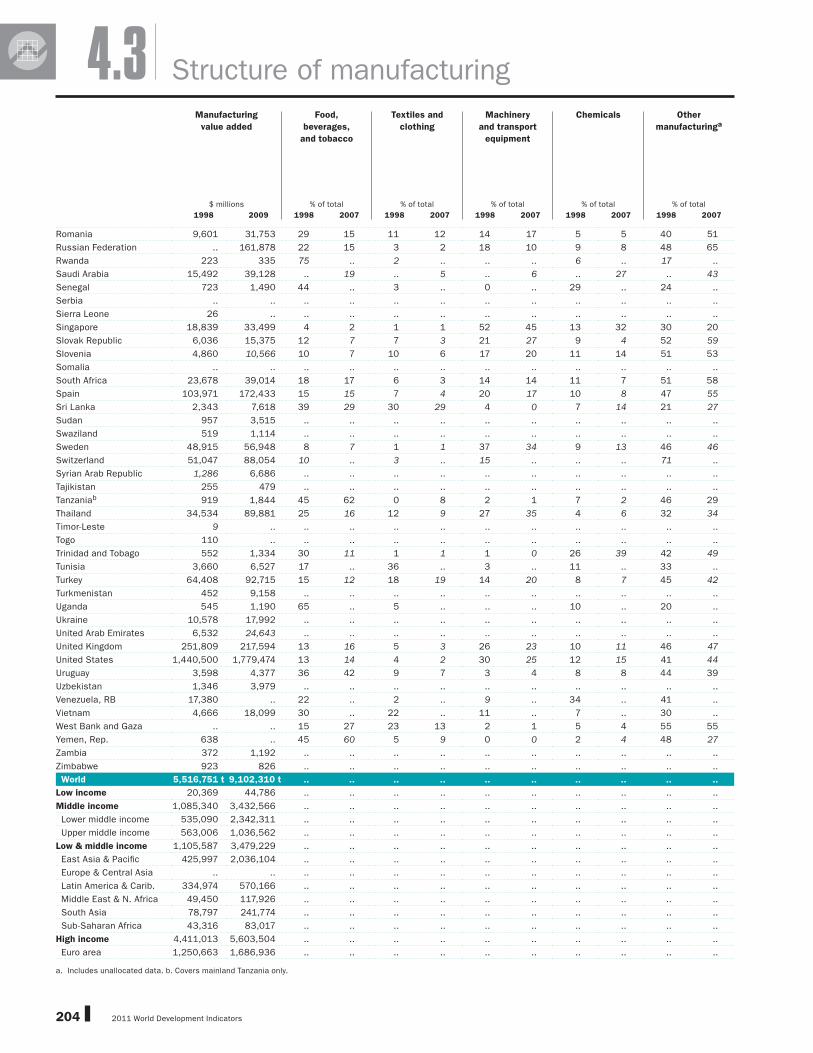
Romania 9,601 31,753 29 15 11 12 14 17 5 5 40 51
Russian Federation .. 161,878 22 15 3 2 18 10 9 8 48 65
Rwanda 223 335 75 .. 2 .. .. .. 6 .. 17 ..
Saudi Arabia 15,492 39,128 .. 19 .. 5 .. 6 .. 27 .. 43
Senegal 723 1,490 44 .. 3 .. 0 .. 29 .. 24 ..
Serbia .. .. .. .. .. .. .. .. .. .. .. ..
Sierra Leone 26 .. .. .. .. .. .. .. .. .. .. ..
Singapore 18,839 33,499 4 2 1 1 52 45 13 32 30 20
Slovak Republic 6,036 15,375 12 7 7 3 21 27 9 4 52 59
Slovenia 4,860 10,566 10 7 10 6 17 20 11 14 51 53
Somalia .. .. .. .. .. .. .. .. .. .. .. ..
South Africa 23,678 39,014 18 17 6 3 14 14 11 7 51 58
Spain 103,971 172,433 15 15 7 4 20 17 10 8 47 55
Sri Lanka 2,343 7,618 39 29 30 29 4 0 7 14 21 27
Sudan 957 3,515 .. .. .. .. .. .. .. .. .. ..
Swaziland 519 1,114 .. .. .. .. .. .. .. .. .. ..
Sweden 48,915 56,948 8 7 1 1 37 34 9 13 46 46
Switzerland 51,047 88,054 10 .. 3 .. 15 .. .. .. 71 ..
Syrian Arab Republic 1,286 6,686 .. .. .. .. .. .. .. .. .. ..
Tajikistan 255 479 .. .. .. .. .. .. .. .. .. ..
Tanzaniab 919 1,844 45 62 0 8 2 1 7 2 46 29
Thailand 34,534 89,881 25 16 12 9 27 35 4 6 32 34
Timor-Leste 9 .. .. .. .. .. .. .. .. .. .. ..
Togo 110 .. .. .. .. .. .. .. .. .. .. ..
Trinidad and Tobago 552 1,334 30 11 1 1 1 0 26 39 42 49
Tunisia 3,660 6,527 17 .. 36 .. 3 .. 11 .. 33 ..
Turkey 64,408 92,715 15 12 18 19 14 20 8 7 45 42
Turkmenistan 452 9,158 .. .. .. .. .. .. .. .. .. ..
Uganda 545 1,190 65 .. 5 .. .. .. 10 .. 20 ..
Ukraine 10,578 17,992 .. .. .. .. .. .. .. .. .. ..
United Arab Emirates 6,532 24,643 .. .. .. .. .. .. .. .. .. ..
United Kingdom 251,809 217,594 13 16 5 3 26 23 10 11 46 47
United States 1,440,500 1,779,474 13 14 4 2 30 25 12 15 41 44
Uruguay 3,598 4,377 36 42 9 7 3 4 8 8 44 39
Uzbekistan 1,346 3,979 .. .. .. .. .. .. .. .. .. ..
Venezuela, RB 17,380 .. 22 .. 2 .. 9 .. 34 .. 41 ..
Vietnam 4,666 18,099 30 .. 22 .. 11 .. 7 .. 30 ..
West Bank and Gaza .. .. 15 27 23 13 2 1 5 4 55 55
Yemen, Rep. 638 .. 45 60 5 9 0 0 2 4 48 27
Zambia 372 1,192 .. .. .. .. .. .. .. .. .. ..
Zimbabwe 923 826 .. .. .. .. .. .. .. .. .. ..
World 5,516,751 t 9,102,310 t .. .. .. .. .. .. .. .. .. ..
Low income 20,369 44,786 .. .. .. .. .. .. .. .. .. ..
Middle income 1,085,340 3,432,566 .. .. .. .. .. .. .. .. .. ..
Lower middle income 535,090 2,342,311 .. .. .. .. .. .. .. .. .. ..
Upper middle income 563,006 1,036,562 .. .. .. .. .. .. .. .. .. ..
Low & middle income 1,105,587 3,479,229 .. .. .. .. .. .. .. .. .. ..
East Asia & Pacifi c 425,997 2,036,104 .. .. .. .. .. .. .. .. .. ..
Europe & Central Asia .. .. .. .. .. .. .. .. .. .. .. ..
Latin America & Carib. 334,974 570,166 .. .. .. .. .. .. .. .. .. ..
Middle East & N. Africa 49,450 117,926 .. .. .. .. .. .. .. .. .. ..
South Asia 78,797 241,774 .. .. .. .. .. .. .. .. .. ..
Sub-Saharan Africa 43,316 83,017 .. .. .. .. .. .. .. .. .. ..
High income 4,411,013 5,603,504 .. .. .. .. .. .. .. .. .. ..
Euro area 1,250,663 1,686,936 .. .. .. .. .. .. .. .. .. ..
a. Includes unallocated data. b. Covers mainland Tanzania only.
Structure of manufacturing4.3Manufacturing
value added
Food,
beverages,
and tobacco
Textiles and
clothing
Machinery
and transport
equipment
Chemicals Other
manufacturinga
$ millions % of total % of total % of total % of total % of total
1998 2009 1998 2007 1998 2007 1998 2007 1998 2007 1998 2007

2011 World Development Indicators 205
ECONOMY
About the data Defi nitions
The data on the distribution of manufacturing value
added by industry are provided by the United Nations
Industrial Development Organization (UNIDO). UNIDO
obtains the data from a variety of national and inter-
national sources, including the United Nations Sta-
tistics Division, the World Bank, the Organisation for
Economic Co-operation and Development, and the
International Monetary Fund. To improve comparabil-
ity over time and across countries, UNIDO supple-
ments these data with information from industrial
censuses, statistics from national and international
organizations, unpublished data that it collects in the
fi eld, and estimates by the UNIDO Secretariat. Nev-
ertheless, coverage may be incomplete, particularly
for the informal sector. When direct information on
inputs and outputs is not available, estimates may
be used, which may result in errors in industry totals.
Moreover, countries use different reference periods
(calendar or fi scal year) and valuation methods (basic
or producer prices) to estimate value added. (See
About the data for table 4.2.)
The data on manufacturing value added in U.S. dol-
lars are from the World Bank’s national accounts fi les
and may differ from those UNIDO uses to calculate
shares of value added by industry, in part because
of differences in exchange rates. Thus value added
in a particular industry estimated by applying the
shares to total manufacturing value added will not
match those from UNIDO sources. Classifi cation of
manufacturing industries in the table accords with
the United Nations International Standard Industrial
Classifi cation (ISIC) revision 3. Editions of World
Development Indicators prior to 2008 used revision
2, fi rst published in 1948. Revision 3 was completed
in 1989, and many countries now use it. But revi-
sion 2 is still widely used for compiling cross-country
data. UNIDO has converted these data to accord with
revision 3. Concordances matching ISIC categories
to national classifi cation systems and to related
systems such as the Standard International Trade
Classifi cation are available.
In establishing classifi cations systems compil-
ers must defi ne both the types of activities to be
described and the units whose activities are to
be reported. There are many possibilities, and the
choices affect how the statistics can be interpreted
and how useful they are in analyzing economic
behavior. The ISIC emphasizes commonalities in the
production process and is explicitly not intended to
measure outputs (for which there is a newly devel-
oped Central Product Classifi cation). Nevertheless,
the ISIC views an activity as defi ned by “a process
resulting in a homogeneous set of products” (United
Nations 1990 [ISIC, series M, no. 4, rev. 3], p. 9).
Firms typically use multiple processes to produce
a product. For example, an automobile manufac-
turer engages in forging, welding, and painting as
well as advertising, accounting, and other service
activities. Collecting data at such a detailed level
is not practical, nor is it useful to record produc-
tion data at the highest level of a large, multiplant,
multiproduct fi rm. The ISIC has therefore adopted as
the definition of an establishment “an enterprise or
part of an enterprise which independently engages in
one, or predominantly one, kind of economic activity
at or from one location . . . for which data are avail-
able . . .” (United Nations 1990, p. 25). By design,
this definition matches the reporting unit required
for the production accounts of the United Nations
System of National Accounts. The ISIC system is
described in the United Nations’ International Stan-
dard Industrial Classifi cation of All Economic Activi-
ties, Third Revision (1990). The discussion of the ISIC
draws on Ryten (1998).
• Manufacturing value added is the sum of gross
output less the value of intermediate inputs used
in production for industries classifi ed in ISIC major
division D. • Food, beverages, and tobacco cor-
respond to ISIC divisions 15 and 16. • Textiles
and clothing correspond to ISIC divisions 17–19.
• Machinery and transport equipment correspond to
ISIC divisions 29, 30, 32, 34, and 35. • Chemicals
correspond to ISIC division 24. • Other manufactur-
ing is calculated as a residual. It covers wood and
related products (ISIC division 20), paper and related
products (ISIC divisions 21 and 22), petroleum and
related products (ISIC division 23), basic metals and
mineral products (ISIC division 27), fabricated metal
products and professional goods (ISIC division 28),
and other industries (ISIC divisions 25, 26, 31, 33,
36, and 37).
4.3Structure of manufacturing
Data sources
Value added in manufacturing (index, 1990 = 100)
0
100
200
300
400
500
600
20092005200019951990
East Asia & Pacific
South Asia
Middle East & North AfricaLatin America & Caribbean
Sub-Saharan Africa
Manufacturing continues to be the dominant sector in East Asia and Pacifi c, growing an average of about
10.5 percent a year between 1990 and 2009.
Source: World Development Indicators data fi les.
Manufacturing continues to show strong growth in East Asia and Pacifi c through 2009 4.3a
Data on manufacturing value added are from
the World Bank’s National Accounts fi les. Data
used to calculate shares of industry value added
are provided to the World Bank in electronic fi les
by UNIDO. The most recent published source is
UNIDO’s International Yearbook of Industrial Sta-
tistics 2010.

2011 World Development Indicators206
Afghanistan 166 560 .. 55 .. 8 .. .. .. 0 .. 18
Albania 202 1,088 11 6 9 3 3 12 12 10 65 70
Algeria 10,258 45,194 1 0 0 0 95 98 1 0 4 2
Angola 3,642 40,080 .. .. .. .. .. .. .. .. .. ..
Argentina 20,967 55,668 50 50 4 1 10 10 2 4 34 33
Armenia 271 698 11 20 5 1 1 0 26 47 54 33
Australia 53,111 154,234 22 14 8 2 19 32 18 27 30 19
Austria 57,738 137,672 4 7 3 2 1 3 3 3 88 81
Azerbaijan 635 21,097 4 4 8 0 66 93 1 0 20 3
Bangladesh 3,501 15,084 10 7 3 3 0 2 0 0 85 88
Belarus 4,803 21,283 .. 11 .. 2 .. 37 .. 1 .. 48
Belgium 178,265a 369,854 10a 10 1a 1 3a 7 4a 3 77a 77
Benin 420 1,000 14 .. 75 .. 5 .. 0 .. 6 ..
Bolivia 1,100 4,848 21 20 10 1 15 40 35 33 19 6
Bosnia and Herzegovina 152 3,929 .. 8 .. 6 .. 13 .. 9 .. 61
Botswana 2,142 3,458 .. 5 .. 0 .. 0 .. 16 .. 78
Brazil 46,506 152,995 29 34 5 4 1 9 10 12 54 39
Bulgaria 5,355 16,455 18 17 3 1 7 13 10 15 60 53
Burkina Faso 276 850 25 27 69 60 0 0 0 1 6 12
Burundi 105 64 91 67 4 5 0 2 1 5 3 21
Cambodia 855 4,200 .. 1 .. 1 .. 0 .. 3 .. 96
Cameroon 1,651 3,000 27 .. 28 .. 29 .. 8 .. 8 ..
Canada 192,197 316,713 8 11 9 4 9 25 7 7 63 50
Central African Republic 171 120 4 .. 20 .. 1 .. 30 .. 45 ..
Chad 243 2,800 .. .. .. .. .. .. .. .. .. ..
Chile 16,024 53,735 24 21 12 5 0 1 48 58 13 11
China† 148,780 1,201,534 8 3 2 0 4 2 2 1 84 94
Hong Kong SAR, Chinab 173,871 329,422 3 7 0 2 0 4 1 6 94 79
Colombia 10,056 32,853 31 16 5 4 28 51 1 2 35 28
Congo, Dem. Rep. 1,563 3,100 .. .. .. .. .. .. .. .. .. ..
Congo, Rep. 1,172 5,600 1 .. 8 .. 88 .. 0 .. 3 ..
Costa Rica 3,453 8,788 63 25 5 2 1 1 1 1 25 47
Côte d’Ivoire 3,806 8,900 63 48 20 6 10 30 0 0 7 15
Croatia 4,517 10,474 11 13 5 4 9 13 2 4 74 66
Cuba 1,600 3,109 .. .. .. .. .. .. .. .. .. ..
Czech Republic 21,335 113,437 6 5 4 1 4 4 3 2 82 87
Denmark 50,906 93,344 24 19 3 2 3 8 1 1 60 65
Dominican Republic 3,780 5,463 19 25 0 1 0 0 0 3 78 70
Ecuador 4,307 13,799 53 36 3 4 36 50 0 0 8 9
Egypt, Arab Rep. 3,450 23,062 10 11 6 2 37 44 6 6 40 37
El Salvador 1,652 3,797 57 23 1 1 0 3 3 1 39 72
Eritrea 86 15 .. .. .. .. .. .. .. .. .. ..
Estonia 1,840 9,031 16 10 10 4 6 16 3 2 65 62
Ethiopia 422 1,596 73 77 13 12 3 0 0 1 11 9
Finland 40,490 62,798 2 2 8 4 2 7 3 4 83 77
France 301,162 484,725 14 12 1 1 2 4 3 2 79 79
Gabon 2,713 5,100 0 .. 13 .. 83 .. 2 .. 2 ..
Gambia, The 16 15 60 53 1 1 0 0 1 7 36 39
Georgia 151 1,135 29 18 3 2 19 3 8 22 41 55
Germany 523,461 1,126,383 5 6 1 1 1 2 3 2 87 82
Ghana 1,724 5,500 58 63 15 9 5 2 9 6 13 19
Greece 11,054 20,093 30 25 4 3 7 9 7 7 50 54
Guatemala 2,155 7,214 65 44 4 3 2 4 0 5 28 43
Guinea 702 1,010 8 2 1 5 0 2 67 59 24 32
Guinea-Bissau 24 115 89 .. 11 .. 0 .. 0 .. 0 ..
Haiti 110 576 37 .. 0 .. 0 .. 0 .. 62 ..
Honduras 1,769 5,196 87 54 3 1 0 4 0 4 9 35†Data for Taiwan, China 113,047 203,675 3 1 2 1 1 6 1 2 93 89
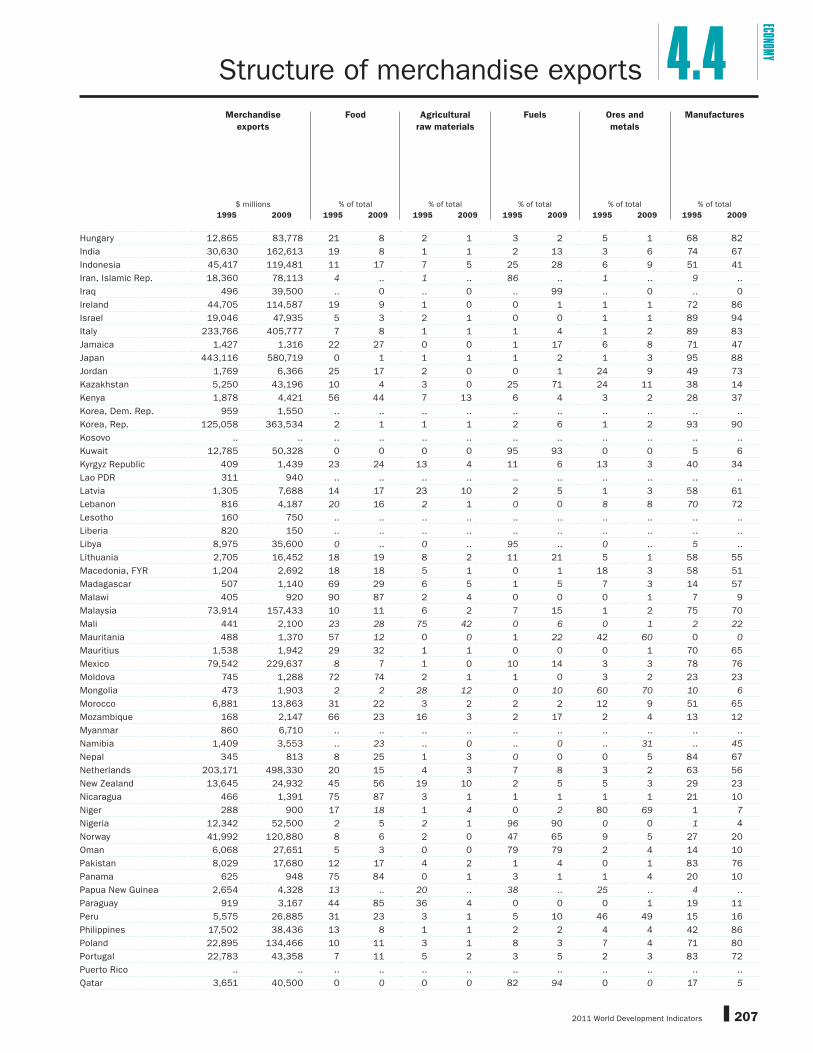
4.4 Structure of merchandise exports
Merchandise
exports
Food Agricultural
raw materials
Fuels Ores and
metals
Manufactures
$ millions % of total % of total % of total % of total % of total
1995 2009 1995 2009 1995 2009 1995 2009 1995 2009 1995 2009
2011 World Development Indicators 207
ECONOMY
Hungary 12,865 83,778 21 8 2 1 3 2 5 1 68 82
India 30,630 162,613 19 8 1 1 2 13 3 6 74 67
Indonesia 45,417 119,481 11 17 7 5 25 28 6 9 51 41
Iran, Islamic Rep. 18,360 78,113 4 .. 1 .. 86 .. 1 .. 9 ..
Iraq 496 39,500 .. 0 .. 0 .. 99 .. 0 .. 0
Ireland 44,705 114,587 19 9 1 0 0 1 1 1 72 86
Israel 19,046 47,935 5 3 2 1 0 0 1 1 89 94
Italy 233,766 405,777 7 8 1 1 1 4 1 2 89 83
Jamaica 1,427 1,316 22 27 0 0 1 17 6 8 71 47
Japan 443,116 580,719 0 1 1 1 1 2 1 3 95 88
Jordan 1,769 6,366 25 17 2 0 0 1 24 9 49 73
Kazakhstan 5,250 43,196 10 4 3 0 25 71 24 11 38 14
Kenya 1,878 4,421 56 44 7 13 6 4 3 2 28 37
Korea, Dem. Rep. 959 1,550 .. .. .. .. .. .. .. .. .. ..
Korea, Rep. 125,058 363,534 2 1 1 1 2 6 1 2 93 90
Kosovo .. .. .. .. .. .. .. .. .. .. .. ..
Kuwait 12,785 50,328 0 0 0 0 95 93 0 0 5 6
Kyrgyz Republic 409 1,439 23 24 13 4 11 6 13 3 40 34
Lao PDR 311 940 .. .. .. .. .. .. .. .. .. ..
Latvia 1,305 7,688 14 17 23 10 2 5 1 3 58 61
Lebanon 816 4,187 20 16 2 1 0 0 8 8 70 72
Lesotho 160 750 .. .. .. .. .. .. .. .. .. ..
Liberia 820 150 .. .. .. .. .. .. .. .. .. ..
Libya 8,975 35,600 0 .. 0 .. 95 .. 0 .. 5 ..
Lithuania 2,705 16,452 18 19 8 2 11 21 5 1 58 55
Macedonia, FYR 1,204 2,692 18 18 5 1 0 1 18 3 58 51
Madagascar 507 1,140 69 29 6 5 1 5 7 3 14 57
Malawi 405 920 90 87 2 4 0 0 0 1 7 9
Malaysia 73,914 157,433 10 11 6 2 7 15 1 2 75 70
Mali 441 2,100 23 28 75 42 0 6 0 1 2 22
Mauritania 488 1,370 57 12 0 0 1 22 42 60 0 0
Mauritius 1,538 1,942 29 32 1 1 0 0 0 1 70 65
Mexico 79,542 229,637 8 7 1 0 10 14 3 3 78 76
Moldova 745 1,288 72 74 2 1 1 0 3 2 23 23
Mongolia 473 1,903 2 2 28 12 0 10 60 70 10 6
Morocco 6,881 13,863 31 22 3 2 2 2 12 9 51 65
Mozambique 168 2,147 66 23 16 3 2 17 2 4 13 12
Myanmar 860 6,710 .. .. .. .. .. .. .. .. .. ..
Namibia 1,409 3,553 .. 23 .. 0 .. 0 .. 31 .. 45
Nepal 345 813 8 25 1 3 0 0 0 5 84 67
Netherlands 203,171 498,330 20 15 4 3 7 8 3 2 63 56
New Zealand 13,645 24,932 45 56 19 10 2 5 5 3 29 23
Nicaragua 466 1,391 75 87 3 1 1 1 1 1 21 10
Niger 288 900 17 18 1 4 0 2 80 69 1 7
Nigeria 12,342 52,500 2 5 2 1 96 90 0 0 1 4
Norway 41,992 120,880 8 6 2 0 47 65 9 5 27 20
Oman 6,068 27,651 5 3 0 0 79 79 2 4 14 10
Pakistan 8,029 17,680 12 17 4 2 1 4 0 1 83 76
Panama 625 948 75 84 0 1 3 1 1 4 20 10
Papua New Guinea 2,654 4,328 13 .. 20 .. 38 .. 25 .. 4 ..
Paraguay 919 3,167 44 85 36 4 0 0 0 1 19 11
Peru 5,575 26,885 31 23 3 1 5 10 46 49 15 16
Philippines 17,502 38,436 13 8 1 1 2 2 4 4 42 86
Poland 22,895 134,466 10 11 3 1 8 3 7 4 71 80
Portugal 22,783 43,358 7 11 5 2 3 5 2 3 83 72
Puerto Rico .. .. .. .. .. .. .. .. .. .. .. ..
Qatar 3,651 40,500 0 0 0 0 82 94 0 0 17 5
4.4Structure of merchandise exports
Merchandise
exports
Food Agricultural
raw materials
Fuels Ores and
metals
Manufactures
$ millions % of total % of total % of total % of total % of total
1995 2009 1995 2009 1995 2009 1995 2009 1995 2009 1995 2009
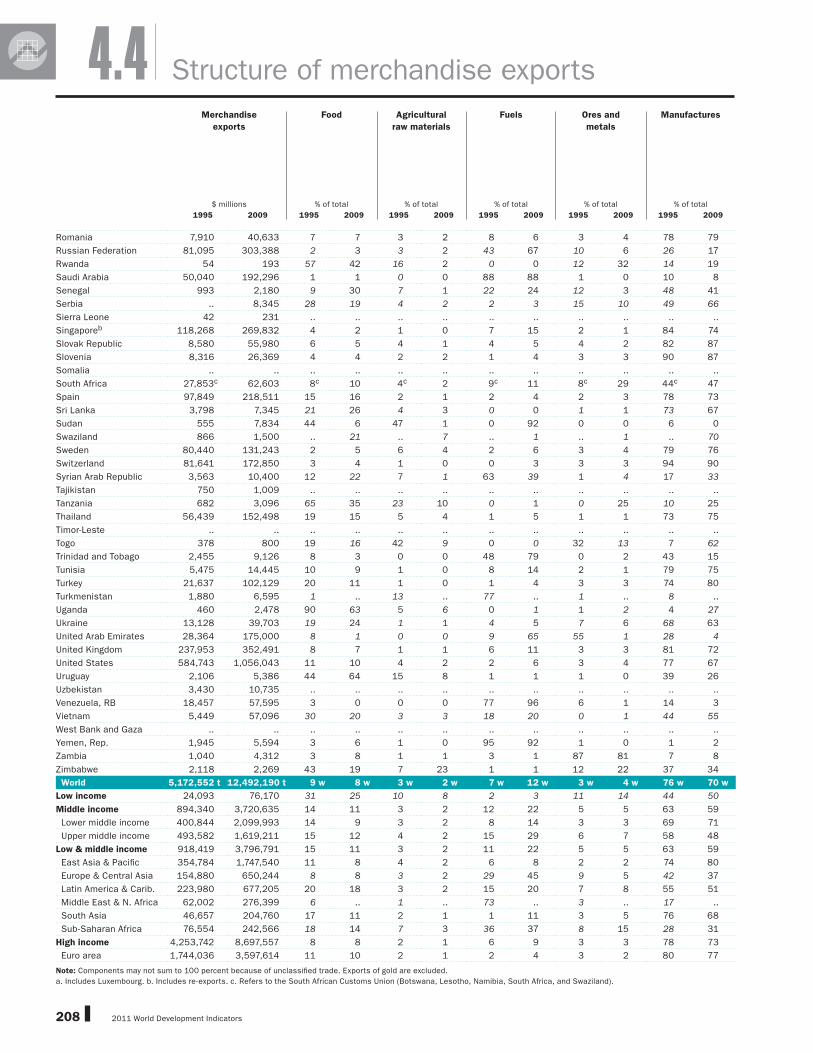
2011 World Development Indicators208
Romania 7,910 40,633 7 7 3 2 8 6 3 4 78 79
Russian Federation 81,095 303,388 2 3 3 2 43 67 10 6 26 17
Rwanda 54 193 57 42 16 2 0 0 12 32 14 19
Saudi Arabia 50,040 192,296 1 1 0 0 88 88 1 0 10 8
Senegal 993 2,180 9 30 7 1 22 24 12 3 48 41
Serbia .. 8,345 28 19 4 2 2 3 15 10 49 66
Sierra Leone 42 231 .. .. .. .. .. .. .. .. .. ..
Singaporeb 118,268 269,832 4 2 1 0 7 15 2 1 84 74
Slovak Republic 8,580 55,980 6 5 4 1 4 5 4 2 82 87
Slovenia 8,316 26,369 4 4 2 2 1 4 3 3 90 87
Somalia .. .. .. .. .. .. .. .. .. .. .. ..
South Africa 27,853c 62,603 8c 10 4c 2 9c 11 8c 29 44c 47
Spain 97,849 218,511 15 16 2 1 2 4 2 3 78 73
Sri Lanka 3,798 7,345 21 26 4 3 0 0 1 1 73 67
Sudan 555 7,834 44 6 47 1 0 92 0 0 6 0
Swaziland 866 1,500 .. 21 .. 7 .. 1 .. 1 .. 70
Sweden 80,440 131,243 2 5 6 4 2 6 3 4 79 76
Switzerland 81,641 172,850 3 4 1 0 0 3 3 3 94 90
Syrian Arab Republic 3,563 10,400 12 22 7 1 63 39 1 4 17 33
Tajikistan 750 1,009 .. .. .. .. .. .. .. .. .. ..
Tanzania 682 3,096 65 35 23 10 0 1 0 25 10 25
Thailand 56,439 152,498 19 15 5 4 1 5 1 1 73 75
Timor-Leste .. .. .. .. .. .. .. .. .. .. .. ..
Togo 378 800 19 16 42 9 0 0 32 13 7 62
Trinidad and Tobago 2,455 9,126 8 3 0 0 48 79 0 2 43 15
Tunisia 5,475 14,445 10 9 1 0 8 14 2 1 79 75
Turkey 21,637 102,129 20 11 1 0 1 4 3 3 74 80
Turkmenistan 1,880 6,595 1 .. 13 .. 77 .. 1 .. 8 ..
Uganda 460 2,478 90 63 5 6 0 1 1 2 4 27
Ukraine 13,128 39,703 19 24 1 1 4 5 7 6 68 63
United Arab Emirates 28,364 175,000 8 1 0 0 9 65 55 1 28 4
United Kingdom 237,953 352,491 8 7 1 1 6 11 3 3 81 72
United States 584,743 1,056,043 11 10 4 2 2 6 3 4 77 67
Uruguay 2,106 5,386 44 64 15 8 1 1 1 0 39 26
Uzbekistan 3,430 10,735 .. .. .. .. .. .. .. .. .. ..
Venezuela, RB 18,457 57,595 3 0 0 0 77 96 6 1 14 3
Vietnam 5,449 57,096 30 20 3 3 18 20 0 1 44 55
West Bank and Gaza .. .. .. .. .. .. .. .. .. .. .. ..
Yemen, Rep. 1,945 5,594 3 6 1 0 95 92 1 0 1 2
Zambia 1,040 4,312 3 8 1 1 3 1 87 81 7 8
Zimbabwe 2,118 2,269 43 19 7 23 1 1 12 22 37 34
World 5,172,552 t 12,492,190 t 9 w 8 w 3 w 2 w 7 w 12 w 3 w 4 w 76 w 70 w
Low income 24,093 76,170 31 25 10 8 2 3 11 14 44 50
Middle income 894,340 3,720,635 14 11 3 2 12 22 5 5 63 59
Lower middle income 400,844 2,099,993 14 9 3 2 8 14 3 3 69 71
Upper middle income 493,582 1,619,211 15 12 4 2 15 29 6 7 58 48
Low & middle income 918,419 3,796,791 15 11 3 2 11 22 5 5 63 59
East Asia & Pacifi c 354,784 1,747,540 11 8 4 2 6 8 2 2 74 80
Europe & Central Asia 154,880 650,244 8 8 3 2 29 45 9 5 42 37
Latin America & Carib. 223,980 677,205 20 18 3 2 15 20 7 8 55 51
Middle East & N. Africa 62,002 276,399 6 .. 1 .. 73 .. 3 .. 17 ..
South Asia 46,657 204,760 17 11 2 1 1 11 3 5 76 68
Sub-Saharan Africa 76,554 242,566 18 14 7 3 36 37 8 15 28 31
High income 4,253,742 8,697,557 8 8 2 1 6 9 3 3 78 73
Euro area 1,744,036 3,597,614 11 10 2 1 2 4 3 2 80 77
Note: Components may not sum to 100 percent because of unclassifi ed trade. Exports of gold are excluded.
a. Includes Luxembourg. b. Includes re-exports. c. Refers to the South African Customs Union (Botswana, Lesotho, Namibia, South Africa, and Swaziland).
Structure of merchandise exports4.4Merchandise
exports
Food Agricultural
raw materials
Fuels Ores and
metals
Manufactures
$ millions % of total % of total % of total % of total % of total
1995 2009 1995 2009 1995 2009 1995 2009 1995 2009 1995 2009

2011 World Development Indicators 209
ECONOMY
About the data
Data on merchandise trade are from customs
reports of goods moving into or out of an economy
or from reports of fi nancial transactions related to
merchandise trade recorded in the balance of pay-
ments. Because of differences in timing and defi -
nitions, trade fl ow estimates from customs reports
and balance of payments may differ. Several inter-
national agencies process trade data, each correct-
ing unreported or misreported data, leading to other
differences.
The most detailed source of data on international
trade in goods is the United Nations Statistics Divi-
sion’s Commodity Trade (Comtrade) database. The
International Monetary Fund (IMF) also collects
customs-based data on trade in goods. Exports are
recorded as the cost of the goods delivered to the
frontier of the exporting country for shipment—the
free on board (f.o.b.) value. Many countries report
trade data in U.S. dollars. When countries report in
local currency, the United Nations Statistics Division
applies the average offi cial exchange rate to the U.S.
dollar for the period shown.
Countries may report trade according to the gen-
eral or special system of trade. Under the general
system exports comprise outward-moving goods that
are (a) goods wholly or partly produced in the country;
(b) foreign goods, neither transformed nor declared
for domestic consumption in the country, that move
outward from customs storage; and (c) goods previ-
ously included as imports for domestic consumption
but subsequently exported without transformation.
Under the special system exports comprise cat-
egories a and c. In some compilations categories
b and c are classifi ed as re-exports. Because of dif-
ferences in reporting practices, data on exports may
not be fully comparable across economies.
The data on total exports of goods (merchandise)
are from the World Trade Organization (WTO), which
obtains data from national statistical offi ces and the
IMF’s International Financial Statistics, supplemented
by the Comtrade database and publications or data-
bases of regional organizations, specialized agen-
cies, economic groups, and private sources (such as
Eurostat, the Food and Agriculture Organization, and
country reports of the Economist Intelligence Unit).
Country websites and email contact have improved
collection of up-to-date statistics, reducing the pro-
portion of estimates. The WTO database now covers
most major traders in Africa, Asia, and Latin America,
which together with high-income countries account
for nearly 95 percent of world trade. Reliability of
data for countries in Europe and Central Asia has
also improved.
Export shares by major commodity group are from
Comtrade. The values of total exports reported
here have not been fully reconciled with the esti-
mates from the national accounts or the balance
of payments.
The classifi cation of commodity groups is based
on the Standard International Trade Classifi cation
(SITC) revision 3. Previous editions contained data
based on the SITC revision 1. Data for earlier years in
previous editions may differ because of this change
in methodology. Concordance tables are available
to convert data reported in one system to another.
• Merchandise exports are the f.o.b. value of goods
provided to the rest of the world. • Food corresponds
to the commodities in SITC sections 0 (food and live
animals), 1 (beverages and tobacco), and 4 (animal
and vegetable oils and fats) and SITC division 22
(oil seeds, oil nuts, and oil kernels). • Agricultural
raw materials correspond to SITC section 2 (crude
materials except fuels), excluding divisions 22, 27
(crude fertilizers and minerals excluding coal, petro-
leum, and precious stones), and 28 (metalliferous
ores and scrap). • Fuels correspond to SITC section
3 (mineral fuels). • Ores and metals correspond to
the commodities in SITC divisions 27, 28, and 68
(nonferrous metals). • Manufactures correspond to
the commodities in SITC sections 5 (chemicals), 6
(basic manufactures), 7 (machinery and transport
equipment), and 8 (miscellaneous manufactured
goods), excluding division 68.
4.4Structure of merchandise exports
Defi nitions
Middle East & N. Africa 1%
Highincome
82%
1995($5.2 trillion)
2009($12.5 trillion)
Highincome
70%East Asia & Pacific 14%
Europe & Central Asia 5%
Latin America & Caribbean 5%
Middle East & N. Africa 2%South Asia 2%
Sub-Saharan Africa 2%
Latin America & Caribbean 4%
South Asia 1%Sub-Saharan Africa 2%
Europe & Central Asia 3%
East Asia & Pacific 7%
Developing economies’ share of world merchandise exports increased 12 percentage points from
1995 to 2009. East Asia and the Pacifi c was the biggest gainer, capturing an additional 7 per-
centage points. All other developing country regions also increased their share in world trade.
Source: World Development Indicators data fi les and World Trade Organization.
Developing economies’ share of world merchandise exports continues to expand 4.4a
Data sources
Data on merchandise exports are from the WTO.
Data on shares of exports by major commodity
group are from Comtrade. The WTO publishes data
on world trade in its Annual Report. The IMF pub-
lishes estimates of total exports of goods in its
International Financial Statistics and Direction of
Trade Statistics, as does the United Nations Sta-
tistics Division in its Monthly Bulletin of Statistics.
And the United Nations Conference on Trade and
Development publishes data on the structure of
exports in its Handbook of Statistics. Tariff line
records of exports are compiled in the United
Nations Statistics Division’s Comtrade database.
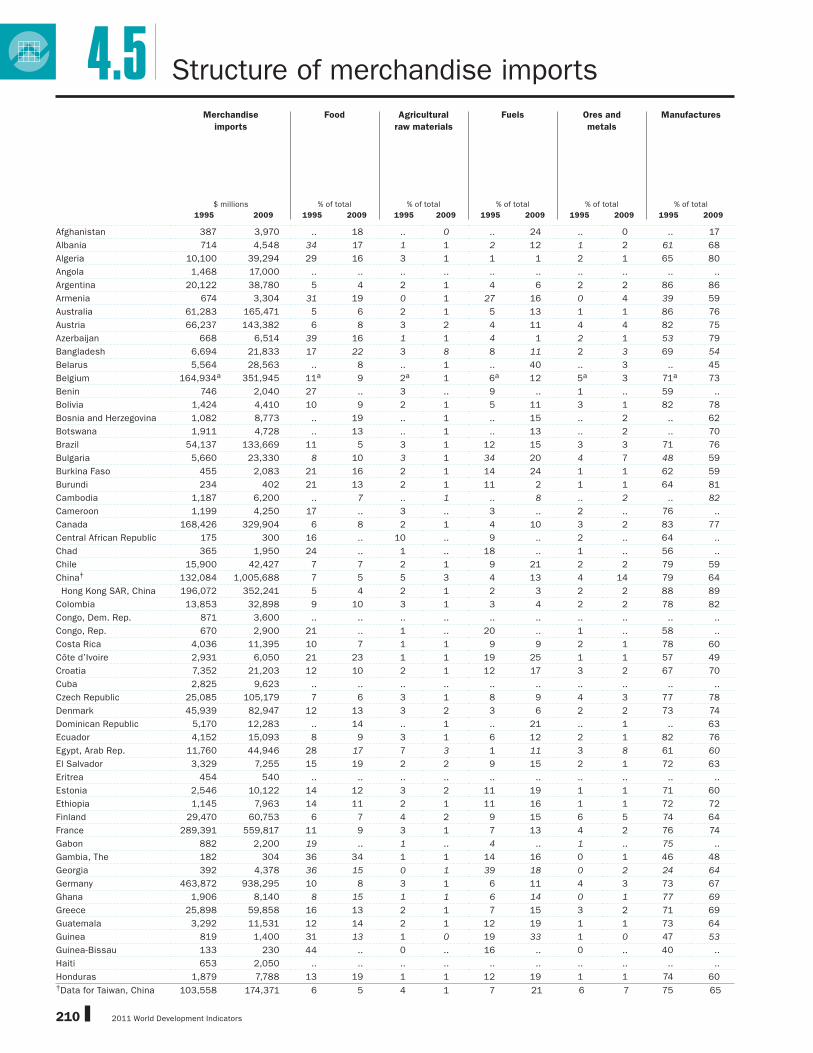
2011 World Development Indicators210
Afghanistan 387 3,970 .. 18 .. 0 .. 24 .. 0 .. 17
Albania 714 4,548 34 17 1 1 2 12 1 2 61 68
Algeria 10,100 39,294 29 16 3 1 1 1 2 1 65 80
Angola 1,468 17,000 .. .. .. .. .. .. .. .. .. ..
Argentina 20,122 38,780 5 4 2 1 4 6 2 2 86 86
Armenia 674 3,304 31 19 0 1 27 16 0 4 39 59
Australia 61,283 165,471 5 6 2 1 5 13 1 1 86 76
Austria 66,237 143,382 6 8 3 2 4 11 4 4 82 75
Azerbaijan 668 6,514 39 16 1 1 4 1 2 1 53 79
Bangladesh 6,694 21,833 17 22 3 8 8 11 2 3 69 54
Belarus 5,564 28,563 .. 8 .. 1 .. 40 .. 3 .. 45
Belgium 164,934a 351,945 11a 9 2a 1 6a 12 5a 3 71a 73
Benin 746 2,040 27 .. 3 .. 9 .. 1 .. 59 ..
Bolivia 1,424 4,410 10 9 2 1 5 11 3 1 82 78
Bosnia and Herzegovina 1,082 8,773 .. 19 .. 1 .. 15 .. 2 .. 62
Botswana 1,911 4,728 .. 13 .. 1 .. 13 .. 2 .. 70
Brazil 54,137 133,669 11 5 3 1 12 15 3 3 71 76
Bulgaria 5,660 23,330 8 10 3 1 34 20 4 7 48 59
Burkina Faso 455 2,083 21 16 2 1 14 24 1 1 62 59
Burundi 234 402 21 13 2 1 11 2 1 1 64 81
Cambodia 1,187 6,200 .. 7 .. 1 .. 8 .. 2 .. 82
Cameroon 1,199 4,250 17 .. 3 .. 3 .. 2 .. 76 ..
Canada 168,426 329,904 6 8 2 1 4 10 3 2 83 77
Central African Republic 175 300 16 .. 10 .. 9 .. 2 .. 64 ..
Chad 365 1,950 24 .. 1 .. 18 .. 1 .. 56 ..
Chile 15,900 42,427 7 7 2 1 9 21 2 2 79 59
China† 132,084 1,005,688 7 5 5 3 4 13 4 14 79 64
Hong Kong SAR, China 196,072 352,241 5 4 2 1 2 3 2 2 88 89
Colombia 13,853 32,898 9 10 3 1 3 4 2 2 78 82
Congo, Dem. Rep. 871 3,600 .. .. .. .. .. .. .. .. .. ..
Congo, Rep. 670 2,900 21 .. 1 .. 20 .. 1 .. 58 ..
Costa Rica 4,036 11,395 10 7 1 1 9 9 2 1 78 60
Côte d’Ivoire 2,931 6,050 21 23 1 1 19 25 1 1 57 49
Croatia 7,352 21,203 12 10 2 1 12 17 3 2 67 70
Cuba 2,825 9,623 .. .. .. .. .. .. .. .. .. ..
Czech Republic 25,085 105,179 7 6 3 1 8 9 4 3 77 78
Denmark 45,939 82,947 12 13 3 2 3 6 2 2 73 74
Dominican Republic 5,170 12,283 .. 14 .. 1 .. 21 .. 1 .. 63
Ecuador 4,152 15,093 8 9 3 1 6 12 2 1 82 76
Egypt, Arab Rep. 11,760 44,946 28 17 7 3 1 11 3 8 61 60
El Salvador 3,329 7,255 15 19 2 2 9 15 2 1 72 63
Eritrea 454 540 .. .. .. .. .. .. .. .. .. ..
Estonia 2,546 10,122 14 12 3 2 11 19 1 1 71 60
Ethiopia 1,145 7,963 14 11 2 1 11 16 1 1 72 72
Finland 29,470 60,753 6 7 4 2 9 15 6 5 74 64
France 289,391 559,817 11 9 3 1 7 13 4 2 76 74
Gabon 882 2,200 19 .. 1 .. 4 .. 1 .. 75 ..
Gambia, The 182 304 36 34 1 1 14 16 0 1 46 48
Georgia 392 4,378 36 15 0 1 39 18 0 2 24 64
Germany 463,872 938,295 10 8 3 1 6 11 4 3 73 67
Ghana 1,906 8,140 8 15 1 1 6 14 0 1 77 69
Greece 25,898 59,858 16 13 2 1 7 15 3 2 71 69
Guatemala 3,292 11,531 12 14 2 1 12 19 1 1 73 64
Guinea 819 1,400 31 13 1 0 19 33 1 0 47 53
Guinea-Bissau 133 230 44 .. 0 .. 16 .. 0 .. 40 ..
Haiti 653 2,050 .. .. .. .. .. .. .. .. .. ..
Honduras 1,879 7,788 13 19 1 1 12 19 1 1 74 60†Data for Taiwan, China 103,558 174,371 6 5 4 1 7 21 6 7 75 65
4.5 Structure of merchandise imports
Merchandise
imports
Food Agricultural
raw materials
Fuels Ores and
metals
Manufactures
$ millions % of total % of total % of total % of total % of total
1995 2009 1995 2009 1995 2009 1995 2009 1995 2009 1995 2009

2011 World Development Indicators 211
ECONOMY
Hungary 15,465 78,175 6 5 3 1 12 8 4 2 75 72
India 34,707 249,590 4 4 4 2 24 34 7 6 54 52
Indonesia 40,630 91,749 9 9 6 3 8 20 4 3 73 65
Iran, Islamic Rep. 13,882 50,375 21 .. 2 .. 2 .. 3 .. 71 ..
Iraq 665 37,000 .. .. .. .. .. .. .. .. .. ..
Ireland 32,340 62,507 8 12 1 1 3 10 2 1 76 68
Israel 29,578 49,278 7 8 2 1 6 17 2 2 82 72
Italy 205,990 412,721 12 10 6 2 7 18 5 3 68 65
Jamaica 2,818 5,064 14 18 2 1 13 28 1 0 68 51
Japan 335,882 551,960 16 10 6 1 16 28 7 6 54 52
Jordan 3,697 14,075 21 17 2 1 13 18 3 2 61 60
Kazakhstan 3,807 28,409 10 9 2 1 25 10 5 1 59 80
Kenya 2,991 10,207 10 15 2 1 15 21 2 2 71 60
Korea, Dem. Rep. 1,380 2,080 .. .. .. .. .. .. .. .. .. ..
Korea, Rep. 135,119 323,085 6 5 6 2 14 28 6 7 68 58
Kosovo .. .. .. .. .. .. .. .. .. .. .. ..
Kuwait 7,790 17,920 16 15 1 1 1 1 2 3 81 81
Kyrgyz Republic 522 3,037 18 17 3 1 36 4 3 1 40 50
Lao PDR 589 1,260 .. .. .. .. .. .. .. .. .. ..
Latvia 1,815 9,765 10 17 2 1 21 16 1 2 66 56
Lebanon 7,278 16,574 21 15 2 1 9 21 2 2 66 61
Lesotho 1,107 1,950 .. .. .. .. .. .. .. .. .. ..
Liberia 510 552 .. .. .. .. .. .. .. .. .. ..
Libya 5,392 10,150 23 .. 1 .. 0 .. 1 .. 75 ..
Lithuania 3,650 18,234 13 14 4 2 19 28 4 2 58 53
Macedonia, FYR 1,719 5,043 17 13 3 1 12 5 3 1 64 62
Madagascar 628 3,250 16 11 2 1 14 10 1 0 65 78
Malawi 475 1,700 14 13 1 1 11 10 1 1 73 74
Malaysia 77,691 123,832 5 8 1 2 2 8 3 4 86 76
Mali 772 2,644 20 12 1 0 16 21 1 1 62 65
Mauritania 431 1,430 24 28 1 1 22 35 0 0 53 36
Mauritius 1,976 3,728 17 22 3 2 7 16 1 1 72 59
Mexico 74,427 241,515 6 7 2 1 2 7 2 2 80 80
Moldova 840 3,278 8 15 3 1 46 22 2 1 42 61
Mongolia 415 2,131 14 12 1 0 19 27 1 1 65 60
Morocco 10,023 32,892 20 11 6 2 14 21 4 2 56 63
Mozambique 704 3,764 22 15 3 1 10 15 1 0 62 55
Myanmar 1,348 4,316 .. .. .. .. .. .. .. .. .. ..
Namibia 1,616 5,120 .. 14 .. 1 .. 14 .. 1 .. 70
Nepal 1,333 4,392 12 15 3 2 12 17 3 3 46 62
Netherlands 185,232 445,496 14 11 2 1 8 13 3 2 72 58
New Zealand 13,957 25,545 7 11 1 1 5 15 3 1 83 72
Nicaragua 975 3,477 18 18 1 1 18 22 1 0 63 59
Niger 374 1,500 32 25 1 5 13 17 3 2 51 52
Nigeria 8,222 39,000 18 12 1 1 1 1 2 2 77 84
Norway 32,968 69,292 7 8 3 1 3 5 6 5 81 79
Oman 4,379 18,020 20 11 1 1 2 5 2 3 70 77
Pakistan 11,515 31,710 18 11 6 4 16 28 3 4 57 52
Panama 2,510 7,801 11 12 1 0 14 17 1 1 73 70
Papua New Guinea 1,452 3,200 .. .. .. .. .. .. .. .. .. ..
Paraguay 3,144 6,940 19 8 0 1 7 15 1 1 74 76
Peru 7,584 21,706 14 11 2 1 9 14 1 1 75 72
Philippines 28,341 45,878 8 12 2 1 9 17 3 4 58 67
Poland 29,050 146,626 10 8 3 2 9 9 3 3 74 74
Portugal 32,610 69,844 14 13 4 1 8 13 2 2 72 62
Puerto Rico .. .. .. .. .. .. .. .. .. .. .. ..
Qatar 3,398 23,000 9 6 1 0 1 1 2 3 87 90
4.5Structure of merchandise imports
Merchandise
imports
Food Agricultural
raw materials
Fuels Ores and
metals
Manufactures
$ millions % of total % of total % of total % of total % of total
1995 2009 1995 2009 1995 2009 1995 2009 1995 2009 1995 2009

2011 World Development Indicators212
Romania 10,278 54,247 8 9 2 1 21 9 4 2 63 75
Russian Federation 60,945 191,803 18 17 1 1 3 2 2 2 45 76
Rwanda 236 1,227 19 12 3 1 12 8 3 2 64 76
Saudi Arabia 28,091 95,567 17 11 1 0 0 0 4 3 76 36
Senegal 1,412 4,713 25 24 2 2 30 23 1 1 42 50
Serbia .. 15,582 14 6 4 2 14 17 7 6 60 69
Sierra Leone 133 520 .. .. .. .. .. .. .. .. .. ..
Singapore 124,507 245,785 5 3 1 0 8 24 2 2 83 67
Slovak Republic 8,770 55,301 9 7 3 1 13 12 6 2 70 78
Slovenia 9,492 26,464 8 9 5 3 7 11 4 4 74 72
Somalia .. .. .. .. .. .. .. .. .. .. .. ..
South Africa 30,546b 73,172 7b 7 2b 1 8b 21 2b 1 78b 64
Spain 113,537 287,567 14 11 3 1 8 16 4 3 71 68
Sri Lanka 5,306 10,207 16 16 2 1 6 19 1 1 75 62
Sudan 1,218 9,691 24 15 2 1 14 4 0 1 59 78
Swaziland 1,008 1,600 .. 21 .. 1 .. 14 .. 1 .. 63
Sweden 65,036 119,839 7 10 2 1 6 12 4 3 80 70
Switzerland 80,152 155,706 6 6 2 1 3 7 3 4 85 81
Syrian Arab Republic 4,709 16,300 17 14 3 3 1 31 1 4 76 47
Tajikistan 810 2,569 .. .. .. .. .. .. .. .. .. ..
Tanzania 1,675 6,347 10 9 1 1 1 23 4 1 84 66
Thailand 70,786 133,801 4 6 4 2 7 19 3 4 81 69
Timor-Leste .. .. .. .. .. .. .. .. .. .. .. ..
Togo 594 1,500 18 15 2 1 30 27 1 2 49 55
Trinidad and Tobago 1,714 6,955 16 10 1 1 1 33 6 3 76 53
Tunisia 7,902 19,096 13 9 4 2 7 11 3 3 73 75
Turkey 35,709 140,921 7 4 6 2 13 14 6 7 68 64
Turkmenistan 1,365 6,750 24 .. 0 .. 3 .. 2 .. 71 ..
Uganda 1,056 4,310 16 13 3 1 2 19 2 1 78 66
Ukraine 15,484 45,436 8 11 2 1 48 32 3 3 38 52
United Arab Emirates 23,778 140,000 15 7 0 0 4 1 6 5 75 73
United Kingdom 267,250 481,707 10 11 2 1 4 10 3 3 80 69
United States 770,852 1,605,296 5 5 2 1 8 17 3 2 79 70
Uruguay 2,867 6,907 10 10 4 2 10 24 1 1 74 62
Uzbekistan 2,750 9,023 .. .. .. .. .. .. .. .. .. ..
Venezuela, RB 12,649 40,597 14 16 4 1 1 1 4 1 77 79
Vietnam 8,155 69,949 5 7 2 3 10 16 2 4 76 70
West Bank and Gaza .. .. .. .. .. .. .. .. .. .. .. ..
Yemen, Rep. 1,582 8,500 29 28 2 1 8 21 1 1 59 50
Zambia 700 3,793 10 6 2 1 13 14 2 13 72 65
Zimbabwe 2,660 2,900 6 22 2 0 9 13 2 5 78 58
World 5,228,194 t 12,595,548 t 9 w 8 w 3 w 1 w 7 w 15 w 4 w 3 w 75 w 69 w
Low income 36,735 127,386 16 16 3 3 12 16 2 2 66 60
Middle income 947,153 3,519,888 8 8 4 2 7 14 3 5 75 69
Lower middle income 434,758 2,038,080 9 7 5 2 8 18 4 8 72 64
Upper middle income 512,441 1,475,992 8 9 3 1 6 11 3 3 77 74
Low & middle income 983,905 3,647,212 8 8 4 2 7 14 3 5 75 69
East Asia & Pacifi c 366,062 1,493,538 6 7 4 3 5 14 4 9 78 68
Europe & Central Asia 163,415 626,665 12 10 3 2 15 14 4 4 57 66
Latin America & Carib. 240,278 668,496 8 8 2 1 5 10 2 2 78 77
Middle East & N. Africa 77,167 289,612 22 .. 4 .. 6 .. 3 .. 66 ..
South Asia 60,322 323,199 8 7 4 2 21 31 6 5 56 53
Sub-Saharan Africa 78,377 253,161 12 11 2 1 10 17 2 2 73 66
High income 4,244,063 8,955,148 9 8 3 1 7 15 4 3 75 69
Euro area 1,647,277 3,519,840 11 10 3 1 7 13 4 3 73 68
Note: Components may not sum to 100 percent because of unclassifi ed trade.
a. Includes Luxembourg. b. Refers to the South African Customs Union (Botswana, Lesotho, Namibia, South Africa, and Swaziland).
4.5 Structure of merchandise imports
Merchandise
imports
Food Agricultural
raw materials
Fuels Ores and
metals
Manufactures
$ millions % of total % of total % of total % of total % of total
1995 2009 1995 2009 1995 2009 1995 2009 1995 2009 1995 2009

2011 World Development Indicators 213
ECONOMY
About the data Defi nitions
Data on imports of goods are derived from the
same sources as data on exports. In principle, world
exports and imports should be identical. Similarly,
exports from an economy should equal the sum of
imports by the rest of the world from that economy.
But differences in timing and defi nitions result in dis-
crepancies in reported values at all levels. For further
discussion of indicators of merchandise trade, see
About the data for tables 4.4 and 6.2.
The value of imports is generally recorded as the
cost of the goods when purchased by the importer
plus the cost of transport and insurance to the fron-
tier of the importing country—the cost, insurance,
and freight (c.i.f.) value, corresponding to the landed
cost at the point of entry of foreign goods into the
country. A few countries, including Australia, Canada,
and the United States, collect import data on a free
on board (f.o.b.) basis and adjust them for freight and
insurance costs. Many countries report trade data in
U.S. dollars. When countries report in local currency,
the United Nations Statistics Division applies the
average offi cial exchange rate to the U.S. dollar for
the period shown.
Countries may report trade according to the general
or special system of trade. Under the general system
imports include goods imported for domestic con-
sumption and imports into bonded warehouses and
free trade zones. Under the special system imports
comprise goods imported for domestic consumption
( including transformation and repair) and withdrawals
for domestic consumption from bonded warehouses
and free trade zones. Goods transported through a
country en route to another are excluded.
The data on total imports of goods (merchandise)
in the table come from the World Trade Organization
(WTO). For further discussion of the WTO’s sources
and methodology, see About the data for table 4.4.
The import shares by major commodity group are
from the United Nations Statistics Division’s Com-
modity Trade (Comtrade) database. The values of
total imports reported here have not been fully recon-
ciled with the estimates of imports of goods and ser-
vices from the national accounts (shown in table 4.8)
or those from the balance of payments (table 4.17).
The classifi cation of commodity groups is based
on the Standard International Trade Classifi cation
(SITC) revision 3. Previous editions contained data
based on the SITC revision 1. Data for earlier years in
previous editions may differ because of this change
in methodology. Concordance tables are available
to convert data reported in one system to another.
• Merchandise imports are the c.i.f. value of goods
purchased from the rest of the world valued in U.S.
dollars. • Food corresponds to the commodities in
SITC sections 0 (food and live animals), 1 (beverages
and tobacco), and 4 (animal and vegetable oils and
fats) and SITC division 22 (oil seeds, oil nuts, and oil
kernels). • Agricultural raw materials correspond to
SITC section 2 (crude materials except fuels), exclud-
ing divisions 22, 27 (crude fertilizers and minerals
excluding coal, petroleum, and precious stones),
and 28 (metalliferous ores and scrap). • Fuels cor-
respond to SITC section 3 (mineral fuels). • Ores
and metals correspond to the commodities in SITC
divisions 27, 28, and 68 (nonferrous metals). • Man-
ufactures correspond to the commodities in SITC
sections 5 (chemicals), 6 (basic manufactures), 7
(machinery and transport equipment), and 8 (miscel-
laneous manufactured goods), excluding division 68.
Structure of merchandise imports 4.5
Merchandise exports ($ billions)
0
300
600
900
1,200
1,500
Iran, Islamic Rep.
TurkeyIndonesiaThailandBrazilMalaysiaIndiaMexicoRussian Federation
China
1995 2009
China continues to dominate merchandise exports among developing economies. Even when developed
economies are included, China ranks as the second leading merchandise exporter.
Source: World Development Indicators data fi les and World Trade Organization.
Top 10 developing economy exporters of merchandise goods in 2009 4.5a
Data sources
Data on merchandise imports are from the WTO.
Data on shares of imports by major commodity
group are from Comtrade. The WTO publishes data
on world trade in its Annual Report. The Interna-
tional Monetary Fund publishes estimates of total
imports of goods in its International Financial Sta-
tistics and Direction of Trade Statistics, as does the
United Nations Statistics Division in its Monthly
Bulletin of Statistics. And the United Nations Con-
ference on Trade and Development publishes data
on the structure of imports in its Handbook of Sta-
tistics. Tariff line records of imports are compiled
in the United Nations Statistics Division’s Com-
trade database.

2011 World Development Indicators214
Afghanistan .. .. .. .. .. .. .. .. .. ..
Albania 94 2,348 19 11 69 78 1 0 10 11
Algeria .. .. .. .. .. .. .. .. .. ..
Angola 113 623 32 5 1 86 9 0 59 9
Argentina 3,676 10,758 27 15 60 37 0 0 12 48
Armenia 27 580 53 19 5 58 7 3 41 21
Australia 16,076 44,513 29 18 51 56 5 3 15 22
Austria 31,692 54,080 12 22 42 35 4 4 42 38
Azerbaijan 166 1,670 46 40 42 21 0 0 12 39
Bangladesh 469 935 15 15 5 7 0 6 80 72
Belarus 466 3,453 65 66 5 11 0 0 30 23
Belgium 35,466a 79,815a ..a 27a ..a 12a ..a 5a ..a 55a
Benin 159 328 26 4 53 72 7 2 14 22
Bolivia 174 498 45 13 32 56 10 14 14 17
Bosnia and Herzegovina 457 1,396 4 20 54 49 3 1 39 30
Botswana 236 842 16 10 68 54 8 4 7 33
Brazil 6,005 26,245 43 15 16 20 17 7 24 57
Bulgaria 1,431 6,889 35 21 33 55 0 3 32 22
Burkina Faso 38 109 17 19 48 57 0 2 35 21
Burundi 4 2 46 22 32 62 0 14 21 2
Cambodia 103 1,592 31 12 52 74 0 0 18 13
Cameroon 242 1,158 48 41 15 19 7 2 30 38
Canada 25,425 57,476 21 15 31 24 11 11 37 50
Central African Republic 0 .. 34 .. 34 .. 20 .. 12 ..
Chad 23 .. 5 .. 50 .. 2 .. 44 ..
Chile 3,249 8,401 37 56 28 19 7 4 28 22
China 18,430 128,600 18 18 47 31 10 2 24 49
Hong Kong SAR, China 33,790 86,306 33 31 17 17 9 13 41 39
Colombia 1,641 4,109 34 28 40 49 6 1 19 23
Congo, Dem. Rep. .. .. .. .. .. .. .. .. .. ..
Congo, Rep. 61 303 52 4 22 18 0 31 25 47
Costa Rica 957 3,694 14 8 71 49 0 0 15 43
Côte d’Ivoire 426 816 29 29 21 14 12 0 38 57
Croatia 2,223 11,889 32 9 61 76 1 1 6 15
Cuba .. .. .. .. .. .. .. .. .. ..
Czech Republic 6,638 20,278 22 27 43 32 1 1 34 40
Denmark 15,171 55,346 45 .. 24 .. .. .. 31 ..
Dominican Republic 1,894 4,864 2 9 83 83 0 1 15 7
Ecuador 687 1,130 47 31 37 59 0 0 16 10
Egypt, Arab Rep. 8,262 21,302 39 31 32 50 1 1 28 17
El Salvador 342 806 28 34 25 40 8 4 39 23
Eritrea 49 .. 70 .. 3 .. 1 .. 27 ..
Estonia 868 4,368 43 37 41 25 0 2 16 36
Ethiopia 310 1,676 77 59 5 20 2 1 16 20
Finland 7,334 27,536 28 10 22 10 2 2 48 78
France 83,108 142,487 25 23 33 35 5 2 37 41
Gabon 191 .. 46 .. 9 .. 3 .. 41 ..
Gambia, The 38 104 22 19 73 60 0 0 5 21
Georgia 188 1,225 48 51 25 39 0 2 27 8
Germany 73,576 226,638 27 23 25 15 5 7 44 54
Ghana 139 1,722 59 19 8 56 3 1 30 24
Greece 9,528 37,690 4 50 43 39 0 2 52 9
Guatemala 628 1,818 9 14 34 65 4 2 54 20
Guinea 17 67 75 22 5 4 1 9 18 65
Guinea-Bissau 2 44 18 0 14 87 0 1 82 12
Haiti 98 327 5 .. 92 96 1 0 2 4
Honduras 221 933 26 5 36 66 2 2 36 28
4.6 Structure of service exports
Commercial
service exports
Transport Travel Insurance and
fi nancial services
Computer, information,
communications, and
other commercial
services
$ millions % of total % of total % of total % of total
1995 2009 1995 2009 1995 2009 1995 2009 1995 2009

2011 World Development Indicators 215
ECONOMY
Hungary 5,086 18,419 8 19 58 31 3 1 31 49
India 6,763 90,193 28 12 38 12 3 5 31 70
Indonesia 5,342 13,238 1 18 98 48 0 2 2 32
Iran, Islamic Rep. 533 .. 26 .. 13 .. 9 .. 53 ..
Iraq .. 1,721 .. 22 .. 0 .. 0 .. 78
Ireland 4,799 92,964 22 4 46 5 0 20 32 70
Israel 7,906 21,961 25 14 38 17 0 0 36 68
Italy 61,173 101,237 18 13 47 40 7 9 29 38
Jamaica 1,568 2,616 16 13 68 74 1 2 15 11
Japan 63,966 125,918 35 25 5 8 1 4 59 62
Jordan 1,689 4,192 25 19 39 69 0 0 36 12
Kazakhstan 535 3,813 66 57 23 25 0 4 12 14
Kenya 1,183 2,198 59 48 36 31 1 1 3 20
Korea, Dem. Rep. .. .. .. .. .. .. .. .. .. ..
Korea, Rep. 22,133 57,304 42 51 23 16 0 5 34 28
Kosovo .. .. .. .. .. .. .. .. .. ..
Kuwait 1,124 10,425 84 30 11 2 6 1 0 66
Kyrgyz Republic 39 850 40 16 12 54 0 2 48 28
Lao PDR 68 368 23 8 76 73 1 3 1 16
Latvia 718 3,812 92 51 3 19 2 7 3 23
Lebanon .. 16,869 .. 2 .. 40 .. 2 .. 56
Lesotho 30 63 7 1 91 64 1 1 1 34
Liberia .. 142 .. 10 .. 87 .. .. .. 3
Libya 20 385 63 68 12 13 .. 16 25 3
Lithuania 482 3,769 60 56 16 30 1 1 23 14
Macedonia, FYR 151 845 32 30 14 26 4 2 51 43
Madagascar 219 .. 30 .. 26 .. 2 .. 42 ..
Malawi 24 .. 28 .. 72 .. 0 .. 0 ..
Malaysia 11,438 28,727 22 15 35 55 0 2 44 28
Mali 68 442 32 7 37 62 5 1 25 30
Mauritania 19 .. 9 .. 58 .. 0 .. 33 ..
Mauritius 773 2,225 26 15 56 50 0 4 19 30
Mexico 9,585 15,420 12 10 64 73 7 10 17 6
Moldova 143 647 30 39 40 26 12 1 19 34
Mongolia 47 412 32 33 44 57 5 1 19 9
Morocco 2,020 11,892 20 18 64 56 1 2 14 25
Mozambique 242 544 25 28 .. 36 .. 1 75 35
Myanmar 353 256 6 51 43 18 0 .. 51 31
Namibia 301 505 .. 23 92 72 1 1 6 4
Nepal 592 548 9 7 30 68 0 0 61 25
Netherlands 44,646 90,853 40 27 15 14 1 2 44 57
New Zealand 4,401 7,760 35 19 53 59 0 1 13 21
Nicaragua 94 429 18 10 52 81 2 1 27 8
Niger 12 126 3 9 58 62 0 7 39 21
Nigeria 608 1,769 16 62 3 34 1 1 80 3
Norway 13,458 38,537 63 41 17 11 4 5 16 44
Oman 13 1,792 100 32 81 39 0 1 0 28
Pakistan 1,432 2,463 58 44 8 11 1 6 33 39
Panama 1,298 5,463 60 56 24 27 6 7 10 9
Papua New Guinea 321 162 11 9 8 1 1 7 80 84
Paraguay 566 1,288 13 13 24 16 5 2 57 69
Peru 1,042 3,517 32 21 41 58 7 9 19 12
Philippines 9,323 10,101 3 11 12 23 1 1 84 65
Poland 10,637 28,856 29 30 22 31 8 2 41 37
Portugal 8,161 22,539 19 26 59 43 5 2 18 30
Puerto Rico .. .. .. .. .. .. .. .. .. ..
Qatar .. .. .. .. .. .. .. .. .. ..
Structure of service exports 4.6Commercial
service exports
Transport Travel Insurance and
fi nancial services
Computer, information,
communications, and
other commercial
services
$ millions % of total % of total % of total % of total
1995 2009 1995 2009 1995 2009 1995 2009 1995 2009
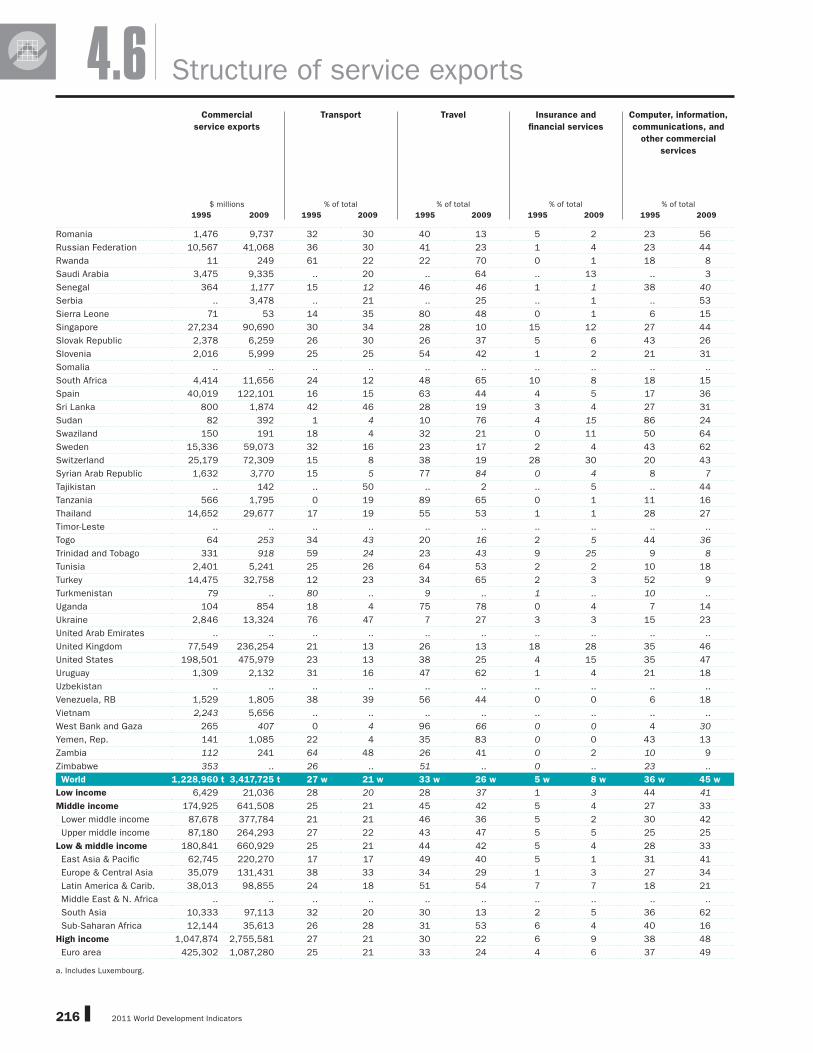
2011 World Development Indicators216
Romania 1,476 9,737 32 30 40 13 5 2 23 56
Russian Federation 10,567 41,068 36 30 41 23 1 4 23 44
Rwanda 11 249 61 22 22 70 0 1 18 8
Saudi Arabia 3,475 9,335 .. 20 .. 64 .. 13 .. 3
Senegal 364 1,177 15 12 46 46 1 1 38 40
Serbia .. 3,478 .. 21 .. 25 .. 1 .. 53
Sierra Leone 71 53 14 35 80 48 0 1 6 15
Singapore 27,234 90,690 30 34 28 10 15 12 27 44
Slovak Republic 2,378 6,259 26 30 26 37 5 6 43 26
Slovenia 2,016 5,999 25 25 54 42 1 2 21 31
Somalia .. .. .. .. .. .. .. .. .. ..
South Africa 4,414 11,656 24 12 48 65 10 8 18 15
Spain 40,019 122,101 16 15 63 44 4 5 17 36
Sri Lanka 800 1,874 42 46 28 19 3 4 27 31
Sudan 82 392 1 4 10 76 4 15 86 24
Swaziland 150 191 18 4 32 21 0 11 50 64
Sweden 15,336 59,073 32 16 23 17 2 4 43 62
Switzerland 25,179 72,309 15 8 38 19 28 30 20 43
Syrian Arab Republic 1,632 3,770 15 5 77 84 0 4 8 7
Tajikistan .. 142 .. 50 .. 2 .. 5 .. 44
Tanzania 566 1,795 0 19 89 65 0 1 11 16
Thailand 14,652 29,677 17 19 55 53 1 1 28 27
Timor-Leste .. .. .. .. .. .. .. .. .. ..
Togo 64 253 34 43 20 16 2 5 44 36
Trinidad and Tobago 331 918 59 24 23 43 9 25 9 8
Tunisia 2,401 5,241 25 26 64 53 2 2 10 18
Turkey 14,475 32,758 12 23 34 65 2 3 52 9
Turkmenistan 79 .. 80 .. 9 .. 1 .. 10 ..
Uganda 104 854 18 4 75 78 0 4 7 14
Ukraine 2,846 13,324 76 47 7 27 3 3 15 23
United Arab Emirates .. .. .. .. .. .. .. .. .. ..
United Kingdom 77,549 236,254 21 13 26 13 18 28 35 46
United States 198,501 475,979 23 13 38 25 4 15 35 47
Uruguay 1,309 2,132 31 16 47 62 1 4 21 18
Uzbekistan .. .. .. .. .. .. .. .. .. ..
Venezuela, RB 1,529 1,805 38 39 56 44 0 0 6 18
Vietnam 2,243 5,656 .. .. .. .. .. .. .. ..
West Bank and Gaza 265 407 0 4 96 66 0 0 4 30
Yemen, Rep. 141 1,085 22 4 35 83 0 0 43 13
Zambia 112 241 64 48 26 41 0 2 10 9
Zimbabwe 353 .. 26 .. 51 .. 0 .. 23 ..
World 1,228,960 t 3,417,725 t 27 w 21 w 33 w 26 w 5 w 8 w 36 w 45 w
Low income 6,429 21,036 28 20 28 37 1 3 44 41
Middle income 174,925 641,508 25 21 45 42 5 4 27 33
Lower middle income 87,678 377,784 21 21 46 36 5 2 30 42
Upper middle income 87,180 264,293 27 22 43 47 5 5 25 25
Low & middle income 180,841 660,929 25 21 44 42 5 4 28 33
East Asia & Pacifi c 62,745 220,270 17 17 49 40 5 1 31 41
Europe & Central Asia 35,079 131,431 38 33 34 29 1 3 27 34
Latin America & Carib. 38,013 98,855 24 18 51 54 7 7 18 21
Middle East & N. Africa .. .. .. .. .. .. .. .. .. ..
South Asia 10,333 97,113 32 20 30 13 2 5 36 62
Sub-Saharan Africa 12,144 35,613 26 28 31 53 6 4 40 16
High income 1,047,874 2,755,581 27 21 30 22 6 9 38 48
Euro area 425,302 1,087,280 25 21 33 24 4 6 37 49
a. Includes Luxembourg.
Structure of service exports4.6Commercial
service exports
Transport Travel Insurance and
fi nancial services
Computer, information,
communications, and
other commercial
services
$ millions % of total % of total % of total % of total
1995 2009 1995 2009 1995 2009 1995 2009 1995 2009
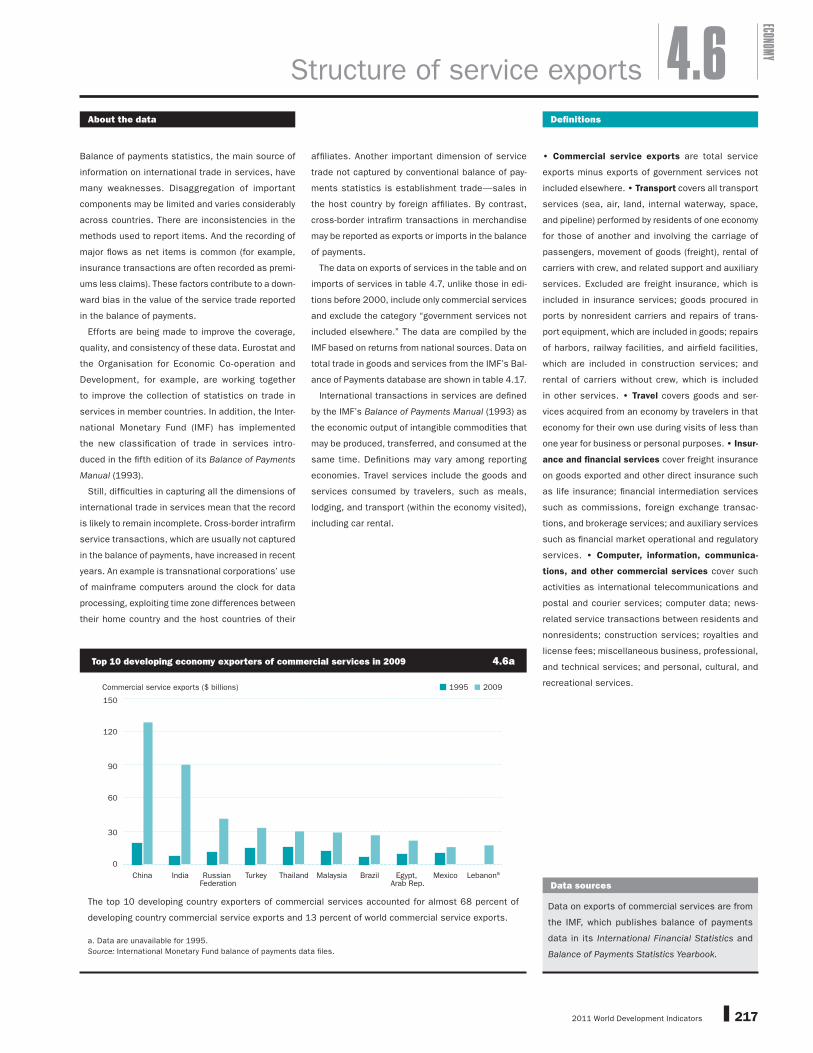
2011 World Development Indicators 217
ECONOMY
About the data Defi nitions
Balance of payments statistics, the main source of
information on international trade in services, have
many weaknesses. Disaggregation of important
components may be limited and varies considerably
across countries. There are inconsistencies in the
methods used to report items. And the recording of
major fl ows as net items is common (for example,
insurance transactions are often recorded as premi-
ums less claims). These factors contribute to a down-
ward bias in the value of the service trade reported
in the balance of payments.
Efforts are being made to improve the coverage,
quality, and consistency of these data. Eurostat and
the Organisation for Economic Co-operation and
Development, for example, are working together
to improve the collection of statistics on trade in
services in member countries. In addition, the Inter-
national Monetary Fund (IMF) has implemented
the new classifi cation of trade in services intro-
duced in the fi fth edition of its Balance of Payments
Manual (1993).
Still, diffi culties in capturing all the dimensions of
international trade in services mean that the record
is likely to remain incomplete. Cross-border intrafi rm
service transactions, which are usually not captured
in the balance of payments, have increased in recent
years. An example is transnational corporations’ use
of mainframe computers around the clock for data
processing, exploiting time zone differences between
their home country and the host countries of their
affi liates. Another important dimension of service
trade not captured by conventional balance of pay-
ments statistics is establishment trade—sales in
the host country by foreign affi liates. By contrast,
cross-border intrafi rm transactions in merchandise
may be reported as exports or imports in the balance
of payments.
The data on exports of services in the table and on
imports of services in table 4.7, unlike those in edi-
tions before 2000, include only commercial services
and exclude the category “government services not
included elsewhere.” The data are compiled by the
IMF based on returns from national sources. Data on
total trade in goods and services from the IMF’s Bal-
ance of Payments database are shown in table 4.17.
International transactions in services are defi ned
by the IMF’s Balance of Payments Manual (1993) as
the economic output of intangible commodities that
may be produced, transferred, and consumed at the
same time. Defi nitions may vary among reporting
economies. Travel services include the goods and
services consumed by travelers, such as meals,
lodging, and transport (within the economy visited),
including car rental.
• Commercial service exports are total service
exports minus exports of government services not
included elsewhere. • Transport covers all transport
services (sea, air, land, internal waterway, space,
and pipeline) performed by residents of one economy
for those of another and involving the carriage of
passengers, movement of goods (freight), rental of
carriers with crew, and related support and auxiliary
services. Excluded are freight insurance, which is
included in insurance services; goods procured in
ports by nonresident carriers and repairs of trans-
port equipment, which are included in goods; repairs
of harbors, railway facilities, and airfi eld facilities,
which are included in construction services; and
rental of carriers without crew, which is included
in other services. • Travel covers goods and ser-
vices acquired from an economy by travelers in that
economy for their own use during visits of less than
one year for business or personal purposes. • Insur-
ance and fi nancial services cover freight insurance
on goods exported and other direct insurance such
as life insurance; fi nancial intermediation services
such as commissions, foreign exchange transac-
tions, and brokerage services; and auxiliary services
such as fi nancial market operational and regulatory
services. • Computer, information, communica-
tions, and other commercial services cover such
activities as international telecommunications and
postal and courier services; computer data; news-
related service transactions between residents and
nonresidents; construction services; royalties and
license fees; miscellaneous business, professional,
and technical services; and personal, cultural, and
recreational services.
Structure of service exports 4.6
Commercial service exports ($ billions)
0
30
60
90
120
150
LebanonaMexicoEgypt, Arab Rep.
BrazilMalaysiaThailandTurkeyRussian Federation
IndiaChina
1995 2009
The top 10 developing country exporters of commercial services accounted for almost 68 percent of
developing country commercial service exports and 13 percent of world commercial service exports.
a. Data are unavailable for 1995.
Source: International Monetary Fund balance of payments data fi les.
Top 10 developing economy exporters of commercial services in 2009 4.6a
Data sources
Data on exports of commercial services are from
the IMF, which publishes balance of payments
data in its International Financial Statistics and
Balance of Payments Statistics Yearbook.

2011 World Development Indicators218
Afghanistan .. .. .. .. .. .. .. .. .. ..
Albania 98 2,215 61 15 7 72 22 5 10 9
Algeria .. .. .. .. .. .. .. .. .. ..
Angola 1,665 18,210 18 23 5 1 3 4 75 72
Argentina 6,992 11,445 30 23 47 39 7 5 16 33
Armenia 52 839 83 46 6 39 10 7 1 8
Australia 16,979 47,613 37 31 30 39 7 3 26 27
Austria 27,552 36,894 12 29 40 29 6 4 43 38
Azerbaijan 297 3,297 31 24 49 11 1 3 19 62
Bangladesh 1,192 3,202 65 83 20 8 6 2 10 8
Belarus 276 2,031 36 40 32 29 4 4 29 28
Belgium 33,134a 73,008 24a 25 28a 25 10a 4 38a 47
Benin 235 500 59 62 15 13 10 5 16 20
Bolivia 321 993 66 38 15 29 9 13 10 19
Bosnia and Herzegovina 262 625 51 32 31 38 10 4 8 25
Botswana 440 1,040 43 40 33 22 8 4 16 34
Brazil 13,161 44,074 44 18 26 25 10 8 21 49
Bulgaria 1,278 5,037 42 22 15 35 0 8 43 35
Burkina Faso 116 564 56 59 20 11 5 17 20 13
Burundi 62 160 49 53 41 39 6 3 4 6
Cambodia 181 939 46 58 5 11 4 5 45 27
Cameroon 485 2,081 35 33 22 17 7 4 36 45
Canada 32,985 77,579 24 22 31 31 11 12 34 35
Central African Republic 114 .. 44 .. 38 .. 8 .. 10 ..
Chad 174 .. 55 .. 15 .. 2 .. 29 ..
Chile 3,524 9,351 54 52 20 17 4 10 22 20
China 24,635 158,107 39 29 15 28 17 8 29 35
Hong Kong SAR, China 24,962 44,379 22 34 54 34 6 8 18 24
Colombia 2,813 6,860 42 34 31 26 12 8 15 32
Congo, Dem. Rep. .. .. .. .. .. .. .. .. .. ..
Congo, Rep. 690 3,523 19 15 8 5 7 5 67 75
Costa Rica 895 1,407 41 36 36 26 5 9 18 29
Côte d’Ivoire 1,235 2,324 50 58 15 15 11 0 23 27
Croatia 1,373 3,812 28 18 31 27 3 5 38 51
Cuba .. .. .. .. .. .. .. .. .. ..
Czech Republic 4,860 18,887 16 21 34 22 5 3 45 54
Denmark 13,945 50,912 45 .. 31 .. .. .. 24 ..
Dominican Republic 957 1,733 61 58 18 20 10 9 11 13
Ecuador 1,141 2,556 42 54 21 21 6 6 31 18
Egypt, Arab Rep. 4,511 12,765 35 45 28 20 5 11 32 24
El Salvador 488 1,231 55 57 15 15 11 15 19 13
Eritrea 45 .. 2 .. 7 .. 0 .. 93 ..
Estonia 420 2,496 53 33 22 24 5 2 21 41
Ethiopia 337 2,190 63 67 8 6 7 4 22 22
Finland 9,418 25,687 23 19 24 17 5 2 48 62
France 64,523 126,425 33 26 25 31 6 3 36 41
Gabon 832 .. 18 .. 17 .. 9 .. 57 ..
Gambia, The 47 83 60 46 30 11 6 8 4 36
Georgia 249 910 27 54 63 20 8 14 2 12
Germany 128,865 253,467 18 21 47 32 2 4 33 43
Ghana 331 2,166 61 41 6 27 6 4 26 28
Greece 4,003 19,525 30 51 33 17 5 8 33 24
Guatemala 672 2,058 41 46 21 35 9 10 29 9
Guinea 252 288 58 37 8 5 7 9 26 50
Guinea-Bissau 27 85 53 38 14 54 5 5 28 4
Haiti 236 736 78 72 15 9 2 1 6 19
Honduras 326 1,077 60 42 18 27 2 6 20 25
Commercial
service imports
Transport Travel Insurance and
fi nancial services
Computer, information,
communications, and
other commercial
services
$ millions % of total % of total % of total % of total
1995 2009 1995 2009 1995 2009 1995 2009 1995 2009
4.7 Structure of service imports

2011 World Development Indicators 219
ECONOMY
Hungary 3,765 16,407 13 17 40 22 5 3 43 57
India 10,062 80,274 57 44 10 12 6 10 28 35
Indonesia 13,230 27,625 37 44 16 19 3 5 43 32
Iran, Islamic Rep. 2,192 .. 43 .. 11 .. 10 .. 36 ..
Iraq .. 7,565 .. 53 .. 10 .. 27 .. 10
Ireland 11,252 104,551 16 2 18 8 1 14 65 76
Israel 8,131 16,865 45 32 26 17 3 2 26 48
Italy 54,613 114,581 24 20 27 24 10 5 39 50
Jamaica 1,073 1,824 46 43 14 12 9 11 31 34
Japan 121,547 146,965 30 28 30 17 2 6 38 50
Jordan 1,385 3,657 52 53 31 29 6 8 11 10
Kazakhstan 776 9,881 38 19 36 11 0 6 25 64
Kenya 900 1,634 46 51 21 14 10 8 22 26
Korea, Dem. Rep. .. .. .. .. .. .. .. .. .. ..
Korea, Rep. 25,394 74,978 38 31 25 18 2 2 36 49
Kosovo .. .. .. .. .. .. .. .. .. ..
Kuwait 3,826 11,297 39 31 59 66 2 1 0 2
Kyrgyz Republic 193 858 27 48 3 31 4 2 65 19
Lao PDR 119 114 43 12 25 72 4 –4 28 20
Latvia 225 2,260 68 26 11 35 7 5 14 34
Lebanon .. 14,301 .. 15 .. 28 .. 2 .. 55
Lesotho 58 91 75 79 23 15 0 0 2 6
Liberia .. 141 .. 60 .. 20 .. 2 .. 17
Libya 510 4,323 60 48 15 37 .. 14 25 2
Lithuania 457 2,883 64 38 23 41 1 2 12 19
Macedonia, FYR 300 789 50 39 9 13 21 4 21 45
Madagascar 277 .. 56 .. 21 .. 4 .. 20 ..
Malawi 151 .. 67 .. 26 .. 0 .. 7 ..
Malaysia 14,821 27,257 38 34 16 24 0 4 47 38
Mali 412 1,022 60 63 12 14 1 5 27 18
Mauritania 197 .. 62 .. 12 .. 1 .. 25 ..
Mauritius 630 1,586 40 32 25 22 5 5 30 40
Mexico 9,021 21,402 38 13 35 33 12 52 14 2
Moldova 193 678 52 38 29 36 9 3 10 24
Mongolia 87 545 70 37 22 39 0 3 8 21
Morocco 1,350 5,302 48 44 22 21 4 5 26 30
Mozambique 350 1,004 33 35 .. 21 2 2 65 42
Myanmar 233 547 11 46 8 7 1 .. 81 47
Namibia 538 602 37 37 17 18 9 4 37 41
Nepal 305 771 36 28 45 56 3 4 16 12
Netherlands 43,618 84,625 29 21 27 25 3 3 41 51
New Zealand 4,571 7,825 41 29 28 33 5 4 26 34
Nicaragua 207 517 39 48 19 28 3 11 38 13
Niger 120 599 74 67 11 11 3 4 12 18
Nigeria 4,398 16,127 22 38 21 25 3 3 54 34
Norway 13,052 36,504 38 26 32 34 6 4 24 37
Oman 985 5,555 42 38 5 16 5 10 49 36
Pakistan 2,431 5,844 67 54 18 12 4 4 10 30
Panama 1,049 2,118 71 58 12 16 9 15 9 11
Papua New Guinea 642 1,915 25 23 9 2 3 12 63 63
Paraguay 676 511 66 61 20 25 12 11 1 3
Peru 1,781 4,619 51 37 17 24 10 11 22 28
Philippines 6,906 8,344 30 44 6 29 2 4 63 23
Poland 7,008 23,789 25 22 6 31 14 6 55 41
Portugal 6,339 14,186 27 30 33 27 9 4 31 40
Puerto Rico .. .. .. .. .. .. .. .. .. ..
Qatar .. .. .. .. .. .. .. .. .. ..
Commercial
service imports
Transport Travel Insurance and
fi nancial services
Computer, information,
communications, and
other commercial
services
$ millions % of total % of total % of total % of total
1995 2009 1995 2009 1995 2009 1995 2009 1995 2009
Structure of service imports 4.7
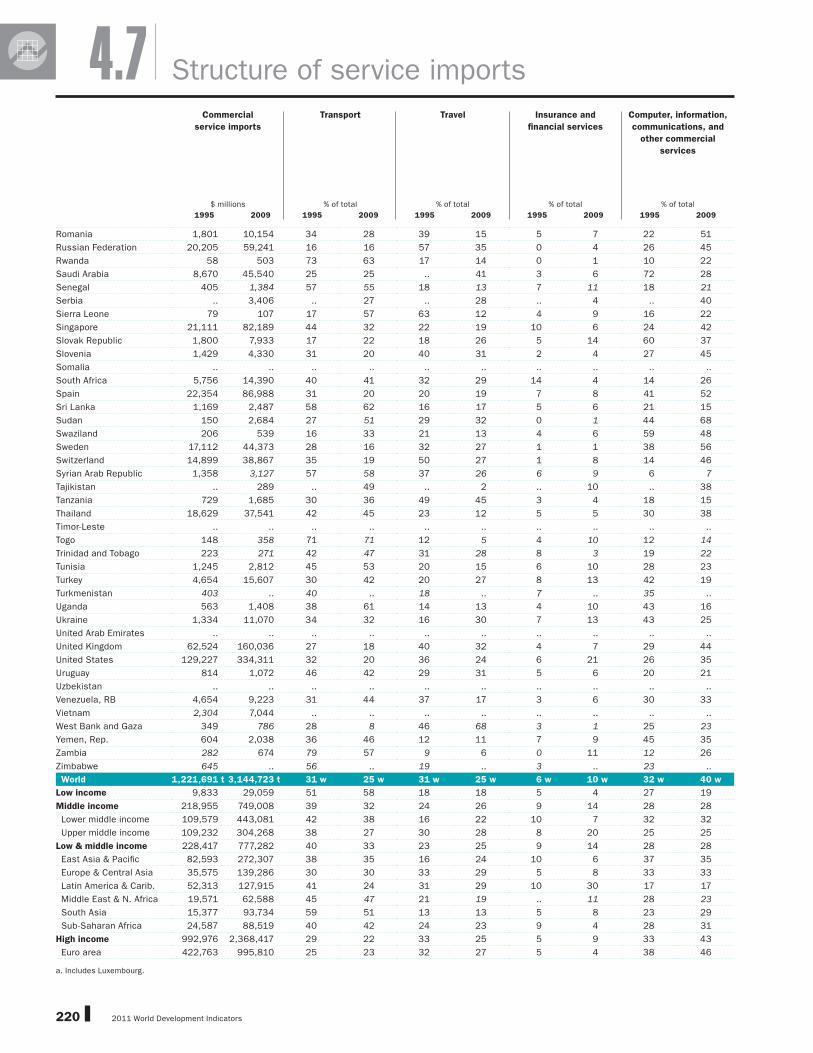
2011 World Development Indicators220
Romania 1,801 10,154 34 28 39 15 5 7 22 51
Russian Federation 20,205 59,241 16 16 57 35 0 4 26 45
Rwanda 58 503 73 63 17 14 0 1 10 22
Saudi Arabia 8,670 45,540 25 25 .. 41 3 6 72 28
Senegal 405 1,384 57 55 18 13 7 11 18 21
Serbia .. 3,406 .. 27 .. 28 .. 4 .. 40
Sierra Leone 79 107 17 57 63 12 4 9 16 22
Singapore 21,111 82,189 44 32 22 19 10 6 24 42
Slovak Republic 1,800 7,933 17 22 18 26 5 14 60 37
Slovenia 1,429 4,330 31 20 40 31 2 4 27 45
Somalia .. .. .. .. .. .. .. .. .. ..
South Africa 5,756 14,390 40 41 32 29 14 4 14 26
Spain 22,354 86,988 31 20 20 19 7 8 41 52
Sri Lanka 1,169 2,487 58 62 16 17 5 6 21 15
Sudan 150 2,684 27 51 29 32 0 1 44 68
Swaziland 206 539 16 33 21 13 4 6 59 48
Sweden 17,112 44,373 28 16 32 27 1 1 38 56
Switzerland 14,899 38,867 35 19 50 27 1 8 14 46
Syrian Arab Republic 1,358 3,127 57 58 37 26 6 9 6 7
Tajikistan .. 289 .. 49 .. 2 .. 10 .. 38
Tanzania 729 1,685 30 36 49 45 3 4 18 15
Thailand 18,629 37,541 42 45 23 12 5 5 30 38
Timor-Leste .. .. .. .. .. .. .. .. .. ..
Togo 148 358 71 71 12 5 4 10 12 14
Trinidad and Tobago 223 271 42 47 31 28 8 3 19 22
Tunisia 1,245 2,812 45 53 20 15 6 10 28 23
Turkey 4,654 15,607 30 42 20 27 8 13 42 19
Turkmenistan 403 .. 40 .. 18 .. 7 .. 35 ..
Uganda 563 1,408 38 61 14 13 4 10 43 16
Ukraine 1,334 11,070 34 32 16 30 7 13 43 25
United Arab Emirates .. .. .. .. .. .. .. .. .. ..
United Kingdom 62,524 160,036 27 18 40 32 4 7 29 44
United States 129,227 334,311 32 20 36 24 6 21 26 35
Uruguay 814 1,072 46 42 29 31 5 6 20 21
Uzbekistan .. .. .. .. .. .. .. .. .. ..
Venezuela, RB 4,654 9,223 31 44 37 17 3 6 30 33
Vietnam 2,304 7,044 .. .. .. .. .. .. .. ..
West Bank and Gaza 349 786 28 8 46 68 3 1 25 23
Yemen, Rep. 604 2,038 36 46 12 11 7 9 45 35
Zambia 282 674 79 57 9 6 0 11 12 26
Zimbabwe 645 .. 56 .. 19 .. 3 .. 23 ..
World 1,221,691 t 3,144,723 t 31 w 25 w 31 w 25 w 6 w 10 w 32 w 40 w
Low income 9,833 29,059 51 58 18 18 5 4 27 19
Middle income 218,955 749,008 39 32 24 26 9 14 28 28
Lower middle income 109,579 443,081 42 38 16 22 10 7 32 32
Upper middle income 109,232 304,268 38 27 30 28 8 20 25 25
Low & middle income 228,417 777,282 40 33 23 25 9 14 28 28
East Asia & Pacifi c 82,593 272,307 38 35 16 24 10 6 37 35
Europe & Central Asia 35,575 139,286 30 30 33 29 5 8 33 33
Latin America & Carib. 52,313 127,915 41 24 31 29 10 30 17 17
Middle East & N. Africa 19,571 62,588 45 47 21 19 .. 11 28 23
South Asia 15,377 93,734 59 51 13 13 5 8 23 29
Sub-Saharan Africa 24,587 88,519 40 42 24 23 9 4 28 31
High income 992,976 2,368,417 29 22 33 25 5 9 33 43
Euro area 422,763 995,810 25 23 32 27 5 4 38 46
a. Includes Luxembourg.
Commercial
service imports
Transport Travel Insurance and
fi nancial services
Computer, information,
communications, and
other commercial
services
$ millions % of total % of total % of total % of total
1995 2009 1995 2009 1995 2009 1995 2009 1995 2009
4.7 Structure of service imports

2011 World Development Indicators 221
ECONOMY
About the data Defi nitions
Trade in services differs from trade in goods because
services are produced and consumed at the same
time. Thus services to a traveler may be consumed
in the producing country (for example, use of a hotel
room) but are classifi ed as imports of the traveler’s
country. In other cases services may be supplied
from a remote location; for example, insurance
services may be supplied from one location and
consumed in another. For further discussion of the
problems of measuring trade in services, see About
the data for table 4.6.
The data on imports of services in the table and on
exports of services in table 4.6, unlike those in edi-
tions before 2000, include only commercial services
and exclude the category “government services not
included elsewhere.” The data are compiled by the
International Monetary Fund (IMF) based on returns
from national sources.
International transactions in services are defi ned
by the IMF’s Balance of Payments Manual (1993) as
the economic output of intangible commodities that
may be produced, transferred, and consumed at the
same time. Defi nitions may vary among reporting
economies.
Travel services include the goods and services
consumed by travelers, such as meals, lodging, and
transport (within the economy visited), including car
rental.
• Commercial service imports are total service
imports minus imports of government services not
included elsewhere. • Transport covers all transport
services (sea, air, land, internal waterway, space,
and pipeline) performed by residents of one economy
for those of another and involving the carriage of
passengers, movement of goods (freight), rental of
carriers with crew, and related support and auxiliary
services. Excluded are freight insurance, which is
included in insurance services; goods procured in
ports by nonresident carriers and repairs of trans-
port equipment, which are included in goods; repairs
of harbors, railway facilities, and airfi eld facilities,
which are included in construction services; and
rental of carriers without crew, which is included
in other services. • Travel covers goods and ser-
vices acquired from an economy by travelers in that
economy for their own use during visits of less than
one year for business or personal purposes. • Insur-
ance and fi nancial services cover freight insurance
on goods imported and other direct insurance such
as life insurance; fi nancial intermediation services
such as commissions, foreign exchange transac-
tions, and brokerage services; and auxiliary services
such as fi nancial market operational and regulatory
services. • Computer, information, communica-
tions, and other commercial services cover such
activities as international telecommunications, and
postal and courier services; computer data; news-
related service transactions between residents and
nonresidents; construction services; royalties and
license fees; miscellaneous business, professional,
and technical services; and personal, cultural, and
recreational services.
4.7Structure of service imports
Transport40%
Travel23%
Insurance andfinancial 9%
Insuranceand financial
14%
Other28%
Transport33%
Travel25%
Other28%
1995($228 billion)
2009($777 billion)
Between 1995 and 2009 developing economies’ commercial service imports more than tripled. Insur-
ance and fi nancial services and travel services are displacing transport as the most important services
imported.
Source: International Monetary Fund balance of payments data fi les.
The mix of commercial service imports by developing economies is changing 4.7a
Data sources
Data on imports of commercial services are from
the IMF, which publishes balance of payments
data in its International Financial Statistics and
Balance of Payments Statistics Yearbook.
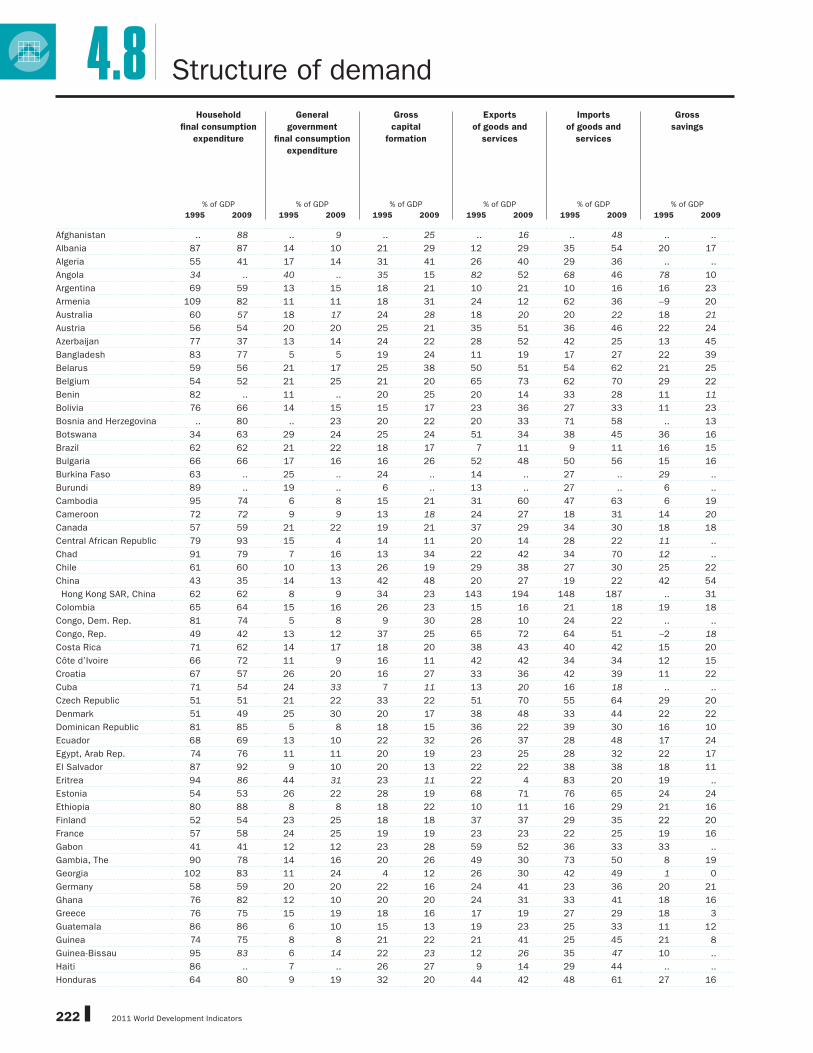
2011 World Development Indicators222
Afghanistan .. 88 .. 9 .. 25 .. 16 .. 48 .. ..
Albania 87 87 14 10 21 29 12 29 35 54 20 17
Algeria 55 41 17 14 31 41 26 40 29 36 .. ..
Angola 34 .. 40 .. 35 15 82 52 68 46 78 10
Argentina 69 59 13 15 18 21 10 21 10 16 16 23
Armenia 109 82 11 11 18 31 24 12 62 36 –9 20
Australia 60 57 18 17 24 28 18 20 20 22 18 21
Austria 56 54 20 20 25 21 35 51 36 46 22 24
Azerbaijan 77 37 13 14 24 22 28 52 42 25 13 45
Bangladesh 83 77 5 5 19 24 11 19 17 27 22 39
Belarus 59 56 21 17 25 38 50 51 54 62 21 25
Belgium 54 52 21 25 21 20 65 73 62 70 29 22
Benin 82 .. 11 .. 20 25 20 14 33 28 11 11
Bolivia 76 66 14 15 15 17 23 36 27 33 11 23
Bosnia and Herzegovina .. 80 .. 23 20 22 20 33 71 58 .. 13
Botswana 34 63 29 24 25 24 51 34 38 45 36 16
Brazil 62 62 21 22 18 17 7 11 9 11 16 15
Bulgaria 66 66 17 16 16 26 52 48 50 56 15 16
Burkina Faso 63 .. 25 .. 24 .. 14 .. 27 .. 29 ..
Burundi 89 .. 19 .. 6 .. 13 .. 27 .. 6 ..
Cambodia 95 74 6 8 15 21 31 60 47 63 6 19
Cameroon 72 72 9 9 13 18 24 27 18 31 14 20
Canada 57 59 21 22 19 21 37 29 34 30 18 18
Central African Republic 79 93 15 4 14 11 20 14 28 22 11 ..
Chad 91 79 7 16 13 34 22 42 34 70 12 ..
Chile 61 60 10 13 26 19 29 38 27 30 25 22
China 43 35 14 13 42 48 20 27 19 22 42 54
Hong Kong SAR, China 62 62 8 9 34 23 143 194 148 187 .. 31
Colombia 65 64 15 16 26 23 15 16 21 18 19 18
Congo, Dem. Rep. 81 74 5 8 9 30 28 10 24 22 .. ..
Congo, Rep. 49 42 13 12 37 25 65 72 64 51 –2 18
Costa Rica 71 62 14 17 18 20 38 43 40 42 15 20
Côte d’Ivoire 66 72 11 9 16 11 42 42 34 34 12 15
Croatia 67 57 26 20 16 27 33 36 42 39 11 22
Cuba 71 54 24 33 7 11 13 20 16 18 .. ..
Czech Republic 51 51 21 22 33 22 51 70 55 64 29 20
Denmark 51 49 25 30 20 17 38 48 33 44 22 22
Dominican Republic 81 85 5 8 18 15 36 22 39 30 16 10
Ecuador 68 69 13 10 22 32 26 37 28 48 17 24
Egypt, Arab Rep. 74 76 11 11 20 19 23 25 28 32 22 17
El Salvador 87 92 9 10 20 13 22 22 38 38 18 11
Eritrea 94 86 44 31 23 11 22 4 83 20 19 ..
Estonia 54 53 26 22 28 19 68 71 76 65 24 24
Ethiopia 80 88 8 8 18 22 10 11 16 29 21 16
Finland 52 54 23 25 18 18 37 37 29 35 22 20
France 57 58 24 25 19 19 23 23 22 25 19 16
Gabon 41 41 12 12 23 28 59 52 36 33 33 ..
Gambia, The 90 78 14 16 20 26 49 30 73 50 8 19
Georgia 102 83 11 24 4 12 26 30 42 49 1 0
Germany 58 59 20 20 22 16 24 41 23 36 20 21
Ghana 76 82 12 10 20 20 24 31 33 41 18 16
Greece 76 75 15 19 18 16 17 19 27 29 18 3
Guatemala 86 86 6 10 15 13 19 23 25 33 11 12
Guinea 74 75 8 8 21 22 21 41 25 45 21 8
Guinea-Bissau 95 83 6 14 22 23 12 26 35 47 10 ..
Haiti 86 .. 7 .. 26 27 9 14 29 44 .. ..
Honduras 64 80 9 19 32 20 44 42 48 61 27 16
4.8 Structure of demand
Household
fi nal consumption
expenditure
General
government
fi nal consumption
expenditure
Gross
capital
formation
Exports
of goods and
services
Imports
of goods and
services
Gross
savings
% of GDP % of GDP % of GDP % of GDP % of GDP % of GDP
1995 2009 1995 2009 1995 2009 1995 2009 1995 2009 1995 2009

2011 World Development Indicators 223
ECONOMY
Hungary 68 67 11 9 21 22 46 81 46 80 17 15
India 64 56 11 12 27 36 11 20 12 24 27 35
Indonesia 62 57 8 10 32 31 26 24 28 21 28 23
Iran, Islamic Rep. 46 45 16 11 29 33 22 32 13 22 37 ..
Iraq .. .. .. .. .. .. .. .. .. .. .. ..
Ireland 54 52 16 19 18 14 76 89 65 74 23 9
Israel 56 57 28 24 25 16 29 35 37 32 13 20
Italy 58 60 18 22 20 19 26 24 22 24 22 16
Jamaica 70 81 11 16 29 21 51 35 61 53 25 13
Japan 55 60 15 20 28 20 9 13 8 12 30 24
Jordan 65 83 24 24 33 15 52 43 73 65 29 10
Kazakhstan 71 50 14 12 20 30 39 42 44 34 15 28
Kenya 70 76 15 16 22 21 33 25 39 38 23 15
Korea, Dem. Rep. .. .. .. .. .. .. .. .. .. .. .. ..
Korea, Rep. 52 54 11 16 38 26 29 50 30 46 36 30
Kosovo .. .. .. 18 .. 28 .. 14 .. 54 .. ..
Kuwait 43 28 32 13 15 19 52 66 42 26 38 59
Kyrgyz Republic 75 86 20 23 18 22 29 50 42 81 8 14
Lao PDR .. 66 .. 8 .. 37 23 33 37 44 .. 25
Latvia 63 61 24 21 14 19 43 42 45 43 14 29
Lebanon 103 79 12 16 36 30 11 22 62 47 .. 13
Lesotho 93 79 35 50 76 31 24 51 128 112 39 28
Liberia .. 202 .. 19 .. 20 9 31 72 173 .. –2
Libya 59 23 22 9 12 28 29 67 22 27 .. 67
Lithuania 68 65 21 19 21 27 47 60 58 72 12 15
Macedonia, FYR 70 81 19 18 21 24 33 44 43 67 13 18
Madagascar 90 80 7 11 11 33 24 28 32 52 2 ..
Malawi 79 62 21 21 17 25 30 30 48 38 8 ..
Malaysia 48 50 12 14 44 14 94 96 98 75 34 31
Mali 83 77 10 10 23 22 21 26 36 36 15 19
Mauritania 77 72 11 21 20 25 37 50 45 68 14 ..
Mauritius 63 75 14 15 26 21 59 48 61 59 25 17
Mexico 67 67 10 12 20 22 30 28 28 29 19 22
Moldova 57 87 27 22 25 27 49 37 58 73 18 19
Mongolia 56 55 13 1 32 50 48 56 49 63 35 42
Morocco 68 57 17 18 21 36 27 29 34 39 17 31
Mozambique 90 84 8 13 27 21 16 25 41 44 9 9
Myanmar .. .. .. .. 14 .. 1 .. 2 .. .. ..
Namibia 54 62 30 24 22 27 49 47 56 60 32 27
Nepal 75 81 9 11 25 30 25 16 35 37 21 38
Netherlands 49 46 24 29 21 18 59 69 54 62 27 22
New Zealand 59 60 17 20 23 18 29 28 28 27 18 16
Nicaragua 83 91 11 12 22 23 19 35 35 61 –1 10
Niger 86 .. 14 .. 7 .. 17 .. 24 .. –1 ..
Nigeria .. .. .. .. .. .. 44 36 42 27 .. ..
Norway 50 43 22 22 22 20 38 42 32 27 26 32
Oman 51 34 25 15 15 30 44 59 36 38 10 39
Pakistan 72 80 12 8 19 19 17 13 19 20 21 22
Panama 52 49 15 10 30 25 101 77 98 61 30 35
Papua New Guinea 44 69 17 11 22 20 61 58 44 57 35 20
Paraguay 76 78 10 12 26 16 59 47 71 52 18 12
Peru 71 64 10 10 25 22 13 24 18 20 16 23
Philippines 74 74 11 11 22 15 36 32 44 31 19 40
Poland 60 61 20 19 19 20 23 39 21 39 20 19
Portugal 65 67 17 21 24 20 27 28 34 36 24 10
Puerto Rico .. .. .. .. .. .. 72 .. 97 .. .. ..
Qatar 32 21 32 25 35 39 44 47 43 31 .. ..
4.8Structure of demand
Household
fi nal consumption
expenditure
General
government
fi nal consumption
expenditure
Gross
capital
formation
Exports
of goods and
services
Imports
of goods and
services
Gross
savings
% of GDP % of GDP % of GDP % of GDP % of GDP % of GDP
1995 2009 1995 2009 1995 2009 1995 2009 1995 2009 1995 2009

2011 World Development Indicators224
Romania 68 61 14 15 24 31 28 33 33 40 19 29
Russian Federation 52 54 19 20 25 19 29 28 26 20 28 23
Rwanda 97 81 10 15 13 22 5 12 26 29 20 15
Saudi Arabia 47 38 24 25 20 26 38 54 28 43 20 32
Senegal 80 83 13 9 14 28 31 24 37 44 8 16
Serbia 73 74 23 19 12 24 17 27 24 44 .. 17
Sierra Leone 88 84 14 14 6 15 19 16 26 29 –3 8
Singapore 41 43 8 10 34 29 .. 221 .. 203 53 45
Slovak Republic 52 47 22 20 24 38 58 99 56 104 27 29
Slovenia 60 55 19 20 24 23 50 59 52 57 23 22
Somalia .. .. .. .. .. .. .. .. .. .. .. ..
South Africa 63 60 18 21 18 19 23 27 22 28 17 15
Spain 60 56 18 21 22 24 22 23 22 26 22 20
Sri Lanka 73 64 11 18 26 25 36 21 46 28 20 24
Sudan 85 67 5 14 14 25 5 15 10 21 3 12
Swaziland 82 73 15 27 16 17 60 60 74 76 16 2
Sweden 49 49 27 28 17 17 40 49 33 42 20 24
Switzerland 60 58 12 11 23 20 36 52 31 41 30 32
Syrian Arab Republic 66 72 13 14 27 16 31 34 38 36 27 14
Tajikistan 62 93 16 28 29 22 66 13 72 56 .. 12
Tanzaniaa 86 62 12 20 20 30 24 23 42 35 7 21
Thailand 55 54 10 13 42 22 42 68 49 58 34 30
Timor-Leste .. .. .. .. .. .. .. .. .. .. .. ..
Togo 77 .. 12 9 16 .. 32 42 37 62 17 ..
Trinidad and Tobago 53 49 12 10 21 12 54 68 39 39 27 31
Tunisia 63 63 16 13 25 27 45 52 49 55 20 23
Turkey 68 72 11 15 25 15 20 23 24 24 22 13
Turkmenistan 44 49 12 10 49 11 84 76 84 46 50 ..
Uganda 85 76 11 11 12 24 12 23 21 35 13 18
Ukraine 55 65 21 19 27 17 47 46 50 48 23 16
United Arab Emirates 48 46 16 10 30 20 69 87 63 64 .. ..
United Kingdom 63 65 20 23 17 14 28 28 28 30 15 12
United States 68 71 15 17 18 14 11 11 12 14 16 10
Uruguay 73 68 12 13 15 18 19 26 19 26 14 17
Uzbekistan 51 56 22 18 27 26 28 36 28 36 .. ..
Venezuela, RB 69 64 7 13 18 25 27 18 22 20 21 22
Vietnam 74 66 8 6 27 38 33 68 42 79 20 29
West Bank and Gaza 98 .. 18 .. 35 .. 16 .. 68 .. 12 ..
Yemen, Rep. 71 .. 14 .. 22 .. 51 .. 58 .. 26 ..
Zambia 72 61 15 13 16 22 36 36 40 32 9 19
Zimbabwe 65 113 18 14 20 2 38 36 41 65 18 ..
World 61 w 62 w 17 w 19 w 22 w 19 w 21 w 24 w 21 w 24 w 22 w 19 w
Low income 81 78 9 10 18 24 18 23 26 36 17 24
Middle income 60 56 14 15 27 28 23 27 24 26 26 29
Lower middle income 55 50 12 13 34 37 23 29 24 28 33 40
Upper middle income 63 62 15 16 22 20 23 25 23 24 20 19
Low & middle income 60 57 14 15 27 28 23 27 24 26 26 29
East Asia & Pacifi c 48 42 13 13 40 40 27 35 28 30 38 47
Europe & Central Asia 61 62 16 17 25 19 29 30 31 29 23 19
Latin America & Carib. 66 64 15 16 20 20 18 21 19 21 18 19
Middle East & N. Africa 63 55 15 13 25 28 26 38 29 33 .. ..
South Asia 67 61 10 11 25 33 12 19 15 24 25 34
Sub-Saharan Africa 69 67 16 18 18 21 28 30 30 34 16 15
High income 61 63 17 20 21 17 21 24 20 24 21 16
Euro area 57 58 20 22 21 19 29 36 28 35 21 19
a. Covers mainland Tanzania only.
Structure of demand4.8Household
fi nal consumption
expenditure
General
government
fi nal consumption
expenditure
Gross
capital
formation
Exports
of goods and
services
Imports
of goods and
services
Gross
savings
% of GDP % of GDP % of GDP % of GDP % of GDP % of GDP
1995 2009 1995 2009 1995 2009 1995 2009 1995 2009 1995 2009
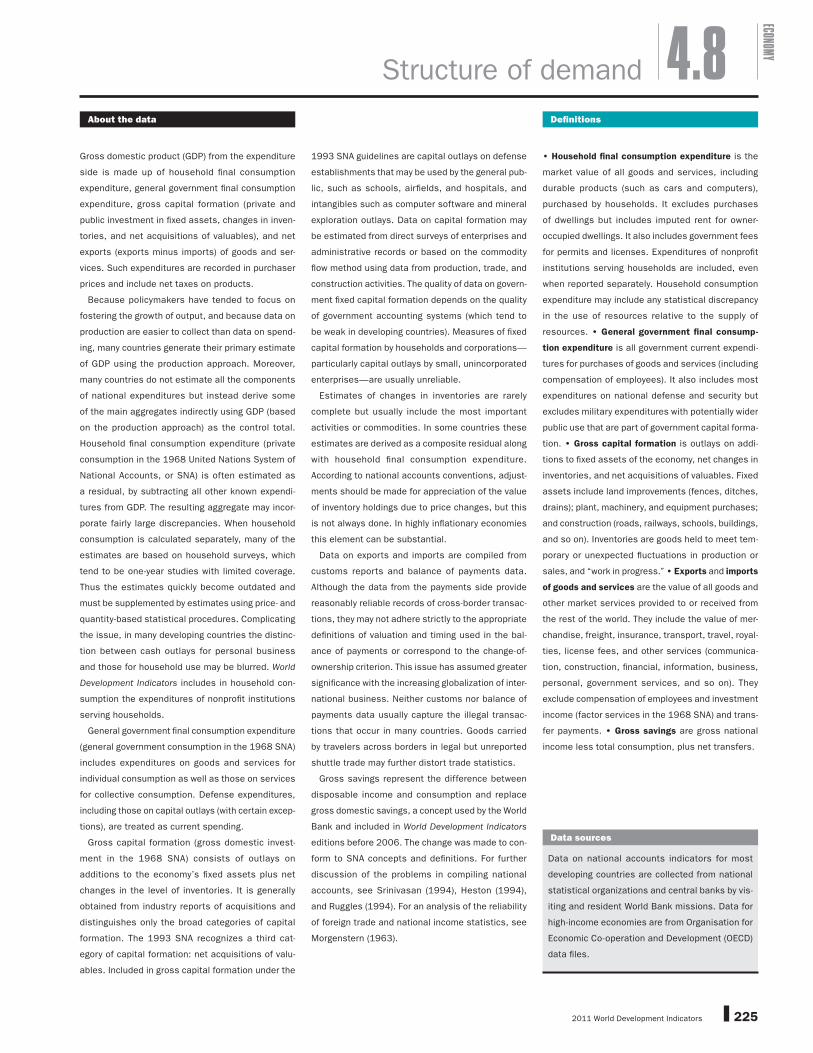
2011 World Development Indicators 225
ECONOMY
About the data Defi nitions
Gross domestic product (GDP) from the expenditure
side is made up of household final consumption
expenditure, general government fi nal consumption
expenditure, gross capital formation (private and
public investment in fi xed assets, changes in inven-
tories, and net acquisitions of valuables), and net
exports (exports minus imports) of goods and ser-
vices. Such expenditures are recorded in purchaser
prices and include net taxes on products.
Because policymakers have tended to focus on
fostering the growth of output, and because data on
production are easier to collect than data on spend-
ing, many countries generate their primary estimate
of GDP using the production approach. Moreover,
many countries do not estimate all the components
of national expenditures but instead derive some
of the main aggregates indirectly using GDP (based
on the production approach) as the control total.
Household fi nal consumption expenditure (private
consumption in the 1968 United Nations System of
National Accounts, or SNA) is often estimated as
a residual, by subtracting all other known expendi-
tures from GDP. The resulting aggregate may incor-
porate fairly large discrepancies. When household
consumption is calculated separately, many of the
estimates are based on household surveys, which
tend to be one-year studies with limited coverage.
Thus the estimates quickly become outdated and
must be supplemented by estimates using price- and
quantity-based statistical procedures. Complicating
the issue, in many developing countries the distinc-
tion between cash outlays for personal business
and those for household use may be blurred. World
Development Indicators includes in household con-
sumption the expenditures of nonprofit institutions
serving households.
General government final consumption expenditure
(general government consumption in the 1968 SNA)
includes expenditures on goods and services for
individual consumption as well as those on services
for collective consumption. Defense expenditures,
including those on capital outlays (with certain excep-
tions), are treated as current spending.
Gross capital formation (gross domestic invest-
ment in the 1968 SNA) consists of outlays on
additions to the economy’s fixed assets plus net
changes in the level of inventories. It is generally
obtained from industry reports of acquisitions and
distinguishes only the broad categories of capital
formation. The 1993 SNA recognizes a third cat-
egory of capital formation: net acquisitions of valu-
ables. Included in gross capital formation under the
1993 SNA guidelines are capital outlays on defense
establishments that may be used by the general pub-
lic, such as schools, airfi elds, and hospitals, and
intangibles such as computer software and mineral
exploration outlays. Data on capital formation may
be estimated from direct surveys of enterprises and
administrative records or based on the commodity
fl ow method using data from production, trade, and
construction activities. The quality of data on govern-
ment fi xed capital formation depends on the quality
of government accounting systems (which tend to
be weak in developing countries). Measures of fixed
capital formation by households and corporations—
particularly capital outlays by small, unincorporated
enterprises—are usually unreliable.
Estimates of changes in inventories are rarely
complete but usually include the most important
activities or commodities. In some countries these
estimates are derived as a composite residual along
with household fi nal consumption expenditure.
According to national accounts conventions, adjust-
ments should be made for appreciation of the value
of inventory holdings due to price changes, but this
is not always done. In highly infl ationary economies
this element can be substantial.
Data on exports and imports are compiled from
customs reports and balance of payments data.
Although the data from the payments side provide
reasonably reliable records of cross-border transac-
tions, they may not adhere strictly to the appropriate
defi nitions of valuation and timing used in the bal-
ance of payments or correspond to the change-of-
ownership criterion. This issue has assumed greater
signifi cance with the increasing globalization of inter-
national business. Neither customs nor balance of
payments data usually capture the illegal transac-
tions that occur in many countries. Goods carried
by travelers across borders in legal but unreported
shuttle trade may further distort trade statistics.
Gross savings represent the difference between
disposable income and consumption and replace
gross domestic savings, a concept used by the World
Bank and included in World Development Indicators
editions before 2006. The change was made to con-
form to SNA concepts and defi nitions. For further
discussion of the problems in compiling national
accounts, see Srinivasan (1994), Heston (1994),
and Ruggles (1994). For an analysis of the reliability
of foreign trade and national income statistics, see
Morgenstern (1963).
• Household fi nal consumption expenditure is the
market value of all goods and services, including
durable products (such as cars and computers),
purchased by households. It excludes purchases
of dwellings but includes imputed rent for owner-
occupied dwellings. It also includes government fees
for permits and licenses. Expenditures of nonprofit
institutions serving households are included, even
when reported separately. Household consumption
expenditure may include any statistical discrepancy
in the use of resources relative to the supply of
resources. • General government fi nal consump-
tion expenditure is all government current expendi-
tures for purchases of goods and services (including
compensation of employees). It also includes most
expenditures on national defense and security but
excludes military expenditures with potentially wider
public use that are part of government capital forma-
tion. • Gross capital formation is outlays on addi-
tions to fi xed assets of the economy, net changes in
inventories, and net acquisitions of valuables. Fixed
assets include land improvements (fences, ditches,
drains); plant, machinery, and equipment purchases;
and construction (roads, railways, schools, buildings,
and so on). Inventories are goods held to meet tem-
porary or unexpected fluctuations in production or
sales, and “work in progress.” • Exports and imports
of goods and services are the value of all goods and
other market services provided to or received from
the rest of the world. They include the value of mer-
chandise, freight, insurance, transport, travel, royal-
ties, license fees, and other services (communica-
tion, construction, financial, information, business,
personal, government services, and so on). They
exclude compensation of employees and investment
income (factor services in the 1968 SNA) and trans-
fer payments. • Gross savings are gross national
income less total consumption, plus net transfers.
Structure of demand 4.8
Data sources
Data on national accounts indicators for most
developing countries are collected from national
statistical organizations and central banks by vis-
iting and resident World Bank missions. Data for
high-income economies are from Organisation for
Economic Co-operation and Development (OECD)
data fi les.
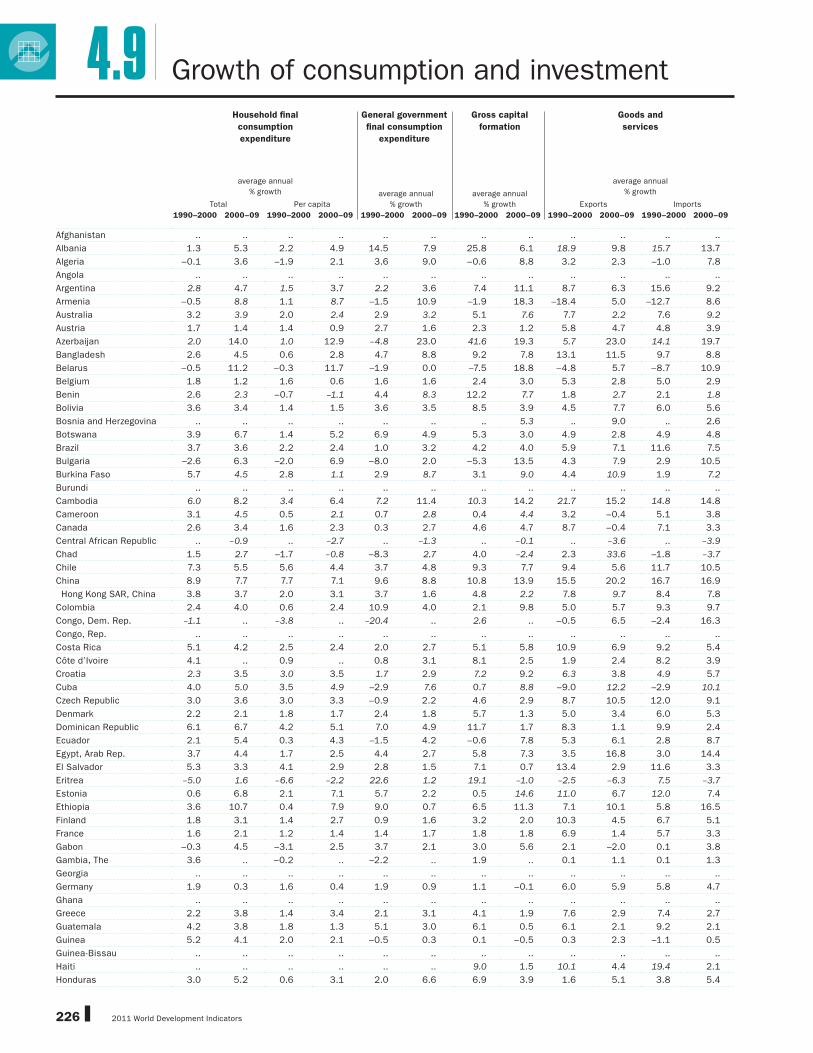
2011 World Development Indicators226
Afghanistan .. .. .. .. .. .. .. .. .. .. .. ..
Albania 1.3 5.3 2.2 4.9 14.5 7.9 25.8 6.1 18.9 9.8 15.7 13.7
Algeria –0.1 3.6 –1.9 2.1 3.6 9.0 –0.6 8.8 3.2 2.3 –1.0 7.8
Angola .. .. .. .. .. .. .. .. .. .. .. ..
Argentina 2.8 4.7 1.5 3.7 2.2 3.6 7.4 11.1 8.7 6.3 15.6 9.2
Armenia –0.5 8.8 1.1 8.7 –1.5 10.9 –1.9 18.3 –18.4 5.0 –12.7 8.6
Australia 3.2 3.9 2.0 2.4 2.9 3.2 5.1 7.6 7.7 2.2 7.6 9.2
Austria 1.7 1.4 1.4 0.9 2.7 1.6 2.3 1.2 5.8 4.7 4.8 3.9
Azerbaijan 2.0 14.0 1.0 12.9 –4.8 23.0 41.6 19.3 5.7 23.0 14.1 19.7
Bangladesh 2.6 4.5 0.6 2.8 4.7 8.8 9.2 7.8 13.1 11.5 9.7 8.8
Belarus –0.5 11.2 –0.3 11.7 –1.9 0.0 –7.5 18.8 –4.8 5.7 –8.7 10.9
Belgium 1.8 1.2 1.6 0.6 1.6 1.6 2.4 3.0 5.3 2.8 5.0 2.9
Benin 2.6 2.3 –0.7 –1.1 4.4 8.3 12.2 7.7 1.8 2.7 2.1 1.8
Bolivia 3.6 3.4 1.4 1.5 3.6 3.5 8.5 3.9 4.5 7.7 6.0 5.6
Bosnia and Herzegovina .. .. .. .. .. .. .. 5.3 .. 9.0 .. 2.6
Botswana 3.9 6.7 1.4 5.2 6.9 4.9 5.3 3.0 4.9 2.8 4.9 4.8
Brazil 3.7 3.6 2.2 2.4 1.0 3.2 4.2 4.0 5.9 7.1 11.6 7.5
Bulgaria –2.6 6.3 –2.0 6.9 –8.0 2.0 –5.3 13.5 4.3 7.9 2.9 10.5
Burkina Faso 5.7 4.5 2.8 1.1 2.9 8.7 3.1 9.0 4.4 10.9 1.9 7.2
Burundi .. .. .. .. .. .. .. .. .. .. .. ..
Cambodia 6.0 8.2 3.4 6.4 7.2 11.4 10.3 14.2 21.7 15.2 14.8 14.8
Cameroon 3.1 4.5 0.5 2.1 0.7 2.8 0.4 4.4 3.2 –0.4 5.1 3.8
Canada 2.6 3.4 1.6 2.3 0.3 2.7 4.6 4.7 8.7 –0.4 7.1 3.3
Central African Republic .. –0.9 .. –2.7 .. –1.3 .. –0.1 .. –3.6 .. –3.9
Chad 1.5 2.7 –1.7 –0.8 –8.3 2.7 4.0 –2.4 2.3 33.6 –1.8 –3.7
Chile 7.3 5.5 5.6 4.4 3.7 4.8 9.3 7.7 9.4 5.6 11.7 10.5
China 8.9 7.7 7.7 7.1 9.6 8.8 10.8 13.9 15.5 20.2 16.7 16.9
Hong Kong SAR, China 3.8 3.7 2.0 3.1 3.7 1.6 4.8 2.2 7.8 9.7 8.4 7.8
Colombia 2.4 4.0 0.6 2.4 10.9 4.0 2.1 9.8 5.0 5.7 9.3 9.7
Congo, Dem. Rep. –1.1 .. –3.8 .. –20.4 .. 2.6 .. –0.5 6.5 –2.4 16.3
Congo, Rep. .. .. .. .. .. .. .. .. .. .. .. ..
Costa Rica 5.1 4.2 2.5 2.4 2.0 2.7 5.1 5.8 10.9 6.9 9.2 5.4
Côte d’Ivoire 4.1 .. 0.9 .. 0.8 3.1 8.1 2.5 1.9 2.4 8.2 3.9
Croatia 2.3 3.5 3.0 3.5 1.7 2.9 7.2 9.2 6.3 3.8 4.9 5.7
Cuba 4.0 5.0 3.5 4.9 –2.9 7.6 0.7 8.8 –9.0 12.2 –2.9 10.1
Czech Republic 3.0 3.6 3.0 3.3 –0.9 2.2 4.6 2.9 8.7 10.5 12.0 9.1
Denmark 2.2 2.1 1.8 1.7 2.4 1.8 5.7 1.3 5.0 3.4 6.0 5.3
Dominican Republic 6.1 6.7 4.2 5.1 7.0 4.9 11.7 1.7 8.3 1.1 9.9 2.4
Ecuador 2.1 5.4 0.3 4.3 –1.5 4.2 –0.6 7.8 5.3 6.1 2.8 8.7
Egypt, Arab Rep. 3.7 4.4 1.7 2.5 4.4 2.7 5.8 7.3 3.5 16.8 3.0 14.4
El Salvador 5.3 3.3 4.1 2.9 2.8 1.5 7.1 0.7 13.4 2.9 11.6 3.3
Eritrea –5.0 1.6 –6.6 –2.2 22.6 1.2 19.1 –1.0 –2.5 –6.3 7.5 –3.7
Estonia 0.6 6.8 2.1 7.1 5.7 2.2 0.5 14.6 11.0 6.7 12.0 7.4
Ethiopia 3.6 10.7 0.4 7.9 9.0 0.7 6.5 11.3 7.1 10.1 5.8 16.5
Finland 1.8 3.1 1.4 2.7 0.9 1.6 3.2 2.0 10.3 4.5 6.7 5.1
France 1.6 2.1 1.2 1.4 1.4 1.7 1.8 1.8 6.9 1.4 5.7 3.3
Gabon –0.3 4.5 –3.1 2.5 3.7 2.1 3.0 5.6 2.1 –2.0 0.1 3.8
Gambia, The 3.6 .. –0.2 .. –2.2 .. 1.9 .. 0.1 1.1 0.1 1.3
Georgia .. .. .. .. .. .. .. .. .. .. .. ..
Germany 1.9 0.3 1.6 0.4 1.9 0.9 1.1 –0.1 6.0 5.9 5.8 4.7
Ghana .. .. .. .. .. .. .. .. .. .. .. ..
Greece 2.2 3.8 1.4 3.4 2.1 3.1 4.1 1.9 7.6 2.9 7.4 2.7
Guatemala 4.2 3.8 1.8 1.3 5.1 3.0 6.1 0.5 6.1 2.1 9.2 2.1
Guinea 5.2 4.1 2.0 2.1 –0.5 0.3 0.1 –0.5 0.3 2.3 –1.1 0.5
Guinea-Bissau .. .. .. .. .. .. .. .. .. .. .. ..
Haiti .. .. .. .. .. .. 9.0 1.5 10.1 4.4 19.4 2.1
Honduras 3.0 5.2 0.6 3.1 2.0 6.6 6.9 3.9 1.6 5.1 3.8 5.4
4.9 Growth of consumption and investment
Household fi nal
consumption
expenditure
General government
fi nal consumption
expenditure
Gross capital
formation
Goods and
services
average annual
% growth average annual
% growth
average annual
% growth
average annual
% growth
Total Per capita Exports Imports
1990–2000 2000–09 1990–2000 2000–09 1990–2000 2000–09 1990–2000 2000–09 1990–2000 2000–09 1990–2000 2000–09

2011 World Development Indicators 227
ECONOMY
Hungary –0.1 3.8 0.1 4.1 0.9 1.3 9.6 1.3 9.9 11.2 11.4 10.0
India 4.8 6.9 2.9 5.4 6.6 5.7 6.9 13.4 12.3 16.0 14.4 16.5
Indonesia 6.6 4.3 5.0 2.9 0.1 8.2 –0.6 5.9 5.9 7.8 5.7 8.6
Iran, Islamic Rep. 3.2 7.4 1.6 5.8 1.6 3.6 –0.1 8.3 1.2 5.0 –6.8 13.2
Iraq .. .. .. .. .. .. .. .. .. .. .. ..
Ireland 5.6 3.7 4.7 1.8 4.1 4.3 9.9 1.5 15.7 4.2 14.5 3.9
Israel 5.0 3.4 2.5 1.5 2.7 1.4 2.0 2.3 10.9 5.9 7.6 3.8
Italy 1.6 0.6 1.5 –0.1 –0.2 1.6 1.6 0.3 5.9 0.4 4.4 1.2
Jamaica .. .. .. .. .. .. .. .. .. .. .. ..
Japan 1.4 1.0 1.1 0.9 2.9 1.6 –0.8 –0.9 4.3 5.5 4.3 2.5
Jordan 4.9 7.5 1.1 5.0 4.7 6.7 0.3 6.7 2.6 5.7 1.5 6.9
Kazakhstan –7.5 9.3 –6.4 8.5 –7.1 7.8 –19.0 17.2 –1.9 5.9 –12.7 5.6
Kenya 3.6 4.0 0.6 1.3 6.9 2.3 6.1 9.0 1.0 6.6 9.4 8.3
Korea, Dem. Rep. .. .. .. .. .. .. .. .. .. .. .. ..
Korea, Rep. 4.9 3.0 3.9 2.6 4.7 4.9 3.4 3.1 16.0 10.6 10.0 8.3
Kosovo .. .. .. .. .. .. .. .. .. .. .. ..
Kuwait 4.5 .. 0.6 .. –2.4 .. 1.0 .. –1.6 .. 0.8 ..
Kyrgyz Republic –4.8 9.9 –5.8 9.0 –7.2 4.2 –1.1 3.8 –1.6 5.1 –8.2 16.0
Lao PDR .. –7.8 .. –9.4 .. 9.7 .. 15.2 .. –7.6 .. –7.2
Latvia –3.9 8.0 –2.7 8.6 1.8 2.1 –3.7 16.4 4.3 7.1 7.6 8.0
Lebanon –0.2 .. –1.9 .. 10.9 .. –5.8 6.3 18.6 10.2 –1.1 6.3
Lesotho 1.8 9.5 0.1 8.4 8.1 6.4 0.2 –0.5 10.3 10.0 2.7 12.2
Liberia .. .. .. .. .. .. .. .. .. .. .. ..
Libya .. .. .. .. .. .. .. .. .. .. .. ..
Lithuania 5.3 9.7 6.1 10.3 1.9 4.3 11.1 13.6 4.9 11.2 7.5 14.0
Macedonia, FYR 2.2 4.8 1.7 4.6 –0.4 0.0 3.6 4.7 4.2 2.4 7.5 4.0
Madagascar 2.2 2.2 –0.8 –0.7 0.0 5.5 3.3 14.1 3.8 6.7 4.1 9.3
Malawi 5.4 .. 3.2 .. –4.4 .. –8.4 .. 4.0 .. –1.1 ..
Malaysia 5.3 7.5 2.6 5.6 4.8 7.9 5.3 2.1 12.0 5.3 10.3 6.1
Mali 3.0 0.9 1.0 –1.5 3.2 .. 0.4 6.2 9.9 6.3 3.5 3.9
Mauritania .. 7.4 .. 4.5 .. 3.1 .. 23.8 –1.3 –2.1 0.6 14.1
Mauritius 5.1 5.6 3.9 4.7 3.6 3.8 4.8 5.3 5.6 2.0 5.1 2.3
Mexico 3.9 3.2 2.2 2.1 1.8 0.8 4.7 0.4 14.6 4.3 12.3 4.7
Moldova 9.9 7.9 10.0 8.2 –12.4 5.9 –15.5 9.8 0.7 9.1 5.6 11.1
Mongolia .. .. .. .. .. .. .. .. .. .. .. ..
Morocco 1.8 4.7 0.3 3.5 3.9 3.8 2.5 8.9 5.9 6.4 5.1 8.3
Mozambique 5.8 6.2 2.6 3.6 3.2 –4.6 8.6 5.9 13.1 16.0 7.6 6.2
Myanmar .. .. .. .. .. .. .. .. .. .. .. ..
Namibia 4.8 5.7 2.3 3.7 3.3 4.5 7.3 9.4 3.8 6.0 5.4 9.5
Nepal .. .. .. .. .. .. .. .. .. .. .. ..
Netherlands 3.1 0.6 2.5 0.3 2.0 3.2 4.4 1.1 7.3 4.1 7.6 3.8
New Zealand 3.2 3.4 2.0 2.0 2.4 4.1 6.1 3.7 5.2 2.2 6.2 4.5
Nicaragua 6.1 3.7 3.9 2.3 –1.5 2.7 11.3 2.1 9.3 8.3 12.2 5.1
Niger .. .. .. .. .. .. .. .. .. .. .. ..
Nigeria .. .. .. .. .. .. .. .. .. .. .. ..
Norway 3.5 3.7 3.0 2.9 2.7 2.4 6.0 5.0 5.5 0.7 5.8 5.0
Oman 5.4 .. 2.6 .. 2.4 .. 4.0 .. 6.2 .. 5.9 ..
Pakistan 4.9 4.6 2.3 2.2 0.7 8.3 1.8 6.3 1.7 7.1 2.5 7.3
Panama 6.4 7.2 4.2 5.4 1.7 3.6 10.4 10.2 –0.4 7.8 1.2 6.9
Papua New Guinea 2.5 .. –0.2 .. 2.5 .. 1.9 .. 5.1 .. 3.4 ..
Paraguay 2.6 3.0 0.3 1.1 2.5 3.3 0.7 3.0 3.1 7.0 2.9 6.0
Peru 4.0 5.2 2.2 3.9 5.2 5.2 7.4 10.5 8.5 7.8 9.0 9.5
Philippines 3.7 5.1 1.5 3.1 3.8 3.1 4.1 1.3 7.8 5.2 7.8 2.9
Poland 5.2 3.7 5.1 3.7 3.7 4.2 10.6 5.9 11.3 9.0 16.7 8.0
Portugal 3.0 1.5 2.7 1.1 2.9 1.5 5.9 –1.8 5.7 3.3 7.6 2.7
Puerto Rico .. .. .. .. .. .. .. .. 1.6 .. 4.5 ..
Qatar .. .. .. .. .. .. .. .. .. .. .. ..
Growth of consumption and investment 4.9Household fi nal
consumption
expenditure
General government
fi nal consumption
expenditure
Gross capital
formation
Goods and
services
average annual
% growth average annual
% growth
average annual
% growth
average annual
% growth
Total Per capita Exports Imports
1990–2000 2000–09 1990–2000 2000–09 1990–2000 2000–09 1990–2000 2000–09 1990–2000 2000–09 1990–2000 2000–09

2011 World Development Indicators228
Romania 1.3 6.2 1.7 6.7 0.8 4.3 –5.1 11.5 8.1 9.6 6.0 13.5
Russian Federation –0.9 9.9 –0.7 10.3 –2.2 2.1 –19.1 9.0 0.8 7.1 –6.1 15.9
Rwanda .. .. .. .. .. .. .. .. .. .. .. ..
Saudi Arabia .. 5.3 .. 2.9 .. 7.6 .. 11.4 .. 6.9 .. 16.9
Senegal 2.6 5.3 –0.2 2.5 0.9 –0.6 3.5 9.6 4.1 4.0 2.0 7.8
Serbia .. 3.3 .. 3.6 .. 4.5 .. 18.3 .. 10.5 .. 10.7
Sierra Leone .. .. .. .. .. .. .. .. .. .. .. ..
Singapore .. .. .. .. .. .. .. .. .. .. .. ..
Slovak Republic 6.0 5.3 5.8 5.2 1.8 3.3 7.7 7.8 9.6 11.0 12.4 9.6
Slovenia 3.9 3.2 4.0 3.0 2.2 3.2 10.4 7.5 1.7 9.1 5.2 8.9
Somalia .. .. .. .. .. .. .. .. .. .. .. ..
South Africa 2.9 4.6 0.6 3.4 0.3 5.0 4.7 9.1 5.8 2.7 7.1 8.1
Spain 2.4 2.8 2.0 1.2 2.7 5.1 3.2 3.3 10.5 2.9 9.4 4.7
Sri Lanka .. .. .. .. 10.5 .. 6.9 .. 7.5 .. 8.6 ..
Sudan 3.7 5.9 1.1 3.7 5.5 8.4 22.0 11.2 11.6 14.3 8.4 12.0
Swaziland 7.3 2.0 4.9 1.0 7.1 6.0 –4.7 –0.3 6.4 5.2 6.2 4.7
Sweden 1.5 2.2 1.1 1.7 0.7 0.9 2.0 3.3 8.6 4.6 6.4 4.2
Switzerland 1.1 1.4 0.5 0.6 0.5 1.2 0.7 0.4 4.1 4.7 4.3 3.6
Syrian Arab Republic 3.0 7.5 0.3 4.6 2.0 8.4 3.3 –0.4 12.0 6.5 4.4 11.3
Tajikistan –11.8 6.1 –13.1 4.8 –15.7 1.6 –17.6 7.3 –5.3 9.5 –6.0 10.6
Tanzaniaa 5.1 6.2 2.0 3.3 –8.8 13.5 –1.1 12.8 11.7 11.6 4.7 15.9
Thailand 3.7 4.0 2.7 3.1 5.1 5.3 –4.0 4.8 9.5 5.8 4.5 5.7
Timor-Leste .. .. .. .. .. .. .. .. .. .. .. ..
Togo 5.0 0.5 2.0 –2.1 0.0 1.3 –0.1 5.9 1.2 6.0 1.1 3.1
Trinidad and Tobago 0.7 13.3 0.1 12.9 0.3 4.3 12.5 4.2 6.9 5.8 9.9 9.5
Tunisia 4.3 5.3 2.6 4.3 4.1 4.4 3.6 2.9 5.1 4.1 3.8 3.6
Turkey 3.8 5.3 2.1 3.9 4.6 4.0 4.7 6.9 11.1 6.4 10.8 8.8
Turkmenistan .. .. .. .. .. .. .. 1.6 –2.4 22.4 7.2 15.2
Uganda 6.7 1.9 3.3 –1.3 7.7 4.0 9.2 12.0 15.4 19.5 9.7 11.2
Ukraine –6.9 12.1 –6.4 12.9 –4.1 2.6 –18.5 5.1 –3.6 1.1 –6.6 5.2
United Arab Emirates 7.1 .. 1.2 .. 6.8 .. 5.5 .. 5.5 .. 6.4 ..
United Kingdom 3.0 2.1 2.8 1.5 1.0 2.2 4.7 1.6 6.5 3.1 6.8 3.4
United States 3.7 2.4 2.5 1.4 0.7 2.1 7.6 0.0 7.3 4.5 9.8 3.3
Uruguay 5.0 2.9 4.3 2.8 2.3 1.3 6.1 6.6 6.0 7.8 9.9 6.4
Uzbekistan .. .. .. .. .. .. –2.5 4.7 2.5 4.9 –0.4 4.2
Venezuela, RB 0.6 8.7 –1.5 6.8 3.7 7.0 11.0 11.2 1.0 –2.0 8.2 13.8
Vietnam 5.4 7.8 3.9 6.4 3.2 7.7 19.8 12.3 19.2 11.4 19.5 13.6
West Bank and Gaza 5.3 –1.5 1.1 –4.9 12.7 1.3 9.2 –3.0 8.7 –3.1 7.5 –2.3
Yemen, Rep. 3.2 .. –0.7 .. 1.7 .. 11.4 .. 16.6 .. 8.3 ..
Zambia 2.4 0.1 –0.5 –2.1 –8.1 24.9 3.9 6.6 6.7 21.9 15.5 15.6
Zimbabwe .. .. .. .. .. .. .. .. 3.9 –10.7 3.1 –5.8
World 3.0 w 2.7 w 1.6 w 1.5 w 1.7 w 2.6 w 3.3 w 3.1 w 7.0 w 5.9 w 7.0 w 5.7 w
Low income 2.9 4.5 0.5 2.2 –1.3 6.8 5.5 8.7 5.5 9.7 5.3 9.4
Middle income 4.1 5.7 2.6 4.5 3.3 5.4 2.6 9.9 7.5 10.4 6.4 10.7
Lower middle income 5.7 6.6 4.1 5.3 6.6 7.4 6.3 12.2 9.3 14.7 8.3 12.9
Upper middle income 3.0 5.0 1.8 4.1 1.4 3.7 –0.5 6.3 6.3 5.5 5.1 8.5
Low & middle income 4.0 5.7 2.4 4.3 3.3 5.5 2.7 9.9 7.4 10.4 6.4 10.7
East Asia & Pacifi c 7.4 6.9 6.1 6.0 8.0 8.4 7.8 12.4 11.8 14.5 10.9 12.6
Europe & Central Asia 0.5 7.6 0.4 7.5 –0.8 3.3 –11.2 9.1 1.8 7.2 –2.3 11.9
Latin America & Carib. 3.6 4.1 2.0 2.9 1.9 3.3 5.4 5.0 8.1 5.0 10.4 6.7
Middle East & N. Africa 2.8 5.3 0.6 3.3 3.5 3.6 1.2 7.4 4.0 7.7 0.0 9.9
South Asia 4.6 6.4 2.6 4.8 5.9 6.1 6.5 12.4 10.0 14.6 11.2 14.8
Sub-Saharan Africa 3.3 4.9 0.6 2.4 0.3 5.1 4.6 8.5 .. .. 5.7 8.8
High income 2.8 2.0 2.1 1.3 1.5 2.1 3.4 0.8 6.9 4.6 7.2 4.3
Euro area 2.0 1.4 1.6 0.8 1.5 1.9 2.2 1.2 6.8 3.8 6.3 3.8
a. Covers mainland Tanzania only.
Growth of consumption and investment4.9Household fi nal
consumption
expenditure
General government
fi nal consumption
expenditure
Gross capital
formation
Goods and
services
average annual
% growth average annual
% growth
average annual
% growth
average annual
% growth
Total Per capita Exports Imports
1990–2000 2000–09 1990–2000 2000–09 1990–2000 2000–09 1990–2000 2000–09 1990–2000 2000–09 1990–2000 2000–09
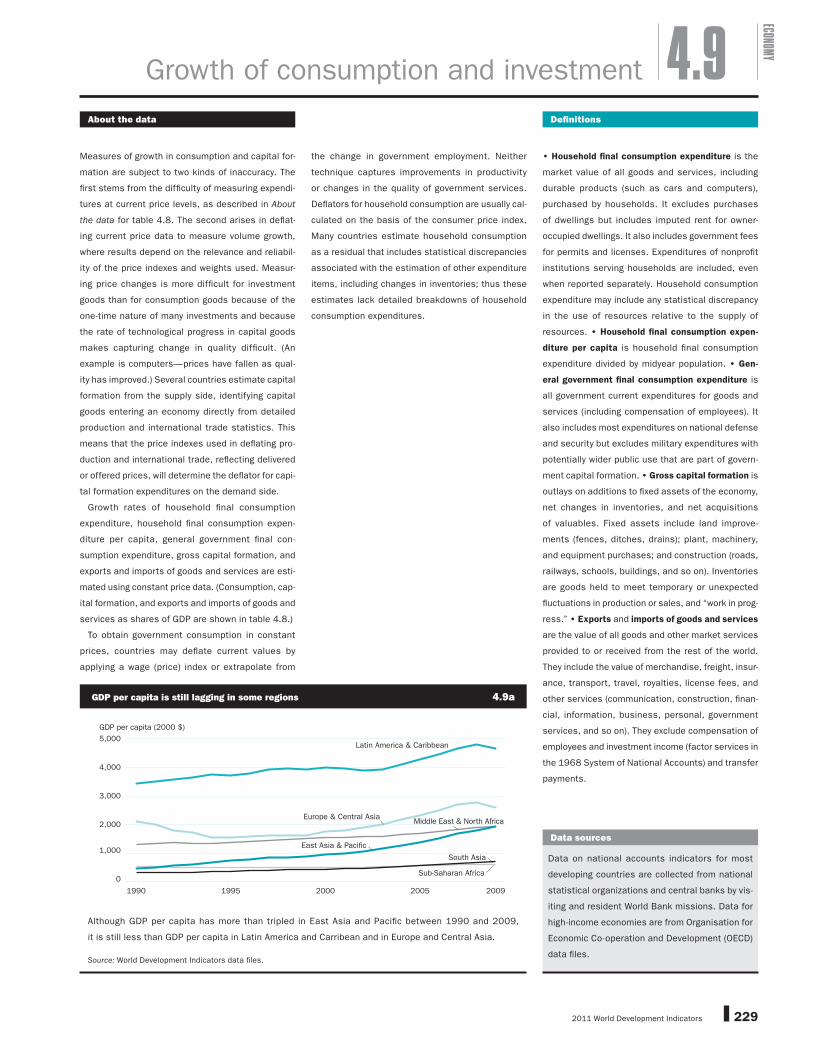
2011 World Development Indicators 229
ECONOMY
About the data Defi nitions
Measures of growth in consumption and capital for-
mation are subject to two kinds of inaccuracy. The
fi rst stems from the diffi culty of measuring expendi-
tures at current price levels, as described in About
the data for table 4.8. The second arises in defl at-
ing current price data to measure volume growth,
where results depend on the relevance and reliabil-
ity of the price indexes and weights used. Measur-
ing price changes is more diffi cult for investment
goods than for consumption goods because of the
one-time nature of many investments and because
the rate of technological progress in capital goods
makes capturing change in quality diffi cult. (An
example is computers—prices have fallen as qual-
ity has improved.) Several countries estimate capital
formation from the supply side, identifying capital
goods entering an economy directly from detailed
production and international trade statistics. This
means that the price indexes used in deflating pro-
duction and international trade, refl ecting delivered
or offered prices, will determine the defl ator for capi-
tal formation expenditures on the demand side.
Growth rates of household fi nal consumption
expenditure, household fi nal consumption expen-
diture per capita, general government fi nal con-
sumption expenditure, gross capital formation, and
exports and imports of goods and services are esti-
mated using constant price data. (Consumption, cap-
ital formation, and exports and imports of goods and
services as shares of GDP are shown in table 4.8.)
To obtain government consumption in constant
prices, countries may defl ate current values by
applying a wage (price) index or extrapolate from
the change in government employment. Neither
technique captures improvements in productivity
or changes in the quality of government services.
Defl ators for household consumption are usually cal-
culated on the basis of the consumer price index.
Many countries estimate household consumption
as a residual that includes statistical discrepancies
associated with the estimation of other expenditure
items, including changes in inventories; thus these
estimates lack detailed breakdowns of household
consumption expenditures.
• Household fi nal consumption expenditure is the
market value of all goods and services, including
durable products (such as cars and computers),
purchased by households. It excludes purchases
of dwellings but includes imputed rent for owner-
occupied dwellings. It also includes government fees
for permits and licenses. Expenditures of nonprofit
institutions serving households are included, even
when reported separately. Household consumption
expenditure may include any statistical discrepancy
in the use of resources relative to the supply of
resources. • Household fi nal consumption expen-
diture per capita is household fi nal consumption
expenditure divided by midyear population. • Gen-
eral government fi nal consumption expenditure is
all government current expenditures for goods and
services (including compensation of employees). It
also includes most expenditures on national defense
and security but excludes military expenditures with
potentially wider public use that are part of govern-
ment capital formation. • Gross capital formation is
outlays on additions to fi xed assets of the economy,
net changes in inventories, and net acquisitions
of valuables. Fixed assets include land improve-
ments (fences, ditches, drains); plant, machinery,
and equipment purchases; and construction (roads,
railways, schools, buildings, and so on). Inventories
are goods held to meet temporary or unexpected
fl uctuations in production or sales, and “work in prog-
ress.” • Exports and imports of goods and services
are the value of all goods and other market services
provided to or received from the rest of the world.
They include the value of merchandise, freight, insur-
ance, transport, travel, royalties, license fees, and
other services (communication, construction, fi nan-
cial, information, business, personal, government
services, and so on). They exclude compensation of
employees and investment income (factor services in
the 1968 System of National Accounts) and transfer
payments.
4.9Growth of consumption and investment
Data sources
Data on national accounts indicators for most
developing countries are collected from national
statistical organizations and central banks by vis-
iting and resident World Bank missions. Data for
high-income economies are from Organisation for
Economic Co-operation and Development (OECD)
data fi les.
0
1,000
2,000
3,000
4,000
5,000
20092005200019951990
GDP per capita (2000 $)
Europe & Central AsiaMiddle East & North Africa
Latin America & Caribbean
South Asia
East Asia & Pacific
Sub-Saharan Africa
Although GDP per capita has more than tripled in East Asia and Pacifi c between 1990 and 2009,
it is still less than GDP per capita in Latin America and Carribean and in Europe and Central Asia.
Source: World Development Indicators data fi les.
GDP per capita is still lagging in some regions 4.9a

2011 World Development Indicators230
4.10 Toward a broader measure of national income
Gross domestic
product
Gross national
income
Adjustments Adjusted net
national income
Gross
domestic
product
Gross
national
income
Adjusted
net national
income
$ billions $ billions
Consumption of
fi xed capital
% of GNI
Natural resource
depletion
% of GNI $ billions % growth % growth % growth
2009 2009 2009 2009 2009 2000–2009 2000–2009 2000–2009
Afghanistan 14.5 10.6 7.7 3.4 9.5 .. .. ..
Albania 12.0 11.9 10.5 1.3 10.5 5.4 5.8 7.3
Algeria 140.6 139.6 10.5 16.9 101.2 4.0 3.7 4.9
Angola 75.5 67.5 11.7 29.1 40.0 13.1 .. ..
Argentina 307.2 297.7 11.8 4.9 248.2 5.4 5.1 5.4
Armenia 8.7 8.9 9.7 0.5 8.0 10.5 10.5 11.4
Australia 924.8 900.7 14.4 5.1 725.2 3.3 3.6 3.3
Austria 381.1 377.1 14.3 0.1 322.8 2.0 1.9 2.0
Azerbaijan 43.0 40.3 11.5 32.7 22.5 17.9 19.4 19.8
Bangladesh 89.4 97.5 6.8 2.6 88.3 5.9 5.3 5.9
Belarus 49.0 47.9 11.1 0.9 42.2 8.4 8.6 10.6
Belgium 471.2 475.0 14.0 0.0 408.7 1.7 1.9 1.3
Benin 6.7 6.6 7.9 1.2 6.0 4.0 3.9 3.6
Bolivia 17.3 16.7 9.5 11.2 13.2 4.1 4.3 3.0
Bosnia and Herzegovina 17.0 17.4 10.4 .. .. 5.0 5.9 ..
Botswana 11.8 11.3 11.5 2.8 9.7 4.4 4.2 3.0
Brazil 1,594.5 1,562.4 11.8 3.1 1,330.0 3.6 3.4 3.6
Bulgaria 48.7 46.6 11.7 1.1 40.7 5.4 6.1 4.9
Burkina Faso 8.1 8.0 7.4 1.6 7.3 5.4 6.0 5.5
Burundi 1.3 1.3 5.5 10.6 1.1 3.0 .. ..
Cambodia 9.9 9.4 8.1 0.2 8.6 9.0 9.3 10.2
Cameroon 22.2 22.1 8.6 4.8 19.1 3.3 2.7 4.4
Canada 1,336.1 1,317.3 14.2 2.3 1,100.4 2.1 1.9 2.9
Central African Republic 2.0 2.0 7.2 0.0 1.8 0.8 –0.9 –1.2
Chad 6.8 6.1 9.9 25.2 4.1 10.2 20.2 –5.5
Chile 163.7 153.4 12.6 10.0 118.8 4.1 5.0 4.9
China 4,985.5 5,028.8 10.2 3.1 4,355.8 10.9 10.6 9.9
Hong Kong SAR, China 210.6 216.9 13.6 0.0 188.5 4.7 4.4 4.2
Colombia 234.0 224.5 11.3 6.2 185.3 4.5 4.7 4.3
Congo, Dem. Rep. 10.6 9.8 5.9 10.7 8.2 5.2 5.5 7.5
Congo, Rep. 9.6 6.9 13.6 50.6 2.5 4.0 .. ..
Costa Rica 29.2 28.8 11.3 0.2 25.5 5.1 4.6 4.0
Côte d’Ivoire 23.3 22.4 8.8 3.1 19.7 0.8 0.6 0.6
Croatia 63.0 60.5 12.9 0.8 52.2 3.9 4.0 5.2
Cuba 62.7 61.8 .. 3.3 52.8 6.7 6.6 6.7
Czech Republic 190.3 178.1 13.6 0.3 153.3 4.1 4.6 4.6
Denmark 309.6 318.3 16.5 1.5 261.1 1.2 0.7 2.0
Dominican Republic 46.8 45.0 11.1 0.5 39.8 5.5 5.4 5.1
Ecuador 57.2 56.1 10.7 9.9 44.5 5.0 4.5 5.2
Egypt, Arab Rep. 188.4 188.6 9.6 7.3 156.9 4.9 5.0 2.8
El Salvador 21.1 20.4 10.5 0.5 18.2 2.6 2.7 2.3
Eritrea 1.9 1.9 6.8 0.8 1.7 0.2 1.4 4.0
Estonia 19.1 18.5 12.8 0.7 16.0 5.9 6.1 6.7
Ethiopia 28.5 28.5 6.7 4.5 25.3 8.5 8.4 10.3
Finland 238.0 238.1 17.0 0.1 197.6 2.5 2.4 1.7
France 2,649.4 2,671.2 14.2 0.0 2,292.1 1.5 1.5 1.4
Gabon 11.1 9.5 13.2 29.2 5.5 2.1 2.6 3.3
Gambia, The 0.7 0.7 7.5 1.0 0.6 5.2 5.4 3.6
Georgia 10.7 10.6 8.8 0.1 9.6 7.4 .. ..
Germany 3,330.0 3,377.0 13.8 0.1 2,908.2 1.0 0.6 1.4
Ghana 26.2 25.9 8.6 6.9 19.7 5.8 .. ..
Greece 329.9 320.8 13.9 0.2 275.8 3.6 4.1 3.0
Guatemala 37.3 36.1 10.1 1.2 32.0 3.7 3.8 3.2
Guinea 4.1 3.7 7.7 6.6 3.2 3.0 4.1 0.9
Guinea-Bissau 0.8 0.8 7.4 0.0 0.8 1.0 .. ..
Haiti 6.5 .. .. .. .. 0.7 .. ..
Honduras 14.3 13.8 9.6 0.4 12.4 4.9 4.8 3.0
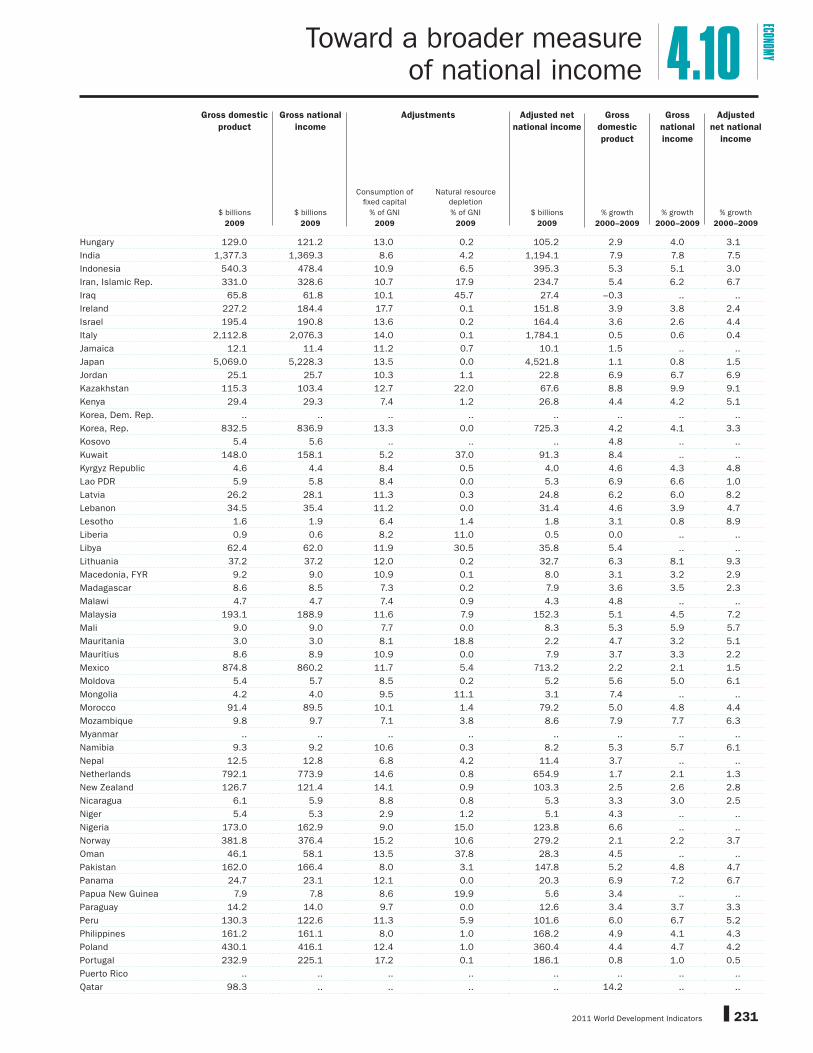
2011 World Development Indicators 231
ECONOMYToward a broader measure of national income 4.10
Gross domestic
product
Gross national
income
Adjustments Adjusted net
national income
Gross
domestic
product
Gross
national
income
Adjusted
net national
income
$ billions $ billions
Consumption of
fi xed capital
% of GNI
Natural resource
depletion
% of GNI $ billions % growth % growth % growth
2009 2009 2009 2009 2009 2000–2009 2000–2009 2000–2009
Hungary 129.0 121.2 13.0 0.2 105.2 2.9 4.0 3.1
India 1,377.3 1,369.3 8.6 4.2 1,194.1 7.9 7.8 7.5
Indonesia 540.3 478.4 10.9 6.5 395.3 5.3 5.1 3.0
Iran, Islamic Rep. 331.0 328.6 10.7 17.9 234.7 5.4 6.2 6.7
Iraq 65.8 61.8 10.1 45.7 27.4 –0.3 .. ..
Ireland 227.2 184.4 17.7 0.1 151.8 3.9 3.8 2.4
Israel 195.4 190.8 13.6 0.2 164.4 3.6 2.6 4.4
Italy 2,112.8 2,076.3 14.0 0.1 1,784.1 0.5 0.6 0.4
Jamaica 12.1 11.4 11.2 0.7 10.1 1.5 .. ..
Japan 5,069.0 5,228.3 13.5 0.0 4,521.8 1.1 0.8 1.5
Jordan 25.1 25.7 10.3 1.1 22.8 6.9 6.7 6.9
Kazakhstan 115.3 103.4 12.7 22.0 67.6 8.8 9.9 9.1
Kenya 29.4 29.3 7.4 1.2 26.8 4.4 4.2 5.1
Korea, Dem. Rep. .. .. .. .. .. .. .. ..
Korea, Rep. 832.5 836.9 13.3 0.0 725.3 4.2 4.1 3.3
Kosovo 5.4 5.6 .. .. .. 4.8 .. ..
Kuwait 148.0 158.1 5.2 37.0 91.3 8.4 .. ..
Kyrgyz Republic 4.6 4.4 8.4 0.5 4.0 4.6 4.3 4.8
Lao PDR 5.9 5.8 8.4 0.0 5.3 6.9 6.6 1.0
Latvia 26.2 28.1 11.3 0.3 24.8 6.2 6.0 8.2
Lebanon 34.5 35.4 11.2 0.0 31.4 4.6 3.9 4.7
Lesotho 1.6 1.9 6.4 1.4 1.8 3.1 0.8 8.9
Liberia 0.9 0.6 8.2 11.0 0.5 0.0 .. ..
Libya 62.4 62.0 11.9 30.5 35.8 5.4 .. ..
Lithuania 37.2 37.2 12.0 0.2 32.7 6.3 8.1 9.3
Macedonia, FYR 9.2 9.0 10.9 0.1 8.0 3.1 3.2 2.9
Madagascar 8.6 8.5 7.3 0.2 7.9 3.6 3.5 2.3
Malawi 4.7 4.7 7.4 0.9 4.3 4.8 .. ..
Malaysia 193.1 188.9 11.6 7.9 152.3 5.1 4.5 7.2
Mali 9.0 9.0 7.7 0.0 8.3 5.3 5.9 5.7
Mauritania 3.0 3.0 8.1 18.8 2.2 4.7 3.2 5.1
Mauritius 8.6 8.9 10.9 0.0 7.9 3.7 3.3 2.2
Mexico 874.8 860.2 11.7 5.4 713.2 2.2 2.1 1.5
Moldova 5.4 5.7 8.5 0.2 5.2 5.6 5.0 6.1
Mongolia 4.2 4.0 9.5 11.1 3.1 7.4 .. ..
Morocco 91.4 89.5 10.1 1.4 79.2 5.0 4.8 4.4
Mozambique 9.8 9.7 7.1 3.8 8.6 7.9 7.7 6.3
Myanmar .. .. .. .. .. .. .. ..
Namibia 9.3 9.2 10.6 0.3 8.2 5.3 5.7 6.1
Nepal 12.5 12.8 6.8 4.2 11.4 3.7 .. ..
Netherlands 792.1 773.9 14.6 0.8 654.9 1.7 2.1 1.3
New Zealand 126.7 121.4 14.1 0.9 103.3 2.5 2.6 2.8
Nicaragua 6.1 5.9 8.8 0.8 5.3 3.3 3.0 2.5
Niger 5.4 5.3 2.9 1.2 5.1 4.3 .. ..
Nigeria 173.0 162.9 9.0 15.0 123.8 6.6 .. ..
Norway 381.8 376.4 15.2 10.6 279.2 2.1 2.2 3.7
Oman 46.1 58.1 13.5 37.8 28.3 4.5 .. ..
Pakistan 162.0 166.4 8.0 3.1 147.8 5.2 4.8 4.7
Panama 24.7 23.1 12.1 0.0 20.3 6.9 7.2 6.7
Papua New Guinea 7.9 7.8 8.6 19.9 5.6 3.4 .. ..
Paraguay 14.2 14.0 9.7 0.0 12.6 3.4 3.7 3.3
Peru 130.3 122.6 11.3 5.9 101.6 6.0 6.7 5.2
Philippines 161.2 161.1 8.0 1.0 168.2 4.9 4.1 4.3
Poland 430.1 416.1 12.4 1.0 360.4 4.4 4.7 4.2
Portugal 232.9 225.1 17.2 0.1 186.1 0.8 1.0 0.5
Puerto Rico .. .. .. .. .. .. .. ..
Qatar 98.3 .. .. .. .. 14.2 .. ..

2011 World Development Indicators232
Gross domestic
product
Gross national
income
Adjustments Adjusted net
national income
Gross
domestic
product
Gross
national
income
Adjusted
net national
income
$ billions $ billions
Consumption of
fi xed capital
% of GNI
Natural resource
depletion
% of GNI $ billions % growth % growth % growth
2009 2009 2009 2009 2009 2000–2009 2000–2009 2000–2009
Toward a broader measure of national income4.10
Romania 161.1 164.1 11.2 1.3 143.5 5.6 5.4 7.2
Russian Federation 1,231.9 1,192.4 12.0 14.5 876.2 6.0 6.1 8.4
Rwanda 5.2 5.2 7.4 2.4 4.7 7.6 .. ..
Saudi Arabia 375.8 384.4 12.6 28.9 226.8 3.8 3.4 6.2
Senegal 12.8 12.8 8.4 0.3 11.7 4.3 4.1 ..
Serbia 43.0 42.3 .. .. .. 5.0 5.3 ..
Sierra Leone 1.9 1.9 6.8 2.1 1.7 9.5 .. ..
Singapore 182.2 179.2 14.1 0.0 154.0 6.5 .. ..
Slovak Republic 87.6 84.7 13.0 0.3 73.4 5.8 6.1 5.6
Slovenia 48.5 47.3 13.5 0.2 40.8 3.8 4.7 4.4
Somalia .. .. .. .. .. .. .. ..
South Africa 285.4 279.0 14.1 5.4 224.6 4.1 4.1 3.8
Spain 1,460.3 1,430.2 13.9 0.0 1,231.5 2.8 2.9 2.7
Sri Lanka 42.0 41.5 9.5 0.5 37.3 5.5 .. ..
Sudan 54.7 49.3 9.7 11.1 39.0 7.3 7.5 5.7
Swaziland 3.0 2.9 10.2 0.1 2.6 2.6 3.2 1.7
Sweden 406.1 413.4 13.3 0.2 357.4 2.4 2.0 2.5
Switzerland 491.9 512.3 14.1 0.0 440.2 1.9 2.6 1.5
Syrian Arab Republic 52.2 50.9 9.9 10.2 40.7 4.4 4.0 6.3
Tajikistan 5.0 4.9 7.9 0.2 4.5 8.2 7.8 5.5
Tanzaniaa 21.4 21.4 7.3 2.5 19.3 7.1 6.9 6.4
Thailand 263.8 252.0 10.9 3.2 216.6 4.6 4.8 4.4
Timor-Leste 0.6 2.9 1.2 .. .. 2.4 .. ..
Togo 2.9 2.8 7.0 3.6 2.5 2.5 2.3 3.0
Trinidad and Tobago 21.2 20.7 12.9 28.2 12.2 7.4 8.3 5.7
Tunisia 39.6 37.3 11.0 4.6 31.5 4.9 5.0 3.7
Turkey 614.6 606.9 11.7 0.2 534.7 4.9 4.8 4.0
Turkmenistan 19.9 19.2 10.8 .. .. 13.9 14.0 ..
Uganda 16.0 15.7 7.4 4.7 13.8 7.8 7.8 7.5
Ukraine 113.5 111.1 9.9 3.8 95.9 5.6 5.6 8.1
United Arab Emirates 230.3 .. .. .. .. 7.0 .. ..
United Kingdom 2,174.5 2,218.1 13.5 1.2 1,892.3 2.0 1.8 2.1
United States 14,119.0 14,011.0 14.3 0.7 11,909.0 2.0 2.2 1.4
Uruguay 31.5 30.8 12.0 0.4 27.0 3.4 3.7 2.8
Uzbekistan 32.1 32.5 8.4 17.8 24.0 6.9 5.0 –6.4
Venezuela, RB 326.1 323.5 12.2 9.8 252.4 4.9 4.6 8.6
Vietnam 90.1 85.2 8.8 7.2 71.5 7.6 8.0 7.0
West Bank and Gaza .. .. .. .. .. –0.9 0.2 ..
Yemen, Rep. 26.4 24.9 9.0 13.2 19.4 3.9 .. ..
Zambia 12.8 11.4 9.3 11.5 9.1 5.4 7.4 5.3
Zimbabwe 5.6 5.2 .. 3.5 4.6 –7.5 –7.2 –9.0
World 58,252.1 w 57,867.2 w 13.1 w 2.4 w 48,996.8 w 2.9 w 2.8 w 2.6 w
Low income 431.5 433.8 7.2 3.8 383.4 5.4 5.6 5.6
Middle income 16,206.0 16,112.0 10.7 5.8 13,495.7 6.4 6.4 6.2
Lower middle income 8,880.2 8,952.6 9.9 4.5 7,727.3 8.5 8.4 7.8
Upper middle income 7,318.4 7,173.2 11.8 7.5 5,782.6 4.4 4.3 4.7
Low & middle income 16,649.8 16,558.2 10.7 5.8 13,887.1 6.4 6.3 6.2
East Asia & Pacifi c 6,346.0 6,307.5 10.3 3.6 5,456.9 9.4 9.2 8.6
Europe & Central Asia 2,591.7 2,521.8 11.7 9.2 1,977.5 5.9 5.9 6.8
Latin America & Carib. 4,017.9 3,921.9 11.7 4.8 3,277.5 3.8 3.7 3.8
Middle East & N. Africa 1,062.4 1,192.9 10.4 14.8 945.9 4.7 4.9 5.0
South Asia 1,700.3 1,702.0 8.4 3.9 1,492.3 7.3 7.3 7.0
Sub-Saharan Africa 945.9 904.2 10.6 9.3 722.6 5.1 4.5 4.2
High income 41,607.7 41,369.3 14.1 1.0 35,134.3 2.0 1.9 1.7
Euro area 12,465.3 12,368.9 14.2 0.1 10,599.8 1.5 1.4 1.4
a. Covers mainland Tanzania only.

2011 World Development Indicators 233
ECONOMY
About the data
An economy’s growth is typically measured by the
change in the volume of its output, as shown in table
4.1. However the widely tracked gross domestic prod-
uct (GDP) may not always be the most relevant sum-
mary of aggregated economic performance for all
economies, such as when production occurs at the
expense of consuming capital stock. For countries
with signifi cant exhaustible natural resources and
important foreign-investor presence, adjusted net
national income complements GDP in assessing eco-
nomic progress (Hamilton and Ley 2010).
The table presents three measures of economic
progress: GDP, gross national income (GNI), and
adjusted net national income. GDP accounts for
all domestic production, regardless of whether the
income accrues to domestic or foreign institutions.
GNI accounts for the operation of foreign inves-
tors, who may be repatriating some of the income
produced domestically. GNI comprises GDP plus
net receipts of primary income from nonresident
sources. Adjusted net national income goes a step
further by subtracting from GNI a charge for the con-
sumption of fi xed capital (a calculation that yields
net national income) and for the depletion of natural
resources. The deduction for the depletion of natural
resources, which covers net forest depletion, energy
depletion, and mineral depletion, refl ects the decline
in asset values associated with the extraction and
harvest of natural resources. For more discussion
of the estimates and methodology of produced capi-
tal consumption and natural capital depletion, see
About the data in table 4.11.
The United Nations System of National Accounts
(SNA) includes nonproduced natural assets (such
as land, mineral resources, and forests) within the
asset boundary when they are under the effective
control of institutional units. The calculation of
adjusted net national income, which accounts for
net forest, energy, and mineral depletion, thus
remains within the SNA boundaries. This point is
critical because it allows for comparisons across
GDP, GNI, and adjusted net national income; such
comparisons reveal the impact of natural resource
depletion, which is otherwise ignored by the popular
economic indicators.
Adjusted net national income is particularly useful
in monitoring low-income, resource-rich economies,
like many countries in Sub-Saharan Africa, because
such economies often see large natural resources
depletion as well as substantial exports of resource
rents to foreign mining companies. For recent years
adjusted net national income gives a picture of eco-
nomic growth that is strikingly different from the one
provided by GDP.
The key to increasing future consumption and
thus the standard of living lies in increasing national
wealth—including not only the traditional measures
of capital (such as produced and human capital),
but also natural capital. Natural capital comprises
such assets as land, forests, and subsoil resources.
All three types of capital are key to sustaining eco-
nomic growth. By accounting for the consumption
of fi xed and natural capital depletion, adjusted net
national income better measures the income avail-
able for consumption or for investment to increase
a country’s future consumption. For a measure of
how comprehensive wealth is changing over time,
see table 4.11.
Methods of computing growth are described in Sta-
tistical methods. For a detailed note on methodology,
see data.worldbank.org/.
• Gross domestic product is the sum of value
added by all resident producers plus any product
taxes (less subsidies) not included in the valu-
ation of output. • Gross national income is GDP
plus net receipts of primary income (compensation
of employees and property income) from abroad.
• Consumption of fi xed capital is the replacement
value of capital used up in production. • Natural
resource depletion is the sum of net forest deple-
tion, energy depletion, and mineral depletion. Net for-
est depletion is unit resource rents times the excess
of roundwood harvest over natural growth. Energy
depletion is the ratio of the value of the stock of
energy resources to the remaining reserve lifetime
(capped at 25 years). It covers coal, crude oil, and
natural gas. Mineral depletion is the ratio of the value
of the stock of mineral resources to the remaining
reserve lifetime (capped at 25 years). It covers tin,
gold, lead, zinc, iron, copper, nickel, silver, bauxite,
and phosphate. • Adjusted net national income is
GNI minus consumption of fi xed capital and natural
resources depletion.
Defi nitions
4.10Toward a broader measure of national income
300
350
400
450
500
550
200920082006200420022000
GDP
Adjusted net national income
(2000 $ billions)
Source: World Development Indicators data fi les.
GDP and adjusted net national income in Sub-Saharan Africa, 2000–09 (2000 $ billions) 4.10a Data sources
GNI and GDP are estimated by World Bank staff
based on national accounts data collected by
World Bank staff during economic missions or
reported by national statistical offi ces to other
international organizations such as the OECD.
Data on consumption of fi xed capital are from
the United Nations Statistics Division’s National
Accounts Statistics: Main Aggregates and Detailed
Tables, extrapolated to 2009. Data on energy, min-
eral, and forest depletion are estimates based
on sources and methods in World Bank’s The
Changing Wealth of Nations: Measuring Sustain-
able Development in the New Millennium (2011a).
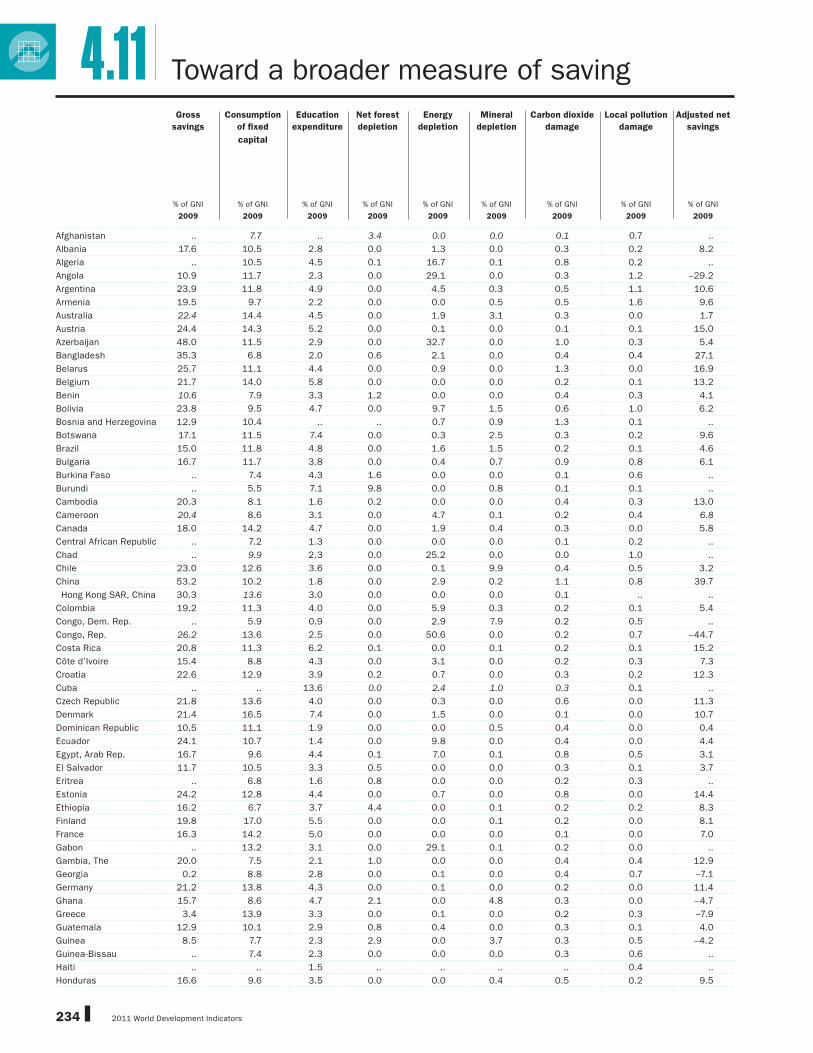
2011 World Development Indicators234
4.11 Toward a broader measure of saving
Gross
savings
Consumption
of fi xed
Education
expenditure
Net forest
depletion
Energy
depletion
Mineral
depletion
Carbon dioxide
damage
Local pollution
damage
Adjusted net
savings
% of GNI
capital
% of GNI % of GNI % of GNI % of GNI % of GNI % of GNI % of GNI% of GNI
2009 2009 2009 2009 2009 2009 2009 2009 2009
Afghanistan .. 7.7 .. 3.4 0.0 0.0 0.1 0.7 ..
Albania 17.6 10.5 2.8 0.0 1.3 0.0 0.3 0.2 8.2
Algeria .. 10.5 4.5 0.1 16.7 0.1 0.8 0.2 ..
Angola 10.9 11.7 2.3 0.0 29.1 0.0 0.3 1.2 –29.2
Argentina 23.9 11.8 4.9 0.0 4.5 0.3 0.5 1.1 10.6
Armenia 19.5 9.7 2.2 0.0 0.0 0.5 0.5 1.6 9.6
Australia 22.4 14.4 4.5 0.0 1.9 3.1 0.3 0.0 1.7
Austria 24.4 14.3 5.2 0.0 0.1 0.0 0.1 0.1 15.0
Azerbaijan 48.0 11.5 2.9 0.0 32.7 0.0 1.0 0.3 5.4
Bangladesh 35.3 6.8 2.0 0.6 2.1 0.0 0.4 0.4 27.1
Belarus 25.7 11.1 4.4 0.0 0.9 0.0 1.3 0.0 16.9
Belgium 21.7 14.0 5.8 0.0 0.0 0.0 0.2 0.1 13.2
Benin 10.6 7.9 3.3 1.2 0.0 0.0 0.4 0.3 4.1
Bolivia 23.8 9.5 4.7 0.0 9.7 1.5 0.6 1.0 6.2
Bosnia and Herzegovina 12.9 10.4 .. .. 0.7 0.9 1.3 0.1 ..
Botswana 17.1 11.5 7.4 0.0 0.3 2.5 0.3 0.2 9.6
Brazil 15.0 11.8 4.8 0.0 1.6 1.5 0.2 0.1 4.6
Bulgaria 16.7 11.7 3.8 0.0 0.4 0.7 0.9 0.8 6.1
Burkina Faso .. 7.4 4.3 1.6 0.0 0.0 0.1 0.6 ..
Burundi .. 5.5 7.1 9.8 0.0 0.8 0.1 0.1 ..
Cambodia 20.3 8.1 1.6 0.2 0.0 0.0 0.4 0.3 13.0
Cameroon 20.4 8.6 3.1 0.0 4.7 0.1 0.2 0.4 6.8
Canada 18.0 14.2 4.7 0.0 1.9 0.4 0.3 0.0 5.8
Central African Republic .. 7.2 1.3 0.0 0.0 0.0 0.1 0.2 ..
Chad .. 9.9 2.3 0.0 25.2 0.0 0.0 1.0 ..
Chile 23.0 12.6 3.6 0.0 0.1 9.9 0.4 0.5 3.2
China 53.2 10.2 1.8 0.0 2.9 0.2 1.1 0.8 39.7
Hong Kong SAR, China 30.3 13.6 3.0 0.0 0.0 0.0 0.1 .. ..
Colombia 19.2 11.3 4.0 0.0 5.9 0.3 0.2 0.1 5.4
Congo, Dem. Rep. .. 5.9 0.9 0.0 2.9 7.9 0.2 0.5 ..
Congo, Rep. 26.2 13.6 2.5 0.0 50.6 0.0 0.2 0.7 –44.7
Costa Rica 20.8 11.3 6.2 0.1 0.0 0.1 0.2 0.1 15.2
Côte d’Ivoire 15.4 8.8 4.3 0.0 3.1 0.0 0.2 0.3 7.3
Croatia 22.6 12.9 3.9 0.2 0.7 0.0 0.3 0.2 12.3
Cuba .. .. 13.6 0.0 2.4 1.0 0.3 0.1 ..
Czech Republic 21.8 13.6 4.0 0.0 0.3 0.0 0.6 0.0 11.3
Denmark 21.4 16.5 7.4 0.0 1.5 0.0 0.1 0.0 10.7
Dominican Republic 10.5 11.1 1.9 0.0 0.0 0.5 0.4 0.0 0.4
Ecuador 24.1 10.7 1.4 0.0 9.8 0.0 0.4 0.0 4.4
Egypt, Arab Rep. 16.7 9.6 4.4 0.1 7.0 0.1 0.8 0.5 3.1
El Salvador 11.7 10.5 3.3 0.5 0.0 0.0 0.3 0.1 3.7
Eritrea .. 6.8 1.6 0.8 0.0 0.0 0.2 0.3 ..
Estonia 24.2 12.8 4.4 0.0 0.7 0.0 0.8 0.0 14.4
Ethiopia 16.2 6.7 3.7 4.4 0.0 0.1 0.2 0.2 8.3
Finland 19.8 17.0 5.5 0.0 0.0 0.1 0.2 0.0 8.1
France 16.3 14.2 5.0 0.0 0.0 0.0 0.1 0.0 7.0
Gabon .. 13.2 3.1 0.0 29.1 0.1 0.2 0.0 ..
Gambia, The 20.0 7.5 2.1 1.0 0.0 0.0 0.4 0.4 12.9
Georgia 0.2 8.8 2.8 0.0 0.1 0.0 0.4 0.7 –7.1
Germany 21.2 13.8 4.3 0.0 0.1 0.0 0.2 0.0 11.4
Ghana 15.7 8.6 4.7 2.1 0.0 4.8 0.3 0.0 –4.7
Greece 3.4 13.9 3.3 0.0 0.1 0.0 0.2 0.3 –7.9
Guatemala 12.9 10.1 2.9 0.8 0.4 0.0 0.3 0.1 4.0
Guinea 8.5 7.7 2.3 2.9 0.0 3.7 0.3 0.5 –4.2
Guinea-Bissau .. 7.4 2.3 0.0 0.0 0.0 0.3 0.6 ..
Haiti .. .. 1.5 .. .. .. .. 0.4 ..
Honduras 16.6 9.6 3.5 0.0 0.0 0.4 0.5 0.2 9.5
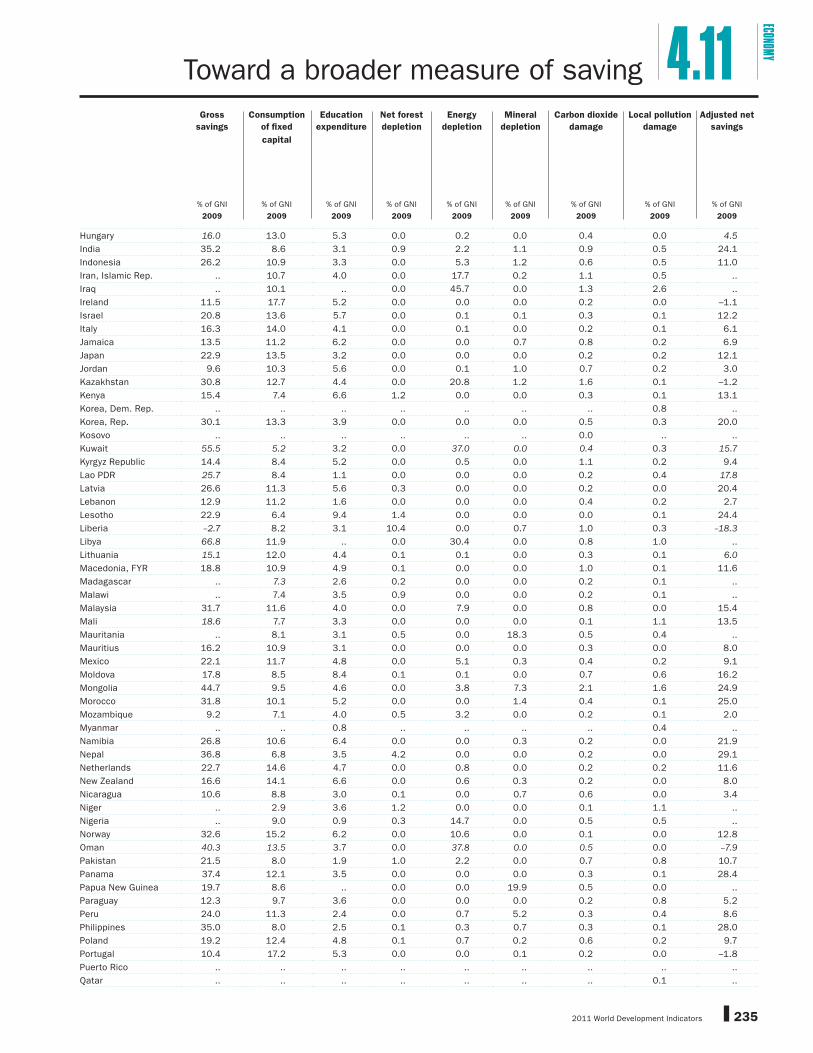
2011 World Development Indicators 235
ECONOMY
Toward a broader measure of saving 4.11Gross
savings
Consumption
of fi xed
Education
expenditure
Net forest
depletion
Energy
depletion
Mineral
depletion
Carbon dioxide
damage
Local pollution
damage
Adjusted net
savings
% of GNI
capital
% of GNI % of GNI % of GNI % of GNI % of GNI % of GNI % of GNI% of GNI
2009 2009 2009 2009 2009 2009 2009 2009 2009
Hungary 16.0 13.0 5.3 0.0 0.2 0.0 0.4 0.0 4.5
India 35.2 8.6 3.1 0.9 2.2 1.1 0.9 0.5 24.1
Indonesia 26.2 10.9 3.3 0.0 5.3 1.2 0.6 0.5 11.0
Iran, Islamic Rep. .. 10.7 4.0 0.0 17.7 0.2 1.1 0.5 ..
Iraq .. 10.1 .. 0.0 45.7 0.0 1.3 2.6 ..
Ireland 11.5 17.7 5.2 0.0 0.0 0.0 0.2 0.0 –1.1
Israel 20.8 13.6 5.7 0.0 0.1 0.1 0.3 0.1 12.2
Italy 16.3 14.0 4.1 0.0 0.1 0.0 0.2 0.1 6.1
Jamaica 13.5 11.2 6.2 0.0 0.0 0.7 0.8 0.2 6.9
Japan 22.9 13.5 3.2 0.0 0.0 0.0 0.2 0.2 12.1
Jordan 9.6 10.3 5.6 0.0 0.1 1.0 0.7 0.2 3.0
Kazakhstan 30.8 12.7 4.4 0.0 20.8 1.2 1.6 0.1 –1.2
Kenya 15.4 7.4 6.6 1.2 0.0 0.0 0.3 0.1 13.1
Korea, Dem. Rep. .. .. .. .. .. .. .. 0.8 ..
Korea, Rep. 30.1 13.3 3.9 0.0 0.0 0.0 0.5 0.3 20.0
Kosovo .. .. .. .. .. .. 0.0 .. ..
Kuwait 55.5 5.2 3.2 0.0 37.0 0.0 0.4 0.3 15.7
Kyrgyz Republic 14.4 8.4 5.2 0.0 0.5 0.0 1.1 0.2 9.4
Lao PDR 25.7 8.4 1.1 0.0 0.0 0.0 0.2 0.4 17.8
Latvia 26.6 11.3 5.6 0.3 0.0 0.0 0.2 0.0 20.4
Lebanon 12.9 11.2 1.6 0.0 0.0 0.0 0.4 0.2 2.7
Lesotho 22.9 6.4 9.4 1.4 0.0 0.0 0.0 0.1 24.4
Liberia –2.7 8.2 3.1 10.4 0.0 0.7 1.0 0.3 –18.3
Libya 66.8 11.9 .. 0.0 30.4 0.0 0.8 1.0 ..
Lithuania 15.1 12.0 4.4 0.1 0.1 0.0 0.3 0.1 6.0
Macedonia, FYR 18.8 10.9 4.9 0.1 0.0 0.0 1.0 0.1 11.6
Madagascar .. 7.3 2.6 0.2 0.0 0.0 0.2 0.1 ..
Malawi .. 7.4 3.5 0.9 0.0 0.0 0.2 0.1 ..
Malaysia 31.7 11.6 4.0 0.0 7.9 0.0 0.8 0.0 15.4
Mali 18.6 7.7 3.3 0.0 0.0 0.0 0.1 1.1 13.5
Mauritania .. 8.1 3.1 0.5 0.0 18.3 0.5 0.4 ..
Mauritius 16.2 10.9 3.1 0.0 0.0 0.0 0.3 0.0 8.0
Mexico 22.1 11.7 4.8 0.0 5.1 0.3 0.4 0.2 9.1
Moldova 17.8 8.5 8.4 0.1 0.1 0.0 0.7 0.6 16.2
Mongolia 44.7 9.5 4.6 0.0 3.8 7.3 2.1 1.6 24.9
Morocco 31.8 10.1 5.2 0.0 0.0 1.4 0.4 0.1 25.0
Mozambique 9.2 7.1 4.0 0.5 3.2 0.0 0.2 0.1 2.0
Myanmar .. .. 0.8 .. .. .. .. 0.4 ..
Namibia 26.8 10.6 6.4 0.0 0.0 0.3 0.2 0.0 21.9
Nepal 36.8 6.8 3.5 4.2 0.0 0.0 0.2 0.0 29.1
Netherlands 22.7 14.6 4.7 0.0 0.8 0.0 0.2 0.2 11.6
New Zealand 16.6 14.1 6.6 0.0 0.6 0.3 0.2 0.0 8.0
Nicaragua 10.6 8.8 3.0 0.1 0.0 0.7 0.6 0.0 3.4
Niger .. 2.9 3.6 1.2 0.0 0.0 0.1 1.1 ..
Nigeria .. 9.0 0.9 0.3 14.7 0.0 0.5 0.5 ..
Norway 32.6 15.2 6.2 0.0 10.6 0.0 0.1 0.0 12.8
Oman 40.3 13.5 3.7 0.0 37.8 0.0 0.5 0.0 –7.9
Pakistan 21.5 8.0 1.9 1.0 2.2 0.0 0.7 0.8 10.7
Panama 37.4 12.1 3.5 0.0 0.0 0.0 0.3 0.1 28.4
Papua New Guinea 19.7 8.6 .. 0.0 0.0 19.9 0.5 0.0 ..
Paraguay 12.3 9.7 3.6 0.0 0.0 0.0 0.2 0.8 5.2
Peru 24.0 11.3 2.4 0.0 0.7 5.2 0.3 0.4 8.6
Philippines 35.0 8.0 2.5 0.1 0.3 0.7 0.3 0.1 28.0
Poland 19.2 12.4 4.8 0.1 0.7 0.2 0.6 0.2 9.7
Portugal 10.4 17.2 5.3 0.0 0.0 0.1 0.2 0.0 –1.8
Puerto Rico .. .. .. .. .. .. .. .. ..
Qatar .. .. .. .. .. .. .. 0.1 ..

2011 World Development Indicators236
Toward a broader measure of saving4.11Gross
savings
Consumption
of fi xed
Education
expenditure
Net forest
depletion
Energy
depletion
Mineral
depletion
Carbon dioxide
damage
Local pollution
damage
Adjusted net
savings
% of GNI
capital
% of GNI % of GNI % of GNI % of GNI % of GNI % of GNI % of GNI% of GNI
2009 2009 2009 2009 2009 2009 2009 2009 2009
Romania 28.4 11.2 3.4 0.0 1.4 0.0 0.5 0.0 18.8
Russian Federation 23.4 12.0 3.5 0.0 13.8 0.7 1.1 0.1 –0.8
Rwanda 15.2 7.4 3.6 2.4 0.0 0.0 0.1 0.1 8.8
Saudi Arabia 31.5 12.6 7.2 0.0 28.9 0.0 0.8 0.7 –3.9
Senegal 16.1 8.4 5.4 0.0 0.0 0.3 0.3 0.5 7.8
Serbia 17.5 .. 4.7 .. 0.4 0.0 0.0 .. ..
Sierra Leone 8.0 6.8 3.4 1.7 0.0 0.4 0.5 0.8 1.2
Singapore 45.2 14.1 2.8 0.0 0.0 0.0 0.3 0.4 33.0
Slovak Republic 29.9 13.0 3.6 0.3 0.0 0.0 0.4 0.0 19.8
Slovenia 22.7 13.5 4.9 0.1 0.1 0.0 0.3 0.1 13.6
Somalia .. .. .. .. .. .. .. 0.4 ..
South Africa 15.8 14.1 5.4 0.3 2.8 2.2 1.2 0.1 0.4
Spain 19.9 13.9 4.0 0.0 0.0 0.0 0.2 0.2 9.7
Sri Lanka 24.3 9.5 2.6 0.5 0.0 0.0 0.2 0.2 16.4
Sudan 13.5 9.7 0.9 0.0 11.1 0.0 0.2 0.5 –7.1
Swaziland 2.5 10.2 7.2 0.1 0.0 0.0 0.3 0.0 –0.9
Sweden 23.6 13.3 6.1 0.0 0.0 0.2 0.1 0.0 16.0
Switzerland 31.0 14.1 4.8 0.0 0.0 0.0 0.1 0.1 21.6
Syrian Arab Republic 13.9 9.9 2.6 0.0 10.0 0.1 1.1 0.7 –14.1
Tajikistan 12.4 7.9 3.2 0.0 0.2 0.0 1.1 0.3 6.2
Tanzaniaa 21.1 7.3 2.4 0.0 0.2 2.3 0.2 0.1 13.5
Thailand 31.0 10.9 4.6 0.2 3.0 0.0 0.9 0.2 20.5
Timor-Leste .. 1.2 1.6 .. 0.0 0.0 0.0 .. ..
Togo .. 7.0 4.5 2.3 0.0 1.3 0.4 0.1 ..
Trinidad and Tobago 34.3 12.9 4.0 0.0 28.2 0.0 1.4 0.2 –32.4
Tunisia 24.1 11.0 6.7 0.1 3.5 1.0 0.5 0.1 14.6
Turkey 13.0 11.7 2.6 0.0 0.2 0.0 0.3 0.6 2.9
Turkmenistan .. 10.8 .. .. 30.4 0.0 2.1 0.9 ..
Uganda 17.9 7.4 3.0 4.7 0.0 0.0 0.1 0.0 8.6
Ukraine 15.9 9.9 5.9 0.0 3.8 0.0 2.4 0.1 5.6
United Arab Emirates .. .. .. .. .. .. .. 0.5 ..
United Kingdom 11.9 13.5 5.1 0.0 1.2 0.0 0.2 0.0 2.2
United States 9.8 14.3 4.8 0.0 0.7 0.1 0.3 0.1 –0.8
Uruguay 17.5 12.0 2.3 0.4 0.0 0.0 0.2 1.1 6.1
Uzbekistan .. 8.4 9.4 0.0 17.8 0.0 3.2 0.3 ..
Venezuela, RB 21.8 12.2 3.6 0.0 9.5 0.3 0.4 0.0 2.9
Vietnam 31.2 8.8 2.8 0.2 7.0 0.0 1.1 0.3 16.6
West Bank and Gaza .. .. .. .. .. .. .. .. ..
Yemen, Rep. .. 9.0 4.2 0.0 13.2 0.0 0.7 .. ..
Zambia 21.3 9.3 1.3 0.0 0.0 11.5 0.2 0.2 1.4
Zimbabwe .. .. 6.9 0.0 2.2 1.3 1.1 0.2 ..
World 21.1 w 13.1 w 4.2 w 0.0 w 2.0 w 0.3 w 0.4 w 0.2 w 6.4 w
Low income 23.9 7.2 3.2 1.4 1.2 1.3 0.3 0.3 ..
Middle income 33.2 10.7 3.2 0.1 5.1 0.7 0.8 0.5 14.5
Lower middle income 43.3 9.9 2.4 0.2 4.0 0.4 1.0 0.7 26.2
Upper middle income 20.0 11.8 4.1 0.0 6.4 1.0 0.6 0.2 3.9
Low & middle income 33.0 10.7 3.2 0.1 5.0 0.7 0.8 0.5 14.6
East Asia & Pacifi c 48.7 10.3 2.1 0.0 3.3 0.3 1.0 0.7 33.1
Europe & Central Asia 21.1 11.7 3.6 0.0 8.7 0.4 0.9 0.2 1.4
Latin America & Carib. 18.9 11.7 4.4 0.0 3.5 1.3 0.3 0.3 6.8
Middle East & N. Africa .. 10.4 4.3 0.0 14.5 0.3 0.9 0.6 ..
South Asia 33.6 8.4 2.9 0.9 2.1 0.9 0.9 0.5 21.6
Sub-Saharan Africa 15.4 10.6 3.6 0.6 7.5 1.2 0.6 0.3 –1.8
High income 16.5 14.1 4.6 0.0 0.9 0.1 0.2 0.1 5.2
Euro area 18.6 14.2 4.5 0.0 0.1 0.0 0.2 0.1 8.7
a. Covers mainland Tanzania only.

2011 World Development Indicators 237
ECONOMY
About the data Defi nitions
Adjusted net savings measures the change in
value of a specifi ed set of assets, excluding capital
gains. If a country’s net savings are positive and
the accounting includes a suffi ciently broad range
of assets, economic theory suggests that the pres-
ent value of social welfare is increasing. Conversely,
persistently negative adjusted net savings indicate
that an economy is on an unsustainable path.
The table shows the extent to which today’s rents
from natural resources and changes in human capital
are balanced by net savings—that is, this genera-
tion’s bequest to future generations.
Adjusted net savings is derived from standard
national accounting measures of gross savings
by making four adjustments. First, estimates of
fi xed capital consumption of produced assets are
deducted to obtain net savings. Second, current
public expenditures on education are added to net
savings (in standard national accounting these
expenditures are treated as consumption). Third,
estimates of the depletion of a variety of natural
resources are deducted to refl ect the decline in asset
values associated with their extraction and harvest.
And fourth, deductions are made for damages from
carbon dioxide and particulate emissions.
The exercise treats public education expenditures
as an addition to savings. However, because of the
wide variability in the effectiveness of public edu-
cation expenditures, these fi gures cannot be con-
strued as the value of investments in human capital.
A current expenditure of $1 on education does not
necessarily yield $1 of human capital. The calcula-
tion should also consider private education expen-
diture, but data are not available for a large number
of countries.
While extensive, the accounting of natural
resources depletion and pollution costs still has
some gaps. Key estimates missing on the resource
side include the value of fossil water extracted from
aquifers, net depletion of fi sh stocks, and depletion
and degradation of soils. Important pollutants affect-
ing human health and economic assets are excluded
because no internationally comparable data are
widely available on damage from ground-level ozone
or sulfur oxides.
Estimates of resource depletion are based on the
“change in real wealth” method described in Hamil-
ton and Ruta (2008), which estimates depletion as
the ratio between the total value of the resource
and the remaining reserve lifetime. The total value
of the resource is the present value of current and
future rents from resource extractions. An economic
rent represents an excess return to a given factor
of production. Natural resources give rise to rents
because they are not produced; in contrast, for pro-
duced goods and services competitive forces will
expand supply until economic profi ts are driven to
zero. For each type of resource and each country, unit
resource rents are derived by taking the difference
between world prices (to refl ect the social oppor-
tunity cost of resource extraction) and the average
unit extraction or harvest costs (including a “normal”
return on capital). Unit rents are then multiplied by
the physical quantity extracted or harvested to arrive
at total rent. To estimate the value of the resource,
rents are assumed to be constant over the life of the
resource (the El Serafy approach), and the present
value of the rent fl ow is calculated using a 4 percent
social discount rate. For details on the estimation of
natural wealth see World Bank (2011a).
A positive net depletion fi gure for forest resources
implies that the harvest rate exceeds the rate of
natural growth; this is not the same as deforesta-
tion, which represents a change in land use (see
Defi nitions for table 3.4). In principle, there should
be an addition to savings in countries where growth
exceeds harvest, but empirical estimates suggest
that most of this net growth is in forested areas that
cannot currently be exploited economically. Because
the depletion estimates refl ect only timber values,
they ignore all the external and nontimber benefi ts
associated with standing forests.
Pollution damage from emissions of carbon dioxide
is calculated as the marginal social cost per unit mul-
tiplied by the increase in the stock of carbon dioxide.
The unit damage fi gure represents the present value
of global damage to economic assets and to human
welfare over the time the unit of pollution remains
in the atmosphere.
Pollution damage from particulate emissions is
estimated by valuing the human health effects from
exposure to particulate matter pollution in urban
areas. The estimates are calculated as willingness to
pay to avoid illness and death, from cardiopulmonary
disease and lung cancer in adults and acute respira-
tory infections in children, that are attributable to
particulate emissions.
Adjusted net savings aims to be as comprehensive
a measure as possible to provide a better under-
standing of the rate of country wealth creation or
depletion. To do so, it treats education as investment
and accounts for pollution damages to assets and
human welfare, which goes outside the boundaries
of the United Nations System of National Accounts.
For a detailed note on methodology, see data.
worldbank.org/.
• Gross savings is the difference between gross
national income and public and private consump-
tion, plus net current transfers. • Consumption of
fi xed capital is the replacement value of capital
used up in production. • Education expenditure
is public current operating expenditures in educa-
tion, including wages and salaries and excluding
capital investments in buildings and equipment.
• Net forest depletion is unit resource rents times
the excess of roundwood harvest over natural
growth. • Energy depletion is the ratio of the value
of the stock of energy resources to the remaining
reserve lifetime (capped at 25 years). It covers coal,
crude oil, and natural gas. • Mineral depletion is the
ratio of the value of the stock of mineral resources to
the remaining reserve lifetime (capped at 25 years).
It covers tin, gold, lead, zinc, iron, copper, nickel,
silver, bauxite, and phosphate. • Carbon dioxide
damage is estimated at $20 per ton of carbon (the
unit damage in 1995 U.S. dollars) times tons of
carbon emitted. • Particulate emissions damage
is the willingness to pay to avoid illness and death
attributable to particulate emissions. • Adjusted net
savings is net savings plus education expenditure
minus energy depletion, mineral depletion, net for-
est depletion, and carbon dioxide and particulate
emissions damage.
Toward a broader measure of saving 4.11
Data on gross savings are from World Bank
national accounts data fi les (see table 4.8).
Data on consumption of fi xed capital are from
the United Nations Statistics Division’s National
Accounts Statistics: Main Aggregates and Detailed
Tables, extrapolated to 2009. Data on educa-
tion expenditure are from the United Nations
Educational, Scientifi c, and Cultural Organization
Institute for Statistics online database; missing
data are estimated by World Bank staff. Data on
energy, mineral, and forest depletion are esti-
mates based on sources and methods in World
Bank (2011a). Data on carbon dioxide damage
are from Fankhauser’s Valuing Climate Change:
The Economics of the Greenhouse (1995). Data
on particulate emissions damage are from Pandey
and others’ “The Human Cost of Air Pollution: New
Estimates for Developing Countries” (2006). The
conceptual underpinnings of the savings measure
appear in Hamilton and Clemens’ “Genuine Sav-
ings Rates in Developing Countries” (1999).
Data sources

2011 World Development Indicators238
Afghanistanb .. 9.1 .. 38.0 .. 0.2 .. 0.1 .. 0.8 .. 0.0
Albaniab 21.2 .. 25.6 .. –8.9 .. 7.4 .. 2.1 .. .. ..
Algeria .. 36.6 .. 25.0 .. –4.4 .. 5.9 .. 0.0 .. 1.0
Angola .. .. .. .. .. .. .. .. .. .. .. ..
Argentina .. .. .. .. .. .. .. .. .. .. .. ..
Armeniab .. 22.1 .. 23.7 .. –7.5 .. 1.3 .. 12.3 .. 2.3
Australia .. 24.6 .. 26.6 .. –2.4 .. .. .. .. 24.1 3.7
Austria 36.6 36.6 42.5 39.6 –5.5 –2.6 .. .. .. .. 70.7 7.0
Azerbaijanb .. 27.3 .. 15.5 .. 0.4 .. 0.0 .. 0.2 .. 0.3
Bangladeshb .. 11.1 .. 11.3 .. –1.7 .. 3.1 .. 0.4 .. 21.7
Belarusb 30.0 35.4 28.7 33.0 –2.7 0.2 2.2 –2.5 0.4 8.4 18.1 2.1
Belgium 41.5 40.3 45.7 45.3 –3.9 –5.1 .. 1.0 –0.5 6.5 92.4 8.5
Beninb .. 17.6 .. 15.0 .. –4.5 .. 2.2 .. 2.1 .. 2.5
Bolivia .. 23.3 .. 21.8 .. 1.2 .. –0.2 .. –0.1 .. 8.0
Bosnia and Herzegovina .. 38.6 .. 41.2 .. –4.3 .. 3.7 .. 3.2 .. 1.2
Botswanab 40.5 .. 30.3 .. 4.9 .. 0.2 .. –0.4 .. .. ..
Brazilb 26.9 23.1 32.9 25.6 –2.7 –3.5 .. 8.3 .. –0.1 61.0 20.7
Bulgariab 35.6 32.3 39.5 31.6 –5.1 –0.1 7.5 –0.4 –0.8 0.5 .. 2.2
Burkina Faso .. 14.0 .. 13.0 .. –4.8 .. 4.5 .. 2.9 .. 2.2
Burundib 19.3 .. 23.6 .. –4.7 .. 3.1 .. 4.0 .. .. ..
Cambodia .. 11.0 .. 11.0 .. –2.3 .. –2.0 .. 2.3 .. 1.3
Cameroonb 11.8 .. 10.6 .. 0.2 .. –0.3 .. 0.3 .. .. ..
Canadab 19.8 17.4 23.8 19.2 –4.0 –1.9 .. .. .. .. 53.2 10.1
Central African Republicb .. .. .. .. .. .. .. .. .. .. .. ..
Chad .. .. .. .. .. .. .. .. .. .. .. ..
Chile .. 20.1 .. 22.6 .. –4.5 .. 0.8 .. –0.4 .. 2.8
Chinab 5.4 11.1 .. .. .. .. 1.6 0.4 .. 0.0 .. ..
Hong Kong SAR, China .. 19.7 .. 18.9 .. 0.6 .. 1.0 .. –0.1 30.5 0.3
Colombia .. 17.0 .. 19.5 .. –4.0 .. 5.8 .. 0.9 59.3 18.9
Congo, Dem. Rep.b 5.3 .. 8.2 .. 0.0 .. 0.0 .. 0.2 .. .. ..
Congo, Rep.b 23.6 .. 29.8 .. –8.2 .. .. .. .. .. .. ..
Costa Rica .. 24.7 .. 26.0 .. –3.4 .. .. .. .. .. 8.8
Côte d’Ivoire .. 18.7 .. 17.6 .. 0.9 .. .. .. .. .. 7.1
Croatiab 36.8 34.1 36.2 36.2 –1.1 –3.0 –2.3 3.0 0.7 2.2 .. 4.8
Cuba .. .. .. .. .. .. .. .. .. .. .. ..
Czech Republicb 33.2 29.1 32.6 37.3 –0.9 –6.1 –0.5 2.9 –0.4 1.9 31.9 4.1
Denmark 37.6 40.0 41.5 42.4 –3.7 –2.1 .. .. .. .. 41.0 4.9
Dominican Republic .. 16.4 .. 16.2 .. –3.8 .. 2.4 .. 1.5 .. 9.7
Ecuadorb 30.9 .. 26.3 .. 0.1 .. .. .. .. .. .. ..
Egypt, Arab Rep.b 34.8 27.0 28.1 30.2 3.4 –6.6 .. 9.9 .. –0.2 79.5 15.2
El Salvador .. 17.5 .. 21.6 .. –5.0 .. 2.0 .. 5.9 48.5 12.3
Eritrea .. .. .. .. .. .. .. .. .. .. .. ..
Estonia 36.2 37.1 32.8 36.8 1.6 –1.3 .. .. .. .. 9.1 0.6
Ethiopiab 12.2 .. 12.0 .. –3.1 .. 1.8 .. 2.6 .. .. ..
Finland 40.4 39.0 49.7 35.0 –7.5 4.6 8.9 –0.2 0.2 –0.6 36.2 3.2
France 43.3 40.5 47.6 47.6 –4.1 –7.3 .. .. .. .. 82.8 5.4
Gabon .. .. .. .. .. .. .. .. .. .. .. ..
Gambia, Theb .. .. .. .. .. .. .. .. .. .. .. ..
Georgiab 12.2 25.2 15.4 31.0 –4.3 –7.8 2.2 1.3 2.4 3.7 34.7 3.4
Germany 29.9 29.4 38.6 31.7 –8.3 –2.2 .. 3.1 .. –0.2 47.2 5.5
Ghanab 17.0 15.3 .. 17.9 .. –5.6 .. 2.8 .. 2.6 .. 15.2
Greece 35.3 36.2 44.3 50.7 –9.1 –15.2 .. .. .. .. 138.5 14.3
Guatemalab 8.4 11.0 7.6 12.6 –0.5 –3.2 .. 1.4 0.4 1.4 23.3 12.6
Guineab 11.2 .. 12.1 .. –4.3 .. –0.1 .. 4.5 .. .. ..
Guinea-Bissau .. .. .. .. .. .. .. .. .. .. .. ..
Haiti .. .. .. .. .. .. .. .. .. .. .. ..
Honduras .. 20.8 .. 24.1 .. –4.5 .. 5.0 .. 1.0 .. 2.9
4.12 Central government fi nances
Revenuea Expense Cash surplus
or defi cit
Net incurrence
of liabilities
Debt and interest
payments
% of GDP % of GDP % of GDP% of GDP
Total
debt
% of GDP
Interest
% of
revenueDomestic Foreign
1995 2009 1995 2009 1995 2009 1995 2009 1995 2009 2009 2009

2011 World Development Indicators 239
ECONOMY
Hungary 43.0 40.5 53.2 45.3 –9.1 –4.0 17.0 –1.9 0.2 5.8 81.7 10.6
Indiab 12.3 11.9 14.4 16.2 –2.2 –4.9 5.1 5.6 0.0 0.2 53.0 28.5
Indonesiab 15.6 15.4 9.5 15.7 1.7 –1.7 .. 0.9 –0.4 0.4 28.3 10.9
Iran, Islamic Rep.b 24.2 31.9 15.8 24.7 1.1 0.6 .. 1.4 0.1 0.0 .. 0.6
Iraq .. .. .. .. .. .. .. .. .. .. .. ..
Ireland 35.5 30.4 37.5 43.4 –2.2 –13.9 .. .. .. .. 69.2 6.9
Israel .. 34.6 .. 40.6 .. –4.3 .. .. .. .. .. 9.7
Italy 40.4 38.5 48.0 44.0 –7.5 –4.9 .. .. .. .. 118.9 11.1
Jamaica .. 27.0 .. 41.5 .. –15.9 .. 7.4 .. 4.7 115.8 64.5
Japan .. .. .. .. .. .. .. .. .. .. 157.7 ..
Jordanb 28.2 23.5 26.1 28.6 0.9 –8.5 –2.5 7.6 6.1 1.2 57.9 8.7
Kazakhstanb 14.0 9.2 18.7 16.9 –1.8 –2.0 0.8 2.8 2.8 0.5 9.5 2.5
Kenyab 21.6 20.5 25.8 21.7 –5.1 –5.5 3.9 3.0 –1.3 0.1 .. 10.4
Korea, Dem. Rep. .. .. .. .. .. .. .. .. .. .. .. ..
Korea, Rep.b 17.8 23.1 14.3 21.9 2.4 0.0 –0.3 5.4 –0.1 –0.1 .. 4.7
Kosovo .. .. .. .. .. .. .. .. .. .. .. ..
Kuwaitb 36.8 47.1 44.0 21.9 –9.9 20.0 .. .. .. .. .. 0.0
Kyrgyz Republicb 16.7 19.2 25.6 19.3 –10.8 –1.4 .. 0.5 .. 7.7 .. 3.3
Lao PDR .. 13.9 .. 11.3 .. –1.6 .. –0.3 .. 2.1 .. 3.2
Latviab 25.8 24.9 28.3 34.8 –2.7 –6.4 2.4 –2.7 1.5 15.1 41.8 3.8
Lebanon .. 22.5 .. 29.5 .. –8.3 .. 11.8 .. 0.3 .. 48.7
Lesothob 57.1 66.4 39.4 52.1 5.8 5.8 0.0 –0.4 7.2 1.6 .. 1.3
Liberiab .. 0.4 .. 0.3 .. 0.0 .. 0.0 .. 0.0 .. 2.1
Libya .. .. .. .. .. .. .. .. .. .. .. ..
Lithuania .. 28.3 .. 38.8 .. –9.0 .. 1.9 .. 9.1 33.3 4.0
Macedonia, FYRb .. 34.0 .. 31.3 .. –0.8 .. –0.6 .. 0.2 .. 1.9
Madagascar .. 14.1 .. 11.7 .. –1.9 .. 0.6 .. 3.0 .. 3.9
Malawi .. .. .. .. .. .. .. .. .. .. .. ..
Malaysiab 23.3 23.3 18.7 22.7 1.5 –6.4 .. 6.5 .. 0.9 53.3 9.0
Mali .. 17.1 .. 14.6 .. –2.1 .. –4.4 .. 2.6 .. 1.7
Mauritania .. .. .. .. .. .. .. .. .. .. .. ..
Mauritius .. 23.5 .. 21.6 .. 0.6 .. 3.1 .. 1.3 38.9 12.0
Mexicob 15.3 .. 15.0 .. –0.6 .. .. .. 5.5 .. .. ..
Moldovab 28.4 33.1 38.4 38.3 –6.3 –5.7 3.0 2.7 2.7 3.3 24.4 4.0
Mongoliab 19.0 29.2 13.8 28.8 2.9 –4.5 1.6 8.6 1.3 5.2 64.8 1.6
Moroccob .. 33.1 .. 27.9 .. 1.0 .. 0.1 .. 1.7 46.9 3.1
Mozambique .. .. .. .. .. .. .. .. .. .. .. ..
Myanmarb 6.4 .. .. .. .. .. .. .. .. .. .. ..
Namibiab 31.7 29.2 35.7 24.1 –5.0 2.0 .. –0.8 .. –0.1 .. 6.3
Nepalb 10.5 14.5 .. .. .. .. 0.6 3.2 2.5 0.0 43.7 4.9
Netherlands 41.5 41.0 50.8 45.6 –9.2 –4.8 .. .. .. .. 58.3 4.6
New Zealand .. 36.1 .. 32.1 .. 3.1 .. .. .. .. 37.9 3.4
Nicaraguab 12.8 19.1 14.2 20.9 0.6 –2.3 .. .. 3.4 .. .. 6.4
Niger .. 13.6 .. 11.8 .. –0.9 .. –1.9 .. 2.4 .. 1.8
Nigeriab .. 9.7 .. 7.2 .. –1.7 .. 0.1 .. .. 3.0 6.6
Norway .. 47.2 .. 35.9 .. 10.7 .. 6.3 .. –15.3 36.3 2.1
Omanb 27.8 .. 32.4 .. –8.9 .. –0.1 .. 0.0 .. .. ..
Pakistanb 17.2 14.0 19.1 16.8 –5.3 –4.8 .. .. .. .. .. 41.7
Panamab 26.1 .. 22.0 .. 1.5 .. .. .. .. .. .. ..
Papua New Guineab 22.7 .. 24.5 .. –0.5 .. 1.5 .. –0.7 .. .. ..
Paraguayb 17.2 19.0 14.5 17.1 0.2 0.1 0.0 1.3 –0.8 0.1 .. 3.1
Perub 17.4 17.2 17.4 17.1 –1.3 –1.5 .. 0.2 3.9 1.1 23.6 7.2
Philippinesb 17.7 14.6 15.9 18.6 –0.8 –3.9 –0.5 1.2 –0.7 2.0 .. 25.7
Poland .. 30.1 .. 35.8 .. –6.1 .. 1.6 .. 3.6 48.1 8.1
Portugal 33.2 34.7 37.1 43.2 –5.1 –8.7 –1.2 3.4 4.2 5.9 84.4 7.7
Puerto Rico .. .. .. .. .. .. .. .. .. .. .. ..
Qatarb .. 47.2 .. 19.3 .. 15.2 .. .. .. .. .. 2.1
Central government fi nances 4.12Revenuea Expense Cash surplus
or defi cit
Net incurrence
of liabilities
Debt and interest
payments
% of GDP % of GDP % of GDP% of GDP
Total
debt
% of GDP
Interest
% of
revenueDomestic Foreign
1995 2009 1995 2009 1995 2009 1995 2009 1995 2009 2009 2009

2011 World Development Indicators240
Revenuea Expense Cash surplus
or defi cit
Net incurrence
of liabilities
Debt and interest
payments
% of GDP % of GDP % of GDP
% of GDP
Total
debt
% of GDP
Interest
% of
revenueDomestic Foreign
1995 2009 1995 2009 1995 2009 1995 2009 1995 2009 2009 2009
Romania .. 30.9 .. 33.8 .. –4.6 .. 2.4 .. 0.9 .. 2.0
Russian Federation .. 35.4 .. 30.9 .. 5.3 .. 0.8 .. –0.2 8.6 1.3
Rwandab 10.6 .. 15.0 .. –5.6 .. 2.9 .. .. .. .. ..
Saudi Arabia .. .. .. .. .. .. .. .. .. .. .. ..
Senegalb 15.2 .. .. .. .. .. .. .. .. .. .. ..
Serbiab .. 36.3 .. 37.7 .. –2.6 .. 2.8 .. 1.2 .. 2.0
Sierra Leoneb 9.4 11.6 .. 22.5 .. –3.1 0.3 .. .. .. .. 8.3
Singaporeb 26.7 18.2 12.4 15.2 19.8 1.7 10.3 13.7 0.0 .. 113.3 0.1
Slovak Republic .. 28.5 .. 37.6 .. –7.3 .. 2.9 .. 3.0 38.1 4.7
Sloveniab 35.8 37.5 34.3 42.7 –0.1 –5.5 –0.4 12.4 0.3 –1.2 .. 2.9
Somalia .. .. .. .. .. .. .. .. .. .. .. ..
South Africa .. 28.2 .. 33.0 .. –4.9 .. 7.0 .. 1.0 .. 8.4
Spain 32.0 22.4 37.1 30.7 –5.8 –8.6 .. 6.4 .. 4.8 46.5 6.1
Sri Lankab 20.4 14.9 26.0 19.2 –7.6 –6.6 5.2 6.9 3.2 –0.1 85.0 31.0
Sudanb 7.2 .. 6.8 .. –0.4 .. 0.3 .. .. .. .. ..
Swazilandb .. .. .. .. .. .. .. .. .. .. .. ..
Sweden 38.6 34.7 .. .. .. .. .. .. .. .. 44.0 ..
Switzerlandb 22.6 18.4 25.7 17.0 –0.6 1.3 –0.5 2.0 .. .. 28.9 3.5
Syrian Arab Republicb 22.9 .. .. .. .. .. .. .. .. .. .. ..
Tajikistanb 9.3 .. 11.4 .. –3.3 .. 0.1 .. 2.3 .. .. ..
Tanzania .. .. .. .. .. .. .. .. .. .. .. ..
Thailand .. 18.6 .. 19.6 .. –3.0 .. 5.3 .. 0.0 28.6 5.8
Timor-Leste .. .. .. .. .. .. .. .. .. .. .. ..
Togo .. 18.8 .. 17.4 .. –0.6 .. 2.7 .. –0.5 .. 4.0
Trinidad and Tobagob 27.2 36.1 25.3 28.4 –0.1 2.3 2.8 –0.6 2.6 0.5 14.1 5.0
Tunisiab 30.0 31.4 28.4 29.9 –2.4 –1.7 0.9 0.3 2.9 0.0 47.1 7.0
Turkeyb .. 21.8 .. 27.3 .. –5.5 .. 6.1 .. 0.6 51.4 24.1
Turkmenistan .. .. .. .. .. .. .. .. .. .. .. ..
Ugandab 10.6 12.4 .. 13.7 .. –0.9 .. 1.5 .. 1.8 32.7 7.7
Ukraineb .. 34.5 .. 40.6 .. –5.6 .. 6.7 .. 4.9 .. 3.1
United Arab Emiratesb 10.1 .. 11.0 .. 0.5 .. .. .. .. .. .. ..
United Kingdom 35.2 35.9 40.4 46.4 –5.5 –10.9 .. .. .. .. 73.2 5.3
United States .. 15.9 .. 26.3 .. –10.4 .. 6.5 .. 4.7 67.1 11.4
Uruguayb 27.6 29.4 27.1 29.3 –1.2 –1.5 7.9 3.8 1.1 2.4 49.5 9.3
Uzbekistan .. .. .. .. .. .. .. .. .. .. .. ..
Venezuela, RBb 16.9 .. 18.5 .. –2.3 .. 1.1 .. 0.1 .. .. ..
Vietnam .. .. .. .. .. .. .. .. .. .. .. ..
West Bank and Gaza .. .. .. .. .. .. .. .. .. .. .. 1.1
Yemen, Rep.b 17.3 .. 19.1 .. –3.9 .. .. .. .. .. .. ..
Zambiab 20.0 17.6 21.4 22.9 –3.1 –0.8 28.0 .. 16.2 .. .. 7.2
Zimbabweb 26.7 .. 32.1 .. –5.4 .. –1.4 .. 1.6 .. .. ..
World .. w 24.3 w .. w 31.1 w .. w –7.1 w .. m .. m .. m .. m .. m 5.4 m
Low income .. .. .. .. .. .. .. .. .. .. .. ..
Middle income 14.6 20.0 .. .. .. .. .. 0.9 .. 0.2 .. 7.0
Lower middle income 10.7 14.7 .. .. .. .. .. 0.5 .. .. .. 6.0
Upper middle income .. .. .. .. .. .. .. 3.7 .. 0.9 .. 7.2
Low & middle income 14.6 19.8 .. .. .. .. .. 0.6 .. .. .. 4.5
East Asia & Pacifi c 7.2 13.4 .. .. .. .. .. 1.2 .. 2.0 .. 5.8
Europe & Central Asia .. 29.3 .. 30.1 .. –0.4 .. 1.9 .. 3.3 .. 2.5
Latin America & Carib. 21.2 .. 23.3 .. –1.4 .. .. 0.1 .. –0.2 .. 9.1
Middle East & N. Africa .. 30.6 .. 27.3 .. –3.0 .. 6.7 .. 0.1 .. 7.0
South Asia 13.1 12.1 15.3 16.0 –2.7 –4.6 3.8 3.2 1.1 0.3 56.5 21.7
Sub-Saharan Africa .. 24.5 .. 24.2 .. –1.0 .. .. .. .. .. ..
High income .. 24.7 .. 32.2 .. –7.7 .. .. .. .. 55.7 5.3
Euro area 34.9 34.5 42.3 39.8 –7.4 –5.2 .. 0.8 .. 0.4 69.9 6.1
a. Excludes grants. b. Data were reported on a cash basis and have been adjusted to the accrual framework.
Central government fi nances4.12
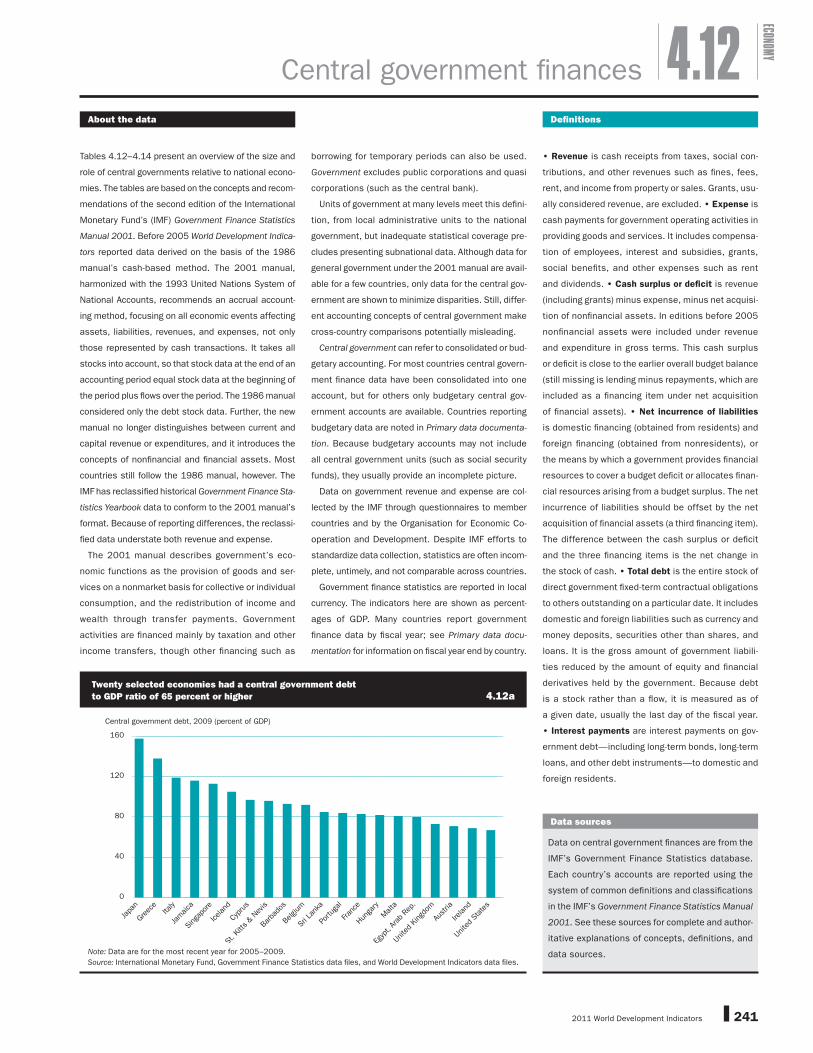
2011 World Development Indicators 241
ECONOMY
About the data Defi nitions
Tables 4.12–4.14 present an overview of the size and
role of central governments relative to national econo-
mies. The tables are based on the concepts and recom-
mendations of the second edition of the International
Monetary Fund’s (IMF) Government Finance Statistics
Manual 2001. Before 2005 World Development Indica-
tors reported data derived on the basis of the 1986
manual’s cash-based method. The 2001 manual,
harmonized with the 1993 United Nations System of
National Accounts, recommends an accrual account-
ing method, focusing on all economic events affecting
assets, liabilities, revenues, and expenses, not only
those represented by cash transactions. It takes all
stocks into account, so that stock data at the end of an
accounting period equal stock data at the beginning of
the period plus fl ows over the period. The 1986 manual
considered only the debt stock data. Further, the new
manual no longer distinguishes between current and
capital revenue or expenditures, and it introduces the
concepts of nonfi nancial and fi nancial assets. Most
countries still follow the 1986 manual, however. The
IMF has reclassifi ed historical Government Finance Sta-
tistics Yearbook data to conform to the 2001 manual’s
format. Because of reporting differences, the reclassi-
fi ed data understate both revenue and expense.
The 2001 manual describes government’s eco-
nomic functions as the provision of goods and ser-
vices on a nonmarket basis for collective or individual
consumption, and the redistribution of income and
wealth through transfer payments. Government
activities are fi nanced mainly by taxation and other
income transfers, though other fi nancing such as
borrowing for temporary periods can also be used.
Government excludes public corporations and quasi
corporations (such as the central bank).
Units of government at many levels meet this defi ni-
tion, from local administrative units to the national
government, but inadequate statistical coverage pre-
cludes presenting subnational data. Although data for
general government under the 2001 manual are avail-
able for a few countries, only data for the central gov-
ernment are shown to minimize disparities. Still, differ-
ent accounting concepts of central government make
cross-country comparisons potentially misleading.
Central government can refer to consolidated or bud-
getary accounting. For most countries central govern-
ment fi nance data have been consolidated into one
account, but for others only budgetary central gov-
ernment accounts are available. Countries reporting
budgetary data are noted in Primary data documenta-
tion. Because budgetary accounts may not include
all central government units (such as social security
funds), they usually provide an incomplete picture.
Data on government revenue and expense are col-
lected by the IMF through questionnaires to member
countries and by the Organisation for Economic Co-
operation and Development. Despite IMF efforts to
standardize data collection, statistics are often incom-
plete, untimely, and not comparable across countries.
Government fi nance statistics are reported in local
currency. The indicators here are shown as percent-
ages of GDP. Many countries report government
fi nance data by fi scal year; see Primary data docu-
mentation for information on fi scal year end by country.
• Revenue is cash receipts from taxes, social con-
tributions, and other revenues such as fines, fees,
rent, and income from property or sales. Grants, usu-
ally considered revenue, are excluded. • Expense is
cash payments for government operating activities in
providing goods and services. It includes compensa-
tion of employees, interest and subsidies, grants,
social benefi ts, and other expenses such as rent
and dividends. • Cash surplus or defi cit is revenue
(including grants) minus expense, minus net acquisi-
tion of nonfi nancial assets. In editions before 2005
nonfi nancial assets were included under revenue
and expenditure in gross terms. This cash surplus
or defi cit is close to the earlier overall budget balance
(still missing is lending minus repayments, which are
included as a fi nancing item under net acquisition
of fi nancial assets). • Net incurrence of liabilities
is domestic fi nancing (obtained from residents) and
foreign fi nancing (obtained from nonresidents), or
the means by which a government provides fi nancial
resources to cover a budget defi cit or allocates fi nan-
cial resources arising from a budget surplus. The net
incurrence of liabilities should be offset by the net
acquisition of fi nancial assets (a third fi nancing item).
The difference between the cash surplus or defi cit
and the three fi nancing items is the net change in
the stock of cash. • Total debt is the entire stock of
direct government fi xed-term contractual obligations
to others outstanding on a particular date. It includes
domestic and foreign liabilities such as currency and
money deposits, securities other than shares, and
loans. It is the gross amount of government liabili-
ties reduced by the amount of equity and fi nancial
derivatives held by the government. Because debt
is a stock rather than a fl ow, it is measured as of
a given date, usually the last day of the fiscal year.
• Interest payments are interest payments on gov-
ernment debt—including long-term bonds, long-term
loans, and other debt instruments—to domestic and
foreign residents.
4.12Central government fi nances
Data sources
Data on central government fi nances are from the
IMF’s Government Finance Statistics database.
Each country’s accounts are reported using the
system of common defi nitions and classifi cations
in the IMF’s Government Finance Statistics Manual
2001. See these sources for complete and author-
itative explanations of concepts, defi nitions, and
data sources.
Central government debt, 2009 (percent of GDP)
0
40
80
120
160
Unite
d St
ates
Ireland
Austria
Unite
d Ki
ngdo
m
Egyp
t, Ar
ab R
ep.
Malta
Hunga
ry
Fran
ce
Portug
al
Sri L
anka
Belgium
Barb
ados
St. K
itts & N
evis
Cypr
us
Icelan
d
Sing
apor
e
Jamaica
Italy
Greec
e
Japa
n
Note: Data are for the most recent year for 2005–2009.
Source: International Monetary Fund, Government Finance Statistics data fi les, and World Development Indicators data fi les.
Twenty selected economies had a central government debt to GDP ratio of 65 percent or higher 4.12a
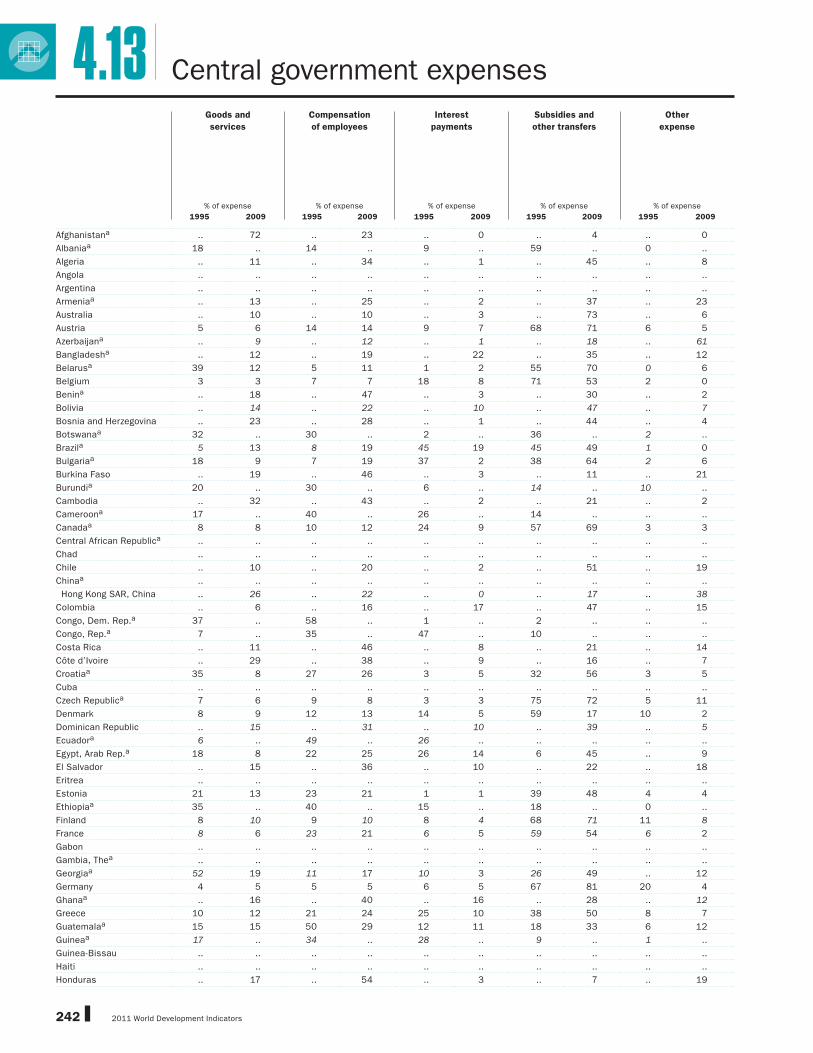
2011 World Development Indicators242
Afghanistana .. 72 .. 23 .. 0 .. 4 .. 0
Albaniaa 18 .. 14 .. 9 .. 59 .. 0 ..
Algeria .. 11 .. 34 .. 1 .. 45 .. 8
Angola .. .. .. .. .. .. .. .. .. ..
Argentina .. .. .. .. .. .. .. .. .. ..
Armeniaa .. 13 .. 25 .. 2 .. 37 .. 23
Australia .. 10 .. 10 .. 3 .. 73 .. 6
Austria 5 6 14 14 9 7 68 71 6 5
Azerbaijana .. 9 .. 12 .. 1 .. 18 .. 61
Bangladesha .. 12 .. 19 .. 22 .. 35 .. 12
Belarusa 39 12 5 11 1 2 55 70 0 6
Belgium 3 3 7 7 18 8 71 53 2 0
Benina .. 18 .. 47 .. 3 .. 30 .. 2
Bolivia .. 14 .. 22 .. 10 .. 47 .. 7
Bosnia and Herzegovina .. 23 .. 28 .. 1 .. 44 .. 4
Botswanaa 32 .. 30 .. 2 .. 36 .. 2 ..
Brazila 5 13 8 19 45 19 45 49 1 0
Bulgariaa 18 9 7 19 37 2 38 64 2 6
Burkina Faso .. 19 .. 46 .. 3 .. 11 .. 21
Burundia 20 .. 30 .. 6 .. 14 .. 10 ..
Cambodia .. 32 .. 43 .. 2 .. 21 .. 2
Cameroona 17 .. 40 .. 26 .. 14 .. .. ..
Canadaa 8 8 10 12 24 9 57 69 3 3
Central African Republica .. .. .. .. .. .. .. .. .. ..
Chad .. .. .. .. .. .. .. .. .. ..
Chile .. 10 .. 20 .. 2 .. 51 .. 19
Chinaa .. .. .. .. .. .. .. .. .. ..
Hong Kong SAR, China .. 26 .. 22 .. 0 .. 17 .. 38
Colombia .. 6 .. 16 .. 17 .. 47 .. 15
Congo, Dem. Rep.a 37 .. 58 .. 1 .. 2 .. .. ..
Congo, Rep.a 7 .. 35 .. 47 .. 10 .. .. ..
Costa Rica .. 11 .. 46 .. 8 .. 21 .. 14
Côte d’Ivoire .. 29 .. 38 .. 9 .. 16 .. 7
Croatiaa 35 8 27 26 3 5 32 56 3 5
Cuba .. .. .. .. .. .. .. .. .. ..
Czech Republica 7 6 9 8 3 3 75 72 5 11
Denmark 8 9 12 13 14 5 59 17 10 2
Dominican Republic .. 15 .. 31 .. 10 .. 39 .. 5
Ecuadora 6 .. 49 .. 26 .. .. .. .. ..
Egypt, Arab Rep.a 18 8 22 25 26 14 6 45 .. 9
El Salvador .. 15 .. 36 .. 10 .. 22 .. 18
Eritrea .. .. .. .. .. .. .. .. .. ..
Estonia 21 13 23 21 1 1 39 48 4 4
Ethiopiaa 35 .. 40 .. 15 .. 18 .. 0 ..
Finland 8 10 9 10 8 4 68 71 11 8
France 8 6 23 21 6 5 59 54 6 2
Gabon .. .. .. .. .. .. .. .. .. ..
Gambia, Thea .. .. .. .. .. .. .. .. .. ..
Georgiaa 52 19 11 17 10 3 26 49 .. 12
Germany 4 5 5 5 6 5 67 81 20 4
Ghanaa .. 16 .. 40 .. 16 .. 28 .. 12
Greece 10 12 21 24 25 10 38 50 8 7
Guatemalaa 15 15 50 29 12 11 18 33 6 12
Guineaa 17 .. 34 .. 28 .. 9 .. 1 ..
Guinea-Bissau .. .. .. .. .. .. .. .. .. ..
Haiti .. .. .. .. .. .. .. .. .. ..
Honduras .. 17 .. 54 .. 3 .. 7 .. 19
4.13 Central government expenses
Goods and
services
Compensation
of employees
Interest
payments
Subsidies and
other transfers
Other
expense
% of expense % of expense % of expense % of expense % of expense
1995 2009 1995 2009 1995 2009 1995 2009 1995 2009
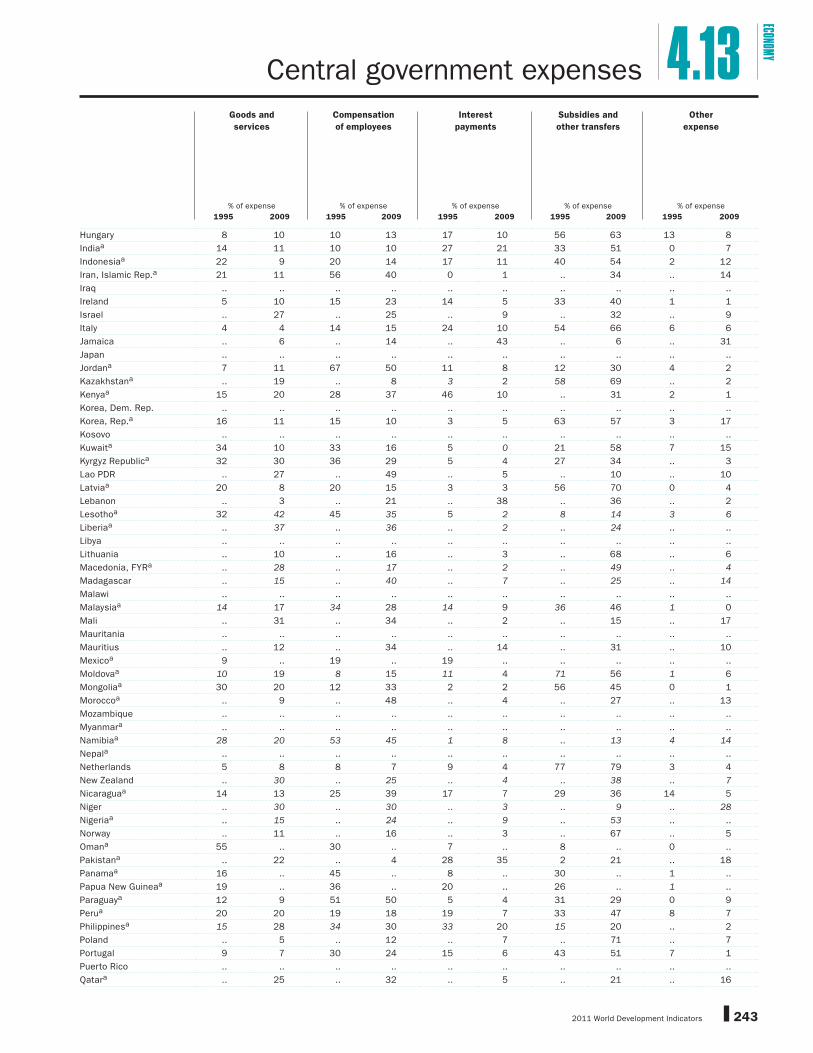
2011 World Development Indicators 243
ECONOMY
Hungary 8 10 10 13 17 10 56 63 13 8
Indiaa 14 11 10 10 27 21 33 51 0 7
Indonesiaa 22 9 20 14 17 11 40 54 2 12
Iran, Islamic Rep.a 21 11 56 40 0 1 .. 34 .. 14
Iraq .. .. .. .. .. .. .. .. .. ..
Ireland 5 10 15 23 14 5 33 40 1 1
Israel .. 27 .. 25 .. 9 .. 32 .. 9
Italy 4 4 14 15 24 10 54 66 6 6
Jamaica .. 6 .. 14 .. 43 .. 6 .. 31
Japan .. .. .. .. .. .. .. .. .. ..
Jordana 7 11 67 50 11 8 12 30 4 2
Kazakhstana .. 19 .. 8 3 2 58 69 .. 2
Kenyaa 15 20 28 37 46 10 .. 31 2 1
Korea, Dem. Rep. .. .. .. .. .. .. .. .. .. ..
Korea, Rep.a 16 11 15 10 3 5 63 57 3 17
Kosovo .. .. .. .. .. .. .. .. .. ..
Kuwaita 34 10 33 16 5 0 21 58 7 15
Kyrgyz Republica 32 30 36 29 5 4 27 34 .. 3
Lao PDR .. 27 .. 49 .. 5 .. 10 .. 10
Latviaa 20 8 20 15 3 3 56 70 0 4
Lebanon .. 3 .. 21 .. 38 .. 36 .. 2
Lesothoa 32 42 45 35 5 2 8 14 3 6
Liberiaa .. 37 .. 36 .. 2 .. 24 .. ..
Libya .. .. .. .. .. .. .. .. .. ..
Lithuania .. 10 .. 16 .. 3 .. 68 .. 6
Macedonia, FYRa .. 28 .. 17 .. 2 .. 49 .. 4
Madagascar .. 15 .. 40 .. 7 .. 25 .. 14
Malawi .. .. .. .. .. .. .. .. .. ..
Malaysiaa 14 17 34 28 14 9 36 46 1 0
Mali .. 31 .. 34 .. 2 .. 15 .. 17
Mauritania .. .. .. .. .. .. .. .. .. ..
Mauritius .. 12 .. 34 .. 14 .. 31 .. 10
Mexicoa 9 .. 19 .. 19 .. .. .. .. ..
Moldovaa 10 19 8 15 11 4 71 56 1 6
Mongoliaa 30 20 12 33 2 2 56 45 0 1
Moroccoa .. 9 .. 48 .. 4 .. 27 .. 13
Mozambique .. .. .. .. .. .. .. .. .. ..
Myanmara .. .. .. .. .. .. .. .. .. ..
Namibiaa 28 20 53 45 1 8 .. 13 4 14
Nepala .. .. .. .. .. .. .. .. .. ..
Netherlands 5 8 8 7 9 4 77 79 3 4
New Zealand .. 30 .. 25 .. 4 .. 38 .. 7
Nicaraguaa 14 13 25 39 17 7 29 36 14 5
Niger .. 30 .. 30 .. 3 .. 9 .. 28
Nigeriaa .. 15 .. 24 .. 9 .. 53 .. ..
Norway .. 11 .. 16 .. 3 .. 67 .. 5
Omana 55 .. 30 .. 7 .. 8 .. 0 ..
Pakistana .. 22 .. 4 28 35 2 21 .. 18
Panamaa 16 .. 45 .. 8 .. 30 .. 1 ..
Papua New Guineaa 19 .. 36 .. 20 .. 26 .. 1 ..
Paraguaya 12 9 51 50 5 4 31 29 0 9
Perua 20 20 19 18 19 7 33 47 8 7
Philippinesa 15 28 34 30 33 20 15 20 .. 2
Poland .. 5 .. 12 .. 7 .. 71 .. 7
Portugal 9 7 30 24 15 6 43 51 7 1
Puerto Rico .. .. .. .. .. .. .. .. .. ..
Qatara .. 25 .. 32 .. 5 .. 21 .. 16
Central government expenses 4.13Goods and
services
Compensation
of employees
Interest
payments
Subsidies and
other transfers
Other
expense
% of expense % of expense % of expense % of expense % of expense
1995 2009 1995 2009 1995 2009 1995 2009 1995 2009

2011 World Development Indicators244
Romania .. 13 .. 19 .. 2 .. 60 .. 8
Russian Federation .. 12 .. 16 .. 1 .. 68 .. 10
Rwandaa 52 .. 36 .. 12 .. 5 .. .. ..
Saudi Arabia .. .. .. .. .. .. .. .. .. ..
Senegala .. .. .. .. .. .. .. .. .. ..
Serbiaa .. 13 .. 26 .. 2 .. 58 .. 1
Sierra Leonea .. 24 .. 28 .. 7 .. 23 .. 18
Singaporea 38 36 39 27 8 0 15 0 .. ..
Slovak Republic .. 7 .. 12 .. 4 .. 68 .. 14
Sloveniaa 19 13 21 20 3 3 55 62 3 3
Somalia .. .. .. .. .. .. .. .. .. ..
South Africa .. 13 .. 13 .. 7 .. 63 .. 4
Spain 5 4 14 8 11 5 42 80 2 5
Sri Lankaa 23 14 20 28 22 25 24 23 10 10
Sudana 44 .. 38 .. 8 .. 10 .. .. ..
Swazilanda .. .. .. .. .. .. .. .. .. ..
Sweden .. .. .. .. .. .. .. .. .. ..
Switzerlanda 24 6 6 6 4 4 66 83 0 3
Syrian Arab Republica .. .. .. .. .. .. .. .. .. ..
Tajikistana 47 .. 8 .. 12 .. 33 .. .. ..
Tanzania .. .. .. .. .. .. .. .. .. ..
Thailand .. 31 .. 36 .. 5 .. 28 .. 3
Timor-Leste .. .. .. .. .. .. .. .. .. ..
Togo .. 24 .. 40 .. 5 .. 18 .. 13
Trinidad and Tobagoa 20 14 36 21 20 6 24 38 1 21
Tunisiaa 7 7 37 36 13 7 36 38 7 13
Turkeya .. 10 .. 23 .. 20 .. 44 .. 5
Turkmenistan .. .. .. .. .. .. .. .. .. ..
Ugandaa .. 31 .. 14 .. 9 .. 45 .. 1
Ukrainea .. 12 .. 13 .. 3 .. 70 .. 2
United Arab Emiratesa 48 .. 33 .. .. .. .. .. .. ..
United Kingdom 14 18 15 14 9 4 57 53 8 12
United States .. 15 .. 12 .. 7 .. 62 .. 6
Uruguaya 13 12 17 25 6 9 64 47 0 7
Uzbekistan .. .. .. .. .. .. .. .. .. ..
Venezuela, RBa 6 .. 22 .. 27 .. 61 .. 2 ..
Vietnam .. .. .. .. .. .. .. .. .. ..
West Bank and Gaza .. 12 .. 67 .. 1 .. 18 .. 1
Yemen, Rep.a 8 .. 67 .. 16 .. 8 .. 0 ..
Zambiaa 32 32 35 30 16 7 19 24 0 7
Zimbabwea 16 .. 34 .. 31 .. 19 .. .. ..
World .. m 12 m .. m 21 m .. m 5 m .. m 46 m .. m 6 m
Low income .. .. .. .. .. .. .. .. .. ..
Middle income .. 12 .. 25 .. 7 .. 45 .. 7
Lower middle income .. 15 .. 31 .. 7 .. 36 .. 8
Upper middle income .. 12 .. 20 .. 7 .. 47 .. 6
Low & middle income .. 15 .. 27 .. 6 .. 37 .. 7
East Asia & Pacifi c .. 27 .. 33 .. 5 .. 28 .. 2
Europe & Central Asia .. 13 .. 17 .. 2 .. 58 .. 6
Latin America & Carib. .. 13 .. 27 .. 9 .. 35 .. 13
Middle East & N. Africa .. 9 .. 36 .. 7 .. 36 .. 9
South Asia .. 17 .. 14 27 21 24 28 .. 10
Sub-Saharan Africa .. .. .. .. .. .. .. .. .. ..
High income 10 9 15 14 9 5 56 62 4 5
Euro area 5 7 14 15 10 5 55 62 5 4
Note: Components may not sum to 100 percent because of rounding or missing data.
a. Data were reported on a cash basis and have been adjusted to the accrual framework.
Central government expenses4.13Goods and
services
Compensation
of employees
Interest
payments
Subsidies and
other transfers
Other
expense
% of expense % of expense % of expense % of expense % of expense
1995 2009 1995 2009 1995 2009 1995 2009 1995 2009
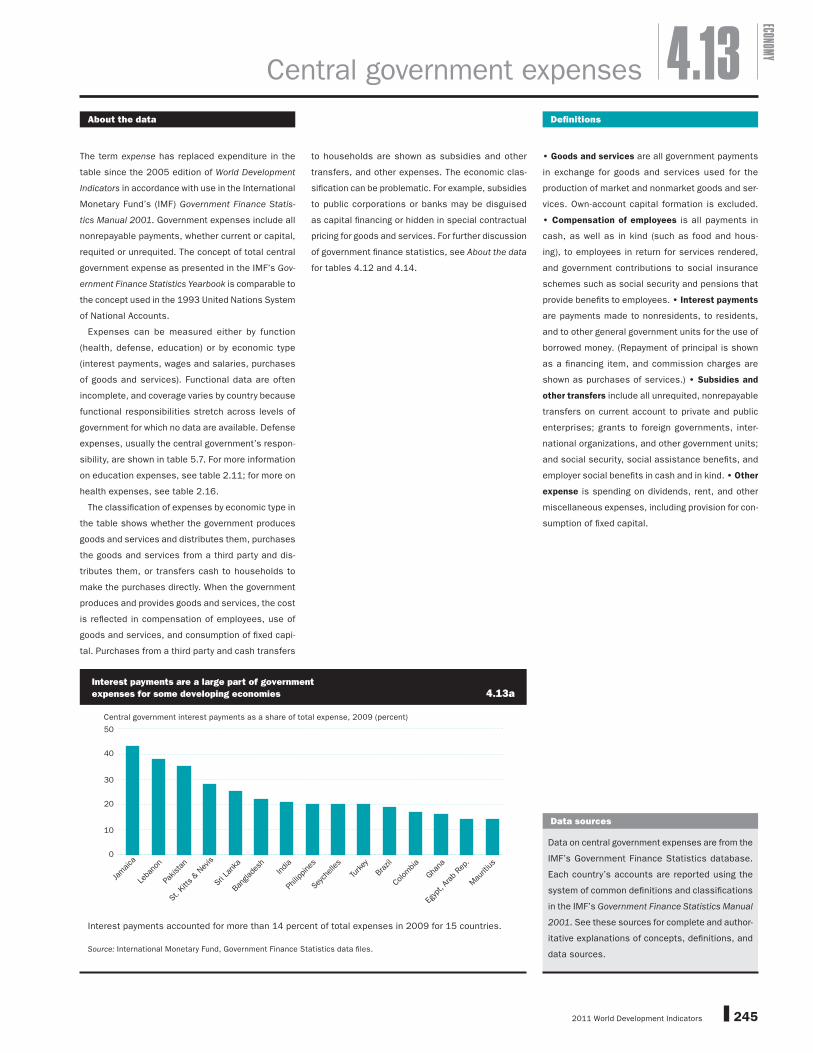
2011 World Development Indicators 245
ECONOMY
About the data Defi nitions
The term expense has replaced expenditure in the
table since the 2005 edition of World Development
Indicators in accordance with use in the International
Monetary Fund’s (IMF) Government Finance Statis-
tics Manual 2001. Government expenses include all
nonrepayable payments, whether current or capital,
requited or unrequited. The concept of total central
government expense as presented in the IMF’s Gov-
ernment Finance Statistics Yearbook is comparable to
the concept used in the 1993 United Nations System
of National Accounts.
Expenses can be measured either by function
(health, defense, education) or by economic type
(interest payments, wages and salaries, purchases
of goods and services). Functional data are often
incomplete, and coverage varies by country because
functional responsibilities stretch across levels of
government for which no data are available. Defense
expenses, usually the central government’s respon-
sibility, are shown in table 5.7. For more information
on education expenses, see table 2.11; for more on
health expenses, see table 2.16.
The classifi cation of expenses by economic type in
the table shows whether the government produces
goods and services and distributes them, purchases
the goods and services from a third party and dis-
tributes them, or transfers cash to households to
make the purchases directly. When the government
produces and provides goods and services, the cost
is refl ected in compensation of employees, use of
goods and services, and consumption of fi xed capi-
tal. Purchases from a third party and cash transfers
to households are shown as subsidies and other
transfers, and other expenses. The economic clas-
sifi cation can be problematic. For example, subsidies
to public corporations or banks may be disguised
as capital fi nancing or hidden in special contractual
pricing for goods and services. For further discussion
of government fi nance statistics, see About the data
for tables 4.12 and 4.14.
• Goods and services are all government payments
in exchange for goods and services used for the
production of market and nonmarket goods and ser-
vices. Own-account capital formation is excluded.
• Compensation of employees is all payments in
cash, as well as in kind (such as food and hous-
ing), to employees in return for services rendered,
and government contributions to social insurance
schemes such as social security and pensions that
provide benefi ts to employees. • Interest payments
are payments made to nonresidents, to residents,
and to other general government units for the use of
borrowed money. (Repayment of principal is shown
as a fi nancing item, and commission charges are
shown as purchases of services.) • Subsidies and
other transfers include all unrequited, nonrepayable
transfers on current account to private and public
enterprises; grants to foreign governments, inter-
national organizations, and other government units;
and social security, social assistance benefi ts, and
employer social benefi ts in cash and in kind. • Other
expense is spending on dividends, rent, and other
miscellaneous expenses, including provision for con-
sumption of fi xed capital.
4.13Central government expenses
Data sources
Data on central government expenses are from the
IMF’s Government Finance Statistics database.
Each country’s accounts are reported using the
system of common defi nitions and classifi cations
in the IMF’s Government Finance Statistics Manual
2001. See these sources for complete and author-
itative explanations of concepts, defi nitions, and
data sources.
Central government interest payments as a share of total expense, 2009 (percent)
0
10
20
30
40
50
Egyp
t, Ar
ab R
ep.
Ghana
Colombia
Braz
il
Turkey
Seyc
helle
s
Philipp
ines
India
Bang
lade
sh
Sri L
anka
St. K
itts & N
evis
Pakistan
Leba
non
Jamaica
Mau
ritius
Interest payments accounted for more than 14 percent of total expenses in 2009 for 15 countries.
Source: International Monetary Fund, Government Finance Statistics data fi les.
Interest payments are a large part of governmentexpenses for some developing economies 4.13a
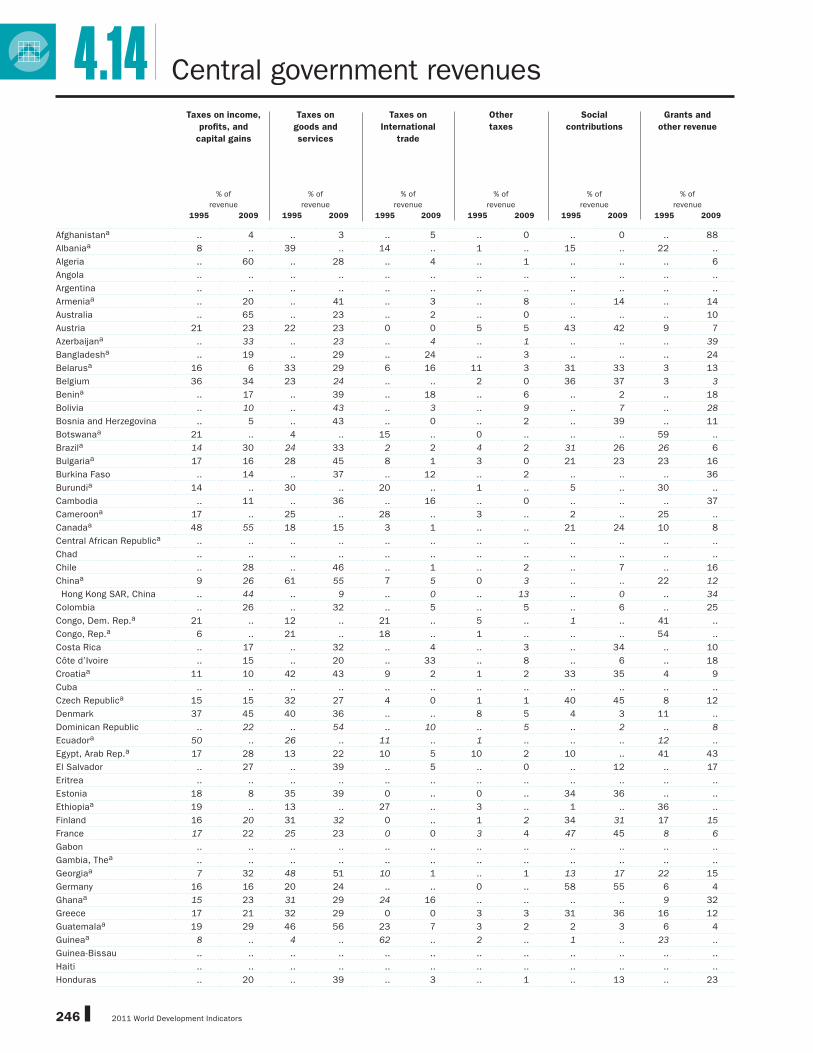
2011 World Development Indicators246
Afghanistana .. 4 .. 3 .. 5 .. 0 .. 0 .. 88
Albaniaa 8 .. 39 .. 14 .. 1 .. 15 .. 22 ..
Algeria .. 60 .. 28 .. 4 .. 1 .. .. .. 6
Angola .. .. .. .. .. .. .. .. .. .. .. ..
Argentina .. .. .. .. .. .. .. .. .. .. .. ..
Armeniaa .. 20 .. 41 .. 3 .. 8 .. 14 .. 14
Australia .. 65 .. 23 .. 2 .. 0 .. .. .. 10
Austria 21 23 22 23 0 0 5 5 43 42 9 7
Azerbaijana .. 33 .. 23 .. 4 .. 1 .. .. .. 39
Bangladesha .. 19 .. 29 .. 24 .. 3 .. .. .. 24
Belarusa 16 6 33 29 6 16 11 3 31 33 3 13
Belgium 36 34 23 24 .. .. 2 0 36 37 3 3
Benina .. 17 .. 39 .. 18 .. 6 .. 2 .. 18
Bolivia .. 10 .. 43 .. 3 .. 9 .. 7 .. 28
Bosnia and Herzegovina .. 5 .. 43 .. 0 .. 2 .. 39 .. 11
Botswanaa 21 .. 4 .. 15 .. 0 .. .. .. 59 ..
Brazila 14 30 24 33 2 2 4 2 31 26 26 6
Bulgariaa 17 16 28 45 8 1 3 0 21 23 23 16
Burkina Faso .. 14 .. 37 .. 12 .. 2 .. .. .. 36
Burundia 14 .. 30 .. 20 .. 1 .. 5 .. 30 ..
Cambodia .. 11 .. 36 .. 16 .. 0 .. .. .. 37
Cameroona 17 .. 25 .. 28 .. 3 .. 2 .. 25 ..
Canadaa 48 55 18 15 3 1 .. .. 21 24 10 8
Central African Republica .. .. .. .. .. .. .. .. .. .. .. ..
Chad .. .. .. .. .. .. .. .. .. .. .. ..
Chile .. 28 .. 46 .. 1 .. 2 .. 7 .. 16
Chinaa 9 26 61 55 7 5 0 3 .. .. 22 12
Hong Kong SAR, China .. 44 .. 9 .. 0 .. 13 .. 0 .. 34
Colombia .. 26 .. 32 .. 5 .. 5 .. 6 .. 25
Congo, Dem. Rep.a 21 .. 12 .. 21 .. 5 .. 1 .. 41 ..
Congo, Rep.a 6 .. 21 .. 18 .. 1 .. .. .. 54 ..
Costa Rica .. 17 .. 32 .. 4 .. 3 .. 34 .. 10
Côte d’Ivoire .. 15 .. 20 .. 33 .. 8 .. 6 .. 18
Croatiaa 11 10 42 43 9 2 1 2 33 35 4 9
Cuba .. .. .. .. .. .. .. .. .. .. .. ..
Czech Republica 15 15 32 27 4 0 1 1 40 45 8 12
Denmark 37 45 40 36 .. .. 8 5 4 3 11 ..
Dominican Republic .. 22 .. 54 .. 10 .. 5 .. 2 .. 8
Ecuadora 50 .. 26 .. 11 .. 1 .. .. .. 12 ..
Egypt, Arab Rep.a 17 28 13 22 10 5 10 2 10 .. 41 43
El Salvador .. 27 .. 39 .. 5 .. 0 .. 12 .. 17
Eritrea .. .. .. .. .. .. .. .. .. .. .. ..
Estonia 18 8 35 39 0 .. 0 .. 34 36 .. ..
Ethiopiaa 19 .. 13 .. 27 .. 3 .. 1 .. 36 ..
Finland 16 20 31 32 0 .. 1 2 34 31 17 15
France 17 22 25 23 0 0 3 4 47 45 8 6
Gabon .. .. .. .. .. .. .. .. .. .. .. ..
Gambia, Thea .. .. .. .. .. .. .. .. .. .. .. ..
Georgiaa 7 32 48 51 10 1 .. 1 13 17 22 15
Germany 16 16 20 24 .. .. 0 .. 58 55 6 4
Ghanaa 15 23 31 29 24 16 .. .. .. .. 9 32
Greece 17 21 32 29 0 0 3 3 31 36 16 12
Guatemalaa 19 29 46 56 23 7 3 2 2 3 6 4
Guineaa 8 .. 4 .. 62 .. 2 .. 1 .. 23 ..
Guinea-Bissau .. .. .. .. .. .. .. .. .. .. .. ..
Haiti .. .. .. .. .. .. .. .. .. .. .. ..
Honduras .. 20 .. 39 .. 3 .. 1 .. 13 .. 23
4.14 Central government revenues
Taxes on income,
profi ts, and
capital gains
Taxes on
goods and
services
Taxes on
International
trade
Other
taxes
Social
contributions
Grants and
other revenue
% of
revenue
% of
revenue
% of
revenue
% of
revenue
% of
revenue
% of
revenue
1995 2009 1995 2009 1995 2009 1995 2009 1995 2009 1995 2009
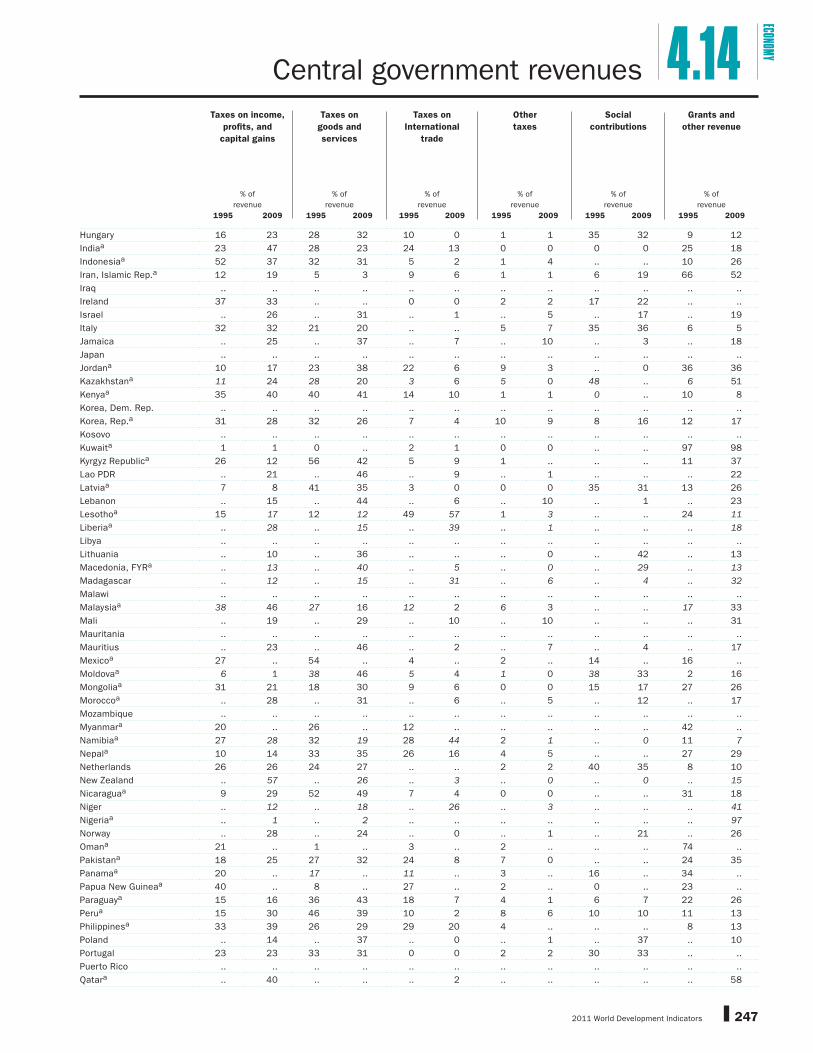
2011 World Development Indicators 247
ECONOMY
Hungary 16 23 28 32 10 0 1 1 35 32 9 12
Indiaa 23 47 28 23 24 13 0 0 0 0 25 18
Indonesiaa 52 37 32 31 5 2 1 4 .. .. 10 26
Iran, Islamic Rep.a 12 19 5 3 9 6 1 1 6 19 66 52
Iraq .. .. .. .. .. .. .. .. .. .. .. ..
Ireland 37 33 .. .. 0 0 2 2 17 22 .. ..
Israel .. 26 .. 31 .. 1 .. 5 .. 17 .. 19
Italy 32 32 21 20 .. .. 5 7 35 36 6 5
Jamaica .. 25 .. 37 .. 7 .. 10 .. 3 .. 18
Japan .. .. .. .. .. .. .. .. .. .. .. ..
Jordana 10 17 23 38 22 6 9 3 .. 0 36 36
Kazakhstana 11 24 28 20 3 6 5 0 48 .. 6 51
Kenyaa 35 40 40 41 14 10 1 1 0 .. 10 8
Korea, Dem. Rep. .. .. .. .. .. .. .. .. .. .. .. ..
Korea, Rep.a 31 28 32 26 7 4 10 9 8 16 12 17
Kosovo .. .. .. .. .. .. .. .. .. .. .. ..
Kuwaita 1 1 0 .. 2 1 0 0 .. .. 97 98
Kyrgyz Republica 26 12 56 42 5 9 1 .. .. .. 11 37
Lao PDR .. 21 .. 46 .. 9 .. 1 .. .. .. 22
Latviaa 7 8 41 35 3 0 0 0 35 31 13 26
Lebanon .. 15 .. 44 .. 6 .. 10 .. 1 .. 23
Lesothoa 15 17 12 12 49 57 1 3 .. .. 24 11
Liberiaa .. 28 .. 15 .. 39 .. 1 .. .. .. 18
Libya .. .. .. .. .. .. .. .. .. .. .. ..
Lithuania .. 10 .. 36 .. .. .. 0 .. 42 .. 13
Macedonia, FYRa .. 13 .. 40 .. 5 .. 0 .. 29 .. 13
Madagascar .. 12 .. 15 .. 31 .. 6 .. 4 .. 32
Malawi .. .. .. .. .. .. .. .. .. .. .. ..
Malaysiaa 38 46 27 16 12 2 6 3 .. .. 17 33
Mali .. 19 .. 29 .. 10 .. 10 .. .. .. 31
Mauritania .. .. .. .. .. .. .. .. .. .. .. ..
Mauritius .. 23 .. 46 .. 2 .. 7 .. 4 .. 17
Mexicoa 27 .. 54 .. 4 .. 2 .. 14 .. 16 ..
Moldovaa 6 1 38 46 5 4 1 0 38 33 2 16
Mongoliaa 31 21 18 30 9 6 0 0 15 17 27 26
Moroccoa .. 28 .. 31 .. 6 .. 5 .. 12 .. 17
Mozambique .. .. .. .. .. .. .. .. .. .. .. ..
Myanmara 20 .. 26 .. 12 .. .. .. .. .. 42 ..
Namibiaa 27 28 32 19 28 44 2 1 .. 0 11 7
Nepala 10 14 33 35 26 16 4 5 .. .. 27 29
Netherlands 26 26 24 27 .. .. 2 2 40 35 8 10
New Zealand .. 57 .. 26 .. 3 .. 0 .. 0 .. 15
Nicaraguaa 9 29 52 49 7 4 0 0 .. .. 31 18
Niger .. 12 .. 18 .. 26 .. 3 .. .. .. 41
Nigeriaa .. 1 .. 2 .. .. .. .. .. .. .. 97
Norway .. 28 .. 24 .. 0 .. 1 .. 21 .. 26
Omana 21 .. 1 .. 3 .. 2 .. .. .. 74 ..
Pakistana 18 25 27 32 24 8 7 0 .. .. 24 35
Panamaa 20 .. 17 .. 11 .. 3 .. 16 .. 34 ..
Papua New Guineaa 40 .. 8 .. 27 .. 2 .. 0 .. 23 ..
Paraguaya 15 16 36 43 18 7 4 1 6 7 22 26
Perua 15 30 46 39 10 2 8 6 10 10 11 13
Philippinesa 33 39 26 29 29 20 4 .. .. .. 8 13
Poland .. 14 .. 37 .. 0 .. 1 .. 37 .. 10
Portugal 23 23 33 31 0 0 2 2 30 33 .. ..
Puerto Rico .. .. .. .. .. .. .. .. .. .. .. ..
Qatara .. 40 .. .. .. 2 .. .. .. .. .. 58
Central government revenues 4.14Taxes on income,
profi ts, and
capital gains
Taxes on
goods and
services
Taxes on
International
trade
Other
taxes
Social
contributions
Grants and
other revenue
% of
revenue
% of
revenue
% of
revenue
% of
revenue
% of
revenue
% of
revenue
1995 2009 1995 2009 1995 2009 1995 2009 1995 2009 1995 2009

2011 World Development Indicators248
Romania .. 22 .. 35 .. 0 .. 0 .. 33 .. 10
Russian Federation .. 1 .. 16 .. 18 .. 0 .. 17 .. 48
Rwandaa 11 .. 25 .. 23 .. 3 .. 2 .. 36 ..
Saudi Arabia .. .. .. .. .. .. .. .. .. .. .. ..
Senegala 17 .. 19 .. 36 .. 2 .. .. .. 26 ..
Serbiaa .. 9 .. 43 .. 5 .. 0 .. 35 .. 7
Sierra Leonea 15 17 34 25 39 14 0 .. .. .. 12 44
Singaporea 26 36 20 26 1 0 15 14 .. .. 38 24
Slovak Republic .. 9 .. 33 .. 0 .. 0 .. 43 .. 15
Sloveniaa 13 13 33 33 9 0 0 0 42 41 3 12
Somalia .. .. .. .. .. .. .. .. .. .. .. ..
South Africa .. 53 .. 32 .. 3 .. 2 .. 2 .. 8
Spain 28 24 21 13 0 .. 0 0 40 58 .. 4
Sri Lankaa 12 18 49 45 17 14 4 8 1 1 18 14
Sudana 17 .. 41 .. 27 .. 1 .. .. .. 14 ..
Swazilanda .. .. .. .. .. .. .. .. .. .. .. ..
Sweden 13 11 33 37 .. .. 4 13 32 25 .. ..
Switzerlanda 11 24 21 26 1 6 2 3 49 36 17 5
Syrian Arab Republica 23 .. 37 .. 13 .. 8 .. 0 .. 19 ..
Tajikistana 6 .. 63 .. 12 .. 0 .. 13 .. 5 ..
Tanzania .. .. .. .. .. .. .. .. .. .. .. ..
Thailand .. 38 .. 38 .. 5 .. 1 .. 5 .. 14
Timor-Leste .. .. .. .. .. .. .. .. .. .. .. ..
Togo .. 17 .. 34 .. 18 .. 3 .. .. .. 28
Trinidad and Tobagoa 50 63 26 13 6 4 1 8 2 4 15 9
Tunisiaa 16 27 20 31 28 6 4 4 15 19 17 12
Turkeya .. 26 .. 51 .. 1 .. 5 .. .. .. 16
Turkmenistan .. .. .. .. .. .. .. .. .. .. .. ..
Ugandaa 10 22 45 47 7 10 2 0 .. .. 37 22
Ukrainea .. 10 .. 34 .. 2 .. 0 .. 37 .. 17
United Arab Emiratesa .. .. 15 .. .. .. .. .. 1 .. 84 ..
United Kingdom 37 36 32 28 .. .. 6 7 20 23 5 6
United States .. 47 .. 3 .. 1 .. 1 .. 43 .. 6
Uruguaya 10 18 32 41 4 3 10 2 31 30 8 6
Uzbekistan .. .. .. .. .. .. .. .. .. .. .. ..
Venezuela, RBa 38 .. 33 .. 9 .. 0 .. 4 .. 19 ..
Vietnam .. .. .. .. .. .. .. .. .. .. .. ..
West Bank and Gaza .. 2 .. 21 .. 11 .. 0 .. 0 .. 66
Yemen, Rep.a 17 .. 10 .. 18 .. 3 .. .. .. 51 ..
Zambiaa 27 33 22 36 36 8 0 0 0 .. 15 23
Zimbabwea 36 .. 22 .. 17 .. 3 .. 2 .. 19 ..
World .. m 23 m .. m 32 m .. m 5 m .. m 2 m .. m .. m .. m 17 m
Low income .. .. .. .. .. .. .. .. .. .. .. ..
Middle income .. 25 .. 36 .. 5 .. 2 .. .. .. 17
Lower middle income 17 26 27 33 16 6 2 1 .. .. 23 17
Upper middle income .. 23 .. 36 .. 4 .. 2 .. 22 .. 16
Low & middle income .. 21 .. 36 .. 7 .. 2 .. .. .. 18
East Asia & Pacifi c 32 37 26 31 10 6 2 1 .. .. 23 26
Europe & Central Asia .. 10 .. 42 .. 4 .. 0 .. 29 .. 16
Latin America & Carib. .. 27 .. 39 .. 4 .. 2 .. 10 .. 17
Middle East & N. Africa 16 27 16 31 16 6 6 3 .. 6 38 23
South Asia 15 19 31 29 24 13 4 0 .. 0 25 29
Sub-Saharan Africa .. .. .. .. .. .. .. .. .. .. .. ..
High income 21 24 28 27 .. 0 2 2 34 36 10 12
Euro area 22 23 24 27 0 0 2 2 36 37 7 8
Note: Components may not sum to 100 percent because of missing data or adjustment to tax revenue.
a. Data were reported on a cash basis and have been adjusted to the accrual framework.
Central government revenues4.14Taxes on income,
profi ts, and
capital gains
Taxes on
goods
and services
Taxes on
International
trade
Other
taxes
Social
contributions
Grants and
other revenue
% of
revenue
% of
revenue
% of
revenue
% of
revenue
% of
revenue
% of
revenue
1995 2009 1995 2009 1995 2009 1995 2009 1995 2009 1995 2009

2011 World Development Indicators 249
ECONOMY
About the data Defi nitions
The International Monetary Fund (IMF) classifi es
government revenues as taxes, grants, and property
income. Taxes are classifi ed by the base on which
the tax is levied, grants by the source, and property
income by type (for example, interest, dividends,
or rent). The most important source of revenue is
taxes. Grants are unrequited, nonrepayable, non-
compulsory receipts from other government units
and foreign governments or from international orga-
nizations. Transactions are generally recorded on an
accrual basis.
The IMF’s Government Finance Statistics Manual
2001 describes taxes as compulsory, unrequited
payments made to governments by individuals, busi-
nesses, or institutions. Taxes are classifi ed in six
major groups by the base on which the tax is levied:
income, profi ts, and capital gains; payroll and work-
force; property; goods and services; international
trade and transactions; and other. However, the dis-
tinctions are not always clear. Taxes levied on the
income and profi ts of individuals and corporations
are classifi ed as direct taxes, and taxes and duties
levied on goods and services are classifi ed as indi-
rect taxes. This distinction may be a useful simplifi ca-
tion, but it has no particular analytical signifi cance
except with respect to the capacity to fi x tax rates.
Direct taxes tend to be progressive, whereas indirect
taxes are proportional.
Social security taxes do not refl ect compulsory pay-
ments made by employers to provident funds or other
agencies with a like purpose. Similarly, expenditures
from such funds are not refl ected in government
expenses (see table 4.13). For further discussion of
taxes and tax policies, see About the data for table
5.6. For further discussion of government revenues
and expenditures, see About the data for tables 4.12
and 4.13.
• Taxes on income, profi ts, and capital gains are
levied on the actual or presumptive net income
of individuals, on the profi ts of corporations and
enterprises, and on capital gains, whether real-
ized or not, on land, securities, and other assets.
Intra-governmental payments are eliminated in con-
solidation. • Taxes on goods and services include
general sales and turnover or value added taxes,
selective excises on goods, selective taxes on ser-
vices, taxes on the use of goods or property, taxes
on extraction and production of minerals, and prof-
its of fi scal monopolies. • Taxes on international
trade include import duties, export duties, profi ts
of export or import monopolies, exchange profi ts,
and exchange taxes. • Other taxes include employer
payroll or labor taxes, taxes on property, and taxes
not allocable to other categories, such as penalties
for late payment or nonpayment of taxes. • Social
contributions include social security contributions by
employees, employers, and self-employed individu-
als, and other contributions whose source cannot
be determined. They also include actual or imputed
contributions to social insurance schemes operated
by governments. • Grants and other revenue include
grants from other foreign governments, international
organizations, and other government units; interest;
dividends; rent; requited, nonrepayable receipts
for public purposes (such as fi nes, administrative
fees, and entrepreneurial income from government
ownership of property); and voluntary, unrequited,
nonrepayable receipts other than grants.
4.14Central government revenues
Data sources
Data on central government revenues are from the
IMF’s Government Finance Statistics database.
Each country’s accounts are reported using the
system of common defi nitions and classifi cations
in the IMF’s Government Finance Statistics Manual
2001. The IMF receives additional information
from the Organisation for Economic Co-operation
and Development on the tax revenues of some of
its members. See the IMF sources for complete
and authoritative explanations of concepts, defi ni-
tions, and data sources.
Taxes on income and capital gains as a share of central government revenue, 2009 (percent)
100 1,000
0
10
20
30
40
50
60
70
10,000 100,000
GNI per capita ($, log scale)
Low income Middle income High income
High-income economies tend to tax income and property, whereas low-income economies tend to rely
on indirect taxes on international trade and goods and services. But there are exceptions in all groups.
Note: Data are for the most recent year for 2005–09.
Source: International Monetary Fund, Government Finance Statistics data fi les, and World Development Indicators data fi les.
Rich economies rely more on direct taxes 4.14a
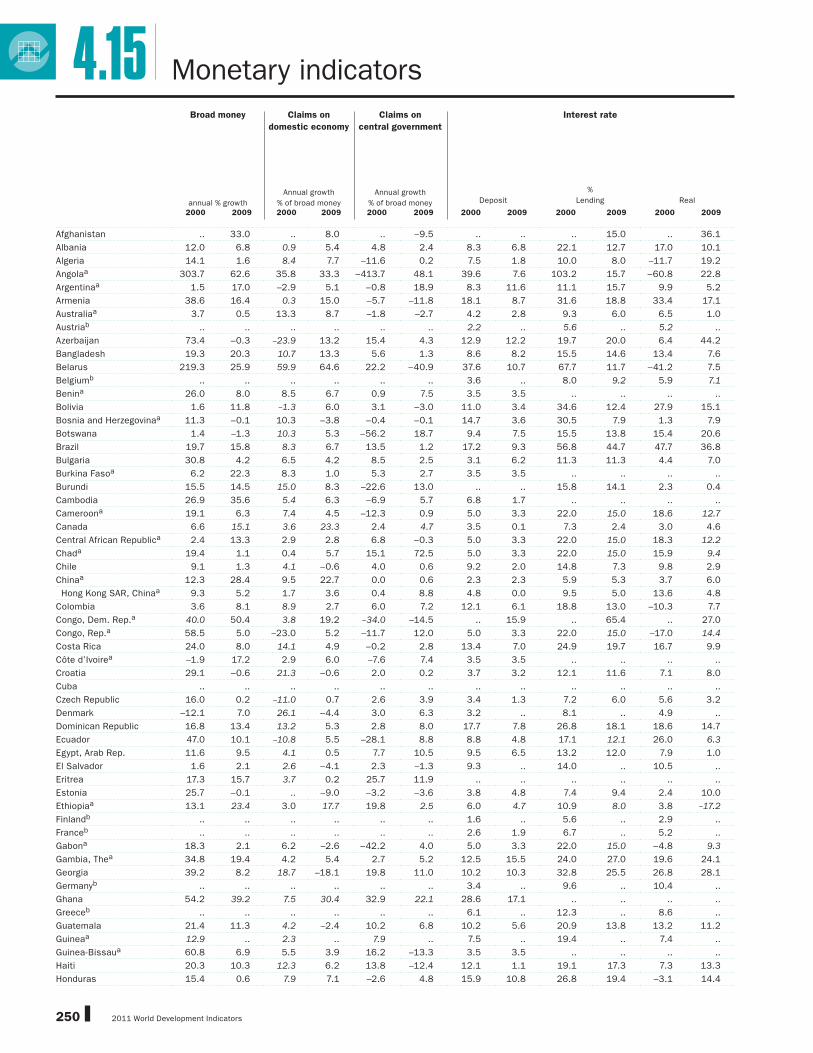
2011 World Development Indicators250
4.15 Monetary indicators
Broad money Claims on
domestic economy
Claims on
central government
Interest rate
annual % growth
Annual growth
% of broad money
Annual growth
% of broad money Deposit
%
Lending Real
2000 2009 2000 2009 2000 2009 2000 2009 2000 2009 2000 2009
Afghanistan .. 33.0 .. 8.0 .. –9.5 .. .. .. 15.0 .. 36.1
Albania 12.0 6.8 0.9 5.4 4.8 2.4 8.3 6.8 22.1 12.7 17.0 10.1
Algeria 14.1 1.6 8.4 7.7 –11.6 0.2 7.5 1.8 10.0 8.0 –11.7 19.2
Angolaa 303.7 62.6 35.8 33.3 –413.7 48.1 39.6 7.6 103.2 15.7 –60.8 22.8
Argentinaa 1.5 17.0 –2.9 5.1 –0.8 18.9 8.3 11.6 11.1 15.7 9.9 5.2
Armenia 38.6 16.4 0.3 15.0 –5.7 –11.8 18.1 8.7 31.6 18.8 33.4 17.1
Australiaa 3.7 0.5 13.3 8.7 –1.8 –2.7 4.2 2.8 9.3 6.0 6.5 1.0
Austriab .. .. .. .. .. .. 2.2 .. 5.6 .. 5.2 ..
Azerbaijan 73.4 –0.3 –23.9 13.2 15.4 4.3 12.9 12.2 19.7 20.0 6.4 44.2
Bangladesh 19.3 20.3 10.7 13.3 5.6 1.3 8.6 8.2 15.5 14.6 13.4 7.6
Belarus 219.3 25.9 59.9 64.6 22.2 –40.9 37.6 10.7 67.7 11.7 –41.2 7.5
Belgiumb .. .. .. .. .. .. 3.6 .. 8.0 9.2 5.9 7.1
Benina 26.0 8.0 8.5 6.7 0.9 7.5 3.5 3.5 .. .. .. ..
Bolivia 1.6 11.8 –1.3 6.0 3.1 –3.0 11.0 3.4 34.6 12.4 27.9 15.1
Bosnia and Herzegovinaa 11.3 –0.1 10.3 –3.8 –0.4 –0.1 14.7 3.6 30.5 7.9 1.3 7.9
Botswana 1.4 –1.3 10.3 5.3 –56.2 18.7 9.4 7.5 15.5 13.8 15.4 20.6
Brazil 19.7 15.8 8.3 6.7 13.5 1.2 17.2 9.3 56.8 44.7 47.7 36.8
Bulgaria 30.8 4.2 6.5 4.2 8.5 2.5 3.1 6.2 11.3 11.3 4.4 7.0
Burkina Fasoa 6.2 22.3 8.3 1.0 5.3 2.7 3.5 3.5 .. .. .. ..
Burundi 15.5 14.5 15.0 8.3 –22.6 13.0 .. .. 15.8 14.1 2.3 0.4
Cambodia 26.9 35.6 5.4 6.3 –6.9 5.7 6.8 1.7 .. .. .. ..
Cameroona 19.1 6.3 7.4 4.5 –12.3 0.9 5.0 3.3 22.0 15.0 18.6 12.7
Canada 6.6 15.1 3.6 23.3 2.4 4.7 3.5 0.1 7.3 2.4 3.0 4.6
Central African Republica 2.4 13.3 2.9 2.8 6.8 –0.3 5.0 3.3 22.0 15.0 18.3 12.2
Chada 19.4 1.1 0.4 5.7 15.1 72.5 5.0 3.3 22.0 15.0 15.9 9.4
Chile 9.1 1.3 4.1 –0.6 4.0 0.6 9.2 2.0 14.8 7.3 9.8 2.9
Chinaa 12.3 28.4 9.5 22.7 0.0 0.6 2.3 2.3 5.9 5.3 3.7 6.0
Hong Kong SAR, Chinaa 9.3 5.2 1.7 3.6 0.4 8.8 4.8 0.0 9.5 5.0 13.6 4.8
Colombia 3.6 8.1 8.9 2.7 6.0 7.2 12.1 6.1 18.8 13.0 –10.3 7.7
Congo, Dem. Rep.a 40.0 50.4 3.8 19.2 –34.0 –14.5 .. 15.9 .. 65.4 .. 27.0
Congo, Rep.a 58.5 5.0 –23.0 5.2 –11.7 12.0 5.0 3.3 22.0 15.0 –17.0 14.4
Costa Rica 24.0 8.0 14.1 4.9 –0.2 2.8 13.4 7.0 24.9 19.7 16.7 9.9
Côte d’Ivoirea –1.9 17.2 2.9 6.0 –7.6 7.4 3.5 3.5 .. .. .. ..
Croatia 29.1 –0.6 21.3 –0.6 2.0 0.2 3.7 3.2 12.1 11.6 7.1 8.0
Cuba .. .. .. .. .. .. .. .. .. .. .. ..
Czech Republic 16.0 0.2 –11.0 0.7 2.6 3.9 3.4 1.3 7.2 6.0 5.6 3.2
Denmark –12.1 7.0 26.1 –4.4 3.0 6.3 3.2 .. 8.1 .. 4.9 ..
Dominican Republic 16.8 13.4 13.2 5.3 2.8 8.0 17.7 7.8 26.8 18.1 18.6 14.7
Ecuador 47.0 10.1 –10.8 5.5 –28.1 8.8 8.8 4.8 17.1 12.1 26.0 6.3
Egypt, Arab Rep. 11.6 9.5 4.1 0.5 7.7 10.5 9.5 6.5 13.2 12.0 7.9 1.0
El Salvador 1.6 2.1 2.6 –4.1 2.3 –1.3 9.3 .. 14.0 .. 10.5 ..
Eritrea 17.3 15.7 3.7 0.2 25.7 11.9 .. .. .. .. .. ..
Estonia 25.7 –0.1 .. –9.0 –3.2 –3.6 3.8 4.8 7.4 9.4 2.4 10.0
Ethiopiaa 13.1 23.4 3.0 17.7 19.8 2.5 6.0 4.7 10.9 8.0 3.8 –17.2
Finlandb .. .. .. .. .. .. 1.6 .. 5.6 .. 2.9 ..
Franceb .. .. .. .. .. .. 2.6 1.9 6.7 .. 5.2 ..
Gabona 18.3 2.1 6.2 –2.6 –42.2 4.0 5.0 3.3 22.0 15.0 –4.8 9.3
Gambia, Thea 34.8 19.4 4.2 5.4 2.7 5.2 12.5 15.5 24.0 27.0 19.6 24.1
Georgia 39.2 8.2 18.7 –18.1 19.8 11.0 10.2 10.3 32.8 25.5 26.8 28.1
Germanyb .. .. .. .. .. .. 3.4 .. 9.6 .. 10.4 ..
Ghana 54.2 39.2 7.5 30.4 32.9 22.1 28.6 17.1 .. .. .. ..
Greeceb .. .. .. .. .. .. 6.1 .. 12.3 .. 8.6 ..
Guatemala 21.4 11.3 4.2 –2.4 10.2 6.8 10.2 5.6 20.9 13.8 13.2 11.2
Guineaa 12.9 .. 2.3 .. 7.9 .. 7.5 .. 19.4 .. 7.4 ..
Guinea-Bissaua 60.8 6.9 5.5 3.9 16.2 –13.3 3.5 3.5 .. .. .. ..
Haiti 20.3 10.3 12.3 6.2 13.8 –12.4 12.1 1.1 19.1 17.3 7.3 13.3
Honduras 15.4 0.6 7.9 7.1 –2.6 4.8 15.9 10.8 26.8 19.4 –3.1 14.4

2011 World Development Indicators 251
ECONOMY
Monetary indicators 4.15Broad money Claims on
domestic economy
Claims on
central government
Interest rate
annual % growth
Annual growth
% of broad money
Annual growth
% of broad money Deposit
%
Lending Real
2000 2009 2000 2009 2000 2009 2000 2009 2000 2009 2000 2009
Hungary 12.6 3.3 14.5 –4.2 –2.0 0.1 9.5 5.8 12.6 11.0 0.9 6.1
Indiaa 15.2 18.0 9.9 7.8 4.7 9.4 .. .. 12.3 12.2 8.5 4.3
Indonesia 16.6 13.0 7.2 6.9 17.2 2.5 12.5 9.3 18.5 14.5 –1.7 5.6
Iran, Islamic Rep.a 22.4 27.7 15.8 10.2 –7.9 2.0 11.7 13.1 .. 12.0 .. 11.3
Iraq .. 26.7 .. 2.0 .. 33.6 .. 7.8 .. 15.6 .. 61.5
Irelandb .. .. .. .. .. .. 0.1 .. 4.8 .. –1.1 ..
Israela 8.0 6.1 10.7 –0.5 –4.8 1.1 8.6 1.1 12.9 3.7 11.1 –1.4
Italyb .. .. .. .. .. .. 1.8 .. 7.0 4.8 5.0 2.6
Jamaica –7.0 5.4 9.1 2.6 –2.3 9.4 11.6 7.0 23.3 16.4 11.5 9.3
Japan 1.3 2.1 –5.4 –2.9 2.6 4.4 0.1 0.4 2.1 1.7 3.9 2.7
Jordana 7.6 24.3 3.2 0.8 –1.2 2.5 7.0 4.9 11.8 9.2 12.2 1.1
Kazakhstan 45.0 19.5 32.2 14.1 –3.2 –4.7 .. .. .. .. .. ..
Kenya 4.9 16.5 4.7 11.5 –2.1 8.2 8.1 6.0 22.3 14.8 15.3 7.6
Korea, Dem. Rep. .. .. .. .. .. .. .. .. .. .. .. ..
Korea, Rep.a 25.4 12.2 21.9 3.9 –1.4 2.2 7.9 3.5 8.5 5.6 3.4 2.2
Kosovo –12.2 11.2 12.1 7.6 –37.7 1.8 .. 4.0 .. 14.1 .. 18.1
Kuwait 6.3 13.4 8.5 7.1 –7.4 –1.0 5.9 2.8 8.9 6.2 –9.7 2.5
Kyrgyz Republica 11.7 33.2 3.5 29.2 7.8 –8.8 18.4 3.9 51.9 23.0 19.5 20.5
Lao PDRa 46.0 18.3 22.4 19.4 –17.6 –3.4 12.0 4.7 32.0 24.0 5.5 14.4
Latvia 27.0 –2.7 31.2 –25.9 7.8 –9.6 4.4 8.0 11.9 16.2 7.4 17.1
Lebanona 9.8 19.6 2.9 4.8 10.5 4.5 11.2 7.3 18.2 9.6 20.7 3.5
Lesotho 1.4 17.7 6.6 7.2 14.9 –0.5 4.9 4.9 17.1 13.0 14.4 9.2
Liberiaa 18.3 43.4 –10.0 17.1 197.0 47.7 6.2 4.1 20.5 14.2 22.1 6.3
Libyaa 3.1 17.4 0.2 2.0 –10.4 1.8 3.0 2.5 7.0 6.0 –9.6 57.8
Lithuania 16.5 0.6 14.4 –12.9 0.5 –4.1 3.9 4.8 12.1 8.4 11.1 10.8
Macedonia, FYR 22.2 5.5 2.7 3.1 –15.9 1.3 11.2 7.0 18.9 10.1 9.9 7.1
Madagascara 17.2 11.3 7.9 3.7 0.1 8.9 15.0 11.5 26.5 45.0 18.0 33.8
Malawia 45.5 24.6 16.5 19.3 7.7 21.2 33.3 3.5 53.1 25.3 17.3 15.6
Malaysia 10.0 7.7 5.5 5.5 2.1 3.3 3.4 2.1 7.7 5.1 –1.1 12.6
Malia 12.2 14.6 –1.5 7.0 –5.0 –13.3 3.5 3.5 .. .. .. ..
Mauritaniaa 16.1 .. 41.1 .. –64.3 .. 9.4 8.0 25.6 23.5 23.9 15.1
Mauritius 9.2 8.1 5.8 0.8 –4.7 1.1 9.6 8.4 20.8 19.3 18.3 17.5
Mexico –4.5 11.5 10.1 8.1 3.5 4.1 8.3 2.0 16.9 7.1 4.3 2.7
Moldova 41.7 3.2 24.4 –4.0 –5.7 4.0 24.9 14.9 33.8 20.5 5.1 18.1
Mongolia 17.6 26.9 29.6 1.2 –7.1 –6.4 16.8 13.3 37.0 21.7 8.6 21.3
Morocco 8.4 5.8 3.6 9.0 3.6 –1.1 5.2 3.8 13.3 .. 14.0 ..
Mozambique 38.3 32.6 11.9 32.7 6.9 0.2 9.7 9.5 19.0 15.7 6.3 12.0
Myanmara 42.5 30.6 13.9 5.2 25.0 29.9 9.8 12.0 15.3 17.0 12.5 ..
Namibia 13.2 5.9 19.4 11.3 –4.0 –4.1 7.4 6.2 15.3 11.1 –9.0 4.4
Nepal 18.8 29.4 –4.6 26.4 2.6 –1.6 6.0 2.5 9.5 8.0 4.8 –3.6
Netherlandsb .. .. .. .. .. .. 2.9 2.6 4.8 2.0 0.6 2.3
New Zealanda 1.5 –0.6 8.0 1.3 –0.9 2.7 6.4 4.0 9.3 10.4 5.9 8.6
Nicaragua 9.4 14.3 7.0 –7.4 10.0 7.0 10.8 6.0 18.1 14.0 8.8 –2.0
Nigera 12.4 18.7 14.8 12.1 –14.1 28.9 3.5 3.5 .. .. .. ..
Nigeria 48.1 14.4 5.8 17.5 –43.0 12.7 11.7 13.3 21.3 18.4 –12.2 19.1
Norwaya 8.7 .. 18.0 .. –4.8 .. 6.7 2.3 8.9 4.3 –5.8 8.7
Oman 6.0 4.7 1.1 7.3 9.5 1.4 7.6 4.1 10.1 7.4 –8.3 –16.0
Pakistan 12.1 14.8 2.0 8.0 2.6 7.4 .. 8.7 .. 14.5 .. –4.6
Panama 9.3 10.3 –8.4 2.5 0.2 –0.6 7.1 3.5 10.5 8.2 11.9 4.0
Papua New Guinea 5.0 21.9 1.2 8.4 –4.6 10.1 8.5 2.3 17.5 10.1 3.9 14.2
Paraguay 2.8 22.2 1.7 14.8 4.7 –3.5 15.7 1.5 26.8 28.3 13.1 28.4
Perua –0.4 2.6 –2.7 0.8 2.3 0.3 9.8 2.8 30.0 21.0 25.4 17.5
Philippines 8.1 10.0 2.2 5.4 1.5 2.5 8.3 2.7 10.9 8.6 4.3 5.9
Poland 11.6 8.1 .. 7.9 –5.8 1.7 14.2 2.2 20.0 5.5 12.0 3.9
Portugalb .. .. .. .. .. .. 2.4 .. 5.2 .. 1.8 ..
Puerto Rico .. .. .. .. .. .. .. .. .. .. .. ..
Qatar 10.7 16.9 –1.7 2.9 –23.1 26.7 0.0 4.2 .. 7.0 .. 31.0

2011 World Development Indicators252
Monetary indicators 4.15Broad money Claims on
domestic economy
Claims on
central government
Interest rate
annual % growth
Annual growth
% of broad money
Annual growth
% of broad money Deposit
%
Lending Real
2000 2009 2000 2009 2000 2009 2000 2009 2000 2009 2000 2009
Romania 40.8 9.0 20.0 1.9 –1.1 10.7 33.1 12.0 53.9 17.3 6.7 10.1
Russian Federation 57.9 16.4 33.2 2.1 –18.1 14.0 6.5 8.6 24.4 15.3 –9.6 12.5
Rwandaa 15.6 .. 10.3 .. –11.4 .. 10.1 6.7 17.0 16.5 20.6 3.3
Saudi Arabiaa 4.5 10.8 3.3 0.0 –3.5 8.9 .. .. .. .. .. ..
Senegala 10.7 11.4 19.1 2.6 –3.9 4.3 3.5 3.5 .. .. .. ..
Serbia 160.8 21.3 –71.0 18.1 22.5 4.9 78.7 11.8 6.3 11.8 –40.1 1.6
Sierra Leonea 12.1 27.5 1.6 14.2 54.6 4.0 9.2 9.7 26.3 24.5 19.0 12.0
Singaporea –2.0 11.3 5.1 1.6 –1.6 8.9 1.7 0.3 5.8 5.4 2.0 7.4
Slovak Republicb .. .. .. .. .. .. 8.5 3.7 14.9 5.8 5.0 2.8
Sloveniab .. .. .. .. .. .. 10.0 1.4 15.8 5.9 9.9 4.0
Somalia .. .. .. .. .. .. .. .. .. .. .. ..
South Africa 7.2 1.8 –11.8 0.1 0.2 5.5 9.2 8.5 14.5 11.7 5.2 4.1
Spainb .. .. .. .. .. .. 3.0 .. 5.2 .. 1.7 ..
Sri Lankaa 12.9 18.7 9.1 –4.6 12.5 4.4 9.2 10.6 16.2 15.7 8.3 9.5
Sudan 36.9 23.7 16.9 13.6 33.9 13.0 .. .. .. .. .. ..
Swaziland –6.6 26.8 16.9 12.5 1.7 17.4 6.5 5.4 14.0 11.4 13.8 5.6
Sweden 1.9 2.5 8.5 3.8 2.4 1.6 2.2 .. 5.8 .. 4.3 ..
Switzerlanda –16.9 7.6 –1.2 5.1 2.1 0.6 3.0 0.1 4.3 2.8 3.1 2.5
Syrian Arab Republic 19.0 8.6 –4.1 8.6 –6.1 1.4 4.0 6.4 9.0 10.0 –0.6 19.0
Tajikistana 63.3 –3.6 8.2 145.1 36.6 –9.8 1.3 5.8 25.6 22.9 2.4 8.5
Tanzania 14.8 17.7 12.2 5.8 0.7 6.2 7.4 8.0 21.6 15.0 13.0 7.1
Thailand 4.9 6.8 6.2 3.6 0.5 0.9 3.3 1.0 7.8 6.0 6.4 3.9
Timor-Leste 41.1 39.3 45.7 0.6 –36.8 12.1 0.8 0.8 16.7 11.2 11.4 1.1
Togoa 15.2 16.0 0.5 9.7 –0.5 6.3 3.5 3.5 .. .. .. ..
Trinidad and Tobagoa 11.7 30.6 8.8 –3.1 –13.2 25.3 8.2 3.4 16.5 11.9 3.2 32.8
Tunisiaa 14.1 12.5 23.7 9.7 5.6 1.4 .. .. .. .. .. ..
Turkey 40.7 12.7 16.2 9.4 26.8 12.4 47.2 17.6 .. .. .. ..
Turkmenistana 83.3 .. 10.8 .. –53.4 .. .. .. .. .. .. ..
Uganda 18.1 17.5 8.2 10.1 29.4 0.4 9.8 9.8 22.9 21.0 10.6 3.8
Ukraine 44.5 –5.5 30.9 –3.4 –1.7 9.4 13.7 13.8 41.5 20.9 15.0 6.6
United Arab Emiratesa 15.3 9.8 8.7 1.4 –9.6 13.3 6.2 .. 9.7 .. –9.9 ..
United Kingdoma 11.1 0.0 17.4 –2.6 –2.4 7.9 4.5 .. 6.0 0.6 4.7 –0.7
United States 8.1 –0.6 5.0 –1.3 0.5 4.5 .. .. 9.2 3.3 6.9 2.3
Uruguay 9.5 –2.6 45.1 –10.3 –1.8 3.0 18.3 4.4 46.1 15.3 41.1 8.9
Uzbekistan .. .. .. .. .. .. .. .. .. .. .. ..
Venezuela, RBa 33.7 26.1 14.3 18.6 –6.4 –1.9 16.3 16.4 25.2 19.9 –3.3 10.6
Vietnama 35.4 26.2 29.6 35.0 –2.4 7.0 3.7 12.7 10.6 10.1 6.9 3.8
West Bank and Gaza .. .. .. .. .. .. .. .. .. .. .. ..
Yemen, Rep.a 25.3 12.8 3.6 –1.2 –45.6 26.2 14.0 10.7 19.5 18.0 –4.9 23.1
Zambia 73.8 7.7 –11.4 –3.4 162.0 16.2 20.2 7.1 38.8 22.1 6.7 8.3
Zimbabwea 45.7 111.3 27.2 56.4 29.5 –28.7 50.2 121.5 68.2 579.0 67.8 ..
a. For these countries data reported under Claims on domestic economy include claims on private sector only. b. As members of the European Monetary Union, these countries share a
single currency, the euro.
2011 World Development Indicators 253
ECONOMY
About the data Defi nitions
Money and the fi nancial accounts that record the
supply of money lie at the heart of a country’s
fi nancial system. There are several commonly used
defi nitions of the money supply. The narrowest,
M1, encompasses currency held by the public and
demand deposits with banks. M2 includes M1 plus
time and savings deposits with banks that require
prior notice for withdrawal. M3 includes M2 as well
as various money market instruments, such as cer-
tifi cates of deposit issued by banks, bank deposits
denominated in foreign currency, and deposits with
fi nancial institutions other than banks. However
defi ned, money is a liability of the banking system,
distinguished from other bank liabilities by the spe-
cial role it plays as a medium of exchange, a unit of
account, and a store of value.
The banking system’s assets include its net for-
eign assets and net domestic credit. Net domestic
credit includes credit extended to the private sector
and general government and credit extended to the
nonfi nancial public sector in the form of investments
in short- and long-term government securities and
loans to state enterprises; liabilities to the public
and private sectors in the form of deposits with the
banking system are netted out. Net domestic credit
also includes credit to banking and nonbank fi nancial
institutions.
Domestic credit is the main vehicle through which
changes in the money supply are regulated, with cen-
tral bank lending to the government often playing the
most important role. The central bank can regulate
lending to the private sector in several ways—for
example, by adjusting the cost of the refi nancing
facilities it provides to banks, by changing market
interest rates through open market operations, or by
controlling the availability of credit through changes
in the reserve requirements imposed on banks and
ceilings on the credit provided by banks to the pri-
vate sector.
Monetary accounts are derived from the balance
sheets of fi nancial institutions—the central bank,
commercial banks, and nonbank fi nancial interme-
diaries. Although these balance sheets are usually
reliable, they are subject to errors of classifi cation,
valuation, and timing and to differences in account-
ing practices. For example, whether interest income
is recorded on an accrual or a cash basis can make
a substantial difference, as can the treatment of non-
performing assets. Valuation errors typically arise
for foreign exchange transactions, particularly in
countries with fl exible exchange rates or in countries
that have undergone currency devaluation during the
reporting period. The valuation of fi nancial deriva-
tives and the net liabilities of the banking system
can also be diffi cult. The quality of commercial bank
reporting also may be adversely affected by delays in
reports from bank branches, especially in countries
where branch accounts are not computerized. Thus
the data in the balance sheets of commercial banks
may be based on preliminary estimates subject to
constant revision. This problem is likely to be even
more serious for nonbank fi nancial intermediaries.
Many interest rates coexist in an economy, refl ect-
ing competitive conditions, the terms governing
loans and deposits, and differences in the position
and status of creditors and debtors. In some econo-
mies interest rates are set by regulation or adminis-
trative fi at. In economies with imperfect markets, or
where reported nominal rates are not indicative of
effective rates, it may be diffi cult to obtain data on
interest rates that refl ect actual market transactions.
Deposit and lending rates are collected by the Inter-
national Monetary Fund (IMF) as representative inter-
est rates offered by banks to resident customers.
The terms and conditions attached to these rates
differ by country, however, limiting their comparabil-
ity. Real interest rates are calculated by adjusting
nominal rates by an estimate of the infl ation rate in
the economy. A negative real interest rate indicates
a loss in the purchasing power of the principal. The
real interest rates in the table are calculated as (i –
P) / (1 + P), where i is the nominal lending interest
rate and P is the infl ation rate (as measured by the
GDP defl ator).
In 2009 the IMF began publishing a new presenta-
tion of monetary statistics for countries that report
data in accordance with the IMF’s Monetary and
Financial Statistics Manual 2000. The presentation
for countries that report data in accordance with the
IMF’s International Financial Statistics (IFS) remains
the same.
• Broad money (IFS line 35L..ZK) is the sum of
currency outside banks; demand deposits other
than those of the central government; the time,
savings, and foreign currency deposits of resident
sectors other than the central government; bank
and traveler’s checks; and other securities such
as certifi cates of deposit and commercial paper.
Change in broad money is measured as the differ-
ence in end-of-year totals relative to the preceding
year. For countries reporting under the old presen-
tation of monetary statistics and for all countries
prior to 2001, data are based on money plus quasi
money. • Claims on domestic economy (IFS line
32S..ZK) include gross credit from the fi nancial
system to households, nonprofi t institutions serv-
ing households, nonfi nancial corporations, state
and local governments, and social security funds.
For countries where claims on domestic economy
are not available, data are claims on private sec-
tor (IFS line 32D..ZK or 32D..ZF) • Claims on cen-
tral government (IFS line 32AN..ZK) include loans
to central government institutions net of deposits.
• Deposit interest rate is the rate paid by commer-
cial or similar banks for demand, time, or savings
deposits. • Lending interest rate is the rate charged
by banks on loans to prime customers. • Real inter-
est rate is the lending interest rate adjusted for infl a-
tion as measured by the GDP defl ator.
4.15Monetary indicators
253
Data sources
Data sources
Data on monetary and fi nancial statistics are
published by the IMF in its monthly International
Financial Statistics and annual International Finan-
cial Statistics Yearbook. The IMF collects data on
the fi nancial systems of its member countries. The
World Bank receives data from the IMF in elec-
tronic fi les that may contain more recent revisions
than the published sources. The discussion of
monetary indicators draws from an IMF publication
by Marcello Caiola, A Manual for Country Econo-
mists (1995). Also see the IMF’s Monetary and
Financial Statistics Manual (2000) for guidelines
for the presentation of monetary and fi nancial sta-
tistics. Data on real interest rates are derived from
World Bank data on the GDP defl ator.
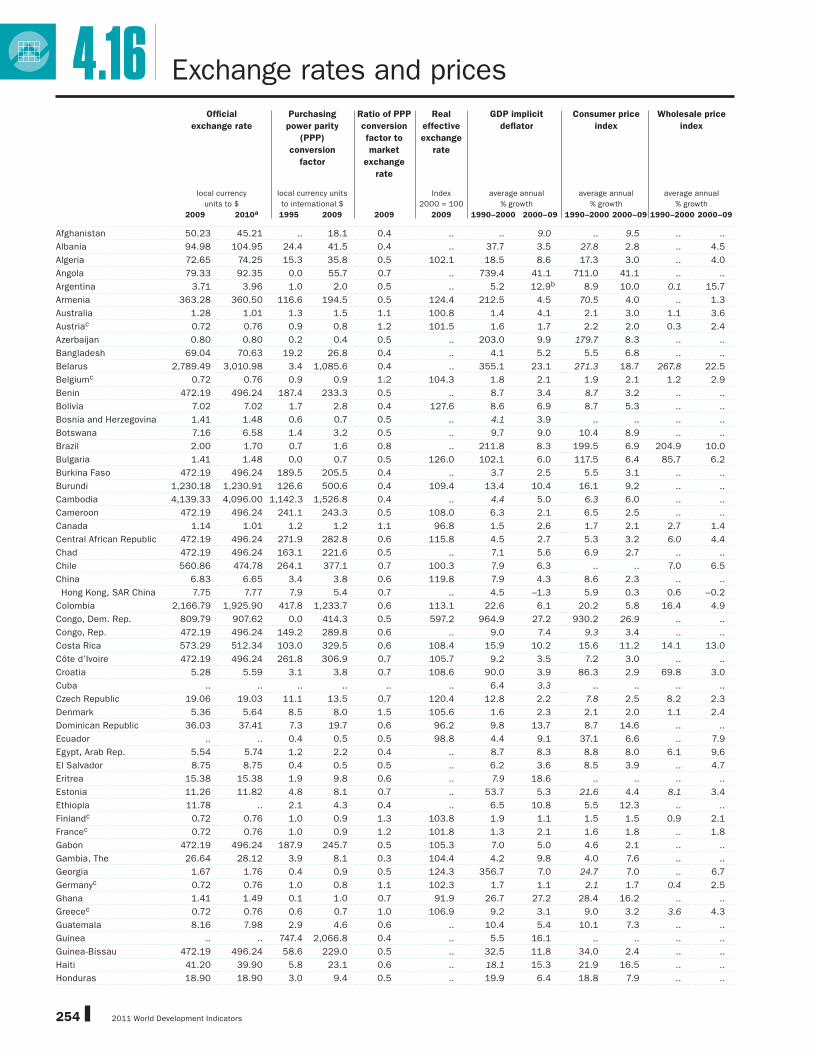
2011 World Development Indicators254
4.16 Exchange rates and prices
Offi cial
exchange rate
Purchasing
power parity
(PPP)
conversion
factor
Ratio of PPP
conversion
factor to
market
exchange
rate
Real
effective
exchange
rate
GDP implicit
defl ator
Consumer price
index
Wholesale price
index
local currency
units to $
local currency units
to international $
Index
2000 = 100
average annual
% growth
average annual
% growth
average annual
% growth
2009 2010a 1995 2009 2009 2009 1990–2000 2000–09 1990–2000 2000–09 1990–2000 2000–09
Afghanistan 50.23 45.21 .. 18.1 0.4 .. .. 9.0 .. 9.5 .. ..
Albania 94.98 104.95 24.4 41.5 0.4 .. 37.7 3.5 27.8 2.8 .. 4.5
Algeria 72.65 74.25 15.3 35.8 0.5 102.1 18.5 8.6 17.3 3.0 .. 4.0
Angola 79.33 92.35 0.0 55.7 0.7 .. 739.4 41.1 711.0 41.1 .. ..
Argentina 3.71 3.96 1.0 2.0 0.5 .. 5.2 12.9b 8.9 10.0 0.1 15.7
Armenia 363.28 360.50 116.6 194.5 0.5 124.4 212.5 4.5 70.5 4.0 .. 1.3
Australia 1.28 1.01 1.3 1.5 1.1 100.8 1.4 4.1 2.1 3.0 1.1 3.6
Austriac 0.72 0.76 0.9 0.8 1.2 101.5 1.6 1.7 2.2 2.0 0.3 2.4
Azerbaijan 0.80 0.80 0.2 0.4 0.5 .. 203.0 9.9 179.7 8.3 .. ..
Bangladesh 69.04 70.63 19.2 26.8 0.4 .. 4.1 5.2 5.5 6.8 .. ..
Belarus 2,789.49 3,010.98 3.4 1,085.6 0.4 .. 355.1 23.1 271.3 18.7 267.8 22.5
Belgiumc 0.72 0.76 0.9 0.9 1.2 104.3 1.8 2.1 1.9 2.1 1.2 2.9
Benin 472.19 496.24 187.4 233.3 0.5 .. 8.7 3.4 8.7 3.2 .. ..
Bolivia 7.02 7.02 1.7 2.8 0.4 127.6 8.6 6.9 8.7 5.3 .. ..
Bosnia and Herzegovina 1.41 1.48 0.6 0.7 0.5 .. 4.1 3.9 .. .. .. ..
Botswana 7.16 6.58 1.4 3.2 0.5 .. 9.7 9.0 10.4 8.9 .. ..
Brazil 2.00 1.70 0.7 1.6 0.8 .. 211.8 8.3 199.5 6.9 204.9 10.0
Bulgaria 1.41 1.48 0.0 0.7 0.5 126.0 102.1 6.0 117.5 6.4 85.7 6.2
Burkina Faso 472.19 496.24 189.5 205.5 0.4 .. 3.7 2.5 5.5 3.1 .. ..
Burundi 1,230.18 1,230.91 126.6 500.6 0.4 109.4 13.4 10.4 16.1 9.2 .. ..
Cambodia 4,139.33 4,096.00 1,142.3 1,526.8 0.4 .. 4.4 5.0 6.3 6.0 .. ..
Cameroon 472.19 496.24 241.1 243.3 0.5 108.0 6.3 2.1 6.5 2.5 .. ..
Canada 1.14 1.01 1.2 1.2 1.1 96.8 1.5 2.6 1.7 2.1 2.7 1.4
Central African Republic 472.19 496.24 271.9 282.8 0.6 115.8 4.5 2.7 5.3 3.2 6.0 4.4
Chad 472.19 496.24 163.1 221.6 0.5 .. 7.1 5.6 6.9 2.7 .. ..
Chile 560.86 474.78 264.1 377.1 0.7 100.3 7.9 6.3 .. .. 7.0 6.5
China 6.83 6.65 3.4 3.8 0.6 119.8 7.9 4.3 8.6 2.3 .. ..
Hong Kong, SAR China 7.75 7.77 7.9 5.4 0.7 .. 4.5 –1.3 5.9 0.3 0.6 –0.2
Colombia 2,166.79 1,925.90 417.8 1,233.7 0.6 113.1 22.6 6.1 20.2 5.8 16.4 4.9
Congo, Dem. Rep. 809.79 907.62 0.0 414.3 0.5 597.2 964.9 27.2 930.2 26.9 .. ..
Congo, Rep. 472.19 496.24 149.2 289.8 0.6 .. 9.0 7.4 9.3 3.4 .. ..
Costa Rica 573.29 512.34 103.0 329.5 0.6 108.4 15.9 10.2 15.6 11.2 14.1 13.0
Côte d’Ivoire 472.19 496.24 261.8 306.9 0.7 105.7 9.2 3.5 7.2 3.0 .. ..
Croatia 5.28 5.59 3.1 3.8 0.7 108.6 90.0 3.9 86.3 2.9 69.8 3.0
Cuba .. .. .. .. .. .. 6.4 3.3 .. .. .. ..
Czech Republic 19.06 19.03 11.1 13.5 0.7 120.4 12.8 2.2 7.8 2.5 8.2 2.3
Denmark 5.36 5.64 8.5 8.0 1.5 105.6 1.6 2.3 2.1 2.0 1.1 2.4
Dominican Republic 36.03 37.41 7.3 19.7 0.6 96.2 9.8 13.7 8.7 14.6 .. ..
Ecuador .. .. 0.4 0.5 0.5 98.8 4.4 9.1 37.1 6.6 .. 7.9
Egypt, Arab Rep. 5.54 5.74 1.2 2.2 0.4 .. 8.7 8.3 8.8 8.0 6.1 9.6
El Salvador 8.75 8.75 0.4 0.5 0.5 .. 6.2 3.6 8.5 3.9 .. 4.7
Eritrea 15.38 15.38 1.9 9.8 0.6 .. 7.9 18.6 .. .. .. ..
Estonia 11.26 11.82 4.8 8.1 0.7 .. 53.7 5.3 21.6 4.4 8.1 3.4
Ethiopia 11.78 .. 2.1 4.3 0.4 .. 6.5 10.8 5.5 12.3 .. ..
Finlandc 0.72 0.76 1.0 0.9 1.3 103.8 1.9 1.1 1.5 1.5 0.9 2.1
Francec 0.72 0.76 1.0 0.9 1.2 101.8 1.3 2.1 1.6 1.8 .. 1.8
Gabon 472.19 496.24 187.9 245.7 0.5 105.3 7.0 5.0 4.6 2.1 .. ..
Gambia, The 26.64 28.12 3.9 8.1 0.3 104.4 4.2 9.8 4.0 7.6 .. ..
Georgia 1.67 1.76 0.4 0.9 0.5 124.3 356.7 7.0 24.7 7.0 .. 6.7
Germanyc 0.72 0.76 1.0 0.8 1.1 102.3 1.7 1.1 2.1 1.7 0.4 2.5
Ghana 1.41 1.49 0.1 1.0 0.7 91.9 26.7 27.2 28.4 16.2 .. ..
Greecec 0.72 0.76 0.6 0.7 1.0 106.9 9.2 3.1 9.0 3.2 3.6 4.3
Guatemala 8.16 7.98 2.9 4.6 0.6 .. 10.4 5.4 10.1 7.3 .. ..
Guinea .. .. 747.4 2,066.8 0.4 .. 5.5 16.1 .. .. .. ..
Guinea-Bissau 472.19 496.24 58.6 229.0 0.5 .. 32.5 11.8 34.0 2.4 .. ..
Haiti 41.20 39.90 5.8 23.1 0.6 .. 18.1 15.3 21.9 16.5 .. ..
Honduras 18.90 18.90 3.0 9.4 0.5 .. 19.9 6.4 18.8 7.9 .. ..

2011 World Development Indicators 255
ECONOMY
Exchange rates and prices 4.16Offi cial
exchange rate
Purchasing
power parity
(PPP)
conversion
factor
Ratio of PPP
conversion
factor to
market
exchange
rate
Real
effective
exchange
rate
GDP implicit
defl ator
Consumer price
index
Wholesale price
index
local currency
units to $
local currency units
to international $
Index
2000 = 100
average annual
% growth
average annual
% growth
average annual
% growth
2009 2010a 1995 2009 2009 2009 1990–2000 2000–09 1990–2000 2000–09 1990–2000 2000–09
Hungary 202.34 209.67 61.7 128.2 0.6 103.8 19.6 4.9 20.3 5.5 16.8 3.5
India 48.41 45.16 10.8 17.2 0.4 .. 8.1 5.6 9.1 5.3 7.4 5.1
Indonesia 10,389.94 8,948.00 1,031.3 5,813.6 0.6 .. 15.8 11.1 13.7 9.1 15.4 11.2
Iran, Islamic Rep. 9,864.30 10,364.64 567.2 3,875.0 0.4 142.1 27.7 16.4 26.0 15.4 28.4 10.8
Iraq 1,170.00 1,170.00 252.5 689.4 0.6 .. .. 11.6 .. .. .. ..
Irelandc 0.72 0.76 0.8 0.9 1.3 107.4 3.6 2.1 2.3 3.2 1.6 –0.1
Israel 3.93 3.60 2.8 3.7 1.0 110.2 11.0 1.3 9.7 1.8 8.1 4.5
Italyc 0.72 0.76 0.8 0.8 1.1 103.2 3.8 2.6 3.7 2.3 2.9 2.7
Jamaica 87.89 85.67 14.6 52.0 0.6 .. 24.8 11.2 23.5 11.7 .. ..
Japan 93.57 83.43 175.0 114.7 1.2 101.4 0.0 –1.1 0.8 –0.1 –1.0 0.7
Jordan 0.71 0.71 0.4 0.5 0.8 .. 3.2 6.1 3.5 4.4 .. 9.1
Kazakhstan 147.50 147.41 17.5 93.0 0.6 .. 204.7 14.9 67.8 8.6 16.3 13.3
Kenya 77.35 80.57 15.8 36.3 0.5 .. 16.6 6.0 15.6 11.3 .. ..
Korea, Dem. Rep. .. .. .. .. .. .. .. .. .. .. .. ..
Korea, Rep. 1,276.93 1,146.23 709.6 804.7 0.6 .. 5.9 2.2 5.1 3.1 3.7 2.5
Kosovo 0.72 0.76 .. .. .. .. .. 0.8 .. 1.5 .. ..
Kuwait 0.29 0.28 0.2 0.3 0.9 .. 1.5 9.8 2.0 3.4 1.4 2.5
Kyrgyz Republic 42.90 47.00 3.5 16.2 0.4 .. 110.6 8.3 23.3 6.9 35.6 10.2
Lao PDR 8,516.05 8,245.42 327.6 3,548.2 0.4 .. 27.2 8.9 28.3 8.3 .. ..
Latvia 0.51 0.53 0.2 0.4 0.7 .. 48.0 8.8 29.2 6.5 12.0 7.3
Lebanon 1,507.50 1,507.50 774.7 942.9 0.6 .. 19.0 2.6 .. .. .. ..
Lesotho 8.47 6.84 2.1 4.5 0.5 93.2 9.7 8.1 5.9 7.8 .. ..
Liberia 68.29 71.85 0.6 38.2 0.6 .. 51.8 10.3 .. .. .. ..
Libya 1.25 1.23 .. 0.7 0.6 .. .. 17.9 5.6 0.4 .. ..
Lithuania 2.48 2.61 1.2 1.6 0.6 .. 75.0 4.1 32.6 3.1 24.8 4.8
Macedonia, FYR 44.10 46.55 18.0 17.8 0.4 104.2 79.3 3.8 10.6 2.4 8.5 2.5
Madagascar 1,956.21 2,117.83 287.5 852.8 0.4 .. 19.1 11.2 18.7 10.7 .. ..
Malawi 141.17 150.80 4.2 55.1 0.4 107.5 33.6 17.0 33.8 12.2 .. ..
Malaysia 3.52 3.13 1.4 1.8 0.5 103.3 4.1 4.0 3.6 2.4 3.4 4.8
Mali 472.19 496.24 226.7 275.4 0.6 .. 7.0 4.5 5.2 2.5 .. ..
Mauritania 262.37 .. 62.4 125.0 0.5 .. 8.7 10.8 6.1 7.3 .. ..
Mauritius 31.96 30.54 10.5 16.8 0.5 .. 6.3 6.0 6.9 6.3 .. ..
Mexico 13.51 12.40 2.9 7.7 0.6 .. 19.0 7.8 19.5 4.5 18.4 6.1
Moldova 11.11 12.15 1.2 5.9 0.5 135.3 119.6 11.0 21.4 10.8 .. ..
Mongolia 1,437.80 1,256.47 158.6 643.7 0.5 .. 57.8 14.6 35.7 8.7 .. ..
Morocco 8.06 8.43 4.9 5.0 0.6 102.4 4.0 2.0 3.9 2.0 2.9 ..
Mozambique 27.52 35.64 4.0 13.0 0.5 .. 34.1 8.0 31.8 10.9 .. ..
Myanmar 5.52 5.42 .. .. .. .. 25.3 .. 25.9 22.4 .. ..
Namibia 8.47 6.84 2.2 5.6 0.7 .. 11.1 7.1 .. 5.9 .. ..
Nepal 77.55 72.38 15.4 28.4 0.4 .. 8.0 6.6 8.7 6.2 .. ..
Netherlandsc 0.72 0.76 0.9 0.9 1.2 102.7 2.1 2.1 2.4 1.9 1.3 2.7
New Zealand 1.60 1.29 1.5 1.5 1.0 86.4 1.7 3.1 1.8 2.7 1.5 3.3
Nicaragua 20.34 21.84 3.5 8.2 0.4 107.8 42.4 7.7 .. 8.8 .. ..
Niger 472.19 496.24 203.1 241.0 0.5 .. 6.0 3.1 6.1 2.8 .. ..
Nigeria 148.90 148.57 15.5 75.6 0.5 109.4 29.5 15.3 32.5 12.5 .. ..
Norway 6.29 5.98 9.2 8.9 1.4 97.8 2.7 4.6 2.2 1.8 1.6 7.9
Oman 0.38 0.38 0.2 0.3 0.9 .. 0.1 9.8 .. 2.9 .. ..
Pakistan 81.71 85.77 10.1 28.8 0.4 98.6 11.1 8.5 9.7 8.0 10.4 8.9
Panama 1.00 1.00 0.5 0.6 0.6 .. 3.6 2.4 1.1 2.5 1.0 3.8
Papua New Guinea 2.76 2.64 0.7 1.4 0.5 116.1 7.6 6.5 9.3 5.9 .. ..
Paraguay 4,965.39 4,667.57 948.9 2,462.5 0.5 135.7 11.5 10.2 13.1 8.4 .. 10.3
Peru 3.01 2.82 1.2 1.6 0.5 .. 26.7 3.5 27.3 2.4 23.7 2.8
Philippines 47.68 43.95 14.1 23.6 0.5 121.3 8.4 5.1 7.7 5.5 6.3 7.0
Poland 3.12 3.02 1.2 1.9 0.6 98.5 24.7 2.7 25.3 2.5 19.8 2.7
Portugalc 0.72 0.76 0.7 0.6 0.9 102.1 5.2 2.6 4.5 2.7 .. 2.6
Puerto Rico .. .. .. .. .. .. 3.0 .. .. .. .. ..
Qatar 3.64 3.64 .. 2.8 0.8 .. .. 10.6 2.8 7.2 .. ..

2011 World Development Indicators256
Exchange rates and prices4.16
Romania 3.05 3.24 0.1 1.6 0.5 102.2 98.0 15.9 100.5 11.5 93.8 15.3
Russian Federation 31.74 30.85 1.7 14.6 0.5 115.3 161.5 15.8 99.1 12.5 99.8 15.7
Rwanda 568.28 594.45 126.3 261.0 0.5 .. 14.3 10.5 16.2 8.9 .. ..
Saudi Arabia 3.75 3.75 1.8 2.4 0.6 103.8 1.6 7.6 1.0 2.2 1.3 2.5
Senegal 472.19 496.24 251.9 265.2 0.6 .. 6.0 2.8 5.4 2.2 .. ..
Serbia 67.58 80.39 2.9 33.4 0.5 .. .. 16.5 50.2 15.4 .. ..
Sierra Leone 3,385.65 .. 379.5 1,399.7 0.4 104.5 31.9 9.5 .. .. .. ..
Singapore 1.45 1.31 1.3 1.1 0.7 107.9 1.3 1.2 1.7 1.5 –1.0 2.8
Slovak Republicc 0.72 0.76 0.4 0.5 0.7 137.2 11.1 3.4 8.4 4.8 9.5 4.7
Sloveniac 0.72 0.76 0.4 0.6 0.9 .. 29.3 4.0 12.0 4.2 9.1 3.9
Somalia .. .. .. .. .. .. .. .. .. .. .. ..
South Africa 8.47 6.84 2.3 4.8 0.6 87.8 9.9 7.2 8.7 5.7 7.7 6.7
Spainc 0.72 0.76 0.7 0.7 1.0 106.2 3.9 3.7 3.8 3.1 2.4 3.2
Sri Lanka 114.94 111.11 18.2 49.8 0.4 .. 9.1 10.7 9.9 11.1 8.1 12.4
Sudan 2.30 .. 0.3 1.4 0.6 .. 65.5 10.0 72.0 8.6 .. ..
Swaziland 8.47 6.84 2.2 4.2 0.5 .. 10.5 7.9 9.5 7.3 .. ..
Sweden 7.65 6.85 9.4 8.9 1.2 89.5 2.2 1.7 1.9 1.5 2.5 2.9
Switzerland 1.09 0.97 2.0 1.5 1.4 101.6 1.1 1.2 1.6 1.0 –0.4 1.1
Syrian Arab Republic 11.23 11.23 12.8 24.4 0.5 .. 7.9 8.0 6.4 6.2 4.7 3.2
Tajikistan 4.14 4.40 0.0 1.5 0.4 .. 235.0 20.9 .. 12.7 .. ..
Tanzania 1,320.31 1,462.88 159.4 487.3 0.4 .. 23.0 7.3 20.9 6.5 .. ..
Thailand 34.29 30.12 15.1 16.7 0.5 .. 4.2 3.2 4.9 2.9 3.8 5.5
Timor-Leste .. .. .. 0.6 0.6 .. .. 4.5 .. 5.1 .. ..
Togo 472.19 496.24 238.5 239.5 0.5 104.8 7.0 1.4 8.5 2.8 .. ..
Trinidad and Tobago 6.32 6.37 2.8 3.9 0.6 123.7 5.4 6.5 5.7 6.5 2.8 3.8
Tunisia 1.35 1.45 0.5 0.6 0.5 94.2 4.4 3.2 4.4 3.3 3.6 4.5
Turkey 1.55 1.52 0.0 0.9 0.6 .. 81.7 15.3 79.9 16.9 75.2 16.9
Turkmenistan .. .. 0.0 1.5 0.5 .. 408.2 13.0 .. .. .. ..
Uganda 2,030.31 .. 500.3 767.5 0.4 103.2 11.6 5.6 8.3 6.7 .. ..
Ukraine 7.79 7.96 0.3 3.2 0.4 96.8 271.0 16.4 155.7 10.9 161.6 14.6
United Arab Emirates 3.67 3.67 1.7 3.2 0.9 .. 2.2 10.2 .. .. .. ..
United Kingdom 0.64 0.64 0.6 0.6 1.0 80.8 2.8 2.6 2.9 2.9 2.4 1.8
United States 1.00 1.00 1.0 1.0 1.0 95.2 2.0 2.6 2.7 2.7 1.2 4.2
Uruguay 22.57 19.99 5.5 16.1 0.7 120.9 32.6 8.4 33.9 9.1 27.2 13.6
Uzbekistan .. .. 11.2 602.5 0.4 .. 245.8 24.7 .. .. .. ..
Venezuela, RB 2.15 2.59 0.1 2.0 0.9 191.2 45.3 25.0 49.0 21.2 44.1 26.0
Vietnam 17,065.08 18,932.00 3,168.8 6,434.3 0.4 .. 15.2 8.3 4.1 7.8 .. ..
West Bank and Gaza .. .. .. .. .. .. 5.7 3.4 .. .. .. ..
Yemen, Rep. 202.85 214.40 22.1 91.8 0.5 .. 22.4 13.0 26.3 11.4 .. ..
Zambia 5,046.11 4,735.74 404.0 3,492.7 0.7 119.5 52.1 16.4 57.0 15.9 101.4 ..
Zimbabwe .. .. .. .. .. .. –3.9 4.1 29.0 497.7 25.9 ..
Note: The differences in the growth rates of the GDP deflator and the consumer and wholesale price indexes are due mainly to differences in data availability for each of the indexes during
the period.
a. Average for December or latest monthly data available. b. Private analysts estimate that consumer price index inflation was considerably higher for 2007–09 and that GDP volume
growth has been significantly lower than official reports indicate since the last quarter of 2008. c. As members of the euro area, these countries share a single currency, the euro.
Offi cial
exchange rate
Purchasing
power parity
(PPP)
conversion
factor
Ratio of PPP
conversion
factor to
market
exchange
rate
Real
effective
exchange
rate
GDP implicit
defl ator
Consumer price
index
Wholesale price
index
local currency
units to $
local currency units
to international $
Index
2000 = 100
average annual
% growth
average annual
% growth
average annual
% growth
2009 2010a 1995 2009 2009 2009 1990–2000 2000–09 1990–2000 2000–09 1990–2000 2000–09

2011 World Development Indicators 257
ECONOMY
About the data Defi nitions
In a market-based economy, household, producer,
and government choices about resource allocation
are infl uenced by relative prices, including the real
exchange rate, real wages, real interest rates, and
other prices in the economy. Relative prices also
largely refl ect these agents’ choices. Thus relative
prices convey vital information about the interaction
of economic agents in an economy and with the rest
of the world.
The exchange rate is the price of one currency
in terms of another. Offi cial exchange rates and
exchange rate arrangements are established by
governments. Other exchange rates recognized by
governments include market rates, which are deter-
mined largely by legal market forces, and for coun-
tries with multiple exchange arrangements, principal
rates, secondary rates, and tertiary rates.
Offi cial or market exchange rates are often used
to convert economic statistics in local currencies to
a common currency in order to make comparisons
across countries. Since market rates refl ect at best
the relative prices of tradable goods, the volume of
goods and services that a U.S. dollar buys in the
United States may not correspond to what a U.S.
dollar converted to another country’s currency at
the offi cial exchange rate would buy in that country,
particularly when nontradable goods and services
account for a signifi cant share of a country’s output.
An alternative exchange rate—the purchasing power
parity (PPP) conversion factor—is preferred because
it refl ects differences in price levels for both tradable
and nontradable goods and services and therefore
provides a more meaningful comparison of real out-
put. See table 1.1 for further discussion.
The ratio of the PPP conversion factor to the offi cial
exchange rate—the national price level or compara-
tive price level—measures differences in the price
level at the gross domestic product (GDP) level. The
price level index tends to be lower in poorer coun-
tries and to rise with income. The real effective
exchange rate is a nominal effective exchange rate
index adjusted for relative movements in national
price or cost indicators of the home country, selected
countries, and the euro area. A nominal effective
exchange rate index is the ratio (expressed on the
base 2000 = 100) of an index of a currency’s period-
average exchange rate to a weighted geometric aver-
age of exchange rates for currencies of selected
countries and the euro area. For most high-income
countries weights are derived from industrial coun-
try trade in manufactured goods. Data are compiled
from the nominal effective exchange rate index and a
cost indicator of relative normalized unit labor costs
in manufacturing. For selected other countries the
nominal effective exchange rate index is based on
manufactured goods and primary products trade with
partner or competitor countries. For these countries
the real effective exchange rate index is the nomi-
nal index adjusted for relative changes in consumer
prices; an increase represents an appreciation of
the local currency. Because of conceptual and data
limitations, changes in real effective exchange rates
should be interpreted with caution.
Infl ation is measured by the rate of increase in a
price index, but actual price change can be nega-
tive. The index used depends on the prices being
examined. The GDP defl ator refl ects price changes
for total GDP. The most general measure of the over-
all price level, it accounts for changes in government
consumption, capital formation (including inventory
appreciation), international trade, and the main com-
ponent, household fi nal consumption expenditure.
The GDP defl ator is usually derived implicitly as the
ratio of current to constant price GDP—or a Paasche
index. It is defective as a general measure of infl ation
for policy use because of long lags in deriving esti-
mates and because it is often an annual measure.
Consumer price indexes are produced more fre-
quently and so are more current. They are also con-
structed explicitly, based on surveys of the cost of
a defi ned basket of consumer goods and services.
Nevertheless, consumer price indexes should be
interpreted with caution. The defi nition of a house-
hold, the basket of goods, and the geographic (urban
or rural) and income group coverage of consumer
price surveys can vary widely by country. In addi-
tion, weights are derived from household expendi-
ture surveys, which, for budgetary reasons, tend to
be conducted infrequently in developing countries,
impairing comparability over time. Although useful for
measuring consumer price infl ation within a country,
consumer price indexes are of less value in compar-
ing countries.
Wholesale price indexes are based on the prices
at the fi rst commercial transaction of commodities
that are important in a country’s output or consump-
tion. Prices are farm-gate for agricultural commodi-
ties and ex-factory for industrial goods. Preference
is given to indexes with the broadest coverage of
the economy. The least squares method is used to
calculate growth rates of the GDP implicit defl ator,
consumer price index, and wholesale price index.
• Offi cial exchange rate is the exchange rate deter-
mined by national authorities or the rate determined
in the legally sanctioned exchange market. It is cal-
culated as an annual average based on monthly aver-
ages (local currency units relative to the U.S. dollar).
• Purchasing power parity (PPP) conversion factor
is the number of units of a country’s currency required
to buy the same amount of goods and services in the
domestic market that a U.S. dollar would buy in the
United States. • Ratio of PPP conversion factor to
market exchange rate is the result obtained by divid-
ing the PPP conversion factor by the market exchange
rate. • Real effective exchange rate is the nominal
effective exchange rate (a measure of the value of a
currency against a weighted average of several for-
eign currencies) divided by a price defl ator or index
of costs. • GDP implicit defl ator measures the aver-
age annual rate of price change in the economy as a
whole for the periods shown. • Consumer price index
refl ects changes in the cost to the average consumer
of acquiring a basket of goods and services that may
be fi xed or may change at specifi ed intervals, such
as yearly. The Laspeyres formula is generally used.
• Wholesale price index refers to a mix of agricul-
tural and industrial goods at various stages of pro-
duction and distribution, including import duties. The
Laspeyres formula is generally used.
4.16Exchange rates and prices
257
Data sources
Data on offi cial and real effective exchange rates
and consumer and wholesale price indexes are
from the International Monetary Fund’s Interna-
tional Financial Statistics. PPP conversion fac-
tors and GDP defl ators are from the World Bank’s
data fi les.
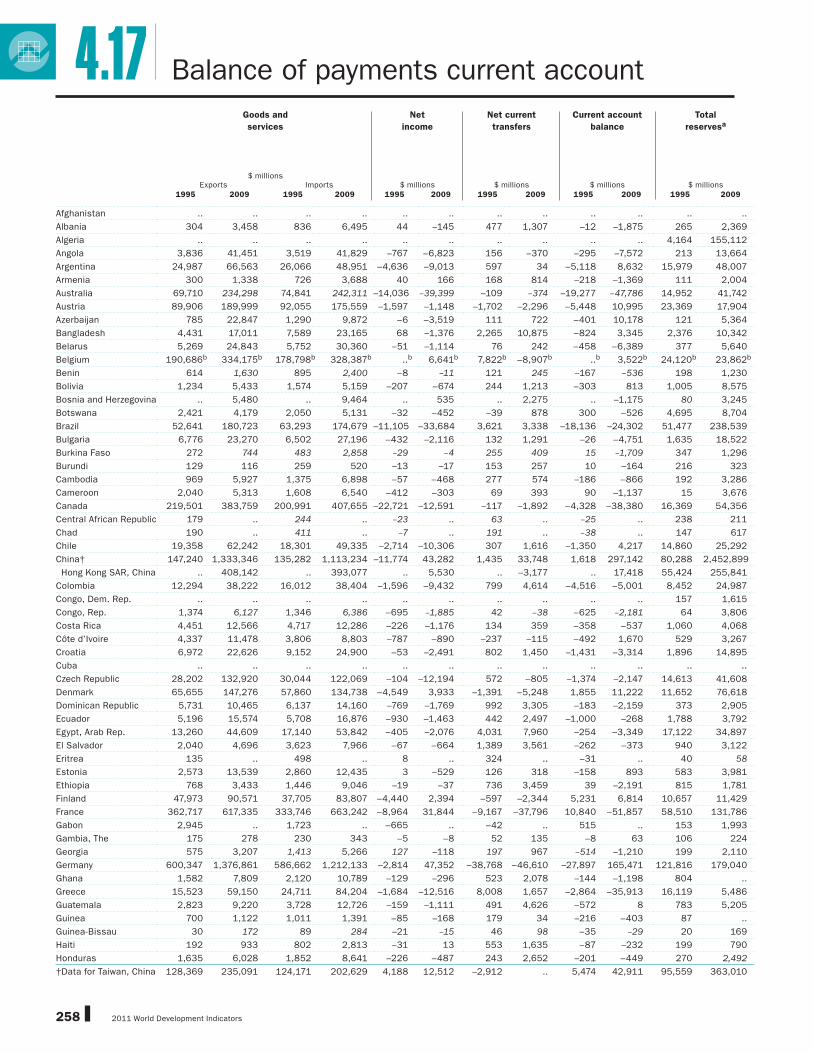
2011 World Development Indicators258
4.17 Balance of payments current account
Goods and
services
Net
income
Net current
transfers
Current account
balance
Total
reservesa
$ millionsExports Imports $ millions $ millions $ millions $ millions
1995 2009 1995 2009 1995 2009 1995 2009 1995 2009 1995 2009
Afghanistan .. .. .. .. .. .. .. .. .. .. .. ..
Albania 304 3,458 836 6,495 44 –145 477 1,307 –12 –1,875 265 2,369
Algeria .. .. .. .. .. .. .. .. .. .. 4,164 155,112
Angola 3,836 41,451 3,519 41,829 –767 –6,823 156 –370 –295 –7,572 213 13,664
Argentina 24,987 66,563 26,066 48,951 –4,636 –9,013 597 34 –5,118 8,632 15,979 48,007
Armenia 300 1,338 726 3,688 40 166 168 814 –218 –1,369 111 2,004
Australia 69,710 234,298 74,841 242,311 –14,036 –39,399 –109 –374 –19,277 –47,786 14,952 41,742
Austria 89,906 189,999 92,055 175,559 –1,597 –1,148 –1,702 –2,296 –5,448 10,995 23,369 17,904
Azerbaijan 785 22,847 1,290 9,872 –6 –3,519 111 722 –401 10,178 121 5,364
Bangladesh 4,431 17,011 7,589 23,165 68 –1,376 2,265 10,875 –824 3,345 2,376 10,342
Belarus 5,269 24,843 5,752 30,360 –51 –1,114 76 242 –458 –6,389 377 5,640
Belgium 190,686b 334,175b 178,798b 328,387b ..b 6,641b 7,822b –8,907b ..b 3,522b 24,120b 23,862b
Benin 614 1,630 895 2,400 –8 –11 121 245 –167 –536 198 1,230
Bolivia 1,234 5,433 1,574 5,159 –207 –674 244 1,213 –303 813 1,005 8,575
Bosnia and Herzegovina .. 5,480 .. 9,464 .. 535 .. 2,275 .. –1,175 80 3,245
Botswana 2,421 4,179 2,050 5,131 –32 –452 –39 878 300 –526 4,695 8,704
Brazil 52,641 180,723 63,293 174,679 –11,105 –33,684 3,621 3,338 –18,136 –24,302 51,477 238,539
Bulgaria 6,776 23,270 6,502 27,196 –432 –2,116 132 1,291 –26 –4,751 1,635 18,522
Burkina Faso 272 744 483 2,858 –29 –4 255 409 15 –1,709 347 1,296
Burundi 129 116 259 520 –13 –17 153 257 10 –164 216 323
Cambodia 969 5,927 1,375 6,898 –57 –468 277 574 –186 –866 192 3,286
Cameroon 2,040 5,313 1,608 6,540 –412 –303 69 393 90 –1,137 15 3,676
Canada 219,501 383,759 200,991 407,655 –22,721 –12,591 –117 –1,892 –4,328 –38,380 16,369 54,356
Central African Republic 179 .. 244 .. –23 .. 63 .. –25 .. 238 211
Chad 190 .. 411 .. –7 .. 191 .. –38 .. 147 617
Chile 19,358 62,242 18,301 49,335 –2,714 –10,306 307 1,616 –1,350 4,217 14,860 25,292
China† 147,240 1,333,346 135,282 1,113,234 –11,774 43,282 1,435 33,748 1,618 297,142 80,288 2,452,899
Hong Kong SAR, China .. 408,142 .. 393,077 .. 5,530 .. –3,177 .. 17,418 55,424 255,841
Colombia 12,294 38,222 16,012 38,404 –1,596 –9,432 799 4,614 –4,516 –5,001 8,452 24,987
Congo, Dem. Rep. .. .. .. .. .. .. .. .. .. .. 157 1,615
Congo, Rep. 1,374 6,127 1,346 6,386 –695 –1,885 42 –38 –625 –2,181 64 3,806
Costa Rica 4,451 12,566 4,717 12,286 –226 –1,176 134 359 –358 –537 1,060 4,068
Côte d’Ivoire 4,337 11,478 3,806 8,803 –787 –890 –237 –115 –492 1,670 529 3,267
Croatia 6,972 22,626 9,152 24,900 –53 –2,491 802 1,450 –1,431 –3,314 1,896 14,895
Cuba .. .. .. .. .. .. .. .. .. .. .. ..
Czech Republic 28,202 132,920 30,044 122,069 –104 –12,194 572 –805 –1,374 –2,147 14,613 41,608
Denmark 65,655 147,276 57,860 134,738 –4,549 3,933 –1,391 –5,248 1,855 11,222 11,652 76,618
Dominican Republic 5,731 10,465 6,137 14,160 –769 –1,769 992 3,305 –183 –2,159 373 2,905
Ecuador 5,196 15,574 5,708 16,876 –930 –1,463 442 2,497 –1,000 –268 1,788 3,792
Egypt, Arab Rep. 13,260 44,609 17,140 53,842 –405 –2,076 4,031 7,960 –254 –3,349 17,122 34,897
El Salvador 2,040 4,696 3,623 7,966 –67 –664 1,389 3,561 –262 –373 940 3,122
Eritrea 135 .. 498 .. 8 .. 324 .. –31 .. 40 58
Estonia 2,573 13,539 2,860 12,435 3 –529 126 318 –158 893 583 3,981
Ethiopia 768 3,433 1,446 9,046 –19 –37 736 3,459 39 –2,191 815 1,781
Finland 47,973 90,571 37,705 83,807 –4,440 2,394 –597 –2,344 5,231 6,814 10,657 11,429
France 362,717 617,335 333,746 663,242 –8,964 31,844 –9,167 –37,796 10,840 –51,857 58,510 131,786
Gabon 2,945 .. 1,723 .. –665 .. –42 .. 515 .. 153 1,993
Gambia, The 175 278 230 343 –5 –8 52 135 –8 63 106 224
Georgia 575 3,207 1,413 5,266 127 –118 197 967 –514 –1,210 199 2,110
Germany 600,347 1,376,861 586,662 1,212,133 –2,814 47,352 –38,768 –46,610 –27,897 165,471 121,816 179,040
Ghana 1,582 7,809 2,120 10,789 –129 –296 523 2,078 –144 –1,198 804 ..
Greece 15,523 59,150 24,711 84,204 –1,684 –12,516 8,008 1,657 –2,864 –35,913 16,119 5,486
Guatemala 2,823 9,220 3,728 12,726 –159 –1,111 491 4,626 –572 8 783 5,205
Guinea 700 1,122 1,011 1,391 –85 –168 179 34 –216 –403 87 ..
Guinea-Bissau 30 172 89 284 –21 –15 46 98 –35 –29 20 169
Haiti 192 933 802 2,813 –31 13 553 1,635 –87 –232 199 790
Honduras 1,635 6,028 1,852 8,641 –226 –487 243 2,652 –201 –449 270 2,492
†Data for Taiwan, China 128,369 235,091 124,171 202,629 4,188 12,512 –2,912 .. 5,474 42,911 95,559 363,010
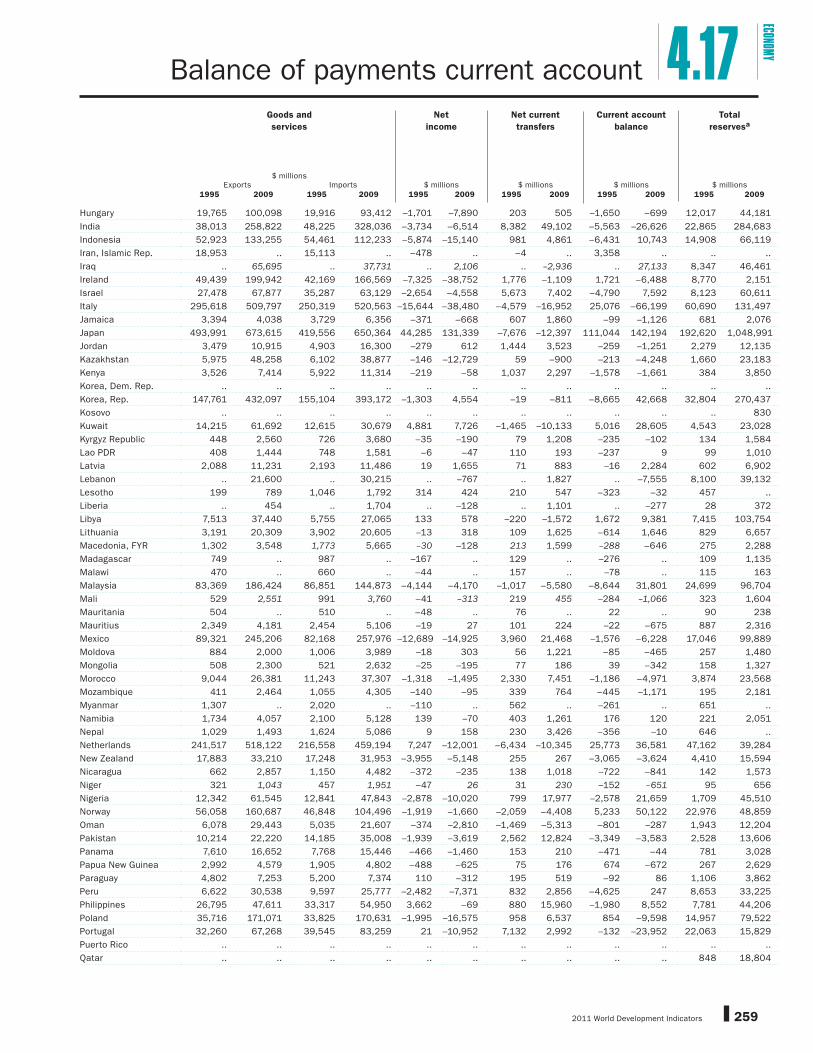
2011 World Development Indicators 259
ECONOMY
Balance of payments current account 4.17Goods and
services
Net
income
Net current
transfers
Current account
balance
Total
reservesa
$ millionsExports Imports $ millions $ millions $ millions $ millions
1995 2009 1995 2009 1995 2009 1995 2009 1995 2009 1995 2009
Hungary 19,765 100,098 19,916 93,412 –1,701 –7,890 203 505 –1,650 –699 12,017 44,181
India 38,013 258,822 48,225 328,036 –3,734 –6,514 8,382 49,102 –5,563 –26,626 22,865 284,683
Indonesia 52,923 133,255 54,461 112,233 –5,874 –15,140 981 4,861 –6,431 10,743 14,908 66,119
Iran, Islamic Rep. 18,953 .. 15,113 .. –478 .. –4 .. 3,358 .. .. ..
Iraq .. 65,695 .. 37,731 .. 2,106 .. –2,936 .. 27,133 8,347 46,461
Ireland 49,439 199,942 42,169 166,569 –7,325 –38,752 1,776 –1,109 1,721 –6,488 8,770 2,151
Israel 27,478 67,877 35,287 63,129 –2,654 –4,558 5,673 7,402 –4,790 7,592 8,123 60,611
Italy 295,618 509,797 250,319 520,563 –15,644 –38,480 –4,579 –16,952 25,076 –66,199 60,690 131,497
Jamaica 3,394 4,038 3,729 6,356 –371 –668 607 1,860 –99 –1,126 681 2,076
Japan 493,991 673,615 419,556 650,364 44,285 131,339 –7,676 –12,397 111,044 142,194 192,620 1,048,991
Jordan 3,479 10,915 4,903 16,300 –279 612 1,444 3,523 –259 –1,251 2,279 12,135
Kazakhstan 5,975 48,258 6,102 38,877 –146 –12,729 59 –900 –213 –4,248 1,660 23,183
Kenya 3,526 7,414 5,922 11,314 –219 –58 1,037 2,297 –1,578 –1,661 384 3,850
Korea, Dem. Rep. .. .. .. .. .. .. .. .. .. .. .. ..
Korea, Rep. 147,761 432,097 155,104 393,172 –1,303 4,554 –19 –811 –8,665 42,668 32,804 270,437
Kosovo .. .. .. .. .. .. .. .. .. .. .. 830
Kuwait 14,215 61,692 12,615 30,679 4,881 7,726 –1,465 –10,133 5,016 28,605 4,543 23,028
Kyrgyz Republic 448 2,560 726 3,680 –35 –190 79 1,208 –235 –102 134 1,584
Lao PDR 408 1,444 748 1,581 –6 –47 110 193 –237 9 99 1,010
Latvia 2,088 11,231 2,193 11,486 19 1,655 71 883 –16 2,284 602 6,902
Lebanon .. 21,600 .. 30,215 .. –767 .. 1,827 .. –7,555 8,100 39,132
Lesotho 199 789 1,046 1,792 314 424 210 547 –323 –32 457 ..
Liberia .. 454 .. 1,704 .. –128 .. 1,101 .. –277 28 372
Libya 7,513 37,440 5,755 27,065 133 578 –220 –1,572 1,672 9,381 7,415 103,754
Lithuania 3,191 20,309 3,902 20,605 –13 318 109 1,625 –614 1,646 829 6,657
Macedonia, FYR 1,302 3,548 1,773 5,665 –30 –128 213 1,599 –288 –646 275 2,288
Madagascar 749 .. 987 .. –167 .. 129 .. –276 .. 109 1,135
Malawi 470 .. 660 .. –44 .. 157 .. –78 .. 115 163
Malaysia 83,369 186,424 86,851 144,873 –4,144 –4,170 –1,017 –5,580 –8,644 31,801 24,699 96,704
Mali 529 2,551 991 3,760 –41 –313 219 455 –284 –1,066 323 1,604
Mauritania 504 .. 510 .. –48 .. 76 .. 22 .. 90 238
Mauritius 2,349 4,181 2,454 5,106 –19 27 101 224 –22 –675 887 2,316
Mexico 89,321 245,206 82,168 257,976 –12,689 –14,925 3,960 21,468 –1,576 –6,228 17,046 99,889
Moldova 884 2,000 1,006 3,989 –18 303 56 1,221 –85 –465 257 1,480
Mongolia 508 2,300 521 2,632 –25 –195 77 186 39 –342 158 1,327
Morocco 9,044 26,381 11,243 37,307 –1,318 –1,495 2,330 7,451 –1,186 –4,971 3,874 23,568
Mozambique 411 2,464 1,055 4,305 –140 –95 339 764 –445 –1,171 195 2,181
Myanmar 1,307 .. 2,020 .. –110 .. 562 .. –261 .. 651 ..
Namibia 1,734 4,057 2,100 5,128 139 –70 403 1,261 176 120 221 2,051
Nepal 1,029 1,493 1,624 5,086 9 158 230 3,426 –356 –10 646 ..
Netherlands 241,517 518,122 216,558 459,194 7,247 –12,001 –6,434 –10,345 25,773 36,581 47,162 39,284
New Zealand 17,883 33,210 17,248 31,953 –3,955 –5,148 255 267 –3,065 –3,624 4,410 15,594
Nicaragua 662 2,857 1,150 4,482 –372 –235 138 1,018 –722 –841 142 1,573
Niger 321 1,043 457 1,951 –47 26 31 230 –152 –651 95 656
Nigeria 12,342 61,545 12,841 47,843 –2,878 –10,020 799 17,977 –2,578 21,659 1,709 45,510
Norway 56,058 160,687 46,848 104,496 –1,919 –1,660 –2,059 –4,408 5,233 50,122 22,976 48,859
Oman 6,078 29,443 5,035 21,607 –374 –2,810 –1,469 –5,313 –801 –287 1,943 12,204
Pakistan 10,214 22,220 14,185 35,008 –1,939 –3,619 2,562 12,824 –3,349 –3,583 2,528 13,606
Panama 7,610 16,652 7,768 15,446 –466 –1,460 153 210 –471 –44 781 3,028
Papua New Guinea 2,992 4,579 1,905 4,802 –488 –625 75 176 674 –672 267 2,629
Paraguay 4,802 7,253 5,200 7,374 110 –312 195 519 –92 86 1,106 3,862
Peru 6,622 30,538 9,597 25,777 –2,482 –7,371 832 2,856 –4,625 247 8,653 33,225
Philippines 26,795 47,611 33,317 54,950 3,662 –69 880 15,960 –1,980 8,552 7,781 44,206
Poland 35,716 171,071 33,825 170,631 –1,995 –16,575 958 6,537 854 –9,598 14,957 79,522
Portugal 32,260 67,268 39,545 83,259 21 –10,952 7,132 2,992 –132 –23,952 22,063 15,829
Puerto Rico .. .. .. .. .. .. .. .. .. .. .. ..
Qatar .. .. .. .. .. .. .. .. .. .. 848 18,804
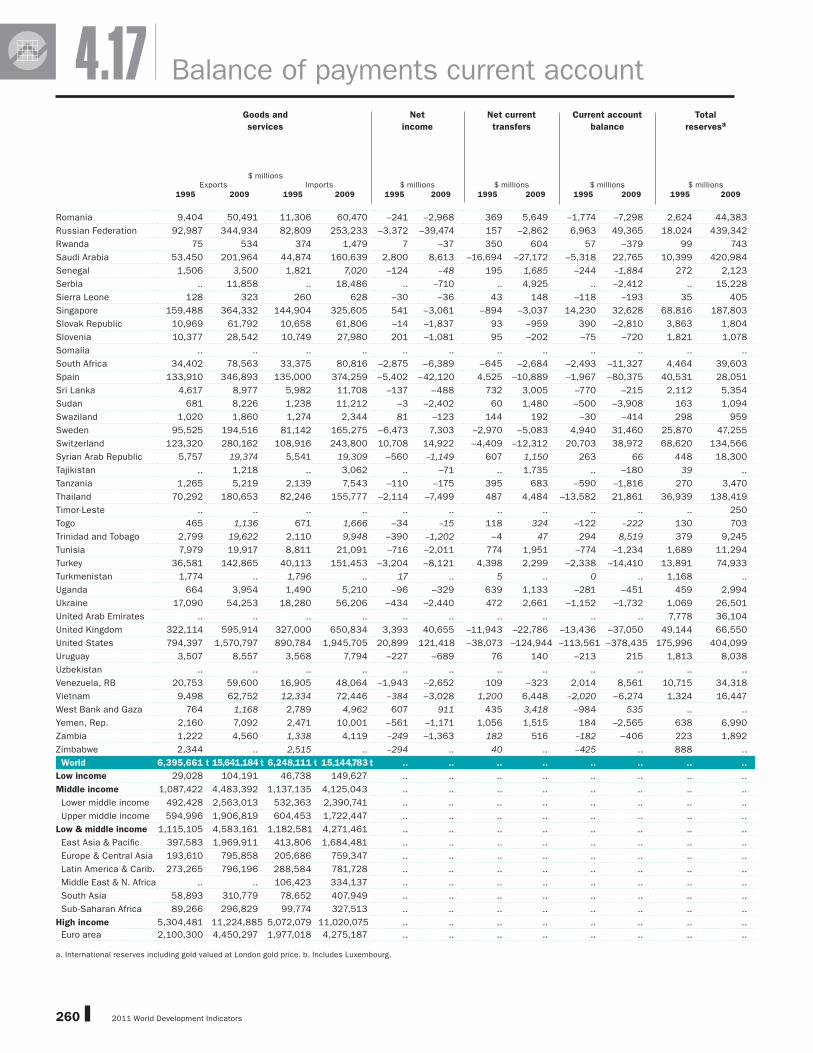
2011 World Development Indicators260
Balance of payments current account4.17Goods and
services
Net
income
Net current
transfers
Current account
balance
Total
reservesa
$ millionsExports Imports $ millions $ millions $ millions $ millions
1995 2009 1995 2009 1995 2009 1995 2009 1995 2009 1995 2009
Romania 9,404 50,491 11,306 60,470 –241 –2,968 369 5,649 –1,774 –7,298 2,624 44,383
Russian Federation 92,987 344,934 82,809 253,233 –3,372 –39,474 157 –2,862 6,963 49,365 18,024 439,342
Rwanda 75 534 374 1,479 7 –37 350 604 57 –379 99 743
Saudi Arabia 53,450 201,964 44,874 160,639 2,800 8,613 –16,694 –27,172 –5,318 22,765 10,399 420,984
Senegal 1,506 3,500 1,821 7,020 –124 –48 195 1,685 –244 –1,884 272 2,123
Serbia .. 11,858 .. 18,486 .. –710 .. 4,925 .. –2,412 .. 15,228
Sierra Leone 128 323 260 628 –30 –36 43 148 –118 –193 35 405
Singapore 159,488 364,332 144,904 325,605 541 –3,061 –894 –3,037 14,230 32,628 68,816 187,803
Slovak Republic 10,969 61,792 10,658 61,806 –14 –1,837 93 –959 390 –2,810 3,863 1,804
Slovenia 10,377 28,542 10,749 27,980 201 –1,081 95 –202 –75 –720 1,821 1,078
Somalia .. .. .. .. .. .. .. .. .. .. .. ..
South Africa 34,402 78,563 33,375 80,816 –2,875 –6,389 –645 –2,684 –2,493 –11,327 4,464 39,603
Spain 133,910 346,893 135,000 374,259 –5,402 –42,120 4,525 –10,889 –1,967 –80,375 40,531 28,051
Sri Lanka 4,617 8,977 5,982 11,708 –137 –488 732 3,005 –770 –215 2,112 5,354
Sudan 681 8,226 1,238 11,212 –3 –2,402 60 1,480 –500 –3,908 163 1,094
Swaziland 1,020 1,860 1,274 2,344 81 –123 144 192 –30 –414 298 959
Sweden 95,525 194,516 81,142 165,275 –6,473 7,303 –2,970 –5,083 4,940 31,460 25,870 47,255
Switzerland 123,320 280,162 108,916 243,800 10,708 14,922 –4,409 –12,312 20,703 38,972 68,620 134,566
Syrian Arab Republic 5,757 19,374 5,541 19,309 –560 –1,149 607 1,150 263 66 448 18,300
Tajikistan .. 1,218 .. 3,062 .. –71 .. 1,735 .. –180 39 ..
Tanzania 1,265 5,219 2,139 7,543 –110 –175 395 683 –590 –1,816 270 3,470
Thailand 70,292 180,653 82,246 155,777 –2,114 –7,499 487 4,484 –13,582 21,861 36,939 138,419
Timor-Leste .. .. .. .. .. .. .. .. .. .. .. 250
Togo 465 1,136 671 1,666 –34 –15 118 324 –122 –222 130 703
Trinidad and Tobago 2,799 19,622 2,110 9,948 –390 –1,202 –4 47 294 8,519 379 9,245
Tunisia 7,979 19,917 8,811 21,091 –716 –2,011 774 1,951 –774 –1,234 1,689 11,294
Turkey 36,581 142,865 40,113 151,453 –3,204 –8,121 4,398 2,299 –2,338 –14,410 13,891 74,933
Turkmenistan 1,774 .. 1,796 .. 17 .. 5 .. 0 .. 1,168 ..
Uganda 664 3,954 1,490 5,210 –96 –329 639 1,133 –281 –451 459 2,994
Ukraine 17,090 54,253 18,280 56,206 –434 –2,440 472 2,661 –1,152 –1,732 1,069 26,501
United Arab Emirates .. .. .. .. .. .. .. .. .. .. 7,778 36,104
United Kingdom 322,114 595,914 327,000 650,834 3,393 40,655 –11,943 –22,786 –13,436 –37,050 49,144 66,550
United States 794,397 1,570,797 890,784 1,945,705 20,899 121,418 –38,073 –124,944 –113,561 –378,435 175,996 404,099
Uruguay 3,507 8,557 3,568 7,794 –227 –689 76 140 –213 215 1,813 8,038
Uzbekistan .. .. .. .. .. .. .. .. .. .. .. ..
Venezuela, RB 20,753 59,600 16,905 48,064 –1,943 –2,652 109 –323 2,014 8,561 10,715 34,318
Vietnam 9,498 62,752 12,334 72,446 –384 –3,028 1,200 6,448 –2,020 –6,274 1,324 16,447
West Bank and Gaza 764 1,168 2,789 4,962 607 911 435 3,418 –984 535 .. ..
Yemen, Rep. 2,160 7,092 2,471 10,001 –561 –1,171 1,056 1,515 184 –2,565 638 6,990
Zambia 1,222 4,560 1,338 4,119 –249 –1,363 182 516 –182 –406 223 1,892
Zimbabwe 2,344 .. 2,515 .. –294 .. 40 .. –425 .. 888 ..
World 6,395,661 t 15,641,184 t 6,248,111 t 15,144,783 t .. .. .. .. .. .. .. ..
Low income 29,028 104,191 46,738 149,627 .. .. .. .. .. .. .. ..
Middle income 1,087,422 4,483,392 1,137,135 4,125,043 .. .. .. .. .. .. .. ..
Lower middle income 492,428 2,563,013 532,363 2,390,741 .. .. .. .. .. .. .. ..
Upper middle income 594,996 1,906,819 604,453 1,722,447 .. .. .. .. .. .. .. ..
Low & middle income 1,115,105 4,583,161 1,182,581 4,271,461 .. .. .. .. .. .. .. ..
East Asia & Pacifi c 397,583 1,969,911 413,806 1,684,481 .. .. .. .. .. .. .. ..
Europe & Central Asia 193,610 795,858 205,686 759,347 .. .. .. .. .. .. .. ..
Latin America & Carib. 273,265 796,196 288,584 781,728 .. .. .. .. .. .. .. ..
Middle East & N. Africa .. .. 106,423 334,137 .. .. .. .. .. .. .. ..
South Asia 58,893 310,779 78,652 407,949 .. .. .. .. .. .. .. ..
Sub-Saharan Africa 89,266 296,829 99,774 327,513 .. .. .. .. .. .. .. ..
High income 5,304,481 11,224,885 5,072,079 11,020,075 .. .. .. .. .. .. .. ..
Euro area 2,100,300 4,450,297 1,977,018 4,275,187 .. .. .. .. .. .. .. ..
a. International reserves including gold valued at London gold price. b. Includes Luxembourg.

2011 World Development Indicators 261
ECONOMY
About the data Defi nitions
The balance of payments records an economy’s
transactions with the rest of the world. Balance of
payments accounts are divided into two groups:
the current account, which records transactions in
goods, services, income, and current transfers, and
the capital and fi nancial account, which records capi-
tal transfers, acquisition or disposal of nonproduced,
nonfi nancial assets, and transactions in fi nancial
assets and liabilities. The table presents data from
the current account plus gross international reserves.
The balance of payments is a double-entry
accounting system that shows all fl ows of goods and
services into and out of an economy; all transfers
that are the counterpart of real resources or fi nancial
claims provided to or by the rest of the world without
a quid pro quo, such as donations and grants; and
all changes in residents’ claims on and liabilities to
nonresidents that arise from economic transactions.
All transactions are recorded twice—once as a credit
and once as a debit. In principle the net balance
should be zero, but in practice the accounts often do
not balance, requiring inclusion of a balancing item,
net errors and omissions.
Discrepancies may arise in the balance of pay-
ments because there is no single source for balance
of payments data and therefore no way to ensure
that the data are fully consistent. Sources include
customs data, monetary accounts of the banking
system, external debt records, information provided
by enterprises, surveys to estimate service transac-
tions, and foreign exchange records. Differences in
collection methods—such as in timing, definitions
of residence and ownership, and the exchange rate
used to value transactions—contribute to net errors
and omissions. In addition, smuggling and other ille-
gal or quasi-legal transactions may be unrecorded or
misrecorded. For further discussion of issues relat-
ing to the recording of data on trade in goods and
services, see About the data for tables 4.4–4.7.
The concepts and defi nitions underlying the data in
the table are based on the fi fth edition of the Inter-
national Monetary Fund’s (IMF) Balance of Payments
Manual (1993). That edition redefi ned as capital
transfers some transactions previously included in the
current account, such as debt forgiveness, migrants’
capital transfers, and foreign aid to acquire capital
goods. Thus the current account balance now refl ects
more accurately net current transfer receipts in addi-
tion to transactions in goods, services (previously
nonfactor services), and income (previously factor
income). Many countries maintain their data collection
systems according to the fourth edition of the Balance
of Payments Manual (1977). Where necessary, the IMF
converts such reported data to conform to the fi fth
edition (see Primary data documentation). Values are
in U.S. dollars converted at market exchange rates.
• Exports and imports of goods and services are all
transactions between residents of an economy and
the rest of the world involving a change in ownership
of general merchandise, goods sent for processing
and repairs, nonmonetary gold, and services. • Net
income is receipts and payments of employee com-
pensation for nonresident workers, and investment
income (receipts and payments on direct investment,
portfolio investment, and other investments and
receipts on reserve assets). Income derived from
the use of intangible assets is recorded under busi-
ness services. • Net current transfers are recorded
in the balance of payments whenever an economy
provides or receives goods, services, income, or
fi nancial items without a quid pro quo. All transfers
not considered to be capital are current. • Current
account balance is the sum of net exports of goods
and services, net income, and net current transfers.
• Total reserves are holdings of monetary gold, spe-
cial drawing rights, reserves of IMF members held by
the IMF, and holdings of foreign exchange under the
control of monetary authorities. The gold component
of these reserves is valued at year-end (December
31) London prices ($386.75 an ounce in 1995 and
$1,087.50 an ounce in 2009).
4.17Balance of payments current account
261
Total reserves ($ billions) Share of world
total (%)2009
Annual change (%)2008–09
Months of imports20092008 2009
China 1,966 2,453 26.1 24.8 25.0
Japan 1,031 1,049 11.2 1.8 18.1
Russian Federation 426 439 4.7 3.0 16.1
Saudi Arabia 451 421 4.5 –6.7 29.4
United States 294 404 4.3 37.4 2.0
Taiwan, China 304 363 3.9 19.6 20.7
India 257 285 3.0 10.6 9.8
Korea, Rep. 202 270 2.9 34.2 8.0
Hong Kong SAR, China 183 256 2.7 40.2 6.3
Brazil 194 239 2.5 23.1 13.2
Singapore 174 188 2.0 7.8 5.9
Germany 139 179 1.9 29.1 1.5
Algeria 148 155 1.7 4.7 ..
Thailand 111 138 1.5 24.7 9.8
Switzerland 74 135 1.4 81.6 5.0
Source: International Monetary Fund, International Financial Statistics data fi les.
Top 15 economies with the largest reserves in 2009 4.17a
Data sources
Data sources
Data on the balance of payments are published in
the IMF’s Balance of Payments Statistics Yearbook
and International Financial Statistics. The World
Bank exchanges data with the IMF through elec-
tronic fi les that in most cases are more timely and
cover a longer period than the published sources.
More information about the design and compila-
tion of the balance of payments can be found in
the IMF’s Balance of Payments Manual, fi fth edition
(1993), Balance of Payments Textbook (1996), and
Balance of Payments Compilation Guide (1995).