2011 stand? abstract - asian economic and social society1(4),pp.108-116.pdfbetter prospect for...
TRANSCRIPT

© AESS Publications, 2011 Page 108
International Journal of Asian Social Science, 1(4), pp.108-116 2011
Background
The relationship between human resource development and economic development has been widely recognised in every part of the world and at all levels. In other words, human resource development is an integral part of the process of economic development of any region. Not only that, evidences shows that the development of human resources besides maintenance of growth of the economy it helps in the management of various social problems in much better way and reduce the social imbalances and conflicts. There is a both way linkage between the two. The development in the quality of human being especially of the working population expedites the development activities in every field including agriculture, industry as well as services. An educated, healthy and wealthy individual has better prospect for invention, innovation and entrepreneurship skill than another individual without those attributes. Improvement in all those qualities also enhances the capability to better manage and utilise the available resources and thus enhance the utility of those resources.
A healthier, better-educated person is capable of producing more. Therefore the commitment of current resources or income to improving an individual’s health and education leads to increase in that person’s future productivity and
income (Bardhan and Udry, 1999; P. 123). Thus, development of human resources also enhances the capability of the people to judiciously manage the natural resources for their self sustenance in the areas like North-East India and particularly Meghalaya, where natural resources like forest and its flora and fauna, minerals like coal, limestone etc. and climatic condition (through tourism and specific agro-horticulture activities)have been important sources of livelihood of many inhabitants. On the other hand, economic development leads to increase in income, which if properly distributed raises the scope for improvement in human resources through proper education and health care arrangements.
At macro level, a country with higher GDP per capita has better entitlement or affordability and possibility of better access to education and health care facilities. As the rich country can afford to acquire more of these goods, their capabilities of technological innovation, efficiency and thus productivity is higher. Moreover, having better understanding and knowledge they can adopt better measures for population control. Ultimately it accelerates the growth of the economy and thus rising per capita GDP again. If we look at the cross-country figures of forest resource degradation, we observe that the degradation in poor human developed countries is much higher than that of high human
Human Resource and Economic Development: Where Does North-East India Stand?
Abstract
Author
Utpal Kumar DeDepartment of Economics,North-Eastern Hill UniversityShillong, 793022, MeghalayaPh: +91-364-2723182 (Off), +91-94361-02066 (M)Email: [email protected]@gmail.com
Keywords: Human Resource, Economic Development, North-East India
JEL Code: O15, P36, P46
The relationship between human resource and economic development has been widely recognised at all level. Human resource development is conceived to be an integral part of the process of economic development of any region. Thus development in the quality of human being especially of the working population expedites the development activities. An educated, healthy and wealthy individual has better prospect for invention, innovation and entrepreneurship than another individual without those attributes. Improvement in all those attributes also raises the capability to better manage and utilise the available resources and thus enhance the utility of those resources.
North-East India, despite having plenty of natural resources fails to accelerate the economic growth of the region. Sometimes, poor infrastructure and human resources are held responsible for this. However, a few states of North-East (Mizoram, Manipur) have performed reasonably well in improving human development but failed to progress much economically compared to the major other Indian states. States like Meghalaya and Assam despite having many natural resources could not develop industries and also the economy. Also they are the backward states in terms of human resource development. These states could transfer only a section of workers from the primary to the tertiary sector. This paper tries to throw some light on the nature of human development and economic development of North-East India vis-à-vis other region of the country.
© AESS Publications, 2011 Page 109
International Journal of Asian Social Science, 1(4), pp.108-116 2011
developed countries. In some cases of highly human developed nations even the forest resource condition has improved (De, 2006).
North-East India, despite having a number of useful natural resources fails to accelerate the economic growth of the region. Sometimes, the blame is put on the poor infrastructure and human resources. However, a few states of North-East (Mizoram, Nagaland, Manipur) have advanced reasonably well in improving human development but failed to progress much economically compared to the major other states of India. States like Meghalaya and Assam despite having many natural resources also could not develop industries and also the economy (Government of India, Planning Commission, 2001). Also they are the backward states in terms of human resource development. These states could succeed in shifting only a section of workers from the primary to the tertiary sector. The service sector has been expanding all over the country during last few decades and that is partly due to the development of a section of human development indicators, education. But it failed to transform the area into a manufacturing economy. Objective: In the light of aforesaid background, the present paper tries to throw some light on the nature and status of human development and economic development of North-East India vis-à-vis other region of the country.
Basic Characteristics of the Economy of North-East India
The region is rich in biological and natural resources. Coal, limestone, natural gas etc are some of the important mineral resources, while rich biodiversity and forest resources are also the strong positive support for the economy of the region. But it is also one of the economically poorer regions of India in terms of per capita income, incidence of poverty and other economic activities. The region registered slow pace of development even after three decades of formation of North-Eastern Council and it failed to judiciously utilize its natural resource base to accelerate the pace of development. The economy is basically agricultural and natural resource-based. However during last few decades tertiary sector has been found to progress much faster than the other sectors. Though a large section of population is engaged in agriculture, most of them still perform for their subsistence, commercialisation of agriculture is yet to take off and very little emphasis on the innovation has been observed for improving agrarian technology, raising productivity of agriculture by those petty farmers. Institutional arrangements have also
been found to be only on paper and not transformed into a reality.
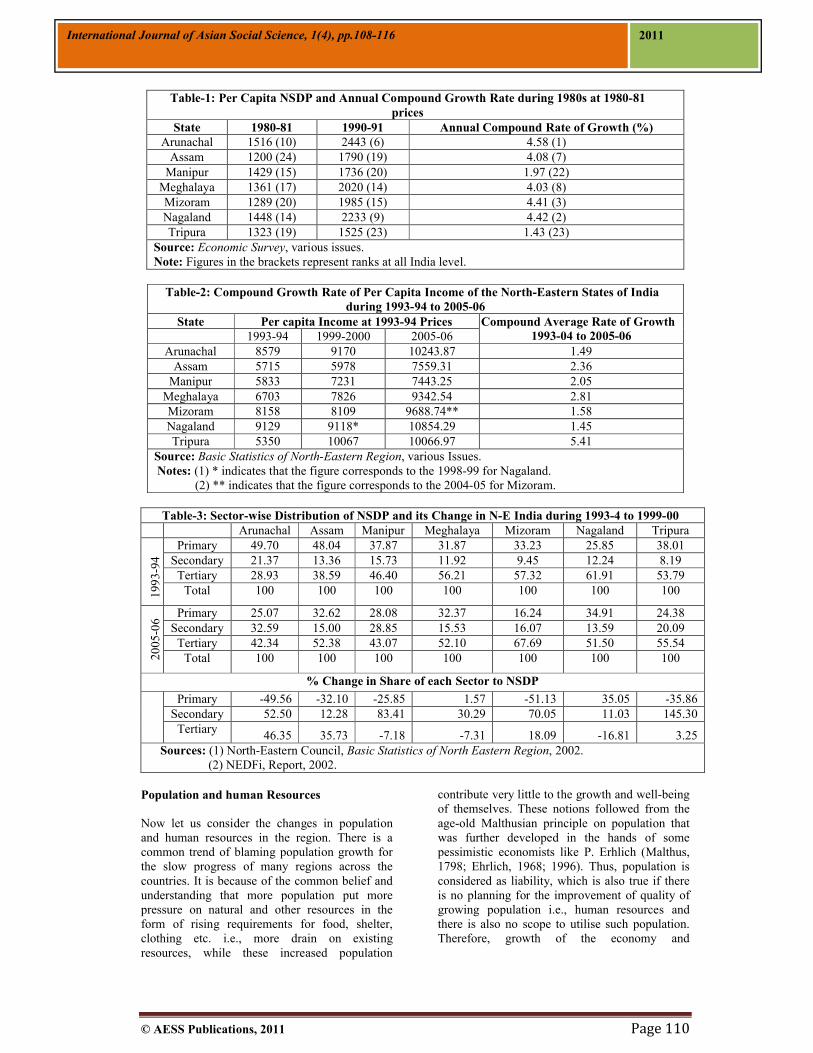
Tables 1 and 2 represent the growth of the per capita income of North-Eastern states during 1980s and 1993-94 to 2005-06 and their relative positions among all the states of India and with respect all India average. Table 1 reveals that in terms of per capita income all the states of North-East India have been lagging behind the other states as their rankings have been much lower among all the states except Arunachal Pradesh. Of course, the ranking of all these states have improved during the decade 1980s except Manipur and Tripura. In terms of growth in per capita income however, Arunachal, Mizoarm and Nagaland was in first three positions but still they failed to develop much in the form of reduction in inequality and poverty. Also, during the next period from 1993-94 to 2005-06 (as shown in Table 2) compound rate of growth in per capita income in Nagaland, Arunachal Pradesh and Mizoram was much lower, which has been primarily due to the high population growth in these states. However, it is interesting to note that the growth of per capita income was much higher in Tripura during the later period and that has been possible due to the drastic fall in population growth as was evident from the 2001 Census Report.1
Whatever development so far has been noticed in these North-Eastern states has been due to the extraction and utilisation of basic natural resources like forest, minerals etc. Therefore the growth has been associated with the depletion of natural resources. Hardly in few cases have such resources been extracted for the utilisation and development of industries in the area. Also, educated unemployment is prevalent in these states due to the lack of development of entrepreneurship. Though contribution of primary sector to the state domestic products has been declining except in Meghalaya and Nagaland due to the rapid growth of the tertiary sector, still now it contributes about one-third of the state domestic product as shown in Table 3 (De, 2004). In the distribution of workers also manufacturing is still far behind and whatever progress is observed is in the tertiary or service sector, whose contribution to employment and income has been continuously rising (Table 4).
1 Population growth in Tripura was the lowest among all the North-Eastern states during 1991 to 2001.
© AESS Publications, 2011 Page 110
International Journal of Asian Social Science, 1(4), pp.108-116 2011
Table-1: Per Capita NSDP and Annual Compound Growth Rate during 1980s at 1980-81 prices
State 1980-81 1990-91 Annual Compound Rate of Growth (%)Arunachal 1516 (10) 2443 (6) 4.58 (1)
Assam 1200 (24) 1790 (19) 4.08 (7)Manipur 1429 (15) 1736 (20) 1.97 (22)
Meghalaya 1361 (17) 2020 (14) 4.03 (8)Mizoram 1289 (20) 1985 (15) 4.41 (3)Nagaland 1448 (14) 2233 (9) 4.42 (2)Tripura 1323 (19) 1525 (23) 1.43 (23)
Source: Economic Survey, various issues.Note: Figures in the brackets represent ranks at all India level.
Table-2: Compound Growth Rate of Per Capita Income of the North-Eastern States of India during 1993-94 to 2005-06
State Per capita Income at 1993-94 Prices Compound Average Rate of Growth1993-04 to 2005-061993-94 1999-2000 2005-06
Arunachal 8579 9170 10243.87 1.49Assam 5715 5978 7559.31 2.36
Manipur 5833 7231 7443.25 2.05Meghalaya 6703 7826 9342.54 2.81Mizoram 8158 8109 9688.74** 1.58Nagaland 9129 9118* 10854.29 1.45Tripura 5350 10067 10066.97 5.41
Source: Basic Statistics of North-Eastern Region, various Issues.Notes: (1) * indicates that the figure corresponds to the 1998-99 for Nagaland. (2) ** indicates that the figure corresponds to the 2004-05 for Mizoram.
Table-3: Sector-wise Distribution of NSDP and its Change in N-E India during 1993-4 to 1999-00
Arunachal Assam Manipur Meghalaya Mizoram Nagaland Tripura
1993
-94
Primary 49.70 48.04 37.87 31.87 33.23 25.85 38.01Secondary 21.37 13.36 15.73 11.92 9.45 12.24 8.19
Tertiary 28.93 38.59 46.40 56.21 57.32 61.91 53.79Total 100 100 100 100 100 100 100
2005
-06
Primary 25.07 32.62 28.08 32.37 16.24 34.91 24.38Secondary 32.59 15.00 28.85 15.53 16.07 13.59 20.09
Tertiary 42.34 52.38 43.07 52.10 67.69 51.50 55.54Total 100 100 100 100 100 100 100
% Change in Share of each Sector to NSDP
Primary -49.56 -32.10 -25.85 1.57 -51.13 35.05 -35.86Secondary 52.50 12.28 83.41 30.29 70.05 11.03 145.30
Tertiary 46.35 35.73 -7.18 -7.31 18.09 -16.81 3.25 Sources: (1) North-Eastern Council, Basic Statistics of North Eastern Region, 2002.
(2) NEDFi, Report, 2002.
Population and human Resources
Now let us consider the changes in population and human resources in the region. There is a common trend of blaming population growth for the slow progress of many regions across the countries. It is because of the common belief and understanding that more population put more pressure on natural and other resources in the form of rising requirements for food, shelter, clothing etc. i.e., more drain on existing resources, while these increased population
contribute very little to the growth and well-being of themselves. These notions followed from the age-old Malthusian principle on population that was further developed in the hands of some pessimistic economists like P. Erhlich (Malthus, 1798; Ehrlich, 1968; 1996). Thus, population is considered as liability, which is also true if there is no planning for the improvement of quality of growing population i.e., human resources and there is also no scope to utilise such population. Therefore, growth of the economy and

© AESS Publications, 2011 Page 111
International Journal of Asian Social Science, 1(4), pp.108-116 2011
technological progress whatever is observed fails to include them in the growth process. On the other hand, the same individuals become happy when extra cattle is born in their houses instead of a human baby as the new born cattle is considered to be a resource as it will contribute to improve their economic condition. That is why these people prefer to have more cattle than to have their own extra children in their family. But they fail to understand the fact that if these extra children can be nurtured properly through education, providing adequate nutrition and other facilities; they can generate positive externality in their family and society and through invention and innovation of newer technologies can solve many of the burning problems of the time and also help continuing growth of the economy in general. That is why Prof. J. Simon considered population growth not to be bad rather population itself is the ultimate resource (Simon, 1981, 1996).
In terms of population growth, all the states of North-East stay ahead of many other states except Tripura and Assam that improved their position by controlling population growth especially fertility and due to substantial decline in in-migration during last decade. During last two decades, Nagaland, Mizoram, Arunachal, Meghalaya and Manipur occupied positions within top ten in terms of population growth among all the Indian states (Table 5). Yet the density of population in these states is much lower than the all India average and thus many other states. But it should be noted that though population density is lower or availability of land per head is much higher in these states; much of the areas cannot be used for cultivation and some areas are inaccessible for harvesting even the common natural resources with the existing technology. Therefore the effective area is not the same as apparent from the density figures. But it is clear that the availability of land has been declining which is the main input of economic activity in the region.
In terms of labour force remain unemployed; conditions of Assam and Tripura were very poor in the early 1980s (Table 6). Though Tripura and Meghalaya have improved their conditions during last two decades the condition of Assam, Manipur, Nagaland and Mizoram have been worsened. The problem is mainly associated with the educated unemployment. Though literacy rate and formal degree education has improved in number, there is a severe lack in professional education to improve the entrepreneurship skill. Moreover, whatever professionally skilled manpower was there, due to either insecurity or lack of remunerative opportunities, there is
always a trend of out-migration of those skilled or semiskilled workers to other regions of the country.
If we look at the incidence of poverty and its change, it is noticed that incidence of poverty has declined across all the North-Eastern states but the figures are still higher than the national average (Table 7). The rate of decline also varies across the states. The highest rate of decline was observed in the successful state Mizoram (from 36 per cent in 1983 to only 19.47 per cent in 1999-2000) i.e., by about 46 per cent where literacy and thus educational index has pushed it up. It was however the lowest in Assam where percentage of poverty declined from 40.47 in 1983 to 36.09 in 1999-2000 i.e., by only 10.82 per cent. Table 7 shows the rate of changes in incidence of poverty in North-Eastern states during 1983 to 2000. But in terms of ranking among all the states, Assam and Tripura has improved significantly and it was moderate in case of Manipur and Meghalaya (Table 8). Relative condition of Mizoram remained more or less same. In terms of reduction in poverty, Mizoram, Manipur and Nagaland do not reflect the same as in case of relative ranking in Human development Index, where these three states were among the top five positions according to the National Human Development Report 2001 (Planning Commission, Government of India).
In order to have an idea about the relative positions of North-Eastern states in terms of human development here the index of human development (HDI) achieved by some of the present day highly developed countries in 1870 and 1913 obtained from different sources are presented in Tables 9 and 10 respectively (Crafts, 2002). It is observed that some of the developed countries like Australia, Switzerland, Denmark, USA and UK already achieved 0.500 HDI by 1870, while some other developed countries attained about 0.2 or 0.3 at that time (Crafts, 2002). During 1913 those former countries attained about 0.7 or more level of HD index while the most successful state of India, Kerala attained only 0.591 in 1991 i.e., about 100 years later, when all India average figure was only 0.38 (Table 11). Though there are little differences in the method of computation of HDI adopted by different countries and that has been changed over time, it can be argued without any hesitation that India has been lagging much behind the developed world and barring a few (that have acquired some achievement recently), the condition of other North-Eastern states has been far from behind.

© AESS Publications, 2011 Page 112
International Journal of Asian Social Science, 1(4), pp.108-116 2011
Table-4: Changes in the Sector-wise Distribution of Main Workers from 1971 to 2001% of Main Workers in
Primary Sector% of Main Workers in
Secondary Sector% of Main Workers in
Tertiary SectorState\Year 1971 1991 2001 1971 1991 2001 1971 1991 2001Arunachal 80.44 67.44 61.84 0.45 8.66 10.75 19.11 23.96 27.41
Assam 77.04 73.99 52.86 4.20 5.56 12.09 17.86 20.45 35.05Manipur 71.30 70.00 52.23 12.24 9.66 15.41 16.46 20.34 32.36
Meghalaya 81.84 74.81 66.53 3.30 3.74 5.92 14.86 21.46 27.55Mizoram 84.17 65.99 60.88 1.76 5.07 7.73 14.07 28.94 31.39Nagaland 79.46 75.26 68.42 2.38 3.48 7.05 18.16 21.26 24.53Tripura 76.58 64.08 51.04 4.25 6.41 9.14 19.17 29.51 39.82
N-E India 77.45 72.61 55.07 4.93 5.78 11.17 17.62 21.61 33.76All India 72.56 67.50 58.72 10.69 12.00 16.69 16.75 20.50 24.59
Sources: (1) North-Eastern Council, Basic Statistics of North Eastern Region, 2002. (2) NEDFi, Report, 2002.
Note: The industry-wise distribution of workers presented in the Census website* is wrong as male, female and total workers figures are all same. Moreover the figures of cultivator, agricultural labourer do not match with the figures available from the printed copies of Workers and Non-Workers, Table-2, of Census of India, 2001. Hence the all India figures are calculated from the printed version.
*Web source: http://www.censusindia.gov.in/Census_Data_2001/Census_data_finder/B_Series/Industrial_Category_of_worker.htm
Table-5: Population Growth, Density and Ranking Annual Compound Growth Rate Density
State\Year 1981-91 1991-01 1981 1991 2001Arunachal 3.19 (3) 2.35 (10) 8 (25) 10 (25) 13 (25)
Assam 1.2 (24) 1.74 (16) 254 (9) 286 (9) 340 (8)Manipur 2.6 (6) 2.66 (4) 64 (19) 82 (19) 107 (19)
Meghalaya 2.88 (5) 2.65 (5) 60 (20) 79 (20) 103 (20)Mizoram 3.4 (2) 2.59 (6) 23 (24) 33 (24) 42 (24)Nagaland 4.55 (1) 5.1 (1) 47 (22) 73 (25) 120 (18)Tripura 2.99 (4) 1.47 (21) 196 (11) 263 (10) 304 (10)
All India 2.13 1.95 216 274 324Source: Census of India, Various issues.Note: Figures in the parentheses represent rankings among all Indian states.
Table-6: Percentage of Labour Force Unemployed1983 1993-4 1999-00
Arunachal -- 1.0 (21) 0.9 (22)Assam 2.2 (8) 5.6 (3) 4.6 (3)
Manipur 0.4 (22) 1.8 (13) 3.5 (6)Meghalaya 1.5 (12) 0.5 (24) 0.9 (23)Mizoram 0.4 (23) 0.8 (22) 2.0 (13)Nagaland 0.3 (24) 2.4 (7) 3.5 (5)Tripura 3.9 (3) 3.4 (5) 1.9 (14)
Source: Planning Commission, Government of India, National Human Development Report, 2001.Note: Figures in the parentheses represent rankings among all Indian states.
On an average, the condition of North-East India in the achievement of human development is not significant except in the states of Mizoram, Manipur and recently Nagaland. Because of increase in literacy rate (which is one of the components of HDI) Mizoram and Nagaland and due to increase in per capita NSDP in recent past (another component of HDI) Manipur could
substantially improve the value of HDI. However, in relative ranking Manipur, Assam, Meghalaya and Tripura lost their earlier positions relegated to lower order by some other advanced states of India. Though some of the North-Eastern states attained higher level of human development, it does not mean an all-round development of these states, which is clear from the existence of

© AESS Publications, 2011 Page 113
International Journal of Asian Social Science, 1(4), pp.108-116 2011
significant educated unemployment; lower all India ranking in per capita income, low growth ofTable-7: Changes in Poverty in North-East IndiaIncidence in Percentage Changes in Percentage
State\Year 1983 1993-4 1999-00 1983 to 1993-4
1993-4 to 1999-00
1983 to 1999-00
Arunachal 40.38 39.35 33.47 -2.55 -14.94 -17.11Assam 40.47 40.86 36.09 0.96 -11.67 -10.82
Manipur 37.02 33.78 28.54 -8.75 -15.51 -22.91Meghalaya 38.81 37.92 33.87 -2.29 -10.68 -12.73Mizoram 36.00 25.66 19.47 -28.72 -24.12 -45.92Nagaland 39.25 37.92 32.67 -3.39 -13.84 -16.76Tripura 40.03 39.01 34.44 -2.55 -11.71 -13.96
Source: Planning Commission, Government of India.
Table-8: All India Ranking of North-Eastern States in BPL Percentage and its ChangeState 1983 1993-94 1999-00
Arunachal 8 7 8Assam 9 5 4
Manipur 16 14 11Meghalaya 14 9 7Mizoram 17 18 16Nagaland 13 10 9Tripura 11 8 6
Source: Planning Commission, Government of India
Table-9: HDI of Some Developed Countries during 1870 Country HDI Country HDIAustralia 0.516 France 0.463
Switzerland 0.515 Germany 0.463Denmark 0.512 Norway 0.454
USA 0.506 Austria 0.331UK 0.500 Spain 0.301
Canada 0.488 Italy 0.268Netherland 0.486 Japan 0.248
Sweden 0.483 Finland 0.239Belgium 0.469 Kerala of India 0.591 (Highest among Indian states)
Sources: Crafts (1997), updated using Maddison (2001) and UNDP (2001).
Table-10: HDI of Some Developed Countries during 1913 Vis-à-vis IndiaCountry HDI Country HDI
Newzealand 0.711 France 0.607Australia 0.696 Germany 0.614
Switzerland 0.643 Norway 0.631Denmark 0.660 Austria 0.501
USA 0.643 Spain 0.421UK 0.644 Italy 0.485
Canada 0.646 Japan 0.466Netherland 0.649 Finland 0.450
Sweden 0.641 India 0.143Belgium 0.590 India: 1950, 1975, 1999 .247, .406, .671
Sources: Crafts (1997), updated using Maddison (2001) and UNDP (2001).
per capita income in Mizoram and Nagaland and finally the rapid population growth that is an
indication of failure of family welfare programmes etc.

© AESS Publications, 2011 Page 114
International Journal of Asian Social Science, 1(4), pp.108-116 2011
In the computation of HDI only life expectancy at birth is considered to represent the health index. But infant mortality is also another parameter indicating the health care condition and family welfare of the respective area. From Table 12 it is observed that Manipur, Tripura, Arunachal Pradesh and Nagaland have been successful in reducing infant mortality rate and their ranking is much lower (means better child healthcare conditions). But for the rest of the North-Eastern states it is much higher in absolute as well as in relative sense, which is clear from their higher rankings in the years 1981, 1991 and 2008 respectively.
In case of male-female gap in infant mortality rate also the North-Eastern states are much better placed except Arunachal and Nagaland. It was even in favour of female in 1991 in the states of Meghalaya, Mizoram, Nagaland and Tripura. But in the recent past it went in favour of male child as is observed from the negative values of male-female gap in most cases and that is an indication of growing negative attitude against female child with the improvement of educational achievements in all these states. The result does not reflect the impact of education on this social evil. Moreover, there is a substantial rural-urban gap in infant mortality rate in all these states except Manipur. The all India ranking of Mizoram, Nagaland and Tripura is moderate. It indicates the worse condition of health care in the rural areas of these states in absolute and relative sense and majority of the population in these states live in rural areas and thereby implying the poor condition of healthcare system for those people. Only a few, living in urban centres can avail and afford to have such facilities.
Inflation and inequality adjusted monthly per capita consumption expenditure is another index of welfare and condition for human development in any region. In this case also all the North-Eastern states except Assam are much ahead of the national average. The condition of Arunachal though better than all India average it ranked 12 among all the states during 1999-2000. Here it may be pointed out that though per capita consumption is adjusted with the general inflation level, at any point of time, general price level in any North-Eastern state is much higher compared to the national average and there is large scale variation in prices within each North-Eastern state especially in Mizoram, Tripura, Nagaland and Meghalaya due to poor marketing infrastructure, transport and communication and if that are taken into consideration the actual conditions would not show much better. Moreover, inequality in actual consumption in the rural areas is observed to increase over time (National Human
Development Report, 2001) in all the North-Eastern states except Arunachal, Meghalaya and Tripura.
Moreover, though literacy rates have increased in all these states, adult literacy rate is only closed tonational average. Also, dropout rates are much higher in these states due to poor economic condition. In addition to that it is to be noted that, the states of Meghalaya, Tripura, Arunachal and Assam have comparatively lower percentage of population covered by every Primary/Secondary schools within 1Km of their residence. But the other three states have comparatively higher figures than the national average. Number of schools per 1000 population is however much higher in all the North-Eastern states exceptTripura. Because of this concentration may be literacy rates are higher. But there is always a question about their capability and production of trained personnel who can take part in the development process.
Conclusion
From the over all discussion, it is clear that though output or income growth accelerates the economic well being and that facilitate human development by meeting the requirements of education, health care. However it is not necessarily a precondition for those achievements in all cases. If the growing income is not properly distributed among the inhabitants and it is associated with large-scale inequality then it cannot guarantee the human development. For example, despite having low-income growth, Kerala could achieve higher human development and also Mizoram, Nagaland during the last decade. Also interrelation among the various other components of human development indicators is not established in all the states of north-east India.
Population growth can affect the human progress adversely but not necessarily. If growing children are nourished properly providing necessary education and health care facilities and through better management of resources it is possible to attain good human development that can also expedite economic growth process and sustain it. In spite of high population growth, due to good works of local level traditional institutions Nagaland achieved better nutritional security, literacy etc.
For the North-Eastern states though some of those states (Nagaland, Mizoram and Manipur) achieved better HDI due to either high educational index or better weight of GDP, they failed to achieve all-round development. They are

© AESS Publications, 2011 Page 115
International Journal of Asian Social Science, 1(4), pp.108-116 2011
still lacking in many respects (inequality in health care, income, poverty reduction, dropout rates of school children, standard of higher and technical education etc) than the developed zone of the country. In general controlling inequality in the distribution of income and expenditure, development of infrastructure is essential for furthering human welfare and economic development.
Finally, integration of North-Eastern states with other region of the country may raise scope for job opportunity that may help reducing unemployment and open up market for goods produced in North-East and hence scope for investment will also increase.
Table-11: HD Index of North-Eastern States and RankingState 1981 1991 2001
Arunachal 0.242 (24) 0.328 (22) 0.617 (22)Assam 0.272 (19) 0.348 (19) 0.534 (29)
Manipur 0.461 (2) 0.536 (4) 0.707 (11)Meghalaya 0.317 (15) 0.365 (18) 0.585 (26)Mizoram 0.411 (4) 0.548 (3) 0.790 (4) Nagaland 0.328 (14) 0.486 (5) 0.770 (7)Tripura 0.287 (18) 0.389 (16) 0.608 (23)India 0.302 0.381 0.575
Source: Planning Commission, Government of India, National Human Development Report, 2001.Note: Figures in the parentheses represent ranking.
Table-12: Infant Mortality Rate and its RankIMR Male-Female Gap Rural-Urban Gap
State\Year 1981 1991 2008 1981 1991 2008 1981 1991Arunachal 126 (9) 91 (5) 32 (26) 30 (3) 8 (7) -4 (6) 41 (12) 66 (1)
Assam -- 92 (4) 64 (4) -- 9 (6) -3 (5) -- 46 (5)Manipur 32 (24) 28 (25) 14 (33) -2 (23) 2 (13) -2 (4) 1 (23) 3 (24)
Meghalaya 79 (21) 80 (9) 58 (6) 5 (21) -3 (17) 0 (2) 25 (19) 60 (2)Mizoram 83 (19) 53 (20) 37 (18) 24 (6) -5 (21) -1 (3) 37 (5) 28 (11)Nagaland 68 (22) 51 (22) 26 (31) 18 (10) -1 (15) -6 (8) 50 (9) 21 (18)Tripura 130 (5) 82 (7) 34 (21) 27 (4) -3 (16) -1 (3) 62 (3) 16 (21)
Sources: (1) Planning Commission, Government of India, National Human Development Report, 2001.(2) The 2008 figures were taken from Sample Registration System, Office of the Registrar General,
India, Ministry of Home Affairs. Note: Figures in the parentheses represent ranking.
Table-13: Inflation and Inequality adjusted Monthly Per Capita Consumption Expenditure (Rs)
State\Year 1983 1993-4 1999-00Arunachal -- 104.71 (14) 129.38 (12)
Assam 93.84 (11) 96 (17) 99.81 (21)Manipur 101.06 (8) 112.89 (9) 130.88 (10)
Meghalaya -- 124.55 (5) 145.65 (7)Mizoram 119.82 (3) 174.47 (1) 202.99 (2)Nagaland -- 164.15 (2) 228.04 (1)Tripura -- 119.53 (8) 125.92 (14)
All India 86.59 97.53 111.28Source: Planning Commission, Government of India, National Human Development Report, 2001.Note: Figures in the parentheses represent ranking.
© AESS Publications, 2011 Page 116
International Journal of Asian Social Science, 1(4), pp.108-116 2011
Reference
Bardhan P. and C. Udry, (1999) Development Microeconomics, Oxford University Press, New York.
Crafts, H. (2002) “The Human Development Index, 1870-1999: Some Revised Estimates” European Review of Economic History, Vol. 6, Pp. 395-405.
Crafts, N.F.R (1997) “The Human Development Index and Changes in Standards of Living: Some Historical Comparisons”, European Review of Economic History I, Pp, 299-322.
De, U. K. (2004) “Structural Change and Resource–Industry Linkages in North-East India” in G. Das edited, Structural Change and Strategy of Development: Resource Industry Linkages in North East India, Akansha Publishing House, New Delhi, Pp. 241-263.
De, U.K. (2006) “Population, Poverty and the Problem of Natural Resource Management”, published in the International Conference on Human and Economic Resources Proceedings Book, Izmir University of Economics and Suny Cortland, PP. 85-100.
Ehrlich. P. (1968) The Population Bomb, Sierra Club, Ballantine, New York.
Ehrlich, Paul R. (1996) Betrayal of Science and Reason, How Anti-Environmental Rhetoric Threatens our Future, ISBN
Government of India, Economic Survey, various issues
Government of India (1991, 2001) Directorate of Census Operations, Census Report, 1991, 2001; Socio Cultural Tables
Maddison, A. (2001) The World Economy: a Millennial Perspective, Paris, OECD.
Malthus, T. R. (1798; 1992) An Essay on the Principles of Population, Cambridge, Cambridge University Press
Planning Commission, Government of India (2001) National Human development Report, 2001
Simon, J. (1981) The Ultimate Resource, Princeton University Press, Princeton, USA.
Simon, J. (1996) The Ultimate Resource 2, 2nd
Edition, Princeton University Press, Princeton, USA.
United Nations Development Programme (2001) Human Development Report, New York, United Nations