2011 long-term load forecast review ercot calvin opheim june 17, 2011
Post on 22-Dec-2015
213 views
TRANSCRIPT

2011 Long-Term Load Forecast Review
ERCOT
Calvin Opheim
June 17, 2011

2
Outline
• Economic Assumptions
• Weather Assumptions
• Model Specifications
• Forecast Results
3
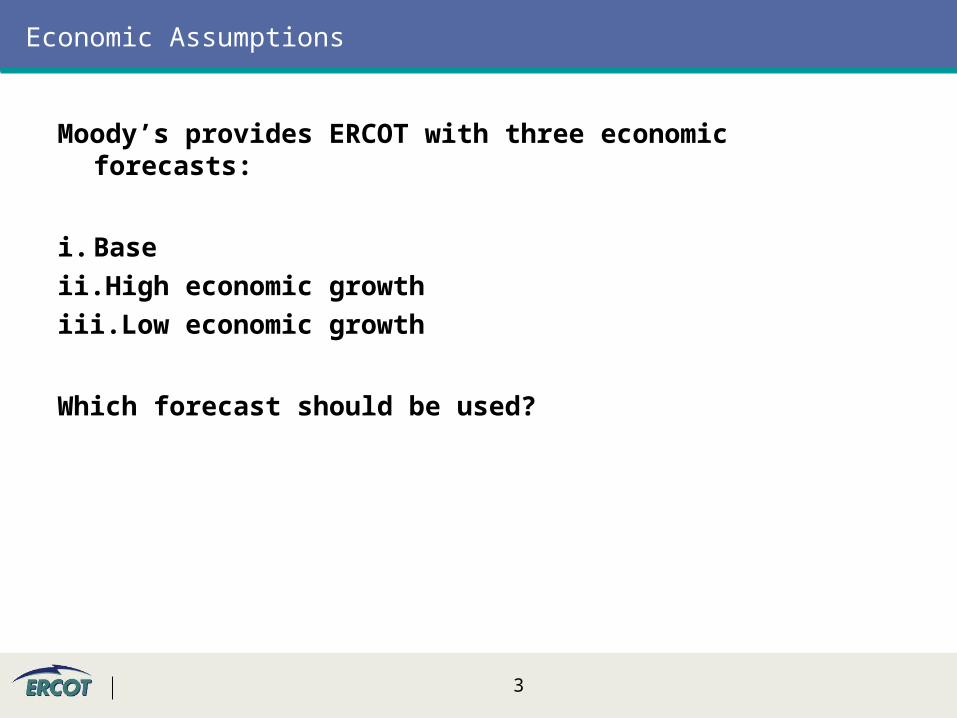
Economic Assumptions
Moody’s provides ERCOT with three economic forecasts:
i. Base
ii. High economic growth
iii. Low economic growth
Which forecast should be used?

4
Economic Assumptions
-1,500
-1,000
-500
0
500
1,000
1,500
2,000
2,500
3,000
Jan-11 Feb-11 Mar-11 Apr-11 May-11
GW
h
Impact of Economy and Weather on Load Forecast Error
2011 YTD: Forecasted Energy - 119.9 TWhActual Energy - 124.6 TWh
Economy Impact
Weather Impact

5
Economic Assumptions

6
Economic Assumptions
• Non-Farm employment values have been exceeding the low economic forecast for the last year.
• This supported using the base economic forecast for non-farm employment in the 2011 forecast update
• The 2010 load forecast was based on the low case economic forecast.

7
Weather Assumptions
Normal weather definition from NERC LTRA:
“When providing a demand forecast, provide a normalized forecast. This is defined as a forecast which has been adjusted to reflect normal weather, and is expected on a 50% probability basis, i.e. a peak demand forecast level which has a 50% probably of being under or over achieved by the actual peak. This is also known as the 50/50 forecast. This forecast can then be used to test against more extreme conditions.”

8
Weather Assumptions
• Determination of “normal” weather year
– There are many ways of deriving a “normal” weather year• Based on average temperature
• Typical meteorological year
• Rank and Average methodology
• Based on weather conditions at time of peak
• Rotating historical weather through a calendar
• Combinations of the above
– There is no universally accepted best approach• Each of the above have strengths and weaknesses

9
Weather Assumptions
• Determination of “normal” weather year
– ERCOT’s analysis includes 15 years of weather data
– The methodology that ERCOT selected ranks monthly weather data based on temperature extremes (hot temperatures in the summer and cold in the winter) and also ranks monthly weather based on average temperature
– The “normal” weather month is determined by selecting the historical month which is closest to the median based on extreme and average temperatures
– Does not take into account shorter-term seasonal weather outlooks (summer of 2011, winter of 2012)

10
Weather Assumptions
• ERCOT represents a large geographical area making the derivation of a “normal” year complicated
– Should we use consistent weather data (i.e., same month) for all weather zones?
– Should we use different weather data (i.e., may use historical months from different years) for weather zones?

11
Weather Assumptions
• Determination of “normal” weather year– Based on high temperature and average temperature, August of
2001 would appear to be a good representation of “normal” weather
Rank Rankwzone year month Mean Temp Max Temp Mean Temp Max TempNCENT 8 1996 81.4 100.0 2 4.5NCENT 8 1997 83.0 98.5 3 2NCENT 8 1998 86.2 106.0 11 12.5NCENT 8 1999 89.3 105.3 15 10.5NCENT 8 2000 89.1 106.0 14 12.5NCENT 8 2001 84.6 102.3 7 7.5NCENT 8 2002 84.5 98.8 6 3NCENT 8 2003 84.9 106.8 8 14NCENT 8 2004 80.4 98.0 1 1NCENT 8 2005 84.1 100.8 4 6NCENT 8 2006 88.2 103.8 12 9NCENT 8 2007 85.5 102.3 10 7.5NCENT 8 2008 84.2 105.3 5 10.5NCENT 8 2009 85.0 100.0 9 4.5NCENT 8 2010 88.7 107.0 13 15

12
Weather Assumptions
• Determination of “normal” weather year– Based solely on average temperature, August of 2003 would be
a good representation of “normal” weather– But the maximum temperature experienced was the 2nd highest
Rank Rankwzone year month Mean Temp Max Temp Mean Temp Max TempCOAST 2001 8 82.9 96.3 3 3COAST 2002 8 83.2 96.1 4 2COAST 2003 8 83.2 99.1 5 9COAST 2004 8 82.4 97.2 1 7COAST 2005 8 84.1 97.1 7 6COAST 2006 8 84.2 96.4 8 4COAST 2007 8 84.0 99.7 6 10COAST 2008 8 82.9 96.1 2 1COAST 2009 8 85.2 96.9 9 5COAST 2010 8 86.4 98.0 10 8

13
Weather Assumptions - challenges
• Using different historical years for individual weather zones will result in ERCOT’s coincident peak demand forecasts being too low based on lower than normal coincidence factors between the weather zone peaks.– August 2001 data is used for NCENT weather zone– August 2003 data is used for COAST weather zone– Seeing that the peak temperatures for these two weather zones
occur on different days this will result in a smaller coincident factor between the peak loads of these weather zones at the time of the ERCOT peak than is normally observed during the summer peak.
• To correct for this problem, have to time align the weather zone non-coincident peak days

14
Weather Assumptions – 2010 forecast
• Used median weather year which was determined using the Rank and Average methodology
• Weather conditions at the time of summer peak were significantly warmer for the NCENT region (104.750 F) than used in the 2011 forecast (102.250 F)
• Weather conditions at the time of summer peak were also somewhat different for the COAST region and the SCENT region– 2010 forecast used 97.70 F for COAST while the 2011 forecast
used 98.70 F– 2010 forecast used 101.50 F for SCENT while the 2011 forecast
100.50 F

15
Maximum August Temperature for North Central
92
94
96
98
100
102
104
106
108
1996 1997 1998 1999 2000 2001 2002 2003 2004 2005 2006 2007 2008 2009 2010
De
gre
es
F

16
Maximum August Temperature for Coast
90
92
94
96
98
100
102
104
1996 1997 1998 1999 2000 2001 2002 2003 2004 2005 2006 2007 2008 2009 2010
De
gre
es
F
17
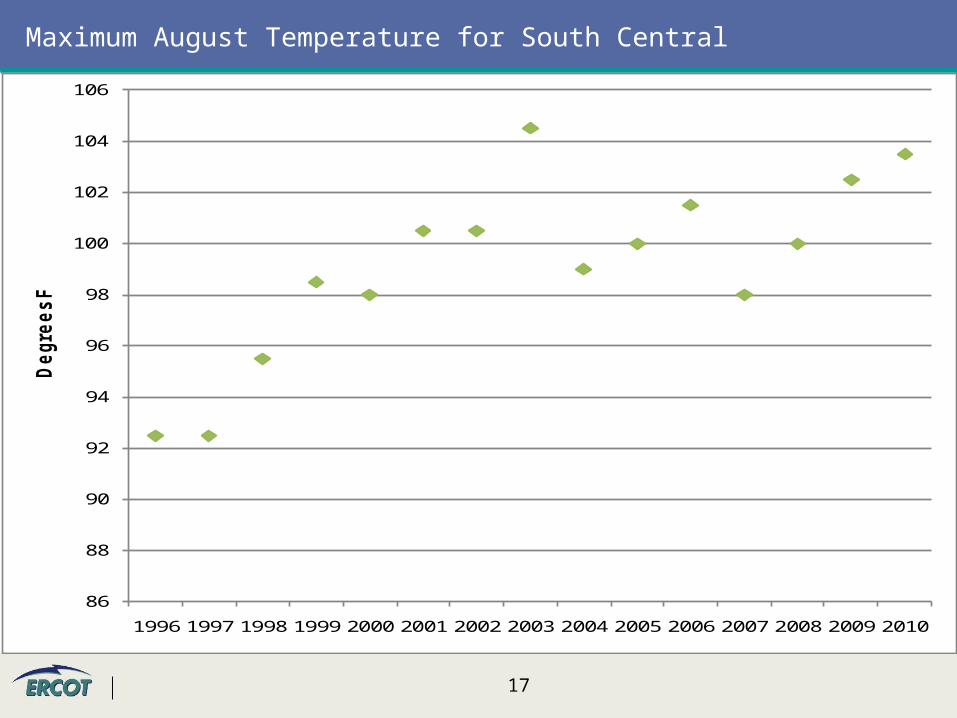
Maximum August Temperature for South Central
86
88
90
92
94
96
98
100
102
104
106
1996 1997 1998 1999 2000 2001 2002 2003 2004 2005 2006 2007 2008 2009 2010
De
gre
es
F

18
Long-Term Load Forecast Model Description
• Independent models are created for each of ERCOT’s eight weather zones
• Two sets of models are used to create the long-term load forecast
– Monthly energy models
– Hourly energy models

19
Long-Term Load Forecast Model Description
• Monthly energy models– Creates a total energy forecast for each weather zone, for each
month in the forecast time period– Long-term growth in energy consumption is correlated with non-
farm employment forecast– The same weather is used for each forecast year
• Hourly energy model– Allocates energy from the monthly energy forecast to each hour
within the month for each weather zone

20
Monthly Energy Model Description
• A two season model is used (summer and winter)– April through September are assigned to the summer season– November, December, January, February, and March are
assigned to the winter season
• Each weather zone model forecasts monthly MWh per one thousand non-farm jobs per day
• Multiplying this result by the number of days in the month gives the monthly total energy for the weather zone

21
Monthly Energy Model Description
• Monthly MWh per one thousand non-farm jobs per day is estimated using a model that has weather data (i.e., cooling degree days and heating degree days) as independent variables
• Degree days (cooling and heating) for the month are divided by the days in the month which results in a degree day per day variable representation which is used in the model
• This approach eliminates the need for “dummy” variables (typically used for months like February, April, June, September, November which have fewer days)

22
Monthly Energy Model Description
• Monthly energy model examples:
• (Daily Energy COAST
) / Non-Farm Employment COAST
=
75.87 + 1.54 HDD50
per day + 0.37 HDD
65 per day + 1.53 CDD
65 per day
– this model uses Heating Degree Days with bases of 50 and 65– this model uses Cooling Degree Days with a base of 65– this model is for the winter season
• (Daily Energy NCENT
) / Non-Farm Employment NCENT
=
66.51 + 2.33 CDD65
per day + 0.81 CDD
85 per day
– this model uses Cooling Degree Days with bases of 65 and 85– this model is for the summer season

23
Monthly Energy Model Description – 2010 forecast
• The monthly energy model forecasts the long-term trends in energy consumption (MWh) utilizing economic, demographic, weather, and season variables and possibly autoregressive terms. The form of the model is as follows:
– Yt = Monthly energy consumption (MWh)
– CDDn,t = Cooling Degree Days (n terms using different basis)
– HDDn,t = Heating Degree Days (n terms using different basis)
– E it = Economic and Demographic variables
– mit = Monthly indicator variables
ititi
iiti
s
itni
n
itni
n
it mHDDCDDY
11
11,
11
,

24
Hourly Energy Model Description
• A neural network model was developed for each weather zone, for each day type, for each hour that forecasts the hourly fraction of energy for each hour within a month
• The neural network model is based on the following variables:– Sunset time– Current day’s maximum and minimum temperatures– Previous day’s maximum and minimum temperatures– Current day’s temperatures at 7 a.m., noon, and 7 p.m.– Hourly fraction of the prior hour– Average monthly temperature

25
Hourly Energy Model Description
• Day types are Saturday, Sunday or holidays, and weekdays excluding holidays
• Multiplying the weather zone’s hourly fraction times the weather zone’s total energy for the month produces the hourly energy forecast for each Weather Zone
• The monthly peaks for the eight weather zones are time aligned
• The eight weather zone forecasts are summed to create the ERCOT hourly load forecast

26
Hourly Energy Model Description – 2010 forecast
• A linear regression model was developed for each weather zone that forecasts the hourly load shape of energy for each hour within a month
• The network model was based on the following variables:– hourly indicator variables– weather variables and their lags– day type variables– weather interaction variables– sunlight variables– special events variables– autocorrelation terms specified with a lag (backshift) operator

27
Hourly Energy Model Description – 2010 forecast
• The peak demand forecasts are obtained by combining the results of the two models:
– the hourly load shape model
– monthly energy forecast which includes economic
• Details for the 2010 load forecast and methodology can be found here:– www.ercot.com/content/news/presentations/
2010/2010%20Long-Term%20Hourly%20Peak%20Demand%20and%20Energy%20Forecast.pdf

28
Forecast Results
• Developed weather scenarios by using actual weather data for 1999 through 2010
– Ran the model using actual weather data for 1999 through 2010
– Used the actual weather data for a historical year as the forecasted weather for all years in the forecast timeframe
(2011 – 2021)
– This resulted in twelve distinct scenarios

29
2011 Summer Forecasted Peak Demand Sensitivities
57,000
58,000
59,000
60,000
61,000
62,000
63,000
64,000
65,000
66,000
67,000
Mw
1999 weather
2000 weather
2001 weather
2002 weather
2003 weather
2004 weather
2005 weather
2006 weather
2007 weather
2008 weather
2009 weather
2010 weather

30
Historical and Forecasted Summer Peak Demand
0
10,000
20,000
30,000
40,000
50,000
60,000
70,000
80,000
90,000
57
,60
6
54
,84
6
56
,08
6
60
,03
7
58
,50
6
60
,21
4
62
,33
9
62
,17
4
62
,17
4
63
,40
0
65
,77
6
63
,89
8
65
,66
5
67
,75
7
70
,54
0
72
,59
1
74
,19
8
75
,36
5
76
,65
4
77
,86
6
79
,27
4
Mw
Actual Forecast

31
Comparison of long-term load forecasts
82,911
75,283
79,274
74,892
55,000
60,000
65,000
70,000
75,000
80,000
85,000
2011 2012 2013 2014 2015 2016 2017 2018 2019 2020
MW
Year
High Forecast (2010 weather) 2010 Forecast 2011 Forecast Low Forecast (mild weather)
32
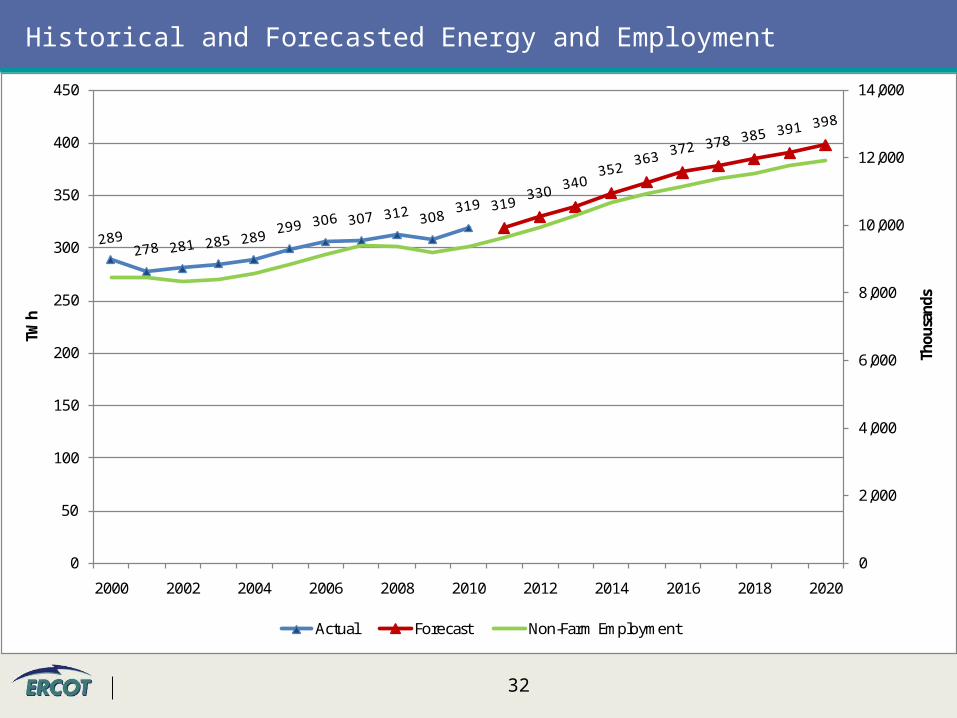
Historical and Forecasted Energy and Employment
0
2,000
4,000
6,000
8,000
10,000
12,000
14,000
0
50
100
150
200
250
300
350
400
450
2000 2002 2004 2006 2008 2010 2012 2014 2016 2018 2020
Thou
sand
s
TWh
Actual Forecast Non-Farm Employment

33
Historical and Forecasted Energy
316 324 331 337 342 347 353 358 362 367
0
50
100
150
200
250
300
350
400
450
2000 2002 2004 2006 2008 2010 2012 2014 2016 2018 2020
TWh
Actual 2011 Forecast 2010 Forecast

34
Adjustments to the Long-Term Forecast
• No significant incremental changes have been reflected in the long-term forecast to account for:
– Energy Efficiency
– Demand Response
– Distributed Generation
– Plug-in Electric Vehicles
• These will need to be developed in the future

35
Questions
ON
OFF