2011 ga chapter of aspa presentation
TRANSCRIPT

Andy Brubaker
University of West Georgia


John H. Chafee Foster Care Independence Act of 1999, [42 U.S.C. 677 § 477 (2001)]
O.C.G.A. § 20-3-660

55%
15%
1.8% to 9%
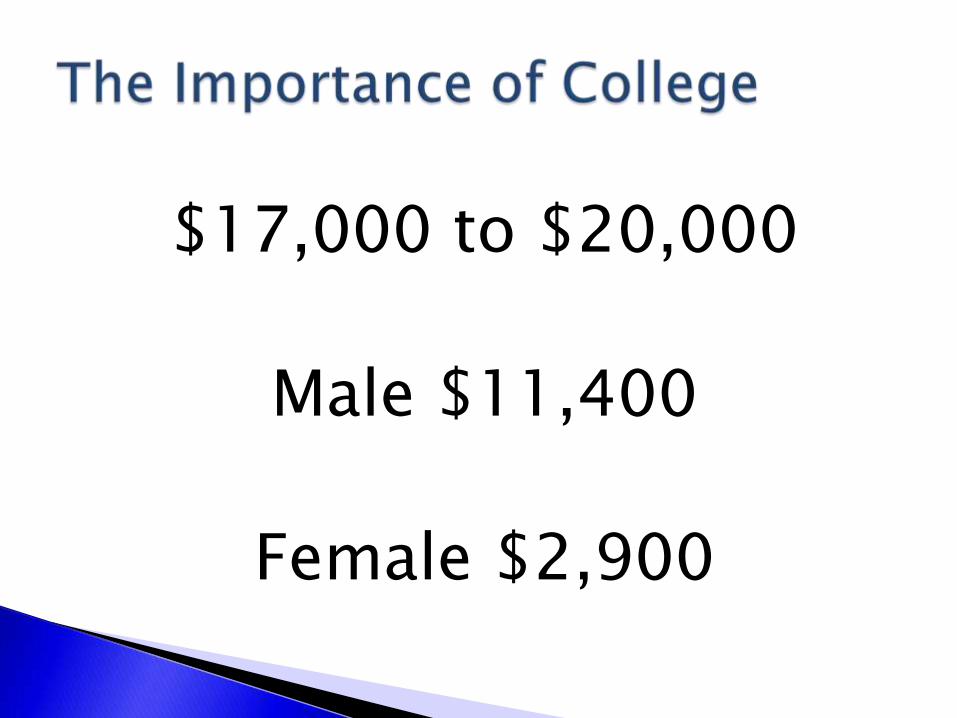
$17,000 to $20,000
Male $11,400
Female $2,900

$0.0
$10.0
$20.0
$30.0
$40.0
$50.0
$60.0
$70.0
$80.0
Millions
Public Assistance Spending in Georgia
High School or Less
Associates Degree or
College
Bachelor's Degree

$0
$200
$400
$600
$800
$1,000
Millions
Georgia State Prison Spending
High School Degree
or Less
Associates Degree or
Some College
Bachelor's Degree

$0
$2,000
$4,000
$6,000
$8,000
$10,000
$12,000
$14,000
Median Annual Taxes
No High School
High School / GED
Bachelor's

9,984 Children in Foster Care (2008)
5,500 achieve High School Degree/GED
300 may achieve a Bachelors Degree
$56.7 Million
If
$67.8 Million


Region IV Independent Living Program Director
State Independent Living Program Director
Open Records Request
Director of Legal, DFACS
Georgia State Senator Greg Goggans, R-7◦ Betty Conner

Data based on ILP Youth Served during reported year. Obtained from IL Annual Report.
a. GED / HSD b. Vocational Training c. College
---------- ---------- --------- ---------- ---------- --------- ---------- ---------- ---------
Year CP C W CP C W CP C W
---------- ---------- --------- ---------- ---------- --------- ---------- ---------- ---------
2001 1103 208 108 79 10 15 97 3 6
2002 1910 265 65 93 6 13 151 4 7
2003 2163 246 28 47 12 7 193 14 9
2004 1852 289 49 57 13 20 247 10 17
2005 1679 353 30 71 14 6 268 14 18
2006 2061 638 75 113 12 24 350 29 49
2007 2813 664 80 129 22 20 446 34 74
2008 2896 562 74 108 17 37 317 25 75
2009 3108 550 99 111 13 27 493 35 67
2010 2950 611 89 115 12 14 446 45 13
CP = Currently Participating
C = Completed (Graduated)
W = Withdrew
*Data based on Youth Served through ILP as reported on the ILP Annual reports

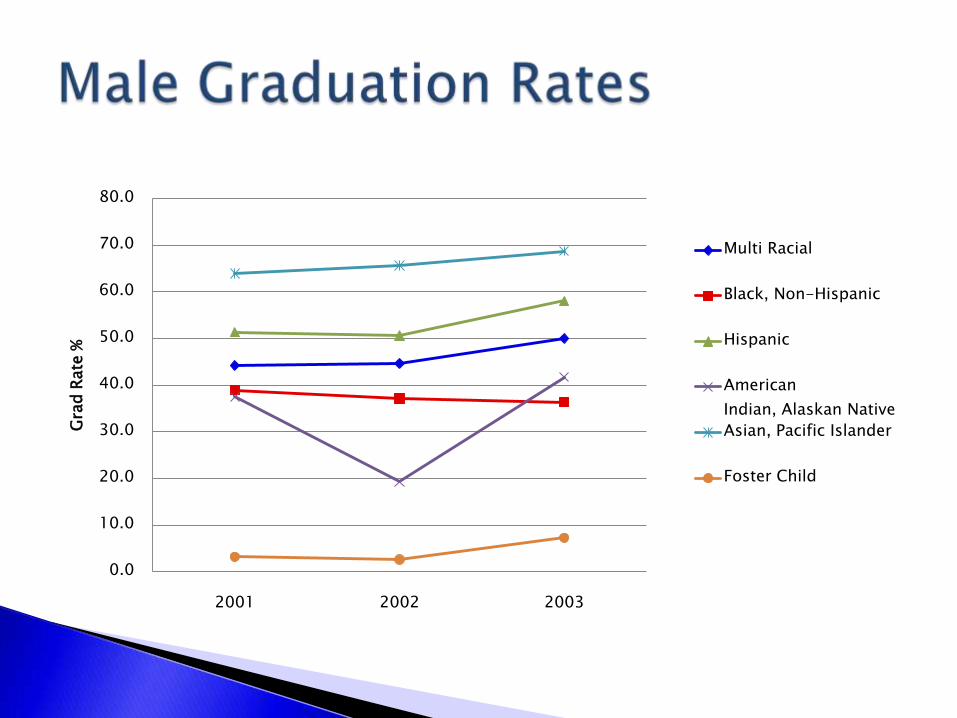
Male Students 2001 Cohort 2002 Cohort 2003 Cohort
6yr Rate 6yr Rate 6yr Rate
Multi Racial 44.2% 44.7% 50.0%
Black, Non-Hispanic 39.0% 37.1% 36.3%
Hispanic 51.4% 50.6% 58.1%
American Indian,
Alaskan Native37.5% 19.2% 41.7%
Asian, Pacific Islander 64.0% 65.7% 68.7%
Foster Child 3.1% 2.6% 7.3%
0.0
10.0
20.0
30.0
40.0
50.0
60.0
70.0
80.0
2001 2002 2003
Gra
d R
ate
%
Multi Racial
Black, Non-Hispanic
Hispanic
American
Indian, Alaskan Native
Asian, Pacific Islander
Foster Child

Female Students 2001 Cohort 2002 Cohort 2003 Cohort
6yr Rate 6yr Rate 6yr Rate
Multi Racial 57.30% 49.90% 52.00%
Black, Non-Hispanic 52.50% 49.30% 50.60%
Hispanic 58.80% 62.70% 53.30%
American Indian, Alaskan Native
54.80% 53.60% 58.50%
Asian, Pacific Islander 71.10% 70.70% 67.70%
Foster Child 3.10% 2.60% 7.30%

0.0
10.0
20.0
30.0
40.0
50.0
60.0
70.0
80.0
2001 2002 2003
Gra
d R
ate
%
Multi Racial
Black, Non-Hispanic
Hispanic
American
Indian, Alaskan
Native


Improved accountability of funds
Enhanced data
Comprehensive research
$ = More professional staff
Collaboration with educational institutions
Training◦ Foster Parent
◦ Case Managers
◦ Foster Children


Andy Brubaker
Director of the LaGrange College Fund
706-880-8773