2011 final results presentation - hld.com · 2011 final results presentation 21 march 2012 . ......
TRANSCRIPT
2011 Final Results – 21 March 2012(Hong Kong stock code: 12)
2011 Final Results Presentation 21 March 2012

2011 Final Results – 21 March 2012
Disclaimer
This presentation has been prepared by Henderson Land Development Company Limited (the “Company” or “HLD”) solely for information purposes and does not constitute an offer, recommendation or invitation to subscribe for or purchase any securities and nothing contained herein shall form the basis of any contract or commitment whatsoever.
The information contained in this presentation has been taken from sources deemed reliable by the Company. However, no representation or warranty (express or implied) is given as to the accuracy or completeness of the information contained herein and none of the Company and/or its affiliated companies and/or their respective employees and/or agents accepts any responsibility or liability as to, or in relation to, the accuracy or completeness of the information and opinions contained in this presentation or as to any information contained in this presentation remaining unchanged after the issue thereof.
This presentation contains forward-looking statements. Statements that are not historical facts, including statements about the Company’s beliefs and expectations are forward-looking statements. These statements are based on current plans, estimates and projections, and therefore you should not place undue reliance on them. Forward-looking statements speak only as of the date they are made, and the Company undertakes no obligation to update, modify or amend this presentation or to otherwise notify the recipient if any information, opinion, projection, forecast or estimate set forth herein, changes or subsequently becomes inaccurate. Forward-looking statements involve inherent risks, uncertainties and assumptions. The Company cautions you that if these risks or uncertainties ever materialise or the assumptions prove incorrect, or if a number of important factors occur or do not occur, the Company’s actual results may differ materially from those expressed or implied in any forward-looking statement.
You acknowledge and agree that HLD and/or its affiliated companies and/or their respective employees and/or agents has/have no responsibility or liability (express or implied) whatsoever and howsoever arising (including, without limitation for any claim, proceedings, action, suits, losses, expenses, damages or costs) which may be brought against or suffered by any person as a result of acting in reliance upon the whole or any part of the contents of this presentation and neither the Company, its affiliated companies nor their respective employees or agents accepts any liability for any error, omission or misstatement, negligent or otherwise, in this presentation and any liability in respect of the presentation or any inaccuracy therein or omission therefrom which might otherwise arise is hereby expressly disclaimed.
- 1 -

2011 Final Results – 21 March 2012
2011 Final Results Highlights
� Underlying profit attributable to Shareholders (before the fair value change of investment properties*) for 2011 : HK$5,560 million 10% y-o-y
� Reported profit attributable to Shareholders for 2011: HK$17,184 million 9% y-o-y
� Earnings per share
• Based on underlying profit: HK$2.41 3% y-o-y
• Based on reported profit: HK$7.44 2% y-o-y
� Dividends per share: HK$1.0 (2010: HK$1.0)
� Net asset value per share: HK$78.23 7% y-o-y
� Net debt to shareholders’ equity: 19.9% 8.3 percentage points
- 2 -
*The fair value change (net of non-controlling interests and deferred taxation) of both completed investment properties and investment properties under development

2011 Final Results – 21 March 2012- 3 -
Audited 2011
HK$ M2010
HK$ MChange
Property sales* Revenue
Pre-tax profit contribution
9,4792,079
3,560
539
166%
286%
Property leasing* Gross rental income
Net rental Income
5,8054,169
4,865
3,344
19%
25%
Profit attributable to ShareholdersUnderlying profit (before the fair value change of investment properties)
5,560 5,042 10%
Adjusted underlying profit∆ 5,560 4,035 38%
Reported profit 17,184 15,820 9%
Earnings per share (HK$)Based on underlying profit
Based on reported profit
2.417.44
2.33
7.32
3%
2%
Dividends per share (HK$)Interim dividend
Final dividend
Total
0.300.701.00
0.30
0.70
1.00 --
*All the figures represent the Group’s attributable share of contributions from its subsidiaries, JCEs and associates in Hong Kong and mainland China.∆Excluding fair value change of investment properties and the HK$1,007 million one-off gain on disposal of the Group’s interest Beijing Youyi Shopping City Co., Ltd.
Beijing Lufthansa Centre which was recognized in 2010 .
2011 Final Results Highlights (Cont’d)
2011 Final Results – 21 March 2012
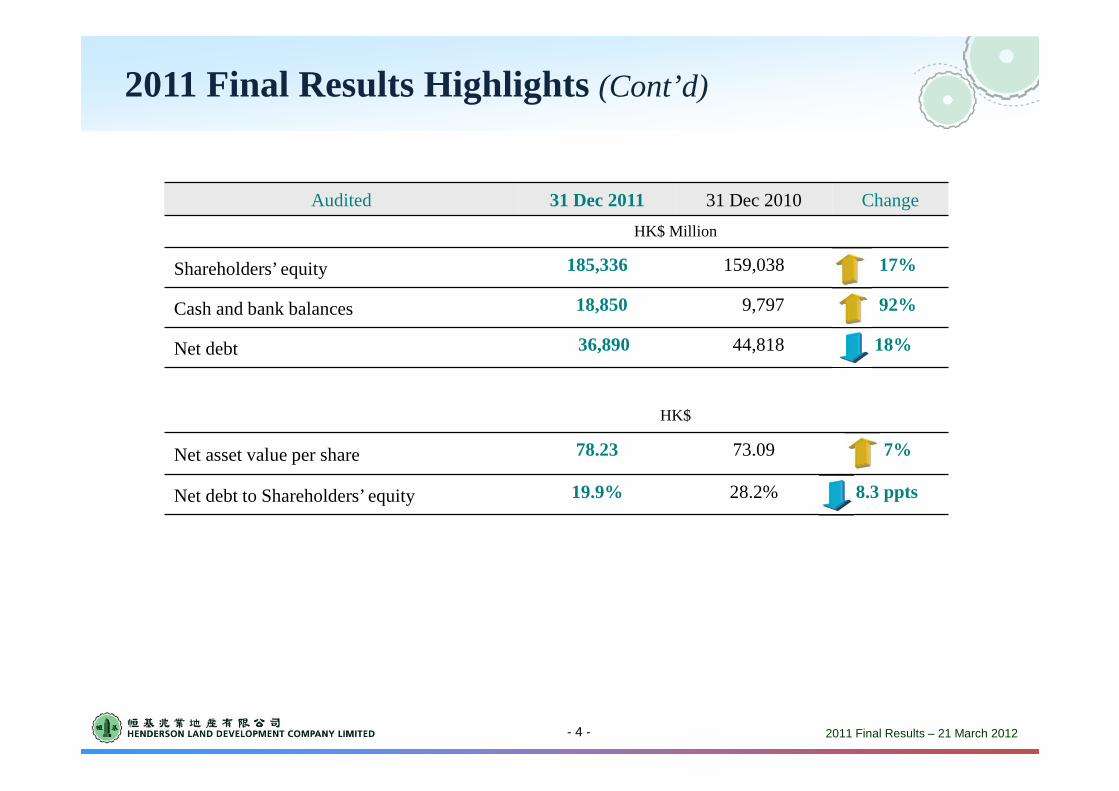
2011 Final Results Highlights (Cont’d)
- 4 -
Audited 31 Dec 2011 31 Dec 2010 Change
HK$ Million
Shareholders’ equity 185,336 159,038 17%
Cash and bank balances 18,850 9,797 92%
Net debt 36,890 44,818 18%
HK$
Net asset value per share 78.23 73.09 7%
Net debt to Shareholders’ equity 19.9% 28.2% 8.3 ppts

2011 Final Results – 21 March 2012
Key Developments in 2011
� Asset turnover from property sale & pre-sale
HK$ Million
In Hong Kong^
� Sales from completed residential developments 8,308
� Sales from non-core investment properties & other stocks
� Incl. villas at Casa Marina (Phase 1 & 2) and
The Beverly Hills (Phase 1), and
� Office & industrial/ office premises etc.
2,538
� Pre-sales from The Gloucester, E-Trade Plaza & AZURA 3,373
Sub-total 14,219
In Mainland China^
� Sales and Pre-sales* 1,905
Sub-total 1,905
Total 16,104
^ All the figures represent the Group’s attributable share of contribution from its subsidiaries, JCEs and associates
*As of 31 December 2011, the cumulative amount of Mainland properties pre-sold attributable to the Group totalled to HK$2,527 million
- 5 -

2011 Final Results – 21 March 2012
Gearing Up for New Launches

2011 Final Results – 21 March 2012
Investment Highlights
� Asset turnover focused strategy
� Rising rental income from investment properties
� Low-risk approach to land-banking
� Continuing growth from Hong Kong & China Gas
- 7 -
� Strong financial position with adequate financing facilities in place

2011 Final Results – 21 March 2012
Asset Turnover Focused Strategy
- 8 -
� Hong Kong
• Three new projects were launched for pre-sale in 2011
Usage* HLD’s interest
Attr. GFA (sq. ft.)
No. of residential units
Units/ GFA sold
Expected completion
The Gloucester R 100% 113,977 177 > 90% 4Q 2012
E-Trade Plaza O 100% 173,850 N/A ~ 30% 2Q 2012
AZURA R 12.5% 25,788 126 ~ 78% 2H 2012
� Mainland China
• Four new projects were launched for pre-sale in 2011
City Project name and location HLD’s interest
Chongqing Phase 1A, Grand Waterfront (翔龍江畔城), Nan An District 100%
Nanjing Phase 1, Emerald Valley (玲瓏翠谷), Xianling New District 100%
Suzhou Phase 1, Riverside Park (水漾花城), Xiangcheng District 100%
Xuzhou Phase 1A, Grand Paradise (恒基‧雍景新城), Dalong Lake Area 100%
*R = Residential; O = Office
• Attributable sales and pre-sales amounted to HK$1,905 million, up 47% y-o-y
• Cumulative attributable pre-sales totalled HK$2,527 million at the end of 2011

2011 Final Results – 21 March 2012
Asset Turnover Focused Strategy (Cont’d)
� Hong Kong
• As at 31 December 2011, the Group had 202 completed residential units which are pending sales
• In 2012, there are seven projects as enlisted below that are due for sale/ pre-sale:
- 9 -
Project name and location Usage^HLD’s interest
No. of residential
units
Attributable GFA (sq. ft.)^
C R
(1) La Verte – 283 Jockey Club Road, Fanling* R 100% 16 -- 34,308
(2) 68 Boundary Street, Kowloon C/R 100% 41 10,125 50,624
Old Building Redevelopment Projects
(3) 30-38 Po Tuck Street and 36 Clarence Terrace, Western District, Hong Kong
R 100% 133 -- 58,400
(4) 45-49 Boundary Street and 189-195 Sai Yeung Choi Street North, Kowloon
C/R 100% 59 8,820 44,099
(5) 186-188 Tai Po Road, Sham Shui Po, Kowloon C/R 100% 138 7,977 62,321
New Territories Land Conversion Projects
(6) Shatin Town Lot 502 at Lok Wo Sha, Wu Kai Sha, Ma On Shan (Phase 1)
C/R 59% 928 58,173 403,902
(7) Yuen Long Town Lot 526, Tai Tong Road, Yuen Long R 79.03% 2,580 -- 1,027,195
Total 3,895 85,095 1,680,849
Total GFA attributable to HLD 1,765,944
1
2
3
4
7
5
6
^C= Commercial; R= Residential *La Verte was launched for sale in February 2012

2011 Final Results – 21 March 2012
Location Map of New Projects Pending Sale/ Pre-salein Hong Kong for 2012
Airport ExpressTung Chung Cable Car
MTR
Harbour TunnelsLight Rail
East RailWest RailMa On Shan Rail
Route 3
Existing line
Shatin to Central Link
Under planning
- 10 -
Lantau Island
Hong Kong International Airport
Tung ChungMui Wo
Discovery Bay
Hong Kong Island
Central
Causeway Bay
Chai Wan
Kai Tak Tseung Kwan O
Sai Kung Ma On Shan
New Territories
Fanling
Yuen Long
Lo Wu
Sheung Shui
Lok Ma
Chau
Tai Po
Shatin
Tsing Yi
Lai King
Tuen Mun
Tsuen Wan
Kowloon
Tong
Olympic
68 Boundary Street
67
24
3
1
Wu Kai Sha
Tai Tong Road
La Verte
Po Tuck Street & Clarence Terrace
5
Wu Kai Sha project in Feb 2012
Tai Tong Road project in Feb 2012

2011 Final Results – 21 March 2012
� Sizeable pre-sale schedule for Hong Kong in the coming years (Note 1)
- 11 -
Asset Turnover Focused Strategy (Cont’d)
Attributable GFA (million sq. ft.) 2012 2013 2014 or onwards Total
Stocks & projects pending sale/ pre-sale 0.72 − − 0.72
Newly acquired 35 old building redevelopment projects (Note 2)
0.18 0.61 1.67 2.46
Redevelopment of existing urban projects − − 1.37 1.37
Wu Kai Sha project (Note 3) 0.40 1.28 − 1.68
Tai Tong Road project (Note 4) 1.03 − − 1.03
Total 2.33 1.89 3.04 7.26
1. The schedule is subject to change in response to changes in construction plan, regulatory and market developments.
2. Among the 37 old building redevelopment projects in which HLD has majority ownership of 80% or above, 35 projects are designated for developing into commercial/ residential projects for sale and the remaining two projects will be developed into investment properties.
3. Wu Kai Sha project will be completed in phases and phase 1 is scheduled for completion in 4Q 2012.
4. Following the successful land-use conversion of Tai Tong Road project’s adjacent land-lot in mid-August 2011, the total attributable GFA of the entire project has been enlarged from 0.93 million sq. ft. to 1.027 million sq. ft. with scheduled completion by the end of 2012.
Notes:
2011 Final Results – 21 March 2012
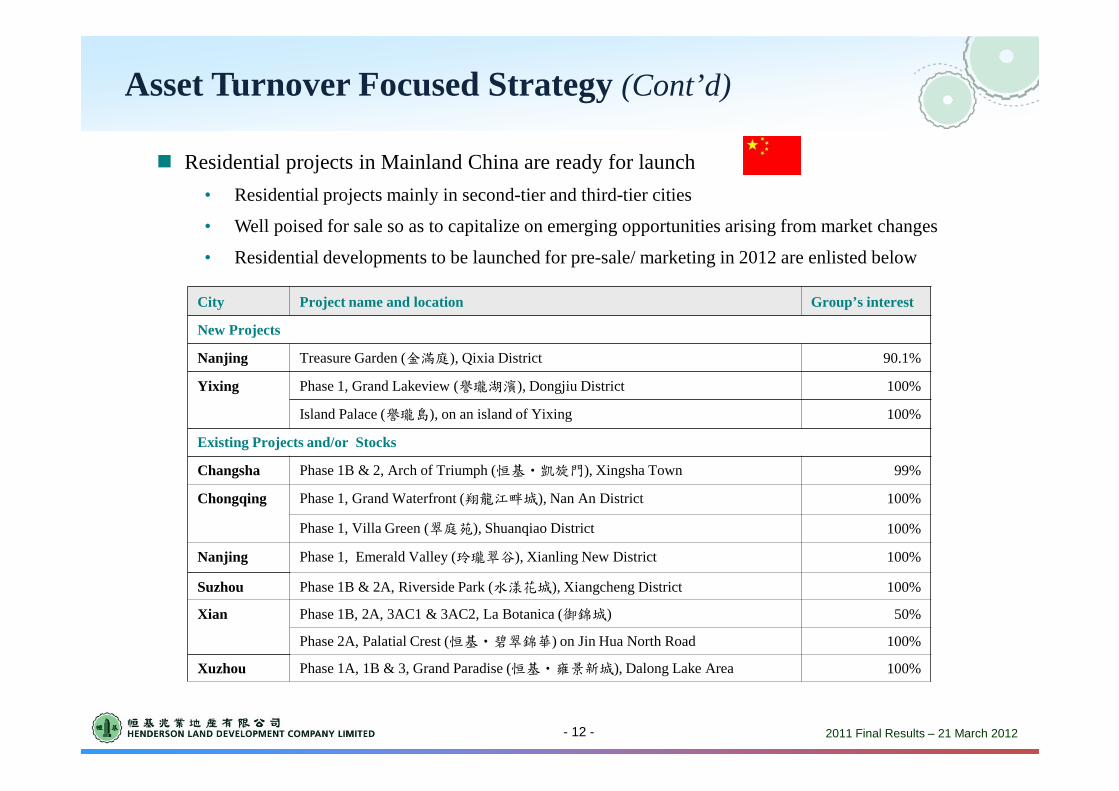
� Residential projects in Mainland China are ready for launch
• Residential projects mainly in second-tier and third-tier cities
• Well poised for sale so as to capitalize on emerging opportunities arising from market changes
• Residential developments to be launched for pre-sale/ marketing in 2012 are enlisted below
- 12 -
Asset Turnover Focused Strategy (Cont’d)
City Project name and location Group’s interest
New Projects
Nanjing Treasure Garden (金滿庭), Qixia District 90.1%
Yixing Phase 1, Grand Lakeview (譽瓏湖濱), Dongjiu District 100%
Island Palace (譽瓏島), on an island of Yixing 100%
Existing Projects and/or Stocks
Changsha Phase 1B & 2, Arch of Triumph (恒基‧凱旋門), Xingsha Town 99%
Chongqing Phase 1, Grand Waterfront (翔龍江畔城), Nan An District 100%
Phase 1, Villa Green (翠庭苑), Shuanqiao District 100%
Nanjing Phase 1, Emerald Valley (玲瓏翠谷), Xianling New District 100%
Suzhou Phase 1B & 2A, Riverside Park (水漾花城), Xiangcheng District 100%
Xian Phase 1B, 2A, 3AC1 & 3AC2, La Botanica (御錦城) 50%
Phase 2A, Palatial Crest (恒基‧碧翠錦華) on Jin Hua North Road 100%
Xuzhou Phase 1A, 1B & 3, Grand Paradise (恒基‧雍景新城), Dalong Lake Area 100%
2011 Final Results – 21 March 2012
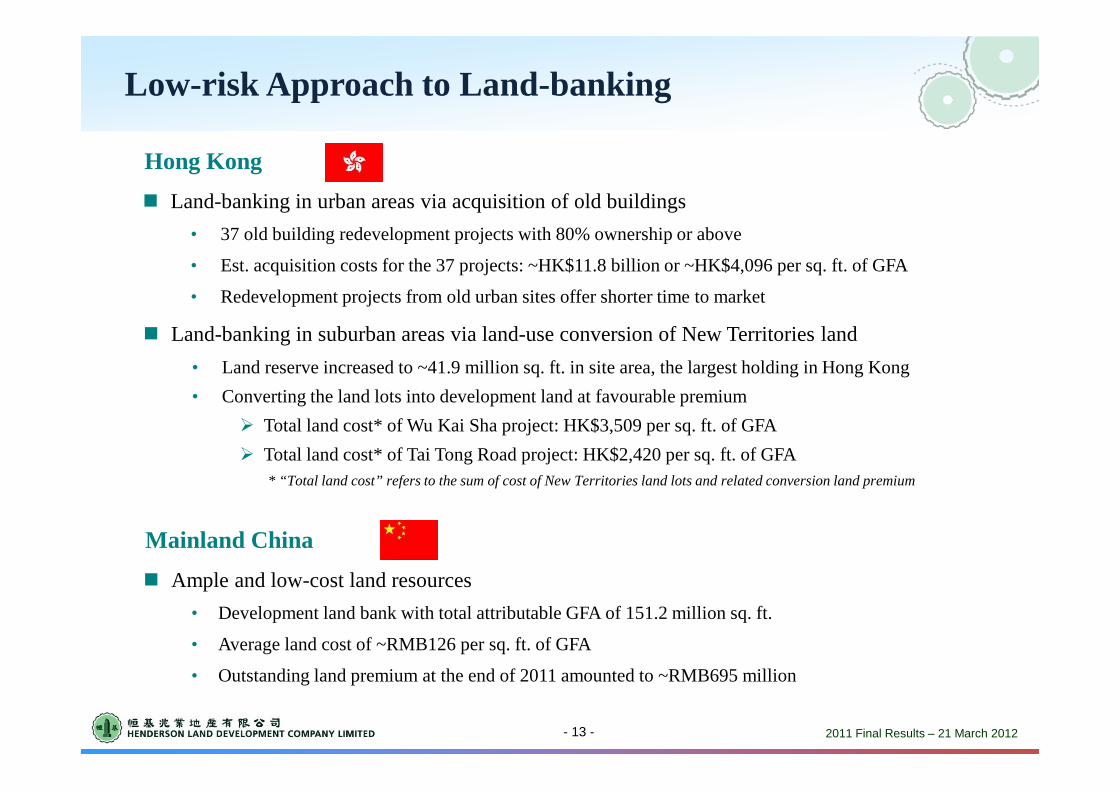
Low-risk Approach to Land-banking
- 13 -
� Land-banking in urban areas via acquisition of old buildings
• 37 old building redevelopment projects with 80% ownership or above
• Est. acquisition costs for the 37 projects: ~HK$11.8 billion or ~HK$4,096 per sq. ft. of GFA
• Redevelopment projects from old urban sites offer shorter time to market
* “Total land cost” refers to the sum of cost of New Territories land lots and related conversion land premium
� Land-banking in suburban areas via land-use conversion of New Territories land
• Land reserve increased to ~41.9 million sq. ft. in site area, the largest holding in Hong Kong
• Converting the land lots into development land at favourable premium
� Total land cost* of Wu Kai Sha project: HK$3,509 per sq. ft. of GFA
� Total land cost* of Tai Tong Road project: HK$2,420 per sq. ft. of GFA
Hong Kong
� Ample and low-cost land resources
• Development land bank with total attributable GFA of 151.2 million sq. ft.
• Average land cost of ~RMB126 per sq. ft. of GFA
• Outstanding land premium at the end of 2011 amounted to ~RMB695 million
Mainland China

2011 Final Results – 21 March 2012
Low-risk Approach to Land-banking (Cont’d)
� Good progress made on acquisition of old buildings in urban areas in Hong Kong
• Totally 37 old building projects with 80% ownership or above, including 13 projects with 100% ownership
• Acquisition continues for another 47 projects with ownership of below 80%
• Total of 84 projects can potentially provide total attributable GFA of ~8.0 million sq. ft. for redevelopment upon completion of acquisition
- 14 -
0 1,000 2,000 3,000 4,000 5,000 6,000
below 80%
80% or above &<100%
100% (321,434 sq. ft.)
(1,454,105 sq. ft.)
(5,472,970 sq. ft.)
Expected Attributable GFA for Future Redevelopment (‘000 sq. ft.)
Ownership Acquired
6 projects
17 projects
Progress of Old Building Acquisitions in Urban Areas in 2011
45 projects
Represents the status as at the end of 2010
13 projects
24 projects
47 projects
(948,529 sq. ft.)
(1,932,328 sq. ft.)
(5,161,878 sq. ft.)
Represent the status as at the end of 2011

2011 Final Results – 21 March 2012
� Land-banking in suburban areas in Hong Kong via New Territories land conversion
(million sq. ft.) Land Area
North East New Territories New Development Areas 5.1
Hung Shui Kiu New Development Area 4.0
Total: 9.1
• Land reserve increased to ~41.9 million sq. ft. in site area, the largest holding in Hong Kong (end of 2010: ~40.6 million sq. ft.)
• Included in such land reserve are sites in “North East New Territories New Development Areas” and “Hung Shui Kiu New Development Area” as designated by the Government
- 15 -
Low-risk Approach to Land-banking (Cont’d)
• The latest planning application of the wetland restoration and residential development in Wo Shang Wai, Yuen Long with total GFA of about 895,000 sq. ft. has been approved
− Corresponding land-use conversion application is in progress

2011 Final Results – 21 March 2012
Rising Rental Income from Investment Properties
*All the above figures represent the Group’s attributable share of contributions (before taxation) from investment properties held by subsidiaries, JCEs and associates.
� Completed investment property portfolio
• Hong Kong: ~9.2 million sq. ft.
• Mainland China: ~6.5 million sq. ft.
- 16 -
Leasing BusinessGross Rental
Income*Y-o-Y
ChangeNet Rental Income* Y-o-Y
Change
For the six months ended 30 June 2011
Hong Kong HK$2,351 million +11% HK$1,747 million +15%
Mainland China HK$ 418 million +107% HK$ 235 million +155%
Overall HK$2,769 million +19% HK$1,982 million +23%
For the year ended 31 December 2011
Hong Kong HK$4,889 million +11% HK$3,585 million +15%
Mainland China HK$ 916 million +91% HK$ 584 million +149%
Overall HK$5,805 million +19% HK$4,169 million +25%

2011 Final Results – 21 March 2012
� Strong leasing demand in Hong Kong
• Average occupancy rate of major investment properties in Hong Kong at the end of December 2011: ~ 97% (end of 2010: ~ 95%)
� Increased rental income from mainland China driven by
• Higher rental income contribution from newly completed properties
- 17 -
Property Committed
Occupancy Rate as at 31 Dec 2011
Gross Rental Income for 2011
Y-o-YChange
World Financial Centre, Beijing ~ 90% HK$330 million +170%
Henderson Metropolitan, Shanghai ~ 97% HK$156 million N/A
Rising Rental Income from Investment Properties (Cont’d)

2011 Final Results – 21 March 2012
Continuing Growth from Hong Kong & China Gas (“HKCG”)
� Sole supplier of piped gas in Hong Kong with 1,750,553 customers
� Largest city-gas enterprise in mainland China with ~ 13.2 million gas customers
• Largest controlling shareholder of Towngas China Company Limited (stock code: 1083), with a 66.18% interest
• Inclusive of Towngas China’s projects, HKCG had 138 projects, 18 more than that in 2010, spread across mainland China encompassing natural gas, water supply and wastewater treatment, natural gas filling stations and emerging environmentally-friendly energy sectors as of 31 December 2011
� Total Issued Shares: ~7,901 million shares � Market Capitalization: ~HK$142,210 million � Shareholders’ Equity: ~HK$41,584 million� 39.88% owned by Henderson Land – largest controlling shareholder
HKCG At A Glance (as of 31 December 2011)
� Profit after taxation attributable to shareholders for 2011 (audited): HK$6,150 million, up 10% y-o-y mainly due to growth in profit of mainland businesses
- 18 -
� Total profit and dividends declared for 2011 attributable to HLD amounted to about HK$2,452 million and HK$1,654 million respectively
• Towngas China’s profit after taxation attributable to its shareholders for 2011 amounted to HK$709 million, up 63% y-o-y

2011 Final Results – 21 March 2012
Continuing Growth from Hong Kong & China Gas (“HKCG”)
- 19 -
22.43
13.47 14.2312.35
19.38
12.35
6.155.869.27
4.30 5.18 5.59
0
5
10
15
20
25
2006 2007 2008 2009 2010 2011
4,148
1,928 2,121 2,333 2,5142,285
0
1,000
2,000
3,000
4,000
5,000
2006 2007 2008 2009 2010 2011
1,002
736 742828
911911
0
500
1,000
1,500
2006 2007 2008 2009 2010 2011
Dividend Declared by HKCG# HKCG Dividends Received by HLD^
HKCG Revenue & Profit Attributable to Shareholders#
HK$ M HK$ M
HK$ B
*
#Data for the years ended 31 December. * Included approximately HK$1,383 million of special dividend for celebrating HKCG’s 150th Anniversary in 2012.
^Dividends received during the years ended 30 June.
Revenue Profit Attributable to Shareholders
2011 Final Results – 21 March 2012
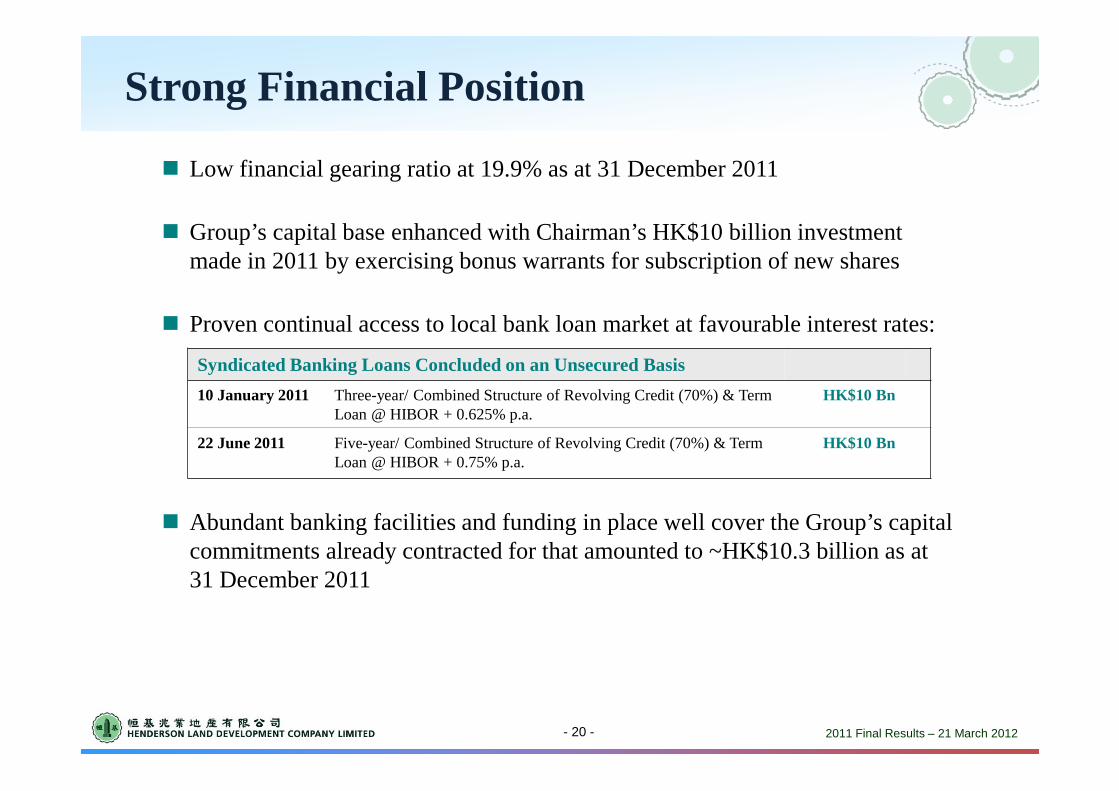
� Low financial gearing ratio at 19.9% as at 31 December 2011
� Group’s capital base enhanced with Chairman’s HK$10 billion investment made in 2011 by exercising bonus warrants for subscription of new shares
� Proven continual access to local bank loan market at favourable interest rates:
� Abundant banking facilities and funding in place well cover the Group’s capital commitments already contracted for that amounted to ~HK$10.3 billion as at 31 December 2011
Strong Financial Position
- 20 -
Syndicated Banking Loans Concluded on an Unsecured Basis
10 January 2011 Three-year/ Combined Structure of Revolving Credit (70%) & Term Loan @ HIBOR + 0.625% p.a.
HK$10 Bn
22 June 2011 Five-year/ Combined Structure of Revolving Credit (70%) & Term Loan @ HIBOR + 0.75% p.a.
HK$10 Bn
2011 Final Results – 21 March 2012
Strong Financial Position (Cont’d)
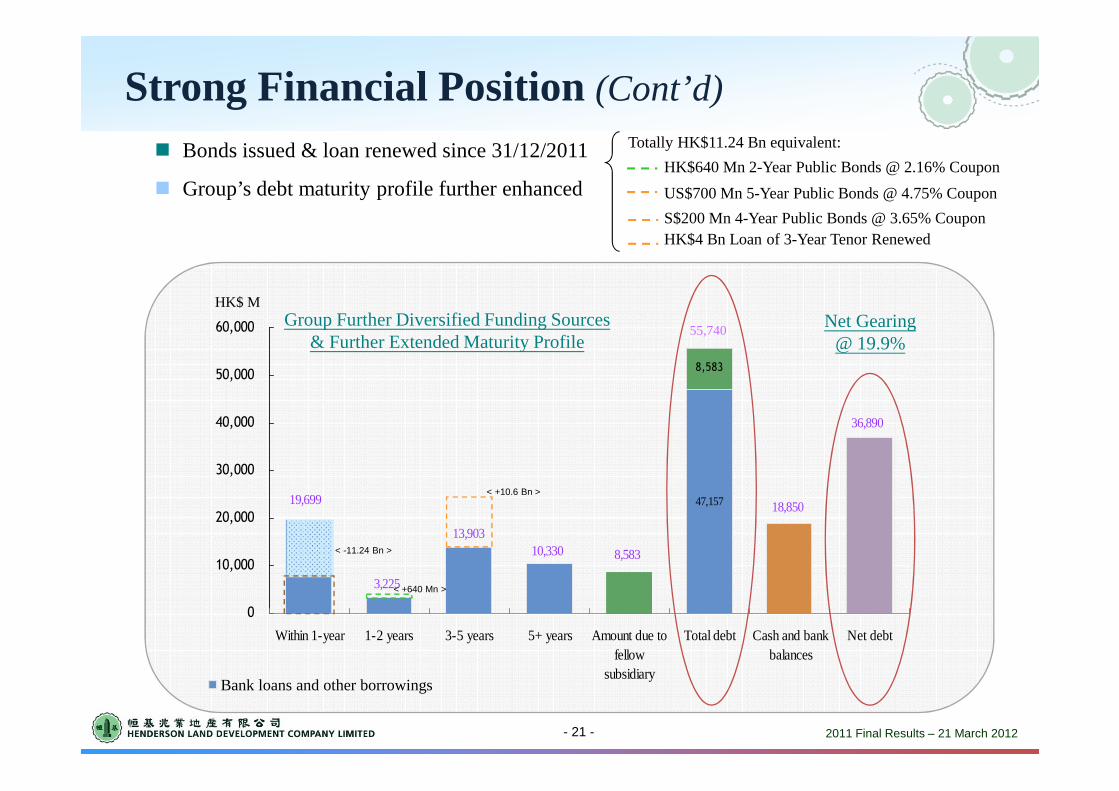
8,583
47,157
36,890
18,850
8,58310,33013,903
3,225
19,699
0
10,000
20,000
30,000
40,000
50,000
60,000
Within 1-year 1-2 years 3-5 years 5+ years Amount due tofellow
subsidiary
Total debt Cash and bankbalances
Net debt
Bank loans and other borrowings
- 21 -
HK$ M
55,740
� Bonds issued & loan renewed since 31/12/2011
� Group’s debt maturity profile further enhanced
Totally HK$11.24 Bn equivalent:
HK$640 Mn 2-Year Public Bonds @ 2.16% Coupon
US$700 Mn 5-Year Public Bonds @ 4.75% Coupon
S$200 Mn 4-Year Public Bonds @ 3.65% CouponHK$4 Bn Loan of 3-Year Tenor Renewed
Group Further Diversified Funding Sources & Further Extended Maturity Profile
Net Gearing@ 19.9%
< -11.24 Bn >
< +640 Mn >
< +10.6 Bn >
2011 Final Results – 21 March 2012
Strong Financial Position (Cont’d)
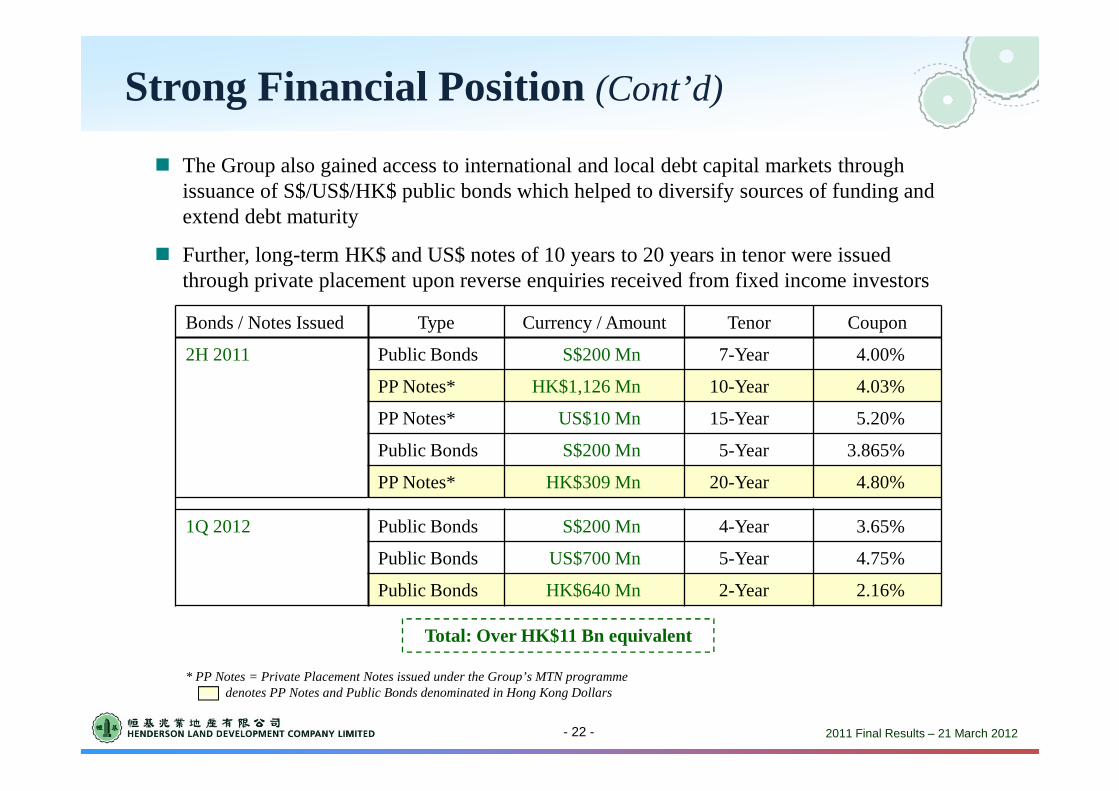
� The Group also gained access to international and local debt capital markets through issuance of S$/US$/HK$ public bonds which helped to diversify sources of funding and extend debt maturity
� Further, long-term HK$ and US$ notes of 10 years to 20 years in tenor were issued through private placement upon reverse enquiries received from fixed income investors
Bonds / Notes Issued Type Currency / Amount Tenor Coupon
2H 2011 Public Bonds S$200 Mn 7-Year 4.00%
PP Notes* HK$1,126 Mn 10-Year 4.03%
PP Notes* US$10 Mn 15-Year 5.20%
Public Bonds S$200 Mn 5-Year 3.865%
PP Notes* HK$309 Mn 20-Year 4.80%
1Q 2012 Public Bonds S$200 Mn 4-Year 3.65%
Public Bonds US$700 Mn 5-Year 4.75%
Public Bonds HK$640 Mn 2-Year 2.16%
* PP Notes = Private Placement Notes issued under the Group’s MTN programmedenotes PP Notes and Public Bonds denominated in Hong Kong Dollars
Total: Over HK$11 Bn equivalent
- 22 -
2011 Final Results – 21 March 2012
Prospects
- 23 -
Gearing Up for New Launches
� The Group remains optimistic about the prospects for property market given growing housing demand from both mainland and local residents and the expected extension of the low interest rate environment
� Two sizeable developments, Lok Wo Sha, Wu Kai Sha project (Phase 1) and Tai Tong, Yuen Long will be put up for sale in 2012
� Strong cross-border spending by mainland shoppers and business expansion by overseas companies will fuel further rental growth
Hong Kong
� Gradual completion of new commercial projects will increase the Group’s rental income
� Group’s overall rental income for 2012 is set to grow considerably
� Property market is restrained by policy measures which would be adjusted in line with changes in external environment – no significant changes are expected in first half of 2012
� A slight relaxation of monetary policy is likely to happen with general price level contained within a reasonable range that could have a profound impact on the market
� Group’s projects are well-poised for sale so as to capitalize on emerging opportunities arising from market changes
Mainland China

2011 Final Results – 21 March 2012
Annexes
Annex 1: Group Structure & Business Model
Annex 2: Operations in Hong Kong
2.1: Sale/ Pre-sale Schedule 2.1.1 – 2.1.2: Stocks and projects pending sale/ pre-sale for 2012
2.1.3 : Sale/ pre-sale schedule for 2013
2.1.4 – 2.1.7: Sale/ pre-sale schedule for 2014 or onwards
2.1.8 : Case study: urban redevelopment in Hong Kong
2.2: Rental Portfolio
Annex 3: Operations in Mainland China
3.1: Development Land-bank
3.2: Completion Schedule
3.2.1: Projects completed in 2011
3.2.2: Completion schedule for 2012
3.3: Rental Portfolio
2011 Final Results – 21 March 2012
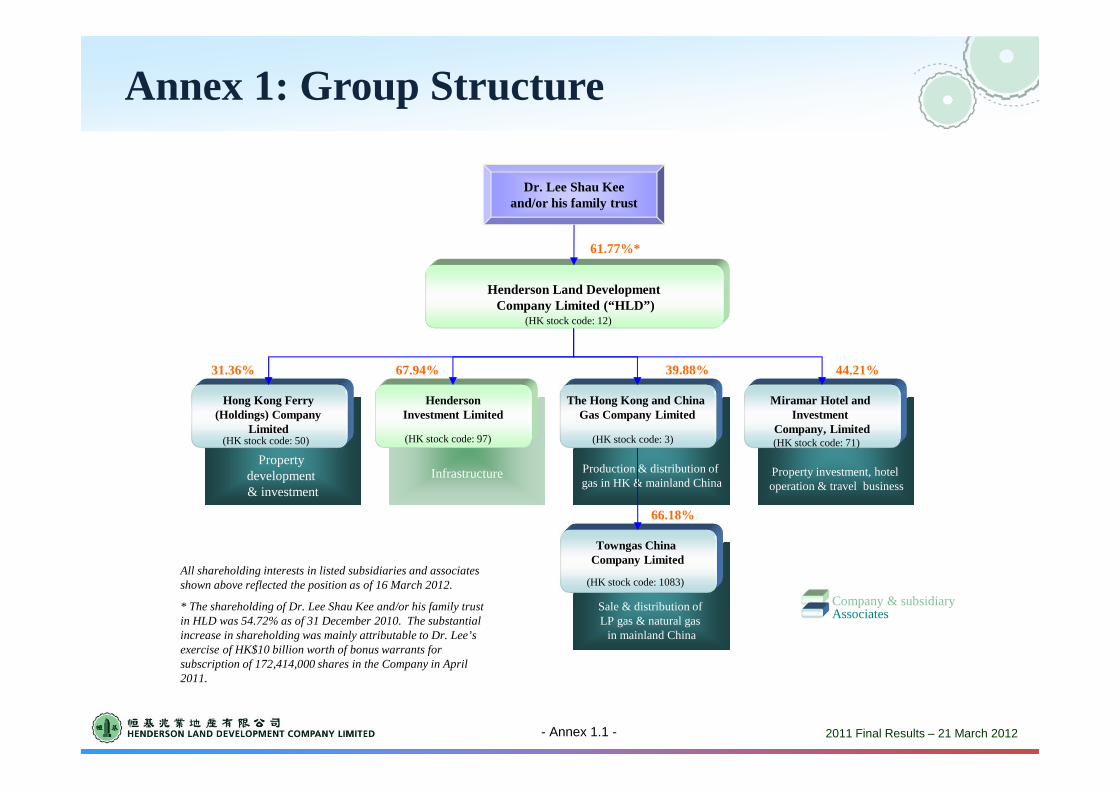
Annex 1: Group Structure
Sale & distribution of LP gas & natural gas
in mainland China
Property investment, hotel operation & travel business
Production & distribution of gas in HK & mainland China
InfrastructureProperty
development & investment
Henderson Land DevelopmentCompany Limited (“HLD”)
Hong Kong Ferry(Holdings) Company
Limited
31.36% 67.94% 39.88% 44.21%
HendersonInvestment Limited
The Hong Kong and China Gas Company Limited
Miramar Hotel and Investment
Company, Limited
Towngas China Company Limited
66.18%
Company & subsidiaryAssociates
Dr. Lee Shau Keeand/or his family trust
61.77%*
All shareholding interests in listed subsidiaries and associates shown above reflected the position as of 16 March 2012.
* The shareholding of Dr. Lee Shau Kee and/or his family trust in HLD was 54.72% as of 31 December 2010. The substantial increase in shareholding was mainly attributable to Dr. Lee’s exercise of HK$10 billion worth of bonus warrants for subscription of 172,414,000 shares in the Company in April 2011.
(HK stock code: 50) (HK stock code: 97) (HK stock code: 3) (HK stock code: 71)
(HK stock code: 1083)
(HK stock code: 12)
- Annex 1.1 -

2011 Final Results – 21 March 2012
Mainland China
Property development
business
Strategic investments
Property investment business
Hong Kong
� Property development business – consistent track record of development profit with large reserve of New Territories land in Hong Kong and sizeable development land bank in mainland China;
� Property investment business – stable rental income from investment property portfolio; and
� Strategic investments – steady revenue stream in form of share of profits from the three listed associates, in particular The Hong Kong and China Gas Company Limited
Annex 1: Business Model
� Diversified business mix: three pillars
- Annex 1.2 -
2011 Final Results – 21 March 2012
Annex 2.1: Sale/ Pre-sale Schedule in Hong Kong
- Annex 2.1.1 -
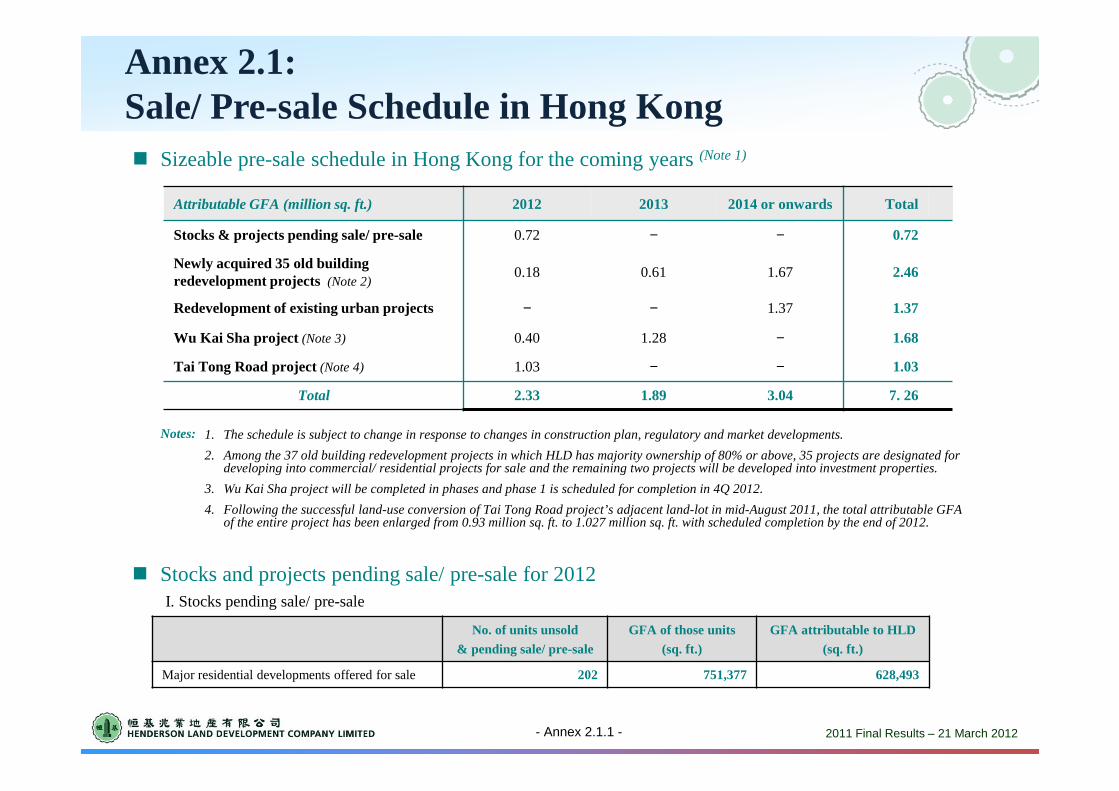
� Stocks and projects pending sale/ pre-sale for 2012
No. of units unsold
& pending sale/ pre-sale
GFA of those units
(sq. ft.)
GFA attributable to HLD
(sq. ft.)
Major residential developments offered for sale 202 751,377 628,493
I. Stocks pending sale/ pre-sale
� Sizeable pre-sale schedule in Hong Kong for the coming years (Note 1)
Attributable GFA (million sq. ft.) 2012 2013 2014 or onwards Total
Stocks & projects pending sale/ pre-sale 0.72 − − 0.72
Newly acquired 35 old building redevelopment projects (Note 2)
0.18 0.61 1.67 2.46
Redevelopment of existing urban projects − − 1.37 1.37
Wu Kai Sha project (Note 3) 0.40 1.28 − 1.68
Tai Tong Road project (Note 4) 1.03 − − 1.03
Total 2.33 1.89 3.04 7. 26
1. The schedule is subject to change in response to changes in construction plan, regulatory and market developments.
2. Among the 37 old building redevelopment projects in which HLD has majority ownership of 80% or above, 35 projects are designated for developing into commercial/ residential projects for sale and the remaining two projects will be developed into investment properties.
3. Wu Kai Sha project will be completed in phases and phase 1 is scheduled for completion in 4Q 2012.
4. Following the successful land-use conversion of Tai Tong Road project’s adjacent land-lot in mid-August 2011, the total attributable GFA of the entire project has been enlarged from 0.93 million sq. ft. to 1.027 million sq. ft. with scheduled completion by the end of 2012.
Notes:
2011 Final Results – 21 March 2012
Annex 2.1: Sale/ Pre-sale Schedule in Hong Kong
- Annex 2.1.2 -
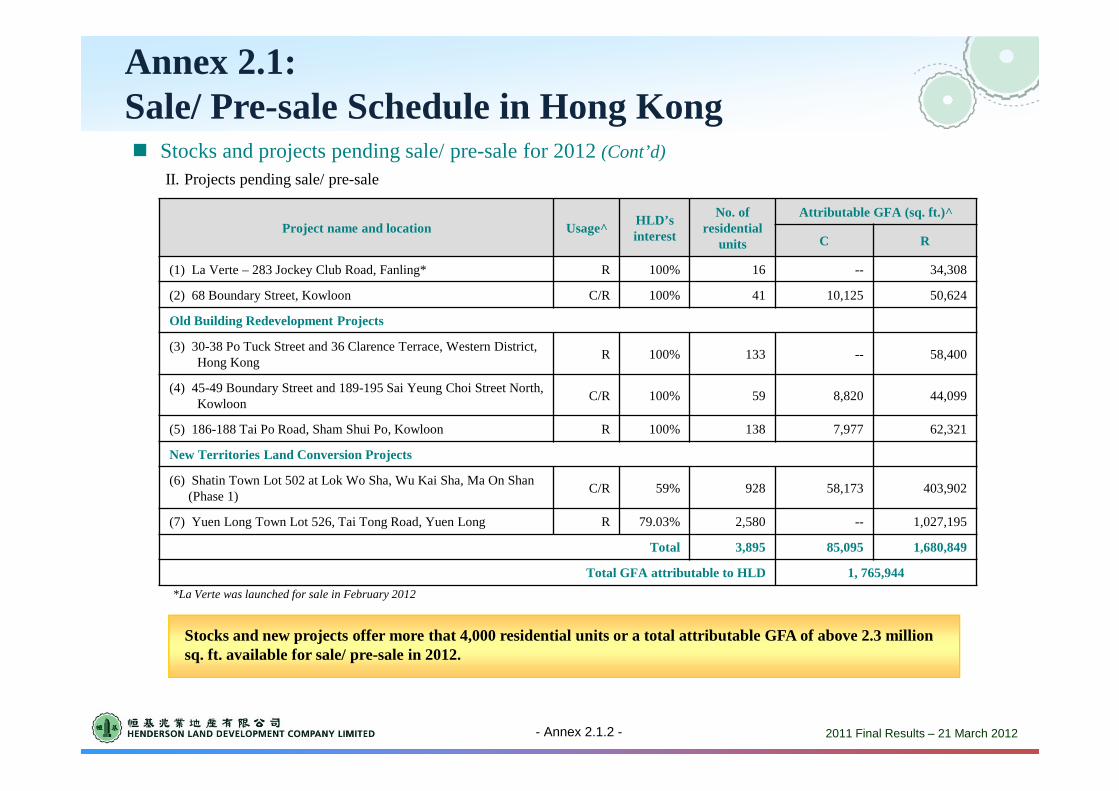
� Stocks and projects pending sale/ pre-sale for 2012 (Cont’d)
II. Projects pending sale/ pre-sale
Stocks and new projects offer more that 4,000 residential units or a total attributable GFA of above 2.3 million sq. ft. available for sale/ pre-sale in 2012.
Project name and location Usage^HLD’s interest
No. of residential
units
Attributable GFA (sq. ft.)^
C R
(1) La Verte – 283 Jockey Club Road, Fanling* R 100% 16 -- 34,308
(2) 68 Boundary Street, Kowloon C/R 100% 41 10,125 50,624
Old Building Redevelopment Projects
(3) 30-38 Po Tuck Street and 36 Clarence Terrace, Western District, Hong Kong
R 100% 133 -- 58,400
(4) 45-49 Boundary Street and 189-195 Sai Yeung Choi Street North, Kowloon
C/R 100% 59 8,820 44,099
(5) 186-188 Tai Po Road, Sham Shui Po, Kowloon R 100% 138 7,977 62,321
New Territories Land Conversion Projects
(6) Shatin Town Lot 502 at Lok Wo Sha, Wu Kai Sha, Ma On Shan (Phase 1)
C/R 59% 928 58,173 403,902
(7) Yuen Long Town Lot 526, Tai Tong Road, Yuen Long R 79.03% 2,580 -- 1,027,195
Total 3,895 85,095 1,680,849
Total GFA attributable to HLD 1, 765,944
*La Verte was launched for sale in February 2012

2011 Final Results – 21 March 2012
Annex 2.1: Sale/ Pre-sale Schedule in Hong Kong
- Annex 2.1.3 -
� Sale/ pre-sale schedule for 2013
Address Attr. site area
(sq. ft.)Expected attr. GFA in future
development (sq. ft.)
Old Building Redevelopment Projects (Note 1)
1 1-7A Gordon Road, North Point, Hong Kong (Note 2) 7,423 64,437
2 75-81 Sa Po Road, Kowloon City, Kowloon (Note 2) 3,582 32,219
3 186-198 Fuk Wing Street, Sham Shui Po, Kowloon(Note 2) 7,500 63,281
4 25 Robinson Road, Mid-Levels, Hong Kong(Note 2 & 3) 15,734 39,292
5 565-577 Fuk Wah Street, Cheung Sha Wan, Kowloon 7,560 63,788
6 62-72 Main Street, Ap Lei Chau, Hong Kong 5,973 50,771
7 89-95 Shek Pai Wan Road, Aberdeen, Hong Kong 3,300 28,050
8 11-33 Li Tak Street, Tai Kok Tsui, Kowloon (Note 2) 19,600 165,339
9 50-56 and 58-64 Ma Tau Kok Road and, 162-168 Pau Chung Street, To Kwa Wan, Kowloon (Note 2)
11,404 102,088
Sub-total 82,076 609,265
New Territories Land Conversion Projects
Shatin Town Lot 502 at Lok Wo Sha, Wu Kai Sha, Ma On Shan (other phases (except Phase 1))
331,929 1,278,814
Total 414,005 1,888,079
1. Completion of a redevelopment is generally expected to occur in the second year after the year of pre-sale.
2. Building plan already approved.
3. The Group holds a 50% stake in such redevelopment project.
Notes:
2011 Final Results – 21 March 2012
Annex 2.1: Sale/ Pre-sale Schedule in Hong Kong
- Annex 2.1.4 -
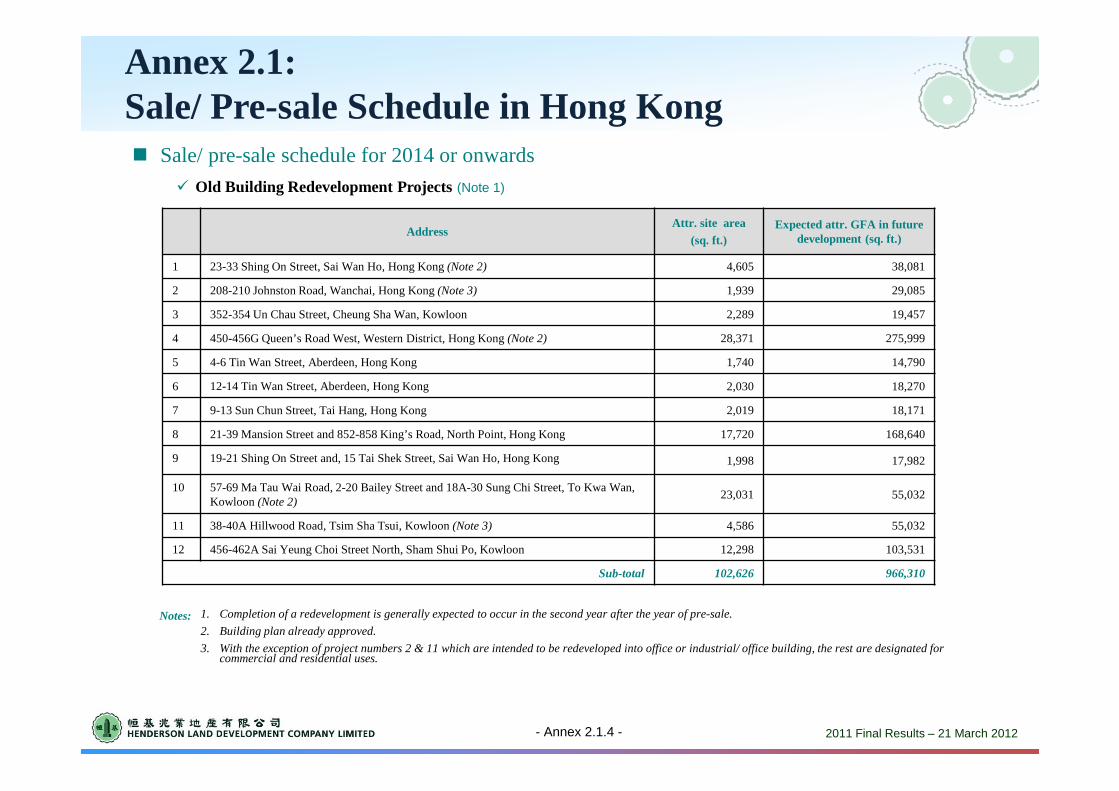
� Sale/ pre-sale schedule for 2014 or onwards
Address Attr. site area
(sq. ft.)Expected attr. GFA in future
development (sq. ft.)
1 23-33 Shing On Street, Sai Wan Ho, Hong Kong (Note 2) 4,605 38,081
2 208-210 Johnston Road, Wanchai, Hong Kong (Note 3) 1,939 29,085
3 352-354 Un Chau Street, Cheung Sha Wan, Kowloon 2,289 19,457
4 450-456G Queen’s Road West, Western District, Hong Kong (Note 2) 28,371 275,999
5 4-6 Tin Wan Street, Aberdeen, Hong Kong 1,740 14,790
6 12-14 Tin Wan Street, Aberdeen, Hong Kong 2,030 18,270
7 9-13 Sun Chun Street, Tai Hang, Hong Kong 2,019 18,171
8 21-39 Mansion Street and 852-858 King’s Road, North Point, Hong Kong 17,720 168,640
9 19-21 Shing On Street and, 15 Tai Shek Street, Sai Wan Ho, Hong Kong 1,998 17,982
10 57-69 Ma Tau Wai Road, 2-20 Bailey Street and 18A-30 Sung Chi Street, To Kwa Wan, Kowloon (Note 2)
23,031 55,032
11 38-40A Hillwood Road, Tsim Sha Tsui, Kowloon (Note 3) 4,586 55,032
12 456-462A Sai Yeung Choi Street North, Sham Shui Po, Kowloon 12,298 103,531
Sub-total 102,626 966,310
� Old Building Redevelopment Projects (Note 1)
1. Completion of a redevelopment is generally expected to occur in the second year after the year of pre-sale.
2. Building plan already approved.
3. With the exception of project numbers 2 & 11 which are intended to be redeveloped into office or industrial/ office building, the rest are designated for commercial and residential uses.
Notes:
2011 Final Results – 21 March 2012
Annex 2.1: Sale/ Pre-sale Schedule in Hong Kong
- Annex 2.1.5 -
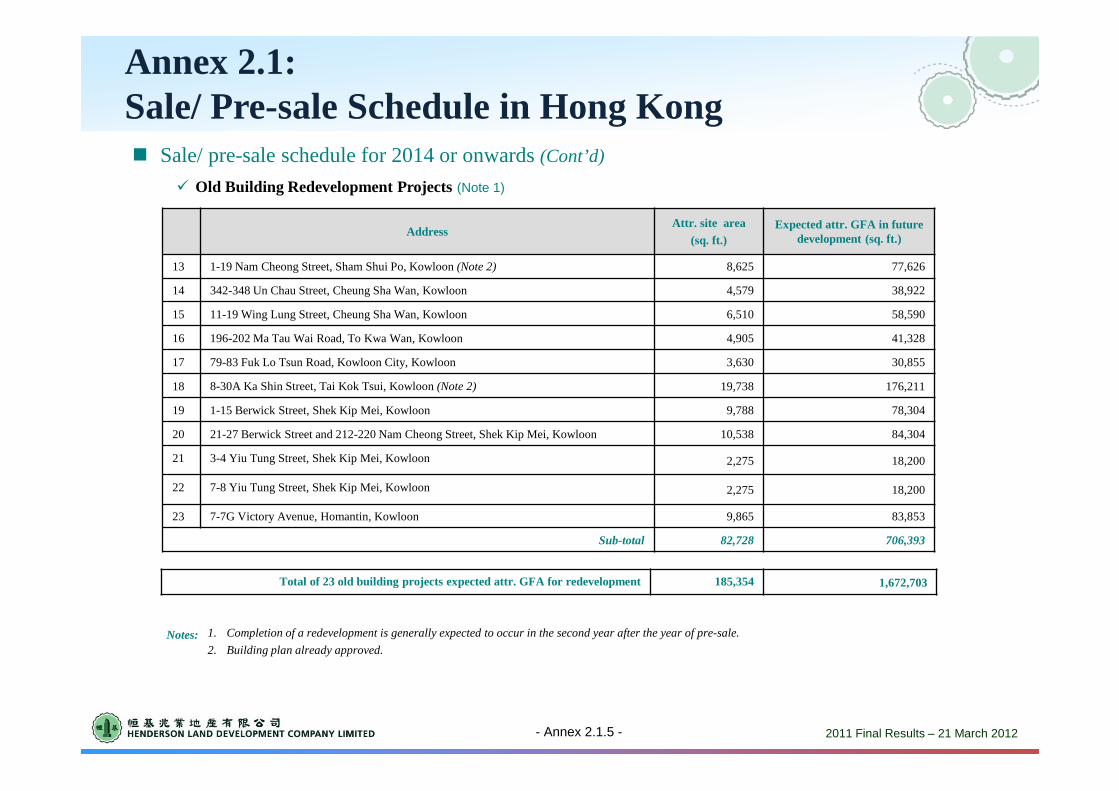
� Sale/ pre-sale schedule for 2014 or onwards (Cont’d)
Address Attr. site area
(sq. ft.)Expected attr. GFA in future
development (sq. ft.)
13 1-19 Nam Cheong Street, Sham Shui Po, Kowloon(Note 2) 8,625 77,626
14 342-348 Un Chau Street, Cheung Sha Wan, Kowloon 4,579 38,922
15 11-19 Wing Lung Street, Cheung Sha Wan, Kowloon 6,510 58,590
16 196-202 Ma Tau Wai Road, To Kwa Wan, Kowloon 4,905 41,328
17 79-83 Fuk Lo Tsun Road, Kowloon City, Kowloon 3,630 30,855
18 8-30A Ka Shin Street, Tai Kok Tsui, Kowloon (Note 2) 19,738 176,211
19 1-15 Berwick Street, Shek Kip Mei, Kowloon 9,788 78,304
20 21-27 Berwick Street and 212-220 Nam Cheong Street, Shek Kip Mei, Kowloon 10,538 84,304
21 3-4 Yiu Tung Street, Shek Kip Mei, Kowloon 2,275 18,200
22 7-8 Yiu Tung Street, Shek Kip Mei, Kowloon 2,275 18,200
23 7-7G Victory Avenue, Homantin, Kowloon 9,865 83,853
Sub-total 82,728 706,393
� Old Building Redevelopment Projects (Note 1)
1. Completion of a redevelopment is generally expected to occur in the second year after the year of pre-sale.
2. Building plan already approved.Notes:
Total of 23 old building projects expected attr. GFA for redevelopment 185,354 1,672,703

2011 Final Results – 21 March 2012
Annex 2.1: Sale/ Pre-sale Schedule in Hong Kong
- Annex 2.1.6 -
� Sale/ pre-sale schedule for 2014 or onwards (Cont’d)
Address Site area(sq. ft.)
Expected GFA in future development
(sq. ft.)
HLD’s interest
Expected attributable GFA in future
development (sq. ft.)
1 19-21 Wong Chuk Hang Road, Hong Kong 14,298 214,467 50% 107,233
2 45-47 Pottinger Street and Ezra’s Lane, Central, Hong Kong 9,067 94,190 19.095% 17,986
3 25 La Salle Road, Kowloon Tong, Kowloon (Note 1) 13,467 24,175 100% 24,175
4 29 Lugard Road, The Peak, Hong Kong 23,653 11,824 100% 11,824
5 8 Wang Kwong Road, Kowloon Bay, Kowloon (Note 2) 21,528 174,789 100% 174,789
6 14-30 King Wah Road, North Point, Hong Kong 37,566 224,828 100% 224,828
7 Yau Tong Bay, Kowloon 878,962 4,394,808 18.4357% 810,214
Sub-total 998,541 5,199,830 -- 1,431,798
1. The site was previously held by the Group as a serviced apartment building.
2. The existing industrial building (i.e. Big Star Centre) at this site is planned to be redeveloped into an office tower with an enlarged gross floor area of about 258,000 sq. ft. However, such land-use conversion plan is still subject to the Government’s approval.
Notes:
� Existing Urban Projects
Total expected attr. GFA for pre-sale/ sale in 2014 or onwards 3,043,752

2011 Final Results – 21 March 2012
Annex 2.1: Sale/ Pre-sale Schedule in Hong Kong
- Annex 2.1.7 -
District / AreaLand area
(sq. ft.)Expected attributable GFA in future development (sq. ft.)
1. Hong Kong
• Central & Western 135,127 1,019,429
• Island East 62,283 593,874
• Causeway Bay 30,368 296,265
• Aberdeen 19,247 172,339
• Wanchai 8,084 72,756
Sub-total: 255,109 2,154,663
2. Kowloon
• Hung Hom 121,750 1,095,750
• Tai Kok Tsui 97,136 837,526
• Homantin 64,650 517,383
• Tsim Sha Tsui 39,483 373,289
• Sham Shui Po 20,363 183,267
Sub-total: 343,382 3,007,215
Total: 598,491 5,161,878
� With estimated total attributable GFA of ~5.16 million sq. ft. for redevelopment
� Acquisition of another 47 old building projects in urban areas in progress

2011 Final Results – 21 March 2012
Case Study: Urban Redevelopment in Hong Kong
Acquisition costs of old building redevelopment projects compare favourably with transacted prices of land sites at public auctions, generating a higher profit margin
� Case study – The Gloucester, a luxurious residential redevelopment project in Wanchai
• Fully consolidated ownership by order of the court in August 2008: average land cost of ~HK$6,446 per sq. ft.
• Launched for pre-sale in April 2011 with over 90% of units sold: average selling price of above HK$21,000 per sq. ft.
• Scheduled for completion by the end of 2012
- Annex 2.1.8 -
2011 Final Results – 21 March 2012- 21 -
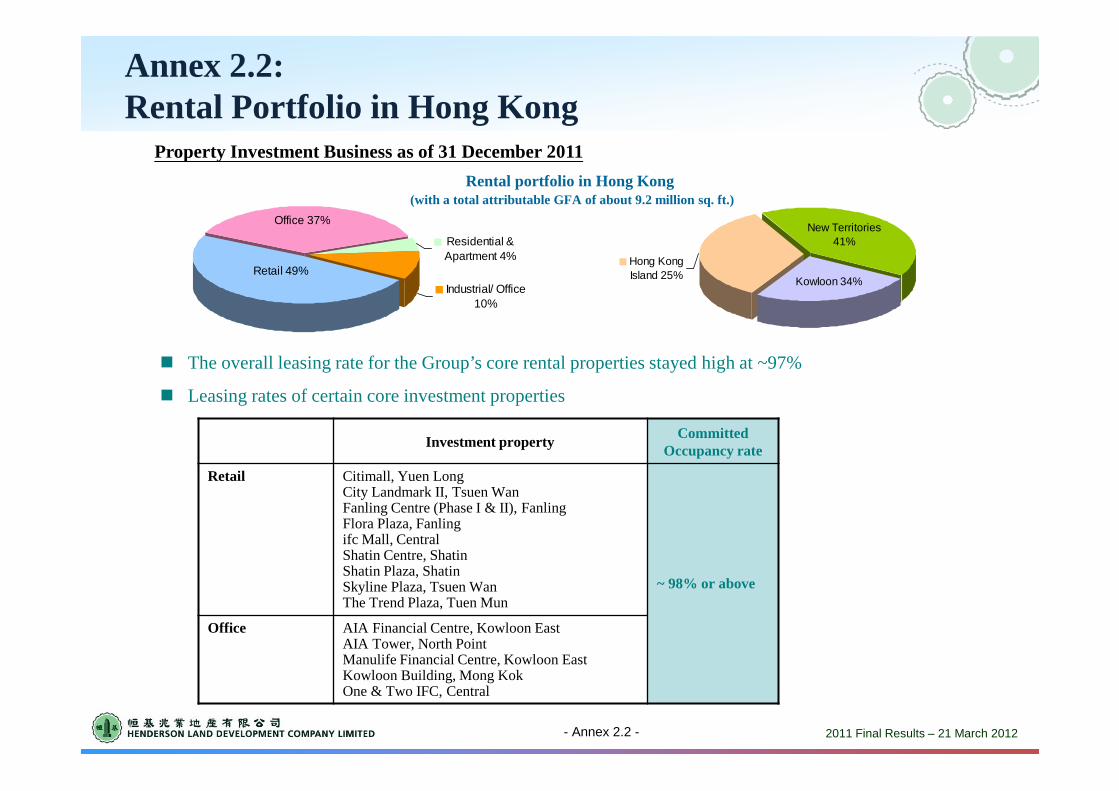
Property Investment Business as of 31 December 2011
� Leasing rates of certain core investment properties
Investment propertyCommitted
Occupancy rate
Retail Citimall, Yuen LongCity Landmark II, Tsuen WanFanling Centre (Phase I & II), FanlingFlora Plaza, Fanling ifc Mall, CentralShatin Centre, ShatinShatin Plaza, ShatinSkyline Plaza, Tsuen Wan The Trend Plaza, Tuen Mun
~ 98% or above
Office AIA Financial Centre, Kowloon EastAIA Tower, North PointManulife Financial Centre, Kowloon EastKowloon Building, Mong KokOne & Two IFC, Central
Annex 2.2: Rental Portfolio in Hong Kong
Rental portfolio in Hong Kong
Industrial/ Office10%
Residential &Apartment 4%
Office 37%
Retail 49%
(with a total attributable GFA of about 9.2 million sq. ft.)
New Territories41%
Hong KongIsland 25% Kowloon 34%
� The overall leasing rate for the Group’s core rental properties stayed high at ~97%
- Annex 2.2 -

2011 Final Results – 21 March 2012- 24 -
No. of Projects
Attributable GFA*(mn sq. ft.)
1 Shanghai 2 1.1
2 Guangzhou 4 14.2
3 Anshan, Liaoning 2 17.9
4 Changsha, Hunan 2 14.5
5 Chengdu, Sichuan 1 4.0
6 Chongqing 2 6.0
7 Dalian, Liaoning 2 10.3
8 Fuzhou, Fujian 1 1.7
9 Nanjing, Jiangsu 3 3.4
10 Shenyang, Liaoning 2 17.3
11 Suzhou, Jiangsu 2 17.0
12 Tieling, Liaoning 2 8.7
13 Xian, Shaanxi 2 20.1
14 Xuzhou, Jiangsu 1 5.3
15 Yixing, Jiangsu 2 9.7
TOTAL at 31 Dec 2011 30 151.2
TOTAL at 31 Dec 2010 28 150.4
Prime cities:15.3 mn sq. ft.
2nd-tier cities:135.9 mn sq. ft.
A “ Two-pronged” strategyLand bank as of 31 December 2011
Annex 3.1: Development Land-bank in Mainland China
*Excluding basement areas and car parking spaces
- Annex 3.1 -
Jiangsu
1
2
3
4
7
9
5 6
14
12
13
15 11
8
10
Sichuan
Shaanxi
Chongqing
Hunan
Guangdong
Shanghai
Liaoning
Fujian
2011 Final Results – 21 March 2012
#Excluding basement areas and car parking spaces
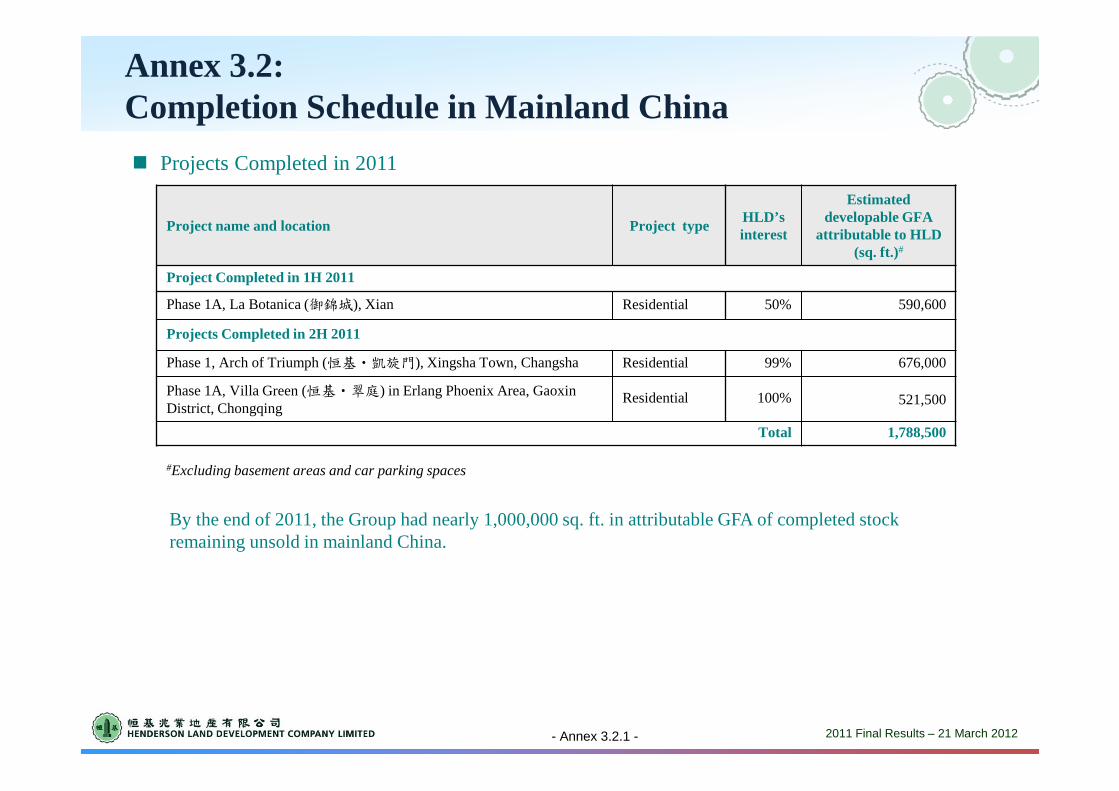
Annex 3.2: Completion Schedule in Mainland China
- Annex 3.2.1 -
Project name and location Project typeHLD’s interest
Estimated developable GFA
attributable to HLD (sq. ft.)#
Project Completed in 1H 2011
Phase 1A, La Botanica (御錦城), Xian Residential 50% 590,600
Projects Completed in 2H 2011
Phase 1, Arch of Triumph (恒基‧凱旋門), Xingsha Town, Changsha Residential 99% 676,000
Phase 1A, Villa Green (恒基‧翠庭) in Erlang Phoenix Area, GaoxinDistrict, Chongqing
Residential 100% 521,500
Total 1,788,500
� Projects Completed in 2011
By the end of 2011, the Group had nearly 1,000,000 sq. ft. in attributable GFA of completed stock remaining unsold in mainland China.

2011 Final Results – 21 March 2012
Annex 3.2: Completion Schedule in Mainland China (Cont’d)
- Annex 3.2.2 -
� Completion schedule for 2012
#Excluding basement areas and car parking spaces
*Greentech Tower was completed in January 2012
Project name and location Project typeHLD’s interest
Estimated developable GFA
attributable to HLD (sq. ft.)#
Greentech Tower, 147 Tianmu Road West, Zhabei District, Shanghai* Office & Retail 100% 410,000
Phase 1A, Palatial Crest (恒基‧碧翠錦華) on Jin Hua North Road, Xian Residential 100% 560,000
Phase 2A & 1B, La Botanica (御錦城), Xian Residential 50% 1,460,000
Phase 1A, Riverside Park (水漾花城), Xiangcheng District, Suzhou Residential 100% 713,000
Phase 1, Grand Waterfront (翔龍江畔城), Nan An District, Chongqing Residential 100% 1,113,000
Phase 1, Golden Riverside (金河灣), Puhe New District Development, Shenyang Residential 100% 289,000
Phase 1A, Grand Paradise (恒基‧雍景新城), Dalong Lake Area, Xuzhou Residential 100% 689,000
Total 5,234,000

2011 Final Results – 21 March 2012
Annex 3.3: Rental Portfolio in Mainland China
Project Name Beijing Henderson Centre
World Financial Centre
Grand Gateway Office Tower II
Skycity Centro Henderson Metropolitan
Hengbao Plaza
Location Beijing Beijing Shanghai Shanghai Shanghai Shanghai Guangzhou
HLD’s interest 100% 100% 100% 100% 100% 100% 100%
Usage Retail Office & Retail Office Retail Office & Retail Office & Retail Retail
Acquisition Yr 1993 1994 1997 1992 1992 2007 1995
Completion Yr 1997 2009 2005 1998 2010 2010 2001
GFA^ 1,130,000 sq. ft. 2,170,000 sq. ft. 690,000 sq. ft. 380,000 sq. ft. 510,000 sq. ft. 980,000 sq. ft. 930,000 sq. ft.
• Office -- 1,990,000 sq. ft. 690,000 sq. ft. -- 370,000 sq. ft. 420,000 sq. ft. --
• Retail 890,000 sq. ft. 140,000 sq. ft -- 290,000 sq. ft. 70,000 sq. ft. 320,000 sq. ft. 700,000 sq. ft.
• Basement Retail Area
-- 40,000 sq. ft. -- -- -- 80,000 sq. ft. --
• Car parking 240,000 sq. ft. -- -- 90,000 sq. ft. 70,000 sq. ft. 160,000 sq. ft. 230,000 sq. ft.
Committed
Leasing Rate83% 90% 99% 100% 100% 97% 95%
^Including car parking spaces and basement retail area
Investment property portfolio in mainland China as of 31 December 2011
- Annex 3.3 -
2011 Final Results – 21 March 2012
Hong Kong Head Office Address: 71-76/F, Two International Finance Centre8 Finance Street, CentralHong KongTelephone: (852) 2908 8888Fax: (852) 2908 8838IR Contact: [email protected]: www.hld.com