2011 corn annual - the positive economic impact …2011 corn annual | page 3 corn refiners...
TRANSCRIPT
Th e Positive Th e Positive Economic Impact Economic Impact of Corn of Corn Wet MillingWet Milling
Th e Positive Th e Positive Economic Impact Economic Impact of Corn of Corn Wet MillingWet Milling
Corn Refiners Association 2011 Annual Report
2009 C o r n An n u A l
BOARD OF DIRECTORSAlan D. Willits, ChairmanCargill, Incorporated
Richard N. Kyle, Vice ChairmanCorn Products International, Inc.
Dennis C. RiddleArcher Daniels Midland Company
Mark A. BemisArcher Daniels Midland Company
Jeff A. CotterCargill, Incorporated
Terry W. ThomasCorn Products International, Inc.
Timothy M. KortemeyerPenford Products Co.
William C. WinetroubPenford Products Co.
Dominique D.P. TaretRoquette America, Inc.
Richard A. O’HaraRoquette America, Inc.
J. Patrick MohanTate & Lyle Americas
Matthew D. WineingerTate & Lyle Americas
STAFFAudrae EricksonPresident
David RosenthalSenior Vice President
David KnowlesDirector of Communications
Pat SaksDirector of Policy and Operations
Nancy KohlerAssistant Director for Policy and Operations
Shannon MarshallAssistant Director of Conferences and Meetings
Therese PompaSocial Media Manager
Victoria WodarcykSecretary
Cassandra KuballCommunications Assistant
DEDICATIOnThis edition of the Corn Annual is dedicated to the memory of Michael A. Urbanic, in appreciation of his leadership and commitment to the advancement of the corn wet milling industry.
2009 C o r n An n u A l
TABlE OF COnTEnTS
Foreword ...........................................................................................2Audrae Erickson, President, Corn Refiners Association
Corn Refining: Many Benefits from Adding Value to Our Most Versatile, Abundant, Adaptable Crop ............................3Senator Tom Harkin (D-IA) Chairman, Senate Health, Education, Labor, And Pensions Committee
The Impressive Economic Impact of Corn Wet Milling .....................5Alan D. Willits, Chairman, Corn Refiners Association
Corn Industry Statistics
Shipments of Products of the Corn Refining Industry – 2010 ...........2
World Corn Production, Consumption, and Stocks ..........................4
U.S. Corn Refining Industry at a Glance – 2010 ...............................5
Safety Program Award Winners .........................................................7
Corn: Food and Industrial Uses .........................................................8
Exports of Products from Corn – 2010 .............................................8
Corn for Grain: Acreage, Yield, and Production ................................9
Corn: Supply and Disappearance ....................................................10
U.S. Per Capita Sweetener Deliveries for Food and Beverage Use ..............................................................10
Corn Refiners Association Member Companies Products ................11
Corn Refiners Association Member Companies Domestic and International Plant Locations ....................................12
2011 C o r n An n u A l | P A g e 2
C o r n r e f i n e r s As s o C i At i o n
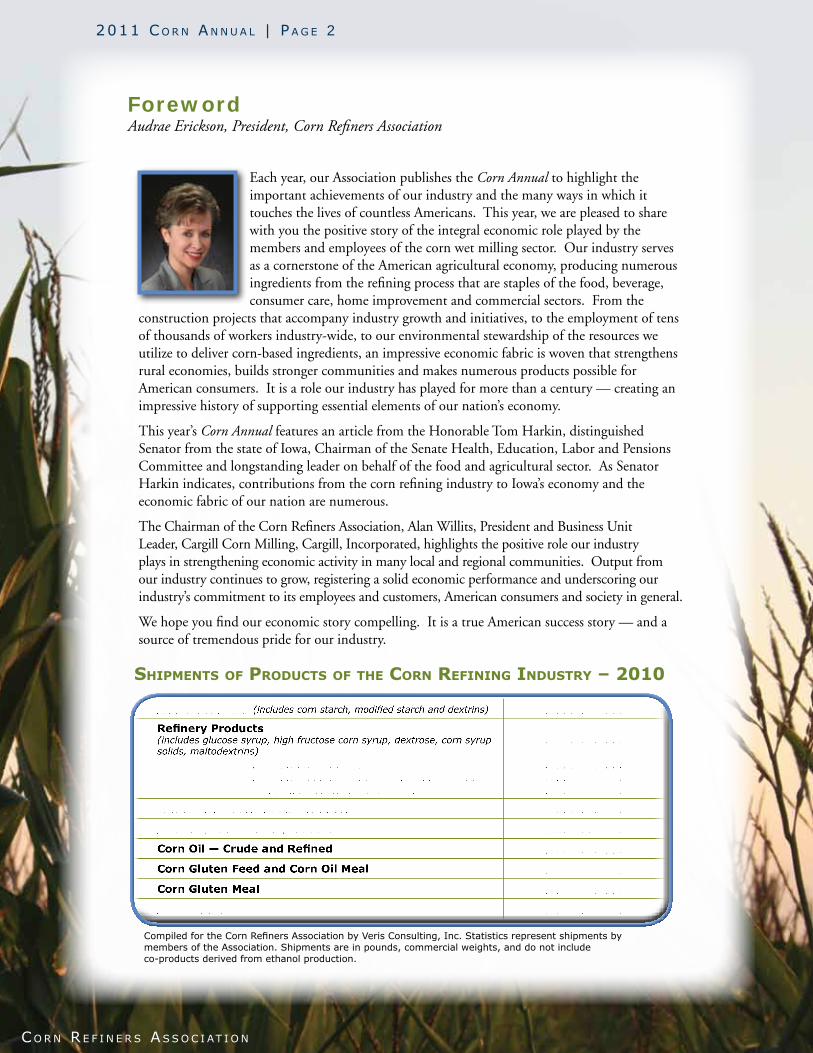
ForewordAudrae Erickson, President, Corn Refiners Association
Each year, our Association publishes the Corn Annual to highlight the important achievements of our industry and the many ways in which it touches the lives of countless Americans. This year, we are pleased to share with you the positive story of the integral economic role played by the members and employees of the corn wet milling sector. Our industry serves as a cornerstone of the American agricultural economy, producing numerous ingredients from the refining process that are staples of the food, beverage, consumer care, home improvement and commercial sectors. From the
construction projects that accompany industry growth and initiatives, to the employment of tens of thousands of workers industry-wide, to our environmental stewardship of the resources we utilize to deliver corn-based ingredients, an impressive economic fabric is woven that strengthens rural economies, builds stronger communities and makes numerous products possible for American consumers. It is a role our industry has played for more than a century — creating an impressive history of supporting essential elements of our nation’s economy.
This year’s Corn Annual features an article from the Honorable Tom Harkin, distinguished Senator from the state of Iowa, Chairman of the Senate Health, Education, Labor and Pensions Committee and longstanding leader on behalf of the food and agricultural sector. As Senator Harkin indicates, contributions from the corn refining industry to Iowa’s economy and the economic fabric of our nation are numerous.
The Chairman of the Corn Refiners Association, Alan Willits, President and Business Unit Leader, Cargill Corn Milling, Cargill, Incorporated, highlights the positive role our industry plays in strengthening economic activity in many local and regional communities. Output from our industry continues to grow, registering a solid economic performance and underscoring our industry’s commitment to its employees and customers, American consumers and society in general.
We hope you find our economic story compelling. It is a true American success story — and a source of tremendous pride for our industry.
Compiled for the Corn Refiners Association by Veris Consulting, Inc. Statistics represent shipments by members of the Association. Shipments are in pounds, commercial weights, and do not include co-products derived from ethanol production.
ShipmentS of productS of the corn refining induStry – 2010
Starch Products (includes corn starch, modified starch and dextrins) 6,028,798,000
Refinery Products (includes glucose syrup, high fructose corn syrup, dextrose, corn syrup solids, maltodextrins)
High Fructose Corn Syrup 42%High Fructose Corn Syrup 55% and AboveTotal High Fructose Corn Syrup
29,946,712,000
8,289,227,00011,885,928,00020,175,155,000
Total — Domestic Basic Products 35,975,510,000
Total — Export Basic Products 5,028,841,000
Corn Oil — Crude and Refined 1,368,916,000
Corn Gluten Feed and Corn Oil Meal 10,748,153,000
Corn Gluten Meal 2,163,453,000
Steepwater 1,707,285,000

2011 C o r n An n u A l | P A g e 3
C o r n r e f i n e r s As s o C i At i o n
As an Iowan, I’ve known corn from my earliest memories and taken a lot of pride in Iowa’s longtime role as our nation’s leading corn-producing state. In fact, there is a corn field
just over the backyard fence at my home in Cumming, Iowa.
We Iowans pay a lot of attention to corn: how the crop in the field is coming along, what the elevator and futures prices are doing, and whether the harvest is on time and manageable or delayed and difficult. Still, it can be easy even for Iowans to overlook or take for granted the critically important contributions to our economy and our modern consumer products and way of life that are made by corn and all of the people involved in growing, processing, transporting and distributing corn and corn products.
Thanks to the productivity of corn growers and the many and varied uses of corn, it has long been the largest and most valuable crop in the United States, and of course in Iowa. According to current U.S. Department of Agriculture estimates, Iowa’s 2010 corn production of 2.2 billion bushels had a value of $11.7 billion, while the 12.4 billion bushels produced throughout our nation had a value of about $65 billion. Of the 2010 crop, the United States exported about 1.8 billion bushels, which contributed nearly $10 billion toward our balance of trade.
Those are big dollar figures themselves, but they are only the beginning. That is because as corn is utilized in our country its value is greatly enhanced, adding jobs, income and economic output along the way. About 40
percent of the U.S. corn crop, about five billion bushels, goes into producing our nation’s output of meat, milk, eggs and other animal products.
Most of the rest of the U.S. corn crop is utilized by the corn processing and refining industry. Ethanol production is the largest use, consuming about 40 percent of our nation’s corn crop, but it is critical to keep in mind that about 30 percent of the corn going into producing ethanol is returned in the form of byproducts that are valued for animal feed and a variety of other purposes.
Corn refining, or wet milling, uses about 14 percent of the corn crop to produce, in addition to ethanol, a very large number and wide variety of corn-derived products, materials and ingredients, which are incorporated into many consumer products and used in numerous industrial processes.
Consumers rely every day upon a multitude of products made from corn or derivatives of corn, although they often may have little idea of corn’s role in enhancing and improving their lives. Food products containing corn ingredients include jams, jellies, sauces, marinades, cereals, condiments, canned fruits and vegetables, baked goods, meat products like bologna and hot dogs, yogurts and snack items. Other daily staples that utilize corn-based ingredients are toothpaste, paper and paper products and soaps and cleaners.
Corn derivatives are also included or used in making a wide variety of other items such as starches, glucose, adhesives, antibiotics, pharmaceuticals, aspirin, automobiles, tires, cosmetics, crayons, paint, carpets, shoe polish, textiles, synthetic rubber and wallpaper.
Corn Refining: Many Benefits from Adding Value to Our Most Versatile, Abundant, Adaptable CropSenator Tom Harkin (D-IA) Chairman, Senate Health, Education, Labor, And Pensions Committee
2011 C o r n An n u A l | P A g e 4
C o r n r e f i n e r s As s o C i At i o n
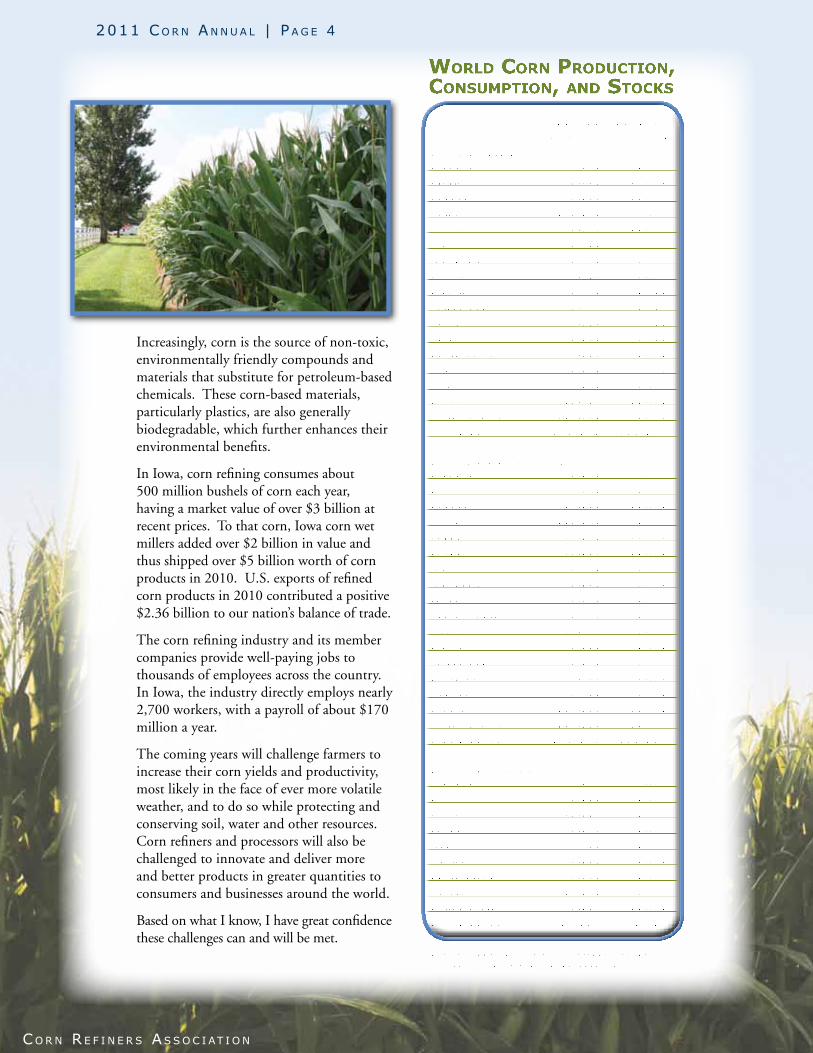
Increasingly, corn is the source of non-toxic, environmentally friendly compounds and materials that substitute for petroleum-based chemicals. These corn-based materials, particularly plastics, are also generally biodegradable, which further enhances their environmental benefits.
In Iowa, corn refining consumes about 500 million bushels of corn each year, having a market value of over $3 billion at recent prices. To that corn, Iowa corn wet millers added over $2 billion in value and thus shipped over $5 billion worth of corn products in 2010. U.S. exports of refined corn products in 2010 contributed a positive $2.36 billion to our nation’s balance of trade.
The corn refining industry and its member companies provide well-paying jobs to thousands of employees across the country. In Iowa, the industry directly employs nearly 2,700 workers, with a payroll of about $170 million a year.
The coming years will challenge farmers to increase their corn yields and productivity, most likely in the face of ever more volatile weather, and to do so while protecting and conserving soil, water and other resources. Corn refiners and processors will also be challenged to innovate and deliver more and better products in greater quantities to consumers and businesses around the world.
Based on what I know, I have great confidence these challenges can and will be met.
World Corn ProduCtion, ConsumPtion, and stoCks
2009/10 2010/11 (thousand metric tons)
Production Argentina 23,300 22,000Brazil 56,100 57,500Canada 9,561 11,714China 158,000 173,000EU-27 56,948 55,902India 16,720 21,280Indonesia 6,900 6,800Mexico 20,374 20,600Nigeria 8,759 8,700Philippines 6,231 7,271Russia 3,963 3,075Serbia 6,400 6,800South Africa 13,420 12,000Ukraine 10,486 11,919Vietnam 4,607 5,000Others 79,125 84,239United States 332,549 316,165World Total 813,443 823,965
Total Consumption Argentina 6,900 7,100Brazil 47,000 49,500Canada 11,606 11,300China 159,000 172,000Egypt 12,000 12,100EU-27 59,500 62,300India 15,100 18,300Indonesia 8,800 9,200Japan 16,300 15,600Korea, South 8,394 8,100Mexico 30,200 28,500Nigeria 8,600 8,800Philippines 6,500 7,200South Africa 10,300 10,600Ukraine 5,700 6,100Others 122,675 127,145United States 281,590 290,336World Total 816,690 843,563
Ending Stocks Argentina 892 1,302Brazil 9,989 9,989China 51,314 53,514EU-27 5,009 4,911Iran 2,795 2,345Mexico 1,389 1,389South Africa 5,169 4,094Others 23,959 23,394United States 43,380 23,360World Total 143,896 124,298
Source: USDA—Foreign Agricultural Service. Based on local marketing years in thousand metric tons.
2011 C o r n An n u A l | P A g e 5
C o r n r e f i n e r s As s o C i At i o n
The corn wet milling industry is an important component of America’s overall economic landscape. Through the simple act of adding value to America’s home grown resource — corn
— a web of economic activity is spun that impacts local and regional communities and contributes to the overall productive output of our nation’s economy. But take a closer look and you will see that an industry that seems almost invisible to the average American is hard at work churning out corn-based ingredients that make everyday products found in our nation’s grocery stores, home improvement centers, consumer care retail outlets and several other industries possible.
Providing Secure Jobs to Americans
Corn wet milling puts tens of thousands of Americans to work through direct employment, and increases the total workforce in numerous other sectors through the purchase of hundreds of input materials
and investment in local infrastructure projects, including transportation, construction and water treatment facilities.
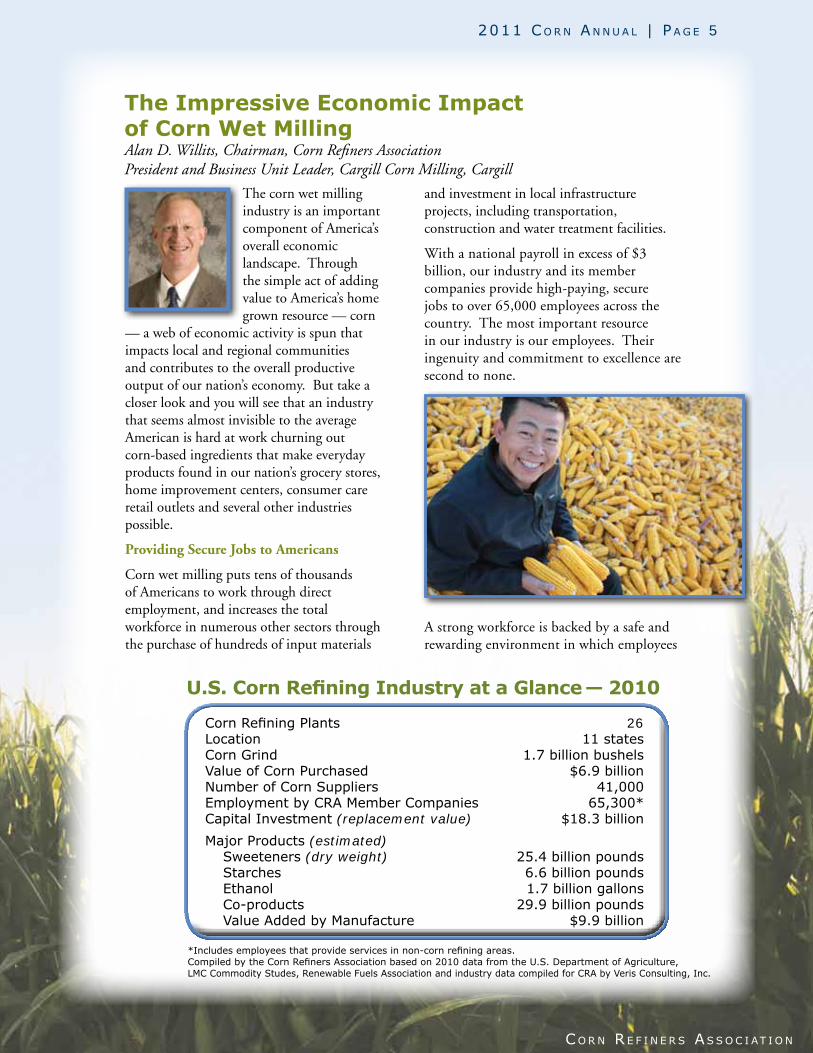
With a national payroll in excess of $3 billion, our industry and its member companies provide high-paying, secure jobs to over 65,000 employees across the country. The most important resource in our industry is our employees. Their ingenuity and commitment to excellence are second to none.
A strong workforce is backed by a safe and rewarding environment in which employees
The Impressive Economic Impact of Corn Wet Milling Alan D. Willits, Chairman, Corn Refiners AssociationPresident and Business Unit Leader, Cargill Corn Milling, Cargill
Corn Refining Plants 26Location 11 statesCorn Grind 1.7 billion bushelsValue of Corn Purchased $6.9 billionNumber of Corn Suppliers 41,000Employment by CRA Member Companies 65,300*Capital Investment (replacement value) $18.3 billion
Major Products (estimated)Sweeteners (dry weight) 25.4 billion poundsStarches 6.6 billion poundsEthanol 1.7 billion gallonsCo-products 29.9 billion poundsValue Added by Manufacture $9.9 billion
*Includes employees that provide services in non-corn refining areas. Compiled by the Corn Refiners Association based on 2010 data from the U.S. Department of Agriculture, LMC Commodity Studes, Renewable Fuels Association and industry data compiled for CRA by Veris Consulting, Inc.
U.S. Corn Refining Industry at a Glance— 2010
2011 C o r n An n u A l | P A g e 6
C o r n r e f i n e r s As s o C i At i o n
thrive. The industry is committed to implementing safety programs that go above and beyond government regulations to ensure the safety of employees. Strong health and continuing education programs not only benefit employees, but also have a positive impact on local communities through further job creation and support of higher education institutions.
Contributing American Products to the Global Economy
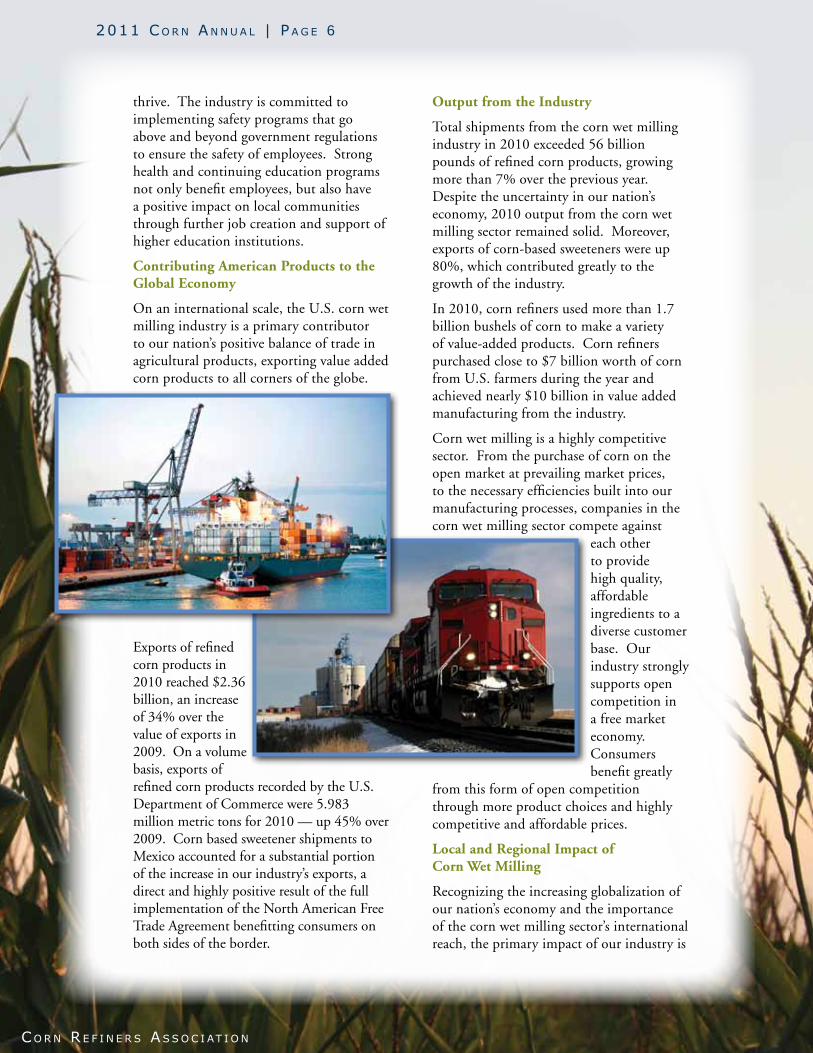
On an international scale, the U.S. corn wet milling industry is a primary contributor to our nation’s positive balance of trade in agricultural products, exporting value added corn products to all corners of the globe.
Exports of refined corn products in 2010 reached $2.36 billion, an increase of 34% over the value of exports in 2009. On a volume basis, exports of refined corn products recorded by the U.S. Department of Commerce were 5.983 million metric tons for 2010 — up 45% over 2009. Corn based sweetener shipments to Mexico accounted for a substantial portion of the increase in our industry’s exports, a direct and highly positive result of the full implementation of the North American Free Trade Agreement benefitting consumers on both sides of the border.
Output from the Industry
Total shipments from the corn wet milling industry in 2010 exceeded 56 billion pounds of refined corn products, growing more than 7% over the previous year. Despite the uncertainty in our nation’s economy, 2010 output from the corn wet milling sector remained solid. Moreover, exports of corn-based sweeteners were up 80%, which contributed greatly to the growth of the industry.
In 2010, corn refiners used more than 1.7 billion bushels of corn to make a variety of value-added products. Corn refiners purchased close to $7 billion worth of corn from U.S. farmers during the year and achieved nearly $10 billion in value added manufacturing from the industry.
Corn wet milling is a highly competitive sector. From the purchase of corn on the open market at prevailing market prices, to the necessary efficiencies built into our manufacturing processes, companies in the corn wet milling sector compete against
each other to provide high quality, affordable ingredients to a diverse customer base. Our industry strongly supports open competition in a free market economy. Consumers benefit greatly
from this form of open competition through more product choices and highly competitive and affordable prices.
Local and Regional Impact of Corn Wet Milling
Recognizing the increasing globalization of our nation’s economy and the importance of the corn wet milling sector’s international reach, the primary impact of our industry is
2011 C o r n An n u A l | P A g e 7
C o r n r e f i n e r s As s o C i At i o n
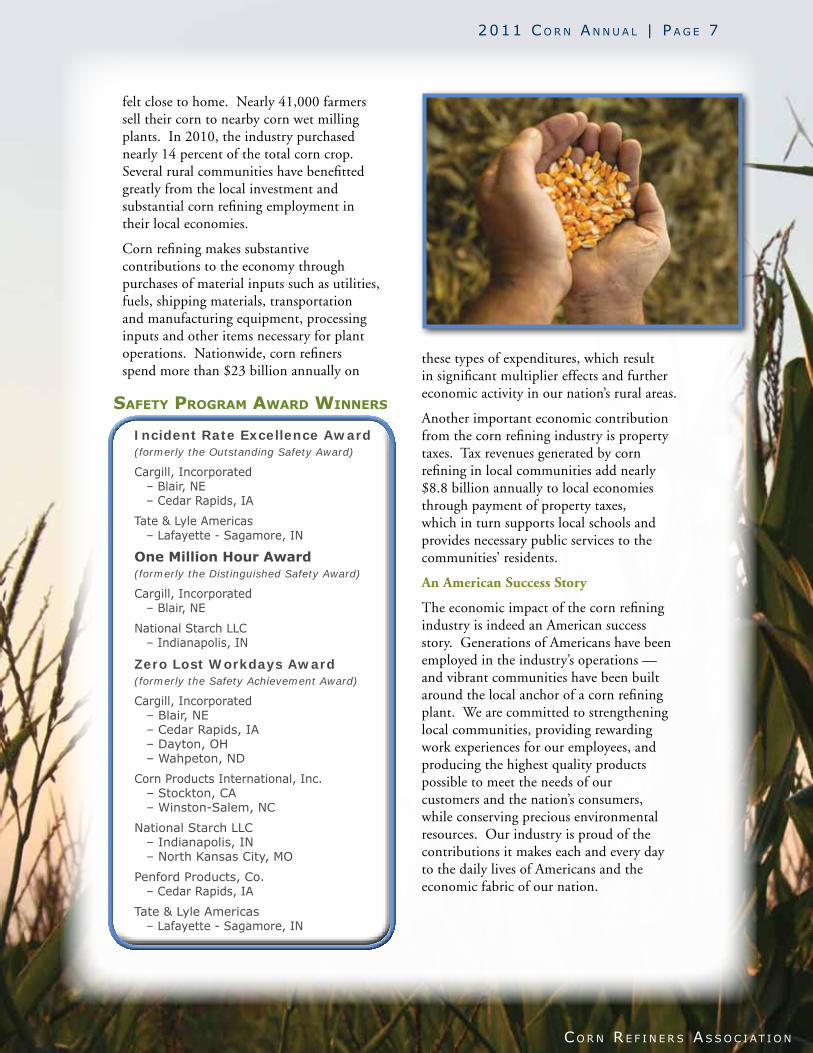
felt close to home. Nearly 41,000 farmers sell their corn to nearby corn wet milling plants. In 2010, the industry purchased nearly 14 percent of the total corn crop. Several rural communities have benefitted greatly from the local investment and substantial corn refining employment in their local economies.
Corn refining makes substantive contributions to the economy through purchases of material inputs such as utilities, fuels, shipping materials, transportation and manufacturing equipment, processing inputs and other items necessary for plant operations. Nationwide, corn refiners spend more than $23 billion annually on
these types of expenditures, which result in significant multiplier effects and further economic activity in our nation’s rural areas.
Another important economic contribution from the corn refining industry is property taxes. Tax revenues generated by corn refining in local communities add nearly $8.8 billion annually to local economies through payment of property taxes, which in turn supports local schools and provides necessary public services to the communities’ residents.
An American Success Story
The economic impact of the corn refining industry is indeed an American success story. Generations of Americans have been employed in the industry’s operations — and vibrant communities have been built around the local anchor of a corn refining plant. We are committed to strengthening local communities, providing rewarding work experiences for our employees, and producing the highest quality products possible to meet the needs of our customers and the nation’s consumers, while conserving precious environmental resources. Our industry is proud of the contributions it makes each and every day to the daily lives of Americans and the economic fabric of our nation.
Safety program award winnerS
Incident Rate Excellence Award(formerly the Outstanding Safety Award)
Cargill, Incorporated– Blair, NE– Cedar Rapids, IA
Tate & Lyle Americas – Lafayette - Sagamore, IN
One Million Hour Award (formerly the Distinguished Safety Award)
Cargill, Incorporated– Blair, NE
National Starch LLC– Indianapolis, IN
Zero lost Workdays Award (formerly the Safety Achievement Award)
Cargill, Incorporated– Blair, NE– Cedar Rapids, IA– Dayton, OH– Wahpeton, ND
Corn Products International, Inc.– Stockton, CA– Winston-Salem, NC
National Starch LLC– Indianapolis, IN – North Kansas City, MO
Penford Products, Co. – Cedar Rapids, IA
Tate & Lyle Americas – Lafayette - Sagamore, IN
2011 C o r n An n u A l | P A g e 8
C o r n r e f i n e r s As s o C i At i o n
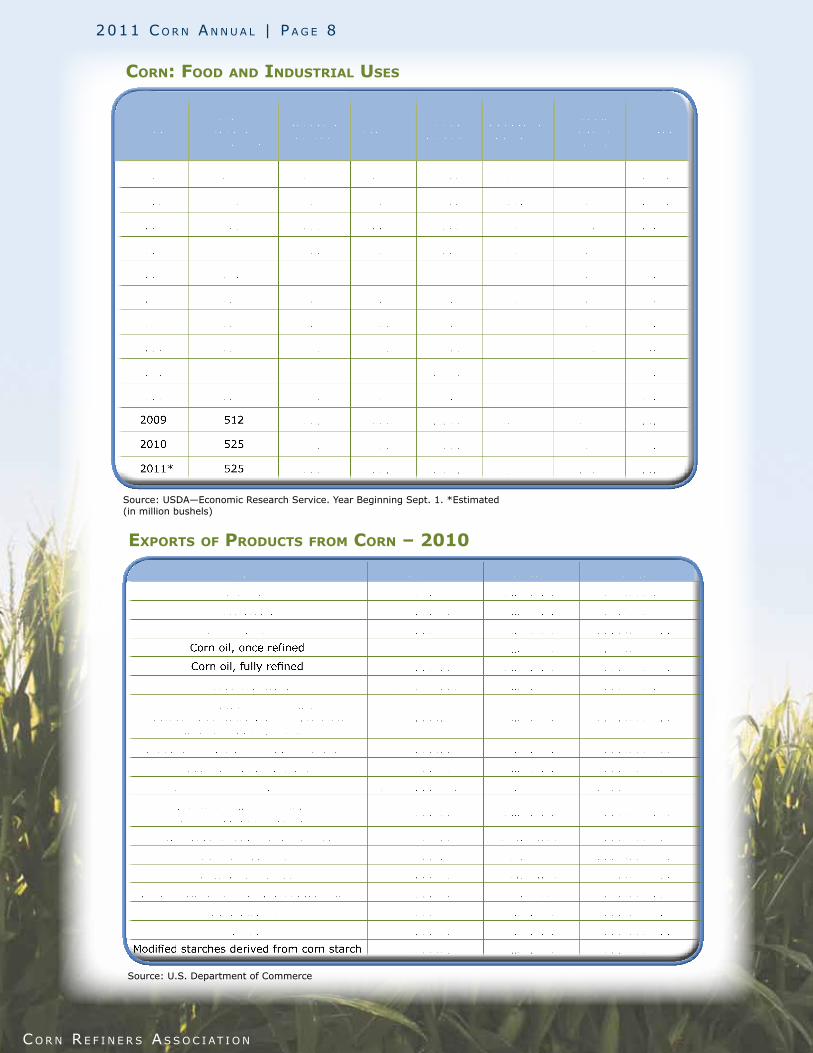
Product Volume Units Value
Corn meal 179,211,841 Kilograms $71,860,010
Corn starch 161,861,721 Kilograms $79,229,116
Corn oil, crude 187,598,147 Kilograms $186,119,596
Corn oil, once refined 20,714,158 Kilograms $22,025,617
Corn oil, fully refined 123,006,454 Kilograms $135,488,470
Glucose (dextrose) 110,949,567 Kilograms $63,867,075
Glucose syrup not containing fructose or containing in the dry state
less than 20% fructose427,095,248 Kilograms $173,262,487
Glucose syrup with 20–50% fructose 201,978,174 Kilograms $60,545,157
Chemically pure fructose 63,201,248 Kilograms $53,901,147
Fructose syrup with 50%+ fructose 1,315,261,657 Kilograms $416,552,139
Fructose solids containing more than 50% fructose 17,306,706 Kilograms $33,520,968
Bran, sharps, and other residues 177,234 Metric tons $23,727,595
Corn gluten feed 1,155,249 Metric tons $161,102,118
Corn gluten meal 699,287 Metric tons $419,890,793
Other residues of starch manufacturing 330,551 Metric tons $75,207,894
Corn oil cake 455,140,629 Kilograms $108,172,485
Dextrins 31,995,993 Kilograms $25,882,683
Modified starches derived from corn starch 322,906,009 Kilograms $250,550,314
exportS of productS from corn – 2010
Source: U.S. Department of Commerce
corn: food and induStrial uSeS
Source: USDA—Economic Research Service. Year Beginning Sept. 1. *Estimated (in million bushels)
YearHigh
Fructose Corn Syrup
Glucose & Dextrose Starch Fuel
AlcoholBeverage Alcohol
Cereals & Other Products
Total
1995 473 227 226 396 125 161 1,608
2000 536 227 250 630 130 185 1,958
2001 542 227 249 707 131 186 2,042
2002 532 231 258 996 131 187 2,335
2003 530 238 273 1,168 132 187 2,528
2004 525 234 282 1,323 133 189 2,687
2005 545 245 280 1,603 135 190 2,999
2006 535 259 277 2,119 136 190 3,517
2007 523 256 265 3,049 135 192 4,420
2008 489 245 234 3,709 134 192 5,003
2009 512 257 250 4,591 134 194 5,939
2010 525 270 260 5,020 135 197 6,407
2011* 525 265 260 5,000 135 202 6,387
2011 C o r n An n u A l | P A g e 9
C o r n r e f i n e r s As s o C i At i o n
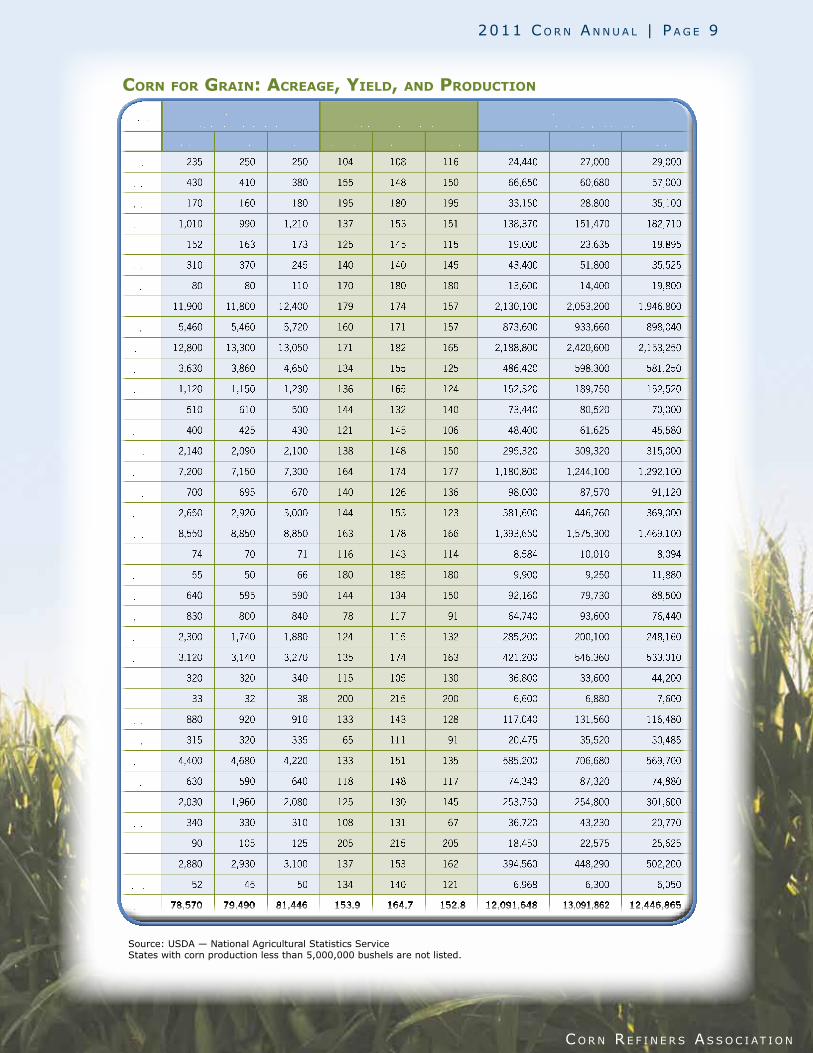
corn for grain: acreage, yield, and production
State Area Harvested(thousand acres)
Yield(bushels per acre)
Production (thousand bushels)
2008 2009 2010 2008 2009 2010 2008 2009 2010
AL 235 250 250 104 108 116 24,440 27,000 29,000
AR 430 410 380 155 148 150 66,650 60,680 57,000
CA 170 160 180 195 180 195 33,150 28,800 35,100
CO 1,010 990 1,210 137 153 151 138,370 151,470 182,710
DE 152 163 173 125 145 115 19,000 23,635 19,895
GA 310 370 245 140 140 145 43,400 51,800 35,525
ID 80 80 110 170 180 180 13,600 14,400 19,800
IL 11,900 11,800 12,400 179 174 157 2,130,100 2,053,200 1,946,800
IN 5,460 5,460 5,720 160 171 157 873,600 933,660 898,040
IA 12,800 13,300 13,050 171 182 165 2,188,800 2,420,600 2,153,250
KS 3,630 3,860 4,650 134 155 125 486,420 598,300 581,250
KY 1,120 1,150 1,230 136 165 124 152,320 189,750 152,520
LA 510 610 500 144 132 140 73,440 80,520 70,000
MD 400 425 430 121 145 106 48,400 61,625 45,580
MI 2,140 2,090 2,100 138 148 150 295,320 309,320 315,000
MN 7,200 7,150 7,300 164 174 177 1,180,800 1,244,100 1,292,100
MS 700 695 670 140 126 136 98,000 87,570 91,120
MO 2,650 2,920 3,000 144 153 123 381,600 446,760 369,000
NE 8,550 8,850 8,850 163 178 166 1,393,650 1,575,300 1,469,100
NJ 74 70 71 116 143 114 8,584 10,010 8,094
NM 55 50 66 180 185 180 9,900 9,250 11,880
NY 640 595 590 144 134 150 92,160 79,730 88,500
NC 830 800 840 78 117 91 64,740 93,600 76,440
ND 2,300 1,740 1,880 124 115 132 285,200 200,100 248,160
OH 3,120 3,140 3,270 135 174 163 421,200 546,360 533,010
OK 320 320 340 115 105 130 36,800 33,600 44,200
OR 33 32 38 200 215 200 6,600 6,880 7,600
PA 880 920 910 133 143 128 117,040 131,560 116,480
SC 315 320 335 65 111 91 20,475 35,520 30,485
SD 4,400 4,680 4,220 133 151 135 585,200 706,680 569,700
TN 630 590 640 118 148 117 74,340 87,320 74,880
TX 2,030 1,960 2,080 125 130 145 253,750 254,800 301,600
VA 340 330 310 108 131 67 36,720 43,230 20,770
WA 90 105 125 205 215 205 18,450 22,575 25,625
WI 2,880 2,930 3,100 137 153 162 394,560 448,290 502,200
WY 52 45 50 134 140 121 6,968 6,300 6,050
US 78,570 79,490 81,446 153.9 164.7 152.8 12,091,648 13,091,862 12,446,865
Source: USDA — National Agricultural Statistics ServiceStates with corn production less than 5,000,000 bushels are not listed.
2011 C o r n An n u A l | P A g e 10
C o r n r e f i n e r s As s o C i At i o n
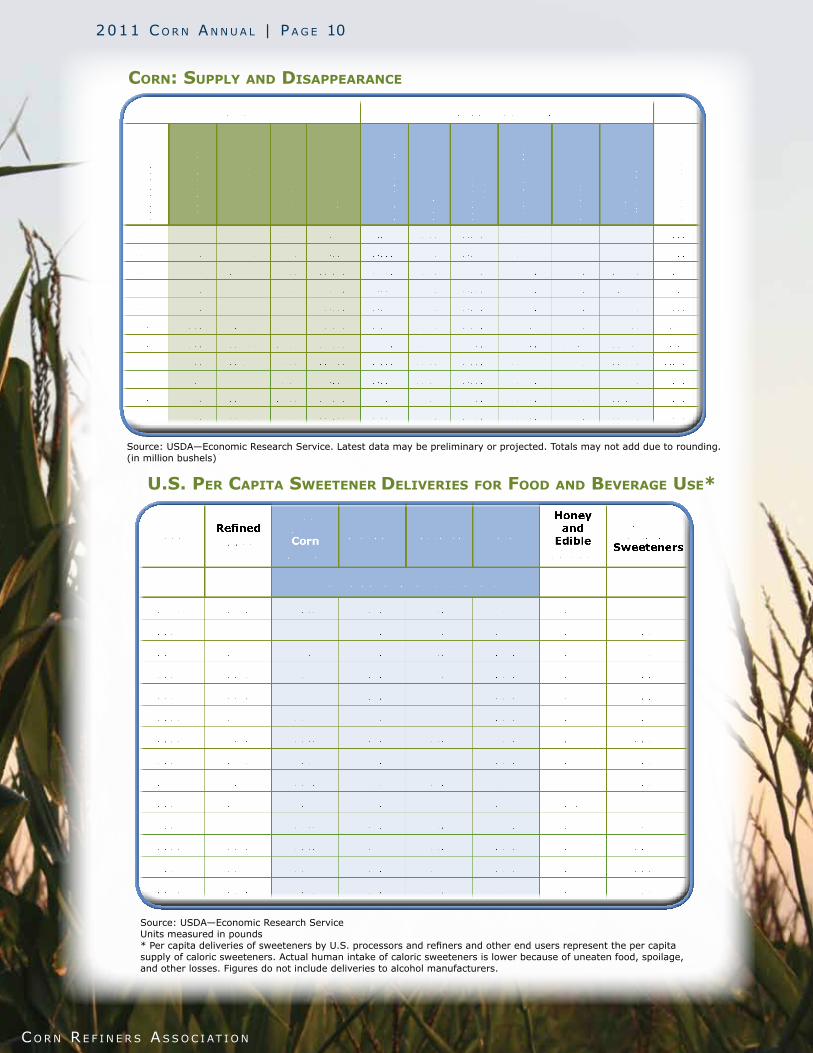
Year Refined Sugar
High Fructose
Corn Syrup
Glucose Dextrose Total
Honey and
Edible Syrups
Total Caloric
Sweeteners
Corn sweeteners (dry basis)
1970 101.8 0.5 10.7 4.6 15.9 1.5 119.1
1980 83.6 19.0 12.9 3.5 35.3 1.2 120.2
1990 64.4 49.6 13.6 3.6 66.8 1.2 132.4
2000 65.6 62.7 15.8 3.4 81.9 1.5 149.0
2001 64.5 62.6 15.5 3.3 81.4 1.3 147.2
2002 63.3 62.9 15.5 3.3 81.6 1.5 146.4
2003 61.0 61.0 15.2 3.1 79.3 1.4 141.7
2004 61.6 59.9 15.6 3.3 78.9 1.3 141.9
2005 63.1 59.2 15.3 3.3 77.8 1.5 142.4
2006 62.2 58.3 13.8 3.1 75.2 1.6 139.0
2007 61.2 56.3 13.7 3.0 73.0 1.3 135.6
2008 65.2 53.1 13.4 2.8 69.3 1.5 135.9
2009 63.5 50.2 13.0 2.7 65.9 1.4 130.8
2010 66.0 48.9 12.7 2.9 64.5 1.5 131.9
u.S. per capita Sweetener deliverieS for food and Beverage uSe*
Source: USDA—Economic Research ServiceUnits measured in pounds* Per capita deliveries of sweeteners by U.S. processors and refiners and other end users represent the per capita supply of caloric sweeteners. Actual human intake of caloric sweeteners is lower because of uneaten food, spoilage, and other losses. Figures do not include deliveries to alcohol manufacturers.
Supply Disappearance
Year
Beg
inn
ing
S
ep
tem
ber
1
Beg
inn
ing
Sto
cks
Pro
du
ctio
n
Imp
ort
s
To
tal
Fo
od
, A
lco
ho
l,
an
d I
nd
ust
rial
Seed
Feed
an
d
Resi
du
al
To
tal D
om
est
ic
Dis
ap
peara
nce
Exp
ort
s
To
tal
Dis
ap
peara
nce
En
din
g S
tock
s
2001 1,899 9,503 10.14 11,412 2,042 20.06 5,849 7,911 1,905 9,815 1,596
2002 1,596 8,967 14.45 10,578 2,335 19.97 5,548 7,903 1,588 9,491 1,087
2003 1,087 10,087 14.08 11,188 2,528 20.56 5,781 8,330 1,900 10,230 958
2004 958 11,806 10.83 12,775 2,687 20.79 6,135 8,842 1,818 10,661 2,114
2005 2,114 11,112 8.81 13,235 2,999 19.90 6,115 9,134 2,134 11,268 1,967
2006 1,967 10,531 11.98 12,510 3,517 23.75 5,540 9,081 2,125 11,207 1,304
2007 1,304 13,038 20.02 14,362 4,420 21.84 5,858 10,300 2,437 12,737 1,624
2008 1,624 12,092 13.53 13,729 5,003 21.95 5,182 10,207 1,849 12,056 1,673
2009 1,673 13,092 8.34 14,774 5,939 22.34 5,125 11,086 1,980 13,066 1,708
2010 1,708 12,447 30.00 14,185 6,407 23.00 5,000 11,430 1,835 13,265 920
2011 920 12,497 15.00 13,432 6,387 23.50 4,700 11,110 1,650 12,760 672
corn: Supply and diSappearance
Source: USDA—Economic Research Service. Latest data may be preliminary or projected. Totals may not add due to rounding. (in million bushels)
2011 C o r n An n u A l | P A g e 11
C o r n r e f i n e r s As s o C i At i o n
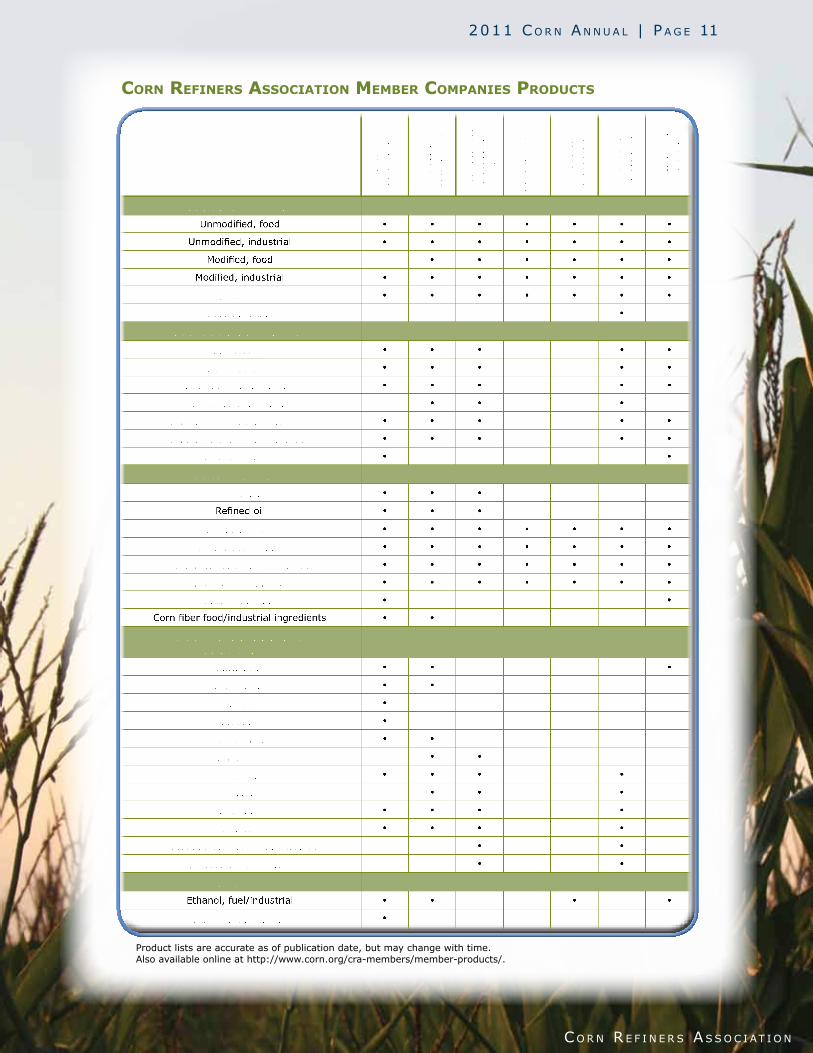
Product lists are accurate as of publication date, but may change with time. Also available online at http://www.corn.org/cra-members/member-products/.
corn refinerS aSSociation memBer companieS productS
Arc
her
D
anie
ls M
idla
nd
Com
pan
y
Car
gill
,
Inco
rpora
ted
Corn
Pro
duct
s In
tern
atio
nal
, In
c.
Nat
ional
Sta
rch
LLC
Penfo
rd
Product
s Co.
Roquet
te
Am
eric
a, I
nc.
Tate
& L
yle
Am
eric
as
STARCH PRODUCTS
Unmodified, food • • • • • • •
Unmodified, industrial • • • • • • •
Modified, food • • • • • •
Modified, industrial • • • • • • •
Dextrins • • • • • • •
Cyclodextrins •
REFINERY PRODUCTS
Glucose syrups • • • • •
Maltodextrins • • • • •
Dextrose monohydrate • • • • •
Dextrose anhydrous • • •
High Fructose Corn Syrup-42 • • • • •
High Fructose Corn Syrup-55 • • • • •
Crystalline fructose • •
CO-PRODUCTS
Crude oil • • •
Refined oil • • •
Corn gluten feed • • • • • • •
Corn gluten meal • • • • • • •
Corn germ or corn germ meal • • • • • • •
Steepwater (CFCE) • • • • • • •
Carbon dioxide • •
Corn fiber food/industrial ingredients • •
FERMENTATION AND OTHER CHEMICALS
Citric acid • • •
Lactic acid • •
Lysine •
Threonine •
Xanthan gum • •
Erythritol • •
Sorbitol • • • •
Xylitol • • •
Mannitol • • • •
Maltitol • • • •
Hydrogenated starch hydrolysates • •
Glucose hydrolysates • •
OTHER
Ethanol, fuel/industrial • • • •
Ethanol, beverage •
2010 C o r n An n u A l | P A g e 12
C o r n r e f i n e r s As s o C i At i o n
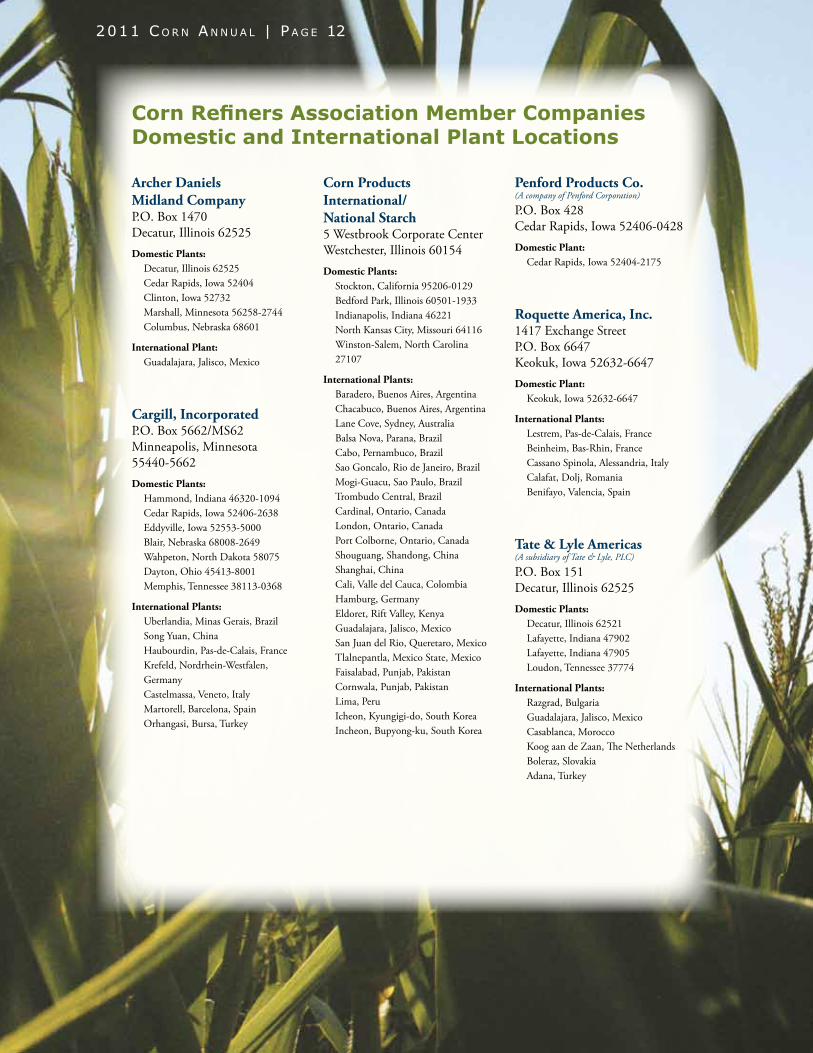
Archer Daniels Midland Company P.O. Box 1470 Decatur, Illinois 62525 Domestic Plants:
Decatur, Illinois 62525Cedar Rapids, Iowa 52404 Clinton, Iowa 52732 Marshall, Minnesota 56258-2744Columbus, Nebraska 68601
International Plant:Guadalajara, Jalisco, Mexico
Cargill, IncorporatedP.O. Box 5662/MS62 Minneapolis, Minnesota 55440-5662 Domestic Plants:
Hammond, Indiana 46320-1094Cedar Rapids, Iowa 52406-2638Eddyville, Iowa 52553-5000 Blair, Nebraska 68008-2649Wahpeton, North Dakota 58075Dayton, Ohio 45413-8001 Memphis, Tennessee 38113-0368
International Plants:Uberlandia, Minas Gerais, BrazilSong Yuan, China Haubourdin, Pas-de-Calais, FranceKrefeld, Nordrhein-Westfalen, GermanyCastelmassa, Veneto, ItalyMartorell, Barcelona, SpainOrhangasi, Bursa, Turkey
Corn Products International/ National Starch5 Westbrook Corporate CenterWestchester, Illinois 60154 Domestic Plants:
Stockton, California 95206-0129Bedford Park, Illinois 60501-1933 Indianapolis, Indiana 46221 North Kansas City, Missouri 64116 Winston-Salem, North Carolina 27107
International Plants:Baradero, Buenos Aires, ArgentinaChacabuco, Buenos Aires, ArgentinaLane Cove, Sydney, AustraliaBalsa Nova, Parana, BrazilCabo, Pernambuco, BrazilSao Goncalo, Rio de Janeiro, BrazilMogi-Guacu, Sao Paulo, BrazilTrombudo Central, BrazilCardinal, Ontario, CanadaLondon, Ontario, CanadaPort Colborne, Ontario, CanadaShouguang, Shandong, ChinaShanghai, ChinaCali, Valle del Cauca, ColombiaHamburg, GermanyEldoret, Rift Valley, KenyaGuadalajara, Jalisco, MexicoSan Juan del Rio, Queretaro, MexicoTlalnepantla, Mexico State, MexicoFaisalabad, Punjab, PakistanCornwala, Punjab, PakistanLima, PeruIcheon, Kyungigi-do, South Korea Incheon, Bupyong-ku, South Korea
Penford Products Co. (A company of Penford Corporation)
P.O. Box 428 Cedar Rapids, Iowa 52406-0428 Domestic Plant:
Cedar Rapids, Iowa 52404-2175
Roquette America, Inc.1417 Exchange Street P.O. Box 6647 Keokuk, Iowa 52632-6647 Domestic Plant:
Keokuk, Iowa 52632-6647
International Plants:Lestrem, Pas-de-Calais, France Beinheim, Bas-Rhin, France Cassano Spinola, Alessandria, Italy Calafat, Dolj, RomaniaBenifayo, Valencia, Spain
Tate & Lyle Americas (A subsidiary of Tate & Lyle, PLC)
P.O. Box 151 Decatur, Illinois 62525 Domestic Plants:
Decatur, Illinois 62521Lafayette, Indiana 47902Lafayette, Indiana 47905Loudon, Tennessee 37774
International Plants:Razgrad, BulgariaGuadalajara, Jalisco, MexicoCasablanca, MoroccoKoog aan de Zaan, The NetherlandsBoleraz, SlovakiaAdana, Turkey
Corn Refiners Association Member Companies Domestic and International Plant Locations
2011 C o r n An n u A l | P A g e 12
2009 C o r n An n u A l | P A g e 13
C o r n r e f i n e r s As s o C i At i o n
HOnORARy DIRECTORS*
Martin Andreas Archer Daniels Midland Company
Fred M. AshCerestar USA, Inc.
Patrick E. BoweCargill, Incorporated
C. G. CaldwellNational Starch and Chemical Company
Paul E. GrunderCPC International, Inc.
E. S. MicekCargill Trustees
G. M. MitchellCargill Trustees
William H. PowellNational Starch and Chemical Company
Robert M. PowersA. E. Staley Manufacturing Company
H. T. ReedPenford Products Co.
John RiceArcher Daniels Midland Company
Samuel C. ScottCorn Products International, Inc.
Richard VandervoortCorn Products International, Inc.
*Listed with their current (or prior) member company affiliation.
1701 Pennsylvania Ave., N.W.Suite 950
Washington, DC 20006-5806tel (202) 331-1634fax (202) 331-2054
corn.org CornNaturally.com
CornSugar.com SweetSurprise.com