2011 ada pubonly 2042-2706 - diabetes.diabetesjournals.org · genetic and environmental factors are...
TRANSCRIPT

A643
For author disclosure information, see page 785.
CATEGORY
ADA-Funded Research
Epid
emio
logy
/G
enet
ics
PUB
LISH
ED O
NLY
EPIDEMIOLOGY
information was available for 48.2% of births (i.e., Medicaid or State Health Plan recipients). Diabetes during pregnancy included gestational and pre-existing and was defi ned by prenatal and maternal inpatient ICD-9-CM diagnostic codes (i.e., 64801-64802, 64881-64882 or 25000-25092) or report on the birth certifi cate. The overall prevalence of diabetes during pregnancy from any source was 8.2%; birth certifi cates identifi ed 4.3%; hospital discharge identifi ed 4.6%; and prenatal data identifi ed 4.6%. Among those with prenatal data available, 10.9% had diabetes from any source with 3.0% concordant across all three sources and 5.3% concordant across at least two sources. From 1996 to 2008 the prevalence of diabetes during pregnancy increased from 5.9% (95% CI: 5.6, 6.2) to 10.5% (95% CI: 10.2, 10.8) in NHW women, from 6.4% (95% CI: 6.0, 6.9) to 11.8% (95% CI: 11.4, 12.2) in NHB women and from 4.1% (95% CI: 2.5, 5.7) to 9.3% (95% CI: 8.6, 9.9) in Hispanic women (Figure 1). The prevalence of recognized diabetes is impacted by reporting, screening and diagnostic practices as well as actual changes in disease burden. As the prevalence of diabetes during pregnancy increases it is important to understand its public health impact; not only on the offspring exposed to diabetes in utero, but also on the mothers who have either developed frank diabetes at a young age or are at high risk for development of type 2 diabetes.
2430-POThe Rs12255372 Variant of Transcription Like Factor 7–Like 2 [TCF7L2] Is Associated with an Increased Risk of Gestational Diabetes Mellitus in Arab WomenNASSER M. RIZK, AFSANEH A. ROOSHENAS, FATEMEH A. ROOSHENAS, EFFAT A. FOULADI, KHALID A. ALALI, AZZA M. KHEDR, Doha, Qatar
Genetic and environmental factors are highly interrelated with gestational diabetes mellitus (GDM) and type 2 diabetes (T2D). GDM is a good model for prediction of T2D. To investigate the associations of two variants rs12255372 G/T and rs7903146 C/T of transcription like factor 7–like 2 [TCF7L2] gene with the risk of gestational diabetes mellitus among Arabian population in state of Qatar. A case control study was designed for such genetic association study. A total of 114 unrelated pregnant women (40 gestational diabetes mellitus cases and 74 controls) were recruited from antenatal care unit of Hamad Medical Hospital in Qatar. Study participants were phenotyped by an oral glucose tolerance test. The two variants were genotyped using TaqMan real time PCR assay. The CC, CT and TT genotype frequencies of the rs7903146 variant was not signifi cantly different between the control and GDM cases (39.4%, 50.0%, 10.6% vs. 40.6%, 43.8%, and 15.6%, p=0.444) among Arab subjects, respectively. The GG, GT and TT genotype frequencies of the rs12255372 variant was not signifi cantly different between the control and GDM cases (34.3%, 51.4%, 14.3% vs. 15.6%, 68.8%, and 15.6%, p=0.109) among Arab subjects, respectively. T allele was the minor allele for rs7903146 and its frequency was [0.36] and T allele was the minor allele for rs12255372 with a frequency of [0.43]. All allele frequencies were in equilibrium for HWE among Arab subjects [P=0.706] for rs7903146 and [p=0.108] for rs12255372. Using logistic regression analysis with adjustments of age and body mass index, only the T allele of rs12255372 variant was signifi cantly associated with risk of GDM with odds ratio of 2.370, (95% of CI 1.010-5.563) with the [p= 0.047] among Arab subjects using the genetic dominant model. On the basis of these observations, we can conclude that TCF7L2 rs12255372 variant is associated with an increased risk of gestational diabetes mellitus in Arab pregnant women.
Supported by: Hamad Medical Corporation - Qatar - # 10099/10
2431-POUtility of an Iterative Intravenous Insulin Infusion Protocol for Glucose Control during Labour in Patients with Diabetes during PregnancyMAHUA GHOSH, CATHERINE MARNOCH, WINNIE SIA, RSHMI KHURANA, KARA NERENBERG, EDMOND A. RYAN, Edmonton, AB, Canada
The major determinant of neonatal hypoglycemia is the maternal blood glucose just prior to delivery, hence the importance of maintaining maternal euglycemia during labour. We retrospectively analyzed maternal glucose levels and rates of neonatal hypoglycemia in pregnant women during labour with diabetes, gestational (GDM), type-1 (DM-1) and type-2 (DM-2) managed with an iterative intravenous (IV) insulin and dextrose infusion protocol. IV insulin was routinely planned for women with GDM requiring insulin >0.5 units/kg/day during pregnancy, DM-1 and DM-2. Blood glucose was monitored hourly and the insulin infusion rate adjusted hourly as needed to a target glucose of 4.1–6.0 mmol/L. Patients were included in the review only if protocol was used for at least 6 hours with glucose readings for the 3 hours prior to delivery used for analysis.
A total of 230 delivery records were analyzed, including, GDM (n= 167), DM-1 (n=31) and DM-2 (n=32). The age and body mass index (mean±SD) for GDM, DM-1 and DM-2 was 32.0±5.3, 29.8±5.0, 32.6±6.0 years and 29.0±6.5, 26.7±4.3, 34.0±7.0 kg/M2 respectively. At birth, the mean insulin dose was 1.0 and 1.3 units per kg per day for DM-1 and DM-2 respectively. The mean gestational age at delivery was 37.0±2.8, 36.7±2.3 and 36.0±4.0 weeks. In the GDM group, 31% were diet controlled, 35% used ≤0.5 units and 34% required >0.5 units/kg/day of insulin. For this abstract, only GDM on >0.5 units/kg/day were analyzed.
Table 1
GDM DM-1 DM-2IV insulin/Dextroseprotocol used for 6h
Yes22 (39)*
No35 (61)
Yes12 (39)
No19 (61)
Yes10 (31)
No22 (69)
Neonatal hypoglycemia(glucose ≤ 2.0 mmol/L)
0 (0) 3 (9) 1 (8) 3 (16) 2 (20) 2 (9)
Maternal hypoglycemia(glucose ≤ 3.5 mmol/L)
1 (4) 4 (11) 2 (16) 4 (21) 0 (0) 0 (0)
Maternal Hyperglycemia(glucose ≥ 7 mmol/L)
1 (4) 4 (11) 1 (8) 3 (16) 0 (0) 9 (41)
* number (%)
These results demonstrate the success of a standardized iterative continuous IV insulin and dextrose infusion protocol in achieving good gly-cemic control with minimal maternal and neonatal hypoglycemia during labor in women with diabetes.
EPIDEMIOLOGY 2432-PO60min Post Load Glucose Predicts Future Type 2 Diabetes in JapaneseYUKIKO ONISHI, TOMOSHIGE HAYASHI, KYOKO KOGAWA SATO, SHOJI KAWAZU, MASATOSHI KIKUCHI, EDWARD J. BOYKO, WILFRED Y. FUJIMOTO, Tokyo, Japan, Osaka, Japan, Seattle, WA
The purpose of this study was to determine which time point of plasma glucose during an oral glucose tolerance test (OGTT) best predicted future type 2 diabetes (T2DM). Analyzed subjects included a cohort of 277 nondiabetic Japanese (143 men and 134 women) aged 45 to 74 years. Baseline variables included plasma glucose measured after an overnight fast and at 30, 60 and 120 min during a 75-g OGTT. The OGTT was repeated at follow-up. T2DM diagnosis was based on the American Diabetes Association 1997 criteria. ΔAkaike information criterion (ΔAIC) was used to evaluate which model including fasting plasma glucose (FPG) or 30-, 60-, or 120-min glucose best predicted future T2DM. ΔAIC for T2DM outcome was calculated as the base model including age, gender, and BMI minus the model with FPG or post-load glucose added. ΔAIC ≥2 indicated a meaningful difference in goodness of fi t between models. At 5-6 years 65.5% of subjects returned for follow-up and there were 48 (17.3%) cases of incident T2DM. In multiple logistic regression analysis and using a 1-SD increase for continuous variables, 60-min post-load glucose (glucose-60) had a higher odds ratio for future T2DM (5.54; 95% CI, 3.31-9.27) than fasting plasma glucose (FPG) (3.72, 2.51-5.52), 30-min post-load glucose (glucose-30) (4.02, 2.61-6.19) or 120-min post-load glucose (glucose-120) (3.33, 2.22-4.99) after adjusting for age, gender and baseline BMI (the 1 SD values of FPG glucose-30, glucose-60 and glucose-120 were 10.6 mg/dl. 29.5 mg/dl, 48.3 mg/dl and 32.8 mg/dl, respectively). In the receiver operating characteristic (ROC) curve analysis of these multivariate models, the area under the ROC curve of the glucose-60 model (0.866) was greater than that of the FPG model (0.849), glucose-30 model (0.823) or

A644
For author disclosure information, see page 785.
CATEGORY
ADA-Funded Research
Epid
emio
logy
/G
enet
ics
PUB
LISH
ED O
NLY
EPIDEMIOLOGY
glucose-120 model (0.814).The model with glucose-60 had the highest values of ΔAIC (67.2) compared to those models with FPG (53.5), glucose-30 (52.8), or glucose-120 (41.3). We concluded that glucose-60 was better than FPG, glucose-30 or glucose-120 in predicting future T2DM.
2433-POA Web-Based Pedometer Program in Women with Recent Histories of Gestational DiabetesCATHERINE KIM, MICHELLE DRASKA, MICHAEL HESS, ELIZABETH J. WILSON, CAROLINE R. RICHARDSON, Ann Arbor, MI
Successful diabetes prevention interventions in women with more recent histories of gestational diabetes mellitus (GDM) have not been reported. We tested a pilot web-based pedometer program for women with recent GDM. Participants were recruited from a university health system, a non-profi t managed care plan, and private practices through a combination of targeted mailings and directed referrals from providers. Mailing recipients had an administrative discharge code consistent with a GDM pregnancy within the past 3 years. The mailings contained the study website address, information regarding GDM and diabetes risk and recommendations regarding lifestyle modifi cation. On the website, women were asked to confi rm their GDM diagnosis within the past 3 years, lack of a current diagnosis of diabetes or pregnancy, age > 18 years, < 150 minutes of self-reported physical activity per week and ability to walk, fl uency in English, and a working e-mail address and Windows XP or Vista platform. If eligible by the web-based screen, women were then contacted by e-mail and telephone to arrange a baseline face-to-face visit, to confi rm that they were at least 6 weeks postpartum, and to confi rm medical clearance. Of the 3285 recruitment mailings, 49 women were eventually randomized. The intervention consisted of a 13-week program consisting of structured education which also gave personalized steps-per-week goals, pedometers, and education regarding lifestyle modifi cation. No signifi cant changes between baseline and 13-weeks were seen in women randomized to the control group vs. the intervention group for fasting glucose (-0.046 mmol/l vs. 0.038 mmol/l, p=0.65). Women in the control and intervention groups both had slight improvements in 2-hour glucose (-0.48 mmol/l vs. -0.42 mmol/l, p=0.91) and weight (-0.14 kg vs. -1.5 kg, p=0.13) respectively, but improvements were similar between groups. We conclude that participation in internet interventions in this high-risk population with signifi cant competing demands is low, and web-based programs may need to be supplemented with additional measures to be effective for reduction of diabetes risk.
2434-POAbility of Hemoglobin A1c To Detect Individuals at Increased Risk of Type 2 Diabetes as Compared with That of Fasting and 2-H Glucose: The Segovia Primary Care Study (SPCS)MANUEL SERRANO-RIOS, CARLOS LORENZO, MARIA T. MARTINEZ-LARRAD, STEVEN M. HAFFNER, Madrid, Spain, San Antonio, TX
There is limited information on the ability of hemoglobin A1c (A1C) to detect individuals at increased risk of type 2 diabetes. Therefore, we compared A1C with fasting and 2-h glucose for classifying individuals at risk of the disease in the SPCS, a population-based, cross-sectional study among individuals aged 36 to 77 years living in Segovia, Spain (n = 653). We excluded participants with diabetes (fasting glucose ≥126 mg/dl, 2-h glucose ≥200, A1C ≥6.5%, or treatment with glucose-lowering agents). A1C 5.7 – 6.4% was less prevalent than impaired fasting glucose (IFG) (fasting glucose 100 - 125 mg/dl) (9.5% vs. 11.8%, p = 0.003) and impaired glucose tolerance (IGT) (2-h glucose 140 - 199 mg/dl) (15.8%, p = 0.002). A total of 145 (22.2%) had pre-diabetes (IFG and/or IGT). Pearson partial correlation coeffi cients demonstrated no signifi cant differences in the relation of fasting and 2-h glucose to A1C (r = 0.15 vs. r = 0.11, p = 0.298) after controlling for the effect of age and sex; however, the relationship between fasting and 2-h glucose was stronger (r = 0.38, p <0.001). Compared with A1C, fasting glucose had more robust correlations with BMI, triglycerides, fasting insulin, and homeostasis model assessment of insulin resistance (HOMA IR); 2-h glucose was more strongly related to HOMA IR and 2-h insulin.
A1C Fasting glucose 2-h glucoseBMI 0.11 0.22 * 0.18 Waist circumference 0.16 0.24 0.17 Log triglycerides 0.12 0.23 * 0.22HDL cholesterol - 0.09 0.01 - 0.16Log fasting insulin 0.08 0.19 * 0.15Log 2-h insulin 0.04 0.12 0.51 †Log HOMA IR 0.10 0.36 † 0.21 *Log C-rective protein 0.09 0.08 0.14
p value for the test of difference in the correlation between single metabolic variables and fasting glucose (or 2-h glucose) relative to corresponding correlation of A1C; * p <0.05; † p <0.001
In summary, IFG and IGT are more prevalent than A1C 5.7– 6.4% in the population of Segovia, Spain. Fasting and 2-h glucose have stronger associations with insulin resistance and some other metabolic traits than A1C.
Supported by: FEDER 2FD 1997-2309 and FIS 03/1618
2435-POAggressiveness of Colon Polyps in Korean Type 2 Diabetes PatientsSUNGHWAN SUH, MI YEON KIM, HYE WON JANG, MIRA KANG, KYU YEON HUR, JAE HYEON KIM, YONG-KI MIN, JAE HOON CHUNG, MYUNG-SHIK LEE, MOON KYU LEE, KWANG-WON KIM, Seoul, Republic of Korea
In this study, we aimed to examine whether diabetes is positively correlated with aggressive colorectal polyps in matched controlled manner. We did a retrospective study on type 2 diabetes patients who underwent sigmoidoscopy for colorectal cancer screening without any gastrointestinal symptoms at the Samsung Medical Center from August 1995 to August 2009. In addition, 495 non-diabetic subjects with colon polyps were matched (i.e.; the year of colonoscopy, age, sex and body mass index) for the colon polyp found diabetes patients. 509 subjects among 3,505 type 2 diabetes patients who underwent colonoscopy were identifi ed to have 1,136 colon polyps. All polyps were removed during endoscopic exam and histologic fi ndings are enlisted in Table 1.
Table 1. Histologic fi ndings of colorectal polyps with or without diabetes
PathologyPathology T2DM patientsT2DM patients(n=509)(n=509)
Non-diabetic controlsNon-diabetic controls(n=495) (n=495)
Total polyp numberTotal polyp number 11361136 760760Tubular adenomaTubular adenoma 701 (61.7%)701 (61.7%) 397 (52.2%)397 (52.2%)Tubulovillous adenomaTubulovillous adenoma 7 (0.6%)7 (0.6%) 9 (1.2%)9 (1.2%)Villous adenomaVillous adenoma 5 (0.4%)5 (0.4%) 1 (0.1%)1 (0.1%)Hyperplastic polypHyperplastic polyp 235 (20.7%)235 (20.7%) 228 (30%)228 (30%)Infl ammatory polypInfl ammatory polyp 26 (2.3%)26 (2.3%) 8 (1.1%)8 (1.1%)No pathologic alterationNo pathologic alteration 112 (9.9%)112 (9.9%) 69 (9.1%)69 (9.1%)AdenocarcinomaAdenocarcinoma 6 (0.5%)6 (0.5%) 3 (0.4%)3 (0.4%)OthersOthers 44 (3.8%)44 (3.8%) 45 (5.9%) 45 (5.9%)
Those with diabetes had more adenomatous polyp, the precursor lesion of colorectal cancer, than non-diabetic subjects. Multivariate logistic regression analysis revealed that DM, male gender, age and BMI are independent risk factors for multiple polyps (more than 3 polyps). For more practical suggestion, age and BMI was divided into quartiles and analyzed OR as indicated in Table 2.
Multiple polypsMultiple polyps OR OR 95% CI 95% CI P value P value Sex Sex FemaleFemaleMaleMale
12.2762.276 1.261-4.1081.261-4.108 0.006 0.006
Age Age < 65 < 65 ≥ 65 65
12.0812.081 1.289-3.359 1.289-3.359 0.0030.003
BMI BMI < 20 < 20 20 20 ≤ BMI < 25 BMI < 25 25 25 ≤ BMI < 30 BMI < 30 ≥ 30 30
16.0626.0627.7397.7399.4229.422
0.784-46.8990.784-46.8990.999-59.9510.999-59.9511.074-82.6731.074-82.673
0.0840.0840.0500.0500.0430.043
However, aspirin and metformin medication did not affect either the size or the number of polyps in diabetic patients. In conclusion, male T2DM patient who is older than 65 and with BMI more than 25 should be screened with colonoscopy to detect and remove multiple adenomatous polyps and prevent colorectal cancer.
2436-POAssociation between Obesity in Children and a Low Family Income in JapanSATORU YAMADA, YOSHIFUMI YAMADA, JUNICHIRO IRIE, YOSHIHITO ATSUMI, Tokyo, Japan
Diabetes and obesity are strongly associated with unhealthful food and physical inactivity. Although data from low-income countries suggest that the prevalence of diabetes and/or obesity is highest in the wealthiest parts of the population, this gradient is known to be reversed in high-income countries. We evaluated the association between obesity and family income in Japan.
WITHDRAWN
WITHDRAWN

A645
For author disclosure information, see page 785.
CATEGORY
ADA-Funded Research
Epid
emio
logy
/G
enet
ics
PUB
LISH
ED O
NLY
EPIDEMIOLOGY
We selected school boys and girls (age 6-15 y/o) as subjects, because they are not affected by work activity and their prevalence of obesity is checked annually. Furthermore, we limited our evaluation to Tokyo city to exclude the effect of life-style differences. In Tokyo city, there are 23 wards. Each ward is 10–50 km2 and has 200–800 × 103 people. Tokyo’s population is 8% of the whole of Japan. We determined the prevalence of obesity in children in each ward from the 2009 annual report of school health in Tokyo city (Tokyo Metropolitan Government) and evaluated the average family income of each ward from the annual report of personal income indices (Japan Planning Systems Co., Ltd). There was a signifi cantly negative association between the prevalence of children’s obesity and the average family income (r=-0.46, p=0.028). There was also a stronger negative association in girls (r=-0.49, p=0.015) than in boys (r=-0.42, p=0.048). Since this association disappears in junior high school (boys: r=-0.19, n.s.; girls: r=-0.24, n.s.), primary school children appear to be more affected by family income (boys: r=-0.44, p=0.035; girls: r=-0.59, p=0.003). Our fi ndings suggest that the obesogenic environment is associated with poverty in Japan. To combat obesity and diabetes, effective social policies are required.
2437-PO
WITHDRAWN
2438-POAssociations between Erythropoietin and Parameters of Glucose Homeostasis in Women at Varying Degrees of Future Diabetic RiskLOUISE J. MAPLE-BROWN, Y. QI, M. WOO, A.J. HANLEY, P.W. CONNELLY, M. SERMER, B. ZINMAN, R. RETNAKARAN, Toronto, ON, Canada
Erythropoietin (EPO) primarily promotes red blood cell formation and survival but there is growing evidence that it also impacts non-erythroid tissues. Indeed, in a mouse model of type 2 diabetes (T2DM), treatment with recombinant EPO was recently shown to protect against incident diabetes through direct effects on the beta-cell. However, there has been limited study of endogenous EPO in relation to the early pathophysiology of T2DM in humans. Thus, we evaluated the relationships between serum EPO levels and parameters of glucose homeostasis at 3-months postpartum in a cohort of women spanning the full spectrum of glucose tolerance in their recent pregnancy and hence refl ecting a broad range of future diabetic risk. In this study, 307 women underwent oral glucose tolerance tests (OGTT) in pregnancy and at 3months postpartum. Antepartum OGTT revealed that 76 had gestational diabetes, 57 gestational impaired glucose tolerance and 174 normal glucose tolerance. At 3-months postpartum, 260 had normal glucose tolerance, 45 pre-diabetes and 2 diabetes. At that time, serum EPO was signifi cantly higher in those with pre-diabetes or diabetes compared to normal glucose tolerance (mean 10.0 vs 8.5mU/ml, p=0.011). After adjustment for age, ethnicity, and waist, EPO was associated with insulin sensitivity (r=-0.24, p<0.0001), CRP (r=0.24, p<0.0001) and leptin (r=0.24, p<0.0001), but not with beta-cell function (r=0.0, p=0.98). On multiple linear regression analysis, the only signifi cant covariates of EPO were leptin (t=1.97, p=0.049) and family history of T2DM (t=1.98, p=0.048); insulin sensitivity and pre-diabetes/diabetes status were not independently associated with EPO. In conclusion, endogenous EPO concentration was not independently associated with glucose intolerance, beta-cell function or insulin sensitivity in this cohort. Nevertheless, these data suggest complex relationships between EPO and metabolic variables which warrant further study.
2439-POBlack African Men Have Greater Visceral Adiposity Than African American Men: The Immigration EffectUGOCHI J. UKEGBU, MADIA RICKS, DARLEEN C. CASTILLO, MICHAEL G. KNIGHT, BERNARD V. MILLER III, BARBARA M. ONUMAH, NILO A. AVILA, ANNE E. SUMNER, Bethesda, MD, Washington, DC
Black African men are less obese than African American men, but it is unknown if smaller body size translates to better metabolic health. Defi ning metabolic health by blood pressure, glucose tolerance status and body fat content and distribution, we compared 68 men (34 Black African, 34 African American, age 38±6; mean±SD, range 30-50y). Glucose tolerance status was determined by the OGTT. Body fat content was measured with DXA and visceral adipose tissue (VAT) by CT scan. BMI was lower in Black African men than African American men. However, Black African men had higher
BP, higher fasting glucose and 2h glucose, higher prevalence of abnormal glucose tolerance (OR: 2.4, 95% CI: 0.9-6.3), higher % fat and higher VAT. Data presented in table and fi gure. Signifi cant weight change occurred in Black African men after arrival in the United States and average weight gain was 4kg per year. Weight gain may be most rapid soon after arrival in the United States because for Black African men who had lived in the United States for <2 years, average weight gain was ≥10kg/year. Therefore, even though Black African men are less obese that African American men, Black African men are less healthy. After immigration, rapid weight gain which may be leading to fat deposition in the VAT compartment may contribute to the adverse health status of Black African men.
Table. Subject Characteristics
Parameters* Black Africans African Americans P-valueBMI (kg/m2) 27.5±3.7 29.9±4.6 <.05Sys BP (mmHg) 130 (126,134) 120 (115,124) <.01Dia BP (mmHg) 79 (76,82) 72 (68,75) <.010h glucose (mg/dL) 95 (92,98) 88 (86,91) <.012h glucose (mg/dL) 145 (135,154) 124 (114,133) <.01Percent Fat 24.5 (23.1,25.9) 22.3 (20.9,23.7) <.05
*Mean±SD or adjusted for BMI (95% CI)
Figure. BMI and VAT in Black African and African American Men
2440-POBody Mass Index and Waist Circumference as Predictors of the Inci-dence of Type 2 Diabetes among Angiographied Coronary PatientsCHRISTOPH H. SAELY, PHILIPP REIN, ALEXANDER VONBANK, STEFAN BEER, CHRISTIAN BOEHNEL, VLADO JANKOVIC, SUSANNE GREBER, HEINZ DREXEL, Feldkirch, Austria
The prevalence of diabetes among angiographied coronary patients is high, but no data are available on the incidence of diabetes in this clinically important patient population. In this prospective cohort study we therefore aimed at investigating the incidence of diabetes among angiographied coronary patients and in particular at evaluating the impact of body mass index (BMI) and of waist circumference on diabetes risk.
The incidence of T2DM was recorded over 8 years in a population of 506 consecutive non-diabetic patients undergoing coronary angiography for the evaluation of stable coronary artery disease.
During follow-up, T2DM was newly diagnosed in 107 (21.1%) of our patients. In logistic regression analysis both baseline BMI (standardized adjusted odds ratio (OR) = 1.34 [1.08-1.66]; p = 0.007) and baseline waist circumference (OR = 1.49 [1.18-1.88]; p = 0.001) signifi cantly predicted the incidence of type 2 diabetes after multivariate adjustment when entered separately into the regression models. When BMI and waist circumference were entered simultaneously into a logistic regression model, waist circumference after adjustment for BMI remained signifi cantly predictive of T2DM (OR = 1.44 [1.02-2.03]; p = 0.039), whereas the association of BMI with incident T2DM after adjustment for the waist circumference was no longer signifi cant (p = 0.788).
We conclude that the incidence of diabetes is high among angiographied coronary patients. A large waist circumference predicts the incidence of diabetes independently from BMI, whereas BMI does not predict diabetes independently from waist circumference.

A646
For author disclosure information, see page 785.
CATEGORY
ADA-Funded Research
Epid
emio
logy
/G
enet
ics
PUB
LISH
ED O
NLY
EPIDEMIOLOGY
2441-PO
WITHDRAWN
2442-POClinical Awareness and Management of Patients with PrediabetesJANE W. NJERU, M. REGINA CASTRO, STEPHEN S. CHA, PEDRO J. CARABALLO, Rochester, MN
Early identifi cation and appropriate management of patients with prediabetes is critical to prevent diabetes and its comorbidities. We assessed the prevalence of clinical documentation of diagnosis of prediabetes and management in patients with criteria of impaired fasting glucose (IFG).
We randomly selected 99 patients from a previously identifi ed cohort of adult residents of Olmsted County, Minnesota, without a previous diagnosis of diabetes and with at least one fasting glucose 100-125 mg/dL between 1999-2004 who visited Mayo Clinic. We reviewed their medical records until their last clinical follow-up to assess documentation of any diagnosis related to prediabetes or diabetes, and management recommendations including lifestyle changes. We collected additional data: age, gender, BMI, BP, lipids, creatinine, HbA1c, glycemia, smoking status, aspirin use, medications for HTN, hyperlipidemia and IFG, diagnosis of HTN, hyperlipidemia, renal failure, ischemic heart disease, cerebrovascular disease, carotid disease, peripheral vascular disease and heart failure.
After 10 years of follow-up, we found clinical documentation of any diagnoses related to IFG in 22 patients (mean age 59.92±14.71, 55% female) and 77 without diagnosis (mean age 60.36±16.76, 55% female). The proportion of patients with lifestyle recommendations for any reason was 91% for patients with diagnosis and 31% for those without diagnosis (p<0.001). Two patients were managed with metformin.
To assess for associations of other clinical data with the detection of prediabetes we compared patients with diagnosis vs. without diagnosis. Out of all the variables mentioned above, only glycemia (103.64 ± 5.60 vs. 100.03 ± 7.72, p=0.034), triglycerides (160.58±49.97 vs. 129.69±59.25, p=0.022) and diagnosis of hyperlipidemia (77% vs. 61%. P=0.042) were statistically signifi cantly different.
Despite evidence supporting the effi cacy of lifestyle changes and medications in the management of prediabetes, this condition is clearly under-recognized in routine clinical practice and the presence of other metabolic risk factors does not help. It is important to increase awareness of diagnostic criteria and appropriate management in order to prevent diabetes.
2443-POComparative Analysis of the Usefulness of Fasting Glucose, HbA1c and Estimated Average Glucose as Screening Tests in a High Risk PopulationNABILA ABDELLA, MONIRA AL AROUJ, ABDULLAH BEN NAKHI, EBAA OZAIRI, OLUSEGUN MOJIMINIYI, Kuwait, Kuwait
Recently, glycated hemoglobin (HbA1c) was included in the criteria for diagnosis of diabetes - HbA1c of ≥ 6.5% is diagnostic, HbA1c of 5.7% to 6.4% identifi es prediabetes. Converting HbA1c to estimated average glucose values (eAG) might help understanding and interpretation of HbA1c. This study evaluates and compares the utility of fasting Glucose, HbA1c and eAG as screening tests for undiagnosed diabetes and the metabolic syndrome (MS) in apparently healthy fi rst degree relatives (FDR) of patients with Type 2 diabetes. We measured fasting glucose, HbA1c and calculated eAG in 575 (232M, 343F) in the FDR. Subjects were classifi ed by the IDF criteria for the MS. Receiver operating characteristic curve (ROC) analysis was used to examine the diagnostic performance characteristics for DM and MS. Using standard cut off values for glucose, HbA1c and eAG, the relative prevalence of undiagnosed diabetes in our cohort were 16/575 (2.8 %) for glucose, 66/575 (11.5%) for HbA1c and 62/575 (10.8%) for eAG respectively. At standard cut-off values, the prevalence of impaired fasting glucose (IFG) was 55/575 (9.6%), 195/575 (33.7%) and 437/575 (76%) for glucose, HbA1c and eAG respectively. Using the ADA glucose diagnostic criteria as reference, the areas under the ROC (0.989; 95% CI (0.874 – 0.982)) for diagnosis of DM were the same for HbA1c and eAG. HbA1c and eAG also had the same ROC areas for the diagnosis of IFG (0.719; 95% CI = 0.647 – 0.791, respectively) and the MS (0.678 (95% CI = 0.600 – 0.756). The ideal cut-off points with the highest sensitivity (100%) and specifi city (65%) for diagnosis of DM in our
cohort were HbA1c = 5.9% and eAG = 6.7 mmol/L. These values are different from recommendations in international guidelines. We conclude that there are signifi cant differences in the number of undiagnosed diabetic subjects identifi ed by screening with glucose, HbA1c and eAG. Differences between HbA1c and eAG could be due to the wide confi dence intervals around eAG estimates. HbA1c and eAG are potentially useful tools for diagnosing subjects who are unaware of their glucose tolerance status.
Supported by: KFAS Project No. 2004-1302-03
2444-POComparison of Capillary Glucose Measurement and a Risk Assess-ment Questionnaire in Screening for Type 2 Diabetes in High-Risk Population in Rural ChinaXIAOLONG ZHAO, HEN SHENG ZHANG, YONGHUI SHU, JINGHUI LI, YIMING LI, SONGWU LI, Shanghai, China, Kunming, China
Objective— To assess the utility of a point-of-care (POC) capillary blood glucose measurement as compared with routine clinical parameters in predicting undiagnosed diabetes in a low-resource rural China setting.
Research Design and Methods— Nine hundred and ninety-three participants aged>25 years stratifi ed by income were randomly selected from 15 villages in southwestern part of china. A clinical risk score questionary, sampling for laboratory venous fasting plasma glucose (FPG) and venous plasma glucose in 2 hours after OGTT, and POC capillary blood glucose assay were performed simultaneously.
Diabetes diagnosis was based on the World Health Organization (WHO) defi nition using OGTT. The capacity of the POC glucose to predict the presence of diabetes was assessed and compared with the questionnaire using area under the receiver operating characteristic curves (AUCs).
Results— The AUC for POC glucose alone in predicting diabetes was 0.867 (95% CI 0.809–0.924).This was signifi cantly better (P <0.001 for AUC comparison) than the models based upon clinical variables alone (AUC for the best clinical model including age, diabetes history, high glucose history ,lipid abnormal history, waist hip ratio: 0.749 [95% CI 0.685–0.812]).
POC glucose appropriately reclassifi ed the risk of up to 15% of participants ranked according to the clinical models. Adding the clinical variables to the POC glucose assay did not signifi cantly improve the discriminatory capability beyond that achieved with the POC glucose measurement alone (all P <0.05).
Conclusions— POC glucose testing appears to be a simple and reliable tool for identifying undiagnosed diabetes in a high-risk,resource-poor rural population.
Supported by: National Science Foundation of China (Grant 300700385)
2445-POConstructing Points-Based Prediction Models for the Risk of Coronary Artery Disease in Community: Report from a Cohort Study in TaiwanKUO-LIONG CHIEN, HSIU-CHING HSU, TA-CHEN SU, WEI-TIEN CHANG, PEI-CHUN CHEN, FUNG-CHANG SUNG, MING-FONG CHEN, YUAN-TEH LEE, Taipei, Taiwan, Taichung, Taiwan
Background: A range of prediction rules predicting coronary artery disease risk have been proposed. However, most studies were conducted in Caucasians and it is not clear whether these models apply to Asian populations. The purpose of this study was to construct a simple points model for predicting incident coronary events among ethnic Chinese people.
A647
For author disclosure information, see page 785.
CATEGORY
ADA-Funded Research
Epid
emio
logy
/G
enet
ics
PUB
LISH
ED O
NLY
EPIDEMIOLOGY
Methods and Results: We estimated the 10-year risk of coronary artery disease in a cohort study of middle-aged and elderly participants who were free from diabetes at baseline. Cox regression coeffi cients were used to construct the simple points model and the discriminatory ability of the resulting prediction rule was determined using the area under the receive operating characteristic curve (AUC). Of 3430 participants (52.2% women, mean 54.8±12.3 yrs) without coronary event at baseline, 171 developed the event during a median 15.9-yr follow-up period. Age (8 ponts), gender (2 points), body mass index (4 points), systolic blood pressure (3 points) and smoking status (1 point) for clinical model and this approach allowed manual estimation of 10-year risk of coronary artery event for each individual. Total cholesterol (1 point), HDL cholesterol (7 points) and LDL cholesterol (2 points) predicted strongly the coronary event in a multivariate model. The estimated AUCs for the clinical model was 0.782 (95% confi dence interval [CI], 0.744 – 0.819). This clinical model outperformed Framingham risk score (0.763, 95% CI, 0.726-0.800); however, less than the PROCAM model (0.800, 95% CI, 0.762 - 0.838) for population at risk.
Conclusions: We have constructed a model for predicting 10-year coronary artery disease in Chinese people in Taiwan which could be useful in identifying individuals at high risk of coronary artery disease.
Supported by: National Science Council (NSC 97-2314-B-002 -130 - MY3), Taiwan
2446-PODescription of 987 French Type 2 Diabetic Patients 70 Years Old and over at Inclusion in the GERODIAB Follow-Up CohortCHRISTIANE VERNY, BERNARD BAUDUCEAU, JEAN PIERRE LE FLOCH, JEAN DOUCET, SFD-SFGG INTERGROUP, Le Kremlin Bicetre, France, Saint-Mande, France, Villecresnes, France, Rouen, France
Because of growing life expectancy and increasing prevalence of type 2 diabetes with age, diabetes in the old becomes a main heath concern. However, most of the studies used to build guidelines have been conducted in younger populations, and it is not clear that they should apply to older populations. GERODIAB is a prospective fi ve-year follow-up survey designed to study the mortality and related factors in French type 2 diabetic patients aged 70 years and above, aiming to support adapted guidelines.
Over 1 year (mid 2009-2010), 987 consecutive out-patients from 56 diabetic centers were included in the study. This report describes the population at baseline.
Patients (48% of men) were (mean±SD) 78±5 years old (1st-3rd quartiles: 74-81); Known duration of diabetes was 18±12 yr (10-25). Prior to inclusion, 86% of the patients had hypertension, 29% coronary desease including 17% myocardial infarction, 10% heart failure, 12% stroke, 26% distal arteriopathy; 26% had retinopathy, 43% microalbuminuria, 22% MDRD<60 ml/min, including 2% <30; 96% of the patients lived at home, although 11% had known cognitive dysfunction. BMI was 30±6 kg/m² (26-33); 45% had BMI >30 kg/m² whereas 93% received an adapted diet counselling. A1c was 7.6±1.3 % (6.7-8.1), including 41% of the patients with A1c >7.5 %. A1c correlated with duration of diabetes (r=0.12, P<0.01). An oral drug was used by 72% of the patients, including biguanides 69%, sulfonylureas 40%, glinides 21%, DPP4 inhibitors 14%, glitazones 10% and α-glucosidase inhibitors 7%. GLP-1 analogues were used in 5% of the patients and insulins in 59%. Antihypertensive or cardiotonic drugs were used in 90% of the patients, antiaggregants in 57% and hypolipemiants in 72%, including 65% statins.
This preliminary report gives an instant picture of the French population of elder type 2 diabetic patients. It highlights the relatively low frequency of degenerative complications despite a long duration of diabetes, and the frequency of cognitive impairment in patients mostly living at home. Surprisingly, new drugs are very commonly used in this population.
Supported by: Research grants: French PHRC, SFD, SFGG, APNET, Novo Nordisk and Merck
2447-PODetection of Diabetes Mellitus and Pre-Diabetes with A1C, Fasting Plasma Glucose and Oral Glucose Tolerance Test. A1c Based Screen-ing May Be More Diagnostic Test for Diabetes MellitusMEHMET OZGUR NIFLIOGLU, MITHAT BAHCECI, SAKINE LEYLA ASLAN, FUSUN TOPCUGIL, ALIYE PELIN TUTUNCUOGLU, Izmir, Turkey
The American Diabetes Association (ADA) proposed Hemoglobin A1C ≥ 6.5% (A1C) for the diagnosis of diabetes and 5.7-6.4% for the highest risk to progress to diabetes. On the other hand, this new criterion’s accuracy is controversial and has not been worldwide adopted yet. We aimed to clarify the power and effi cacy of A1C in diagnosis of diabetes and pre-diabetes by comparing with fasting plasma glucose (FPG) and conventional 2nd hour 75-g oral glucose tolerance test (2h-OGTT).
We evaluated 622 male (34.3%), 1192 female (65.7%), totally 1814 subjects admitted to the internal medicine outpatient clinic between 2006 and 2010 years, with clinical suspicion of diabetes,. Diabetic subjects and patients who had been using drugs that may cause diabetes were excluded from this study.
According to new ADA criteria; 760 of 1814 individuals had diabetes mellitus (41.8 %) (at least one of the ADA diagnosis criteria was positive). Each of these tests, A1C, 2h-OGTT and FPG, was alone detected 529 (69.6%), 488 (64.2%) and 328 (43.2%) of the diabetic patients, respectively. Differences between, FPG and 2h-OGTT; FPG and A1C; 2h-OGTT and A1C were statistically signifi cant (p<0.0001, p<0.0001 and p=0.02, respectively). Among those 1814 subjects, 1094 (60,3%) had impaired fasting glucose. Besides that, 511 (28,2%) and 980 (54.0%) of these subjects were glucose intolerant according to 2h-OGTT and A1C, respectively. Differences among these groups were also statistically signifi cant (p<0.0001, p<0.0001 and p<0.0001, respectively).
Diagnostic power of A1C criterion is higher than FPG and 2h-OGTT for diabetes mellitus. In addition, proposed A1C level is more diagnostic than that of 2h-OGTT for determination of prediabetes. High diagnostic power of A1C can lead to decrease in the number of undiagnosed patients.
2448-POWITHDRAWN
2449-PODiabetes in Nursing Home Facilities: Prevalence, Quality of Care and ComplicationsSHADI S. YARANDI, ALEXANDRA MIGDAL, RAKHEE CHHABRIA, MARCOS K. TOYO-SHIMA, LIMIN PENG, DAWN SMILEY, DARIN E. OLSON, ZOBAIR J. NAGA MIA, WINTER D. POWELL, INGRID PINZON, THEODORE M. JOHNSON, GUILLERMO E. UMPIERREZ, Atlanta, GA
Limited information is available on the approach to diabetes care and diabetic complications in nursing homes (NH). Accordingly, we analyzed the medical records in two Nursing homes in Atlanta between 1/1/08 to 12/31/08 to determine the prevalence and management of DM, and to evaluate the impact of BG control on clinical outcome. A total of 1114 patients were admitted for subacute rehab (n=864) and long-term care (n=250). DM prevalence was 31%. Major causes for admissions were dementia and psychiatric illnesses 45%, debility 13%, post-surgical 23%, fractures 16%, and vascular disease 10%. Diabetics were younger, heavier, and had higher admission BG than nonDM patients. DM subjects had a mean hospital BG of 152±35 mg/dl and A1C 7.5%, and were treated with diet 12%, oral agents (OA) 4%, sliding scale insulin 21.4%, basal insulin 27%, and OA+insulin 34.6%. A total of 36% of DM patients had ≥1 episode of hypoglycemia. Compared to nonDM, DM patients had 1) higher rates of comorbidities and polypharmacy, and higher number of infections and heart failure (p<0.001), 2) less fractures and 3) similar cognition decline, LOS, emergency room, hospital transfers, and mortality.
Conclusion: Diabetes is present in 31% of NH patients and is associated with increased comorbidities, infections and heart failure, but with similar cognitive decline, LOS, mortality, and hospital admissions. Randomized studies are needed to determine the impact of improving glycemic control on clinical outcome in long-term care facilities.
No DM DM P value # patients, % 768 (69%) 346 (31%) -Mean Age, yr 83+10 80+9 < 0.001BMI 24.4 + 5 27.3 + 6 < 0.001Admission BG, mg/dl 109 + 30 138 + 55 < 0.001ER VisitsHospital Transfer
9%21%
9% 26%
- 0.2
Mortality 12.6% 9.8% 0.3LOS, days 449 468 0.7Co morbidities: HTN DyslipidemiaCAD CHFChronic Kidney Disease
83.9% 32.7% 25.1% 22.4%15%
95.7% 54.6%36.4%32.4%23.4%
< 0.001< 0.001< 0.001< 0.001
0.002 Complications: Infections (pneumonia, UTI)CHF ExacerbationFractures
32.2%2.2%2.7%
34.4%6.1%1.7%
0.001< 0.001< 0.001
Supported by: sanofi -aventis
A648
For author disclosure information, see page 785.
CATEGORY
ADA-Funded Research
Epid
emio
logy
/G
enet
ics
PUB
LISH
ED O
NLY
EPIDEMIOLOGY
2450-PODiabetic Neuropathy Status and Concerns in Medically Underserved Rural CommunitiesWEN WANG, APPATHURAI BALAMURUGAN, JOYCE BIDDLE, KIMBERLY M. ROLLINS, Conway, AR, Little Rock, AR
Diabetic peripheral neuropathy (DPN) is a major causative factor in the development of diabetic foot ulcers. Studies on the prevalence of DPN in medically underserved rural community have been limited. The purpose of this study was to investigate the prevalence of DPN and to identify at risk populations in these underserved communities.
A cross-sectional study was conducted in 816 type 2 diabetic patients from 5 rural Arkansas counties who attended a diabetes education program from 2005 to 2009. The data was collected through a survey questionnaire and from medical record reviews. Univariate and multivariate analyses were conducted, and the variables were considered signifi cant if p <0.05.
Of the 816 patients studied (mean age 57 ± 14 years, diabetes duration 3 ± 6 years), the prevalence of the patients with DPN diagnosis was 9.6%, and the prevalence of the patients that reported peripheral neuropathy symptoms (PNS) was 43%. Among the 78 patients with DPN diagnosis, 95% or 74 patients had PNS (p = 0.000). However, of the 351 patients with PNS, 79% had not been diagnosed with DPN. Multivariate analyses found that being female (OR 1.45), being White (OR 2.22), having less than a college education (OR 1.47), having a longer duration of diabetes (OR 1.88), having a history of smoking (OR 1.76), having a professional foot examination (OR 1.86), and performing self foot examination (OR 1.47) were signifi cantly associated with a higher risk for having DPN or PNS.
In conclusion, this study found that the prevalence of patients with PNS was high, and the DPN was alarmingly under-diagnosed in these underserved rural communities. The high prevalence of PNS and under-diagnosis of DPN could infl uence the development of severe foot complications like foot ulcer, and even possibly increase the risk of lower extremity amputation in these underserved communities. The at-risk population identifi ed by this study would be a resource to help develop targeted education and intervention programs in underserved rural communities.
2451-POEffects of Ethnicity on Postpartum Metabolic Outcome in Women with Previous Gestational DiabetesKAREN E. ELKIND-HIRSCH, DONNA L. SHALER, MARTHA S. PATERSON, BEVERLY W. OGDEN, BRETT L. SCHELIN, Baton Rouge, LA
Women with prior gestational diabetes (p-GDM) are at risk for type 2 diabetes (DM2) and its comorbidities. We examined whether ethnicity impacts metabolic disorder prevalence in these high-risk women in the early postpartum period.
From April 2009-October 2010, 180 p-GDM women (134 white [W] and 46 non-white [NW]) underwent a 75-g oral glucose tolerance test and metabolic assessment at 6-12 weeks after delivery. Insulin sensitivity and β--cell secretory capacity derived from fasting (HOMA-IR) and glucose-stimulated measures (SIogtt and IGI) were determined. The corrected early phase insulin secretion index (IGI/HOMA-IR) was calculated to adjust for degree of insulin resistance (IR).
Obesity was highly prevalent with 74% of p-GDM women having a BMI >25. The incidence of abnormal glucose regulation (AGR) did not vary with race; 23.3% of p-GDM women had dysglycemia whereas metabolic dysfunction (AGR and/or β-cell dysfunction) was observed in 57% p-GDM women. BMI had a signifi cant impact; 28% of p-GDM women with a BMI <25 had metabolic dysfunction compared to 67% of p-GDM women with a BMI > 25.
Parameter White Non-White p-valueDysglycemia (%) 20 32 NSPostpartum BMI (kg/m2) 29 (.6) 34 (.9) <.0001GDM recurrence (%) 71 89.3 <.025HOMA-IR 2.1 (.2) 3.1 (.3) <.009ISIogtt 8.4 (.5) 4.7 (.5) <.0001Insulinogenic index (IGI) 1.0 (.2) 2.3 (.9) <.04IGI/HOMA-IR .76 (.1) .85 (.2) NSMetabolic dysfunction (%) 55 61 NSDyslipidemia 79 54 <.001
Treatment of GDM, age, family history of DM2, menstrual history, C-section rate, breastfeeding, or large baby rate were not racially disparate. GDM recurrence was higher in NW women who also had signifi cantly greater parity. NW p-GDM women had higher blood pressure and IR whereas W p-GDM women had higher triglycerides, total and LDL-cholesterol levels.
Overweight p-GDM woman are at increased risk for dysglycemia regardless of ethnicity. Although not signifi cantly different, the prevalence of AGR was higher in NW p-GDM women given that these women were heavier and had greater central adiposity. Compared with NW women, W p-GDM women have a more atherogenic lipid profi le by 6-12 weeks post-partum
Supported by: Pennington Foundation and BCBSLA
2452-POEnhanced Cardiometabolic Disease in Patients with Severe Mental Illness: Experience from an Integrated Clinical and Research CentreROGER CY CHEN, ELIZABETH DENT, JEFF SNARS, TIM J. LAMBERT, Sydney, Australia, Concord, Australia
Severe mental illness is associated with a twofold increase in risk of adverse cardiometabolic outcomes. Despite the development of screening and management guidelines across the world, clinical practice has been slow to change. Numerous barriers to equitable health care exist for patients with severe mental illness, calling for a shift in the organization of service delivery. In response to this need, Concord Centre for Mental Health, Concord Hospital Department of Endocrinology and Metabolism, The University of Sydney and the Australian Diabetes Council have collaborated to provide integrated, multidisciplinary hospital and community based clinics in Sydney offering metabolic health screening, treatment and follow up for patients. Since 2008 our service, Concord Centre for Cardiometabolic Health in Psychosis (ccCHIP); has reviewed 464 patients (mean age 41, mean BMI 30, mean duration of illness 13 years) with diagnoses including schizophrenia (51%), schizoaffective disorder (12%), bipolar disorder 9%, depression (11.4%) and other disorders (6.5%). There was a high concentration of cardiovascular risk factors: 39% of patients were from high risk ethnic background for diabetes. Family history of hypertension/CVD (43%), obesity (43%), diabetes (39%) and psychosis (26%) were also common. Smoking rates were 67%, 76% reported minimal exercise levels, and 60% describing regular fast food/ take away intake. The incidence of metabolic syndrome (IDF defi nition) was 54%; with rates of 82% abdominal adiposity, 54% hypertension, 55% raised total cholesterol, 77% raised LDL, 72% raised triglycerides, 56% low HDL, and 22% raised blood glucose. Data from this integrated service confi rms the signifi cantly elevated cardiovascular risk in this relatively young patient group, confi rming the need for a multidisciplinary approach to the management of these patients.
Supported by: NSW Department of Health, Australia
2453-POFeatures of the Metabolic Syndrome Are Associated with Low Vitamin D Levels in MalaysiaALEX T.B. TAN, YEE YEAN CHEW, ANANDA VIJAY, SOO SAN LIM, ABU SAAD HAZIZI, PENDEK ROKIAH, SIEW PHENG CHAN, Kuala Lumpur, Malaysia
Recent evidence suggests that low levels of 25-hydroxy vitamin D [25(OH)D] may play a role in the etiology of metabolic syndrome(MetS) and there is a suggestion of it playing a role in subsequent adverse cardiovascular outcome. We assessed 25(OH)D levels and its association with features of the cardiometabolic syndrome (MetS) in a rural population.
This was a cross sectional study in randomly selected community dwelling individuals. Preliminary analysis of 681 individuals (mean age 55.2+7.0 years) was conducted. Analysis of individual risk factors revealed signifi cant differences in 25(OH)D in those with hyperglycaemia (DM/IGT/IFG) vs Normal glucose tolerance (33.0 vs 35.0 ng/ml, p=0.018); increased waist circumference,>90cm-men/>80cm-women (32.2 vs 38.0, p<0.001); hypertriglyceridaemia (32.8 vs 34.7 p=0.014) and with low HDL-cholesterol (30.8 vs 34.3, p=0.01). There was no difference in hypertensive vs non-hypertensive individuals. Using the NCEP criteria, there were 350 (51.4%) with Met Syndrome+. A signifi cant difference was found in those with MetS+ 32.6 vs MetS- 34.9 ng/ml, p=0.006). Multiple logistic regression analyses indicated signifi cant adjusted inverse associations of 25(OH)D with waist circumference, hypertriglyceridaemia, fasting hyperglycaemia, diastolic BP (p<0.001) and positive association with high HDL-cholesterol (p=0.014). Our analysis of this rural cohort is consistent with data suggesting that individuals with cardiometabolic risk have lower levels of vitamin D
A649
For author disclosure information, see page 785.
CATEGORY
ADA-Funded Research
Epid
emio
logy
/G
enet
ics
PUB
LISH
ED O
NLY
EPIDEMIOLOGY
when compared to those without. All those studied did not have signifi cant ill-health that caused disability and non-exposure to sunlight. The clinical signifi cance of this association will be assessed in a prospective longitudinal study of occurrence of adverse CV outcomes.
2454-POFulminant Type 1 Diabetes Mellitus: Report of 18 CasesZHIMIN HUANG, WANPING DENG, AILING CHEN, YANBING LI, Guangzhou, China
Fulminant type 1 diabetes mellitus (FT1DM) is characterized as remarkably abrupt onset, ketoacidosis at diagnosis, negative autoantibodies, virtually no C-peptide secretion and elevated pancreatic enzyme levels. It was fi rst reported in Japanese population in 2000, and sporadic cases were reported in China in recent years, but epidemiological data are yet lacking. A retrospective chart review was performed consecutively on newly diagnosed type 1 diabetic patients between January 1, 1999 and December 31, 2009 in our hospital – a 1700-bed teaching hospital. Clinical features and biochemical data were analyzed. A total of 18 out of 205 (8.8%) newly diagnosed patients met with criteria of FT1DM. The median age at onset was 28 years old, while 3 of them were under age 18, and the youngest was 2.5 years. The number of female patients was twice that of the male. And 2 patients developed FT1DM during pregnancy or postpartum, accounting for 22.2% of the fertile female subjects. Eight patients (44.4%) had fl u-like symptoms before developing the disease. The onset was so abrupt that the average symptomatic duration before diagnosis was 3.2±2.3 days. The BMI of the patients was 20.1±3.1kg/m2 before onset, and they almost lost no weight (0.6±1.4kg). Though the plasma glucose levels (32.0±11.7mmol/L) were extremely high, HbA1C (6.8±1.1%) were slightly above the normal range. All of the patients were with ketoacidosis, and one third of them were with coma at onset. Hyponatremia was frequent, and 4 of them had a remarkably low sodium level (<120mmol/L). Of the 11 patients tested for creatine kinase levels, one was found to be complicated with rhabdomyolysis. Only one out of 15 patients tested for autoantibodies was positive for GAD-Ab. Almost all the patients had undetectable fasting or post-load C-peptide levels. Fulminant type 1 diabetes mellitus is not uncommon in Chinese population. Associations with prodromal infection and pregnancy were frequent, which were in accordance with those reported in the literature. The onset was extremely critical, and complications were usually threatening to life. Be familiar with the clinical characteristics is important for the diagnosis as well as the treatment of FT1DM.
2455-POGlucose Metabolism Disorders in Acute Stroke PatientsLAURA F. DIACONU, VIOREL SERBAN, ROMULUS TIMAR, IOAN A. VERESIU, ADRIAN VLAD, BOGDAN TIMAR, Timisoara, Romania, Cluj-Napoca, Romania
Diabetes is a recognized risk factor for stroke. The impact of stroke on diabetes incidence rates is not known.
The aim of our study was to evaluate the prevalence of carbohydrate metabolism disorders in patients with acute stroke.
The study enrolled 142 subjects diagnosed with acute stroke, 83 males (58.45%) and 59 females (41.54%), with average age 58.44 ± 7.32 years.
Diagnosis of stroke was made based upon neurological examination and imaging investigations. Consecutively, admitted acute stroke patients were screened for glucose tolerance according to the standardized WHO protocol in the 1st, 2nd and 4th week after the stroke event.
Of patients included in the study 28 (19.72%) had previously known diabetes; 18 (12.67%) were classifi ed as having newly diagnosed diabetes; 12 (8.45%) as having both impaired glucose tolerance (IGT) and impaired fasting glucose (IFG); 11 (7.74%) presented IGT; 8 (5.63%) IFG; 52 (36.61%) had normal glucose tolerance. Thirteen patients (9.15%) had hyperglycemic values only in the 1st week - transient hyperglycemia.
Patients with diabetes, IFG and/or IGT had more severe strokes at admission and a higher rate of mortality, in compare with normoglycemic subjects (27.4% vs. 9.2%).
The prevalence of type 2 diabetes is higher in patients with stroke than in general population. In the post–acute phase of stroke, an oral glucose tolerance test should be performed in all stroke patients with no prior history of diabetes.
2456-POHbA1c and Fasting Plasma Glucose Together Predict Future Type 2 Diabetes in Japanese Better Than Each SeparatelyYUKIKO ONISHI, TOMOSHIGE HAYASHI, KYOKO KOGAWA SATO, SHOJI KAWAZU, MASATOSHI KIKUCHI, EDWARD J. BOYKO, WILFRED Y. FUJIMOTO, Tokyo, Japan, Osaka, Japan, Seattle, WA
The purpose of this study was to examine how well fasting plasma glucose (FPG), HbA1c, and the combination of FPG and HbA1c predicted type 2 diabetes (T2DM). Analyzed subjects included a cohort of 277 nondiabetic Japanese (143 men and 134 women) aged 45 to 74 years. Baseline variables included FPG measured after an overnight fast and HbA1c. A 75-g oral glucose tolerance test was used to diagnose T2DM at baseline and follow-up based on the American Diabetes Association 1997 criteria. ΔAkaike information criterion (ΔAIC) was used to evaluate which model including FPG, HbA1c, or their combination best predicted future T2DM. ΔAIC for T2DM outcome was calculated as the base model including age, gender, and BMI minus the model with FPG, HbA1c, or both added. ΔAIC ≥2 indicated a meaningful difference in goodness of fi t between models. At 5-6 years 65.5% of subjects returned for follow-up and there were 48 (17.3%) incident cases of T2DM. In multiple logistic regression analysis, both higher FPG and HbA1c were independently associated with an increased risk of T2DM. Multiple-adjusted odds ratio of FPG was 2.67 (95% CI, 1.68-4.25), and HbA1c was 1.76 (1.12-2.77) for a 1 standard deviation change (the 1 SD values of FPG and HbA1c were 10.6 mg/dl and 0.35 %, respectively). Using the area under the receiver operating characteristic (AUROC) curve analysis, the model including both FPG and HbA1c had a greater AUROC curve than those including FPG alone (0.864 VS 0.849) or HbA1c alone (0.864 VS 0.823). The combination model including both FPG and HbA1c had the highest values of ΔAIC (57.6) compared to those models including FPG alone (53.5) or HbA1c alone (40.5). We concluded that FPG was better than HbA1c in predicting future diabetes while the combined measurement of HbA1c and FPG was best.
2457-POHeart Failure in Type-2 Diabetes: Patient Characteristics and Compli-ca tions of Antidiabetic PharmacotherapyDIETHELM TSCHÖPE, PETER BRAMLAGE, CHRISTIANE BINZ, MICHAEL KREKLER, TANJA PLATE, EVELIN DEEG, KRISTIAN LÖBNER, ANSELM GITT, Bad Oeynhausen, Germany, Mahlow, Germany, Munich, Germany, Wedel, Germany, Ludwigshafen, Germany
Background: Patients with type 2 diabetes have an increased risk of heart failure (HF). However epidemiological data on patient characteristics and drug utilization are scarce.
Methods: DiaRegis is a prospective registry in Germany including 3810 patients with type-2 diabetes in 2009/2010. For the comparison of patients with or without HF Odds Ratios (OR) were determined from univariate analyses.
Results: For 3,746 patients data were available (64 patients with missing data) and 370 (9.9%) of them were reported to have HF. Overall, median (IQR) age was 65.9 (57.6-72.8) years and 46.8% were female. HF Patients were older (73.1 vs. 64.7 years; p<0.0001), had a longer diabetes duration (6.2 vs. 5.5 years; p<0.05), and had more co-morbid disease such as coronary heart disease, prior stroke/TIA, and peripheral arterial disease. They received less metformin (Met) in monotherapyand more sulfonylureas (SU). Frequent antidiabetic combinations were Met/SU (48.6%), Met/thiazolidinediones (16.5%) and Met/DPP-4-inhibitors (18.3%). After intensifi cation of therapy, HF patients received insulin more often than patients without HF (21.4 vs. 16.6%; p<0.05). Hypoglycaemia in the 12 months preceding enrolment was more frequent in patients with heart failure compared to patients without HF. This applied especially to those requiring medical assistance and non-medical assistance, respectively.
A650
For author disclosure information, see page 785.
CATEGORY
ADA-Funded Research
Epid
emio
logy
/G
enet
ics
PUB
LISH
ED O
NLY
EPIDEMIOLOGY
Heart failure(n=370)
No heart failure(n=3376)
p-value
Coronary heart disease (%) 52.9 13.8 <0.0001Peripheral arterial disease (%) 15.6 4.9 <0.0001Stroke / TIA (%) 9.5 4.1 <0.0001Hypoglycaemia (%) 17.8 10.0 <0.0001- Non-med assistance (%) 2.7 0.7 <0.001- Requiring med. attention (%) 1.6 0.2 <0.0001- Hospital admission (%) 0.5 0.3 0.43Metformin monotherapy (%) 70.5 80.2 <0.001Sulfonylurea monotherapy (%) 23.4 13.6 <0.0001
Conclusions: There was a substantial co-morbidity (CAD and PAD), in patients with heart failure. Type 2 diabetic patients with heart failure reported to have experienced more episodes of hypoglycaemia, especially those requiring medical assistance or help from another person.
Supported by: Bristol Myers Squibb and AstraZeneca
2458-POHemoglobin A1c Predicts Total and CVD Mortality in Singaporean Chinese without Known DiabetesMARK PEREIRA, ANDREW ODEGAARD, MYRON GROSS, WOON PUAY KOH, JIAN-MIN YUAN, Minneapolis, MN, Singapore, Singapore
Studies are limited, especially in Asian populations, on glycated hemoglobin (HbA1c) and risk of total and cardiovascular (CVD) mortality from prospective cohort studies. We examined associations between HbA1c and total and CVD mortality in a Southeast Asian population with high rates of diabetes and CVD. Our analysis from the Singapore Chinese Health Study included a subset of 3,385 men and women aged 48-81 at the time of the blood draw (1999-2004), when they reported never having been diagnosed with diabetes. Through the end of 2009 we observed 228 total deaths and 61 CVD deaths (ICD-9 codes 394.0 to 459.0). Self-reported chronic diseases, demographic factors, height, weight, and cigarette smoking were assessed by questionnaire. Hazard ratios (HR) for mortality according to HbA1c percentage were estimated with Cox proportional hazards regression analysis. After adjustment for age, sex, dialect group, year of interview, and education, those with undiagnosed diabetes based on HbA1c ≥6.5% had 2- to 3-fold higher mortality risk compared to those with HbA1c <6.0% (HR for total mortality = 2.02, 95%CI = 1.34 – 3.03; HR for CVD mortality = 3.33, 95%CI = 1.72 – 6.44), whereas those with intermediate HbA1c values of 6.0 to 6.5% were not at increase risk. Adjustment for body mass index and history of cardiovascular disease and cigarette smoking did not materially alter these estimates. These fi ndings suggest that HbA1c is an independent predictor of total and CVD mortality in Southeast Chinese. Studies are needed to more fully examine the distribution and cutoffs of HbA1c with mortality risk in Asian populations.
Supported by: NIH
2459-PO
WITHDRAWN
2460-POHigh Prevalence of Impaired Glucose Metabolism in Overweight Patients with Peripheral Arterial DiseaseSTEFAN BEER, PHILIPP REIN, CHRISTOPH H. SAELY, ALEXANDER VONBANK, CHRISTIAN BOEHNEL, JANA ORTMANN, HEINZ DREXEL, IRIS BAUMGARTNER, Feld-kirch, Austria, Bern, Switzerland
Epidemiologic studies show a high prevalence of type 2 diabetes mellitus (T2DM), impaired glucose tolerance (IGT), and of impaired fasting glucose (IFG) in patients with coronary artery disease. However, the prevalence of abnormal glucose metabolism in patients with sonographically proven peripheral arterial disease (PAD) is unclear and is addressed in the present study.
We enrolled 294 overweight and obese patients (223 men and 71 women) who underwent routine duplex sonography for the evaluation of suspected or established PAD and in whom PAD was verifi ed sonographically. Oral glucose tolerance tests were performed in non-diabetic subjects.
From our patients, 119 (40.5%) had a normal glucose tolerance, 31 (10.5%) IGT, and 144 (49.0%) T2DM (previously known in 121 and newly diagnosed in 23 patients). Impaired fasting glucose was diagnosed in 39 patients with normal glucose tolerance and in 12 patients with IGT. Thus, glucose metabolims was normal in only 80 (27.2%) of our PAD patients.
In conclusion, the prevalence of abnormal glucose metabolism is extremely high in overweight PAD patients. Routine screening for abnormal glucose metabolism (including oral glucose tolerance tests) in these patients therefore is warranted.
2461-POHypertension Is Less Severe in Israeli Diabetic Men of Yemenite Origin Than Non-Yemenite OriginMORAN BLAYCHFELD-MAGNAZI, NAAMA RESHEF, TAIBA ZORNITZKI, SHIMON WEITZMAN, ANNE E. SUMNER, HILLA KNOBLER, Rehovot, Israel, Beer-Sheva, Israel, Bethesda, MD
From 1949 to 1951, 47,000 Jews left Yemen for Israel, and experienced major change in environment and culture. At immigration, the prevalence of type 2 diabetes mellitus (T2DM) in Yemenite Jews was <1%. Recent data from the Israel Center for Disease Control indicates that the prevalence of T2DM in Yemenite origin Israelis (YI) is higher than in non-Yemenite origin Israelis (NYI), with an OR of 1.78 (95% CI 1.13-2.8, P=0.01) if age ≥ 65 yr. High blood pressure (HBP) is common in rapidly urbanized societies. It is unknown if the burden of HBP differs in YI diabetics and NYI diabetics. In 2008, the history of HBP was retrospectively determined by chart review of 104 diabetic men (36 YI, 68 NYI) at a health clinic in the Mid-South region of Israel. Subjects were contacted, and data on dietary and physical activity were collected. YI and NYI diabetics did not differ in age or duration of T2DM, but YI had a lower BMI than NYI (27±5 vs. 32±5 kg/m2, P<0.001). Systolic (SBP) and diastolic blood pressure (DBP) measurements did not differ in YI and NYI men (SBP: 127±21 vs. 127±13 mm Hg, P=0.94; DBP: 72±11 vs. 71±10, mm Hg, P=0.61). Yet fewer YI than NYI were diagnosed as hypertensive (61% vs. 87%, P< 0.001). Furthermore, the severity of HBP, defi ned by the duration of HBP (7±9 vs. 12±10y, P<0.05) and number of BP medications (1.6±1.8 vs. 2.8±1.6, P<0.001) were less in YI vs. NYI men. Additionally, YI men were more likely than NYI to have the diagnosis of HBP made after the diagnosis of T2DM (77% vs. 49%, P<0.01). Furthermore BP prevalence and severity did not differ in immigrant and Israeli born Yemenite men. As physical activity, diet and specifi cally salt intake, did not differ in YI and NYI, environmental factors cannot account for differences in hypertension severity in the men. Even with the potential for cultural stress, hypertension is less severe in diabetic men of Yemenite origin than non-Yemenite origin. Prospective studies will determine if less severe HBP in diabetic YI translates into lower rates of diabetic renal failure and cardiac compromise.
2462-PO
WITHDRAWN
2463-POImpact of Medication Treatment Prior to and during Hospitalization on Mortality and Readmission in Patients with HyperglycemiaRATTAN JUNEJA, GAIL L. KONGABLE, MEHUL DALAL, TERRY GERMANSON, Indianapolis, IN, Charlottesville, VA, Bridgewater, NJ
Little is known about the impact of medical management of diabetes before hospitalization on in-hospital mortality and readmissions. Using a hospital database linked to outpatient data with 73,977 admissions between July 1, 2003 and December 31, 2009, we identifi ed 18,078 patients with a clinical encounter 12 months before and after an “index” admission (IA). At IA mean age was 50 ± 16 years and 52% were female. We evaluated diabetes (DM) status and use of antidiabetic medication pre-admission (PA) and during IA. At IA 25% had pre-existing DM (Group A), 7% were newly diagnosed (Group B), 27% were not DM but with hyperglycemia (any BG > 140 mg/dl) (Group C) and 41% were not DM with no hyperglycemia (Group D). During IA, nearly 60% had hyperglycemia or DM diagnosis and 349/18,078 (1.9%) died. Group C had the highest mortality during IA, 216/349 (62%), a 2.8 fold increase compared to Group A and B DM patients (p<.0001). We further examined the association of mortality with anti-diabetes, antihypertensive and antilipidemia medication treatment. Patients receiving insulin or oral hyperglycemic medication (OHM) either PA or during IA experienced lower

A651
For author disclosure information, see page 785.
CATEGORY
ADA-Funded Research
Epid
emio
logy
/G
enet
ics
PUB
LISH
ED O
NLY
EPIDEMIOLOGY
mortality than those not receiving insulin or OHM, (p<.0001, p<.007). Less than half of Group A patients were receiving antihypertensive and antilipidemia medication treatments PA. In Group A and B patients, patients who were not taking these therapies PA had a 2- and 3-fold higher morality risk than those patients who were. Mortality in patients in Group C and D was not affected by these medications. This study showed that mortality risk was lower in patients receiving Insulin and or OHM either PA or during IA across all groups, suggesting that hyperglycemia treatment offers a mortality benefi t. The presence of drugs commonly associated with CV protection in the outpatient setting might also offer some protection for hospitalized patients. Further analysis of mortality risk adjusting for comorbidity at IA will be required to confi rm this relationship.
Supported by: sanofi -aventis
2464-POImpact of Mitochondrial Genetic Heteroplasmy of Peripheral Leukocytes on Diabetic Complications of Japanese Subjects with Mitochondrial DNA 3243 (A to G) MutationAYA FUJIMOTO, KUNIMASA YAGI, MASAKO SUGIHARA, NAOKO ITO, EIKO KITAMOTO, AZUSA OBATAKE, MIYUKI KUBOTA, KAORU NAKANO, YOSHIYU TAKEDA, MASAKAZU YAMAGISHI, Takaramachi, Japan, Kanazawa, Japan
Diabetes mellitus with mitochondrial DNA 3243 A to G mutation (MDM) accounts for about 1% of the diabetic population, thus potential number of the MDM subjects should be more than we usually recognize. In addition, since MDM subjects frequently accompany serious cardiovascular complications including heart failure, the importance of clinical management of MDM needs be recognized. However, to date there are very few reports on the clinical course and clinical features of vascular complications in MDM.
We investigated clinical records of 18 MELAS subjects from 16 families we previously diagnosed as mt-DNA 3243 A to G mutation positive on diabetic cmmplications, cardiomyopathy, and treatment regimens. We also evaluated the heteroplasmic ratio (HPR) of the mt-DNA mutation in peripheral blood leukocytes with fl uorescent conjugated DNA probes.
Nine out of the 18 subjects were alive. Their clinical features were as below; age 46.7±13.1 yrs, HbA1c 7.00±1.51%, insulin therapy in 7 (78%), diabetic retinopathy in 2 (22%), diabetic neuropathy in 6 (67%) and heart failure in 2 (22%).
The other 9 cases died at the age of 53.7±8.96 with mainly heart failure (67%) and pseudo ileus (22%). The deceased cases also accompanied diabetic retinopathy in 5 (56%) and diabetic neuropathy in 5 (56%).
In the whole subjects, age at the diagnosis of diabetes showed signifi cant negative correlationship with HPR of mutated mt-DNA. In addition, signifi cant positive correlation was observed between HPR and E/A (ratio of the height of early diastolic fi lling wave to the height of atrial fi lling wave on ultrasound cardiography). On the other hand, the severity of diabetic complications including renal dysfunction and heart failure did not show signifi cant relationship with HPR. These results suggest the importance of appropriate managements to preserve cardiac and renal function, which in turn determines the prognosis of subjects with mt-DNA mutations.
2465-POIncidence and Type of Cancer in Japanese Subjects with Type 2 DiabetesSACHIKO HONJO, YUKIKO KAWASAKI, YOSHIYUKI HAMAMOTO, KANAKO MORI, HIROKI IKEDA, YOSHIHARU WADA, KAZUHIRO NOMURA, HIROYUKI KOSHIYAMA, Osaka, Japan
We prospectively investigated the frequency and type of cancer in Japanese subjects with type 2 diabetes. Subjects included a total of 3004 consecutive patients with type 2 diabetes, who visited our clinic during two years from January 2009 to December 2010. A total of 51 patients were newly diagnosed to have cancer. The mean age was 71[10] years and male/female ratio was 33/18. The most frequent site of cancer was pancreas (n=11), followed by colon (n=10), stomach (n=10), liver (n=4), lung (n=3), breast (n=3), kidney (n=3), bile duct (n=3), esophagus (n=2), and others. The double cancer was found in two subjects. The A1C at the diagnosis of cancer was 8.3[2.4]%, and the therapy for diabetes was diet and exercise only (n=8), oral antidiabetic drugs (OADs) (n=26) and insulin (n=17). They included ten patients, who had recently visited our clinic during these 6 months. The therapeutic variations (diet and exercise only 15.7%, OADs 51.0%, and insulin 33.3%) of the patients with cancer were not signifi cantly different from those without malignancy in our clinic (diet and exercise only 18.0%, OADs 42.9%, and insulin 39.1%). The subjects without any symptom and/or sign were 46.9%.
In the cases with cancer who had recently visited our clinic during these 6 months(n=10), 50% of them were found to have pancreatic cancer. This is in line with a previous report, suggesting that onset of diabetes preceded the diagnosis of asymptomatic pancreatic cancer. The mean HbA1c was signifi cantly higher in the patients with pancreatic cancer than that in the patients with other cancers (9.6 % vs. 7.4%, p<0.05). Furthermore, among the patients with pancreatic cancer, seven of eleven of them were found to have new-onset diabetes.
The present registry indicated that the incidence of cancer was considerably high in Japanese patients with type 2 diabetes, and that the therapeutic intervention, such as insulin or metformin, might not affect the incidence of cancer. Furthermore, nearly half of them were without any symptom and/or sign, justifying the routine screening for malignancy in subjects with type 2 diabetes.
2466-POIncreased Serum Fibroblast Growth Factor 21(FGF21) Levels Are Associated with Metabolic Syndrome and Dyslipidemia in Type 2 Diabetic PatientsJANG YEL SHIN, MI YOUNG LEE, YOUNG GOO SHIN, CHOON HEE CHUNG, Wonju-Si, Republic of Korea
Fibroblast growth factor 21 (FGF21) has been found to be increased in patients with obesity, nonalcoholic fatty liver disease (NAFLD), metabolic syndrome (MetS), and type 2 diabetes. In this study, we investigated the associations of the serum FGF21 levels with metabolic parameters in type 2 diabetic patients.
We enrolled 240 type 2 diabetic patients (mean age 56.9 ± 9.3 years; body mass index (BMI) 26.0 ± 3.4 kg/m2; male 57.1%; duration of diabetes 7.1 ± 6.5 years; HbA1C 7.6 ± 1.5%). Clinical and biochemical metabolic parameters including hepatic enzymes, lipid profi les, C-reactive protein (CRP), and tumor necrosis factor-α (TNF-α) levels were measured. Serum FGF21 levels were determined by ELISA. The severity of NAFLD was measured using liver ultrasound.
Patients with MetS and overt NAFLD (greater than moderate degree) were 68.3% and 43.3%, respectively. FGF21 levels in patients with MetS, high triglycerides (TG≥150 mg/dl), and low HDL cholesterol (men < 40 and women < 50 mg/dl) were signifi cantly higher compared to those without MetS, high TG, and low HDL (p < 0.05). However, FGF21 levels in patients with overt NAFLD, hypertension, high BMI (≥ 27 kg/m2), and high waist circumference (men ≥ 90 and women ≥ 85 cm) were not signifi cantly increased. FGF21 level was positively correlated with female gender, hypertension, overt NAFLD, BMI, HOMA-IR, TG, γ-glutamyltransferase (γGT), CRP, and TNF-α (p < 0.05). Also, it was negatively correlated with HDL (p < 0.05). In multivariate regression analysis, female gender, TG, HDL, and TNF-α were independently associated with FGF21 (p < 0.05). The odds ratios (ORs) for the presence of MetS were signifi cantly increased with increasing tertile of FGF21 after adjustments for age and sex [OR (95%CI) = 1: 2.37 (1.20 - 4.68): 2.68 (1.35 - 5.29)]. The ORs in the highest tertile of FGF21 was remained signifi cant even after further adjustments for overt NAFLD, BMI, γGT, CRP, and HOMA-IR [OR (95%CI) = 2.32 (1.01 - 5.30)].
In conclusion, our data demonstrated that increased FGF21 levels were associated with MetS and were independently correlated with high TG and low HDL in type 2 diabetic patients.
2467-POInsulin Resistance Is Associated with the Metabolic Syndrome but Not with Peripheral Arterial DiseaseALEXANDER VONBANK, CHRISTOPH H. SAELY, PHILIPP REIN, CHRISTIAN BOEH-NEL, VERONIKA KIENE, VERONIKA DREXEL, SUSANNE GREBER, HEINZ DREXEL, Feld-kirch, Austria
Insulin resistance (IR) is the key feature of the metabolic syndrome (MetS); its association with peripheral arterial disease (PAD) is unclear. We hypothesised that insulin resistance is associated with both the MetS and sonographically proven PAD.
IR was determined using the HOMA index in 197 patients with sono-graphically proven PAD as well as in 214 controls who did not have a history of PAD and in whom coronary artery disease was ruled out angiographically; the MetS was defi ned according to NCEP-ATPIII criteria.
HOMA-IR scores were higher in MetS patients than in subjects without the MetS (5.9±6.2 vs. 2.9±3.9; p<0.001). However, HOMA IR did not differ signifi cantly between patients with PAD and controls (4.2±5.4 vs. 3.3±4.3; p=0.124). When both, the presence of the MetS and of PAD was considered, HOMA-IR was signifi cantly higher in patients with the MetS both among those with PAD (6.1±5.7 vs. 3.6±5.2; p<0.001) and among controls (5.8±6.8

A652
For author disclosure information, see page 785.
CATEGORY
ADA-Funded Research
Epid
emio
logy
/G
enet
ics
PUB
LISH
ED O
NLY
EPIDEMIOLOGY
vs. 2.3±1.8; p<0.001), whereas it did not differ signifi cantly between patients with PAD and controls among patients with the MetS (5.8±6.8 vs. 6.1±5.7; p=0.587) nor among those without the MetS (2.3±1.8 vs. 3.6±5.2; p=0.165). Similar results were obtained with the IDF or harmonized consensus defi nitions of the MetS.
We conclude that IR is signifi cantly associated with the MetS but not with sonographically proven PAD.
2468-POKetoacidosis at Diagnosis of Type 1 Diabetes in a Nationwide Survey in Brazil: Tendency for Temporal Changing over 30 YearsCARLOS A. NEGRATO, ROBERTA A. COBAS, LUIZ CANANI, NEUSA B. ARAUJO, JORGE LUESCHER, MILTON FOSS, ANTONIO C. PIRES, SAULO CAVALCANTI, JANICE SEPULVIDA, HENRIQUETA ALMEIDA, LUIZ ARAUJO, NELSON RASSI, NAIR MELO, ALBERTO RAMOS, ROSSANA AZULAY, DEBORA JERZINI, SERGIO DIB, MARILIA B. GOMES, BRASDIAB1SG, Bauru, Brazil, Rio de Janeiro, Brazil, Porto Alegre, Brazil, São Paulo, Brazil, Belo Horizonte, Brazil, Londrina, Brazil, Joinville, Brazil, Goiania, Brazil, Sergipe, Brazil, Paraiba, Brazil, Maranhao, Brazil, Manaus, Brazil
Diabetic ketoacidosis (DKA) is the leading cause of acute morbidity and mortality in children with type 1 diabetes (T1D) and frequently present at diagnosis. The aim of this study was to perform a temporal analysis on frequency of DKA at onset of T1D in Brazil and to identify risk factors for this clinical condition. This was a retrospective cross-sectional multicenter study conducted between January 2009 and December 2010 in 28 public clinics from 23 cities. Medical records from 3591 patients (56.9% females, 56.7% Caucasians), aged 21.0 ± 10.4 years, age at diagnosis of 11.7± 7.9 years, duration of T1D of 9 ± 6.9 years were analyzed.The sample was representative to the Country population density (38.8%, 23.0%, 31.7% and 6.6% from Southeastern, South, North/Northeast and Middle-east regions, respectively). Logistic regression model (Forward,Wald) with DKA (Yes/No) as dependent variable and other variable of interest as independent variables was performed.The diagnosis of T1D was done by the presence of DKA in 1520 patients (42.3%); by fasting plasma glucose (FPG) in 1413 patients (39.4%); by casual blood glucose measure in 515 patients (14.4%); by OGTT in 64 patients (1.8 %)and miscellaneous in 74 patients (2.1%). In the multivariate (n= 3460), male gender, low socioeconomic class, country region, diagnosis of T1D before 5 years-old and before the year 2000, were associated with a higher odds of presenting DKA at diagnosis (table 1). After the year 2000, a tendency for temporal changing in the pattern of diagnosis of T1D in Brazil was noted with more cases being diagnosed by FPG, casual blood glucose measure and OGTT.The most important predictors of DKA besides gender, economic class, age and region of the country was the year of diagnosis. These data are important to the development of strategies for diagnosis of T1D at national population health care system.
OR p-value(Intercept) 0.000Diagnosis before 2000 1.06 0.06Male 1.08 0.01Very low/Low economic class 1.27 0.000Southeastern region 1.34 0.000Age < 5 anos 1.67 0.000Non-caucasians 0.95 0.50
Supported by: Sociedade Brasileira de Diabetes, Farmanguinhos
2469-POKey Role of Low HDL Cholesterol for the Association of the Meta bolic Syndrome with Infl ammation in Patients with Peripheral Arterial DiseaseCHRISTIAN BOEHNEL, JANA ORTMANN, PHILIPP REIN, CHRISTOPH H. SAELY, ALEXANDER VONBANK, STEFAN BEER, IRIS BAUMGARTNER, HEINZ DREXEL, Feldkirch, Austria, Bern, Switzerland
The association of the metabolic syndrome (MetS) and of the individual MetS stigmata with infl ammation in patients with peripheral arterial disease (PAD) has not been investigated yet.
We enrolled 410 consecutive patients who underwent routine duplex sonography for the evaluation of suspected or established PAD Fontain stages I-III and in whom PAD was verifi ed sonographically. According to National Cholesterol Education Programme Adult Treatment Panel III criteria, the MetS was defi ned in the presence of at least 3 out of the 5 quantitatively defi ned criteria large waist circumference, low HDL cholesterol, high triglycerides, high blood pressure, and elevated fasting glucose.
In univariate analyses, CRP was higher in patients with the MetS (n=200) than in those who did not have the MetS (0.94±1.88 vs. 0.56±1.18 mg/dl; p=0.001), and also was higher in patients who fulfi lled the large waist (0.93±1.93 vs. 0.59±1.16 mg/dl; p = 0.009) and the low HDL criteria (1.10±1.66 vs. 0.61±1.52 mg/dl; p<0.001) than in those who did not. Importantly however, after adjustment for gender, smoking, BMI and LDL cholesterol by means of ANCOVA only the low HDL cholesterol criterion (F=6.06; p=0.014) remained signifi cantly associated with CRP. The signifi cant and independent association of low HDL with CRP was confi rmed after additional adjustment for all other MetS traits (F=7.76; p=0.006).
We conclude that among patients with sonographically proven PAD, low HDL cholesterol drives the association between the MetS and subclinical infl ammation. This observation is well in line with the paramount role of low HDL cholesterol as a marker of cardiovascular risk.
2470-POLong Term Mortality and Morbidity after Acute Ischemic Stroke in Subjects with and without Diabetes MellitusALEXIOS SOTIROPOULOS, ATHANASIA PAPAZAFIROPOULOU, ANTHI KOKOLAKI, DIMITRA MOURLOUKOU, ELIAS TAMVAKOS, THEODOROS PEPPAS, STAVROS BOUSBOULAS, STAVROS PAPPAS, Nikaia, Greece
Background and aims: A lot of studies have showed that type 2 diabetes mellitus (T2D) has a predictive signifi cance for increased in-hospital mortality after acute ischemic stroke. The aim of the present study was to estimate the impact of T2D in long term mortality and cardiovascular morbidity in diabetic subjects compared to nondiabetic subjects hospitalized for an acute ischemic stroke.
Material and methods: We performed a retrospective analysis of the medical records of 46 diabetic subjects (34 males / 12 females, mean age ± SD: 76.4 ± 6.4 years) and 106 non diabetic subjects (48 males / 58 females, mean age ± SD: 76.9 ± 7.2 years) hospitalized in our hospital for ischemic stroke during the period from January 2006 to December 2007. In the study we included only subjects with known status of health and medical history (made by a telephone contact on December 2010).
Results: Death rates did not differ between diabetic and nondiabetic subjects [34.8% vs. 32.1%, respectively, P=0.77]. Logistic regression analysis demonstrated that death was related with age [odds ratio (OR): 1.15, 95% Confi dence Intervals (95% CI): 1.09-1.02, P=0.01) and length of hospital stay (OR: 1.14, 95% CI: 1.01-1.29, P=0.03). 8.5% of the nondiabetic subjects were diagnosed with T2D during the period after the hospitalization. No difference was observed between the two study groups regarding the onset of a new cerebrovascular event [6.5% vs. 11.3%, respectively, P=0.35] as well as coronary artery disease [6.5% vs. 8.5%, respectively, P=0.66].
Conclusion: There were no signifi cant differences regarding death rates between diabetic and nondiabetic subjects hospitalized for an acute ischemic stroke after a 3 years follow up period. The same pattern was observed regarding the onset of a new cerebrovascular event as well as coronary artery disease.
2471-POLow Bone Mineral Density Is Not Associated with Coronary Athero-sclerosis in Patients with Type 2 DiabetesSTEFAN BEER, CHRISTOPH H. SAELY, GUENTER HOEFLE, PHILIPP REIN, ALEX-ANDER VONBANK, JOHANNES BREUSS, BARBARA GAENSBACHER, AXEL MUEND LEIN, HEINZ DREXEL, Feldkirch, Austria
The association between low bone mass and angiographically determined coronary atherosclerosis is unclear, this especially holds true for patients with type 2 diabetes (T2DM).
We enrolled 978 consecutive patients, 254 (26.0%) with T2DM and 724 (74.0%) nondiabetic subjects who were undergoing coronary angiography for the evaluation of established or suspected stable coronary artery disease (CAD). Bone mineral density (BMD) was assessed by dual X-ray absorptiometry; signifi cant CAD was diagnosed in the presence of coronary stenoses with lumen narrowing ≥70%.
Of the total study cohort (63.7% men; mean age 65±11 years) 35.7% (n=349) had osteopenia and 14.0% (n=137) had osteoporosis. Signifi cant CAD was present in 44.5% (n=435) of our patients. In patients with T2DM the prevalence of signifi cant CAD did not differ signifi cantly between patients with normal BMD, osteopenia or osteoporosis (42.9%, 37.4% and 45.4%; ptrend=0.251). Concordantly, neither osteopenia nor osteoporosis were signifi cantly associated with the presence of signifi cant CAD after multivariate adjustment (adjusted ORs 1.09 [95% CI 0.62-1.92], p=0.118 and 1.05 [0.45-2.46], p=0.913, respectively). In non-diabetic subjects results were similar: The prevalence of signifi cant CAD did not differ signifi cantly

A653
For author disclosure information, see page 785.
CATEGORY
ADA-Funded Research
Epid
emio
logy
/G
enet
ics
PUB
LISH
ED O
NLY
EPIDEMIOLOGY
between patients with normal BMD, osteopenia or osteoporosis (42.9%, 37.4% and 45.4%; ptrend=0.251) and no association between the presence of osteopenia or osteoporosis and signifi cant CAD was observed after multivariate adjustment (OR 0.83 [95% CI 0.59-1.17], p=0.292 and 1.27 [0.79-2.04], p=0.319, respectively).
We conclude that BMD neither among patients with T2DM nor among non-diabetic subjects is associated with angiographically determined coronary atherosclerosis.
2472-POManaging 90 Million Type 2 Diabetes—Patient Profi le, Risk Factors, and Treatment Patterns—CCMR-3B StudyLINONG JI, DAYI HU, CHANGYU PAN, GUANGWEI LI, GUANG NING, YIMING MU, CHANGSHENG MA, YONG HUO, JIANPING WONG, QIUHE JI, XINGWU RAN, QIFU LI, BENLI SU, RENMING HU, CHUANMING HAO, HAN LEI, DANYI ZHANG, CCMR-3B, Beijing, China, Shanghai, China, Guang Zhou, China, Xi An, China, Chengdu, China, Dalian, China, Chongqing, China, Berwyn, PA
Diabetes prevalence has grown rapidly in China. Nationwide Assessment of CVD Risk Factors: Blood Pressure, Blood Lipid, and Blood Glucose, in Chinese Patients with Type 2 Diabetes (T2D) – part of China Cardiometabolic Registries (CCMR-3B) was conducted to assess patient profi le, risk factors, and treatment patterns. This was a cross sectional, observational study. Patients were recruited from all three tiers of hospitals across all six major geographic regions in China by cardiologists, nephrologists and endocrinologist to better ensure the broad representation of the patient pool in the study. To detect the difference between regions and tiers of hospitals in T2D management a sample size of 25,000 was determined. A total of 5099 patients were included at the time of abstract. Complete data set will be included for reporting at presentation. Among them were 41.89% male, 47.72% age 65 years or older, 32.52% smokers, 55.38% BMI > 24 Kg/m2, and 30.91% had family history of T2D. The mean HbA1C, blood pressure, serum LDL were 7.23+2.08%, 131.1/77.8+15.1/8.6 mmHg, 2.83+0.98 mmol/L. Age, smoking, drinking, and exercise were strong predictors of HbA1c (p<0.001) followed by BMI (p=0.002). There was a strong trend of association between the year of T2D diagnosis and metabolic syndromes (Table 1). The majority of patients were on one or two oral anti-diabetic drugs (OAD) and only 30% of them were on insulin (Table 2). While T2D patient profi le in China is similar to that in the US, the management patterns are different. The high prevalence and unique management pattern coupled with unique healthcare structure in China requires special attention for more effective diagnosis and treatment.
Table 1.
Year of T2D DiagnosisAll Patients (N=5099) <1 year
(n=411, 8.06%)1-5 Year
(n=2135, 41.87%)6– 10 years
(n=918, 18.0%) >10 Years
(n=1635,32.07%)Metabolic Syndrome N (%) 160(38.93%) 909 (42.58%) 462 (50.33%) 834 (51.01%)
Table 2.
OneOAD
TwoOADs
>TwoOADs
InsulinAlone
Insulin +One OAD
Insulin + Two OADs
Hearbal Medicin Alone
All (n=5099) 2056 (40.32%)
1565 (30.69%)
507(9.94%)
656(12.87%)
631(12.87%)
252(4.94%)
252(4.94%)
Supported by: Merck
2473-POMeasured Nutritional Biomarkers Associated with Risk of Type 2 Diabetes: A Systematic ReviewSILVIA C. EUFINGER, MARY B. WEBER, K.M. VENKAT NARAYAN, Atlanta, GA
Dietary factors (excessive caloric intake, poor diet quality) play an intrinsic role in the pathogenesis of obesity, insulin resistance (IR), and type 2 diabetes mellitus (T2DM); however, measuring dietary factors is often subjective and challenging. We, therefore, systemically reviewed epidemiological evidence on the association between objectively measured nutritional biomarkers and IR among healthy individuals. Using the PubMed database as well as reference lists of searched papers, 31 individual cohort studies reported between 1990 and December 2010 were identifi ed. The number of subjects (81 to 21,831), follow-up length (0-27y), and factors adjusted for varied between studies. We found evidence of an association of vitamin D, antioxidant vitamins (vitamins A, C and E), and minerals (ferritin, magnesium calcium, selenium, and phosphate) with IR. For vitamin D, 9 studies were identifi ed, all of which showed a signifi cant inverse association between serum 25(OH)D and IR (β-coeffi cients with fasting plasma glucose
varied from -0.0023 to -0.17; β-coeffi cients with the homeostatic model assessment of insulin resistance (HOMA-IR) varied from -0.003 to -0.0061). For vitamins A, C and E, a total of 5 studies were identifi ed, most of which reported a protective association (OR for risk of diabetes in the highest vs. lowest quantile of serum concentration varied from 0.18 to 0.68 depending on the vitamin measured). For the minerals, 17 papers were identifi ed showing different directions of association for each mineral. For example, in the majority of ferritin studies (7 out of 8), elevated serum ferritin levels were signifi cantly associated with an increased risk of diabetes (correlation coeffi cients between serum ferritin and plasma glucose concentrations varied from 0.08 to 0.42; OR for new onset diabetes in the highest vs. lowest quartile of serum ferritin varied from 2.96 to 7.4). Evidence from this systematic review demonstrates the potential importance of vitamin D, antioxidant vitamins, and various minerals in helping to identify persons-at-risk of developing IR prior to onset of T2DM. The literature on nutritional biomarkers, however, remains sparse.
2474-POMetabolic Syndrome Does Not Detect Metabolic Risk in Black African MenDARLEEN C. CASTILLO, UGOCHI J. UKEGBU, MADIA RICKS, MICHAEL G. KNIGHT, BERNARD V. MILLER, BARBARA M. ONUMAH, ANNE E. SUMNER, Bethesda, MD, Washington, DC
The ability of the Metabolic Syndrome (MetS) to detect risk for cardiovascular disease (CVD) and type 2 diabetes mellitus (T2DM) in African Americans (AA) has been challenged. Further, the ability of the MetS to detect metabolic risk in Black Africans (BA) is unknown. Defi ning metabolic risk by the fi ve MetS factors as well as glucose tolerance status and body fat distribution, our goal was to compare both metabolic risk and the frequency of MetS in BA and AA men. The subjects were 83 men (34 BA, 49 AA, age 38±6; mean±SD). Glucose tolerance status was determined by OGTT. Visceral adipose tissue (VAT) was measured by computerized tomographic (CT) scan. MetS was determined by the presence of 3 out of 5 factors (increased waist circumference (WC), high triglyceride (TG), low high density lipoprotein-cholesterol (HDL-C), high blood pressure (BP) and fasting hyperglycemia). The prevalence of MetS was the same for BA and AA men (12% vs. 12%, P=0.95). WC, TG and HDL-C levels were not signifi cantly different by ethnicity. But BP, fasting glucose, 2h glucose and the odds of abnormal glucose tolerance (OR: 2.8, 95% CI: 1.1-7.0) were higher in BA than AA men. Further, VAT was higher in BA than AA men. Results are in Table. In BA men, the presence of risk factors associated with the future development of CVD and T2DM are concerning, specifi cally high BP, abnormal glucose tolerance status and high visceral fat mass. As the MetS prevalence is the same in both groups, the MetS does not appear to detect the high metabolic risk of BA men.
Table: Subject Characteristics
Variables* Black Africans African Americans P-ValueBMI (kg/m2) 27.5 ± 3.7 29.2 ± 4.0 0.06Systolic BP (mmHg) 130 (125, 134) 120 (116, 124) <0.01Diastolic BP (mmHg) 79 (76, 82) 72 (69, 74) <0.010h Glucose (mg/dL) 95 (92, 98) 89 (87, 91) <0.012h Glucose (mg/dL) 145 (136, 154) 121 (113, 128) <0.01VAT (cm2) 124.5 (109, 140) 102.3 (90, 115) <0.05
*Mean±SD or adjusted for BMI (95% CI)
2475-POMetabolic Syndrome Help Finding the Candidates for Oral Glucose Tolerance Test in a High Risk Population in Beijing ChinaPING ZENG, FENG XUE ZHU, YI ZHANG, SHU WANG, Beijing, China
The objectives of this study are to investigate the association of metabolic syndrome or its components with the probability of IGT in high risk population who can access the regular health examination, therefore to provide information for clinical practitioners to identify appropriate candidates for OGTT.
There were totally 955 eligible subjects (423males and 532 females) without diagnosed diabetes participating in this study. 249 subjects (105 males and 144 females) were founded having IGT. The subjects with IGT were tended to be older, had higher level of waist circumference, fasting glucose, triglycerides, systolic blood pressure, diastolic blood pressure and lower HDL cholesterol level. Persons with metabolic syndrome had statistically higher risk of presenting IGT than its reference group.
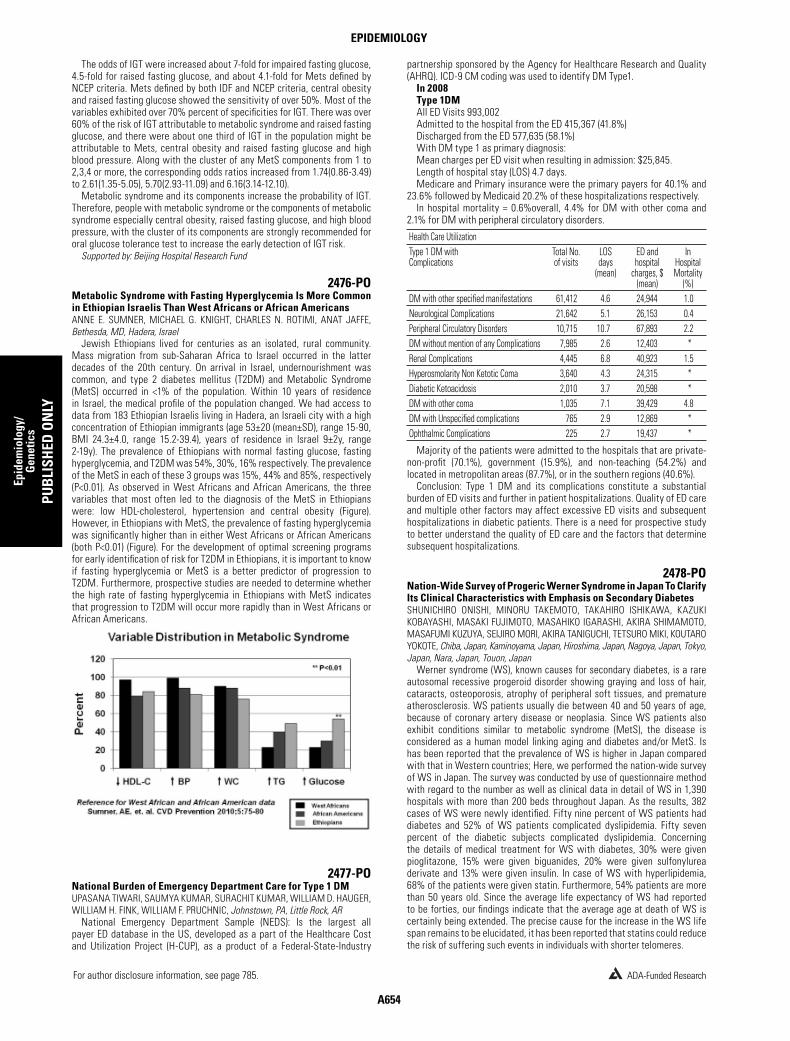
A654
For author disclosure information, see page 785.
CATEGORY
ADA-Funded Research
Epid
emio
logy
/G
enet
ics
PUB
LISH
ED O
NLY
EPIDEMIOLOGY
The odds of IGT were increased about 7-fold for impaired fasting glucose, 4.5-fold for raised fasting glucose, and about 4.1-fold for Mets defi ned by NCEP criteria. Mets defi ned by both IDF and NCEP criteria, central obesity and raised fasting glucose showed the sensitivity of over 50%. Most of the variables exhibited over 70% percent of specifi cities for IGT. There was over 60% of the risk of IGT attributable to metabolic syndrome and raised fasting glucose, and there were about one third of IGT in the population might be attributable to Mets, central obesity and raised fasting glucose and high blood pressure. Along with the cluster of any MetS components from 1 to 2,3,4 or more, the corresponding odds ratios increased from 1.74(0.86-3.49) to 2.61(1.35-5.05), 5.70(2.93-11.09) and 6.16(3.14-12.10).
Metabolic syndrome and its components increase the probability of IGT. Therefore, people with metabolic syndrome or the components of metabolic syndrome especially central obesity, raised fasting glucose, and high blood pressure, with the cluster of its components are strongly recommended for oral glucose tolerance test to increase the early detection of IGT risk.
Supported by: Beijing Hospital Research Fund
2476-POMetabolic Syndrome with Fasting Hyperglycemia Is More Common in Ethiopian Israelis Than West Africans or African AmericansANNE E. SUMNER, MICHAEL G. KNIGHT, CHARLES N. ROTIMI, ANAT JAFFE, Bethesda, MD, Hadera, Israel
Jewish Ethiopians lived for centuries as an isolated, rural community. Mass migration from sub-Saharan Africa to Israel occurred in the latter decades of the 20th century. On arrival in Israel, undernourishment was common, and type 2 diabetes mellitus (T2DM) and Metabolic Syndrome (MetS) occurred in <1% of the population. Within 10 years of residence in Israel, the medical profi le of the population changed. We had access to data from 183 Ethiopian Israelis living in Hadera, an Israeli city with a high concentration of Ethiopian immigrants (age 53±20 (mean±SD), range 15-90, BMI 24.3±4.0, range 15.2-39.4), years of residence in Israel 9±2y, range 2-19y). The prevalence of Ethiopians with normal fasting glucose, fasting hyperglycemia, and T2DM was 54%, 30%, 16% respectively. The prevalence of the MetS in each of these 3 groups was 15%, 44% and 85%, respectively (P<0.01). As observed in West Africans and African Americans, the three variables that most often led to the diagnosis of the MetS in Ethiopians were: low HDL-cholesterol, hypertension and central obesity (Figure). However, in Ethiopians with MetS, the prevalence of fasting hyperglycemia was signifi cantly higher than in either West Africans or African Americans (both P<0.01) (Figure). For the development of optimal screening programs for early identifi cation of risk for T2DM in Ethiopians, it is important to know if fasting hyperglycemia or MetS is a better predictor of progression to T2DM. Furthermore, prospective studies are needed to determine whether the high rate of fasting hyperglycemia in Ethiopians with MetS indicates that progression to T2DM will occur more rapidly than in West Africans or African Americans.
2477-PONational Burden of Emergency Department Care for Type 1 DMUPASANA TIWARI, SAUMYA KUMAR, SURACHIT KUMAR, WILLIAM D. HAUGER, WILLIAM H. FINK, WILLIAM F. PRUCHNIC, Johnstown, PA, Little Rock, AR
National Emergency Department Sample (NEDS): Is the largest all payer ED database in the US, developed as a part of the Healthcare Cost and Utilization Project (H-CUP), as a product of a Federal-State-Industry
partnership sponsored by the Agency for Healthcare Research and Quality (AHRQ). ICD-9 CM coding was used to identify DM Type1.
In 2008Type 1DMAll ED Visits 993,002Admitted to the hospital from the ED 415,367 (41.8%)Discharged from the ED 577,635 (58.1%)With DM type 1 as primary diagnosis:Mean charges per ED visit when resulting in admission: $25,845.Length of hospital stay (LOS) 4.7 days.Medicare and Primary insurance were the primary payers for 40.1% and
23.6% followed by Medicaid 20.2% of these hospitalizations respectively.In hospital mortality = 0.6%overall, 4.4% for DM with other coma and
2.1% for DM with peripheral circulatory disorders.
Health Care UtilizationType 1 DM withComplications
Total No. of visits
LOS days
(mean)
ED and hospital
charges, $ (mean)
In Hospital Mortality
(%)DM with other specifi ed manifestations 61,412 4.6 24,944 1.0Neurological Complications 21,642 5.1 26,153 0.4Peripheral Circulatory Disorders 10,715 10.7 67,893 2.2DM without mention of any Complications 7,985 2.6 12,403 *Renal Complications 4,445 6.8 40,923 1.5Hyperosmolarity Non Ketotic Coma 3,640 4.3 24,315 *Diabetic Ketoacidosis 2,010 3.7 20,598 *DM with other coma 1,035 7.1 39,429 4.8DM with Unspecifi ed complications 765 2.9 12,869 *Ophthalmic Complications 225 2.7 19,437 *
Majority of the patients were admitted to the hospitals that are private-non-profi t (70.1%), government (15.9%), and non-teaching (54.2%) and located in metropolitan areas (87.7%), or in the southern regions (40.6%).
Conclusion: Type 1 DM and its complications constitute a substantial burden of ED visits and further in patient hospitalizations. Quality of ED care and multiple other factors may affect excessive ED visits and subsequent hospitalizations in diabetic patients. There is a need for prospective study to better understand the quality of ED care and the factors that determine subsequent hospitalizations.
2478-PONation-Wide Survey of Progeric Werner Syndrome in Japan To Clarify Its Clinical Characteristics with Emphasis on Secondary DiabetesSHUNICHIRO ONISHI, MINORU TAKEMOTO, TAKAHIRO ISHIKAWA, KAZUKI KOBA YASHI, MASAKI FUJIMOTO, MASAHIKO IGARASHI, AKIRA SHIMAMOTO, MASA FUMI KUZUYA, SEIJIRO MORI, AKIRA TANIGUCHI, TETSURO MIKI, KOUTARO YOKOTE, Chiba, Japan, Kaminoyama, Japan, Hiroshima, Japan, Nagoya, Japan, Tokyo, Japan, Nara, Japan, Touon, Japan
Werner syndrome (WS), known causes for secondary diabetes, is a rare autosomal recessive progeroid disorder showing graying and loss of hair, cataracts, osteoporosis, atrophy of peripheral soft tissues, and premature atherosclerosis. WS patients usually die between 40 and 50 years of age, because of coronary artery disease or neoplasia. Since WS patients also exhibit conditions similar to metabolic syndrome (MetS), the disease is considered as a human model linking aging and diabetes and/or MetS. Is has been reported that the prevalence of WS is higher in Japan compared with that in Western countries; Here, we performed the nation-wide survey of WS in Japan. The survey was conducted by use of questionnaire method with regard to the number as well as clinical data in detail of WS in 1,390 hospitals with more than 200 beds throughout Japan. As the results, 382 cases of WS were newly identifi ed. Fifty nine percent of WS patients had diabetes and 52% of WS patients complicated dyslipidemia. Fifty seven percent of the diabetic subjects complicated dyslipidemia. Concerning the details of medical treatment for WS with diabetes, 30% were given pioglitazone, 15% were given biguanides, 20% were given sulfonylurea derivate and 13% were given insulin. In case of WS with hyperlipidemia, 68% of the patients were given statin. Furthermore, 54% patients are more than 50 years old. Since the average life expectancy of WS had reported to be forties, our fi ndings indicate that the average age at death of WS is certainly being extended. The precise cause for the increase in the WS life span remains to be elucidated, it has been reported that statins could reduce the risk of suffering such events in individuals with shorter telomeres.

A655
For author disclosure information, see page 785.
CATEGORY
ADA-Funded Research
Epid
emio
logy
/G
enet
ics
PUB
LISH
ED O
NLY
EPIDEMIOLOGY
Pioglitazone could also ameliorate metabolic abnormalities and infl ammation in WS. Therefore, intensive management of the multiple risks may benefi t WS patients by reducing cardiovascular mortality as also implicated in non-WS individuals.
2479-PONeck Circumference as a Marker of Central Obesity and Insulin Resistance in Normal Weight to Grade II Obese SubjectsCHRISTIANE STABE, MARCELO MIRANDA LIMA, ANA CAROLINA VASQUES, JOSE CARLOS PAREJA, MARCOS ANTONIO TAMBASCIA, BRUNO GELONEZE, Campinas, Brazil
Central fat, also known as upper-body fat, is associated with an increased risk of cardiometabolic disease and insulin resistance (IR), being usually evaluated by measuring waist circumference. Neck circumference (NC), a proxy for upper-body fat, has been used as an alternative index for central fat estimation. The aims of this study were to examine the association between neck circumference with surrogate markers of central fat [waist circumference (WC) and sagittal abdominal diameter (SAD)] and BMI, and with insulin sensitivity. An admixture sample population from Brazilian Metabolic Syndrome Study – BRAMS (n=900; female: 65%; age: 41(12) years) were studied presenting a wide range of adiposity (BMI range: men = 18.2-37.2 kg/m2; female = 17.1-37.5 kg/m2) with normal glucose tolerance (71%) or type 2 diabetes (28%). To estimate IR, the gold standard method, the euglycemic-hyperinsulinemic clamp (E-HC) was performed in 60 patients, and estimated by surrogate methods [HOMA-IR, QUICKY and fasting plasma insulin (FPI)] in the whole sample population. NC was signifi cantly correlated with measurements of adiposity and IR. Pearson correlations adjusted for gender, age and glucose tolerance showed that NC was correlated with WC (r = 0.84, p<0.001); with SAD (r = 0.48, p<0.01) and BMI (r = 0.86, p<0.001). IR estimated by E-HC (M-value) were signifi cantly correlated with surrogate markers of IR (r = -0.75 for HOMA-IR; r = 0.73 for QUICKY; r = - 0.68 for FPI). NC showed signifi cant correlation with IR estimated by E-HC (r = - 0.65, p<0.001); with QUICKY (r = - 0.74, p<0.001), HOMA-IR (r = 0.75, p<0.001) and FPI (r = 0.59, p<0.001). Signifi cant correlations were found between WC and SAT with IR. Neck circumference is associated with other markers of central obesity and insulin resistance. Central obesity remains a strongly signifi cant indicator of insulin resistance in a Brazilian population ranging from normal weight to grade II obesity. Neck circumference is similar to other anthropometric measurements as a powerful and accessible marker of both central obesity and insulin resistance.
Supported by: FAPESP
2480-PONeck Circumference as Compared with Overall and Abdominal Fat in Relation to Insulin Resistance—The Cardiometabolic Risk in Chinese (CRC) StudyJUN LIANG, FEI TENG, NA ZHOU, CAIYAN ZOU, HUAIDONG SONG, YING XUE, MANQING YANG, LU QI, Xuzhou, China, Boston, MA
Background: Recent evidence indicates that neck circumference (NC) may be an independent risk factor for cardiometabolicdisorders. We examined the separate and joint associations of NC, percentage of body fat (PFAT) and waist circumference (WC) with insulin resistance (IR) in a large sample of Chinese.
Method: The study included 5,530 men and women from a community-based health examination survey (2009), with measures of NC, PFAT, WC, and Homeostasis Model Assessment for Insulin Resistance (HOMA-IR).
Results: NC, WC, and PFAT were all signifi cantly associated with increasing HOMA-IR, adjusting for age, sex, BMI, blood pressure and cholesterol levels (all p<0.0001). Further adjustment for WC or PFAT did not appreciably change the association between NC and HOMA-IR (adjusted p=0.002 and p<0.0001; respectively). The multivariate odds ratio [ORs] of insulin resistance (top 25% of HOMA-IR in the study population) across increasing sex-specifi c quintiles of NC were 1.00, 1.11 (95% confi dence interval [CI], 0.94-1.30), 1.29 (95% CI, 1.07-1.55), 1.56 (95% CI, 1.27-1.93), and 1.98 (95% CI, 1.57-2.49) (P<0.0001 for trend).
We found signifi cant interaction between NC and WC in relation to insulin resistance, adjusting for age, sex and other covariates (p for interaction=0.009). The association between NC and insulin resistance was stronger in the participants with higher WC (above the sex-specifi c median values) as compared with those with lower WC.
Conclusions: Our data indicate that NC was associated with insulin resistance, independent of WC, PFAT and other metabolic risk factors. WC signifi cantly modifi ed the effects of NC on insulin resistance.
2481-PONew and Old Criteria for the Diagnosis of Diabetes Mellitus in Patients with Peripheral Arterial DiseaseCHRISTIAN BOEHNEL, PHILIPP REIN, CHRISTOPH H. SAELY, ALEXANDER VONBANK, JANA ORTMANN, STEFAN BEER, IRIS BAUMGARTNER, HEINZ DREXEL, Feldkirch, Austria, Bern, Switzerland
Recently, an International Expert Committee concluded that haemoglobin A1c (Hba1c) may be a better means of diagnosing diabetes than glucose levels. A diagnosis of diabetes was recommended with hba1c ≥6.5%. Data on the concordance of new and old criteria for the diagnosis of diabetes are very scarce; no data at all are available for patients with peripheral arterial disease (PAD).
We enrolled 278 consecutive patients without previously known diabetes (195 men and 83 women) in whom PAD was verifi ed sonographically. HbA1c was measured and standard 75g oral glucose tolerance tests were performed.
From the patients with newly diagnosed diabetes according to the new diagnostic criterion of an hba1c ≥6.5% (n=26), 62% fulfi lled the WHO glucose criteria for diabetes, 15% had impaired glucose tolerance (IGT), and 23% normal glucose tolerance (NGT). Conversely, the hba1c ≥6.5% criterion was fulfi lled in 52% of the 31 patients with diabetes newly diagnosed according to WHO criteria, in 8% of the 51 patients with IGT and in 3 % of the patients with NGT. Compared to the standard of WHO criteria, the proposed hba1c ≥6.5% for the diagnosis of diabetes had a sensitivity of 52% and a positive predictive value of 62% for detecting previously undiagnosed diabetes, whereas specifi city and negative predictive value were 96% and 94%, respectively.
The recently recommended Hba1c criterion for the diagnosis of diabetes among PAD patients is highly specifi c but not sensitive. This might strongly limit its use as a screening tool for identifying individuals with diabetes.
2482-POOGTT Is a Better Tool for Detection of Diabetes, Impaired Glucose Regulation and Impaired Insulin Secretion and Action Than HbA1c. The GENFIEV StudyCRISTINA BIANCHI, ROBERTO MICCOLI, GIUSEPPE PENNO, STEFANO DEL PRATO, GENFIEV STUDY GROUP, Pisa, Italy
HbA1c (A1c) has been proposed for the diagnosis of diabetes (DM) and identifi cation of individuals at risk. However it is not yet completely clear whether A1c performs better than OGTT for categorization of impaired glucose regulation (IGR: IFG, IGT, IFG+IGT) and associated metabolic abnormalities. We have examined 844 consecutive subjects (44% men; age 49.5±11 years; BMI 29±5 Kg/m2) entering into the Genetics Physiopathology and Evolution of Type 2 diabetes (GENFIEV) study. Plasma glucose and C-peptide were determined during OGTT to assess β-cell function while lipid profi le, HOMA-IR and A1c (HPLC) were evaluated in fasting condition. Based on ADA criteria 43% had normal glucose tolerance (NGT), 42% IGR and 15% DM on OGTT, while IGR and DM were 38 and 11% on A1c with a concordance rate of 54% and 44%, respectively. A1c specifi city was 74% and 95% for IGR and DM. In non-diabetics, both A1c and 2h-postload glucose were correlated with lipid profi le, blood pressure, obesity, although 2-h glucose correlation was stronger (triglycerides r=0.21 vs 0.11; HDL-Ch r=0.19 vs -0.10; SBP r=0.25 vs 0.15; DBP r= 0.20 vs 0.07; all p<0.04) with the exception of BMI: r=0.08 vs. 0.13; p=ns). In a logistic regression analyses adjusted for age, sex, and BMI, individuals with IGR and even more DM by OGTT had greater chance to have insulin resistance and impaired insulin secretion (Odd Ratio for HOMA-IR: IGR-OGTT 3.33 (95%CI 2.32-4.78) vs IGR-A1c 2.52 (1.77-3.58), DM-OGTT 8.02 (4.78-13.45) vs. DM-A1c 3.95 (2.30-6.77); OR for Insulinogenic Index: IGR-OGTT- 3.08 (2.15-4.40) vs. IGR-A1c 2.88 (2.03-4.09), DM-OGTT 14.24 (8.49-23.89) vs DM-A1c 8.56 (5.00-14.64). Finally, IGR and DM by OGTT were more associated with metabolic syndrome (ATP III) than IGR and DM by A1c (IGR-OGTT 2.80 (1.90-4.14) vs IGR-A1c 2.08 (1.42-3.04); DM-OGTT 4.31 (2.55-7.31) vs DM-A1c 3.36 (1.92-5.88). In conclusion A1c identifi es a smaller proportion of individual at-risk and even smaller with DM than OGTT and has a weaker correlation with pathogenetic defects of hyperglycemia as well as of other metabolic abnormalities.
Supported by: Italian Society of Diabetology, Eli Lilly
A656
For author disclosure information, see page 785.
CATEGORY
ADA-Funded Research
Epid
emio
logy
/G
enet
ics
PUB
LISH
ED O
NLY
EPIDEMIOLOGY
2483-POOptimal Cut-Point of Hemoglobin A1c for Detecting Individuals with Type 2 Diabetes: The Segovia StudyMARÍA T. MARTINEZ-LARRAD, ARTURO CORBATON-ANCHUELO, CRISTINA FERNANDEZ-PEREZ, CARINA ZABENA, CARLOS LORENZO, MANUEL SERRANO-RIOS, Madrid, Spain, San Antonio, TX
There is still relatively limited information on the optimal cut-point of hemoglobin A1C (HbA1C) for detecting individuals with type 2 diabetes (DM2). We examined 818 unrelated participants (females, 53.6%; mean age and standard deviation, 55 ± 12 years) in the Segovia Study, a cross-sectional population based study among individuals living in the province of Segovia, Spain. All participants underwent a 75-g oral glucose tolerance (OGTT) and A1C measurement. We defi ned DM2 according to the 2003 American Diabetes Association (ADA) criteria (fasting glucose ≥ 126 mg/dl, 2-h glucose ≥200 mg/dl, or treatment with anti-diabetic medications). The prevalence of DM2 was 8.9 % (73 of 818 participants). We used the area under the receiver operating characteristic curve (AUC) to assess the predictive discrimination of HbA1C for detecting individuals with DM2. The AUC of HbA1C for detecting DM2 was 0.87 (95% CI: 0.83 - 0.92). The optimal cut-point of HbA1C for detecting individuals with DM2 was ³ 5.5%. This cut-point had a sensibility and specifi city of 81% and 78%, respectively. The positive likelihood ratio was 3.48 and the negative likelihood ratio was 0.22. The probability of having DM2 was 26.1% after a positive test and 2.2% after a negative test. In summary, the HbA1C cut-point that is optimal for identifying individuals with 2003 ADA-defi ned diabetes is ≥ 5.5% in the Segovia Study. Consequently, an OGTT should be administered to individuals with HbA1C ≥5.5%.
2484-POPrevalence of Clinical Manifestations in Hispanic Prediabetic Patients and Their Relationship with A1CJOSÉ A. ROJAS JIMÉNEZ, ELDA R. ROMERO GUTIÉRREZ, ANDREA DOMÍNGUEZ BARBOSA, GABRIELA C. LEVIN PICK, SILVIA ALBARRÁN ECHEVERRÍA, VANESSA MOTA SANHUA, LOURDES RIVAS AYALA, DIANA MARTÍNEZ CASTAÑEDA, MARÍA E. MORENO SENTÍES, JOAQUÍN G. JOYA GALEANA, Mexico City, Mexico
Literature review for a constellation of clinical manifestations (CM) and their association with prediabetes has not yet been established. Thus, the aim of this study was to determine the prevalence of CM and to establish their relationship with HbA1c (A1C) and fasting plasma glucose (FPG). In 2010, a transversal study was conducted in 84 adult patients from three outpatient clinics in Mexico City. Inclusion criteria: aged 18-65 years, BMI ≥25 kg/m2(mean 31.18, ±3.03), visceral fat (VF) ≥2.1 kg (mean 4.24, ±1.18), A1C 5.7-6.4%(mean 5.97, ±0.23) and FPG 100-125 mg/dl(mean 108.81, ±6.60). The following CM were used as independent variables: asthenia, dysthymia, headache, dizziness, postprandial somnolence, acanthosis nigricans (AN) and pendulous fi broma. All data was obtained using interview and physical exam. Frequencies and proportions were calculated. Chi-square test, Spearman’s Rho correlation and odds ratio (OR) were estimated to evaluate the relationship between CM, A1C and FPG. The mean age was 40.7(±14.4); 51.2% were female. The mean number of CM was 2.9(±1.64). The most frequent CM was AN (54.8%) followed by asthenia and dysthymia with 45.2% and 42.9%, respectively. Headache in 41.7%; postprandial somnolence and dizziness showed the same prevalence (35.7%), and pendulous fi broma in 34.5%. Pendulous fi broma correlated with headache (0.402, p≤0.0001), and dizziness (0.295, p≤0.006). The association between asthenia and A1C ≥5.9% was statistically signifi cant (OR:2.5, 95% CI: 1.02-6.40). The presence of both asthenia and AN was statistically signifi cant (p<0.05) with A1C ≥6.3%(75th percentile). The number of CM correlated with VF (0.28, p≤0.009). These results indicate the importance of identifying CM among patients with prediabetes; asthenia and AN presented the highest prevalence rates. The described association of asthenia and AN with higher A1C values supports the relevance of physical exam for early detection and intervention. Further study is needed using a larger sample size to be able to demonstrate the direct relationship between biochemical aspects and clinical implications.
2485-POPrevalence of Complications of Diabetes in People with Type 2 Diabetes: Data from Asia, Africa, Europe and Latin America from the A1chieve StudyALEXEY V. ZILOV, YANG WENYING, GUILLERMO GONZALEZ-GALVEZ, PHILIP HOME, CHEN JIANWEN, MOHAMMAD HASAN, Moscow, Russia, Beijing, China, Guadalajara, Mexico, Newcastle upon Tyne, United Kingdom, Lahore, Pakistan
Glycemic control is associated with a risk of development or progression of microvascular and macrovascular complications. Epidemiological data on geographical differences in the prevalence of complications can thus provide insights into the quality of global diabetes care. A1chieve is a multinational, open-label, observational study of people with type 2 diabetes (n=66 726) starting insulin analogs in routine clinical care. Participants enrolled from 28 countries across Asia, Africa, Europe and Latin America. Diabetes complication data at baseline were available for around 90% of participants. Macrovascular complications were reported in 23 to 75% of participants (depending on region) and microvascular complications in 22 to 84% (Table). This high prevalence of complications could be expected as a result of poor glycemic control (mean A1C levels 9.3 to 9.8 %) and low use of prophylactic therapies, such as statins, ACE inhibitors and aspirin (37.2%, 42.6% and 42.6% respectively). Variations in clinical care and defi nitions used in routine clinical practice may also be contributing to the large variations in prevalence of complications, and warrant further investigation. Combined with the high prevalence of diabetes in these countries, the high prevalence of complications will be a major cause of current and future health and economic burdens, and suggest a need for further enhancement of preventative measures.
Table. Demographic and complications details of the study participants
2486-POPrevalence of Diabetes in a Rural Village in South IndiaSURESH SHIVAPPA SOMANNAVAR, K.R. NARASIMHA SETTY, H.R. SACHI-DANANDA MURTHY, L. MURALI, R. ANILKUMAR, PUNAM VISHAL BHENDE, VISWANATHAN MOHAN, Bangalore, India, Chennai, India
Rapid changes in lifestyle are witnessing very high levels of diabetes in urban and also in rural areas of India where over 70% of population lives. Even little increase will affect drastically. With no recent data, diabetes scenario in rural south India is not clear. Aim of the present study is to show high prevalence of diabetes in rural Karnataka state (South India).
Sathnur village a rural place was adopted by Karnataka Institute of Diabetology, Bangalore a government institute to study the prevalence of diabetes in the year 2008-09. Study design was cross sectional. Total population was 6548 and adult population (above 18 years) was 3566 with 1500 households.
Village was divided into 3 blocks by local panchayat. Each households of the village was visited block wise and family history was taken. All the family members above 18 years were listed and every 3rd individual was randomly selected, educated and invited to the community hall on the next morning with 8 hours fast for detailed physical examination and blood sugar test. Plasma glucose concentrations (GOD - POD method) were measured on Robonik Pri Test Touch semi auto analyser. A total of 1035 adults participated in study (response rate 87%) and of whom 58% were women. Mean age of the participants was 48 years. Known diabetics were 64 (6.1%) individuals and of whom 43% were women. Newly detected diabetics were 60 (5.8%). Diabetes unawareness was very high (>75%). BMI was over 25kg/mt2 in 27.7% individuals. Overall prevalence was 11.9% with total 124 diabetic subjects. As individuals were selected by systematic randomisation, extrapolating the prevalence of diabetes obtained in the study to the total population there were 425 diabetic individuals of whom 218 were known diabetic subjects and 207 newly diagnosed diabetics.
A657
For author disclosure information, see page 785.
CATEGORY
ADA-Funded Research
Epid
emio
logy
/G
enet
ics
PUB
LISH
ED O
NLY
EPIDEMIOLOGY
Current study reveals even in rural areas of India diabetes has raised sharply in the recent time an early indication of the likely huge burden of diabetes which need to be studied in detail. Present study calls comprehensive approach for identifi cation of diabetics and initiation of diabetes prevention and control programmes in the rural areas which should be acceptable, affordable and available to rural Indians.
2487-POPrevalence of Diabetes in Louisiana from 1998 to 2009YUJIE WANG, WEI LI, LIWEI CHEN, RONALD HORSWELL, XIAO KE, JOLENE JOHNSON, DONNA H. RYAN, GANG HU, Baton Rouge, LA
Diabetes is considered “the epidemic of the 21st century”, affecting approximately 24 million individuals in the United State (U.S.) alone, or nearly 8% of the U.S. population. The data from the National Health and Nutrition Examination Survey (NHANES) indicated that the prevalence of diabetes in the Americans aged ≥20 years increased from 6.6% to 12.9% between 1976-1980 and 2005-2006. The trend of diabetes prevalence in Louisiana, however, has not been investigated. We examined the trends in the prevalence of diabetes between 1998 and 2009 in Louisiana.
The study population included patients who received medical care from the Louisiana State University Health Care Services Division (LSUHCSC) hospital system. A total of 798,311 new patients were recorded between 1998 and 2009. The diabetes cases were identifi ed by using ICD-9 code (250) for both inpatients and outpatients from the LSUHCSC Disease Management Evaluation Database. The annual prevalence of diabetes were calculated and stratifi ed by age groups and race. The crude prevalence of total diabetes in patients aged ≥25 years increased by 84.3% during 1998-2009, from 8.3% (3.2% undiagnosed) of 251,201 patients to 15.3% (3.5 % undiagnosed) of 232,222 patients. The crude prevalence of total diabetes among White, African and Asian Americans were 7.4% (2.7 % undiagnosed), 9.1% (3.6 % undiagnosed), and 5.3% (3.0 % undiagnosed) in 1998, and 14.5% (3.5 % undiagnosed), 16.6% (3.5 % undiagnosed), and 10.5% (3.6 % undiagnosed) in 2009, respectively. The annual prevalence of diabetes has dramatically increased from 1998 to 2009 in Louisiana. This study demonstrates the rapidly increasing burden of diabetes in the population served by the LSU Hospitals and demands efforts in diabetes prevention and control.
2488-POPrevalence of Resistant Hypertension among Greek Type 2 Diabetic SubjectsATHANASIA PAPAZAFIROPOULOU, ALEXIOS SOTIROPOULOS, ANTHI KOKOLAKI, STAVROS BOUSBOULAS, MARINA KARDARA, PARASKEVI VERGIDOU, IOANNIS PAPAPANAGIOTOU, STAVROS PAPPAS, Nikaia, Greece
Background and aims: It is well documented that hypertension is more prevalent among type 2 diabetic (T2D) subjects. Despite the fact that tight blood pressure control reduces signifi cantly the incidence of microvascular and cardiovascular complications in T2D subjects, more than 50% of the diabetics failed to achieve good blood pressure control. Therefore, we performed a retrospective analysis in order to estimate the prevalence of resistant hypertension among Greek T2D subjects.
Material and methods: We performed a retrospective analysis of the medical records of 664 T2D subjects (mean age ± SD: 65.5 ± 9.8 years, 341 females / 323 males) with arterial hypertension attending the diabetes outpatient clinic of our hospital during the period from January 2010 to September 2010.
Results: Of the study participants 20.8% (n=138) had resistant hyper-tension. The antihypertensive treatment of the diabetic subjects with and without resistant hypertension was, respectively; 59.4% vs. 47.9% on angiotensin-converting enzyme inhibitors (P=0.01), 45.7% vs. 21.9% on angiotensin II receptor blockers (P<0.001), 52.2% vs. 23.0% on β-blockers (P<0.001), 12.3% vs. 1.5% on centrally acting antihypertensives (P<0.001), and 71.0% vs. 29.7% on calcium channel blockers (P<0.001). Of the diabetic subjects without resistant hypertension 39.53% was on treatment with diuretics. Multivariate logistic analysis showed that resistant hypertension was associated with body mass index [odds ratio (OR): 1.06, 95% Confi dence Intervals (95% CI): 1.02-1.11, P<0.001), presence of coronary artery disease (OR: 1.83, 95% CI: 1.21-2.77, P=0.004) and insulin therapy (OR: 1.78, 95% CI: 1.15-2.75, P=0.01).
Conclusion: The present study showed that a signifi cant percentage of T2D subjects had resistant hypertension. Resistant hypertension was related with body mass index, presence of coronary artery disease and insulin treatment.
2489-POPrevalence of Retinopathy among Type 2 Diabetic Subjects with and without MicroalbuminuriaATHANASIA PAPAZAFIROPOULOU, ALEXIOS SOTIROPOULOS, STAVROS BOUS-BOULAS, ANTHI KOKOLAKI, OURANIA APOSTOLOU, MARINA KARDARA, MPATIA GLYKIDOU, STAVROS PAPPAS, Nikaia, Greece
Background and aims: Although microalbuminuria (MA) has been associated with an increased risk of retinopathy in type 1 diabetic patients, this association is not so clear in type 2 diabetic (T2D) subjects. Therefore, the aim of the present study was to evaluate the relationship between MA and retinopathy in a sample of T2D subjects.
Material and methods: A hundred diabetic subjects with MA (53 males / 47 females, mean age ± SD: 65.5 ± 11.1 years) and 100 diabetic subjects without MA (52 males / 48 females, mean age ± SD: 65.4 ± 11.3 years), were recruited in the study.
Results: Prevalence of retinopathy did not differ among diabetic subjects with and without MA (44% vs. 39%, respectively, Ρ=0.47). Univariate logistic analysis showed that retinopathy was associated with age [odds ratio (OR): 1.05, 95% Confi dence Intervals (95% CI): 1.02-1.09, P<0.001], duration of diabetes (OR: 1.07, 95% CI: 1.04-1.11, P<0.001), HbA1c (OR: 1.30, 95% CI: 1.04-1.61, P=0.02), hypertension (OR: 1.02, 95% CI: 1.01-1.04, P=0.002), smoking (OR: 0.55, 95% CI: 0.31-0.99, P=0.04), coronary artery disease (OR: 1.82, 95% CI: 0.99-3.30, P=0.05) and insulin therapy (OR: 2.28, 95% CI: 1.26-4.12, P=0.006). After multivariate adjustment retinopathy was associated only with age (OR: 1.04, 95% CI: 1.01-1.08, P=0.02) and duration of diabetes (OR: 1.05, 95% CI: 1.01-1.09, P=0.02).
Conclusion: The present study showed no difference regarding the prevalence of retinopathy among T2D subjects with or without MA. However, despite the above fi ndings, it must be emphasized that T2D subjects with MA might benefi t from tactical ophthalmologic follow-up.
2490-PO
WITHDRAWN
2491-PORelative Cancer-Specifi c Mortality after Diagnosis of Common Cancers among People with Type 2 DiabetesJEREMY WALKER, SCOTTISH DIABETES RESEARCH NETWORK EPIDEMIOLOGY GROUP, Edinburgh, United Kingdom
The purpose of this study was to describe relative cancer-specifi c mortality following diagnosis of common cancers among people with type 2 diabetes compared to a non-diabetic population and to investigate whether any association was confounded by socio-economic status (SES). We performed a retrospective cohort study using a population-based national diabetes database for people in Scotland for 2001-7 and an area-based measure of SES. Relative risks (RR) for cancer specifi c mortality after the diagnosis of lung, colo-rectal, breast and prostate cancer among people that had these cancers registered after diagnosis of type 2 diabetes compared to the non-diabetic population were estimated using Poisson regression. Follow-up was censored at death from other causes or 31st December 2007.Complete data were available for 9835 people with type 2 diabetes and one of the cancers. Numbers of deaths and person-years of follow-up among people with type 2 diabetes, age adjusted RR and age and SES adjusted RR by sex (M=men, W=women) and cancer site are shown below.
Cancer site Sex Deaths Person-years
Relative risk (95% CI)
adjusted for age
Relative risk (95% CI) adjusted for age and SES
Lung MW
1229791
1,265.0911.6
1.44 (1.29 to 1.69)1.37 (1.19 to 1.59)
1.44 (1.34 to 1.55)1.37 (1.22 to 1.53)
Colo-rectal MW
572351
4,429.82,989.6
1.57 (1.33 to 1.84)1.57 (1.32 to 1.86)
1.55 (1.41 to 1.70)1.54 (1.36 to 1.75)
Breast W 341 7,016.6 1.36 (1.14 to 1.63) 1.34 (1.19 to 1.51)Prostate M 377 5,539.7 1.21 (0.96 to 1.53) 1.19 (1.04 to 1.36)
Cancer-specifi c mortality was higher among people that developed any of the four common cancers after a diagnosis of type 2 diabetes than among people that had one of the cancers but did not have diabetes. Adjusting for SES had little effect. Possible explanations for the higher mortality among people with diabetes that require investigation include co-morbidity, more advanced stage of cancer at diagnosis, effects of hyperglycemia or diabetes treatment and differential cancer treatment.
Supported by: Wellcome Trust (Scottish Health Informatics Programme)
A658
For author disclosure information, see page 785.
CATEGORY
ADA-Funded Research
Epid
emio
logy
/G
enet
ics
PUB
LISH
ED O
NLY
EPIDEMIOLOGY
2492-PORelative Contribution of Insulin Sensitivity and Beta Cell Function in Transition of Glucose Tolerance StateRUDRUIDEE KARNCHANASORN, HORNG-YIH OU, LEE-MING CHUNAG, KEN C. CHIU, Duarte, CA, Tainan, Taiwan, Taipei, Taiwan
Insulin sensitivity (IS) and beta cell function (BCF) play a major role in determination of plasma glucose level (PGL). However, confl icting information were noted in context to their roles in transition of glucose tolerance to abnormal glucose tolerance. This is mainly due to a dynamic interaction between IS and BCF.
To address this issue, we conducted a study consistent of 1,927 adult (≥ 18 years old) participants of the NHANES 2007-2008 who were not receiving any pharmacological treatment of diabetes with both fasting and 2-hour postchallenged PGLs available. According to the current ADA criteria, they were defi ned as glucose tolerance (GT, n=800), impaired fasting glucose only (IFG, n=575), impaired glucose tolerance only (IGT, n=114), combined impaired fasting glucose and impaired glucose tolerance (IFG/IGT, n=253), and overt diabetes (DM, n=185). Based on the fasting glucose and insulin levels, insulin sensitivity (HOMA-S) and beta cell function (HOMA-B) were calculated using the homeostasis model assessment. For comparison of the interaction of BCF with IS, we performed a linear regression analysis after log transformation.
HOMA-S was signifi cantly different between groups (P<0.03-0.0001) except for between the NGT and IGT groups (P=0.20). Log transformed HOMA-S was an excellent predictor for HOMA-B (P<0.0001). The slope was highest (-0.71) in the DM group and lowest (-0.94) in the IFG group with signifi cant difference from the NGT group (-0.89, P<0.0001 and P=0.01, respectively). The slopes for the IGT and IFG/IGT groups were -0.91 and -0.92, respectively. These results indicated a compensatory increase in BCF occurred in transition from NGT to IGT and IFG with eventual decompensation to DM. During the transition from NGT to IFG and IFG/IGT, PGL raised in spite of a compensatory increase in BCF, indicating failure of fully compensation of BCF to overcome the change in IS.
Our results indicates that the transition from NGT to IGT results from the primary failure of beta cell compensation, while the transition of NGT to IFG is a combination of worsening IS with failure of beta cell compensation. The transition to DM is a further decompensation of BCF.
2493-PORepeatability and Validity of a Self-Reported Survey of Complications in Type 1 DiabetesRAYNARD WASHINGTON, AARON SECREST, TREVOR ORCHARD, Pittsburgh, PA
Self-reported data on the epidemiology of T1D complications has not been extensively validated. The repeatability and validity of a 5-page survey, developed to collect self-reported data on physician-diagnosed diabetes complications, treatment, health-care utilization and demographic factors for randomly selected participants in the Allegheny County T1D Registry were therefore evaluated. The characteristics of those discordant on the basis of agreement of repeated surveys (n=30) approximately 1 year apart for participants or for validity, the survey responses of 30 participants who were examined 2-3 years earlier. Kappa statistics (k) were calculated to determine agreement between repeated surveys and between the survey and clinical exam. High reliability agreement (k>.60) was observed for all complications and risk factors, except stroke (k=.03) and peripheral vascular disease (k=.46), both of which had a low overall prevalence, in the repeated surveys. A high level of agreement was also observed in the validation with clinical exam data, with lesser agreement (.40<k<.60) being shown for overt nephropathy (k=.46) and high triglycerides (k=.52). In the repeatability sample, individuals discordant for at least one complication appeared less likely to check blood glucose regularly (p=.160). In the validity sample, discordant cases were signifi cantly less likely to have seen a physician in the last year for routine care of diabetes (p=.02) and, though statistically non-signifi cant, were twice as likely to be male (p=.12) and less likely to check their blood glucose 3+ times daily (p=.10). There were no differences by concordance for mean age, diabetes duration, or HbA1c. Though the results of this analysis show high repeatability and validity and little bias of self-reporting of complications and risk factors among patients with T1D, less frequent physician follow up was associated with invalid survey responses.
2494-PORole of HbA1c in Screening of Diabetes Mellitus in Korean Rural CommunityGUN WOO KIM, JAE HYUN KIM, MI YOUNG LEE, JANG YEL SHIN, YOUNG GOO SHIN, SANG BAEK KOH, CHOON HEE CHUNG, Wonju, Republic of Korea
Background: Recently, the measurement of HbA1c was recommended for diagnosing diabetes mellitus as an alternative method to fasting plasma glucose or oral glucose tolerance test. In this study, we analyzed the proper HbA1c level for screening or predicting test for diabetes mellitus in Korean rural population.
Methods: We analyzed receiver operating characteristic (ROC) curve to fi nd appropriate HbA1c level in relation to diabetes mellitus determined by oral glucose tolerance test in 10,111 subjects from Korean Rural Genomic Cohort (KRGC) study.
Results: The HbA1c level of total subjects was 5.68 ± 0.86 %. The proper cutoff level of HbA1c for screening diabetes mellitus was 5.95 % (sensitivity, 77 %; specifi city, 89.4 %) and the cutoff level of HbA1c for predicting diabetes mellitus was 6.4 % (specifi city, 97.5 %).
Conclusions: We suggested that optimal HbA1c level for screening and predicting diabetes mellitus were 5.95 % and 6.4 %.
2495-PO
WITHDRAWN
2496-POScreening India’s Twin Epidemic (SITE)—Diabetes Mellitus and Hyper tension: Results from DelhiAMBRISH MITHAL, MURUGA VADIVALE, SHASHANK JOSHI, SITE DELHI INVESTI-GATORS, New Delhi, India, Mumbai, India
The increase in diabetes mellitus (DM) and hypertension (HT) in India is likely to result in a twin epidemic. We aimed to estimate the prevalence of diagnosed and undiagnosed DM and HT in outpatient settings, understand their management, and estimate the prevalence of underlying risk factors. During 2009-2010, SITE was conducted in 8 states, in waves - 1 state at a time; with 2000 patients (pts) from 100 centers per wave. Each center enrolled the fi rst 10 pts (≥18 years, not pregnant, signed consent, and allowed screening test) per day on 2 consecutive days. Post wave-1: Maharashtra, this wave-2 was conducted in Delhi. Evaluations included- visit 1 (V1): demographics, medical history, and blood pressure; V2 (days 2¬5 post V1): fasting plasma glucose (FPG) for unknown cases of DM, HbA1c for known cases of DM, ECG for pts ≥40 years, and fasting lipids and urine albumin for all pts. Of 1980 pts (61% males) enrolled– known cases: DM 601 (30%), HT 627 (32%); newly diagnosed cases among pts with unknown status of disease: DM 43 (3%; FPG≥126 mg/dL), HT 328 (24%; as per JNC 7 criteria); overall prevalence: DM 644 (33%), HT 955 (48%), pts with both DM+HT 418 (21%), overweight/obese 1489 (75%; BMI≥23 kg/m2), and truncal obesity 1752 (89%).
Table 1. Prevalence of Twin (DM+HT)N=1930
DMn (%)
Known Newly diagnosedHT n (%) Known 299 (16) 15 (1)
Table 2. Prevalence of comorbid conditions DM HTN n (%) N n (%)
Known family history 644 289 (45) 955 324 (34)Micro/macroalbuminuria 428 116 (27) 602 138 (23)
Of 601 known DM pts, 595 were on treatment: 518 (87%) took oral antidiabetic agents (OAD) – with 262 (51%) pts on monotherapy, mainly biguanides; 38 (6%) pts took insulin; 39 (7%) pts took both OAD+insulin. Of 393 known DM pts tested, 245 (62%) had HbA1c ≥7%. Most pts (604 of 627) with known HT were being treated; 279 (46%) pts with monotherapy, mainly beta blockers; but, 482 (77%) pts were uncontrolled as per JNC 7 criteria. In the Indian state of Delhi, high prevalence and poor control of DM and HT, indicate the need for early diagnosis and management of these diseases to reduce complications.
Supported by: sanofi -aventis (India)

A659
For author disclosure information, see page 785.
CATEGORY
ADA-Funded Research
Epid
emio
logy
/G
enet
ics
PUB
LISH
ED O
NLY
EPIDEMIOLOGY
2497-POScreening India’s Twin Epidemic (SITE)—Diabetes Mellitus and Hypertension: Results from Madhya PradeshSUSHIL JINDAL, MURUGA VADIVALE, SHASHANK JOSHI, SITE MADHYA PRA-DESH INVESTIGATORS, Madhya Pradesh, India, Mumbai, India
The increase in diabetes mellitus (DM) and hypertension (HT) in India is likely to result in a twin epidemic. We aimed to estimate the prevalence of diagnosed and undiagnosed DM and HT in outpatient settings, understand their management, and estimate the prevalence of underlying risk factors. During 2009-2010, SITE was conducted in 8 states, in waves - 1 state at a time; with 2000 patients (pts) from 100 centers per wave. Each center enrolled the fi rst 10 pts (≥18 years, not pregnant, signed consent, allowed screening test) per day on 2 consecutive days. Post wave-1: Maharashtra, wave-2: Delhi, wave-3: Tamil Nadu, wave-4: West Bengal, wave-5: Karnataka, wave-6: Andhra Pradesh, wave-7: Gujarat, this wave-8 was conducted in Madhya Pradesh. Evaluations included- visit 1 (V1): demographics, medical history, blood pressure; V2 (days 2-5 post V1): fasting plasma glucose (FPG), HbA1c, fasting lipids, urine albumin. Of 1903 pts (58% males) enrolled–known cases: DM 540 (28%), HT 725 (38%); newly diagnosed cases: DM 101 (7%; FPG≥126 mg/dL), HT 266 (23%; JNC 7 criteria); overall prevalence: DM 641 (34%), HT 991 (52%), pts with both DM+HT 431 (23%), overweight/obese 1332 (70%; BMI≥23 kg/m2), and truncal obesity 1694 (89%).
Table 1. Prevalence of Twin (DM+HT)N=1903
DMn (%)
Known Newly diagnosedHTn (%)
Known 297 (16) 50 (3)Newly diagnosed 67 (4) 17 (1)
Table 2. Prevalence of comorbid conditions DM HTN n (%) N n (%)
Known family history 641 232 (36) 991 368 (37)Micro/macroalbuminuria 565 124 (22) 857 130 (15)
Most pts (511 of 540) with known DM were on treatment: 484 (95%) took oral antidiabetic agents (OAD) – with 242 (50%) pts on monotherapy, mainly sulphonylureas; 15 (3%) pts took insulin; 12 (2%) pts took both OAD+insulin. Of 499 known DM pts tested, 358 (72%) had HbA1c ≥7%. Most pts (654 of 725) with known HT were being treated; 343 (53%) pts with monotherapy, mainly angiotensin-converting enzyme inhibitors; but, 587 (81%) pts were uncontrolled as per JNC 7 criteria. In the Indian state of Madhya Pradesh, high prevalence and poor control of DM and HT, indicate the need for early diagnosis and management of these diseases to reduce complications.
Supported by: sanofi -aventis (India)
2498-POSerum Uric Acid Levels Are Associated with Elevated Aortic Arterial Stiffness in ChineseJUN LIANG, YANPING LI, LIANJUN DOU, NA ZHOU, FEI TENG, CAIYAN ZOU, YING XUE, MANQING YANG, HUAIDONG SONG, LU QI, Xuzhou, China, Boston, MA
Aims/Hypothesis: Circulating levels of uric acid were related to diabetes and cardiovascular disease. The detrimental effects of elevated uric acid may start from early stage of atherosclerosis. We examined the association between serum uric acid and the central and peripheral arterial stiffness.
Methods: The study included 3,772 Chinese men and women with carotid radial pulse wave velocity (crPWV), carotid femoral pulse wave velocity (cfPWV), carotid artery dorsalis pedis pulse wave velocity (cdPWV) and serum uric acid measured.
Results: After adjustment for age, sex, and BMI, the levels of serum uric acid were signifi cantly associated with an increasing trend of cfPWV, crPWV and cdPWV in a dose-dependent fashion (P for trend < 0.0001). Further adjustment for blood pressure, heart rate, and lipids attenuated the associations with crPWV and cdPWV to be non-signifi cant; but the association for cfPWV remained signifi cant (P=0.004). The cfPWV across the quintiles of uric acid (from the lowest to the highest) were 10.48, 10.51, 10.65 and 10.72 m/s. We found signifi cant interaction between hypertension status and uric acid level in relation to cfPWV (P for interaction=0.003). The associations between uric acid and cfPWV were signifi cant (P<0.0001) among those without hypertension but were not signifi cant (P=0.515) among the hypertension patients (Figure).
Conclusions: Serum uric acid was associated with elevated aortic arterial stiffness, independent of conventional cardiovascular risk factors. Hypertension might amplify the deleterious effects of uric acid. Figure. Interaction between uric acid and hypertension in relation to cfPWV
2499-POSex Difference in the Diagnosis of Diabetes with HbA1c in a Japanese SubjectSUMIE OKAHATA, MINORU YAMAKADO, KENTARO SAKAMOTO, MASAO YANO, KAZUO HARA, TAKASHI KADOWAKI, TERUO SHIBA, Tokyo, Japan
Aim: We aimed to study to the contribution of sex difference to the results of OGTT, HbA1c and their relationships. Methods: We used cross-sectional data from 3,142 men and women (men 66 %). The result of the OGTT was classifi ed into 5 categories and the result of HbA1c was classifi ed into 4 groups (table 1, 2). In Japan, cases with more than 6.9% of HbA1c are formally diagnosed as diabetes. Results: According to OGTT, compared to women, men had higher FPG in both NGT and i-IGT, and higher FPG and 2hPG in NGT while women had higher HbA1c level in NGT (table 1). Regarding to results of HbA1c, among the DM regarded, 65% of men had DM pattern, while that number of women is only 19% (**: p =0.001). However, within the low risk, 32% of men had normal OGTT pattern, while that number of women is 56% (***: p<0.001). In all groups classifi ed with HbA1c men had higher FPG and 2hPG levels than women, except for the DM overt (table 2). For instance in the DM regarded, men showed higher 2hPG by 33 mg/dl. Conclusion: Sex difference induces discrepancy in diagnosis of diabetes with HbA1c or OGTT. Women showed comparably higher HbA1c regardless of milder glucose intolerance than men. As a result, as for women, compared to the diagnosis of OGTT, the diagnosis of diabetes with HbA1c has more chance of over diagnosis.
FPG: Fasting plasma glucose 2hPG: 2h post-OGTT plasma glucose NGT: Normal glucose tolerance i-IGT: Isolated impaired glucose tolerance others: i-IFG, IGT+IFG, DM. *: p<0.05
Table 1
NGT i-IGT othersmen women men women men women
n 1261 810 389 157 1052 310FPG(mg/dl) 95.4(0.2) 91.5(0.25)*** 99.0(6.6) 96.8(6.7)*** 117.0(0.78) 107.8(1.43)***2hPG(md/dl) 111.3(0.52) 107.6(0.65)*** 159.3(15.5) 158.2(14.8) 190.1(1.9) 168.2(3.6)***HbA1c (%) 5.24(0.0) 5.27(0.0)* 5.8(0.3) 5.8(0.3) 6.2(0.0) 6.0(0.1)*
Table 2
(%) Low risk(≤6.0) High risk(6.0-6.5) DM regarded (6.5-6.9) DM overt (>6.9)men women men women men women men women
n 1532 837 474 229 124 31 175 20FPG mg/dl) 97.4(0.2) 92.5(0.3)*** 108.4(0.5) 100.7(0.8)*** 119.8(1.4) 114.2(2.7) 154.6(3.0) 160.5(8.9)2hPG(md/dl) 130.5(1.0) 111.0(1.3)*** 163.2(2.6) 140.2(3.8)*** 206.1(5.7) 173.3(11.3)* 290.7(6.5) 309.8(21.0)
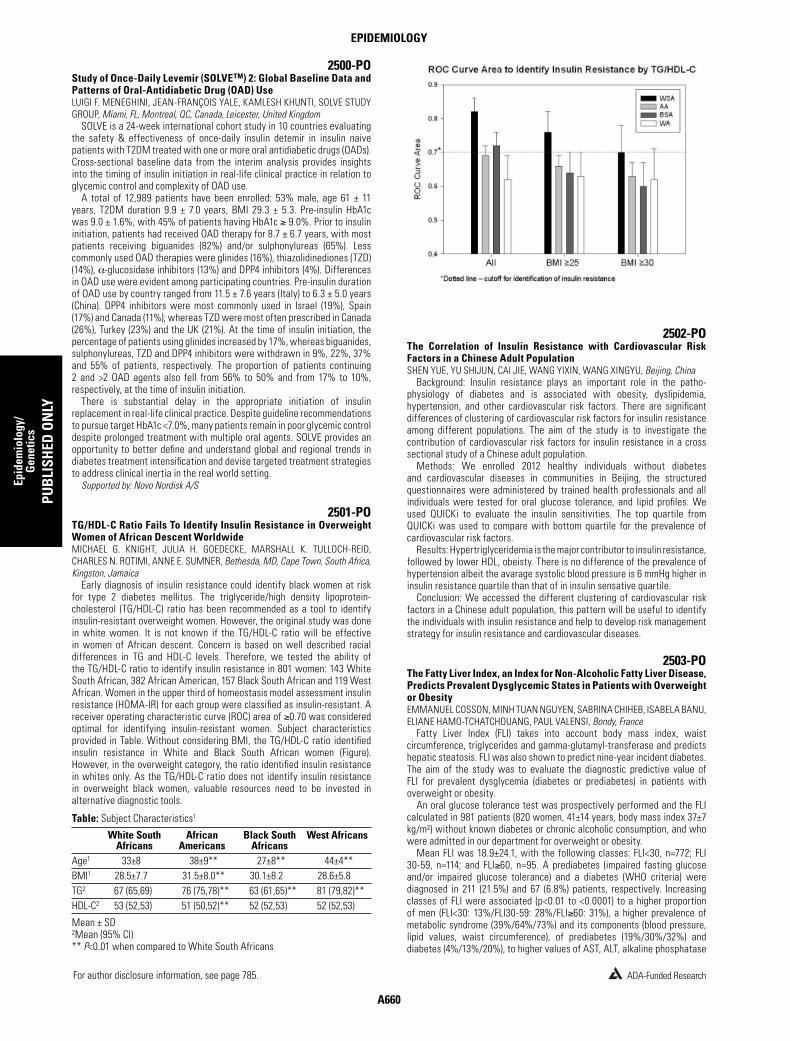
A660
For author disclosure information, see page 785.
CATEGORY
ADA-Funded Research
Epid
emio
logy
/G
enet
ics
PUB
LISH
ED O
NLY
EPIDEMIOLOGY
2500-POStudy of Once-Daily Levemir (SOLVETM) 2: Global Baseline Data and Patterns of Oral-Antidiabetic Drug (OAD) UseLUIGI F. MENEGHINI, JEAN-FRANÇOIS YALE, KAMLESH KHUNTI, SOLVE STUDY GROUP, Miami, FL, Montreal, QC, Canada, Leicester, United Kingdom
SOLVE is a 24-week international cohort study in 10 countries evaluating the safety & effectiveness of once-daily insulin detemir in insulin naive patients with T2DM treated with one or more oral antidiabetic drugs (OADs). Cross-sectional baseline data from the interim analysis provides insights into the timing of insulin initiation in real-life clinical practice in relation to glycemic control and complexity of OAD use.
A total of 12,989 patients have been enrolled: 53% male, age 61 ± 11 years, T2DM duration 9.9 ± 7.0 years, BMI 29.3 ± 5.3. Pre-insulin HbA1c was 9.0 ± 1.6%, with 45% of patients having HbA1c ≥ 9.0%. Prior to insulin initiation, patients had received OAD therapy for 8.7 ± 6.7 years, with most patients receiving biguanides (82%) and/or sulphonylureas (65%). Less commonly used OAD therapies were glinides (16%), thiazolidinediones (TZD) (14%), α-glucosidase inhibitors (13%) and DPP4 inhibitors (4%). Differences in OAD use were evident among participating countries. Pre-insulin duration of OAD use by country ranged from 11.5 ± 7.6 years (Italy) to 6.3 ± 5.0 years (China). DPP4 inhibitors were most commonly used in Israel (19%), Spain (17%) and Canada (11%); whereas TZD were most often prescribed in Canada (26%), Turkey (23%) and the UK (21%). At the time of insulin initiation, the percentage of patients using glinides increased by 17%, whereas biguanides, sulphonylureas, TZD and DPP4 inhibitors were withdrawn in 9%, 22%, 37% and 55% of patients, respectively. The proportion of patients continuing 2 and >2 OAD agents also fell from 56% to 50% and from 17% to 10%, respectively, at the time of insulin initiation.
There is substantial delay in the appropriate initiation of insulin replacement in real-life clinical practice. Despite guideline recommendations to pursue target HbA1c <7.0%, many patients remain in poor glycemic control despite prolonged treatment with multiple oral agents. SOLVE provides an opportunity to better defi ne and understand global and regional trends in diabetes treatment intensifi cation and devise targeted treatment strategies to address clinical inertia in the real world setting.
Supported by: Novo Nordisk A/S
2501-POTG/HDL-C Ratio Fails To Identify Insulin Resistance in Overweight Women of African Descent WorldwideMICHAEL G. KNIGHT, JULIA H. GOEDECKE, MARSHALL K. TULLOCH-REID, CHARLES N. ROTIMI, ANNE E. SUMNER, Bethesda, MD, Cape Town, South Africa, Kingston, Jamaica
Early diagnosis of insulin resistance could identify black women at risk for type 2 diabetes mellitus. The triglyceride/high density lipoprotein-cholesterol (TG/HDL-C) ratio has been recommended as a tool to identify insulin-resistant overweight women. However, the original study was done in white women. It is not known if the TG/HDL-C ratio will be effective in women of African descent. Concern is based on well described racial differences in TG and HDL-C levels. Therefore, we tested the ability of the TG/HDL-C ratio to identify insulin resistance in 801 women: 143 White South African, 382 African American, 157 Black South African and 119 West African. Women in the upper third of homeostasis model assessment insulin resistance (HOMA-IR) for each group were classifi ed as insulin-resistant. A receiver operating characteristic curve (ROC) area of ≥0.70 was considered optimal for identifying insulin-resistant women. Subject characteristics provided in Table. Without considering BMI, the TG/HDL-C ratio identifi ed insulin resistance in White and Black South African women (Figure). However, in the overweight category, the ratio identifi ed insulin resistance in whites only. As the TG/HDL-C ratio does not identify insulin resistance in overweight black women, valuable resources need to be invested in alternative diagnostic tools.
Table: Subject Characteristics1
White South Africans
African Americans
Black South Africans
West Africans
Age1 33±8 38±9** 27±8** 44±4**BMI1 28.5±7.7 31.5±8.0** 30.1±8.2 28.6±5.8TG2 67 (65,69) 76 (75,78)** 63 (61,65)** 81 (79,82)**HDL-C2 53 (52,53) 51 (50,52)** 52 (52,53) 52 (52,53)
Mean ± SD2Mean (95% CI)** P<0.01 when compared to White South Africans
2502-POThe Correlation of Insulin Resistance with Cardiovascular Risk Factors in a Chinese Adult PopulationSHEN YUE, YU SHIJUN, CAI JIE, WANG YIXIN, WANG XINGYU, Beijing, China
Background: Insulin resistance plays an important role in the patho-physiology of diabetes and is associated with obesity, dyslipidemia, hyper tension, and other cardiovascular risk factors. There are signifi cant differences of clustering of cardiovascular risk factors for insulin resistance among different populations. The aim of the study is to investigate the contribution of cardiovascular risk factors for insulin resistance in a cross sectional study of a Chinese adult population.
Methods: We enrolled 2012 healthy individuals without diabetes and cardio vascular diseases in communities in Beijing, the structured questionnaires were administered by trained health professionals and all individuals were tested for oral glucose tolerance, and lipid profi les. We used QUICKi to evaluate the insulin sensitivities. The top quartile from QUICKi was used to compare with bottom quartile for the prevalence of cardiovascular risk factors.
Results: Hypertriglyceridemia is the major contributor to insulin resistance, followed by lower HDL, obeisty. There is no difference of the prevalence of hypertension albeit the avarage systolic blood pressure is 6 mmHg higher in insulin resistance quartile than that of in insulin sensative quartile.
Conclusion: We accessed the different clustering of cardiovascular risk factors in a Chinese adult population, this pattern will be useful to identify the individuals with insulin resistance and help to develop risk management strategy for insulin resistance and cardiovascular diseases.
2503-POThe Fatty Liver Index, an Index for Non-Alcoholic Fatty Liver Disease, Predicts Prevalent Dysglycemic States in Patients with Overweight or ObesityEMMANUEL COSSON, MINH TUAN NGUYEN, SABRINA CHIHEB, ISABELA BANU, ELIANE HAMO-TCHATCHOUANG, PAUL VALENSI, Bondy, France
Fatty Liver Index (FLI) takes into account body mass index, waist circumference, triglycerides and gamma-glutamyl-transferase and predicts hepatic steatosis. FLI was also shown to predict nine-year incident diabetes. The aim of the study was to evaluate the diagnostic predictive value of FLI for prevalent dysglycemia (diabetes or prediabetes) in patients with overweight or obesity.
An oral glucose tolerance test was prospectively performed and the FLI calculated in 981 patients (820 women, 41±14 years, body mass index 37±7 kg/m²) without known diabetes or chronic alcoholic consumption, and who were admitted in our department for overweight or obesity.
Mean FLI was 18.9±24.1, with the following classes: FLI<30, n=772; FLI 30-59, n=114; and FLI≥60, n=95. A prediabetes (impaired fasting glucose and/or impaired glucose tolerance) and a diabetes (WHO criteria) were diagnosed in 211 (21.5%) and 67 (6.8%) patients, respectively. Increasing classes of FLI were associated (p<0.01 to <0.0001) to a higher proportion of men (FLI<30: 13%/FLI30-59: 28%/FLI≥60: 31%), a higher prevalence of metabolic syndrome (39%/64%/73%) and its components (blood pressure, lipid values, waist circumference), of prediabetes (19%/30%/32%) and diabetes (4%/13%/20%), to higher values of AST, ALT, alkaline phosphatase

A661
For author disclosure information, see page 785.
CATEGORY
ADA-Funded Research
Epid
emio
logy
/G
enet
ics
PUB
LISH
ED O
NLY
EPIDEMIOLOGY
and lower values of albumin. Performing c statistic, area under operating curve (AUC) for FLI to diagnose a dysglycemia (0.683 [0.646-0.719]) was slightly better than those of HbA1c (0.669 [0.630-0.707]) and of Finnish diabetes risk score (Findrisc) (0.650 [0.612-0.688]). Sensitivity and specifi city of a FLI ≥8 to diagnose a dysglycemia were 72% and 59%, respectively. The AUC to diagnose a diabetes was better for HbA1c (0.818 [0.757-0.880]) than for FLI (0.750 [0.695-0.806]) and for Findrisc (0.709 [0.647-0.771]).
To conclude, the FLI is not only associated with incident diabetes but also with unknown prevalent diabetes or prediabetes in patients with overweight or obesity. This index may be a useful screening tool in subjects at risk who should benefi t from an oral glucose tolerance test.
2504-POThe Impact of Income on the Incidence of Diabetes: A Population-Based StudyZOE LYSY, PETER AUSTIN, BAIJU SHAH, GILLIAN BOOTH, LORRAINE LIPSCOMBE, Toronto, ON, Canada
It is expected that between 2007 and 2017, 1.9 million Canadians aged 20 years and older will be diagnosed with diabetes, in parallel with increasing obesity rates particularly in low-income populations. Even in a universally funded health care system like Canada, the income gap in mortality has widened over the last decade among patients with diabetes, possibly due to increasing barriers to costly and complex treatments. It remains unknown whether this income gap exists for diabetes incidence. Using a validated, population-based diabetes registry and census data from Ontario, Canada, we recorded all new cases of diabetes diagnosed between April 1st 2005 and March 31st 2006. We examined the association between neighbourhood income quintile and diabetes incidence rates, and whether trends were different based on age and sex. We also looked at diabetes testing by income among persons without diabetes to determine whether differences in incidence can be attributed to screening differences. There were 8886 new cases of diabetes diagnosed during our 1-year study period in Ontario (incidence rate 8.25/1000). There was a signifi cant association between decreasing income quintile and increasing diabetes incidence (p<0.0001), and incidence increased with age (p<0.0001) and was higher in males compared to females (8.9/1000 vs. 7.6/1000, p<0.0001). Signifi cant interactions were found between age groups and income quintiles (p<0.01), such that the impact of income on diabetes incidence decreased with increasing age. The incidence rate ratio for the lowest compared to highest income quintile was 1.55 in persons aged 20-39 years, compared to 1.22 in persons over age 60 years. There were no signifi cant income differences in diabetes screening. This population-based study found that while income has a signifi cant effect on the incidence of diabetes, the income gap was widest in younger persons. Our fi ndings have important implications for patients, the health care system and policy makers. Greater diabetes preventive efforts directed toward younger lower-income populations are necessary, in order to lessen the lifelong burden of diabetes on the health and productivity of an already disadvantaged population.
2505-POThe Prevalence of Diabetes, Pre Diabetes and the Metabolic Syn-drome in Irish TravellersDAVID SLATTERY, MARIA BRENNAN, CAROLINE CANNY, GLORIA AVALOS, FIDELMA DUNNE, Galway, Ireland
Travellers are a disadvantaged ethnic minority group in Ireland.They experience poor health compared to the background Irish population.
Male and female Travellers on average live 14 and 11 years less respectively than Irish non – Travellers. It is well known that cardiovascular disease (CVD) is a major cause of mortality and morbidity in this group .Our pilot study determines the prevalence of type 2 diabetes, pre-diabetes(impaired fasting glucose and impaired glucose tolerance) and the metabolic syndrome(MetS) in Travellers living on the Irish Atlantic seaboard as well as assessing for the more traditional cardiovascular risk factors.
Travellers(>18 years) were recruited via the Galway and Western Traveller movements. Following informed consent and an overnight fast, blood was drawn for glucose levels, lipid profi les and a 2 hour 75g oral glucose tolerance test (OGTT).
Blood pressure, weight, height and waist circumference were also measured.Metabolic syndrome (MetS) was defi ned using the National Cholesterol
Education Programme (NCEP) revised third audit criteria. Statistical analysis was performed using SPSS 18.
To date, 354 Travellers have participated in our study. 127 males and 227 females with a mean age of 37± 11.21 years. The prevalence of diabetes, pre-diabetes and the MetS is 5.9%(p=0.1302), 9.3%(p=0.0149) and 39.3%(p<0.0001)
respectively. In the background Irish population, these prevalences are estimated to be 4.3%, 6.2% and 21% respectively. While the prevalence of type 2 diabetes is higher in Travellers, it is not statistically signifi cant when compared to the background population. When interpreting this, one must consider the young age of the cohort and that the prevalence of type 2 diabetes increases with age. Additionally, 47% are obese and a further 33% overweight. 61% display abdominal obesity, 39% were hypertensive, hypertriglyceridaemia was present in 42% and 43% had an elevated LDL cholesterol of > 3mmol/l.
Targeted screening for glucose abnormalities and CVD risk factors is needed in this high risk group. Appropriate, culturally sensitive intervention might reasonably be expected to improve mortality rates and reduce morbidity.
2506-POThe Relation of Insulin Use and Cancer Risk: A Study in Japanese Patients with DiabetesYOSHIYUKI HAMAMOTO, SACHIKO HONJO, KANAKO MORI, YUKIKO KAWA-SAKI, YOSHIHARU WADA, KAZUHIRO NOMURA, HIROKI IKEDA, HIROYUKI KOSHI-YAMA, Osaka, Japan
There has been concern about a possible risk of developing cancer associated with insulin therapy. In the present study we examined the prevalence of cancer in relation to treatment with insulin.
The subjects included all of the outpatients of our hospital who had been administered insulin in 2004, and the presence of malignancy until December 2010 was investigated. We investigated the prevalence of cancer, type of cancer, duration of diabetes and period of insulin until the diagnosis of cancer. A total of 634 patients were investigated, and 121 patients (19.1%) were found to have at least one or more cancer. They were divided into the two groups, the patients who were found to have cancer after the start of insulin therapy (group A; n=50, 7.8%), and who started to use insulin after the diagnosis of cancer (group B; n= 71, 11.2%). In group A, 11 (22.0%) had multiple independent cancers, and 12 (24.0%) used insulin analogues. The mean duration of diabetes, duration from the start of insulin to the diagnosis, and dose of insulin were 16.1±10.4 years, 53.3±40.7 months, and 25.5±18.6 units per day, respectively. Hepatic cell carcinoma was most frequent (32.0%), followed by gastric (23.4%), colon (19.1%), breast (6.4%) and lung cancer (6.4%). There was no signifi cant correlation between the prevalence of cancer and insulin use. On the other hand, in group B, 10 (14.1%) had multiple cancers (before start of insulin), and pancreatic cancer was most frequent (21.2%), followed by gastric (19.2%), hepatic (17.3%), colon (13.5%) and beast cancer (11.5%).
In conclusion, our study indicated that cancer was frequently associated with Japanese patients with type 2 diabetes using insulin. However, there was no correlation between insulin use and cancer, and more than a half of them started insulin therapy after the diagnosis of cancer, suggesting that the causal relationship between the use of insulin and cancer was unlikely.
2507-POThyroid Dysfunction in Patients with Type 2 Diabetes: A Longitudinal StudyAFAF M.S. AL-ADSANI, Kuwait, Kuwait
Cross-sectional studies have reported that the risk of thyroid dysfunction in patients with type 2 diabetes is twofold higher than the non-diabetic subjects. However, a guideline for screening for thyroid dysfunction in type 2 diabetes is lacking. This study was conducted to determine the natural history and incidence of thyroid dysfunction in patients with type 2 diabetes. Medical records of 140 patients with type 2 diabetes who had attended a hospital-based clinic were reviewed. Thyroid stimulating hormone (TSH) and serum free thyroxine (T4) were measured at baseline and at annual review. Antibodies to thyroperoxidase (TPOAb) were documented. Mean age was 48.7 years, and 67.1% were females. Three patients (2.1%) were known to have thyroid disease, and nineteen patients (13.6%) were identifi ed to have thyroid dysfunction at baseline screening. Thyroid dysfunction was signifi cantly associated with positive TPOAb (p<0.0001) and female gender (p<0.05). Among the 118 patients with normal thyroid function tests at baseline, ten patients were lost to follow up. A total of 108 patients were periodically re-examined during 5.5 years of mean follow-up. Eight patients (7.4%) had incident thyroid dysfunction. One patient developed clinical hypothyroidism, one patient developed clinical hyperthyroidism and six patients developed subclinical hypothyroidism. Mean age was 38.3 years at diagnosis for type 2 diabetes and 55.9 years for thyroid dysfunction. Mean time between baseline and onset of thyroid dysfunction was 3.8 years. Thyroid dysfunction occurred more frequently in female (9.0%) than in male (4.9%) patients and in TPOAb+ patients (25.0%) than in TPOAb-
A662
For author disclosure information, see page 785.
CATEGORY
ADA-Funded Research
Epid
emio
logy
/G
enet
ics
PUB
LISH
ED O
NLY
EPIDEMIOLOGY
patients (6.2%), but both were not statistically signifi cant. TSH>2.2 mU/l was the signifi cant risk factor for incident thyroid dysfunction (p<0.0001). In conclusion, this study suggests that patients with type 2 diabetes should have assessment of thyroid function and TPO antibodies at baseline. Annual re-exmination should be limited to those with baseline TSH>2.2 mU/l and/or positive TPO antibodies. Patients with baseline TSH<2.2 mU/l should be re-examined less frequently (every 3 years), or if the patient develops symptoms of thyroid dysfunction.
2508-POTracking the Prevalence and Distribution of Diabetes in Canada “A Growing Concern”; a Systematic Literature ReviewJORGE ALFONSO ROSS TERRES, DANIELLA DHALLA, STEPHANIE CROLEY, NIGEL RAWSON, Toronto, ON, Canada
The increasing prevalence of diabetes mellitus (DM) has become an established trend in the past 20 years, which has been attributed to the rise in obesity, sedentary lifestyle and an aging population. We performed a systematic literature review to identify Canadian data describing the prevalence of DM.
PubMed, EMBASE and Web-based sources were searched from 2000-2010 using the criteria: English language, Canada, diabetes, incidence, prevalence, trends.
1982 sources were identifi ed. Of these, 42 underwent full-text review by 3 reviewers. 16 reported DM prevalence in Canada and 13 province-specifi c prevalence, while the other 13 reported prevalence in aboriginal populations. The majority of articles reported DM prevalence using analyses of hospitalizations (ICD code listings).
Data were available from 1990-2007 in age, sex, and province-specifi c formats. Overall, DM prevalence increased dramatically in Canada from 1990 to 2007. The prevalence of diagnosed DM among Canadians (population 33,465,522) was 6.2% in 2006-07 (5.9% for females and 6.6% for males). The age-standardized prevalence of diagnosed DM increased by 4% from 2005-06 and 21% between 2002 and 2007. The age-standardized prevalence varied across the provinces, being higher in Newfoundland and Labrador (5.9%), Nova Scotia (5.8%), Manitoba (5.6%), New Brunswick (5.6%) and Ontario (5.6%) and lower in Alberta (4.7%), British Columbia (4.9%), Quebec (4.7%) and Saskatchewan (5.1%). A lower prevalence was found among children and adolescents. Signifi cant increases were found among individuals aged 35-39 years (2.4%), 45-49 years (5.3%), and 65- 69 years (19.5%). In the aboriginal community, the prevalence increased by ∼15.5% from 2002 to 2007.
Recent reports show a substantial increase of DM in Canada in the past 10 years. Despite progress in risk factor identifi cation and the development of effective clinical tools, the trend of DM is still on the rise. The baby boomer effect impacts Canada more than any other country. Information necessary to anticipate and plan for DM needs of aging Canadians requires improvement in resources to manage the greater number of people living longer with the disease.
2509-POTriglyceride to HDL Cholesterol Ratio and Systolic Blood Pressure: Potential Markers for NAFLD in Patients with Type 2 DiabetesCHEVON M. ALDERSON, LINDA MORROW, SUZANNE P. LINDSAY, San Diego, CA, Chula Vista, CA
Non-alcoholic fatty liver disease (NAFLD) in patients with type 2 diabetes is associated with an increased risk of mortality in this population; the relationship between risk factors for mortality and NAFLD has not been well defi ned. This cross-sectional study of 78 patients with type 2 diabetes examined the hypothesis that patients with NAFLD were more likely than those without NAFLD to have elevated triglyceride/HDL ratio. NAFLD, identifi ed by abdominal ultrasound, was present in 72% (n=56) of the sample. Patients with NAFLD had a mean triglyceride/HDL ratio of 3.64; those with no NAFLD had a mean ratio of 2.60 (p=0.0293). Very low-density lipoprotein (VLDL) caused a 35.7% reduction in the Odds Ratio (OR) of the relationship between triglyceride/HDL ratio and NAFLD. Bivariate analysis of racial/ethnic (R/E) groups across triglyceride/HDL ratio and VLDL revealed signifi cant differences (see table).
No NAFLDN = 22
NAFLDN = 56
Within group t-test p-value
Triglyceride:HDL ratioAfrican American (AA) (N=22) 1.505 2.831 0.005White (W) (N=26) 2.862 4.031 0.308Hispanic/Other (H) (N=30) 3.590 3.745 0.888VLDLAA 16.444 26.826 0.017W 29 32.273 0.680H 28 32.571 0.472
AA with NAFLD had signifi cantly higher triglyceride/HDL ratios and VLDL levels than those without NAFLD. They also had signifi cantly lower average triglyceride/HDL ratio and VLDL level versus W with NAFLD (p=0.024), suggesting that R/E may be an effect modifi er of the relationship. In multiple logistic regression analysis, SBP remained a signifi cant predictor of NAFLD. After controlling for age, gender, R/E, triglyceride/HDL ratio, and VLDL level, every 20 mm/Hg increase in SBP increased the likelihood of the presence of NAFLD nearly 3 fold (OR= 2.94, 95% CI (1.22, 6.98)). In conclusion, the cardiovascular risk factors of triglyceride/HDL ratio and SBP are important potential markers for NAFLD in this population. Larger studies examining these potential markers, using race and ethnicity as control variables and including VLDL as a potential confounder, are warranted.
2510-POType 1 Diabetes in Primary Care: Secular Trends in Cardiometabolic Risk Factors (2004-2009)SIMON G. ANDERSON, JEHAD AMLESH, RAM P. NARAYANAN, M. ZUBAIR QURESHI, ADRIAN H. HEALD, Manchester, United Kingdom, Crewe, United Kingdom
Multifactorial interventions for type 2 diabetes in primary care have been shown to be more effective than conventional risk factor management in the prevention of cardiovascular morbidity and mortality. We aimed to evaluate time-trends in cardiometabolic risk factor profi les for primary care patients with newly diagnosed and known type 1 diabetes attending annual screening.
We retrospectively examined longitudinal case records for 291 (137 female) adult patients (age range 16-85) with type 1 diabetes between 2004 and 2009. Data search of primary care records, in Cheshire, UK was performed through the EMIS® software provider using data held in primary care.
Baseline mean (±standard error) total cholesterol (5.00±0.08 vs. 4.5±0.07 mM, p<0.001) and triglycerides (1.5±0.13 vs. 1.1±0.14 mM, p=0.04) levels were greater in females, with no differences by gender, for age, BMI, weight, HbA1c, diastolic or systolic blood pressure. Longitudinal analysis of individually followed patients indicated a mean 0.4% reduction in HbA1c from 8.3% at baseline (p = 0.002). The proportion of patients with an HbA1c ≥10% at baseline signifi cantly reduced over time from 14.0 to 9.5% (χ2 = 9.4, p = 0.002), with the mean HbA1c levels in this group falling from 11.7±0.4 to 9.1±0.6 % over 6 years. BMI remained unchanged (28.3 vs 28.4 kg/m2) over the same period. However total cholesterol fell by 12.5% from 4.8mM to 4.2mM, (p<0.0001) with a corresponding 23% reduction in LDL-cholesterol from 3.0mm to 2.3mM (p<0.0001). There was a signifi cant fall in diastolic blood pressure (78 to 74 mmHg, p =0.0016) with no change in systolic blood pressure. In a mixed longitudinal regression model, HbA1c was associated with LDL-cholesterol (β = 0.28, p <0.001) and age (β = 0.02, p = 0.001), independent of BMI, gender and systolic blood pressure.
In spite of intensive work to improve glycemic control in type 1 diabetes, mean HbA1c remains above target for many people in our area, highlighting the diffi culty of bringing patients with type 1 diabetes to target HbA1c. The signifi cant reduction in diastolic blood pressure, LDL and total cholesterol may have long-term benefi t in cardiovascular event rate reduction.
2511-POValidation of the PHQ9 and CESD to Screen for Depression in Hong Kong Chinese Type 2 DiabetesHAIRONG NAN, GARY T.C. KO, JOYCE LAM, ALICE KONG, ROSE TING, H.B. LAM, HARRIET CHUNG, REBECCA WONG, WING-YEE SO, YUN-KWOK WING, JULIANA C.N. CHAN, Hong Kong, China
Amongst various instruments used to screen for depression, the 9-item Patient Health Questionnaire (PHQ9) and Center for Epidemiological Studies Depression Scale (CESD) are most popular which have been validated in American and Mainland Chinese general population. We aim to confi rm the validity of PHQ9 and CESD in detecting major depressive disorder (MDD)
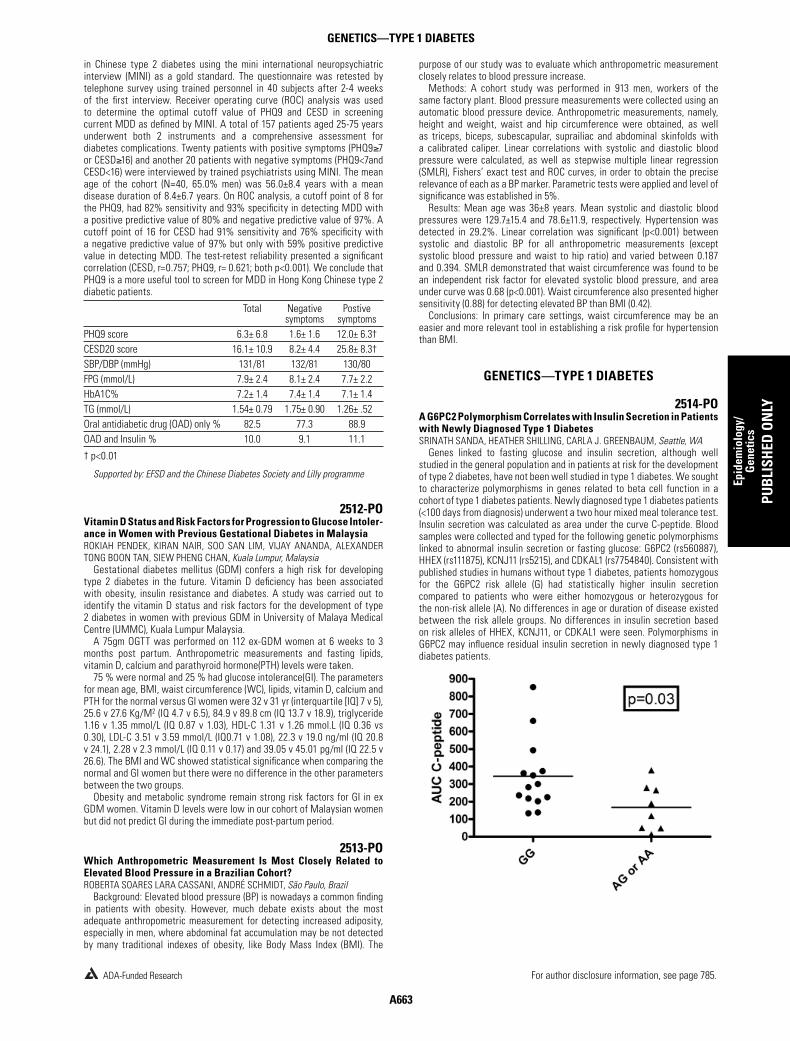
A663
For author disclosure information, see page 785.
CATEGORY
ADA-Funded Research
Epid
emio
logy
/G
enet
ics
PUB
LISH
ED O
NLY
GENETICS—TYPE 1 DIABETES
in Chinese type 2 diabetes using the mini international neuropsychiatric interview (MINI) as a gold standard. The questionnaire was retested by telephone survey using trained personnel in 40 subjects after 2-4 weeks of the fi rst interview. Receiver operating curve (ROC) analysis was used to determine the optimal cutoff value of PHQ9 and CESD in screening current MDD as defi ned by MINI. A total of 157 patients aged 25-75 years underwent both 2 instruments and a comprehensive assessment for diabetes complications. Twenty patients with positive symptoms (PHQ9≥7 or CESD≥16) and another 20 patients with negative symptoms (PHQ9<7and CESD<16) were interviewed by trained psychiatrists using MINI. The mean age of the cohort (N=40, 65.0% men) was 56.0±8.4 years with a mean disease duration of 8.4±6.7 years. On ROC analysis, a cutoff point of 8 for the PHQ9, had 82% sensitivity and 93% specifi city in detecting MDD with a positive predictive value of 80% and negative predictive value of 97%. A cutoff point of 16 for CESD had 91% sensitivity and 76% specifi city with a negative predictive value of 97% but only with 59% positive predictive value in detecting MDD. The test-retest reliability presented a signifi cant correlation (CESD, r=0.757; PHQ9, r= 0.621; both p<0.001). We conclude that PHQ9 is a more useful tool to screen for MDD in Hong Kong Chinese type 2 diabetic patients.
Total Negative symptoms
Postive symptoms
PHQ9 score 6.3± 6.8 1.6± 1.6 12.0± 6.3†CESD20 score 16.1± 10.9 8.2± 4.4 25.8± 8.3†SBP/DBP (mmHg) 131/81 132/81 130/80FPG (mmol/L) 7.9± 2.4 8.1± 2.4 7.7± 2.2HbA1C% 7.2± 1.4 7.4± 1.4 7.1± 1.4TG (mmol/L) 1.54± 0.79 1.75± 0.90 1.26± .52Oral antidiabetic drug (OAD) only % 82.5 77.3 88.9OAD and Insulin % 10.0 9.1 11.1
† p<0.01
Supported by: EFSD and the Chinese Diabetes Society and Lilly programme
2512-POVitamin D Status and Risk Factors for Progression to Glucose Intoler-ance in Women with Previous Gestational Diabetes in MalaysiaROKIAH PENDEK, KIRAN NAIR, SOO SAN LIM, VIJAY ANANDA, ALEXANDER TONG BOON TAN, SIEW PHENG CHAN, Kuala Lumpur, Malaysia
Gestational diabetes mellitus (GDM) confers a high risk for developing type 2 diabetes in the future. Vitamin D defi ciency has been associated with obesity, insulin resistance and diabetes. A study was carried out to identify the vitamin D status and risk factors for the development of type 2 diabetes in women with previous GDM in University of Malaya Medical Centre (UMMC), Kuala Lumpur Malaysia.
A 75gm OGTT was performed on 112 ex-GDM women at 6 weeks to 3 months post partum. Anthropometric measurements and fasting lipids, vitamin D, calcium and parathyroid hormone(PTH) levels were taken.
75 % were normal and 25 % had glucose intolerance(GI). The parameters for mean age, BMI, waist circumference (WC), lipids, vitamin D, calcium and PTH for the normal versus GI women were 32 v 31 yr (interquartile [IQ] 7 v 5), 25.6 v 27.6 Kg/M2 (IQ 4.7 v 6.5), 84.9 v 89.8 cm (IQ 13.7 v 18.9), triglyceride 1.16 v 1.35 mmol/L (IQ 0.87 v 1.03), HDL-C 1.31 v 1.26 mmol.L (IQ 0.36 vs 0.30), LDL-C 3.51 v 3.59 mmol/L (IQ0.71 v 1.08), 22.3 v 19.0 ng/ml (IQ 20.8 v 24.1), 2.28 v 2.3 mmol/L (IQ 0.11 v 0.17) and 39.05 v 45.01 pg/ml (IQ 22.5 v 26.6). The BMI and WC showed statistical signifi cance when comparing the normal and GI women but there were no difference in the other parameters between the two groups.
Obesity and metabolic syndrome remain strong risk factors for GI in ex GDM women. Vitamin D levels were low in our cohort of Malaysian women but did not predict GI during the immediate post-partum period.
2513-POWhich Anthropometric Measurement Is Most Closely Related to Elevated Blood Pressure in a Brazilian Cohort?ROBERTA SOARES LARA CASSANI, ANDRÉ SCHMIDT, São Paulo, Brazil
Background: Elevated blood pressure (BP) is nowadays a common fi nding in patients with obesity. However, much debate exists about the most adequate anthropometric measurement for detecting increased adiposity, especially in men, where abdominal fat accumulation may be not detected by many traditional indexes of obesity, like Body Mass Index (BMI). The
purpose of our study was to evaluate which anthropometric measurement closely relates to blood pressure increase.
Methods: A cohort study was performed in 913 men, workers of the same factory plant. Blood pressure measurements were collected using an automatic blood pressure device. Anthropometric measurements, namely, height and weight, waist and hip circumference were obtained, as well as triceps, biceps, subescapular, suprailiac and abdominal skinfolds with a calibrated caliper. Linear correlations with systolic and diastolic blood pressure were calculated, as well as stepwise multiple linear regression (SMLR), Fishers’ exact test and ROC curves, in order to obtain the precise relevance of each as a BP marker. Parametric tests were applied and level of signifi cance was established in 5%.
Results: Mean age was 36±8 years. Mean systolic and diastolic blood pressures were 129.7±15.4 and 78.6±11.9, respectively. Hypertension was detected in 29.2%. Linear correlation was signifi cant (p<0.001) between systolic and diastolic BP for all anthropometric measurements (except systolic blood pressure and waist to hip ratio) and varied between 0.187 and 0.394. SMLR demonstrated that waist circumference was found to be an independent risk factor for elevated systolic blood pressure, and area under curve was 0.68 (p<0.001). Waist circumference also presented higher sensitivity (0.88) for detecting elevated BP than BMI (0.42).
Conclusions: In primary care settings, waist circumference may be an easier and more relevant tool in establishing a risk profi le for hypertension than BMI.
GENETICS—TYPE 1 DIABETES
2514-POA G6PC2 Polymorphism Correlates with Insulin Secretion in Patients with Newly Diagnosed Type 1 DiabetesSRINATH SANDA, HEATHER SHILLING, CARLA J. GREENBAUM, Seattle, WA
Genes linked to fasting glucose and insulin secretion, although well studied in the general population and in patients at risk for the development of type 2 diabetes, have not been well studied in type 1 diabetes. We sought to characterize polymorphisms in genes related to beta cell function in a cohort of type 1 diabetes patients. Newly diagnosed type 1 diabetes patients (<100 days from diagnosis) underwent a two hour mixed meal tolerance test. Insulin secretion was calculated as area under the curve C-peptide. Blood samples were collected and typed for the following genetic polymorphisms linked to abnormal insulin secretion or fasting glucose: G6PC2 (rs560887), HHEX (rs111875), KCNJ11 (rs5215), and CDKAL1 (rs7754840). Consistent with published studies in humans without type 1 diabetes, patients homozygous for the G6PC2 risk allele (G) had statistically higher insulin secretion compared to patients who were either homozygous or heterozygous for the non-risk allele (A). No differences in age or duration of disease existed between the risk allele groups. No differences in insulin secretion based on risk alleles of HHEX, KCNJ11, or CDKAL1 were seen. Polymorphisms in G6PC2 may infl uence residual insulin secretion in newly diagnosed type 1 diabetes patients.
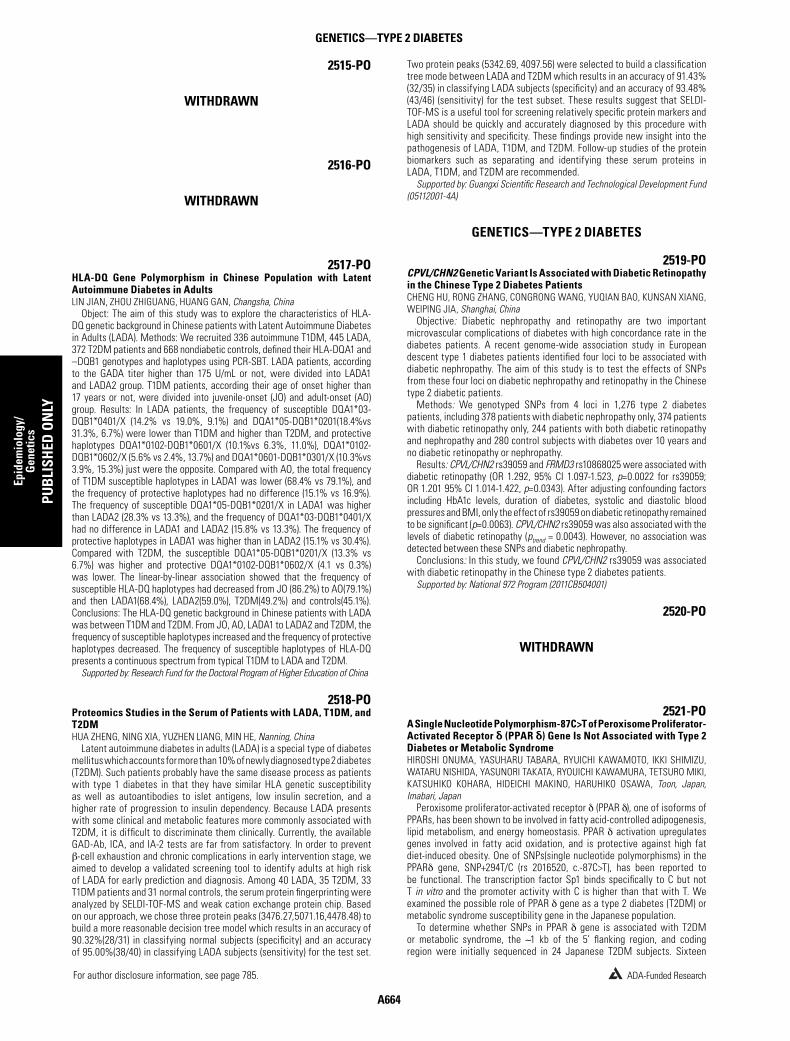
A664
For author disclosure information, see page 785.
CATEGORY
ADA-Funded Research
Epid
emio
logy
/G
enet
ics
PUB
LISH
ED O
NLY
GENETICS—TYPE 2 DIABETES
2515-PO
WITHDRAWN
2516-PO
WITHDRAWN
2517-POHLA-DQ Gene Polymorphism in Chinese Population with Latent Autoimmune Diabetes in AdultsLIN JIAN, ZHOU ZHIGUANG, HUANG GAN, Changsha, China
Object: The aim of this study was to explore the characteristics of HLA-DQ genetic background in Chinese patients with Latent Autoimmune Diabetes in Adults (LADA). Methods: We recruited 336 autoimmune T1DM, 445 LADA, 372 T2DM patients and 668 nondiabetic controls, defi ned their HLA-DQA1 and –DQB1 genotypes and haplotypes using PCR-SBT. LADA patients, according to the GADA titer higher than 175 U/mL or not, were divided into LADA1 and LADA2 group. T1DM patients, according their age of onset higher than 17 years or not, were divided into juvenile-onset (JO) and adult-onset (AO) group. Results: In LADA patients, the frequency of susceptible DQA1*03-DQB1*0401/X (14.2% vs 19.0%, 9.1%) and DQA1*05-DQB1*0201(18.4%vs 31.3%, 6.7%) were lower than T1DM and higher than T2DM, and protective haplotypes DQA1*0102-DQB1*0601/X (10.1%vs 6.3%, 11.0%), DQA1*0102-DQB1*0602/X (5.6% vs 2.4%, 13.7%) and DQA1*0601-DQB1*0301/X (10.3%vs 3.9%, 15.3%) just were the opposite. Compared with AO, the total frequency of T1DM susceptible haplotypes in LADA1 was lower (68.4% vs 79.1%), and the frequency of protective haplotypes had no difference (15.1% vs 16.9%). The frequency of susceptible DQA1*05-DQB1*0201/X in LADA1 was higher than LADA2 (28.3% vs 13.3%), and the frequency of DQA1*03-DQB1*0401/X had no difference in LADA1 and LADA2 (15.8% vs 13.3%). The frequency of protective haplotypes in LADA1 was higher than in LADA2 (15.1% vs 30.4%). Compared with T2DM, the susceptible DQA1*05-DQB1*0201/X (13.3% vs 6.7%) was higher and protective DQA1*0102-DQB1*0602/X (4.1 vs 0.3%) was lower. The linear-by-linear association showed that the frequency of susceptible HLA-DQ haplotypes had decreased from JO (86.2%) to AO(79.1%) and then LADA1(68.4%), LADA2(59.0%), T2DM(49.2%) and controls(45.1%). Conclusions: The HLA-DQ genetic background in Chinese patients with LADA was between T1DM and T2DM. From JO, AO, LADA1 to LADA2 and T2DM, the frequency of susceptible haplotypes increased and the frequency of protective haplotypes decreased. The frequency of susceptible haplotypes of HLA-DQ presents a continuous spectrum from typical T1DM to LADA and T2DM.
Supported by: Research Fund for the Doctoral Program of Higher Education of China
2518-POProteomics Studies in the Serum of Patients with LADA, T1DM, and T2DMHUA ZHENG, NING XIA, YUZHEN LIANG, MIN HE, Nanning, China
Latent autoimmune diabetes in adults (LADA) is a special type of diabetes mellitus which accounts for more than 10% of newly diagnosed type 2 diabetes (T2DM). Such patients probably have the same disease process as patients with type 1 diabetes in that they have similar HLA genetic susceptibility as well as autoantibodies to islet antigens, low insulin secretion, and a higher rate of progression to insulin dependency. Because LADA presents with some clinical and metabolic features more commonly associated with T2DM, it is diffi cult to discriminate them clinically. Currently, the available GAD-Ab, ICA, and IA-2 tests are far from satisfactory. In order to prevent β-cell exhaustion and chronic complications in early intervention stage, we aimed to develop a validated screening tool to identify adults at high risk of LADA for early prediction and diagnosis. Among 40 LADA, 35 T2DM, 33 T1DM patients and 31 normal controls, the serum protein fi ngerprinting were analyzed by SELDI-TOF-MS and weak cation exchange protein chip. Based on our approach, we chose three protein peaks (3476.27,5071.16,4478.48) to build a more reasonable decision tree model which results in an accuracy of 90.32%(28/31) in classifying normal subjects (specifi city) and an accuracy of 95.00%(38/40) in classifying LADA subjects (sensitivity) for the test set.
Two protein peaks (5342.69, 4097.56) were selected to build a classifi cation tree mode between LADA and T2DM which results in an accuracy of 91.43% (32/35) in classifying LADA subjects (specifi city) and an accuracy of 93.48% (43/46) (sensitivity) for the test subset. These results suggest that SELDI-TOF-MS is a useful tool for screening relatively specifi c protein markers and LADA should be quickly and accurately diagnosed by this procedure with high sensitivity and specifi city. These fi ndings provide new insight into the pathogenesis of LADA, T1DM, and T2DM. Follow-up studies of the protein biomarkers such as separating and identifying these serum proteins in LADA, T1DM, and T2DM are recommended.
Supported by: Guangxi Scientifi c Research and Technological Development Fund (05112001-4A)
GENETICS—TYPE 2 DIABETES
2519-POCPVL/CHN2 Genetic Variant Is Associated with Diabetic Retinopathy in the Chinese Type 2 Diabetes PatientsCHENG HU, RONG ZHANG, CONGRONG WANG, YUQIAN BAO, KUNSAN XIANG, WEIPING JIA, Shanghai, China
Objective: Diabetic nephropathy and retinopathy are two important microvascular complications of diabetes with high concordance rate in the diabetes patients. A recent genome-wide association study in European descent type 1 diabetes patients identifi ed four loci to be associated with diabetic nephropathy. The aim of this study is to test the effects of SNPs from these four loci on diabetic nephropathy and retinopathy in the Chinese type 2 diabetic patients.
Methods: We genotyped SNPs from 4 loci in 1,276 type 2 diabetes patients, including 378 patients with diabetic nephropathy only, 374 patients with diabetic retinopathy only, 244 patients with both diabetic retinopathy and nephropathy and 280 control subjects with diabetes over 10 years and no diabetic retinopathy or nephropathy.
Results: CPVL/CHN2 rs39059 and FRMD3 rs10868025 were associated with diabetic retinopathy (OR 1.292, 95% CI 1.097-1.523, p=0.0022 for rs39059; OR 1.201 95% CI 1.014-1.422, p=0.0343). After adjusting confounding factors including HbA1c levels, duration of diabetes, systolic and diastolic blood pressures and BMI, only the effect of rs39059 on diabetic retinopathy remained to be signifi cant (p=0.0063). CPVL/CHN2 rs39059 was also associated with the levels of diabetic retinopathy (ptrend = 0.0043). However, no association was detected between these SNPs and diabetic nephropathy.
Conclusions: In this study, we found CPVL/CHN2 rs39059 was associated with diabetic retinopathy in the Chinese type 2 diabetes patients.
Supported by: National 972 Program (2011CB504001)
2520-PO
WITHDRAWN
2521-POA Single Nucleotide Polymorphism-87C>T of Peroxisome Proliferator-Activated Receptor δ (PPAR δ) Gene Is Not Associated with Type 2 Diabetes or Metabolic SyndromeHIROSHI ONUMA, YASUHARU TABARA, RYUICHI KAWAMOTO, IKKI SHIMIZU, WATARU NISHIDA, YASUNORI TAKATA, RYOUICHI KAWAMURA, TETSURO MIKI, KATSUHIKO KOHARA, HIDEICHI MAKINO, HARUHIKO OSAWA, Toon, Japan, Imabari, Japan
Peroxisome proliferator-activated receptor δ (PPAR δ), one of isoforms of PPARs, has been shown to be involved in fatty acid-controlled adipogenesis, lipid metabolism, and energy homeostasis. PPAR δ activation upregulates genes involved in fatty acid oxidation, and is protective against high fat diet-induced obesity. One of SNPs(single nucleotide polymorphisms) in the PPARδ gene, SNP+294T/C (rs 2016520, c.-87C>T), has been reported to be functional. The transcription factor Sp1 binds specifi cally to C but not T in vitro and the promoter activity with C is higher than that with T. We examined the possible role of PPAR δ gene as a type 2 diabetes (T2DM) or metabolic syndrome susceptibility gene in the Japanese population.
To determine whether SNPs in PPAR δ gene is associated with T2DM or metabolic syndrome, the ∼1 kb of the 5’ fl anking region, and coding region were initially sequenced in 24 Japanese T2DM subjects. Sixteen
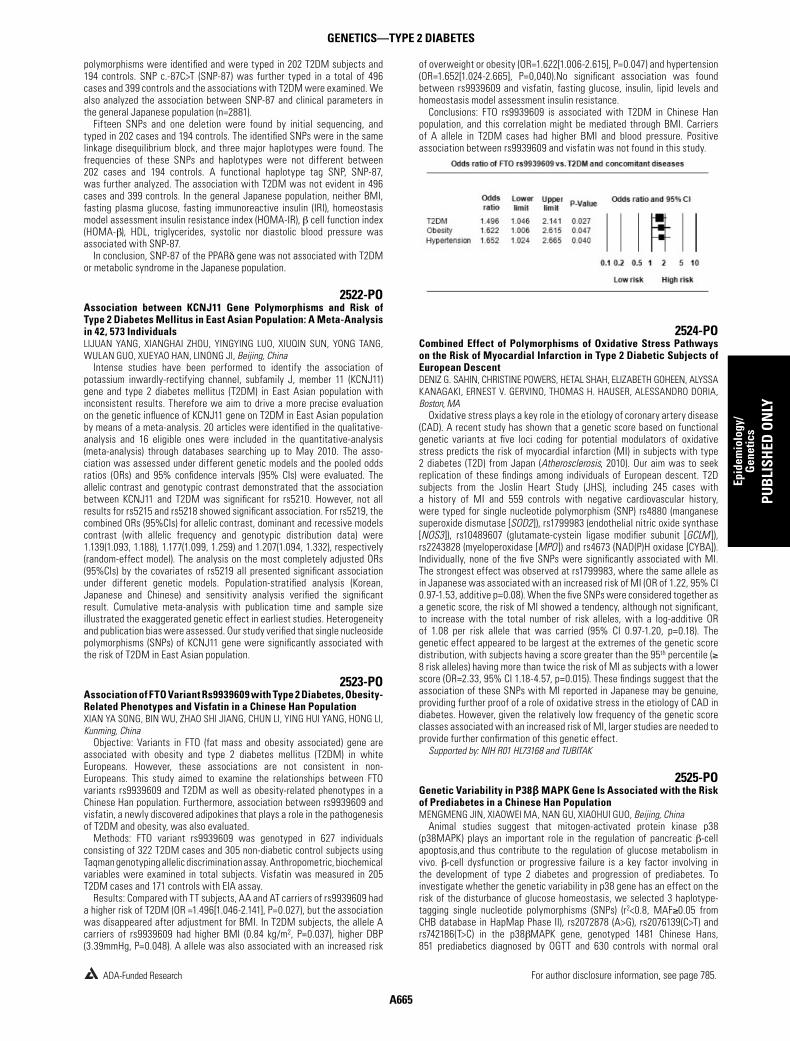
A665
For author disclosure information, see page 785.
CATEGORY
ADA-Funded Research
Epid
emio
logy
/G
enet
ics
PUB
LISH
ED O
NLY
GENETICS—TYPE 2 DIABETES
polymorphisms were identifi ed and were typed in 202 T2DM subjects and 194 controls. SNP c.-87C>T (SNP-87) was further typed in a total of 496 cases and 399 controls and the associations with T2DM were examined. We also analyzed the association between SNP-87 and clinical parameters in the general Japanese population (n=2881).
Fifteen SNPs and one deletion were found by initial sequencing, and typed in 202 cases and 194 controls. The identifi ed SNPs were in the same linkage disequilibrium block, and three major haplotypes were found. The frequencies of these SNPs and haplotypes were not different between 202 cases and 194 controls. A functional haplotype tag SNP, SNP-87, was further analyzed. The association with T2DM was not evident in 496 cases and 399 controls. In the general Japanese population, neither BMI, fasting plasma glucose, fasting immunoreactive insulin (IRI), homeostasis model assessment insulin resistance index (HOMA-IR), β cell function index (HOMA-β), HDL, triglycerides, systolic nor diastolic blood pressure was associated with SNP-87.
In conclusion, SNP-87 of the PPARδ gene was not associated with T2DM or metabolic syndrome in the Japanese population.
2522-POAssociation between KCNJ11 Gene Polymorphisms and Risk of Type 2 Diabetes Mellitus in East Asian Population: A Meta-Analysis in 42, 573 IndividualsLIJUAN YANG, XIANGHAI ZHOU, YINGYING LUO, XIUQIN SUN, YONG TANG, WULAN GUO, XUEYAO HAN, LINONG JI, Beijing, China
Intense studies have been performed to identify the association of potassium inwardly-rectifying channel, subfamily J, member 11 (KCNJ11) gene and type 2 diabetes mellitus (T2DM) in East Asian population with inconsistent results. Therefore we aim to drive a more precise evaluation on the genetic infl uence of KCNJ11 gene on T2DM in East Asian population by means of a meta-analysis. 20 articles were identifi ed in the qualitative-analysis and 16 eligible ones were included in the quantitative-analysis (meta-analysis) through databases searching up to May 2010. The asso-ciation was assessed under different genetic models and the pooled odds ratios (ORs) and 95% confi dence intervals (95% CIs) were evaluated. The allelic contrast and genotypic contrast demonstrated that the association between KCNJ11 and T2DM was signifi cant for rs5210. However, not all results for rs5215 and rs5218 showed signifi cant association. For rs5219, the combined ORs (95%CIs) for allelic contrast, dominant and recessive models contrast (with allelic frequency and genotypic distribution data) were 1.139(1.093, 1.188), 1.177(1.099, 1.259) and 1.207(1.094, 1.332), respectively (random-effect model). The analysis on the most completely adjusted ORs (95%CIs) by the covariates of rs5219 all presented signifi cant association under different genetic models. Population-stratifi ed analysis (Korean, Japanese and Chinese) and sensitivity analysis verifi ed the signifi cant result. Cumulative meta-analysis with publication time and sample size illustrated the exaggerated genetic effect in earliest studies. Heterogeneity and publication bias were assessed. Our study verifi ed that single nucleoside polymorphisms (SNPs) of KCNJ11 gene were signifi cantly associated with the risk of T2DM in East Asian population.
2523-POAssociation of FTO Variant Rs9939609 with Type 2 Diabetes, Obesity-Related Phenotypes and Visfatin in a Chinese Han PopulationXIAN YA SONG, BIN WU, ZHAO SHI JIANG, CHUN LI, YING HUI YANG, HONG LI, Kunming, China
Objective: Variants in FTO (fat mass and obesity associated) gene are associated with obesity and type 2 diabetes mellitus (T2DM) in white Europeans. However, these associations are not consistent in non-Europeans. This study aimed to examine the relationships between FTO variants rs9939609 and T2DM as well as obesity-related phenotypes in a Chinese Han population. Furthermore, association between rs9939609 and visfatin, a newly discovered adipokines that plays a role in the pathogenesis of T2DM and obesity, was also evaluated.
Methods: FTO variant rs9939609 was genotyped in 627 individuals consisting of 322 T2DM cases and 305 non-diabetic control subjects using Taqman genotyping allelic discrimination assay. Anthropometric, biochemical variables were examined in total subjects. Visfatin was measured in 205 T2DM cases and 171 controls with EIA assay.
Results: Compared with TT subjects, AA and AT carriers of rs9939609 had a higher risk of T2DM (OR =1.496[1.046-2.141], P=0.027), but the association was disappeared after adjustment for BMI. In T2DM subjects, the allele A carriers of rs9939609 had higher BMI (0.84 kg/m2, P=0.037), higher DBP (3.39mmHg, P=0.048). A allele was also associated with an increased risk
of overweight or obesity (OR=1.622[1.006-2.615], P=0.047) and hypertension (OR=1.652[1.024-2.665], P=0,040).No signifi cant association was found between rs9939609 and visfatin, fasting glucose, insulin, lipid levels and homeostasis model assessment insulin resistance.
Conclusions: FTO rs9939609 is associated with T2DM in Chinese Han population, and this correlation might be mediated through BMI. Carriers of A allele in T2DM cases had higher BMI and blood pressure. Positive association between rs9939609 and visfatin was not found in this study.
2524-POCombined Effect of Polymorphisms of Oxidative Stress Pathways on the Risk of Myocardial Infarction in Type 2 Diabetic Subjects of European DescentDENIZ G. SAHIN, CHRISTINE POWERS, HETAL SHAH, ELIZABETH GOHEEN, ALYSSA KANAGAKI, ERNEST V. GERVINO, THOMAS H. HAUSER, ALESSANDRO DORIA, Boston, MA
Oxidative stress plays a key role in the etiology of coronary artery disease (CAD). A recent study has shown that a genetic score based on functional genetic variants at fi ve loci coding for potential modulators of oxidative stress predicts the risk of myocardial infarction (MI) in subjects with type 2 diabetes (T2D) from Japan (Atherosclerosis, 2010). Our aim was to seek replication of these fi ndings among individuals of European descent. T2D subjects from the Joslin Heart Study (JHS), including 245 cases with a history of MI and 559 controls with negative cardiovascular history, were typed for single nucleotide polymorphism (SNP) rs4880 (manganese superoxide dismutase [SOD2 ]), rs1799983 (endothelial nitric oxide synthase [NOS3 ]), rs10489607 (glutamate-cystein ligase modifi er subunit [GCLM ]), rs2243828 (myeloperoxidase [MPO ]) and rs4673 (NAD(P)H oxidase [CYBA]). Individually, none of the fi ve SNPs were signifi cantly associated with MI. The strongest effect was observed at rs1799983, where the same allele as in Japanese was associated with an increased risk of MI (OR of 1.22, 95% CI 0.97-1.53, additive p=0.08). When the fi ve SNPs were considered together as a genetic score, the risk of MI showed a tendency, although not signifi cant, to increase with the total number of risk alleles, with a log-additive OR of 1.08 per risk allele that was carried (95% CI 0.97-1.20, p=0.18). The genetic effect appeared to be largest at the extremes of the genetic score distribution, with subjects having a score greater than the 95th percentile (≥ 8 risk alleles) having more than twice the risk of MI as subjects with a lower score (OR=2.33, 95% CI 1.18-4.57, p=0.015). These fi ndings suggest that the association of these SNPs with MI reported in Japanese may be genuine, providing further proof of a role of oxidative stress in the etiology of CAD in diabetes. However, given the relatively low frequency of the genetic score classes associated with an increased risk of MI, larger studies are needed to provide further confi rmation of this genetic effect.
Supported by: NIH R01 HL73168 and TUBITAK
2525-POGenetic Variability in P38β MAPK Gene Is Associated with the Risk of Prediabetes in a Chinese Han PopulationMENGMENG JIN, XIAOWEI MA, NAN GU, XIAOHUI GUO, Beijing, China
Animal studies suggest that mitogen-activated protein kinase p38 (p38MAPK) plays an important role in the regulation of pancreatic β-cell apoptosis,and thus contribute to the regulation of glucose metabolism in vivo. β-cell dysfunction or progressive failure is a key factor involving in the development of type 2 diabetes and progression of prediabetes. To investigate whether the genetic variability in p38 gene has an effect on the risk of the disturbance of glucose homeostasis, we selected 3 haplotype-tagging single nucleotide polymorphisms (SNPs) (r2<0.8, MAF≥0.05 from CHB database in HapMap Phase II), rs2072878 (A>G), rs2076139(C>T) and rs742186(T>C) in the p38βMAPK gene, genotyped 1481 Chinese Hans, 851 prediabetics diagnosed by OGTT and 630 controls with normal oral
A666
For author disclosure information, see page 785.
CATEGORY
ADA-Funded Research
Epid
emio
logy
/G
enet
ics
PUB
LISH
ED O
NLY
GENETICS—TYPE 2 DIABETES
glucose tolerance and negative family history of type 2 diabetes (Table 1). At rs2072878 locus, the frequency of allele A was higher in the prediabetic group compared to allele G (OR=1.295, 95%CI 1.037-1.617, p =0.026). The AA homozygotes were at a higher risk than the non-carriers (OR=1.346, p=0.028). After adjusting for gender, age, BMI and WHR, the difference was still statistically signifi cant (OR’=1.442, p’=0.020). In the obese (BMI>28.0kg/m2) subjects, the carriers of genotype AA at rs2072878 locus had an increased risk for prediabetes compared to the lean carriers of genotype AG (p=0.000, OR= 1.435; p’=0.036, OR’=1.631 after adjustment). Our fi ndings indicated that the genetic variability in p38β MAPK gene may be associated with, and interact with obesity on, the risk of prediabetes in the Chinese Han population.
Tab. 1. Clinical Characteristics of Control and Pre-diabetic Individuals
Control(n=630) p-DM(n=851)Age(y) 65.9±7.1 61.7±11.3*Gender(M/F) 240/390 342/509BMI(kg/m2) 25.11±3.43 26.53±3.77FPG (mmol/L) 5.26±0.42 5.7±0.57*2hPG(mmol/L) 6.01±1.07 8.5±1.33*TC(mmol/L) 5.24±1.00 5.28±1.11TG(mmol/L) 1.54±0.99 1.86±1.28*HDL-C(mmol/L) 1.35±0.33 1.29±0.35LDL-C(mmol/L) 3.23±0.94 3.25±1.50
Compared with control group: *p < 0.05
Supported by: National Natural Science Foundation of China (NSFC30771033)
2526-POGenetic Variants of TCF7L2 Are Strongly Associated with Increased Risk of Type 2 Diabetes in Lebanese SubjectsRITA NEMR, AKRAM ECHTAY, MAI S. SATER, WASSIM Y. ALMAWI, Beirut, Lebanon, Manama, Bahrain
Background. Genome-wide association studies validated transcription factor 7-like 2 (TCF7L2) gene as a type 2 diabetes (T2DM) susceptibility locus, and an ethnic contribution of specifi c TCF7L2 variants to T2DM risk was reported.
Aim. We investigated the associations of rs7901695, rs4506565, rs7903146, rs12243326, rs7895340, rs11196205 and rs12255372 TCF7L2 variants in 376 Lebanese T2DM patients and 376 control subjects.
Methods. TCF7L2 genotyping was done by allelic discrimination method.Results. The distribution of TCF7L2 variants was in Hardy-Weinberg
equilibrium. Minor allele frequencies of rs7901695 [P = 0.012], rs4506565 [P <0.001], rs7903146 [P <0.001], rs12243326 [P <0.001], and rs12255372 [P <0.001] were signifi cantly higher in cases. All variants showed increased risk when homozygous than heterozygous, thus establishing a dose-response effect. The seven TCF7L2 variants were found to be in complete linkage disequilibrium. Four-locus (rs4506565 - rs7903146 - rs12243326 - rs12255372) haplotype analysis identifi ed strong association of the all-mutant haplotype (haplotype 2222) with increased T2DM risk (P = 1.0 ´ 10-8). Regression analysis confi rmed the positive association of haplotype 2222 (P < 0.001; aOR = 1.90; 95% CI = 1.47-2.46),and negative association of haplotypes 2221 (P = 0.023; aOR = 0.21; 95% CI = 0.05-0.81),1121 (P = 0.008; aOR = 0.11; 95% CI = 0.02-0.57),and 2111 (P = 0.045; aOR = 0.27; 95% CI = 0.08-0.97),with T2DM after controlling for covariates.
Marker Assoc Allele Patients1 Controls1 c2 P value2 OR (95% CI)
rs7901695 C 354 (0.47) 295 (0.39) 6.38 0.003 1.38 (1.12 – 1.69)
rs4506565 T 350 (0.47) 3 278 (0.37) 14.14 2.1 ´ 10-4 1.48 (1.20 – 1.82)
rs7903146 T 335 (0.45) 255 (0.34) 17.35 3.0 ´ 10-5 1.57 (1.27 – 1.93)
rs12243326 C 329 (0.44) 239 (0.32) 22.86 2.0 ´ 10-6 1.67 (1.35 – 2.06)
rs7895340 A 310 (0.41) 266 (0.35) 4.35 0.022 1.28 (1.04 – 1.58)
rs11196205 C 293 (0.39) 275 (0.37) 0.52 0.366 1.11 (0.90 – 1.36)
rs12255372 T 353 (0.47) 246 (0.33) 31.72 1.8 ´ 10-8 1.82 (1.48 – 2.24)
Conclusion. Our data replicate similar fi ndings established for other ethnic groups, thereby establishing TCF7L2 as a universal T2DM candidate gene.
2527-POIdentifi cation of MODY through a Monogenic Diabetes RegistryROCHELLE N. NAYLOR, SIRI AW GREELEY, HELEN I. WORRELL, KINGA B. SKOWRON, VERONICA P. PAZ, GRAEME I. BELL, LOUIS H. PHILIPSON, Chicago, IL
Monogenic diabetes accounts for ∼2% of all diabetes yet most cases are undiagnosed. MODY is the most prevalent type of monogenic diabetes and is characterized by autosomal dominant inheritance of young onset, non-insulin dependent diabetes. Mutations in at least 7 different genes important in beta cell function and in the gene encoding insulin can cause MODY with varying clinical manifestations. MODY is often misdiagnosed as type 1 or type 2 diabetes. However, a genetic diagnosis of MODY alters diabetes management and identifi es affected and at-risk family members. Thus, identifying clinical diagnoses of MODY is important.
Here we describe initial results with an internet based monogenic diabetes registry to facilitate identifi cation, genetic diagnosis, clinical laboratory confi rmation and long-term follow-up of monogenic diabetes with onset after 12 months of age.
Prior to registry establishment, we identifi ed a monogenic etiology of diabetes in 11 of 69 probands. Since March 2010, we have enrolled 24 probands in our registry. With DNA sequencing ongoing in most subjects, mutations have been identifi ed in 3 probands,including a novel GCK mutation, Met57Ile, found in a proband and his two children who report mild diabetes with hemoglobin A1C of 6-6.4%, with or without therapy. In the remaining probands, 52% have a phenotype consistent with glucokinase gene mutations (MODY2). MODY1 or MODY3 is suspected in nearly all remaining subjects. Case examples illustrate the utility of our registry, including cessation of insulin in two siblings with GCK mutations, transition from insulin to sulfonylureas in a subject without family history of diabetes found to have HNF4A diabetes with improved glycemic control, and identifi cation of novel, apparently pathogenic mutations in known MODY diabetes genes.
This monogenic diabetes registry will clarify prevalence, disease course and complications and optimal treatment of the different single gene mutations leading to diabetes. This registry will also identify subjects for inclusion in clinical trials and translational research studies that will add to our knowledge of the pathophysiology and management of both monogenic and polygenic diabetes. ADA-Funded Research
2528-POLack of Association between Arg144Cys Variant of CYP2C9 Gene and Therapeutic Response to Oral Agents in Type 2 Diabetes PatientsJERZY HOHENDORFF, ANDRZEJ PLIS, NATALIA NOWAK, TOMASZ KLUPA, MACIEJ T. MALECKI, Krakow, Poland
Sulfonylureas (SU) are mainly metabolized by the cytochrome p450 2C9 (CYP2C9) enzyme. It has been shown that polymorphisms within the CYP2C9 gene infl uence enzymatic activity of the protein and its loss-of-function alleles are associated with a better response to SU and decreased rate of failure of SU treatment. The aim of the study was to verify whether the rs1799853 (Arg144Cys) polymorphism within the CYP2C9 gene may infl uence the length of insulin-free therapy in T2DM patients in the Polish population. For the purpose of the study we analyzed clinical data of 285 T2DM patients (155 women and 130 men), currently treated with insulin. Data concerning age of diagnosis, length of insulin-free therapy, HbA1c level, lipid profi les, BMI were obtained. The patients were genotyped for rs1799853 within the CYP2C9 gene using real-time PCR. The minor allele frequency was 10,70%. Age at diagnosis was not statistically different between minor allele non carriers vs. carriers (47,3 +/- 9,1 yrs, 45,0 +/- 9,5 yrs, for CC and CT/TT genotypes, respectively, p=0.0934). The patients were/had been switched to insulin after a median period of 7,0 yrs (range 1.0-29,0 yrs). We searched for the association between the CYP2C9 genotypes and therapeutic response to oral hypoglycemic agent therapy defi ned as length of time from T2DM onset to the insulin therapy initiation. The mean time to insulin introduction was 7.43 years vs. 8.13 years for CC and CT/TT genotypes respectively, p=0.39. The analysis did not show signifi cant association between CYP2C9 variant and glycemic control as measured by the HbA1c level (p=0,4661). No signifi cant association between rs1799853 and HbA1c, lipid profi le or BMI was observed. In conclusion, we did not fi nd association between the CYP2C9 gene Arg144Cys polymorphism and therapeutic response to oral agents in T2DM patients.
A667
For author disclosure information, see page 785.
CATEGORY
ADA-Funded Research
Epid
emio
logy
/G
enet
ics
PUB
LISH
ED O
NLY
GENETICS—TYPE 2 DIABETES
2529-POPharmacogenomics of ThiazolidinedionesNISA M. MARUTHUR, LISA M. WILSON, ANITA SAHU, SHARI BOLEN, WENDY BENNETT, ERIC BASS, W.H. LINDA KAO, JEANNE M. CLARK, Baltimore, MD, Cleveland, OH
Thiazolidinediones (TZDs) remain one of the most commonly prescribed medication classes for type 2 diabetes (DM) worldwide. Genetic variation may partially explain the heterogeneity of response to these drugs. Pharmacogenomic studies of TZDs report a range of gene-drug interactions. We conducted a systematic review to summarize and identify gaps in this evidence. We searched 3 electronic databases to identify original articles evaluating response to TZD therapy by genetic variation in adults. Of 2633 titles, 10 articles met our inclusion criteria. Using standardized forms, two reviewers abstracted data from the included articles consecutively and evaluated quality independently. The 10 articles (1463 adults with type 2 DM) included rosiglitazone (rosi) (n=8) and pioglitazone (pio) (n=2); 19 single nucleotide polymorphisms (SNPs); and 8 genes. All studies were conducted in Korea or China. Nine studies were non-randomized, experimental trials, and one study was observational. In 2 studies, among participants with the Pro12Pro genotype of PPARγ (ref: Pro12Ala), rosi decreased HbA1c by 0.8% (P=0.015) and fasting glucose (FG) by 26 mg/dl (P=0.026); pio decreased HbA1c by 0.25% and FG by 3 mg/dL. In 2 studies of T45G (ADIPOQ), rosi decreased HbA1c by 0.8% (TT + TG, P<0.03, ref: GG) and by 1.1% (TT, ref: TG+GG). Rosi also decreased FG by 25 mg/dl (P=0.082) and 28 mg/dL (P=0.07) for TT and TG, respectively (ref: GG). Rosi decreased HbA1c by 0.8% and FG by 39 mg/dl (ref: GG, P<0.05) in those with the TT genotype of G276T (ADIPOQ). For rs10192566 of LPIN1, rosi decreased HbA1c (-0.3%) and FG (-15 mg/dl) in the CG+GG group (ref: CC, P<0.05). Safety outcomes were not reported in any study. Most studies were susceptible to selection bias, selective reporting, and type I error. TZDs may be more effective in patients with the Pro12Pro genotype of PPARγ, and rosi may decrease HbA1c more in those with the T allele of T45G (ADIPOQ). These fi ndings warrant confi rmation and suggest the promise of pharmacogenomics in helping physicians tailor therapy for type 2 DM.
2530-POPleiotropic Effects of a Variant in the GIPR Gene on Islet Function and Risk of Type 2 DiabetesVALERIYA LYSSENKO, LENA ELIASSON, OLGA KOTOVA, KASPER PILGAARD, ALBERT SALEHI, ANNA JONSSON, BO ISOMAA, RICCARDO BONADONNA, STEFANO DELPRATO, ALLAN VAAG, MARKKU LAAKSO, MARIA F. GOMEZ, LEIF GROOP, Malmo, Sweden, Gentofte, Denmark, Helsinki, Finland, Verona, Italy, Pisa, Italy, Kuopio, Finland
The incretin hormone GIP (glucose-dependent insulinotropic polypeptide) promotes beta-cell function by potentiating proliferation and secretion. Recently, a combined analysis of several GWAS (MAGIC - Meta-Analysis of Glucose and Insulin-related traits Concortium) showed association to postprandial insulin at the GIP receptor (GIPR) locus (SNP rs10423928). Our aim was to explore the effects of this common variant. Associations of the GIPR rs10423928 with metabolic and anthropometric phenotypes in both non-diabetic (N=53,730) and type 2 diabetic individuals (N=2,731) were explored by combining data from 11 studies. Insulin secretion was measured both in vivo in non-diabetic subjects and in vitro in islets from cadaver donors. The in vitro measurements included protein and gene expression as well as measurements of beta-cell viability and proliferation. The A-allele of GIPR rs10423928 was associated with impaired glucose- and GIP-stimulated insulin secretion, and a decrease in BMI, lean body mass and waist circumference. The decrease in BMI almost completely neutralized the effect of impaired insulin secretion on risk of type 2 diabetes. Expression of GIPR mRNA was decreased in human islets from carriers of the A-allele or patients with type 2 diabetes. GIP stimulated osteopontin (OPN) mRNA and protein expression. Consistently, OPN expression was lower in carriers of the A-allele. GIP prevented cytokine-induced reduction in cell viability, and OPN stimulated proliferation in insulin-secreting cells. These fi ndings support beta-cell proliferative and anti-apoptotic roles for GIP, in addition to its action as an incretin hormone.
2531-POSingle Nucleotide Polymorphism (SNP) at -420 or -358 in the Human Resistin Gene Is Not Associated with Fasting Plasma Glucose or Insulin in the General Japanese PopulationHARUHIKO OSAWA, HIROSHI ONUMA, YASUHARU TABARA, RYOICHI KAWA-MURA, WATARU NISHIDA, YASUNORI TAKATA, RYUICHI KAWAMOTO, KATSU-HIKO KOHARA, HIDEICHI MAKINO, TETSURO MIKI, Toon, Japan, Imabari, Japan
Resistin is an adipokine that antagonizes insulin in mice. In humans, resistin is mainly expressed in monocytes/macrophages. We reported that the G/G genotype of single nucleotide polymorphism (SNP) at -420 (rs 1862513) in the human resistin gene was a primary variant determining type 2 diabetes (T2D) susceptibility. Circulating resistin was higher in subjects with T2D. In the Japanese general population, plasma resistin was positively correlated with homeostasis model assessment of insulin resistance (HOMA-IR) index. Plasma resistin was highest in subjects with G/G genotype of SNP-420C>G, followed by C/G and C/C. In Caucasians, this association was not observed. Most recently, we reported that A at SNP-358G>A (rs3219175) is required for G at SNP-420 to confer the highest plasma resistin in the general Japanese population. Based on HapMap data, this SNP-358 appears monophormic in Caucasians, which may explain this ethnic difference.
In this study, we examined the association between SNP-420 or SNP-358, and metabolic parameters including BMI, fasting plasma glucose (FPG), immunoreactive insulin (IRI), HOMA-IR, total cholesterol, triglycerides, HDL, systolic and diastolic blood pressure (SBP and DBP) in the general Japanese population (n=∼2000).
SNP-420 and SNP-358 explained 26% and 55%, respectively, of the variation of plasma resisitin as previously reported. Individually, either SNP-420 or SNP-358 was not correlated with each of the above metabolic parameters. Since we reported that the G-A haplotype of SNP-420 and SNP-358 increased plasma resistin by ∼8 ng/ml, we examined the relation between the haplotype of SNP-420 and SNP-358 and metabolic parameters. No association was found.
Therefore, SNP-420 or SNP-358 was not correlated with metabolic parameters such as FPG and IRI in the Japanese general population. The lack of the direct association between resistin SNP-420 or SNP-358 and these parameters could be explained by the possibility that these metabolic parameters are located at the downstream of plasma resistin, and are infl uenced by many other genetic and environmental factors.
2532-POThe Association of Several Type 2 Diabetes Susceptibility Genes and Pro-Insulin Conversion in a Chinese PopulationWEI REN, XIAOYA ZHENG, SUHUA ZHANG, JINGJING LIU, SUFANG LI, JINCHAO LI, PING YANG, Chongqing, China
Background: TCF7L2 and SLC30A8 have been found to be associated with type 2 diabetes mellitus (T2DM) as well as with impaired proinsulin processing recently, enzymes encoded by PCSK1 and PCSK2 are reported to play an important role in the process of proinsulin conversion.
Objective: To investigate whether the single nucleotide polymorphisms (SNPs) of TCF7L2, SLC30A8, PCSK1 and PCSK2 were associated with T2DM as well as with proinsulin conversion in a Han Chinese population from Chongqing.
Methods: A case-control study was performed in Han Chinese subjects with normal control (n=152) and T2DM (n=227), we genotyped rs7903146 and rs11196218 at TCF7L2, rs13266634 at SLC30A8, rs3811951 at PCSK1 and rs2021785 at PCSK2. Plasma levels of proinsulin were measured with an Enzyme Linked Immunosorbent Assay (ELISA). Genotype distribution and associations with T2DM and fasting levels of proinsulin and proinsulin/insulin ratios were analyzed.
Results: We confi rmed the association of risk allele of rs2021785 at PCSK2 with type 2 diabetes also existed in Han Chinese population (OR=1.4489 with 95%CI (1.0285, 2.0412), P=0.0335). Rs13266634 at SLC30A8 had a tendency to be associated with fasting plasma levels of proinsulin (P=0.0639 in additive model). We did not fi nd the signifi cant association between other SNPs and T2DM or fasting levels of proinsulin or proinsulin/insulin ratios.
A668
For author disclosure information, see page 785.
CATEGORY
ADA-Funded Research
Imm
unol
ogy/
Tran
spla
ntat
ion
PUB
LISH
ED O
NLY
IMMUNOLOGY
Table 1. Minor allele distribution and association with T2DM
Gene/SNPs
AllelesM/m
M/M M/m m/m *P value **P value
TCF7L2rs11196218
G/A 11.03±2.30 11.53±2.72 11.13±2.42 0.1762 0.0913
TCF7L2rs7903146
C/T 11.19±2.44 11.46±2.90 12.02±0.00 0.7859 0.5107
SLC30A8rs13266634
C/T 10.90±2.56 11.05±2.25 12.13±2.73 0.0639 0.0937
PCSK1rs3811951
A/G 11.25±2.45 11.12±2.55 11.46±2.45 0.7425 0.8094
PCSK2rs2021785
G/A 11.22±2.44 11.27±2.54 11.11±2.64 0.9479 0.9522
Conclusion: Our results provide evidence that the association of PCSK2 and T2DM was also existed in Han Chinese population in Chongqing. We were underpowered to detect the association between other SNPs and T2DM or proinsulin conversion.
Supported by: Medical Science Research Fund of Chongqing Health Bureau (Number: 2008-2-96)
IMMUNOLOGY
2533-POA Mathematical Model To Study the Autoimmune Progression towards Type 1 DiabetesROSALBA PORTUESI, CHRISTIAN CHERUBINI, ALESSIO GIZZI, GIUDITTA VALOR-ANI, RAFFAELLA BUZZETTI, SIMONETTA FILIPPI, PAOLO POZZILLI, Rome, Italy, London, United Kingdom
Islets of Langerhans are small endocrine organs characterized by an complex anatomy including a core of insulin producing beta-cells, tightly interconnected by gap junctions and a mantle of other endocrine cells. The integrity of the interactions and the 3D architecture among beta-cells is critical for proper biosynthesis, storage and the release of insulin. The aim of this study was to evaluate the effect on beta-cells signalling of progressive lymphocytic islet cell infi ltration (insulitis), by modelling the disruption of pancreatic islet anatomy as a consequence of insulitis in terms of apoptotic events of beta-cells and altered glucose concentration. We numerically simulated a 3D small cluster of mouse beta-cells via an extended stochastic Sherman-Rinzel-Keizer electrophysiological model. Progressive damage was modelled (0%, 31%, 69%, 84%, 94% and 98% of dead beta-cells) at different glucose concentrations, representing the different glycaemic states in the autoimmune progression towards type 1 diabetes (T1D). At 31% (normoglycaemia) and 69% (hyperglycaemia) of dead beta-cells, the system appeared to be biologically robust to maintain regular [Ca ++] oscillations guaranteeing an effective insulin release. Simulations at 84%, 94% and 98% of death beta-cells (severe hyperglycemia) showed that the complex periodic bursting pattern disappeared and [Ca ++] oscillations were absent. In such conditions insulin pulsatility is not expected to occur. Our results suggest that the islet tissue of beta-cells is biophysically robust enough to compensate high rates of cellular loss, a fact which is in agreement with in vitro animal experiments. The model indicates the necessity of maintaining glycaemia within physiological levels as soon as possible after diabetes onset in order to avoid a dramatic drop of [Ca ++] pulsatility and consequent insulin release. In the absence of glucotoxicity, any adjuvant therapy to cure this disease including immunomodulation or the regeneration of beta-cells can be more benefi cial and hopefully contribute to impeding the destruction of any residual beta-cell still functioning.
Supported by: University Campus Bio-Medico, ICRANet & Centro Internazionale Studi Diabete
2534-POAn Anti-Idiotypic Vaccine Prepared from Pancreatic Lymph Nodes Prevents T1DM in NOD MiceWERNER GURR, YANXIA LI, ROBERT SHERWIN, New Haven, CT
To develop an immune intervention that targets T-cell specifi c for a particular autoantigen we have evaluated anti-idiotypic vaccination in T1DM. The vaccine consists of antigen receptors specifi c for complexes of MHC with peptides derived from islet autoantigens. To obtain these receptors we used phage-display to enrich libraries for clones recognizing the desired MHC peptide complex. A critical point is the isolation of positive clones. Receptor libraries generated from mice immunized with the appropriate antigen can be successfully selected, whereas those generated from non-
immunized mice may not yield positive clones. Translation of this approach is therefore limited since immunization for this purpose is not possible in humans. Alternatively, autoreactive T-cells in NOD mice and humans with T1DM are concentrated in pancreatic lymph nodes (pln), making pln (currently available from nPOD) suitable for construction of selectable libraries.
To test the feasibility of this approach we generated from pln of non-immunized NOD mice an antigen receptor library in the form Vα-linker-Vβ (TscFv for single chain fragment variable from T-cells). Since RegII and specifi cally its N-terminal fragment (NtfrII) acts as potential autoantigen in T1DM the library was enriched for clones recognizing complexes of I-Ag7 with NtfrII-derived peptides.
The enriched but not the non-enriched library distinguished NtfrII-pulsed from unpulsed NOD antigen presenting cells (APCs). Further characterization led to the isolation of S9/P2, a TscFv clone that recognized I-Ag7 bound to an NtfrII T-cell epitope capable of activating autoaggressive T-cells.
Vaccination of NOD mice with the selected TscFv library signifi cantly delayed T1DM and B- but not T-cells from S9/P2-vaccinated mice were able to prevent disease in NOD-SCID mice when induced with diabetogenic CD4+ NtfrII-specifi c T-cells but not when induced with T-cells of another specifi city (BDC2.5). We conclude that selection of TscFv binding to HLA complexed with autoantigen-derived peptides from human pln libraries could yield antigens for effective anti-idiotypic vaccinations in humans at risk of T1DM.
Supported by: Juvenile Diabetes Research Foundation ADA-Funded Research
2535-POAnti-Autonomic Receptor Antibodies in Diabetic Orthostatic Hypo-tensionXICHUN YU, STAVROS STAVRAKIS, SEAN REIM, MUNEER KHAN, MICHAEL HILL, MADELEINE CUNNINGHAM, DAVID KEM, Oklahoma City, OK, Columbia, MO
Orthostatic hypotension (OH) is often associated with diabetes and has many causes. Very little new data exists relating to the pathophysiology of OH. We have recently identifi ed the presence of agonist-like autoantibodies to beta-adrenergic and muscarinic receptors in a subgroup of patients with OH. These autoantibodies are frequently observed in patients with diabetes and concurrent cardiac diseases which often have associated OH. There is precedence for the pathological signifi cance of such antibodies in cardiomyopathies. Using ELISA and bioassays, IgG from antibody-positive OH patients demonstrated signifi cant capacity to activate their respective receptors. Patients with resting tachycardia had IgG with predominantly beta-adrenergic activity, while patients with a relative resting bradycardia and impaired pulse rate response in the face of OH had IgG with predominantly muscarinic activity. IgG from patients with antibodies to beta2-adrenergic and/or M3 muscarinic receptors produced an expected potent vasodilatation (5-20%) in the rat cremaster skeletal muscle arterioles which return to control after the infusion is fi nished, suggesting these antibodies may contribute to systemic vasodilatation. Three patients treated with combined M2/3 blockade (oxybutynin LR) showed decreased orthostatic symptoms and signs. These data support the hypothesis that these circulating agonistic autoantibodies cause or exacerbate OH by altering the postural cardiovascular response in these patients. These data will also be useful in identifying therapeutic strategies that target these autoantibodies.
Supported by: Diabetes CoBRE
2536-PO
WITHDRAWN
2537-PODevelopment of a Tolerogenic Matrix Containing Autoantigens for the Prevention of Type 1 DiabetesYOUNG MEE YOON, CLIVE WASSERFALL, JAMAL LEWIS, MARK ATKINSON, BENJAMIN KESELOWSKY, Gainesville, FL
Antigen specifi c immunomodulation remains an important goal in the treatment of type 1 diabetes (T1D). We hypothesized that T1D can be prevented through the use of an adjuvant modifi ed matrix containing β cell autoantigens and a chemoattractant. In order to test this hypothesis, D, L-lactic acid-co-glycolic acid phagocytosable microparticles (MP) were used as a vehicle for delivery of insulin B chain: 9-23 (B9-23) and the adjuvants CpG or hemoglobin:haptoglobin (Hb:Hp). The MPs were then placed into a hydrogel containing GM-CSF as the chemoattractant. These formulations were injected subcutaneously into 12 week old female NOD mice (n=10/treatment group). Groups consisted of untreated mice, GM-CSF with empty MP, GM-CSF with