2zpdzone6.res.in/apr 2011-12.doc · web viewrajasthan, gujarat, dadra and nagar haveli, daman and...
TRANSCRIPT

ANNUAL REPORT 2011-12
Guidance :Dr. Kiran D. KokateDeputy Director General (Agril. Extension)Indian Council of Agricultural Research, New Delhi
Compiled and Edited by :
Dr. Y. V. Singh, Zonal Project Director, Zone-VIDr. R. S. Dohare, Sr. Scientist (Agril. Extension), ZPD, Zone-VIDr. P. P. Rohilla, Sr. Scientist (L.P.M.), ZPD, Zone-VIDr. R. N. Kumawat, Sr. Scientist (Agro.), ZPD, Zone-VISh. Kale Rajiv Baliram, Scientist (Agril. Extension), ZPD, Zone-VI
Technical Assistant/Secretarial Assistance :
Mr. P. K. Satapathy, T-6 (Senior Computer Assistant)Mr. Shyam Das, Research Associate
Citation :
Annual Report 2011-12Zonal Project Directorate, Zone-VI(ICAR), CAZRI Campus, Jodhpur – 342005 (Rajasthan)
Published by :
Dr. Y. V. SinghZonal Project DirctorZonal Project Directorate, Zone-VI (ICAR)CAZRI Cmapus, Jodhpur – 342005 (Rajasthan)
Zonal Project Directorate, Zone-VI
ANNUAL REPORT 2011-12
PREFACE
Zone-VI comprising rajasthan, Gujarat and Union Territories namely Daman & Diu and Dadra & Nagar Havelli experienced good rain fall during 2010-11 and 2011-12. Rajasthan achieved record production in pulses and oilseed crops during 2010-11. On the otherhand the agricultural income of Gujarat rose from Rs.8000 crore in 2000 to 80,000 crore in 2010-11. KVKs of rajasthan and Gujarat played crucial and leading role in enhancing the production and productivity of agriculture allied fields by technological backstopping through training of farmers, rural youth and extension functionaries, conducting demonstration and simultaneously disseminating technologing adopting various extension methodologies including ICT.
Zonal Project Directorate, Zone-VI have 59 KVKs in two states namely Rajasthan and Gujarat functioning under SAUs, ICAR Institutes and well reputed NGOs. Now with establishment of 13 more KVKs in big (11) and new(2) districts, Zone-VI has now 70 KVKs by the end of eleventh plan (31st March, 2012). Now KVKs have to focus intensively on Farmers FIRST, secondary agriculture during XIIth five year plan to make India self dependent by achieving food, nutritional and socio-economic securities.
It gives us immense pleasure to bring out Annual Proress Report for the year 2011-12. The efforts put up by KVK scientists under the guidance of Vice Chancellors of SAUs, Directors of ICAR Institutes and Presidents of Non-Government Organisations are highly appreciable. The services rendered by DEEs, district administrators and others in the support of KVK deserve praise. Our team expresses profound gratitude to Dr. S. Ayyappan, Secretary DARE and DG(ICAR) for organizing new thrust to the KVKs in ICAR programmes with all support. His valuable suggestionsand guidance works as constant source fo motivation for the professional involved in the technological dissemination for farming community. We are highly thankful to Dr. Kiran D. Kokate, Deputy Director General (Agric. Extn.), ICAR for his regular dynamic leadership, guidance and support in better implementation of these programmes in KVKs through ZPD, Zone-VI. Our thanks are due to Assistant Director Generals (AE) and other officers of ICAR for endless cooperation. We also thank to Zonal Project Directors of other Zones and others who helped us to make better the best.
At last but not least it is my pleasure to thank the staff of ZPD and KVKs of Zone-VI for kind cooperation and moral support to achieve the mandate and targets of KVKs.
Place : Jodhpur (Y. V. Singh)Date : 19th June, 2012 Zonal Project Director, Zone-VI
Zonal Project Directorate, Zone-VI

ANNUAL REPORT 2011-12
Lkkjak’k{ks«kh; Ifj;kstuk funs’kky; ¼ rduhdh vakdyu lq/kkjhdj.k ,oe
izn’kZu ½ {ks«k 6 tks/kiqj us jktLFkku ,oe~ xqtjkr jkT; esa LFkkfir 6 —f”k fo’o fo/kky;] 3 Hkkjrh; Ñf”k vuqla/kku laLFkku o 14 xSj ljdkjh laLFkkvksa }kjk lapkfyr Ñf”k foKku dsUnzksa dk HkkSfrd ,oa vkfFkZd eqY;kadu o ekxZ n’kZu fd;k A
Ñf”k foKku dsUnzzksa us 15 fo”k;ksa ij vk/kkfjr dqy 2360 iz{ks«k ijh{k.k vk;ksftr dj 193 rduhfd;ksa dk eqY;kadu fd;kA Ñf”k foKku dsUnzksa }kjk frygu] nygu] lfCt;ks vukt uxnh Qly o Ñf”k okfudh bR;kfn ds vUrZxr 3790‐2 gSDVj {sk«k ij 10177 iafDr izn’kZu vk;ksftr fd;s x;sA i’kq ikyu eNyh mRiknu ,oe~ Ñf”k vk;kstu ds {ks«k esa 461 izn’kZu vk;ksftr dj Ñ”kdksa dh u dsoy vk; c<kbZ cfYd Je ykxr] Jfed O;; o Jfed le; esa lq/kkj fd;kA
Áf’k{k.k ds {ks«k esa 5714 dk;Zdze vk;ksftr dj 170869 Ñ”kdksa] Ñ”kd efgykvksa xzkeh.k ;qodksa ,oe~ izlkj dk;ZdrkZvksa dks ykHkkfUor fd;k A yxHkx 147234 Ñ”kd o efgyk Ñ”kdksa dks 4905 çf’k{k.kksa }kjk ykHk feyk A ftlesa lwfpr o vuqlwfpr oxZ o efgyk Ñ”kdksa dh Hkkxhnkjh Øe’k 35‐4 o 23‐6 çfr’kr jgh A xzkeh.k ;qodksa o Ñf”k çlkj dk;ZdrkZvksa ds fy, 422 vkSj 387 dk;ZØeksa ds vUrZxr 11480 xzkeh.k ;qod vkSj 12155 Ñf”k Álkj drkZvksa us Hkkx ysdj vius rduhdh Kku esa o`f} dh blds vfrfjDr Ñf”k Álkj f’k{kk funs’kky; ,oa {ks«kh; ifj;kstuk funs’kky; }kjk Ñf”k foKku dsUnzksa ds 507 fo”k; fo’ks”kKksa dks fofHkUu fo”;ksa ij çf’k{k.k nsdj muds Kku esa o`f} dh A
Ñf”k foKku dsUæksa }kjk fdlkuksa dh O;kid —f”k tkudkjh gsrq 112 fdlku esys] 445 Ñf”k fnol] 760 fdlku xks”Vh;k] 195 çn’kZu] 309 dk;Z’kkyk,a] 548 fof/k çn’kZu vkSj 630 fo’ks”k ehfVax vk;ksftr dha ftlls 980996 Ñ”kdksa ds rduhdh Kku esa o`f} gqbZ A xqtjkr esa Ñf”k fo|ky; o Ñf”k foKku dsUnz ds oSKkfudksa us Ñf”k egksRlo esa ,d eghus rd Hkkx ysdj yk[kksa fdlkuksa dks ubZ tkudkfj;ka miyC/k djokbZ vkSj i’kq LokLF; dk Áca/ku fd;k A jktLFkku ,oe xqtjkr ds 1706 xakoksa ds 41536 fdlkuksa ds 34600 e`nk] 143 ikS/ks] 11034 ikuh vkSj 2792 [kkn ds uewuksa dh takp dh A Ñf”k foKku dsUnzksa us vkRek] jk”Vªh; Ñf”k fodkl ;kstukvksa dk u dsoy lg;ksx fd;k cfYd fofHkUu oxksZ ds lekt dks rdfudh Kku fn;k AZonal Project Directorate, Zone-VI
ANNUAL REPORT 2011-12
Ñf”k foKku dsUnzksa }kjk 6715‐29 dq0 cht vkSj 33554437 ikS/ks 32661 fdlkuksa dks miyC/k djok,A blds vfrfjDr 380 mUur i’kq larfr;k ,oa 121232‐2 fd0 xzke ok;ks mRikn fdlkuksa dks miyC/k djokbZ A
lkr Ñf”k rduhdh lwpuk dsUnzksa }kjk ,dy f[kMdh ds vUrxZr fdlkuksa dks u dsoy mUur fdLeksa ds cht] lkfgR; miyC/k djok, cfYd rduhdh Kku Hkh fn;k A Ñf”k foKku dsUnzksa }kjk 54 oSKkfud lykgdkj lfefr;ak vk;ksftr dh xbZ A Ñf”k foKku dsUnzksa us 279 lwpuk;sa 16631 fdlkuksa dks laf{kIr lans’k muds eksckbZy Qksu ij miyC/k djokbZa A
oSKkfud lykgdkj lfefr ,oa Ñf”k foKku dsUnzksa dh okf”kZd dk;Z’kkyk ds vUrxZr okf”kZd miyfC/;ksa dk eqY;kadu o vxys o”kZ dh ;kstukvksa esa fofHkUu oxZ leqgksa us viuk ;ksxnku nsdj bl dk;ZØe dks c<kus esa vfo”ej.kh; lg;ksx fd;k A xr o”kZ Ñf”k foKku dsUnzksa us 219 ‘kks/k i«k] 53 cqysfVu] 417 rduhdh fjiksZV 362 y?kq ys[k ,oa 378 çlkj lkfgR; fy[kdj fofHkUu oxZ leqgksa dks ubZ rduhdh tkudkjh miyC/k djokbZ A bl o”kZ 6497‐36 yk[k :i;s vkoafVr /kujk’kh dk 6495 yk[k aa:i;s dk mi;ksx djds Ñf”k foKku dsUnzksa ds dk;ZØeksa dk lQy vk;kstu fd;k A
blds vfrfjDr iapo"khZ; eqY;kadu lferh dh fjiksVZ fu/kkZfjr le; ij Ñf"k vuqla/kku ifj"kn esa çLrqr dh A QkjelZ QLZV o Ñf"k foKku dsUnzksa ds fy;s ekxZ nf’kZdk lfefr;ak vk;ksftr dj ds vxyh iapo"khZ; ;kstukvksa ds dk;ZØeksa dh :i js[kk rS;kj djus esa Hkh ;ksxnku fn;k A
Zonal Project Directorate, Zone-VI

ANNUAL REPORT 2011-12
EXECUTIVE SUMMARY
Zonal Project Directorate (Technology Assessment, Refinement and Demonstration), Zone-VI, Jodhpur monitors activities of 59 Krishi Vigyan Kendras functioning under administrative control of six SAUs, 2 ICAR Institutes and 14 Non Government Organisations (NGOs) in Rajasthan and Gujarat. The Krishi Vigyan Kendras (KVKs) are innovative institutions of Indian Council of Agricultural Research (ICAR) entrusted agricultural technology application and dissemination in rural areas. Out of 912 sanctioned posts 707 (77.7%) are in position as on 31st March, 2012.
In on farm testing, 193 technologies through 2360 trials on thirteen thematic areas were conducted by KVKs of Zone-VI. To demonstrate proven production potentials of latest location specific technologies in agriculture and allied areas for generating production data and obtaining feed back, 10177 front line demonstrations covering 3710.20 ha area on major crops of oilseeds, pulses, cereals, vegetables, cash crops and millet were carried out. The increase in yield was to the tune of 12.50 per cent in fruit crops to 98.46 per cent in oilseed crops. In addition, 461 demonstrations on other income generating enterprises like livestock, fisheries, women empowerment, farm machinery, etc. were successfully conducted. The relative advantage was noted in dairy, animal and fisheries, etc. The farm implements were also found to be effective in drudgery reduction, and saving in cost, time and labour. In addition to above 89 demonstrations on hybrids covered 20.60 ha.
In trainings, 5714 number of training courses benefiting 170869 farmers, rural youths and extension functionaries were conducted out of which 4905 courses benefited 147234 practising farmers/farm women. The participation of scheduled castes/tribes and farm women was noted as 36 per cent and 24 per cent, respectively. The training courses conducted for the rural youths and extension functionaries were 422 and 387 through which 11480 rural youths 12155 extension functionaries, respectively, got benefited. Zonal Project Directorate, Zone-VI and Directorates of Extension Education (SAUs) had conducted twelve human resource development activities for 507 subject matter specialists from different KVKs to enrich their knowledge and skills on agricultural knowledge management, watershed management, organic farming and mobile advisory services, etc.
The major extension activities namely, kisan mela (112), field days (445), kisan gosthies (760), exhibitions (195), farmers workshop (309), method demonstration (548), group meetings (630), ex-trainee samellan (37), exposure visits (381), advisory services, animal camps, diagnostic visits, interactions, extension literature, print media coverage, broadcasting in electronic media were conducted. A total of 961931farmers and 19065 extension personnel were benefited. Twenty-five KVKs have provided agroadvisory through 279 SMS to 16631 farmers.
A total of 48569 samples comprising 34600 soils, 11034 water, 143 plant and 2792 manures of 41536 farmers inhabiting 1706 villages were tested by KVKs of Rajasthan and Gujarat. A total of 6715.29 q seeds of different crops and 3554437 plants were sold to 32661 farmers. In addition to that 121232.2 kg bio products and 380 progeny animals were also produced and sold to the farmers.
The KVKs have established the linkages with ATMA, NHM, RMoL, NABARD, RKVY and Ministry of Water Resources (MoWR), etc. in conducting training, extension, demonstration. Besides, KVKs had also made liasion with line departments, MNREGA, AIR, Doordarshan and print media for implementation of transfer of technologies through different activities.
Seven Agricultural Technology Information Centres (ATICs) functioning at CAZRI, Jodhpur, and six SAUs have provided single window delivery on technologies, informations, seeds, planting material and value added products to visiting farmers and other stakeholders.
In fifty-four scientific advisory committee meetings comprising representatives from the host institutes, ICAR Institutes, district line departments, progressive farmers and farm women had provided advisory for proper functioning of the KVKs in Zone-VI. Annual Zonal Workshop for KVKs of Zone-VI was organized at
Zonal Project Directorate, Zone-VI

ANNUAL REPORT 2011-12
JAU, Junagadh during 9-11 June, 2011 to finalize the programme for the year 2011-12 and discuss the achievements of 2010-11. KVKs have published research paper (219), technical bulletin (53), technical report (417), popular article (362) and extension literature (378) during the period under report. A total of Rs. 6497.36 lakhs fund was sanctioned in recurring and n on-recurring heads for the Zone out of which Rs. 6495.06lakhs was utilized.
Besides, two travel workshop of QRT including visits of KVKs were organized during May to July 2011 and recommendations were submitted to the ICAR on October 14, 2011. Farmer FIRST meeting was organized at SDAU, Dantiwada to chalk out the programme for the betterment of farming communities. The meeting of High Power Committee on preparing guidelines for KVKs under the Chairmanship of Dr. R. S. Paroda/Sh. Rajiv Mehrishi was organized in January 2012 at Jodhpur and Jaisalmer.
Zonal Project Directorate, Zone-VI

ANNUAL REPORT 2011-12
C O N T E N T S
Sl. No. Topic Page No.1. Introduction 1-12. Particulars of KVKs 1-23. Staff position 3-34. Infrastructure facilities 3-35. Budget and expenditure 3-36. Revolving fund 3-37. Agro-climatic zone & thrust areas 4-48. Annual action plan 5-59. Technology assessment and refinement through on farm
testing5-10
10. Front line demonstrations 11-4911. Training achievements 50-7112. Extension activities 72-7313. Details of technology week celebrations 73-7314. Seed and seedling production of different crops 74-8215. Details of soil, water and plant analysis 83-8316. Scientific advisory committee meeting 83-8417. Publication (KVKs) 84-8418. Additional activities done by KVKs on Zone-VI 85-8519. Details on HRD activites 86-8720. Workshops/Regional meeting of Zone-VI/National
Conference87-87
21. Publications (ZPD) 87-9022. Case studies 91-9623. Agricultural technology information centre 97-9824. Technological backstopping by directorates of extension 99-10125. ZPD staff position 102-10226. Annexure-I 103-109
Zonal Project Directorate, Zone-VI
ANNUAL REPORT 2011-12
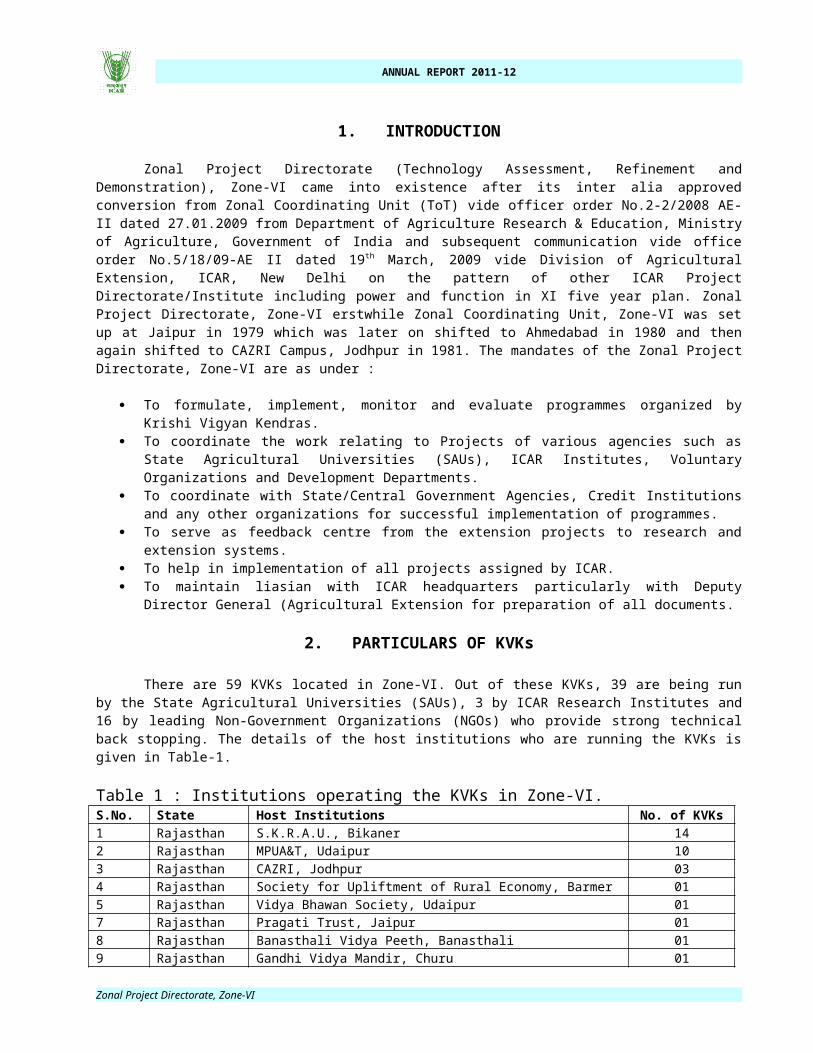
1. INTRODUCTION
Zonal Project Directorate (Technology Assessment, Refinement and Demonstration), Zone-VI came into existence after its inter alia approved conversion from Zonal Coordinating Unit (ToT) vide officer order No.2-2/2008 AE-II dated 27.01.2009 from Department of Agriculture Research & Education, Ministry of Agriculture, Government of India and subsequent communication vide office order No.5/18/09-AE II dated 19 th
March, 2009 vide Division of Agricultural Extension, ICAR, New Delhi on the pattern of other ICAR Project Directorate/Institute including power and function in XI five year plan. Zonal Project Directorate, Zone-VI erstwhile Zonal Coordinating Unit, Zone-VI was set up at Jaipur in 1979 which was later on shifted to Ahmedabad in 1980 and then again shifted to CAZRI Campus, Jodhpur in 1981. The mandates of the Zonal Project Directorate, Zone-VI are as under :
To formulate, implement, monitor and evaluate programmes organized by Krishi Vigyan Kendras. To coordinate the work relating to Projects of various agencies such as State Agricultural Universities
(SAUs), ICAR Institutes, Voluntary Organizations and Development Departments. To coordinate with State/Central Government Agencies, Credit Institutions and any other
organizations for successful implementation of programmes. To serve as feedback centre from the extension projects to research and extension systems. To help in implementation of all projects assigned by ICAR. To maintain liasian with ICAR headquarters particularly with Deputy Director General (Agricultural
Extension for preparation of all documents.
2. PARTICULARS OF KVKs
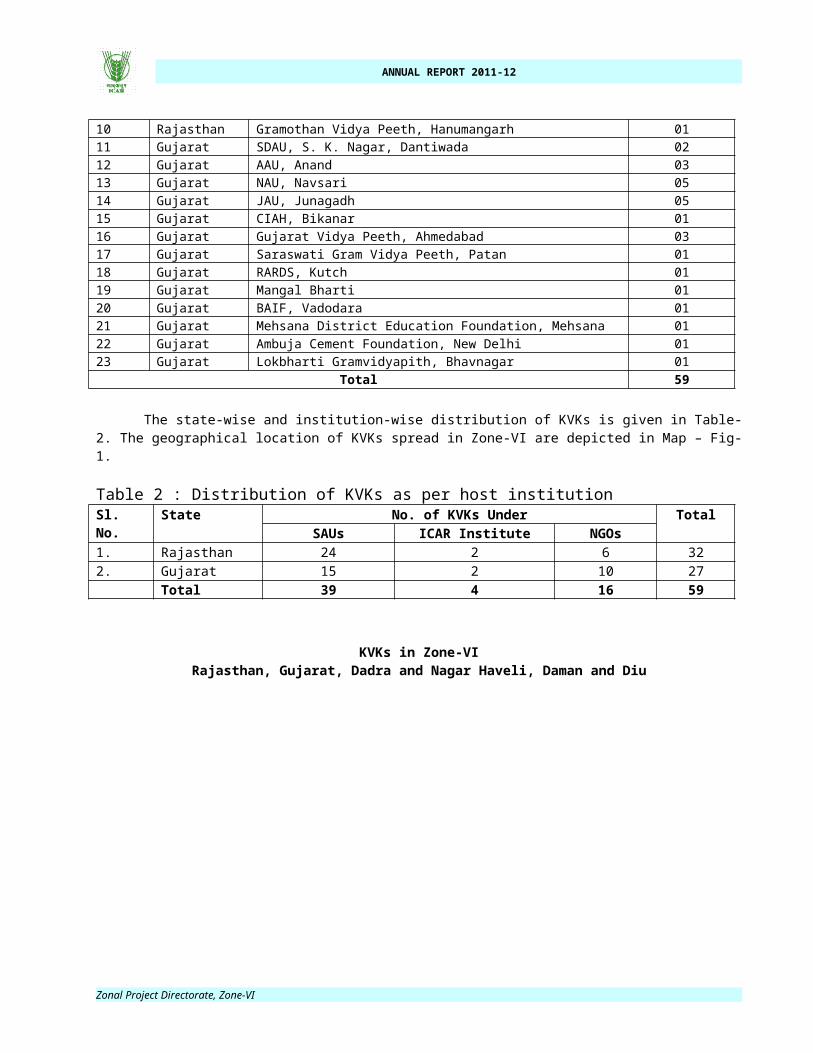
There are 59 KVKs located in Zone-VI. Out of these KVKs, 39 are being run by the State Agricultural Universities (SAUs), 3 by ICAR Research Institutes and 16 by leading Non-Government Organizations (NGOs) who provide strong technical back stopping. The details of the host institutions who are running the KVKs is given in Table-1.
Table 1 : Institutions operating the KVKs in Zone-VI.S.No. State Host Institutions No. of KVKs1 Rajasthan S.K.R.A.U., Bikaner 142 Rajasthan MPUA&T, Udaipur 103 Rajasthan CAZRI, Jodhpur 034 Rajasthan Society for Upliftment of Rural Economy, Barmer 015 Rajasthan Vidya Bhawan Society, Udaipur 017 Rajasthan Pragati Trust, Jaipur 018 Rajasthan Banasthali Vidya Peeth, Banasthali 019 Rajasthan Gandhi Vidya Mandir, Churu 0110 Rajasthan Gramothan Vidya Peeth, Hanumangarh 0111 Gujarat SDAU, S. K. Nagar, Dantiwada 0212 Gujarat AAU, Anand 0313 Gujarat NAU, Navsari 0514 Gujarat JAU, Junagadh 0515 Gujarat CIAH, Bikanar 0116 Gujarat Gujarat Vidya Peeth, Ahmedabad 0317 Gujarat Saraswati Gram Vidya Peeth, Patan 0118 Gujarat RARDS, Kutch 0119 Gujarat Mangal Bharti 0120 Gujarat BAIF, Vadodara 0121 Gujarat Mehsana District Education Foundation, Mehsana 0122 Gujarat Ambuja Cement Foundation, New Delhi 0123 Gujarat Lokbharti Gramvidyapith, Bhavnagar 01
Total 59
Zonal Project Directorate, Zone-VI

ANNUAL REPORT 2011-12
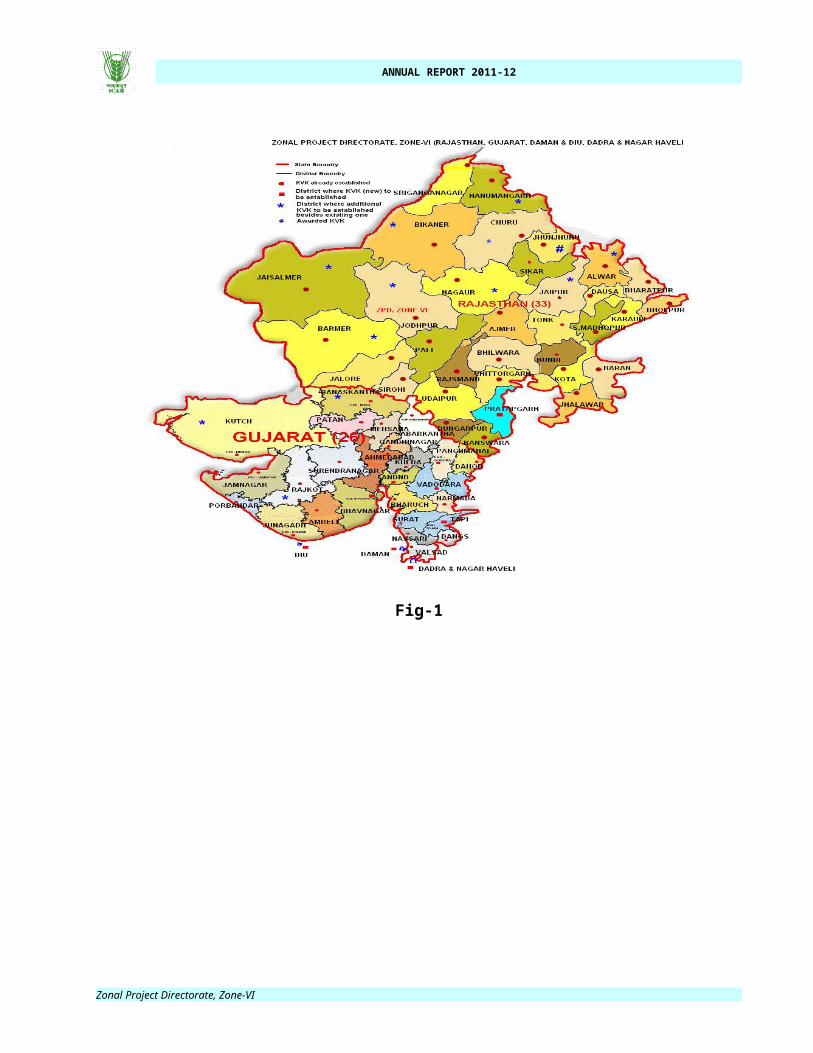
The state-wise and institution-wise distribution of KVKs is given in Table-2. The geographical location of KVKs spread in Zone-VI are depicted in Map – Fig-1.
Table 2 : Distribution of KVKs as per host institutionSl. No. State No. of KVKs Under Total
SAUs ICAR Institute NGOs1. Rajasthan 24 2 6 322. Gujarat 15 2 10 27
Total 39 4 16 59
KVKs in Zone-VIRajasthan, Gujarat, Dadra and Nagar Haveli, Daman and Diu
Fig-1
Zonal Project Directorate, Zone-VI

ANNUAL REPORT 2011-12
3. STAFF POSITION
The KVKs have staff strength of 16 positions uniformly. The current staff position in KVKs is given in Table-3. An analysis of the staff position shows that around 77.52 % staff positions are filled.
Table 3 : Details of Staff position as on 31.03.2012 (57 KVKs)*
Category Rajasthan Gujarat TOTALS F V S F V S F V
Programme Coordinator 32 21 11 25 22 3 57 43 14Subject Matter Specialist 192 139 53 150 116 34 342 255 87Programme Assistant 96 81 15 75 57 18 171 138 33Administrative 64 42 22 50 38 12 114 80 34Auxiliary 64 43 21 50 37 13 114 80 34Supporting 64 66 -2 50 45 5 114 111 3Total 512 392 120 400 315 85 912 707 205
* Two KVKs in Kutch (additional KVK in larger district) and Surat have been opened recently.
4. INFRASTRUCTURE FACILITIES
The details of infrastructural facilities in Zone-VI is given in Table-4.
Table 4 : Status of Infrastructural facilities in KVKs under Zone-VI.State No. of
KVKsAdm. building Training hostel Staff quarter
Completed In progress
NA Completed In progress
NA Completed In progress
NA
Rajasthan 32 31 - 1 31 - 1 31 - 1Gujarat 27 27 - - 27 - 0 26 - 1
5. BUDGET AND EXPENDITURE
The details of budgetary information of KVKs in Zonal Project Directorate, Zone-VI is given Table-5.
Table 5 : Budget and expenditure during 2011-12 (Rs. in lakhs)
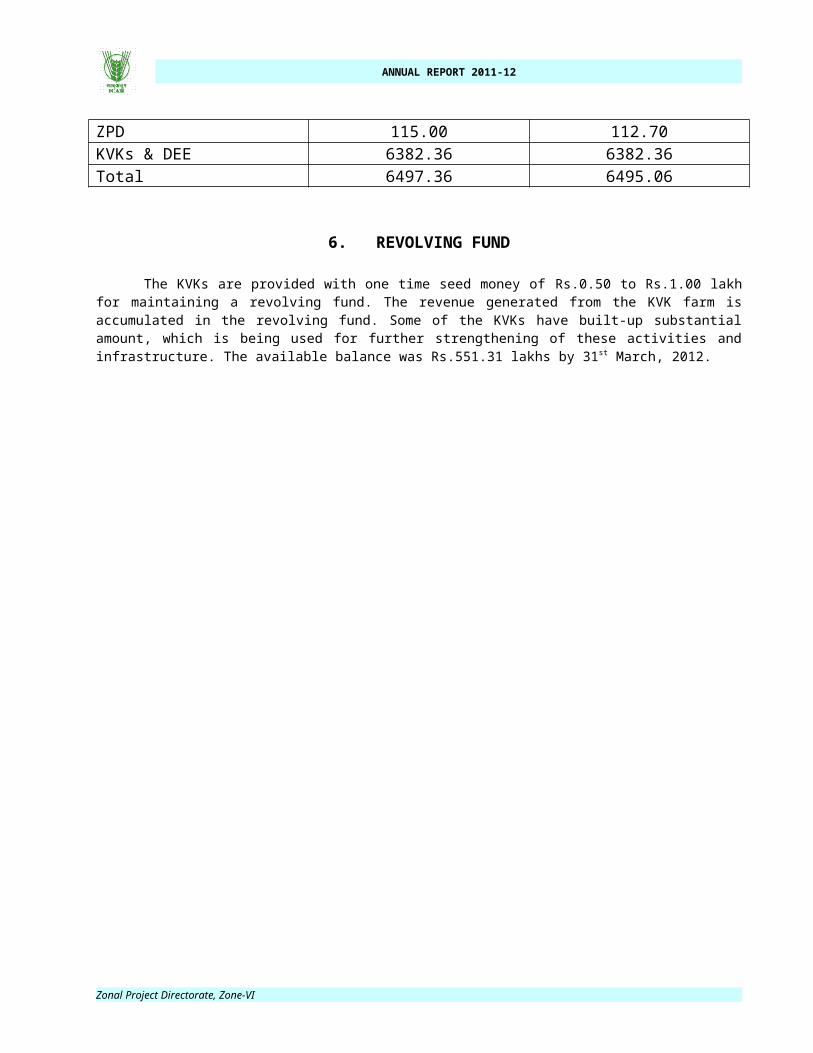
Institution Sanction Actual ExpenditureZPD 115.00 112.70KVKs & DEE 6382.36 6382.36Total 6497.36 6495.06
6. REVOLVING FUND
The KVKs are provided with one time seed money of Rs.0.50 to Rs.1.00 lakh for maintaining a revolving fund. The revenue generated from the KVK farm is accumulated in the revolving fund. Some of the KVKs have built-up substantial amount, which is being used for further strengthening of these activities and infrastructure. The available balance was Rs.551.31 lakhs by 31st March, 2012.
Zonal Project Directorate, Zone-VI

ANNUAL REPORT 2011-12
7. AGRO-CLIMATIC ZONES AND THRUST AREAS OF ZONE-VI
The 32 KVKs of rajsthan and 27 KVKs of Gujarat are covered under 10 and 9 agro-climatic zones respectively are given in Table-6.
Table 6 : Agro-climatic zones of Zone-VIAgro-climatic zone Annual rainfall
(mm)Name of KVK
Rajasthan1a Arid western Plains 150-350 Jodhpur & Barmer1b Irrigated North western Plain 300-350 Hanumangarh & Sriganganagar1c Hyper Arid and partially irrigated Western Plain
100-300 Bikaner, Jaisalmer & Churu
IIa Transitional Plain of Inland drainage 300-450 Sikar, Nagaur & JhunjhnuIIb Transitional Plain of Luni Basin 300-500 Jalore, Sirohi and PaliIIIa Semi Arid Eastern Plain 450-650 Jaipur, Ajmer, Tonk & DausaIIIb Flood Prone Eastern Plain 500-700 Alwar, Bharatpur and DholpurIVa Sub-Humid Southern Plain and Aravali Hills 500-900 Bhilwara, Chittoregarh, Rajsamand &
UdaipurIVb Humid Southern Plain 525-1000 Banswara & DungerpurV Humid South Eastern Plain 650-1150 Kota, Bundi, Jhalawar, Baran & Swai
MadhopurGujaratSouth Gujarat Heavy Rainfall 1500-2100 Dangs & ValsadSouth Gujarat Medium Rainfall 1000-1500 Surat & BharuchMiddle Gujarat 800-1100 Anand, Panchmahal, Dahod & BarodaNorth Gujarat 500-1000 Banaskantha, Gandhinagar,
Ahmedabad, Sabarkantha, Mehsana, Patan
North-West Arid 250-400 KutchNorth Saurastra 400-700 Amreli, Jamnagar, Rajkot &
SurenderanagarSouth Saurastra 750-1000 Junagadh & PorbandarBhal & Coastal 650-750 Bhavnagar & Kheda
Thrust Area for the KVKs in Zone-VI
The thrust areas mentioned below are identified for the KVKs in XIth Plan.
1. Natural Resource Management2. Dryland/Rainfed farming technology3. Conservation of soil, water and natural resources4. Promotion of Agro-Horti.-forestry and silvi-pastoral system5. Reclamation of problematic soils6. IPM, IPNP, INM7. PHT & Value Addition8. Organic Farming9. Promoting use of vermi-compost, bio-fertilizer and bio-agents10. Livestock production and management11. Farm women empowerment through income generating activities12. Popularization of Farm tools and implements
Zonal Project Directorate, Zone-VI
ANNUAL REPORT 2011-12
8. ANNUAL ACTION PLAN
The action plan, based on the identified thrust areas, gap analysis and dialogue with the farmers and officers of the line departments, the activities to be carried out by the KVK under different mandates were formulated and documented in the form of an Annual Action Plan. This action plan is further discussed in the Scientific Advisory Committee meetings of the KVKs and also in the Zonal Workshops of KVKs before its implementation.
9. TECHNOLOGY ASSESSMENT AND REFINEMENT THROUGH ON FARM TESTING
The KVKs under Zone-VI assessed the technologies including crop production and animal husbandry technologies. The details on technology assessment and refinement is given in Annexure-I. The OFT comprises different thematic area conducted by KVKs are given in Table-7.
Table 7 : Total No. of OFTs conducted by KVKs of Zone-VIOFT in Zone-VI No. of OFTs No. of TrialsAssessedRajasthanCrops 43 325Livestock 9 224Other enterprise 4 120Total 56 669Gujarat Crops 76 593Livestock 12 305Other enterprise 6 80Total 94 978Refined Rajasthan Crops 29 591Livestock 5 72Other enterprise 0 0Total 34 663Gujarat Crops 8 40Livestock 1 10Other enterprise 0 0Total 9 50Zone Total Crops 156 1549Livestock 27 611Other enterprise 10 200Grand Total 193 2360
The thematic areas on which OFT were conducted are as follows – Integrated nutrient management, varietal evaluatin, integrated pest management, integrated crop management, integrated disease management, weed management, resource conservation technology, farm machinery, integrated farming system, seed/plant production, value addition, drudgery reduction and nutrition management in children. Some of the prominent technologies are described below :
Zonal Project Directorate, Zone-VI
ANNUAL REPORT 2011-12
Assessment of technologies
1. Low income from cotton as sole crop.
KVK, Kutch made assessment of relay cropping of castor with Bt. Cotton to enhance the income of farmers from per unit land.
Table 8: Effect of cropping system on cotton-castor production. Technological options Yield (q/ha) Net Return
(Rs./ha)B:C ratio
Farmers Practice: Sole Bt. Cotton. 18.5 41075 2.45Sole crop castor 21.5 48325 2.49Relay crop Bt. Cotton : Castor 29.8 70550 2.71
Study revealed that relay crop - castor sown during last week of August in standing crop of Bt. Cotton owing to poor growth of cotton observed by continuous raining produced highest yield (29.8 q/ha) with highest net return (Rs.70550/ha) and 2.71 B:C ratio.
2. Low yield of gram under conserved moisture condition.
The productivity of gram under conserved soil moisture declined in flood prone area of Bharatpur due to depletion of nutrient under continuous mono-cropping of gram. KVK, Bhartpur assessed the effect of thiourea spray @ 0.1% and DAP @ 2% at 50% flowering stage on gram. Study revealed that application of DAP @ 0.2% and thiourea @ 0.1% provided highest yield of 1575 kg/ha and resulted maximum BC ratio 1:2.10
Table 9: Effect of nutrient management on gramTechnology option Yield kg/ha Net Return
(Rs./ha)B:C Ratio
Farmer practice 1295 10580 1:1.3Pohar spray @ 0.2% DAP+0.1 % tu 1518 14050 1:2.1
3. Low yeild of rainfed groundnut
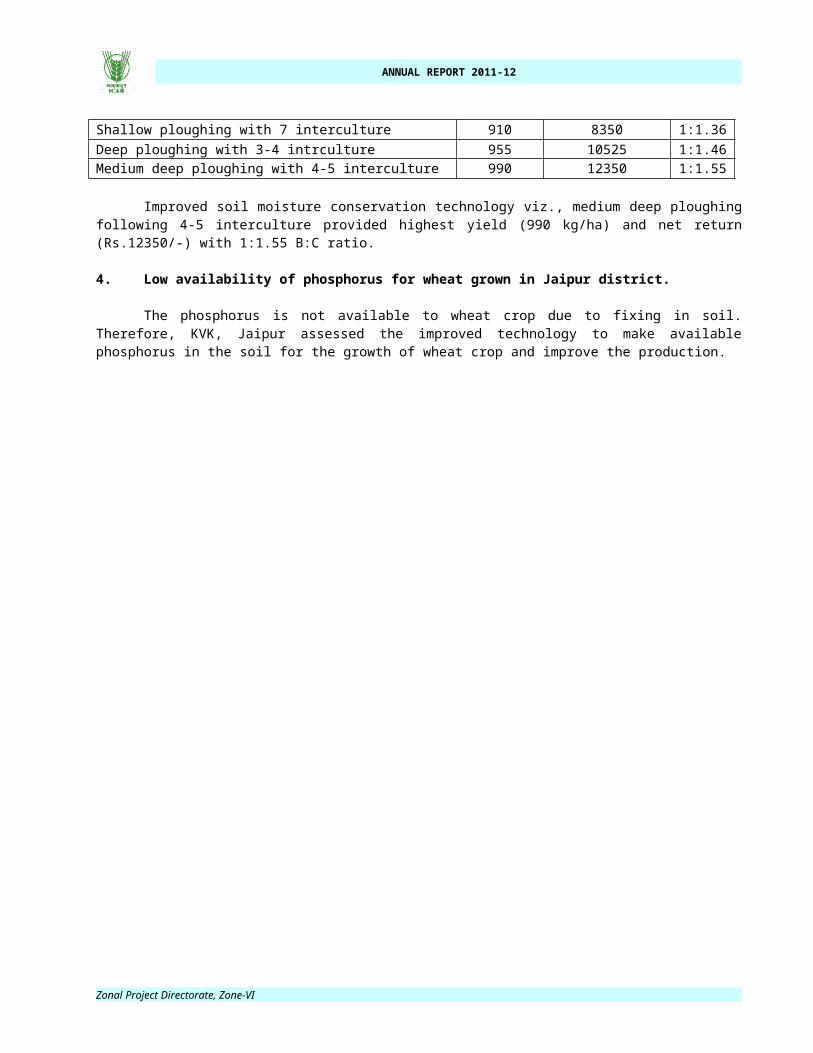
The yield of rainfed groundnut is low due to inadequate moisture conservation in Rajkot district. KVK, Rajkot assessed improved moisture conservation technology in augmenting the production of groundnut.
Table 10: Effect of moisture conservation technologies on production of groundnut.Technological options Yield
(kg/ha)Net Return
(Rs./ha)B:C ratio
Shallow ploughing with 7 interculture 910 8350 1:1.36Deep ploughing with 3-4 intrculture 955 10525 1:1.46Medium deep ploughing with 4-5 interculture 990 12350 1:1.55
Improved soil moisture conservation technology viz., medium deep ploughing following 4-5 interculture provided highest yield (990 kg/ha) and net return (Rs.12350/-) with 1:1.55 B:C ratio.
4. Low availability of phosphorus for wheat grown in Jaipur district.
The phosphorus is not available to wheat crop due to fixing in soil. Therefore, KVK, Jaipur assessed the improved technology to make available phosphorus in the soil for the growth of wheat crop and improve the production.
Zonal Project Directorate, Zone-VI
ANNUAL REPORT 2011-12
Zonal Project Directorate, Zone-VI

ANNUAL REPORT 2011-12
Table 11 : Effect of integrated phosphorus management through microbial application in wheat.Technological options Yield
(kg/ha)Net Return
(Rs./ha)B:C ratio
Farmers practice : DAP @ 100 kg/ha 3180 36340 -SSP@ 200 KG/HA + 600 GM PSB 3625 42125 1:1.6
Study revealed that application of single super phosphate @ 200 kg/ha + 600 gm PSB produced highest yield (3625 kg/ha), which resulted highest net profit of Rs.42125 with 1:1.6 B:C ratio.
5. Phyllody disease reduces the yield of sesame
The yield of sesame reduces drastically due to infestation with phyllody disease in Panchmahal district of Gujarat. KVK, Panchmahal assessed the integrated management technique viz., intercropping of maize along with one spray of Dimethoate @ 0.03% at flowering initiation stage in sesame.
Table 12 : Effect of integrated management of phyllody in sesame.Technological options Yield (kg/ha) Net Return
(Rs./ha)B:C ratio
Farmers practice 509 11340 1:1.59Intercropping of 2 rows of sesame with one row of maize
587 13100 1:1.66
Sesame + maize (2:1) intercrop plus spray of dimethioate @ 0.03% at flowering
663 14790 1:1.73
It was observed that one row of maize intercropped with two rows of sesame reduced infestation of phyllody disease in sesame crop. It provided highest equivalent yield of sesame (663 kg/ha) and net return (Rs.14790) with B:C ratio of 1:1.73.
6. Low yield of coriander due to stemgall.
Coriander a major spice crop of Kota district is often affected with stemgall disease. KVK, Kota conducted trials to assess the improved disease management technology on the fields of farmers of Kota district. Study revealed that application of 6 g/kg seed of trichoderma and spray of calaxin @ 0.1% produced highest yield (13.25 q/ha), which provided a net return of Rs.39750/ha with 1:1.76 BC ratio (Table 13).
Table 13 : Effect of integrated management of stems in coriander
Technological options Yield (kg/ha) Net Return (Rs./ha) B:C ratioFarmers practice 850 25500 -Seed treatment with 1.5 g + Bavistin 1.5 g/kg seed and spray of calaxin @ 0.1%
1150 34500 1:1.53
Trichodermad 6 g/kg seed and spray of calaxin @ 0.1%
1325 39750 1:1.76
7. Low yield of cattle in tribal belt of Udaipur.
Milk yield of cattle is extremely low due to poor feeding management. KVK, Udaipur conducted trials on feeding management on farmers cattle in villages. Study revealed that use of probiotic increased the milk yield from 5.28 litre/animal to 6.33 litre/animal. Farmers earned a net profit of Rs.21.75 per litre with 1:4.06 B:C ratio.
Table 14 : Effect of feeding management in milk yield of cattle.
Zonal Project Directorate, Zone-VI
ANNUAL REPORT 2011-12
Technological Milk yield l/animal/ day
Net Return (Rs./ha)
B:C ratio
Farmers practice 5.28 - -Recommended practice 5.46 4.50 -Probiotic feeding 6.33 21.75 1:2.92
8. Low yield of local mungbean
Yield of local cultivars of mungbean is very low due to low yield potential of long duration nature. KVK, Nagaur conducted trials to assess the performance of high yielding mungbean cultivars at farmers’ fields. Study revealed that RMG-668 have provided highest seed yield (702 kg/ha) at higher B:C ratio of 1:2.24 (Table 15)
Table 15 : Assessment of mungbean varietiesTechnological options Yield
(kg/ha)Net Return
(Rs./ha)B:C ratio
Own seed 590 24780 1:1.95RMG-492 648 27216 1:2.01RMG-668 702 29484 1:2.24
9. Low yield of paddy due to weed infestation
Weed infestation in paddy increases weeding cost and drudgery in operation. KVK, Ahmedabad conducted trials to assess the performance of weeding tools in minimizing operating cost and improving the field capacity. Study revealed that use of cono-weeder & paddy weeder in SRI planted paddy reduced the operating cost by 17-20 % and improved field capacity by 50% over conventional weeding practices (Table 16)
Table 16 : Effect of weeding tools in SRI paddyTechnological options Field capacity
ha/hourOperating cost
Rs/haHand weeding with Khurpi 0.008 1235Paddy weeder 0.016 890Cono-weeder 0.016 1019
Refinement of Technologies
KVKs had also refined technologies which included in the recommendations of respective state in ZREAC meetings. The achievements of some of the technologies highlighted below :
1. Low yield of cotton due millibug problem
Millibug cause heavy damage to cotton and ultimately reduce the yield. KVK, Mehsana conducted trial to refine the assessed technology for further adoption on large scale in Gujarat. Study revealed that soil application of methyl parathion @ 2% DP (25 kg/ha) + profenophos (15 ml/15 l/water) produced highest yield (2860 kg/ha) with a net profit of Rs.57635/ha (B:C ratio 1:1.89).
Table 17 : Effect of pesticide on the yield of cottonTechnological options Yield
(kg/ha)Net Return
(Rs./ha)B:C ratio
Farmers practice : Profenophos 15 ml/15 l/water + DDVP (5 ml/15 l water) + 0.1% soap solution
2490 4118 1:1.64
Zonal Project Directorate, Zone-VI

ANNUAL REPORT 2011-12
Carbofuron 3G 12 kg/ha after 30 & 60 days 2435 39368 1:1.62Methyl parathion @ 2% (25 kg/ha soil application)+profenophos (15 ml/15 l water)
2860 57635 1:1.89
2. Low yield of paddy due to stem borer
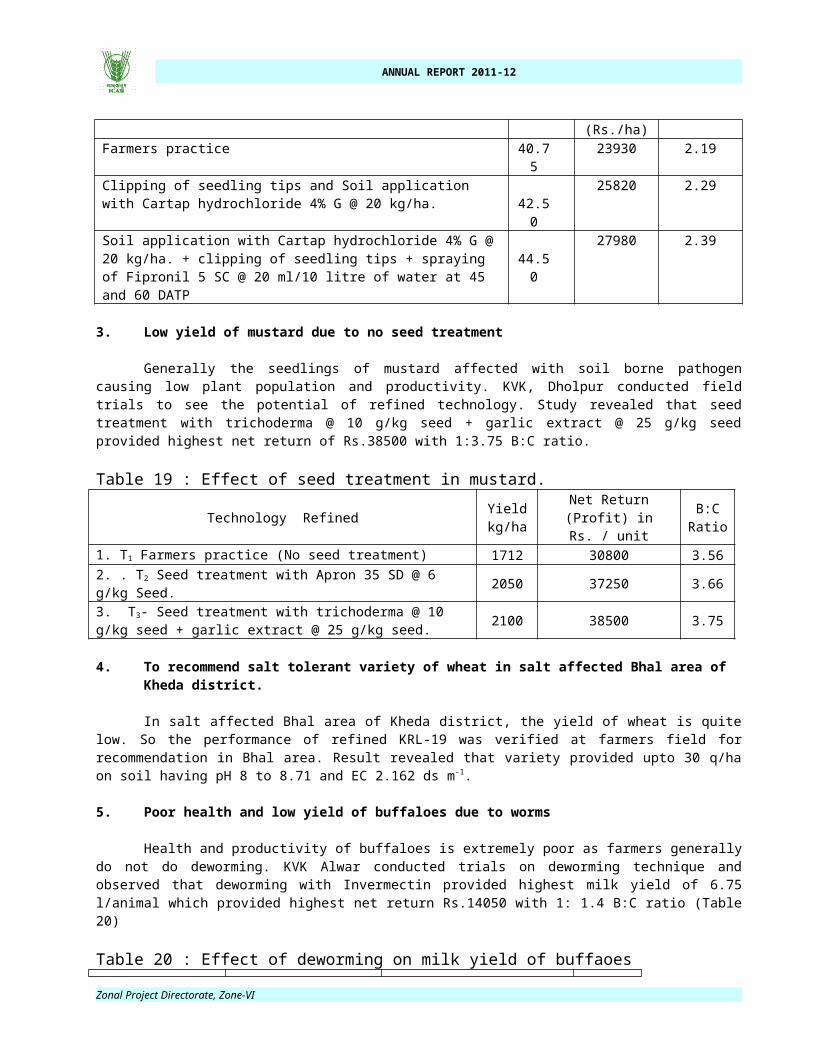
High humidity coupled with favourable temperature caused attack of stem borer in paddy which led to low production often in paddy. KVK, Vadodara conducted trials on refinement of suitable technology to control stem borer in paddy crop. Result shown in table-18 reveald that soil application with cartap hydrochloride 4% G @ 20 kg/ha + clipping of seedling tip + spraying of Fipronil 5 SC @ 20 ml/10 l water at 45 & 60 days after planting has provided the highest return (Rs.27980) with 1:2.39 B:C ratio.
Table 18 : Effect of pesticides on stemborer infestation in paddy. Technological options Yield
(q/ha)Net Return
(Rs./ha)B:C ratio
Farmers practice 40.75 23930 2.19Clipping of seedling tips and Soil application with Cartap hydrochloride 4% G @ 20 kg/ha. 42.50
25820 2.29
Soil application with Cartap hydrochloride 4% G @ 20 kg/ha. + clipping of seedling tips + spraying of Fipronil 5 SC @ 20 ml/10 litre of water at 45 and 60 DATP
44.5027980 2.39
3. Low yield of mustard due to no seed treatment
Generally the seedlings of mustard affected with soil borne pathogen causing low plant population and productivity. KVK, Dholpur conducted field trials to see the potential of refined technology. Study revealed that seed treatment with trichoderma @ 10 g/kg seed + garlic extract @ 25 g/kg seed provided highest net return of Rs.38500 with 1:3.75 B:C ratio.
Table 19 : Effect of seed treatment in mustard.Technology Refined Yield
kg/haNet Return (Profit) in
Rs. / unitB:C
Ratio1. T1 Farmers practice (No seed treatment) 1712 30800 3.562. . T2 Seed treatment with Apron 35 SD @ 6 g/kg Seed. 2050 37250 3.66
3. T3- Seed treatment with trichoderma @ 10 g/kg seed + garlic extract @ 25 g/kg seed. 2100 38500 3.75
4. To recommend salt tolerant variety of wheat in salt affected Bhal area of Kheda district.
In salt affected Bhal area of Kheda district, the yield of wheat is quite low. So the performance of refined KRL-19 was verified at farmers field for recommendation in Bhal area. Result revealed that variety provided upto 30 q/ha on soil having pH 8 to 8.71 and EC 2.162 ds m-1.
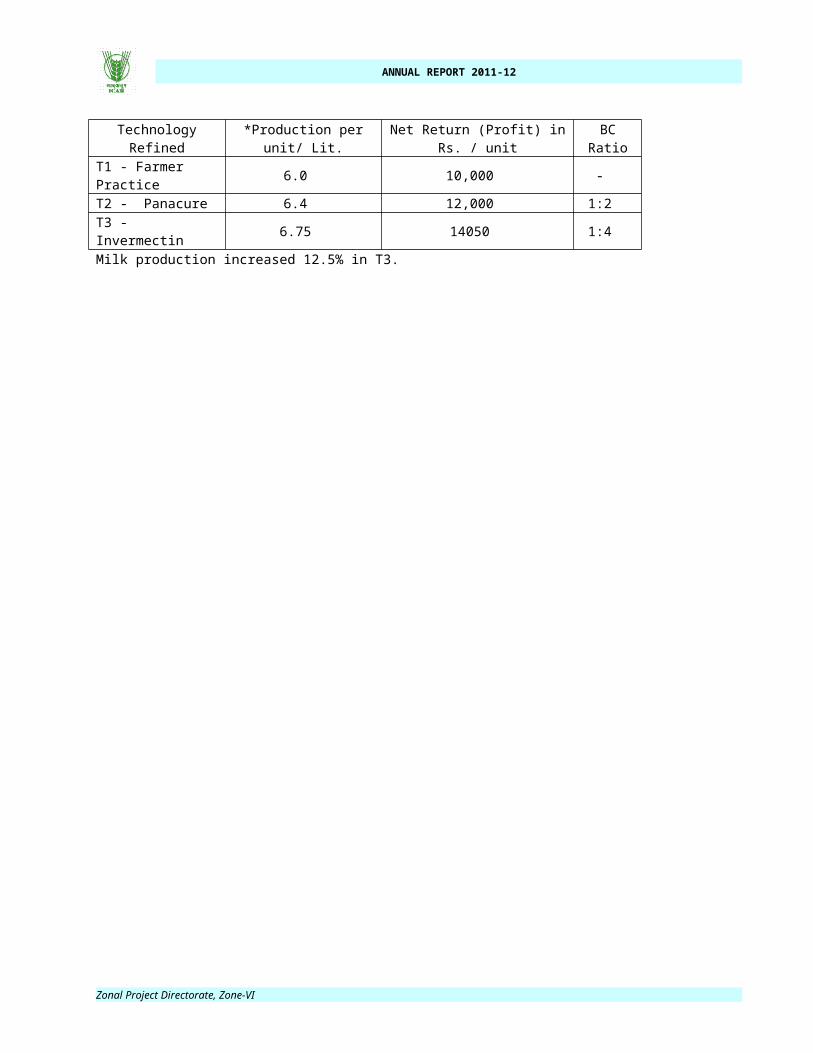
5. Poor health and low yield of buffaloes due to worms
Health and productivity of buffaloes is extremely poor as farmers generally do not do deworming. KVK Alwar conducted trials on deworming technique and observed that deworming with Invermectin provided highest milk yield of 6.75 l/animal which provided highest net return Rs.14050 with 1: 1.4 B:C ratio (Table 20)
Table 20 : Effect of deworming on milk yield of buffaoesTechnology Refined *Production per unit/ Lit. Net Return (Profit) in Rs. / unit BC RatioT1 - Farmer Practice 6.0 10,000 -T2 - Panacure 6.4 12,000 1:2
Zonal Project Directorate, Zone-VI

ANNUAL REPORT 2011-12
T3 - Invermectin 6.75 14050 1:4Milk production increased 12.5% in T3.
Zonal Project Directorate, Zone-VI

ANNUAL REPORT 2011-12
6. Low milk production due to poor feeding management in buffaloes
Milk yield in buffaloes is generally low due to poor feeding management in Dausa district. KVK, Dausa, therefore, tested and refined the technology on feeding management. It was observed that multi-nutrient feed block with usual ration has improved the milk yield by 14.28% during lactation period over farmer practice (Table 21)
Table 21 : Effect of feeding management on milk yield of buffaloesTechnology Refined Av. Milk Production
(Lt./Lactation) % Increase
T1 Farmers Practice- Usual feed (Dry fodder, green fodder & concentrate) given by the farmers to animal
1453.66 -
T2 Mineral mixture @ 40-50gm/day/animal with usual ration for whole lactation 1604.33 10.36%
T3. Urea molasses brick with usual ration for whole lactation. 1661.33 14.28%
7. Low growth rate in goat
Poor feeding management in goat causes slow growth in Chittorgarh district. KVK, Chittorgarh has tested and refined technology viz., natural grazing + concentrate mixture @ 1.5% of body weight + microbial feed supplementation (bio bloom) @ 3 q/day/animal. This increased the body weight from 39 kg in control to 72 kg. A unit of goat fetched Rs.868 at 1:1.47 BC ratio.
Zonal Project Directorate, Zone-VI

ANNUAL REPORT 2011-12
10. FRONT LINE DEMONSTRATIONS
The main objective of frontline demonstration is to demonstrate latest, location specific technologies of agriculture and allied areas on farmers’ fields for generating the production data and obtaining feed back. During the period under report, a total number of 10177 FLDs on various crops of oilseeds, pulses, cereals, vegetable crops, cash crops, millets,etc. covering 3710.20 ha area were conducted in Zone-VI. In addition, 461 FLDs on other income generating enterprises like livestock, farm machinery, etc. were also conducted. The details of front line demonstrations conducted on different identified technologies and comparative economic gains based upon certain parameters of various crops and enterprises have been given in subsequent tables (Table 22 to table 31). However, summary of the front line demonstrations conducted in different states is given in table 22. Table 22 : State-wise FLDs during 2011-12.
State Crops Area (ha) No. of farmers
Rajasthan
Oilseeds 135.7 249Pulses 616 1506Cotton 75 69Cereals 800.8 2024Millets 232.2 496Vegetables 93.05 586Fruits 1 5Spices & Condiments 148.3 372Commercial Crops 0 0Fodder Crops 37.25 342Flowers 0 0Others 173.75 417
Total 2313.05 6066
Gujarat
Oilseeds 144.63 366Pulses 217.09 753Cotton 174.7 402Cereals 511.7 1408Millets 114.4 372Vegetables 116.83 383Fruits 15 32Spices & Condiments 75 180Commercial Crops 2.3 23Fodder Crops 21.5 158Flowers 4 34Others 0 0
Total 1397.15 4111Zone-VI
Oilseeds 280.33 615Pulses 833.09 2259Cotton 249.7 471Cereals 1312.5 3432Millets 346.6 868Vegetables 209.88 969Fruits 16 37
Zonal Project Directorate, Zone-VI
ANNUAL REPORT 2011-12
State Crops Area (ha) No. of farmersSpices & Condiments 223.3 552Commercial Crops 2.3 23Fodder Crops 58.75 500Flowers 4 34Others 173.75 417
Grand Total 3710.20 10177
Zonal Project Directorate, Zone-VI

ANNUAL REPORT 2011-12
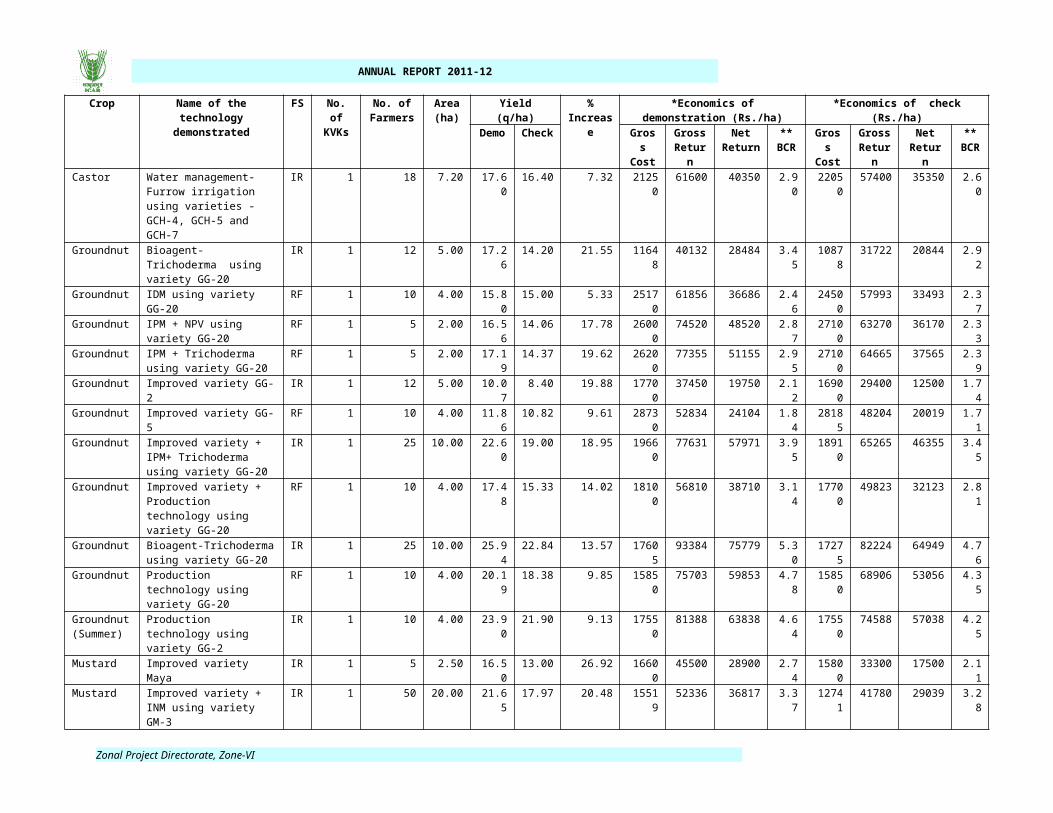
Frontline demonstrations on oilseed crops
A total number of 615 demonstrations covering an area of 280.33 ha area on identified recommended technologies of various oilseeds crops namely castor, groundnut, seasame, soybean, in Kharif and mustard and groundnut in Rabi were laid out, in both irrigated and rainfed farming situations of Rajasthan and Gujarat states. Technology-wise performance of various crops and the economic benefit gained over local checks has been reflected against the each crop are given table : 23 :
Table 23 : Performance of FLDs of oilseeds in different farming situations.
Crop Name of the technology demonstrated
FS No. of KVKs
No. of Farmers
Area(ha)
Yield (q/ha) % Increase
*Economics of demonstration (Rs./ha)
*Economics of check(Rs./ha)
Demo Check GrossCost
GrossReturn
Net Return
**BCR
GrossCost
GrossReturn
Net Return
**BCR
RajasthanMustard Production technology
using variety Bio-902RF 1 38 19.00 24.00 21.00 14.29 12300 59688 47388 4.85 10000 51600 41600 5.16
Mustard Improved varieties using varieties - Rohini and Laxmi
IR 2 118 73.00 17.51 14.90 17.77 24521 57319 32798 2.34 19162 47213 28051 2.46
Sesame Improved varieties + Biofertilizer using variety RT-346
RF 1 15 10.00 6.10 4.80 27.08 7813 24383 16570 3.12 6358 16929 10571 2.66
Sesame Improved variety - Ujjawal IR 1 21 10.50 6.45 3.25 98.46 10750 32250 21500 3.00 10450 16250 5800 1.56Soybean Improved varieties JS 93-
05, JS 93-60 and RKS-24IR 1 57 23.20 17.77 15.20 16.90 14425 35538 21113 2.46 13945 30400 16455 2.18
Total 6 249 135.70GujaratCastor Land configuration using
variety GCH-7IR 1 5 2.50 14.10 12.80 10.16 27280 44415 17135 1.63 26840 40320 13480 1.50
Castor Improved varieties using varieties – GCH-4, GCH-5 and GCH-7
IR 1 72 22.93 22.49 19.33 15.81 19314 78703 59390 4.08 18699 67643 48944 3.62
Castor Improved variety + INM technology using variety GCH-7
IR 1 20 10.00 17.40 15.60 11.54 26840 54810 27970 2.04 26560 49140 22580 1.85
Castor Water management- Furrow irrigation using varieties - GCH-4, GCH-5 and GCH-7
IR 1 18 7.20 17.60 16.40 7.32 21250 61600 40350 2.90 22050 57400 35350 2.60
Groundnut Bioagent- Trichoderma using variety GG-20
IR 1 12 5.00 17.26 14.20 21.55 11648 40132 28484 3.45 10878 31722 20844 2.92
Groundnut IDM using variety GG-20 RF 1 10 4.00 15.80 15.00 5.33 25170 61856 36686 2.46 24500 57993 33493 2.37Groundnut IPM + NPV using variety
GG-20RF 1 5 2.00 16.56 14.06 17.78 26000 74520 48520 2.87 27100 63270 36170 2.33
Groundnut IPM + Trichoderma using variety GG-20
RF 1 5 2.00 17.19 14.37 19.62 26200 77355 51155 2.95 27100 64665 37565 2.39
Groundnut Improved variety GG-2 IR 1 12 5.00 10.07 8.40 19.88 17700 37450 19750 2.12 16900 29400 12500 1.74Groundnut Improved variety GG-5 RF 1 10 4.00 11.86 10.82 9.61 28730 52834 24104 1.84 28185 48204 20019 1.71Groundnut Improved variety + IPM+
Trichoderma using variety GG-20
IR 1 25 10.00 22.60 19.00 18.95 19660 77631 57971 3.95 18910 65265 46355 3.45
Zonal Project Directorate, Zone-VI

ANNUAL REPORT 2011-12
Crop Name of the technology demonstrated
FS No. of KVKs
No. of Farmers
Area(ha)
Yield (q/ha) % Increase
*Economics of demonstration (Rs./ha)
*Economics of check(Rs./ha)
Demo Check GrossCost
GrossReturn
Net Return
**BCR
GrossCost
GrossReturn
Net Return
**BCR
Groundnut Improved variety + Production technology using variety GG-20
RF 1 10 4.00 17.48 15.33 14.02 18100 56810 38710 3.14 17700 49823 32123 2.81
Groundnut Bioagent-Trichoderma using variety GG-20
IR 1 25 10.00 25.94 22.84 13.57 17605 93384 75779 5.30 17275 82224 64949 4.76
Groundnut Production technology using variety GG-20
RF 1 10 4.00 20.19 18.38 9.85 15850 75703 59853 4.78 15850 68906 53056 4.35
Groundnut (Summer)
Production technology using variety GG-2
IR 1 10 4.00 23.90 21.90 9.13 17550 81388 63838 4.64 17550 74588 57038 4.25
Mustard Improved variety Maya IR 1 5 2.50 16.50 13.00 26.92 16600 45500 28900 2.74 15800 33300 17500 2.11Mustard Improved variety + INM
using variety GM-3IR 1 50 20.00 21.65 17.97 20.48 15519 52336 36817 3.37 12741 41780 29039 3.28
Mustard Improved variety + Production technology using variety GM-2
IR 1 10 4.00 16.35 14.33 14.10 12300 32700 20400 2.66 12450 28660 16210 2.30
Sesame Improved variety GT-2 RF 1 4 2.00 4.70 3.60 30.56 16500 27225 10725 1.65 16150 20898 4748 1.29Sesame Improved variety GT-2 IR 1 5 2.00 11.50 10.30 11.65 15265 26220 10955 1.72 16510 23484 6974 1.42Sesame Improved variety +
Production technology using variety GT-2
RF 1 10 4.00 5.90 5.20 13.46 12700 31860 19160 2.51 12450 28080 15630 2.26
Sesame (Summer)
Production technology using variety GT-3
IR 1 20 8.00 12.09 11.21 7.85 8919 66481 57562 7.45 8919 56031 47113 6.28
Soybean Production technology using variety GS-1
RF 1 10 4.00 17.58 15.19 15.73 9710 48331 38621 4.98 9710 41766 32056 4.30
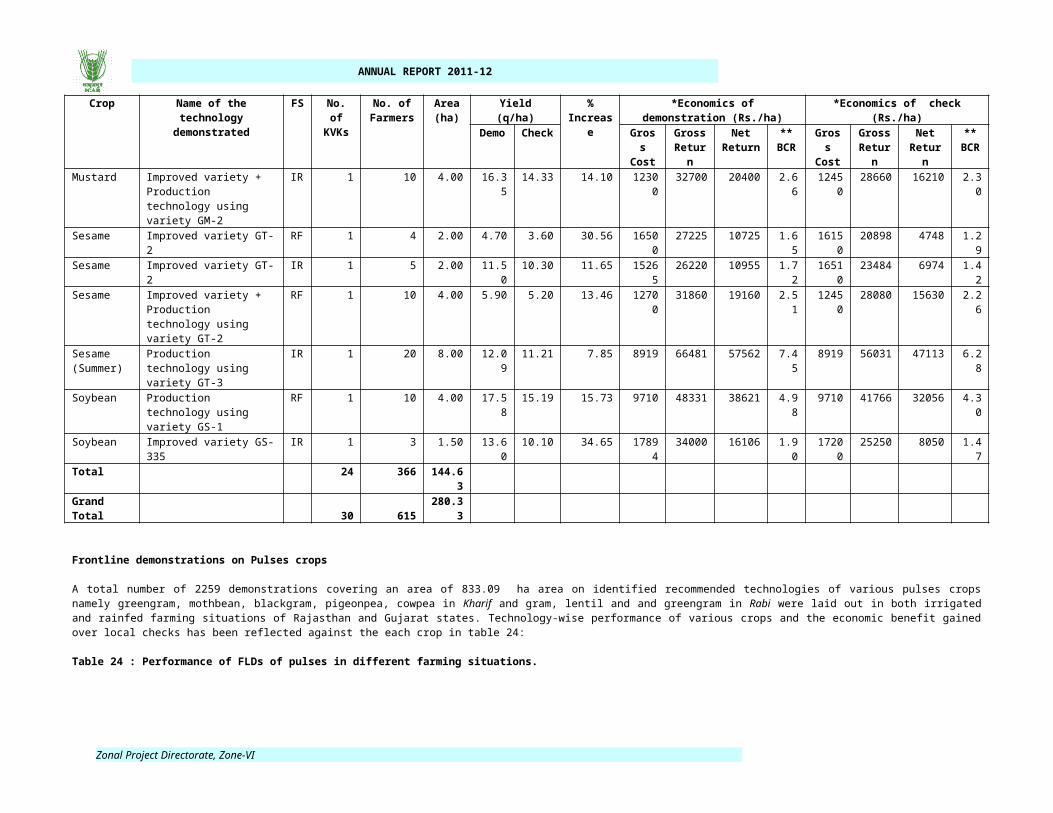
Soybean Improved variety GS-335 IR 1 3 1.50 13.60 10.10 34.65 17894 34000 16106 1.90 17200 25250 8050 1.47Total 24 366 144.63Grand Total 30 615 280.33
Frontline demonstrations on Pulses crops
A total number of 2259 demonstrations covering an area of 833.09 ha area on identified recommended technologies of various pulses crops namely greengram, mothbean, blackgram, pigeonpea, cowpea in Kharif and gram, lentil and and greengram in Rabi were laid out in both irrigated and rainfed farming situations of Rajasthan and Gujarat states. Technology-wise performance of various crops and the economic benefit gained over local checks has been reflected against the each crop in table 24:
Table 24 : Performance of FLDs of pulses in different farming situations.Crop Name of the technology
demonstratedFS No. of
KVKsNo. of
FarmersArea(ha)
Yield (q/ha) % Increase
*Economics of demonstration (Rs./ha)
*Economics of check(Rs./ha)
Demo Check GrossCost
GrossReturn
Net Return
**BCR
GrossCost
GrossReturn
Net Return
**BCR
RajasthanCowpea Improved variety RC-19 RF 1 47 23.50 11.13 9.62 15.70 12350 22460 10110 1.82 12030 19240 7210 1.60Gram ICM using varieties - RSG-
888 and GNG-1581IR 1 20 8.00 17.05 15.94 7.34 14718 35810 21092 2.43 14718 33479 18761 2.27
Gram Production technology using varieties - RSG-888, RSG-963 and GNG-663
IR 5 150 60.00 15.75 12.73 23.96 13604 36798 23194 2.70 11227 29701 18475 2.65
Zonal Project Directorate, Zone-VI

ANNUAL REPORT 2011-12
Crop Name of the technology demonstrated
FS No. of KVKs
No. of Farmers
Area(ha)
Yield (q/ha) % Increase
*Economics of demonstration (Rs./ha)
*Economics of check(Rs./ha)
Demo Check GrossCost
GrossReturn
Net Return
**BCR
GrossCost
GrossReturn
Net Return
**BCR
Gram Production technology using varieties - RSG-888, RSG-963 and GNG-663
RF 2 45 18.00 16.63 12.60 31.54 14782 40474 25691 2.74 12089 30647 18558 2.54
Gram Seed treatment + INM + IPM using variety RSG-888
IR 1 25 10.00 20.12 16.07 25.20 15370 42252 26882 2.75 12725 33104 20379 2.60
Gram Improved varieties BG-1105 and BG-372
IR 1 15 7.50 12.66 8.50 48.94 10532 43860 33328 4.16 10000 32550 22550 3.26
Gram Improved variety + INM+ IPM using variety RSG-888
RF 1 15 6.00 18.16 13.06 39.05 10626 38136 27510 3.59 8688 27426 18738 3.16
Gram Improved variety + IPM + INM + IWM using variety RSG-973
IR 1 20 8.00 25.10 20.15 24.57 21080 60240 39160 2.86 18077 48360 30283 2.68
Gram Improved variety + Production technology using variety GNG-663
IR 1 30 12.00 18.66 14.73 26.68 19432 42302 22870 2.18 15750 33506 17756 2.13
Lentil Bioagent -Trichoderma using variety K-75
IR 1 11 4.00 12.50 10.30 21.36 20500 67600 47100 3.30 19000 55000 36000 2.89
Lentil Improved variety K-75 IR 2 15 2.60 14.61 11.77 23.38 15077 49685 34608 3.30 12531 40723 28192 3.25Mung bean ICM using varieties IPM-O2-
3 and SatyaIR 1 20 8.00 8.75 8.40 4.10 15068 36729 21661 2.44 15288 31882 16594 2.09
Mung bean INM + Plant Protection using variety SML- 668
IR 1 30 12.00 8.70 7.55 15.23 8250 53256 45006 6.46 7760 44063 36303 5.68
Mung bean Production technology using varieties RMG-492, RMG-268 and SML-668
IR 2 55 22.00 10.23 7.63 36.03 12215 31350 19135 2.57 8636 24277 15641 2.81
Mung bean Production technology using varieties SML-668, RMG-492, RMG-268 and IPM 02 – 03
RF 6 144 69.60 9.44 6.94 37.05 12340 31696 19356 2.57 10267 23120 12853 2.25
Mung bean Seed treatment + INM + IPM using variety RMG-62
RF 1 30 12.00 9.33 7.27 28.34 15262 38253 22991 2.51 13500 29807 16307 2.21
Mung bean Improved varieties GM-4, SML-668 and RMG-344
RF 4 210 85.00 9.33 7.02 35.36 13091 31418 18327 2.40 11818 23706 11889 2.01
Mung bean Improved variety + Biofertilizer using variety RMG-344
RF 1 44 15.00 6.50 4.90 32.65 9897 27900 18003 2.82 8277 18900 10623 2.28
Mung bean Improved variety + ICM + Seed treatment using variety RMG-268
IR 1 30 12.00 6.49 5.23 24.09 10375 22713 12338 2.19 8565 18305 9740 2.14
Mung bean Improved varieties + INM + IPM using varieties - RMG-492, RMG-62 and RMG-268
RF 2 60 24.00 9.30 6.87 35.55 12388 32550 20163 2.63 10455 24045 13591 2.30
Mung bean Improved varieties + Land configuration + Production technology using variety SML-668
RF 1 25 10.00 8.56 4.96 72.58 12174 30816 18642 2.53 10600 17608 7008 1.66
Zonal Project Directorate, Zone-VI
ANNUAL REPORT 2011-12
Crop Name of the technology demonstrated
FS No. of KVKs
No. of Farmers
Area(ha)
Yield (q/ha) % Increase
*Economics of demonstration (Rs./ha)
*Economics of check(Rs./ha)
Demo Check GrossCost
GrossReturn
Net Return
**BCR
GrossCost
GrossReturn
Net Return
**BCR
Mung bean (Summer)
Improved variety GM-4 IR 1 15 4.00 6.14 5.10 20.39 13400 18900 5500 1.41 12800 15800 3000 1.23
Urd bean Production technology using varieties PU-31, KU-96-3 and IPU 94-1 (Uttra)
RF 3 151 68.00 10.13 7.97 28.28 13522 31879 18357 2.36 11060 24967 13907 2.26
Urd bean Improved varieties PU-31and KU-96-3
RF 4 180 76.00 10.33 7.91 32.66 12137 31886 19749 2.63 10121 24338 14217 2.40
Urd bean Improved variety + INM + IWM using variety PU-31
RF 1 10 4.00 11.30 7.90 43.04 12826 28250 15424 2.20 11160 19750 8590 1.77
Urd bean Improved variety + INM+ IPM using variety KU-300
RF 1 15 6.00 8.25 6.16 33.93 17876 31350 13474 1.75 15414 23408 7994 1.52
Urd bean Improved varieties + Land configuration + Production technology using varieties - PU-31 and KU-96-3
RF 1 50 20.00 10.02 5.76 74.07 11724 34082 22358 2.91 10520 19074 8554 1.81
Urd bean Improved variety + Production technology using variety PU-31
RF 1 44 8.80 7.16 5.11 40.12 6875 24885 18010 3.62 6167 17833 11666 2.89
Total 49 1506 616GujaratGram Bioagent - Trichoderma
using variety GG-2IR 2 32 13.00 7.63 7.14 6.50 9169 23692 14523 2.58 8969 21523 12554 2.40
Gram Bioagent + Trichoderma using variety - Local
RF 1 12 5.00 17.88 16.66 7.32 10995 50064 39069 4.55 10870 47600 36730 4.38
Gram Bioagent- Biofertilizer using variety GG-2
IR 1 10 5.00 5.00 4.71 6.16 10120 18000 7880 1.78 9850 16956 7106 1.72
Gram ICM using variety GG-1 IR 1 15 6.00 7.93 6.50 22.00 12325 15860 3535 1.29 11150 13000 1850 1.17Gram IPM + Pheromone trap
using variety GG-1RF 1 5 2.00 16.00 14.00 14.29 18000 52000 34000 2.89 16750 45500 28750 2.72
Gram Land configuration using varieties GG-1 and GG-2
IR 1 7 3.50 6.20 5.30 16.98 11320 22320 11000 1.97 10120 19080 8960 1.89
Gram Improved varieties GG-2 and GG-3
IR 4 215 36.00 20.00 16.63 24.18 10208 47084 36876 4.61 9981 39002 29021 3.91
Gram Improved varieties GG-2 and GG-1
RF 2 24 9.80 10.52 8.00 31.69 8011 28267 20257 3.53 7000 21524 14523 3.07
Gram Improved varieties + Land configuration using varieties GG 2 and DBG 72
IR 1 32 6.59 13.24 10.68 23.97 16550 48988 32438 2.96 15650 39516 23866 2.52
Gram Improved variety + Production technology using variety GG-3
IR 1 10 4.00 15.16 13.38 13.30 12900 31836 18936 2.47 13050 28098 15048 2.15
Gram IPM using variety Local RF 1 12 4.80 19.90 17.00 17.06 12375 55720 43345 4.50 10870 47600 36730 4.38Mung bean Improved varieties GM-4
and CO4IR 3 36 14.00 18.24 15.31 23.43 11779 41188 29409 3.50 11021 33376 22354 3.03
Mung bean Improved variety GM-4 RF 1 5 2.00 5.20 4.80 8.33 14575 17651 3076 1.21 14375 16233 1858 1.13Mung bean Improved variety GM-4 RF 1 20 8.00 11.07 8.47 30.70 19465 41146 21682 2.11 16663 31566 14903 1.89
Zonal Project Directorate, Zone-VI
ANNUAL REPORT 2011-12
Crop Name of the technology demonstrated
FS No. of KVKs
No. of Farmers
Area(ha)
Yield (q/ha) % Increase
*Economics of demonstration (Rs./ha)
*Economics of check(Rs./ha)
Demo Check GrossCost
GrossReturn
Net Return
**BCR
GrossCost
GrossReturn
Net Return
**BCR
Mung bean Improved variety + Production technology using variety GM-4
IR 1 13 5.20 9.48 7.14 32.77 13750 33180 19430 2.41 12670 24990 12320 1.97
Mung bean Improved variety + Production technology using variety GM-4
RF 2 30 12.00 9.96 8.11 22.51 11860 33330 21470 2.81 10653 27308 16655 2.56
Pigeonpea Bioagent - Trichoderma using varieties – Local and Vaishali
RF 2 29 12.00 9.45 7.92 21.58 14683 48635 33952 3.31 13683 39647 25964 2.90
Pigeonpea ICM using variety Vaishali IR 1 20 8.00 12.10 9.80 23.47 17650 42350 24700 2.40 15440 34300 18860 2.22Pigeonpea IPM + Trichoderma using
variety LocalRF 1 3 1.00 15.95 13.00 22.69 8550 38280 29730 4.48 7575 31200 23625 4.12
Pigeonpea Improved variety Vaishali IR 1 12 8.00 14.20 10.96 29.56 19250 49700 30450 2.58 18600 38360 19760 2.06Pigeonpea Improved varieties Vaishali
and BDN-2 RF 2 54 22.00 12.45 9.98 24.66 13009 43482 30473 3.34 12247 35700 23453 2.92
Pigeonpea Improved variety + Land configuration using variety Vaishali
IR 1 134 20.00 10.65 9.15 16.39 17100 42600 25500 2.49 16350 36600 20250 2.24
Pigeonpea Improved variety + Production technology using variety GT-101
IR 1 15 6.00 9.99 7.69 29.91 13620 33057 19437 2.43 12070 25446 13376 2.11
Urd bean Improved variety GU-1 RF 1 8 3.20 4.20 3.80 10.53 13813 15403 1590 1.12 13625 13936 311 1.02Total 34 753 217.09Grand Total 83 2259 833.09
Frontline demonstrations on Cotton (Technology mission on Cotton – MM-II)
A total number of 471 demonstrations covering of 249.70 ha area under frontline demonstration on cotton were conducted. The demonstrations were under different componts of production technologies using Bt. Cottons, INM, IPM in Rajasthan and Gujarat states. The performance of various technologies introduced in cotton production are summarized below in Table-25.
Table 25 : Performance of frontline demonstration on various components of production technologies in cotton.
Crop Name of the technology demonstrated
FS No. of KVKs
No. of Farmers
Area(ha)
Yield (q/ha) % Increase
*Economics of demonstration (Rs./ha)
*Economics of check(Rs./ha)
Demo Check GrossCost
GrossReturn
Net Return
**BCR
GrossCost
GrossReturn
Net Return
**BCR
RajasthanCotton INM using varieties - JK-
1947, Bio-6488, MRC- 6025, MRC-7017, and GK -212
IR 1 67 25.00 22.50 19.50 15.38 14023 58000 43977 4.14 15911 52000 36089 3.27
Cotton Farm machinery: Aero blast using variety Bio-6488
IR 1 2 50.00 25.10 22.60 11.06 14023 58000 43977 4.14 15911 52000 36089 3.27
Total 2 69 75.00GujaratCotton Bioagent - Trichoderma
using varieties - BG-II and ADC-1
IR 3 57 23.00 19.49 17.30 11.10 19863 83074 63211 4.18 19537 73783 54245 3.78
Zonal Project Directorate, Zone-VI

ANNUAL REPORT 2011-12
Crop Name of the technology demonstrated
FS No. of KVKs
No. of Farmers
Area(ha)
Yield (q/ha) % Increase
*Economics of demonstration (Rs./ha)
*Economics of check(Rs./ha)
Demo Check GrossCost
GrossReturn
Net Return
**BCR
GrossCost
GrossReturn
Net Return
**BCR
Cotton IDM using variety BG-II IR 1 25 10.00 22.50 20.00 12.50 23500 92250 68750 3.93 24471 82000 57529 3.35Cotton INM using variety Bijdhan-5 IR 1 25 10.00 30.10 25.61 17.53 23705 120280 96575 5.07 26350 102480 76130 3.89Cotton INM using variety BG-II RF 1 50 20.00 32.35 30.83 4.93 44935 143472 98537 3.19 44288 136864 92576 3.09Cotton INM:MgSO4 using variety
ADC-1IR 1 20 10.00 15.70 14.90 5.37 32720 70650 37930 2.16 31220 67050 35830 2.15
Cotton IPM using variety BG-II IR 1 5 14.00 20.00 18.00 11.11 58000 200000 142000 3.45 56000 140000 84000 2.50Cotton IPM - Neem oil + Methyl
parathion+ Sorghum inter cropping + MgSO4 using variety Bijdhan-2
IR 1 25 10.00 30.94 28.46 8.71 69902 137039 67137 1.96 69640 126932 57292 1.82
Cotton IPM + INM using variety BG-II
IR 1 25 10.00 36.88 29.37 25.57 28500 147520 119020 5.18 32000 117480 85480 3.67
Cotton IPM + INM using variety Bijdhan-2
RF 1 25 10.00 19.30 16.10 19.88 23240 77200 53960 3.32 24325 64400 40075 2.65
Cotton IPM- Methyl parathion 2% dust + Profenophos 50 EC using variety BG-2
IR 1 10 4.00 32.00 28.50 12.28 45625 128000 82375 2.81 43250 114000 70750 2.64
Cotton Land configuration using variety ADC-1
IR 1 5 2.50 13.50 12.20 10.66 21050 41850 20800 1.99 20480 37820 17340 1.85
Cotton Moisture conservation: Mulching using variety BG-II
RF 1 10 1.00 32.80 26.40 24.24 34350 147600 113250 4.30 32450 118800 86350 3.66
Cotton Nutrient management: Foliar spray of KNO3 using variety BG-II
IR 1 12 5.00 27.10 24.85 9.05 33903 113820 79917 3.36 33434 104370 70936 3.12
Cotton Improved variety using variety ADC-1
IR 1 20 10.00 12.80 11.40 12.28 20482 39680 19198 1.94 20482 35340 14858 1.73
Cotton Improved variety + Production technology using variety CMM-II
IR 1 60 24.00 23.15 20.04 15.21 23329 95227 71898 4.08 22892 82302 59410 3.60
Cotton Weed Management using variety BG-II
RF 1 3 1.20 30.79 28.71 7.24 46300 138093 91793 2.98 42100 128764 86664 3.06
Cotton Nutrient management using variety Bijdhan-5
RF 1 25 10.00 21.79 17.48 24.66 25575 96421 70846 3.77 24890 77349 52459 3.11
Total 19 402 174.70Grand Total 21 471 249.70
Zonal Project Directorate, Zone-VI

ANNUAL REPORT 2011-12
Frontline demonstrations on Cereals, Horticulture and Other Crops
During 2011-12, 6832 demonstrations covering 2347.08 ha area in different major crops were conducted. The technology related to integrated crop management, integrated nutrient management, integrated disease and pest management and weed management, etc. were demonstrated. The performance of proven technologies of different crops in terms of effective economic gains over local checks is presented in Table-26.
Table 26 : Frontline demonstration on other crops.
Category and Crop
Name of the technology
demonstrated
FS No. of
KVKs
No. of Farme
r
Area(ha)
Yield (q/ha) % change in yield
*Economics of demonstration (Rs./ha)
*Economics of check(Rs./ha)
Demonsration
Check GrossCost
GrossReturn
Net Return
**BCR
GrossCost
GrossReturn
Net Return
**BCR
Cereals RajasthanBarley Production
technology using varieties - RD-2552, RD-2035 and RD-2592
IR 5 152 63.00 44.37 39.15 14.00 15985
53743 37758 3.36 14995 47223 32228 3.15
Barley Improved varieties RD-2668, RD- 2035, RD-2660 and RD-2592
IR 4 127 29.40 37.69 30.60 24.17 15554
43986 28433 2.83 14037 33817 19780 2.41
Barley Improved variety + Biofertilizer using variety RD-2668
IR 1 30 15.00 34.93 28.50 22.56 14903
39740 24837 2.67 14200 30272 16072 2.13
Barley Improved variety + Production technology using varieties - RD-2552, RD-2597 and RD-2668
IR 4 79 32.00 44.78 37.72 18.43 16132
51580 35667 3.20 14289 43307 29608 3.03
Maize Production technology using varieties - PM-3, Bio-9681 and HQPM-1
IR 3 160 64.00 35.16 27.99 28.90 15333
33768 18436 2.20 11998 27015 15016 2.25
Maize Production technology using variety Bio-9681
RF
2 65 26.00 33.55 21.77 56.01 13185
33548 20362 2.54 12423 21768 9345 1.75
Maize Improved variety using varieties - Pratap Hybrid Maize-1, HQPM-1, PEHM-2, Bio-9681, PM-3, Pro agro-4644 and DKC-7074
RF
6 229 92.40 26.52 17.12 60.20 10623
28774 18151 2.71 9656 20430 10774 2.12
Zonal Project Directorate, Zone-VI

ANNUAL REPORT 2011-12
Category and Crop
Name of the technology
demonstrated
FS No. of
KVKs
No. of Farme
r
Area(ha)
Yield (q/ha) % change in yield
*Economics of demonstration (Rs./ha)
*Economics of check(Rs./ha)
Demonsration
Check GrossCost
GrossReturn
Net Return
**BCR
GrossCost
GrossReturn
Net Return
**BCR
Maize Improved variety + INM + IPM using varieties - HQPM-1 and PEHM-2
IR 1 10 4.00 37.90 25.50 48.63 23811
53060 29249 2.23 20696 33150 12454 1.60
Maize Improved variety + Land configuration + Seed treatment using variety Bio-9681
RF
1 25 10.00 36.92 24.50 50.69 14940
36920 21980 2.47 12650 25725 13075 2.03
Maize Improved variety + Production technology using variety Bio-9681
RF
1 50 10.00 36.45 26.58 37.13 20770
51834 31064 2.50 17585 35369 17784 2.01
Maize Improved variety + Seed treatment+ Weed Management using variety PM-3
IR 1 50 20.00 30.20 22.70 33.04 11500
27180 15680 2.36 7400 20430 13030 2.76
Maize Weed management using variety DKC-7074
RF
1 4 1.10 24.00 18.00 33.33 13202
24000 10798 1.82 13500 18000 4500 1.33
Maize (Rabi) Production technology using varieties Bio-9681 and Prabal
IR 1 25 10.00 53.42 45.30 17.92 13202
53420 40218 4.05 13500 45300 31800 3.36
Paddy Improved variety using variety P-1460
RF
1 25 10.00 20.10 17.50 14.86 10852
50250 39398 4.63 9852 43750 33898 4.44
Paddy Improved variety + Land configuration + Seed treatment using variety PS-4
IR 1 22 8.80 40.59 32.68 24.20 18902
74925 56023 3.96 18240 53992 35752 2.96
Sourghum Improved variety using variety CSV-15
RF
1 12 5.00 18.60 10.70 73.83 5874 17150 11276 2.92 5760 12495 6735 2.17
Wheat Production technology using varieties - Raj-3765, Raj-4037, Raj-4161 and PBW-502,
IR 4 254 100.40 42.87 34.76 23.45 13375
52465 40136 3.92 11279 45485 34973 4.03
Wheat Improved variety using varieties - Raj-4037, DBW-17, HD-2932 and Raj-4120
IR 9 450 198.50 38.42 32.56 17.90 19217
46362 27145 2.41 18065 36973 18908 2.05
Wheat Improved variety + Biofertilizer using variety Raj-4037
IR 1 30 15.00 39.46 32.50 21.42 20300
48248 27948 2.38 18700 39275 20575 2.10
Zonal Project Directorate, Zone-VI

ANNUAL REPORT 2011-12
Category and Crop
Name of the technology
demonstrated
FS No. of
KVKs
No. of Farme
r
Area(ha)
Yield (q/ha) % change in yield
*Economics of demonstration (Rs./ha)
*Economics of check(Rs./ha)
Demonsration
Check GrossCost
GrossReturn
Net Return
**BCR
GrossCost
GrossReturn
Net Return
**BCR
Wheat Improved variety + INM using varieties - Raj-4037 and DBW-17
IR 1 31 13.00 43.07 35.21 22.98 23338
71060 47721 3.04 22034 58089 36054 2.64
Wheat Improved variety + Production technology using varieties - PBW-502, Raj-3765, Raj-4037 and Raj-4037
IR 4 175 62.00 49.55 41.45 19.52 20140
64527 44386 3.20 19641 54194 34553 2.76
Wheat Improved variety + Seed treatment + Micronutrient using variety Raj-3765
IR 1 13 5.20 49.66 42.70 16.30 23563
68102 44539 2.89 22843 59959 37116 2.62
Wheat Weed management using variety Raj-3765
IR 2 6 6.00 44.93 39.40 13.72 15467
44330 28863 2.87 14000 37200 23200 2.66
Total 56 2024 800.80GujaratMaize Plant protection
using variety GM-2RF
1 10 2.00 43.75 34.50 26.81 29100
48125 19025 1.65 27700 37950 10250 1.37
Maize Improved variety using variety HQPM-1
RF
1 12 8.00 41.80 33.00 26.67 28100
45980 17880 1.64 27900 36300 8400 1.30
Maize Improved variety using varieties - GM-6 and HQPM-1
RF
2 82 22.00 12.56 10.52 17.62 8325 14701 6377 1.77 7766 12301 4534 1.58
Maize Improved variety + Production technology using varieties - HQPM-1 and GM-2
RF
2 65 26.00 30.12 23.72 26.70 15838
36394 20556 2.30 14623 27169 12546 1.86
Paddy ICM using varieties - GAR-1 and GAR-13
IR 1 60 15.00 45.61 41.41 10.06 27677
45274 17596 1.64 29579 39447 9869 1.33
Paddy INM-Green manuring using variety - Gurjari
IR 1 10 5.00 38.60 35.20 9.66 24600
42460 17860 1.73 23800 38720 14920 1.63
Paddy IPM using variety GR-11
IR 1 12 5.00 42.50 38.00 11.84 20080
45900 25820 2.29 19490 41040 21550 2.11
Paddy SRI using variety GR-13
IR 1 25 12.50 46.28 40.08 15.49 30260
57850 27590 1.91 28555 50100 21545 1.75
Paddy Improved variety using varieties - GAR-13 and NAUR-1
IR 3 229 51.80 43.63 33.04 33.93 23151
50498 27348 2.18 19573 38023 18450 1.94
Zonal Project Directorate, Zone-VI
ANNUAL REPORT 2011-12
Category and Crop
Name of the technology
demonstrated
FS No. of
KVKs
No. of Farme
r
Area(ha)
Yield (q/ha) % change in yield
*Economics of demonstration (Rs./ha)
*Economics of check(Rs./ha)
Demonsration
Check GrossCost
GrossReturn
Net Return
**BCR
GrossCost
GrossReturn
Net Return
**BCR
Paddy Improved variety using varieties - GR-9, ADR-1, GR-5 and MTU-1010
RF
3 152 51.00 31.90 27.93 16.41 17092
36172 19080 2.12 18477 32048 13571 1.73
Wheat INM using varieties - GW-496 and GW-1
IR 2 32 14.80 17.01 14.90 13.61 15014
27437 12423 1.83 13973 24120 10147 1.73
Wheat INM- Micronutrient spray using variety GW-496
IR 1 50 20.00 32.60 31.40 3.82 24880
40750 15870 1.64 23880 39250 15370 1.64
Wheat Nutrient management using variety GW-496
IR 1 25 10.00 32.50 27.00 20.37 18390
42250 23860 2.30 12500 34375 21875 2.75
Wheat Production technology using variety GW-366
IR 1 20 10.00 48.13 43.34 11.05 23085
84228 61143 3.65 24495 75845 51350 3.10
Wheat Improved variety using varieties - GW-496, GW-366, GW-173 and GW-322
IR 10 506 207.40 16.25 13.70 8.68 7071 23507 16437 3.32 7065 19394 12330 2.75
Wheat Improved variety + IPM using variety GW-273
IR 1 25 10.00 35.20 29.80 18.12 13850
45056 31206 3.25 12600 38144 25544 3.03
Wheat Improved variety + Production technology using varieties – GW-366 and GW-496
IR 2 45 20.00 40.45 35.97 12.48 19189
59248 40059 3.09 19362 51239 31877 2.65
Wheat Water management using varieties - GW-366 and GW-1
IR 2 35 16.00 22.90 19.55 23.45 17611
33438 15826 1.90 16344 29875 13531 1.83
Wheat Weed management- Metsulpho methyl using variety GW-496
IR 1 3 1.20 32.50 28.25 15.04 25990
40625 14635 1.56 25990 35313 9323 1.36
Wheat Termite control using variety Own seed
RF
1 10 4.00 25.66 23.85 7.59 16280
35924 19644 2.21 15655 33390 17735 2.13
Total 38 1408 511.70Grand Total 94 3432 1312.50MilletsRajasthanPearl millet Improved variety
using varieties – JBV-3 and Raj-171
RF
2 46 32.50 16.08 12.88 25.29 11899
25338 13439 2.13 10602 20192 9591 1.90
Zonal Project Directorate, Zone-VI
ANNUAL REPORT 2011-12
Category and Crop
Name of the technology
demonstrated
FS No. of
KVKs
No. of Farme
r
Area(ha)
Yield (q/ha) % change in yield
*Economics of demonstration (Rs./ha)
*Economics of check(Rs./ha)
Demonsration
Check GrossCost
GrossReturn
Net Return
**BCR
GrossCost
GrossReturn
Net Return
**BCR
Pearl millet Abiotic stress management through Thiourea using varieties - Hybrid Seed of Pro Agro 4444 variety Kaveri
IR 1 10 5.00 22.86 19.69 16.10 8208 23431 15223 2.85 6968 20737 13769 2.98
Pearl millet ICM using variety HHB-67
IR 1 25 10.00 16.62 17.36 -4.26 11951
16620 4669 1.39 12131 17360 5229 1.43
Pearl millet Production technology using varieties - HHB-197, GHB-538 and RHB-121
IR 2 56 25.20 20.99 17.02 24.32 14422
27902 13479 1.93 12484 22910 10425 1.84
Pearl millet Production technology using varieties - SUN-4094, HHB-67 and Raj-171
RF
3 75 30.00 18.02 13.61 33.56 11067
19953 8886 1.80 9493 15542 6048 1.64
Pearl millet Improved variety using variety Raj-171
IR 1 50 22.50 14.41 12.39 16.78 8606 16654 8049 1.94 8324 14821 6496 1.78
Pearl millet Improved variety + Fertilizer management using variety HHB-67 (imp.)
RF
1 20 10.00 13.25 11.86 11.72 8780 10600 1820 1.21 8700 9488 788 1.09
Pearl millet Improved variety + ICM using variety HHB-67 (imp.)
RF
1 25 10.00 11.29 7.84 44.01 9241 21062 11821 2.28 7845 16883 9038 2.15
Pearl millet Improved variety + INM using varieties - RHB-121 and RHB173
RF
1 25 10.00 23.35 17.86 30.74 16903
27200 10297 1.61 14807 21560 6753 1.46
Pearl millet Improved variety + IPM and INM using varieties - HHB-67 (imp.) and CZP-9802
RF
1 75 30.00 11.79 7.86 50.04 4200 11790 7590 2.81 3700 7860 4160 2.12
Pearl millet Improved variety + Production technology using varieties - HHB-67 (imp.), HHB-67, Pioneer-86M86 and Proagro-9444
RF
2 75 40.00 17.43 13.92 26.33 7300 16194 8894 2.22 6450 12915 6465 2.00
Zonal Project Directorate, Zone-VI

ANNUAL REPORT 2011-12
Category and Crop
Name of the technology
demonstrated
FS No. of
KVKs
No. of Farme
r
Area(ha)
Yield (q/ha) % change in yield
*Economics of demonstration (Rs./ha)
*Economics of check(Rs./ha)
Demonsration
Check GrossCost
GrossReturn
Net Return
**BCR
GrossCost
GrossReturn
Net Return
**BCR
Rajgira (Grain amaranthus)
Improved variety + Fertilizer management using varieties – Swarna and GA-2
IR 1 14 7.00 13.47 10.00 34.70 16800
40300 23500 2.40 14000 30000 16000 2.14
Total 17 496 232.20GujaratKang (Foxtail Millet)
Improved variety using variety - Local
RF
1 17 8.00 7.20 4.70 53.19 7753 10080 2327 1.30 4600 7050 2450 1.53
Nagli (Finger millet)
Improved variety using variety Gujarat Nagli-4
RF
1 20 4.00 18.00 15.20 18.42 14190
27000 12810 1.90 13445 22800 9355 1.70
Nagli red (Finger millet)
Improved variety + Production technology using variety GN-4
RF
1 59 11.80 14.00 8.84 58.37 7475 21000 13525 2.81 6770 13260 6490 1.96
Nagli white (Finger millet)
Improved variety + Production technology using variety GN-5
RF
1 8 1.60 13.30 8.84 50.45 7475 18260 10785 2.44 6770 12376 5606 1.83
Pearl millet Fertilizer management using variety GHB-526
IR 1 20 5.00 41.90 35.70 17.37 16300
39805 23505 2.44 15900 33915 18015 2.13
Pearl millet ICM using variety GHB-558
IR 1 20 5.00 9.13 10.60 -13.87 9005 21702 12697 2.41 9285 25175 15890 2.71
Pearl millet Production technology using variety GHB-538
IR 1 20 8.00 11.08 18.36 -39.65 2650 10249 7599 3.87 3742 16983 13241 4.54
Pearl millet Improved variety using varieties - GHB-538 and GHD-744
IR 2 40 16.00 27.13 23.58 14.40 9530 36588 27058 3.84 10040 31683 21643 3.16
Pearl millet Improved variety using varieties - GHB-538 and GHB-744
RF
4 73 29.00 24.15 22.02 10.52 12022
27206 15184 2.26 11264 24874 13610 2.21
Pearl millet Improved variety + Fertilizer management using variety GHB-744
RF
1 10 4.00 23.02 18.84 22.19 14550
36450 21900 2.51 13975 29647 15672 2.12
Pearl millet Improved variety + ICM using variety GHB-538
RF
1 20 8.00 11.42 9.64 18.46 14980
19555 4575 1.31 13175 16010 2835 1.22
Zonal Project Directorate, Zone-VI

ANNUAL REPORT 2011-12
Category and Crop
Name of the technology
demonstrated
FS No. of
KVKs
No. of Farme
r
Area(ha)
Yield (q/ha) % change in yield
*Economics of demonstration (Rs./ha)
*Economics of check(Rs./ha)
Demonsration
Check GrossCost
GrossReturn
Net Return
**BCR
GrossCost
GrossReturn
Net Return
**BCR
Vari (Proso millet)
Improved variety + Production technology using variety GV-2
RF
1 65 14.00 15.54 12.83 21.12 7378 25434 18056 3.45 6890 19800 12910 2.87
Total 16 372 114.40Grand Total 33 868 346.60VegetablesRajasthanBitter gourd Improved variety
using varieties - MBTH-101and US-6214
IR 1 12 1.15 91.09 82.57 10.33 84513
541135 456622 6.40 87900 519700 431800 5.91
Bottle gourd Improved variety WaradWarad
IR 1 18 1.95 223.31 200.92 11.14 58800
154050 95250 2.62 54816 127377 72561 2.32
Brinjal Nutrient management using variety HB-Ananya
IR 1 20 5.00 314.00 242.00 29.75 41200
144000 102800 3.50 39600 114600 75000 2.89
Brinjal Improved variety Indian-540
IR 1 4 1.00 360.00 302.00 19.21 41200
144000 102800 3.50 39600 114600 75000 2.89
Cabbage Improved variety Super express
IR 1 5 1.00 300.00 258.00 16.28 22950
135000 112050 5.88 21240 116100 94860 5.47
Carrot Improved variety Desi Red
IR 1 10 1.00 253.70 221.00 14.80 40000
101480 61480 2.54 37000 88400 51400 2.39
Cauliflower Improved variety using varieties - PSBK-1, Karkie and Snow Ball-16
IR 4 31 5.40 222.69 193.15 16.12 37722
132117 94394 3.50 34222 99722 65500 2.91
Chilli Improved variety using varieties – Sitara, Bharti (Nunhems) and Pusa jwala
IR 3 50 6.35 130.17 108.17 23.20 34907
122602 203046 3.51 33664 94293 145709 2.80
Coriander (leaves)
Nutrient management using variety Kasturi
IR 1 4 0.40 190.50 179.00 6.42 17600
50220 32620 2.85 16850 43980 27130 2.61
Kachra Improved variety AHS-82
RF
1 15 2.00 190.00 160.00 18.75 21500
72700 51200 3.38 20600 44950 24350 2.18
Kachri Improved variety AHK-119
RF
1 15 2.00 85.00 65.00 30.77 20100
62300 42200 3.10 19300 37315 18015 1.93
Okra Nutrient management using variety Arka anamika
IR 1 20 5.00 91.00 84.00 8.33 62600
143940 81340 2.30 46500 97500 51000 2.10
Zonal Project Directorate, Zone-VI

ANNUAL REPORT 2011-12
Category and Crop
Name of the technology
demonstrated
FS No. of
KVKs
No. of Farme
r
Area(ha)
Yield (q/ha) % change in yield
*Economics of demonstration (Rs./ha)
*Economics of check(Rs./ha)
Demonsration
Check GrossCost
GrossReturn
Net Return
**BCR
GrossCost
GrossReturn
Net Return
**BCR
Okra Production technology using variety Arka anamika
IR 1 20 5.00 84.30 80.30 4.98 25381
67840 42459 2.67 24280 64240 39960 2.65
Okra Improved variety using varieties - Indian-9821, Mahyco-10, Arka Anamika and Aprajita
IR 4 46 7.10 84.29 71.69 16.94 46783
133289 89038 2.85 36190 92697 56507 2.56
Okra Improved variety + seed priming + Production technology using variety Arka anamika
IR 1 20 2.00 39.20 33.00 18.79 37000
189500 152500 5.12 31000 146700 115700 4.73
Okra Zaid Improved variety using variety OH-597
IR 1 11 1.00 153.20 111.35 37.58 32500
153200 120700 4.71 26500 111350 84850 4.20
Onion Production technology using variety RO-1
IR 1 47 4.70 315.00 280.00 12.50 45000
140000 95000 3.11 38000 84000 46000 2.21
Onion Improved variety using varieties - N-53, Agri Found Dark Red, Nasik red and AFDR
IR 7 120 19.50 296.19 251.35 18.50 53155
122621 69465 2.31 49948 115170 65223 2.31
Onion Improved variety + seed priming + Production technology using variety N-53
IR 1 50 5.00 138.50 120.00 15.42 62600
143940 81340 2.30 46500 97500 51000 2.10
Pea Nutrient management using variety Azad P-1
IR 1 12 5.00 99.00 91.00 8.79 37490
188620 151130 5.03 126292 128070 1778 1.01
Pea Improved variety using variety GS-10
IR 1 14 2.00 95.00 82.80 14.73 22000
114180 92180 5.19 19800 82800 63000 4.18
Ridge gourd Improved variety using variety Latika
IR 1 1 0.05 106.00 95.00 11.58 58800
154050 95250 2.62 54816 127377 72561 2.32
Tomato Nutrient management using variety HB-505
IR 1 20 5.00 258.00 211.00 22.27 45600
150000 104400 3.29 40000 115000 75000 2.88
Tomato Improved variety using varieties - MUM-9502 and Dev (Nuhems)
IR 2 20 4.40 510.82 470.41 9.32 38955
180523 141568 4.63 33045 139495 106450 4.22
Zonal Project Directorate, Zone-VI

ANNUAL REPORT 2011-12
Category and Crop
Name of the technology
demonstrated
FS No. of
KVKs
No. of Farme
r
Area(ha)
Yield (q/ha) % change in yield
*Economics of demonstration (Rs./ha)
*Economics of check(Rs./ha)
Demonsration
Check GrossCost
GrossReturn
Net Return
**BCR
GrossCost
GrossReturn
Net Return
**BCR
Watermelon Improved variety using varieties - Namdhari and NS-295
IR 1 1 0.05 294.00 266.00 10.53 58800
154050 95250 2.62 54816 127377 72561 2.32
Total 40 586 93.05GujaratBitter gourd IPM using variety
Viket kohinurIR 1 24 10.00 451.11 424.50 6.27 8451
3541135 456622 6.40 87900 519700 431800 5.91
Bitter gourd Management of cucurbit fruit fly using variety ABG-1
IR 1 5 1.00 94.25 71.50 31.82 22500
56550 34050 2.51 20000 42900 22900 2.15
Bitter gourd Improved variety using variety ABG-1
IR 1 10 5.00 121.50 108.20 12.29 13000
58700 45700 4.52 12500 52350 39850 4.19
Bottle gourd Organic liquid bio-fertilizer using varieties - PSB variety Azo.
RF
1 24 5.00 308.10 283.10 8.83 58800
154050 95250 2.62 54816 127377 72561 2.32
Bottle gourd Improved variety using variety Varad
IR 1 25 5.00 311.90 248.10 25.72 62500
155980 93480 2.50 55000 111681 56681 2.03
Brinjal Bioagent:Wota T-Trap for control of brinjal fruit & shoot borer using variety Cutia
IR 1 5 2.00 278.40 224.30 24.12 21245
107869 86624 5.08 20147 89720 69573 4.45
Brinjal INM- foliar spray of urea using variety Nilesh
IR 1 20 5.00 390.00 320.00 21.88 76000
429000 353000 5.64 88000 352000 264000 4.00
Brinjal IPM using variety Dolly
IR 1 41 15.73 115.66 108.42 6.48 28986
55267 26282 1.91 29976 51268 21292 1.71
Brinjal Improved variety using varieties - BR-14, Doli-5 and DPR
IR 4 50 14.00 291.68 235.86 25.50 32632
147636 115004 4.52 63804 107804 44001 1.69
Cabbage INM- foliar spray of urea using variety CH-21
IR 1 20 5.00 510.00 460.00 10.87 46000
204000 158000 4.43 52000 184000 132000 3.54
Chilli INM -Micronutirient Grade V using variety GVC-111
IR 1 10 5.00 105.50 87.00 21.26 42784
145063 102279 3.39 35500 119625 84125 3.37
Chilli Management of Chilli thrips using variety GVC-111
IR 1 10 2.00 128.13 80.30 59.56 40775
102500 61725 2.51 39600 64240 24640 1.62
Chilli Improved variety using varieties - H-1 and Sitara
IR 3 23 8.00 128.81 104.06 24.19 46563
140681 94119 3.02 43500 114122 70622 2.62
Zonal Project Directorate, Zone-VI

ANNUAL REPORT 2011-12
Category and Crop
Name of the technology
demonstrated
FS No. of
KVKs
No. of Farme
r
Area(ha)
Yield (q/ha) % change in yield
*Economics of demonstration (Rs./ha)
*Economics of check(Rs./ha)
Demonsration
Check GrossCost
GrossReturn
Net Return
**BCR
GrossCost
GrossReturn
Net Return
**BCR
Chilli Improved variety + ICM using variety GVC-111
IR 1 5 2.00 96.00 85.00 12.94 42144
132000 89856 3.13 40500 116875 76375 2.89
Elephant foot Fertilizer management using variety - Local
IR 1 28 7.00 34398 31487 9.25 85960
302230 216270 3.52 72960 263400 190440 3.61
Elephant foot Improved variety using variety Gajendra
IR 1 15 1.10 4680.64 3664.36 52.49 26034
85005 58970 3.27 22133 64891 42758 2.93
Okra Management YVM virus using variety GO-2
IR 1 10 2.00 58.68 49.50 18.55 18465
41076 22611 2.22 17625 34650 17025 1.97
Okra Improved variety using variety GO-2
IR 2 14 4.50 82.39 68.67 19.51 22333
72292 49959 3.24 21111 60320 39208 2.86
Okra Improved variety + ICM using variety - GO-2
IR 1 5 2.00 63.50 52.00 22.12 41649
76200 34551 1.83 36200 62400 26200 1.72
Onion Improved variety using variety Agri Found Light Red
IR 1 12 5.00 265.50 203.00 30.79 19840
81300 61460 4.10 23930 60900 36970 2.54
Tomato Bioagent: NPV using variety -Own seed
RF
1 5 1.00 111.40 102.30 8.90 17270
111400 94130 6.45 10240 16360 6120 2.00
Tomato INM using variety - GT-2
IR 1 5 2.00 304.00 297.40 2.22 28000
136620 108620 4.88 27000 115290 88290 4.27
Tomato IPM-Leaf curl and leaf blight using variety - Alankar
IR 1 10 4.00 250.00 210.00 19.05 37000
189500 152500 5.12 31000 146700 115700 4.73
Tomato Improved variety using variety - Gujarat Tomato-2
IR 1 5 2.50 196.40 152.50 28.79 38900
108020 69120 2.78 37200 86900 49700 2.34
Tomato Improved variety + ICM using variety - AT-3
IR 1 2 1.00 285.80 252.00 13.41 46760
328613 281853 7.03 45000 289800 244800 6.44
Total 31 383 116.83Grand Total 71 969 209.88FruitsRajasthanPapaya Improved variety
using variety - Red lady
RF
1 5 1.00 980.00 840.00 16.67 60000
588000 528000 9.80 56000 336000 280000 6.00
Total 1 5 1.00GujaratAonla INM using varieties
- Anand-2 and NA-7IR 1 10 5.00 70.20 62.40 12.50 9500 105300 95800 11.08 8200 74880 66680 9.13
Zonal Project Directorate, Zone-VI

ANNUAL REPORT 2011-12
Category and Crop
Name of the technology
demonstrated
FS No. of
KVKs
No. of Farme
r
Area(ha)
Yield (q/ha) % change in yield
*Economics of demonstration (Rs./ha)
*Economics of check(Rs./ha)
Demonsration
Check GrossCost
GrossReturn
Net Return
**BCR
GrossCost
GrossReturn
Net Return
**BCR
Ber ICM using variety Umran
RF
1 10 5.00 107.30 97.50 10.05 16550
53650 37100 3.24 14800 48750 33950 3.29
Mango Management of powdery mildew using variety Kesar
IR 1 12 5.00 72.65 69.00 5.29 16680
108990 92310 6.53 19760 103500 83740 5.24
Total 3 32 15.00Grand Total 4 37 16.00Spices & CondimentsRajasthanCoriander Improved variety
using varieties - CS-6 and RCR-436
IR 3 114 57.50 11.20 9.78 15.04 18223
62284 44061 3.42 20396 53656 33260 2.63
Cumin Organic farming using variety - RZ-223
IR 1 30 15.00 7.56 5.80 30.34 31200
89375 58175 2.86 30280 60000 29720 1.98
Cumin Improved variety using variety - GC-4
IR 1 15 6.00 7.07 5.80 21.90 9086 11682 2596 1.29 8364 9350 986 1.12
Cumin Improved variety + ICM +seed treatment using variety - RZ-19
IR 1 30 12.00 5.15 4.29 20.05 17100
77250 60150 4.52 15200 64350 49150 4.23
Fennel Improved variety + ICM +seed treatment using variety - RF-125
IR 2 65 11.00 11.81 9.77 20.52 20893
69809 48916 3.34 20387 58409 38022 2.86
Fenugreek Production technology using variety - RMT-1
IR 1 37 14.80 17.50 15.00 16.67 7500 40000 32500 5.33 6500 34000 27500 5.23
Fenugreek Improved variety using varieties - RMT-1 and Hisar Sonali
IR 3 36 13.00 15.77 12.23 31.51 11909
44077 32168 3.70 11371 34100 22729 3.00
Isabgol Improved variety + ICM +seed treatment using variety - RI-89
IR 2 45 19.00 10.74 8.46 30.36 13401
50943 37542 3.80 11706 41889 30183 3.58
Total 14 372 148.30GujaratCoriander Improved variety +
Production technology using variety - GC- 2
IR 1 10 4.00 17.90 16.15 10.84 18630
53640 35010 2.88 21465 48450 26985 2.26
Zonal Project Directorate, Zone-VI
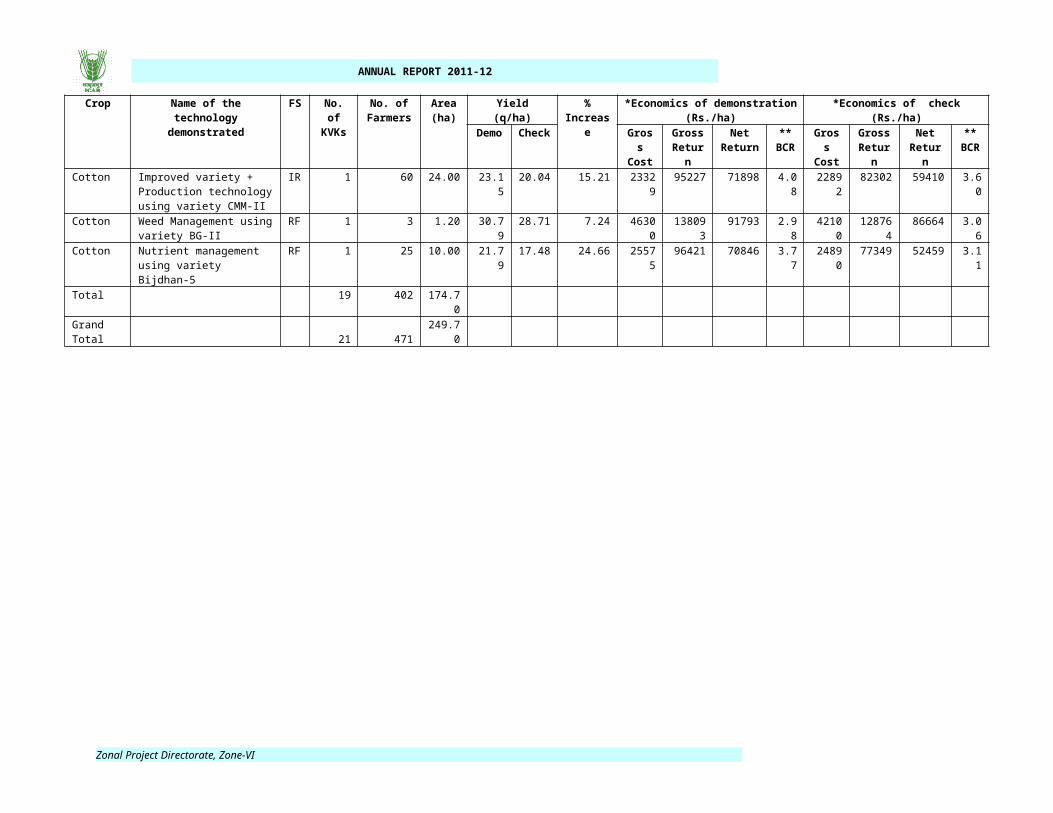
ANNUAL REPORT 2011-12
Category and Crop
Name of the technology
demonstrated
FS No. of
KVKs
No. of Farme
r
Area(ha)
Yield (q/ha) % change in yield
*Economics of demonstration (Rs./ha)
*Economics of check(Rs./ha)
Demonsration
Check GrossCost
GrossReturn
Net Return
**BCR
GrossCost
GrossReturn
Net Return
**BCR
Cumin Land configuration using variety - GC-4
IR 1 10 5.00 7.60 7.00 8.57 17780
85120 67340 4.79 16580 78400 61820 4.73
Cumin Improved variety using variety - GC-4
IR 5 70 28.00 7.13 6.36 12.20 15727
91235 75508 5.80 15286 81114 65828 5.31
Cumin Improved variety + ICM using variety - GC-4
IR 1 38 15.00 9.34 7.47 25.03 25060
103410 78350 4.13 24004 80246 56243 3.34
Cumin Improved variety + Production technology using variety –GC-4
IR 1 20 8.00 7.09 6.21 14.17 14900
85080 70180 5.71 15150 74520 59370 4.92
Fennel Improved variety using variety - G-11
IR 2 22 10.00 18.25 15.45 17.96 31275
124550 93275 3.98 30500 104900 74400 3.44
Isabgol Improved variety + ICM using variety - GI-3
IR 1 10 5.00 8.74 7.44 17.47 21318
39549 18230 1.86 21407 33182 11775 1.55
Total 12 180 75.00Grand Total 26 552 223.30Commercial CropsGujaratTurmeric Improved variety
using varieties – Sugandham and NAUT-1
RF
1 13 1.30 247.81 208.00 19.14 17600
50728 33128 2.88 16850 43980 27130 2.61
Sugarcane Improved variety using variety - Co-N 5072
IR 1 10 1.00 954.00 845.00 12.90 52259
190800 138541 3.65 54980 169000 114020 3.07
Total 2 23 2.30Grand Total 2 23 2.30Fodder CropsRajasthanBerseem Improved variety
using varieties - APBN-1and Mascavi
IR 2 105 7.95 571.08 418.08 35.62 10839
52475 41636 4.84 9401 43650 34248 4.64
Berseem Improved variety + Production technology using variety - JB-1
IR 1 10 1.00 547.50 454.90 20.36 10000
54750 44750 5.48 9000 45490 36490 5.05
Lucerne Production technology using variety - T-9
IR 1 32 1.60 759.06 500.00 51.81 31500
80380 48880 2.55 28100 49600 21500 1.77
Oat Improved variety using variety - Kent
IR 2 65 5.75 396.83 348.13 15.83 13833
50621 36788 3.66 12255 42737 30482 3.49
Zonal Project Directorate, Zone-VI
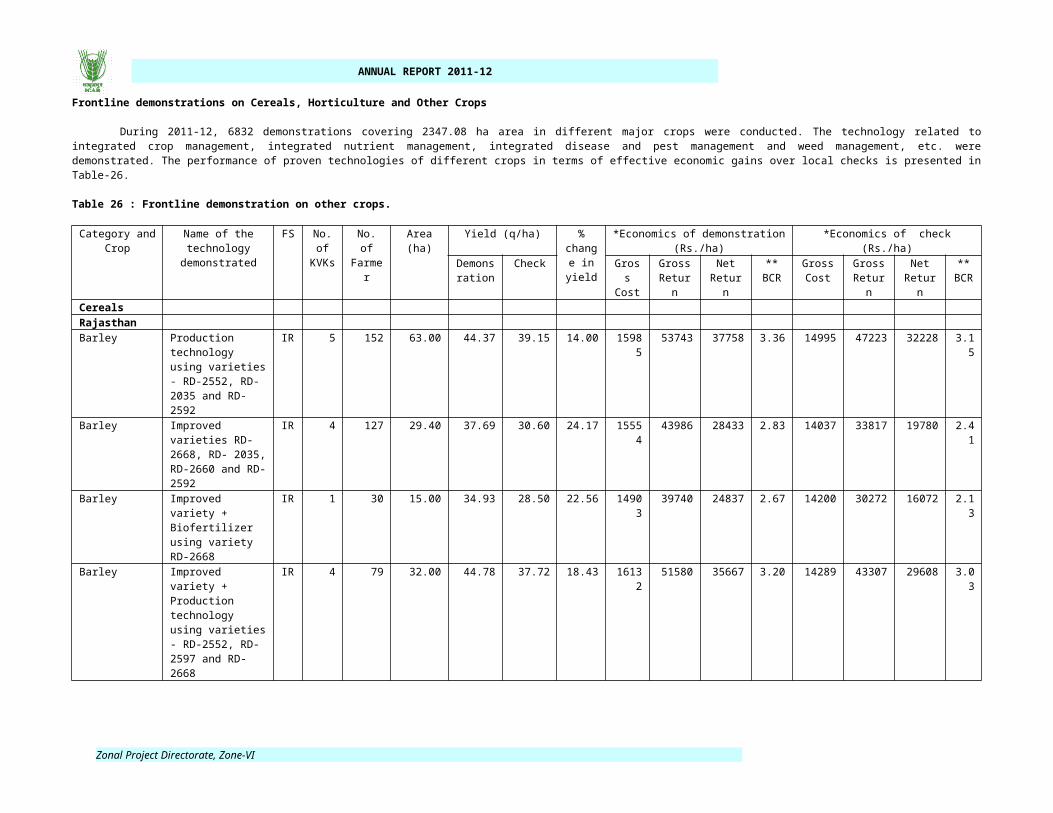
ANNUAL REPORT 2011-12
Category and Crop
Name of the technology
demonstrated
FS No. of
KVKs
No. of Farme
r
Area(ha)
Yield (q/ha) % change in yield
*Economics of demonstration (Rs./ha)
*Economics of check(Rs./ha)
Demonsration
Check GrossCost
GrossReturn
Net Return
**BCR
GrossCost
GrossReturn
Net Return
**BCR
Sorghum Production technology using variety - CSV-15
IR 1 42 10.00 60.00 45.00 33.33 5010 14130 9120 2.82 4830 9076 4246 1.88
Sorghum Improved variety using variety - SSG-1755
IR 3 88 10.95 447.70 252.06 73.93 17065
50249 33184 2.94 12133 30374 18241 2.50
Total 10 342 37.25GujaratChinese cabbage
Production technology using variety - Desi
IR 1 15 1.50 265.00 200.00 32.50 15180
26500 11320 1.75 13725 20000 6275 1.46
Hybrid napier Production technology using varieties- Co-3 and APBN-1
IR 2 27 5.50 914.21 326.36 188.23 42155
134313 92158 3.19 17336 46727 29391 2.70
Lucerne Improved variety using variety - Anand -2
IR 1 21 5.00 401.19 248.76 61.28 31500
80380 48880 2.55 28100 49600 21500 1.77
Oat Production technology using variety - Kent
IR 2 40 4.00 417.50 315.00 33.70 15985
46596 30611 2.92 14625 34900 20275 2.39
Pearl millet Improved variety using variety - GFB-1
IR 2 37 3.70 419.14 332.16 31.34 15634
42077 26443 2.69 16411 33216 16805 2.02
Sorghum Improved variety using varieties - PC-23 and MP Chari
IR 2 18 1.80 405.00 316.67 27.96 13922
49062 35139 3.52 13989 38793 24804 2.77
Total 10 158 21.50Grand Total 20 500 58.75FlowersGujaratChrysanthemum
ICM using variety - Local
IR 1 4 1.00 200.25 165.50 21.00 50719
410513 359794 8.09 42600 339275 296675 7.96
Gailardia ICM using variety - Lorenziana
IR 1 4 1.00 147.50 122.00 20.90 44343
258125 213782 5.82 42600 213500 170900 5.01
Marigold Improved variety using variety - African giant
RF
1 26 2.00 14.80 9.70 52.58 5760 19240 13480 3.34 4530 9700 5170 2.14
Total 3 34 4.00Grand Total 3 34 4.00Other CropsRajasthanCluster bean ICM using variety -
HG 2-02IR 1 10 5.00 13.80 11.60 18.97 1191
469000 57086 5.79 11386 58000 46614 5.09
Zonal Project Directorate, Zone-VI
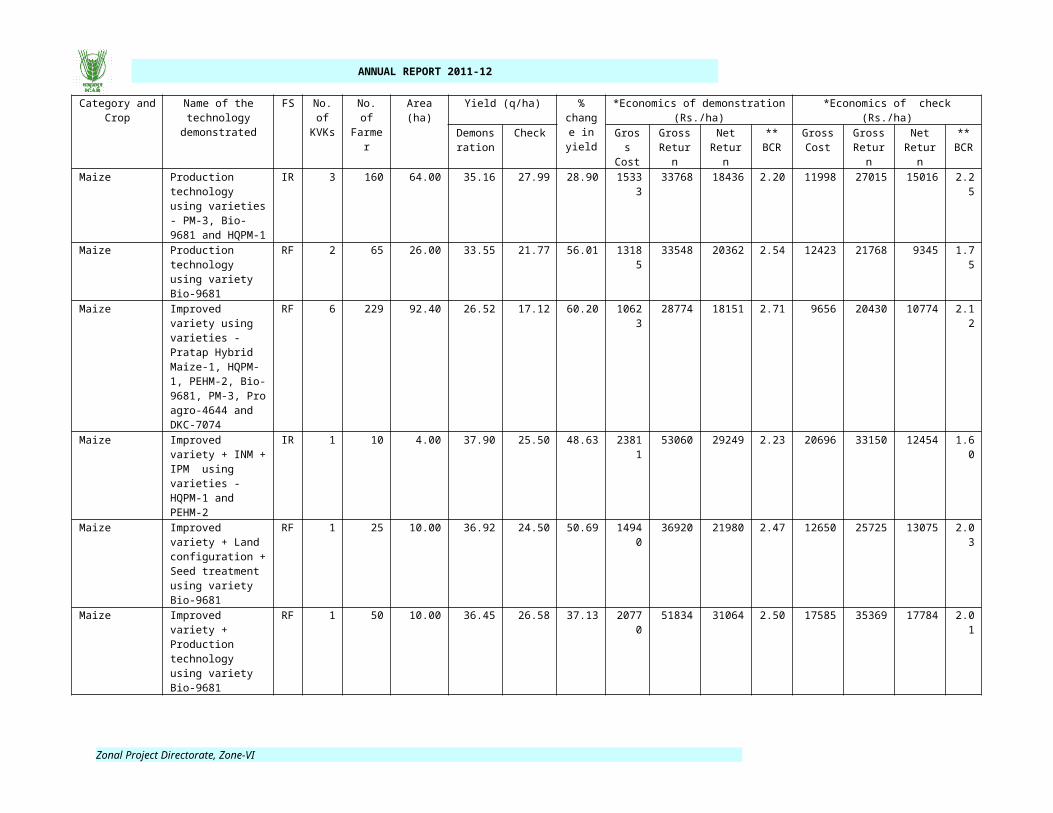
ANNUAL REPORT 2011-12
Category and Crop
Name of the technology
demonstrated
FS No. of
KVKs
No. of Farme
r
Area(ha)
Yield (q/ha) % change in yield
*Economics of demonstration (Rs./ha)
*Economics of check(Rs./ha)
Demonsration
Check GrossCost
GrossReturn
Net Return
**BCR
GrossCost
GrossReturn
Net Return
**BCR
Cluster bean Production technology using varieties - RGC-1066 and RGC-936
IR 2 52 23.00 11.19 9.09 22.69 6565 54089 47523 8.24 5800 44422 38622 7.66
Cluster bean Production technology using variety - RGC-1003
RF
1 30 10.00 18.76 15.90 17.99 12800
115374 102574 9.01 11400 97785 86385 8.58
Cluster bean Improved variety using variety - RGC-936
IR 1 40 20.00 10.26 8.98 14.25 11590
46170 34580 3.98 11410 40410 29000 3.54
Cluster bean Improved variety using varieties - RGC-1017, RGC-1002, RGC-1003, RGM-112 and RGC-1066
RF
5 157 63.75 11.61 9.55 22.25 12089
44489 32400 3.68 11096 36649 25553 3.30
Cluster bean Improved variety + Biofertilizer using varieties - RGM-1017 and RGM-112
RF
1 48 20.00 8.60 6.65 29.36 16425
75551 59126 4.60 15150 54900 39750 3.62
Cluster bean Improved variety + ICM + Seed treatment using variety - RGC-936
IR 1 30 12.00 7.32 5.15 42.14 9145 32934 23789 3.60 7640 23160 15520 3.03
Cluster bean Improved variety + IPM + INM using variety - RGC-1017
RF
1 50 20.00 5.05 3.29 53.50 2700 17675 14975 6.55 2000 11575 9575 5.79
Total 13 417 173.75Grand Total 13 417 173.75
Front line demonstrations on livestock, fisheries, farm implements, women empowerment and hybrids
Front line demonstrations on livestock, fisheries, farm implements, women empowerment and hybrids conducted by KVKs of Zone-VI are given in tables 27-31.
Table 27 : Performance of front line demonstrations on livestock
Category/KVK
Name of the technology
demonstrated
No. of
KVKs
No. of Farme
r
No.of
units
Major parameters % change in
major paramete
r
Other parameter *Economics of demonstration (Rs.)
*Economics of check(Rs.)
Demonsration Check Demons
rationChec
k
Gross
Cost
GrossRetur
n
Net Retur
n
**BCR
Gross
Cost
GrossRetur
n
Net Retur
n
**BCR
Anand
Cow
Bypass fat & Mineral mixture by KVK - Anand
1
20 20Milk
yield/day - 9.7
9.1 6.6 Fat %-4.9% 4.2%
5125 5875 750 1.15 4200 4724 524 1.12
Zonal Project Directorate, Zone-VI
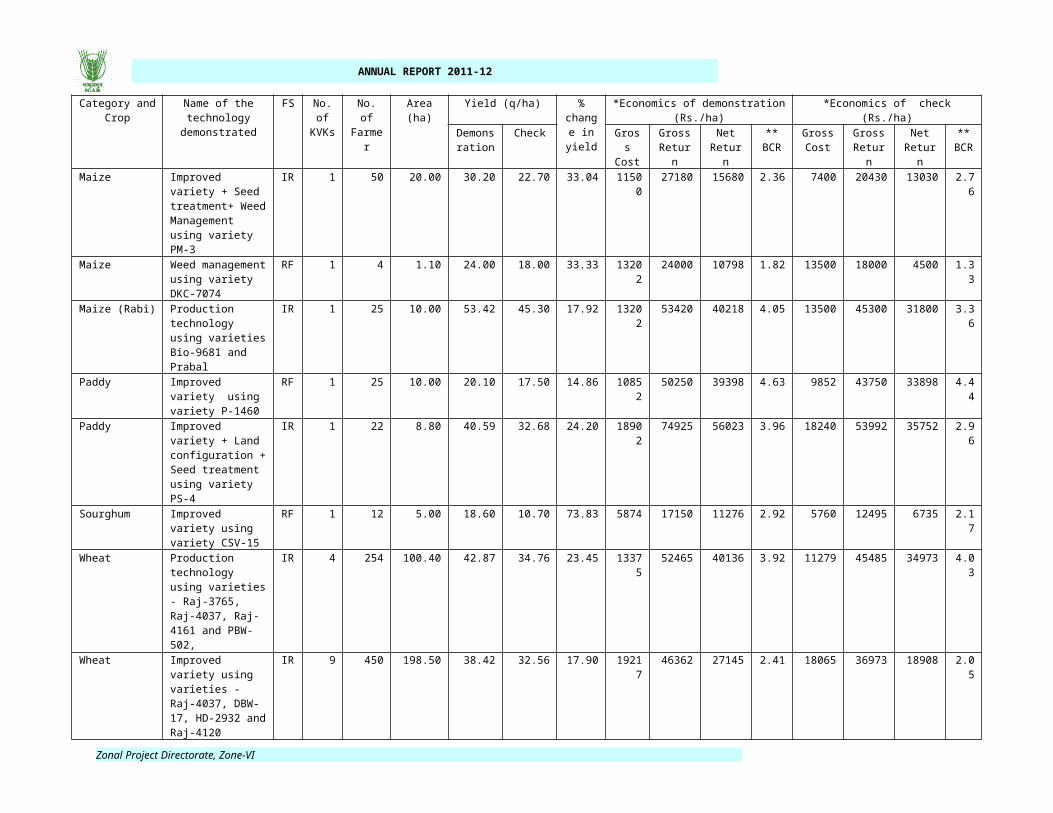
ANNUAL REPORT 2011-12
Category/KVK
Name of the technology
demonstrated
No. of
KVKs
No. of Farme
r
No.of
units
Major parameters % change in
major paramete
r
Other parameter *Economics of demonstration (Rs.)
*Economics of check(Rs.)
Demonsration Check Demons
rationChec
k
Gross
Cost
GrossRetur
n
Net Retur
n
**BCR
Gross
Cost
GrossRetur
n
Net Retur
n
**BCR
Mehsana
BuffaloUrea treatment on wheat straw
1
10 10 Avg. milk yield lit par day-7.90
Avg. milk yield lit par day-6.90
14.49 - - 49665
66360 16695 1.33 45995
57960 11965 1.26
Buffalo
KMno4 1
10 10 Avg. milk yield lit par day-6.76
Avg. milk yield lit par day-6.06
11.55 - - 47140
56784 9644 1.20 45995
50400 4405 1.10
BuffaloMineral Mixture 1
30 30 Avg. milk yield lit par day-8.07
Avg. milk yield lit par day-6.60
21.21 - - 47455
67200 19745 1.41 45995
55440 9445 1.20
Buffalo
Manger 1
10 10 Avg. milk yield lit par day-7.80
Avg. milk yield lit par day-6.70
16.42 - - 51240
70200 18960 1.37 45870
57420 11550 1.25
Narmada
Crossedbread COW
Urea treatment on Paddystraw
110 10 Milk Yield - 14.01 - - 2450
034200 9700 1:1.4
02200
028600 6600 1:1.3
COWs (HF)KMNO4 1
10 20 Mastitis 3 15 Infestation of
mastitis
- 24170
30600 6430 1:1.27
25600
29400 3800 1:1.15
Buffalo
Mineral Mixture 1
20 20 Service period(days
)114
Service period(days
)142
19.71 % -- -- 22300
29900 7600 1:1.34
25300
26100 800 1:1.03
Sheep and goat
Concentrate feed to kid
1 10 20 Body weight (kg)
-26.90
Body weight (kg)
-21.59
24.59% -- -- 800 1650 850 1:2.06
600 1050 450 1:1.75
Tapi
BuffaloUrea treatment to paddy straw
120 20 Avg. milk
yield lit per day
Avg. milk yield lit per
day
18.86 % -- -- 98 186.52
88.52 1:1.90
90 156.92
66.92 1:1.74
5.829(32 Rs./lit)
4.904(32 Rs./lit)
Dangs
Cow
Nutrient management: -Feeding of Mineral mixture
1
20 20 5.7 Milk yield/day
4.5 Milk yield/day
26.70% 4.5 % fat 3.9% fat
1790 5472 3682 2.05 1500 4320 2820 1.88
Zonal Project Directorate, Zone-VI

ANNUAL REPORT 2011-12
Category/KVK
Name of the technology
demonstrated
No. of
KVKs
No. of Farme
r
No.of
units
Major parameters % change in
major paramete
r
Other parameter *Economics of demonstration (Rs.)
*Economics of check(Rs.)
Demonsration Check Demons
rationChec
k
Gross
Cost
GrossRetur
n
Net Retur
n
**BCR
Gross
Cost
GrossRetur
n
Net Retur
n
**BCR
Poultry
To popularize backyard poultry farming
1
20 20 44 Birds Nil 44.0 % - - 3000 6600 3600 1.20 - - - -
Cow
Urea treatment to paddy straw (Method demonstration)
1
10 10 Avg. milk yield lit par
day-5.5
Avg. milk yield lit par
day-4.3
26.0 % 4.4 4.0 1500 3750 2250 1.50 1400 3000 1600 1.14
Total 13 200 220
Table 28 : Performance of front line demonstrations on Fisheries
Category/ State/KVK Thematic area
Name of the technology
demonstrated
No. of
KVKs
No. of Farmer
No.of units
Major parameters % change in major
parameter
Other parameter *Economics of demonstration (Rs.)
*Economics of check(Rs.)
Demonsration Check Demons
ration Check GrossCost
GrossReturn
Net Return
**BCR
GrossCost
GrossReturn
Net Return
**BCR
Common carps Gujarat/ Anand
Indian Major CarpsComposite
fish culture
Composite fish culture (pen culture) by KVK Anand
1 1 1 1.15 qtl/ha
0.98 53.06 - - 27000 97500 70500 3.61 22000 63375 41375 2.88
Grass Carp Composite fish culture
Composite fish culture by KVK Anand
1 1 1 1.8 1.3 38.46 32000 91000 59000 2.84 25000 65000 40000 2.60
Total 1 2 2
Table 29 : Women empowerment (drudgery reduction and child nutrition)Category/KVK Name of technology No. of KVKs No. of demonstrations Name of observations Demonstration CheckWomenMehsanaOther women Reduction of drudgery by
using wheel hoe for weeding1 10 Labour saving 70.83 %time reduced manually
Other women Renewable source of energy 1 5 Fuel consumption 16.1 Kg/ 6 month 33.1 Kg/ 6 monthOther women Nutritional Management 1 10 Yield in Kg 94 Kg ---PorbandarFarm Women Renewable energy source:
Solar cooker1 10 1.Cost Saving of cost
Rs. 45/month/member2.energy Saving of energy
45% energy savingBanswaraTribal Family Nutrition
Nutri Garden 1 177 Family Consuption per day 350 gm/per day/ family 100 gm/per day/ family
Zonal Project Directorate, Zone-VI

ANNUAL REPORT 2011-12
Introduction of NAVEEV Sickle for paddy harvesting by KVK Banswara
1 20 1. Labour saving 28.12 % in labour saved traditional sickle
Total 6 232
Table 30 : Tillage and sowing operationsState
District
Name of equipment
Traditional/ Existing practice
Traditional Practice Improved equipment practice
Capacity/Output (ha/hr) Man hour/haCost of operation(Rs./ha)
Capacity/Output (ha/hr)
Man hour/ha
Cost of operation(Rs./ ha)
Gujarat Porbandar Rotavator Cultivating- Harrowing- Clod breaking
0.05 7 3800 0.20 3 2450
Gujarat Porbandar Shredder Buring the cotton stalk - - - 0.20 8 925Gujarat Rajkot Manual drawn
automatic seed drill
Manual planting 0.125 8 960 0.20 5 600
Gujarat Rajkot Tractor drawn automatic seed-cum-fertilizer drill
Bullock drawn indigenous seed drill
0.10 10 1000 0.50 2 600
Gujarat Rajkot Royavator 1) Uprooting of cotton stalk and burning
2) Two operation for tillage by plough/harrow
1) 0.08
2) 0.20
1) 12
2) 5
1) 1440
2) 2000
0.40 3 2000
Gujarat Rajkot Mobile chopper/shredder
1) Uprooting of cotton stalk and burning
2) Two operation for tillage by plough/harrow
1) 0.08
2) 0.20
1) 12
2) 5
1) 1440
2) 2000
0.40 3 2000
Gujarat Rajkot Cotton stalk Shredder
Burning the cotton stalk - - - 0.25 8 800
Zonal Project Directorate, Zone-VI
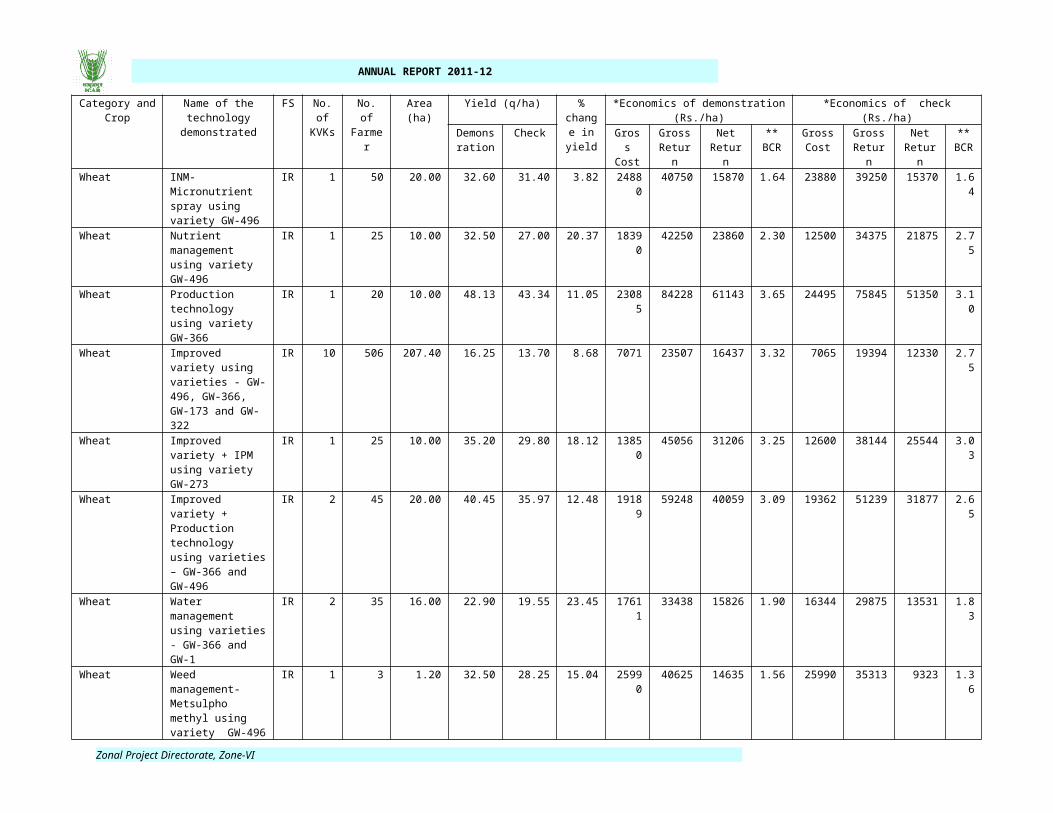
ANNUAL REPORT 2011-12
TABLE 31 : DEMONSTRATION DETAILS ON CROP HYBRIDS
Crop Name of the Hybrid No. offarmers
Area(ha)
Yield (kg/ha) / major parameter Economics (Rs./ha)
Demo Local check % change GrossCost
GrossReturn
NetReturn BCR
CerealsMaize DKC-7074 14 5.10 19.92 14.71 35.61 13594.16 19921.57 6327.41 1.47Maize HQPM-1 48 24.55 32.62 25.35 29.72 15121.82 34925.46 19803.64 2.31Maize PEHM-2 70 28.00 24.62 15.50 59.27 8429.50 30977.29 22547.79 3.67Maize PM-3 140 56.00 29.49 20.91 41.66 10883.57 27629.14 16745.57 2.54
MaizePratap hybrid maize-1 3 1.25 26.58 17.50 51.89 18500.00 29000.00 10500.00 1.57
Maize Pro agro-4644 36 10.00 25.10 11.56 117.13 13980.00 22590.00 8610.00 1.62Maize (Rabi) Prabal 15 6.00 50.70 45.30 11.92 13202.00 50700.00 37498.00 3.84Total 326 130.9
MilletsPearlmillet GHB-526 20 5.00 41.90 35.70 17.37 16300.00 39805.00 23505.00 2.44Pearlmillet GHB-538 153 60.00 20.66 19.47 5.94 11150.33 28266.32 17115.99 2.54Pearlmillet GHB-744 50 20.00 20.00 17.24 16.12 11317.60 23056.40 11738.80 2.04Pearlmillet HHB-197 25 10.00 17.50 14.25 22.81 15000.00 28000.00 13000.00 1.87Pearlmillet HHB-67 225 96.00 12.76 10.18 30.67 6905.42 13135.83 6230.42 1.90Pearlmillet Pro Agro 4444 10 5.00 22.86 19.69 16.10 8208.00 23431.00 15223.00 2.85Pearlmillet Pioneer-86M86 5 5.00 27.20 21.50 26.51 8000.00 24480.00 16480.00 3.06Pearlmillet Proagro-9444 5 5.00 28.60 22.50 27.11 8000.00 25740.00 17740.00 3.22Pearlmillet RHB-121 36 15.20 26.31 21.06 26.26 15294.08 26652.63 11358.55 1.74Pearlmillet SUN-4094 25 10.00 24.00 17.00 41.18 13000.00 22000.00 9000.00 1.69Total 554 231.2OilseedsCastor GCH-4 49 17.83 1162.52 1029.08 10.71 20415.34 65314.24 44898.90 3.20Castor GCH-5 30 8.55 2276.00 1972.00 15.42 18850.00 79660.00 60810.00 4.23Castor GCH-7 36 16.25 720.65 579.26 14.36 25063.85 65334.23 40270.38 2.61Total 115 42.63CottonCotton ADC-1 65 30.50 13.18 12.22 7.98 23437.54 51879.51 28441.97 2.21Cotton BG-II 252 110.20 27.43 24.34 152.80 37819.86 130154.60 92334.74 3.44Cotton Bijdhan-5 25 10.00 21.79 17.48 24.66 25575.00 96421.00 70846.00 3.77Cotton Bio-6488 2 50.00 25.10 22.60 11.06 14023.00 58000.00 43977.00 4.14Cotton JK-1947 67 25.00 22.50 19.50 15.38 14023.00 58000.00 43977.00 4.14
Zonal Project Directorate, Zone-VI

ANNUAL REPORT 2011-12
Crop Name of the Hybrid No. offarmers
Area(ha)
Yield (kg/ha) / major parameter Economics (Rs./ha)
Total 411 225.7VegetablesBrinjal HB-Ananya 20 5.00 314.00 242.00 29.75 41200.00 144000.00 102800.00 3.50Okra Mahyco-10 32 4.10 53.77 47.07 14.26 62600.00 143940.00 85723.90 2.30Okra Zaid OH-597 11 1.00 153.20 111.35 37.58 32500.00 153200.00 120700.00 4.71Tomato Alankar 10 4.00 250.00 210.00 19.05 37000.00 189500.00 152500.00 5.12Tomato AT-3 2 1.00 285.80 252.00 13.41 46760.00 328612.50 281852.50 7.03Tomato GT-2 10 4.50 244.22 216.90 16.98 34055.56 120731.11 86675.56 3.55Tomato MUM-9502 4 1.00 364.00 312.00 16.67 45600.00 150000.00 104400.00 3.29Total 89 20.6
Zonal Project Directorate, Zone-VI
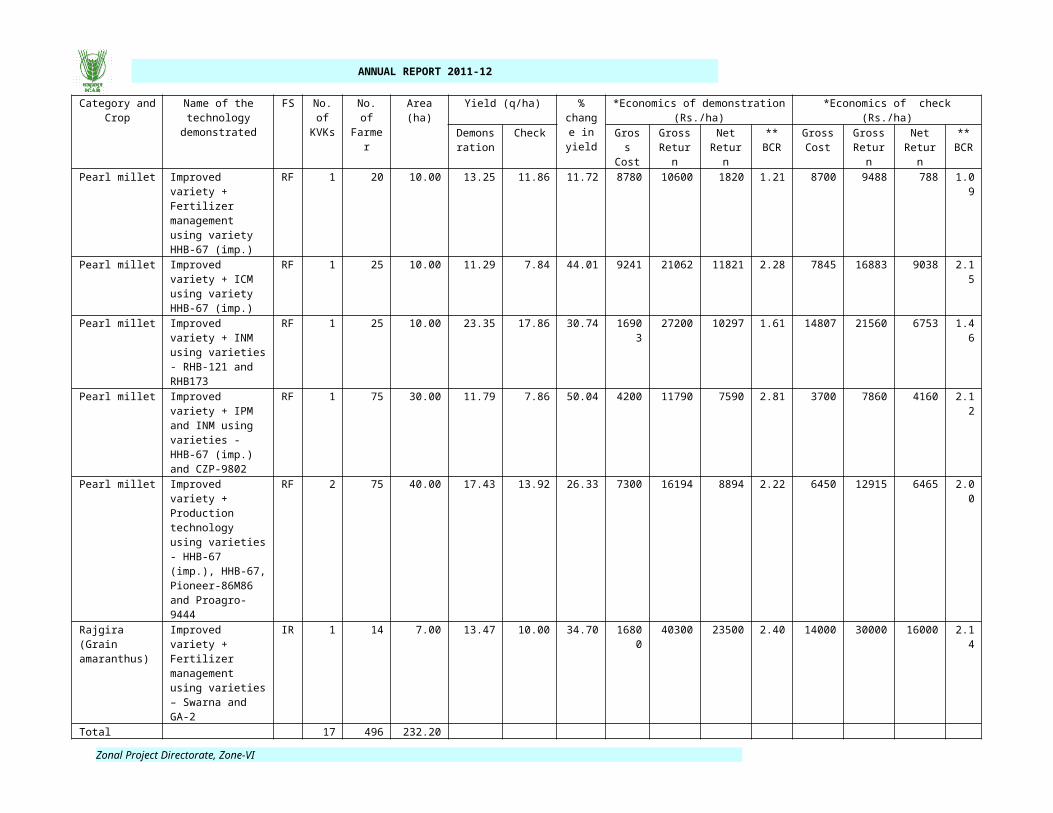
ANNUAL REPORT 2011-12
11. TRAINING ACHIEVEMENTS
The Krishi Vigyan Kendra is an innovative science based institution which undertakes training for vocational needs of the farmers, farm women, rural youths and grass root level of extension functionaries. In total 5714 number of training courses benefiting 170869 farmers, rural youths and extension functionaries were conducted out of which 4905 courses benefited 147234 practising farmers/farm women. The participation of scheduled castes/tribes and farm women was noted as 36 per cent and 24 per cent, respectively. The training courses conducted for the rural youths and extension functionaries were 422 and 387 through which 11480 rural youths 12155 extension functionaries, respectively, got benefited. The details of trainings on different thematic areas are given in Table 32-42.
Table 32 : Farmers’ Training including sponsored training programmes (on campus)Thematic area No. of
courses
ParticipantsOthers SC/ST Grand Total
Male Female
Total Male Female
Total Male Female
Total
Weed management 41 704 76 780 319 110 429 1023 186 1209Resource conservation technologies
15 190 4 194 304 108 412 494 112 606
Cropping systems 48 801 103 904 350 39 389 1151 142 1293Crop diversification 25 478 35 513 282 0 282 760 35 795Integrated farming 84 2456 138 2594 1541 284 1825 3997 422 4419Micro Irrigation/irrigation 25 604 55 659 239 20 259 843 75 918Seed production 55 1070 54 1124 460 88 548 1530 142 1672Nursery management 26 349 85 434 306 98 404 655 183 838Integrated crop management
205 3941 41 3982 2187 372 2559 6128 413 6541
Soil & water conservation
0 0 0 0 0 0 0 0 0 0
Integrated nutrient management
0 0 0 0 0 0 0 0 0 0
Production of organic inputs
20 392 62 454 70 23 93 462 85 547
Others (fodder production)
10 79 44 123 135 9 144 214 53 267
Total 554 11064
697 11761
6193 1151 7344 17257
1848 19105
II Horticulture a) Vegetable Crops Production of low value and high volume crops
83 1163 157 1320 815 193 1008 1978 350 2328
Off-season vegetables 29 310 98 408 338 120 458 648 218 866Nursery raising 25 320 23 343 214 49 263 534 72 606Exotic vegetables 0 0 0 0 0 0 0 0 0 0Export potential vegetables
10 118 0 118 133 0 133 251 0 251
Grading and standardization
8 55 51 106 24 48 72 79 99 178
Protective cultivation 19 371 19 390 180 32 212 551 51 602Others (pl specify) 0 0 0 0 0 0 0 0 0 0Total (a) 174 2337 348 2685 1704 442 2146 4041 790 4831b) Fruits Training and pruning 5 55 0 55 38 0 38 93 0 93Layout and management of orchards
20 303 37 340 96 46 142 399 83 482
Cultivation of fruit 44 1122 73 1195 408 62 470 1530 135 1665Management of young 8 121 0 121 144 21 165 265 21 286
Zonal Project Directorate, Zone-VI

ANNUAL REPORT 2011-12
Thematic area No. of course
s
ParticipantsOthers SC/ST Grand Total
Male Female
Total Male Female
Total Male Female
Total
plants/orchardsRejuvenation of old orchards
4 86 12 98 26 10 36 112 22 134
Export potential fruits 0 0 0 0 0 0 0 0 0 0Micro irrigation systems of orchards
10 179 35 214 65 15 80 244 50 294
Plant propagation techniques
18 433 26 459 104 4 108 537 30 567
Others (pl specify) 0 0 0 0 0 0 0 0 0 0Total (b) 109 2299 183 2482 881 158 1039 3180 341 3521c) Ornamental Plants Nursery management 3 8 0 8 30 10 40 38 10 48Management of potted plants
0 0 0 0 0 0 0 0 0 0
Export potential of ornamental plants
0 0 0 0 0 0 0 0 0 0
Propagation techniques of ornamental plants
0 0 0 0 0 0 0 0 0 0
Others (pl specify) 0 0 0 0 0 0 0 0 0 0Total ( c) 3 8 0 8 30 10 40 38 10 48d) Plantation crops Production and management technology
5 103 0 103 1 0 1 104 0 104
Processing and value addition
5 45 20 65 76 61 137 121 81 202
Others (pl specify) 0 0 0 0 0 0 0 0 0 0Total (d) 10 148 20 168 77 61 138 225 81 306e) Tuber crops Production and management technology
9 204 0 204 82 0 82 286 0 286
Processing and value addition
1 40 0 40 0 0 0 40 0 40
Others (pl specify) 0 0 0 0 0 0 0 0 0 0Production and management technology
10 244 0 244 82 0 82 326 0 326
f) Spices Production and management technology
18 282 32 314 89 29 118 371 61 432
Processing and value addition
12 314 10 324 61 3 64 375 13 388
Others (pl specify) 0 0 0 0 0 0 0 0 0 0Total (f) 30 596 42 638 150 32 182 746 74 820g) Medicinal and Aromatic Plants
Nursery management 1 10 3 13 7 5 12 17 8 25Production and management technology
7 124 14 138 61 0 61 185 14 199
Post harvest technology and value addition
7 90 82 172 14 0 14 104 82 186
Others (pl specify) 0 0 0 0 0 0 0 0 0 0Total (g) 15 224 99 323 82 5 87 306 104 410
Zonal Project Directorate, Zone-VI

ANNUAL REPORT 2011-12
Thematic area No. of course
s
ParticipantsOthers SC/ST Grand Total
Male Female
Total Male Female
Total Male Female
Total
GT (a-g) 351 5856 692 6548 3006 708 3714 8862 1400 10262
III Soil Health and Fertility Management
Soil fertility management
28 426 48 474 261 7 268 687 55 742
Integrated water management
15 284 7 291 143 23 166 427 30 457
Integrated nutrient management
40 602 18 620 338 69 407 940 87 1027
Production and use of organic inputs
14 132 40 172 157 9 166 289 49 338
Management of problematic soils
11 181 10 191 78 1 79 259 11 270
Micro nutrient deficiency in crops
3 95 0 95 31 0 31 126 0 126
Nutrient use efficiency 5 77 17 94 35 0 35 112 17 129Balance use of fertilizers
10 169 40 209 52 4 56 221 44 265
Soil and water testing 0 0 0 0 0 0 0 0 0 0Others (pl specify) 0 0 0 0 0 0 0 0 0 0Total 126 1966 180 2146 1095 113 1208 3061 293 3354IV Livestock Production and Management
Dairy management 136 1666 567 2233 947 650 1597 2613 1217 3830Poultry management 7 85 6 91 82 0 82 167 6 173Piggery management 1 0 0 0 0 31 31 0 31 31Rabbit management 1 20 0 20 0 0 0 20 0 20Animal nutrition management
72 1202 218 1420 594 192 786 1796 410 2206
Disease management 37 477 151 628 245 128 373 722 279 1001Feed & fodder technology
0 0 0 0 0 0 0 0 0 0
Production of quality animal products
10 210 28 238 76 74 150 286 102 388
Others (pl specify) 0 0 0 0 0 0 0 0 0 0Total 264 3660 970 4630 1944 1075 3019 5604 2045 7649V Home Science/Women empowerment
Household food security by kitchen gardening and nutrition gardening
18 40 283 323 13 154 167 53 437 490
Design and development of low/minimum cost diet
20 5 346 351 0 143 143 5 489 494
Designing and development for high nutrient efficiency diet
11 12 140 152 6 112 118 18 252 270
Minimization of nutrient loss in processing
9 1 147 148 2 63 65 3 210 213
Processing and cooking 0 0 0 0 0 0 0 0 0 0Gender mainstreaming through SHGs
13 10 149 159 10 156 166 20 305 325
Storage loss 5 0 107 107 0 35 35 0 142 142
Zonal Project Directorate, Zone-VI
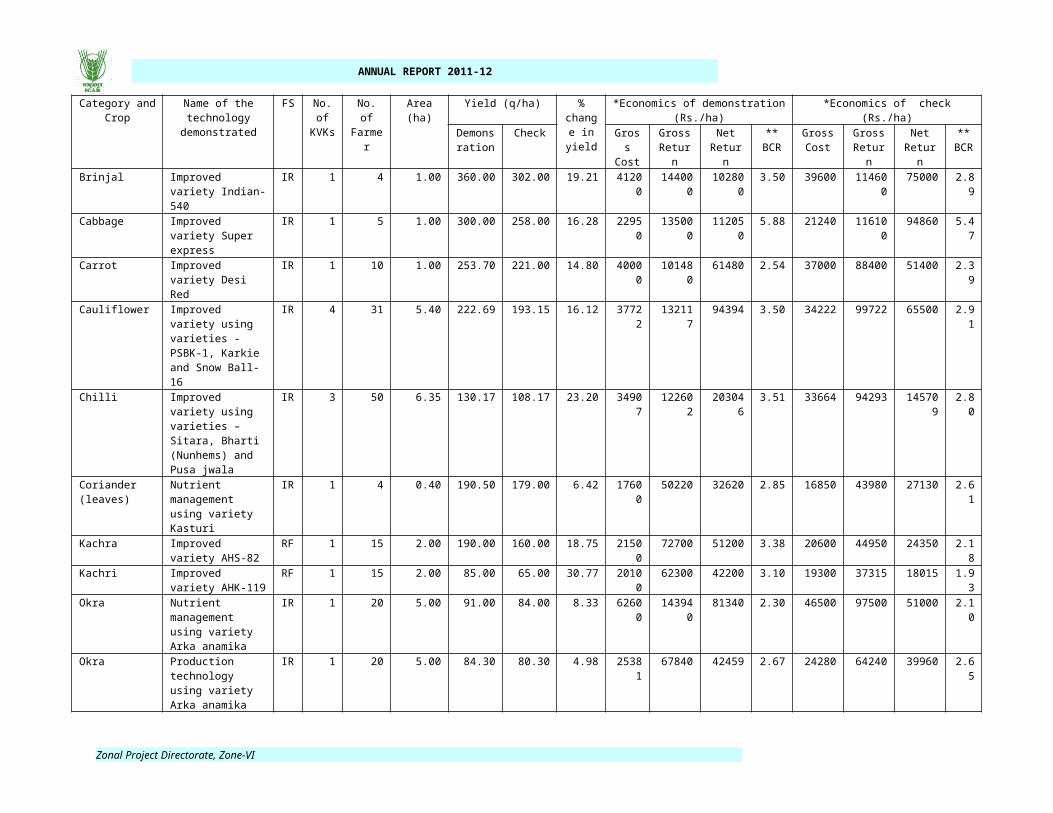
ANNUAL REPORT 2011-12
Thematic area No. of course
s
ParticipantsOthers SC/ST Grand Total
Male Female
Total Male Female
Total Male Female
Total
minimization techniquesValue addition 62 68 1039 1107 25 571 596 93 1610 1703Women empowerment 54 35 827 862 2 722 724 37 1549 1586Location specific drudgery reduction technologies
18 41 228 269 35 120 155 76 348 424
Rural crafts 13 0 313 313 0 67 67 0 380 380Women and child care 26 8 414 422 10 256 266 18 670 688Others (pl specify) 0 0 0 0 0 0 0 0 0 0Total 249 220 3993 4213 103 2399 2502 323 6392 6715VI Agril. Engineering Farm machinary and its maintenance
0 0 0 0 0 0 0 0 0 0
Installation and maintenance of micro irrigation systems
13 241 21 262 93 9 102 334 30 364
Use of plastics in farming practices
3 51 0 51 0 33 33 51 33 84
Production of small tools and implements
9 46 64 110 37 91 128 83 155 238
Repair and maintenance of farm machinery and implements
27 435 56 491 174 12 186 609 68 677
Small scale processing and value addition
5 87 0 87 77 21 98 164 21 185
Post harvest technology 6 98 23 121 65 9 74 163 32 195Others (pl specify) 0 0 0 0 0 0 0 0 0 0Total 63 958 164 1122 446 175 621 1404 339 1743VII Plant Protection Integrated pest management
162 2529 86 2615 1427 225 1652 3956 311 4267
Integrated disease management
80 1073 88 1161 749 122 871 1822 210 2032
Bio-control of pests and diseases
39 497 67 564 389 65 454 886 132 1018
Production of bio control agents and bio pesticides
5 74 0 74 80 0 80 154 0 154
Others (pl specify) 0 0 0 0 0 0 0 0 0 0Total 286 4173 241 4414 2645 412 3057 6818 653 7471VIII Fisheries Integrated fish farming 3 7 0 7 87 14 101 94 14 108Carp breeding and hatchery management
3 39 31 70 15 0 15 54 31 85
Carp fry and fingerling rearing
2 30 6 36 3 40 43 33 46 79
Composite fish culture 10 86 4 90 88 0 88 174 4 178Hatchery management and culture of freshwater prawn
0 0 0 0 0 0 0 0 0 0
Breeding and culture of ornamental fishes
0 0 0 0 0 0 0 0 0 0
Portable plastic carp hatchery
0 0 0 0 0 0 0 0 0 0
Pen culture of fish and 0 0 0 0 0 0 0 0 0 0
Zonal Project Directorate, Zone-VI

ANNUAL REPORT 2011-12
Thematic area No. of course
s
ParticipantsOthers SC/ST Grand Total
Male Female
Total Male Female
Total Male Female
Total
prawnShrimp farming 3 3 0 3 28 1 29 31 1 32Edible oyster farming 0 0 0 0 0 0 0 0 0 0Pearl culture 0 0 0 0 0 0 0 0 0 0Fish processing and value addition
2 0 22 22 0 17 17 0 39 39
Others (pl specify) 0 0 0 0 0 0 0 0 0 0Total 23 165 63 228 221 72 293 386 135 521IX Production of Inputs at site
Seed production 12 216 4 220 104 2 106 320 6 326Planting material production
0 0 0 0 0 0 0 0 0 0
Bio-agents production 0 0 0 0 0 0 0 0 0 0Bio-pesticides production
0 0 0 0 0 0 0 0 0 0
Bio-fertilizer production 0 0 0 0 0 0 0 0 0 0Vermi-compost production
2 26 0 26 0 0 0 26 0 26
Organic manures production
3 41 0 41 36 0 36 77 0 77
Production of fry and fingerlings
0 0 0 0 0 0 0 0 0 0
Production of bee-colonies and wax sheets
0 0 0 0 0 0 0 0 0 0
Small tools and implements
0 0 0 0 0 0 0 0 0 0
Production of livestock feed and fodder
0 0 0 0 0 0 0 0 0 0
Production of fish feed 0 0 0 0 0 0 0 0 0 0Mushroom production 0 0 0 0 0 0 0 0 0 0Apiculture 0 0 0 0 0 0 0 0 0 0Others (pl specify) 0 0 0 0 0 0 0 0 0 0Total 17 283 4 287 140 2 142 423 6 429X Capacity Building and Group Dynamics
Leadership development
71 1652 51 1703 761 22 783 2413 73 2486
Group dynamics 62 843 353 1196 506 363 869 1349 716 2065Formation and management of SHGs
44 548 256 804 196 170 366 744 426 1170
Mobilization of social capital
12 211 61 272 60 4 64 271 65 336
Entrepreneurial development of farmers/youths
75 1584 148 1732 801 36 837 2385 184 2569
WTO and IPR issues 2 28 0 28 1 0 1 29 0 29Others (pl specify) 0 0 0 0 0 0 0 0 0 0Total 266 4866 869 5735 2325 595 2920 7191 1464 8655XI Agro-forestry Production technologies 19 56 28 84 260 256 516 316 284 600Nursery management 3 84 18 102 0 0 0 84 18 102Integrated farming systems
28 1059 97 1156 135 4 139 1194 101 1295
Others (pl specify) 0 0 0 0 0 0 0 0 0 0
Zonal Project Directorate, Zone-VI
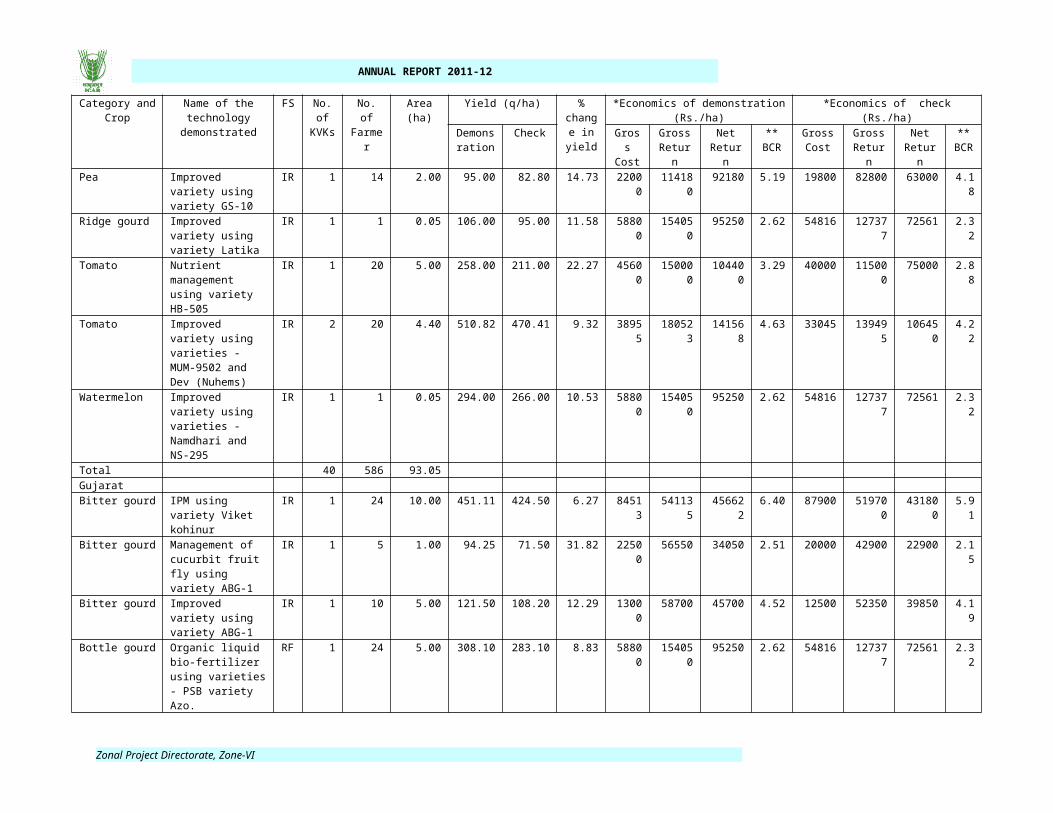
ANNUAL REPORT 2011-12
Thematic area No. of course
s
ParticipantsOthers SC/ST Grand Total
Male Female
Total Male Female
Total Male Female
Total
Total 50 1199 143 1342 395 260 655 1594 403 1997GRAND TOTAL 2249 3441
08016 4242
61851
36962 2547
55292
314978 6790
1
Table 33 : Farmers’ Training including sponsored training programmes (off campus)Thematic area No. of
courses
ParticipantsOthers SC/ST Grand Total
Male Female
Total Male Female
Total Male Female
Total
I Crop Production Weed management 62 921 109 1030 556 135 691 1477 244 1721Resource conservation technologies
38 506 97 603 541 193 734 1047 290 1337
Cropping systems 42 596 68 664 433 66 499 1029 134 1163Crop diversification 19 460 40 500 171 26 197 631 66 697Integrated farming 20 441 43 484 121 23 144 562 66 628Micro irrigation/irrigation 42 1016 63 1079 321 38 359 1337 101 1438Seed production 39 971 57 1028 343 99 442 1314 156 1470Nursery management 5 40 2 42 95 19 114 135 21 156Integrated crop management
239 4748 334 5082 2634 801 3435 7382 1135 8517
Soil & water conservatioin
0 0 0 0 0 0 0 0 0 0
Integrated nutrient management
0 0 0 0 0 0 0 0 0 0
Production of organic inputs
15 372 1 373 100 24 124 472 25 497
Others (fodder production)
12 110 24 134 129 56 185 239 80 319
Total 533 10181
838 11019
5444 1480 6924 15625
2318 17943
II Horticulture a) Vegetable Crops Production of low value and high valume crops
81 1287 72 1359 824 164 988 2111 236 2347
Off-season vegetables 29 377 47 424 230 162 392 607 209 816Nursery raising 23 355 58 413 112 25 137 467 83 550Exotic vegetables 2 29 0 29 3 0 3 32 0 32Export potential vegetables
12 202 2 204 122 4 126 324 6 330
Grading and standardization
10 212 16 228 42 39 81 254 55 309
Protective cultivation 15 313 11 324 110 13 123 423 24 447Others (pl specify) 0 0 0 0 0 0 0 0 0 0Total (a) 172 2775 206 2981 1443 407 1850 4218 613 4831b) Fruits Training and pruning 27 428 61 489 127 38 165 555 99 654Layout and management of orchards
28 455 33 488 124 60 184 579 93 672
Cultivation of fruit 45 1071 87 1158 359 54 413 1430 141 1571Management of young plants/orchards
14 153 19 172 96 12 108 249 31 280
Rejuvenation of old 3 67 0 67 10 0 10 77 0 77
Zonal Project Directorate, Zone-VI

ANNUAL REPORT 2011-12
Thematic area No. of course
s
ParticipantsOthers SC/ST Grand Total
Male Female
Total Male Female
Total Male Female
Total
orchardsExport potential fruits 1 16 0 16 0 0 0 16 0 16Micro irrigation systems of orchards
8 256 16 272 45 0 45 301 16 317
Plant propagation techniques
11 93 21 114 91 142 233 184 163 347
Others (pl specify) 0 0 0 0 0 0 0 0 0 0Total (b) 137 2539 237 2776 852 306 1158 3391 543 3934c) Ornamental Plants Nursery management 9 57 64 121 151 0 151 208 64 272Management of potted plants
0 0 0 0 0 0 0 0 0 0
Export potential of ornamental plants
3 15 0 15 24 19 43 39 19 58
Propagation techniques of ornamental plants
1 17 2 19 0 0 0 17 2 19
Others (pl specify) 0 0 0 0 0 0 0 0 0 0Total ( c) 13 89 66 155 175 19 194 264 85 349d) Plantation crops Production and management technology
10 181 18 199 47 3 50 228 21 249
Processing and value addition
5 61 59 120 2 0 2 63 59 122
Others (pl specify) 0 0 0 0 0 0 0 0 0 0Total (d) 15 242 77 319 49 3 52 291 80 371e) Tuber crops Production and management technology
3 50 3 53 18 0 18 68 3 71
Processing and value addition
0 0 0 0 0 0 0 0 0 0
Others (pl specify) 0 0 0 0 0 0 0 0 0 0Total (e) 3 50 3 53 18 0 18 68 3 71f) Spices Production and management technology
34 955 52 1007 316 29 345 1271 81 1352
Processing and value addition
5 87 12 99 7 0 7 94 12 106
Others (pl specify) 0 0 0 0 0 0 0 0 0 0Total (f) 39 1042 64 1106 323 29 352 1365 93 1458g) Medicinal and Aromatic Plants
Nursery management 4 57 15 72 27 0 27 84 15 99Production and management technology
7 131 10 141 43 19 62 174 29 203
Post harvest technology and value addition
4 32 67 99 27 5 32 59 72 131
Others (pl specify) 0 0 0 0 0 0 0 0 0 0Total (g) 15 220 92 312 97 24 121 317 116 433GT (a-g) 394 6957 745 7702 2957 788 3745 9914 1533 1144
7III Soil Health and Fertility Management
Zonal Project Directorate, Zone-VI

ANNUAL REPORT 2011-12
Thematic area No. of course
s
ParticipantsOthers SC/ST Grand Total
Male Female
Total Male Female
Total Male Female
Total
Soil fertility management
32 543 48 591 295 32 327 838 80 918
Integrated water management
19 341 24 365 99 18 117 440 42 482
Integrated nutrient management
60 1011 159 1170 457 130 587 1468 289 1757
Production and use of organic inputs
46 728 42 770 333 130 463 1061 172 1233
Management of problematic soils
9 200 9 209 64 0 64 264 9 273
Micro nutrient deficiency in crops
7 156 23 179 64 25 89 220 48 268
Nutrient use efficiency 5 56 1 57 143 0 143 199 1 200Balance use of fertilizers
22 355 53 408 249 61 310 604 114 718
Soil and Water Testing 0 0 0 0 0 0 0 0 0 0Others (pl specify) 0 0 0 0 0 0 0 0 0 0Total 200 3390 359 3749 1704 396 2100 5094 755 5849IV Livestock Production and Management
Dairy management 134 1820 598 2418 905 450 1355 2725 1048 3773Poultry management 17 252 36 288 99 72 171 351 108 459Piggery management 1 9 9 18 0 0 0 9 9 18Rabbit management 0 0 0 0 0 0 0 0 0 0Animal nutrition management
134 1807 662 2469 798 398 1196 2605 1060 3665
Disease management 110 1238 594 1832 653 474 1127 1891 1068 2959Feed & fodder technology
0 0 0 0 0 0 0 0 0 0
Production of quality animal products
14 201 13 214 160 11 171 361 24 385
Others (pl specify) 0 0 0 0 0 0 0 0 0 0Total 410 5327 1912 7239 2615 1405 4020 7942 3317 1125
9V Home Science/Women empowerment
Household food security by kitchen gardening and nutrition gardening
32 60 624 684 25 287 312 85 911 996
Design and development of low/minimum cost diet
22 3 494 497 0 117 117 3 611 614
Designing and development for high nutrient efficiency diet
13 0 190 190 15 192 207 15 382 397
Minimization of nutrient loss in processing
15 0 258 258 0 88 88 0 346 346
Processing and cooking 0 0 0 0 0 0 0 0 0 0Gender mainstreaming through SHGs
40 2 1094 1096 0 212 212 2 1306 1308
Storage loss minimization techniques
21 85 280 365 7 138 145 92 418 510
Value addition 65 35 1146 1181 5 548 553 40 1694 1734Women empowerment 32 11 451 462 21 352 373 32 803 835
Zonal Project Directorate, Zone-VI

ANNUAL REPORT 2011-12
Thematic area No. of course
s
ParticipantsOthers SC/ST Grand Total
Male Female
Total Male Female
Total Male Female
Total
Location specific drudgery reduction technologies
26 35 419 454 1 162 163 36 581 617
Rural Crafts 13 50 227 277 2 91 93 52 318 370Women and child care 56 115 959 1074 11 557 568 126 1516 1642Others (pl specify) 0 0 0 0 0 0 0 0 0 0Total 335 396 6142 6538 87 2744 2831 483 8886 9369VI Agril. Engineering Farm machinary and its maintenance
0 0 0 0 0 0 0 0 0 0
Installation and maintenance of micro irrigation systems
40 545 31 576 378 58 436 923 89 1012
Use of plastics in farming practices
3 54 0 54 0 0 0 54 0 54
Production of small tools and implements
15 175 61 236 60 13 73 235 74 309
Repair and maintenance of farm machinery and implements
32 540 21 561 257 65 322 797 86 883
Small scale processing and value addition
5 63 0 63 21 30 51 84 30 114
Post harvest technology 16 235 45 280 75 10 85 310 55 365Others (pl specify) 0 0 0 0 0 0 0 0 0 0Total 111 1612 158 1770 791 176 967 2403 334 2737VII Plant Protection Integrated pest management
279 4840 415 5255 2025 349 2374 6865 764 7629
Integrated disease management
124 2241 164 2405 1073 222 1295 3314 386 3700
Bio-control of pests and diseases
34 671 74 745 282 17 299 953 91 1044
Production of bio control agents and bio pesticides
14 202 2 204 156 28 184 358 30 388
Others (pl specify) 0 0 0 0 0 0 0 0 0 0Total 451 7954 655 8609 3536 616 4152 1149
01271 1276
1VIII Fisheries Integrated fish farming 8 98 17 115 100 60 160 198 77 275Carp breeding and hatchery management
4 45 0 45 16 0 16 61 0 61
Carp fry and fingerling rearing
2 18 0 18 15 0 15 33 0 33
Composite fish culture 11 175 2 177 60 42 102 235 44 279Hatchery management and culture of freshwater prawn
4 85 3 88 34 0 34 119 3 122
Breeding and culture of ornamental fishes
0 0 0 0 0 0 0 0 0 0
Portable plastic carp hatchery
0 0 0 0 0 0 0 0 0 0
Pen culture of fish and prawn
0 0 0 0 0 0 0 0 0 0
Shrimp farming 2 19 2 21 7 1 8 26 3 29
Zonal Project Directorate, Zone-VI

ANNUAL REPORT 2011-12
Thematic area No. of course
s
ParticipantsOthers SC/ST Grand Total
Male Female
Total Male Female
Total Male Female
Total
Edible oyster farming 0 0 0 0 0 0 0 0 0 0Pearl culture 5 112 0 112 0 0 0 112 0 112Fish processing and value addition
2 25 12 37 0 0 0 25 12 37
Others (pl specify) 0 0 0 0 0 0 0 0 0 0Total 38 577 36 613 232 103 335 809 139 948IX Production of Inputs at site
Seed production 9 100 15 115 63 8 71 163 23 186Planting material production
0 0 0 0 0 0 0 0 0 0
Bio-agents production 0 0 0 0 0 0 0 0 0 0Bio-pesticides production
1 18 0 18 0 0 0 18 0 18
Bio-fertilizer production 0 0 0 0 0 0 0 0 0 0Vermi-compost production
1 17 12 29 0 0 0 17 12 29
Organic manures production
1 32 0 32 0 0 0 32 0 32
Production of fry and fingerlings
0 0 0 0 0 0 0 0 0 0
Production of bee-colonies and wax sheets
0 0 0 0 0 0 0 0 0 0
Small tools and implements
0 0 0 0 0 0 0 0 0 0
Production of livestock feed and fodder
0 0 0 0 0 0 0 0 0 0
Production of fish feed 0 0 0 0 0 0 0 0 0 0Mushroom production 0 0 0 0 0 0 0 0 0 0Apiculture 0 0 0 0 0 0 0 0 0 0Others (pl specify) 0 0 0 0 0 0 0 0 0 0Total 12 167 27 194 63 8 71 230 35 265X Capacity Building and Group Dynamics
Leadership development
28 384 28 412 257 87 344 641 115 756
Group dynamics 38 1404 210 1614 383 80 463 1787 290 2077Formation and Management of SHGs
30 1201 329 1530 191 103 294 1392 432 1824
Mobilization of social capital
21 245 63 308 144 53 197 389 116 505
Entrepreneurial development of farmers/youths
38 616 48 664 190 103 293 806 151 957
WTO and IPR issues 5 70 2 72 38 1 39 108 3 111Others (pl specify) 0 0 0 0 0 0 0 0 0 0Total 160 3920 680 4600 1203 427 1630 5123 1107 6230XI Agro-forestry Production technologies 5 34 4 38 47 1 48 81 5 86Nursery management 6 251 61 312 67 22 89 318 83 401Integrated farming systems
1 32 0 32 6 0 6 38 0 38
Others (pl specify) 0 0 0 0 0 0 0 0 0 0Total 12 317 65 382 120 23 143 437 88 525GRAND TOTAL 2656 4079 11617 5241 1875 8166 2691 5955 19783 7933
Zonal Project Directorate, Zone-VI

ANNUAL REPORT 2011-12
Thematic area No. of course
s
ParticipantsOthers SC/ST Grand Total
Male Female
Total Male Female
Total Male Female
Total
8 5 2 8 0 3
Table 34 : Farmers’ Training including sponsored training programmes – CONSOLIDATED (On + Off campus)
Thematic area No. of courses
ParticipantsOthers SC/ST Grand Total
Male Female Total Male Female Total Male Female TotalI Crop Production Weed management 103 1625 185 1810 875 245 1120 2500 430 2930Resource conservation technologies
53 696 101 797 845 301 1146 1541 402 1943
Cropping systems 90 1397 171 1568 783 105 888 2180 276 2456Crop diversification 44 938 75 1013 453 26 479 1391 101 1492Integrated farming 104 2897 181 3078 1662 307 1969 4559 488 5047Micro irrigation/irrigation
67 1620 118 1738 560 58 618 2180 176 2356
Seed production 94 2041 111 2152 803 187 990 2844 298 3142Nursery management 31 389 87 476 401 117 518 790 204 994Integrated crop management
444 8689 375 9064 4821 1173 5994 13510 1548 15058
Soil & water conservatioin
0 0 0 0 0 0 0 0 0 0
Integrated nutrient management
0 0 0 0 0 0 0 0 0 0
Production of organic inputs
35 764 63 827 170 47 217 934 110 1044
Others (fodder production)
22 189 68 257 264 65 329 453 133 586
Total 1087 21245 1535 22780 11637 2631 14268 32882 4166 37048II Horticulture a) Vegetable Crops Production of low value and high valume crops
164 2450 229 2679 1639 357 1996 4089 586 4675
Off-season vegetables
58 687 145 832 568 282 850 1255 427 1682
Nursery raising 48 675 81 756 326 74 400 1001 155 1156Exotic vegetables 2 29 0 29 3 0 3 32 0 32Export potential vegetables
22 320 2 322 255 4 259 575 6 581
Grading and standardization
18 267 67 334 66 87 153 333 154 487
Protective cultivation 34 684 30 714 290 45 335 974 75 1049Others (pl specify) 0 0 0 0 0 0 0 0 0 0Total (a) 346 5112 554 5666 3147 849 3996 8259 1403 9662b) Fruits Training and pruning 32 483 61 544 165 38 203 648 99 747Layout and management of orchards
48 758 70 828 220 106 326 978 176 1154
Cultivation of fruit 89 2193 160 2353 767 116 883 2960 276 3236Management of young
22 274 19 293 240 33 273 514 52 566
Zonal Project Directorate, Zone-VI

ANNUAL REPORT 2011-12
Thematic area No. of courses
ParticipantsOthers SC/ST Grand Total
Male Female Total Male Female Total Male Female Totalplants/orchardsRejuvenation of old orchards
7 153 12 165 36 10 46 189 22 211
Export potential fruits 1 16 0 16 0 0 0 16 0 16Micro irrigation systems of orchards
18 435 51 486 110 15 125 545 66 611
Plant propagation techniques
29 526 47 573 195 146 341 721 193 914
Others (pl specify) 0 0 0 0 0 0 0 0 0 0Total (b) 246 4838 420 5258 1733 464 2197 6571 884 7455c) Ornamental Plants
Nursery management 12 65 64 129 181 10 191 246 74 320Management of potted plants
0 0 0 0 0 0 0 0 0 0
Export potential of ornamental plants
3 15 0 15 24 19 43 39 19 58
Propagation techniques of ornamental plants
1 17 2 19 0 0 0 17 2 19
Others (pl specify) 0 0 0 0 0 0 0 0 0 0Total ( c) 16 97 66 163 205 29 234 302 95 397d) Plantation crops Production and management technology
15 284 18 302 48 3 51 332 21 353
Processing and value addition
10 106 79 185 78 61 139 184 140 324
Others (pl specify) 0 0 0 0 0 0 0 0 0 0Total (d) 25 390 97 487 126 64 190 516 161 677e) Tuber crops Production and management technology
12 254 3 257 100 0 100 354 3 357
Processing and value addition
1 40 0 40 0 0 0 40 0 40
Others (pl specify) 0 0 0 0 0 0 0 0 0 0Total (e) 13 294 3 297 100 0 100 394 3 397f) Spices Production and management technology
52 1237 84 1321 405 58 463 1642 142 1784
Processing and value addition
17 401 22 423 68 3 71 469 25 494
Others (pl specify) 0 0 0 0 0 0 0 0 0 0Total (f) 69 1638 106 1744 473 61 534 2111 167 2278g) Medicinal and Aromatic Plants
Nursery management 5 67 18 85 34 5 39 101 23 124Production and management technology
14 255 24 279 104 19 123 359 43 402
Post harvest technology and value addition
11 122 149 271 41 5 46 163 154 317
Others (pl specify) 0 0 0 0 0 0 0 0 0 0Total (g) 30 444 191 635 179 29 208 623 220 843
Zonal Project Directorate, Zone-VI

ANNUAL REPORT 2011-12
Thematic area No. of courses
ParticipantsOthers SC/ST Grand Total
Male Female Total Male Female Total Male Female TotalGT (a-g) 745 12813 1437 14250 5963 1496 7459 18776 2933 21709III Soil Health and Fertility Management
Soil fertility management
60 969 96 1065 556 39 595 1525 135 1660
Integrated water management
34 625 31 656 242 41 283 867 72 939
Integrated nutrient management
100 1613 177 1790 795 199 994 2408 376 2784
Production and use of organic inputs
60 860 82 942 490 139 629 1350 221 1571
Management of problematic soils
20 381 19 400 142 1 143 523 20 543
Micro nutrient deficiency in crops
10 251 23 274 95 25 120 346 48 394
Nutrient use efficiency
10 133 18 151 178 0 178 311 18 329
Balance use of fertilizers
32 524 93 617 301 65 366 825 158 983
Soil and water testing 0 0 0 0 0 0 0 0 0 0Others (pl specify) 0 0 0 0 0 0 0 0 0 0Total 326 5356 539 5895 2799 509 3308 8155 1048 9203IV Livestock Production and Management
Dairy management 270 3486 1165 4651 1852 1100 2952 5338 2265 7603Poultry management 24 337 42 379 181 72 253 518 114 632Piggery management 2 9 9 18 0 31 31 9 40 49Rabbit management 1 20 0 20 0 0 0 20 0 20Animal nutrition management
206 3009 880 3889 1392 590 1982 4401 1470 5871
Disease management 147 1715 745 2460 898 602 1500 2613 1347 3960Feed & fodder technology
0 0 0 0 0 0 0 0 0 0
Production of quality animal products
24 411 41 452 236 85 321 647 126 773
Others (pl specify) 0 0 0 0 0 0 0 0 0 0Total 674 8987 2882 11869 4559 2480 7039 13546 5362 18908V Home Science/Women empowerment
Household food security by kitchen gardening and nutrition gardening
50 100 907 1007 38 441 479 138 1348 1486
Design and development of low/minimum cost diet
42 8 840 848 0 260 260 8 1100 1108
Designing and development for high nutrient efficiency diet
24 12 330 342 21 304 325 33 634 667
Minimization of nutrient loss in processing
24 1 405 406 2 151 153 3 556 559
Processing and 0 0 0 0 0 0 0 0 0 0
Zonal Project Directorate, Zone-VI

ANNUAL REPORT 2011-12
Thematic area No. of courses
ParticipantsOthers SC/ST Grand Total
Male Female Total Male Female Total Male Female TotalcookingGender mainstreaming through SHGs
53 12 1243 1255 10 368 378 22 1611 1633
Storage loss minimization techniques
26 85 387 472 7 173 180 92 560 652
Value addition 127 103 2185 2288 30 1119 1149 133 3304 3437Women empowerment
86 46 1278 1324 23 1074 1097 69 2352 2421
Location specific drudgery reduction technologies
44 76 647 723 36 282 318 112 929 1041
Rural crafts 26 50 540 590 2 158 160 52 698 750Women and child care
82 123 1373 1496 21 813 834 144 2186 2330
Others (pl specify) 0 0 0 0 0 0 0 0 0 0Total 584 616 10135 10751 190 5143 5333 806 15278 16084VI Agril. Engineering
Farm machinary and its maintenance
0 0 0 0 0 0 0 0 0 0
Installation and maintenance of micro irrigation systems
53 786 52 838 471 67 538 1257 119 1376
Use of plastics in farming practices
6 105 0 105 0 33 33 105 33 138
Production of small tools and implements
24 221 125 346 97 104 201 318 229 547
Repair and maintenance of farm machinery and implements
59 975 77 1052 431 77 508 1406 154 1560
Small scale processing and value addition
10 150 0 150 98 51 149 248 51 299
Post harvest technology
22 333 68 401 140 19 159 473 87 560
Others (pl specify) 0 0 0 0 0 0 0 0 0 0Total 174 2570 322 2892 1237 351 1588 3807 673 4480VII Plant Protection Integrated pest management
441 7369 501 7870 3452 574 4026 10821 1075 11896
Integrated disease management
204 3314 252 3566 1822 344 2166 5136 596 5732
Bio-control of pests and diseases
73 1168 141 1309 671 82 753 1839 223 2062
Production of bio control agents and bio pesticides
19 276 2 278 236 28 264 512 30 542
Others (pl specify) 0 0 0 0 0 0 0 0 0 0Total 737 12127 896 13023 6181 1028 7209 18308 1924 20232VIII Fisheries Integrated fish farming
11 105 17 122 187 74 261 292 91 383
Carp breeding and hatchery
7 84 31 115 31 0 31 115 31 146
Zonal Project Directorate, Zone-VI

ANNUAL REPORT 2011-12
Thematic area No. of courses
ParticipantsOthers SC/ST Grand Total
Male Female Total Male Female Total Male Female TotalmanagementCarp fry and fingerling rearing
4 48 6 54 18 40 58 66 46 112
Composite fish culture
21 261 6 267 148 42 190 409 48 457
Hatchery management and culture of freshwater prawn
4 85 3 88 34 0 34 119 3 122
Breeding and culture of ornamental fishes
0 0 0 0 0 0 0 0 0 0
Portable plastic carp hatchery
0 0 0 0 0 0 0 0 0 0
Pen culture of fish and prawn
0 0 0 0 0 0 0 0 0 0
Shrimp farming 5 22 2 24 35 2 37 57 4 61Edible oyster farming 0 0 0 0 0 0 0 0 0 0Pearl culture 5 112 0 112 0 0 0 112 0 112Fish processing and value addition
4 25 34 59 0 17 17 25 51 76
Others (pl specify) 0 0 0 0 0 0 0 0 0 0Total 61 742 99 841 453 175 628 1195 274 1469IX Production of Inputs at site
Seed production 21 316 19 335 167 10 177 483 29 512Planting material production
0 0 0 0 0 0 0 0 0 0
Bio-agents production 0 0 0 0 0 0 0 0 0 0Bio-pesticides production
1 18 0 18 0 0 0 18 0 18
Bio-fertilizer production
0 0 0 0 0 0 0 0 0 0
Vermi-compost production
3 43 12 55 0 0 0 43 12 55
Organic manures production
4 73 0 73 36 0 36 109 0 109
Production of fry and fingerlings
0 0 0 0 0 0 0 0 0 0
Production of Bee-colonies and wax sheets
0 0 0 0 0 0 0 0 0 0
Small tools and implements
0 0 0 0 0 0 0 0 0 0
Production of livestock feed and fodder
0 0 0 0 0 0 0 0 0 0
Production of fish feed
0 0 0 0 0 0 0 0 0 0
Mushroom Production
0 0 0 0 0 0 0 0 0 0
Apiculture 0 0 0 0 0 0 0 0 0 0Others (pl specify) 0 0 0 0 0 0 0 0 0 0Total 29 450 31 481 203 10 213 653 41 694X Capacity Building and Group Dynamics
Leadership 99 2036 79 2115 1018 109 1127 3054 188 3242
Zonal Project Directorate, Zone-VI

ANNUAL REPORT 2011-12
Thematic area No. of courses
ParticipantsOthers SC/ST Grand Total
Male Female Total Male Female Total Male Female TotaldevelopmentGroup dynamics 100 2247 563 2810 889 443 1332 3136 1006 4142Formation and Management of SHGs
74 1749 585 2334 387 273 660 2136 858 2994
Mobilization of social capital
33 456 124 580 204 57 261 660 181 841
Entrepreneurial development of farmers/youths
113 2200 196 2396 991 139 1130 3191 335 3526
WTO and IPR issues 7 98 2 100 39 1 40 137 3 140Others (pl specify) 0 0 0 0 0 0 0 0 0 0Total 426 8786 1549 10335 3528 1022 4550 12314 2571 14885XI Agro-forestry Production technologies
24 90 32 122 307 257 564 397 289 686
Nursery management 9 335 79 414 67 22 89 402 101 503Integrated farming systems
29 1091 97 1188 141 4 145 1232 101 1333
Others (pl specify) 0 0 0 0 0 0 0 0 0 0Total 62 1516 208 1724 515 283 798 2031 491 2522GRAND TOTAL 4905 75208 19633 94841 37265 15128 52393 112473 34761 147234
Table 35 : Training for Rural Youths including sponsored training programmes (On campus)
Area of training No. of Courses
No. of Participants General SC/ST Grand Total
Male Female Total Male Female Total Male Female TotalNursery management of horticulture crops
13 203 0 203 86 3 89 289 3 292
Training and pruning of orchards
3 30 0 30 21 9 30 51 9 60
Protected cultivation of vegetable crops
12 151 43 194 107 29 136 258 72 330
Commercial fruit production 4 87 2 89 23 2 25 110 4 114Integrated farming 48 828 37 865 375 56 431 1203 93 1296Seed production 9 157 0 157 104 6 110 261 6 267Production of organic inputs 6 76 32 108 116 16 132 192 48 240Planting material production 6 123 32 155 22 3 25 145 35 180Vermi-culture 14 248 33 281 63 40 103 311 73 384Mushroom production 7 154 8 162 15 8 23 169 16 185Bee-keeping 7 133 0 133 105 0 105 238 0 238Sericulture 0 0 0 0 0 0 0 0 0 0Repair and maintenance of farm machinery and implements
8 46 39 85 103 1 104 149 40 189
Value addition 28 41 258 299 107 248 355 148 506 654Small scale processing 3 35 90 125 0 2 2 35 92 127Post harvest technology 15 232 93 325 24 28 52 256 121 377Tailoring and stitching 20 0 295 295 0 150 150 0 445 445Rural crafts 12 0 95 95 0 199 199 0 294 294Production of quality animal products
2 20 0 20 0 24 24 20 24 44
Dairying 22 252 23 275 221 55 276 473 78 551Sheep and goat rearing 1 17 0 17 8 0 8 25 0 25
Zonal Project Directorate, Zone-VI

ANNUAL REPORT 2011-12
Area of training No. of Courses
No. of Participants General SC/ST Grand Total
Male Female Total Male Female Total Male Female TotalQuail farming 0 0 0 0 0 0 0 0 0 0Piggery 0 0 0 0 0 0 0 0 0 0Rabbit farming 0 0 0 0 0 0 0 0 0 0Poultry production 2 30 6 36 10 5 15 40 11 51Ornamental fisheries 1 2 0 2 13 0 13 15 0 15Composite fish culture 2 1 2 3 61 0 61 62 2 64Freshwater prawn culture 1 4 0 4 8 0 8 12 0 12Shrimp farming 1 36 0 36 1 0 1 37 0 37Pearl culture 0 0 0 0 0 0 0 0 0 0Cold water fisheries 0 0 0 0 0 0 0 0 0 0Fish harvest and processing technology
1 21 0 21 0 0 0 21 0 21
Fry and fingerling rearing 0 0 0 0 0 0 0 0 0 0Any other (para vets and para extension)
29 652 8 660 221 36 257 873 44 917
TOTAL 277 3579 1096 4675 1814 920 2734 5393 2016 7409
Table 36 : Training for Rural Youths including sponsored training programmes (Off campus)
Area of training No. of Courses
No. of Participants General SC/ST Grand Total
Male Female Total Male Female Total Male Female TotalNursery management of horticulture crops
5 73 0 73 30 3 33 103 3 106
Training and pruning of orchards
1 0 24 24 0 0 0 0 24 24
Protected cultivation of vegetable crops
9 176 34 210 51 31 82 227 65 292
Commercial fruit production 2 40 0 40 14 0 14 54 0 54Integrated farming 19 372 37 409 145 55 200 517 92 609Seed production 2 37 0 37 8 0 8 45 0 45Production of organic inputs 2 60 5 65 8 3 11 68 8 76Planting material production 1 18 5 23 6 3 9 24 8 32Vermi-culture 9 199 15 214 29 4 33 228 19 247Mushroom production 3 42 0 42 28 0 28 70 0 70Bee-keeping 5 86 13 99 47 20 67 133 33 166Sericulture 0 0 0 0 0 0 0 0 0 0Repair and maintenance of farm machinery and implements
8 115 10 125 79 30 109 194 40 234
Value addition 25 62 312 374 140 128 268 202 440 642Small scale processing 2 22 22 44 3 6 9 25 28 53Post harvest technology 3 41 50 91 4 4 8 45 54 99Tailoring and stitching 6 0 97 97 0 50 50 0 147 147Rural crafts 17 71 95 166 50 289 339 121 384 505Production of quality animal products
3 64 8 72 13 0 13 77 8 85
Dairying 11 61 48 109 64 29 93 125 77 202Sheep and goat rearing 3 67 0 67 45 0 45 112 0 112Quail farming 0 0 0 0 0 0 0 0 0 0Piggery 0 0 0 0 0 0 0 0 0 0Rabbit farming 0 0 0 0 0 0 0 0 0 0Poultry production 2 38 4 42 10 3 13 48 7 55Ornamental fisheries 0 0 0 0 0 0 0 0 0 0Composite fish culture 0 0 0 0 0 0 0 0 0 0Freshwater prawn culture 1 5 0 5 11 0 11 16 0 16Shrimp farming 0 0 0 0 0 0 0 0 0 0
Zonal Project Directorate, Zone-VI

ANNUAL REPORT 2011-12
Area of training No. of Courses
No. of Participants General SC/ST Grand Total
Male Female Total Male Female Total Male Female TotalPearl culture 0 0 0 0 0 0 0 0 0 0Cold water fisheries 1 0 21 21 0 0 0 0 21 21Fish harvest and processing technology
1 14 4 18 2 0 2 16 4 20
Fry and fingerling rearing 0 0 0 0 0 0 0 0 0 0Any other (para vets and para extension)
4 81 18 99 45 15 60 126 33 159
TOTAL 145 1744 822 2566 832 673 1505 2576 1495 4071
Table 37 : Training for Rural Youths including sponsored training programmes – CONSOLIDATED (On + Off campus)
Area of training No. of Courses
No. of Participants General SC/ST Grand Total
Male Female Total Male Female Tota
l Male Female Total
Nursery management of horticulture crops
18 276 0 276 116 6 122 392 6 398
Training and pruning of orchards
4 30 24 54 21 9 30 51 33 84
Protected cultivation of vegetable crops
21 327 77 404 158 60 218 485 137 622
Commercial fruit production 6 127 2 129 37 2 39 164 4 168Integrated farming 67 1200 74 1274 520 111 631 1720 185 1905Seed production 11 194 0 194 112 6 118 306 6 312Production of organic inputs 8 136 37 173 124 19 143 260 56 316Planting material production 7 141 37 178 28 6 34 169 43 212Vermi-culture 23 447 48 495 92 44 136 539 92 631Mushroom production 10 196 8 204 43 8 51 239 16 255Bee-keeping 12 219 13 232 152 20 172 371 33 404Sericulture 0 0 0 0 0 0 0 0 0 0Repair and maintenance of farm machinery and implements
16 161 49 210 182 31 213 343 80 423
Value addition 53 103 570 673 247 376 623 350 946 1296Small scale processing 5 57 112 169 3 8 11 60 120 180Post harvest technology 18 273 143 416 28 32 60 301 175 476Tailoring and stitching 26 0 392 392 0 200 200 0 592 592Rural crafts 29 71 190 261 50 488 538 121 678 799Production of quality animal products
5 84 8 92 13 24 37 97 32 129
Dairying 33 313 71 384 285 84 369 598 155 753Sheep and goat rearing 4 84 0 84 53 0 53 137 0 137Quail farming 0 0 0 0 0 0 0 0 0 0Piggery 0 0 0 0 0 0 0 0 0 0Rabbit farming 0 0 0 0 0 0 0 0 0 0Poultry production 4 68 10 78 20 8 28 88 18 106Ornamental fisheries 1 2 0 2 13 0 13 15 0 15Composite fish culture 2 1 2 3 61 0 61 62 2 64Freshwater prawn culture 2 9 0 9 19 0 19 28 0 28Shrimp farming 1 36 0 36 1 0 1 37 0 37Pearl culture 0 0 0 0 0 0 0 0 0 0Cold water fisheries 1 0 21 21 0 0 0 0 21 21Fish harvest and processing technology
2 35 4 39 2 0 2 37 4 41
Fry and fingerling rearing 0 0 0 0 0 0 0 0 0 0
Zonal Project Directorate, Zone-VI

ANNUAL REPORT 2011-12
Area of training No. of Courses
No. of Participants General SC/ST Grand Total
Male Female Total Male Female Tota
l Male Female Total
Any other (para vets and para extension)
33 733 26 759 266 51 317 999 77 1076
TOTAL 422 5323 1918 7241 2646 1593 4239 7969 3511 11480
Table 38 : Training programmes for Extension Personnel including sponsored training programmes (on campus)
Area of training No. of Courses
No. of Participants General SC/ST Grand Total
Male Female Total Male Fema
le Total Male Female Total
Productivity enhancement in field crops
98 1981 65 2046 1307 60 1367 3288 125 3413
Integrated pest management 23 451 31 482 149 12 161 600 43 643Integrated nutrient management 14 174 132 306 93 36 129 267 168 435Rejuvenation of old orchards 2 47 0 47 4 0 4 51 0 51Protected cultivation technology 16 259 27 286 97 50 147 356 77 433Production and use of organic inputs
10 47 15 62 159 31 190 206 46 252
Care and maintenance of farm machinery and implements
4 68 1 69 71 0 71 139 1 140
Gender mainstreaming through SHGs
3 40 40 80 6 0 6 46 40 86
Formation and management of SHGs
10 134 136 270 51 50 101 185 186 371
Women and child care 7 0 121 121 0 218 218 0 339 339Low cost and nutrient efficient diet designing
11 0 255 255 0 84 84 0 339 339
Group dynamics and farmers organization
51 760 24 784 602 68 670 1362 92 1454
Information networking among farmers
14 298 22 320 115 9 124 413 31 444
Capacity building for ICT application
20 286 26 312 291 14 305 577 40 617
Management in farm animals 38 451 19 470 99 27 126 550 46 596Livestock feed and fodder production
8 208 9 217 71 11 82 279 20 299
Household food security 5 22 82 104 4 30 34 26 112 138Any other (WTO and IPR issues)
5 35 0 35 111 0 111 146 0 146
TOTAL 339 5261 1005 6266 3230 700 3930 8491 1705 10196
Zonal Project Directorate, Zone-VI

ANNUAL REPORT 2011-12
Table 39 : Training programmes for Extension Personnel including sponsored training programmes (off campus)
Area of training No. of Courses
No. of Participants General SC/ST Grand Total
Male Female Total Male Female Total Male Female TotalProductivity enhancement in field crops 15 452 44 496 157 99 256 609 143 752Integrated pest management 7 178 21 199 27 0 27 205 21 226Integrated nutrient management 1 32 0 32 6 0 6 38 0 38Rejuvenation of old orchards 1 20 0 20 0 0 0 20 0 20Protected cultivation technology 0 0 0 0 0 0 0 0 0 0Production and use of organic inputs 3 41 0 41 49 16 65 90 16 106Care and maintenance of farm machinery and implements 0 0 0 0 0 0 0 0 0 0Gender mainstreaming through SHGs 1 20 0 20 0 0 0 20 0 20Formation and management of SHGs 3 0 0 0 87 51 138 87 51 138Women and child care 3 0 48 48 0 258 258 0 306 306Low cost and nutrient efficient diet designing 0 0 0 0 0 0 0 0 0 0Group dynamics and farmers organization 1 5 0 5 18 0 18 23 0 23Information networking among farmers 3 34 1 35 19 0 19 53 1 54Capacity building for ICT application 5 26 16 42 49 29 78 75 45 120Management in farm animals 1 22 0 22 15 0 15 37 0 37Livestock feed and fodder production 1 20 0 20 18 0 18 38 0 38Household food security 2 40 0 40 15 0 15 55 0 55Any other (WTO and IPR issues) 1 20 6 26 0 0 0 20 6 26TOTAL 48 910 136 1046 460 453 913 1370 589 1959
Table 40 : Training programmes for Extension Personnel including sponsored training programmes – CONSOLIDATED (On + Off campus)
Area of training No. of Courses
No. of Participants General SC/ST Grand Total
Male Female Total Male Female Total Male Female TotalProductivity enhancement in field crops 113 2433 109 2542 1464 159 1623 3897 268 4165Integrated pest management 30 629 52 681 176 12 188 805 64 869Integrated nutrient management 15 206 132 338 99 36 135 305 168 473Rejuvenation of old orchards 3 67 0 67 4 0 4 71 0 71Protected cultivation technology 16 259 27 286 97 50 147 356 77 433
Zonal Project Directorate, Zone-VI

ANNUAL REPORT 2011-12
Area of training No. of Courses
No. of Participants General SC/ST Grand Total
Male Female Total Male Female Total Male Female TotalProduction and use of organic inputs 13 88 15 103 208 47 255 296 62 358Care and maintenance of farm machinery and implements 4 68 1 69 71 0 71 139 1 140Gender mainstreaming through SHGs 4 60 40 100 6 0 6 66 40 106Formation and management of SHGs 13 134 136 270 138 101 239 272 237 509Women and child care 10 0 169 169 0 476 476 0 645 645Low cost and nutrient efficient diet designing 11 0 255 255 0 84 84 0 339 339Group dynamics and farmers organization 52 765 24 789 620 68 688 1385 92 1477Information networking among farmers 17 332 23 355 134 9 143 466 32 498Capacity building for ICT application 25 312 42 354 340 43 383 652 85 737Management in farm animals 39 473 19 492 114 27 141 587 46 633Livestock feed and fodder production 9 228 9 237 89 11 100 317 20 337Household food security 7 62 82 144 19 30 49 81 112 193Any other (WTO and IPR issues) 6 55 6 61 111 0 111 166 6 172TOTAL 387 6171 1141 7312 3690 1153 4843 9861 2294 12155
Table 41 : Sponsored training programmes
Area of trainingNo. of
Courses No. of Participants General SC/ST Grand Total
Male Female Total Male Female Total Male Female Total
Crop production and management
Increasing production and productivity of crops
767 19358 1086 20444 6884 626 7510 26242 1712 27954
Commercial production of vegetables
69 1192 133 1325 629 79 708 1821 212 2033
Production and value addition
Fruit Plants 58 1001 917 1918 226 273 499 1227 1190 2417 Ornamental plants 1 18 10 28 0 0 0 18 10 28
Spices crops 5 409 0 409 18 0 18 427 0 427Soil health and fertility management
48 1288 34 1322 158 68 226 1446 102 1548
Production of inputs at site 1 23 0 23 7 0 7 30 0 30Methods of protective cultivation
3 26 15 41 14 5 19 40 20 60
Others (commercial fruit production)
6 105 0 105 56 1 57 161 1 162
Total 958 23420 2195 25615 7992 1052 9044 31412 3247 34659Post harvest technology and value addition
Processing and value addition
4 87 0 87 17 0 17 104 0 104
Zonal Project Directorate, Zone-VI

ANNUAL REPORT 2011-12
Area of trainingNo. of
Courses No. of Participants General SC/ST Grand Total
Male Female Total Male Female Total Male Female TotalOthers (pl. specify) 0 0 0 0 0 0 0 0 0 0Total 4 87 0 87 17 0 17 104 0 104Farm machinery Farm machinery, tools and implements
9 213 34 247 51 21 72 264 55 319
Others (pl. specify) 0 0 0 0 0 0 0 0 0 0Total 9 213 34 247 51 21 72 264 55 319Livestock and fisheries Livestock production and management
110 1784 665 2449 466 657 1123 2250 1322 3572
Animal nutrition management
4 121 0 121 17 0 17 138 0 138
Animal disease management
2 20 0 20 5 0 5 25 0 25
Fisheries nutrition 0 0 0 0 0 0 0 0 0 0Fisheries management 3 56 3 59 46 0 46 102 3 105Others (pl. specify) 0 0 0 0 0 0 0 0 0 0Total 119 1981 668 2649 534 657 1191 2515 1325 3840Home Science Household nutritional security
2 0 61 61 0 0 0 0 61 61
Economic empowerment of women
7 0 111 111 0 49 49 0 160 160
Drudgery reduction of women
0 0 0 0 0 0 0 0 0 0
Others (pl. specify) 0 0 0 0 0 0 0 0 0 0Total 9 0 172 172 0 49 49 0 221 221Agricultural Extension Capacity building and group dynamics
178 4001 612 4613 1567 91 1658 5568 703 6271
Others (pl. specify) 0 0 0 0 0 0 0 0 0 0Total 178 4001 612 4613 1567 91 1658 5568 703 6271
GRAND TOTAL 1277 29702 3681 33383 10161 1870 12031 39863 5551 45414
Name of sponsoring agencies involved : AARDS, Chittorgarh; AD Extn. Jaisalmer; Ag, Deptt.; Agrocell, Mundra; AKRSP; AMIC, NAIP, Udaipur; ANARDe, Palanpur; ARS, Bikaner; ARS, Jaipur; ARS, Jaipur; ARS, Kota; ARS, Kota; ARS, Kota; ARS, Kota; ARS, Kota; ARS, Sriganganagar; ARS, Sriganganagar; ASPEE; ATMA; BAIF RRIDMA; BSVS, Bodeli; Chambal fertilizer;CIBA, Hyderabad; CIPMC, Sriganganagar; Cocacola hindustan Barclay,Pvt. Ltd.; CPSMVS; CSPC, Ahmedabad; CWC, Ahmedabad; CWC, Gandhinagar; Dept. of Ag. Dangs; Dept. of AH, Udaipur; Dept. of soil and water conservation, Udaipur; Deptt. Agri. Rajsamand; Deptt. Hort. Chittorgarh; Deptt. Of Ag. Udaipur; Deptt. Of Hort. Surendranagar; Deptt. Of Soil water conservation, Nagaur; Dhanuka; DIET, Kukas Mehsana; DOA, Jhunjhunu; DOA, Nagaur; DOA, Pali; DOAH; DOAH; DRDA; Dudh dhara dairy; DWDU, Bhavnagar; DWDU, Mehsana; DWDU, Palanpur; FAI, New Delhi; FES, Udaipur; Forest dept. Panchamahal; FTC, Bhavnagar; FTC, Silvasa; GGRC; GLDC, Palanpur; GNFC; Guj, State Watershed Dev. Agency; IFFCO; IGMRI, Hapur; IICPT; ISPL, Ahmedabad; IWMD, Newai; IWMP, Kheda & Anand; Jagran jan vikas sansthan, Udaipur; Jan chetna NGO; Jila Parishad Jhunjhunu; Kendriya kamdar sikshan Board, Ahmedabad; Khodiya education trust, Mehsana; Kohzin, Shihori; KRIBHKO, Bhavnagar; KSS, Ramgarh; Lokbharti, Sanosara; Mahindra & mahindra, Himmatnagar; Mahindra Samridhi; Manu Sansthan, Udaipur; MBSA, Bikaner; Ministry of water resources, GOI, New Delhi; NABARD; NAIP; NAIP-III; Navachar sansthan, Chittorgarh; NDDB, New Delhi; Nehru Yuva Kendra, Mehsana; Nehru Yuva Kendra, Rajsamand; NFL, Bharatpur; NFL, Kota; NGO, Bhilwara; NHM; NHRDF.; NIAM, Jaipur; NICRA; NRCSS, Ajmer; NSC; NYV&AS, Bikaner; Om Seva sansthan, rajsamand; Panchayat Samiti, Nohar; Panchayat Samiti, Rawatsar; PFDC; Pulse project; RAISEM, Jaisalmer; RICEM, Jipur; RKVY; RMoL; RMoSL; RSEM COP. Jaipur; SARD, Sirohi; Sarva Mangal Sansthan, Bhilwara; Sevarth Sansthan Gaytri Ashram,
Zonal Project Directorate, Zone-VI

ANNUAL REPORT 2011-12
Bhilwara; Sewarth Sansthan , Bhilwara; SRTT; State DAC; State hort. Deptt.; Urmul, Loonkaransar; Vetuna niketan, Narishakti mahila mandal, UNNAI; Viksat, Kheroj; VIP, Hapur; VRTI, Mandvi; WDP; Weed control dept. Anand; Zila Parishad
Table 42 : Details of vocational training programmes carried out by KVKs for rural youth
Area of training No. of Courses
No. of Participants General SC/ST Grand Total
Male Female Total Male Female Total Male Female Total
Crop production and management Commercial floriculture 1 17 0 17 0 0 0 17 0 17Commercial fruit production 2 20 0 20 0 0 0 20 0 20Commercial vegetable production 1 19 0 19 0 0 0 19 0 19Integrated crop management 12 265 19 284 26 1 27 291 20 311Organic farming 2 36 0 36 0 0 0 36 0 36Others (pl. specify) 0 0 0 0 0 0 0 0 0 0Total 18 357 19 376 26 1 27 383 20 403Post harvest technology and value addition Value addition 31 94 634 728 0 46 46 94 680 774Others (pl. specify) 0 0 0 0 0 0 0 0 0 0Total 31 94 634 728 0 46 46 94 680 774Livestock and fisheries Dairy farming 9 171 25 196 4 0 4 175 25 200Composite fish culture 1 30 0 30 0 0 0 30 0 30Sheep and goat rearing 0 0 0 0 0 0 0 0 0 0Piggery 0 0 0 0 0 0 0 0 0 0Poultry farming 2 36 0 36 0 0 0 36 0 36Others (ornamental fisheries) 0 0 0 0 0 0 0 0 0 0Total 12 237 25 262 4 0 4 241 25 266Income generation activities Vermicomposting 6 117 26 143 15 0 15 132 26 158Production of bio-agents, bio-pesticides, 0 0 0 0 0 0 0 0 0 0bio-fertilizers etc. 0 0 0 0 0 0 0 0 0 0Repair and maintenance of farm machinery and implements 4 89 0 89 0 0 0 89 0 89Rural crafts 24 101 537 638 0 0 0 101 537 638Seed production 0 0 0 0 0 0 0 0 0 0Sericulture 1 42 0 42 0 0 0 42 0 42Mushroom cultivation 0 0 0 0 0 0 0 0 0 0Nursery, grafting etc. 13 272 4 276 12 26 38 284 30 314Tailoring, stitching, embroidery, dying etc. 28 235 433 668 0 4 4 235 437 672Agril. para-workers, para-vet training 7 135 0 135 0 0 0 135 0 135Others (bee keeping) 4 171 0 171 0 0 0 171 0 171Total 87 1162 1000 2162 27 30 57 1189 1030 2219Agricultural Extension Capacity building and group dynamics 0 0 0 0 0 0 0 0 0 0Others (pl. specify) 0 0 0 0 0 0 0 0 0 0Total 0 0 0 0 0 0 0 0 0 0Grand Total 148 1850 1678 3528 57 77 134 1907 1755 3662
Zonal Project Directorate, Zone-VI
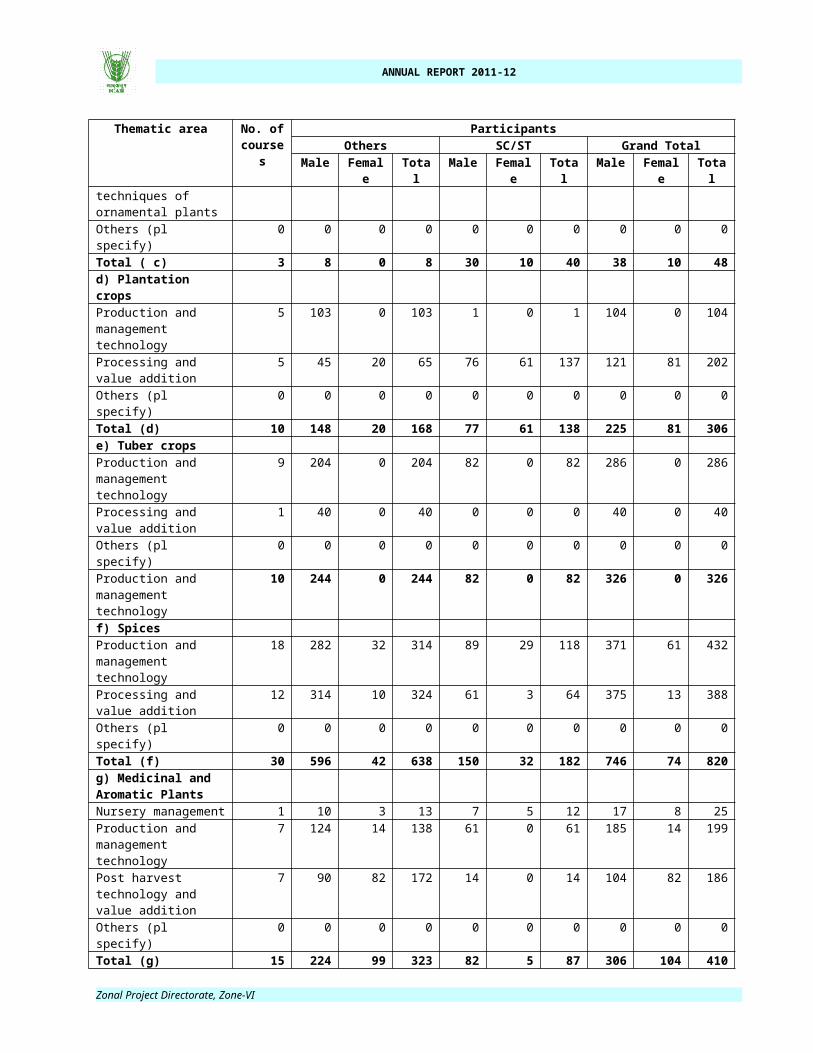
ANNUAL REPORT 2011-12
12. EXTENSION ACTIVITIES
Extension activities play an important role in creating awareness among the farmers. The KVKs have made all concerted effort in these activities so as to accelerate the process of technology transfer. During 2011-12 a total of 41163 activities were organised which benefited 961931 farmers and 19065 extension personnel. The details are given in table 43.
Table 43 : Extension Programmes
Activities No. of programmes No. of farmersNo. of
Extension Personnel
TOTAL
Advisory services 23886 19506 5553 25059Diagnostic visits 1403 7697 468 8165Field day 445 23921 1083 25004Group discussions 630 43420 1004 44424Kisan ghosthi 760 47053 2753 49806Film show 1425 43430 1108 44538Self -help groups 247 3697 144 3841Kisan mela 112 305008 1519 306527Exhibition 195 321325 2159 323484Scientists' visit to farmers field 4434 31561 801 32362Plant/animal health camps 112 16887 611 17498Farm science club 97 1643 75 1718Ex-trainees sammelan 37 1378 38 1416Farmers' seminar/workshop 309 19779 760 20539Method demonstrations 548 16770 340 17110Celebration of important days 254 31393 307 31700Special day celebration 0 0 0 0Exposure visits 381 12289 231 12520Others (soil health camp) 93 1798 43 1841Agri mobile clinic 37 3864 8 3872Soil test campaign 5734 8871 27 8898Mahila mandal convenors meet 24 641 33 674Total 41163 961931 19065 980996
In addition to above extension programmes KVKs were also involved in dissemination of technologies through various approaches including media (Table 44).
Table 44 : Details of other extension programmesParticulars Number Number of KVKsElectronic media (CD./DVD) 71 17 Extension literature 377 42 News paper coverage 1428 50Popular articles 552 46Radio talks 364 39TV talks 116 23Animal health camps (number of animals treated) 16887 30Others (farmers visit to KVK) 68935 50 Lecture delivered as a resource person 5891 56Total 94621
Kisan Mobile Advisory :
Zonal Project Directorate, Zone-VI

ANNUAL REPORT 2011-12
Kisan Mobile Advisory services was initiated on 24.11.2010 and became functional from 1st
December, 2010 in Zone-VI. Twenty-five KVKs have started this activity in Rajasthan and Gujarat. The details of SMSs sent and farmers benefited in 2011-12 are provided in Table-45.
Table 45 : Kisan Mobile Advisory Services: No. of KVKs No. of SMSs sent No. of farmers benefited
25 279 16631*
*A total of 16631 registered farmer got messages 127630 times during 2011-12
13. DETAILS OF TECHNOLOGY WEEK CELEBRATIONSTechnology week concept implemented by the KVKs was showcasing the available technologies to
the extension functionaries and farmers. During technology week farmers could directly interact with KVK experts, technology generator and extension personnel which would result in higher adoption of technologies. The details are provided in Table 46.
Table 46 : Technology week celebrations by KVKsNumber of KVKs
organisedTechnology Week
Types of Activities No. ofActivities
Number ofParticipants
Related crop/livestock technology
10
Gosthies 7 210 Crop/livestockLectures organised 69 16975 Crop/livestockExhibition 3 12503 Crop/livestockFilm show 6 123 Crop/livestockFair 1 10000 Crop/livestockFarm visit 14 1249 Crop/livestockDiagnostic practicals 16 899 Crop/livestockDistribution of literature (No.) 20 2160 Crop/livestockDistribution of seed (q) 2.385 50 CropDistribution of planting materials (No.) 1 530 CropBio product distribution (Kg)Bio fertilizers (q)Distribution of fingerlingsDistribution of livestock specimen (No.)Total number of farmers visited the technology week 7 13418
Zonal Project Directorate, Zone-VI

ANNUAL REPORT 2011-12
14. SEED AND SEEDLING PRODUCTION OF DIFFERENT CROPS
In order to increase the revolving fund and make available the quality seeds of newly released varieties to the farmers, the majority of the KVKs are producing seeds of different crops at their instructional farm. The information about seed production, planting material, bio-products and livestock progeny is given in Table-47 to 50.
Table 47 : Production and distribution of seed by KVKs
Crop Name of the crop Name of the variety
Quantity of seed (q)
Value(Rs)
Number of
farmersNo. of KVKs
Oilseeds Castor GCH-7 103.3 428630 Mandi-1 1RHC-1 13.2 264000 142 1
Castor (Parent) VP-1 2.52 49500 SDAU-1 1Groundnut GAUG-10 1 4500 1 1
GG-11 50.4 354536 50 1GG-14 30 195000 30 1GG-2 11.5 43516 86 2GG-20 105.35 644789 59 3GG-5 6.43 28935 6 1GG-6 1.43 10269 2 1
Groundnut (Breeder seed)
GG-31 13.5 35000 JAU-11
GG-5 30.1 301000 JAU-1 1Groundnut (Mega seed)
GG-205.65 25425 6 1
GG-5 26.9 12105 3 1Mustard Ashirvad 22.95 80325 460 1
Bio-902 87.04 315868 2068 4GM-3 7.02 21362 92 4Laxmi 155.77 407191 1809 3NRCDR-2 11 55000 300 1RGN-48 32.9 11515 600 1Rohini 50 250000 1500 1
Niger Guj. Nig.-1 2.17 2170 40 1Sesame GT-2 1.54 5600 100 2
GT-3 3.6 12600 180 1RT-127 5.96 29620 200 3RT-346 5 20000 150 1
Sesame (Breeder seed)
GT-2 2.42 12100JAU-1 1
JS-335 78.95 220625 345 3NRC-37 11.8 47200 50 1RKS-24 62.9 249040 91 3
Taramira RT-46 0.5 1600 25 1RTM-314 5.6 11890 110 1
Total 948.4 4150911 8505 50Pulses Cowpea RC-101 8.08 21355 36 2
Gujrat-3 18 72000 100 1
Zonal Project Directorate, Zone-VI

ANNUAL REPORT 2011-12
Crop Name of the crop Name of the variety
Quantity of seed (q)
Value(Rs)
Number of
farmersNo. of KVKs
Cowpea (Breeder seed)
RC-19 12.94 6470032 1
Gram GG-2 8.55 28935 36 4GNG-1581 40.66 202466 67 2GNG-663 2.5 9925 4 1Prartap chana 15 46903 7 1Pratap chana-1 10 40000 16 1RSG-888 21 113000 76 2RSG-896 10.82 50901 18 1RSG-963 14 65800 28 1RSG-973 21.17 103214 32 2Samrat, Vardan 15 60000 50 1
Gram (Breeder seed) GNG-663 22.5 112500 NAU-1 1
RSG-888 148.11 1184880 SKRAU-1 1Lentil K-75 65 390000 200 1Moth bean RMO-435 3.77 18850 38 2Mung bean GM-4 9.41 69900 67 3
Guj.-4 9.9 39600 60 1IPMO2-3 15.78 70320 106 3Meha 12.35 123170 67 2Pusa vaishali 3.6 14400 180 1RMG-268 3.15 15750 22 2RMG-492 54.09 286490 228 3RMG-62 24.58 135190 75 1SML-668 74.65 464470 596 8SML-668, GM-4 17 153000 170 1SML-668, GM-4, RMG-62 3.58 35800 24 1
Mung bean (Breeder seed) Ganga-1 2.95 29205 1 1
RMG-344 52.26 261300 SKRAU-1 1RMG-62 37.17 371700 SKRAU-1 1
Pigeon pea Vaishali 11.36 80750 147 2Urd bean GU-1 1.67 8330 4 2
Guj.-1 3.9 22750 22 1IPU94-1 6.56 29520 30 1KU96-3 79 276500 228 1KU-96-3 20.8 104000 140 2PU-31 83.9 361000 423 2PU-40 4 16000 20 1RBU-38 12 48000 60 1TAU-2 0.61 4575 4 1
Urd bean (Mega seed)
G-1 6.72 2232045 1
Total 988.09 5629469 3459 69Cereals Barley RD-2052 142 189090 314 2
Zonal Project Directorate, Zone-VI

ANNUAL REPORT 2011-12
Crop Name of the crop Name of the variety
Quantity of seed (q)
Value(Rs)
Number of
farmersNo. of KVKs
RD-2552 292.04 490354 425 4RD-2592 102.69 199901 121 1RD-2660 207.65 257724 260 2RD-2668 8.9 8900 35 1
Barley (Breeder seed) RD-2052 185.84 557520
SKRAU-11
RD-2552 205.54 615000 SKRAU-1 1RD-2668 116.68 928000 SKRAU-1 1
Maize GM-6 25 33750 100 1Pratap hybrid-1 1.49 5960 32 1
Paddy GR-5 1.28 24225 54 1GR-7 164.1 436000 590 3Gurjari 188.2 488900 728 3IR-28 92.95 175675 220 2IR-8 40 75000 130 1Jaya 15.67 31340 117 1MTU-1010 50 100000 316 1NAUR-1 4.37 10000 11 1
Pearl millet RHB-173 6.12 122400 150 1JBV-3 30 30000 600 1RHB-173 7.5 7125 Mandi-1 1
Sorghum GJ-38 6 24000 20 1Wheat DBW-1 1.2 2160 1 1
GW-1 12 240800 10 1GW-322 3.5 3500 3 1GW-366 154.65 292730 213 4GW-496 115.61 242910 170 5HI-8498 78 156000 65 1Lok-1 60 120000 50 1PBW-550 13.2 23520 8 1Raj-3077 90 135000 75 1Raj-3675 55 121000 125 1Raj-3765 307.9 497287 411 4Raj-4035 92 202400 184 1Raj-4037 144.11 189717 238 5Raj-4120 45.86 93160 42 1
Wheat (Breeder seed)
Lok-1 56 224000SKRAU-1
1
Raj-1482 49.6 198400 11 1Raj-3765 353.51 1414440 SKRAU-1 1Raj-4087 118.76 475040 SKRAU-1 1Raj-6560 97.9 391600 SKRAU-1 1
Total 3742.82 9834528 5829 65Commercial crops
Turmeric NAUT-1 24 120000 22 1
Cotton Abhay-251 22.8 111150 Krishi Mandi-1
1
Zonal Project Directorate, Zone-VI

ANNUAL REPORT 2011-12
Crop Name of the crop Name of the variety
Quantity of seed (q)
Value(Rs)
Number of
farmersNo. of KVKs
Cotton (Bt.) Bijdhan20.79 101874
Krishi Mandi-1
1
Sugarcane CO-5071 340 89199 26 2Sugarcane Co-5072 65.8 16450 5 1
Total 503.39 438673 53 6Vegetables Bottle gourd Pusa naveen 0.07 4900 2 1
Brinjal BR-14 0.03 3000 3 1Onion ADR 18 36000 20 1Onion N-53 0.01 800 1 1Onion RO-1 0.28 28000 28 1Raddish Pusa safed 3.15 68000 60 1
Total 21.54 140700 114 6Flower crops Marie gold Local Yellow 0.05 10500 3 1Total 0.05 10500 3 1Spices Coriander CS-6 3 30000 10 1
Guj cori-2 1.61 8050 16 1RCR-435 0.91 9100 27 1RCR-436 6.32 59200 33 2
Cumin GC-4 1.33 43624 20 1RZ-223 3.34 36740 30 1GC-4 1.09 16350 16 1
Cumin (Breeder) GC-4 5.58 214000 SDAU-1 1Dill seed Guj-Suva-3 2.13 8520 40 1Fennel GF-11 7.04 65730 124 3
GF-2 3.99 15752 100 1Guj-1 0.52 4160 20 1
Fenugreek GM-2 4.28 10618 10 2RMT-1 34.17 181915 534 6RMT-305 11.11 59075 131 4
Isabgol GI-2 0.63 2354 8 1RI-89 30.9 317135 150 2
Total 117.95 1082323 1269 30Fodder crop seeds Oat (Breeder seed) Kent 27.53 110120 SKRAU 1
Berseem Local 0.4 13500 3 1Lucerne AL-3 0.24 6000 12 1Dhaman CC-358 0.95 15200 6 1
Total 29.12 144820 21 4Fruit
Aonla Anand-2 20 6000Nursery
grower-1 1
AonlaNA-7 10 3000 Nursery
grower-1 1Total 30 9000 2Greenmanure Sunhemp Local 9 18000 60 1
Dhaincha Hissar-1 2.2 3800 15 1Total 11.2 21800 75 2Clusterbean M-83 0.6 12000 3 1
Zonal Project Directorate, Zone-VI

ANNUAL REPORT 2011-12
Crop Name of the crop Name of the variety
Quantity of seed (q)
Value(Rs)
Number of
farmersNo. of KVKs
RGC-1002 7.4 27380 27 1RGC-1003 36.27 145080 240 2RGC-1017 80.61 162240 505 3RGC-1038 9.92 40000 113 1RGC-1055 45.93 183720 414 3RGC-1066 7.2 28800 48 1RGC-936 0.4 8000 1 1
Clusterbean (Breeder seed) RGC-1066 134.4 5376000 800 1
Total 322.73 5983220 2151 14Grand Total 6715.29 27445944 21479 249
Table 48 : Production of sapling/seedling of fruit/vegetables/forest species
Crop Name of the crop Name of the variety Number Value (Rs.) Number of
farmersNo. of KVKs
Vegetable seedlings
Bitter gourd Mahyco A-114 577 1154 501
Bottle gourd Varad 440 880 80 1Brinjal BR-14 30000 1000 40 1
DPR 512000 51200 10 1GJB-2 1540 1027 107 1HB-707 65930 22030 289 2Local purple 3200 100 1 1Palanpuri 2400 2150 1 1PLR-1, Dolly-5, JBGR-1 69050 13810 385 1PLR-1, GBL-1 3500 875 42 1PPR 800 200 2 1Surti ravaiya 40750 8150 82 1
Cabbage Golden acre 1312511 25700 48 2Pride of India 40000 2000 6 1
Cauliflower Agni 1400 700 1 1Early kufri 4100 1640 23 1Manghi 4525 905 12 1Snowball 6295 6295 28 1
Chilli GC-1, GVC-111, AVC-131 228900 68670 613 1GC-2 51500 3100 14 1Hy.-71 49000 4900 1 1Kranti 112329 50351 427 2Seminis-4884 850 500 1 1Sitara 148042 66421 13 2
Drumstick PKM-1 400 400 3 1Onion AFDR 15000 1500 1 1
Nasik red 112550 12510 39 2Ridge gourd Latika 804 1608 15 1
Zonal Project Directorate, Zone-VI

ANNUAL REPORT 2011-12
Crop Name of the crop Name of the variety Number Value (Rs.) Number of
farmersNo. of KVKs
Tomato Abhinav 56250 28175 21 2GT-1 9875 870 44 2GT-1, GT-2, GT-3 26100 5220 330 1GT-3 2675 733 74 2HB-5005 10215 10215 60 1PKM-1 62000 6200 1 1Pusa hybrid-2 600 400 2 1S-22 6375 1275 15 1
Water melon Namdhary-295 1237 618 2 1Total 2993720 403482 2883 45Fruits Aonla Chakaiya, Banarasi 500 8000 7 1
NA-7 2373 27930 110 5Bael Local 500 5000 65 1
Selection local 227 2270 64 1Ber Gola 8113 107005 210 5
Seb 400 4000 20 1Custard apple Balangar 9715 251177 98 2Datepalm Local elite 550 1650000 22 1Fig Local 41 410 8 1Guava Allahbadi safeda 262 3860 19 3
L-49 8784 237015 86 4Guava (Seeded)
local5538 55380 185 1
Jack fruit Local 556 5560 65 2Jamun (Seeded) Local 670 7050 118 2Karonda American red 2000 20000 20 1
Local 52 260 12 2Local selection 917 5502 265 1
Kathal Local 165 1650 17 1Kinnow Kinnow 2253 45060 51 1Lasoda local 305 3050 31 2
Paras, Pushkar selection 447 3570 23 1
Lemon (Seeded)
Local 3665 36650 701
Lime Baramasi 4051 81020 16 1Kagzi 31052 299614 1058 10Kagzi 1500 15000 25 1Seedless 95 1900 48 1local 545 2180 50 1
Malta Blood red 2675 53500 35 1Mango Alphanso 700 49000 16 1
Dashari 84 2520 20 1Deshari 800 48000 18 1Kesar 2485 249400 139 3local 565 16950 50 1Mallika, Dashari, 4550 136500 28 1
Zonal Project Directorate, Zone-VI

ANNUAL REPORT 2011-12
Crop Name of the crop Name of the variety Number Value (Rs.) Number of
farmersNo. of KVKs
Langra, KesarMango root stock Local 700 8400 7 1Mango scions Mallika, Dashari 600 2400 3 1Mullberry Local 20 200 4 1Papaya Coorg honey dew 13537 80322 476 4
Coorg honey red, Taiwan 5700 40500 30 1F-1 hybrid 25 365 8 1Honey dew 1500 75000 30 1Honey dew, Pusa nanha 4044 17887 41 1Honey dew, Red lady 8378 98025 250 1Madhu bindu 7796 38438 122 3Maharaja 24288 145728 715 1Pusa-nanha 284 1420 18 1Red lady 54543 520995 900 5Selection-1 20 90 2 1Taiwan 21086 316290 572 3
Pomegrenate Bhagwa 10001 288225 96 3Ganesh 50 750 10 1Mridula 865 19035 16 2Sinduri 1869 28380 19 2
Rayan Local 131 1310 25 1Sapota Kali patti 700 28000 14 1Sweet orange local 6 180 4 1
Total 253278 5147923 6431 100Ornamental plants
Acylpha Local 50 250 101
Arenthima Local 50 150 30 1Avenue tree Local 3500 17500 21 1Boguavillea Million dollar 402 4020 81 3Chameli Grafted 4 40 3 1Chandni Local 5 50 5 1Colius Local 20 60 6 1Eclipha Local 50 150 2 1Gurhal Local 50 150 30 1Harsingar Local 204 648 34 2Hibiscus Grafted 13 180 6 1Laila majnu Local 12 264 5 1Meetha neem Local 9 162 7 1Mehandi Sojat-1 22 220 3 1Mogra Grafted 7 126 4 1Moongia Local 6 72 3 1Rose Apmeri 610 3030 42 1
Ganganagri 2860 10880 40 2Ganganagri red 1500 7500 300 1
Zonal Project Directorate, Zone-VI

ANNUAL REPORT 2011-12
Crop Name of the crop Name of the variety Number Value (Rs.) Number of
farmersNo. of KVKs
Grafted 3655 18175 365 2Thuja Local 50 150 30 1
Total 13079 63777 1027 26Spices Fennel GF-2 38350 7420 17 2
GF-11 5000 750 5 1Total 43350 8170 22 3Fodder crop saplings
Fodder toussek CO-1,2,3,9 26300 500 245 1
Total 26300 500 245 1Forest Species Aarolu Local 14 140 3 1
Kachnar Local 200 600 50 1Khejari Local 427 4216 44 2Kumat Local 500 5000 100 1Neem Local 1667 5870 121 4Putramjeeva Local 20 60 10 1Sahenjna Local 2 20 1 1Saras Local 282 2256 8 1Shisham Local 216 2160 12 1
Total 3328 20322 349 13Medicinal Aloe-vera Indigenous 1800 12400 4 2
Local 5000 10000 61 1NBPGR-1 572 3,210 50 1
Drumstick Local 510 150 60 2Duranta Local 500 1500 20 1
Total 8382 27260 195 7Others Tobacco GCT-4 213000 10650 30 1Total 213000 10650 30 1Grand Total 3554437 5682084 11182 196
Table 49 : Bio-products produced by KVKs of Zone-VIBio Products Name of the bio-product Quantity Kg Value (Rs.) No. of Farmers No. of KVKs
Bio Fertilisers Azatobacter 2,660 3010 1103 2Azolla 78 4200 89 2PSB 2665.4 4,905 1127 2Rhizobium 19.4 970 90 1Vermicompost 103932 267724 327 11
Total 109355 280809 2,736 18Bio-pesticide HNPV 3.7 8880 37 1
Trichoderma 4300 301000 1486 26100 460000 1379 2
Total 10403.7 769880 2902 5Bio Agents Worms 1473.5 213398 301 6Total 1473.5 213398 301 6Grand Total 121232.20 1264087 5939 29
Zonal Project Directorate, Zone-VI
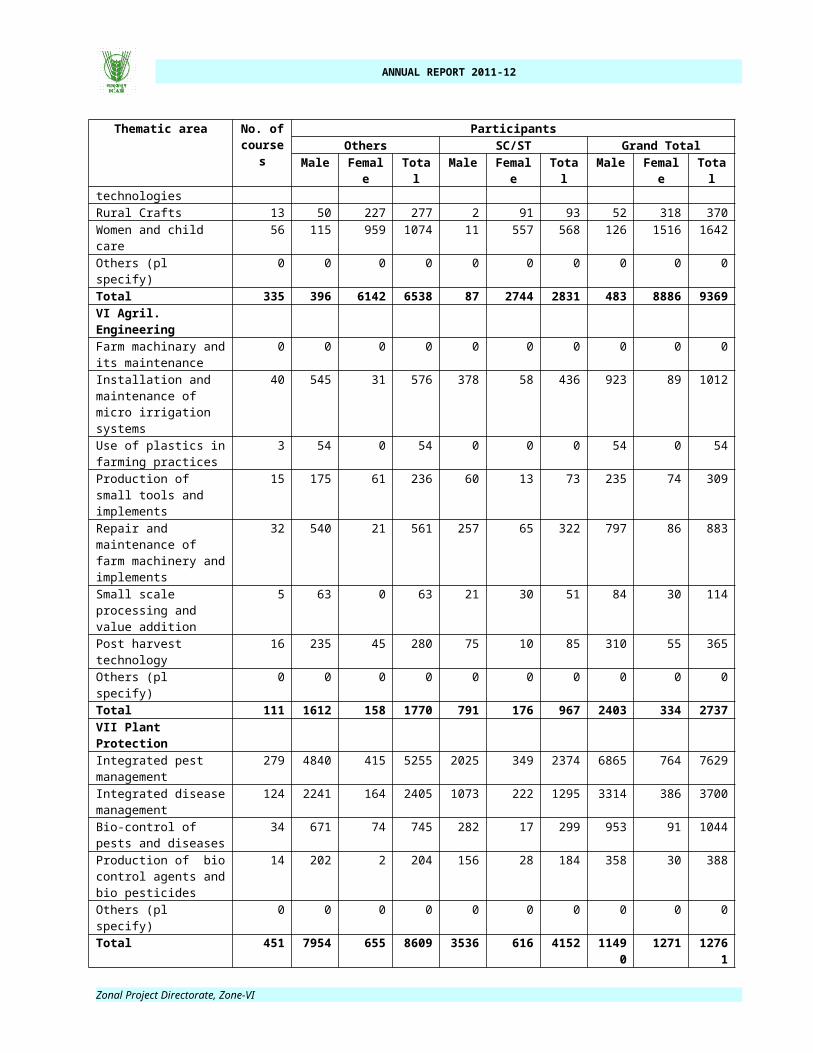
ANNUAL REPORT 2011-12
Table 50 : Production of livestock materialsParticulars of Live stockName of the
breed Number Value (Rs.) No. of Farmers No. of KVKs
Dairy animals Cows Jersy, HF 5 236344 5 1
Tharpaker 10 104510 10 1Total 15 340854 15 2Goats Sirohi 20 110000 20 1Goat buck Sirohi 5 40000 5 1Total 25 150000 25 2Poultry Hen Nirbheek 300 3000 20 1Fisheries Fingerlings 2000 10000 1 1Spawn 9905000 128765 18 1Total 9907000 138765 19 2Grand total 9907340 632619 79 7
15. DETAILS OF SOIL, WATER AND PLANT ANALYSIS
Analysis of soil, water and plant samples by KVKs is one of the important activity for recommending nutrient application on soil test based, suitability of water for irrigation (Table 51).
Table 51 : Details of soil, water, manure and plant sample analysis by KVKsSamples No. of SamplesNo. of FarmersNo. of VillagesAmount realized (Rs.)No. of KVKs
Soil 34600 29906 1060 814905 38Water 11034 10011 578 216435 29Plant 143 29 21 5280 3Manure 2792 1590 47 69800 1Others (pl.specify) 0 0 0 0 0Total 48569 41536 1706 1106420
16. SCIENTIFIC ADVISORY COMMITTEE MEETING
Scientific Advisory Committee (SAC) plans the activities and reviews the progress of KVKs. This committee includes the representatives from the host institution, ICAR, district level line departments, progressive farmers and farm women. Regular meeting of SAC is a must for proper functioning of the KVKs. The details of SAC meetings held during the year are given in Table-52:
Table 52 : Details of SAC meetings organized by different KVKs of Zone-VIName of KVK Number of SACs conductedRajasthanJodhpur 1Pali 1Ajmer 1Alwar 1Bharatpur 1Bikaner 1Dausa 1Dholpur 1
Zonal Project Directorate, Zone-VI

ANNUAL REPORT 2011-12
Name of KVK Number of SACs conductedJaisalmer 1Jalore 1Jhunjhunu 1Karauli 1Nagaur 1S. Madhopur 1Sikar 1Sriganganagar 1Banswara 1Baran 1Bhilwara 1Bundi 1Chittorgarh 1Dungarpur 1Jhalawar 1Kota 1Rajsamand 1Sirohi 1Barmer 1Churu 1Hanumangarh 1Jaipur 1Tonk 0Udaipur 1GujaratPanchmahal 1Banaskantha 1Sabarkantha 1Anand 1Ahmedabad 1Dahod 1Dangs 1Surat 1Navsari 1Narmada 1Amreli 1Jamnagar 1Porbandar 1Rajkot 0Surendranagar 0Baroda 1Bharuch 1Gandhi Nagar 1Kheda 1Kutchch 1Mehsana 1Patan 1Valsad 1Junagadh 1Bhavnagar 1Total 54
Zonal Project Directorate, Zone-VI

ANNUAL REPORT 2011-12
17. PUBLICATIONSKVKs of Zone-VI had published articles in various categories for wide circulation of improved
technologies among different stakeholders (Table 53).Table 53 : Publications by KVKs
Category Number of KVKs NumberResearch paper 37 219Technical bulletins 12 53Technical reports 32 417Others (Popular articles) 39 362Extension literature 43 378News letter 2 14
Zonal Project Directorate, Zone-VI

ANNUAL REPORT 2011-12
18. Additional activities done by KVKs on Zone-VI
KVKs of Zone-VI have done some additional activities like rainwater harvesting and micro-irrigation system demonstration and drought mitigation. The details are given in Table 54.
Table 54 : Details on rain water harvesting structure and micro-irrigation system
Zone No. of KVKs
Activities conductedNo. of Training programmes
No. of Demonstrations
No. of plant materials produced
Visit by farmers
(No.)
Visit by officials
(No.)VI 22 54 15 500 11232 221
Table 55 : Interventions on drought mitigation
A. Introduction of alternate crops/varietiesState Crops/cultivars Area (ha) Number of beneficiariesRajasthan Sorghum (SSG-Chari) 10.0 52Total 10.0 52
B. Major area coverage under alternate crops/varietiesCrops Area (ha) Number of beneficiariesOilseeds -- --Pulses 27.6 74Cereals 46.6 81Vegetable crops 2.1 54Tuber crops 10.0 41Other Crops 10.0 30Total 96.3 280
C. Large scale adoption of resource conservation technologies State Crops/cultivars and gist of
resource conservation technologies introduced
Area (ha) Number of farmers
Rajasthan Introduced Kharif Onion production technology
25.0 120
Use of bioagent (trigoderma) for the mgt of collor rot in gram
50.0 150
Integrated Management of gram pod borer
15.0 40
Total 90.0 310
D. Awareness campaign State Meetings Gosthies Field days Farmers fair Exhibition Film show
No. No.of farmers
No. No.of farmers
No.
No.of farmers
No.
No.of farmers
No. No.of farmers
No.
No.of farmers
Rajasthan
18 747 02 124 10 464 -- -- 08 5000 73 851
Total 18 747 02 124 10 464 -- -- 08 5000 73 851
Zonal Project Directorate, Zone-VI
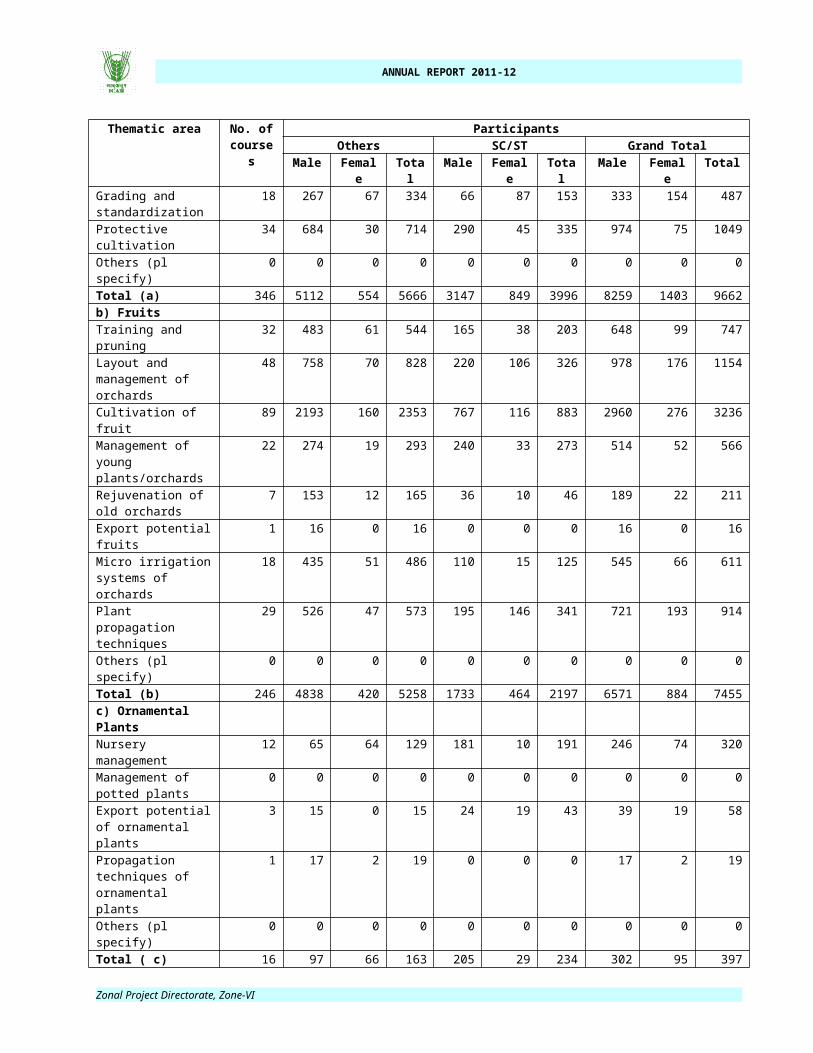
ANNUAL REPORT 2011-12
19. DETAILS ON HRD ACTIVITIES
Human resource development of KVKs is very important activity to upgrade knowledge and skills of KVK scientists for effective conductance of trainings. Six directorates of extension education of state agricultural universities of Zone-VI have been given overseeing responsibilities of the KVKs under their jurisdiction. Subject matter specialists were benefitted in upgradation of their knowledge and skills through the human resource development programme carried out by the directorates of SAUs. The details of HRD activities are given as under :
Table 56 : HRD activities organized in identified areas for KVK staff by the Directorate of Extension
Name of the SAU
Title of the training programmes
No of programmes
No. of Participants
No. of KVKs involved
SKRAU, Bikaner
Capacity building training for A.H. Scientists
1 37 21
Capacity building training on soil and water analysis for KVK scientists
1 28 21
Capacity building training of PCs for accounts
1 17 14
MPUA&T, Udaipur
Computer aided designing & manufacturing of clothes on 1-8th August, 2011
1 13 10
Scientists – farmer interaction on 28th February, 2012
1 236 11
Technology for quality life of rural families on 21-22nd March, 2012
1 12 10
Hi-tech horticulture for quality life of rural families on 27-28th March, 2012
1 14 10
SDAU, S. K. Nagar
Training-cum-Workshop on “On Farm Testing and Front Line Demonstration” on 22.03.2012
1 25 7
AAU, Anand Advanced Extension Strategy on ICT for value added Agriculture
1 34 6
JAU, Junagadh
Farmers oriented recommended agricultural technologies
1 28 7
NAU, Navsari
Training on "Conduction of systematic mandatory activities of KVKs"
1 31 5
Training on "FLDs & OFTs - Important Extension Tools of Transfer of Technology"
1 32 6
Total 12 507 128
Zonal Project Directorate, Zone-VI

ANNUAL REPORT 2011-12
Zonal Project Directorate, Zone-VI

ANNUAL REPORT 2011-12
Table 57 : HRD activities organized in identified areas for KVK staff by Zonal Project Directorate Title of the training programmes
No of programmes No. of Participants No. of KVKs involved
Review Workshop under NICRA
1 12 7
Total 1 12 7
20. WORKSHOPS/REGIONAL MEETING OF ZONE-VI
Various meetings/workshops including QRT Travel Workshop, Zonal Workshop of KVKs, High Powered Committee meeting, Institute Management Committee meetings, etc. were organized in Zone-VI. All the programme corodinators of KVKs, directors of extesnion education, zonal project director, scientists and dignitories of ICAR participated in the meetings/workshops. The details of the meetings/workshops are given in Table-58.
Trable 58 : Group Meetings/Training-cum-Workshop organized by Zonal Project Directorate in Zone-VI
Sr. No. Name of the meeting/ training/ workshop
Period Venue No. of participants
1. 1st QRT Travel Workshop May 23, 2011 ZPD, Zone-VI, Jodhpur
45
2. Zonal Workshop of KVKs June 9-11, 2011 JAU, Junagadh
70
3. 2nd QRT Travel Workshop June 27, 2011 AAU, Anand 404. Firmers FIRST meeting of Zone-VI
(Member Secretary Dr. A. K. Singh, ZPD, Zone-IV, Kanpur)
July 10, 2011 SDAU, Dantiwada
50
5. High Powered Committee held at ZPD Zone-VI, Jodhpur for finalizing the KVK guidelines under the Chairmanship of Dr RS Paroda, Former Secretary, DARE and DG, ICAR, New Delhi. Visited KVK Jaisalmer for conducting meeting on EFC Memo for 12th Plan under the Chairmanship of Dr KD Kokate, DDG (Agril. Extn.) and all the ZPDs of Zone-I to VIII.
Jan 15-17, 2012 ZPD, Zone-VI, Jodhpur
& KVK, Jaisalmer
17
6. Institute Management Committee Meeting
19.03.2012 ZPD, Zone-VI, Jodhpur
8
21. PUBLICATIONS
Research
1. Rohilla PP, Patil NV and Bohra HC. 2011. Effect of feeding probiotics and nutrient mixture on kids and goats. Full paper in Post-Symposium Compendium published by the Indian Society of Animal Production and Management (ISAPM) held at Khanapara Guwahati (Assam), held during November 11-13, 2010.
2. Tanwar PS and Rohilla PP. 2011. Feeding and grazing management practices adopted by goat keepers in semi-arid Rajasthan. Indian Journal of Small Ruminants. October 17 (2): In Press.
Zonal Project Directorate, Zone-VI
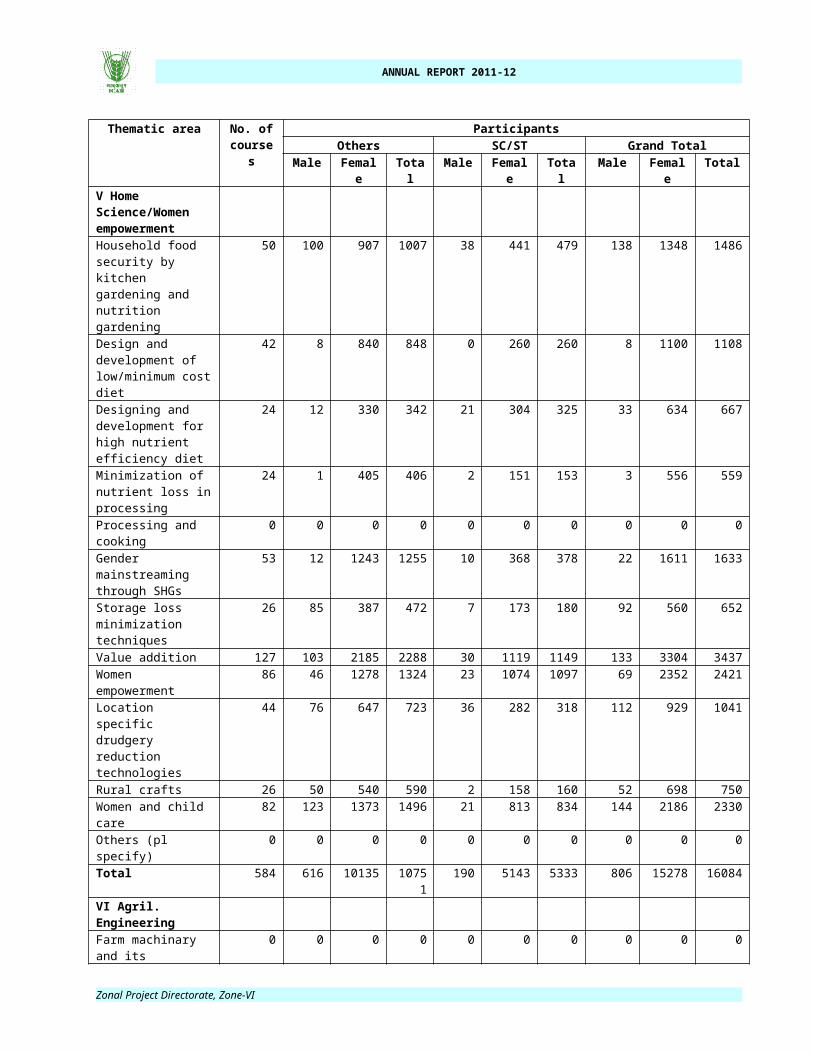
ANNUAL REPORT 2011-12
3. Kumawat, R.N., Mertia, R.S. and Mahajan, S.S. 2010. Comparative performance of groundnut-cumin and clusterbean-cumin cropping systems under foliar application of panchgavya in western Rajasthan. Annals of Arid Zone 49 (1): 31-38.
4. Mahajan, S.S., Kumawat, R.N. and Mertia, R.S. 2011. Organic seed production of cluster bean (Cyamopsis tetragonaloba L.) with foliar application of panchgavya and plant leaf extracts. Seed Research 39 (1): 28-33.
5. Sinha, N.K., Mertia, R.S., Kandpal, B.K., Kumawat, R.N., Santra, P. and Singh, D. 2010. Morphological characterization of guggal (Commiphora wightii) provenances from extremely arid parts of India. Forests, Trees and Livelihoods iFirst: 1–7
Pamphlets/Popular Articles
1. Bohra HC, Patel AK, Mathur BK and Rohilla PP. 2011. Multi-nutrient feed block: An appropriate means for supplementation of essential nutrients to desert livestock. Division of Animal Production Systems and Range Management. Central Arid Zone Research Institute, Jodhpur-342 003, Rajasthan. INDIA.
Reports
1. Singh Y. V., Rohilla P. P. and Kumawat, R. N. compiled and Edited “ Annual Progress Report of Krishi Vigyan Kendras 2010-11, Published by Zonal Project Director, Zonal Project Directorate, Zone VI, Jodhpur pages 1-97.
2. Proceedings of 5th National Conference of KVKs-2010 held at Maharana Pratap University of Agriculture and Technology, Udaipur during December 22-24, 2010 on theme, “Farm Innovations 4 Agripreneurs” in collaboration with Division of Agricultural Extension, New Delhi. Pp: 300.
3. “Zonal Project Directorate, Zone-VI Marching Ahead” that was released by the Chief Guest during 6th National Conference of KVK-2011 held at Jawaharlal Nehru Krishi Vishwa Vidyalaya, Jabalpur during December 3-5, 2011. Pp: 1- 28.
4. “Animal Husbandry Activities in Rajasthan and Gujarat (2005-2010)” authored by PP Rohilla, Y V Singh, RS Dohare, RN Kumawat and PK Satapathy, Zonal Project Directorate, Zone-VI, Jodhpur. Pp:1- 317.
Bulletin
1. “Innovations by Farmers of Rajasthan and Gujarat” authored by PP Rohilla, Y V Singh, RS Dohare, RN Kumawat and PK Satapathy, Zonal Project Directorate, Zone-VI, Jodhpur. Pp: 1-53.
Conference/symposium presentation
1. Rohilla PP, Dohare RS and Singh YV. 2011. Successful farm entrepreneurial innovators of Rajasthan and Gujarat. Pp: 181-182. In: International Conference on, “Innovative Approaches for Agricultural Knowledge Management: Global Extension Experiences”, w.e.f. November 9-12, 2011; organized by International Society of Extension Education and Indian Agricultural Research Institute, PUSA, New Delhi. 110012.
2. National Symposium on, “Emerging management concepts for sustainable livestock and poultry production” and XIX Annual Convention of Indian Society of Animal Production and Management during November 02-04, 2011; organized by ISAPM in collaboration with Department of Livestock Production and Management, College of Veterinary Sciences, Guru Angad Dev Veterinary and Animal Sciences University, Ludhiana (Punjab) – 141004.
a) Tanwar PS and Rohilla PP. 2011. Constraints perceived by goat farmers in semi-arid Rajasthan. Pp: 53-54
b) Tanwar PS and Rohilla PP. Effect of supplementation of UMMB on milk yield in buffaloes. Pp : 133
c) Tanwar PS and Rohilla PP. 2011. Goat management practices adopted by goat farmers in Jaipur district of Rajasthan. Pp : 143-44
Zonal Project Directorate, Zone-VI

ANNUAL REPORT 2011-12
d) Tanwar PS, Yogendra Kumar and Rohilla PP. 2011. Socio-economic profile of members and non-members families of dairy co-operatives in Jaipur district of Rajasthan. Pp: 268 In: Patel AK, Rohilla PP and Patil NV. 2011. Variability study on production traits in Marwri goat in its native tract. Pp: 89.
e) Tanwar PS and Rohilla PP. 2011. Livestock resources for sustainable farming system in Rajasthan. Pp:89-90.
3. R.N. Kumawat, Y.V. Singh, R.S. Dohare, P.K. Satapathy and Shayam Das. 2011. Comparative performance of frontline extension on the productivity and economics of the mustard grown in Rajasthan and Gujarat. In: Proceedings on “International conference on innovative approaches for agricultural knowledge management: Global extension experiences” held at Vigyan Bhavan and NASC Complex, New Delhi from November 9-12, 2011, p. 94.
4. R.S. Dohare, R.N. Kumawat, P.K. Satapathy and Y.V. Singh. 2011. Frontline extension strategies through agricultural knowledge management: Experiences of KVKs in arid and semi-arid regions of Rajasthan and Gujarat. In: Proceedings on “International conference on innovative approaches for agricultural knowledge management: Global extension experiences” held at Vigyan Bhavan and NASC Complex, New Delhi from November 9-12, 2011, p. 26-27.
5. R.N. Kumawat, Y.V. Singh, R.S. Dohare and P.K. Satapathy 2011. Yield and economics of cumin varieties under frontline demonstrations conducted on the soils of Rajasthan and Gujarat. In: Gopal Lal, R S Mehta, B K Mishra and S Chaudhary (Eds.), Book of lead paper and abstracts of National Seminar on “Harnessing seed spices for better socio-economic well being”, organised by The Indian Society of Seed Spices and NRCSS at Ajmer, January 6-7, 2012., pp. 162.
22. CASE STUDIES
1. Impact of Training and FLD on Fish Seed Rearing in ‘Pen Culture’ of Village Pond: KVK Devtaj
Sikandarbhai Abdulbhai Vohra (09727948856), 55 year old age, of Sojitra is a fish farmer for last 20 years and he got 5 village ponds for fish culture on lease basis from Fisheries Department, Government of Gujarat, Anand. Every year he brought fish fingerlings from the out state (West Bengal) as well as Fisheries Department of Gujarat and stocked into their village ponds. He has no nursery ponds and that is why he has to depend on others for fish fingerling. He met SMS (Fisheries) during the Fisheries Shibir (dated 18.05.2011) organised at Navali under the Krishi Mahotsava – 2011. Thereafter he also visited the KVK, A.A.U., Devataj and discussed the problem, and also actively participated in the training on “composite fish culture” organized at KVK Devataj during July 2011.
After completion of training KVK scientist visited Palol village pond in July 2011 and KVK scientist advised him to use the natural three side pocket of village (by one side covering the bamboo and net to form nearly 0.3 ha ‘Pen’). He agreed and erected the ‘Pen’ in village pond on dated 28.07.2011. He had removed the wild cat fish, aquatic insect and aquatic weed from ‘Pen’ by applying Tobaco dust @ 20 kg, also applied lime @ 250kg/ha along with cow dung + single super phosphate. These induced the primary production i.e. planktons and developed the natural food chain for fish spawn. KVK gave FLD on spawn to fry rearing (August-2011), 2 lacs mrigal spawn (6-7mm) to stock in prepared Pen culture. Provided fish feed as 2 lacs of spawn with 1:1 rice bran and mustard oil cake @ 2kg/day for six days and there after 4kg/day for next seven days. He also added the agrimin (for minerals and amino acids). Sampling and other operations were carried out under the guidance of KVK scientist which resulted into 62% survival.
Outcome from rearing of fry to fingerling: About 1,24,000 fry (25-30mm) produced from their own ‘Pen’. These fry were stocked in the same village pond to save expenditure of fish fry Rs31,000/- ( @ Rs 0.25/fry ). Not required nursery ponds, in this way he saved the lease amount as well as transportation expenditure on fish fry. The survival rate was high during rearing and later stages. Thereafter these were released in same pond. He earned a net saving of Rs 24000/ due to rearing of fish in the Pen culture during the year 2011-12. Other fish farmers of the village have started producing their own Fish seed (Fry and Fingerling) in pen culture and have got self sufficiency in fish seed production.
Zonal Project Directorate, Zone-VI
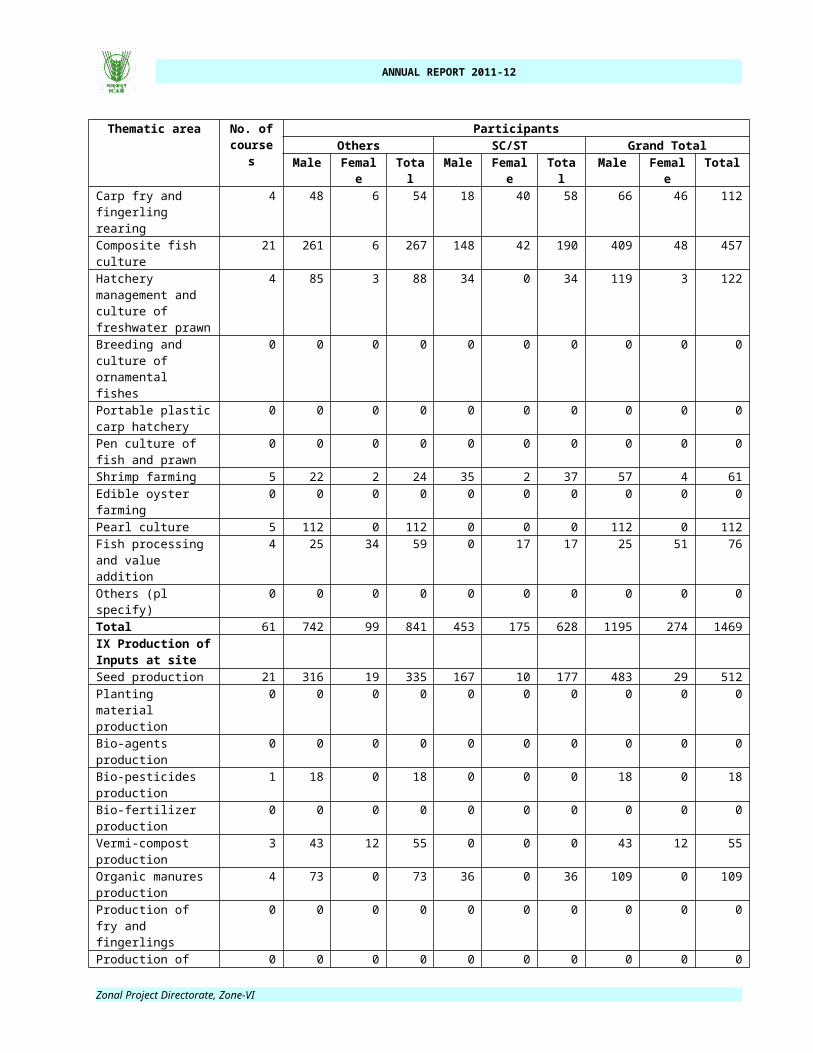
ANNUAL REPORT 2011-12
2. Promotion of Pomegranate cultivation: KVK Banaskantha
Sh Genabhai Dargabhai Patel of village Agathlal (Sarkari Goliya) having 5.0 ha irrigated land used to do traditional farming, cultivating bajra, castor and pulses in Kharif, mustard and amaranthus in rabi and bajra in summer. His average profit was around Rs.10,000/ha/year. Sh Genabhai Patel visited demo units of the KVK centre and impressed by farmer oriented activities of the centre. During discussion on the use of the latest technologies in agriculture to harvest bumper production he decided to grow pomegranate on his farm and implemented his idea in 4 hectares of land. After establishment of Pomegranate orchard his economy recorded significant increase, as he used garlic and chilly as intercrop in the orchard. During the year 2011-12 he earned a net profit of Rs37.50 lakh. The traders from metro cities come directly to his orchard and tender for the standing crop.
For successful and profitable cultivation of pomegranate he adopted drip irrigation system to apply water and Bio Nutrient (IBNM) an innovative technique developed by SDAU, Dantiwada. Moreover, he has again planted pomegranate, on one more acre adopting plastic mulching and bird protecting nylon net. As a result 6000 farmers from surrounding area personally visited his farm during last 3 years, as “SEEING IS BELIEVING”. The farmer Genabhai Patel had promoted 633 farmers for the adoption of pomegranate cultivation on 666 ha during the year 2010-11 to 2011-12. Ge became a lead person for horizontal spread of pomegranate cultivation mainly in Deesa, Deodar and Tharad with technological and training support of the scientists of Krushi Vigyan Kendra, Deesa. Further, Krushi Vigyan Kendra had organised Farmer Field School on his farm for providing latest “know-how” regularly and timely about pomegranate cultivation to the pomegranate growers in Banaskantha.
3. Rabbit Farming-A boon to marginal tribal farmers: KVK Dangs
Balubhai Karshanbhai Pasare is a marginal farmer belonging to a village named Chikar (Rambhas),
Taluka-Ahwa, District-Dangs, Gujarat. He studied upto 9th class. He has three children and a total of seven members in his family. The only source of income was the agricultural produces produced during the rainy season. Thereafter he was forced to migrate to industrial in search of labour along with his family. The land he owned was not sufficient for the survival of his family in such a hilly area with uneven rainfall. He along with other farmers was trained by subject matter specialists of KVKs on rabit farming under RKVY programme during 2010. He went to Nasik on exposure visit to get detail information on rabbetory. He purchased a pair and was guided by KVK staff from time to time.
Zonal Project Directorate, Zone-VI

ANNUAL REPORT 2011-12
He used to feed rabbits as per the guidance provided by the experts through training, demonstration. As a result the number of rabbits increased. He started to sell them and earned handsome income. He is maintaining the parent stock and selling the surplus animals. Till date he has sold 36 adult rabbits at a rate of 100 Rs./Kg live body weight. From this business he earned Rs. 45,530/- during first year of establishment. He is scientifically managing, breeding and caring his rabbits and selling them every two months. Now he is not migrating to industrial area in search of work. Simultaneously, he purchased Dangi cow breed, 21 desi poultry birds, one TV set, telephone and one motorcycle. There is a clear cut improvement in his socio-economic status and the rabbit unit has been established at larger scale in Dang district, as it is low cost unit and give returns in a very short time to the low income group of farmers.
4.Relay Cropping of Castor in Bt. Cotton and Groundnut: KVK Kutch
Farmers of irrigated pockets of Kutch district used to grow Bt. Cotton and groundnut to earn their livelihood
security. Heavy rainfall just after sowing caused damage to these crops several times. Farmers contacted
KVK, Kutch for the solution of problems. KVK, Kutch trained and demonstrated relay cropping of Bt. Cotton
with castor and groundnut with castor. In case of groundnut castor system 6 rows of groundnut were planted
with one row of castor while 1 row of cotton with 1 row of castor were planted. Groundnut and cotton were
planted during May and June while castor was planted in August as relay crop. These combination provided
additional income of Rs.5600 for castor + groundnut and Rs.32000 for castor + cotton. Now 380 farmers of
Varli, Tharavada, Ratnapur 45 farmers of Bhalot and Kanzara villages trained by KVK have adopted this
technique to counter the effect of climate aberrations.
Zonal Project Directorate, Zone-VI

ANNUAL REPORT 2011-12
5. Prosperity through Integrated Farming System: KVK RajsamandlefUor d`f’k i)fr ls thou esa [kq’kkgkyh vkbZ
d`’kd dk uke
Jh ukuk yky dqekor
firk dk uke
Jh ekaxh yky dqekor
irk xkWo& egklfr;ksa dh eknM+h] ia-l- o ftyk& jktlean
“kS{kf.kd ;ksX;rk
gk;j lSd.Mjh
mez 45 o’kZHkwfe 8-0 gSDVjJh ukuk yky iwoZ esa flQZ /kkU; Qlysa tSls eDdk] Tokj] xsagwW] tkS bR;kfn dh Qly ikjaifjd rjhds ls gh ysrk Fkk ,oa ns’kh fdLe dh gh xk;sa j[krk Fkk vkSj og vk/kwfud d`f’k rduhdksa ls fcYdqy vufHkK FkkA bl izdkj og vkSj mlds ifjokj ds lEiw.kZ lnL; vFkd esgur ds ckotwn Hkh lkykuk eq’fdy ls ,d yk[k #i;s Hkh ughsa ys ikrk Fkk] ftlls mlds ifjokj dk dsoy Hkj.k&iks’k.k gh gks ikrk FkkA fdlku d`f’k foKku dsUnz ds oSKkfudksa ds izf’k{k.k ds ek/;e ls lEidZ esa vkus ds i’kpkr dsUnz ds oSKkfudksa ds lkFk fopkj foe’kZ dj vius QkeZ dk lqfu;ksftr rjhds ls ;kstuk cukdj vius ikl miyC/k lalk/kuksa dk leqfpr mi;ksx dj ’kuS% ’kuS% ,d vk/kqfud izpfyr d`f’k rdfufd ;qDr lefUor d`f’k i)fr dk #i nsdj ftys esa vxzflr fdlku ds #i esa gh ugha vfirq vU; fdlkuksa ds izsjd ds #i esa viuh igpku cuk;hA Jh ukuk yky dqekor dks d`f’k ds {ks= esa ftys ,oa jkT; Lrj ij iqjLdkj Hkh fey pqds gSA vk/kqfud rdfudh viukus dh yxu] esgur ,oa fo’ks’kKksa dh lykg dks gh bldk Js; nsrs gSA orZeku esa fdlku dk /;s; d`f’k esa izpfyr vk/kqfud rdfufd;ksa dks viukus dh vksj vxzflr gSA lefUor [ksrh viukdj bl fdlku us viuh vk; ,d yk[k lkykuk ls c<kdj vkt 12‐35 yk[k rd dj yh gS A Jh ukuk yky dh orZeku dh fLFkfr dk fooj.k bl izdkj gS&miyC/k lalk/ku
flapkbZ ds lk/ku% dqvkW&1] V~;wcosy&1] okVj VSad&1d`f’k midj.k% VªSDVj&1] Vªksyh&1] Fkzslj&1] lhMMªhy&1vU;% fo|qr pkfyr eksVj iEi] cwan&cwan flapkbZ i)fr o gLrpfyr vk/kqfud d`f’k ;a=
Qly {ks=Qy
vk; ( #-)
dikl 11 ch?kk
2-00 yk[k
eDdk 9 ch?kk
0-90 yk[k
xsagwW &tkS 11 ch?kk
1-30 yk[k
ljlksa 9 ch?kk
0-90 yk[k
fHk.Mh 6 ch?kk
2-00 yk[k
lCth
Qy ikq/
Zonal Project Directorate, Zone-VI

ANNUAL REPORT 2011-12
I;kt 2 ch?kkaa
0-60 yk[k
cSaxu 2 ch?kk
0-80 yk[k
fephZ 1 ch?kk
0-40 yk[k
uhacw 1 ch?kk
0-25 yk[k
djksank 100 ikS/ks
0-10 yk[k
phdw 10 ikS/ks
&
iihrk] vkWoyk 20 ikS/ks
0-10 yk[k
xk;& gkWfyLVhu] fxj
06 3-00 yk[k
cSy 02 &dEiksLV fiV 01 &gjkpkjk mRiknu 2 ch?
kk&
dqy vk; ( #-) 12-35 yk[k
fo’ks"k
mUur fdLe ds chtksa o mUur uLy ds ikS/kks dk iz;ksxcwan&cwan flapkbZ i)fr ls dikl o lCth mRiknuklk;fud moZjdksa] dhVukk’kdksa ,oa [kjirokjukk’kdksa dk iz;ksxvk/kqfud d`f’k ;a=ksa o midj.kksa dk bLrseky ty laj{k.k rdfudh viukuk
6. KVK Navsari : Self employment through small scale nursery
Sh Rajeshbhai Ganvin of Kavdej taluka Vansda got training on small scale nursery at KVK Navsari.
Under Rastriya Krishi Vikas Yojna he got a net house of 25 × 40 m2 in which sprinkler was also given in 1000
square meters. In this Net House he started nursery of fruits plants such as custard apple (50,000 No.),
bamboo plant (60,000 to 70 000 No.), Sandal wood plants (15000 to 20000 No.) and around 20000 new
grafts were also prepared.
He raised nursery on small scale at initial stages. Later he sold nursery plants to the farmers of
Rajasthan, Mandhya Pradesh, Andhra Pradesh and Karnataka. He has raised the nursery of bamboo plants
for selling to the faremrs of neighboring states. Later he established 4 net houses and now earning Rs.4.00
lakh per year by selling the plants of his nursery. A number of farmers had adopted polyhouse technique in
Navsari district on getting inspiration from Rajeshbhai Ganvin.
Zonal Project Directorate, Zone-VI

ANNUAL REPORT 2011-12
Zonal Project Directorate, Zone-VI
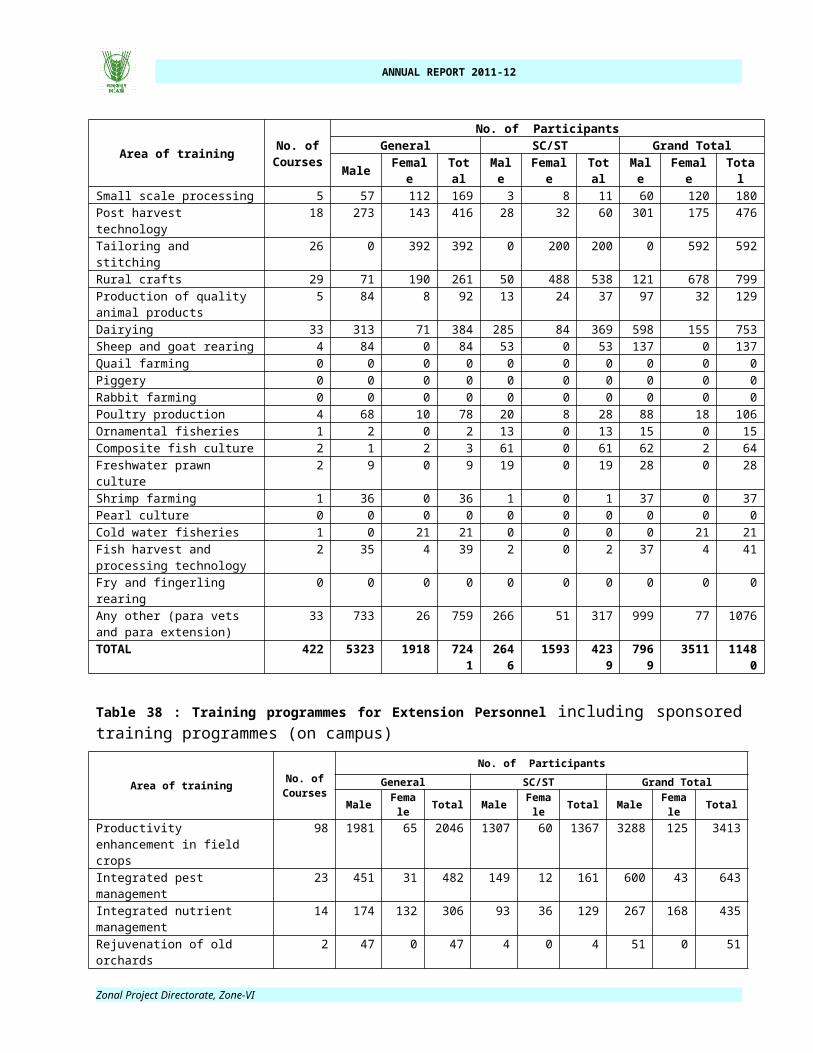
ANNUAL REPORT 2011-12
7. Water Resource Management: Recharge of tube-well in Sitara village: KVK Bharatpur
Climate change is likely to threaten the food security and livelihood of millions of people in India. It is therefore important to enhance the resilience of India Agricultural production system to climate variability and climate change. Resilience is the capability of the production system to resist the negative impacts of climate change and also capacity to recover quickly after the damage. Due to change in rainfall pattern during last ten years the groundwater declined to suffice the need of crops.
Recharging of shallow tube well based on indigenous wisdom of farmers and scientific knowledge is used to modified design for developing low cost recharging of tube well structures. Material used included -Cement Ring – 8-10 Nos. 4.5 ft Radius and 2 ft height, bricks 500, one cement bag, 10 ft long pipe and one perforated pipe of 6ft length costing around Rs 10000/only; out of which 25% contributed by the farmers and remaining amount was financed under NICRA project.
The technology has the significant impact on charging of tube-wells in the village. Water table has risen significantly (5 to 6 ft). It collected nearly 3000 cubic metre of rain water and continuously delivered in tube wells. The stored water is used for irrigation purpose during dry spell as protective irrigation. Due to recharge of tube well and availability of water farmers cultivated wheat, barley and vegetables other than mustard. Run-off water continuously delvers in tube-well, helps farmers to pre-irrigate the field for sowing the rabi crops when September rains are not received. Area of wheat, Barley, increased due to availability of water. Also reduced cost of irrigation. The salinity of ground water declined with this technique.
Farmers are very happy to adopt this modified technology, as they irrigate best quality water to rabi crops, learnt crop water requirement. This project created awareness among farmers as it helped to solve the most prominent problems of water, enhanced the people’s participation in water conservation and started looking and adopting various farm practices related to collection, storage and in-situ-moisture conservation practices. The technology has horizontal spread in Bharatpur district. Farmers from other villages are also visiting village Sitara for observing recharging structure and have decided to construct same structure.
Zonal Project Directorate, Zone-VI

ANNUAL REPORT 2011-12
23. AGRICULTURAL TECHNOLOGY INFORMATION CENTRE
A. Details on ATICsS. No Name of the ATIC Name of the Host Institute Name of the ATIC Manager1. CAZRI, Jodhpur CAZRI, Jodhpur Dr. Bhagwan Singh2. SKRAU, Bikaner SKRAU, Bikaner Dr. (Mrs.) Meenakshi
Chaudhary3. MPUA&T, Udaipur MPUA&T, Udaipur Dr. Meena Sanadhya4. SDAU, S. K. Nagar SDAU, S. K. Nagar Dr. M. R. Prajapati5. AAU, Anand AAU, Anand Dr. B. H. Patel6. NAU, Navsari NAU, Navsari Dr. O. P. Sharma7. Sardar Smruit Kendra ATIC,
JAU, JunagadhJAU, Junagadh Dr. B.R. Karkar
B. Details on Farmer’s visit S. No Purpose of visit Number of farmer’s visited01 Technology Information 1973102 Technology Products 849603 Others (Diagnosis of plant, soil
and animals) 442
C. Facilities in the ATIC which are in operation S. No Particulars Availability (Please √ mark) Number of ATICs01 Reception counter √ 702 Exhibition / technology
museum√
603 Touch screen Kiosk √ 104 Cafeteria √ 505 Sales counter √ 706 Farmer’s feedback
register√
707 Others if any (please
specify)
D. Technology information provided
D.1. Details on technology information S. No
Information category
Number of ATICs
Total number of farmers bene-fited
Category of informationVarieties / hybrids
Pest management
Disease management
Agro-techniques
Soil and water conser-vation
Post harvest technology and Value addition
Animal husban-dry and fisheries
01 Kisan Call Centre / other Phone calls from farmers
7 5262 2110 708 806 467 639 240 292
02 Video shows
3 1046 162 133 161 60 60 132 338
03 Letters received
4 130 55 14 27 11 6 6 11
Zonal Project Directorate, Zone-VI

ANNUAL REPORT 2011-12
S. No
Information category
Number of ATICs
Total number of farmers bene-fited
Category of informationVarieties / hybrids
Pest management
Disease management
Agro-techniques
Soil and water conser-vation
Post harvest technology and Value addition
Animal husban-dry and fisheries
04 Letters replied
4 130 55 14 27 11 6 6 11
05 Training to farmers / technocrats / students
3 2714 2292 58 95 51 42 23 153
07 Others pl. specify
0 0 0 0 0 0 0 0 0
D.2 . Publications (Print & Electronic media)S. No Particulars Number sold Revenue generated in
Rs.Number of farmers
benefited01 Books 23183 436554 699102 Technical
bulletins 5024 0 5915
03 Technology Inventory
295 280 292
04 CDs 88 0 19005 DVDs 8 0 806 Video films 5 0 507 Audio CDs 0 0 008 Others if any
(news letters, folders, leaflets, etc.)
52996 50945 26949
E. Technology Products provided S. No Particulars Quantity Unit of quantity Value in Rs. Number of
farmers benefited
01 Seeds 854.48 Quintal 11478988 552902 Planting
materials 175193 Numbers 2115951 2762
03 Livestock 9 Numbers 5400 204 Poultry birds 0 Numbers 0 005 Bio-products 733 Quintals 25130 2506 Others pl.
specify 0 0 0
F. Technology services provided
S. No Particulars Number of farmers benefited01 Soil and water testing 59002 Plant diagnostics 47903 Details about the services to line
Departments 2145
04 Others if any (cotton stalk shredder and rotavator provided for demonstration)
596
Zonal Project Directorate, Zone-VI

ANNUAL REPORT 2011-12
Zonal Project Directorate, Zone-VI

ANNUAL REPORT 2011-12
24. TECHNOLOGICAL BACKSTOPPING BY DIRECTORATES OF EXTENSION
States covered: Rajasthan and GujaratNumber of Directorates of Extension : 6 (Six)
A. Details on Directors of Extension S. No
Name of the SAU
Name of the Director of Extension
Number of KVKs for which technological backstopping is provided SAU/CAU DU ICAR NGO SDA Others
(pl. specify)
1 SKRAU, Bikaner
Dr. P. N. Kalla 14 2 5
2 MPUA&T, Udaipur
Dr. I. J. Mathur 10 0 1
3 SDAU, S.K.Nagar
Dr. M. C. Soni 2 1 4
4 AAU, Anand Dr. P. P. Patel 3 1 25 JAU,
JunagadhDr. A. M. Parakhia 5 0 3
6 NAU, Navsari
Dr.H. J. Derashri 5 0 1
Total 39 4 16
B. Workshops / meetings organized DEE/S. No. Details of workshop/meeting conducted No. of KVKs participated
SKRAU, Bikaner
1 Review meeting of KVKs 142 Review meeting of KVKs 14
MPUA&T, Udaipur
1 Two days workshop on OFTs of KVKs on 20-21 September, 2011. (All the Programme Coordinators concerned SMS, all head of the Departments, all Deans of Colleges, all the three Zonal Director Research, Senior officers of Directorate of Extension Education, total 70 scientists attended the workshop)
11
SDAU, S. K.
Nagar1 Training-cum-Workshop on “On Farm Testing and Front
Line Demonstration” – 22.03.20127
2 Farmers-Scientist Interface – 21.03.2012 1093 Monthly Review Meeting on 07.04.2011 at KVK,
Gandhinagar7
4 Review meeting of KVKs on 21.06.2011 at Sardarkruhinagar
7
5 Monthly Review Meeting on 22.07.2011 at KVK, Kutch 76 Monthly Review Meeting on 08.09.2011 at Cotton
Research Station, Sabarkantha7
7 Monthly Review Meeting on 13.10.2011 at Farm Women Training Centre, SDAU, Rapar, Kutch
7
Zonal Project Directorate, Zone-VI

ANNUAL REPORT 2011-12
DEE/S. No. Details of workshop/meeting conducted No. of KVKs participated
8 Monthly Review Meeting on 05.01.2012 at S. K. Nagar, Banaskantha
7
9 Monthly Review Meeting on 22.03.2012 at S. K. Nagar, Banaskantha
7
AAU, Anand
1 Annual Zonal Workshop 62 Meeting regarding Review of Annual Progress Report 63 Meeting regarding Action Plan Preparation 64 Meeting regarding workload of KVK Technical staff 65 Zonal Research Extension Action Committee 56 Agricultural Research Sub-committee meeting 57 QRT 6
NAU, Navsari
1 Workshop on "Preparation and Operationalisation of Comprehensive District Agricultural Plan".
06
2 Interface meeting on "Agricultural Scientists and Subject Matter Specialists for effectively organization of FLDs and OFTs".
05
3 Workshop on "Preparation of effective Action Plan and scheduling of mandatory activities of KVKs working in South Gujarat region".
06
4 Meeting on "Finalization and compilation of Annual Progress Report of KVKs"
06
5 Quarterly review meetings of KVK staff 06
6 Interface meeting on "Zonal Research & Extension Action Plan".
05
7 Workshop on "Preparation of XII Plan EFC Plan Document".
06
JAU, Junagadh
7
1 National level model training course on “Good Agricultural Practices” during 28th September to 5th October, 2011
7
2 Workshop on “Writing for Print Media” during 27th to 29th February, 2012
7
3 Interface meeting on “Agricultural Scientists and Subject Matter Specialists for effectively organization of FLDs and OFTs”
5
4 Meeting on “Finalization and compilation of Annual Progress Reports of KVKs”
5
5 Quarterly review meeting of KVK staff 56 Monthly review meeting of KVKs activities 57 Meeting on “Preparation of XII Plan EFC Plan
Document”5
Zonal Project Directorate, Zone-VI
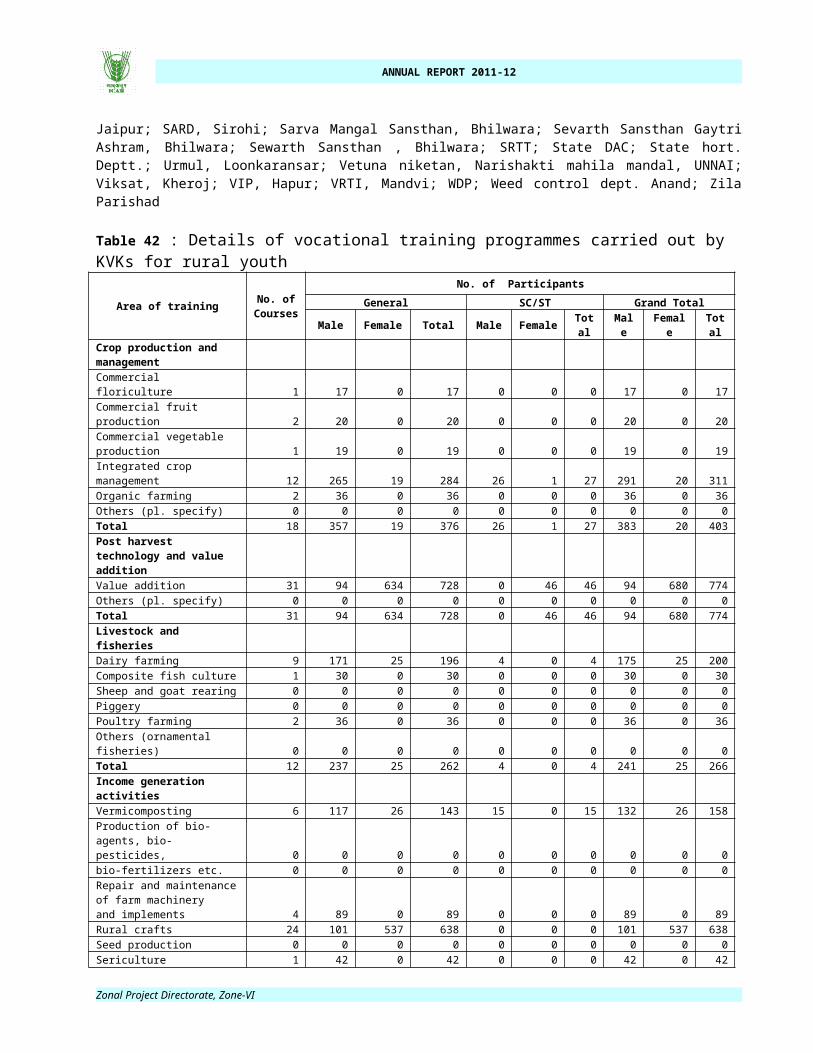
ANNUAL REPORT 2011-12
DEE/S. No. Details of workshop/meeting conducted No. of KVKs participated
8 Meeting on “Interactive meeting with KVKs and stakeholders” on 30th September, 2011 at Dry farming Research Station, JAU, Targhadia (Rajkot)
5
9 Farmers’ awareness programme on climate change at Dry farming Research Station, JAU, Targhadia (Rajkot)
5
10 Special lecture-cum-seminar on “Bt. Cotton” organized by Mahyco-Monsanto bio-tech India Private Limited on 20th March, 2012
5
11 One day farmers’ awareness programme under Integrated Agro met Advisory Services Scheme, IMD, Puna on 17th March, 2012
5
C. Visits made by DE / Officials in the Directorate to KVKs S. No. Particulars Number of visits
01 SAC meetings 5002 Field days 5403 Workshops / seminars 3704 Technology week 1105 Training programmes 6806 Others pl. specify 22
D. Overseeing of KVKs activities S.
No. Particulars Number of fields visited
Major observations / remarks
Major suggestions given
01 On Farm Trials 59 FLDs were arranged systematically with signboards on road sides.
PCs were advised to arranged the meeting of farmers on FLDs plots while important agricultural operations
02 Front Line Demonstration
210 FLDs were arranged systematically with signboards on road sides.
PCs were advised to arranged the meeting of farmers on FLDs plots while important agricultural operations
03 Others pl. specify
E. Publication on Technology inventory S. No. Particulars Number
01 Directorates published the technological inventory
9
02 Directorates constantly updating the technological inventory
9
F. Technological Products provided to KVKsS. No. Major technologies provided Number of KVKs
01 Seeds 73
Zonal Project Directorate, Zone-VI

ANNUAL REPORT 2011-12
02 Planting materials 2003 Bio-products 1204 Livestock breed 05 Livestock products 06 Poultry breed 07 Poultry products 08 Others pl. specify (sex pheromone
trap)2
Zonal Project Directorate, Zone-VI
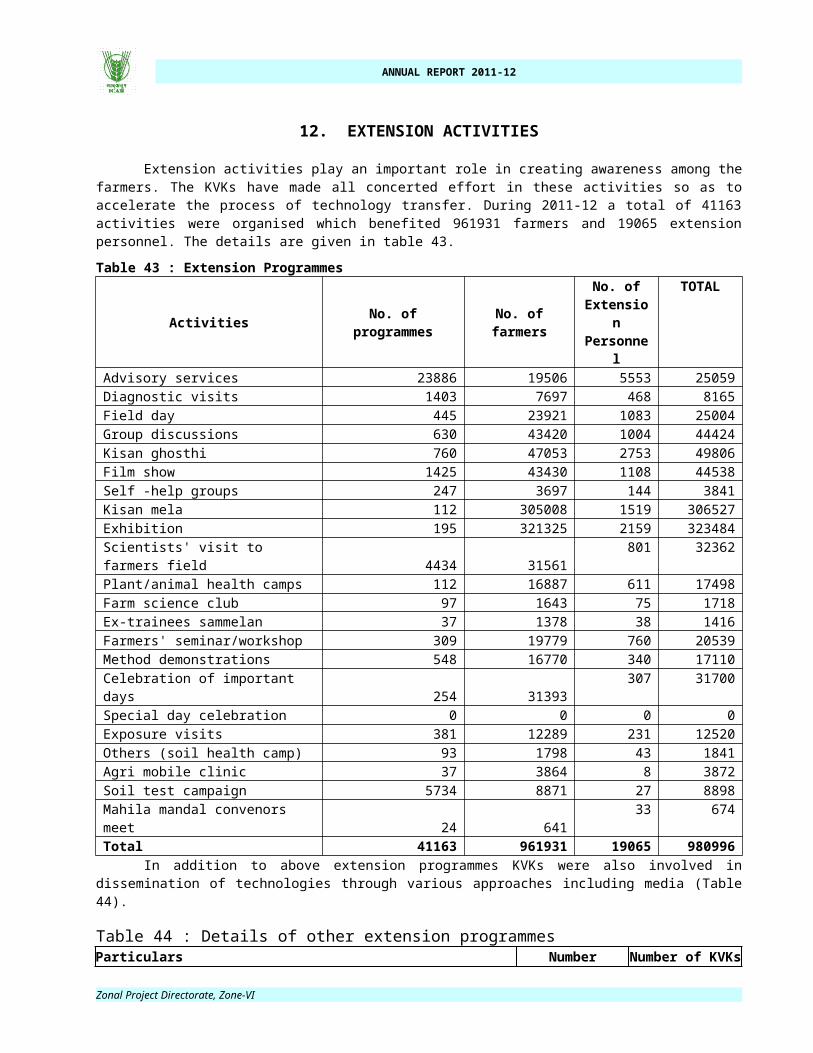
ANNUAL REPORT 2011-12
25. ZONAL PROJECT DIRECTORATE (ZONE-VI), JODHPUR
Staff Position as on 31st March, 2012
S. No. Name of incumbent Designation Date of joiningScientific1. Dr. Y. V. Singh Zonal Project Director 19.12.20092. Dr. R. S. Dohare Principal Scientist (AE) 30.01.19993. Dr. P. P. Rohilla Senior Scientist (LPM) 17.04.20104. Dr. R. N. Kumawat Senior Scientist (Agro) 04.04.20115. Sh. K. R. Baliram Scientist (AE) 23.12.2012Technical6. Sh. P. K. Satapathy T-6 (Sr. Computer Assistant) 04.04.20067. Sh. Ram Niwas Driver (T-2) 01.08.1997Administrative8. Ms. A. Sharma F&AO 19.11.20119. Sh. N. S. Gehlot Assistant 07.05.199210. Sh. R. Benda Senior Clerk 06.02.199911. Sh. Mukesh Tripathi Junior Clerk 18.02.1993
Zonal Project Directorate, Zone-VI

ANNUAL REPORT 2011-12
Annexure-ISummary of technologies assessed under various crops by KVKs Thematic areas Crop Name of the technology assessed No. of
trialsNo. of KVKs
Drudgery Reduction Cotton Assessment of different cotton picking bags for drudgery reduction
10 1
Gram Drudgery Reduction in Weeding by Wheel hoe
8 1
Wheat Use of Wheel hand hoe in wheat 5 1
Integrated Crop Management
Acid lime Management of Hasta bahar in acid lime 20 1
Ber Improving production technologies of ber in rainfed conditions
3 1
castor Productivity of Castor + Cotton relay cropping system
3 1
Cotton Yield assessment of Bt. Cotton + castor inter cropping system
10 1
Cumin Optimisation of seed rate in cumin 2 1Cumin Optimisation of seed rate in cumin under
salty soils3 1
Fennel Optimization of crop geometry for fennel 3 1Fenugreek Standardisation of suitable technology for
maitaining quality in the dry leaves kasuri methi in Nagaur District
1 1
Gram Biological control of wilt in gram by using Trichoderma
3 1
Gram Optimisation of sowing time in gram 3 1Gram Optimization of seed rate in gram 16 4Gram Water and fertiliser managemnt in gram 5 1Guava Crop regulation in Guava (Bahar
treatment)3 1
Isabgol Optimization of crop geometry for Isabgol 3 1Long melon Effect of plant growth promoter (ethrel) on
yield of long melon9 1
Mango Control of fruit drop in mango cv. Kesar 5 1
MustardDevelopment of suitable crop system for mustard 2 1
Mustard Optimization of seed rate in mustard 13 2Mustard Yield assessment of Mustard + Lucerne
inter cropping system3 1
Okra Optimisation of sowing date in okra 5 1Paddy Development of suitable transplanting
method for paddy cultivation5 1
Tomato Developmenet of suitable nursery for tomato
9 2
Tomato Mangement of frost injury in tomatos by foliar application of scavangers
5 1
Wheat Optimization of seed rate in wheat 42 6Integrated Disease Management
Bt. Cotton Management of sucking pests in Bt. Cotton 6 1
Castor Integrated control of wilt in castor 10 1Chili Management of chilli leaf curl disease 5 1Cluster bean Control of bacterial blight in cluster bean 10 1
Zonal Project Directorate, Zone-VI

ANNUAL REPORT 2011-12
Thematic areas Crop Name of the technology assessed No. of trials
No. of KVKs
Cumin Integrated control of wilt in cumin 10 1
Gram Development of IPM modules for control of Helicoverpa armigera in gram
5 1
Gram Integrated control of wilt in gram 6 2Gram Management of wilt in gram 9 2Groundnut Biological control of Sclerotium rolfsii (stem
rot) in groundnut3 1
Groundnut Standardisation of Truchoderma application method
6 2
Lentil Management of seedling wilt in lentil 5 1Maize Management of phyllody disease of
sesame by intercropping with maize6 1
Mustard Biological control of diseases in mustard 5 1Mustrad Management of sclerotinia rot in mustard 16 3Okra Management of YVMV in Okra 12 1Paddy Response of rice to soil applied
Fluorescent pseudomonas 15 1
Papaya Management of root, stem or foot rot in papaya
5 1
Pome granate
Management of Bacterial blight in pomegranate
21 1
Soybean Control of YMV in soybean through seed treatment with Thiamethaxam (35FS)
5 1
Wheat Nematode management in wheat crop 6 1Integrated Nutrient Management
Ber Nutrient management in ber 5 1
Cauliflower Nutrient management in cauliflower 5 1Chili Impact study of micronutrient on yield of
chilly13 2
Coriander Impact study of foliar nutrient spray (19 : 19 : 19) on yield and quality of coriander
10 1
Cotton Balanced use of plant nutrients 13 3Cotton Response of cotton to phosphatic fertilizers 3 1Gram Effect of foliar applied micro nutrients on
the yield of gram6 1
Gram Fertiliser management in gram 12 1Gram Nutrient management in gram 10 1Groundnut Effect of foliar applied potassic fertilisers
on the yield of groundnut3 1
Groundnut Nutrient management in wheat 5 1Marigold gypsum application to increase FUE 3 1Mustard Effect of foliar applied thiourea and zinc
sulphate on the yield of mustard crop 10 1
Mustard Effect of Thio urea on Mustard yield 4 1Onion Balanced use of plant nutrients 21 3Onion Effect of sulphur on onion production 10 1Whear Effect of micronutrient on the yield of wheat 5 1Wheat Balanced use of plant nutrients 5 1
WheatEffect od SSP and PSB on the yield of wheat
5 1
Zonal Project Directorate, Zone-VI

ANNUAL REPORT 2011-12
Thematic areas Crop Name of the technology assessed No. of trials
No. of KVKs
Wheat Effect of foliar applied thio-urea and zinc sulphate on wheat yield
18 3
Wheat Integrated nutrient management in wheat 10 1Wheat Nitrogen management in wheat 5 1Wheat Nutrient management in wheat 27 5Wheat Response of wheat to soil applied zinc
sulphate10 1
Integrated Pest Management
AonlaManagement of Mealy-bug in Aonla
5 1
Binjal Management for fruit and shoot borer in brinjal
12 1
Castor Control of semilooper in castor 5 1Coriander Stem gall management in coriander 3 1Cotton Control of sucking pests in cotton 23 6Cotton Management of mealy bug in cotton 4 1Cotton Management of mealy bug infestation in
cotton16 3
Fenugreek Comparative efficacy of insecticides for aphid management in fenugreek
6 1
Gram Management of chickpea Pod Borer 12 1Gram Management of pod borer infestation in
gram19 4
Gram Termite control in groundnut 5 1Groundnut Termite control in groundnut 5 1Indian bean Management of Helicoverpa armigera in
Indian bean by biological means.7 1
Mustard Management of painted bug in mustard 5 1Mustard Management of sucking pests in mustard 5 1Soybean Evaluation of insecticide against Girdle
beetle in soybean3 1
Tomato Management of Helicoverpa armigera in tomato
5 1
Resource Conservation Technology
Barley Abiotic stress management in barley through folira application of Urea and Thio-Urea
6 1
Gram Abiotic stress management in gram through folira application of DAP and Thio-Urea
9 1
Groundnut Soil moisture conservation in groundnut through deep tillage
5 2
Wheat Effect of seed priming and foliar application of Thio-urea on the yield of wheat
12 1
Varietal Evaluation Anand Asessment of new variety 3 1Brinjal Assessment of brinzal varieties for their
productivity10 1
Cauliflower Assessment of early sown varieties of cauliflower for their productivity
5 1
Cotton Assessment of Bt. cotton varieties for their productivity
6 1
Cucumber Assessment of HYVs of Cucumber 5 1Cumin Assessment of cumin varieties for their 14 2
Zonal Project Directorate, Zone-VI
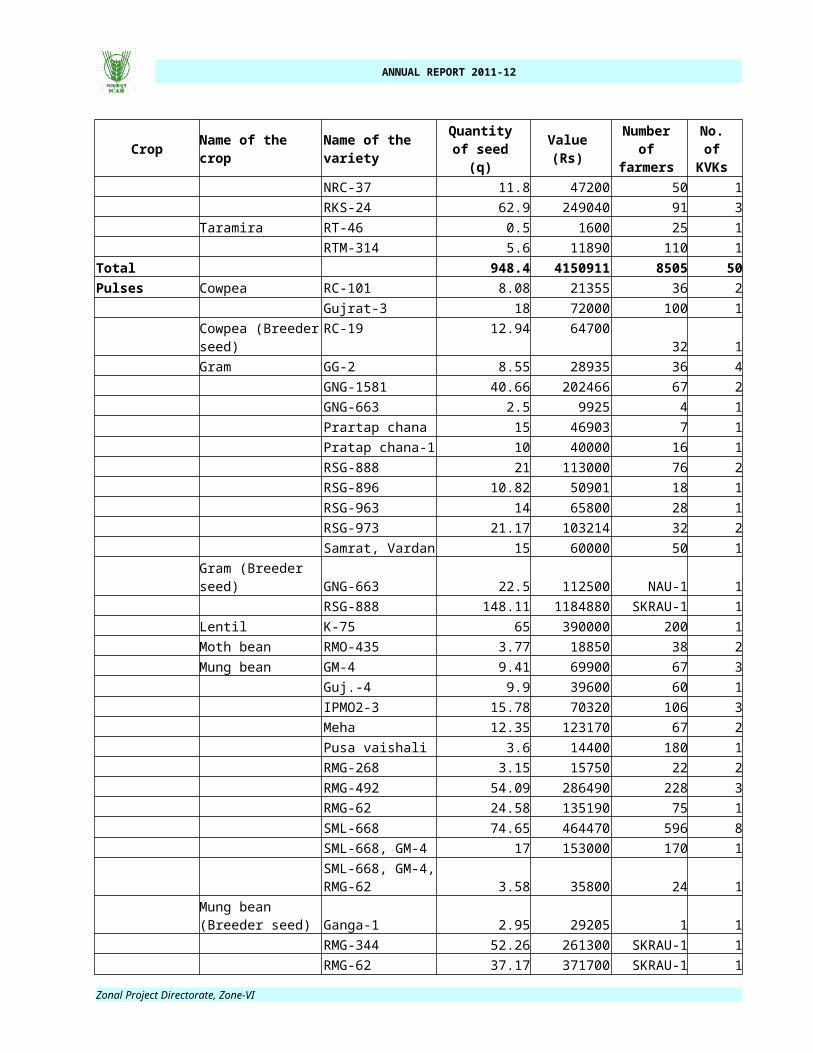
ANNUAL REPORT 2011-12
Thematic areas Crop Name of the technology assessed No. of trials
No. of KVKs
productivityCumin Assessment of cumin varieties for their
productivity3 1
Gram Assessment of gram varieties for their productivity
5 1
Isabgol Assessment of isabgol varieties for their productivity
5 1
Mung bean Assessment of mung bean varieties for their productivity
5 1
Mustard Assessment of mustard varieties for their productivity
5 1
Nagli Assessment of varieties of Nagli (Finger Millet) for productivity
3 1
Okra Asessment of new variety 8 2Onion Assessment of onion varieties for their
productivity10 1
Pea Assessment of pea varieties for their productivity
10 2
Sorghum Assessment of sorghum varieties for their productivity
3 1
Soybean Asessment of new variety 8 1Tomato Assessment of determinate and
indeterminate type varieties of tomato 5 1
Wheat Assessment of wheat varieties for their productivity
5 1
Wheat Yield and productivity of wheat variety RAJ 4037 under saline conditions
3 1
Weed Management Coriander Management of late emerging weeds in coriander
5 1
Cumin Weed management in cumin 5 1Isabgol Weed management in isabgol 3 1Mung bean Weed management in mung bean 7 1Paddy Use of conoweeder to control weeds in SRI
grown paddy3 1
Soybean Weed management in soybean 5 1Wheat Weed management in wheat 14 2
Total 119 918 160
Summary of technologies assessed under livestock by KVKsThematic areas Name of the
livestock enterprise
Name of the technology assessed No. of trials
No. of KVKs
Feed and pest management
Bufallo Nutritional and seasonal management in dairy animal 3 1
Cattle Nutritional and seasonal management in dairy animal 3 1
Nutrition Management Bufallo Impact of the feed additives on the productivity of buffalo
78 4
Bufallo Nutritional Management of Milch animals
3 1
Zonal Project Directorate, Zone-VI

ANNUAL REPORT 2011-12
Thematic areas Name of the livestock enterprise
Name of the technology assessed No. of trials
No. of KVKs
Bufallo Role of By-pass Fat on the productivity of dairy animal
3 1
Calf Effect of supplementing mineral mixture and concentrate on Body growth performance in calves
15 1
Calf Effect of supplementing mineral mixture and concentrate on growth performance in calves
5 1
Catlle Feeding Management in cross-bred cattle
3 1
Cattle Effect of probiotic inclusion in the ration on the productivity of farm animals
3 1
Cattle Impact nutritional managemnt on the production and reproduction of cattle
10 1
Cattle Nutritional management in miching cattles
12 1
Cattle Nutritional Management of Milch animals
5 1
Cattle Nutritional Management of Milch animals
30 1
Goat Nutrional management in goat for proper growth
88 5
Goat Nutrional management in goat for proper growth
60 1
Poultry Impact assesment of probiotic food supplement on the groth of broilers
150 1
Sheep Feeding management in marwari sheep lambs 20
1
Production and Management
Bufallo Reduction of long inter-calving period in buffaloes through feeding managemnt
3 1
Bufallo Reduction of long inter-calving period in buffaloes through feeding managemnt
29 3
Cattle Regulation of oestrus cycle in cattle through feed and shelter management
2 1
heifers Nutritional management to reduction age of first calving (AFC) in heifers
4 1
Total 21 529 30
Summary of technologies assessed under various enterprises by KVKs Thematic areas Enterprise Name of the technology assessed No. of trials No. of
KVKsNurtional Garden Human beings assessment of different preserves
for preparation of mango pickle3 1
Human beings Establishment of nutritional garden 12 1Rural women Establishment of nutritional garden 10 1
Nutrition Management Adolescent girl Nutritional management in 30 1
Zonal Project Directorate, Zone-VI

ANNUAL REPORT 2011-12
Thematic areas Enterprise Name of the technology assessed No. of trials No. of KVKs
adolescent girls for Iron deficiency Adolesecnt girl Control of Anemic in adolescent girls 30 1Children Management of protein-energy
malnutrition through balanced diet50 2
Children Management of protein-energy malnutrition through balanced diet
5 2
Porbandar Management of Anemia in adolescent girls
38 3
Women Nutrional management to increase Hemoglobin
12 1
Others (Pl. specify) Cooking food Assessment of energy saving among different type of cookers
10 1
Total 10 200 14
Summary of technologies refined under various crops by KVKsThematic areas Crop Name of the technology refined No. of
trialsNo. of KVKs
Integrated Crop Management Aonla Regulation of fruiting in aonla 1 1Ber Effect of manuring and soil
conservation measures on the productivity of ber
1 1
Cauliflower Nursey managemnt for raising early cauliflower seedlings
10 1
Chili Optimisation of crop geometry in chilli
5 1
Mustard Management of sclerotinia rot in mustard
5 1
Okra Optimization of seed rate in okra 5 1Paddy Optimisation of seed rate in
transplanted paddy6 1
Wheat Optimisation of seed rate in wheat 5 1Wheat Yield and productivity wheat var.
KRL 19 under saline soils5 1
Integrated Disease Management Gram Management of wilt in gram 6 1Pigeon pea Effect of seed treatment on the
disease incidence in Tur6 1
Integrated Nutrient Management Bt. Cotton Nutrient management for Bt. Cotton 1 1Bt. Cotton Nutrient management for Bt. Cotton 3 1Cumin Mutrinet management in cumin 5 1Cumin Response of cumin to integrated
nutrient sources3 1
Gram Impact of foliar applied Thio urea & ZnSO4 On productivity of gram
10 1
Ground nut Response of crops to foliar spray of Iron and thiourea
20 1
Ground nut Response of groundnut to soil applied potassium fertilizer
10 1
Ground nut Response of KCl and K2SO4 spray on groundnut
50 1
Kheda performance of the VAM in Guava Orchard
5 1
Mustard Abiotic stress mitigation in mustard 8 2
Zonal Project Directorate, Zone-VI
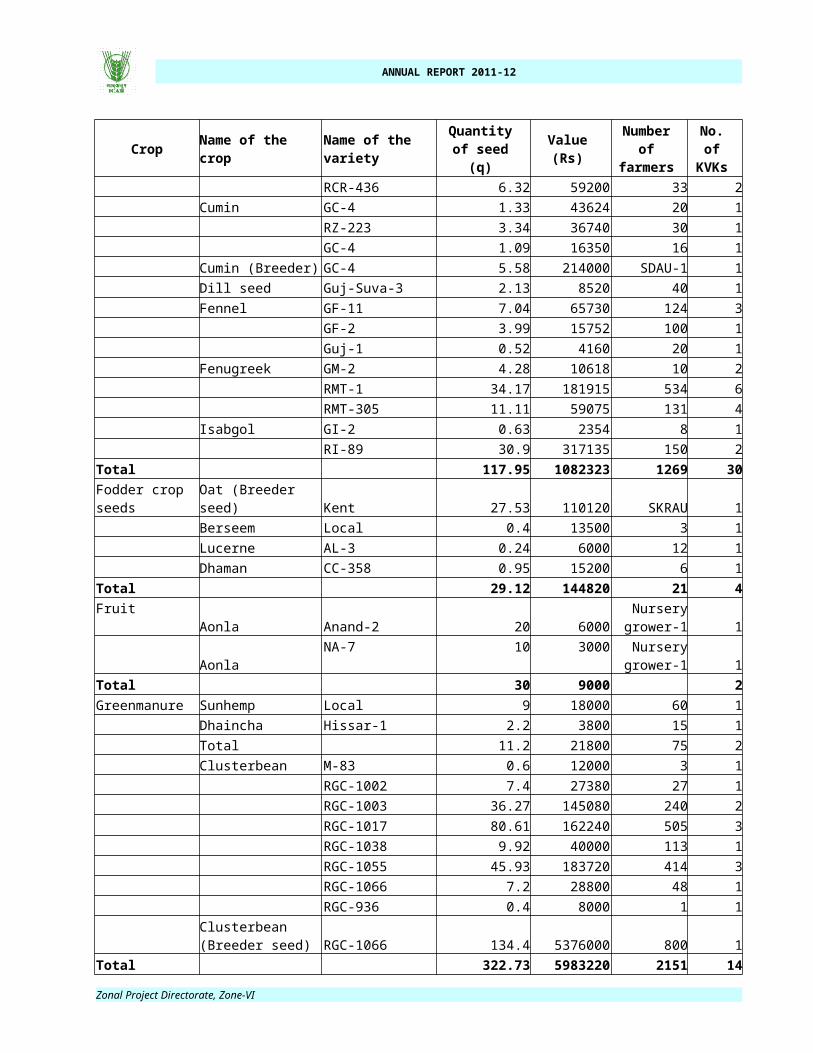
ANNUAL REPORT 2011-12
Thematic areas Crop Name of the technology refined No. of trials
No. of KVKs
with foliar application of Thio-Ureatomato Balanced use of plant nutrients 15 1Wheat Abiotic stress mitigation in wheat
with foliar application of TGA and Thio-Urea
106 2
Wheat Impact of foliar applied Thio urea & ZnSO4 On productivity of wheat
38 2
Wheat Impact of foliar applied urea & ZnSO4 On productivity of Wheat
160 2
Wheat Nutrient managemnet in wheat 5 1Integrated Pest Management Ber Management of fruit drop in Ber 12 1
Cotton Management of Mealybug in cotton 10 1Cumin Insect pest management in cumin 3 1Gram Insect pest management in gram 30 1Gram Management of pod borar in
chickpea11 2
Mustard Management of aphid in mustard 50 1Paddy Control of Stem borer in Paddy 3 1Paddy Control of stem borer in Paddy 3 1
Weed Management Cumin Weed management in cumin 5 1Garlic Management of weeds in garlic 5 1Wheat Chemical weed control in wheat 5 1
Total 37 631 42
Summary of technologies refined under various livestock by KVKsThematic areas Name of the
livestock enterprise
Name of the technology refined No. of trials
No. of KVKs
Disease Management Bufallo Deworming of buffalo to increaee milk yield 15 1Nutrition Management Bufallo Feeding management for improvement of
milk yield in buffalo10 1
Bufallo Impact of feed additives on the milk yield of buffalo
3 1
Bufallo Impact assessment of different oilcakes on the milk yield of buffalo
14 1
Sheep Feeding management in marwari sheep lambs
20 1
Sheep Growth performance of Marwari Sheep lambs under Probiotic Supplementation
20 20
Total 6 82 25
Zonal Project Directorate, Zone-VI